
Application of the computational theory of perceptions to human gait pattern recognition
16
Application of the Computational Theory of Perceptions to Human Gait Pattern Recognition Gracian Trivino 1 Alberto Alvarez-Alvarez 1 Gonzalo Bailador 2 Abstract This paper aims to contribute to the field of human gait pattern recognition by providing a solution based on the Computational Theory of Perceptions. Our model differs significantly from others, e.g., based on machine learning techniques, because we use a linguistic model to represent the subjective designer’s perceptions of the human gait process. This model is easily understood and provides good results. We include a practical demonstration with an Equal Error Rate of 3 %. Key words: Gait recognition, Fuzzy Logic, Fuzzy Finite State Machine, Computational Theory of Perceptions, Authentication. 1. Introduction Currently, industry demands new techniques for user authentication. Authentication based on biomet- rics is one area that has grown over the last few years. There are two types of biometric characteristics that are useful in this field: physiological characteristics, such as fingerprints [1] or DNA, and behavioral characteristics like signature [2], voice [3] or gait. Gait analysis has been explored thoroughly during the last decade as a behavioral biometric measurement. Some areas of application include: access control, surveillance, activity monitoring and clinical analysis. Most research is based on computer vision [4, 5, 6, 7, 8, 9, 10]. The main advantage of this approach is that there is no need to wear sensors, therefore allowing identification from a distance. For some applications, the main drawbacks of these methods are: dependence on illumination, misinterpretations due to shadows, need of a complex system for capturing images and its computational cost. Nevertheless, solutions based on accelerometers [11, 12, 13, 14, 15], provide a smart solution to the problem of capturing the signal and its practical implementation as a commercial product. They can be used in the dark and provide 3-D data whereas computer vision systems produce 2-D projections. However the user must wear sensors and this makes the solution invalid for certain applications. Regarding algorithms used for gait pattern recognition, the most frequent are based on Neural Networks [16] or Hidden Markov Models [17, 18]. However, the published results do not yet demonstrate the availability of a sufficiently robust method for a marketable product. Email addresses: [email protected] (Gracian Trivino ), [email protected] (Alberto Alvarez-Alvarez ), [email protected] (Gonzalo Bailador ) 1 European Centre for Soft Computing, C/ Gonzalo Gutierrez Quir´os, s/n, 33600 Mieres, Asturias, Spain 2 Polytechnic University of Madrid, Campus de Montegancedo s/n, 28660 Boadilla del Monte, Madrid, Spain European Centre for Soft Computing Internal Report (February 2009). Final version published in Pattern Recognition, Volume 43, Issue 7, July 2010, Pages 2572-2581. Available online at: http://dx.doi.org/10.1016/j.patcog.2010.01.017
Transcript of Application of the computational theory of perceptions to human gait pattern recognition
Application of the Computational Theory of Perceptionsto Human Gait Pattern Recognition
Gracian Trivino1
Alberto Alvarez-Alvarez1
Gonzalo Bailador2
Abstract
This paper aims to contribute to the field of human gait pattern recognition by providing a solution based onthe Computational Theory of Perceptions. Our model differs significantly from others, e.g., based on machinelearning techniques, because we use a linguistic model to represent the subjective designer’s perceptions ofthe human gait process. This model is easily understood and provides good results. We include a practicaldemonstration with an Equal Error Rate of 3 %.
Key words: Gait recognition, Fuzzy Logic, Fuzzy Finite State Machine, Computational Theory ofPerceptions, Authentication.
1. Introduction
Currently, industry demands new techniques for user authentication. Authentication based on biomet-rics is one area that has grown over the last few years. There are two types of biometric characteristicsthat are useful in this field: physiological characteristics, such as fingerprints [1] or DNA, and behavioralcharacteristics like signature [2], voice [3] or gait.
Gait analysis has been explored thoroughly during the last decade as a behavioral biometric measurement.Some areas of application include: access control, surveillance, activity monitoring and clinical analysis.
Most research is based on computer vision [4, 5, 6, 7, 8, 9, 10]. The main advantage of this approach isthat there is no need to wear sensors, therefore allowing identification from a distance. For some applications,the main drawbacks of these methods are: dependence on illumination, misinterpretations due to shadows,need of a complex system for capturing images and its computational cost.
Nevertheless, solutions based on accelerometers [11, 12, 13, 14, 15], provide a smart solution to theproblem of capturing the signal and its practical implementation as a commercial product. They can beused in the dark and provide 3-D data whereas computer vision systems produce 2-D projections. Howeverthe user must wear sensors and this makes the solution invalid for certain applications.
Regarding algorithms used for gait pattern recognition, the most frequent are based on Neural Networks[16] or Hidden Markov Models [17, 18]. However, the published results do not yet demonstrate the availabilityof a sufficiently robust method for a marketable product.
Email addresses: [email protected] (Gracian Trivino ), [email protected] (AlbertoAlvarez-Alvarez ), [email protected] (Gonzalo Bailador )
1European Centre for Soft Computing, C/ Gonzalo Gutierrez Quiros, s/n, 33600 Mieres, Asturias, Spain2Polytechnic University of Madrid, Campus de Montegancedo s/n, 28660 Boadilla del Monte, Madrid, Spain
European Centre for Soft Computing Internal Report (February 2009).Final version published in Pattern Recognition, Volume 43, Issue 7, July 2010, Pages 2572-2581.Available online at: http://dx.doi.org/10.1016/j.patcog.2010.01.017

In this paper, we make emphasis in modeling the knowledge acquired by a human observer of thesystem. For example, it is interesting to consider how a human observer has not difficulties recognizingthe gait as a quasi-periodic process, i.e., the signal evolves in time approximately repeating its shape andperiod. Moreover, a human observer is clearly able to separate the relevant from the irrelevant features inthe observed signal.
Although, we consider that both procedures are complementary, our approach is based on modeling thedesigner’s perception of the system in contrast with a procedure based on machine learning.
We aim to contribute to the pattern recognition field by providing a technique for modeling this typeof human perceptions. We present a new method for human gait recognition involving analysis of theaccelerations produced during a complete gait cycle. We used a Fuzzy Finite State Machine (FFSM) [19] tomodel the perception of the signal evolution, where each state was established using our knowledge aboutthe physiological phases of the human gait.
The model was implemented using fuzzy linguistic variables and rules to describe a set of states that thesignal undergoes during its evolution in time. This type of model provides sufficient flexibility to representthe variations in both, signal amplitude and states time span. The model is expressed using linguistic termsthat make its interpretation easier with a low computational cost.
Once the model was available, we used three relevant features of the human gait (homogeneity, symmetryand the relation weight/legs length) to recognize the gait style corresponding to a specific person. In thedemonstration, we explain how to solve the problem of authentication of one person among 11 people withan Equal Error Rate (EER) of 3 %.
We have limited the scope of this paper to the case of using accelerometers to obtain the signal, but alsothe described method could be applied to signals that were obtained by computer vision.
2. Computing with the meaning of human perceptions
The Computational Theory of Perceptions (CTP) was outlined in the Zadeh’s seminal paper “Fromcomputing with numbers to computing with words - from manipulation of measurements to manipulationof perceptions” [20] and further developed in subsequent papers [21]. The general goal of CTP is to developcomputational systems with the capability of computing with the meaning of Natural Language (NL) ex-pressions, i.e., with the capability of computing with imprecise descriptions of the world in a similar waythat humans do it.
In this section, we introduce a set of definitions including and developing ideas taken from CTP. Wefocus our effort on exploring the possibilities of this theory in the field of pattern recognition.
2.1. Perceptions
In CTP, the computational model of a physical model is based on the subjective perceptions of a personthat we will call the designer.
A perception (p) is a unit of information acquired by the designer about different parts of the systemand its environment.
The designer ’s perceptions are described using granules. A granule is a clump of elements which aredrawn together by indistinguishability, similarity, proximity or functionality [22].
In CTP, the boundary of a granule is fuzzy. Fuzziness of granules allows us to model the way in whichhuman concepts are formed, organized and manipulated in an environment of imprecision, uncertainty andpartial truth [23].
The concept of linguistic variable is essential in the formal description of perceptions. Informally, alinguistic variable is a variable whose values are words or sentences in a NL [24]. For example, the linguisticvariable Age, with possible values {very old, old, quite new, new}, can be used to describe a subjectiveperception of the age of an automobile.
The attributes of a perception are linguistic variables with values defined using fuzzy sets. The designer
describes his/her perceptions using constraints [25], i.e., defining a set of relevant attributes and the sets oftheir possible linguistic values.
2

2.2. First-order Perceptions
The designer uses first-order perceptions to define the maximum level of granularity in a model.Typically, the designer obtains a first-order perception (p1) using data provided by a sensor.There are two forms of representing (p1):The linguistic representation, e.g.:
p1: “The Temperature is High”
And the formal representation:
p1: T = µAi(z)
where:
• T is a linguistic variable (e.g.: Temperature).
• Ai is a linguistic term belonging to the set of possible linguistic values of T (e.g.: {Low, Warm, High}).
• µAi(z) is the membership function associated with the linguistic term Ai.
• z is a numerical value obtained from the sensor (e.g.: 45oC).
2.3. Second-order perceptions
The concept of granularity allows the designer to create a hierarchy of perceptions. In this structure,the designer uses a set of lower order perceptions to explain a higher order perception.
For example, two first-order perceptions:
p11: “The Temperature is Warm”.
p12: “The Humidity is Medium”.
could be used to explain the perception of Comfort in a room:
p2: “The Room is Comfortable”.
Typically this explanation has the form of a set of fuzzy rules such as:
IF p11 AND p12 THEN p2
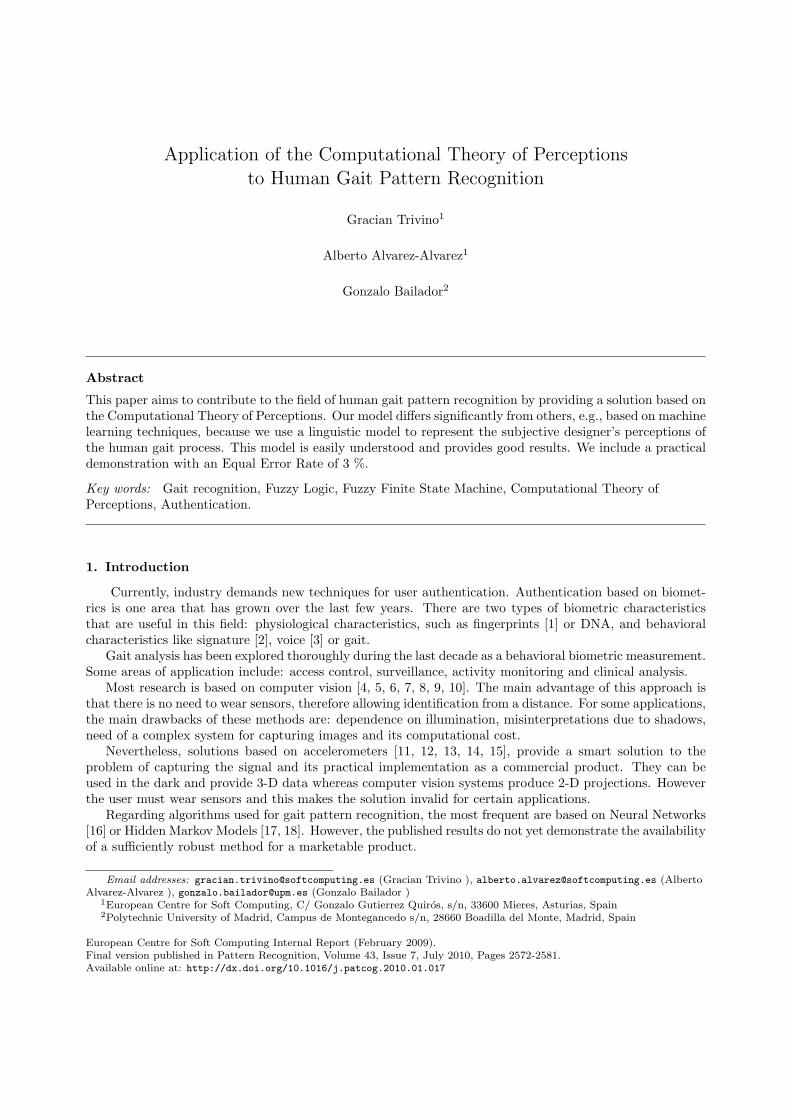
The network in this example can be extended easily by considering additional perceptions like “Acousticnoise” or “Number of persons in the room” to explain the perception of “Comfort”. Furthermore, thisperception can be used to explain a higher order perception, e.g., “Efficiency” of an air conditioning system,(see Fig. 1).
A granular network represents the explanation of a perception with certain level of granularity. Forexample, we summarize the description of an object by hiding the irrelevant granules and remarking therelevant ones. In CTP, the model of a generic perception is called a Protoform [25]. Here, the value of theattributes of a second-order perception changes dynamically when the first-order perceptions change, e.g.,when the values provided by the sensors change.
3
Figure 1: Granular network corresponding to a higher-order perception.
2.4. Perception of a system evolving in time
The most of practical applications concern with the perception of systems that evolve in time. Themodel of the perception of a system evolving in time is a protoform that describes how the system changesbetween the different states.
If, for the sake of simplicity, we restrict our attention to time invariant discrete-time systems, the equa-tions that represent the evolution of a system in time are:
{
x[t+ 1] = f(x[t], u[t])y[t] = g(x[t], u[t])
where
• x[t] is a vector that represents the state of the system at time t as it is perceived by the designer.
• y[t] is a vector that represents the system output as it is perceived by the designer.
• u[t] is a vector that represents the system input as it is perceived by the designer.
• f(x[t], u[t]) is an explanation of how the system state evolves in time.
• g(x[t], u[t]) is an explanation of how the system output evolves in time.
We say that the system described by these equations is a Fuzzy System when at least one of the variablesis fuzzy [23]. It is important to remark that, from the point of view of our approach, the model of a systemconsists of a particular description of the designer ’s perception of the system. This description contains,in certain degree of detail, an explanation of how the perceived outputs could be caused by the perceivedinputs.
3. Fuzzy Finite State Machine
In the rest of this paper, we focus our attention on a specific type of computational models that providea linguistic summary of data obtained by sensors. Here the designer must:
4

• Define a set of first-order perceptions (u[t]) using values provided by sensors.
• Define a second-order perception (y[t]) of this information with a level of granularity suitable for thefinal user purposes.
• Design an explanation of the system evolution consisting of a set of fuzzy rules that allows obtainingthe values of the output linguistic variables in function of the inputs. This explanation includes a setof intermediate order perceptions x[t] representing the relevant internal states of the system.
In a preliminary research, we have learnt that Fuzzy Finite State Machines are suitable tools for modelingsignals which evolve approximately following a repetitive pattern [26, 27, 28]. We will see that Finite StateMachines provide an interesting paradigm to design the sets of fuzzy rules that allow us to implement thefunctions f(x[t], u[t]) and g(x[t], u[t]) for modeling this type of signals.
A Fuzzy Finite State Machine (FFSM) is a tuple:
{X,U, Y, f, g,X0}
where:
• X is the set of states {x1, x2, ..., xnx}. Every state represents the pattern of a repetitive situation.
We say that, the system is in a specific state, when the current input variables and the previous stateactivations fulfil certain conditions. The activation of a state is a matter of degree, i.e., the FFSMcould be partially in several states simultaneously. We will denote Xiε[0, 1] the degree of activation ofa state. Defining the states includes determining their temporal order, i.e., the sequence with whichthe system follows the different relevant states.
• U is the input vector {u1, u2, ..., unu}. U is a set of first-order perceptions where each variable ui takes
its value in a domain defined with a set of linguistic labels {Ai1, Ai2, ..., Ain}. Fig. 3 shows an exampleof these linguistic labels over the vertical axis.
• Y is the output vector {y1, y2, ..., yny}. Y represents a summary of the values taken by the inputs
while staying in a specific state.
• f is the state transition function X[t + 1] = f(U [t], X[t]). This function can be implemented using aset of fuzzy rules:
– Rules that constrain the signal amplitude. We distinguish between rules to stay in a state xi
(Rii) and rules to change from the state xi to the state xj (Rij):
Rii : IF Xi(t) ∨ (u is Ci) THEN Xi(t+ 1)
Rij : IF Xi(t) ∧ (u is Cj) THEN Xj(t+ 1)
where Ci and Cj represent the conditions of amplitude for the state xi and xj respectively.
We used ∨ in Rii to introduce an inertia to change of state. This makes the FFSM more robustagainst spurious in the input. This OR is typically implemented using the Maximum operator.
We used ∧ in Rij to define the conditions to change more sharply. This AND is typicallyimplemented using the Minimum operator.
– Rules that constrain the signal time span. We did this using two additional linguistic labels (seeFig. 4):
Tstayi: is the maximum time that the signal is expected to remain in state xi.
Tchangeij : is the minimum time that the signal is expected to remain in state xi before changingto state xj .
Therefore, adding the temporal conditions:Rii : IF Xi(t) ∨ (u = Ci) ∨ (di = Tstayi
) THEN Xi(t+ 1)Rij : IF Xi(t) ∧ (u = Cj) ∧ (di = Tchangeij ) THEN Xj(t+ 1)
where di is the duration of the state xi.5

• g is the output function Y [t] = g(U [t], X[t]). The output variables are obtained as a summary of thevalues of the inputs while the system remained in the considered state, e.g., using the average or thestandard deviation (see an example in the next section).
• X0 is the initial state.
4. Human Gait Pattern Recognition
The following sections describe how to apply the introduced above concepts in the field of human gaitpattern recognition.
4.1. Linguistic terms in the application domain
Before embarking on a description of the different phases of the human gait, it is needed to introduce asmall set of terms belonging to the domain of language.
• Reference foot: One foot.
• Opposite foot: The other foot.
• Stance phase: It begins when the heel contacts the ground and ends when the toes rise off the ground.
• Swing phase: It covers the period when the foot is not in contact with the ground.
The human gait is a quasi-periodic process with peculiarities that allow identifying a specific person. Weused three characteristics to distinguish among different human gait styles:
• Symmetry: The degree with which the movement of a leg is similar to the other one.
• Homogeneity: The degree with which the whole gait profile repeats in time.
• The estimated proportion between legs length and weight.
We have designed a model of the human gait, i.e., a protoform where these characteristics appearremarked whereas the irrelevant aspects remain hidden.
4.2. Input variables
We attached a sensor in the belt, centered in the back, that provided measurements of three orthogonalaccelerations every 100 millisecond. We programmed a PDA to receive the data via a Bluetooth connectionand to record them with a timestamp. Every record contained the following information:
(T imestamp, ax, ay, az)
where:
• ax is the vertical acceleration.
• ay is the lateral acceleration.
• az is the acceleration in the progress direction.
During a first analysis of data, we realized that ax and ay were indicative for the states we wanted todistinguish. az was more difficult to use because it has to do with the walking speed and this speed can varyfor the same person. Therefore, we used the two first accelerations as input to the fuzzification process.
4.2.1. Normalization
As an initial step, we normalized the signals. First, we subtracted the average making them to becentered on zero. Then, we rescaled them in the range given by their standard deviations. This allowed usto perform the analysis at the scale that gives us more information about the signal changes. Fig. 2 showsan example of the evolution of these two accelerations during one cycle and a half.
6

Figure 2: Vertical and lateral acceleration in g units during the four states of the human gait cycle.
4.2.2. Fuzzification
This step allows defining the first-order perceptions. In this level of granularity, the linguistic variablestake a value belonging to the set {Negative, Zero, Positive}. Fig. 3 shows the drawing of these trapezoidallinguistic labels over the vertical axis. Note that, thanks to the normalization step, each trapezoidal linguisticlabel covers one third of the total amplitude.
4.3. Set of rules
The states were defined as follows:
• x1: Reference foot is in stance phase and opposite foot is in stance phase (double limb support).
• x2: Reference foot is in stance phase and opposite foot is in swing phase (reference limb single support).
• x3: Reference foot is in stance phase and opposite foot is in stance phase (double limb support butdifferent of x1 because the feet position).
• x4: Reference foot is in swing phase and opposite foot is in stance phase (opposite limb single support).
We used a set of fuzzy rules to explain the signal evolution between the different states. In contrast tomachine learning techniques, we derived the rules from the designer ’s perceptions about the human gaitacceleration signals. The use of linguistic rules allows the designer to include his/her experience about thehuman gait in a easy way.
The model is able to synchronize without the need of doing previous segmentation of the signal. Wechose the initial state X0 = {x1} (X1 = 1 and Xi = 0 ∀i 6= 1), i.e., the FFSM synchronizes with the signalwhen the conditions of x1 are fulfilled.
7

Figure 3: Trapezoidal linguistic labels for the normalized vertical acceleration.
4.3.1. Conditions of amplitude
We defined the conditions of amplitude to remain in a state or to change between states by combiningthe information obtained from the sensors and the available generic knowledge about the human gait. Wedefined 8 rules (4 to remain in each state and 4 to change between states).
We aggregated the conditions to remain in a specific state using OR to make the system more robustagainst spurious in the input. For example, the lateral acceleration (ay) can fluctuate in the state x3 whilethe vertical acceleration (ax) matches its condition.
We aggregated the conditions to change between states using AND, trying to make the changes of stateas sharp as possible.
• R11 : IF X1(t) ∨ (ax = P ) ∨ (ay = P ) THEN X1(t+ 1)
• R22 : IF X2(t) ∨ (ax = N) ∨ (ay = Z) THEN X2(t+ 1)
• R33 : IF X3(t) ∨ (ax = P ) ∨ (ay = N) THEN X3(t+ 1)
• R44 : IF X4(t) ∨ (ax = N) ∨ (ay = Z) THEN X4(t+ 1)
• R12 : IF X1(t) ∧ (ax = N) ∧ (ay = Z) THEN X2(t+ 1)
• R23 : IF X2(t) ∧ (ax = P ) ∧ (ay = N) THEN X3(t+ 1)
• R34 : IF X3(t) ∧ (ax = N) ∧ (ay = Z) THEN X4(t+ 1)
• R41 : IF X4(t) ∧ (ax = P ) ∧ (ay = P ) THEN X1(t+ 1)
4.3.2. Temporal conditions
We applied self-correlation analysis to the vertical acceleration to obtain an approximation of the signalperiod (T ). In agreement with our knowledge about the typical human gait cycle, we assigned to each stateapproximately a 25 % of T . Fig. 4 shows the linguistic labels Tstay and Tchange used to define the temporalconstraints. Tstay was tuned manually with the conservative criteria of ensuring that the state will span atleast the 25 %. Tchange was designed to allow the change of state as soon as the conditions for changing arefulfilled.
Adding these temporal conditions, the rules were formulated as follows:
8

Figure 4: Temporal conditions for the state xi.
• R11 : IF X1(t) ∨ (ax = P ) ∨ (ay = P ) ∨ (d1 = Tstay) THEN X1(t+ 1)
• R22 : IF X2(t) ∨ (ax = N) ∨ (ay = Z) ∨ (d2 = Tstay) THEN X2(t+ 1)
• R33 : IF X3(t) ∨ (ax = P ) ∨ (ay = N) ∨ (d3 = Tstay) THEN X3(t+ 1)
• R44 : IF X4(t) ∨ (ax = N) ∨ (ay = Z) ∨ (d4 = Tstay) THEN X4(t+ 1)
• R12 : IF X1(t) ∧ (ax = N) ∧ (ay = Z) ∧ (d1 = Tchange) THEN X2(t+ 1)
• R23 : IF X2(t) ∧ (ax = P ) ∧ (ay = N) ∧ (d2 = Tchange) THEN X3(t+ 1)
• R34 : IF X3(t) ∧ (ax = N) ∧ (ay = Z) ∧ (d3 = Tchange) THEN X4(t+ 1)
• R41 : IF X4(t) ∧ (ax = P ) ∧ (ay = P ) ∧ (d4 = Tchange) THEN X1(t+ 1)
where di is the duration of the state xi.Fig. 2 represents the degree of activation Xi of the four states of the FFSM following the evolution of
the human gait. It shows how this set of fuzzy rules is able to separate efficiently the four phases of thehuman gait.
4.4. Output variables
After some experimentation, we realized that, although ay is useful to distinguish between the states x1
and x3, it does not provide relevant information for our purpose. Also, as mentioned above, the accelerationin the direction of march az depends on the person’s walking speed.
Indeed, the use of these variables or other additional signals, e.g. gyroscopes, could be considered.However the algorithms would grow up in complexity and we should lose the advantage of the simplicity.
Therefore, once identified the four phases in the signal, we focused on the characteristics of the verti-cal acceleration ax. This acceleration provided sufficient information for our purpose. Here in after, forsimplicity, we denote the vertical acceleration as a.
Fig. 5 shows the evolution of a along the four phases. The four rectangles represent graphically therelevant characteristics of each cycle of a specific gait. The dimensions of every rectangle summarize thevalues of the acceleration while staying in each state, i.e. they are a graphical representation of a protoformof the human gait. Therefore, the output of the FFSM is a vector:
yi =(ti, ai, σti , σai)
The elements of this vector are:
9

• ti: The horizontal coordinate of the center of each rectangle is the temporal “center of mass” of thevertical acceleration in the state xi. Note that the “mass” in every instant t is calculated as the verticalacceleration a(t) weighted by the degree of activation Xi(t) of the state xi.
ti =
T∑
t=0t·a(t)·Xi(t)
T∑
t=0a(t)·Xi(t)
• ai: The vertical coordinate of the center of each rectangle is the average of the vertical accelerationduring the state xi.
ai =
T∑
t=0a(t)·Xi(t)
T∑
t=0Xi(t)
• σti : The width of each rectangle is the standard deviation of the temporal distribution of the verticalacceleration weighted by the degree of activation Xi(t) of the state xi.
σ2ti=
T∑
t=0(t−ti)
2·a(t)·Xi(t)
T∑
t=0a(t)·Xi(t)
• σai: The height of each rectangle is the standard deviation of the vertical acceleration during the state
xi.
σ2ai=
T∑
t=0(a(t)−ai)
2·Xi(t)
T∑
t=0Xi(t)
where:
• a(t) is the vertical acceleration at the instant t.
• Xi(t) is the degree of activation of the state xi at the instant t.
• T is the duration of a complete cycle.
5. Relevant characteristics
Using this model, we were able to analyze the differences among gaits of different people. We used theareas of the rectangles to distinguish the peculiarities of each specific gait.
In agreement with the section above, each cycle was modeled using four rectangles (states) and eachrectangle was represented by the vector yi =(ti, ai, σti , σai
).As mentioned above, we used three characteristics of the human gait that are useful to recognize the
gait style corresponding to a specific person, namely, homogeneity, symmetry and the relation between theweight and the length of legs.
5.1. Homogeneity
The Homogeneity (H) was obtained by comparing a gait with itself. The Homogeneity is based on thestandard deviation of the sequence of rectangles of each state.
The Homogeneity of the state xi (Hi) was formulated as follows:
Hi =
{
Ai−std(Ai)
Aiif std(Ai) < Ai
0 if std(Ai) ≥ Ai
where:10

Figure 5: Characteristic rectangles and vertical acceleration in g units during the human gait cycle.
• Ai are the areas of the rectangles corresponding to the state xi in the total number of available cycles.
• Ai is the mean of this sequence of areas.
• std(Ai) is the standard deviation of this sequence of areas.
This equation provides a value Hi ∈ [0, 1]. A low standard deviation indicates similar areas, i.e., Homo-geneity close to 1. A high standard deviation indicates differences, i.e., Homogeneity close to 0.
The total Homogeneity (H) summarizes the homogeneities of the four states as follows:
H = 14
4∑
i=1
Hi
5.2. Symmetry
Symmetry (S) was obtained by comparing the movement of both legs. Symmetry is based on comparingthe areas of the states x1 and x2 (stance and swing phase of the reference foot) versus the areas of x3 and x4
(stance and swing phase of the opposite foot). A gait will be symmetric if the areas of the states x1 and x2 aresimilar to the areas of the states x3 and x4. The Symmetry in a cycle j (Sj ∈ [0, 1]) was formulated as follows:
Sj =
{
Aj3+Aj4
Aj1+Aj2if Aj1 +Aj2 ≥ Aj3 +A4j
Aj1+Aj2
Aj3+Aj4if Aj1 +Aj2 < Aj3 +Aj4
where:Aj1, Aj2, Aj3, Aj4 are the areas of the rectangles corresponding to states x1, x2, x3, x4 in the cycle j.
The total Symmetry (S) was calculated as the average of the symmetries of the sampled cycles M :
S = 1M
M∑
j=1
Sj
11

5.3. The fourth root model
The “fourth root model” is an empiric model for estimating the distance covered with a number of stepsmeasuring the vertical acceleration [29]. This model includes an experimental parameter (C) that is prac-tically invariant for a certain person, but that varies significantly among different people. C is related withthe proportion between the legs length and the weight. It is calculated experimentally making a person towalk a known distance. The stride length is given by the formula:
Step = C · (amax − amin)1/4
where:
• Step is the stride length.
• C is the experimental parameter.
• amax is the maximum of the vertical acceleration.
• amin is the minimum of the vertical acceleration.
The stride length can also be calculated as the product between the walking speed of the person (V )and the period of the corresponding cycle (T ):
Step = C · (amax − amin)1/4
Step = V · T
}
⇒ CV = T
(amax−amin)1/4
We considered that V is approximately constant for each person as a function of his/her selection (seesection 6). Therefore, we assumed that C/V was a constant K:
K = T(amax−amin)1/4
where:
• T is the mean of the period during various cycles.
• amax is the mean of the maximum vertical accelerations during various cycles.
• amin is the mean of the minimum vertical accelerations during various cycles.
We used this constant K as a third invariant characteristic of the human gait.
5.4. Authentication
We applied these formulas to obtain a vector of characteristics (H, S, K) for each person in a database.Empirically,we tested that this vector provided sufficient separation among the gaits of different persons whereas thesamples of the same person were distributed randomly around a center of gravity. Therefore, we usedGaussian membership functions to represent the distribution of values of these variables on the axes of athree-dimensional domain.
These membership functions were formulated as follows:
µH = e−
(H−H)2
2·σ2H
µS = e−
(S−S)2
2·σ2S
µK = e−
(K−K)2
2·σ2K
where:
12

Figure 6: Gaussian membership functions for two different people.
• H is of the mean the Homogeneity values of a person and σH the standard deviation.
• S is the mean of the Symmetry values of a person and σS the standard deviation.
• K is the mean of the K values of a person and σK the standard deviation.
Fig. 6 shows an example of two clusters with their respective membership functions.The process of authentication of a person was performed using a sample of his/her gait (H∗, S∗, K∗).
We calculated the membership values (µH∗ , µS∗ , µK∗). And then, the intersection of these conditions wasformulated as follows:
Score = min(µH∗ , µS∗ , µK∗)
where Score represents the degree of membership of this sample to the cluster associated to the authen-ticated person. If Score > λ the human gait is accepted, being λ a threshold that depends on the application.
In summary, Fig. 7 shows a granular network that explains the perception that allows the designer toidentify a person using the human gait.
6. Experimentation
We tested this pattern recognition method by authenticating one person among eleven people. Subjectswere instructed to walk at a self-selected, comfortable walking speed. Each subject walked 20 samples of 10steps each, so we obtained a total of 220 samples (20 genuine and 200 impostors).
Each sample was tested using the leave-one-out cross validation (K-fold cross-validation with K beingequal to the number of observations in the original sample) against the remaining training data.
The Equal Error Rate (EER) is obtained from the intersection between the False Acceptance Rate (FAR)and the False Rejection Rate (FRR) versus the threshold λ (see Fig. 8). With our experimental data, weobtained the values: λ = 0.0118 and EER = 3 %.
In order to show the advantage of our approach, we studied the results obtained by other researchers(See table 1). It is worth to remark that these Equal Error Rates are relatively comparable. These worksuse different number of subjects, different sensor configuration and different methods to analyze the signal.
We have summarized the differences and similarities of these works as follows:
13

Figure 7: The granular network explaining the n’th-order perception needed for authenticate a gait.
Ailisto et al. [11] authenticate users of portable devices from the accelerations obtained by a three-axis accelerometer placed on the belt, at back. They divide the signal into one step long parts using themaximum and the minimum of the signal. They assume that the right and left steps are not necessarilysymmetrical. They used 36 subjects that walked in their normal, fast and slow speed. They perform threedifferent analysis: correlation, frequency domain and they use two variants of data distribution statisticsmethod. They obtaining an EER of 7 %, 10 %, 18 % and 19 % respectively.
Gafurov et al. [12] authenticate 22 subjects walking in their normal speed wearing a three-axial ac-celerometer in their hip. They normalize each gait cycle in time. They use a cycle length analysis methodto obtain an EER of 16 %. In a subsequent paper [13] they authenticate 21 subjects with the accelerometerfixed on the ankle. They use the same on time-normalized cycle length method and histogram similarityanalysis to obtain an EER of 9 % and 5 % respectively. Finally, in [14] they authenticate 50 subjects with theaccelerometer placed in the trousers pocket. They perform the same preprocessing and use four methods:absolute distance, correlation, histogram and higher order moments. The best result (with the absolutedistance) is an EER of 7 %.
Rong et al. [15] use a three-axis accelerometer fixed on the user’s waist to obtain the signal of 21 subjects.They perform a preprocessing of the signal that includes wavelet denoising, gait cycles dividing and dynamictime warping. They analyze the signal in time and frequency domains obtaining an EER of 5.6 % and 21.1% respectively.
Table 1: Summary of accelerometer-based Gait Pattern Recognition Works.
Work # Subjects EER %Ailisto et al. [11] 36 7, 10, 18, 19Gafurov et al. [12] 22 16Gafurov et al. [13] 21 5, 9Gafurov et al. [14] 50 7.3, 9.2, 14, 20Rong et al. [15] 21 5.6, 21.1
This paper 11 3
14

Figure 8: FAR and FRR versus the threshold λ
In our approach, the segmentation or preprocessing of the signal was not needed. The FFSM was ableto divide the acceleration signals into cycles and to synchronize with the signal automatically.
The main difference of our contribution is the use of a fuzzy linguistic model for describing the humangait. The flexibility of this paradigm allows the designer to focus the model on the relevant characteristicsof the signal for an specific purpose
7. Conclusions
In this paper, we have contributed to the field of pattern recognition presenting a new method of signalanalysis based on the CTP. We have explored the possibility of using a model of the perceptions of a humanobserver as a complement to the well established automatic machine learning procedures.
We have focused our effort on modeling the perception of a quasi-periodic signal. Specifically, we haveproposed a flexible model of the human gait that allows representing linguistically the relative variations ofperiod and amplitude of this type of signal.
8. Acknowledgements
This work has been partially funded by Foundation for the Advancement of Soft Computing (Asturias,Spain) and Spanish government (CICYT) under grant: TIN2008-06890-C02-01.
References
[1] C. V. K. Rao, On fingerprint pattern recognition, Pattern Recognition 10 (1978) 15–18.[2] M. Faundez-Zanuy, On-line signature recognition based on VQ-DTW, Pattern Recognition 40 (3) (2007) 981–992.[3] L. Rodriguez-Linares, C. Garcıa-Mateo, On combining classifiers for speaker authentication, Pattern Recognition 36 (2)
(2003) 347–359.[4] J. Hayfron-Acquah, M. S. Nixon, J. N. Carter, Automatic gait recognition by symmetry analysis, Pattern Recognition
Letters 24 (13) (2003) 2175–2183.[5] R. Zhang, C. Vogler, D. Metaxas, Human gait recognition at sagittal plane, Image and Vision Computing 25 (3) (2007)
321–330.[6] J. E. Boyd, J. J. Little, Biometric gait recognition, in: Advanced Studies in Biometrics, Springer, Berlin, 2005, pp. 19–42.[7] T. Lam, R. Lee, D. Zhang, Human gait recognition by the fusion of motion and static spatio-temporal templates, Pattern
Recognition 40 (9) (2007) 2563–2573.[8] N. Boulgouris, Z. Chi, Human gait recognition based on matching of body components, Pattern Recognition 40 (2007)
1763–1770.
15

[9] N. Boulgouris, X. Huang, Gait recognition based on multiple views, EURASIP Journal on Advances on Signal Processing(2008).
[10] M. Ahmad, S.-W. Lee, Human Action Recognition Using Shape and CLG-Motion Flow from Multi-View Image Sequences,Pattern Recognition 41 (7) (2008) 2237–2252.
[11] H. A. Ailisto, M. Lindholm, E. Vildjiounaite, S. Makela, J. Mantyjarvi, Identifying users of portable devices from gaitpattern with accelerometers, in: Proc. IEEE International Conference on Acoustics, Speech and Signal Processing, 2005,pp. 973–976.
[12] D. Gafurov, E. Snekkenes, T. E. Buvarp, Robustness of biometric gait authentication against impersonation attack, in:Proc. First International Workshop on Information Security (IS’06), OnTheMove Federated Conferences (OTM’06), 2006,pp. 51–59.
[13] D. Gafurov, K. Helkala, T. Sondrol, Gait recognition using acceleration from MEMS, in: Proc. First IEEE InternationalConference on Availability, Reliability and Security (ARES), 2006, pp. 479–488.
[14] D. Gafurov, E. Snekkenes, P. Bours, Gait authentication and identification using wearable accelerometer sensor, in: Proc.IEEE Workshop on Automatic Identification Advanced Technologies, 2007, pp. 220–225.
[15] L. Rong, Z. Jianzhong, L. Ming, H. Xiangfeng, A wearable acceleration sensor system for gait recognition, in: Proc. IEEEConference on Industrial Electronics and Applications (ICIEA), 2007, pp. 2654–2659.
[16] H. Su, F. Huang, Gait recognition using principal curves and Neural Networks, Lecture Notes In Computer Science 3973(2006) 238–243.
[17] A. Sundaresan, A. R. Chowdhury, A Hidden Markov Model based framework for recognition of humans from gait sequences,in: Proc. ICIP, Vol. 2, 2003, pp. 93–96.
[18] M. Cheng, M. Ho, C. Huang, Gait analysis for human identification through manifold learning and HMM, PatternRecognition 41 (8) (2008) 2541–2553.
[19] J. N. Mordeson, D. S. Malik, Fuzzy Automata and Languages: Theory and Applications (Computational Mathematics),Chapman & Hall/CRC, 2002.
[20] L. A. Zadeh, From computing with numbers to computing with words - from manipulation of measurements to manipu-lation of perceptions, IEEE Transactions on Circuits and Systems 1 (1999) 1–10.
[21] L. A. Zadeh, Toward human level machine intelligence - is it achievable? the need for a paradigm shift, IEEE ComputationalIntelligence Magazine 1 (2008) 1–10.
[22] L. A. Zadeh, Fuzzy sets and information granularity, in: Gupta M. Ragade R, Yager R (eds) Advances in fuzzy Set Theoryand Applications. North-Holland Publishing CO, 1979.
[23] L. A. Zadeh, Towards a theory of fuzzy information granulation and its centrality in human reasoning and fuzzy logic,Fuzzy Sets and Systems 90 (1997) 111–127.
[24] L. A. Zadeh, The concept of linguistic variable and its application to approximate reasoning, Information Sciences 8 (3)(1975) 199–249.
[25] L. A. Zadeh, Generalized theory of uncertainty (GTU) - principal concepts and ideas, Computational Statistics & DataAnalysis 51 (2006) 15–46.
[26] G. Trivino, A. van der Heide, G. Bailador, Fuzzy sets of quasy-periodic signals, in: Proc. XIV Spanish Conference onTecnology and Fuzzy Logic (ESTYLF), 2008, pp. 293–298.
[27] G. Trivino, A. van der Heide, An experiment on the description of sequences of fuzzy perceptions, in: Proc. 8th Interna-tional Conference on Hybrid Intelligent Systems (HIS), 2008, pp. 228–233.
[28] G. Trivino, A. van der Heide, Linguistic summarization of the human activity using skin conductivity and accelerometers,in: Proc. Conference Information Processing and Management of Uncertainty in Knowledge Based Systems (IPMU), 2008,pp. 1583–1589.
[29] H. Weinberg, Using the ADXL202 in pedometer and personal navigation applications, Tech. rep., Analog Devices (2002).
16