International Perceptions and Aspirations
12
The Australian Centre for Entrepreneurship Research ‘CAUSEE’ Research Briefing Paper INTERNATIONAL PERCEPTIONS AND ASPIRATIONS March 2011
-
Upload
independent -
Category
Documents
-
view
2 -
download
0
Transcript of International Perceptions and Aspirations

The Australian Centre for Entrepreneurship Research‘CAUSEE’ Research Briefing Paper
INTERNATIONAL PERCEPTIONS AND ASPIRATIONS
March 2011

INTERNATIONAL PERCEPTIONS AND ASPIRATIONS
The Australian Centre for Entrepreneurship Research‘CAUSEE’ Research Briefing Paper
Highlights• Australian business founders’ international background is aligned with overall population
statistics – 25 per cent of them are born outside Australia.
• International experience plays a significant role in the overall experience of founders – this is even more prevalent in our High Potential over sample.
• Between 20 and 30 per cent of founders view ‘being international’ as the norm amongst their industry peers and competitors; however this perception trends downward over the three waves of our analysis.
• International opportunities are seen as highly attractive by High Potential start-ups while regular start-ups do not necessarily hold the same view.
• Expansion into additional overseas countries is viewed as being relatively easy by many current exporters.
• The level of expected sales from international customers trends downwards over the three waves of data providing evidence of learning and adaptation that exists within these new ventures.
• While international aspirations tend to be relatively high early in the start-up process, the actual degree of internationalizations of established young firms is considerably lower, suggesting that that many early-stage founders are overly optimistic about the attractiveness and accessibility of international opportunities.
Industry Partners

1
The CAUSEE StudyThe Comprehensive Australian Study of Entrepreneurial Emergence research project, or CAUSEE, is the largest study of business start-ups ever undertaken in Australia. It is the only such study to track ventures over time. The project provides an exciting opportunity to improve our understanding of independent entrepreneurship in Australia.
CAUSEE has identified a random sample of approximately 600 emerging, but not yet operating business start-ups (henceforth Nascent Firms, or NFs for short). As well, the project has also identified another random sample of approximately 600 newly established firms that had already commenced trading but not been operational for more than 4 years (henceforth Young Firms or YFs). These random samples are intended to give a fair picture of what Australian business start-ups are like ‘in general’.. In addition, judgment based (i.e., non-random) over samples of some 100 High Potential start-ups in each category have been identified in order to have sufficient representation of this potentially more important type of start-ups. Firms were considered ‘High Potential’ based on a combination of founders’ education and experience; their aspirations for the start-up, and its degree of technological sophistication. All firms are being tracked over a four-year period.
Figure 1 illustrates the different samples and the number of cases at the first wave of data collection.
Figure 1: From where was the data obtained?
Regular Start-Ups
Judgment Sampling
Random Sampling
Type
Nascent Firms (NF)(625 firms)
Young Firms (YF)(561 firms)
High Potential Start-Ups
Stage of Development
Nascent Firms (NF)(106 firms)
Young Firms (YF)(120 firms)
Post Start-UpPre Start-Up
CAUSEE aims to uncover the factors that initiate, hinder and facilitate the process of emergence of new economic activities and organisations. Unlike much previous entrepreneurship research, the CAUSEE project does not put a singular focus on the ‘entrepreneur(s)’. Assessing key characteristics of the venture including the venture idea, such as the degree and type of novelty the emerging venture has compared to what is already in the market, are also an important part of the research. Equally importantly is looking at the venture and the outcomes it may achieve along with the relationship between the characteristics of the venture idea and achieved outcomes.
The focus of this report 2010 marked the completion of data collection for year three (Wave 3) of the CAUSEE study. This report uses data from the first three years.
Australia’s population is noted for its mixed international background. The ABS 2006 census reports showed that almost a quarter of Australian population were born overseas, contributing to a high degree of cultural diversity.
This report examines the international background and experience of Australian business founders as well as their aspired and actual participation in international markets.
In this research briefing paper, we compare Nascent Firm (NF) and Young Firm (YF) groups and also ‘Regular’ start-ups in both categories with their High Potential counterparts. When we compare characteristics at one point in time the analysis uses data from the first interview and sample sizes are of the order indicated in Figure 1. When we compare development over time the analysis includes only those cases that have survived and continued to participate in the study over three years, which means that the samples are smaller. Unless otherwise stated the findings we comment on are ‘statistically significant’. That is, there is less than 5 per cent risk that they would appear by chance if there is no true difference in the population from which the samples were drawn.

2
Founder’s international backgroundFigure 2 shows that around 25 per cent of NF and YF founders were born outside Australia. Interestingly, this is almost exactly consistent with Australian population statistics generally which showed at June 30, 2009 that 25.6 per cent of Australian residents were born overseas. (Australian Immigration fact Sheet 15 Population Projections, June 2009). In short, immigrants are neither over nor under represented as founders.
Figure 2: Founders Background
Born in Australia Born overseas
70
80
90
100
60
50
40
30
20
10
0Nascent Young
26.6%
73.4%
25.7%
74.3%
Figure 3: Founders and Parents Backgrounds
Self or parent born in Australia Self or parent born overseas
70
80
90
100
60
50
40
30
20
10
0Regular Nascent
High Potential Nascent
Regular Young
High Potential Young
48.6%
51.4%
42.6%
57.4%
51.9%
48.1%
43.3%
56.7%
Previous research from the USA has suggested that immigrants create a disproportionate number of ‘high tech’ or high potential ventures. This has recently been refuted by leading entrepreneurship scholar Scott Shane (see http://smallbiztrends.com/2010/06/are-immigrants-really-more-likely-to-become-high-tech-entrepreneurs.html). Figure 3 demonstrates that our research has found a slight tendency for higher representation in our High Potential (HP) group of those founders who were either born abroad, or had foreign parents. It should be noted that this effect is only slight and statistically uncertain.
Figure 4 shows the geographic or ethnic origin of founders who have an international background (either self or parent born abroad). The differences here reflect the relative size of these groups in the Australian population. No statistically significant differences exist between the three identified groups (Europeans, Asians and Others) in terms of their propensity to engage in business start-ups.
Figure 4: Origins of Founders or Parents
European decent Asian overseas Something else overseas
70
80
90
100
60
50
40
30
20
10
0Nascent Young
18.9%
7.3%
73.8%
15.1%
5.9%
79.1%

3
Founders’ international experienceWhat about other international experiences that founder’s may have had? We firstly asked how many years the founder had spent abroad.
A majority, namely 60 per cent, of ‘Regular’ founders have spent some time overseas after the age of 18 years. However less that 25 per cent have 5 years or more international experience. Our analysis of the high potential start-ups shows that the level of international experience is much higher with over 40 per cent of the start-ups having founders with more than five years of overseas experience. Whilst this higher level can in part be explained by the fact that HP firms are more likely to have multiple founders, it continues to hold true in an analysis including only solo founders.
Figure 5: International Experience
none one year or less 2–4 years 5–9 years more than 10 years
70
80
90
100
60
50
40
30
20
10
0Regular Nascent
High Potential Nascent
Regular Young
High Potential Young
17.3%
6.6%
13.7%
21.0%
41.5%
15.6%
7.8%
12.3%
22.8%
41.5%
34.3%
12.7%
15.7%
19.6%
17.6%
31.6%
11.1%
21.4%
20.5%
15.4%
Similarly close to 40 per cent of regular founders have either worked or studied for 3 months or more in another country. Again the numbers are much higher for HPs with close to two thirds claiming such experience being represented on the founder team and close to 20 per cent claiming experience from 5 countries or more.
Figure 6: Work/Study Experience in Foreign Countries
none one country 2–4 countries 5 plus countries
70
80
90
100
60
50
40
30
20
10
0Regular Nascent
High Potential Nascent
Regular Young
High Potential Young
62.1%
7.2%
15.3%
15.3%
63.1%
5.0%12.4%
19.4%
37.7%
19.8%
27.4%
15.1%
36.7%
18.3%
34.2%
10.8%
In summary Australian business founders do have a high degree of international background and/or experience. Our research finds that 25 per cent are born abroad, a further 20 per cent have at least one parent who has been born abroad, and 60 per cent either have such family background/heritage or have spent more than one year abroad for work or study. However there is no evidence that individuals with international background are more likely to become business founders. Furthermore of those with international background, there is no statistically significant difference between Europeans, Asians and others in the likelihood to engage in a business start-up.
Figure 7: International Experience or Background Compared
none some
70
80
90
100
60
50
40
30
20
10
0Regular Nascent
High Potential Nascent
Regular Young
High Potential Young
37.4%
62.6%
42.3%
57.7%
21.2%
78.8%
25.0%
75.0%
Despite the HP over sample having only a slight over representation of international background by birth, HP ventures are much more likely to have international work and study experience on their founding team. They also have more years of such experiences and have gained that experience from a larger number of countries.

4
Perceived internationalisation of the competitive market.An important gauge of competitive international activity is the extent to which ones competitors are operating outside Australia. We asked ‘to what extent do your Australian based competitors tend to operate in international markets. Figure 8 displays how the answers were distributed across the three response categories.
Figure 8: Perceptions of Local Competitors Operating in Foreign Markets
to a large extent to some extent not at all
70
80
90
100
60
50
40
30
20
10
0Regular Nascent
High Potential Nascent
Regular Young
High Potential Young
44.6%
34.1%
21.3%
47.7%
32.7%
19.7%
32.3%
39.4%
28.3%
34.8%
34.8%
30.4%
Around 20 per cent of ‘Regular’ start-ups and 30 per cent of high potentials view being internationally present as the ‘norm’ amongst their competitors.
We further extended this analysis to considering the shift in this perception over the three years of data. (Wave 1, Wave 2 and Wave 3)
Figure 9: The Trend of Perception ‘To A Large Extent’
35
40
45
50
30
25
20
15
10
5
0Wave 1 Wave 2 Wave 3
Regular Nascent
Regular Young
High Potential Nascent
High Potential Young
37.3%
28.6%
21.7%
20.0%
15.7%
12.2%
26.8%
13.2%
10.3%
28.6%
18.5%
17.6%
Whilst there is a downward adjustment in the degree to which founders view their competitors’ international behaviour, its adjustment is more likely to reflect what founders learn over time rather than real changes in the competitive environment.
How attractive are international opportunities?Further support for the extent to which new ventures learn and adapt over the venture creation journey were seen when we considered the responses to ‘How attractive are opportunities for your business in international markets compared to the Australian market?’
Figure 10: International Market Opportunities Attractiveness
more attractive about the same less attractive
70
80
90
100
60
50
40
30
20
10
0Regular Nascent
High Potential Nascent
Regular Young
High Potential Young
39.2%
35.1%
25.7%
53.4%
28.4%
18.2%
4.8%
21.9%
73.3%
16.8%
29.4%
53.8%
There are huge differences at Wave 1 in the perception of the attractiveness of international markets. Among ‘Regular’ start-ups a larger proportion views the domestics market as relatively more attractive. Among HP start-ups, the majority is of the view that international markets are more attractive. In addition, YFs relative preference for international markets is lesser than that of NFs (both for ‘Regular’ and HP start-ups).
Among survivors over time, these perceptions develop over the three-year sample period as shown in Figure 11.
Figure 11: International Trends ‘More Attractive’ Compared between Waves
70
80
90
100
60
50
40
30
20
10
0Wave 1 Wave 2 Wave 3
Regular Nascent
Regular Young
High Potential Nascent
High Potential Young
76.3%
51.5%
28.3%
16.3%
69.0%
55.4%
27.3%
15.4%
65.0%
65.0%
65.0%
11.5%

5
The general trend shows that international markets are seen as relatively less attractive over time. The Wave 1 difference between NF and YF suggests that this is in part due to learning over time. However, the Global Financial Crisis may have also contributed to this trend. It is important to note that Lehman Brothers’ bankruptcy happened in the middle of our second wave of data collection. Our ‘Learning and Adaptation Report’ (http://www.bus.qut.edu.au/research/ace/news-events/papers.jsp) provides further support for these perception adjustments in more detail.
We explored international perceptions further by asking those who were not yet active exporters ‘How easy or difficult do you think it would be for your business to start selling to customers in other countries?’
Figure 12: Ease/Difficulty of Commencing International Sales
very difficult somewhat difficult somewhat easy very easy
70
80
90
100
60
50
40
30
20
10
0Regular Nascent
High Potential Nascent
Regular Young
High Potential Young
8.7%
17.1%
27.4%
46.8%
2.4%11.2%
19.7%
66.8%
12.2%
14.3%
61.2%
12.2%
23.9%
45.7%
30.4%
Current HP non-exporters perceive commencing export activities as less difficult than do ‘Regular’ start-ups. Within both categories, NFs perceive commencing exporting as less difficult than do YFs. However, even
in the most optimistic category, High Potential NFs, it is just a little more than a quarter (26.5 per cent) that see commencing export as very or somewhat easy. In short, the majority in all groups see commencing exporting as somewhat or very difficult.
What about expanding markets to additional countries?For those already active in international sales we explored the perceived difficulty for new venture founders to further expand their existing international business by selling to customers in additional countries.
Figure 13: Ease/Difficulty of Commencing Further International Sales
very difficult somewhat difficult somewhat easy very easy
70
80
90
100
60
50
40
30
20
10
0Regular Nascent
High Potential Nascent
Regular Young
High Potential Young
24.1%
37.0%
29.6%
9.3%
25.0%
22.4%
35.5%
17.1%
21.9%13.3%
37.5%
34.4%
6.3%
24.4%
48.9%
13.3%
Among those who are active exporters, the majority think that it would be somewhat or very easy to expand into additional countries. There is also a tendency for NFs to perceive that expanding export activity is less difficult to do than YFs. This provides further support for the value that experience seems to play in developing new venture founders expertise and confidence.
6
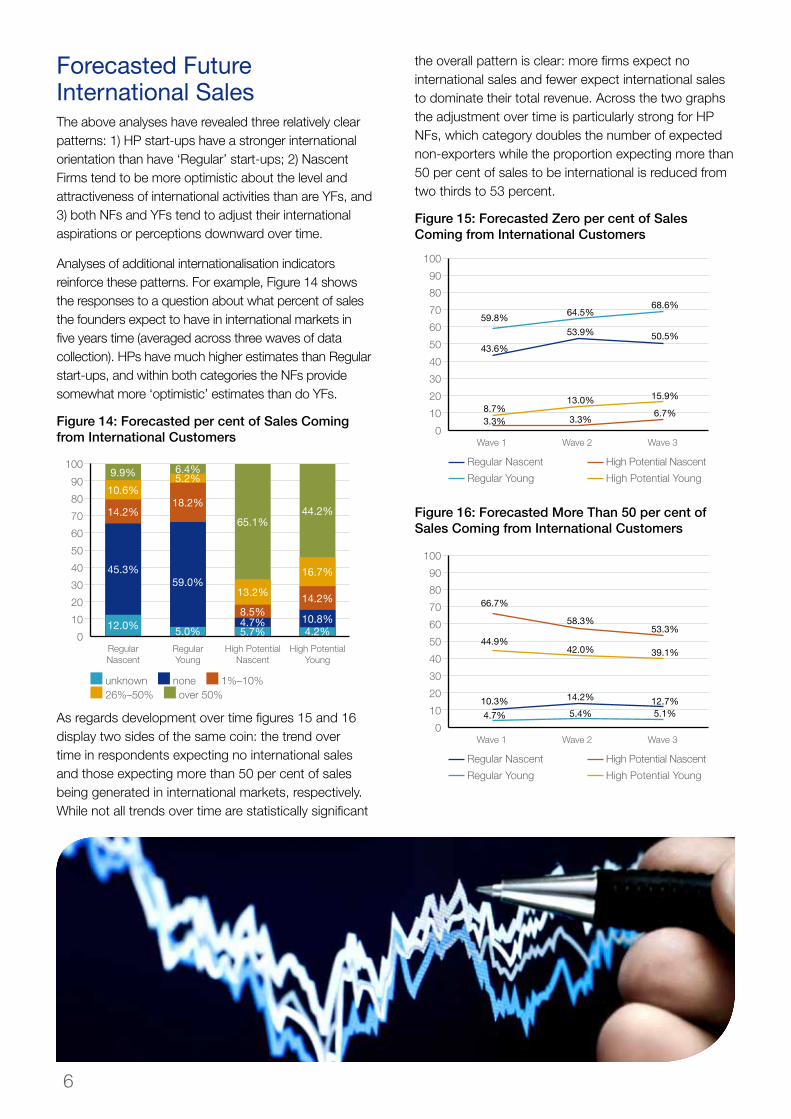
Forecasted Future International SalesThe above analyses have revealed three relatively clear patterns: 1) HP start-ups have a stronger international orientation than have ‘Regular’ start-ups; 2) Nascent Firms tend to be more optimistic about the level and attractiveness of international activities than are YFs, and 3) both NFs and YFs tend to adjust their international aspirations or perceptions downward over time.
Analyses of additional internationalisation indicators reinforce these patterns. For example, Figure 14 shows the responses to a question about what percent of sales the founders expect to have in international markets in five years time (averaged across three waves of data collection). HPs have much higher estimates than Regular start-ups, and within both categories the NFs provide somewhat more ‘optimistic’ estimates than do YFs.
Figure 14: Forecasted per cent of Sales Coming from International Customers
unknown none 1%–10% 26%–50% over 50%
70
80
90
100
60
50
40
30
20
10
0Regular Nascent
High Potential Nascent
Regular Young
High Potential Young
10.6%
9.9%
14.2%
45.3%
12.0%
5.2%6.4%
18.2%
59.0%
5.0%
13.2%
65.1%
8.5%4.7%5.7%
16.7%
44.2%
14.2%
10.8%4.2%
As regards development over time figures 15 and 16 display two sides of the same coin: the trend over time in respondents expecting no international sales and those expecting more than 50 per cent of sales being generated in international markets, respectively. While not all trends over time are statistically significant
the overall pattern is clear: more firms expect no international sales and fewer expect international sales to dominate their total revenue. Across the two graphs the adjustment over time is particularly strong for HP NFs, which category doubles the number of expected non-exporters while the proportion expecting more than 50 per cent of sales to be international is reduced from two thirds to 53 percent.
Figure 15: Forecasted Zero per cent of Sales Coming from International Customers
70
80
90
100
60
50
40
30
20
10
0Wave 1 Wave 2 Wave 3
Regular Nascent
Regular Young
High Potential Nascent
High Potential Young
59.8%64.5%
68.6%
50.5%
15.9%
6.7%
53.9%
13.0%
3.3%
43.6%
8.7%3.3%
Figure 16: Forecasted More Than 50 per cent of Sales Coming from International Customers
70
80
90
100
60
50
40
30
20
10
0Wave 1 Wave 2 Wave 3
Regular Nascent
Regular Young
High Potential Nascent
High Potential Young
44.9%
10.3%
4.7%
66.7%
58.3%53.3%
39.1%
12.7%5.1%
42.0%
14.2%
5.4%

7
Dreams and RealityA perhaps even more telling way of portraying the adjustment that takes place over time is displayed in Table 1. This analysis compares the 5-year outlook of nascent firms (i.e., NFs responses in the wave of interviewing) with what surviving firms actually have achieved by the time they have operated in the market for about 5 years (i.e., surviving YFs responses in the third wave interviews). In a sense, this compares the ‘dream’ at early stage with the ‘reality’ experienced after having operated in the market for a few years.
The results show that for both ‘Regular’ and HP start-ups, international aspirations tend to be MUCH higher than realization. It is important to note that this analysis compares categories; it does not actually follow the exact same firms over time. It is also important to note that these results do not reveal whether the internationally active firms are more or less financially successful than others, or whether due to their lower-than-expected international sales the YFs in the third wave are doing worse financially than they expected. However, the analysis very clearly indicates relatively high aspirations for international activity early on, which are not being realized as quickly or to the extent expected.
Table 1: Aspirations of Nascent Firms Compared to Outcomes for 5 Year Old Firms
‘Dream’ ‘Reality’Percentage of early stage ‘Regular’ nascent ventures that aspire to have…
Percentage of surviving ‘Regular’ young ventures that are about 5 years old that over the last 12 months actually had
…Any international sales: 37.9% …Any international sales: 17.2%…At least 25% international sales: 12.2% …At least 25% international sales: 4.7%…At least 50% international sales: 6.8% …At least 50% international sales: 2.4%Percentage of early stage ‘High potential’ NFs that aspire to have…
Percentage of surviving, High Potential YFs that are about 5 years old that actually have
…Any international sales: 88.7% …Any international sales: 46.4%…At least 25% international sales: 63.5% …At least 25% international sales: 18.8%…At least 50% international sales: 46.1% …At least 50% international sales: 13.0%

8
So what does all this mean?This report has considered the international aspirations and perceptions of new ventures in an Australian context. The diversity of the Australian culture is reflected in the cultural diversity of new venture founders, however there is no evidence that suggests that this diversity has any direct influence on the decision to proceed, and indeed, the likely success of operating internationally.
Our findings show a relatively high level of international activity early on in the life of start-ups, with not surprisingly, a MUCH higher level of international activity being demonstrated by High Potential start-ups.
The warning for practitioners and policy makers is that whilst HPs may be an interesting target group for policies aiming at increased international sales this should not be interpreted as HPs being the only worthwhile target: There are many, many more ‘Regular’ start-ups in the economy than HPs; hence the overall total international sales from start-ups may well be actually dominated by ‘Regulars’ contributions. Support
aimed at developing and growing international sales should be focussed on start-ups as a whole, rather than necessarily focussing on one sector or group.
There is clearly much lower international sales realization as compared with aspirations. For founders this is another reminder about the need to be realistic about what it takes to develop new ventures, especially as regards to doing business internationally. Perhaps it highlights the need to ensure that founders are being more selective in what international activities to engage in. For policy makers it provides firstly a reason for not taking aspirations as indications of what is actually going to happen; and secondly and more importantly it highlights the need to investigate these challenges in greater depth so that we can better understand what it is that hinders the rapid internationalization that many start-ups aspire for.
Doing business internationally, has a number of challenges, which, if understood in more detail, may have significant positive benefits in allowing Australian ventures to ‘soar higher’ internationally.

9

CRICOS No.00213J © QUT 2011 17729
The Australian Centre for Entrepreneurship ResearchQueensland University of TechnologyPhone +61 7 3138 2035Email [email protected] 7 Z Block, Gardens Point campus2 George Street, Brisbane Qld Australia 4001GPO Box 2434
www.bus.qut.edu.au/research/ace
Government Business
Research & Knowledge
The Australian Centre for Entrepreneurship Research
This report was prepared by
Professor Per Davidsson | Mr Neil James | Dr Marcello Tonelli
The Australian Centre for Entrepreneurship Research (ACE) aims to be the hub for research knowledge in entrepreneurship, innovation and small business studies.
We aim to be the national leader and an international top player in conducting cutting edge scholarly research on entrepreneurship. We also aim to be a primary link between research and practice in this area through building relationships with business, media and government throughout Australia.