Application Of GIS In Irrigation
26
APPLICATION OF GIS AND REMOTE SENSING IN IRRIGATION NETWORKS MANAGEMENT Abstract Irrigation is one of the most important input for an efficient and sustainable agricultural production. Irrigation experts are seeking the ways in which the water is used very efficiently. So, good and sustainable irrigation project management leads to success of irrigation. A methodology was developed using a Geographic Information System (GIS) to select, design, install and manage an irrigation system for a farm. GIS was used to develop different thematic layers, each consisting of a particular attribute required for analysis of alternative irrigation system types. These layers included data such as: topography, soil texture, soil water retention, bulk density, infiltration rate of water and field drainage system. These layers were used with water availability and water demand to design and plan the farm irrigation systems. GIS includes the implementation of following applications: land use mapping, irrigated area mapping, detection of heterogeneities, irrigation monitoring, radiative frost monitoring, and flooded area mapping. Remote sensing alone cannot be sufficient to run all these applications but an association with GIS seems to be very promising in order to improve some of the existing applications and also in development of new applications. Introduction
-
Upload
independent -
Category
Documents
-
view
0 -
download
0
Transcript of Application Of GIS In Irrigation

APPLICATION OF GIS AND REMOTE SENSING INIRRIGATION
NETWORKS MANAGEMENT
AbstractIrrigation is one of the most important input for anefficient and sustainable agricultural production.Irrigation experts are seeking the ways in which thewater is used very efficiently. So, good andsustainable irrigation project management leads tosuccess of irrigation. A methodology was developedusing a Geographic Information System (GIS) toselect, design, install and manage an irrigationsystem for a farm. GIS was used to develop differentthematic layers, each consisting of a particularattribute required for analysis of alternativeirrigation system types. These layers included datasuch as: topography, soil texture, soil waterretention, bulk density, infiltration rate of waterand field drainage system. These layers were usedwith water availability and water demand to designand plan the farm irrigation systems. GIS includesthe implementation of following applications: landuse mapping, irrigated area mapping, detection ofheterogeneities, irrigation monitoring, radiativefrost monitoring, and flooded area mapping. Remotesensing alone cannot be sufficient to run all theseapplications but an association with GIS seems to bevery promising in order to improve some of theexisting applications and also in development of newapplications.
Introduction
One of the world’s great challenges is to increasefood production in a sustainable manner so that arapidly growing global population can be fed. Theworld’s growing population and production, combinedwith unsustainable consumption patterns, is puttingincreasing stress on land, water and other essentialresources (degirmenci et al., 2005). According to ICID(International Commission for Irrigation andDrainage), since 1950, the world irrigated area hasincreased threefold, from 80 millions up to 250 or280 millions of hectares, in order to fulfil theworld food needs. Up to 2025 word population willincrease from 5 millions to 8 millions. The irrigatedareas will contribute for 80% at least to theincrease of food production. In the near future,irrigated agriculture will need to produce two-thirdsof the increase in food products required by a largepopulation increase (English et al., 2002). Thegrowing dependence on irrigated agriculture coincideswith an accelerated competition for water andincreased awareness of unintended negativeconsequences of poor design and management.Irrigation systems are selected, designed andoperated to supply the individual irrigationrequirements of each crop field on the farm whilecontrolling deep percolation, runoff, evaporation andoperational losses to establish a sustainableproduction process. The two-third of all water of theworld is used in irrigation, and 40% of totalagricultural production is obtained from irrigatedareas. Unsustainable and insufficient management ofirrigation projects leads to poor performance ofirrigation projects. The poor design, construction,operation and maintenance are also a shortcomingswhich lead to poor performance of irrigation systems(gundogdu et al., 2005). Information which helps to system
manager must be easily accessible in irrigationmanagement. Most of the data related irrigation ischaracterized geographically. Use of gis software isof great importance in establishing databases forirrigation systems in order to have readily,accessible and not superfluous data, data must becollected, recorded and interrelated in systematicway. For that reason it is very important to organizedatabase which is the basis of the information system(gundogdu et al., 2005). Some authors have alreadydiscussed the possibilities for the practical use ofsatellite remote sensing data in management ofirrigation systems (Wolters and Al 1991). Although AGis Software Package Can create useful, colourfulmaps, GIS is more than just a map. GIS software canbe used in many purposes in irrigation projectmanagement such as a mapping tool, a databaseintegration tool, a planning/management tool and GIScan be used in modelling (fipps & eric, 2003). Also GISsoftware has a great importance in irrigation projectmanagement to drawing the layers, inputting of thedata, analysing and processing of the input data andoutputting of the results and reports. Remote sensingand Geographic Information System (GIS) with theircapability of data collection and analysis are nowviewed as efficient and effective tools forirrigation water management. The capability of GIS toanalyze the information across space and time wouldhelp in managing such dynamic systems as irrigationsystems. Soil survey data and GIS are important toolsin land use planning. Intertwined, they represent aninvaluable and underutilized resource. Hazrat et al.(2003) found that the GIS is an important tool thatcan be used for optimal allocation of water resourcesof an irrigation project. Mean water balancecomponents results for different months were stored

in GIS databases, analyzed and displayed as themonthly crop water requirements maps. Chowdary etal. (2008) showed that satellite remote sensingcoupled with GIS offers an excellent alternative toconventional mapping techniques in monitoring andmapping of surface and sub-surface waterlogged areas.Good planning is essential for successful irri-gation, including: 1) The selection of an irrigationsystem that provides the best practical andeconomical irrigation system alternative, 2) thedesign and installation of a system according tostandards and accepted engineering practice and 3)system management that ensures a correct and timelyapplication of water that is based on croprequirements and avoids unnecessary water use(Holzapfel et al., 1985a).
Methodology development The use of GIS to design and plan irrigation systemsrequires a procedure for adequate analysis as isshown in the chart flow (Figure 1). The methodologydeveloped and applied to this study consists of thefollowing steps:

Figure 1. Methodology implemented in this work
Data collection In this step the soil data as texture, water holdingcapacity, infiltration rate, bulk density; must becollected. In addition, topography, actual plots,constructions, irrigation network, drainage networkgeo referenced basic information, which requires thecoordinates of each sampling point for the differentinformation, as well as to develop the thematiclayers for each parameter must be obtained.

Analysis On the basis of the data, the spatial distributionfor each parameter, considering the most restrictiveareas and their weight in the total study area mustbe evaluated, for the design and management of theirrigation systems and the pipe distribution network.A thematic layer with the established irrigationsystem is incorporated. The design system is donetaking into account the procedure given by Holzapfelet al. (1984) for surface irrigation and forpressurized irrigation on the basis of Holzapfel etal. (1990) and Abarca (2002). For the optimal design of surface irrigation thelength, time of cutoff and discharge must beconsidered (Holzapfel et al., 1985a; Walker &Skogerboe, 1987, Holzapfel et al., 2010). The optimaldesign of pressurized irrigation system takes intoaccount, the selection of emitters (Holzapfel et al.,2007a, b), optimal design of sub-units and optimalpipe diameter (Pizarro, 1996; Stuardo, 2006). It is important to mention that all the thematiclayers are dynamic and can improve as a greaterquantity of new information is incorporated. Thisdynamic nature permits adaptation of irrigationsystem management to real-time conditions and evensystem design modification is permitted. The use of this tool is also of great use in farmmanagement and planning since it can also help inother activities necessary for the productionprocess, such as crop rotation, changes in farmstructures or their location, implementation of newcrops with new irrigation systems.Main steps of creation a GIS-supported database in irrigationproject management:
Data determination Data classification

Data organization Determination of data features and contents Determination of relationship between data Determination of analysis
General farm information This include all the information about the farmswhich is to be irrigated. For example: Los Crisolesfarm is located in San Ignacio County, VIII Region,Chile (Latitude 36° 50’ 7’’ S, Longitude 72° 6’ 17’’W). The farm surface area is 110 ha., crops mostoften grown include wheat, sugar beet and grasses. Areliable water supply for irrigation is available ata sustained flow rate of 42 L s-1, in addition toother non-quantifiable sources. The area has a largepotential for berries and apple orchards.
Topographic map An existing topographic map (scale 1: 5000), with 0.5m equidistance contour level curves is available. Themap includes cultivated plots, internal roads,construction, drains and water sources. This map wasdigitalized, forming an independent thematic layer.
Farm geo referencing Using the previously described topographic map,
characteristic points on the farm were selected forgeo referencing using a GPS model GARMIN 12. Thesepoints were site vertexes, constructions, plotborders and other structures. Geo referencing was performed at several key points,at three different times and with three replications.This was done to minimize distortion errors andensure good map adjustment.
Determination of physical characteristics of the soil

For irrigation design and management purposes thefollowing soil information is required: texture, bulkdensity and water holding capacity. To obtain thesesoil data, initially ten one meter soil test pits(profiles) were distributed following threetransects, to assure good representation of the area.Given GIS’s dynamic characteristic, a new soilcharacteristic sampled with additional test profileswere incorporated according to the field digitalmodel data results for each of the parameters wereanalyzed. Simultaneously, these test profile were georeferenced in their spatial location in the map,including soil texture, water holding capacity anddepth. In addition, close to the soil test profileswater infiltration rate were determined with doublering cylinder infiltrometer.
Applications
GIS as A Mapping ToolOne basic function of GIS is the production ofcustomized maps that can be updated and reformattedas needed. Most irrigation districts begin GISprogram because of their
Data determination Data classification Data organization Determination of data features and contents Determination of relationship between data Determination of analysis
Need for continuing updating district maps andinformation, including distribution networks, canalsizes and lining, infrastructure locations, and other

district facilities and their corresponding attributeinformation. In this study arc catalog ver. 9.2 (anapplication of the GIS software) have been used tobuild the drawing files of all features of theirrigation project. In addition, GIS maps are used insome purposes including:Allowing districts to have accurate and up-to-datemaps as when changes occur.
Defining conditions of the infrastructure tohelp identify segments needing
Increased maintenance or rehabilitation. Combining data based on spatially and find
relationships. Solving location or property disputes. To determining the size of a service area.
Basic Map The GIS Is used to create basic digitalizedinformation, as presented in Figure 2, with fourthematic layers: 0.5 m equidistance contour levelcurves, plots, drains and location of soil testprofiles. From Figure 2 it can be observed that thestudy area does not present great topographicvariations.

Figure 2. Basic thematic map of Crisoles Farm that includes topography, drains, plots and location of test pitsTexture To digitalize a soil texture information a numericcode was used as shown in Table 1.
Table 1. Values of the different soil texturesaccording to the international classification system

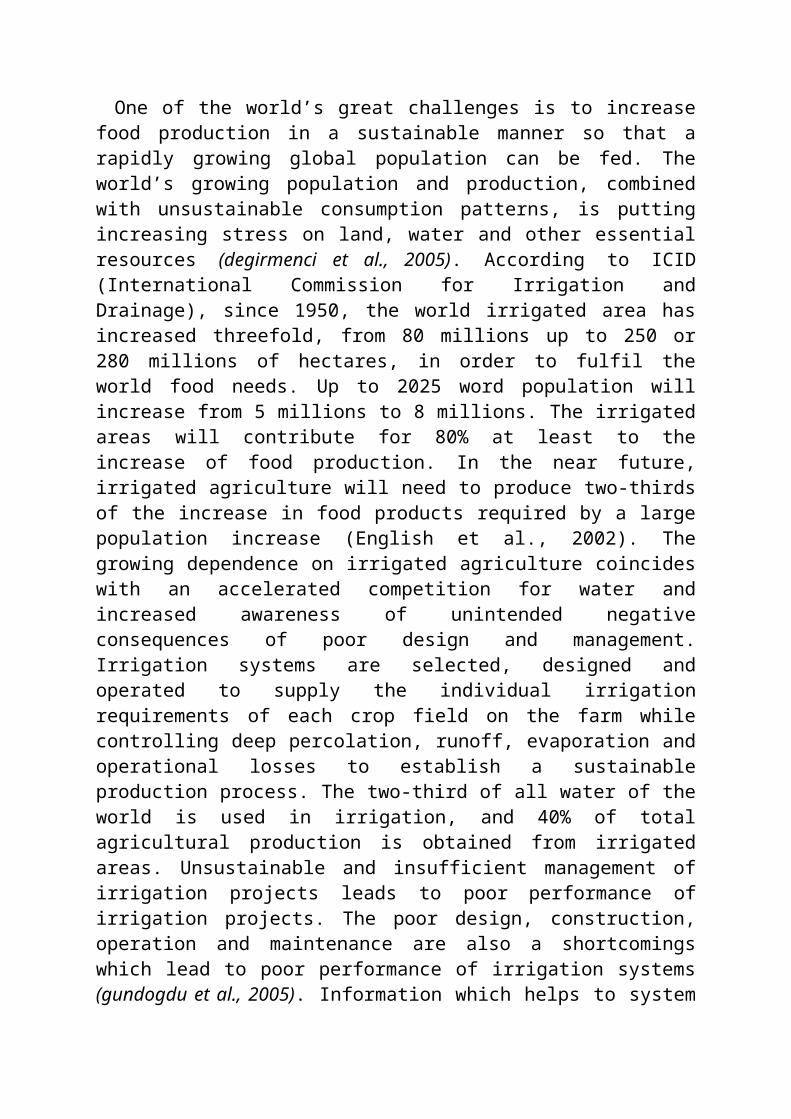
Based on the proposed classification and the texturalinformation from the test pits, thematic maps wereconstructed for each soil strata, which weredifferentiated by texture. Figure 3 presents thethematic layer for the first soil strata because thisstratum is the most important for crop development.
Figure 3. Thematic map of Crisoles Farm of texture for the first soilstrata
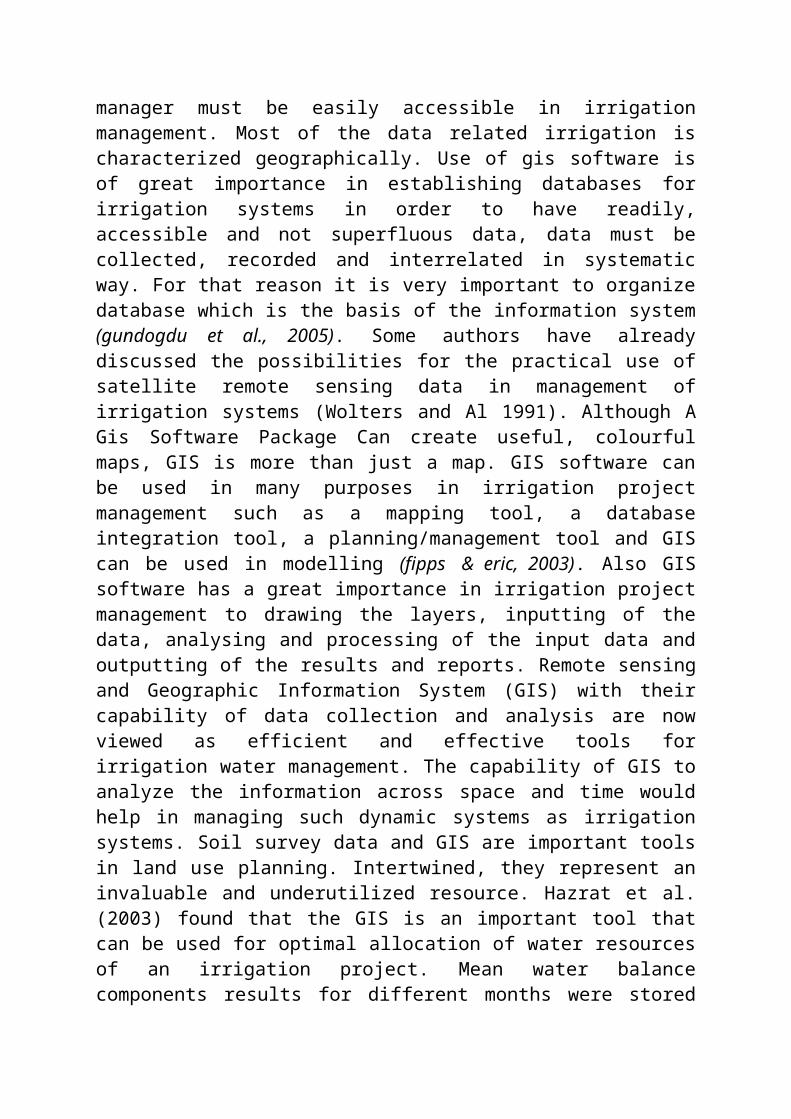
In general, from the texture thematic level, with arange between 7 and 10, it can be established thatthe soil is principally clayey (silty clay, clay loamand low density clay). This layer corresponds to thefirst soil profile strata analyzed. Soil water retention Soil water retention capacity is very important forirrigation system design and planning due to itsrelation with irrigation frequency and applicationtimes. The spatial distribution of this parameter isshown in Figure 4.
Figure 4. Thematic map of Crisoles Farm of soil water retention up to 1 mdepth
Infiltration rate Furthermore, the points used to determine theinfiltration rate of water in soil, are the same asfor the previously described profiles, andconsequently other soil information could be relatedwith this parameter. The infiltration rate curves obtained in each pointindicate a similar tendency, decreasing abruptly inthe first 30 min, characteristic that is generallypresented in sandy soils and which is quite normal inthis type of soils, derived from volcanic ash(Holzapfel et al., 1985b). In general, the infiltration rate was observed tostabilize at 120 min in most of the performed tests.However, it is important to consider that the soilinfiltration rate did not greatly vary and that the

values of 120 min are within the range of 0.03 and0.08 cm min-1. In Figure 5 the soil infiltration rate thematic mapcorresponds to an infiltration time of 120 min. Othermaps for different infiltration times can beincorporated if necessary, depending on theirrigation systems that can be feasibly implementedin the study area.
Figure 5. Thematic map of Crisoles Farm of soil infiltration rate at 120minutes
Also GIs mapping is used for the following purposes(daniel et al., 2003) :1- Data organization – spatial organized streamflow data, water quality data, turnout deliveries,distribution system layout and flow rates, groundwater elevation, crop Type, irrigation methods,…,etc.2- Data retrieval – crop and irrigation methodacreage, biannual ground water elevation contourgeneration, lengths of canals and laterals,analysis of wet land and riparian habitat.

3- Presentation – presenting the organized data aswell as recommendations for a strategicmodernization plan.
GIs and database integrationDatabases components which will be created forirrigation project management were considered in twodifferent groups: permanent project data and yearlychanging project data. Permanent project data isshown in (table 2). Permanent project data constitutes

basic database of the model and this data is enteredto the system only ones for each irrigation project.
Table (2) permanent project data.
Annual project data is obtained depending onirrigation season. These data can be obtainedmonthly, daily or hourly. Classified data as yearlyproject data is shown in (table 3).

To obtain relationship between yearly project dataand permanent project data, an appropriate frameworkhas to be established. For example, to enter waterdemand data to system for any year, planting cropscan select from plant information database.System will have a connection with parcel database sothat annual data about parcel can be entered to thesystem. Crop to be planted can be selected from plantinformation database. Plant specifications such asgrowing period, crop coefficient, root depth … etc.Were given in plant information database. Whenentering plant cropping time, harvest time of everyplant can be calculated by plant information databaseaccording to plant growing periods. Yields and cropprices are entered by users. Consequently, allinformation will be saved in an information file forthat year.Also to enter the data of irrigation system (types ofcanals (main canal, branch and

distributaries canals), their dimensions and slops,their design discharge,…, etc), it can be enteredfrom the attribute table of each feature by using thearc map as shown in figures (3-a and 3-b).

Created database provides the user to inquiryinformation related irrigation project in GIsenvironment. Either permanent data or yearly changingdata can be inquired in database. Some of example ofqueries are as follows (gundogdu et al., 2005) :
Parcel irrigated by selected channel and itssize.
Crop pattern under selected channel. Selected channel specifications. Channels which irrigate selected parcel. Crop pattern under selected parcel. Selected parcel specification. Water structures in project area. Maintenance locations on channel. Parcels belongs owners
GIs as A Planning/Management ToolGIs can serve as a powerful resource for planning andmanagement. The only limitations are the imaginationand the availability of data. A combination of gis

mapping, data collection, and field measurements canbe used to identify any problems in irrigationproject. For example, the combination can be used toidentify infrastructure problems in irrigationdistricts, the potential water saving benefits ofspecific rehabilitation projects, indication of thelocations of deficiencies or problems in the project,…, etc. The next step of this process is to use theinformation obtained from the above combination todiscussing on whether plan rehabilitation projectsand/or re-designing areas, or in the case of systemproblems that would not allow for a change in theinfrastructure, a change in the management of thesystem must be happened. One common use is to visually represent informationfor quick analysis. In the fig.Below (fig. 4), distributaries canals that have beenremaining unlined in the project are highlighted inberyl green.

GIs and ModellingBetter interpretation of hydro geological data oftenrequires that their spatial location be incorporateinto the analysis. GIs can be used for storing hydrogeological data as well as their spatial locations ina relational database. It also provides the facilityto analyze the spatial data objectively using variouslogical conditions. As a result, nowadays, gis iswidely used for spatial modelling of hydro geologicalprospect of a large area with more reliability. GIsare best suited for handling a wide range of datafrom different sources for a quick and cost-effectiveassessment (shahid & nath, 2004). Local for example onmodelling in this study is the hidrogest. Hidrogest

is a software application using database operationthrough a designed interface. It is an irrigationprojects management tool that integrates differentmodels for different purposes. This application andits interface join the databases with those models,thus creating a management tool. Although this is aGIs application, it can also be used without GIssoftware losing its user-map functionalities.Mathematical models need data to operate and producenew information.Besides almost all models allow manual input data,they are developed over a unique internal database.These internal databases have large variability offormats (.mdb, .txt, .dbf, etc.) Specifically adaptedto the model where they are integrated. However, alarge amount of data in these databases is or shouldbe the same for several models, like soil data, cropdata, climatic data, and other. Applying a singledatabase structure will increase data stability andvalidation using diverse models and by comparing andreusing output data between models. Thus, if datashould be the same for various models it becomesdifficult to maintain and synchronize all differentdatabases of all existing models. The centralizationof all data in a single database has thus thefollowing advantages (pedro et al., 2005):• Maintenance – it is no longer necessary tosynchronize several databases, including withdifferent formats. Data are updated only in onedatabase;• Accessibility – data can be accessed in only onephysical location;• Integration – standard data types and structureddata allow to cross information between models;• Technologic evolution – allows modification of datatype formats without changing the models. The linkage

between the models and the database is made through adatabase interface, which is part of hidrogest.Changing database format will only take effect onthis interface. The main purpose of hidrogest is toplay a role of workbench for usage of various models,integrating them with a unique database (fig. 5). Notethat a single database it is not composed by only onefile, but by a combination of one or more files withone or more formats.
The use of the mathematical models along with the GIsapplication is made through the development of aninterface (model interface) that is used has a GIsapplication toolbar. This toolbar accedes thedifferent models available. The database managementsystem is a software that allows managing thedatabase information and its querying (fig 6). Anychange made in the data tables within the databasesis considered as input data, as any parameter used inthe advanced queries definition. The output data ispresented as data tables or graphical representationin GIs.

CONCLUSIONSA system which converts data from internal andexternal sources into information and communicatesthat information, in an appropriate form, to managersat all levels in all functions to enable them to taketimely and effective decisions for planning, managingand controlling activities for which they areresponsible has been developed and applied to theirrigation network.From the presented study it was concluded that:
· The use of different information managementtools like database and GIS proved to be ofhigh efficiency in supporting the dataanalysis and reporting. Also it helps theintegration of all types of data in afriendly usage environment.

· A geographic information system (GIS) is ahighly useful tool for farm irrigationdesign and planning.
· The information incorporated in the thematicmaps establish a dynamic system useful forfarm irrigation system management.
· Remote sensed data although it is of highcost it was proved to be very effective asan accurate source of the currentsituations.
· Collecting and processing informationrequires the commitment of time andresources. It is therefore important tocollect and record only that informationwhich is going to be usefully used. Too muchinformation can be as bad as too little.
· Soil, crop, and topographic information canbe spatially observed and analysed and basicdesign criteria, such as water application,irrigation frequency, and operationrestrictions can be more easily established.
· Management systems that based on informationtools maximise the opportunities in properidentifications of the existing problems andconsequently taking the right decisions toovercome the problems.
· Considering design and optimizationcriteria, with support of GIS, the feasibleirrigation method for the farm can beescorted out.
· The location of the central control systemand water distribution system was determinedusing the general vision of the farmprovided by the GIS.
· Integrating approach in identifying thecurrent situation of existing conditions

such as the studied irrigation network isvery efficient in compiling all aspects inone system. The system using this approachwill be able to communicate the rightinformation in a very appropriate manner.
· A general criterion for irrigation systemplanning and design is to base decisions intools that help make real-time decisions forsite specific conditions.
· Based on this study it is concluded that thedevelopment of a management system will leadto prevent any future deterioration in thenetwork conditions. This is due to thecontinuous access to proper information.


![... ir Tučas R., Augustinavičius R., Suncovas V. GIS technologijų taikymas archeologijoje [Application of GIS technologies in Archaeology]](https://static.fdokumen.com/doc/165x107/631b9491a906b217b9068868/-ir-tucas-r-augustinavicius-r-suncovas-v-gis-technologiju-taikymas-archeologijoje.jpg)