
APPLICATION OF GIS IN ELECTRICAL DISTRIBUTION ...
15
European International Journal of Science and Technology Vol. 4 No. 8 October, 2015 81 APPLICATION OF GIS IN ELECTRICAL DISTRIBUTION NETWORK SYSTEM Ihiabe Y. Adejoh 1* , Ajileye O.O 1 , Alaga A.T 1 , Samson A. Samuel 1 and S. O. Onuh 2 1 Cooperative Information Network, National Space Research and Development Agency, Obafemi Awolowo University, Ile-Ife, Nigeria 2 Centre for Satellite Technology Development, National Space Research and Development Agency * Corresponding Author: [email protected] ABSTRACT The distributions of electrical energy to end users in most urban area are faced with divers spatial problems particularly with the use of analogue system. Based on this, this study seeks to use geospatial technique for effective management of electricity distribution. The study assesses the spatial relationship between power holding company of Nigeria (PHCN) assets and their customer’s connectivity in the study area and makes decision on how to improve and manage electricity distribution. The result shows that, the study area has only one transformer rated 500KVA with 4 upriser connected to numerous distribution lines serving 250 buildings with an average consumption rate of 2.1KW and total consumption of 525.6KW with an excess of 25.6KW, indicating that the transformer is overloaded. It is evident from the finding that asset management, load shedding technique, can easily be managed with the use of geospatial technique. Key words: Electricity, Overloading, Geospatial, Distribution, Upriser, Load-shedding 1.0 INTRODUCTION One of the primary contribution to the advancement and improvement in man’s life style over the years has been the ability to use and control energy. The socio-economic and technological development of any nation and the society is largely dependent on the supply of electricity. It is one of the most important basic needs for the smooth, meaningful and productive economic life of any nation, as the growth of the economy of
-
Upload
khangminh22 -
Category
Documents
-
view
2 -
download
0
Transcript of APPLICATION OF GIS IN ELECTRICAL DISTRIBUTION ...

European International Journal of Science and Technology Vol. 4 No. 8 October, 2015
81
APPLICATION OF GIS IN ELECTRICAL DISTRIBUTION
NETWORK SYSTEM
Ihiabe Y. Adejoh1*
, Ajileye O.O1, Alaga A.T
1, Samson A. Samuel
1 and S. O. Onuh
2
1 Cooperative Information Network, National Space Research and Development Agency,
Obafemi Awolowo University, Ile-Ife, Nigeria
2
Centre for Satellite Technology Development, National Space Research and Development Agency
* Corresponding Author: [email protected]
ABSTRACT
The distributions of electrical energy to end users in most urban area are faced with divers spatial problems
particularly with the use of analogue system. Based on this, this study seeks to use geospatial technique for
effective management of electricity distribution. The study assesses the spatial relationship between power
holding company of Nigeria (PHCN) assets and their customer’s connectivity in the study area and makes
decision on how to improve and manage electricity distribution. The result shows that, the study area has
only one transformer rated 500KVA with 4 upriser connected to numerous distribution lines serving 250
buildings with an average consumption rate of 2.1KW and total consumption of 525.6KW with an excess of
25.6KW, indicating that the transformer is overloaded. It is evident from the finding that asset management,
load shedding technique, can easily be managed with the use of geospatial technique.
Key words: Electricity, Overloading, Geospatial, Distribution, Upriser, Load-shedding
1.0 INTRODUCTION
One of the primary contribution to the advancement and improvement in man’s life style over the years has
been the ability to use and control energy. The socio-economic and technological development of any nation
and the society is largely dependent on the supply of electricity. It is one of the most important basic needs
for the smooth, meaningful and productive economic life of any nation, as the growth of the economy of

European International Journal of Science and Technology ISSN: 2304-9693 www.eijst.org.uk
82
nations largely depend on the effective management and control of the available generated power, effective
maintenance of the equipment and efficient generation of power to meet the growing demand for electricity
supply. The use of electricity as a tool for socio-economic development of the nation cannot be
overemphasized. Hence, there is a need to keep a comprehensive and accurate inventory of their physical
assets, spatial location, both as part of normal service provision, extending the network and undertaking
maintenance by the use of geospatial technique (Geographic Information System). GIS as an emerging
technology is a software application, used to create and display cartographic information. In practice,
however, GIS consists of five Components: software, data, procedures, hardware, and people. These five
components work together to capture, store, retrieve, analyze, and display geographically referenced
information. It has an added capability to analyze spatial data, through attribute and location analysis or
spatial modeling.
Efficient functioning of the transmitted power cannot be achieved without proper record keeping and
monitoring of the distribution network system. Any organizations that expect to run efficient day-to-day
operation and to manage and develop its service effectively must know what asset it has, where they are,
their condition and how they are performing (Pickering, 1993). The knowledge about physical assets of the
electricity distribution network is necessary to make strategic and operational decision. Hence to make such
informed decision regarding the distribution and management of electricity and its facilities, information
must be collected and analyzed to its full extent through GIS technique.
GIS technique is used to create database and develop map which can show the spatial relationship between
PHCN asset and their customers in the study area. The production of digital map and functional geo-
database about the facilities will be able to show utility transformer and the rating of the transformer which
can be used to determine the capacity of energy it can distribute and the current energy demanded on it. This
will also show the numbers of customer attach to each transformer and the energy consumed by each
customer. This will help to determine whether the transformer is overloaded or still operating within its
installed capacity. At such, determine the upriser to put off from a transformer that is already overloaded for
a period of time, make decision on how to carry out load shedding, how to detect illegal connection, due
time for transformer replacement and when to stop new customer from connecting to a transformer.
The buffering analysis was carried out on the transformer and the principle of network ordering was also
applied to validate the developed system.
The efficiency of distribution system can be affected by some of the identified problems below.
• Capacity of the distribution transformer.
• Lack of effective control of the available generated power.
• Distance of customers from the distribution transformer.
• Imbalanced allocation of the distribution lines.
• Metering inaccuracies and unmetered energy in other area
1.1 Objectives
• Create electricity distribution network map that shows the spatial location of the transformer, low
tension poles and low tension lines of the study area.
• Create a map that will show the spatial relationship between transformer and consumer’s
connectivity to the transformer.

European International Journal of Science and Technology Vol. 4 No. 8 October, 2015
83
2.0 STUDY AREA
The study area selected for this project is Olonade community of Ife central local government, Ile-Ife. It lies
between longitude 4032’42E”- 4
033’4”
E and Latitude 7
030’0N”- 7
030’26N”.
Figure 1.0 Map of the study area
3.0 MATERIALS AND METHOD
3.1 Data Requirement
• Satellite image
• GPS points
• Transformer detail
• The number of customers connected to the transformer
• Energy consumed by each customer
3.2 Software used
• ArcGIS 9.3
• Microsoft word
3.3 Hardware
• HP 4GB Ram, 500GB Hard Disc Computer
• GPS receiver
3.4 Data Analysis
High spatial resolution Satellite image was acquired and integrated into GIS environment whereby thematic
layers such as buildings and road network were extracted and represented in form of polygons and lines, also
service lines and customer connection point were digitized. A personal geodatabase was involved with
dataset projected using coordinate system WGS 1984 UTM zone 31N. The personal geodatabase contain

European International Journal of Science and Technology ISSN: 2304-9693 www.eijst.org.uk
84
features named as building, roads, consumer points and service lines. The area of interest was delineated
from the satellite image and subsequently used to subset others thematic layers. The coordinate point of the
transformer and low tension poles acquired with the hand-held GPS, and customers records were linked
together and captured into the geodatabase using add xy coordinate in Arc Map environment. Electricity
Distribution network map and data was created which shows the spatial location of the transformer, low
tension poles, as well as the spatial relationship between all PHCN asset and customer’s connectivity to the
transformer.
Figure 2.0: Flow chart diagram showing the method employed
4.0 RESULTS AND DISCUSSIONS
Figure 3 show the consumer point where customers are connected to the service lines, the spatial location of
electric poles, and transformer with the four uprisers connecting the transformer to the service lines and also
the road network of the study area. The thickness of the service line at any point is proportional to the level
of energy on it at that very point, indicating the power flow level of the network system.

European International Journal of Science and Technology Vol. 4 No. 8 October, 2015
85
Figure 3.0: Electricity distribution network map
Figure 4 mapped the flow of electricity from the transformer to the poles and from the poles to the
consumers (buildings). This shows the customer’s connectivity to the distribution network. The total number
of buildings served by the transformer can be determined from the attribute table of these building (table 1)
in the database.
Figure 4.0: Map showing customer’s connectivity to distribution network

European International Journal of Science and Technology ISSN: 2304-9693 www.eijst.org.uk
86
Figure 5 shows the details of the energy consumed by each of the customers. This is indicated in the legend
by the variation in color from dark to light colour, the darkest colour indicate the highest energy
consumption level while the lightest colour shows the lowest in terms of energy consumption. The energy
consumed by each customer as well as the total energy consumed by the entire area connected to the upriser
can be visibly seen in the attribute table of the buildings in the area (table 1) and (figure 5). This will help
the PHCN to know where they could extend or improve their services and equally area that need new
installation.
Figure 5.0: Map showing the power consumption level of each of the building

European International Journal of Science and Technology Vol. 4 No. 8 October, 2015
87
Table1.0: Attribute table of building
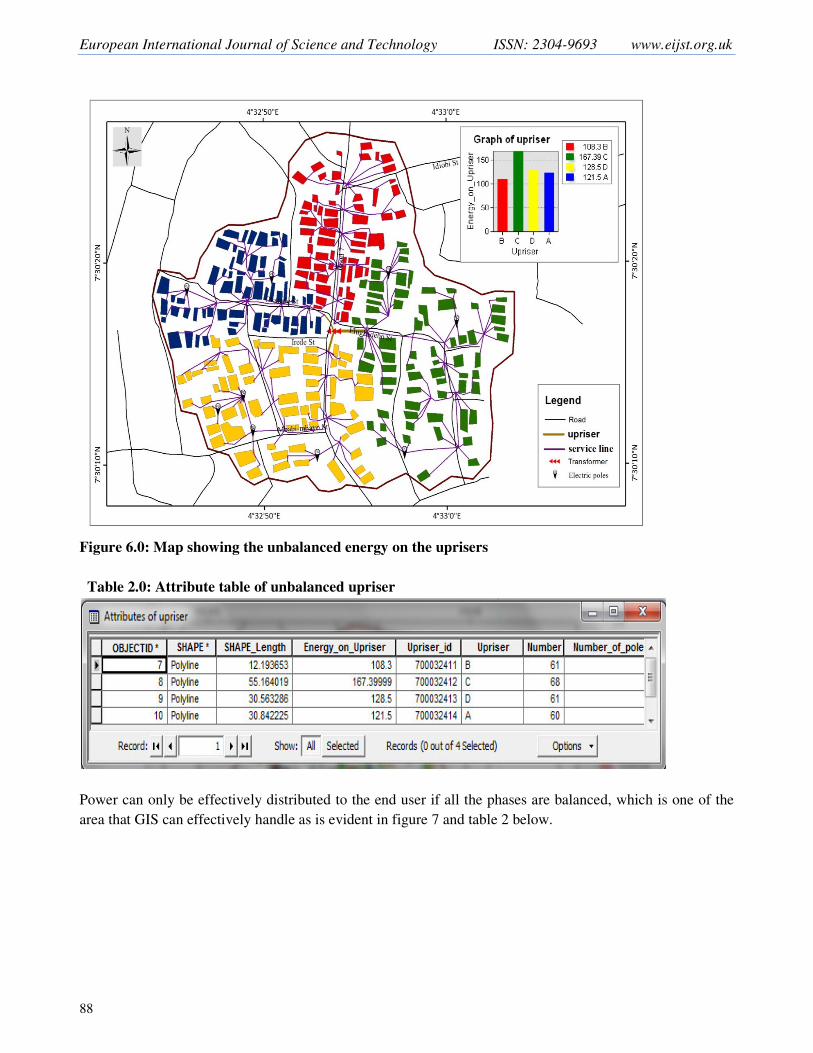
Figure 6 show the imbalance in the allocation of distribution line as the uprisers are not balanced in terms of
the load. This in most cases result in the blowing off of fuse and tripping off of the transformer or low
supply of voltage or voltage collapse and subsequently total blackout. The thickness of the upriser
determines the level of energy it carries; the thicker it is the more energy it carries and the thinner it is the
less energy it carries. Table1 validate it by showing the numerical value of the energy on the uprisers.
European International Journal of Science and Technology ISSN: 2304-9693 www.eijst.org.uk
88
Figure 6.0: Map showing the unbalanced energy on the uprisers
Table 2.0: Attribute table of unbalanced upriser
Power can only be effectively distributed to the end user if all the phases are balanced, which is one of the
area that GIS can effectively handle as is evident in figure 7 and table 2 below.

European International Journal of Science and Technology Vol. 4 No. 8 October, 2015
89
Figure 7.0: Map showing balanced stage of the uprisers
Table 2: Attribute table of balanced stage of uprisers
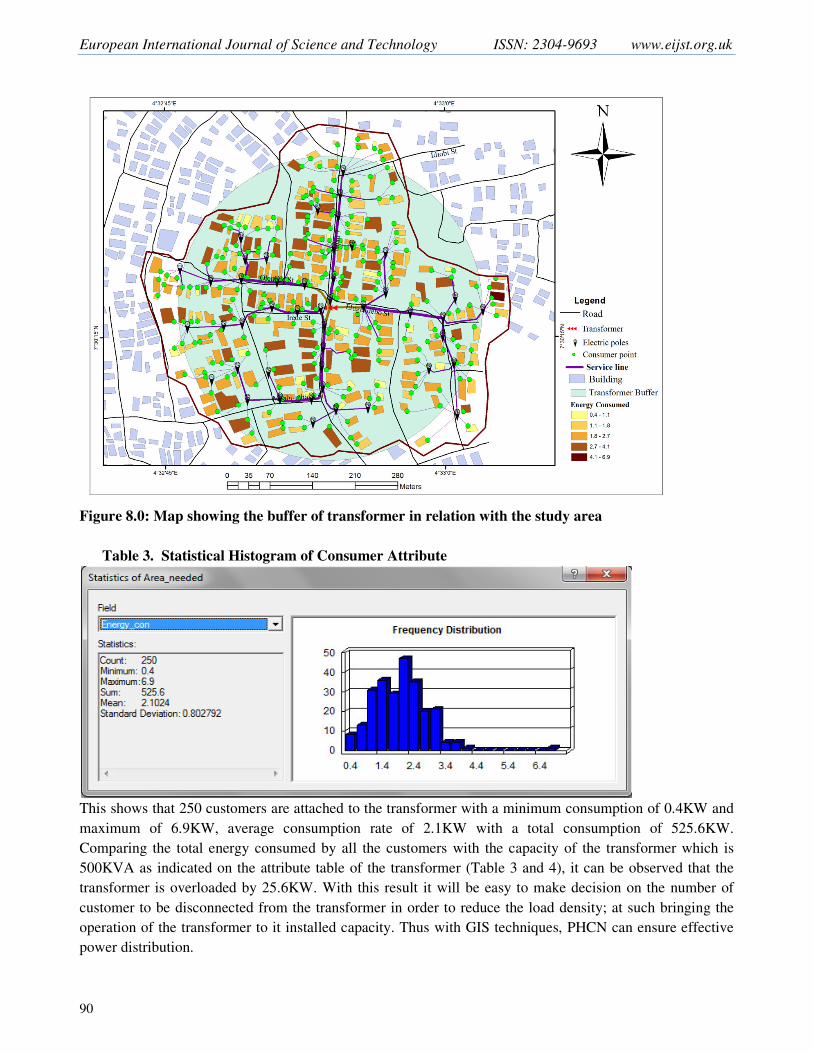
Figure 8 shows the buffer of the transformer with respect to the study area. This can be used to locate the
load center for the installation of the transformer. The buffering analysis helps to determine the shortest
possible length of connection as voltage drop may be permitted due to long distance covered in the
distribution of power. This also help us to compute voltage drop and the power loss at a particular length as
the exact distance of coverage can be determine from the buffering analysis. With the help of buffering
analysis, the transformer can be centrally located with respect to the load area being served as this minimises
the length of the distrbution lines connecting the transformer to the load and also reduce the numbers of
electric polse. Cost of cable is reduced and also distribution losses will be minimised
European International Journal of Science and Technology ISSN: 2304-9693 www.eijst.org.uk
90
Figure 8.0: Map showing the buffer of transformer in relation with the study area
Table 3. Statistical Histogram of Consumer Attribute
This shows that 250 customers are attached to the transformer with a minimum consumption of 0.4KW and
maximum of 6.9KW, average consumption rate of 2.1KW with a total consumption of 525.6KW.
Comparing the total energy consumed by all the customers with the capacity of the transformer which is
500KVA as indicated on the attribute table of the transformer (Table 3 and 4), it can be observed that the
transformer is overloaded by 25.6KW. With this result it will be easy to make decision on the number of
customer to be disconnected from the transformer in order to reduce the load density; at such bringing the
operation of the transformer to it installed capacity. Thus with GIS techniques, PHCN can ensure effective
power distribution.

European International Journal of Science and Technology Vol. 4 No. 8 October, 2015
91
Table 4: Attribute table of transformer
GIS allows for creating, maintaining, and querying of electrical database to generate information, with an
added capability to analyze spatial data, through attribute and location analysis or spatial modeling User can
query any layer of the GIS map to get the attribute data for a particular feature of that layer. User has to click
on any feature of a particular layer to get the attribute of that feature as indicated in table 5 and figure 9. GIS
can be used to monitor power loss as a result of metering inaccuracy in the distribution sector by knowing
the total number of customers using prepaid meter and those using postpaid meter as well as those that their
energy are not metered at all by the use of query. This system provides timely, accurate and easier way of
acquiring information, which is very vital in taking prompt and accurate decisions.
Table 5: Query table performed on building attached to upriser C

European International Journal of Science and Technology ISSN: 2304-9693 www.eijst.org.uk
92
Figure 9.0: Result of query showing the number of customers on upriser C
The result of the query can also be used to determine how to carry out load shedding, which can be used to
reduce the load on a transformer that is already overloaded. The table of the building was queried as shown
in table 5 and the result of the query (as shown in fig 9) highlighted the attributes of the building connected
to the upriser with id C. All customers connected to the highlighted upriser can be disconnected for a certain
period of time while those connected to the other three uprisers are connected for that same period. This
reduce the excess load on the transformer that is overloaded, at such effective services will be rendered.

European International Journal of Science and Technology Vol. 4 No. 8 October, 2015
93
Table 7: Attribute table of low tension poles.
This shows the detail of low tension poles, such as the geographic coordinate showing the spatial location,
number of electric pole attached to the transformer, number of cables and the condition of the poles. Such
updated information is required to improve planning, monitoring, maintenance and upgrading of the
facilities when necessary. This shows that GIS technique can be used for proper asset management.

European International Journal of Science and Technology ISSN: 2304-9693 www.eijst.org.uk
94
Figure 10: This is showing the study area superimposed on the satellite image.
5.0 CONCLUSION AND RECOMMENDATION
Improving the performance of distribution systems to meet the required target is a matter of selecting the
most effective and appropriate technology with right operating practices. It is not sufficient to analyze how a
particular portion of the network may be modified to improve its performance today, rather in determining
the optimal solution based on future demand scenario.
Since the distribution network of a power utility have a geographical reference, it is beneficial to create the
network on GIS map and constantly update the same as per field parameters. With periodic updating and
monitoring, GIS mapping of the Electrical Network and Consumer database helps in improved planning,
load management, loss reduction, better revenue realization, asset and management standard of the
distribution network and possibly better consumer relationship.
GIS technology helps in fast, accurate and reliable data management, provides timely, accurate and easier
way of acquiring information, which are very vital in taking prompt and accurate decisions necessary in
electricity distribution network.
GIS principal task is to model "real world", perform spatial analyses and ensure high accuracy of
optimization procedure. This help to carry out different analysis like, load analysis, location analysis, and
problem identification analysis, also to find the average distributed power and utilized power. With this, the
growing demand for electricity with growing rates and high densities can be satisfied in an optimum ways.
This study has demonstrated that geographic information system (GIS) can be used as a decision making
tool to improve electricity distribution in Nigeria.
There is a need for greater awareness to be created at all level of government of the need and what is
required to establish GIS. Briefing, training and re-training sessions among staff of PHCN and other
municipal authorities in GIS is also needed.

European International Journal of Science and Technology Vol. 4 No. 8 October, 2015
95
REFERENCES
Adetoro, S.A. (2005): Developing Geographic Information System for Utility management: A case study of
Electrical Distribution Line and Transformer stations in Obafemi Awolowo University, Ile-Ife. Proceeding
of the technical session of the 37th Annual General Conference and meeting of Nigeria Institution of
surveyors, Owerri, Imo-State, Nigeria, pp. 57-62
Ezeigbo C. U. (1998): Application of Geographic Information System (GIS) to Utility Mapping
Sinha, J. (2010): GIS Application in power distribution utility
Osuagwu C. C. (2008): Geo-spatial Information System for monitoring and analysis of Electricity
Distribution in Osogbo, South-Western Nigeria.
Pickering, D.J.M and Bannister, D.H. (1993): Utility Mapping and Record Keeping for Infrastructure.
Raghav, (2006): Electrical Network Mapping and Consumer Indexing using GIS.
Kulkarni S. S.(2011): Improving Efficiency of power sectors by using GIS.