Soybean Root Distribution Related to Claypan Soil Properties and Apparent Soil Electrical...
12
Reproduced from Crop Science. Published by Crop Science Society of America. All copyrights reserved. 1498 CROP SCIENCE, VOL. 47, JULY– AUGUST 2007 RESEARCH C laypan soils of northeastern Missouri and southern Illinois, the Central Claypan Areas (USDA-NRCS, 2006), possess extreme variability within the soil profile and across the landscape. As a result of this variability, soybean [ Glycine max (L.) Merr.] plants growing in these soils must contend with starkly contrasting physi- cal, chemical, and hydrologic environments at different depths. The dominant characteristic of soils in the Central Claypan Areas is their namesake argillic horizon, the claypan. The claypan horizon has an abrupt upper boundary, with at least 100% more clay than the superior horizon, as well as very slow permeability. Claypan horizons in these areas contain 45 to 65% clay and high concen- trations of cations (K + , Ca 2+ , Mg 3+ , Al 3+ , H + ), and organic matter Soybean Root Distribution Related to Claypan Soil Properties and Apparent Soil Electrical Conductivity D. Brenton Myers,* Newell R. Kitchen, Kenneth A. Sudduth, Robert E. Sharp, and Randall J. Miles ABSTRACT Soybean [Glycine max (L.) Merr.] yield in claypan soils varies systematically with soil properties and landscape position. This is likely caused by soil interactions with soybean roots. Field obser- vations of soybean root distribution are needed to reveal its effect on yield variability. This study examined profile distributions of soybean root length density (RLD) and average root diameter (ARD) as a function of landscape position, depth to claypan (DTC), apparent soil electrical con- ductivity (EC a ), clay-maximum translated depth (D t ), and other soil properties. A landscape of claypan soils was sampled postharvest at two sites near Centralia, MO, in 2001. Roots were washed from soil cores in 15-cm layers (15–120 cm) and measured with image analysis. Root length density and ARD were significantly related to landscape position, DTC, D t , and EC a . Predictions of RLD and ARD were best from 15 to 60 cm, the depths with the greatest influence from claypan soil morphology. Soil profile distri- butions of base cations, P, and pH matched root density profiles. Soybean roots were inhibited in E horizons above the claypan and stimulated 20 to 40 cm below it. Soybean roots below the claypan had about 20 to 30% smaller diameter. We conclude that DTC and rapid estimators of claypan morphology, such as EC a , can be used to predict soybean root distribution in claypan soil landscapes. D.B. Myers, Dep. of Soil Environmental and Atmospheric Sciences, Agricultural Engineering Building, Univ. of Missouri, Columbia, MO 65211; N.R. Kitchen and K.A. Sudduth, USDA-ARS Cropping Systems and Water Quality Unit, Agricultural Engineering Building, Univ. of Missouri, Columbia, MO 65211; R.E. Sharp, Division of Plant Sciences, Agriculture Building, Univ. of Missouri, Columbia, MO 65211; R.J. Miles, Dep. of Soil Environmental and Atmospheric Sci- ences, Anheuser-Busch Natural Resources Building, Univ. of Missouri, Columbia, MO 65211. Mention of trade names or commercial products in this article is solely for the purpose of providing specific informa- tion and does not imply recommendation or endorsement by the U.S. Department of Agriculture or the University of Missouri. Received 13 July 2006. *Corresponding author ([email protected]). Abbreviations: ARD, average root diameter; CEC, cation exchange capacity; EC a , apparent soil electrical conductivity; D t , clay-maximum translated depth; DTC, depth to claypan; NA, neutralizeable acidity; OM, organic matter; RLD, root length density. Published in Crop Sci. 47:1498–1509 (2007). doi: 10.2135/cropsci2006.07.0460 © Crop Science Society of America 677 S. Segoe Rd., Madison, WI 53711 USA All rights reserved. No part of this periodical may be reproduced or transmitted in any form or by any means, electronic or mechanical, including photocopying, recording, or any information storage and retrieval system, without permission in writing from the publisher. Permission for printing and for reprinting the material contained herein has been obtained by the publisher. Published online July 30, 2007
-
Upload
independent -
Category
Documents
-
view
0 -
download
0
Transcript of Soybean Root Distribution Related to Claypan Soil Properties and Apparent Soil Electrical...
Repro
duced
from
Cro
pS
cie
nce.
Publis
hed
by
Cro
pS
cie
nce
Socie
tyof
Am
erica.
All
copyrights
reserv
ed.
1498 CROP SCIENCE, VOL. 47, JULY–AUGUST 2007
RESEARCH
Claypan soils of northeastern Missouri and southern Illinois, the Central Claypan Areas (USDA-NRCS, 2006), possess
extreme variability within the soil profi le and across the landscape. As a result of this variability, soybean [Glycine max (L.) Merr.] plants growing in these soils must contend with starkly contrasting physi-cal, chemical, and hydrologic environments at diff erent depths. The dominant characteristic of soils in the Central Claypan Areas is their namesake argillic horizon, the claypan. The claypan horizon has an abrupt upper boundary, with at least 100% more clay than the superior horizon, as well as very slow permeability. Claypan horizons in these areas contain 45 to 65% clay and high concen-trations of cations (K+, Ca2+, Mg3+, Al3+, H+), and organic matter
Soybean Root Distribution Related to Claypan Soil Properties and Apparent Soil
Electrical Conductivity
D. Brenton Myers,* Newell R. Kitchen, Kenneth A. Sudduth, Robert E. Sharp, and Randall J. Miles
ABSTRACT
Soybean [Glycine max (L.) Merr.] yield in claypan
soils varies systematically with soil properties
and landscape position. This is likely caused by
soil interactions with soybean roots. Field obser-
vations of soybean root distribution are needed
to reveal its effect on yield variability. This study
examined profi le distributions of soybean root
length density (RLD) and average root diameter
(ARD) as a function of landscape position, depth
to claypan (DTC), apparent soil electrical con-
ductivity (ECa), clay-maximum translated depth
(Dt), and other soil properties. A landscape of
claypan soils was sampled postharvest at two
sites near Centralia, MO, in 2001. Roots were
washed from soil cores in 15-cm layers (15–120
cm) and measured with image analysis. Root
length density and ARD were signifi cantly
related to landscape position, DTC, Dt, and EC
a.
Predictions of RLD and ARD were best from 15
to 60 cm, the depths with the greatest infl uence
from claypan soil morphology. Soil profi le distri-
butions of base cations, P, and pH matched root
density profi les. Soybean roots were inhibited
in E horizons above the claypan and stimulated
20 to 40 cm below it. Soybean roots below the
claypan had about 20 to 30% smaller diameter.
We conclude that DTC and rapid estimators of
claypan morphology, such as ECa, can be used
to predict soybean root distribution in claypan
soil landscapes.
D.B. Myers, Dep. of Soil Environmental and Atmospheric Sciences,
Agricultural Engineering Building, Univ. of Missouri, Columbia,
MO 65211; N.R. Kitchen and K.A. Sudduth, USDA-ARS Cropping
Systems and Water Quality Unit, Agricultural Engineering Building,
Univ. of Missouri, Columbia, MO 65211; R.E. Sharp, Division of Plant
Sciences, Agriculture Building, Univ. of Missouri, Columbia, MO
65211; R.J. Miles, Dep. of Soil Environmental and Atmospheric Sci-
ences, Anheuser-Busch Natural Resources Building, Univ. of Missouri,
Columbia, MO 65211. Mention of trade names or commercial products
in this article is solely for the purpose of providing specifi c informa-
tion and does not imply recommendation or endorsement by the U.S.
Department of Agriculture or the University of Missouri. Received 13
July 2006. *Corresponding author ([email protected]).
Abbreviations: ARD, average root diameter; CEC, cation exchange
capacity; ECa, apparent soil electrical conductivity; D
t, clay-maximum
translated depth; DTC, depth to claypan; NA, neutralizeable acidity;
OM, organic matter; RLD, root length density.
Published in Crop Sci. 47:1498–1509 (2007).doi: 10.2135/cropsci2006.07.0460© Crop Science Society of America677 S. Segoe Rd., Madison, WI 53711 USA
All rights reserved. No part of this periodical may be reproduced or transmitted in any form or by any means, electronic or mechanical, including photocopying, recording, or any information storage and retrieval system, without permission in writing from the publisher. Permission for printing and for reprinting the material contained herein has been obtained by the publisher.
Published online July 30, 2007
Repro
duced
from
Cro
pS
cie
nce.
Publis
hed
by
Cro
pS
cie
nce
Socie
tyof
Am
erica.
All
copyrights
reserv
ed.
CROP SCIENCE, VOL. 47, JULY–AUGUST 2007 WWW.CROPS.ORG 1499
(OM) (Bray, 1935). These accumulations are preceded by a depletion of clay minerals, cations, and P, as well as low pH in the superior AE, E, or BE horizons. Depth to the clay-pan (DTC) varies systematically across the landform from summit to footslope. Summit soils have a moderate DTC of around 35 cm, which decreases to as little as 10 cm on eroded backslopes and increases again to between 50 and 100 cm on depositional footslope areas. This systematic soil profi le variation may be an important infl uence on soybean root growth and development.
Soybean shoot and grain variability on claypan soils has been attributed to water redistribution and soil mor-phology (e.g., DTC) (Kitchen et al., 1999; Thompson et al., 1991; Yang et al., 2003b). These previous fi ndings emphasize the importance of the root environment on aboveground plant variation and highlight some of the possible causes. However, relatively little work exists characterizing and explaining soybean root variability as infl uenced by these soil landscapes. Initial evidence of a secondary maximum of roots in the soil below the claypan indicates that corn (Zea mays L.) and soybeans grown on these soils can have a diff erent root distribution than the exponentially diminishing form they demonstrate in ideal well-watered and well-drained soils (Fraisse et al., 2001; Wang et al., 2003; Yang et al., 2003a). This evidence also indicates that the distribution of soybean roots varies as DTC varied across the claypan landscape, with root dis-tributions appearing more like those seen in ideal soils as DTC increased. Characterization of the physical, chemi-cal, and hydrologic properties of claypan soil profi les is critical for understanding the possible physiological causes of root distribution adaptations.
Often referred to as the “hidden half” of plants (Waisel et al., 2002), root systems are decidedly chal-lenging to study, particularly under fi eld conditions. To address this diffi culty, sensor-based methods are desirable. For instance, minirhizotron tubes have been used to access and image roots (Huck and Taylor, 1982; Upchurch and Ritchie, 1983). However, this technique is not acceptable for some soils. For example, argillic horizons of claypan soils have vertic properties imparted by high concentra-tions of smectitic clays, leading to the high possibility of soil shrinking away from tube walls. Shrinkage gaps would interfere with the natural development of roots in the clay-pan, possibly providing an altered pathway for water and air infi ltration, nutrient mobility, and root growth. Given the special characteristics of these soils, destructive soil coring and root washing may be the most reasonable and accurate method to characterize roots, but the techniques required are labor and time ineffi cient. Apparent soil elec-trical conductivity (EC
a) is a sensor-based measurement
that has been successfully used to estimate DTC (Doo-little et al., 1994). Because of the suspected relationships of root growth with DTC, EC
a could provide an alternative
for rapid estimation of root distribution in claypan soils without destructive sampling.
Research is needed to improve understanding of the hidden half of soybeans. The claypan soil profi le provides an interesting setting that may have implications for under-standing soybean physiology. Further, understanding the interaction between soybean growth and claypan mor-phology will enhance the development of new soybean cultivars with specifi c tolerance to claypan soils. These points are important for soybean producers since soybean is grown on more than 60% of the arable land in the nearly 4 million hectares of the Central Claypan Areas (USDA-NASS, 2004). To address these research needs we used sensor measurements, soil geomorphology, and soil pro-fi le properties to characterize soybean root distribution. The specifi c objectives of this research were (i) to examine the relationships of DTC, EC
a, and chemical and physical
properties of the soil profi le to soybean root length den-sity (RLD) and average root diameter (ARD) and (ii) to examine the relationships of these soil–root interactions to landscape position.
MATERIALS AND METHODSTwo study sites (named Sites 1 and 2) were chosen within 2 km
of each other near Centralia, MO (39°13´58˝ N, 92°7´57˝ W),
on soils predominantly classifi ed as claypan soils. The sites are
located in USDA Major Land Resource Area 113, the Central
Claypan Areas (USDA-NRCS, 2006). The general landform
for the region was an initially fl at lobe of basal till that has
undergone signifi cant dissection and received 1 to 2 m of loess
deposition into which the soils are formed (Guccione, 1982;
Young and Hammer, 2000).
Soybean crops were planted on Sites 1 and 2 in 2001. Crop
management practices varied between sites. Site 1 was part of
a long-term replicated research project evaluating the impact
of various grain and grass cropping systems over a catena of
claypan soils (Kitchen et al., 1998). Two of the fi ve cropping
systems being evaluated on this site were included in this study:
cropping system 1, a mulch-till (chisel plow or disk and fi eld
cultivator) corn–soybean rotation, and cropping system 2, a no-
till corn–soybean rotation. Soybeans (‘Maverick’) were drilled
in 20-cm rows at 494 000 seeds ha−1 on 19 June 2001. Site 2 was
a uniformly managed fi eld in a no-till corn–soybean rotation
and was drilled on 18 June 2001 with the same variety, rate, and
row spacing as Site 1.
Site Descriptions and Soil SamplingFor the two sites, soils on the upland interfl uves and backslopes
are fi ne, smectitic, mixed, mesic, Vertic Epiaqualfs. Various
cumulic mollisols are formed in hill-slope sediments on foot-
slopes and depositional areas (Table 1). These soils present a
challenge to root investigations, primarily due to the properties
imparted by the smectitic clays found at concentrations up to
65% in the claypan. Because of the vertic properties of these
soils, the destructive method of coring and measurement of
washed roots was employed.
Repro
duced
from
Cro
pS
cie
nce.
Publis
hed
by
Cro
pS
cie
nce
Socie
tyof
Am
erica.
All
copyrights
reserv
ed.
1500 WWW.CROPS.ORG CROP SCIENCE, VOL. 47, JULY–AUGUST 2007
Site 2Site 2 was a 13-ha fi eld with a long and narrow aspect cutting
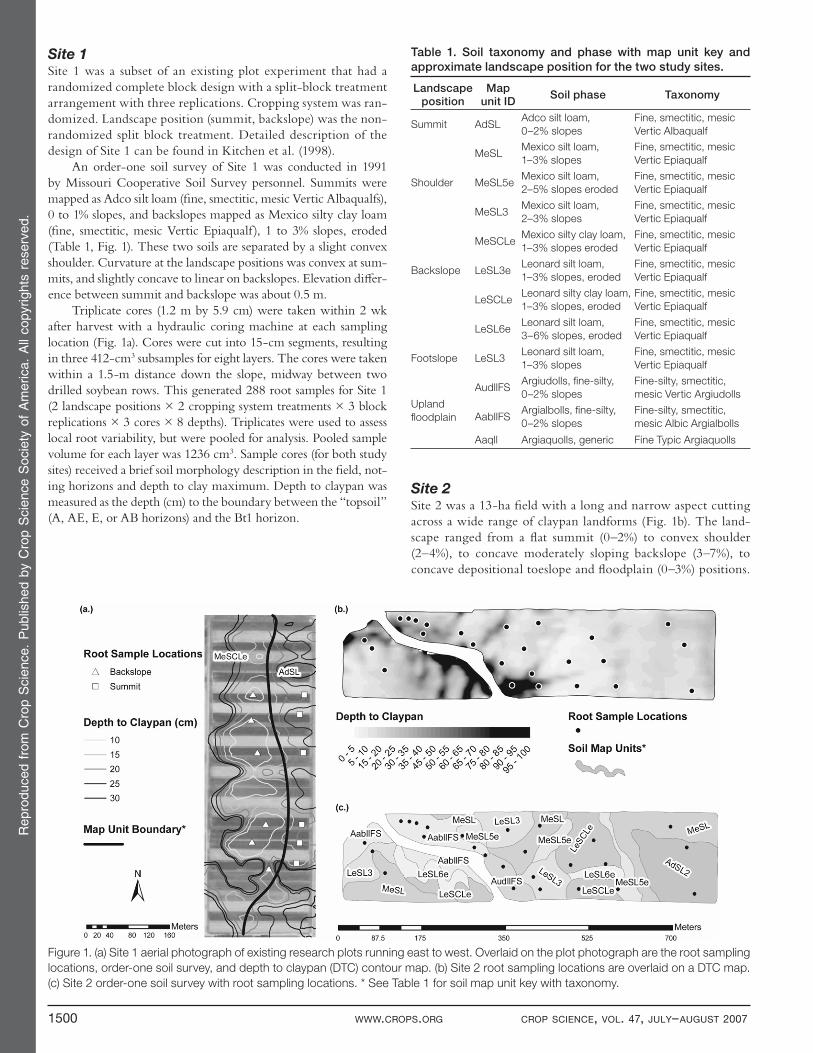
across a wide range of claypan landforms (Fig. 1b). The land-
scape ranged from a fl at summit (0–2%) to convex shoulder
(2–4%), to concave moderately sloping backslope (3–7%), to
concave depositional toeslope and fl oodplain (0–3%) positions.
Site 1Site 1 was a subset of an existing plot experiment that had a
randomized complete block design with a split-block treatment
arrangement with three replications. Cropping system was ran-
domized. Landscape position (summit, backslope) was the non-
randomized split block treatment. Detailed description of the
design of Site 1 can be found in Kitchen et al. (1998).
An order-one soil survey of Site 1 was conducted in 1991
by Missouri Cooperative Soil Survey personnel. Summits were
mapped as Adco silt loam (fi ne, smectitic, mesic Vertic Albaqualfs),
0 to 1% slopes, and backslopes mapped as Mexico silty clay loam
(fi ne, smectitic, mesic Vertic Epiaqualf ), 1 to 3% slopes, eroded
(Table 1, Fig. 1). These two soils are separated by a slight convex
shoulder. Curvature at the landscape positions was convex at sum-
mits, and slightly concave to linear on backslopes. Elevation diff er-
ence between summit and backslope was about 0.5 m.
Triplicate cores (1.2 m by 5.9 cm) were taken within 2 wk
after harvest with a hydraulic coring machine at each sampling
location (Fig. 1a). Cores were cut into 15-cm segments, resulting
in three 412-cm3 subsamples for eight layers. The cores were taken
within a 1.5-m distance down the slope, midway between two
drilled soybean rows. This generated 288 root samples for Site 1
(2 landscape positions × 2 cropping system treatments × 3 block
replications × 3 cores × 8 depths). Triplicates were used to assess
local root variability, but were pooled for analysis. Pooled sample
volume for each layer was 1236 cm3. Sample cores (for both study
sites) received a brief soil morphology description in the fi eld, not-
ing horizons and depth to clay maximum. Depth to claypan was
measured as the depth (cm) to the boundary between the “topsoil”
(A, AE, E, or AB horizons) and the Bt1 horizon.
Figure 1. (a) Site 1 aerial photograph of existing research plots running east to west. Overlaid on the plot photograph are the root sampling
locations, order-one soil survey, and depth to claypan (DTC) contour map. (b) Site 2 root sampling locations are overlaid on a DTC map.
(c) Site 2 order-one soil survey with root sampling locations. * See Table 1 for soil map unit key with taxonomy.
Table 1. Soil taxonomy and phase with map unit key and
approximate landscape position for the two study sites.
Landscape position
Map unit ID
Soil phase Taxonomy
Summit AdSLAdco silt loam,
0–2% slopes
Fine, smectitic, mesic
Vertic Albaqualf
MeSLMexico silt loam,
1–3% slopes
Fine, smectitic, mesic
Vertic Epiaqualf
Shoulder MeSL5eMexico silt loam,
2–5% slopes eroded
Fine, smectitic, mesic
Vertic Epiaqualf
MeSL3Mexico silt loam,
2–3% slopes
Fine, smectitic, mesic
Vertic Epiaqualf
MeSCLeMexico silty clay loam,
1–3% slopes eroded
Fine, smectitic, mesic
Vertic Epiaqualf
Backslope LeSL3eLeonard silt loam,
1–3% slopes, eroded
Fine, smectitic, mesic
Vertic Epiaqualf
LeSCLeLeonard silty clay loam,
1–3% slopes, eroded
Fine, smectitic, mesic
Vertic Epiaqualf
LeSL6eLeonard silt loam,
3–6% slopes, eroded
Fine, smectitic, mesic
Vertic Epiaqualf
Footslope LeSL3Leonard silt loam,
1–3% slopes
Fine, smectitic, mesic
Vertic Epiaqualf
Upland
fl oodplain
AudllFSArgiudolls, fi ne-silty,
0–2% slopes
Fine-silty, smectitic,
mesic Vertic Argiudolls
AabllFSArgialbolls, fi ne-silty,
0–2% slopes
Fine-silty, smectitic,
mesic Albic Argialbolls
Aaqll Argiaquolls, generic Fine Typic Argiaquolls
Repro
duced
from
Cro
pS
cie
nce.
Publis
hed
by
Cro
pS
cie
nce
Socie
tyof
Am
erica.
All
copyrights
reserv
ed.
CROP SCIENCE, VOL. 47, JULY–AUGUST 2007 WWW.CROPS.ORG 1501
Relief on this site was about 12 m. Missouri Cooperative Soil
Survey personnel conducted an order-one survey on this fi eld
in 2000, classing the incised topography into 21 diff erent soil
map units (Table 1, Fig. 1c).
Within 2 wk after harvest, 26 locations were sampled for
root measurement, stratifying the fi eld based on landforms and
DTC. At each sampling location a hydraulic coring machine
was used to pull duplicate cores (1.2 m by 3.8 cm) from between
two drilled soybean rows, cut into eight 15-cm layers, and then
combined across duplicates. A total of 208 samples were taken
for root analysis with a combined sample volume of 340 cm3.
Root Measurements and CalculationsThe sequence of procedures and algorithms to obtain root dis-
tribution data included washing, imaging and enhancement,
debris removal via image processing, and measurement. These
procedures were adapted from the published procedures of oth-
ers (Dowdy et al., 1998; Murphy and Smucker, 1995; Smucker,
1982). Soil was washed from roots using a Gillison’s hydropneu-
matic elutriator (Gillison’s Variety Fabrication Inc., Benzonia,
MI). Air-dried soil samples were presoaked for 15 min and then
washed for 12 min. Cleaned root samples were placed in 100 mL
of 30% (v/v) methanol solution for storage at 4°C. Before imag-
ing, roots were stained with malachite green (Sigma-Aldrich
Corp., St. Louis, MO) for a minimum of 30 min at 0.05% (w/v)
by adding concentrated dye to the storage containers.
Stained roots were rinsed and fl oated in a thin fi lm of dis-
tilled water inside 22.5 by 22.5 cm tissue culture plates. Plates were
imaged in grayscale using a common fl atbed scanner at 300 dpi.
Image enhancement and root object discrimination was performed
in image analysis software using a macro language for automated
processing (Insightful Corporation, 2000). Due to the similar den-
sity of root and nonroot debris, incomplete cleaning was a prob-
lem. A linear discriminant model was developed from a training
dataset of pixel measurements of root and nonroot objects to cal-
culate a selection criterion. Objects that exceeded the discriminant
threshold were deleted from the images and pixel measurements of
root objects were retained for analysis.
Image vectorizing software was then used to thin root
object pixels and to convert the thinned lines into vectors (Soft-
Soft.net, 2004). Length of the resulting polyline vectors was
calculated based on their Cartesian coordinates (ESRI, 2002).
A linear calibration model based on known string lengths and
surface area adjusted for the eff ects of increasing overlap as the
density of roots on an image increased. Root length density was
calculated for Sites 1 and 2 as the ratio of the calibrated vector
length (Lv, cm) to the sample volume (V, cm3).
3 vRLD (cm cm )L
V=− [1]
Projected surface area (Ap, cm2) of unthinned root objects and
measured vector length (Lv, cm) of a processed root image were
used to calculate ARD (Eq. [2]) for a sampled layer for Site 2,
assuming that individual root segments approximate a cylinder
(Benjamin and Nielsen, 2004).
p
v
ARD (mm) 10A
L
⎛ ⎞⎟⎜ ⎟= ⎜ ⎟⎜ ⎟⎜⎝ ⎠ [2]
Surface soils had many undecomposed root-like plant fi bers
that were indistinguishable from root segments by discrimi-
nant analysis and diffi cult to identify even by a trained eye. A
limited set of surface root measurements was obtained from Site
1. Random samples of 12 surface cores from the top 15 cm (six
summit and six backslope) were manually cleaned of debris and
measured. No diff erence was seen due to tillage or landscape
position because of high variability (Myers, 2005). Therefore
the surface samples were pooled within landscape position for
Site 1 and no surface layers were sampled for Site 2.
ECa Measurement
Geonics EM-38 (Geonics Limited, Mississauga, ON) and Veris
3100 (Veris Technologies, Inc., Salina, KS) ground conductiv-
ity sensors were used to survey Site 2 (Kitchen et al., 1999; Sud-
duth et al., 2003). EM-38 measurements (ECa-em
) were taken in
the vertical dipole mode (eff ective depth 1.5 m) using a mobile
sensor cart. The Veris Model 3100 produces two measurements;
shallow (ECa-sh
, eff ective depth 0.3 m) and deep (ECa-dp
, eff ec-
tive depth 1.0 m). Both sensors were run on 10-m transects
with GPS logging. Local polynomial regression was used to
interpolate ECa maps (ESRI, 2002). Based on this map, esti-
mated ECa was predicted at the root sampling coordinates.
Clay-Maximum Depth TranslationDepth to clay-maximum was obvious (± 2.5 cm) from fi eld
observations on soil cores by determining the moist consistency
of the soil, resistance to knife insertion, and gloss of the pol-
ished core surface. Depth to clay-maximum served as a useful
variable for integrating soil profi le and landscape relationships.
For each soil profi le, clay-maximum translated depth (Dt) of a
sample from layer i was calculated by Eq. [3] where clay maxi-
mum depth (cm) is the depth to maximum clay concentration
and d is the midlayer depth (cm) of soil layer i.
Dt,i (cm) = clay-maximum depth − d
i [3]
Results of this equation indicate the distance that a given soil layer
occurs either above or below its profi le clay maximum. When
performed on a group of soils from across a landform with vary-
ing DTC, Dt is a coherent linear translation, aligning profi les by
the clay-maximum origin. Coherent depth translation resolves
soil and root property measurements from a wide landscape onto
a single scale, enhancing their comprehensive interpretation.
Soil Profi le Property MeasurementsData from previous research on the study sites were used to char-
acterize soil profi le property distributions. Surface and subsoil
samples taken by horizon and fi xed increment were subjected
to laboratory analysis as reported by previous research ( Jung
et al., 2005; Spautz, 1998; Sudduth et al., 2004). Included soil
property measurements were: texture, buff er pH (pHs), OM,
available P, cation exchange capacity (CEC), K+, Ca2+, Mg2+,
Na+, Al3+, and neutralizeable acidity (NA).
Statistics and Model DevelopmentAnalysis of variance, linear regression, and exploratory local
regression procedures were performed in S-Plus (Insightful
Corporation, 2000). For Site 1 a two-factor analysis of variance
was employed to test each soil layer for the main eff ects of land-
scape position and tillage treatment, interaction of the main
eff ects, and to determine treatment diff erences (Myers, 2005).
Repro
duced
from
Cro
pS
cie
nce.
Publis
hed
by
Cro
pS
cie
nce
Socie
tyof
Am
erica.
All
copyrights
reserv
ed.
1502 WWW.CROPS.ORG CROP SCIENCE, VOL. 47, JULY–AUGUST 2007
Only the eff ects of landscape position comparisons are relevant
to this study. Layer by layer, sampled root parameters from Site
2 were regressed as a function of DTC and ECa. Linear and
quadratic models were selected based on the signifi cance of the
overall model (P < 0.1), signifi cance of the linear or quadratic
parameter (P < 0.05), and the degree of fi t (r2 > 0.2). For some
fi gures, local regression models (“loess” function; Cleveland et
al., 1992), were fi t to characterize Dt relationships with root and
soil measurements. Local regression parameters were identifi ed
via the improved Akaike information criterion which optimizes
parsimony and residual error (Hurvich et al., 1998).
RESULTS
Site 1
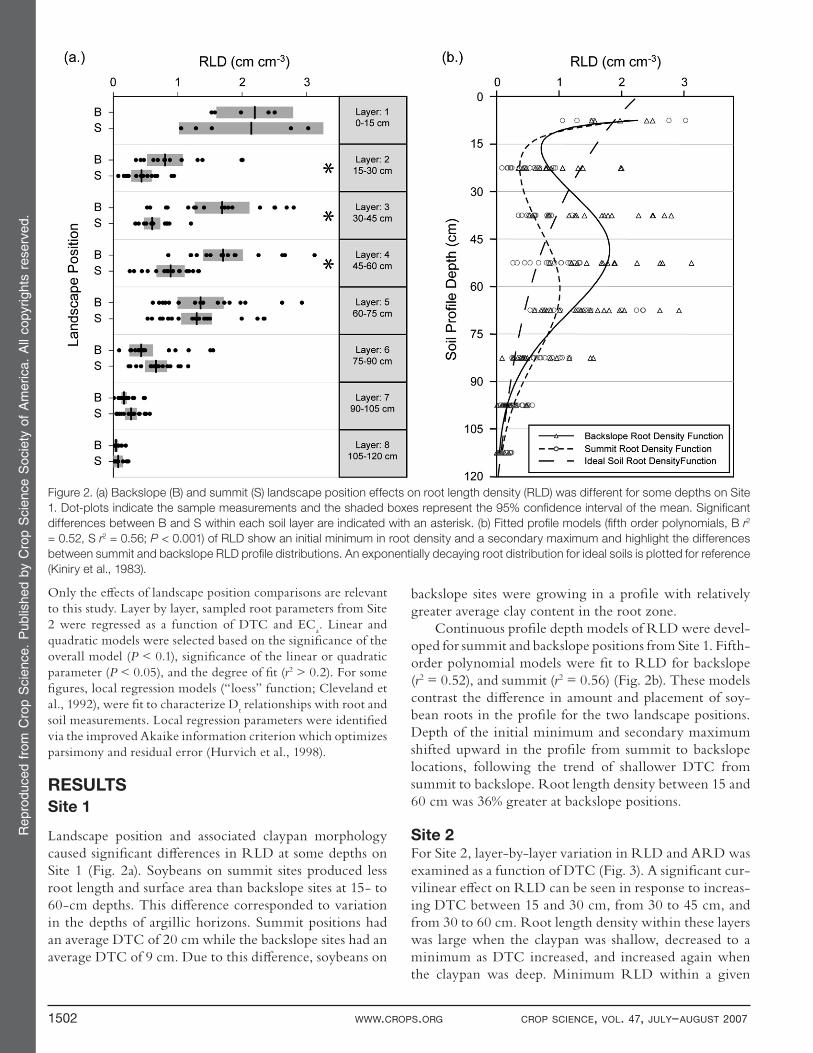
Landscape position and associated claypan morphology caused signifi cant diff erences in RLD at some depths on Site 1 (Fig. 2a). Soybeans on summit sites produced less root length and surface area than backslope sites at 15- to 60-cm depths. This diff erence corresponded to variation in the depths of argillic horizons. Summit positions had an average DTC of 20 cm while the backslope sites had an average DTC of 9 cm. Due to this diff erence, soybeans on
backslope sites were growing in a profi le with relatively greater average clay content in the root zone.
Continuous profi le depth models of RLD were devel-oped for summit and backslope positions from Site 1. Fifth-order polynomial models were fi t to RLD for backslope (r2 = 0.52), and summit (r2 = 0.56) (Fig. 2b). These models contrast the diff erence in amount and placement of soy-bean roots in the profi le for the two landscape positions. Depth of the initial minimum and secondary maximum shifted upward in the profi le from summit to backslope locations, following the trend of shallower DTC from summit to backslope. Root length density between 15 and 60 cm was 36% greater at backslope positions.
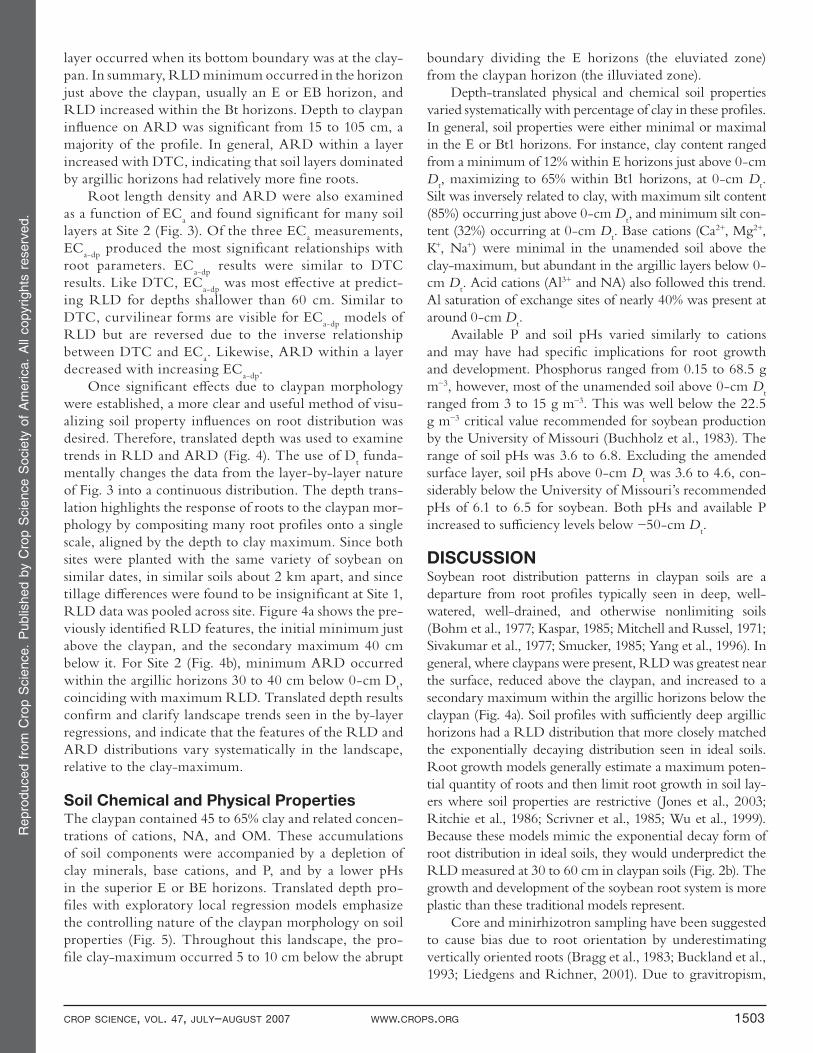
Site 2For Site 2, layer-by-layer variation in RLD and ARD was examined as a function of DTC (Fig. 3). A signifi cant cur-vilinear eff ect on RLD can be seen in response to increas-ing DTC between 15 and 30 cm, from 30 to 45 cm, and from 30 to 60 cm. Root length density within these layers was large when the claypan was shallow, decreased to a minimum as DTC increased, and increased again when the claypan was deep. Minimum RLD within a given
Figure 2. (a) Backslope (B) and summit (S) landscape position effects on root length density (RLD) was different for some depths on Site
1. Dot-plots indicate the sample measurements and the shaded boxes represent the 95% confi dence interval of the mean. Signifi cant
differences between B and S within each soil layer are indicated with an asterisk. (b) Fitted profi le models (fi fth order polynomials, B r2
= 0.52, S r2 = 0.56; P < 0.001) of RLD show an initial minimum in root density and a secondary maximum and highlight the differences
between summit and backslope RLD profi le distributions. An exponentially decaying root distribution for ideal soils is plotted for reference
(Kiniry et al., 1983).
Repro
duced
from
Cro
pS
cie
nce.
Publis
hed
by
Cro
pS
cie
nce
Socie
tyof
Am
erica.
All
copyrights
reserv
ed.
CROP SCIENCE, VOL. 47, JULY–AUGUST 2007 WWW.CROPS.ORG 1503
layer occurred when its bottom boundary was at the clay-pan. In summary, RLD minimum occurred in the horizon just above the claypan, usually an E or EB horizon, and RLD increased within the Bt horizons. Depth to claypan infl uence on ARD was signifi cant from 15 to 105 cm, a majority of the profi le. In general, ARD within a layer increased with DTC, indicating that soil layers dominated by argillic horizons had relatively more fi ne roots.
Root length density and ARD were also examined as a function of EC
a and found signifi cant for many soil
layers at Site 2 (Fig. 3). Of the three ECa measurements,
ECa-dp
produced the most signifi cant relationships with root parameters. EC
a-dp results were similar to DTC
results. Like DTC, ECa-dp
was most eff ective at predict-ing RLD for depths shallower than 60 cm. Similar to DTC, curvilinear forms are visible for EC
a-dp models of
RLD but are reversed due to the inverse relationship between DTC and EC
a. Likewise, ARD within a layer
decreased with increasing ECa-dp
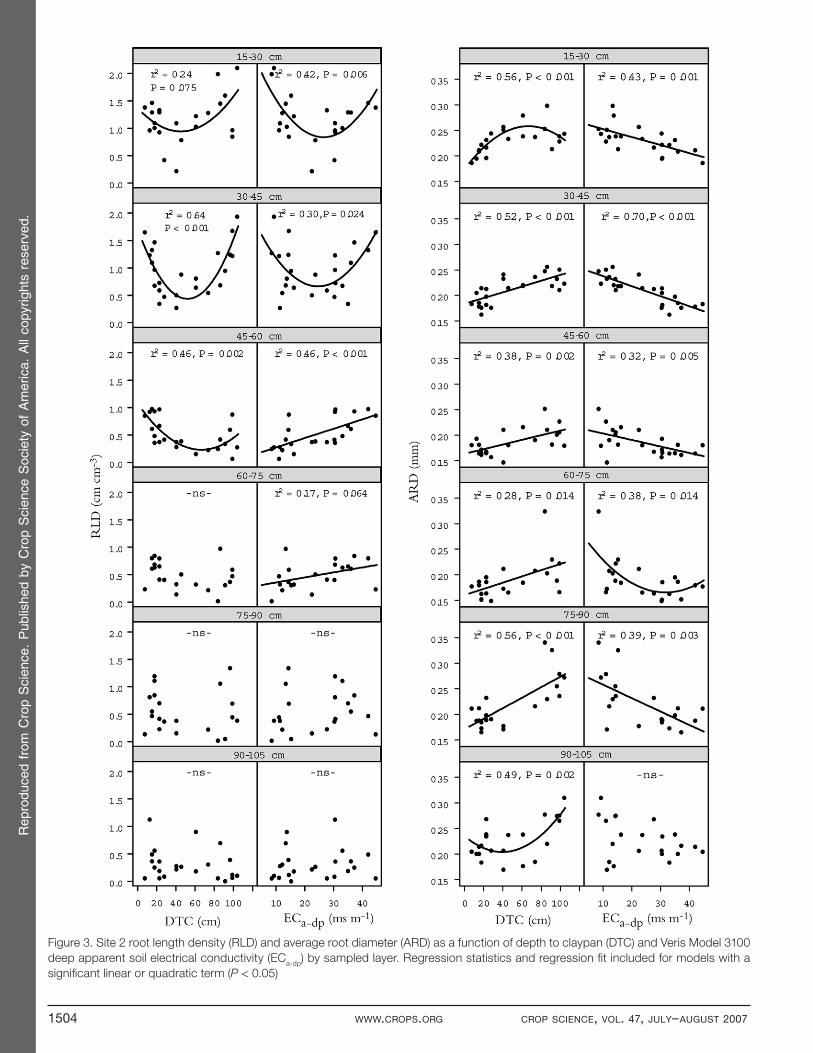
.Once signifi cant eff ects due to claypan morphology
were established, a more clear and useful method of visu-alizing soil property infl uences on root distribution was desired. Therefore, translated depth was used to examine trends in RLD and ARD (Fig. 4). The use of D
t funda-
mentally changes the data from the layer-by-layer nature of Fig. 3 into a continuous distribution. The depth trans-lation highlights the response of roots to the claypan mor-phology by compositing many root profi les onto a single scale, aligned by the depth to clay maximum. Since both sites were planted with the same variety of soybean on similar dates, in similar soils about 2 km apart, and since tillage diff erences were found to be insignifi cant at Site 1, RLD data was pooled across site. Figure 4a shows the pre-viously identifi ed RLD features, the initial minimum just above the claypan, and the secondary maximum 40 cm below it. For Site 2 (Fig. 4b), minimum ARD occurred within the argillic horizons 30 to 40 cm below 0-cm D
t,
coinciding with maximum RLD. Translated depth results confi rm and clarify landscape trends seen in the by-layer regressions, and indicate that the features of the RLD and ARD distributions vary systematically in the landscape, relative to the clay-maximum.
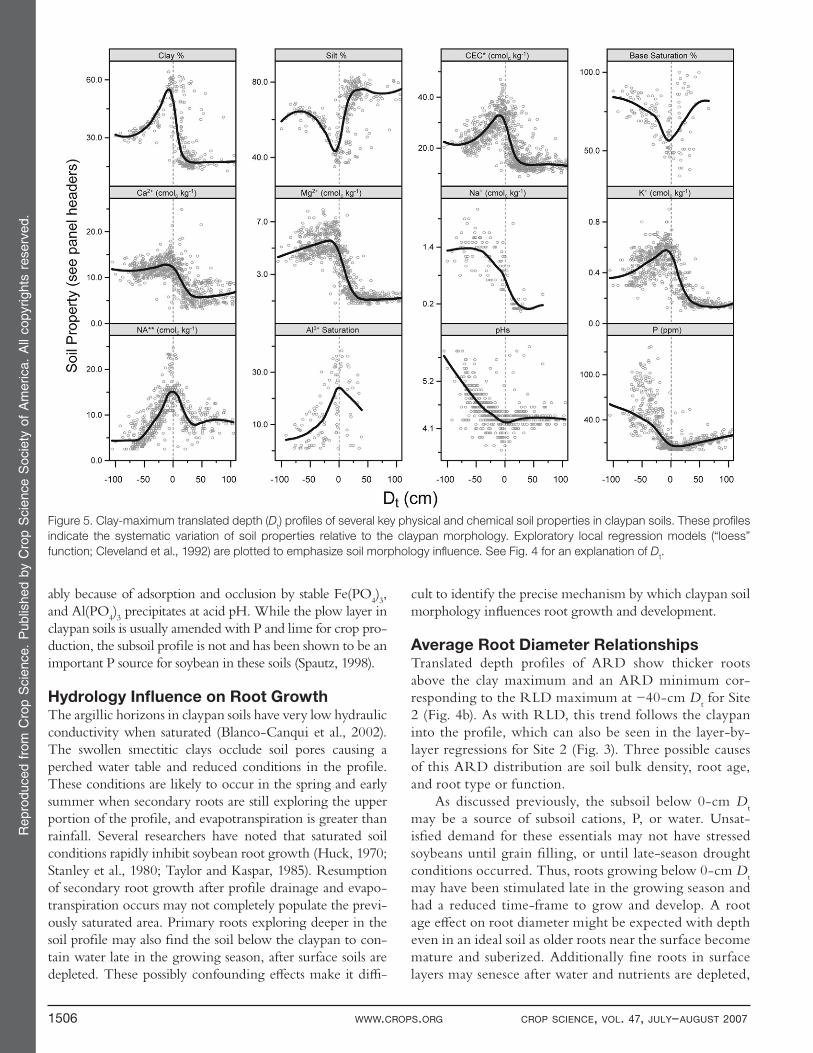
Soil Chemical and Physical PropertiesThe claypan contained 45 to 65% clay and related concen-trations of cations, NA, and OM. These accumulations of soil components were accompanied by a depletion of clay minerals, base cations, and P, and by a lower pHs in the superior E or BE horizons. Translated depth pro-fi les with exploratory local regression models emphasize the controlling nature of the claypan morphology on soil properties (Fig. 5). Throughout this landscape, the pro-fi le clay-maximum occurred 5 to 10 cm below the abrupt
boundary dividing the E horizons (the eluviated zone) from the claypan horizon (the illuviated zone).
Depth-translated physical and chemical soil properties varied systematically with percentage of clay in these profi les. In general, soil properties were either minimal or maximal in the E or Bt1 horizons. For instance, clay content ranged from a minimum of 12% within E horizons just above 0-cm D
t, maximizing to 65% within Bt1 horizons, at 0-cm D
t.
Silt was inversely related to clay, with maximum silt content (85%) occurring just above 0-cm D
t, and minimum silt con-
tent (32%) occurring at 0-cm Dt. Base cations (Ca2+, Mg2+,
K+, Na+) were minimal in the unamended soil above the clay-maximum, but abundant in the argillic layers below 0-cm D
t. Acid cations (Al3+ and NA) also followed this trend.
Al saturation of exchange sites of nearly 40% was present at around 0-cm D
t.
Available P and soil pHs varied similarly to cations and may have had specifi c implications for root growth and development. Phosphorus ranged from 0.15 to 68.5 g m−3, however, most of the unamended soil above 0-cm D
t
ranged from 3 to 15 g m−3. This was well below the 22.5 g m−3 critical value recommended for soybean production by the University of Missouri (Buchholz et al., 1983). The range of soil pHs was 3.6 to 6.8. Excluding the amended surface layer, soil pHs above 0-cm D
t was 3.6 to 4.6, con-
siderably below the University of Missouri’s recommended pHs of 6.1 to 6.5 for soybean. Both pHs and available P increased to suffi ciency levels below −50-cm D
t.
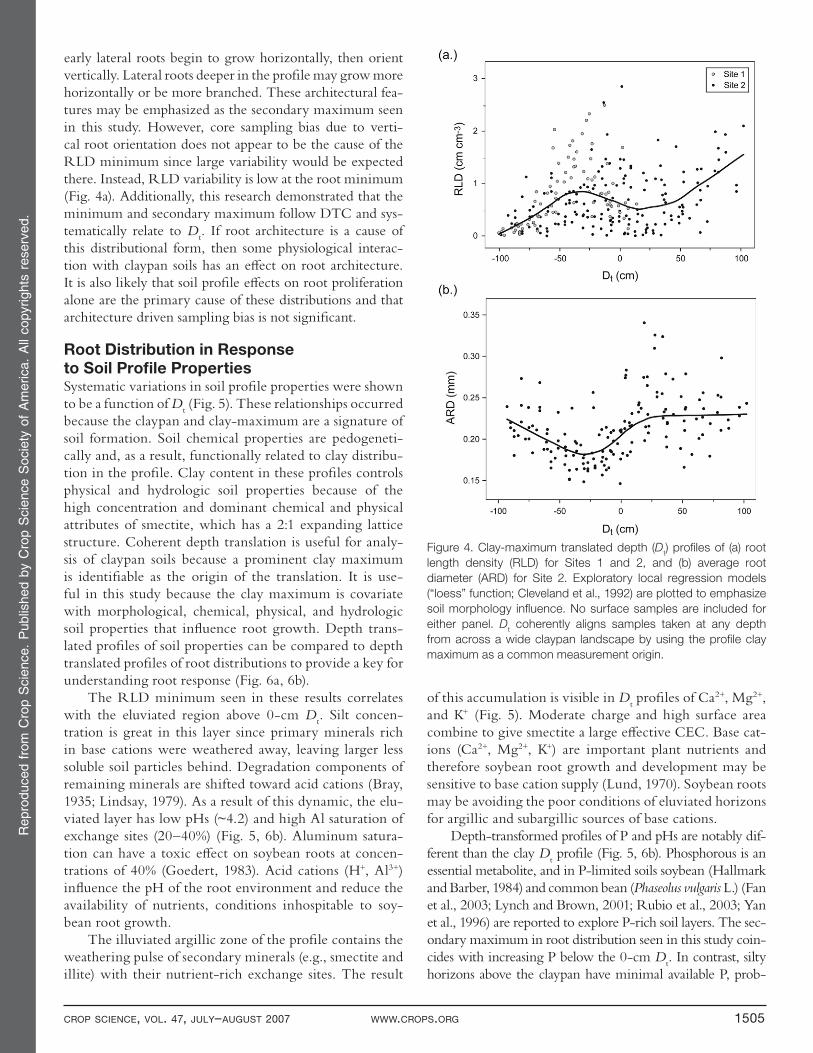
DISCUSSIONSoybean root distribution patterns in claypan soils are a departure from root profi les typically seen in deep, well-watered, well-drained, and otherwise nonlimiting soils (Bohm et al., 1977; Kaspar, 1985; Mitchell and Russel, 1971; Sivakumar et al., 1977; Smucker, 1985; Yang et al., 1996). In general, where claypans were present, RLD was greatest near the surface, reduced above the claypan, and increased to a secondary maximum within the argillic horizons below the claypan (Fig. 4a). Soil profi les with suffi ciently deep argillic horizons had a RLD distribution that more closely matched the exponentially decaying distribution seen in ideal soils. Root growth models generally estimate a maximum poten-tial quantity of roots and then limit root growth in soil lay-ers where soil properties are restrictive (Jones et al., 2003; Ritchie et al., 1986; Scrivner et al., 1985; Wu et al., 1999). Because these models mimic the exponential decay form of root distribution in ideal soils, they would underpredict the RLD measured at 30 to 60 cm in claypan soils (Fig. 2b). The growth and development of the soybean root system is more plastic than these traditional models represent.
Core and minirhizotron sampling have been suggested to cause bias due to root orientation by underestimating vertically oriented roots (Bragg et al., 1983; Buckland et al., 1993; Liedgens and Richner, 2001). Due to gravitropism,
Repro
duced
from
Cro
pS
cie
nce.
Publis
hed
by
Cro
pS
cie
nce
Socie
tyof
Am
erica.
All
copyrights
reserv
ed.
1504 WWW.CROPS.ORG CROP SCIENCE, VOL. 47, JULY–AUGUST 2007
Figure 3. Site 2 root length density (RLD) and average root diameter (ARD) as a function of depth to claypan (DTC) and Veris Model 3100
deep apparent soil electrical conductivity (ECa-dp
) by sampled layer. Regression statistics and regression fi t included for models with a
signifi cant linear or quadratic term (P < 0.05)
Repro
duced
from
Cro
pS
cie
nce.
Publis
hed
by
Cro
pS
cie
nce
Socie
tyof
Am
erica.
All
copyrights
reserv
ed.
CROP SCIENCE, VOL. 47, JULY–AUGUST 2007 WWW.CROPS.ORG 1505
early lateral roots begin to grow horizontally, then orient vertically. Lateral roots deeper in the profi le may grow more horizontally or be more branched. These architectural fea-tures may be emphasized as the secondary maximum seen in this study. However, core sampling bias due to verti-cal root orientation does not appear to be the cause of the RLD minimum since large variability would be expected there. Instead, RLD variability is low at the root minimum (Fig. 4a). Additionally, this research demonstrated that the minimum and secondary maximum follow DTC and sys-tematically relate to D
t. If root architecture is a cause of
this distributional form, then some physiological interac-tion with claypan soils has an eff ect on root architecture. It is also likely that soil profi le eff ects on root proliferation alone are the primary cause of these distributions and that architecture driven sampling bias is not signifi cant.
Root Distribution in Response to Soil Profi le PropertiesSystematic variations in soil profi le properties were shown to be a function of D
t (Fig. 5). These relationships occurred
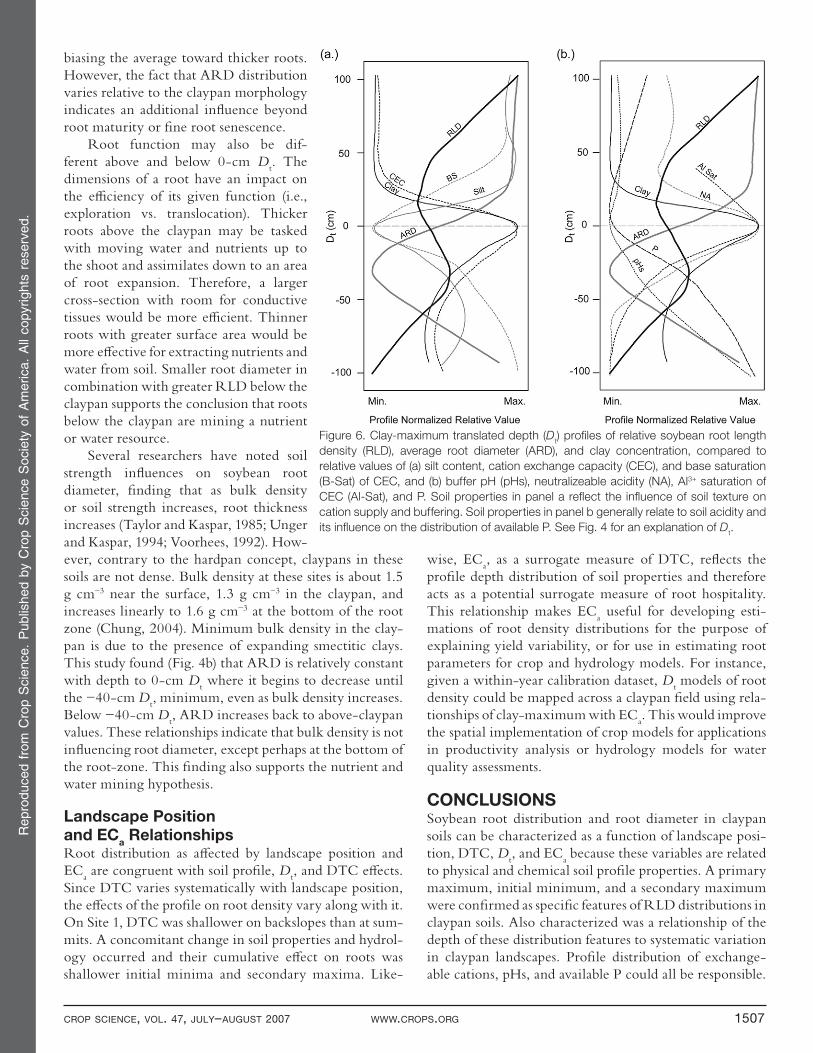
because the claypan and clay-maximum are a signature of soil formation. Soil chemical properties are pedogeneti-cally and, as a result, functionally related to clay distribu-tion in the profi le. Clay content in these profi les controls physical and hydrologic soil properties because of the high concentration and dominant chemical and physical attributes of smectite, which has a 2:1 expanding lattice structure. Coherent depth translation is useful for analy-sis of claypan soils because a prominent clay maximum is identifi able as the origin of the translation. It is use-ful in this study because the clay maximum is covariate with morphological, chemical, physical, and hydrologic soil properties that infl uence root growth. Depth trans-lated profi les of soil properties can be compared to depth translated profi les of root distributions to provide a key for understanding root response (Fig. 6a, 6b).
The RLD minimum seen in these results correlates with the eluviated region above 0-cm D
t. Silt concen-
tration is great in this layer since primary minerals rich in base cations were weathered away, leaving larger less soluble soil particles behind. Degradation components of remaining minerals are shifted toward acid cations (Bray, 1935; Lindsay, 1979). As a result of this dynamic, the elu-viated layer has low pHs (~4.2) and high Al saturation of exchange sites (20–40%) (Fig. 5, 6b). Aluminum satura-tion can have a toxic eff ect on soybean roots at concen-trations of 40% (Goedert, 1983). Acid cations (H+, Al3+) infl uence the pH of the root environment and reduce the availability of nutrients, conditions inhospitable to soy-bean root growth.
The illuviated argillic zone of the profi le contains the weathering pulse of secondary minerals (e.g., smectite and illite) with their nutrient-rich exchange sites. The result
of this accumulation is visible in Dt profi les of Ca2+, Mg2+,
and K+ (Fig. 5). Moderate charge and high surface area combine to give smectite a large eff ective CEC. Base cat-ions (Ca2+, Mg2+, K+) are important plant nutrients and therefore soybean root growth and development may be sensitive to base cation supply (Lund, 1970). Soybean roots may be avoiding the poor conditions of eluviated horizons for argillic and subargillic sources of base cations.
Depth-transformed profi les of P and pHs are notably dif-ferent than the clay D
t profi le (Fig. 5, 6b). Phosphorous is an
essential metabolite, and in P-limited soils soybean (Hallmark and Barber, 1984) and common bean (Phaseolus vulgaris L.) (Fan et al., 2003; Lynch and Brown, 2001; Rubio et al., 2003; Yan et al., 1996) are reported to explore P-rich soil layers. The sec-ondary maximum in root distribution seen in this study coin-cides with increasing P below the 0-cm D
t. In contrast, silty
horizons above the claypan have minimal available P, prob-
Figure 4. Clay-maximum translated depth (Dt) profi les of (a) root
length density (RLD) for Sites 1 and 2, and (b) average root
diameter (ARD) for Site 2. Exploratory local regression models
(“loess” function; Cleveland et al., 1992) are plotted to emphasize
soil morphology infl uence. No surface samples are included for
either panel. Dt coherently aligns samples taken at any depth
from across a wide claypan landscape by using the profi le clay
maximum as a common measurement origin.
Repro
duced
from
Cro
pS
cie
nce.
Publis
hed
by
Cro
pS
cie
nce
Socie
tyof
Am
erica.
All
copyrights
reserv
ed.
1506 WWW.CROPS.ORG CROP SCIENCE, VOL. 47, JULY–AUGUST 2007
ably because of adsorption and occlusion by stable Fe(PO4)3,
and Al(PO4)3 precipitates at acid pH. While the plow layer in
claypan soils is usually amended with P and lime for crop pro-duction, the subsoil profi le is not and has been shown to be an important P source for soybean in these soils (Spautz, 1998).
Hydrology Infl uence on Root GrowthThe argillic horizons in claypan soils have very low hydraulic conductivity when saturated (Blanco-Canqui et al., 2002). The swollen smectitic clays occlude soil pores causing a perched water table and reduced conditions in the profi le. These conditions are likely to occur in the spring and early summer when secondary roots are still exploring the upper portion of the profi le, and evapotranspiration is greater than rainfall. Several researchers have noted that saturated soil conditions rapidly inhibit soybean root growth (Huck, 1970; Stanley et al., 1980; Taylor and Kaspar, 1985). Resumption of secondary root growth after profi le drainage and evapo-transpiration occurs may not completely populate the previ-ously saturated area. Primary roots exploring deeper in the soil profi le may also fi nd the soil below the claypan to con-tain water late in the growing season, after surface soils are depleted. These possibly confounding eff ects make it diffi -
cult to identify the precise mechanism by which claypan soil morphology infl uences root growth and development.
Average Root Diameter RelationshipsTranslated depth profi les of ARD show thicker roots above the clay maximum and an ARD minimum cor-responding to the RLD maximum at −40-cm D
t for Site
2 (Fig. 4b). As with RLD, this trend follows the claypan into the profi le, which can also be seen in the layer-by-layer regressions for Site 2 (Fig. 3). Three possible causes of this ARD distribution are soil bulk density, root age, and root type or function.
As discussed previously, the subsoil below 0-cm Dt
may be a source of subsoil cations, P, or water. Unsat-isfi ed demand for these essentials may not have stressed soybeans until grain fi lling, or until late-season drought conditions occurred. Thus, roots growing below 0-cm D
t
may have been stimulated late in the growing season and had a reduced time-frame to grow and develop. A root age eff ect on root diameter might be expected with depth even in an ideal soil as older roots near the surface become mature and suberized. Additionally fi ne roots in surface layers may senesce after water and nutrients are depleted,
Figure 5. Clay-maximum translated depth (Dt) profi les of several key physical and chemical soil properties in claypan soils. These profi les
indicate the systematic variation of soil properties relative to the claypan morphology. Exploratory local regression models (“loess”
function; Cleveland et al., 1992) are plotted to emphasize soil morphology infl uence. See Fig. 4 for an explanation of Dt.
Repro
duced
from
Cro
pS
cie
nce.
Publis
hed
by
Cro
pS
cie
nce
Socie
tyof
Am
erica.
All
copyrights
reserv
ed.
CROP SCIENCE, VOL. 47, JULY–AUGUST 2007 WWW.CROPS.ORG 1507
biasing the average toward thicker roots. However, the fact that ARD distribution varies relative to the claypan morphology indicates an additional infl uence beyond root maturity or fi ne root senescence.
Root function may also be dif-ferent above and below 0-cm D
t. The
dimensions of a root have an impact on the effi ciency of its given function (i.e., exploration vs. translocation). Thicker roots above the claypan may be tasked with moving water and nutrients up to the shoot and assimilates down to an area of root expansion. Therefore, a larger cross-section with room for conductive tissues would be more effi cient. Thinner roots with greater surface area would be more eff ective for extracting nutrients and water from soil. Smaller root diameter in combination with greater RLD below the claypan supports the conclusion that roots below the claypan are mining a nutrient or water resource.
Several researchers have noted soil strength infl uences on soybean root diameter, fi nding that as bulk density or soil strength increases, root thickness increases (Taylor and Kaspar, 1985; Unger and Kaspar, 1994; Voorhees, 1992). How-ever, contrary to the hardpan concept, claypans in these soils are not dense. Bulk density at these sites is about 1.5 g cm−3 near the surface, 1.3 g cm−3 in the claypan, and increases linearly to 1.6 g cm−3 at the bottom of the root zone (Chung, 2004). Minimum bulk density in the clay-pan is due to the presence of expanding smectitic clays. This study found (Fig. 4b) that ARD is relatively constant with depth to 0-cm D
t where it begins to decrease until
the −40-cm Dt, minimum, even as bulk density increases.
Below −40-cm Dt, ARD increases back to above-claypan
values. These relationships indicate that bulk density is not infl uencing root diameter, except perhaps at the bottom of the root-zone. This fi nding also supports the nutrient and water mining hypothesis.
Landscape Position and EC
a Relationships
Root distribution as aff ected by landscape position and EC
a are congruent with soil profi le, D
t, and DTC eff ects.
Since DTC varies systematically with landscape position, the eff ects of the profi le on root density vary along with it. On Site 1, DTC was shallower on backslopes than at sum-mits. A concomitant change in soil properties and hydrol-ogy occurred and their cumulative eff ect on roots was shallower initial minima and secondary maxima. Like-
wise, ECa, as a surrogate measure of DTC, refl ects the
profi le depth distribution of soil properties and therefore acts as a potential surrogate measure of root hospitality. This relationship makes EC
a useful for developing esti-
mations of root density distributions for the purpose of explaining yield variability, or for use in estimating root parameters for crop and hydrology models. For instance, given a within-year calibration dataset, D
t models of root
density could be mapped across a claypan fi eld using rela-tionships of clay-maximum with EC
a. This would improve
the spatial implementation of crop models for applications in productivity analysis or hydrology models for water quality assessments.
CONCLUSIONSSoybean root distribution and root diameter in claypan soils can be characterized as a function of landscape posi-tion, DTC, D
t, and EC
a because these variables are related
to physical and chemical soil profi le properties. A primary maximum, initial minimum, and a secondary maximum were confi rmed as specifi c features of RLD distributions in claypan soils. Also characterized was a relationship of the depth of these distribution features to systematic variation in claypan landscapes. Profi le distribution of exchange-able cations, pHs, and available P could all be responsible.
Figure 6. Clay-maximum translated depth (Dt) profi les of relative soybean root length
density (RLD), average root diameter (ARD), and clay concentration, compared to
relative values of (a) silt content, cation exchange capacity (CEC), and base saturation
(B-Sat) of CEC, and (b) buffer pH (pHs), neutralizeable acidity (NA), Al3+ saturation of
CEC (Al-Sat), and P. Soil properties in panel a refl ect the infl uence of soil texture on
cation supply and buffering. Soil properties in panel b generally relate to soil acidity and
its infl uence on the distribution of available P. See Fig. 4 for an explanation of Dt.
Repro
duced
from
Cro
pS
cie
nce.
Publis
hed
by
Cro
pS
cie
nce
Socie
tyof
Am
erica.
All
copyrights
reserv
ed.
1508 WWW.CROPS.ORG CROP SCIENCE, VOL. 47, JULY–AUGUST 2007
Declining RLD above the claypan matched the decline in pHs which likely causes decreasing availability of soil nutrients, particularly P, and refl ects potentially toxic lev-els of Al3+ saturation. In contrast, increasing RLD below the clay-maximum correlated with increasing pHs, possi-bly causing increased P solubility and nutrient availability at around 40 cm below the claypan, as well as reduced Al3+ toxicity. Additional root growth at this depth could be compensating for nutrient and water defi ciencies above the claypan. Reduced ARD below the claypan could be due to root age, refl ecting late season foraging for nutri-ents or water. Alternatively, or additionally, roots may be thinner for improved function in nutrient and water absorption. Bulk density is probably not responsible for RLD or ARD distributions.
The results of this fi eld study provide an important picture of the hidden half of soybeans on claypan soils and may be useful information for the explanation of yield variability, the calibration or validation of crop models, and the development of claypan-tolerant soy-bean varieties. Finally, while our study focused on the Central Claypan Areas, soils in the upland landscapes of the loess-covered till plains of Missouri, Iowa, Illinois, and Indiana have comparable soil morphology and are likely to respond similarly.
ReferencesBenjamin, J.G., and D.C. Nielsen. 2004. A method to separate
plant roots from soil and analyze root surface area. Plant Soil
267:225–234.
Blanco-Canqui, H., C.J. Gantzer, S.H. Anderson, E.E. Alberts,
and F. Ghidey. 2002. Saturated hydraulic conductivity and
its impact on simulated runoff for claypan soils. Soil Sci. Soc.
Am. J. 66:1596–1602.
Bohm, W., H. Madukor, and H.M. Taylor. 1977. Comparison
of fi ve methods for characterizing soybean rooting density.
Agron. J. 69:415–419.
Bragg, P.L., G. Govi, and S.R. Canner. 1983. A comparison of
methods, including angled and vertical minirhizotrons, for
studying root growth and distribution in a spring oat crop.
Plant Soil 75:435–440.
Bray, R.H. 1935. The origin of horizons in claypan soils. Am. Soil
Surv. Assoc. Bull. 16:70–75.
Buchholz, D.D., J.R. Brown, J.D. Garret, R.G. Hanson, and H.N.
Wheaton. 1983. Soil test interpretations and recommenda-
tions handbook. Revised 12/92 ed. Univ. of Missouri, Col-
lege of Agriculture, Dep. of Agronomy, Columbia.
Buckland, S.T., C.D. Campbell, L.A. Mackiedawson, G.W.
Horgan, and E.I. Duff . 1993. A method for counting roots
observed in minirhizotrons and their theoretical conversion
to root length density. Plant Soil 153:1–9.
Chung, S.-O. 2004. On-the-go soil strength profi le sensor. Ph.D.
diss. Univ. of Missouri, Columbia.
Cleveland, W.R., E. Grosse, and W.M. Shyu. 1992. Local regres-
sion models. p. 309–376. In J.M. Chambers and T.J. Hastie
(ed.) Statistical models in S. Wadsworth, Pacifi c Grove, CA.
Doolittle, J.A., K.A. Sudduth, N.R. Kitchen, and S.J. Indorante.
1994. Estimating depths to claypans using electromagnetic
induction methods. J. Soil Water Conserv. 45:572–575.
Dowdy, R.H., A.J.M. Smucker, M.S. Dolan, and J.C. Ferguson.
1998. Automated image analyses for separating plant roots from
soil debris elutriated from soil cores. Plant Soil 200:91–94.
ESRI. 2002. Arcgis geostatistical analyst extension. Earth Sciences
Res. Inst., Redmond, WA.
Fan, M., J. Zhu, C. Richards, K.M. Brown, and J.P. Lynch. 2003.
Physiological roles for aerenchyma in phosphorus-stressed
roots. Funct. Plant Biol. 30:493–506.
Fraisse, C.W., K.A. Sudduth, and N.R. Kitchen. 2001. Calibration
of the CERES-maize model for simulating site-specifi c crop
development and yield on claypan soils. Appl. Eng. Agric.
17:547–556.
Goedert, W.J. 1983. Management of cerrado soils in Brazil: A
review. J. Soil Sci. 34:405–428.
Guccione, M.J.W. 1982. Stratigraphy, soil development, and min-
eral weathering of quaternary deposits, midcontinent, USA.
Ph.D. diss. Univ. of Colorado, Boulder.
Hallmark, W.B., and S.A. Barber. 1984. Root growth and mor-
phology, nutrient uptake, and nutrient status of early growth of
soybeans as aff ected by soil P and K. Agron. J. 76:209–212.
Huck, M.G. 1970. Variation in taproot elongation rate as infl u-
enced by composition of the soil air. Agron. J. 62:815–818.
Huck, M.G., and H.M. Taylor. 1982. The rhizotron as a tool for
root research. Adv. Agron. 35:1–35.
Hurvich, C.M., J.S. Siminoff , and C. Tsai. 1998. Smoothing
parameter selection in nonparametric regression using an
improved Akaike information criterion. J. R. Statist. Soc. Ser.
B 60:271–293.
Insightful Corporation. 2000. S-plus 2000, release 5. Insightful
Corp., Seattle, WA.
Jones, J.W., G. Hoogenboom, C.H. Porter, K.J. Boote, W.D.
Batchelor, L.A. Hunt, P.W. Wilkens, U. Singh, A.J. Gijsman,
and J.T. Ritchie. 2003. The DSSAT cropping system model.
Eur. J. Agron. 18:235–265.
Jung, W.K., N.R. Kitchen, K.A. Sudduth, R.J. Kremer, and
P.P. Motavalli. 2005. Relationship of apparent soil electrical
conductivity to claypan soil properties. Soil Sci. Soc. Am. J.
69:883–892.
Kaspar, T.C. 1985. Growth and development of soybean root sys-
tems. p. 841–847. In R. Shibles (ed.) Proc. World Soybean
Research Conf. III, Ames, IA. 12–17 Aug. 1984. Westview
Press, Boulder, CO.
Kiniry, L.N., C.L. Scrivner, and M.E. Keener. 1983. A soil pro-
ductivity index based upon predicted water depletion and
root growth. Res. Bull. 1051. Univ. of Missouri–Columbia,
College of Agriculture, Agric. Exp. Stn., Columbia.
Kitchen, N.R., D.E. Hughes, W.W. Donald, and E.E. Alberts.
1998. Agrichemical movement in the root-zone of claypan
soils: Ridge- and mulch-tillage systems compared. Soil Till-
age Res. 48:179–193.
Kitchen, N.R., K.A. Sudduth, and S.T. Drummond. 1999. Soil
electrical conductivity as a crop productivity measure for
claypan soils. J. Prod. Agric. 12:607–617.
Liedgens, M., and W. Richner. 2001. Minirhizotron observations
of the spatial distribution of the maize root system. Agron. J.
93:1097–1104.
Lindsay, W.L. 1979. Chemical equilibria in soils. John Wiley &
Sons, New York.
Lund, Z.F. 1970. The eff ect of calcium and its relation to sev-
Repro
duced
from
Cro
pS
cie
nce.
Publis
hed
by
Cro
pS
cie
nce
Socie
tyof
Am
erica.
All
copyrights
reserv
ed.
CROP SCIENCE, VOL. 47, JULY–AUGUST 2007 WWW.CROPS.ORG 1509
eral cations in soybean root growth. Soil Sci. Soc. Am. Proc.
34:457–459.
Lynch, J.P., and K.M. Brown. 2001. Topsoil foraging: An archi-
tectural adaptation of plants to low phosphorus availability.
Plant Soil 237:225–237.
Mitchell, R.L., and W.J. Russel. 1971. Root development and
rooting patterns of soybean (Glycine max (L.) Merrill) evalu-
ated under fi eld conditions. Agron. J. 63:313–316.
Murphy, S.L., and A.J.M. Smucker. 1995. Evaluation of video
image-analysis and line-intercept methods for measuring root
systems of alfalfa and ryegrass. Agron. J. 87:865–868.
Myers, D.B. 2005. Soybean root distribution in claypan soils. M.S.
thesis. Univ. of Missouri, Columbia.
Ritchie, J.T., J.R. Kiniry, C.A. Jones, and P.T. Dyke. 1986. Model
inputs. p. 37–49. In C.A. Jones and J.R. Kiniry (ed.) CERES-
maize: A simulation model of maize growth and develop-
ment. Texas A&M Univ. Press, College Station.
Rubio, G., H. Liao, X.L. Yan, and J.P. Lynch. 2003. Topsoil for-
aging and its role in plant competitiveness for phosphorus in
common bean. Crop Sci. 43:598–607.
Scrivner, C.L., B.L. Conkling, and P.G. Koenig. 1985. Soil pro-
ductivity indices and soil properties for farm-fi eld sites in
Missouri. Extension pub. University of Missouri–Columbia,
College of Agriculture, Agric. Exp. Stn., Columbia.
Sivakumar, M.J.K., H.M. Taylor, and R.H. Shaw. 1977. Tap and
root relations of fi eld grown soybeans. Agron. J. 69:470–473.
Smucker, A.J.M. 1982. Quantitative separation of roots from com-
pacted soil profi les by the hydropneumatic elutriation system.
Agron. J. 74:500–503.
Smucker, A.J.M. 1985. Soybean crop responses to soil environ-
mental stresses. p. 1000–1006. In R. Shibles (ed.) Proc. World
Soybean Research Conf. III, Ames, IA. 12–17 Aug. 1984.
Westview Press, Boulder, CO.
SoftSoft.net. 2004. Wintopo. Release 2.52. SoftSoft.net, Bedford-
shire, UK.
Spautz, R.E. 1998. Topsoil thickness infl uence on phosphorus and
potassium availability and crop response. M.S. thesis. Univer-
sity of Missouri, Columbia.
Stanley, C.D., T.C. Kaspar, and H.M. Taylor. 1980. Soybean top
and root response to temporary water tables imposed at three
diff erent stages of growth. Agron. J. 72:341–346.
Sudduth, K.A., J.W. Hummel, and S.T. Drummond. 2004. Com-
parison of the Veris Profi ler 3000 to an ASAE-standard pen-
etrometer. Appl. Eng. Agric. 20:535–541.
Sudduth, K.A., N.R. Kitchen, G.A. Bollero, D.G. Bullock, and
W.J. Wiebold. 2003. Comparison of electromagnetic induc-
tion and direct sensing of soil electrical conductivity. Agron.
J. 95:472–482.
Taylor, H.M., and T.C. Kaspar. 1985. Soybean root growth in
response to soil environmental conditions. p. 995–999. In R.
Shibles (ed.) Proc. World Soybean Research Conf. III, Ames,
IA. 12–17 Aug. 1984. Westview Press, Boulder, CO.
Thompson, A.L., C.J. Gantzer, and S.H. Anderson. 1991. Topsoil
depth, fertility, water management, and weather infl uences
on yield. Soil Sci. Soc. Am. J. 55:1085–1091.
Unger, P.W., and T.C. Kaspar. 1994. Soil compaction and root
growth: a review. Agron. J. 86:759–766.
Upchurch, D.R., and J.T. Ritchie. 1983. Root observations
using a video recording system in mini-rhizotrons. Agron. J.
75:1009–1015.
USDA-NASS. 2004. Missouri farm facts. Missouri Agricultural
Statistics Service, Columbia.
USDA-NRCS. 2006. Land resource regions and major land
resource areas of the United States, the Caribbean, and the
Pacifi c Basin. Agric. Handb. 296, USDA-Natural Resource
Conservation Service Available at soils.usda.gov/survey/
geography/mlra/index.html (verifi ed 10 May 2007). U.S.
Gov. Print. Offi ce, Washington, DC.
Voorhees, W.B. 1992. Wheel-induced soil physical limitations
to root growth. p. 73–75. In J.L. Hatfi eld and B.A. Stewart
(ed.) Limitations to plant root growth. Adv. Soil Sci. Vol. 19.
Springer, New York.
Waisel, Y., A. Eshel, and U. Kafkafi . 2002. Plant roots: The hid-
den half. 3rd ed. Marcel Dekker, New York.
Wang, F., C.W. Fraisse, N.R. Kitchen, and K.A. Sudduth. 2003.
Site-specifi c evaluation of the CROPGRO-soybean model
on Missouri claypan soils. Agric. Syst. 76:985–1005.
Wu, J., R. Zhang, and S. Gui. 1999. Modeling soil water move-
ment with water uptake by roots. Plant Soil 215:7–17.
Yan, X.L., J.P. Lynch, and S.E. Beebe. 1996. Utilization of phos-
phorus substrates by contrasting common bean genotypes.
Crop Sci. 36:936–941.
Yang, J., R.W. Blanchar, R.D. Hammer, and A.L. Thompson.
1996. Soybean growth and rhizosphere pH as infl uenced by A
horizon thickness. Soil Sci. Soc. Am. J. 60:1901–1907.
Yang, J., R.D. Hammer, and R.W. Blanchar. 2003a. Minirhizotron
quantifi cation of soybean root growth as aff ected by reduced
A horizon in soil. J. Plant Nutr. Soil Sci. 166:708–711.
Yang, J., R.D. Hammer, A.L. Thompson, and R.W. Blanchar.
2003b. Predicting soybean yield in a dry and wet year using a
soil productivity index. Plant Soil 250:175–182.
Young, F.J., and R.D. Hammer. 2000. Soil–landform relation-
ships on a loess-mantled upland landscape in Missouri. Soil
Sci. Soc. Am. J. 64:1443–1454.