causes and correlates of apparent failures to delay - University ...
98
CAUSES AND CORRELATES OF APPARENT FAILURES TO DELAY GRATIFICATION IN CHILDREN AND ADULTS by LAURA ELIZABETH MICHAELSON B.A., Vassar College, 2009 M.A., University of Colorado Boulder, 2013 A thesis submitted to the Faculty of the Graduate School of the University of Colorado in partial fulfillment of the requirement for the degree of Doctor of Philosophy Department of Psychology and Neuroscience 2017
-
Upload
khangminh22 -
Category
Documents
-
view
0 -
download
0
Transcript of causes and correlates of apparent failures to delay - University ...
CAUSES AND CORRELATES OF APPARENT FAILURES TO DELAY
GRATIFICATION IN CHILDREN AND ADULTS
by
LAURA ELIZABETH MICHAELSON
B.A., Vassar College, 2009
M.A., University of Colorado Boulder, 2013
A thesis submitted to the
Faculty of the Graduate School of the
University of Colorado in partial fulfillment
of the requirement for the degree of
Doctor of Philosophy
Department of Psychology and Neuroscience
2017

This thesis entitled:
Causes and Correlates of Apparent Failures to Delay Gratification in Children and Adults
written by Laura Elizabeth Michaelson
has been approved for the Department of Psychology and Neuroscience
Yuko Munakata, Committee Chair
Allison Atteberry, Committee Member
McKell Carter, Committee Member
Phil Fernbach, Committee Member
Naomi Friedman, Committee Member
Date
The final copy of this thesis has been examined by the signatories, and we
find that both the content and the form meet acceptable presentation standards
of scholarly work in the above mentioned discipline.
iii
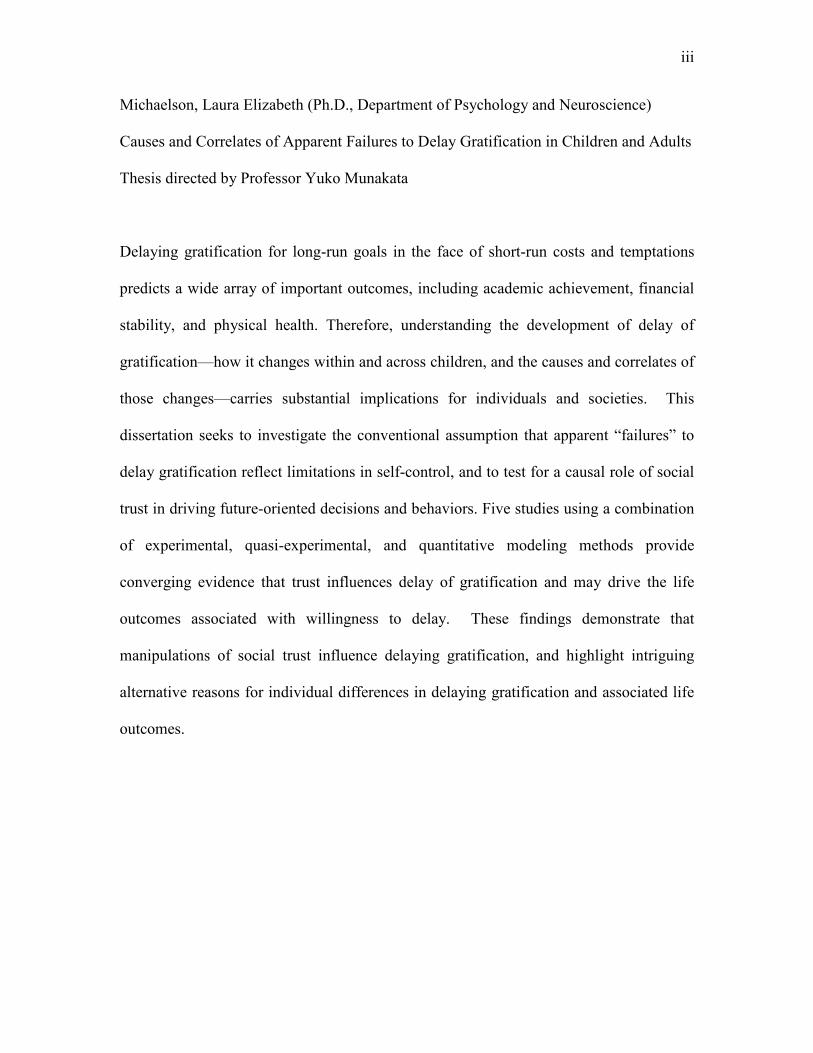
Michaelson, Laura Elizabeth (Ph.D., Department of Psychology and Neuroscience)
Causes and Correlates of Apparent Failures to Delay Gratification in Children and Adults
Thesis directed by Professor Yuko Munakata
Delaying gratification for long-run goals in the face of short-run costs and temptations
predicts a wide array of important outcomes, including academic achievement, financial
stability, and physical health. Therefore, understanding the development of delay of
gratification—how it changes within and across children, and the causes and correlates of
those changes—carries substantial implications for individuals and societies. This
dissertation seeks to investigate the conventional assumption that apparent “failures” to
delay gratification reflect limitations in self-control, and to test for a causal role of social
trust in driving future-oriented decisions and behaviors. Five studies using a combination
of experimental, quasi-experimental, and quantitative modeling methods provide
converging evidence that trust influences delay of gratification and may drive the life
outcomes associated with willingness to delay. These findings demonstrate that
manipulations of social trust influence delaying gratification, and highlight intriguing
alternative reasons for individual differences in delaying gratification and associated life
outcomes.
iv
CONTENTS
CHAPTER 1: INTRODUCTION AND LITERATURE REVIEW ................................... 1
Dissertation Goals and Organization .............................................................................. 1
Literature Review............................................................................................................ 2
CHAPTER 2: CAUSAL EFFECTS OF TRUST ACROSS TWO RANDOMIZED
EXPERIMENTS WITH ADULTS ..................................................................................... 7
Introduction ..................................................................................................................... 7
Experiment 1 ................................................................................................................... 7
Methods....................................................................................................................... 7
Results and Discussion ............................................................................................... 9
Experiment 2 ................................................................................................................. 12
Methods..................................................................................................................... 12
Results and Discussion ............................................................................................. 14
General Discussion ....................................................................................................... 16
CHAPTER 3: CAUSAL EFFECTS OF TRUST IN A RANDOMIZED EXPERIMENT
WITH PRESCHOOLERS ................................................................................................ 18
Introduction ................................................................................................................... 18
Methods......................................................................................................................... 19
Results ........................................................................................................................... 22
Discussion ..................................................................................................................... 25
CHAPTER 4: GROUP DIFFERENCES IN TRUST AND DELAY OF
GRATIFICATION AMONG INCARCERATED CRIMINAL OFFENDERS ............... 27
Methods......................................................................................................................... 28

v
Results ........................................................................................................................... 30
Discussion ..................................................................................................................... 32
CHAPTER 5: IMPACTS OF TRUST ON LIFE OUTCOMES IN A DISCORDANT
TWIN COMPARISON DESIGN ..................................................................................... 33
Introduction ................................................................................................................... 33
MIDUS Dataset ............................................................................................................. 33
Methods......................................................................................................................... 34
Results ........................................................................................................................... 35
Discussion ..................................................................................................................... 40
CHAPTER 6: REPLICABILITY OF AND REASONS BEHIND THE PREDICTIVE
VALIDITY OF DELAYING GRATIFICATION ............................................................ 42
Introduction ................................................................................................................... 42
SECCYD Dataset .......................................................................................................... 43
Research Question 1 ..................................................................................................... 48
Methods..................................................................................................................... 48
Results ....................................................................................................................... 50
Discussion ................................................................................................................. 51
Research Question 2 ..................................................................................................... 51
Methods..................................................................................................................... 52
Results ....................................................................................................................... 53
Discussion ................................................................................................................. 62
CHAPTER 7: GENERAL DISCUSSION AND CONCLUSIONS ................................. 63
References ......................................................................................................................... 67

vi
Appendix A: Questionnaire items used in Chapter 5........................................................ 85
Appendix B: Measures and corresponding SECCYD codes included in Chapter 6
composite variables ............................................................ Error! Bookmark not defined.
Appendix C: Measures, subscales, and indices included in Chapter 6 composite variables
........................................................................................................................................... 89
vii
TABLES
Table 1. Sociodemographic Characteristics of the MIDUS Sample ..................................37
Table 2. Relationships Between Trust and Life Outcomes Across Three Different
Estimation Methods ...........................................................................................................39
Table 3. Interactions Between Trust and Zygosity ............................................................40
Table 4. Search Terms Used to Identify Relevant Measures from the SECCYD
Documentation ...................................................................................................................47
Table 5. Descriptive Statistics for RQ1 Measured Variables ...........................................49
Table 6. Correlations With Age 4 Delay of Gratification ..................................................50
Table 7. Predicting Adolescent Outcomes from Preschool Delay of Gratification ...........51
Table 8. Random Intercept Model Results ........................................................................53
Table 9. Unconditional Random Linear Time Model Results ...........................................55
Table 10. Cross-Level Interaction Models.........................................................................58
Table 11. Intercepts-As-Outcomes Models .......................................................................60
Table 12. Summary of Model Comparisons ......................................................................61
viii
FIGURES
Figure 1 ..............................................................................................................................11
Figure 2 ..............................................................................................................................12
Figure 3 ..............................................................................................................................15
Figure 4 ..............................................................................................................................23
Figure 5 ..............................................................................................................................31
Figure 6 ..............................................................................................................................54
Figure 7 ..............................................................................................................................56
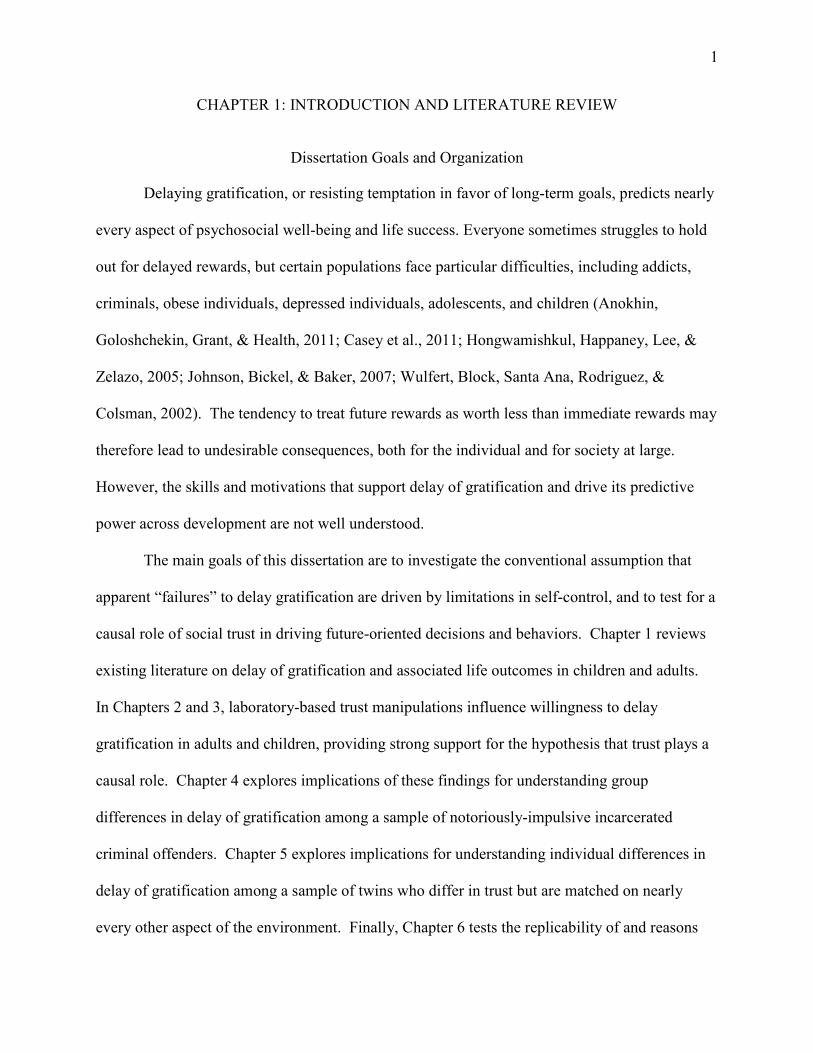
1
CHAPTER 1: INTRODUCTION AND LITERATURE REVIEW
Dissertation Goals and Organization
Delaying gratification, or resisting temptation in favor of long-term goals, predicts nearly
every aspect of psychosocial well-being and life success. Everyone sometimes struggles to hold
out for delayed rewards, but certain populations face particular difficulties, including addicts,
criminals, obese individuals, depressed individuals, adolescents, and children (Anokhin,
Goloshchekin, Grant, & Health, 2011; Casey et al., 2011; Hongwamishkul, Happaney, Lee, &
Zelazo, 2005; Johnson, Bickel, & Baker, 2007; Wulfert, Block, Santa Ana, Rodriguez, &
Colsman, 2002). The tendency to treat future rewards as worth less than immediate rewards may
therefore lead to undesirable consequences, both for the individual and for society at large.
However, the skills and motivations that support delay of gratification and drive its predictive
power across development are not well understood.
The main goals of this dissertation are to investigate the conventional assumption that
apparent “failures” to delay gratification are driven by limitations in self-control, and to test for a
causal role of social trust in driving future-oriented decisions and behaviors. Chapter 1 reviews
existing literature on delay of gratification and associated life outcomes in children and adults.
In Chapters 2 and 3, laboratory-based trust manipulations influence willingness to delay
gratification in adults and children, providing strong support for the hypothesis that trust plays a
causal role. Chapter 4 explores implications of these findings for understanding group
differences in delay of gratification among a sample of notoriously-impulsive incarcerated
criminal offenders. Chapter 5 explores implications for understanding individual differences in
delay of gratification among a sample of twins who differ in trust but are matched on nearly
every other aspect of the environment. Finally, Chapter 6 tests the replicability of and reasons
2
behind the link between early delay of gratification and later life outcomes. Overall conclusions
and a general discussion are presented in Chapter 7.
Literature Review
Introduction
What factors are most important for promoting positive development in children?
Delaying gratification is a strong contender. Holding out for a preferred reward (e.g., two
marshmallows later) in the face of a less-preferred option (e.g., one marshmallow now) during
childhood predicts a wide array of important later life outcomes (Mischel & Ebbeson, 1970;
Mischel, Shoda, & Peake, 1988), including academic achievement, career advancement,
financial stability, and physical health (Ayduk et al., 2000; Mischel, Shoda, & Peake, 1989;
Schlam et al., 2013; Shoda , Mischel, & Peake, 1990; Moffitt et al., 2011). As evidence
continues to accumulate for the predictive power of this simple behavioral task, delay of
gratification is increasingly recognized as an early diagnostic marker of later life outcomes, with
substantial potential implications for efforts to reduce social problems such as obesity, poverty,
addiction, and violence.
Unfortunately, that “one simple thing” that supports delaying gratification is
comparatively lacking in consensus. Many explanations focus on self-control (often used
interchangeably with related concepts of ‘cognitive control’, ‘willpower’, ‘impulsivity’, and
‘inhibition’; e.g. Casey, Somerville, Gotlib, Ayduk, Franklin, et al., 2011; Duckworth,
Tsukayama & Kirby, 2013; Eigsti, Zayas, Mischel, Shoda, Ayduk et al., 2006; Mischel &
Ayduk, 2004). Self-control refers to a family of functions that support the ability to override
impulsive actions in the service of goal-relevant behavior (Allport, 1987; Banich, 2009; Braver
& Cohen, 2001; Miller & Cohen, 2001). Delaying gratification has been associated with
3
performance on behavioral tasks tapping processes related to self-control, such as selective
attention, response inhibition, and affective regulation (Eigsti et al., 2006; Hofmann, Friese &
Roefs, 2009; Nederkoorn, Braet, van Eijs, Tanghe & Jansen, 2006; Rodriguez, Mischel, &
Shoda, 1989). In addition, neural processes associated with self-control in the ventral medial and
ventral striatal cortex are activated when making decisions to delay reward (Figner, Knoch,
Johnson, Krosch, Lisanby et al., 2010; McClure, Laibson, Loewenstein & Cohen, 2004), and the
neuromaturation of this frontostriatal circuitry tracks developmental improvements in the ability
to delay gratification (Achterberg, Peper, van Duijvenvoorde, Mandl, & Crone, 2016).
From this perspective, the predictive validity of group and individual differences in
delaying gratification derive from its assessment of lifelong individual differences in self-control
(Duckworth, Tsukayama, & Kirby, 2013; Mischel et al., 2011). However, self-control and delay
of gratification do not always coincide: delay of gratification shows no change over a
developmental period where children improve substantially on measures of self-control (Beck,
Schaefer, Pang & Carlson, 2011; Carlson, 2005), and training programs that improve self-control
in 4–12-year-old children show no effects on delay of gratification (Diamond & Lee, 2011).
What drives delay of gratification when it diverges from self-control?
One possibility is trust. All future outcomes are uncertain; even with perfect self-control,
delaying gratification for a future reward only makes sense if the future outcome is likely to
actually materialize (Kidd, Palmeri & Aslin, 2013; Mahrer, 1956; Michaelson, de la Vega,
Chatham & Munakata, 2013; Michaelson & Munakata, 2016; Mischel & Ayduk, 2004).
Decisions to delay gratification are often rife with social expectations (e.g., that parents will
deliver that promised bowl of ice cream if other sweets are avoided until after dinner; that
portfolio managers will responsibly manage and grow clients’ savings if provided with a portion

4
of their monthly income), and social competencies during childhood are as important as
cognitive abilities for predicting later life success (Bronfenbrenner & Morris, 1998; Raver &
Zigler, 1997). Thus, apparent “failures” to delay gratification may be driven by a lack of social
trust, as opposed to limitations in self-control.
Trust in others is dynamically updated through experience (King-Casas, Tomlin, Anen,
Comerer, Quartz, & Montague, 2005), and can be can be modulated by information about others’
prior behavior (Delgado, Frank, & Phelps, 2005) and perceptions of their ability to regulate their
own behavior (Righetti & Finkenauer, 2011), as well as by motivational and affective states
(Dunn & Schweitzer, 2005; van den Bos, van Dijk, & Crone, 2011). Although early accounts of
delaying gratification emphasized the importance of trust in the person promising a reward
(Mischel, 1961b; Mischel et al., 1972), and studies have established the role of the
trustworthiness of adults in what children will learn from them (e.g. Koenig, Clement & Harris,
2004), few studies of delaying gratification have controlled for trust or tested the importance of
trust experimentally. Relevant studies have been limited by being correlational, examining trust
in only adults, or focusing on the role of reward expectations, leaving ambiguous the possible
role of trust.
Some early correlational accounts of delay of gratification emphasized the importance of
trust in the person promising a reward (Mischel, 1961b; Mischel et al., 1972). For example,
children with absent fathers (who tend to be less trusting than children in two-parent families;
Wentzel, 1991) preferred smaller immediate rewards over larger delayed options (Mischel,
1961b). In addition, adolescents who reported uncertainty about receiving promised delayed
rewards from their parents, as well as adults who were less trusting in a behavioral economics
game, more rapidly devalued delayed rewards when making hypothetical choices between them

5
and smaller immediately available rewards (Harris & Madden, 2002; Schneider, Peters, Peth &
Büchel, 2014). However, such correlations could be driven by other factors. Low social trust
could be associated with low self-control, which could drive the relationships between social
trust and willingness to delay. Alternatively, such correlations could be driven by a causal
relationship in the reverse direction, such that social trust requires the ability to delay
gratification (Harris & Madden, 2002).
Some experimental work suggests a causal role of social trust in delaying gratification,
but could alternatively be interpreted in terms of more general reward effects. For example,
when rewards are promised by an experimenter but never provided, or are delivered
inconsistently, preferences for immediate gratification increase in humans and other animals
(Kidd et al., 2013; Mahrer, 1956; Stevens, Rosati, Heilbronner, & Muhloff, 2011). This effect
could arise from reduced trust that a delayed reward will be provided, but might alternatively
arise from the changes to subjective wellbeing, motivation, and willpower that accompany
reward provision/omission (Gomez & McLaren, 1997) and are known to influence self-control
(Vansteenkiste & Deci, 2003; Ifcher & Zarghamee, 2011; Lerner, Li, & Weber, 2012; Pyone &
Isen, 2011). That is, participants may have been less able to delay gratification because rewards
that were inconsistent or withheld led to reduced self-control, rather than to reduced social trust.
The studies reported in Chapters 2 and 3 thus constitute an initial test of whether social
trust, manipulated in the absence of rewards, influences choices about whether to delay
gratification. In Chapter 1, hypothetical trust manipulations influenced adults’ decisions about
whether to delay gratification for hypothetical monetary rewards in a temporal discounting task.
In Chapter 2, manipulating children’s real impressions of the trustworthiness of the experimenter
in a laboratory-based delay of gratification task influenced their time spent waiting for a delayed

6
reward promised by that experimenter. These studies provide the first targeted evidence that
trust causally impacts willingness to wait for delayed rewards.

7
CHAPTER 2: CAUSAL EFFECTS OF TRUST ACROSS TWO RANDOMIZED
EXPERIMENTS WITH ADULTS
Introduction
Two experimental studies were conducted to test whether the trustworthiness of the
person providing a choice between immediate and delayed rewards influences adult preferences
in a modified intertemporal choice task. Trust was manipulated using short vignettes about
fictional characters that conveyed information about their trustworthiness (Experiment 1) and
accompanying faces that varied in perceived trustworthiness (Experiment 2). Participants were
then asked to complete a series of intertemporal choices in which they selected between a series
of smaller, immediate rewards and a larger, delayed rewards from the characters they read about.
Adults were tested to build on prior manipulations of trust in the absence of rewards (Delgado,
Frank, & Phelps, 2005; Fareri, Chang, & Delgado, 2012; Oosterhof & Todorov, 2008), and to
obtain more precise estimates of willingness to delay. This research was completed along with
co-authors Alejandro de la Vega, Ph.D., Christopher H. Chatham, Ph.D., and Professor Yuko
Munakata, and the resulting manuscript published in Frontiers in Psychology in 2013.
Experiment 1
Methods
Participants. Seventy-eight participants (34 male, 39 female, five who preferred not to
indicate gender) between 18 and 64 years of age (Mage = 31.1 years, SD = 11.1 years) were paid
$1.00 for completing the experiment, which lasted 10-15 min. Participants were recruited via
Amazon’s Mechanical Turk, a website that allows users to complete small tasks for pay, and had
an average approval rating of at least 99% from previous jobs. Participants lived in the United
8
States, and were normally distributed in terms of socioeconomic status, with the average
participant having completed some college and receiving a financial income between $37,500 -
$49,999 per year. All participants were included in the analyses; results were identical when
excluding participants based on null discounting (i.e., all later responses in at least one condition,
n = 2; as in Kirby and Marakovic, 1996).
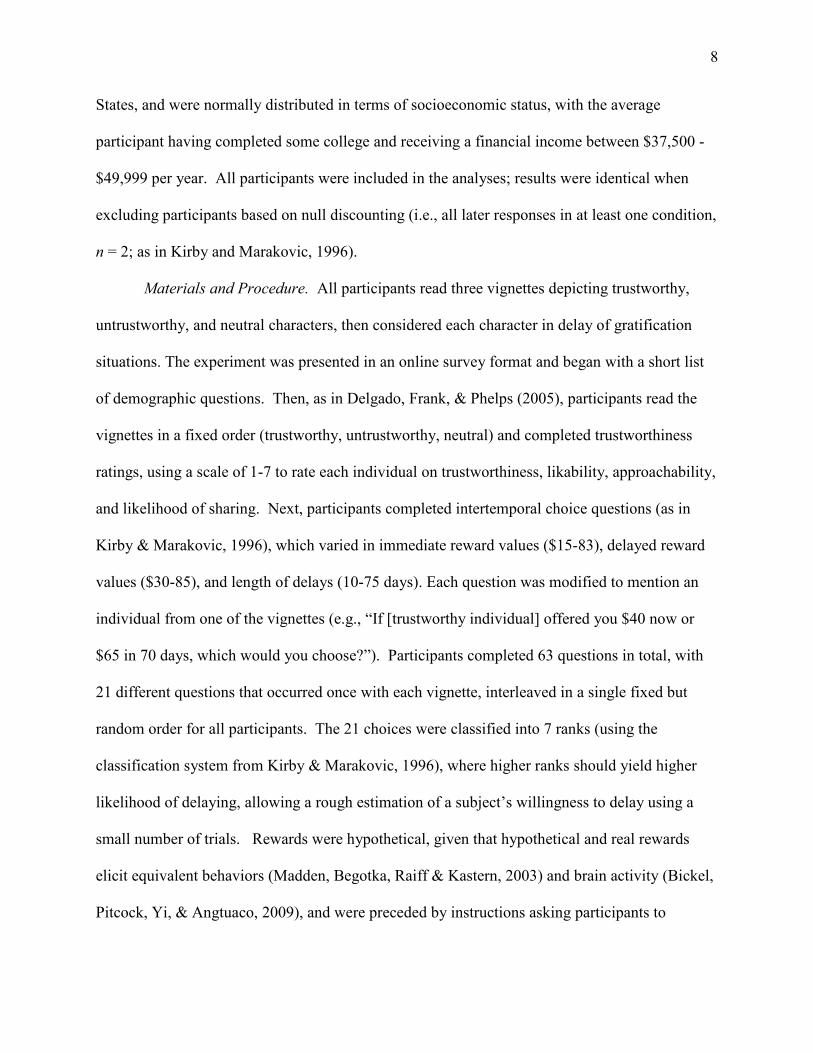
Materials and Procedure. All participants read three vignettes depicting trustworthy,
untrustworthy, and neutral characters, then considered each character in delay of gratification
situations. The experiment was presented in an online survey format and began with a short list
of demographic questions. Then, as in Delgado, Frank, & Phelps (2005), participants read the
vignettes in a fixed order (trustworthy, untrustworthy, neutral) and completed trustworthiness
ratings, using a scale of 1-7 to rate each individual on trustworthiness, likability, approachability,
and likelihood of sharing. Next, participants completed intertemporal choice questions (as in
Kirby & Marakovic, 1996), which varied in immediate reward values ($15-83), delayed reward
values ($30-85), and length of delays (10-75 days). Each question was modified to mention an
individual from one of the vignettes (e.g., “If [trustworthy individual] offered you $40 now or
$65 in 70 days, which would you choose?”). Participants completed 63 questions in total, with
21 different questions that occurred once with each vignette, interleaved in a single fixed but
random order for all participants. The 21 choices were classified into 7 ranks (using the
classification system from Kirby & Marakovic, 1996), where higher ranks should yield higher
likelihood of delaying, allowing a rough estimation of a subject’s willingness to delay using a
small number of trials. Rewards were hypothetical, given that hypothetical and real rewards
elicit equivalent behaviors (Madden, Begotka, Raiff & Kastern, 2003) and brain activity (Bickel,
Pitcock, Yi, & Angtuaco, 2009), and were preceded by instructions asking participants to
9
consider each choice as if they would actually receive the option selected. Participants took as
much time as they needed to complete the procedures.
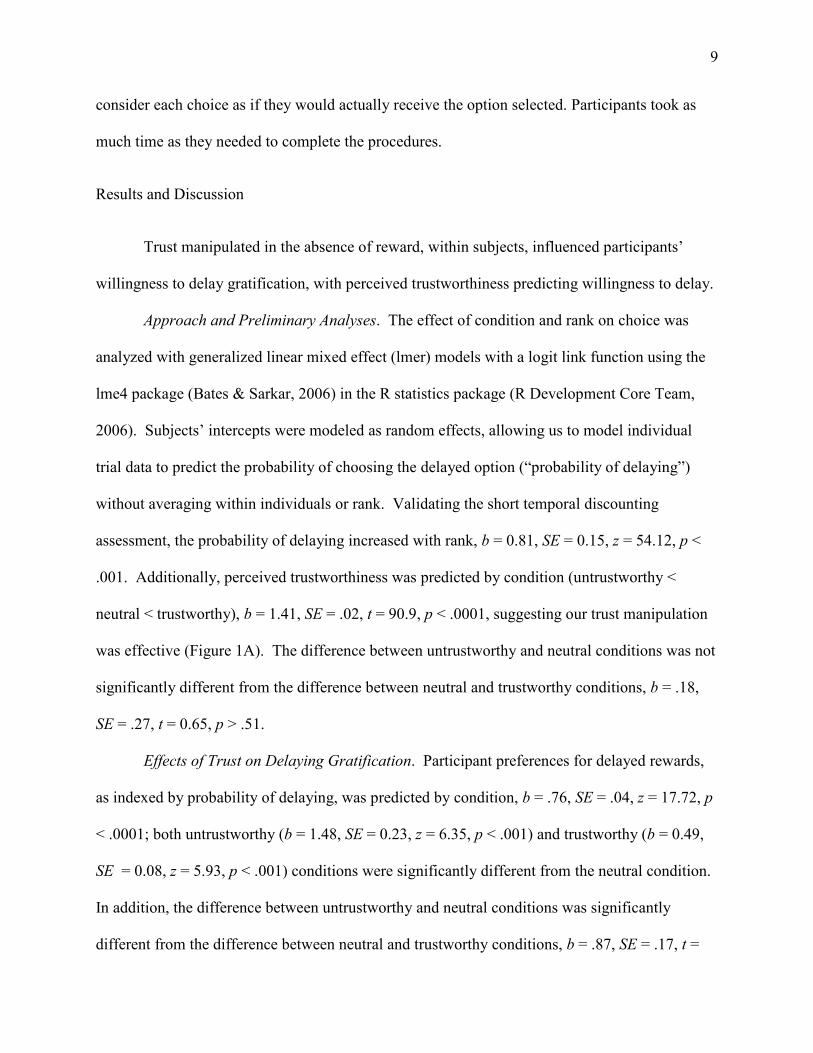
Results and Discussion
Trust manipulated in the absence of reward, within subjects, influenced participants’
willingness to delay gratification, with perceived trustworthiness predicting willingness to delay.
Approach and Preliminary Analyses. The effect of condition and rank on choice was
analyzed with generalized linear mixed effect (lmer) models with a logit link function using the
lme4 package (Bates & Sarkar, 2006) in the R statistics package (R Development Core Team,
2006). Subjects’ intercepts were modeled as random effects, allowing us to model individual
trial data to predict the probability of choosing the delayed option (“probability of delaying”)
without averaging within individuals or rank. Validating the short temporal discounting
assessment, the probability of delaying increased with rank, b = 0.81, SE = 0.15, z = 54.12, p <
.001. Additionally, perceived trustworthiness was predicted by condition (untrustworthy <
neutral < trustworthy), b = 1.41, SE = .02, t = 90.9, p < .0001, suggesting our trust manipulation
was effective (Figure 1A). The difference between untrustworthy and neutral conditions was not
significantly different from the difference between neutral and trustworthy conditions, b = .18,
SE = .27, t = 0.65, p > .51.
Effects of Trust on Delaying Gratification. Participant preferences for delayed rewards,
as indexed by probability of delaying, was predicted by condition, b = .76, SE = .04, z = 17.72, p
< .0001; both untrustworthy (b = 1.48, SE = 0.23, z = 6.35, p < .001) and trustworthy (b = 0.49,
SE = 0.08, z = 5.93, p < .001) conditions were significantly different from the neutral condition.
In addition, the difference between untrustworthy and neutral conditions was significantly
different from the difference between neutral and trustworthy conditions, b = .87, SE = .17, t =

10
5.18, p < .001, (Figure 1B); thus, our trust manipulation had a larger effect on delaying
gratification at lower levels of trust, consistent with prior work showing nonlinear effects of trust
manipulations on other behaviors (Fareri, Chang, & Delgado, 2012). There was also an
interaction between condition and rank, b = .11, SE = .02, z = 6.1, p < .001, such that the increase
in delay choices with rank was smaller in the untrustworthy condition relative to the trustworthy
and neutral conditions. This suggests that as the delayed option became more appealing, those in
the untrustworthy condition were more likely to continue to choose the immediate option.
Importantly, perceived trustworthiness predicted probability of delaying, b = .49, SE = 0.03, z =
18.53 p < 0.0001, such that less perceived trustworthiness predicted lower willingness to delay
gratification (Figure 1C). In addition, there was an interaction between condition and
trustworthiness (b = .21, SE = .03, z = 6.30, p < .001), such that trustworthiness predicted
probability of delaying within only the untrustworthy condition, consistent with a non-linear
effect of trust on delay of gratification.
11
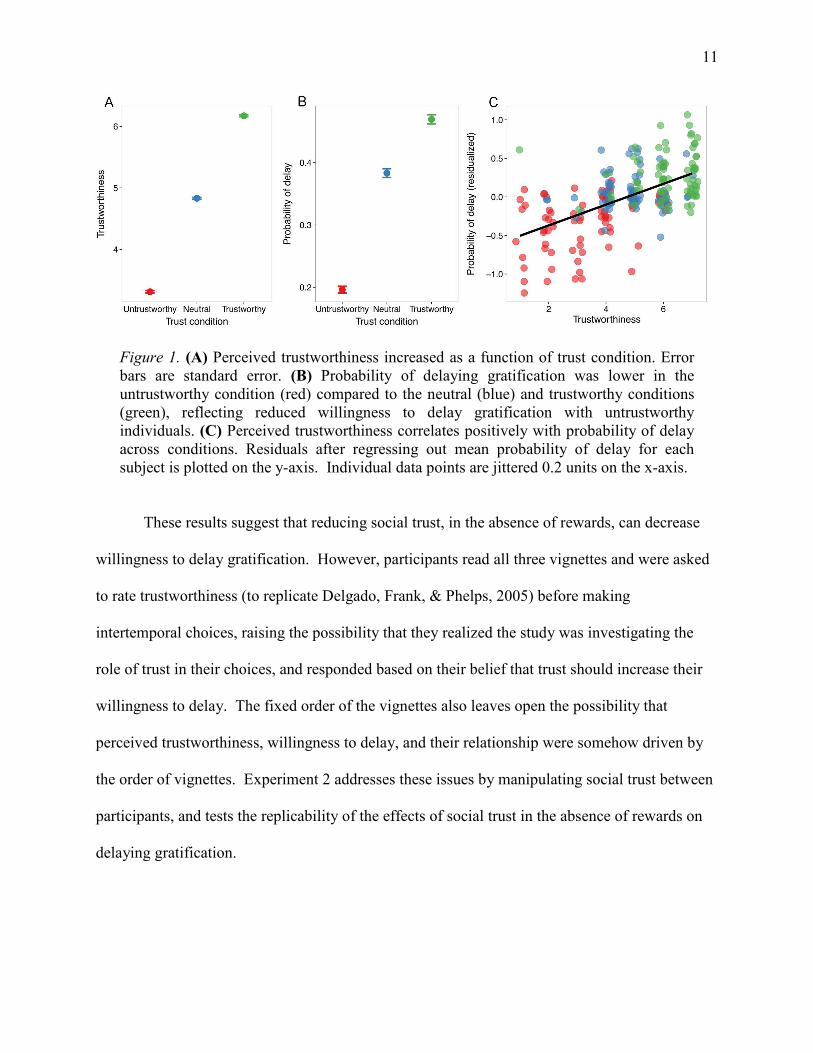
Figure 1. (A) Perceived trustworthiness increased as a function of trust condition. Error bars are standard error. (B) Probability of delaying gratification was lower in the untrustworthy condition (red) compared to the neutral (blue) and trustworthy conditions (green), reflecting reduced willingness to delay gratification with untrustworthy individuals. (C) Perceived trustworthiness correlates positively with probability of delay across conditions. Residuals after regressing out mean probability of delay for each subject is plotted on the y-axis. Individual data points are jittered 0.2 units on the x-axis.
These results suggest that reducing social trust, in the absence of rewards, can decrease
willingness to delay gratification. However, participants read all three vignettes and were asked
to rate trustworthiness (to replicate Delgado, Frank, & Phelps, 2005) before making
intertemporal choices, raising the possibility that they realized the study was investigating the
role of trust in their choices, and responded based on their belief that trust should increase their
willingness to delay. The fixed order of the vignettes also leaves open the possibility that
perceived trustworthiness, willingness to delay, and their relationship were somehow driven by
the order of vignettes. Experiment 2 addresses these issues by manipulating social trust between
participants, and tests the replicability of the effects of social trust in the absence of rewards on
delaying gratification.
12
Experiment 2
Methods
All details were identical to Experiment 1 except where noted. Participants were
randomly assigned to trustworthy, untrustworthy, or neutral conditions, rather than reading all
three vignettes, and personality ratings were moved to the end of the survey, to minimize
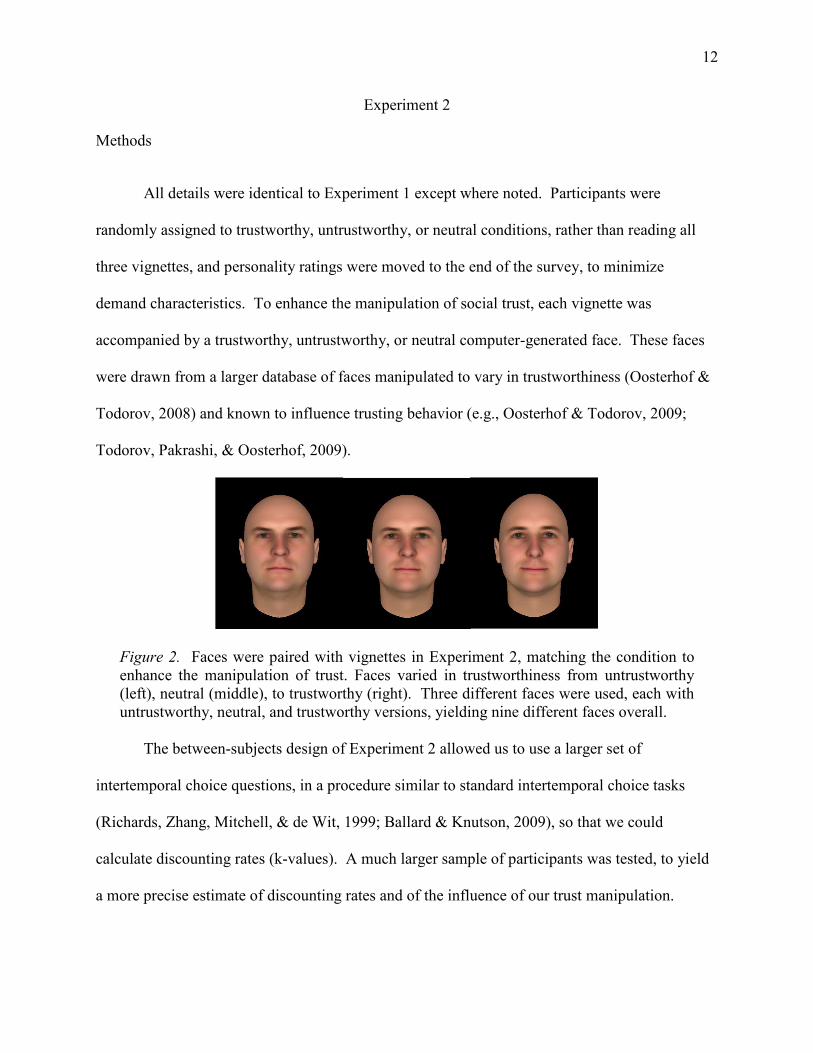
demand characteristics. To enhance the manipulation of social trust, each vignette was
accompanied by a trustworthy, untrustworthy, or neutral computer-generated face. These faces
were drawn from a larger database of faces manipulated to vary in trustworthiness (Oosterhof &
Todorov, 2008) and known to influence trusting behavior (e.g., Oosterhof & Todorov, 2009;
Todorov, Pakrashi, & Oosterhof, 2009).
Figure 2. Faces were paired with vignettes in Experiment 2, matching the condition to enhance the manipulation of trust. Faces varied in trustworthiness from untrustworthy (left), neutral (middle), to trustworthy (right). Three different faces were used, each with untrustworthy, neutral, and trustworthy versions, yielding nine different faces overall.
The between-subjects design of Experiment 2 allowed us to use a larger set of
intertemporal choice questions, in a procedure similar to standard intertemporal choice tasks
(Richards, Zhang, Mitchell, & de Wit, 1999; Ballard & Knutson, 2009), so that we could
calculate discounting rates (k-values). A much larger sample of participants was tested, to yield
a more precise estimate of discounting rates and of the influence of our trust manipulation.
13
Participants. One hundred and seventy two participants (65 male, 60 female, 13 who
preferred not to indicate gender) between 18 and 61 years of age (Mage = 28 years, SD = 8.9
years) participated in this study. Participants were paid $0.25 for completing this study, which
took approximately 10 mins. This lower pay rate was chosen given the larger sample size, and
because compensation rates on Mechanical Turk only influence enrollment rate, not quality of
the data (Buhrmester, Kwang, & Gosling, 2011). All participants lived in the United States, and
were normally distributed in terms of socioeconomic status, with the average participant having
completed some college and receiving a financial income between $37,500 - $49,999 per year.
To maintain the between subjects design, we only included data collected on the first
visit from any IP address; this resulted in the exclusion of 34 participants who completed surveys
from more than one condition from the same IP address. All remaining participants were
included in the analyses; results were identical when excluding subjects based on null or
inconsistent temporal discounting behavior (as defined as in Johnson & Bickel, 2008, N = 22), or
for completing the survey too quickly (< 3 mins, n = 3) as has been done in some studies
(Bucholz & Latorre, 2011; Lee, 2010), but did not occur in Experiment 1. Final analyses
included 46 participants in the trustworthy condition, 49 in the untrustworthy condition, and 43
in the neutral condition.
Materials and Procedure. Participants read one vignette, accompanied by a face. Three
faces were selected from a database of 100 white male faces developed by Oosterhof and
Todorov (2008) and implemented in the FaceGen Modeller program (Singular Inversions,
Toronto, Ontario, Canada). Three faces were used to minimize effects of stimulus-specific
variances related to the faces. Three variations – trustworthy, untrustworthy, and neutral – of
each of the three faces were used, resulting in nine faces total (Figure 2). These variations

14
differed in terms of characteristics that had been determined to be optimal in representing
trustworthiness, based on principle component analysis of 300 emotionally neutral computerized
faces that had been rated on a variety of social dimensions (Oosterhof & Todorov, 2008). For
example, increasing the distance between the eyes and the eyebrows was associated with ratings
of increased trustworthiness. Face images were 400 x 477 pixels in size.
Participants then completed the intertemporal choice task, which consisted of 49 binary
choice questions between a smaller immediate reward ($5) and a larger delayed reward that
varied in delay (4-150 days) and value ($11-34). The face from the vignette appeared three
times across the intertemporal choice questions, to reinforce the character that the questions
pertained to. Lastly, participants completed the personality ratings. Three participants had some
missing rating scores and were excluded from rating analyses.
Results and Discussion
Trust manipulated in the absence of reward, between subjects, influenced participants’
willingness to delay gratification, with perceived trustworthiness again predicting willingness to
delay.
Approach and Preliminary Analyses. A k-parameter was estimated for each participant
(as in Ballard & Knutson, 2009), with lower k-values indicating increased preference for delayed
rewards. Indifference points were calculated at each delay using logistic regression to determine
the later value at which there was an equal probability of each response. When estimates were
outside of the range of displayed later values (e.g. participants gave all later or now responses or
gave inconsistent responses), indifference points were assume to be just outside the range of
values presented (34.5 for all “now” and 10.5 for all “later” responses). Discounted value (DV)
was calculated at each delay (DV=$5/indifference point) and a hyperbolic discounting function

15
was fit to all DVs using nonlinear least squares: DV=1/(1+k*delay), where k is the unknown
discounting parameter. As in previous research, this hyperbolic model provided a good fit for
the data, as assessed using visual inspection and model comparison with an exponential function.
There were no significant main effects or interactions with the different versions of trustworthy,
untrustworthy, and neutral faces, so subsequent analyses collapse across faces within each trust
condition. All analyses were completed using linear model (lm) in the R statistical package. All
results were confirmed using bootstrapping, as k-values are not normally distributed.
Perceived trustworthiness was again predicted by condition (untrustworthy < neutral <
trustworthy), b = 0.85, SE = 0.16, t(130) = 5.34, p < .0001, Cohen’s d = 0.45, suggesting that our
trust manipulation was effective (Figure 3A). The difference between trustworthy and neutral
conditions was not significantly different from the difference between neutral and untrustworthy
conditions, as evidenced by overlapping 95% confidence intervals of parameter estimates for
trustworthy-neutral (0.32, 1.52) and neutral-untrustworthy (0.12, 1.38).
Figure 3. (A) Perceived trustworthiness increased as a function of trust condition. Error bars are standard error. (B) Discounting rates were higher in the untrustworthy condition (red) compared to the neutral (blue) and trustworthy conditions (green), reflecting reduced willingness to delay gratification with untrustworthy individuals. (C) Perceived trustworthiness correlates positively with discounting rates. Correlation (95 % confidence interval of r: 0.02 – 0.36) was verified using non-parametric bootstrapping due to positive skew in discounting values. Individual data points are jittered 0.2 units on the x-axis.
16
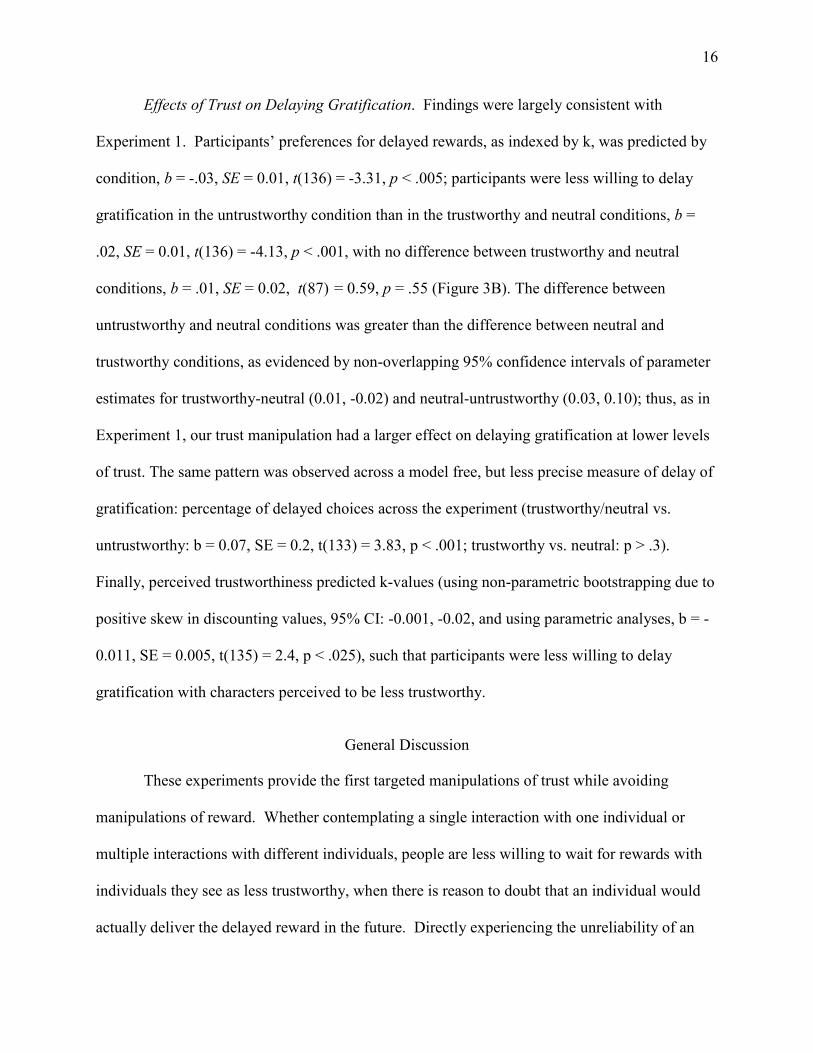
Effects of Trust on Delaying Gratification. Findings were largely consistent with
Experiment 1. Participants’ preferences for delayed rewards, as indexed by k, was predicted by
condition, b = -.03, SE = 0.01, t(136) = -3.31, p < .005; participants were less willing to delay
gratification in the untrustworthy condition than in the trustworthy and neutral conditions, b =
.02, SE = 0.01, t(136) = -4.13, p < .001, with no difference between trustworthy and neutral
conditions, b = .01, SE = 0.02, t(87) = 0.59, p = .55 (Figure 3B). The difference between
untrustworthy and neutral conditions was greater than the difference between neutral and
trustworthy conditions, as evidenced by non-overlapping 95% confidence intervals of parameter
estimates for trustworthy-neutral (0.01, -0.02) and neutral-untrustworthy (0.03, 0.10); thus, as in
Experiment 1, our trust manipulation had a larger effect on delaying gratification at lower levels
of trust. The same pattern was observed across a model free, but less precise measure of delay of
gratification: percentage of delayed choices across the experiment (trustworthy/neutral vs.
untrustworthy: b = 0.07, SE = 0.2, t(133) = 3.83, p < .001; trustworthy vs. neutral: p > .3).
Finally, perceived trustworthiness predicted k-values (using non-parametric bootstrapping due to
positive skew in discounting values, 95% CI: -0.001, -0.02, and using parametric analyses, b = -
0.011, SE = 0.005, t(135) = 2.4, p < .025), such that participants were less willing to delay
gratification with characters perceived to be less trustworthy.
General Discussion
These experiments provide the first targeted manipulations of trust while avoiding
manipulations of reward. Whether contemplating a single interaction with one individual or
multiple interactions with different individuals, people are less willing to wait for rewards with
individuals they see as less trustworthy, when there is reason to doubt that an individual would
actually deliver the delayed reward in the future. Directly experiencing the unreliability of an

17
individual was unnecessary; here, impressions of trustworthiness from vignettes and faces
produced powerful effects. This work complements prior correlational work, which suggested a
link between trust and delaying gratification but did not establish causality (Harris & Madden,
2002; Mischel, 1961b), and prior experimental work, which suggested that trust could influence
delaying gratification but did not manipulate trust independent of rewards that can influence self-
control (Kidd et al., 2013; Mahrer, 1956).

18
CHAPTER 3: CAUSAL EFFECTS OF TRUST IN A RANDOMIZED EXPERIMENT WITH
PRESCHOOLERS
Introduction
Across two experiments in Chapter 2, adults displayed steeper discounting of delayed
rewards for individuals they perceived to be untrustworthy relative to trustworthy and neutral
individuals. This constitutes strong causal evidence for the importance of trust in driving delay
of gratification, independent of other relevant factors, such as self-control or reward reliability.
However, trust might play less of a role when dominated by other factors, such limitations in
self-control. This chapter will evaluate this hypothesis by testing trust manipulations with
preschoolers, for whom ongoing developmental and neuromaturational processes lead to well-
established limitations in self-control and self-regulation (e.g., Eigsti, et al., 2006; Zelazo, Craik
& Booth, 2004).
Trust was manipulated via interactions that the child observed between the experimenter
and another adult, unrelated to rewards or delaying gratification. Children were then were tested
in the classic delay of gratification task by that experimenter. We predicted that children would
be less willing to forgo an immediate reward in favor of a delayed reward when the rewards were
promised by an untrustworthy individual compared to a trustworthy one (Michaelson et al.,
2013). Alternatively, effects of trust may only be observable when limitations in cognitive
control are not as influential, in which case trust could play less of a role in children’s delaying
gratification relative to adults. This study was conducted along with co-author Yuko Munakata,
Professor of Psychology of Neuroscience at the University of Colorado Boulder, and was
published in the journal Developmental Science in 2016.

19
Methods
Participants
Participants were 34 typically developing children (Mage = 4 years 5 months, range = 3
years 6 months to 5 years 10 months as in Kidd et al., 2013). This sample size was based on
having 80% power to detect d = 1.04, which was the effect size obtained from a planned interim
analysis of these data at n = 19 subjects.1 Data from nine additional participants were not
included in the analyses because they did not complete all of the tasks due to uncooperativeness
(n = 8), or because the parent informed the child that she would be watching the child’s behavior
via webcam during the Marshmallow Test (altering the conditions of the study and potentially
influencing child behavior, n = 1).
Children were randomly assigned to one of two experimental conditions (Trustworthy
and Untrustworthy) such that each group was age and gender balanced (nine females, eight
males). Informed consent was obtained for all children, and children received a small prize for
participating. Parents were paid $5 for travel expenses.
Materials and Procedure
Children observed the experimenter behave in either a trustworthy or untrustworthy
manner toward another adult during a series of art projects (adapted from Vaish, Carpenter &
We conducted this planned interim analysis given the exploratory nature of this study, and the fact that the only recent similar experiment to our knowledge produced an extremely large effect size of d = 1.82 from only 28 participants (Kidd et al., 2013). We used G*Power to determine that we required only seven participants in each condition to have 80% power to detect such a large effect, but we also recognized the reasonable possibility that the effects of interest for the present study might be considerably smaller. Thus, we conducted a planned interim analysis at n = 19 subjects to estimate the effect size to determine the number of subjects to include in our study. (We initially targeted n = 20 for this interim analysis as many researchers do, but ended up doing it at n = 19 for practical reasons related to confederate planning.) We then proceeded with data collection without additional analyses until reaching the sample size determined by our planned interim analysis. Importantly, the there is little impact on the Type I error rate under the approach that we adopted, of ‘data-peeking’ with a commitment to continue data collection regardless of what the peek reveals, rather than making a conditional decision to continue or to stop data collection based on what the peek revealed (Sagarin, Ambler & Lee, 2014).
20
Tomasello, 2010), then engaged in the classic marshmallow task (adapted from Mischel, 1958)
with that experimenter. We obtained children’s pre- and post-experiment mood ratings to assess
the possibility that the trust manipulation affected mood. Three adults were involved in the
procedures: an experimenter, a recipient (confederate who was the target of the trustworthy and
untrustworthy behavior), and a neutral adult (confederate who was involved in the preference
checks). All adults spent ten minutes warming up with the child before beginning the
experiment.
Mood Ratings (adapted from Pothmann & Goepel, 1984). The child, experimenter, and
recipient sat around a small table. The neutral adult sat in an adjacent chair reading a magazine,
visible to the child but inattentive to the activities at the table. The recipient asked the child to
rate their mood using a six-item smiley face scale including one ‘sad’ (frowning) face, one
neutral face, and four levels of ‘happy’ faces depicting increasing levels of smiling (adapted
from Pothmann & Goepel, 1984).
Trust Manipulation (adapted from Vaish et al., 2010). The recipient guided the child
through the creation of a drawing of a tree and a clay bird. The experimenter did not make art
projects but observed the child and recipient with interest. After each art project, the recipient
momentarily excused herself from the testing room. In her absence, the experimenter damaged
the recipient’s art project in front of the child, and then either lied or was honest about the
incident. In the trustworthy condition, the damage was accidental, while in the untrustworthy
condition, the damage was intentional. Upon returning to the room, the recipient confronted the
experimenter. In the trustworthy condition, the experimenter answered honestly (‘Yes, I
tore/broke your drawing/bird. It was an accident. I’m sorry’), while in the untrustworthy
21
condition, the experimenter lied (‘No, I didn’t tear/break your drawing/bird. I don’t know how it
got torn/broken’).
Initial Preference Check. The recipient then conducted an exploratory check of
children’s preferences for the experimenter versus the neutral adult in two forced choice
scenarios involving the art projects: ‘We’re all done with art projects for now, but we should
bring the art projects you made to your [parent/guardian] to hold while we play the rest of our
games! Who would you like to bring your drawing to your [parent/guardian]? Her [motioned
toward experimenter] or her [motioned toward neutral adult]?’ The child chose between the
experimenter and neutral adult twice (once for each of the two art projects).
Delay of Gratification. The recipient and neutral adult then excused themselves from the
room, and the experimenter administered the marshmallow test (non-bell version, as in Kidd et
al., 2013). The experimenter cleared the art supplies from the table, then provided the child with
a single marshmallow: ‘Okay, now it’s snack time! Do you like marshmallows? You have a
choice for your snack today. You can either have this one marshmallow to eat right now, or if
you wait for me to get more marshmallows from the other room, you can have two
marshmallows to eat instead. How does that sound? You stay right there in that chair. I’ll leave
this right here, and if you haven’t eaten it when I get back, you can have two to eat instead.’
The experimenter monitored the child’s behavior from the observation room for a maximum of
15 min. In both conditions, if the child ate the marshmallow before 15 min, all adults returned to
the room. If the child waited the full 15 min without eating the marshmallow, all adults returned
to the room, and the experimenter delivered the second marshmallow.
Final Preference Check. The final preference check required children to make a forced
choice to help either the experimenter or the neutral adult complete a color-matching game (as in
22
Vaish et al., 2010). Both adults simultaneously played separate but identical color-matching
games and required a blue ball to complete their games, but only one blue ball was present,
which had been placed directly in front of the child (and out of reach of the adults). Both adults
simultaneously reached for the single blue ball, and if the child did not act within 15 s, the
recipient instructed him/her to ‘give the ball’. After the child selected one of the two adults,
he/she was provided with a second blue ball, giving him/her the opportunity to help both adults.
Mood Ratings. Finally, the recipient asked the child to rate their post-experiment mood.
Children in the untrustworthy condition watched a staged reconciliation between the
experimenter and recipient.
Results
A naive coder reviewed blinded videos and recorded when each child’s first taste (a lick
or bite) occurred (as in Kidd et al., 2013). Judgments were checked against a second naïve coder
to ensure reliability, r(32) = .99, p < .001, with coders differing by more than 1 s on only one of
34 judgments (less than 3%). All analyses were conducted using the R statistical package (R
Development Core Team, 2006).
Delay of Gratification
Wait times across the delay period were not normally distributed because data for
children who waited the full 15 min were right-censored (amounting to 38% of the total number
of responses). Therefore, the Mantel-Cox log-rank test was used to test the null hypothesis that
there was no difference in the probability of resisting the marshmallow at any time point across
the delay period between conditions. Survival functions reflecting the proportion of children
resisting the marshmallow as a function of time are depicted in Figure 4. Children who had been
tested by a trustworthy experimenter waited longer in the marshmallow test (median wait time =
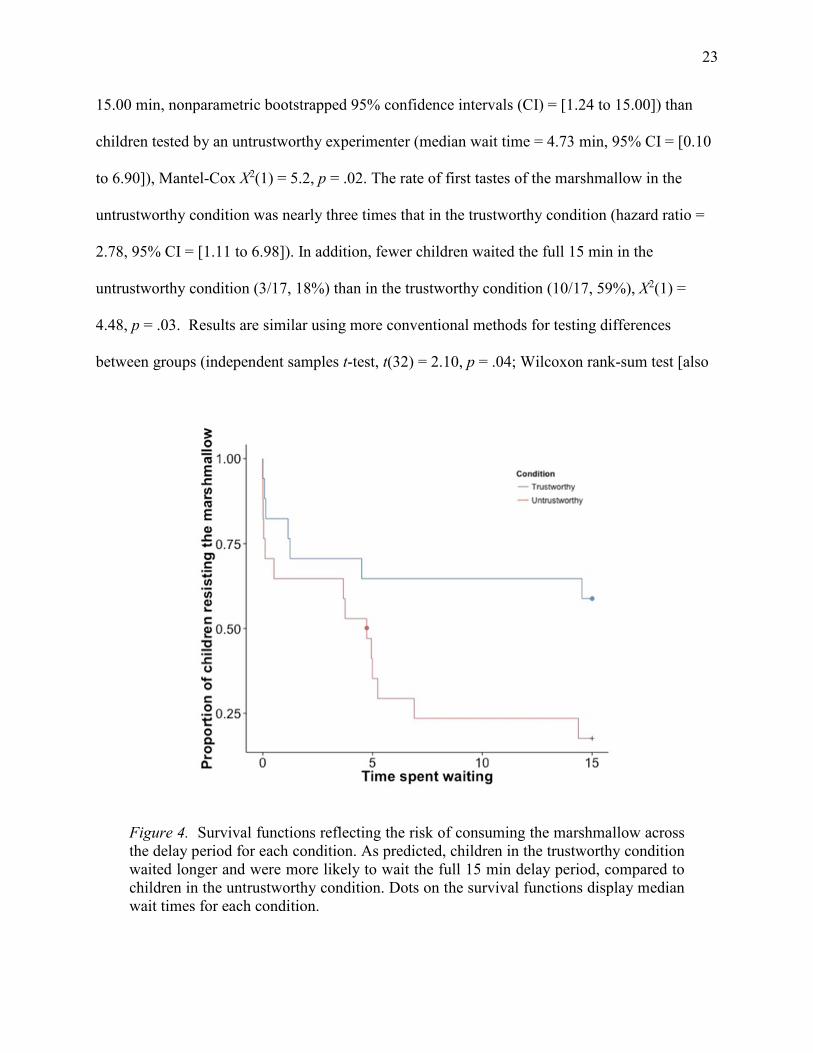
23
15.00 min, nonparametric bootstrapped 95% confidence intervals (CI) = [1.24 to 15.00]) than
children tested by an untrustworthy experimenter (median wait time = 4.73 min, 95% CI = [0.10
to 6.90]), Mantel-Cox X2(1) = 5.2, p = .02. The rate of first tastes of the marshmallow in the
untrustworthy condition was nearly three times that in the trustworthy condition (hazard ratio =
2.78, 95% CI = [1.11 to 6.98]). In addition, fewer children waited the full 15 min in the
untrustworthy condition (3/17, 18%) than in the trustworthy condition (10/17, 59%), X2(1) =
4.48, p = .03. Results are similar using more conventional methods for testing differences
between groups (independent samples t-test, t(32) = 2.10, p = .04; Wilcoxon rank-sum test [also
Figure 4. Survival functions reflecting the risk of consuming the marshmallow across the delay period for each condition. As predicted, children in the trustworthy condition waited longer and were more likely to wait the full 15 min delay period, compared to children in the untrustworthy condition. Dots on the survival functions display median wait times for each condition.

24
known as a Mann-Whitney U-test], W = 90, p = .055).
Although males waited marginally longer than females, Mantel-Cox X2(1) = 3.7, p = .05,
there was no significant interaction between gender and condition, p > .6, and the effect of
condition on wait times persisted when controlling for gender, X2(2) = 8.6, p = .01. Wait times
were unrelated to age, p > .3.
Mood
Mood did not significantly change over the course of the experiment (pre-experiment
mood rating: Mtrustworthy = 5.3, SD = 1.1, Muntrustworthy = 5.5, SD = 0.6; post-experiment: Mtrustworthy
= 5.0, SD = 1.2, Muntrustworthy = 4.4, SD = 1.5), and conditions did not differ in pre- or post-
experiment mood ratings, or in the difference between them, as indicated by Wilcoxon rank sum
tests and independent samples t-tests, all ps > .1. The difference between pre- and post-
experiment mood ratings did not predict wait times in a Cox proportional hazards regression
model, p > .6, or a simple linear regression model, p > .7. Although null results should not be
over-interpreted, these patterns are thus consistent with the interpretation that differences in
delaying gratification were not driven by differences in mood.
Preference Checks
Children showed no significant preferences for the experimenter versus the neutral adult
(ps > .1), although children’s choices showed some consistency with the expectation that
children should prefer the trustworthy experimenter to the untrustworthy experimenter. (The
numbers of children preferring the experimenter to a neutral adult were: initial preference check:
12/17 children in trustworthy condition, 9/17 in untrustworthy; final preference check: 8/17 in
trustworthy condition, 4/17 in untrustworthy.) The lack of significant preferences may reflect
25
insensitivity in our initial preference check (which was developed for this study and has not been
validated in other work, and in fact required children to trust their artwork with an experimenter
who had just damaged the recipient’s art works, whether accidentally or intentionally), the
considerable delay between the trust manipulation and the final preference check (taken from
Vaish et al., 2010, who administered it immediately), and the variability across children in the
length of this delay and the way they spent it.
Discussion
Manipulating children’s perceptions of the trustworthiness of an adult influenced their
willingness to delay gratification for rewards promised by that adult. This was true even without
children directly experiencing the consequences of an adult’s untrustworthy behavior, and even
when trust manipulations were unrelated to rewards. Although this initial evidence should be
replicated in larger-scale confirmatory studies to obtain more accurate estimates of the
magnitude of effects (e.g. Asendorpf, Conner, Fruyt, Houwer, Denissen et al., 2013; Sakaluk,
2016), these findings provides compelling causal evidence that trust influences children’s delay
of gratification.
These conclusions are based on experimental manipulations of trustworthiness in order to
isolate causal factors, and so can only speak to contexts in which trust is manipulated. However,
these findings also highlight intriguing possibilities about group differences and individual
differences in delaying gratification. First, certain groups may delay gratification less than
others because they have less trust that delayed rewards will be delivered as promised. For
example, although children may be biased towards accepting information from adults as true
(e.g. Jaswal, Croft, Setia & Cole, 2010; Mills, 2013; Vanderbilt, Liu & Heyman, 2011),
compared to adults, children show lower levels of trust about how others will behave (Harbaugh,

26
Krause, Liday & Vesterlund, 2003; Sutter & Kocher, 2007) and greater sensitivity to violations
of trust (van den Bos, van Dijk & Crone, 2011) in economic exchanges. Such reluctance and
sensitivity to trusting what others will do may lead to children’s corresponding preferences for
immediate over delayed rewards. Other groups who show lower levels of delaying gratification,
such as addicts (e.g. Hoffman, Moore, Templin, McFarland, Hitzemann et al., 2006; Johnson,
Bickel & Baker, 2007) and criminals (e.g. Arantes, Berg, Lawlor & Grace, 2013; Petry, 2002),
might also be driven in part by their difficulties with trusting others (Wright & Kirimani, 1977;
Mischel, 1961a; Mischel & Gilligan, 1964). The latter possibility will be tested in Chapter 4.
Second, certain individuals may delay gratification less than others because they have
less trust that delayed rewards will be delivered as promised (consistent with correlational
findings; Harris & Madden, 2002; Schneider et al., 2014). These differences in social trust could
contribute to differences in life outcomes, given the stability of social trust across development
(Harbaugh et al., 2003; Rotter, 1971). Being more trusting is associated with many positive
outcomes that have also been linked to delaying gratification, including better academic
performance (Imber, 1973), higher educational attainment (Paxton, 2007), higher income (Li,
Pickles & Savage, 2005), lower divorce rates (Patterson, 1999), and better physical health
(Kawachi, Kennedy & Glass, 1999; Kawachi, 1997). These possibilities will be explored in
Chapters 5 and 6.
27
CHAPTER 4: GROUP DIFFERENCES IN TRUST AND DELAY OF GRATIFICATION
AMONG INCARCERATED CRIMINAL OFFENDERS
This chapter reports an initial test of the hypothesis that certain groups or populations
may delay gratification less than others because they are less trusting that delayed rewards will
be delivered. A group of incarcerated criminal offenders and a group non-offending controls
were surveyed on their preferences for immediate gratification and their dispositional trust.
Criminal offenders were selected as the population of interest due to their characteristic
preferences for immediate gratification, even after controlling for third-variable confounds
(Arantes, Berg, Lawlor, & Grace, 2012; Cherek, Moeller, Dougherty, & Rhoades, 1997;
Newman, Kossen, & Patterson, 1992), and given well-established correlations between
neighborhood-level measures of social capital and crime (Kawachi, Kennedy, & Wilkinson,
1999; Kennedy, Kawachi, Prothrow-Stith, Lochner, & Gupta, 1998; Sampson, Raudenbush, &
Earls, 1997). Results were evaluated using a mediation model to quantify the direct and indirect
“effects” of being a criminal offender. Importantly, although mediation is a causal phenomenon,
the cross-sectional nature of this study precludes any direct assessment of causality among these
three variables. Instead, our primary aim is to evaluate patterns of group differences and their
interactions. This research was conducted in March of 2014 through a partnership between
Boulder County Jail and the University of Colorado Boulder, in collaboration with Joanne
Belknap, Professor of Ethnic Studies, Yuko Munakata, Professor of Psychology and
Neuroscience, Sargent Lydia Mitchell with Boulder County Correctional Services, and
undergraduate students Olivia Kolodziejczak and Abby Cher.
28
Methods
Inmates incarcerated at the county jail (n = 70) and control participants from Mechanical
Turk (n = 59) were surveyed on a number of personality and behavioral characteristics, including
social trust and delay of gratification. We predicted that group differences in delay of
gratification would diminish or decrease after controlling for differences in trust.
Participants
Jail Participants. A total of 76 currently-incarcerated criminal offenders enrolled and
completed the survey during a single day of data collection at Boulder County Jail (BCJ). Six
participants were excluded for missing data, yielding a total of 70 participants available for
analysis. Participants were recruited from one of 11 non-disciplinary housing modules.
Eligibility was restricted to individuals who were over the age of 18, post-sentencing (in order to
confirm age), and fluent in English. Recruitment occurred the day prior to data collection and
was coordinated by plain-clothed BCJ staff (e.g., therapists or program leaders, but not
correctional staff, to avoid coercion). Participants were supplied with a recruitment flyer and
provided information about the study during program sessions. Inmates recruited from the jail
were not compensated financially or otherwise for participating in the study.
Control Participants. Data collection for the control sample occurred within one week of
the jail sample, also within a single 24-hour period. A total of 74 participants initially enrolled
and completed the survey through Amazon’s Mechanical Turk. Eligibility was restricted to
individuals aged 18-65 years, IP addresses from the United State (to increase the likelihood of
English fluency and ensure he appropriateness of US currency for the delay of gratification
measure), at least a 99% approval rating from previous Mechanical Turk jobs, and no prior
incarcerations in the preceding six months (as indicated on a survey item). Fifteen control

29
participants were excluded prior to analysis due to survey non-compliance (i.e., failing the catch
question, n=5) and having a prior incarceration history (n=10), leaving a total of 59 control
participants in the analytic sample. Participants were roughly gender-balanced and normally
distributed in terms of socioeconomic status.
Materials and Procedure
Participants in the control group completed the survey electronically through the
Qualtrics web-based survey platform (hosted on Mechanical Turk). Participants in the jail group
completed surveys on pencil and paper during module-based program sessions attended by
inmates and overseen by BCJ staff members. Jail participants were consented by members of the
research team prior to survey administration, and researchers remained available to answer
participant questions through the duration of the survey. The survey included sections on
Demographics, Decision-Making and Trust, Health History, Brief Offending and Victimization
History, and Concluding Questions, and took approximately 30-45 min to complete. Analyses in
this chapter are restricted to items from the Decision-Making and Trust section of the survey; the
remaining sections were included to address questions of interest to other members of the
research team.
In the Decision-Making and Trust section of the survey, participants first read a short
fictional vignette about a neutral character, then made a series of intertemporal choices between
immediate and delayed rewards offered by that character. These procedures exactly matched the
trust manipulations and delay of gratification measure used in Experiment 2 of Chapter 2.
Importantly, the neutral vignette was not intended to manipulate trust in the present study;
instead, it provided a social context for the intertemporal choice questions, and was therefore
used to reflect individual differences in trust toward neutral people. Next, participants rated the

30
fictional vignette character on trustworthiness and other personality traits. Finally, participants
completed a well-established and validated self-report measure of dispositional trust (Propensity
to Trust Survey; Evans & Revelle, 2008). After survey completion, all inmates were verbally
debriefed by a member of the research team before being escorted back to their modules by BCJ
staff.
Results
As predicted, inmates were less willing to delay gratification for hypothetical monetary
rewards, and also less trusting, relative to controls. Additionally, the direct effect of criminal
status on delay of gratification was attenuated in a series of mediation models that adjust for
group differences in trust. However, these mediation effects were not statistically
distinguishable from zero, suggesting trust does not fully or reliably explain these group
differences.
Analytic Approach and Preliminary Analyses
A trust composite variable was created from the z-scored average of the two survey
measures (trust ratings of the fictional vignette character and dispositional trust score on the
Propensity to Trust survey). Individual k-parameters were computed to reflect individual
differences in delay of gratification using the k-parameter estimation procedures described in
Chapter 2 and log-transformed prior to analysis. Groups were contrast coded (Jail = 1, Control =
-1) prior to analysis. Groups were equivalent in age and gender at baseline, and neither age nor
gender was significantly related to trust or delay of gratification.
Relationships between criminal offending, trust, and willingness to delay gratification
were evaluated using a series of multiple regression models based on Baron and Kenny’s (1986)
framework for mediation analysis. In this framework, impacts of X (criminal offender status) on
31
M (trust) propagate causally to Y (delay of gratification), representing the “indirect effect” of X
on Y. The model assumes X can also affect Y directly, independent of X’s influence on M.
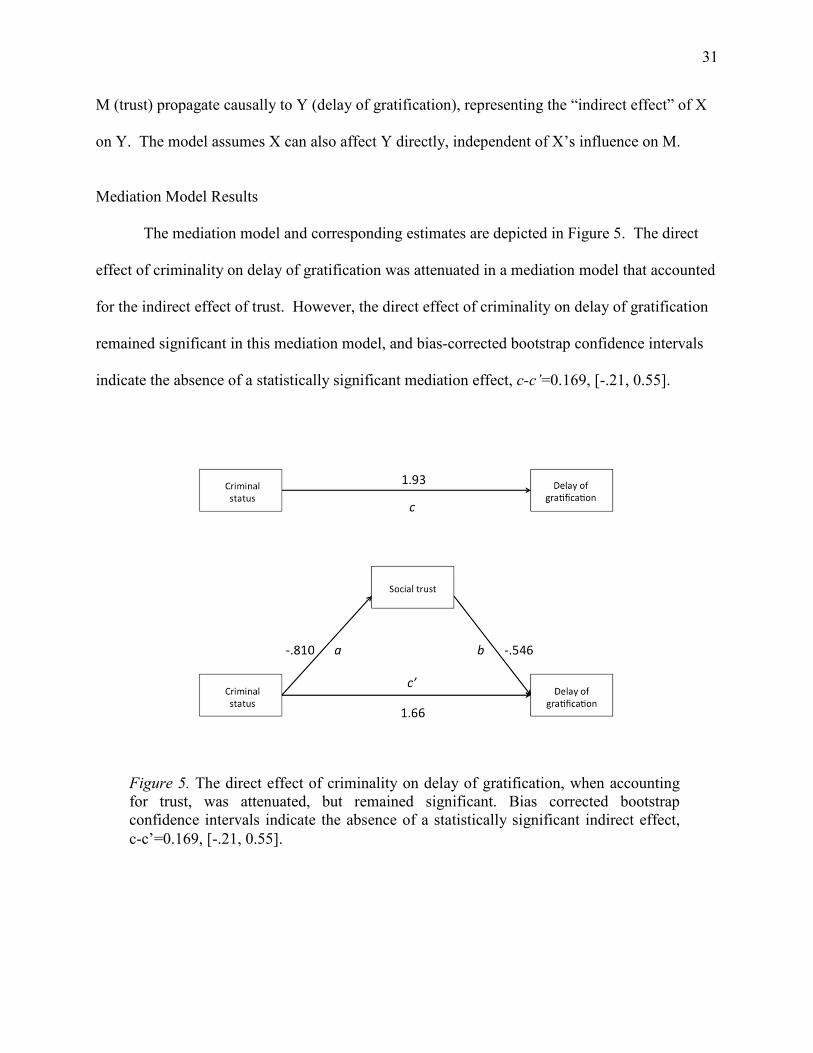
Mediation Model Results
The mediation model and corresponding estimates are depicted in Figure 5. The direct
effect of criminality on delay of gratification was attenuated in a mediation model that accounted
for the indirect effect of trust. However, the direct effect of criminality on delay of gratification
remained significant in this mediation model, and bias-corrected bootstrap confidence intervals
indicate the absence of a statistically significant mediation effect, c-c’=0.169, [-.21, 0.55].
Figure 5. The direct effect of criminality on delay of gratification, when accounting for trust, was attenuated, but remained significant. Bias corrected bootstrap confidence intervals indicate the absence of a statistically significant indirect effect,
c-c’=0.169, [-.21, 0.55].

32
Discussion
Criminal offenders self-reported significantly lower trust and less willingness to delay
gratification relative to control participants, but these differences in trust did not fully account for
the group differences in delay of gratification. Although these findings do not support the
mediation model that was hypothesized a priori, they are consistent with previous evidence on
group differences in delay of gratification in criminal offenders, and contribute to a large body of
sociological and econometrics research on associations between social capital and crime.
Importantly, the data stopping rule in this study was determined by the availability of
access to criminal offenders as opposed to an a priori power analysis, and our resulting sample
size was small and underpowered to detect mediation effects. Our results should therefore be
interpreted as insufficient evidence to reject the null hypothesis, rather than compelling evidence
against the hypothesized mediation model.
An alternative interpretation of these results is that our mediation model was overly
simplistic. Trust is highly endogenous (i.e., it both determines and is determined by other factors
in the environment), and is consistently correlated with many aspects of the environment that are
also associated with criminal convictions, like neighborhood quality and socioeconomic status.
Additionally, recent longitudinal work suggests that relations between delay of gratification and
crime may also be reciprocal: low delay of gratification predicts subsequent criminal behavior,
but criminal behavior also predicts subsequent delay of gratification (Lee, Derefinko, Milich,
Lynam, & DeWall, 2017). These reciprocal relations among trust, crime, and delay of
gratification, and their potential moderators, may need to be modeled directly in order to provide
a valid test of our hypothesized mediation effects.

33
CHAPTER 5: IMPACTS OF TRUST ON LIFE OUTCOMES IN A DISCORDANT TWIN
COMPARISON DESIGN
Introduction
This chapter presents a quasi-experimental study designed to address some of the
interpretational issues highlighted in Chapter 4. Specifically, we evaluate the hypothesis that
individual differences in trust causally contribute to individual differences in life outcomes by
comparing twins discordant on trust but matched on nearly every other aspect of the
environment. Discordant-twin studies can powerfully eliminate a number of alternative causal
explanations of endogenous variables by focusing statistical comparisons on within-cluster
variance. This approach effectively eliminates confounds that vary between families (and are
known to affect and vary with trust, e.g., socioeconomic status, neighborhoods, early
socialization experiences), thus providing a targeted test of hypothesized causal factors that can
support stronger causal inferences relative to traditional cross-sectional designs. This work was
conducted along with co-author John Lurquin, Ph.D., and is currently being prepared for journal
submission.
MIDUS Dataset
The data for this study come from Phase II of the Midlife Development in the United
States (MIDUS) series, a dataset which is maintained and distributed by the National Institutes of
Health (NIH) and hosted by the Interuniversity Consortium for Political and Social Research
(ICPSR). Initially established in 1989, the MIDUS project followed individuals aged 25-70
longitudinally across three decades with the goal of identifying behavioral, psychological, and
social factors that predict age-related differences in physical and mental health. Data collection
occurred in three phases: Phase 1 in 1995, Phase 2 in 2004, and Phase 3 in 2013. Approximately

34
77% of living longitudinal participants retained at Phase 3 (longitudinal N=3294). Participants
included a general population survey (including siblings of the general population respondents),
a twin pairs sample, and an oversample from five metropolitan areas. This chapter will focus on
twin pairs in the MIDUS II dataset (Ryff et al., 2004-2006), as data from MIDUS III were not
yet available at the time this study was initiated.
Methods
Participants
Both monozygotic and dizygotic twin pairs were eligible for inclusion in the study. Twin
pairs were recruited by first screening a sample of 50,000 randomly selected households for the
presence of a twin. Of the 14.8% of households that reported a twin, 60% agreed to participate
in the MIDUS study. The final enrolled twin sample in MIDUS I consisted of n = 1915
participants, with a total of N = 7,108 participants enrolled in the overall MIDUS sample. At the
time of MIDUS II, 4,963 of the original 7,108 MIDUS I participants were successfully
recontcted, including n = 1,484 of the original n = 1,915 twins. Participants in MIDUS II
completed a 30-minute phone interview and two self-administered questionnaires and received
$20 upon completion.
Measured Variables
Measured variables include social trust, health, wealth, and a collection of
sociodemographic covariates used for specificity testing. Specific items and additional details
about the measures are available in Appendix A.
Social Trust. Trust was measured from the z-scored composite of participant responses to
the following three survey items: “I have not experienced many warm and trusting relationships
with others” (1: Agree strongly to 7: Disagree strongly); “I know that I can trust my friends, and

35
they know they can trust me” (1: Agree strongly to 7: Disagree strongly); “People in my
neighborhood trust each other” (1: A lot to 4: Not at all). Each response was z-scored and then
combined to create an average composite trust measure for each participant. Higher values
indicate more social trust.
Health. Physical health was measured with two subjective items (perceived physical
health, perceived overweight) and one objective measure (body mass index; BMI). Mental
health was measured with one item asking about perceived general mental health, a 7-item
Depressed Affect Scale that measures depressive symptoms, and a single-item measure of worry.
We also included two items related to substance use, one measuring drug use (specific to drugs
the participant self-reported to have used), and one measuring alcohol use.
Wealth. Wealth was measured using four self-report items (perceived financial situation,
perceived control over financial situation, whether participants have enough money to meet their
needs, difficulty in paying monthly bills), as well as one objective measure of wealth (annual
income), though this measure was also self-reported.
Covariates. Covariates include gender, highest level of education (some or no high
school, graduated high school, some college, graduated college or more), working status (full-
time, retired, homemaker, unemployed), age, and race, each selected based on prior evidence of
correlations with trust. Race was organized into three categories (white, black, other).
Results
Analytic Approach and Statistical Models
First, we fit separate linear models to predict each of our outcome variables with social
trust using the full dataset and OLS regression. Next, we added covariates to estimate the same
relationships after accounting for observed and theoretically-relevant confounds. Finally, we
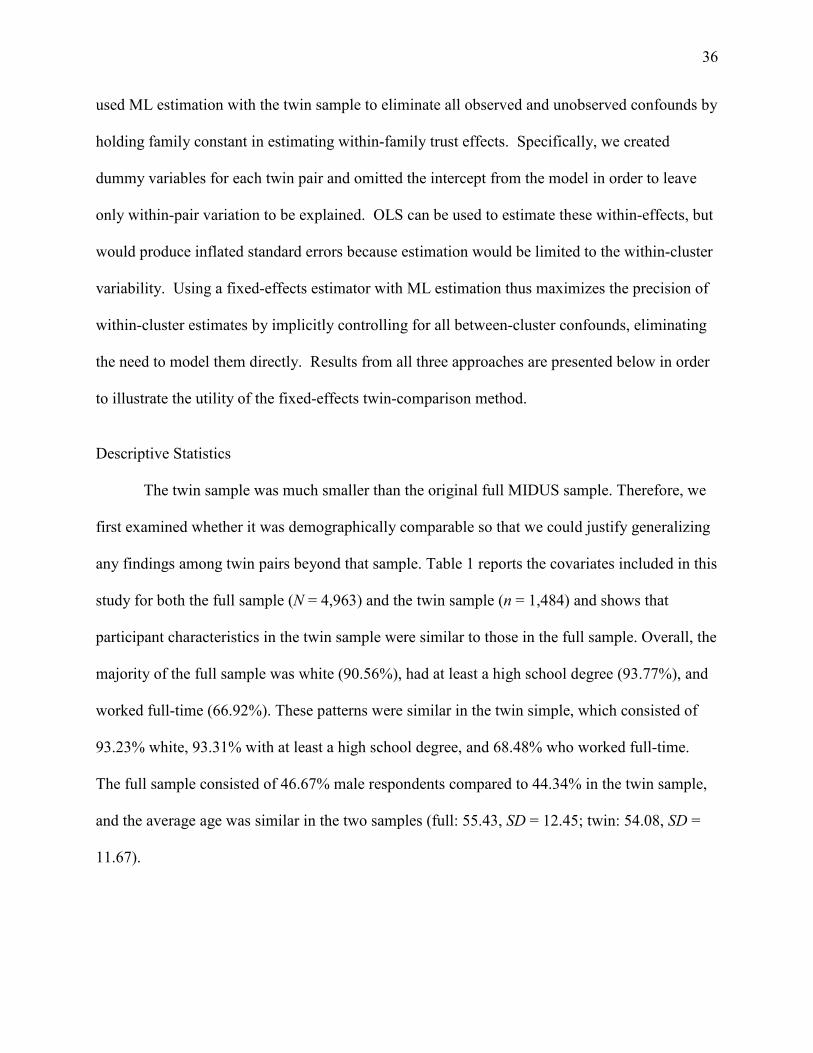
36
used ML estimation with the twin sample to eliminate all observed and unobserved confounds by
holding family constant in estimating within-family trust effects. Specifically, we created
dummy variables for each twin pair and omitted the intercept from the model in order to leave
only within-pair variation to be explained. OLS can be used to estimate these within-effects, but
would produce inflated standard errors because estimation would be limited to the within-cluster
variability. Using a fixed-effects estimator with ML estimation thus maximizes the precision of
within-cluster estimates by implicitly controlling for all between-cluster confounds, eliminating
the need to model them directly. Results from all three approaches are presented below in order
to illustrate the utility of the fixed-effects twin-comparison method.
Descriptive Statistics
The twin sample was much smaller than the original full MIDUS sample. Therefore, we
first examined whether it was demographically comparable so that we could justify generalizing
any findings among twin pairs beyond that sample. Table 1 reports the covariates included in this
study for both the full sample (N = 4,963) and the twin sample (n = 1,484) and shows that
participant characteristics in the twin sample were similar to those in the full sample. Overall, the
majority of the full sample was white (90.56%), had at least a high school degree (93.77%), and
worked full-time (66.92%). These patterns were similar in the twin simple, which consisted of
93.23% white, 93.31% with at least a high school degree, and 68.48% who worked full-time.
The full sample consisted of 46.67% male respondents compared to 44.34% in the twin sample,
and the average age was similar in the two samples (full: 55.43, SD = 12.45; twin: 54.08, SD =
11.67).

37
Table 1 Sociodemographic Characteristics of the MIDUS
Sample
Full sample Twin sample
Gender
Male 46.67 44.34
Female 53.33 55.66
Education
< High school 6.23 6.69
High school 26.78 29.46
Some college 29.94 30.95
Graduated college 37.05 32.91
Working Status
Full-time 66.92 68.48
Retired 24.74 22.24
Homemaker 5.65 7.01
Unemployed 2.69 2.27
Race
White 90.56 93.23
Black 4.64 3.32
Other 4.8 3.45
Age in years 55.43 (12.45) 54.08 (11.67)
Total N 4963 1484
Note. All values reflect percentages with the exception of Age in years. Parentheses denote standard error.
Regression Model Results
Results across all three analytic approaches are listed in Table 2. Overall, individuals
who were more trusting had better life outcomes across all variables we examined. Higher trust
predicted lower BMI, better perceptions of physical health, and lower likelihood of being
overweight. Similar trends were observed between trust and mental health: higher trust predicted
better perceived general mental health, fewer depressive symptoms, and less worry. Correlations
between trust and substance use (alcohol and drugs) were in the predicted direction but not
statistically significant. Finally, being more trusting was also associated with better wealth,
including better perceived financial situations, more perceived financial control, higher

38
likelihood of feeling as though they had enough (or more than enough) money to meet their
needs, and less reported difficulty paying monthly bills. Trust did not predict the only objective
measure of wealth (annual income) in this model.
Multiple Regression Model Results
Results from the multiple regression models are generally consistent with those reported
above: every relationship remained statistically significant after controlling for gender,
education, employment status, age, and race. Interestingly, the magnitude of relationships with
trust decreased for nearly every variable after controlling for these covariates. This supports our
suspicions that failing to account for these observed and theoretically- justified
sociodemographic variables can produce inflated estimates of relationships with trust.
Fixed-Effects Model Results
Relationships between trust and life outcomes continue to diminish in the fixed-effects
models that control for between-family effects. Trust no longer significantly predicts BMI or
perceived overweight status. The remaining relationships are statistically significant, but
considerably smaller in magnitude relative to those suggested from the multiple regression
results. This pattern is consistent with the notion that unobserved confounds continue to inflate
estimated relationships in the multiple regression models even after controlling for the observed
covariates. Interestingly, whereas there were virtually no relationships between social trust and
the substance use items in the naïve model, the estimates of these relationships increased when
fixed effects were included.
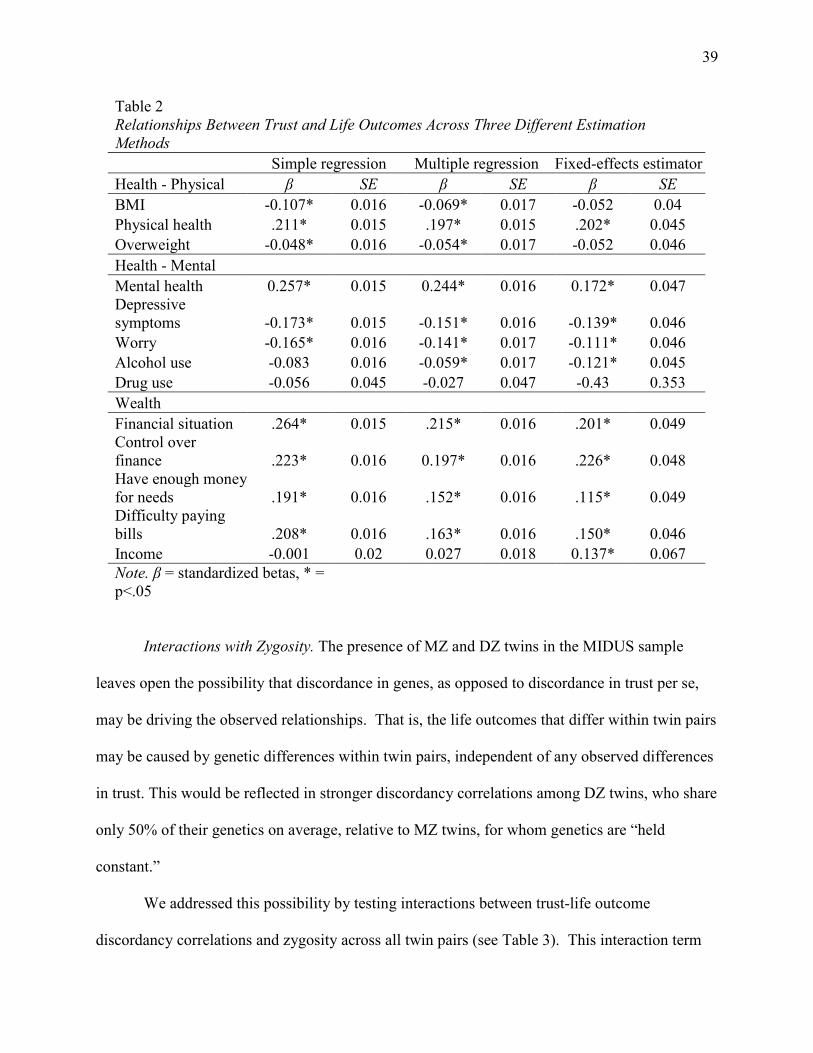
39
Table 2 Relationships Between Trust and Life Outcomes Across Three Different Estimation
Methods
Simple regression Multiple regression Fixed-effects estimator
Health - Physical β SE β SE β SE
BMI -0.107* 0.016 -0.069* 0.017 -0.052 0.04
Physical health .211* 0.015 .197* 0.015 .202* 0.045
Overweight -0.048* 0.016 -0.054* 0.017 -0.052 0.046
Health - Mental
Mental health 0.257* 0.015 0.244* 0.016 0.172* 0.047 Depressive symptoms -0.173* 0.015 -0.151* 0.016 -0.139* 0.046
Worry -0.165* 0.016 -0.141* 0.017 -0.111* 0.046
Alcohol use -0.083 0.016 -0.059* 0.017 -0.121* 0.045
Drug use -0.056 0.045 -0.027 0.047 -0.43 0.353
Wealth
Financial situation .264* 0.015 .215* 0.016 .201* 0.049 Control over finance .223* 0.016 0.197* 0.016 .226* 0.048 Have enough money for needs .191* 0.016 .152* 0.016 .115* 0.049 Difficulty paying bills .208* 0.016 .163* 0.016 .150* 0.046
Income -0.001 0.02 0.027 0.018 0.137* 0.067
Note. β = standardized betas, * = p<.05
Interactions with Zygosity. The presence of MZ and DZ twins in the MIDUS sample
leaves open the possibility that discordance in genes, as opposed to discordance in trust per se,
may be driving the observed relationships. That is, the life outcomes that differ within twin pairs
may be caused by genetic differences within twin pairs, independent of any observed differences
in trust. This would be reflected in stronger discordancy correlations among DZ twins, who share
only 50% of their genetics on average, relative to MZ twins, for whom genetics are “held
constant.”
We addressed this possibility by testing interactions between trust-life outcome
discordancy correlations and zygosity across all twin pairs (see Table 3). This interaction term
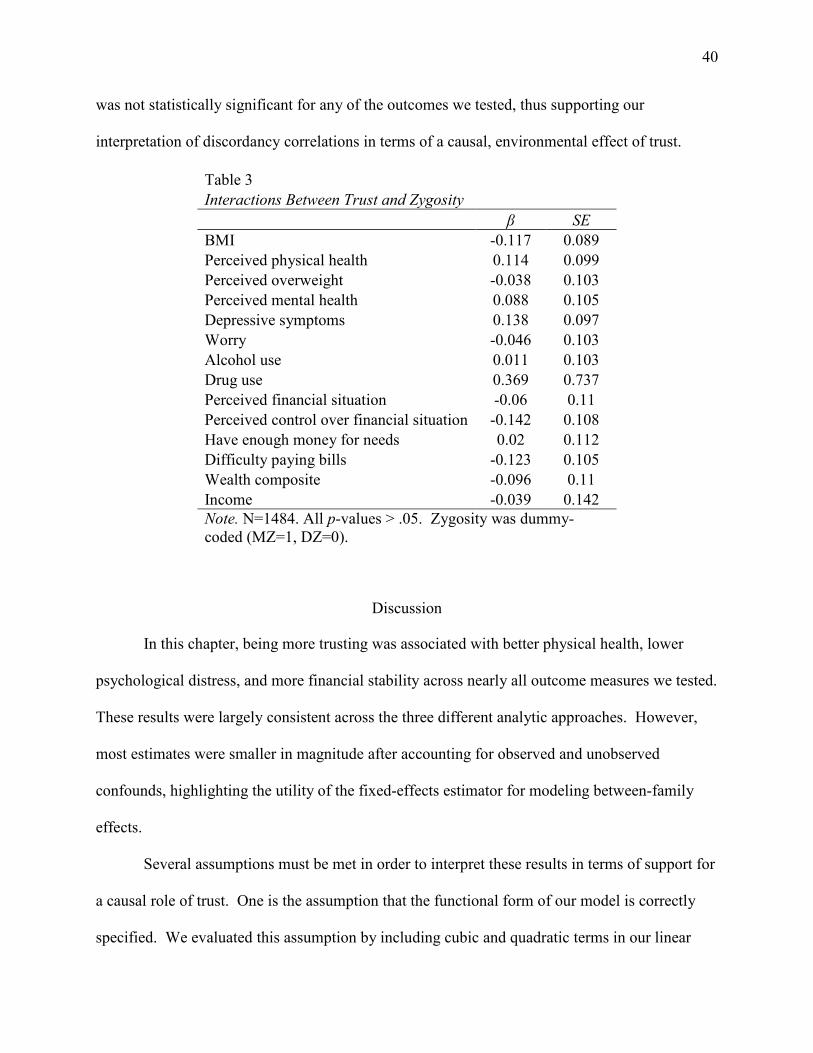
40
was not statistically significant for any of the outcomes we tested, thus supporting our
interpretation of discordancy correlations in terms of a causal, environmental effect of trust.
Table 3
Interactions Between Trust and Zygosity
β SE
BMI -0.117 0.089
Perceived physical health 0.114 0.099
Perceived overweight -0.038 0.103
Perceived mental health 0.088 0.105
Depressive symptoms 0.138 0.097
Worry -0.046 0.103
Alcohol use 0.011 0.103
Drug use 0.369 0.737
Perceived financial situation -0.06 0.11
Perceived control over financial situation -0.142 0.108
Have enough money for needs 0.02 0.112
Difficulty paying bills -0.123 0.105
Wealth composite -0.096 0.11
Income -0.039 0.142
Note. N=1484. All p-values > .05. Zygosity was dummy-coded (MZ=1, DZ=0).
Discussion
In this chapter, being more trusting was associated with better physical health, lower
psychological distress, and more financial stability across nearly all outcome measures we tested.
These results were largely consistent across the three different analytic approaches. However,
most estimates were smaller in magnitude after accounting for observed and unobserved
confounds, highlighting the utility of the fixed-effects estimator for modeling between-family
effects.
Several assumptions must be met in order to interpret these results in terms of support for
a causal role of trust. One is the assumption that the functional form of our model is correctly
specified. We evaluated this assumption by including cubic and quadratic terms in our linear

41
model, neither of which were statistically significant. Another critical assumption is ignorable
treatment assignment within units; in other words, the assumption that within-twin pair variation
in trust is as good as random. We evaluated this assumption in two ways: by including each of
our covariates as moderators in the fixed-effects models to control for adult differences between
twins, and by regressing each of our covariates that varied within twin pairs (education and
gender) on trust within both the full sample and the twin sample. None of the covariates
significantly moderated the observed discordancy correlations in the fixed-effects models,
suggested differences in trust continue to predict differences in life outcomes over and above any
confounding differences in twins as adults. Furthermore, although both covariates were
significantly related to trust in the full participant sample, (β = 0.073, p < .001 for education; β =
0.057, p < .001 for gender), neither predicted variation in trust within twins (β = -0.023, p = .711
for education, β = 0.032, F = .527, p = .599 for gender). In the future, ruling out other variables
that might vary with trust within twin pairs and also predict our dependent variables would
bolster our causal interpretation, and could also lead to testable predictions about what might be
causing within-twin pair differences in trust. Finally, the Stable Unit Treatment Value
Assumption (SUTVA) states that the outcome of one individual is not affected by the treatment
status of another. This assumption seems tenuous in the case of twins. For example, if one twin is
higher in trust, for example, and is consequently less likely to abuse drugs and alcohol, the other
twin may follow suit. This would lead to a downward bias in the estimated effect of trust. A
careful and systematic evaluation of these assumptions could strengthen the causal inferences
that are able to be drawn from this work.

42
CHAPTER 6: REPLICABILITY OF AND REASONS BEHIND THE PREDICTIVE
VALIDITY OF DELAYING GRATIFICATION
Introduction
The studies in this chapter test the replicability of and reasons behind the link between
early delay of gratification and later life outcomes. Two primary research questions are
addressed:
1) Do longitudinal associations between preschool delay of gratification and important
life outcomes replicate when tested using slightly different outcome measures and a
larger, more diverse sample of participants?
2) If so, do individual differences in trust or self-control account for these observed
associations?
The first research question (RQ1) constitutes a conceptual replication of longitudinal
associations between delay of gratification and adolescent outcomes initially documented in
Mischel, Shoda, & Peake (1988). The latter (RQ2) provides a test of the hypothesized
importance of social trust in driving such associations. Both questions will be tested using the
NICHD Study of Early Child Care and Youth Development (SECCYD) dataset.
An overall description of the dataset is provided below, followed by a description of the
search and selection process that was used to identify measured variables. Methods and Results
sections are then reported separately for each research question. A detailed preregistration plan
summarizing the hypothesis and planned analyses was registered on the Open Science
Framework prior to the viewing of any raw data or descriptive statistics for this study
(https://osf.io/vjmkz/register/).

43
SECCYD Dataset
The data used in this study come from the National Institute of Child Health and
Development’s Study of Early Child Care and Youth Development (SECCYD), a prospective
longitudinal study of 1,354 children and their families conducted from 1991 through 2006. The
purpose of the study was to examine associations between early child care experiences and
subsequent developmental outcomes. As such, children and their mothers were regularly queried
on information relating to children’s family, school, alternate care environments, social-
emotional functioning, cognitive functioning, and physical health throughout the first 15 years of
life. Strong precedent for use of the SECCYD dataset in longitudinal studies of psychosocial
development in childhood and adolescence have been established in prior work (e.g., Duckworth,
Tsukayama, & Kirby, 2013; Meldrum & Hay, 2011). Crucially, the SECCYD also includes a
measure of children’s delay of gratification in a variation of the self-imposed delay task at four
years of age. Thus, these data are thus well-suited for research on the predictive validity of
preschool delay of gratification for adolescent outcomes.
The SECCYD dataset is restricted from general dissemination in order to protect
respondent privacy. Access is only granted to individuals who hold a Ph.D. or other terminal
degree and are affiliated with an institution of higher education, research organization, or
government agency (or graduate students under the direct supervision of one of the above).
Application and provision of the data are coordinated through the Interuniversity Consortium for
Political and Social Research (ICPSR) after successful completion of the Data Access Request
Form, which includes Investigator Information, Research Staff Information, Sponsor
Information, Research Description, Confidential Data Security Plan, proof of approval or
exemption from an Institutional Review Board, and signed Agreement for the Use of the NICHD
44
SECCYD Restricted-Use Data from an individual legally authorized to enter a contractual
agreement on behalf of the investigator’s institution.
Study documentation and datasets were sent via email download in an encrypted,
password-protected file from ICPSR. This file was transferred to an encrypted container of a
non-networked computer for storage and analysis. Data were not copied or moved out of this
secured directory for any reason at any time, and statistical applications were configured to point
temporary analysis files to this secured data directory. The physical location of the non-
networked computer containing the directory was secure. In short, all reasonable precautions
were taken to avoid incidental identification of participants in the SECCYD sample.
Sample
Data collection was coordinated in four primary phases by 41 Principal Investigators at
29 universities across the United States. Mothers who had recently given birth to full-term,
healthy newborns were recruited to participate through one of 24 hospitals in the following 10
locations throughout the United States: Little Rock, AR; Irvine, CA; Lawrence, KS; Wellesley,
MA; Morganton, NC; Philadelphia, PA; Pittsburgh, PA; Charlottesville, VA; Seattle, WA;
Madison, WI. A total of 8,986 families were screened at birth based. At two weeks, 5,416
families were identified as eligible based on the mother being of legal age to consent, English
spoken in the home, no medical complications of the baby or mother, and the proximity of the
family home to a data collection center. Of those, 3,015 families were contacted for an interview
based on a conditional random sampling procedure designed to maintain at least 10%
representation of single parent households, mothers with less than a high school education, and
ethnic minority mothers. At one month of age, 1,364 children and their families enrolled in the

45
study (i.e., completed first visit). At Phase IV of the study, a total of 1,009 children and their
families remained enrolled.
The resulting sample was representative of the sociodemographic composition of the 10
study sites at the time. Approximately 56% of enrolled families lived above-poverty, 23% lived
near-poverty, and 21% lived in-poverty. The average household income among families
($37,947) was slightly higher than the U.S. average ($36,875), though enrolled families were
more likely than the average U.S. family to receive public assistance (18.8 % versus 7.5%).
Approximately 36% of mothers who took part in the study had a bachelor’s degree or higher,
33% had some college, and 31% had a high school degree or lower. Enrolled children were
76.4% White (of non-Hispanic origin), 12.7% African American, 6.1% Hispanic, and 4.8%
Asian, Pacific Islander, American Indian, or Other.
Measured Variables
For researchers interested in psychosocial development, thousands of relevant measures
and variables are available in the SECCYD dataset. In order to “reduce the temptation to p-
hack” and to abide by recent recommendations regarding the use of large-N datasets in
psychology to conduct hypothesis-driven confirmatory testing (Sakaluk, 2016), the only
variables included in the present study were those deemed minimally necessary to assess the
variables of interest and carry out the planned analyses. Several additional repeated observations
and theoretically-relevant variables are available from the SECCYD dataset for further
exploration in future research.
I developed a systematic search and selection process to identify measured variables to be
included. First, broadly inclusive search terms were developed for each variable (with the
exception of delay of gratification, for which an obvious measure was available from the

46
SECCYD dataset) in consultation with Medical Subject Headings (MeSH) thesaurus. MeSH is a
web-based thesaurus of health-related terms organized in sets of hierarchical structures to permit
searching at varying levels of specificity. The MeSH vocabulary is continually revised and
updated by staff subject specialists in the Medical Subject Headings Section at the U.S. National
Library of Medicine (NLM), and is primarily used by the NLM for indexing articles and other
electronic resources from leading journals for the Medline/PubMed database. The MeSH
thesaurus is available free of charge through the National Institute of Health website
(https://www.nlm.nih.gov/mesh/mbinfo.html), and is widely used by researchers and
professionals for classification, indexing, and systematic review of health-related information.
Variables entered in the MeSH Browser are automatically mapped to their “preferred”
form for the purposes of indexing and retrieval by health-related electronic databases, and
resulting descriptors can be viewed alongside their synonyms, subordinate terms, and
superordinate terms in the MeSH Tree Structure. Each variable was entered as a MeSH search
term and the resulting descriptors were individually evaluated for relevance to the variable of
interest along with their neighboring terms and concepts. Relevant terms identified through this
process were added to the search term for each variable (see Table 4).

47
Table 4
Search Terms Used to Identify Relevant Measures from the SECCYD Documentation
Variable Search Term Academic Achievement
achievement | aptitude | dropout | learning | literacy | motivation | "educational status" | "gpa"
Social Skills cooperation | empathy | friend | interpersonal | shy | "social skills"
Problem Behaviors
aggression | alcohol | bullying | compuls | crim | delusion | drinking | depersonalization problem | gambling | impuls | risk | self-injur | self-harm | self-mutil | smoking | substance | tobacco | violence | "behavioral symptoms" | "problem behavior" | "underage drinking" | "child reactive disorders"
Emotion Regulation
allostatic | anxiety | depression | emotion | fear | forgive | frustrat | pleasure | psychotherapy | "affective" | "affect" | "anger" | "rage" | "stress"
Personality assertiveness | attitude | empathy | extraversion | individuality | individuation | intelligence | introversion | leadership | moral | negativism | optimism | perfectionism | personality | pessimism | temperamen | "ego"
Trust attachment | confidence | interpersonal | reliance | trust
Self-Control “regulation” | self-control” | temperance
These MeSH-informed search terms were then submitted to a full-text OCR (optical
character recognition) search of the compiled SECCYD documentation. Specifically, the user
guides, codebooks, questionnaires, assessment charts, annotated lists of research instruments,
and manuals of operation for each phase of the study were combined to form a total of 4,792
pages of searchable text, and full and partial matches to each search term were identified from
within this document. Matching terms that appeared in the title/description, items, validity, or
subscales of a measure within the documentation were evaluated as candidates for the associated
variable. This search effectively returned any instrument, item, or coded variable or subscale
appearing anywhere within the SECCYD documentation that contained a term related to the
variables of interest for the present study.
48
Matching entries were individually evaluated for inclusion based on the following
criteria: conceptual relevance to the variable of interest, observations available at necessary time
points, and moderate to high (i.e., >.7) internal reliability (when reported). Additionally, no
more than one parent served as an informant on a given questionnaire for a given variable at any
particular time point in order to reduce dependencies among informants. This process was
repeated for each variable at each time point, resulting in a list of 77 candidate measures
spanning all variables.
Alphanumeric variable labels and data files corresponding to each candidate measure
were used to compute cross-sectional correlations among all candidate measures for a given
variable at a given time point. Any measure that demonstrated one or more non-significant
correlation was dropped. Remaining measures for each variable were then z-scored and averaged
to form a single composite. A full list of the measures, subscales, indices, and SECCYD variable
codes included in each composite variable, submitted as a part of my pre-registered analysis plan
for this chapter, can be found in Appendices B and C.
Research Question 1: Do longitudinal associations replicate?
Methods
At four years of age, children in the SECCYD completed a laboratory-based delay of
gratification task closely resembling the delay of gratification task used in Mischel, Shoda, &
Peake (1988). Wait times from the delay of gratification task across the delay period were not
normally distributed due to right-censoring of the distribution for those children who waited the
full delay period (amounting to 53% of the total number of responses), and delay of gratification
was therefore dummy-coded to indicate whether the child waited the full delay period during
preschool (1=Delayer, 0=Otherwise).
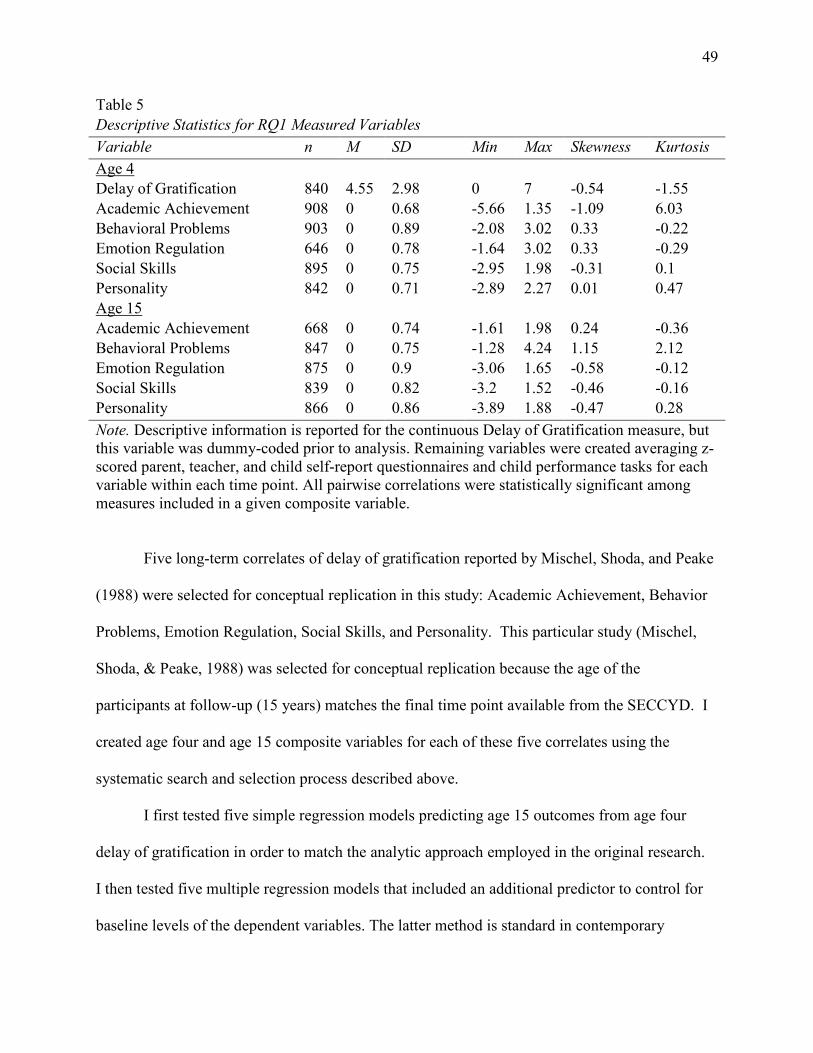
49
Table 5
Descriptive Statistics for RQ1 Measured Variables
Variable n M SD Min Max Skewness Kurtosis
Age 4
Delay of Gratification 840 4.55 2.98 0 7 -0.54 -1.55
Academic Achievement 908 0 0.68 -5.66 1.35 -1.09 6.03
Behavioral Problems 903 0 0.89 -2.08 3.02 0.33 -0.22
Emotion Regulation 646 0 0.78 -1.64 3.02 0.33 -0.29
Social Skills 895 0 0.75 -2.95 1.98 -0.31 0.1
Personality 842 0 0.71 -2.89 2.27 0.01 0.47
Age 15
Academic Achievement 668 0 0.74 -1.61 1.98 0.24 -0.36
Behavioral Problems 847 0 0.75 -1.28 4.24 1.15 2.12
Emotion Regulation 875 0 0.9 -3.06 1.65 -0.58 -0.12
Social Skills 839 0 0.82 -3.2 1.52 -0.46 -0.16
Personality 866 0 0.86 -3.89 1.88 -0.47 0.28
Note. Descriptive information is reported for the continuous Delay of Gratification measure, but this variable was dummy-coded prior to analysis. Remaining variables were created averaging z-scored parent, teacher, and child self-report questionnaires and child performance tasks for each variable within each time point. All pairwise correlations were statistically significant among measures included in a given composite variable.
Five long-term correlates of delay of gratification reported by Mischel, Shoda, and Peake
(1988) were selected for conceptual replication in this study: Academic Achievement, Behavior
Problems, Emotion Regulation, Social Skills, and Personality. This particular study (Mischel,
Shoda, & Peake, 1988) was selected for conceptual replication because the age of the
participants at follow-up (15 years) matches the final time point available from the SECCYD. I
created age four and age 15 composite variables for each of these five correlates using the
systematic search and selection process described above.
I first tested five simple regression models predicting age 15 outcomes from age four
delay of gratification in order to match the analytic approach employed in the original research.
I then tested five multiple regression models that included an additional predictor to control for
baseline levels of the dependent variables. The latter method is standard in contemporary

50
approaches to regression-based longitudinal data analysis, as it adjusts for cross-sectional
correlations and autocorrelations between the dependent and independent variables.
Results
Preliminary Analyses. Longitudinal correlations of each variable with itself were
computed as an initial assessment of the reliability and validity of the composite measures.
These correlations were generally large and statistically significant, ranging from r = 0.32 to
0.39, all p-values <.001, with the exception of the Personality variable, r = -.05, p = .151.
Results of analyses involving the Personality variable should therefore be interpreted with this
caveat in mind. Descriptive information for the composite variables are listed for each time
point in Table 5. Pairwise correlations with delay of gratification are listed for each variable at
each time point in Table 6.
Table 6
Correlations with Age 4 Delay of Gratification
Age 4 Age 15
r p r p
Academic Achievement .34 <.001 .14 <.001
Behavioral Problems -.09 .010 -.11 .002
Emotion Regulation .09 .022 -.01 .775
Social Skills .21 <.001 .09 .017
Personality -.13 <.001 .05 .211
Longitudinal Results. Results are summarized in Table 7. In a series of simple regression
models, individuals who delayed gratification at age four had significantly better Academic
Achievement (β = 0.270, F = 11.22), fewer Behavior Problems (β = -0.224, F = -9.38), and better
Social Skills (β = 0.017, F = 5.78) at age 15 relative to those who were classified as non-
delayers, all p-values <.05. Longitudinal correlations with Emotion Regulation and Personality
were not statistically distinguishable from zero (though the Personality composite variable may

51
be unreliable). Two of these three longitudinal associations were no longer significant in the
multiple regression models, leaving only the outcome of Behavior Problems of the five long-
term correlates tested.
Table 7 Predicting Adolescent Outcomes from Preschool Delay of Gratification
Simple regression Controlling for baseline
F df p F df p
Academic Achievement 0.270 11.22 1, 600 <.001 0.043 0.30 1, 597 .583 Behavioral Problems -0.224 9.38 1, 754 .002 -0.175 6.45 1, 741 .011 Emotion Regulation -0.021 0.08 1, 775 .775 -0.095 1.40 1, 543 .237 Social Skills 0.175 5.78 1, 746 .017 0.081 1.27 1, 729 .260 Personality 0.091 1.567 1, 768 .211 0.091 1.42 1, 696 .234
Note. β = standardized beta coefficients.
Discussion
Associations between preschool delay of gratification and adolescent outcomes replicated
across three of five adolescent outcomes tested using simple regression models, but two of those
three associations were no longer significant after controlling for baseline outcome levels. One
possible explanation for this pattern is that preschool delay of gratification does not explain any
unique variance in subsequent life outcomes over and above its reflection of the concurrently-
measured outcomes, and their predictive validity for subsequent levels. Still, preschool delay of
gratification did continue to significantly predict the outcome of Behavior Problems even after
the inclusion of baseline controls. RQ2 explores factors that might be driving this longitudinal
association.
Research Question 2: If so, are they better explained by trust or self-control?
The main goal of RQ2 is to evaluate whether trust or self-control better-accounts for
observed associations between delay of gratification and behavior problems. The outcome of
behavior problems was selected as the primary focus of this RQ in order to reduce the number of
β β
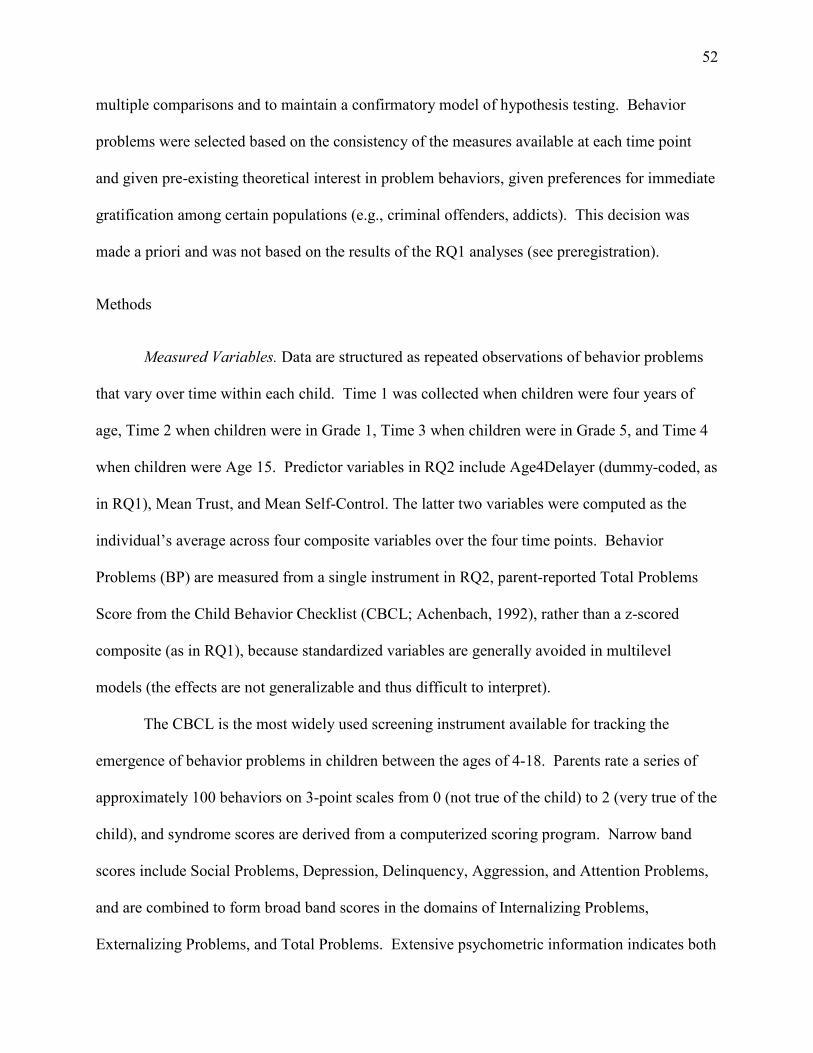
52
multiple comparisons and to maintain a confirmatory model of hypothesis testing. Behavior
problems were selected based on the consistency of the measures available at each time point
and given pre-existing theoretical interest in problem behaviors, given preferences for immediate
gratification among certain populations (e.g., criminal offenders, addicts). This decision was
made a priori and was not based on the results of the RQ1 analyses (see preregistration).
Methods
Measured Variables. Data are structured as repeated observations of behavior problems
that vary over time within each child. Time 1 was collected when children were four years of
age, Time 2 when children were in Grade 1, Time 3 when children were in Grade 5, and Time 4
when children were Age 15. Predictor variables in RQ2 include Age4Delayer (dummy-coded, as
in RQ1), Mean Trust, and Mean Self-Control. The latter two variables were computed as the
individual’s average across four composite variables over the four time points. Behavior
Problems (BP) are measured from a single instrument in RQ2, parent-reported Total Problems
Score from the Child Behavior Checklist (CBCL; Achenbach, 1992), rather than a z-scored
composite (as in RQ1), because standardized variables are generally avoided in multilevel
models (the effects are not generalizable and thus difficult to interpret).
The CBCL is the most widely used screening instrument available for tracking the
emergence of behavior problems in children between the ages of 4-18. Parents rate a series of
approximately 100 behaviors on 3-point scales from 0 (not true of the child) to 2 (very true of the
child), and syndrome scores are derived from a computerized scoring program. Narrow band
scores include Social Problems, Depression, Delinquency, Aggression, and Attention Problems,
and are combined to form broad band scores in the domains of Internalizing Problems,
Externalizing Problems, and Total Problems. Extensive psychometric information indicates both

53
narrow band and broad band scores on the CBCL are highly reliable, internally consistent, and
valid measures of the onset and continuation of problems in children.
Analysis Strategy. I used hierarchical models Two general approaches are used to fit
growth models to longitudinal data: multilevel (hierarchical) modeling (MLM or HLM; e.g.,
Bryk & Raudenbush, 1987; Raudenbush & Bryk, 2002) and structural equation modeling (SEM;
e.g., Bollen & Curran, 2006). Hierarchical growth curve models will be used for the present
study because children in the SECCYD study were not all observed at every occasion, causing
unbalanced data. The high degree of variability within and across children in terms of their
testing occasions also supports the use of a hierarchical approach.
Results
Model Specification. As is customary, I began with an empty means, random intercept
model in order to partition the variance across levels. The intraclass correlation computed from
this model, ICC = ���
������ = (65.18/(65.18+39.96)), indicates approximately 62% of the variance
in behavior problems exists between-persons (see Table 8), which can later be modeled as a
function of individual differences at Level-2.
Table 8
Random Intercept Model Results
Fixed Effect Coefficient SE z p
Mean Age 15 Behavior Problems, 52.57 .37 142.85 <.001
Mean Change, -0.55 .03 -21.40 <.001
Random Effect
Variance
Component
SE 95% CI
Age 15 Behavior Problems, r0i 65.18 3.49 58.68 72.40
Level-1 error, eti 39.96 1.10 37.88 42.17
β00
β10

54
Visual examination of the raw trajectories in BP over time indicate a systematically
decreasing, roughly linear fit to the data (see Figure 6). This decrease in BP with age was
unexpected, but may be an artifact of the specific items on the CBCL Total Problems measure,
which are perhaps more developmentally-appropriate for younger as opposed to older children
(causing their parents to endorse the items less frequently as their children age).
Figure 6. Estimated mean behavior problems over time.
I next compared a series of nested models using likelihood ratio tests to determine the
variance components to be included in my unconditional model for time. Results indicated
significant random intercept variance and significant random linear variance, supporting the use
of the following unconditional model:
Unconditional Random Linear Time
���� − 1: ��� = ��� + ��������� + ��� ��� ∼ ���, ��0, � !
���� − 2:��� = #�� + $�� $�� ∼ ���, ��0, %��!��� = #�� + $�� $�� ∼ ���, ��0, %��!
55
The fixed intercept in this model #̂�� = 52.58 represents the average BP level at age 15 across
children, and the fixed linear time slope #̂�� = −0.55 reflects the annual change in BP across the
study period (i.e., from ages four through 15). Importantly, the random effects parameters
indicate significant variability around these mean estimates. Importantly, the random effects
parameters indicate significant variability around these mean estimates (see Table 9).
Table 9
Unconditional Random Linear Time Model Results
Fixed Effect Coefficient SE z p
Mean Age 15 Behavior Problems, 52.58 .36 144.82 <.001
Mean Change, -0.55 .03 -17.99 <.001
Random Effect Variance SE 95% CI
Age 15 Behavior Problems, r0i 74.64 5.93 63.88 87.21
Mean Change, r1i 0.39 0.04 0.31 0.48
Level-1 error, eti 31.23 1.05 29.24 33.36
Consider the variance component associated with the slope on time: *+,����! = %�� = 0.39.
Although the fixed effect of time is significant, indicating systematic decreases in BP over time
on average across children, the range of plausible values extend from -1.79 to 0.69, ��*/ =
#̂�� ± 1.96�2%̂��! = 0.55 ± 1.96 ∗ 0.63. Thus, many children in the sample are not well-
represented by this mean estimate, and some are actually predicted to increase in behavior
problems over time. This can be seen from a plot of raw trajectories from a random subset of
participants, which are displayed along with the mean trajectory in Figure 7.
β00
β10
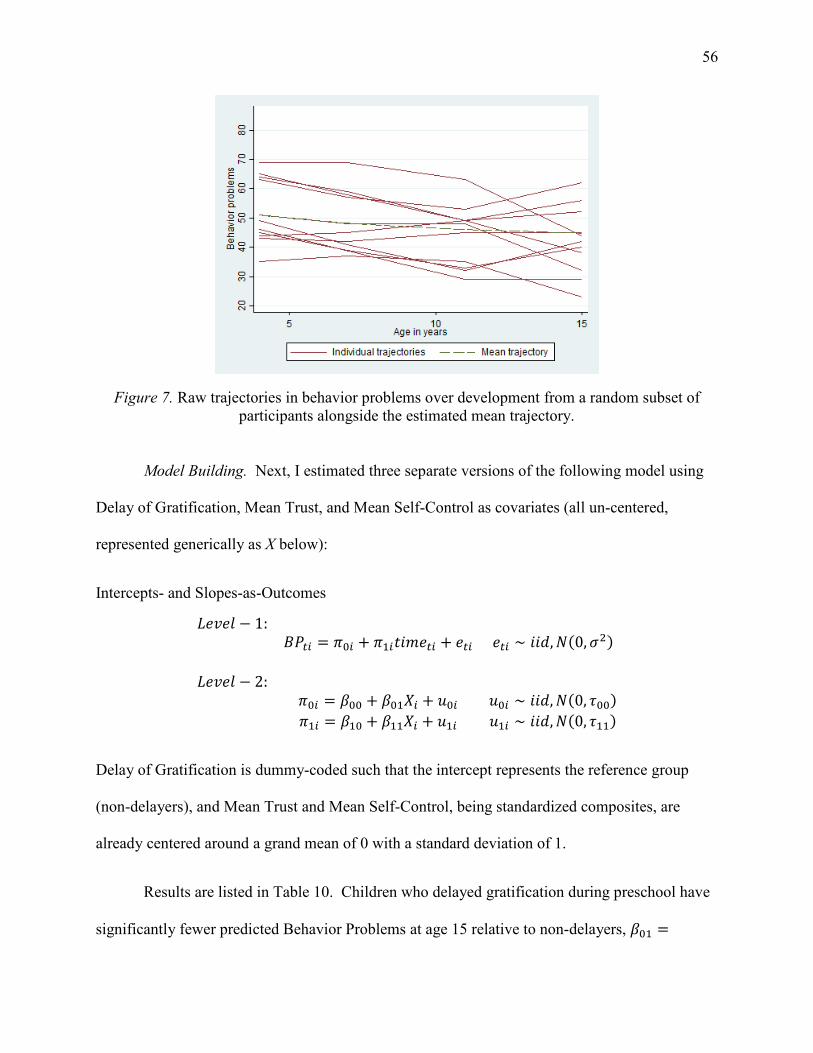
56
Figure 7. Raw trajectories in behavior problems over development from a random subset of participants alongside the estimated mean trajectory.
Model Building. Next, I estimated three separate versions of the following model using
Delay of Gratification, Mean Trust, and Mean Self-Control as covariates (all un-centered,
represented generically as X below):
Intercepts- and Slopes-as-Outcomes
���� − 1: ��� = ��� + ��������� + ��� ��� ∼ ���, ��0, � !
���� − 2:��� = #�� + #��4� + $�� $�� ∼ ���, ��0, %��!��� = #�� + #��4� + $�� $�� ∼ ���, ��0, %��!
Delay of Gratification is dummy-coded such that the intercept represents the reference group
(non-delayers), and Mean Trust and Mean Self-Control, being standardized composites, are
already centered around a grand mean of 0 with a standard deviation of 1.
Results are listed in Table 10. Children who delayed gratification during preschool have
significantly fewer predicted Behavior Problems at age 15 relative to non-delayers, #�� =

57
−1.74, 7 = −2.27, 8 = .023, but delaying gratification does not significantly differentiate
children in terms of their change in Behavior Problems over time, #�� = −0.01, 7 = −0.07, 8 =
.943. Having more Mean Trust is also associated with significantly fewer age 15 Behavior
Problems, #�� = −6.47, 7 = −14.95, 8 < .001, as well as marginally-significant additional
decrease to the already-decreasing time trend in Behavior Problems, #�� = −0.08, 7 = −1.89,
8 = .058. Results with Mean Self-Control are similar: each unit increase in Mean Self-Control
is associated with a predicted decrease of #�� = −5.00 in age 15 Behavior Problems, and an
additional decrease to the time trend in Behavior Problems of #�� = −0.11, 7 = −2.62, 8 =
.009. Though the fixed effects of Mean Trust and Mean Self-Control on the time slope are both
statistically significant by conventional standards, these variables explained less than 1% of the
overall variance in time and were therefore dropped from subsequent models, given that the
majority of the variance in Behavior Problems exists between individuals, and in an effort to
balance best fit against parsimony in model building.
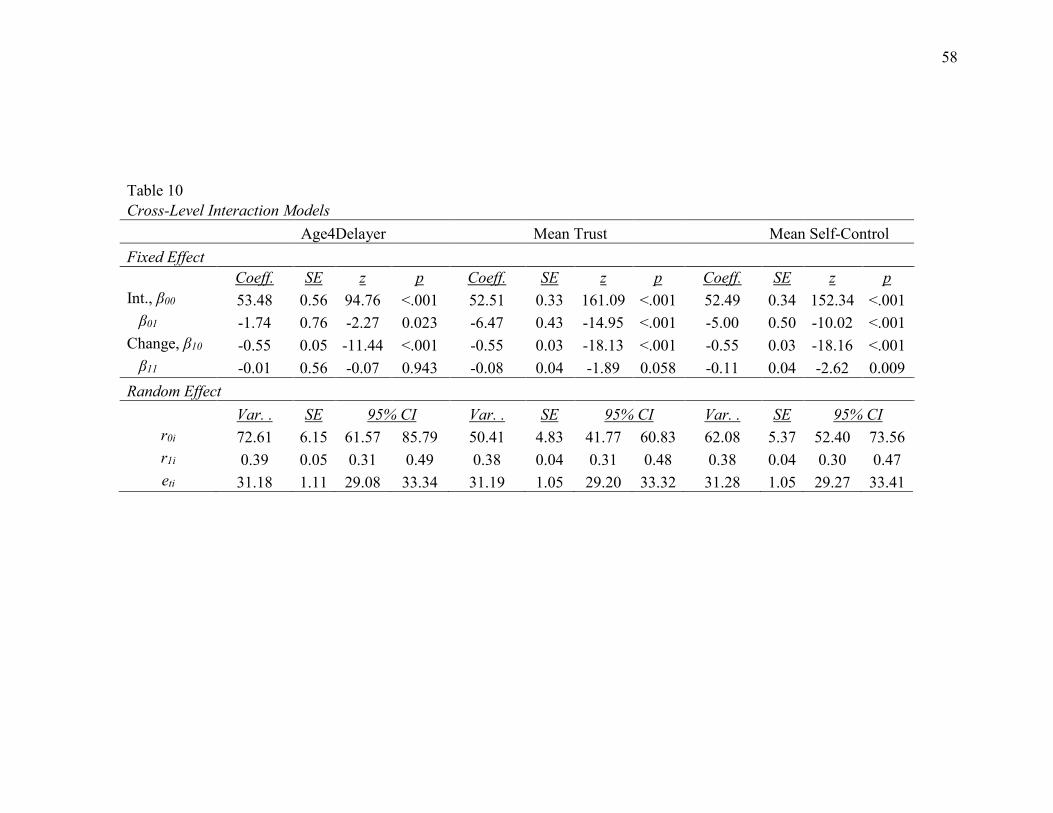
58
Table 10
Cross-Level Interaction Models
Age4Delayer Mean Trust Mean Self-Control
Fixed Effect
Coeff. SE z p Coeff. SE z p Coeff. SE z p
Int., β00 53.48 0.56 94.76 <.001 52.51 0.33 161.09 <.001 52.49 0.34 152.34 <.001
β01 -1.74 0.76 -2.27 0.023 -6.47 0.43 -14.95 <.001 -5.00 0.50 -10.02 <.001
Change, β10 -0.55 0.05 -11.44 <.001 -0.55 0.03 -18.13 <.001 -0.55 0.03 -18.16 <.001
β11 -0.01 0.56 -0.07 0.943 -0.08 0.04 -1.89 0.058 -0.11 0.04 -2.62 0.009
Random Effect
Var. . SE 95% CI Var. . SE 95% CI Var. . SE 95% CI
r0i 72.61 6.15 61.57 85.79 50.41 4.83 41.77 60.83 62.08 5.37 52.40 73.56
r1i 0.39 0.05 0.31 0.49 0.38 0.04 0.31 0.48 0.38 0.04 0.30 0.47
eti 31.18 1.11 29.08 33.34 31.19 1.05 29.20 33.32 31.28 1.05 29.27 33.41
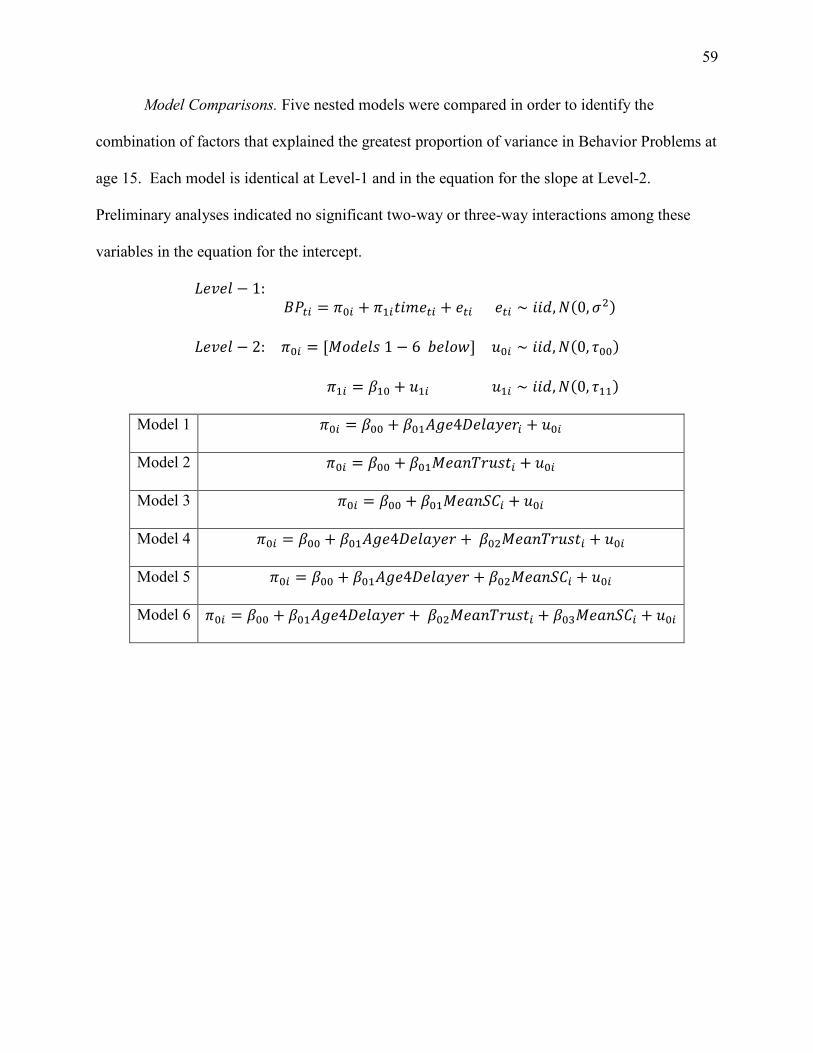
59
Model Comparisons. Five nested models were compared in order to identify the
combination of factors that explained the greatest proportion of variance in Behavior Problems at
age 15. Each model is identical at Level-1 and in the equation for the slope at Level-2.
Preliminary analyses indicated no significant two-way or three-way interactions among these
variables in the equation for the intercept.
���� − 1: ��� = ��� + ��������� + ��� ��� ∼ ���, ��0, � !
���� − 2: ��� = [;<��= 1 − 6 ?�<@] $�� ∼ ���, ��0, %��!
��� = #�� + $�� $�� ∼ ���, ��0, %��!
Model 1 ��� = #�� + #��BC�4D�+E�,� + $��
Model 2 ��� = #�� + #��;�+FG,$=�� + $��
Model 3 ��� = #�� + #��;�+FHI� + $��
Model 4 ��� = #�� + #��BC�4D�+E�, + #� ;�+FG,$=�� + $��
Model 5 ��� = #�� + #��BC�4D�+E�, + #� ;�+FHI� + $��
Model 6 ��� = #�� + #��BC�4D�+E�, + #� ;�+FG,$=�� + #�J;�+FHI� + $��

60
Table 11
Intercepts-As-Outcomes Models
Age4Delayer (Model 1) Mean Trust (Model 2) Mean SC (Model 3)
Fixed Effect
Coeff. SE z p Coeff. SE z p Coeff. SE z p
Int., β00 53.5 0.5 107.38 <.001 52.5 0.32 160.91 <.001 52.47 0.35 152.1 <.001
β01 -1.77 0.59 -3 0.003 -7.08 0.29 -24.58 <.001 -5.93 0.35 -16.75 <.001
Change, β10 -0.55 0.03 -17.02 <.001 -0.55 0.03 -18.06 <.001 -0.55 0.03 -18.03 <.001
Random Effect
Var. SE 95% CI Var. SE 95% CI Var. SE 95% CI
r0i 72.68 6.15 61.57 85.8 50.61 4.85 41.96 61.06 62.43 5.4 52.71 73.97
r1i 0.39 0.05 0.31 0.49 0.39 0.04 0.31 0.48 0.38 0.04 0.31 0.48
eti 31.18 1.11 29.08 33.44 31.19 1.05 29.2 33.32 31.28 1.05 29.28 33.42
Age4Delayer + Mean Trust (Model 4)
Age4Delayer + Mean SC (Model 5)
Age4Delayer + Mean Trust + Mean SC (Model 6)
Fixed Effect
Coeff. SE z p Coeff. SE z p Coeff. SE z p
Int., β00 52.68 0.43 122.09 <.001 52.45 0.47 112.69 <.001 52.32 0.43 122.4 <.001
Delayer -0.2 0.47 -0.43 0.667 0.15 0.53 0.28 0.779 0.43 0.46 0.92 0.359
Trust -7.18 0.32 -22.58 <.001
-5.87 0.36 -16.52 <.001
SC
-6.1 0.39 -15.67 <.001 -2.9 0.39 -7.43 <.001
Change, β10 -0.55 0.03 -17.03 <.001 -0.55 0.03 -17.02 <.001 -0.55 0.03 -17.03 <.001
Random Effect
Var. SE 95% CI Var. SE 95% CI Var. SE 95% CI
r0i 52.08 5.16 42.89 63.26 61.84 5.66 51.69 73.98 50.8 5.11 41.71 61.88
r1i 0.39 0.05 0.31 0.49 0.39 0.05 0.31 0.49 0.39 0.05 0.31 0.49
eti 31.13 1.11 29.03 33.38 31.2 1.11 29.1 33.46 31.14 1.1 29.05 33.39

61
Results are summarized in Table 11, and model comparisons appear in Table 12. Models
containing either Mean Trust or Mean Self-Control as covariates in addition to Delayer status at
age 4 are significantly more probable than the model containing Delayer status alone (Model 1).
Moreover, the inclusion of Delayer status in addition to either Mean Trust or Mean Self-Control
did not yield a significantly more probable model, both ps > .05. The full model containing
Delayer, Trust, and Self-Control explained the greatest proportion of variance (PVE),
%��K �LFM<F�! − %��K �;<��6!/%��K �LFM<F�! = .319, followed closely by Model 4 containing
only Mean Trust, PVE = 0.322.
Table 12
Summary of Model Comparisons
Proportion of Intercept Variance Explained
Model Variance Component PVE
Unconditional time 74.64
Model 1 72.61 .027
Model 2 50.61 .322
Model 3 62.43 .164
Model 4 52.08 .302
Model 5 61.84 .171
Model 6 50.80 .319
Likelihood ratio tests
Comparison χ2 p
Model 1 versus Unconditional 8.98 0.003
Model 2 versus Unconditional 466.34 <.001
Model 3 versus Unconditional 244.51 <.001
Model 1 versus Model 4 396.95 <.001
Model 1 versus Model 5 213.79 <.001
Model 2 versus Model 4 0.19 0.667
Model 3 versus Model 5 0.08 0.779
Model 4 versus Model 6 53.29 <.001
Model 5 versus Model 6 236.53 <.001

62
Discussion
This chapter provides important insights as to the factors that might be driving
previously-documented longitudinal associations between preschool delay of gratification and
subsequent life outcomes. Specifically, individual differences in children’s trust explain nearly
32% of the variance in where they end up in terms of behavior problems later on in adolescence,
even after accounting for their time trends in behavior problems across development. These
results support the hypothesis that trust may drive longitudinal correlations between preschool
delay of gratification and later life outcomes, over and above the contributions of self-control.
However, these results also support the importance of self-control. Individual differences in self-
control explain approximately 16% of the variance in adolescent behavior problems. Although
the explanatory contributions of self-control are comparatively less than those of trust, future
studies could test stronger causal models comparing the relative contributions of trust and self-
control over time using quasi-experimental methods that support causal inference from
longitudinal data, such as reversing time-lagged predictor and outcome variables (e.g.,
Duckworth, Tsukayama, & May, 2011).
Importantly, these models assume that all children show a linear change in behavior
problems over time, but this assumption is not supported by visual inspection of raw trajectories
or the wide range of plausible values for the estimated linear slopes. Future studies should
estimate alternative polynomial forms (e.g., quadtratic or piecewise-linear change models) and
model individual differences in the shape of change over time as a function of other individual
differences at Level-2.
63
CHAPTER 7: GENERAL DISCUSSION AND CONCLUSIONS
The goals of this dissertation were to investigate the conventional assumption that
“failures” to delay gratification reflect limitations in self-control, and to test the alternative
possibility that delay of gratification, and the life outcomes predicted by it, may be driven by
social trust. In Chapters 2 and 3, experimental manipulations of trust influenced willingness to
delay gratification in adults and children, supporting the hypothesis that trust can drive
willingness to delay even when self-control is limited (as in the case of preschoolers). Chapter 4
extended these ideas to an adult population with characteristic self-control limitations:
incarcerated criminal offenders. Although we did not obtain sufficient evidence to support a
mediation model of trust, the results indicate systematic differences in trust between criminals
and controls. Chapter 5 proposed a causal model of trust as an initial test of the hypothesis that
longitudinal correlations between delay of gratification and important life outcomes may be
driven by their shared reliance on trust, as opposed to self-control. This hypothesis was further
supported by the results of Chapter 6, in which some of the well-established long-term correlates
of delay of gratification disappeared in multiple regression models that included simple baseline
controls (RQ1), and the explanatory contributions of trust for understanding the development of
behavior problems across childhood were found to far exceed those of delay of gratification
(RQ2).
The results in Chapters 2-6 are consistent with some existing accounts of delay of
gratification that emphasize decision-making processes over and above abilities and limitations
in self-control. For example, some have proposed that “failures” to delay gratification can be
understood in terms of rational, utility-maximizing choices based on temporal predictions
(McGuire & Kable, 2012, 2013), environmental reliability (Kidd, Palmeri, & Aslin, 2013;

64
McGuire & Kable, 2012, 2013), or systemic conditions such as socioeconomic inequalities
(Jachimowicz et al., 2017; Pepper & Nettle, 2017). These accounts are compatible with the idea
that trust plays a fundamental role, but place relatively less emphasis on the social contingencies
of delaying gratification that motivate hypotheses around trust. The points of overlap and
distinction among these alternative theories should be explored to generate testable predictions
for evaluation in future research.
The failed replications of longitudinal associations in Chapter 6, many of which occurred
even when using naïve regression models without baseline covariates, are surprising given the
widespread popularity of the original studies on delay of gratification. The predictive validity of
the “marshmallow test” has been the topic of multiple best-selling popular-press books, articles
in the The New Yorker and The New York Times, TED talks, Radiolab episodes, and countless
home videos made by parents desperate to know whether their young child is destined for
success or doomed for failure. However, other longitudinal cohort studies resembling the
original studies in terms of the participant sample size and experimental procedures have also
failed to replicate the original effects. No significant associations were found between delay
time (raw number of seconds spent waiting in the delay of gratification task) at age four and
inhibitory control performance on a go/no-go task approximately ten years later among a sample
of 34 participants tested at the Barnard College nursery school (Eigsti et al., 2006), and although
delay time measured at the start of the school year was weakly associated with GPA measured at
the end of the school year among a sample of 56 Boston-area middle-schoolers (rh = 0.65, CI =
[0.41, 1.03]; Duckworth, Tsukayama, & Kirby, 2013, Study 1), this marginally significant
association only emerged after controlling for intelligence, which was not a covariate used in the
original Bing cohort studies.
65
These null and inconsistent longitudinal associations are somewhat less surprising when
considered in light of certain aspects of the original studies that limit their internal and external
validity, including high and likely non-random attrition and small-study effects. For example,
because the marshmallow test research was not initially designed to be longitudinal, only 95 of
the original 653 participants who had completed some version of the test at Stanford between
1968-1973 were successfully re-contacted for the first follow-up study (Mischel, Shoda, &
Peake, 1988). Attrition from the original sample is very likely non-random; socio-demographic
characteristics that cause one to move away or drop out of the study also predict later outcomes
(e.g., highly mobile low-SES children were unlikely to be successfully re-contacted and also at
greater risk for poor health/low wealth/more crime). As a result, estimates of longitudinal
associations are based on a selected sample, which limits the precision and external validity of
the results. In addition to concerns about selection and generalizability, the high rate of attrition
from the original study also raises the threat of small-study effects. Some of the most widely
cited longitudinal associations reported in studies on the original cohort were based on a very
small number of observations (e.g., n = 35 for associations with adolescent SAT scores, Shoda,
Mischel, & Peake, 1989; n = 26 for associations with adult emotional processing, Casey et al.,
2011). Regardless of the original sample size, with follow-up samples this small, estimated
effect sizes and significance levels have very wide confidence intervals and are highly unstable
(e.g., Lakens & Evers, 2014). This increases the possibility of obtaining a false-positive result or
an estimated association that is highly inflated.
Despite the alluring simplicity of the idea that one could “sit a child down, hand her a
marshmallow and 15 minutes later be able to predict her SAT score” (Bourne, 2014), the results
of this dissertation suggest that the seemingly simplistic nature of the predictive validity of delay

66
of gratification may belie the full complexity of potential implications for social and educational
policies. Specifically, repeated “failures” to delay gratification across child development may
reflect the stability of social forces that shape delay of gratification and life outcomes that are
typically attributed to self-control, as opposed to trait-level cognitive limitations and
competencies. If so, this highlights promising new directions for policies and programs that seek
to improve delay of gratification in children and adults who struggle. Few demonstrations of
large-scale trust interventions exist, but initial efforts have produced promising results.
Community-based trust interventions in both laboratory and field settings have led to
improvements in financial planning among low-income individuals (Jachimowicz, Chafik,
Munrat, Prabhu, & Weber, 2017), and several researchers have suggested additional directions
for such efforts, including attitude-change strategies that cultivate social belonging on college
campuses (Walton & Cohen, 2011) and expanding funding for community service programs and
incentivizing private employers to offer flexible work arrangements that facilitate family and
community engagement (given the importance of family and community ties for social trust;
Putnam, 2000).
Somewhat alarmingly, however, trends in cross-national survey data suggest that trust is
on the decline among Americans. Trust in others and confidence in institutions measured in
2012 were at historic lows among all generations, with trust in recent years lower than trust
during the Watergate scandal of the early 1970s, the 9/11 terrorist attacks in 2001, and the
financial crisis of the late 2000s (Putnam, 2000; Twenge, Campbell, & Carter, 2014). At the
same time, trust has become more relevant than ever for occupational, financial, and
interpersonal exchanges: for example, the so-called “sharing economy,” with companies like
Airbnb, Uber, and Tinder, has emerged as a legitimate economic and cultural force, and depends

67
critically on the willingness of strangers to trust one another. Thus, despite the increasing social
and economic relevance of trust and its potential applicability as a candidate for health, wealth,
and public safety interventions, trust may be in need of repair. Increased attention to research on
trust, delay of gratification, associated life outcomes could support the re-focusing of
intervention and prevention efforts in order to address the essential role of trust in individual and
public health and well-being.
In conclusion, although self-control is commonly assumed to be the clear intervention
target for policy-makers who seek to improve life outcomes in the domains of health, wealth, and
crime (e.g., Mischel et al., 2011; Moffitt et al., 2011), the studies in this dissertation highlight the
important and previously underemphasized role for social trust in predicting life outcomes.
Converging evidence for the importance of trust was obtained across multiple investigative
approaches, including experimental and quasi-experimental designs as well as quantitative
models of longitudinal data. Based on the conclusions drawn from this evidence, the viability of
social trust as a target for intervention efforts is an important future area of focus for policy-
makers who seek to improve health, wealth, and public safety.
References
Achenbach, T. M. (1991). Manual for the Child Behavior Checklist/4-18 and Profile. Burlington,
VT: University of Vermont, Department of Psychiatry.
Achterberg, M., Peper, J. S., van Duijvenvoorde, A. C., Mandl, R. C., & Crone, E. A. (2016).
Frontostriatal white matter integrity predicts development of delay of gratification: a
longitudinal study. Journal of Neuroscience, 36(6), 1954-1961.
Allport, D.A. (1987). Perspectives on perception and action. In H. Heuer & S.D.F (Eds.),
Perspectives on perception and action (pp. 395–419). Hillsdale, NJ: Erlbaum.

68
Anokhin, A. P., Golosheykin, S., Grant, J. D., & Heath, A. C. (2010). Heritability of delay
discounting in adolescence: A longitudinal twin study. Behavior Genetics, 41(2), 175–
183. doi:10.1007/s10519-010-9384-7
Arantes, J., Berg, M.E., Lawlor, D., & Grace, R.C. (2013). Offenders have higher delay-
discounting rates than non-offenders after controlling for differences in drug and alcohol
abuse. Legal and Criminological Psychology, 18 (2), 240–253. doi:10.1111/j.2044-
8333.2012.02052.x
Asendorpf, J.B., Conner, M., Fruyt, F.D.E., Houwer, J.A.N.D.E., Denissen, J.J.A. et al. (2013).
Recommendations for increasing replicability in psychology. European Journal of
Personality, 119, 108–119.
Ayduk, O., Mendoza-Denton, R., Mischel, W., Downey, G., Peake, P.K. et al. (2000).
Regulating the interpersonal self: strategic self-regulation for coping with rejection
sensitivity. Journal of Personality and Social Psychology, 79 (5), 776–92. Retrieved
from: http://www.ncbi.nlm.nih.gov/pubmed/11079241
Ayduk, O., Zayas, V., Downey, G., Cole, A.B., Shoda, Y. et al. (2008). Rejection sensitivity and
executive control: joint predictors of borderline personality features. Journal of Research
in Personality, 42 (1), 151–168. doi:10.1016/j.jrp.2007.04.002
Ballard, K., & Knutson, B. (2009). Dissociable neural representations of future reward
magnitude and delay during temporal discounting. NeuroImage, 45(1), 143–150.
doi:10.1016/j.neuroimage.2008.11.004
Banich, M. (2009). Executive function: the search for an integrated account. Current Directions
in Psychological Science, 18 (2), 89–94.

69
Baron, R. M., & Kenny, D. A. (1986). The moderator–mediator variable distinction in social
psychological research: Conceptual, strategic, and statistical considerations. Journal of
Personality and Social Psychology, 51(6), 1173.
Bates, D., & Sarkar, D. (2006). lme4: Linear mixed-effect models using S4 classes (R package
Version 0.995-2) [Computer software].
Beck, D.M., Schaefer, C., Pang, K., & Carlson, S.M. (2011). Executive function in preschool
children: test–retest reliability. Journal of Cognition and Development, 12 (2), 169–193.
doi:10.1080/15248372.2011.563485
Benzion, U., Rapoport, A., & Yagil, J. (1989) Discount rates inferred from decisions: An
experimental study. Management Science, 35(3), 270-284. doi:10.1287/mnsc.35.3.270
Bernier, A., Carlson, S. M., Deschênes, M., & Matte-Gagné, C. (2011). Social factors in the
development of early executive functioning: a closer look at the caregiving environment.
Developmental Science, 15(1), 12–24. doi:10.1111/j.1467-7687.2011.01093.x
Bickel, W. K., Pitcock, J. A., Yi, R., & Angtuaco, E. J. C. (2009). Congruence of BOLD
response across intertemporal choice conditions: Fictive and real money gains and losses.
Journal of Neuroscience, 29(27), 8839–8846. doi:10.1523/JNEUROSCI.5319-08.2009
Bollen, K. A., & Curran, P. J. (2006). Latent Curve Models: A Structural Equation Perspective
(Vol. 467). John Wiley & Sons.
Bourne, M. (2014, January 10). We didn't eat the marshmallow. The marshmallow ate us. The
New York Times. Retrieved from https://www.nytimes.com/
Braver, T.S., & Cohen, J.D. (2001). Working memory, cognitive control, and the prefrontal
cortex: computational and empirical studies. Cognitive Processing, 2, 25–55
70
Broadbent, E., Kumar, V., Li, X., Sollers, J., Stafford, R.Q. et al. (2013). Robots with display
screens: a robot with a more humanlike face display is perceived to have more mind and
a better personality. PLOS ONE, 8 (8):e72589. doi:10.1371/journal.pone.0072589.
pmid:24015263
Bronfenbrenner, U., & Morris, P. (1998). The ecology of developmental processes. In Handbook
of Child Psychology, ed. W Damon, R Lerner, pp. 992–1028. New York: Wiley.
Bryk, A. S., & Raudenbush, S. W. (1987). Application of hierarchical linear models to assessing
change. Psychological Bulletin, 101(1), 147.
Bucholz, S., & Latorre, J. (2011). Crowdsourcing preference tests and how to detect cheating.
Proceedings of Interspeech2011, 3053-3056.
Carlson, S.A. (2005). Developmentally sensitive measures of executive function in preschool
children. Developmental Neuropsychology, 28 (2), 595–616
Casey, B. J., Somerville, L. H., Gotlib, I. H., Ayduk, O., Franklin, N. T., Askren, M. K., …
Shoda, Y. (2011). Behavioral and neural correlates of delay of gratification 40 years later.
Proceedings of the National Academy of Sciences, 108(36), 14998–15003.
doi:10.1073/pnas.1108561108
Cherek, D. R., Moeller, F. G., Dougherty, D. M., & Rhoades, H. (1997). Studies of violent and
nonviolent male parolees: II. Laboratory and psychometric measurements of impulsivity.
Biological Psychiatry, 41(5), 523-529.
Delgado, M. R., Frank, R. H., & Phelps, E. A. (2005). Perceptions of moral character modulate
the neural systems of reward during the trust game. Nature Neuroscience, 8(11), 1611–
1618. doi:10.1038/nn1575

71
DeSteno, D., Breazeal, C., Frank, R.H., Pizarro, D., Baumann, J. et al. (2012). Detecting the
trustworthiness of novel partners in economic exchange. Psychological Science, 23 (12),
1549–1556. doi: 10.1177/0956797612448793
de Visser, E. & Krueger, F. (2012). Interpersonal trust as a dynamic belief? In F. Krueger & J.
Grafman (Eds.), The Neural Basis of Human Belief Systems. Hove, England: Psychology
Press.
Diamond, A., & Lee, K. (2011). Interventions shown to aid executive function development in
children 4 to 12 years old. Science, 333 (6045), 959–964. doi:10.1126/science.1204529
Duckworth, A.L., & Kern, M.L. (2011). A meta-analysis of the convergent validity of self-
control measures. Journal of Research in Personality. 45, 259–268.
Duckworth, A.L., Tsukayama, E., & Kirby, T.A. (2013). Is it really self-control? Examining the
predictive power of the delay of gratification task. Personality & Social Psychology
Bulletin, 39 (7), 843–855. doi:10.1177/0146167213482589
Duckworth, A. L., Tsukayama, E., & May, H. (2011). Establishing Causality Using Longitudinal
Hierarchical Linear Modeling: An Illustration Predicting Achievement From Self-
Control. Social Psychological and Personality Science, 1(4), 311–317.
http://doi.org/10.1177/1948550609359707.Establishing
Dunn, J. E., & Schweitzer, M. E. (2005). Feeling and believing: The influence of emotion on
trust. Journal of Personality and Social Psychology, 88, 736-748.
Eigsti, I.M., Zayas, V., Mischel, W., Shoda, Y., Ayduk, O. et al. (2006). Predicting cognitive
control from preschool to late adolescence and young adulthood. Psychological Science,
17 (6), 478–484. doi:10.1111/j.1467-9280.2006.01732.x
72
Epley, N., Akalis, S., Waytz, A., & Cacioppo, J.T. (2008). Creating social connection through
inferential reproduction: loneliness and perceived agency in gadgets, gods, and
greyhounds. Psychological Science, 19, 114–120.
Evans, A. M., & Revelle, W. (2008). Survey and behavioral measurements of interpersonal trust.
Journal of Research in Personality, 42(6), 1585–1593. doi:10.1016/j.jrp.2008.07.011
Fareri, D. S., Chang, L. J. & Delgado, M. R. (2012). Effects of direct social experience on trust
decisions and neural reward circuitry. Frontiers in Neurosciences. 1–17.
doi:10.3389/fnins.2012.00148/abstract
Figner, B., Knoch, D., Johnson, E.J., Krosch, A.R., Lisanby, S.H. et al. (2010). Lateral prefrontal
cortex and self-control in intertemporal choice. Nature Neuroscience, 13 (5), 538–539.
doi:10.1038/nn.2516
Fiore, S.M., Wiltshire, T.J., Lobato, E.J.C., Jentsch, F.G., Huang, W.H. et al. (2013). Toward
understanding social cues and signals in human–robot interaction: effects of robot gaze
and proxemic behavior. Frontiers in Psychology, 4, 859.
http://doi.org/10.3389/fpsyg.2013.00859
Frederick, S., Loewenstein, G., & O'Donoghue, T. (2002). Time discounting and time
preference: a critical review. Journal of Economic Literature, 40, 351-401.
Gomez, R., & McLaren, S. (1997). The effects of reward and punishment on response
disinhibition, moods, heart rate and skin conductance level during instrumental learning.
Personality and Individual Differences, 23 (2), 305–316. doi:10.1016/S0191-
8869(97)00031-7
Harris, A. C., & Madden, G. J. (2002). Delay discounting and performance on the prisoner's
dilemma game. Psychological Record, 52(4), 429–440.
73
Harbaugh, W.T., Krause, K., Liday, S.G., & Vesterlund, L. (2003). Trust in children. In E.
Ostrom & J. Walker (Eds.), Trust, reciprocity and gains from association:
Interdisciplinary lessons from experimental research (pp. 143–154). New York: Russell
Sage Foundation.
Harris, A.C., & Madden, G.J. (2002). Delay discounting and performance on the prisoner’s
dilemma game. The Psychological Record, 52 (4), 429–440. Retrieved from:
http://cat.inist.fr/?aModele=afficheN&cpsidt=13994923
Heider, F., & Simmel, M. (1944). An experimental study of apparent behavior. American
Journal of Psychology, 57, 243–259.
Hofmann, W., Friese, M., & Roefs, A. (2009). Three ways to resist temptation: the independent
contributions of executive attention, inhibitory control, and affect regulation to the
impulse control of eating behavior. Journal of Experimental Social Psychology, 45 (2),
431–435. doi:10.1016/j.jesp.2008.09.013
Hoffman, W.F., Moore, M., Templin, R., McFarland, B., Hitzemann, R.J. et al. (2006).
Neuropsychological function and delay discounting in methamphetamine-dependent
individuals. Psychopharmacology, 188, 162–170.
Hongwanishkul, D., Happaney, K. R., Lee, W. S. C., & Zelazo, P. D. (2005). Assessment of hot
and cool executive function in young children: age-related changes and individual
differences. Developmental Neuropsychology, 28(2), 617–644.
doi:10.1207/s15326942dn2802_4
Ifcher, J., & Zarghamee, H. (2011). Happiness and time preference: the effect of positive affect
in a random-assignment experiment. American Economic Review, 101 (7), 3109–3129.

74
Imber, S. (1973). Relationship of trust to academic performance. Journal of Personality and
Social Psychology, 28, 145–150
Ifcher, J., & Zarghamee, H. (2011). Happiness and time preference: The effect of positive affect
in a random-assignment experiment. American Economic Review, 101(7),
Jachimowicz, J. M., Chafik, S., Munrat, S., Prabhu, J. C., & Weber, E. U. (2017). Community
trust reduces myopic decisions of low-income individuals. Proceedings of the National
Academy of Sciences, (April), 201617395. http://doi.org/10.1073/PNAS.1617395114
Jaswal, V.K., Croft, A.C., Setia, A.R., & Cole, C.A. (2010). Young children have a specific,
highly robust bias to trust testimony. Psychological Science, 21 (10), 1541–1547.
Johnson, M.W., & Bickel, W.K. (2002). Within-subject comparison of real and hypothetical
money rewards in delay discounting. Journal of the Experimental Analysis of Behavior.
77, 129–146.
Johnson, M. W., & Bickel, W. K. (2008) An algorithm for identifying nonsystematic delay-
discounting data. Experimental and Clinical Psychomaracology, 16(3), 264-274. doi:
10.1037/1064-1297.16.3.264
Johnson, M. W., Bickel, W. K., & Baker, F. (2007). Moderate drug use and delay discounting: a
comparison of heavy, light, and never smokers. Experimental and Clinical
Psychopharmacology, 15(2), 187–194. doi:10.1037/1064-1297.15.2.187
Johnston, A.M., Mills, C.M., & Landrum, A.R. (2015). How do children weigh competence and
benevolence when deciding whom to trust? Cognition, 144, 76–90.
Kawachi, I. (1997). Long live community: social capital as public health. American Prospect, 35,
56–59.
75
Kawachi, I., Kennedy, B., & Glass, R. (1999). Social capital and self-rated health: a contextual
analysis. American Journal of Public Health, 8, 1187–1193.
Kawachi, I., Kennedy, B. P., & Wilkinson, R. G. (1999). Crime: social disorganization and
relative deprivation. Social Science & Medicine, 48(6), 719-731.
Kennedy, B. P., Kawachi, I., Prothrow-Stith, D., Lochner, K., & Gupta, V. (1998). Social capital,
income inequality, and firearm violent crime. Social Science & Medicine, 47(1), 7-17.
Kidd, C., Palmeri, H., & Aslin, R.N. (2013). Rational snacking: young children’s decision-
making on the marshmallow task is moderated by beliefs about environmental reliability.
Cognition, 126 (1), 109–114. doi:10.1016/j.cognition.2012.08.004
King-Casas, B., Tomlin, D., Anen, C., Camerer, C.F., Quartz, S.R., Montague, P.R. (2005).
Getting to know you: reputation and trust in a two-person economic exchange. Science,
308, 78–83.
Kirby, K. N., & Maraković, N. N. (1996). Delay-discounting probabilistic rewards: Rates
decrease as amounts increase. Psychonomic Bulletin & Review, 3(1), 100–104.
Koenig, M.A., Clement, F., & Harris, P.L. (2004). Trust in testimony: children’s use of true and
false statements. Psychological Science, 15 (10), 694–698
Kosfeld, M., Heinrichs, M., Zak, P. J., Fischbacher, U., & Fehr, E. (2005). Oxytocin increases
trust in humans. Nature, 435, 673-676.
Krueger, F. (2012). Oxytocin receptor genetic variation promotes human trust behavior.
Frontiers in Human Neuroscience, 1–9. doi:10.3389/fnhum.2012.00004/abstract
Lakens, D., & Evers, E. R. (2014). Sailing from the seas of chaos into the corridor of stability:
Practical recommendations to increase the informational value of studies. Perspectives on
Psychological Science, 9(3), 278-292.
76
Landrum, A.R., Mills, C.M., & Johnston, A.M. (2013). When do children trust the expert?
Benevolence information influences children’s trust more than expertise. Developmental
Science, 16 (4), 622–638
Lane, J.D., Wellman, H.M., & Gelman, S.A. (2013). Informants’ traits weigh heavily in young
children’s trust in testimony and in their epistemic inferences. Child Development, 84 (4),
1253–1268.
Laubrock, J., Engbert, R., Rolfs, M., & Kliegl, R. (2007). Microsaccades are an index of covert
attention: commentary on Horowitz, Fine, Fencsik, Yurgenson, and Wolfe (2007).
Psychological Science, 18(4), 364–6– discussion 367–8. doi:10.1111/j.1467-
9280.2007.01904.x
Lee, J. H. (2010). Crowdsourcing music similarity judgments using mechanical turk.
Proceedings of the International Conference of Music Information Revival, 183-188.
Lee, C. A., Derefinko, K. J., Milich, R., Lynam, D. R., & DeWall, C. N. (2017). Longitudinal
and reciprocal relations between delay discounting and crime. Personality and Individual
Differences, 111, 193-198.
Lerner, J.S., Li, Y., & Weber, E.U. (2013). The financial costs of sadness. Psychological
Science, 24 (1), 72–79. doi:10.1177/0956797612450302
Li, Y., Pickles, A., & Savage, M. (2005). Social capital and social trust in Britain. European
Sociological Review, 21 (2), 109–123. doi:10.1093/esr/jci007
Luhmann, C. (2009). Temporal decision-making: insights from cognitive neuroscience.
Frontiers in Behavioral Neuroscience, 3. doi:10.3389/neuro.08.039.2009
Madden G. J., Begotka A. M., Raiff B. R., Kastern L. L. (2003). Delay discounting of real and
hypothetical rewards. Experimental Clinical Psychopharmacology, 11, 139-145.
77
Mahrer, A. R. (1956). The role of expectancy in delayed reinforcement. Journal of Experimental
Psychology, 52(2), 101–106.
Mascaro, O., & Sperber, D. (2009). The moral , epistemic , and mindreading components of
children’s vigilance towards deception. Cognition, 112 (3), 367–380.
doi:10.1016/j.cognition.2009.05.012
McCabe, K., Houser, D., Ryan, L., Smith, V., & Trouard, T. (2001). A functional imaging study
of cooperation in two-person reciprocal exchange. Proceedings National Academy
Science United States of America, 98, 11832–11835.
McClure, S.M., Laibson, D.I., Loewenstein, G., & Cohen, J.D. (2004). Separate neural systems
value immediate and delayed monetary rewards. Science, 306 (5695), 503–507.
doi:10.1126/science.1100907
McGuire, J.T., & Kable, J.W. (2013). Rational temporal predictions can underlie apparent
failures to delay gratification. Psychological Review, 120 (2), 395–410.
doi:10.1037/a0031910
Meldrum, R. C., & Hay, C. (2012). Do peers matter in the development of self-control? Evidence
from a longitudinal study of youth. Journal of Youth and Adolescence, 41(6), 691-703.
Meyer, M. L., Spunt, R. P., Berkman, E. T., Taylor, S. E., & Lieberman, M. D. (2012). Evidence
for social working memory from a parametric functional MRI study. Proceedings of the
National Academy of Sciences, 109(6), 1883–1888. doi:10.1073/pnas.1121077109/-
/DCSupplemental
Michaelson, L.E., de la Vega, A., Chatham, C.H., & Munakata, Y. (2013). Delaying gratification
depends on social trust. Frontiers in Psychology, 4, 355. doi:10.3389/fpsyg.2013.00355

78
Michaelson, L. E., & Munakata, Y. (2016). Trust matters: Seeing how an adult treats another
person influences preschoolers’ willingness to delay gratification. Developmental
Science, 19(6), 1011–1019. http://doi.org/10.1111/desc.12388
Miller, E.K., & Cohen, J.D. (2001). An integrative theory of prefrontal cortex function. Annual
Review of Neuroscience, 24, 167–202. doi:10.1146/annurev.neuro.24.1.16
Mills, C.M. (2013). Knowing when to doubt: developing a critical stance when learning from
others. Developmental Psychology, 49 (3), 404–418.
Mischel, W. (1958). Preference for delayed reinforcement: an experimental study of a cultural
observation. Journal of Abnormal Psychology, 56 (1), 57–61. doi:10.1037/h0041895
Mischel, W. (1961a). Father-absence and delay of gratification. Journal of Abnormal and Social
Psychology, 63 (1), 116–124.
Mischel, W. (1961b). Preference for delayed reinforcement and social responsibility. Journal of
Abnormal and Social Psychology, 62, 1–7. Retrieved from
http://www.ncbi.nlm.nih.gov/pubmed/13771261
Mischel, W., & Ayduk, O. (2004). Willpower in a cognitive–affective processing system: the
dynamics of delay of gratification. In K.D. Vohs & R.F. Baumeister (Eds.), Handbook of
self-regulation: Reseach, theory, and applications (pp. 99–129). New York: Guilford.
Mischel, W., Ayduk, O., Berman, M. G., Casey, B. J., Gotlib, I. H., Jonides, J., ... & Shoda, Y.
(2011). ‘Willpower’over the life span: decomposing self-regulation. Social Cognitive and
Affective Neuroscience, 6(2), 252-256.
Mischel, W., & Ebbesen, E. B. (1970). Attention in delay of gratification. Journal of Personality
and Social Psychology, 16(2), 329-337.

79
Mischel, W., Ebbesen, E.B., & Zeiss, A.R. (1972). Cognitive and attentional mechanisms in
delay of gratification. Journal of Personality and Social Psychology, 21 (2), 204–218.
Retrieved from: http://www.ncbi.nlm.nih.gov/pubmed/5010404
Miscbel, W., & Gilligan, C. (1964). Delay of gratification, motivation for the prohibited
gratification, and resistance to temptation. Journal of Abnormal and Social Psychology,
69, 411– 417.
Mischel, W., Shoda, Y., & Peake, P.K. (1988). The nature of adolescent competencies predicted
by preschool delay of gratification. Journal of Personality and Social Psychology, 54 (4),
687–696. Retrieved from: http://www.ncbi.nlm.nih.gov/pubmed/3367285
Mischel, W., Shoda, Y., & Rodriguez, M.I. (1989). Delay of gratification in children. Science,
244 (4907), 933–938. doi:10.1126/science.2658056
Moffitt, T. E., Arseneault, L., Belsky, D., Dickson, N., Hancox, R. J., Harrington, H., ... & Sears,
M. R. (2011). A gradient of childhood self-control predicts health, wealth, and public
safety. Proceedings of the National Academy of Sciences, 108(7), 2693-2698.
Nass, C., & Moon, Y. (2000). Machines and mindlessness: social responses to computers.
Journal of Social Issues, 56 (1), 81–103. doi:10.1111/0022-4537.00153
Nederkoorn, C., Braet, C., Van Eijs, Y., Tanghe, A., & Jansen, A. (2006). Why obese children
cannot resist food: the role of impulsivity. Eating Behaviors, 7 (4), 315–322.
doi:10.1016/j.eatbeh.2005.11.005
Newman, J. P., Kosson, D. S., & Patterson, C. M. (1992). Delay of gratification in psychopathic
and nonpsychopathic offenders. Journal of Abnormal Psychology, 101(4), 630-636.
Oosterhof, N. N., & Todorov, A. (2008). The functional basis of face evaluation. Proceedings of
the National Academy of Sciences, 105(32), 11087–11092. doi:10.1073/pnas.0805664105
80
Oosterhof, N. N., & Todorov, A. (2009). Shared perceptual basis of emotional expressions and
trustworthiness impressions from faces. Emotion, 9, 128-133.
Pepper, G. V., & Nettle, D. (2017). The behavioural constellation of deprivation: causes and
consequences. Behavioral and Brain Sciences, 1-72.
Peters, J., & Büchel, C. (2011). The neural mechanisms of inter-temporal decision-making:
understanding variability. Trends in Cognitive Sciences, 15(5), 227–239.
doi:10.1016/j.tics.2011.03.002
Patterson, O. (1999). Liberty against the democratic state: on the historical and contemporary
sources of American distrust. In M.E. Warren (Ed.), Democracy and trust (pp. 151–207).
Cambridge: Cambridge University Press.
Paxton, P. (2007). Not all association memberships increase trust: a model of generalized trust in
thirty-one countries. Social Forces, 86, 47–76.
Pothmann, R., & Goepel, R. (1984). Comparison of the visual analog scale (YAS) and a smiley
analog scale (SAS) for the evaluation of pain in children. In Proceedings: Pain World
Congress (Vol. 28). 31 August–5 September, Seattle, WA. New York: Raven Press.
Putnam, R. D. (2000). Bowling alone: America’s declining social capital. In Culture and Politics
(pp. 223-234). Palgrave Macmillan US.
Pyone, J.S., & Isen, A.M. (2011). Positive affect, intertemporal choice, and levels of thinking:
increasing consumers’ willingness to wait. Journal of Marketing Research, 48, 532–543.
R Development Core Team (2006). R: A language and environment for statistical computing.
Retrieved 16 July 2014, from: http://soer.justice.tas.gov.au/2009/source/1780/index.php
Raudenbush, S. W., & Bryk, A. S. (2002). Hierarchical Linear Models: Applications and Data
Analysis Methods (Vol. 1). Sage.

81
Raver, C. C., & Zigler, E. F. (1997). Social competence: An untapped dimension in evaluating
Head Start’s success. Early Childhood Research Quarterly, 12, 363–385.
Reeves, B., & Nass, C. (1996). The media equation: How people treat computers, television, and
new media like real people and places. Cambridge: CSLI Publications and Cambridge
University Press.
Reynolds, B., Karraker, K., Horn, K., & Richards, J. B. (2003). Delay and probability
discounting as related to different stages of adolescent smoking and non-smoking.
Behavioural Processes, 64, 333–344.
Richards, J. B., Zhang, L., Mitchell, S. H., & De Wit, H. (1999). Delay or probability
discounting in a model of impulsive behavior: effect of alcohol. Journal of the
Experimental Analysis of Behavior, 71(2), 121.
Righetti, F., & Finkenauer, C. (2011). If you are able to control yourself , I will trust you: the
role of perceived self-control in interpersonal trust. Journal of Personality and Social
Psychology, 100 (5), 874–876. doi:10.1037/a0021827
Robinson, S.L. (1996). Trust and breach of the psychological contract. Administrative Science
Quarterly, 41, 574–599.
Rodriguez, M.L., Mischel, W., & Shoda, Y. (1989). Cognitive person variables in the delay of
gratification of older children at risk. Journal of Personality and Social Psychology, 57
(2), 358–367. Retrieved from: http://www.ncbi.nlm.nih.gov/pubmed/2760808
Rotter, J.B. (1971). Generalized expectancies for interpersonal trust. American Psychologist, 26,
443–452.
Ryff, C., Almeida, D. M., Ayanian, J. S., Carr, D. S., Cleary, P. D., Coe, C., et al. (2004-2006).
National Survey of Midlife Development in the United States (MIDUS II), 2004-2006.
82
ICPSR04652-V6. Ann Arbor, MI: Inter-university Consortium for Political and Social
Research.
Sagarin, B.J., Ambler, J.K., & Lee, E.M. (2014). An ethical approach to peeking at data.
Perspectives on Psychological Science, 9 (3), 293–304. doi:10.1177/1745691614528214
Sakaluk, J. K. (2016). Exploring small, confirming big. Journal of Experimental Social
Psychology, 1–33.
Sampson, R. J., Raudenbush, S. W., & Earls, F. (1997). Neighborhoods and violent crime: A
multilevel study of collective efficacy. Science, 277(5328), 918-924.
Sanfey, A. G. (2007). Social decision-making: Insights from game theory and neuroscience.
Science, 318(5850), 598–602. doi:10.1126/science.1142996
Schlam, T. R., Wilson, N. L., Shoda, Y., Mischel, W., & Ayduk, O. (2013). Preschoolers' delay
of gratification predicts their body mass 30 years later. The Journal of Pediatrics, 162(1),
90-93.
Schneider, S., Peters, J., Peth, J.M., & Büchel, C. (2014). Parental inconsistency, impulsive
choice and neural value representations in healthy adolescents. Translational Psychiatry,
4, e382. doi:10.1038/tp.2014.20
Seeyave, D.M., Coleman, S., Appugliese, D., Corwyn, R.F., Bradley, R.H. et al. (2009). Ability
to delay gratification at age 4 years and risk of overweight at age 11 years. Archives of
Pediatrics and Adolescent Medicine, 163, 303–308. doi:10.1001/archpediatrics.2009.12
Shoda, Y., Mischel, W., & Peake, P.K. (1990). Predicting adolescent cognitive and self-
regulatory competencies from preschool delay of gratification: identifying diagnostic
conditions. Developmental Psychology, 26 (6), 978–986.

83
Stevens, J. R., Rosati, A. G., Heilbronner, S. R., & Mühlhoff, N. (2011). Waiting for grapes:
expectancy and delayed gratification in bonobos. International Journal of Comparative
Psychology, 24(1).
Sutter, M., & Kocher, M.G. (2007). Trust and trustworthiness across different age groups.
Games and Economic Behavior, 59 (2), 364–382. doi:10.1016/j.geb.2006.07.006
Todorov, A., Pakrashi, M., & Oosterhof, N. N. (2009). Evaluating faces on trustworthiness after
minimal time exposure. Social Cognition, 27, 813-833.
Twenge, J. M., Campbell, W. K., & Carter, N. T. (2014). Declines in trust in others and
confidence in institutions among American adults and late adolescents, 1972–2012.
Psychological Science, 25(10), 1914-1923.
Vaish, A., Carpenter, M., & Tomasello, M. (2010). Young children selectively avoid helping
people with harmful intentions. Child Development, 81 (6), 1661–1669.
doi:10.1111/j.1467-8624.2010.01500.x
Van den Bos, W., van Dijk, E., & Crone, E.A. (2011). Learning whom to trust in repeated social
interactions: a developmental perspective. Group Processes & Intergroup Relations, 15
(2), 243–256. doi:10.1177/1368430211418698
Vanderbilt, K.E., Liu, D., & Heyman, G.D. (2011). The development of distrust. Child
Development, 82 (5), 1372–1380.
Vansteenkiste, M., & Deci, E.L. (2003). Competitively contingent rewards and intrinsic
motivation: can losers remain motivated? Motivation and Emotion, 27 (4), 273–299.
Walton, G. M., & Cohen, G. L. (2011). A brief social-belonging intervention improves academic
and health outcomes of minority students. Science, 331(6023), 1447-1451.

84
Wentzel, K.R. (1991). Relations between social competence and academic achievement in early
adolescence. Child Development, 62 (5), 1066–1078. Retrieved from:
http://www.ncbi.nlm.nih.gov/pubmed/1756656
Wittmann, M., & Paulus, M. P. (2008). Decision making, impulsivity and time perception.
Trends in Cognitive Sciences, 12(1), 7–12. doi:10.1016/j.tics.2007.10.004
Wright, T.L., & Kirimani, A. (1977). Interpersonal trust, trustworthiness and shoplifting in high
school. Psychological Reports, 41, 1165–1166.
Wulfert, E., Block, J. A., Santa Ana, E., Rodriguez, M. L., & Colsman, M. (2002). Delay of
gratification: impulsive choices and problem behaviors in early and late adolescence.
Journal of Personality, 70(4), 533–552.
Zelazo, P.D., Craik, F.I.M., & Booth, L. (2004). Executive function across the life span. Acta
Psychologica, 115 (2–3), 167–183. doi:10.1016/j.actpsy.2003.12.00
Zauberman, G., & Lynch, J. G., Jr. (2005). Resource slack and propensity to discount delayed
investments of time versus money. Journal of Experimental Psychology. General, 134(1), 23.

85
Appendix A: Questionnaire items used in Chapter 5
Data were collected during a 30-minute phone interview and with self-administered
questionnaires (SAQs).
Physical Health
1. BMI (SAQ)
[Calculated with self-reported weight, height, and age.]
2. Perceived physical health (phone)
In general, would you say your physical health is excellent, very good, good, fair, or poor?
3. Perceived overweight (SAQ)
Which of the following do you consider yourself: very overweight, somewhat overweight, about
the right weight, somewhat underweight, very underweight?
Mental Health
1. Perceived mental health (phone)
Would you say your mental or emotional health is excellent, very good, good, fair, or poor?
2. Depressive symptoms (SAQ)
Depressed Affect Scale
During two weeks in the past 12 months, when you felt sad, blue, or depressed, did you
a. lose interest in most things?
b. feel more tired out or low on energy than usual?
c. lose your appetite?
d. have more trouble falling asleep than usual?
e. have a lot more trouble concentrating than usual?
f. feel down on yourself, no good, or worthless?
g. think a lot about death?
3. Worry (phone)
Considering how things have been going in your life over the past 12 months, do you worry more
than most people in the same situation, less than most people, or about the same as most people
in the same situation?

86
4. Alcohol use (SAQ)
During the past 12 months, how many times did you use much larger amounts of alcohol than
you intended to when you began, or used them for a longer period of time than you intended to?
(1: Never to 6: more than 20 times)
5. Drug use (SAQ)
During the past 12 months, how many times did you use much larger amounts of any of these
substances than you intended to when you began, or used them for a longer period of time than
you intended to? (1: Never to 6: more than 20 times)
Wealth
1. Perceived financial situation. (SAQ)
Using a scale from 0 to 10 where 0 means “the worst possible financial situation” and 10 means
“the best possible financial situation,” how would you rate your financial situation these days?
2. Perceived control over financial situation. (SAQ)
Using a scale from 0 to 10 where 0 means “no control at all” and 10 means “very much
control,” how would you rate the amount of control you have over your financial situation these
days?
3. Does your income meet your needs? (SAQ)
In general, would you say you (and your family living with you) have more money than you need,
just enough for your needs, or not enough for your needs?
4. Difficulty paying bills. (SAQ)
How difficult is it for you (and your family) to pay your monthly bills? (1: Very difficult to 4: Not
at all difficult)
5. Income (SAQ)
Pre-tax income you earned in the last calendar year:

87
Appendix B: Measures and corresponding SECCYD codes included in Chapter 6 composite variables
Time Variable Measure(s) Code(s)
1 Delay of Gratification Delay of Gratification Task DOGPFO54
Trust Positive Relationship Score TPRELM54
CBCL Withdrawn BWT_TM54_r
SC SRSS Self-Control SLFRSM54
Stroop IMPLSC54_r
AA Woodcock-Johnson Achievement WJAPPC54, WJIWPC54, WJLWPC54, WJMSPC54, WJPVPC54
BP CBCL Total Problems BTO_TM54
SRSS Problem Behaviors PRBSSM54
ER CBCL Internalizing Problems BIN_TM54_r
SRSS Internalizing Problems INTRSM43_r
CBQ Negative Affectivity CBQANM54_r, CBQFEM54_r, CBQSDM54_r
SS SRSS Social Skills Total Standard Score
SSTSSM54
Social Competence score on Social Problem-Solving Test
SOCASC54
P CBQ Surgency CBQAPM54, CBQALM54, CBQSGM54_r
2 Trust Positive Relationship Score TPRE_M1S, TPRE_T1S
CBCL Withdrawn BWT_TM1S_r, BWT_TT1S_r
Child Peer Status TCPRPST1S
Loneliness and Social Dissatisfaction
LONLYC1F_r
SC SRSS Self-Control SLFRSM1S, SLFRST1S
BP CBCL Total Problems BTO_TM1S, BTO_TT1S
3 Trust Positive Relationship Score TPRE_MG5, TPRE_TG5
CBCL Withdrawn BWT_TMG5_r, BWT_TTG5_r

88
Security in Relationships SRSMACG5, SRSTRCG5
Social Support From Peers SSFRCG5
HOME Acceptance and Responsivity
HH_ARMG5
Friendship Quality FSQTOCG5
SC SRSS Self-Control SLFRSMG5, SLFRSTG5
BP CBCL Total Problems BTO_TTG5, BTO_TMG5
Risky Behavior Questionnaire TOTRTMG5
4 Trust Positive Relationship Score TPRE_MX5
CBCL Withdrawn BWT_TMX5
Friendship Quality FSQT_CX5
Loneliness and Social Dissatisfaction
LONL_CX5
HOME Acceptance and Responsivity
HHAARMX5
Parental Warmth and Support PR1WSCX5
Secure Parental Attachment SECATCX5
SC SRSS Self-Control SLFRSMX5, SLFRSCX5
Weinberger Impulsivity Scale MPLSCXX5_r
AA Math, science, and English achievement
MTHCLSG9, SCICLSG9, HAPENSG9
BP CBCL Total Problems BTO_TMX5
Risky Behavior Questionnaire ANYR_CX5
SRSS Problem Behaviors PRBSSMX5
ER CBCL Internalizing BIN_TMX5_r
SRSS Internalizing Problems INTRSMX5_r
SS SRSS Social Skills SSTSSMX5, SSTSSCX5
P Psychosocial Maturity Inventory PSMITCX5
Resistance to Peer Influence REPPRCX5

89
Appendix C: Measures, subscales, and indices included in Chapter 6 composite variables
Academic Achievement
Time 1: Woodcock-Johnson Psycho-Educational Battery Revised score (z-scored average of child performance across five subtests: Applied Problems, Incomplete Words, Letter-Word Identification, Memory For Sentences, Picture Vocabulary). Time 4: Math, science, and English achievement (z-scored average of child course level achievement scores coded from transcripts on a 0-6 scale for math and science and a 0-1 scale for English).
Behavioral Problems
Time 1: Average of z-scored CBCL Total Problems score (parent-report) and SRSS Problem Behaviors score (parent-report). Time 2: Average of z-scored CBCL Total Problems scores (parent-/teacher-report). Time 3: Average of z-scored CBCL Total Problems scores (parent-/teacher-report average) and z-scored Total Risk-Taking Score on Risky Behavior Questionnaire (parent-report). Time 4: Average of z-scored CBCL Total Problems score (parent-report), z-scored SRSS Problem Behaviors score (parent-report), and z-scored Total Risk-Raking Score on Risky Behavior Questionnaire (child self-report).
Delay of Gratification
Time 1: Two indices: the z-scored amount of time spent waiting for the delayed reward will be examined but is likely to be highly skewed due to right-censoring. If so, a binary pass/fail indicator of whether the child waited full delay period will be used.
Emotion Regulation
Time 1: Reverse-scored average of z-scored CBCL Internalizing score (parent-report), SRSS Internalizing Problems score (parent-report), and CBQ Negative Affectivity score (parent-report). Time 4: Reverse-scored average of z-scored CBCL Internalizing score (parent-report) and SRSS Internalizing Problems score (parent-report).
Personality
Time 1: CBQ Surgency score (z-scored average of parent-reported Approach, Activity Level, and reverse-scored Shyness subscales). Time 4: Average of z-scored Psychosocial Maturity Inventory score (child self-report) and Resistance to Peer Influence score (child self-report).

90
Self-Control
Time 1: Two indices will be separately examined: reverse-scored Stroop impulsivity score (z-scored percent incorrect out of the total number of non-missing trials; child performance) and z-scored SRSS Self-Control score (parent-report).
Times 2 and 3: Average of z-scored SRSS Self-Control scores (parent-/teacher-report). Time 4: Average of z-scored SRSS Self-Control scores (parent-report/child self-report average) and reverse-scored impulse control scores on the Weinberger Adjustment Inventory (child self-report).
Social Skills
Time 1: Average of z-scored SRSS Social Skills score (parent-report) and Social Competence score from the Social Problem Solving Task (child performance). Time 4: Average of z-scored SRSS Social Skills scores (parent-report/child self-report).
Trust
Time 1: Average of z-scored Positive Relationship Scores (parent-report) and reverse-scored CBCL Withdrawn scores (parent-report). Time 2: Average of z-scored Positive Relationship scores (parent/teacher average), reverse-scored CBCL Withdrawn scores (parent/teacher average), Child Peer Status score (teacher-report), and reverse-scored Loneliness and Social Dissatisfaction score (child self-report). Time 3: Average of z-scored Positive Relationship scores (parent/teacher average), reverse-scored CBCL Withdrawn scores (parent/teacher average), Security In Relationships scores (parent/teacher average), Social Support from Peers score (child self-report), HOME Acceptance and Responsivity score (researcher observation), and Friendship Quality score (child self-report). Time 4: Average of z-scored Positive Relationship scores (parent-report), reverse-scored CBCL Withdrawn scores (parent-report), HOME Acceptance and Responsivity score (researcher observation), reverse-scored Loneliness and Social Dissatisfaction scores (child self-report), Friendship Quality score (child self-report), Parental Warmth and Support score (child self-report), and Secure Parental Attachment score (child self-report).


![Credit ratings failures and policy options [with Discussion]](https://static.fdokumen.com/doc/165x107/633fd3e6d10f841e2f086984/credit-ratings-failures-and-policy-options-with-discussion.jpg)