
RUSLE2 Model Application for Soil Erosion Assessment Using Remote Sensing and GIS
20
RUSLE2 Model Application for Soil Erosion Assessment Using Remote Sensing and GIS Jasmin Ismail & S. Ravichandran Received: 18 February 2006 / Accepted: 22 December 2006 / Published online: 16 February 2007 # Springer Science + Business Media B.V. 2007 Abstract The study is focused on the estimation of rate of soil erosion, using Revised Universal Soil Loss Eq. 2 (RUSLE2), in the Veppanapalli subwatershed of Krishnagiri catchment located in Tamil Nadu, India. The soil erosion is estimated for each of the hillslope units in the study area. The factors considered are intensity of rainfall, type of soil, land use classification and the existing soil conservation practices. Detailed analysis of soil samples were done to assess the texture, structure, permeability and organic matter content of the soil samples of each hillslope unit. The required data for the other parameters were estimated by carrying out intense field investigations and by the analysis of the satellite imagery of 5.6 m resolution. A data base was created with all the subfactor values for the hillslope units. Incorporation of remote sensing technique and Geographic Information System (GIS) made the spatial analysis of the study more reliable and accurate. The annual average soil erosion rate is estimated as 25 t/ha/year, which is on a higher range. This indicates the immediate need for the adoption of proper conservation strategies in this area to control the eutrophication in the Krishnagiri reservoir and to prevent further watershed degradation. Key words erosion . RUSLE2 model . remote sensing . GIS analysis 1 Introduction Soil is the precious gift of nature to the mankind. Ironically, soil is the most neglected commodity on the earth. Shifting cultivation on the hillslopes, non-adoption of soil conservation techniques and overexploitation of land for crop production due to population stress lead to enormous soil erosion. Erosion removes organic matter from the soil and contributes to the breakdown of soil structure that will in turn affect soil fertility and the crop yields. Land degradation from water-induced soil erosion is a serious problem in India and thus it forms an important social and economic problem. Water Resour Manage (2008) 22:83–102 DOI 10.1007/s11269-006-9145-9 J. Ismail (*) : S. Ravichandran Centre for Water Resources, College of Engineering Guindy, Anna University, Chennai, India e-mail: [email protected]
-
Upload
independent -
Category
Documents
-
view
7 -
download
0
Transcript of RUSLE2 Model Application for Soil Erosion Assessment Using Remote Sensing and GIS
RUSLE2 Model Application for Soil Erosion AssessmentUsing Remote Sensing and GIS
Jasmin Ismail & S. Ravichandran
Received: 18 February 2006 /Accepted: 22 December 2006 /Published online: 16 February 2007# Springer Science + Business Media B.V. 2007
Abstract The study is focused on the estimation of rate of soil erosion, using RevisedUniversal Soil Loss Eq. 2 (RUSLE2), in the Veppanapalli subwatershed of Krishnagiricatchment located in Tamil Nadu, India. The soil erosion is estimated for each of thehillslope units in the study area. The factors considered are intensity of rainfall, type of soil,land use classification and the existing soil conservation practices. Detailed analysis of soilsamples were done to assess the texture, structure, permeability and organic matter contentof the soil samples of each hillslope unit. The required data for the other parameters wereestimated by carrying out intense field investigations and by the analysis of the satelliteimagery of 5.6 m resolution. A data base was created with all the subfactor values for thehillslope units. Incorporation of remote sensing technique and Geographic InformationSystem (GIS) made the spatial analysis of the study more reliable and accurate. The annualaverage soil erosion rate is estimated as 25 t/ha/year, which is on a higher range. Thisindicates the immediate need for the adoption of proper conservation strategies in this areato control the eutrophication in the Krishnagiri reservoir and to prevent further watersheddegradation.
Key words erosion . RUSLE2model . remote sensing . GIS analysis
1 Introduction
Soil is the precious gift of nature to the mankind. Ironically, soil is the most neglectedcommodity on the earth. Shifting cultivation on the hillslopes, non-adoption of soilconservation techniques and overexploitation of land for crop production due to populationstress lead to enormous soil erosion. Erosion removes organic matter from the soil andcontributes to the breakdown of soil structure that will in turn affect soil fertility and thecrop yields. Land degradation from water-induced soil erosion is a serious problem in Indiaand thus it forms an important social and economic problem.
Water Resour Manage (2008) 22:83–102DOI 10.1007/s11269-006-9145-9
J. Ismail (*) : S. RavichandranCentre for Water Resources, College of Engineering Guindy, Anna University, Chennai, Indiae-mail: [email protected]

Soil erosion causes siltation of reservoirs, which ultimately reduces the life of the projectand affects generation of hydroelectric power. It also affects the flora and fauna of the earth.Soil conservation is the process by which the loss of soil is checked, reducing the velocityof runoff through erosion control measures for maximum sustained crop production and forprotection of human life. The study and estimation of soil erosion is essential for assessingthe health and function of watersheds and eutrophication of their water bodies. As a result,it is fundamentally important to have tools able to predict the entity of soil erosion and toevaluate the risk of sediment transport.
A pilot study conducted in the Krishnagiri reservoir catchment showed that thecatchment suffers serious erosion problems which result in eutrophication of the reservoirthat further affects the quality of water. Accurate estimation of sediment yield in thecatchment is thus an important concern for which the study was done. The aim of thepresent study is to assess quantitatively the soil erosion using RUSLE2 model with the helpof remote sensing and GIS in a subwatershed in the catchment of Krishnagiri reservoir.
According to Merritt et al. (2003), soil erosion is a three-stage process: detachment,transport and deposition. The effect of erosion on crop productivity is explained by Harveyet al. (1998). The slope of the land, soil composition, and extend of vegetative coverinfluence the rate of erosion, while the soil depth, presence of soil biota, water holdingcapacity and nutrient’s level influence the soil’s productive capacity. The mountainousregions, such as the Himalayas in Southeast Asia and the Andes in South America, suffersome of the world’s highest erosion rates.
The factors that influence the rate of soil erosion include rainfall, runoff, slope, landcover and the presence or absence of conservation strategies. It is useful to make anestimate of how fast the soil is being eroded, before implementing any conservationstrategies. Thus methods of predicting the soil loss under a wide range of conditions arerequired. The three categories of model classification are: empirical models, conceptualmodels and physically based model as suggested by Merritt et al. (2003).
Erosion models are necessary tools to predict excessive soil loss and to help in theimplementation of an erosion control strategy. As part of literature review, a wide range ofsoil erosion models is studied which includes USLE and its revised forms, GIS based USLE(Murimi and Prasad 1998), WEPP (Amore et al. 2004), AGNPS (Haregeweyn andYohannes 2003), LISEM (De Roo and Jetten 1999) and Cs137 (Ionita and Margineanu2000). The Universal Soil Loss Equation (USLE) was developed by Weischmeier andSmith (1978), is the most widely used erosion prediction method. Revised USLE (RUSLE)replaced it in 1991, which was supposed to be replaced by the Water Erosion PredictionProject (WEPP) in 1995. RUSLE is still widely used, as WEPP is difficult to use for mostusers.
Soil erosion patterns in watersheds are patchy, heterogeneous and therefore it is difficultto assess. Predictive models can overcome this problem. Lufafa et al. (2003) conducted astudy to evaluate different methods of USLE input parameter derivation and to predict soilloss within a microcatchment of the Lake Victoria Basin (LVB). The highest soil loss waspredicted for annual cropland followed by rangeland and then by forest and papyrusswamp. Dinesan and James (2002) modeled the soil erosion within the Rampatna watershedin Kolar region for different management scenarios. The successful integration of USLEwith GIS is used to develop a spatial decision support system to estimate soil erosion underdifferent conservation practices and to facilitate soil conservation planning within amountainous watershed located in the semiarid region. The work done by Angima et al.(2003) highlights the severity of erosion in tropical highlands of east Africa. In Africa,about 5 mg/ha of productive topsoil is lost to lakes and oceans each year. Soil erosion by
84 J. Ismail, S. Ravichandran
water is thus a serious global problem. This study was conducted by Angima at Kianjukicatchment in central Kenya to predict annual soil loss using the Revised Universal SoilLoss Equation (RUSLE1) and to determine erosion hazard in the area and target locationsfor appropriate initiation of conservation measures.
Merritt et al. (2003) reviewed Water Erosion Prediction Project (WEPP), which is aphysically based erosion prediction model. WEPP is intended to replace the USLE family andexpands the capabilities of prediction in a variety of landscapes and settings. WEPP is oflimited applicability to large-scale catchments because of its greater data requirements, modelcomplexity and accumulation of errors. Schumacher et al. (1999) evaluated the changes insoil profile due to water erosion over a 50-year period using the WEPP hillslope model.
Coogle et al. (2003) developed a Hillslope Erosion Model (HEP) to describe erosion andsediment yield based on mathematical relationships among sediment yield, runoff, hillslopecharacteristics and a relative soil erodibility value. The HEM was tested in the hillslopes ofIndia, New Zealand and Australia. Foster et al. (2002) obtained RUSLE2 by combining thebest of empirically based and process-based erosion prediction technologies. It is a well-validated erosion prediction technology. Modern theory on erosion processes ofdetachment, transport and deposition of soil particles by raindrop impact and surfacerunoff was used to derive RUSLE2. It takes into account the deposition along the hillslopes.It has improved computational procedures and provides more useful output for conservationplanning. RUSLE2 estimates soil loss, sediment yield and sediment characteristics from rilland interill erosion caused by rainfall and overland flow.
2 Study Area
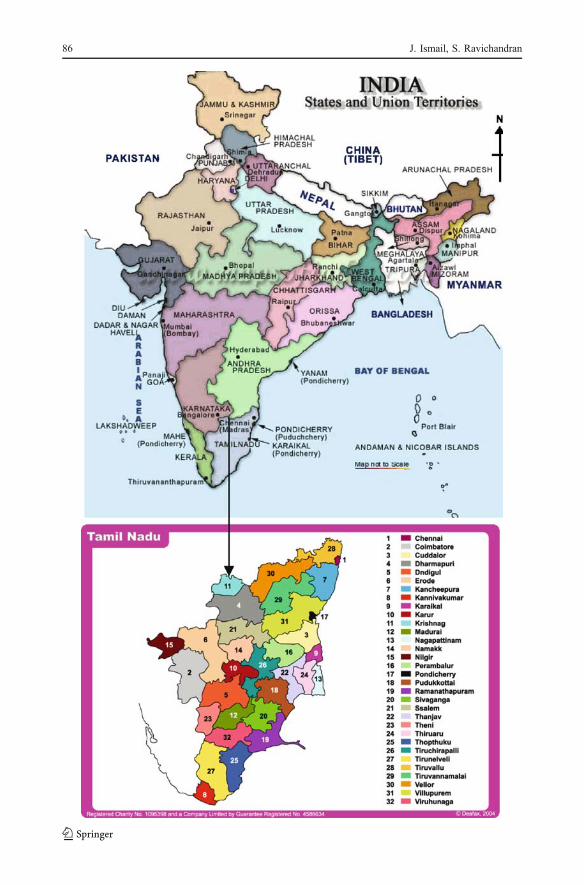
The Krishnagiri reservoir was constructed across the river Ponnaiyar, near Periyamuthurvillage, about 10 km from Krishnagiri town, in Dharmapuri district of Tamil Nadu state inIndia. Dharmapuri district is in the northwestern part of Tamil Nadu, bordering Karnatakaand Andhra Pradesh states. The location of study area is shown in Fig. 1. The total capacityof Krishnagiri reservoir is 66.10 mm3, which irrigates a total ayacut of 3642 ha. Thetributaries of river Ponnaiyar are Chinnar, Sulagiri Chinnar, Markanda Nadhi, Nachikup-pam and Veppanapalli Nadhi.
The Veppanapalli subwatershed, which drains the Veppanapalli Nadhi, is chosen as thestudy area. The Veppanapalli subwatershed lies between 12° 38′ 57″ N – 12° 46′ 27″ Nlatitudes and 78° 10′ 57″ E – 78° 18′ 27″ E longitudes. It covers an area of about117.2 km2. The general slope of the terrain is towards south. The contours range from 560to 1,064 m above mean sea level. The Veppanapalli subwatershed is benefited both by thesouthwest monsoon and northeast monsoon. But most of the rainfall is received during thenortheast monsoon season, from September to December. The annual rainfall ranges from aminimum of 480 mm to a maximum of 1784 mm. The major crops cultivated in the area arepaddy, bajra, ragi, maize, coconut, mango, lemon, chilly, eucalyptus, mulberry, guava,brinjal and horticulture crops like jasmine, marigold etc. During the month of May most ofthe lands are kept fallow. The land preparations are done two weeks prior to the onset ofmonsoon.
The terrain in general is found to have cultivated plains and valleys interspersed withsharply raising boulder hills. Many of the hills are spectacularly large and are often devoid oftree growth. The study area includes cultivated lands, fallow lands, open shrubs, boulders,stony wastes, water body, settlement and reserved forests. The mountains are very steep inthis part of the watershed. Like the variability in the land cover, the soils are also highly
RUSLE2 model application for soil erosion assessment using remote sensing and GIS 85
86 J. Ismail, S. Ravichandran

varying. The topsoil ranges from 2 to 7 m in depth. Red soil, black soil, grey soil, coarse soilsetc. are found. White crustations on the soils are seen in some part. Vannapatti series is themost common soil series found in the study area. It is yellowish red to red, loamy sand andexternally well drained. The organic matter, nutrient and salt content are very low.
3 Model Description
RUSLE2 is a hydrological model, which is the second generation of RUSLE1 and uses aset of equations to compute erosion. It can be used on areas where mineral soil is exposedto raindrop impact and surface overland flow produced by rainfall intensity exceedinginfiltration rate, commonly referred to as Hortonian overland flow. The strength of theUSLE is its empiricism, which is also its weakness. The USLE cannot be applied to thesituations where empirical data are not available for a specified field condition to deriveappropriate factor values. A subfactor method that estimates values for the covermanagement factor C allows RUSLE1 to be applied to any land use. Process basedequations were also added to estimate the values for the support practice factor P, which isnot possible with the USLE. The hybrid approach of starting with an empirical structure,then adding process based equations where empirical data were not adequate, greatlyincreases the power of RUSLE1 over the USLE.
RUSLE2 significantly expands on this hybrid approach by combining the best ofempirically based and process-based prediction technologies. RUSLE2 is likely a bettererosion prediction technology that builds on the success of USLE and RUSLE1. RUSLE2uses a set of mathematical equations to compute erosion. The erosion estimates are basedon site specific condition which allows erosion control practices to be tailored to eachspecific site. The four major factors that affect erosion are climate, inherent soil propertiesincluding soil erodibility, topography and land use.
RUSLE2 computes annual soil loss as
A¼RKLSCP ð1Þwhere
A average annual soil loss (t/(ha/year))R erosivity factor ((MJ mm)/(ha h))K soil erodibility factor ((t/ha)/(MJ mm))L slope length factorS slope steepness factorC cover management factorP supporting practices factor
3.1 Climate
Rainfall drives interill and rill erosion. The most important characteristics of rainfall arerainfall intensity and rainfall amount. The average annual erosivity factor, R, is an index oferosivity at a location. Average annual erosivity is computed as the sum of the erosivity(EI30), which is the product of the total energy and the maximum 30-min intensity of
Fig. 1 Map showing the location of Veppanapalli Subwatershed in Krishnagiri district of Tamil Nadu, IndiaR
RUSLE2 model application for soil erosion assessment using remote sensing and GIS 87

individual storms. Maximum 30-min intensity is the average intensity for the continuous30 min with the maximum rainfall.
The average annual erosivity is computed as
R ¼X
Rm=M ð2Þ
Where Rm erosivity for an individual stormM number of storms
Erosivity for an individual storm is calculated as
Rm ¼ EI30 ð3Þ
where E total storm energy (MJ/ha)I30 maximum 30-min intensity of individual storm (mm/h)
The total energy of a storm is computed by
E ¼ eΔV ð4Þ
Where e unit energy (MJ/(ha mm))ΔV rainfall amount (mm)
The unit energy is computed from
e ¼ 0:29 1� 0:72 exp �0:082ið Þ½ � ð5Þ
where i rainfall intensity (mm/h)
3.2 Soil
Soils vary in their susceptibility to erosion. Some soils are naturally more erodible thanother soils. Knowledge of basic soil properties such as texture provides an indication oferodibility, which is an important RUSLE2 variable. The soil erodibility factor K is ameasure of erodibility for a standard condition. The standard condition is the unit plot,which is an erosion plot 22.1 m long, on a 9% slope, maintained in continuous fallow, tilledup and down hill periodically to control weeds and break crusts that are formed on the soilsurface.
The equation for soil erodibility factor is
K ¼ ktko þ ks þ kp� ��
100 ð6Þ
where K soil erodibility factor (t/ha)/(MJ mm)kt soil texture subfactorko soil organic matter subfactorks soil structure subfactorkp soil profile permeability subfactor
88 J. Ismail, S. Ravichandran

The soil texture subfactor equation is given by
Ktb ¼ 2:1 Psl þ Pvfsð Þ 100� Pclð Þ½ �1:14�10000 ð7Þ
Kt68 ¼ 2:1 68 100� Pclð Þ½ �1:14.1000 ð8Þ
Kt ¼ Ktb for Psl þ Pvfs � 68% ð9Þ
Kt ¼ Ktb � 0:67 Ktb � Kt68ð Þ0:82h i
for Psl þ Pvfs > 68% ð10Þ
where Psl percentage of siltPvfs percentage of very fine sandPcl percentage of clayKtb base soil texture subfactorKt68 soil texture subfactor corresponding to 68%
Pvfs ¼ 0:74� 0:62Psd=100ÞPsd
� ð11Þ
where Psd percentage of sand
The soil organic matter subfactor is given by
Ko ¼ 12� Omð Þ ð12Þ
where Om percentage of inherent soil organic matter
The soil structure subfactor is given by
Ks ¼ 3:25 Ss � 2ð Þ ð13Þ
where Ss soil structure class
1 – very fine granular, 2 – fine granular, 3 – medium or coarse granular and 4 – blocky,platy or massive
The soil profile permeability subfactor is given by
Kp ¼ 2:5 Pr � 3ð Þ ð14Þ
where Pr soil profile permeability rating
1 – rapid , 2 – moderate rapid, 3 – moderate, 4 – slow to moderate, 5 – slow and 6 – veryslow
RUSLE2 model application for soil erosion assessment using remote sensing and GIS 89
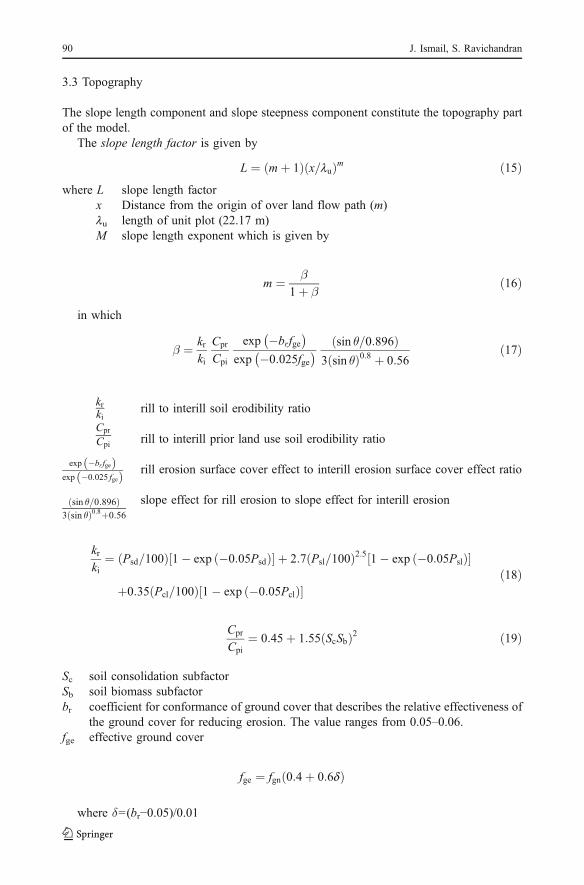
3.3 Topography
The slope length component and slope steepness component constitute the topography partof the model.
The slope length factor is given by
L ¼ mþ 1ð Þ x lu=ð Þm ð15Þwhere L slope length factor
x Distance from the origin of over land flow path (m)lu length of unit plot (22.17 m)M slope length exponent which is given by
m ¼ β1þ β
ð16Þ
in which
β ¼ krki
Cpr
Cpi
exp �brfge� �
exp �0:025fge� � sin θ=0:896ð Þ
3 sin θð Þ0:8 þ 0:56ð17Þ
krki
rill to interill soil erodibility ratio
Cpr
Cpi rill to interill prior land use soil erodibility ratio
exp �brfgeð Þexp �0:025 fgeð Þ rill erosion surface cover effect to interill erosion surface cover effect ratio
sin θ=0:896ð Þ3 sin θð Þ0:8þ0:56
slope effect for rill erosion to slope effect for interill erosion
krki
¼ Psd=100ð Þ 1� exp �0:05Psdð Þ½ � þ 2:7 Psl=100ð Þ2:5 1� exp �0:05Pslð Þ½ �
þ0:35 Pcl=100ð Þ 1� exp �0:05Pclð Þ½ �ð18Þ
Cpr
Cpi¼ 0:45þ 1:55 ScSbð Þ2 ð19Þ
Sc soil consolidation subfactorSb soil biomass subfactorbr coefficient for conformance of ground cover that describes the relative effectiveness of
the ground cover for reducing erosion. The value ranges from 0.05–0.06.fge effective ground cover
fge ¼ fgn 0:4þ 0:6dð Þ
where δ=(br−0.05)/0.01
90 J. Ismail, S. Ravichandran

The slope steepness factor is given by
S ¼ 10:8 sin θþ 0:03 Sp < 9% ð20Þ
S ¼ 1608 sin θ� 0:5 Sp � 9% ð21Þ
where θ ¼ tan�1 Sp�100
� � ð22Þ
Sp steepness of the overland flow path (%)
3.4 Land Use
Erosion occurs when the soil is left bare and exposed to raindrop impact and surface runoff.However, vegetative cover greatly reduces surface runoff. Among the four factors, land useis the most important because it has the greatest effect and it is the one factor that can mosteasily be changed to control soil loss and sediment yield. RUSLE2 is powerful because it island use independent. A subfactor method used to compute values for the covermanagement factor C gives the land use independence. Land use and management affectone or more of the subfactors.
Cover management factor C is given as
C ¼ CcgcSrSbrhScSm ð23Þ
where Cc canopy subfactorgc ground cover subfactorSr soil surface roughness subfactorSb soil biomass subfactorrh ridge height subfactorSc soil consolidation subfactorSm antecedent soil moisture subfactor, which is 1
The canopy cover subfactor is estimated as
Cc ¼ 1� fec exp �0:1hfð Þ ð24Þ
fec ¼ fc 1� fgn� � ð25Þ
hf ¼ hb þ asag ht � hbð Þ ð26Þ
RUSLE2 model application for soil erosion assessment using remote sensing and GIS 91
Where
ag coefficient related to height within the canopy where vegetative surface area isconcentrated, used to compute effective fall height
as coefficient that is a function of canopy shape used to compute effective fallheight
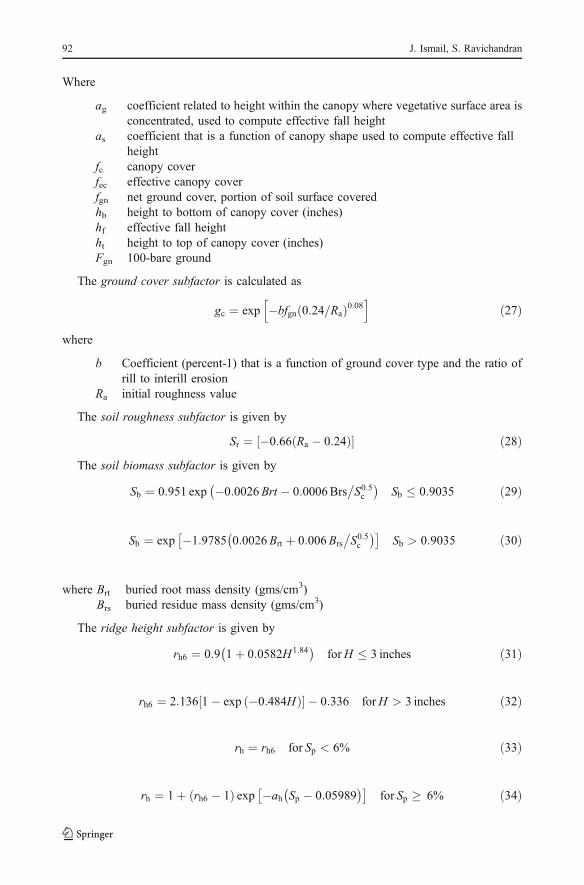
fc canopy coverfec effective canopy coverfgn net ground cover, portion of soil surface coveredhb height to bottom of canopy cover (inches)hf effective fall heightht height to top of canopy cover (inches)Fgn 100-bare ground
The ground cover subfactor is calculated as
gc ¼ exp �bfgn 0:24=Rað Þ0:08h i
ð27Þ
where
b Coefficient (percent-1) that is a function of ground cover type and the ratio ofrill to interill erosion
Ra initial roughness value
The soil roughness subfactor is given by
Sr ¼ �0:66 Ra � 0:24ð Þ½ � ð28ÞThe soil biomass subfactor is given by
Sb ¼ 0:951 exp �0:0026Brt � 0:0006Brs�S0:5c
� �Sb � 0:9035 ð29Þ
Sb ¼ exp �1:9785 0:0026Brt þ 0:006Brs
�S0:5c
� �� �Sb > 0:9035 ð30Þ
where Brt buried root mass density (gms/cm3)Brs buried residue mass density (gms/cm3)
The ridge height subfactor is given by
rh6 ¼ 0:9 1þ 0:0582H1:84� �
forH � 3 inches ð31Þ
rh6 ¼ 2:136 1� exp �0:484Hð Þ½ � � 0:336 forH > 3 inches ð32Þ
rh ¼ rh6 for Sp < 6% ð33Þ
rh ¼ 1þ rh6 � 1ð Þ exp �ah Sp � 0:05989� �� �
for Sp � 6% ð34Þ
92 J. Ismail, S. Ravichandran
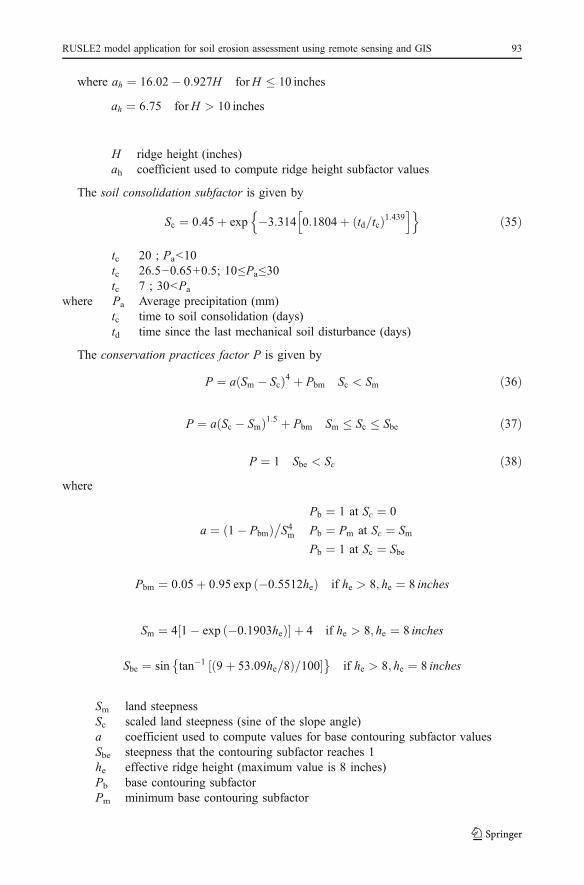
where ah ¼ 16:02� 0:927H forH � 10 inches
ah ¼ 6:75 forH > 10 inches
H ridge height (inches)ah coefficient used to compute ridge height subfactor values
The soil consolidation subfactor is given by
Sc ¼ 0:45þ exp �3:314 0:1804þ td=tcð Þ1:439h in o
ð35Þ
tc 20 ; Pa<10tc 26.5−0.65+0.5; 10≤Pa≤30tc 7 ; 30<Pa
where Pa Average precipitation (mm)tc time to soil consolidation (days)td time since the last mechanical soil disturbance (days)
The conservation practices factor P is given by
P ¼ a Sm � Scð Þ4 þ Pbm Sc < Sm ð36Þ
P ¼ a Sc � Smð Þ1:5 þ Pbm Sm � Sc � Sbe ð37Þ
P ¼ 1 Sbe < Sc ð38Þwhere
a ¼ 1� Pbmð Þ�S4mPb ¼ 1 at Sc ¼ 0
Pb ¼ Pm at Sc ¼ SmPb ¼ 1 at Sc ¼ Sbe
Pbm ¼ 0:05þ 0:95 exp �0:5512heð Þ if he > 8; he ¼ 8 inches
Sm ¼ 4 1� exp �0:1903heð Þ½ � þ 4 if he > 8; he ¼ 8 inches
Sbe ¼ sin tan�1 9þ 53:09he=8ð Þ=100½ �� �if he > 8; he ¼ 8 inches
Sm land steepnessSc scaled land steepness (sine of the slope angle)a coefficient used to compute values for base contouring subfactor valuesSbe steepness that the contouring subfactor reaches 1he effective ridge height (maximum value is 8 inches)Pb base contouring subfactorPm minimum base contouring subfactor
RUSLE2 model application for soil erosion assessment using remote sensing and GIS 93

4 Data Collection and Methodology
A vast data collection of both primary and secondary has been carried out. Soil survey byfree sampling method has been done at each hillslope unit. Representative canopy for eachhillslope has been selected. Measurements regarding the height to the top of canopy andheight to the bottom of canopy from the ground surface have been made. Ground truthverification for the remote sensing data has been done in the study area. The secondary datacollected includes Rainfall data for the year 2003 from Subdivisional Office, Krishnagiridam, Tamil Nadu. The toposheets 57L1, 57L2, 57L5 and 57L6 of 1:50000 scale of thestudy area were obtained from Survey of India, Chennai and Bangalore. And satelliteimagery, which is a merged product of IRS 1D PAN and LISS III of 21st May 2003, havinga resolution of 5.6 m, of scale 1: 25000 is obtained from National Remote Sensing Agency,Hyderabad, India.
Digitization of the topographic maps The four topographic maps 57L1, 57L2, 57L5 and57L6 of 1:50000 scale that covered the whole subwatershed were scanned and the imageswere then imported into the MapInfo environment. Latitude and longitude values for eachtopographic map were given for georeferencing and were mosaiced to form a single basemap of the study area. The subwatershed boundary was delineated and digitized. Thedrainage patterns, contour lines, roads, towns etc. were identified and digitized to createdifferent thematic layers. Based on the order of the streams and terrain characteristics thewhole area is subdivided into small hillslope units. The number of hillslope units chosen is48 and is shown in Fig. 2. These are the basic units considered for the study for theapplication of RUSLE2.
Soil sampling A free sampling method is adopted for soil survey and soil samples for eachof the hillslope units were collected. The physical soil analysis was done through sieveanalysis and hydrometer analysis was done for finding out the percentage of sand, silt andclay in each sample. The buried root mass density and buried residue mass density was
Fig. 2 Study area map showingthe drainage pattern and hillslopeunits
94 J. Ismail, S. Ravichandran

found out for each soil sample. The percentage of organic carbon content of soil sampleswas also determined.
Creation of Digital Elevation Model (DEM) The contour lines of different elevation andsome spot heights available from topographic sheets of the area were digitized to makevector layers of line and point features respectively and were used as input to the MapInfo.With the Vertical Mapper utility, the Digital Elevation Model (DEM) of the study area iscreated.
Land use/land cover map generation Land use/land cover map of the study area is derivedfrom the satellite imagery. The imagery analysis requires ground truth information thatneeds to be collected, for which an intense 3 days field visit has been carried out. The visualdata interpretation technique has been used for generating the land use/land cover map.
5 Application of RUSLE2 to Veppanapalli subwatershed
The estimation of rate of soil erosion has been conducted in the Veppanapalli sub watershedof Krishnagiri catchment using RUSLE2. Soil erosion depends upon rainfall intensity, typeof soil, slope length, slope steepness, land use/land cover and soil conservation practices.All these parameters are having spatial distribution and hence satellite remote sensing andGeographic Information System (GIS) have wide application in erosion estimation. Theresults are summarized as follows.
5.1 Rainfall Erosivity Factor (R)
There is only one rainfall recording station for the Veppanapalli subwatershed. The rainfalldata were collected for the year 2003 and R value is estimated using Eq. 2.
Fig. 3 Soil erodibility factor (K)map
RUSLE2 model application for soil erosion assessment using remote sensing and GIS 95

5.2 Soil Erodibility Factor (K)
The detailed analysis of soil samples was done to assess the texture, structure permeabilityand organic matter content and to calculate the K values using Eq. 6.The K map is shown inFig. 3. The result shows that soil erodibility plays an important role in bringing the erosionload.
5.3 Slope Length Factor (L)
L factor is determined based on the length of hillslope units. The slope length values arefound out using Eq. 15. The slope length map is prepared based on those values and isshown in Fig. 4.
Fig. 4 Slope length factor (L)map
Fig. 5 Digital elevation model ofthe study area
96 J. Ismail, S. Ravichandran

5.4 Slope Steepness Factor (S)
The slope map is derived from the DEM, shown in Fig. 5, from which the percentage slopesteepness values are determined for each hillslope unit. The slope steepness varies from 1 to62%. The steepness values are above 30% for most of the hillslope units. Using Eqs. 20 and21 the slope steepness factor values are calculated and the corresponding map is preparedand is shown in Fig. 6.
Fig. 6 Slope steepness factor (S)map
Fig. 7 Land use/land cover mapof the study area
RUSLE2 model application for soil erosion assessment using remote sensing and GIS 97

5.5 Cover Management Factor (C)
The canopy subfactor depends on vegetative cover, which dissipates the energy ofraindrops before reaching the ground surface. From the land use/land cover map shown inFig. 7, the area was classified into six land use patterns namely agricultural land, settlement,water body, fallow land, barren land and forest area. The details regarding agriculturalpractices were obtained by discussion with the farmers of the watershed. Figure 7 shows themajor part of the watershed (52%) in forest area followed by agricultural land. Table 1shows the current land use and their area in the watershed. The canopy cover subfactor,ground cover subfactor, soil roughness subfactor, soil biomass subfactor, soil ridge heightsubfactor and soil consolidation subfactor were calculated using Eqs. 24, 27, 28, 29 and 30,33 and 34, 35 respectively. The antecedent moisture subfactor is taken as 1 as given byFoster et al. (2002). From the land use/land cover map and the observations made in thefield, the input values are chosen for the equations for each hillslope unit to get the covermanagement factor (C) value. The cover management factor map is prepared based on thesevalues and is shown in Fig. 8.
Type of land use Area (km2) Percentage area
Settlement 0.98 0.84Water body 0.27 0.23Barren land 21.36 18.23Fallow land 2.32 1.98Agricultural land 30.87 26.33Forest 61.50 51.62
Table 1 The areal extent ofdifferent land use pattern existingin the watershed
Fig. 8 Cover management factor(C) map
98 J. Ismail, S. Ravichandran

5.6 Conservation Practices Subfactor (P)
Conservation practices factor is important to be known to incorporate the erosion controlmanagement practices. P factor map shown in Fig. 9 was prepared based on valuescalculated using Eqs. 36, 37 and 38.
6 Results and Discussion
The annual average erosivity is obtained as 81.6 (MJ mm)/(ha h) for the Veppanapallisubwatershed during the year 2003. The erodibility value ranges from 0.16 (t/ha)/(MJ mm)to 0.24 (t/ha)/(MJ mm). The soil erodibility map shows the variability of soil characteristics
Fig. 9 Conservation practicesfactor (P) map
Fig. 10 Annual soil erosion (A)map of the Veppanapallisubwatershed
RUSLE2 model application for soil erosion assessment using remote sensing and GIS 99

within a small region. It is found that the uplands in the northern part of the watershed werehighly erodible, owing to the loose soil type and the steep terrain available there. Due tothis, even a small intensity rain can bring considerable quantity of sediment from thehillslopes. In the study area, the agricultural fields are comparatively less eroded as they liemostly in flat plains. Low K factor values are seen on the western part of the watershedwhich is also flat terrain and built up areas which are interspersed with agricultural lands.The L values ranges from 0.70 to 1.
From the study, it is seen that the slope steepness plays a very important role in sedimentload generation in the Veppanapalli subwatershed. The slope steepness factor values arevery high in the uplands. Since the subwatershed is hilly except for a small portion, the soilerosion rate is very high. The steeper slopes are seen in the eastern part which is reservedforest area. The C values range from 0.1 to 0.9. The map shows that the canopy values arevery high in the forest area. The agricultural cover near the Veppanapalli town may alsocontribute much to the erosion. The effect of canopy on erosion rate thus appearsirrespective of terrain conditions. From the conservation practices factor (P) map, it is seenthat the P factor values are higher in the steep mountains and in the agricultural areas. In thestudy area, no erosion control practice is specifically adopted. Thus, there is need forconservation measures to be adopted in the study area to reduce the P values, which willsubsequently reduce the erosion rate.
From the study of estimation of amount of soil erosion in the Veppanapalli subwatershedin the Krishnagiri catchment, using RUSLE2, the annual average soil loss is estimated to be25 t/ha/year. The combined effect of all the factors contribute to the soil erosion, which hasgot a high spatial variation owing to the different factors and the soil erosion map is shownin Fig. 10. The soil erosion ranges are given in Table 2. The severe erosion zones are seenconcentrated in the northern part of the basin (>39 t/ha/year) and eastern part of the basin(>29 t/ha/year). These zones fall under the forest areas and are having higher slope values.Though these areas are forests with varying degree of tree cover, the erosion is high in theseareas compared to other parts. The southern part of the watershed indicated medium rangeof soil loss (>22 t/ha/year) while the western parts, mostly built up land with agriculturalfields, indicated lowest erosion class (<10 t/ha/year).
Soil loss (t/ha/year) Classification
0–10 Low10–20 Moderate20–30 HighAbove 30 Severe
Table 2 Soil erosion categoriesbased on annual soil loss from thewatershed
17%
14%
27%
42%
0 to 10
10 to 20
20 to 30
>30
Fig. 11 Soil erosion classes inVeppanapalli subwatershed
100 J. Ismail, S. Ravichandran

The results suggest that independent of land use/land cover in the watershed, the slopeand soil erodibility are important factors controlling erosion in the Veppanapalli watershed.The various range of soil erosion in the study area are shown in Fig. 11 and the total spatialannual soil loss in the watershed is estimated as 25 t/ha/h, which is the higher rangecomparatively. Studies done earlier in the upper Ponnaiyar watershed on the rates of erosionby Karunakaran (2003) have also identified Veppanapalli as one of the most erodible part ofthe watershed.
Another important aspect in this study is the near absence of erosion control structures orsoil conservation practices being undertaken. Very limited number of check dams wasconstructed even if the slope is very large. Information collected from the governmentagencies as well as field observations conducted indicate that no serious measures are beingtaken at present. This may be one of the reasons for the higher erosion rates noticed in theVeppanapalli watershed. So as to control the soil erosion by water, the raindrop impact has tobe reduced and the soil resistance has to be increased. The ground cover has to be increased toreduce the effect of water drops falling from height. The soil resistance can be increased byimproving the soil structure by suitable amendments. The slope can be reduced byconstructing check dams. The check dams can be constructed out of the locally availablematerials like brushes, rocks, wooden slabs etc. Installation of a number of check dams inseries is the recommended practice, which will reduce the erosion rate considerably.
Thus, in general, it is clear from the results of the study that Revised Universal Soil LossEq. 2 is a powerful model for the qualitative as well as quantitative assessment of soilerosion rate for the conservation management. Multispectral remote sensing data haveprovided valuable and very important factors like C and P for the study. GIS has given avery useful environment to undertake the task of data compilation and analysis within ashort period at very high resolution. The satellite data of high resolution can be used foraccurate estimation and it updated the toposheet data that helped in creating the detailedland use/land cover pattern.
Acknowledgements We are grateful for the support and help from Dr. George R. Foster, Scientist, UnitedStates Department of Agriculture, for providing us with the recently developed scientific documentation ofRUSLE2 model. We are immensely thankful to The Director, Data Centre, National Remote Sensing Agency,Hyderabad for providing the remote sensing data and Dr. K. Karunakaran, Director, Centre for WaterResources, College of Engineering, Anna University, Chennai for providing the infrastructure to completethe work.
References
Amore E, Carlo M, Nearing, MA Santoro,VC (2004) Scale effect of USLE and WEPP application for soilerosion computation from three Sicilian basins. J Hydrol 293:100–114
Angima SD, Stott DE, O’Neill MK (2003) Soil erosion prediction using RUSLE for central Kenyan highlandconditions. Agric Ecosyst Environ 97:295–308
Coogle AL, Lane LJ, Basher L (2003) Testing the hillslope erosion model for application in India, NewZealand and Australia. Environ Model Softw 18:825–830
De Roo APJ, Jetten VG (1999) Calibrating and validating the LISEM model for two data sets fromNetherland and South Africa. Catena 37:477–493
Dinesan VP, James EJ (2002) GIS based spatial decision support system for managing soil erosion – a casestudy, water and waste water; perspectives of developing countries, Rama Devi and Naved Ahsan –Proceedings of the International Conference, WAPDEC, Dec. 11–13. Anamaya Publishers, New Delhi,India, pp 175–182
Foster GR, Yoder DC, Weesies GA, McCool DK, McGregor KC, Binger RL (2002) RUSLE2 User’s Guide.USDA – Agricultural Research Service, Washington, pp 1–76
RUSLE2 model application for soil erosion assessment using remote sensing and GIS 101
Haregeweyn N, Yohannes F (2003) testing and evaluation of agricultural non-point source pollution model(AGNPS) on Augucho catchment, Western Hararghe, Ethiopia. Agric Ecosyst Environ 99:201–212
Harvey C, Pimentel D, Resosudarmo P, Sinclair K, Kurtz D, McNair M, Crist S, Shpritz L, Fitton L, saffuriR, Blair R (1998) Land use, erosion and water resources. In: Biswass, AK (ed) Water resources –environmental planning, management and development. Tata McGraw-Hill, New Delhi, India, pp 31–37
Ionita I, Margineanu RM (2000) Application of Cs137 for measuring soil erosion and deposition rate inRomania. Acta Geologia Hispania 35:311–319
Karunakaran K (2003) Pilot study on nutrient transport, Eutrophication and environmental impacts inKrishnagiri reservoir. Centre for Water Resources, Anna University, pp 1–52
Lufafa A, Tenywa MM, Isabirye M, Majaliwa MJG, Womer PL (2003) Prediction of soil erosion in a LakeVictoria basin catchment using a GIS-based Universal Soil Loss model. Agric Syt 76:883–894
Merritt WS, Letcher RA, Jakeman AJ (2003) A review of erosion and sediment transport models. EnvironModel Softw 18:761–799
Murimi SK, Prasad H (1998) Modelling potential soil erosion in Lake Nakuru Drainage Basin.Ecohydrology. Subramanian V and Ramanathan AL, pp 403–414
Schumacher TE, Lindstrom MJ, Schumacher JA, Lemme GD (1999) Modelling spatial variation inproductivity due to tillage and water erosion. Soil Tillage Res 51:331–339
Weischmeier WH, Smith DD (1978) Predicting rainfall erosion losses – a guide to conservation planning,United States Department of Agriculture, Agriculture Handbook No. 537
102 J. Ismail, S. Ravichandran