Groundwater resources development in hard rock terrain - an approach using remote sensing and GIS...
12
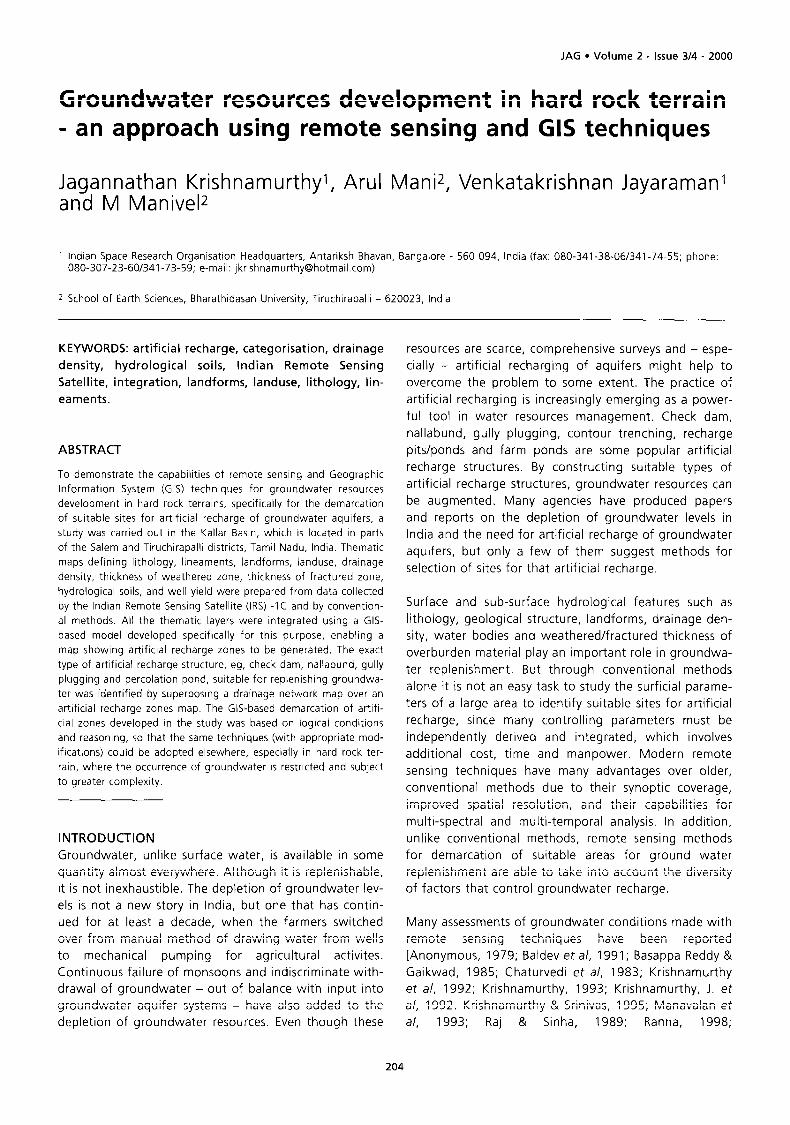
JAG l Volume 2 - Issue 3/4 - 2000 Groundwater resources development in hard rock terrain - an approach usi,ng remote sensing and GIS techniques Jagannathan Krishnamurthyl, Arul Man?, Venkatakrishnan Jayaramanl and M ManiveP 1 Indian Space Research Organisation Headquarters, Antariksh Bhavan, Bangalore - 560 094, India (fax: 080-341-38-06/341-74-55; phone: 080-307.23-60/341-73-59; e-mail: jkrishnamurthyQhotmail.com) 2 School of Earth Sciences, Bharathidasan University, Tiruchirapalli - 620023, India KEYWORDS: artificial recharge, categorisation, drainage density, hydrological soils, Indian Remote Sensing Satellite, integration, landforms, landuse, lithology, lin- eaments. ABSTRACT To demonstrate the capabilities of remote sensing and Geographic Information System (GIS) techniques for groundwater resources development in hard rock terrains, specifically for the demarcation of suitable sites for artificial recharge of groundwater aquifers, a study was carried out in the Kallar Basin, which is located in parts of the Salem and Tiruchirapalli districts, Tamil Nadu, India. Thematic maps defining lithology, lineaments, landforms, landuse, drainage density, thickness of weathered zone, thickness of fractured zone, hydrological soils, and well yield were prepared from data collected by the Indian Remote Sensing Satellite (IRS) -1 C and by convention- al methods. All the thematic layers were integrated using a GIS- based model developed specifically for this purpose, enabling a map showing artificial recharge zones to be generated. The exact type of artificial recharge structure, eg, check dam, nallabund, gully plugging and percolation pond, suitable for replenishing groundwa- ter was identified by superposing a drainage network map over an artificial recharge zones map. The GIS-based demarcation of artifi- cial zones developed in the study was based on logical conditions and reasoning, so that the same techniques (with appropriate mod- ifications) could be adopted elsewhere, especially in hard rock ter- rain, where the occurrence of groundwater is restricted and subject to greater complexity. INTRODUCTION Groundwater, unlike surface water, is available in some quantity almost everywhere. Although it is replenishable, it is not inexhaustible. The depletion of groundwater lev- els is not a new story in India, but one that has contin- ued for at least a decade, when the farmers switched over from manual method of drawing water from wells to mechanical pumping for agricultural activites. Continuous failure of monsoons and indiscriminate with- drawal of groundwater - out of balance with input into groundwater aquifer systems - have also added to the depletion of groundwater resources. Even though these resources are scarce, comprehensive surveys and - espe- cially - artificial recharging of aquifers might help to overcome the problem to some extent. The practice of artificial recharging is increasingly emerging as a power- ful tool in water resources management. Check dam, nallabund, gully plugging, contour trenching, recharge pits/ponds and farm ponds are some popular artificial recharge structures. By constructing suitable types of artificial recharge structures, groundwater resources can be augmented. Many agencies have produced papers and reports on the depletion of groundwater levels in India and the need for artificial recharge of groundwater aquifers, but only a few of them suggest methods for selection of sites for that artificial recharge. Surface and sub-surface hydrological features such as lithology, geological structure, landforms, drainage den- sity, water bodies and weathered/fractured thickness of overburden material play an important role in groundwa- ter replenishment. But through conventional methods alone it is not an easy task to study the surficial parame- ters of a large area to identify suitable sites for artificial recharge, since many controlling parameters must be independently derived and integrated, which involves additional cost, time and manpower. Modern remote sensing techniques have many advantages over older, conventional methods due to their synoptic coverage, improved spatial resolution, and their capabilities for multi-spectral and multi-temporal analysis. In addition, unlike conventional methods, remote sensing methods for demarcation of suitable areas for ground water replenishment are able to take into account the diversity of factors that control groundwater recharge. Many assessments of groundwater conditions made with remote sensing techniques have been reported [Anonymous, 1979; Baldev et a/, 1991; Basappa Reddy & Gaikwad, 1985; Chaturvedi et a/, 1983; Krishnamurthy et al, 1992; Krishnamurthy, 1993; Krishnamurthy, J. et al, 1992. Krishnamurthy & Srinivas, 1995; Manavalan et al, 1993; Raj & Sinha, 1989; Ranna, 1998; 204
-
Upload
independent -
Category
Documents
-
view
1 -
download
0
Transcript of Groundwater resources development in hard rock terrain - an approach using remote sensing and GIS...
JAG l Volume 2 - Issue 3/4 - 2000
Groundwater resources development in hard rock terrain - an approach usi,ng remote sensing and GIS techniques
Jagannathan Krishnamurthyl, Arul Man?, Venkatakrishnan Jayaramanl and M ManiveP
1 Indian Space Research Organisation Headquarters, Antariksh Bhavan, Bangalore - 560 094, India (fax: 080-341-38-06/341-74-55; phone: 080-307.23-60/341-73-59; e-mail: jkrishnamurthyQhotmail.com)
2 School of Earth Sciences, Bharathidasan University, Tiruchirapalli - 620023, India
KEYWORDS: artificial recharge, categorisation, drainage
density, hydrological soils, Indian Remote Sensing
Satellite, integration, landforms, landuse, lithology, lin-
eaments.
ABSTRACT
To demonstrate the capabilities of remote sensing and Geographic
Information System (GIS) techniques for groundwater resources
development in hard rock terrains, specifically for the demarcation
of suitable sites for artificial recharge of groundwater aquifers, a
study was carried out in the Kallar Basin, which is located in parts
of the Salem and Tiruchirapalli districts, Tamil Nadu, India. Thematic
maps defining lithology, lineaments, landforms, landuse, drainage
density, thickness of weathered zone, thickness of fractured zone,
hydrological soils, and well yield were prepared from data collected
by the Indian Remote Sensing Satellite (IRS) -1 C and by convention-
al methods. All the thematic layers were integrated using a GIS-
based model developed specifically for this purpose, enabling a
map showing artificial recharge zones to be generated. The exact
type of artificial recharge structure, eg, check dam, nallabund, gully
plugging and percolation pond, suitable for replenishing groundwa-
ter was identified by superposing a drainage network map over an
artificial recharge zones map. The GIS-based demarcation of artifi-
cial zones developed in the study was based on logical conditions
and reasoning, so that the same techniques (with appropriate mod-
ifications) could be adopted elsewhere, especially in hard rock ter-
rain, where the occurrence of groundwater is restricted and subject
to greater complexity.
INTRODUCTION
Groundwater, unlike surface water, is available in some
quantity almost everywhere. Although it is replenishable,
it is not inexhaustible. The depletion of groundwater lev-
els is not a new story in India, but one that has contin-
ued for at least a decade, when the farmers switched
over from manual method of drawing water from wells
to mechanical pumping for agricultural activites.
Continuous failure of monsoons and indiscriminate with-
drawal of groundwater - out of balance with input into
groundwater aquifer systems - have also added to the
depletion of groundwater resources. Even though these
resources are scarce, comprehensive surveys and - espe-
cially - artificial recharging of aquifers might help to
overcome the problem to some extent. The practice of
artificial recharging is increasingly emerging as a power-
ful tool in water resources management. Check dam,
nallabund, gully plugging, contour trenching, recharge
pits/ponds and farm ponds are some popular artificial
recharge structures. By constructing suitable types of
artificial recharge structures, groundwater resources can
be augmented. Many agencies have produced papers
and reports on the depletion of groundwater levels in
India and the need for artificial recharge of groundwater
aquifers, but only a few of them suggest methods for
selection of sites for that artificial recharge.
Surface and sub-surface hydrological features such as
lithology, geological structure, landforms, drainage den-
sity, water bodies and weathered/fractured thickness of
overburden material play an important role in groundwa-
ter replenishment. But through conventional methods
alone it is not an easy task to study the surficial parame-
ters of a large area to identify suitable sites for artificial
recharge, since many controlling parameters must be
independently derived and integrated, which involves
additional cost, time and manpower. Modern remote
sensing techniques have many advantages over older,
conventional methods due to their synoptic coverage,
improved spatial resolution, and their capabilities for
multi-spectral and multi-temporal analysis. In addition,
unlike conventional methods, remote sensing methods
for demarcation of suitable areas for ground water
replenishment are able to take into account the diversity
of factors that control groundwater recharge.
Many assessments of groundwater conditions made with
remote sensing techniques have been reported
[Anonymous, 1979; Baldev et a/, 1991; Basappa Reddy &
Gaikwad, 1985; Chaturvedi et a/, 1983; Krishnamurthy
et al, 1992; Krishnamurthy, 1993; Krishnamurthy, J. et
al, 1992. Krishnamurthy & Srinivas, 1995; Manavalan et
al, 1993; Raj & Sinha, 1989; Ranna, 1998;
204
Groundwater resources development in hard rock terrain
Thillaigovindarajan, 1999; Venkateswara Rao, 19981.
Rather than using a single technique, combinations of
different techniques have provided more dependable
information for developing suitable plans of action for
development. Such studies have integrated various surfi-
cial features derived from remote sensing data in a GIS
environment [Chi & Lee, 1994; Gustafsson, 1993;
Jeyaram, 1997; Krishnamurthy et al, 1996; Murthy,
2000; Padmavathy et al, 1993; Saraf & Jain, 1996; Saraf
& Choudhury, 1998; Shahid et al, 2000; Sohani et a/,
19981. However only a limited number of studies have
taken the approach of specifically locating artificial
recharge zones using remote sensing and GIS tech-
niques. Researchers have adopted different GIS-based
models while demarcating areas suitable for artificial
recharge, and as such there is no standard model avail-
able. Also, most of the models normally give importance
to the mathematical relations rather than local ground
truth. Hence it was decided to design and test a GIS-
based model for demarcating artificial recharge zones in
hard rock terrain that could be put to operational use.
This study therefore demonstrates the utility of remote
sensing and GIS techniques for demarcating areas suit-
able for artificial recharge, especially the identification of
suitable sites for artificial recharge of groundwater
aquifers in hard rock terrain, where groundwater is typi-
cally scarce.
The aim of this study was to demonstrate the potential of
remote sensing and GIS techniques for selecting suitable
areas for artificial recharge of groundwater aquifers. The
specific objectives of the study were:
Preparation of various thematic maps that are relevant
for demarcation of artificial recharge zones. Thematic
maps that can be prepared from remotely sensed data
may include, for example, lithology, lineaments, land-
forms, surface water bodies and landuse. Thematic maps
that can be prepared from data collected by convention-
al methods may include drainage density, hydrological
soils, weathered zone thickness, fractured zone thickness
and well yield.
Development of a GIS-based model for integration of
thematic maps specifically to demarcate artificial
recharge zones for groundwater development.
Identification of suitable areas/zones for artificial
recharge of groundwater through integration of themat-
ic maps by using the GIS-based model developed.
Definition of suitable artificial recharge structures for
potential recharge zones identified.
DATA SOURCES
STUDY AREA
Because the present study was aimed at generating a
package to demonstrate the potential of remote sensing
and GIS techniques for selecting suitable areas for artifi-
JAG l Volume 2 - Issue 3/4 - 2000
cial recharge of groundwater aquifers, it was decided to
use a study area that was actually having problems with
groundwater availability, thus requiring a suitable plan of
action for groundwater development. From develop-
ments in groundwater status, the Public Works
Department (PWD) of Madras classified the entire Tamil
Nadu region as either “Dark areas” “Grey areas” and
“White areas” for 1994 and 1997 (projected) [Public
Works Department, 19941. “Dark areas” are those areas
in which groundwater extraction is greater than the
input (augmentation is required to maintain groundwater
balance). In contrast, areas classified as “White areas”
are those areas that are recommended for groundwater
exploration since adequate groundwater is available.
After consultation of the PWD’s groundwater develop-
ment status report, the Kallar Basin, located in parts of
Salem and Tiruchirapalli districts in Tamil Nadu, was cho-
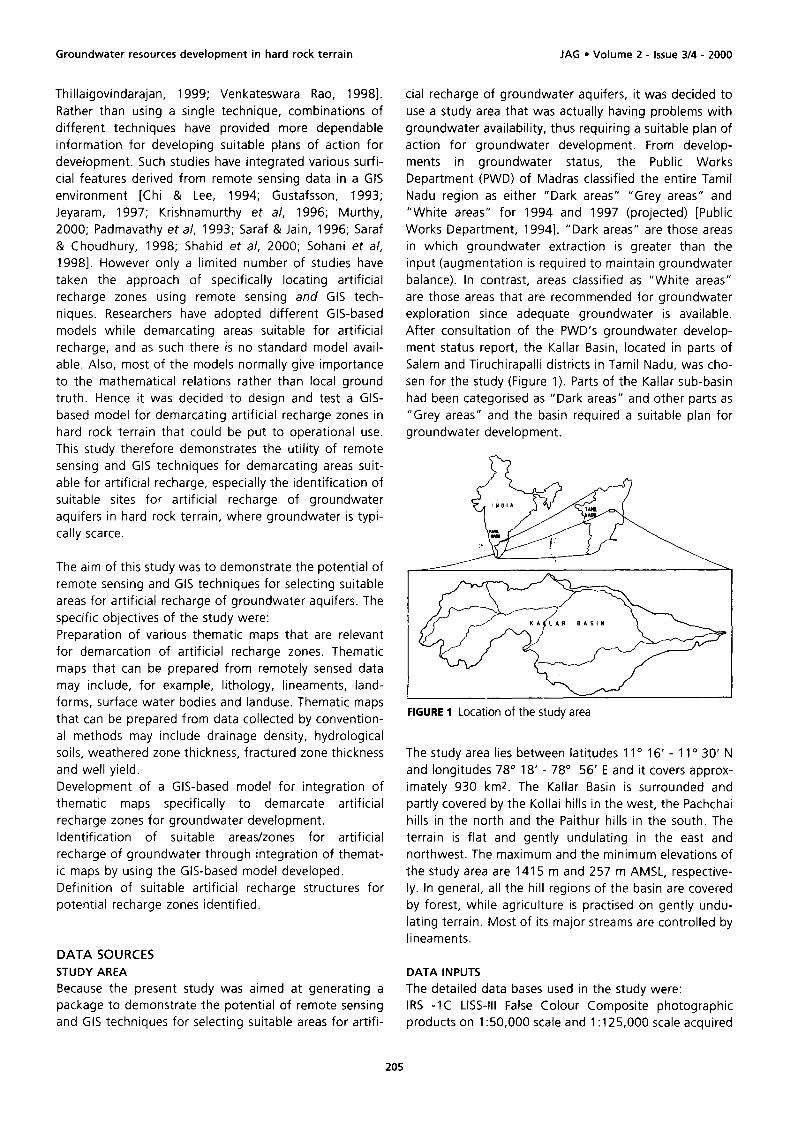
sen for the study (Figure 1). Parts of the Kallar sub-basin
had been categorised as “Dark areas” and other parts as
“Grey areas” and the basin required a suitable plan for
groundwater development.
FIGURE 1 Location of the study area
The study area lies between latitudes 11 o 16’ - 1 I0 30’ N
and longitudes 78’ 18’ - 78” 56’ E and it covers approx-
imately 930 km*. The Kallar Basin is surrounded and
partly covered by the Kollai hills in the west, the Pachchai
hills in the north and the Paithur hills in the south. The
terrain is flat and gently undulating in the east and
northwest. The maximum and the minimum elevations of
the study area are 1415 m and 257 m AMSL, respective-
ly. In general, all the hill regions of the basin are covered
by forest, while agriculture is practised on gently undu-
lating terrain. Most of its major streams are controlled by
lineaments.
DATA INPUTS
The detailed data bases used in the study were:
IRS -lC LISS-Ill False Colour Composite photographic
products on 1:50,000 scale and 1 :I 25,000 scale acquired
205
Groundwater resources development in hard rock terrain
on 24 May 1996.
Survey of India topographical sheet No. 58 I on
1:250,000 scale and No.s 58 l/6, 58 l/7, 58 VI 0, 58 l/l 1
and 58 l/l 5 on 1:50,000 scale.
Soil map of the study area and its surroundings on
1:63,360 scale, prepared by Soil and Land Use
Organisation, Coimbatore, Tamil Nadu.
Groundwater yields and bore hole litholog data collected
by the Public Works Department of Madras.
Field observations collected during field checks.
METHOD
In the first phase of the work a number of thematic maps
that reflect factors that directly influence the recharge of
groundwater were prepared from remotely sensed data
and from data collected by conventional field methods.
Thematic maps prepared from remote sensing sources
included: (i) lithology, (ii) landforms, (iii) lineaments, (iv)
landuse, and (v) water bodies from the IRS IC LISS-Ill
Geocoded photographic products. Additional thematic
maps that were developed from the data collected by
conventional field methods included: (vi) base details,
(vii) drainage density, (viii) a soil map of the study area
produced by regrouping soil types on the basis of hydro-
logical characteristics, (ix) weathered zone thickness, (x)
fractured zone thickness, (xi) and groundwater yields.
Details collected during field checks were incorporated
during the final preparation of thematic maps.
In the second phase of the study, GIS techniques were
used to integrate and analyse the thematic maps and to
prepare a map showing areas suitable for artificial
recharge of groundwater.
By superimposing the drainage network map onto this
artificial recharge map and also by taking terrain charac-
teristics into consideration, the types of artificial recharge
structures suitable for each of the zones, for example, a
check dam, a nallabund, a percolation pond, or a con-
tour trench, were identified. The method used in the
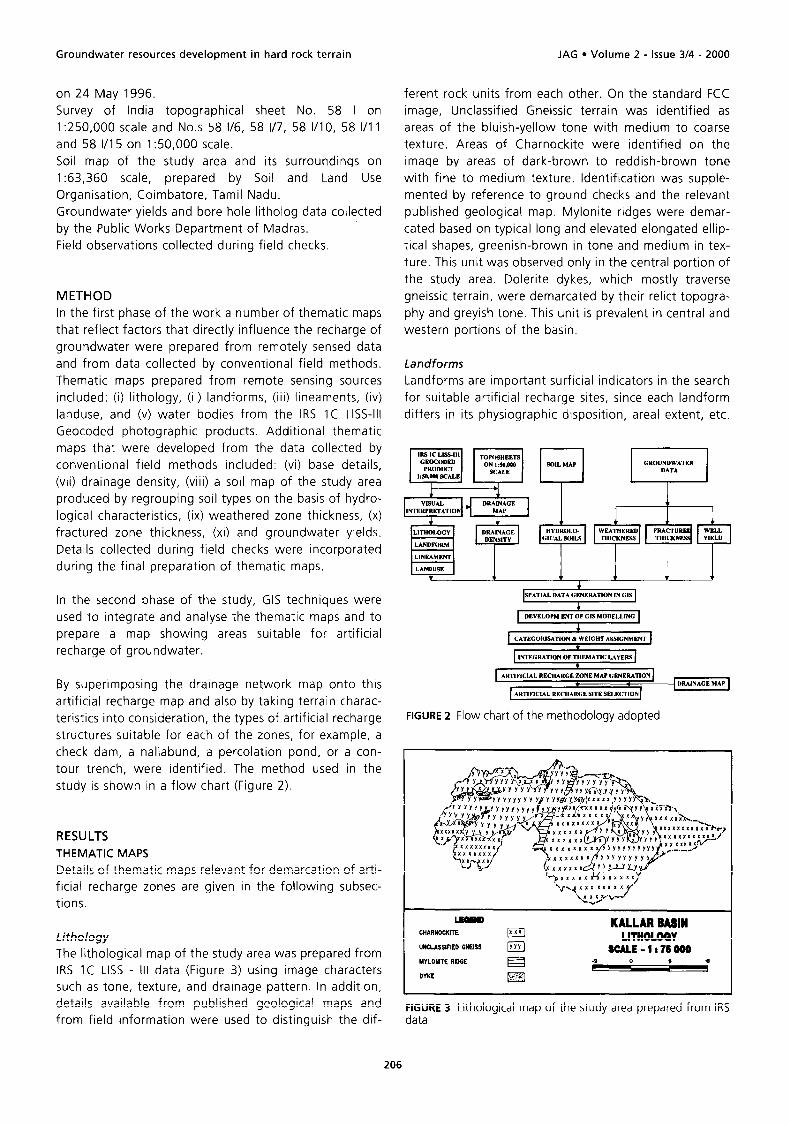
study is shown in a flow chart (Figure 2).
RESULTS
THEMATIC MAPS
Details of thematic maps relevant for demarcation of arti-
ficial recharge zones are given in the following subsec-
tions
Lithology
The lithological map of the study area was prepared from
IRS IC LISS - Ill data (Figure 3) using image characters
such as tone, texture, and drainage pattern. In addition,
details available from published geological maps and
from field information were used to distinguish the dif-
JAG l Volume 2 - Issue 3/4 - 2000
ferent rock units from each other. On the standard FCC
image, Unclassified Gneissic terrain was identified as
areas of the bluish-yellow tone with medium to coarse
texture. Areas of Charnockite were identified on the
image by areas of dark-brown to reddish-brown tone
with fine to medium texture. Identification was supple-
mented by reference to ground checks and the relevant
published geological map. Mylonite ridges were demar-
cated based on typical long and elevated elongated ellip-
tical shapes, greenish-brown in tone and medium in tex-
ture. This unit was observed only in the central portion of
the study area. Dolerite dykes, which mostly traverse
gneissic terrain, were demarcated by their relict topogra-
phy and greyish tone. This unit is prevalent in central and
western portions of the basin.
Landforms
Landforms are important surficial indicators in the search
for suitable artificial recharge sites, since each landform
differs in its physiographic disposition, areal extent, etc.
LlNEAMENT
LANDUSE
t I t t + *
FIGURE 2 Flow chart of the methodology adopted
KALLAR BASIN CHARKOCKITE LlTtloLoaY wcL*ss!FIEo OWlSS SCALE-1176666 YYLOMTE RWE #
-s DYKE m
FIGURE 3 Lithological map of the study area prepared from IRS data
206
Groundwater resources development in hard rock terrain
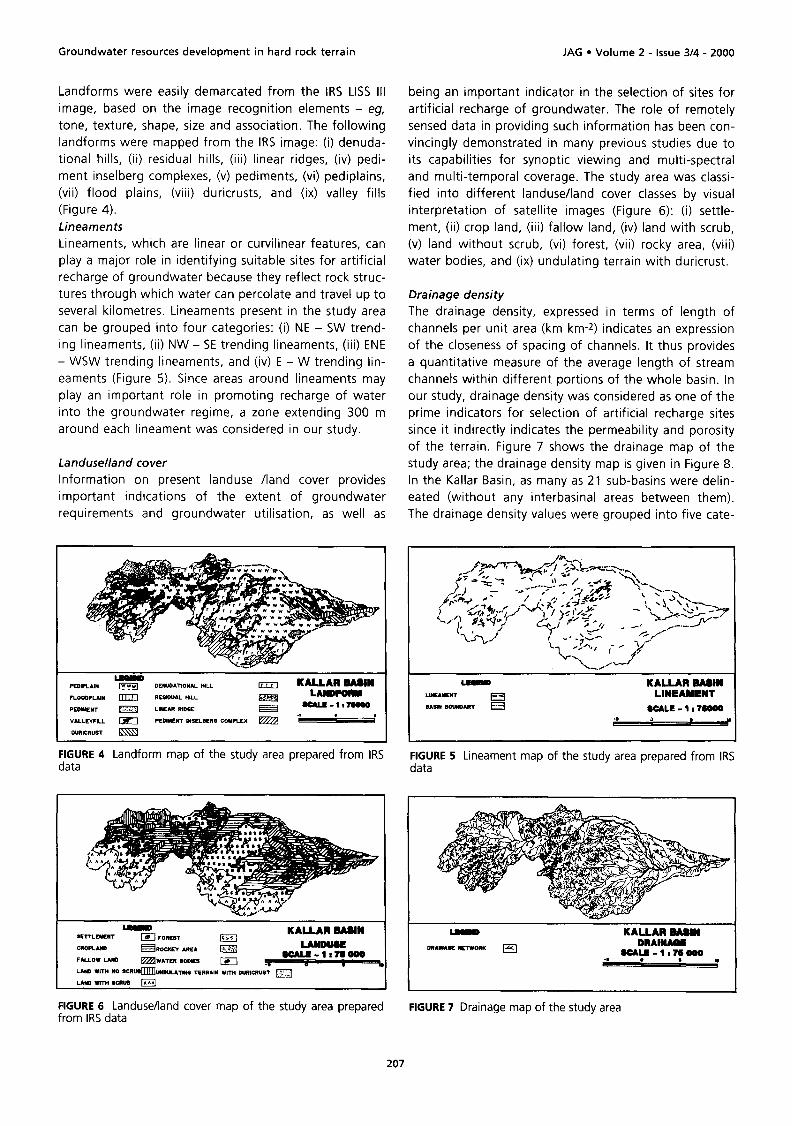
Landforms were easily demarcated from the IRS LISS III
image, based on the image recognition elements - eg,
tone, texture, shape, size and association. The following
landforms were mapped from the IRS image: (i) denuda-
tional hills, (ii) residual hills, (iii) linear ridges, (iv) pedi-
ment inselberg complexes, (v) pediments, (vi) pediplains,
(vii) flood plains, (viii) duricrusts, and (ix) valley fills
(Figure 4).
Lineaments
Lineaments, which are linear or curvilinear features, can
play a major role in identifying suitable sites for artificial
recharge of groundwater because they reflect rock struc-
tures through which water can percolate and travel up to
several kilometres. Lineaments present in the study area
can be grouped into four categories: (i) NE - SW trend-
ing lineaments, (ii) NW - SE trending lineaments, (iii) ENE
- WSW trending lineaments, and (iv) E - W trending lin-
eaments (Figure 5). Since areas around lineaments may
play an important role in promoting recharge of water
into the groundwater regime, a zone extending 300 m
around each lineament was considered in our study.
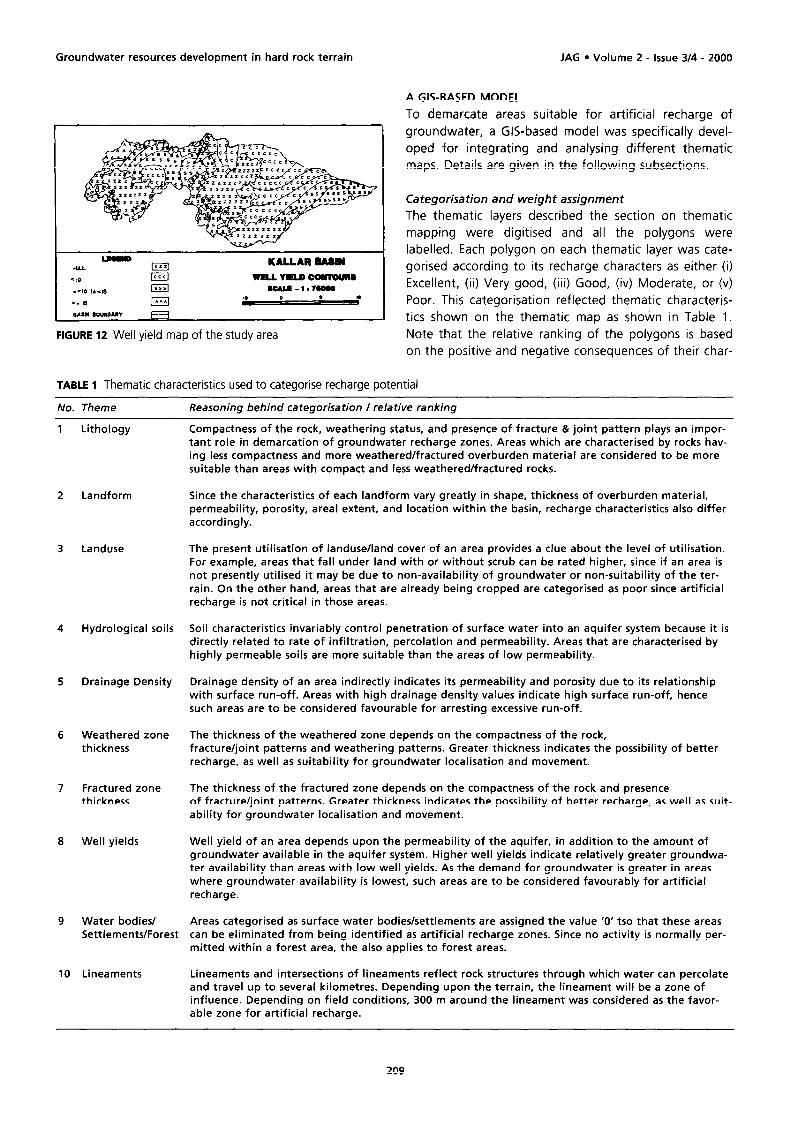
Landuselland cover
Information on present landuse /land cover provides
important indications of the extent of groundwater
requirements and groundwater utilisation, as well as
FIGURE 4 Landform map of the study area prepared from IRS
W SETTLEYIIT El FOMST Lr.r
KALLAR MUW
CR0Pl.M EJRO~Y lREI m LANDWI
F&Low L1D mW&TER moDy* w-lI7~ooo
m h-v LW WTH 110 .C.~aununDILLTIIQ TERRAI” WrH cuRleR”It m LAO WITH *cwa @
FIGURE 6 Landuseiland cover map of the study area prepared from IRS data
JAG l Volume 2 - Issue 314 - 2000
being an important indicator in the selection of sites for
artificial recharge of groundwater. The role of remotely
sensed data in providing such information has been con-
vincingly demonstrated in many previous studies due to
its capabilities for synoptic viewing and multi-spectral
and multi-temporal coverage. The study area was classi-
fied into different IanduseAand cover classes by visual
interpretation of satellite images (Figure 6): (i) settle-
ment, (ii) crop land, (iii) fallow land, (iv) land with scrub,
(v) land without scrub, (vi) forest, (vii) rocky area, (viii)
water bodies, and (ix) undulating terrain with duricrust.
Drainage density
The drainage density, expressed in terms of length of
channels per unit area (km km-z) indicates an expression
of the closeness of spacing of channels. It thus provides
a quantitative measure of the average length of stream
channels within different portions of the whole basin. In
our study, drainage density was considered as one of the
prime indicators for selection of artificial recharge sites
since it indirectly indicates the permeability and porosity
of the terrain. Figure 7 shows the drainage map of the
study area; the drainage density map is given in Figure 8.
In the Kallar Basin, as many as 21 sub-basins were delin-
eated (without any interbasinal areas between them).
The drainage density values were grouped into five cate-
FIGURE 5 Lineament map of the study area prepared from IRS data
W KALLAR lwuW
FIGURE 7 Drainage map of the study area
207

Groundwater resources development in hard rock terrain
gories: (i) <I .5 km km-z, (ii) >I .5 to <I .75 km km-z, (iii)
~I.75 to cl.85 km km-z. (iv) >I.85 to ~2.20 km km-z,
and (v) >2.20 km km-z.
Hydrological soils
Soil characteristics invariably control penetration of sur-
face water into an aquifer system and they are directly related to rates of infiltration, percolation and perme-
ability, for example. The hydrological soils map of the
study area was generated by evolution of the soil map
published by Soil Survey and Land Use Organisation,
Coimbatore. Ten different categories of soils were
demarcated (Figure 9) according to their hydrological
characteristics.
Weathered zone thickness
The predominant rocks exposed in the study area are Biotite Gneisses and Charnockites. The intensity of
weathering depends on the composition of the rocks.
Since the weathered mantle permits percolation of water into groundwater aquifers, a map showing the thickness
of the weathered zone was generated (Figure 10). Due to
variation in the compactness of the different rock units,
areas covered by Charnockite rock have relatively less
weathered thickness than Biotite Gneisses. The thickness
of the weathered zone in the study area varies between
JAG l Volume 2 - Issue 3/4 - 2000
7 and 68 m. Based on field observations, the weathered
thickness zone of the study area was grouped into four
categories: (i) <I 5 m, (ii) 15 to 25 m, (iii) 25 to 40 m, and
(iv) >40 m.
Fractured zone thickness
Highly fractured rock columns hold the maximum amount of water and have the highest percolation rate,
so highly fractured zones are considered to be most suit-
able for artificial recharge. Therefore a contour map
showing the thickness of fractured zones in the study
area was constructed (Figure 11). The thickness of frac-
tured zones in the study area ranges between 0 m and
81 m. Based on field observations, the thickness of frac-
tured zones was grouped into four categories: (i) <I 0 m, (ii) 10 to 35 m, (iii) 35 to 50 m, and (iv) >50 m.
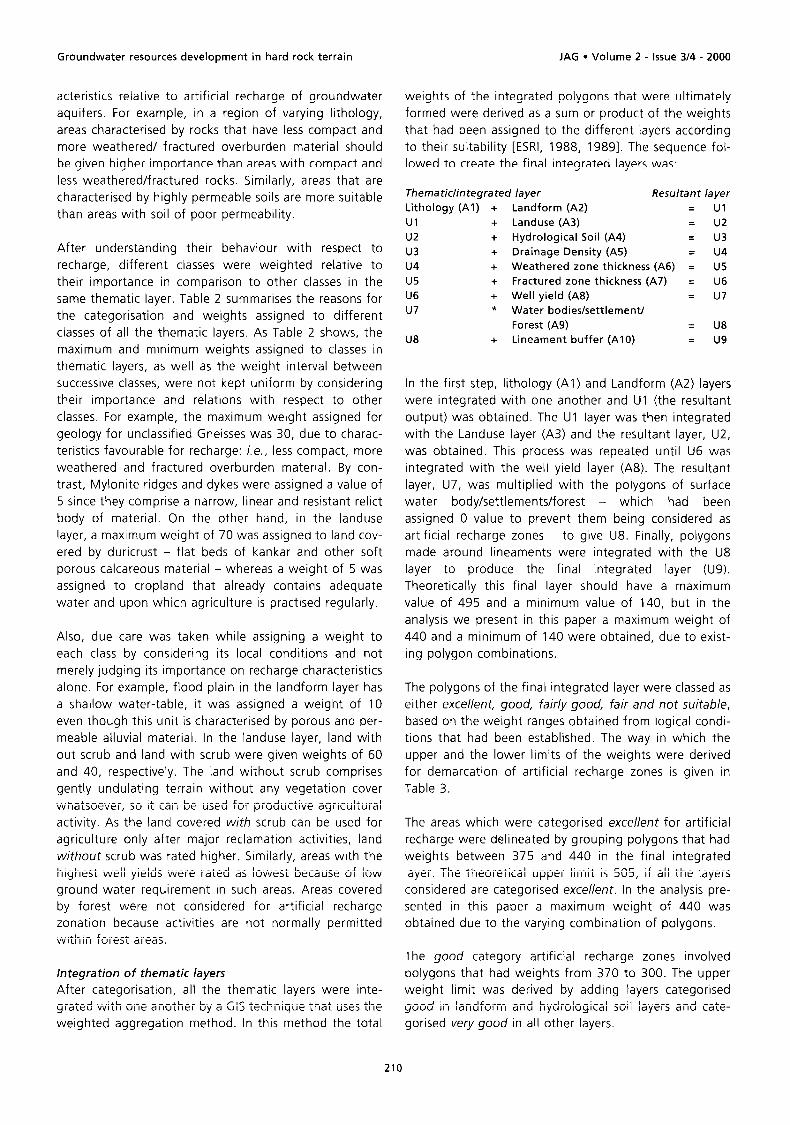
Well yield
Well yields in an area depend, for example, upon the per-
meability of the aquifer and the amount of available sub-
surface water in the aquifer system. A contour map was
prepared showing well yields with contour interval of
22.5 litres per minute (Figure 12). The zone of highest
well yield was observed in the western part of the study
area, while the zone of lowest well yield was observed in
the northeastern part of the study area
FIGURE 8 Drainage density map of the study area
FIGURE 10 Weathered thickness map of the study area
FIGURE 9 Hydrological soil map of the study area
Ll!Qu*) KALLAR BASIN
FIGURE II Fractured thickness map of the study area
208
Groundwater resources development in hard rock terrain JAG l Volume 2 - Issue 314 - 2000
FIGURE 12 Well yield map of the study area
TABLE I Thematic characteristics used to categorise recharge potential
A G&BASED MODEL
To demarcate areas suitable for artificial recharge of
groundwater, a G&based model was specifically devel-
oped for integrating and analysing different thematic
maps. Details are given in the following subsections.
Categorisation and weight assignment
The thematic layers described the section on thematic
mapping were digitised and all the polygons were
labelled. Each polygon on each thematic layer was cate-
gorised according to its recharge characters as either (i)
Excellent, (ii) Very good, (iii) Good, (iv) Moderate, or (v)
Poor. This categorisation reflected thematic characteris-
tics shown on the thematic map as shown in Table 1.
Note that the relative ranking of the polygons is based
on the positive and negative consequences of their char-
No. Theme Reasoning behind categorisation I relative ranking
1 Lithology
2 Landform
3 Landuse
Hydrological soils
Drainage Density
Weathered zone thickness
Fractured zone thickness
Well yields
Water bodies/ Settlements/Forest
Lineaments
209
Compactness of the rock, weathering status, and presence of fracture & joint pattern plays an impor- tant role in demarcation of groundwater recharge zones. Areas which are characterised by rocks hav- ing less compactness and more weathered/fractured overburden material are considered to be more suitable than areas with compact and less weathered/fractured rocks.
Since the characteristics of each landform vary greatly in shape, thickness of overburden material, permeability, porosity, areal extent, and location within the basin, recharge characteristics also differ accordingly.
The present utilisation of landuse/land cover of an area provides a clue about the level of utilisation. For example, areas that fall under land with or without scrub can be rated higher, since if an area is not presently utilised it may be due to non-availability of groundwater or non-suitability of the ter- rain. On the other hand, areas that are already being cropped are categorised as poor since artificial recharge is not critical in those areas.
Soil characteristics invariably control penetration of surface water into an aquifer system because it is directly related to rate of infiltration, percolation and permeability. Areas that are characterised by highly permeable soils are more suitable than the areas of low permeability.
Drainage density of an area indirectly indicates its permeability and porosity due to its relationship with surface run-off. Areas with high drainage density values indicate high surface run-off, hence such areas are to be considered favourable for arresting excessive run-off.
The thickness of the weathered zone depends on the compactness of the rock, fracture/joint patterns and weathering patterns. Greater thickness indicates the possibility of better recharge, as well as suitability for groundwater localisation and movement.
The thickness of the fractured zone depends on the compactness of the rock and presence of fracture/joint patterns. Greater thickness indicates the possibility of better recharge, as well as suit- ability for groundwater localisation and movement.
Well yield of an area depends upon the permeability of the aquifer, in addition to the amount of groundwater available in the aquifer system. Higher well yields indicate relatively greater groundwa- ter availability than areas with low well yields. As the demand for groundwater is greater in areas where groundwater availability is lowest, such areas are to be considered favourably for artificial recharge.
Areas categorised as surface water bodies/settlements are assigned the value ‘0’ tso that these areas can be eliminated from being identified as artificial recharge zones. Since no activity is normally per- mitted within a forest area, the also applies to forest areas.
Lineaments and intersections of lineaments reflect rock structures through which water can percolate and travel up to several kilometres. Depending upon the terrain, the lineament will be a zone of influence. Depending on field conditions, 300 m around the lineament was considered as the favor- able zone for artificial recharge.
Groundwater resources development in hard rock terrain
acteristics relative to artificial recharge of groundwater
aquifers. For example, in a region of varying lithology,
areas characterised by rocks that have less compact and
more weathered/ fractured overburden material should
be given higher importance than areas with compact and
less weathered/fractured rocks. Similarly, areas that are
characterised by highly permeable soils are more suitable
than areas with soil of poor permeability.
After understanding their behaviour with respect to
recharge, different classes were weighted relative to
their importance in comparison to other classes in the
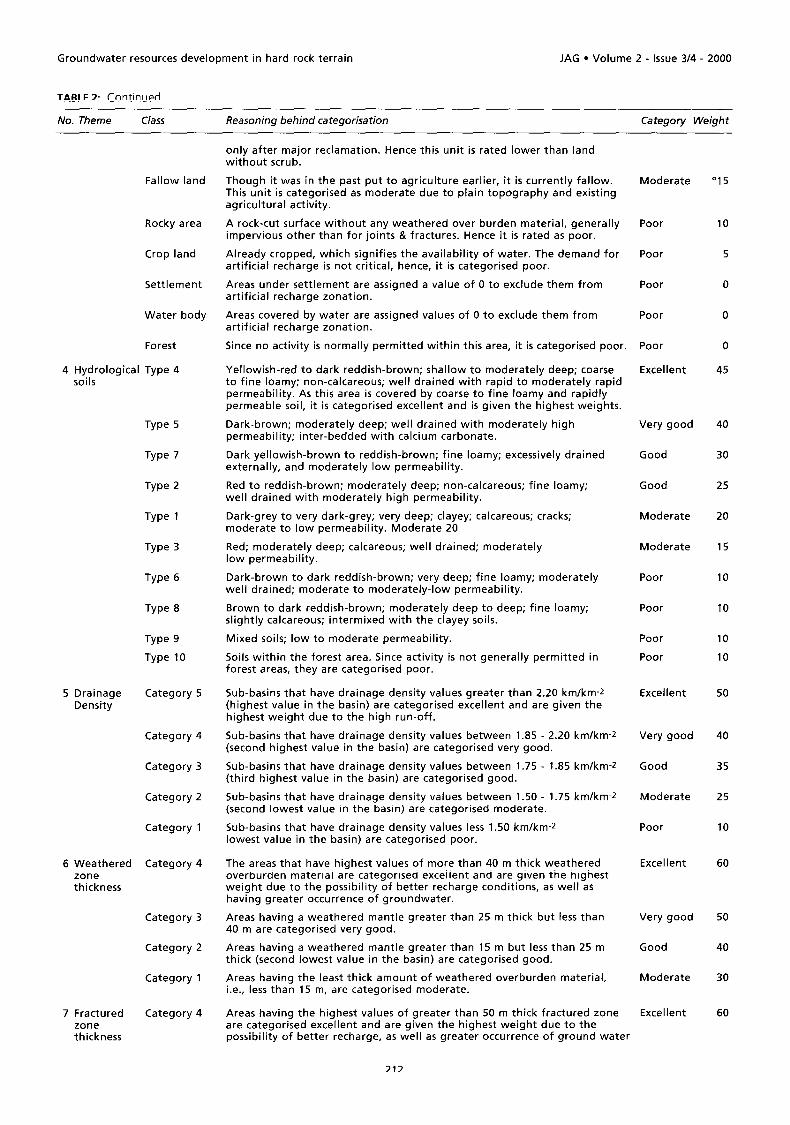
same thematic layer. Table 2 summarises the reasons for
the categorisation and weights assigned to different
classes of all the thematic layers. As Table 2 shows, the
maximum and minimum weights assigned to classes in
thematic layers, as well as the weight interval between
successive classes, were not kept uniform by considering
their importance and relations with respect to other
classes. For example, the maximum weight assigned for
geology for unclassified Gneisses was 30, due to charac-
teristics favourable for recharge: i.e., less compact, more
weathered and fractured overburden material. By con-
trast, Mylonite ridges and dykes were assigned a value of
5 since they comprise a narrow, linear and resistant relict
body of material. On the other hand, in the landuse
layer, a maximum weight of 70 was assigned to land cov-
ered by duricrust - flat beds of kankar and other soft
porous calcareous material - whereas a weight of 5 was
assigned to cropland that already contains adequate
water and upon which agriculture is practised regularly.
Also, due care was taken while assigning a weight to
each class by considering its local conditions and not
merely judging its importance on recharge characteristics
alone. For example, flood plain in the landform layer has
a shallow water-table, it was assigned a weight of 10
even though this unit is characterised by porous and per-
meable alluvial material. In the landuse layer, land with
out scrub and land with scrub were given weights of 60
and 40, respectively. The land without scrub comprises
gently undulating terrain without any vegetation cover
whatsoever, so it can be used for productive agricultural
activity. As the land covered with scrub can be used for
agriculture only after major reclamation activities, land
without scrub was rated higher. Similarly, areas with the
highest well yields were rated as lowest because of low ground water requirement in such areas. Areas covered
by forest were not considered for artificial recharge
zonation because activities are not normally permitted
within forest areas.
Integration of thematic layers
After categorisation, all the thematic layers were inte-
grated with one another by a GIS technique that uses the
weighted aggregation method. In this method the total
JAG l Volume 2 - Issue 3/4 - 2000
weights of the integrated polygons that were ultimately
formed were derived as a sum or product of the weights
that had been assigned to the different layers according
to their suitability [ESRI, 1988, 19891. The sequence fol-
lowed to create the final integrated layers was:
Thematic/integrated layer Resultant layer
Lithology (Al) + Landform (AZ) = Ul
Ul + Landuse (A3) = u2
u2 + Hydrological Soil (A4) = u3
u3 + Drainage Density (A5) u4
u4 + Weathered zone thickness (A6) 1 U5
u5 + Fractured zone thickness (A7) = U6
U6 + Well yield (A8) = u7
u7 * Water bodies/settlement/
Forest (A9) = U8
U8 + Lineament buffer (AIO) = u9
In the first step, lithology (Al) and Landform (AZ) layers
were integrated with one another and Ul (the resultant
output) was obtained. The Ul layer was then integrated
with the Landuse layer (A3) and the resultant layer, U2,
was obtained. This process was repeated until U6 was
integrated with the well yield layer (A8). The resultant
layer, U7, was multiplied with the polygons of surface
water body/settlements/forest - which had been
assigned 0 value to prevent them being considered as
artificial recharge zones - to give U8. Finally, polygons
made around lineaments were integrated with the U8
layer to produce the final integrated layer (U9).
Theoretically this final layer should have a maximum
value of 495 and a minimum value of 140, but in the
analysis we present in this paper a maximum weight of
440 and a minimum of 140 were obtained, due to exist-
ing polygon combinations.
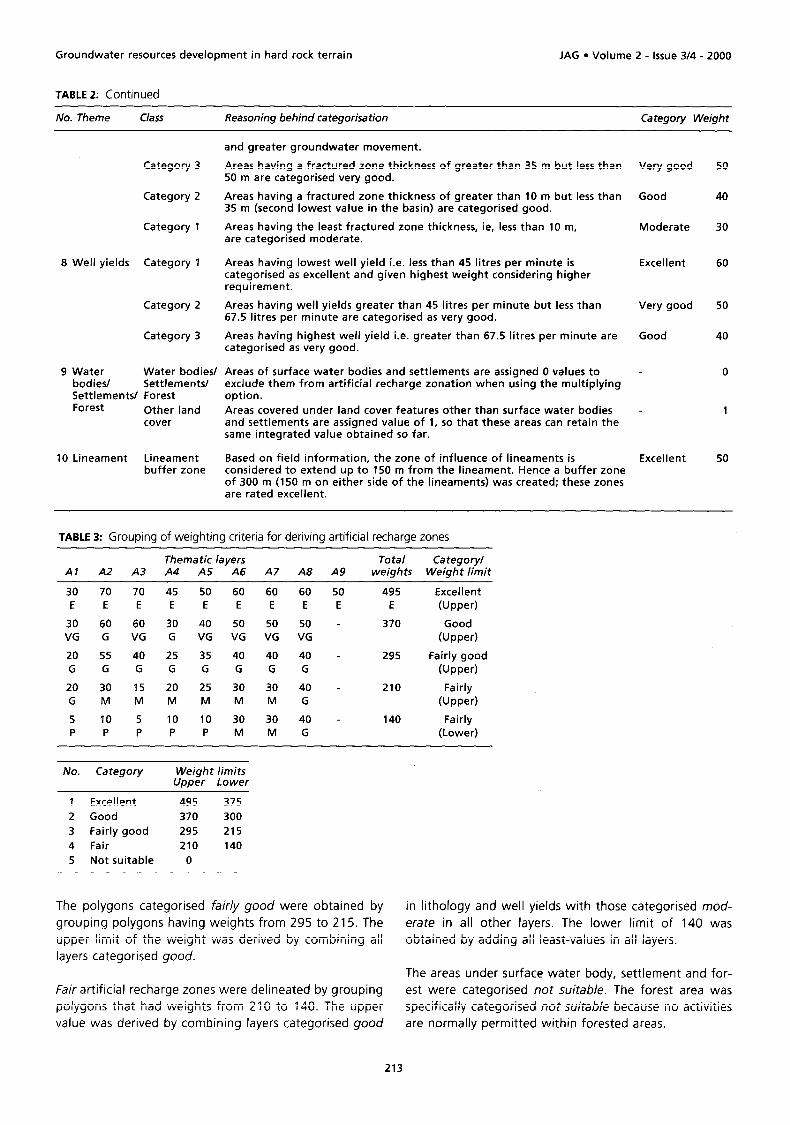
The polygons of the final integrated layer were classed as
either excellent, good, fairly good, fair and not suitable,
based on the weight ranges obtained from logical condi-
tions that had been established. The way in which the
upper and the lower limits of the weights were derived
for demarcation of artificial recharge zones is given in
Table 3.
The areas which were categorised excellent for artificial
recharge were delineated by grouping polygons that had
weights between 375 and 440 in the final integrated
layer. The theoretical upper limit is 505, if all the layers
considered are categorised excellent. In the analysis pre-
sented in this paper a maximum weight of 440 was
obtained due to the varying combination of polygons.
The good category artificial recharge zones involved
polygons that had weights from 370 to 300. The upper
weight limit was derived by adding layers categorised
good in landform and hydrological soil layers and cate-
gorised very good in all other layers.
210

Groundwater resources development in hard rock terrain JAG . Volume 2 - Issue 3/4 - 2000
TABLE 2: Reasoning behind categorisation of and weights assigned to different features affect artificial recharge site selection
No. Theme Class Reasoning behind categorisation Category Weight
1 Lithology Unclassified Gneisses
Charnockite
Mylonite ridge
Dyke
2 Landform Duricrust
Denudation hill
Residual hill
Valley fill
Pediplain
Pediment
Pediment insulberg Complex
Linear Ridge
Flood Plain permeable
3 Landuse Land covered under duricrust
Land without scrub
Land with The area covered under this category is characterized by gently undulating. scrub terrain and is covered with scrub. It could be used for agricultural activity
This rock unit is characterised by less compact rock with more weathered/ fractured overburden material than Charnockite; it is therefore considered to be relatively better than Charnockite. This observation corroborates with data on the thickness of the weathered/fractured overburden material collected in the field through borehole logs, geophysical vertical electrical sounding measurements and open well/road cuttings.
Compact and having less weathered/fractured overburden material than unclassified gneisses, it also has less joints/fracture patterns. Hence it is rated relatively lower than Unclassified Gneisses.
Linear ridge of resistant body, which acts as a run-off zone. Because of its linear relict nature, this unit is categorised poor.
Linear ridge of resistant body that acts as a run-off zone. Because of its linear relict nature and its narrower spatial extent, this unit is categorised poor.
This unit is characterised by flat lying beds of kankar and other calcareous material under a thin soil cover. These materials are soft and porous with high rate of percolation and infiltration. In places they are exposed as barren crust. Hence this unit has been categorised excellent when compared to any other landforms.
They are an exfoliated, elongated feature with a fractured &jointed rocky area still affected by the process of denudation. These hills are concen- trated around catchment regions and a number of streams originate from and criss-cross the hilly region of the sub-basin. This unit is rated as good. If a recharge structure is located within this unit it will benefit not only the area immediately surrounding the structure it but also down stream areas of the basin.
This unit is characterised by the hills, which are relatively less in spatial extent and occur as isolated land masses left over due to differential weathering.Within the study area this unit is concentrated mainly in the catchment area.lf a recharge structure is located with in this unit it will benefit not only the area immediately surrounding the structure but also the down stream areas of the basin. This unit is rated relatively lower than Denudational hill due to its spatial extent
As this unit is characterised by unconsolidated sediments of both colluvial and alluvial material, it is considered to be a good recharge area.
These are gently undulating landscape broken by isolated residual uplands and covered with varying thickness of overburden material that itself covered by soil. Generally they are characterised by high porosity and permeability, suggesting high infiltration rates. As this unit is characterised by gently undulating surfaces and lesser drainage networks, only specific artificial recharge structures can be constructed. Hence this unit is considered after Duricrust. Denudational hill, and Residual hill.
A rock-floored surface of low relief, generally without a weathered mantle. Normally this surface has low permeability.
A number of small isolated island-like hills that stands out in prominence in a dome form because of their resistance to weathering within the extensive pediment zone. Only a pediment zone within this entire unit is suitable for artificial recharge, hence it is categorised lower than pediment alone.
Linear ridge of resistant material; it acts as a run-off zone. Because of its linear relict nature, this unit is categorised poor.
Though this unit is characterized by alluvial material that is highly and porous, it is deliberately characterised as poor because this unit has experienced shallow water-tables.
This unit is characterised by the flat lying beds of kankar and other calcareous material under thin cover of soil. These materials are soft and porous with high rates of percolation and infiltration. In spots they are exposed as barren crust. Hence this unit has been rated as excellent when compared to any other landforms.
This area is characterized by gently undulating terrain that is not covered with any vegetation, be it either crops or scrub. It could however be used for productive agricultural activity. Hence this unit is considered very good (better than Land with scrub).
Very Good
Good
Poor
Poor
Excellent
Good
Good
Good
Good
Moderate
Moderate
Poor
Poor
Excellent
Very Good
Good
30
20
5
5
70
60
55
55
50
30
25
10
10
70
60
40
211
Groundwater resources development in hard rock terrain JAG l Volume 2 - issue 3/4 - 2000
TABLE 2: Continued
No. Theme Class Reasoning behind categorisation Category Weight
Fallow land Though it was in the past put to agriculture earlier, it is currently fallow. This unit is categorised as moderate due to plain topography and existing agricultural activity.
Rocky area
Crop land
Settlement
A rock-cut surface without any weathered over burden material, generally impervious other than for joints & fractures. Hence it is rated as poor.
Already cropped, which signifies the availability of water. The demand for artificial recharge is not critical, hence, it is categorised poor.
Areas under settlement are assigned a value of 0 to exclude them from artificial recharge zonation.
Water body Areas covered by water are assigned values of 0 to exclude them from artificial recharge zonation.
Forest Since no activity is normally permitted within this area, it is categorised poor.
4 Hydrological Type 4 Yellowish-red to dark reddish-brown; shallow to moderately deep; coarse to fine loamy; non-calcareous; well drained with rapid to moderately rapid permeability. As this area is covered by coarse to fine loamy and rapidly permeable soil, it is categorised excellent and is given the highest weights.
Dark-brown; moderately deep; well drained with moderately high permeability; inter-bedded with calcium carbonate.
Dark yellowish-brown to reddish-brown; fine loamy; excessively drained externally, and moderately low permeability.
Red to reddish-brown; moderately deep; non-calcareous; fine loamy; well drained with moderately high permeability.
Dark-grey to very dark-grey; very deep; clayey; calcareous; cracks; moderate to low permeability. Moderate 20
Red; moderately deep; calcareous; well drained; moderately low permeability.
soils
5 Drainage Density
6 Weathered zone thickness
7 Fractured zone thickness
Type 5
Type 7
Type 2
Type 1
Type 3
Type 6
Type 8
Me 9
Type 10
Category 5
Category 4
Category 3
Category 2
Category 1
Category 4
Category 3
Category 2
Category 1
Category 4
only after major reclamation. Hence this unit is rated lower than land without scrub.
Dark-brown to dark reddish-brown; very deep; fine loamy; moderately well drained; moderate to moderately-low permeability.
Brown to dark reddish-brown; moderately deep to deep; fine loamy; slightly calcareous; intermixed with the clayey soils.
Mixed soils; low to moderate permeability.
Soils within the forest area. Since activity is not generally permitted in forest areas, they are categorised poor.
Sub-basins that have drainage density values greater than 2.20 km/km-z (highest value in the basin) are categorised excellent and are given the highest weight due to the high run-off.
Sub-basins that have drainage density values between 1.85 - 2.20 km/km-z (second highest value in the basin) are categorised very good.
Sub-basins that have drainage density values between 1.75 - 1.85 km/km-z (third highest value in the basin) are categorised good.
Sub-basins that have drainage density values between 1.50 - 1.75 km/km-z (second lowest value in the basin) are categorised moderate.
Sub-basins that have drainage density values less 1.50 km/km-z lowest value in the basin) are categorised poor.
The areas that have highest values of more than 40 m thick weathered overburden material are categorised excellent and are given the highest weight due to the possibility of better recharge conditions, as well as having greater occurrence of groundwater.
Areas having a weathered mantle greater than 25 m thick but less than 40 m are categorised very good.
Areas having a weathered mantle greater than 15 m but less than 25 m thick (second lowest value in the basin) are categorised good.
Areas having the least thick amount of weathered overburden material, i.e., less than 15 m, are categorised moderate.
Areas having the highest values of greater than 50 m thick fractured zone are categorised excellent and are given the highest weight due to the possibility of better recharge, as well as greater occurrence of ground water
212
Moderate O15
Poor 10
Poor 5
Poor 0
Poor 0
Poor
Excellent
0
45
Very good 40
Good 30
Good 25
Moderate 20
Moderate 15
Poor 10
Poor 10
Poor
Poor
10
10
Excellent 50
Very good 40
Good 35
Moderate 25
Poor 10
Excellent 60
Very good 50
Good 40
Moderate 30
Excellent 60
Groundwater resources development in hard rock terrain JAG l Volume 2 - Issue 314 - 2000
TABLE 2: Continued
No. Theme Class Reasoning behind categorization Category Weight
Category 3
Category 2
Category I
8 Well yields Category I
Category 2
Category 3
9 Water Water bodies/ bodies/ Settlements/ Settlements/ Forest Forest Other land
cover
IO Lineament Lineament buffer zone
and greater groundwater movement.
Areas having a fractured zone thickness of greater than 35 m but less than Very good 50 m are categorised very good.
50
Areas having a fractured zone thickness of greater than 10 m but less than Good 35 m (second lowest value in the basin) are categorised good.
Areas having the least fractured zone thickness, ie, less than IO m, Moderate are categorised moderate.
40
30
Areas having lowest well yield i.e. less than 45 litres per minute is categorised as excellent and given highest weight considering higher requirement.
Excellent 60
Areas having well yields greater than 45 litres per minute but less than Very good 67.5 litres per minute are categorised as very good.
Areas having highest well yield i.e. greater than 67.5 litres per minute are Good categorised as very good.
Areas of surface water bodies and settlements are assigned 0 values to - exclude them from artificial recharge zonation when using the multiplying option.
Areas covered under land cover features other than surface water bodies - and settlements are assigned value of I, so that these areas can retain the same integrated value obtained so far.
Based on field information, the zone of influence of lineaments is Excellent considered to extend up to 150 m from the lineament. Hence a buffer zone of 300 m (150 m on either side of the lineaments) was created; these zones are rated excellent.
50
40
0
I
50
TABLE 3: Grouping of weighting criteria for deriving artificial recharge zones
Thematic layers Total Category1 Al A2 A3 A4 A5 A6 A7 A8 A9 weights Weight limit
30 70 70 45 50 60 60 60 50 E E E E E E E E E
30 60 60 30 40 50 50 50 - VG G VG G VG VG VG VG
20 55 40 25 35 40 40 40 - G G G G G G G G
20 30 I5 20 25 30 30 40 -
G M M M M M M G
5 IO 5 IO 10 30 30 40 - P P P P P M M G
495 E
370
295
210
140
Excellent
(Upper)
Good
(Upper)
Fairly good
(Upper)
Fairly
(Upper)
Fairly (Lower)
No. Category Weight limits Upper Lower
1 Excellent 495 375
2 Good 370 300
3 Fairly good 295 215
4 Fair 210 140
5 Not suitable 0
The polygons categorised fairly good were obtained by in lithology and well yields with those categorised mod-
grouping polygons having weights from 295 to 215. The crate in all other layers. The lower limit of 140 was upper limit of the weight was derived by combining all obtained by adding all least-values in all layers. layers categorised good.
The areas under surface water body, settlement and for- Fair artificial recharge zones were delineated by grouping est were categorised not suitable. The forest area was polygons that had weights from 210 to 140. The upper specifically categorised not suitable because no activities
value was derived by combining layers categorised good are normally permitted within forested areas.
213

Groundwater resources development in hard rock terrain
By utilising the model discussed above, a map showing
the artificial recharge zones of the study area was pre-
pared (Figure 13). The preliminary artificial recharge
zone map prepared through remote sensing and GIS
techniques was verified in the field for correctness: the
artificial zones demarcated were in agreement with
conditions in the field. By superimposing the drainage
network map over the artificial recharge zone map and
also considering the terrain conditions, the exact type
of artificial recharge structure suitable for replenishing
groundwater in the study area was identified. The
results of our study should help decision-makers set in
motion the steps required to replenish groundwater
aquifer systems.
LDmND KALLAR BASIN EXCELLENT B B*SIN BO”YDeiRI E DOOD m ARTIFICIAL RECHAROE ZONE
FIGURE 13 Map of artificial recharge zones in the study area prepared using remote sensing and GIS techniques
CONCLUSIONS
In order to demarcate artificial recharge zones, different
thematic maps were prepared using either remote sens-
ing techniques or data collected through conventional
field methods. These included maps of lithology, linea-
ments, landforms and landuse from remotely sensed
data; and maps of drainage density, weathered thickness
zone, fractured thickness zone, hydrological soils and
well yield from data collected by conventional survey
methods. By integrating the different thematic layers
using a G&based model developed specifically for this
purpose, an artificial recharge zones map of the study
area was prepared. The drainage network map was
superimposed over the artificial recharge zones map and,
taking into consideration terrain conditions, suitable sites
for construction of artificial recharge structures were
identified. Our study demonstrates the capabilities of
remotely sensed data and GIS techniques for selection of
sites for artificial recharge, especially in hard rock terrain.
Since the present approach was based on logical condi-
tions and reasoning, the same approach can be used
elsewhere with appropriate modifications, especially in
hard rock terrain, where the occurrence of groundwater
is more restricted and complex in nature.
JAG l Volume 2 - Issue 3/4 - 2000
ACKNOWLEDGEMENTS
We are grateful to Dr M.G. Chandrasekhar in his previ-
ous capacity of Scientific Secretary, ISRO Hq, Bangalore,
and Professor S.M. Ramasamy, School of Earth Science,
Tiruchirapalli, for their encouragement to carry out this
study. We are also thankful to officials of the Public
Works Department, Tamil Nadu, for providing ground-
water yield and bore hole data, and to officials of the Soil
and Land use Organisation, Coimbatore, Tamil Nadu, for
providing us with a soil map of the study area.
REFERENCES
Anonymous, 1979. Satellite remote sensing survey - southern part of Tamil Nadu. Project Report, Volumes I & Il. Department of Space, National Remote Sensing Agency, Hyderabad, India.
Baldev, S., A. Bhattacharya & V.S. Hedge, 1991. IRS-IA applicatron for ground water targeting. Journal of Current Science 61(3&4): 172-179.
Basappa Reddy, M. & R.L. Gaikwad, 1985. Use of remote sensing techniques for targetting ground water in fractured crystalline rocks: two case studies from Karnataka. Proceedings, Sixth Asian Conference on Remote Sensing, Hyderabad, 21-26 November 1985, pp. 322-327. (Japan : Asian Association on Remote Sensing)
Chaturvedi, R.S., D.C. Bhattacharya, P. Kamal, J. Krishnamurthy & N. Sunder Raman, 1983. Integrating remote sensing technrques in ground water exploration - a typical case study from Bundelkhand region in Uttar Pradesh. Proceedings, National Symposium on Remote Sensing in Development and Management of Water Resources, Ahmedabad, 25-27, October 1983, pp 267-276, edited by Baldev sahai, R.S Chaturvedi, H.S.lyer, (Dehradun : Indian Society of Photo-Interpretation and Remote Sensing)
Chi, K.H. & B.J. Lee, 1994. Extracting potential ground water area using remotely sensed data and GIS techniques. Proceedings, Regional Seminar on Integrated Applications of Remote Sensing and GIS for Land and Water Resources Management ESCAP. Bangkok, pp. 64-69.
ESRI (Environmental System Research Instrtute), 1988. User Guide ARC/INFO: The Geographic Information System software. ESRI, Redlands, CA.
ESRI (Environmental System Research Institute), 1989. ARC/INFO training course class material, Volume 1. ESRI, Redlands, CA.
Gustafsson, P., 1993. High resolution satellite data and GIS as a tool for assessment of ground water potential of a semi-arid area. IXth Thematic Conference on Geologic Remote Sensing, Pasadena, CA, 8-11 February 1993, Vol 1, pp 609619.
Jeyaram, A., 1997. Water Resources Assessment and Management in Uma-Kalhar Watershed, Chandrapur District, Using Remote Sensing and a Geographic Information System. PhD thesis (unpublished), Nagpur University, India.
Krishnamurthy, J., 1993. Geological and hydrogeologrcal studies of parts of Karnataka between latrtudes 13” N and 14” N using remote sensing techniques. PhD thesis (unpublished). Bangalore University, India, I-21 5.
Krishnamurthy, J. & G. Srinivas, 1995. Role of geological and geo- morphological factors in ground water exploration: a study using IRS LISS data. International Journal of Remote Sensing 16(14): 2595-2618.
Krishnamurthy, J., P. Manavalan & V. Saivasan, 1992. Application of digital enhancement techniques for ground water exploration in a hard rock terrain. International Journal of Remote Sensing 13 (15): 2925-2942.
214
Groundwater resources development in hard rock terrain JAG l Volume 2 - Issue 3/4 - 2000
Krishnamurthy, J., N. Venkatesa Kumar, V. Jayaraman & M. Manivel, 1996. An approach to demarcate ground water potential zones through remote sensing and geographic information systems. International Journal of Remote Sensing 17( 10): 1867-l 884.
Manavalan, P., J. Krishnamurthy, B. Manikiam, S. Adiga, K. Radhakrishnan & M.G. Chandrasekhar, 1993. Watershed analy- sis response using digital data integration techniques. Advanced Space Research 13, No.5, (5) 177 - (5) 180.
Murthy, K.S.R., 2000. Ground water potential in a semi-arid region of Andhra Pradesh - a geographical information system approach. International Journal of Remote Sensing 21(g): 1867- 1884.
Padmavathy, A.S., K. Ganesha Raj, N. Yogarajan, P. Thangavel & M.G. Chandrasekhar, 1993. Check dam site selection using GIS approach. Journal of Advances in Space Research 13: 123-127.
Public Works Department, 1994. Report on ground water resources of Tamil Nadu. Present status of development, June 1994. Government of Tamil Nadu, PWD, Madras.
Raj, S. & A.K Sinha, 1989. An integral approach for the delineation of potential groundwater zones using satellite data: case study, Udaipur District, Rajasthan. Asia-Pacific Remote Sensing Journal 2(l): 61-64.
Ranna, S.S.. 1998. Applications of directional filtering in lineament mapping for ground water prospecting around Bhinmal - a semi-arid part of Thar desert, Photonirvachak. Journal of Indian Society of Remote Sensing 26(1&z): 35-44.
Saraf, A.K. & SK. Jain, 1996, Integrated use of remote sensing and GIS methods for ground water exploration in parts of Lalitpur District, U.P. In: Subsurface-water Hydrology, edt. by V. P. Singh and B. Kumar, Kluwer Academic Publishers, pp.251-259.
Saraf, A.K. & P.R. Choudhury, 1998. Integrated remote sensing and GIS for groundwater exploration and identification of artificial recharge sites. International Journal of Remote Sensing 19(10): 1825-1841.
Shahid, S., S.K. Nath & J. Roy, 2000. Groundwater potential model- ling in a soft rock area using a GIS. International Journal of Remote Sensing 2 l(9): 1919-l 924.
Sohani, G.G., F. Simpson, B.K. Kakade, W.H. Blackburn, V.J. Harris, G.V. Jadhav, D.N. Joshi, SC. Kanekar, A. Kaulagekar, S.G. Patil, P.R. Sharma, M.G. Sklash, T.E. Smith & D.W. Steele, 1998, Conjunctive use of water resources in Deccan trap, India. Report :BAIF Development Research Foundation, Pune, India,
Thillaigovindarajan, S., 1999. Ground water recharge - case study from Tamil Nadu. Lecture notes, UNESCO Regional Training Programme on Remote Sensing Applications to Geology. Department of Geology, Anna University, Chennai, India.
Venkateswara Rao, B., 1998. Hydrogeomorphological investigations in a typical Khondalitic terrain using remote sensing data, Journal of Indian Society of Remote Sensing 26(1&2): 77-93.
RESUME
Pour demontrer les capacites de la t&detection et des tech- niques de SystPme d’lnformation Geographique (SIG) pour le developpement des ressources d’eau souterraine dans des ter- rains de roche dure, specialement pour la demarcation de sites appropries pour la recharge artificielle d’eau souterraine, une etude a ete faite dans le bassin Kallar, qui est situ& en partie dans les districts de Salem et Tiruchirapalli, Tamil Nadu, lnde. Des cartes thematiques definissant la lithologie, les lineaments, les formes de terrain, I’occupation du sol, la densite de draina- ge, I’epaisseur de zone humide, I’epaisseur de zone fracturee, les sols hydrologiques et le rendement des sources ont ete pre- parees a partir de donnees acquises par le satellite indien de teledetection (IRS) - IC et par des methodes conventionnelles. Toutes les couches thematiques ont et@ integrees en utilisant un modele SIG developpe specialement dans ce but, permettant de creer une carte montrant les zones de recharge artificielle. Le type exact de structure de recharge artificielle, ex. barrage de controle, “nallabund”, mise en place de caniveaux, etang de percolation, appropries pour alimenter I’eau souterraine a ete identifie en superposant une carte de reseau de drainage sur une carte de zones de recharge artificielle. La demarcation de zones artificielles basee sur un SIG developpe dans cette etude a ete basee sur des conditions logiques et le raisonnement, de sorte que les m@mes techniques (avec des modifications appro- prices) pourraient @tre adoptees ailleurs, specialement dans un terrain a roche dure, oti I’occurrence d’eau souterraine est limi- tee et sujette a une plus grande complexite.
RESUMEN
Se realize un estudio en la cuenca de Kallar localizada en partes de 10s distritos Salem y Tiruchirapalli, en Tamil Nadu, India, para demostrar la capacidad de las tecnicas de teledeteccion y de 10s sistemas de informacidn geogrdfica (SIG) para el desarrollo de 10s recursos de aguas subterraneas en terrenos de rotas duras, especificamente para la delineation de sitios aptos para la recar- ga artificial de acuiferos subterraneos. Se elaboraron mapas tematicos referidos a litologia, lineamientos, formas de terreno, uso de las tierras, densidad de drenaje, espesor de la zona de meteorizacion, espesor de la zona fracturada, suelos hidrologi- cos, y rendimiento de pozos, a partir de datos suministrados por el Indian Remote Sensing Satellite (IRS)-IC y por metodos con- vencionales. Se integraron todas las capas tematicas en un modelo basado en SIG y desarrollado especificamente para este proposito, el cual permitio elaborar un mapa mostrando las zonas de recarga artificial a ser generadas. El tipo precise de estructura requerido para la recarga artificial, por ejemplo dique de retention, nallabund (dique), tapon de cdrcava y laguna de percolation, apropiado para reabastecer las aguas subterraneas, se identific6 mediante superposition de un mapa de la red de drenaje sobre un mapa de las zonas de recarga artificial. La deli- neaci6n de las zonas de recarga artificial en SIG se bas6 en con- diciones y razonamiento Iogicos, de tal manera que las mismas tecnicas (con modificaciones apropiadas) podrian ser adoptadas en otras areas, especialmente en terrenos de rotas duras donde la ocurrencia de aguas subterraneas es limitada y sujeta a patro- nes complejos.
215