
Soil erosion and non-point source pollution impacts assessment with the aid of multi-temporal remote...
14
UNCORRECTED PROOF Soil erosion and non-point source pollution impacts assessment with the aid of multi-temporal remote sensing images Shu-Kuang Ning a , Ni-Bin Chang b, * , Kai-Yu Jeng c , Yi-Hsing Tseng d a Department of Civil and Environmental Engineering, National University of Kaohsiung, Kaohsiung, Taiwan, ROC b Department of Civil and Environmental Engineering, University of Central Florida, Orlando, FL 32826, USA c Department of Environmental Engineering, National Cheng-Kung University, Tainan, Taiwan, ROC d Department of Surveying Engineering, National Cheng-Kung University, Tainan, Taiwan, ROC Received 15 November 2004; revised 20 March 2005; accepted 24 May 2005 Abstract Soil erosion associated with non-point source pollution is viewed as a process of land degradation in many terrestrial environments. Careful monitoring and assessment of land use variations with different temporal and spatial scales would reveal a fluctuating interface, punctuated by changes in rainfall and runoff, movement of people, perturbation from environmental disasters, and shifts in agricultural activities and cropping patterns. The use of multi-temporal remote sensing images in support of environmental modeling analysis in a geographic information system (GIS) environment leading to identification of a variety of long-term interactions between land, resources, and the built environment has been a highly promising approach in recent years. This paper started with a series of supervised land use classifications, using SPOT satellite imagery as a means, in the Kao-Ping River Basin, South Taiwan. Then, it was designed to differentiate the variations of eight land use patterns in the past decade, including orchard, farmland, sugarcane field, forest, grassland, barren, community, and water body. Final accuracy was confirmed based on interpretation of available aerial photographs and global positioning system (GPS) measurements. Finally, a numerical simulation model (General Watershed Loading Function, GWLF) was used to relate soil erosion to non- point source pollution impacts in the coupled land and river water systems. Research findings indicate that while the decadal increase in orchards poses a significant threat to water quality, the continual decrease in forested land exhibits a potential impact on water quality management. Non-point source pollution, contributing to part of the downstream water quality deterioration of the Kao-Ping River system in the last decade, has resulted in an irreversible impact on land integrity from a long-term perspective. q 2005 Elsevier Ltd. All rights reserved. Keywords: Land use classification; Remote sensing; Environmental impact assessment; River basin management; Erosion control; Non-point source pollution 1. Introduction With rapid socio-economic changes and various environ- mental perturbations during the last decade, land resources of populated areas, such as the Kao-Ping River Basin in South Taiwan, have been depleted and eroded significantly, resulting in increased ecological vulnerability and hydro- logical disruption. Furthermore, the instable geological structure resulting from earthquake impacts has led to accelerated soil erosion, increased turbidity of rivers, and more incidences of debris flow when storm events occur. Ecosystem integrity due to such variations also becomes an urgent focus for the prospective planning of the land exploitation in this river basin. Change detection of land use and land cover is one of the essential practices in many interrelated disciplinary areas, such as soil erosion, flood control, landscape conservation, ecosystem restoration, and water quality management via non-point source pollution control. Careful monitoring and assessment with different temporal and spatial scales in this regard would reveal a fluctuating interface, punctuated by changes in rainfall and runoff, movement of people, perturbation from environ- mental disasters, and shifts in agricultural activities and cropping patterns. Many previous analyses focused on investigating the interactive relationship between soil erosion associated with Journal of Environmental Management xx (xxxx) 1–14 www.elsevier.com/locate/jenvman 0301-4797/$ - see front matter q 2005 Elsevier Ltd. All rights reserved. doi:10.1016/j.jenvman.2005.05.019 * Corresponding author. Tel.: C1 361 455 3179. E-mail address: [email protected] (N.-B. Chang). YJEMA 1027—8/9/2005—15:39—SPRIYA—163790—XML MODEL 5 – pp. 1–14 DTD 5 ARTICLE IN PRESS 1 2 3 4 5 6 7 8 9 10 11 12 13 14 15 16 17 18 19 20 21 22 23 24 25 26 27 28 29 30 31 32 33 34 35 36 37 38 39 40 41 42 43 44 45 46 47 48 49 50 51 52 53 54 55 56 57 58 59 60 61 62 63 64 65 66 67 68 69 70 71 72 73 74 75 76 77 78 79 80 81 82 83 84 85 86 87 88 89 90 91 92 93 94 95 96 97 98 99 100 101 102 103 104 105 106 107 108 109 110 111 112
Transcript of Soil erosion and non-point source pollution impacts assessment with the aid of multi-temporal remote...

DTD 5 ARTICLE IN PRESS
1
2
3
4
5
6
7
8
9
10
11
12
13
14
15
16
17
18
19
20
21
22
23
24
25
26
27
28
29
30
31
32
33
34
35
36
37
38
39
40
41
42
43
44
45
46
47
48
49
50
51
52
53
54
55
56
57
58
59
60
61
62
63
64
65
66
67
68
69
70
71
72
73
74
75
76
77
78
79
80
81
82
83
84
85
86
87
88
89
90
91
92
93
94
95
CTED PROOF
Soil erosion and non-point source pollution impacts assessment
with the aid of multi-temporal remote sensing images
Shu-Kuang Ninga, Ni-Bin Changb,*, Kai-Yu Jengc, Yi-Hsing Tsengd
aDepartment of Civil and Environmental Engineering, National University of Kaohsiung, Kaohsiung, Taiwan, ROCbDepartment of Civil and Environmental Engineering, University of Central Florida, Orlando, FL 32826, USA
cDepartment of Environmental Engineering, National Cheng-Kung University, Tainan, Taiwan, ROCdDepartment of Surveying Engineering, National Cheng-Kung University, Tainan, Taiwan, ROC
Received 15 November 2004; revised 20 March 2005; accepted 24 May 2005
Abstract
Soil erosion associated with non-point source pollution is viewed as a process of land degradation in many terrestrial environments.
Careful monitoring and assessment of land use variations with different temporal and spatial scales would reveal a fluctuating interface,
punctuated by changes in rainfall and runoff, movement of people, perturbation from environmental disasters, and shifts in agricultural
activities and cropping patterns. The use of multi-temporal remote sensing images in support of environmental modeling analysis in a
geographic information system (GIS) environment leading to identification of a variety of long-term interactions between land, resources,
and the built environment has been a highly promising approach in recent years. This paper started with a series of supervised land use
classifications, using SPOT satellite imagery as a means, in the Kao-Ping River Basin, South Taiwan. Then, it was designed to differentiate
the variations of eight land use patterns in the past decade, including orchard, farmland, sugarcane field, forest, grassland, barren, community,
and water body. Final accuracy was confirmed based on interpretation of available aerial photographs and global positioning system (GPS)
measurements. Finally, a numerical simulation model (General Watershed Loading Function, GWLF) was used to relate soil erosion to non-
point source pollution impacts in the coupled land and river water systems. Research findings indicate that while the decadal increase in
orchards poses a significant threat to water quality, the continual decrease in forested land exhibits a potential impact on water quality
management. Non-point source pollution, contributing to part of the downstream water quality deterioration of the Kao-Ping River system in
the last decade, has resulted in an irreversible impact on land integrity from a long-term perspective.
q 2005 Elsevier Ltd. All rights reserved.
Keywords: Land use classification; Remote sensing; Environmental impact assessment; River basin management; Erosion control; Non-point source pollution
96
97
98
99
100
101
102
103
104
105
106
CORRE1. Introduction
With rapid socio-economic changes and various environ-
mental perturbations during the last decade, land resources
of populated areas, such as the Kao-Ping River Basin in
South Taiwan, have been depleted and eroded significantly,
resulting in increased ecological vulnerability and hydro-
logical disruption. Furthermore, the instable geological
structure resulting from earthquake impacts has led to
accelerated soil erosion, increased turbidity of rivers, and
UN0301-4797/$ - see front matter q 2005 Elsevier Ltd. All rights reserved.
doi:10.1016/j.jenvman.2005.05.019
* Corresponding author. Tel.: C1 361 455 3179.
E-mail address: [email protected] (N.-B. Chang).
YJEMA 1027—8/9/2005—15:39—SPRIYA—163790—XML MODEL 5 – pp. 1–14
107
108
109
110
111
112
more incidences of debris flow when storm events occur.
Ecosystem integrity due to such variations also becomes an
urgent focus for the prospective planning of the land
exploitation in this river basin. Change detection of land use
and land cover is one of the essential practices in many
interrelated disciplinary areas, such as soil erosion, flood
control, landscape conservation, ecosystem restoration, and
water quality management via non-point source pollution
control. Careful monitoring and assessment with different
temporal and spatial scales in this regard would reveal a
fluctuating interface, punctuated by changes in rainfall and
runoff, movement of people, perturbation from environ-
mental disasters, and shifts in agricultural activities and
cropping patterns.
Many previous analyses focused on investigating the
interactive relationship between soil erosion associated with
Journal of Environmental Management xx (xxxx) 1–14
www.elsevier.com/locate/jenvman

T
YJ
S.-K. Ning et al. / Journal of Environmental Management xx (xxxx) 1–142
DTD 5 ARTICLE IN PRESS
113
114
115
116
117
118
119
120
121
122
123
124
125
126
127
128
129
130
131
132
133
134
135
136
137
138
139
140
141
142
143
144
145
146
147
148
149
150
151
152
153
154
155
156
157
158
159
160
161
162
163
164
165
166
167
168
169
170
171
172
173
174
175
176
177
178
179
180
181
182
183
184
185
186
187
188
189
190
191
192
193
194
195
196
197
198
199
200
201
202
203
204
205
206
207
208
209
210
211
212
213
214
215
216
217
218
219
220
221
222
223
224
UNCORREC
non-point source discharge and ecosystem management.
Some pinpointed the effects of environmental changes that
would impact both the ecological characteristics of plant
species and their distribution and abundance in specific
landscapes (Hoffmann, 1998). Others assessed landscape
changes in terms of landscape functions and conservation
potential to form a comparative basis in the search for the
optimal ecological management alternative (Bastian and
Roder, 1998). The most susceptible factor that affects
ecosystem functioning is actually the seasonal patterns of
soil moisture distribution, inorganic nutrients, organic
nitrogen, and soil erosion over the most abundant vegetation
types in some typical watersheds around the world
(Arhonditsis et al., 2000). In the past, environmental studies
were often designed to determine the nutrient concentrations
in runoff sediments in order to quantify the outflows of the
ecosystem’s nutrient budget for preserving agricultural
productivity and diminishing non-point pollution (Arhon-
ditsis et al., 2000). Some case studies explored socio-
economic, climatic, and lithological components of the
erosion processes leading to development of a risk-based
map associated with the large-scale clearance of dispersive
soils for arboriculture (Warren et al., 2001; Faulkner et al.,
2003).
Best management practices (BMPs) have long been
recognized as an integral part of water pollution prevention
and control in river basins for controlling non-point source
pollution using ecologically benign approaches. Simulation
analyses of non-point source pollution impacts, which are
instrumental to Total Maximum Daily Loads (TMDLs)
programs, play an important role in decision-making
(Shoemaker et al., 1997). They help planners identify,
analyze, and simulate the impacts of alternative land use
management policies and practices with respect to non-point
source pollution control. Various types of non-point source
numerical simulation models were employed to account for
the integrated impacts of hydrological cycle and land use
pattern in relation to nutrient yield (Bailey et al., 1974;
Donigian et al., 1996). They can be further classified as
distributed (i.e. grid-based approach) and lumped (i.e. semi-
mechanistic approach) parameter hydrologic models. Two
salient examples based on a monthly scale in each category
include the generalized watershed loading function (GWLF)
(Haith et al., 1992) and the Cornell non-point sources
simulation model (CNPS) (Dikshit and Loucks, 1995, 1996).
More elaborate grid-based numerical simulation models for
assessing non-point source waste loads in the agricultural
field may enable planners to assess detailed pros and cons of
different policy options. They generally simulate rainfall,
soil erosion, run-off sediment, temperature, wind speed,
atmospheric pressure, and non-point source processes
leading to estimate pollutant loading at the watershed outlet.
Existing examples include ANSWERS (Beasley and
Huggins, 1982), HSPF (Donigian et al., 1980), and AGNPS
(Young et al., 1989). Synergy of different models is
sometimes anticipated for designated applications with
EMA 1027—8/9/2005—15:39—SPRIYA—163790—XML MODEL 5 – pp. 1–14
ED PROOF
various temporal and spatial scales. For instance, the
Spatially Integrated Models for Phosphorus Loading and
Erosion (SIMPLE) model was developed to evaluate the
potential phosphorus loading to streams from areas with
various soil and management practices. This model operates
on a daily time step and independent simulations are based on
factors such as rainfall, soil characteristics, fertilizers and
animal waste applications, and topographic characteristics
(Kornecki et al., 1999). It is often connected with the Erosion
Productivity Impact Calculator (EPIC) which is a physically
based model designed to simulate the effect of different
management practices on crop yield and on chemicals,
including phosphorus losses by surface runoff, sediment
movement, and leaching below the root zone to accomplish
an integrated study. Recent efforts using a neural network
model demonstrate an additional dimension for soil erosion
modeling (Licznar and Nearing, 2003). With the aid of
various environmental models, the improvement of the
estimation and control of non-point sources in some reservoir
watersheds was greatly enhanced in recent years (Safe and
Choudhury, 1998; Yool, 1998; and Miller et al., 1998).
The integration of grid cell information in the study area
of interest in geographic information systems (GIS) with
various environmental models has been fully implemented
(Liang and Chen, 1995; Goodchild et al., 1996; Dikshit and
Loucks, 1995, 1996). In many cases the grid-based non-
point sources modeling analysis is prohibitively hindered
because of insufficient information and unbearable data-
intensive requirements. However, land use characterization
and change detection analysis based on remote sensing are
able to provide planners with sufficient background
information for model parameterization (Helmschrot and
Flugel, 2002). Recent applications with different spatial
scales range from a continental scale to a river basin scale
and to an urban scale (Cohen et al., 2003; Hashiba et al.,
2000; Tapiador and Casanova, 2003). With such a need,
advanced and improved remote sensing data analysis and
land use classification techniques are anticipated (Steele,
2000; Foody, 2002; Pal and Mather, 2003).
The goal of this study is to assess the long-term impact of
soil erosion and nonpoint source pollution in a fast growing
river basin in Taiwan via the integrative use of remote
sensing, global positioning system (GPS), GIS, and nume-
rical simulation models. While a companion study (Ning et
al., 2002) addressed available data, choices of method, and
what has been done with these data in a short-term analysis
for the Kao-Ping River Basin, this paper focuses on the
application of multi-temporal remote sensing images to aid
in soil erosion and non-point source pollution assessment
within the same study area from a long-term perspective.
2. Study area
The Kao-Ping River Basin is located from 1208 and
22 min (122822 0) north longitude and 228 and 28 min

S.-K. Ning et al. / Journal of Environmental Management xx (xxxx) 1–14 3
DTD 5 ARTICLE IN PRESS
225
226
227
228
229
230
231
232
233
234
235
236
237
238
239
240
241
242
243
244
245
246
247
248
249
250
251
252
253
254
255
256
257
258
259
260
261
262
263
264
265
266
267
268
269
270
271
272
273
274
275
276
277
278
279
280
281
282
283
284
285
286
287
288
289
290
291
292
(22828 0) east latitude to 1218 and 3 min (12183 0) north
longitude and 228 and 30 min (22830 0) east latitude. The
mainstream flows through approximately 140 km and drains
towards Southern Taiwan Strait. With an area of 3256 km2,
the mainstream of the Kao-Ping River originates from four
small tributaries: Chi-San River, Liao-Nung River, Cho-
Kou River, and Ai-Liao River (Fig. 1). From the confluence
to the union with those tributaries at the location of Li-Ling
Bridge, the river carries the name Kao-Ping River. The river
basin elevations range from sea level near the estuary region
to 3293 m upon the headwater with the average slope of
about 1/150. Five soil types appear in this river basin.
UNCORRECT
Fig. 1. System environment of the Kao-
YJEMA 1027—8/9/2005—15:39—SPRIYA—163790—XML MODEL 5 – pp. 1–14
Entisols, which are Lithosols, are spread around the
northern and eastern mountainous area. Inceptisols and
Alfisols that come from the older alluvial soils are
distributed over the southwestern plain. Ultisols and
Oxisols, which constitute the red soils, cover the southern
region. Inceptisols and Ultisols that represent most yellow
soils are dominant soils around the midwestern area. The
land use pattern is quite distinct. Forested land covers the
northeastern mountainous region in the upper portion of the
river basin. Residential districts are mostly located down-
stream in this river basin. While many groves are located
along the river corridor, agricultural land spreads around
ED PROOF
Ping River Basin, South Taiwan.
293
294
295
296
297
298
299
300
301
302
303
304
305
306
307
308
309
310
311
312
313
314
315
316
317
318
319
320
321
322
323
324
325
326
327
328
329
330
331
332
333
334
335
336

YJ
S.-K. Ning et al. / Journal of Environmental Management xx (xxxx) 1–144
DTD 5 ARTICLE IN PRESS
337
338
339
340
341
342
343
344
345
346
347
348
349
350
351
352
353
354
355
356
357
358
359
360
361
362
363
364
365
366
367
368
369
370
371
372
373
374
375
376
377
378
379
380
381
382
383
384
385
386
387
388
389
390
391
392
393
394
395
396
397
398
399
400
401
402
403
404
405
406
407
408
409
410
411
412
413
414
415
416
417
418
419
420
421
the western portion of the river basin. There are also a
number of small- and medium-scale industrial parks in the
populated region downstream.
The mean annual rainfall in this river basin is close to
3000 mm, over 90% of which precipitates in the wet season
from May to September. The period of high flow rate in the
stream usually occurs in late spring and summer due to the
impacts of monsoons and typhoons. In this time period, the
Kao-Ping River flow increases to a level approximately 8–
12 times higher than the dry season flow. Uneven rainfall
over seasons has resulted in severe issues of water resources
redistribution in the winter and early spring that inevitably
requires building more reservoirs for water storage. Land
subsidence occurred in some coastal areas due to the abuse
of groundwater resources.
The drainage area of the Kao-Ping River Basin is
primarily planned for agricultural production. Crops that are
produced from the agricultural fields include rice, sugar-
cane, pineapple, and a variety of vegetables. Stock farming
is an active agricultural activity. In addition to the use of
water for agricultural production and industrial manufactur-
ing processes, water is also essential for drinking and
personal hygiene in this area. The Kao-Ping River system,
however, has a long history of higher BOD and NH3–N
concentrations due to careless landfill operations,
inadequate disposal of manure from stock farming, and
continuous discharges of industrial and domestic waste-
water effluents. These discharges in the middle and
downstream areas of the Kao-Ping River system, where
UNCORRECT
Fig. 2. The analytica
EMA 1027—8/9/2005—15:39—SPRIYA—163790—XML MODEL 5 – pp. 1–14
most water intakes are located, have resulted in acute needs
for promoting a new management policy to improve the
water quality condition. The attainable use of river water is
officially classified into three categories for management
and control purposes. Several pollution prevention pro-
grams have been put into practice by the government agency
(Ning et al., 2001). These include a large-scale livestock
subsidy program for removing almost half of the domestic
livestock in the upstream and middle stream areas and a
series of collective sewer construction projects in several
cities along the river corridor. On the other hand, controlling
the agricultural run-off would require a complete assess-
ment of soil erosion and associated non-point source
pollution impacts in the river basin from a long-term
perspective.
PROOF3. Methods
The analysis of soil erosion associated with non-point
source pollution impacts includes three stages (Fig. 2): (1)
land use pattern classification, (2) data acquisition for
modeling analysis, and (3) simulation analysis for non-
point source pollution impact assessment. The classification
of land use pattern is viewed as one of the prerequisites for
applying the subsequent simulation analysis. Thus, the initial
focus of this study was on classifying eight types of land-use
patterns in the watershed with the aid of SPOT satellite
images that were generated during the time period of
ED
l framework.
422
423
424
425
426
427
428
429
430
431
432
433
434
435
436
437
438
439
440
441
442
443
444
445
446
447
448
S.-K. Ning et al. / Journal of Environmental Management xx (xxxx) 1–14 5
DTD 5 ARTICLE IN PRESS
449
450
451
452
453
454
455
456
457
458
459
460
461
462
463
464
465
466
467
468
469
470
471
472
473
474
475
476
477
478
479
480
481
482
483
484
485
486
487
488
489
490
491
492
493
494
495
496
497
498
499
500
501
502
503
504
505
506
507
508
509
510
511
512
513
514
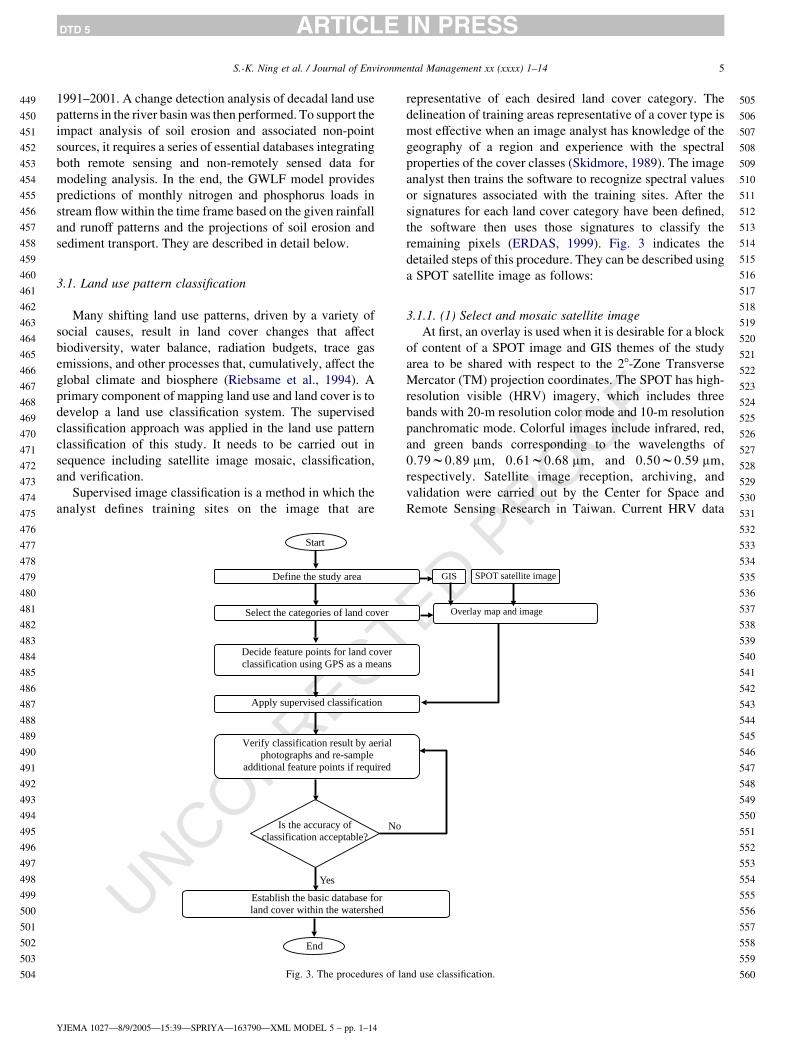
1991–2001. A change detection analysis of decadal land use
patterns in the river basin was then performed. To support the
impact analysis of soil erosion and associated non-point
sources, it requires a series of essential databases integrating
both remote sensing and non-remotely sensed data for
modeling analysis. In the end, the GWLF model provides
predictions of monthly nitrogen and phosphorus loads in
stream flowwithin the time frame based on the given rainfall
and runoff patterns and the projections of soil erosion and
sediment transport. They are described in detail below.
515516
517
518
519
520
521
522
523
524
525
526
527
528
529
530
531
3.1. Land use pattern classification
Many shifting land use patterns, driven by a variety of
social causes, result in land cover changes that affect
biodiversity, water balance, radiation budgets, trace gas
emissions, and other processes that, cumulatively, affect the
global climate and biosphere (Riebsame et al., 1994). A
primary component of mapping land use and land cover is to
develop a land use classification system. The supervised
classification approach was applied in the land use pattern
classification of this study. It needs to be carried out in
sequence including satellite image mosaic, classification,
and verification.
Supervised image classification is a method in which the
analyst defines training sites on the image that are
UNCORRECT
Establish the basic database for land cover within the watershed
Start
Yes
End
Select the categories of land cover
Decide feature points for land cover classification using GPS as a means
Apply supervised classification
Verify classification result by aerial photographs and re-sample
additional feature points if required
Define the study area
Is the accuracy of classification acceptable?
No
Fig. 3. The procedures of la
YJEMA 1027—8/9/2005—15:39—SPRIYA—163790—XML MODEL 5 – pp. 1–14
representative of each desired land cover category. The
delineation of training areas representative of a cover type is
most effective when an image analyst has knowledge of the
geography of a region and experience with the spectral
properties of the cover classes (Skidmore, 1989). The image
analyst then trains the software to recognize spectral values
or signatures associated with the training sites. After the
signatures for each land cover category have been defined,
the software then uses those signatures to classify the
remaining pixels (ERDAS, 1999). Fig. 3 indicates the
detailed steps of this procedure. They can be described using
a SPOT satellite image as follows:
OOF
3.1.1. (1) Select and mosaic satellite image
At first, an overlay is used when it is desirable for a block
of content of a SPOT image and GIS themes of the study
area to be shared with respect to the 28-Zone Transverse
Mercator (TM) projection coordinates. The SPOT has high-
resolution visible (HRV) imagery, which includes three
bands with 20-m resolution color mode and 10-m resolution
panchromatic mode. Colorful images include infrared, red,
and green bands corresponding to the wavelengths of
0.79w0.89 mm, 0.61w0.68 mm, and 0.50w0.59 mm,
respectively. Satellite image reception, archiving, and
validation were carried out by the Center for Space and
Remote Sensing Research in Taiwan. Current HRV data
ED PR
SPOT satellite imageGIS
Overlay map and image
nd use classification.
532
533
534
535
536
537
538
539
540
541
542
543
544
545
546
547
548
549
550
551
552
553
554
555
556
557
558
559
560

YJ
S.-K. Ning et al. / Journal of Environmental Management xx (xxxx) 1–146
DTD 5 ARTICLE IN PRESS
561
562
563
564
565
566
567
568
569
570
571
572
573
574
575
576
577
578
579
580
581
582
583
584
585
586
587
588
589
590
591
592
593
594
595
596
597
598
599
600
601
602
603
604
605
606
607
608
609
610
611
612
613
614
615
616
617
618
619
620
621
622
623
624
625
626
627
628
629
630
631
632
633
634
635
636
637
precision (80 bit) appears suitable for land cover identifi-
cation on a river basin scale.
The entire analysis for land use identification and
classification in the watershed of the Kao-Ping River
Basin was designed based on a practical scale GIS
framework. The study area has been further classified by
the authors using three bands of SPOT satellite images in the
spectrum that were collected during the time periods of
1994 (i.e. November, 1994), 1996 (i.e. June, 1996 and
August, 1996), 1997–1998 (i.e. November, 1997 and
January, 1998), and 2001 (i.e. January, 2001). Fig. 4
shows the decadal SPOT satellite images of the Kao-Ping
River Basin. These SPOT scenes selected for land use
pattern identification covering the portions of the Kao-Ping
River Basin in South Taiwan must be first verified to a status
of GICS level 10 by the Center for Space and Remote
Sensing Research before performing various environmental
applications. Automatically matching conjugate features in
overlapped images was required first. Due to time
differences when producing these satellite images, direct
UNCORRECT
Fig. 4. Decadal SPOT satellite image
EMA 1027—8/9/2005—15:39—SPRIYA—163790—XML MODEL 5 – pp. 1–14
matching of them was impractical. Instead of using
advanced direct matching algorithms, this study applied a
different method in which each satellite image acquired at a
different time was used for land use classification
independently and individual outcomes were then integrated
together as a whole for final evaluation via the use of Erdas
Imaginew image processing software.
F
3.1.2. (2) Classification of land use patterns
Application of GPS helps verify the effectiveness of land
use classification based on SPOT satellite image. The
information gained from GPS can be divided into two
groups. One group is prepared as a set of feature points that
is designed for a direct calibration of land use classification
in the Erdas Imaginew image processing system. The other
group is prepared as an additional set of feature points or
ground-control points (GCPs) for validation purposes. Fig. 5
shows the locations of all GPS feature points prepared for
ground truth verification in 2001. Partial feature points
expressed as dots were used for supervised land use
ED PROO
s of the Kao-Ping River Basin.
638
639
640
641
642
643
644
645
646
647
648
649
650
651
652
653
654
655
656
657
658
659
660
661
662
663
664
665
666
667
668
669
670
671
672

T
PROOFFig. 5. The distribution of feature points for calibration (2001).
Fig. 6. The surveyed land use patterns in the Kao-Ping River Basin (1991).
S.-K. Ning et al. / Journal of Environmental Management xx (xxxx) 1–14 7
DTD 5 ARTICLE IN PRESS
673
674
675
676
677
678
679
680
681
682
683
684
685
686
687
688
689
690
691
692
693
694
695
696
697
698
699
700
701
702
703
704
705
706
707
708
709
710
711
712
713
714
715
716
717
718
719
720
721
722
723
724
725
726
727
728
729
730
731
732
733
734
735
736
737
738
739
740
741
742
743
744
745
746
747
748
749
750
751
752
753
754
755
756
757
758
759
760
761
762
763
764
765
766
767
768
ECclassification, while those expressed as triangles were saved
for final validation of land use patterns. The overall
supervised ground truth classification process can therefore
be trained based on the first set of feature points in the first
stage and then be validated by the given land use pattern in
the watershed with the aid of the second set of feature points
in the second stage. An independent survey of land
utilization in 1991, as shown in Fig. 6, was selected as the
baseline information to track down the variations within a
ten-year time frame when looking for the temporal
variations of land use on a long term basis.
769
770
771
772
773
774
775
776
777
778
779
780
781
782
783
784
UNCORR3.1.3. (3) Verification of land use pattern by local aerial
photographs
Final accuracy can be confirmed by using some available
aerial photographs as a kind of supplementary ground truth
verification. A geometrical rectification procedure is
required to map the aerial photographs onto the ground
coordinate system. In this paper, the aerial photographs
were rectified using an ortho-rectification procedure. The
original hardcopy photographs were digitized first for
digital processing. The photogrammetric procedure of
Digital Aerial Triangulation was then performed to recover
the exterior orientation. Because the correction for terrain
displacement requires a Digital Surface Model (DSM),
automatic stereo image matching was carried out to
generate DSM. Then, the images were ortho-rectified
YJEMA 1027—8/9/2005—15:40—SPRIYA—163790—XML MODEL 5 – pp. 1–14
ED according to the perspective geometry and terrain displace-
ment. Finally, all rectified images were mosaiced together to
compose an overall rectified image, which enabled us to
overlap the aerial image on the satellite images. This
eventually led to the accuracy assessment for the outputs of
land use pattern classification. To achieve this goal, Kappa
statistics are normally selected to express the proportionate
reduction in error generated by a classification process,
compared with the error of a completely random classifi-
cation (Congalton, 1991). Fig. 7 indicates the area picked up
for accuracy assessment points, in which a stratified random
sampling method was applied. It uniquely allows us to
evaluate a classified image file for evaluating diagnostic
imaging methods.
3.1.4. (4) Change detection analysis of decadal land use in
the designated river basin
An increasingly interesting application of remotely
sensed data in the context of land use pattern classification
is for change detection. Change detection is an important
process in monitoring and managing land resources because
it provides quantitative analysis of the spatial variations of
the land use patterns within the designated time frame.
Based on the remote sensing efforts aforementioned, this
paper is also designed to summarize all the spatial variations

TD P
ROOF
Fig. 7. The accuracy assessment selected by stratified random sampling.
YJ
S.-K. Ning et al. / Journal of Environmental Management xx (xxxx) 1–148
DTD 5 ARTICLE IN PRESS
785
786
787
788
789
790
791
792
793
794
795
796
797
798
799
800
801
802
803
804
805
806
807
808
809
810
811
812
813
814
815
816
817
818
819
820
821
822
823
824
825
826
827
828
829
830
831
832
833
834
835
836
837
838
839
840
841
842
843
844
845
846
847
848
849
850
851
852
853
854
855
856
857
858
859
860
861
862
863
864
865
866
867
868
869
870
871
872
873
874
875
876
877
878
879
880
881
882
RECwith respect to seven land use categories that provide a clueto decadal shifts in agricultural activities and cropping
patterns.
3.2. Data acquisition for modeling analysis
The input data needed for non-point source modeling
analysis covers physical, topographical, meteorological,
hydrological, and geological features, and nutrient export
UNCORTable 1
The nutrient concentration applied in this analysis (Ning et al., 2002)
Nutrient content in the runoff
Land use patterns Forest Community Orchard
TN (mg/L) 1.925 1.806 1.709
TP (mg/L) 0.18 1.17 0.46
Nutrient content in the sediment
Soil classification Podzolic soils Red
soils
Mudstone, silt-shale stone
Non-weathering S
TN (mg/kg) 877 78 1
TP (mg/kg) 859 141 3
EMA 1027—8/9/2005—15:40—SPRIYA—163790—XML MODEL 5 – pp. 1–14
Edata. Precipitation, temperature, and evapotranspiration
data can be obtained from regular meteorological obser-
vations. Runoff Curve Numbers (RCU) can be acquired
from a technical report published by the US Soil
Conservation Service (1986). The RCU were designed
based on the information of land cover, soil groups, and
hydrologic condition. Erosion and sediment parameters
described by the Universal Soil Loss Equation may be
obtained from the investigation of soil erosion, digital
Agricultural land Grassland Sugarcane
17.74 0.3 10.69
9.56 0.15 4.66
Regosol
emi-weathering Weathering
36 397 318
05 518 233
883
884
885
886
887
888
889
890
891
892
893
894
895
896

S.-K. Ning et al. / Journal of Environmental Management xx (xxxx) 1–14 9
DTD 5 ARTICLE IN PRESS
897
898
899
900
901
902
903
904
905
906
907
908
909
910
911
912
913
914
915
916
917
918
919
920
921
922
923
924
925
926
927
928
929
930
931
932
933
934
935
936
937
938
939
940
941
942
943
944
945
946
947
948
949
950
951
952
953
954
955
956
957
958
959
960
961
962
terrain modeling (DTM) information, mode of cover and
management types for handling field crops, and the
condition of agricultural practices in the field. But the
representation of flow directions and calculation of upslope
areas using rectangular grid digital elevation models must
be applied (Tarboton, 1997). Finally, the mean concen-
trations (i.e. export coefficients) of nutrients in runoff and
sediment transport from both rural and urban regions were
collected and combined based on several previous sampling
practices in Taiwan (Ning et al., 2002). They are
UNCORRECT
Fig. 8. The identified decadal land-use pa
YJEMA 1027—8/9/2005—15:40—SPRIYA—163790—XML MODEL 5 – pp. 1–14
summarized as part of the semi-empirical inputs in this
model (see Table 1) (Ning et al., 2002).
3.3. Simulation analysis
The GWLF model was selected as a baseline tool to
estimate the non-point source waste loads reflecting the
impacts from soil erosion processes and nutrient cycles in
the watershed of the Kao-Ping River Basin. The GWLF
model describes non-point sources for runoff, erosion and
ED PROOF
tterns in the Kao-Ping River Basin.
963
964
965
966
967
968
969
970
971
972
973
974
975
976
977
978
979
980
981
982
983
984
985
986
987
988
989
990
991
992
993
994
995
996
997
998
999
1000
1001
1002
1003
1004
1005
1006
1007
1008

YJ
S.-K. Ning et al. / Journal of Environmental Management xx (xxxx) 1–1410
DTD 5 ARTICLE IN PRESS
1009
1010
1011
1012
1013
1014
1015
1016
1017
1018
1019
1020
1021
1022
1023
1024
1025
1026
1027
1028
1029
1030
1031
1032
1033
1034
1035
1036
1037
1038
1039
1040
1041
1042
1043
1044
1045
1046
1047
1048
1049
1050
1051
1052
1053
1054
1055
1056
1057
1058
1059
1060
1061
1062
1063
1064
1065
1066
1067
1068
1069
1070
1071
1072
1073
1074
1075
1076
1077
1078
1079
1080
1081
1082
1083
1084
1085
1086
1087
1088
1089
1090
1091
1092
urban wash off, and a lumped parameter linear reservoir
groundwater model. The delivery ratio concept was
defined based on the Runoff Curve Numbers and the
Universal Soil Loss Equation methods (Vanoni, 1975). It
helps to yield an estimation of non-point source waste
loads with respect to soil erosion, sediment transport, and
resulting nutrient fluxes, such as total phosphorus (TP)
and total nitrogen (TN). Eight types of land use patterns
that have been classified in the previous step can be
incorporated to track down long-term non-point source
impacts.
All data from the SPOT satellite images were eventually
integrated into the ArcVieww system, in which land use and
land cover information can be extracted from the GIS
database to help in the estimation of soil loss and non-point
pollutant loading in the watershed. The GIS expresses the
geographic area as a matrix of grid cells of which each grid
cell stands for a parcel of land of certain size and serves as the
basic unit for quantification of various physical, topographi-
cal, meteorological, hydrological and geological features.
Thereafter, the spatial analyst module in GIS can be applied
for the prediction analysis with respect to each type of land
use pattern in the watershed in a way that enables us to
estimate individual impacts due to each type of non-point
source of interest. Total impacts of soil erosion and non-point
sources can then be integrated with respect to all land use
patterns identified by SPOT satellite images and associated
GIS operations.
1093
1094
1095
4. Results and discussionTTable 3
The area of land use patterns identified in the Kao-Ping River Basin (km2)
Land-use
patterns
1991 1994 1996 1998 2001
1096
1097
1098
1099
1100
1101
1102
1103
1104
1105
1106
1107
1108
REC4.1. Assessment of long-term land use variations
The spatial analyst module embedded in the ArcVieww
system enables us to compute the land use statistics
corresponding to each drainage sub-basin. Except for the
area covered by clouds in the satellite image, the land use
patterns being categorized include orchard, farmland,
sugarcane farm, forest, grassland, barren, community, and
water body in each sub-basin. These land-use patterns can
be delineated as an ArcVieww cartographic output as shown
in Fig. 8.
UNCORTable 2
The kappa coefficient
Class name Reference points Kappa coefficient
Orchard 78 0.8449
Forest 27 0.6917
Grassland 12 0.8670
Community 5 0.2308
Farmland 29 0.8051
Sugarcane 2 1.0000
Barren 44 0.8397
Water body 3 0.7462
Total 200 0.7648
EMA 1027—8/9/2005—15:40—SPRIYA—163790—XML MODEL 5 – pp. 1–14
ED PROOF
For the sake of further assessment of classification
accuracy, GPS feature points and aerial photographs were
used as real ground truth for final confirmation. Table 2
shows the number of points in the assessment and the
associated Kappa coefficient for each land use pattern. The
Kappa agreement test was applied and an average accuracy
of 0.7648 was achieved with respect to different Kappa
coefficients associated with different land use patterns.
Table 3 summarizes land use patterns on a comparative
basis and covers the time period from 1991 to 2001. The
survey of land use patterns in the year 1991 was manually
digitized for comparison. At present, forested land occupies
approximately 60.3% of the total area of the river basin. It
spreads out along the eastern mountainous area in the
watershed. Orchard areas that keep increasing over time are
scattered around on both sides of the river corridor. They
occupy approximately 17.7% of the total area in this river
basin. Farmland, grassland, barren, and community con-
stitute approximately 9.9, 3.3, 2.2 and 4.1% of the total area,
respectively. They are normally located at the southwest
region of the river basin. Because barren was not included in
the classification, the dry riverbed was classified as part of
the water body, which results in some inaccuracy. The
stream flow rate in the wet season may be ten times higher
than that in the dry season. Such seasonal stream flow
variations were so phenomenal that they increased
classification inaccuracy with respect to the water body.
Due to the effect of clouds, inevitable discrepancies arise
from the adoption of different satellite images acquired in
the wet seasons in 1994 and 1996 and the dry seasons in
1998 and 2001. On the other hand, the increasing with-
drawal of water flows from the river to satisfy the rising
demand for water resources over time could affect the area
of the water body (Ning et al., 2002). In 1998, clouds
covered an area of about 62 km2, which also impacts the
classification of forested land in the watershed.
Fig. 9 summarizes the decadal variations of land use
patterns in the Kao-Ping River Basin. From 1994 to 2001,
the land use for orchard had increased dramatically due to
Orchard 132.44 385.90 389.60 471.44 576.22
Forest 2242.30 2182.28 2048.55 1816.97 1962.52
Grassland 169.48 114.53 132.68 206.51 106.99
Commu-
nity
69.74 71.96 108.55 153.44 133.59
Farmland 442.84 267.80 285.71 255.17 323.10
Sugar-
cane
102.06 47.26 47.91 46.19 45.89
Barren 0.00 132.98 191.60 207.06 70.70
Water
body
91.71 48.72 41.97 38.08 29.30
Cloud 0.00 0.86 9.80 61.71 3.99
Total 3250.58 3252.30 3256.38 3256.57 3252.30
1109
1110
1111
1112
1113
1114
1115
1116
1117
1118
1119
1120

TED PROOF
Fig. 10. The statistics of forest change versus timber export in Taiwan
(1993–2002).
S.-K. Ning et al. / Journal of Environmental Management xx (xxxx) 1–14 11
DTD 5 ARTICLE IN PRESS
1121
1122
1123
1124
1125
1126
1127
1128
1129
1130
1131
1132
1133
1134
1135
1136
1137
1138
1139
1140
1141
1142
1143
1144
1145
1146
1147
1148
1149
1150
1151
1152
1153
1154
1155
1156
1157
1158
1159
1160
1161
1162
1163
1164
1165
1166
1167
1168
1169
1170
1171
1172
1173
1174
1175
1176
1177
1178
1179
1180
1181
1182
1183
1184
1185
1186
1187
1188
1189
1190
1191
1192
1193
1194
1195
1196
1197
1198
1199
1200
1201
1202
1203
1204
1205
1206
1207
1208
1209
1210
1211
1212
1213
1214
1215
1216
ECfast economic growth region wide. The capacity for
production of versatile fruits contributed to both domestic
and foreign target markets from which the income supports
the local socio-economical system basin wide. In addition,
the local pork industry, which counts heavily on stock
farming, has enormous implications for the international
trade surplus due to steady export demand. As a result, the
total area of grassland and community also presented an
increasing trend over time in the last decade. Yet forested
land decreased substantially in the last decade. Fig. 10(a)
explains the distribution of forest versus non-forested land
in Taiwan. However, non-forested land only occupies
41.47% of the total area. Fig. 10(b) reveals observational
evidence that while the per capita GDP and the export
volume of the timber remained the same within the last
decade, the reforestation efforts decreased over time in the
same time period. A considerable area of forested land
might be eradicated and transferred into golf courses,
recreational parks, orchard farms, tea farms, and residential
areas. The destabilization of fragile mountain slopes,
through deforestation, agricultural expansion, excessive
and indiscriminate grazing and expansion of the road
network, disrupted the hydrological cycle in the river basin.
It also caused the ecosystem irretrievable changes, such as
vegetation area reduction and protozoan and protophyte
disappearance affecting biodiversity in the long run. The
intelligent use, extraction, conservation, and reuse of forest
resources, and the design of long-term strategies require not
only comprehensive understanding of the changes in the
forested land, but also new and appropriate technology and
solutions. To identify the susceptible spots for managerial
use, Fig. 11 further pinpoints the long-term variations in
forested land in the Kao-Ping River Basin (1994–2001).
Overall, the long-term change detection analysis in this
study showed that the land development programs in the last
decade significantly changed the land use patterns in this
region such that the land management, ecological conserva-
tion, and pollution control actions have become a new
challenge to the environmental decision makers in the river
basin.
UNCORR
0%
10%
20%
30%
40%
50%
60%
70%
80%
1991 1994 1996 1998 2001
area
per
cent
age
(%)
orchard forest grassland
community farmland sugarcane
Fig. 9. Decadal change detection of land use in the Kao-Ping River Basin
(1991–2001). (a) Forest versus non-forest land distribution. (b) Reforest
area versus timber export and per capita GDP
Fig. 11. The variation of forest regions in the Kao-Ping River Basin (1994–
2001).
YJEMA 1027—8/9/2005—15:40—SPRIYA—163790—XML MODEL 5 – pp. 1–14
1217
1218
1219
1220
1221
1222
1223
1224
1225
1226
1227
1228
1229
1230
1231
1232

T
Fig. 12. The variation of nutrient loadings and soil erosion in the Kao-Ping
River Basin.
YJ
S.-K. Ning et al. / Journal of Environmental Management xx (xxxx) 1–1412
DTD 5 ARTICLE IN PRESS
1233
1234
1235
1236
1237
1238
1239
1240
1241
1242
1243
1244
1245
1246
1247
1248
1249
1250
1251
1252
1253
1254
1255
1256
1257
1258
1259
1260
1261
1262
1263
1264
1265
1266
1267
1268
1269
1270
1271
1272
1273
1274
1275
1276
1277
1278
1279
1280
1281
1282
1283
1284
1285
1286
1287
1288
1289
1290
1291
1292
1293
1294
1295
1296
1297
1298
1299
1300
1301
1302
1303
1304
1305
1306
1307
1308
1309
1310
1311
1312
1313
1314
1315
1316
1317
1318
1319
1320
1321
1322
1323
1324
1325
1326
1327
1328
1329
1330
1331
1332
RREC4.2. Assessment of soil erosion and non-point source
pollution impact
Simulation outputs using the GWLF model reveal that
more than ninety percent of the total impacts of TN and TP
appear from June to September within a year when rainfall
goes up in the summer. The long-term change detection
analysis with regards to soil erosion and associated non-
point source pollutant loading between years can also be
explored based on the land use patterns in different years.
Table 4 summarizes the decadal changes in total nutrient
fluxes and soil erosion impacts. The impacts of non-point
source pollution over the years result from a complex
environmental process due to movement of people, changes
in land use patterns, and shifts in agricultural activities and
cropping patterns. The positive correlations between rainfall
and soil erosion obtained quantitatively in the analysis may
further verify the complex, dynamic, and interdependent
relationships between them.
The combination of Figs. 12 and 13 would enable us to
graphically demonstrate the possible cross linkages of
spatial and temporal changes in soil erosion associated
with non-point source pollution in the study area. While
Fig. 12 delineates the temporal variations in soil erosion
associated with varying nutrient loading in the last decade,
Fig. 13 further categorizes the distribution of non-point
source pollution in terms of different land use patterns
using the year 2001 as a representative case. It clearly
shows that the levels of annual soil erosion fluctuate
stepwise in association with the variations in annual
precipitation, and are associated with continuous land
cultivation over the years. Within the seven identified land
use patterns, excluding water body, in 2001, farmland is
recognized as the most important one contributing to the
biggest portion of nutrient sources in the river basin
owing to a great deal of manure spreading. This also
resulted in a critical situation for water quality manage-
ment since most of those farms are situated alongside of
the Kao-Ping River corridor. Furthermore the total area of
forested land has been gradually decreasing, accompanied
by increasing orchard and farmland. As a consequence,
nutrient flux is anticipated to increase as intensive
applications of fertilizers in most agricultural regions
UNCOTable 4
The estimate amounts of nutrient loading and soil erosion in the Kao-Ping
River Basin
Year Rainfall
(mm)
TN (ton/year) TP (ton/year) Erosion
(million-ton/
year)
1991 2601.4 1407.6 260.0 213.2
1994 3349.3 2021.0 332.4 275.3
1996 2329.7 1935.0 310.3 264.9
1998 3017.3 2070.8 348.3 289.2
2001 3769.3 2386.1 451.1 356.0
EMA 1027—8/9/2005—15:40—SPRIYA—163790—XML MODEL 5 – pp. 1–14
and inadequate disposal of animal waste in livestock
farming communities continue.
ED PROOF4.3. Management policy
Risk maps of nutrient loading and soil erosion impacts
may be produced for essential assessment and policy
decision-making (Khawlie et al., 2002). To ease the
management efforts, Fig. 14 exhibits the ranking of risk of
nutrient loading and soil erosion impacts in the Kao-Ping
River Basin. It involves using three regional patterns,
consisting of high, middle, and low levels, to address how
the resultant changes in land use patterns affect people in
the coupled human and natural systems. While a
significant number of non-point sources are spread around
the middle stream and downstream areas, the regions with
critical soil erosion are located at the upland area in the
watershed. In particular, these regions with high-level
potential for soil erosion are mostly located at the eastern
and northern mountainous areas where the slope is steeper
and the local rainfall is relatively higher than the other
regions. Agricultural activities for crop and orchard
farming have already been extended to those marginal
and sub-marginal areas nearby the forest without taking
the sustainability issue into consideration. This will
eventually lead to the consequences of increased sediment
transport in the river channel and impact the ecosystem
Fig. 13. The non-point sources distribution in the Kao-Ping River Basin in
2001.
1333
1334
1335
1336
1337
1338
1339
1340
1341
1342
1343
1344

T P
Fig. 14. The potential of nutrient loading and soil erosion in the Kao-Ping
River Basin.
S.-K. Ning et al. / Journal of Environmental Management xx (xxxx) 1–14 13
DTD 5 ARTICLE IN PRESS
1345
1346
1347
1348
1349
1350
1351
1352
1353
1354
1355
1356
1357
1358
1359
1360
1361
1362
1363
1364
1365
1366
1367
1368
1369
1370
1371
1372
1373
1374
1375
1376
1377
1378
1379
1380
1381
1382
1383
1384
1385
1386
1387
1388
1389
1390
1391
1392
1393
1394
1395
1396
1397
1398
1399
1400
1401
1402
1403
1404
1405
1406
1407
1408
1409
1410
1411
1412
1413
1414
1415
1416
1417
1418
1419
1420
1421
1422
1423
1424
1425
1426
1427
1428
1429
1430
1431
1432
1433
1434
1435
1436
1437
1438
1439
1440
1441
EC
integrity in the estuary region. To handle the interrelated
challenges, the non-point source critical map analysis
obtained from this multidisciplinary study would allow
decision makers to identify, describe, rank, and then
visualize site options in collaborative spatial decision
making. A ‘consensus map’ is thus devised for future
decision making to visualize both the priority of the
critical area as well as the consensus status about those
priorities in a management sense, which should be
instrumental to land development and environmental
management programs (Sivertun and Prange, 2003).
Parks, including golf courses, designed for recreational
use, could be another vital non-point source in some of
the middle and upstream areas. The continuous develop-
ment of golf courses is thus deemed very important in
non-point source pollution control in the context of land
use management. In the presence of so many golf courses
in this region, advanced remote sensing images, such as
IKONO images, should be used to access the correspond-
ing non-point source impacts in the future. On the other
hand, it is also worthwhile paying attention to the
pesticides discharged from agricultural practices. The
methods discussed in this study, such as GIS, remote
sensing and the GWLF model, are not suitable for
estimating the impact of pesticides.
R 14421443
1444
1445
1446
1447
1448
1449
1450
1451
1452
1453
1454
1455
1456
UNCOR5. Conclusion
With the rapid increase in population during the last
decade in the Kao-Ping River Basin, the demand for land
and food has increased considerably, putting increased
biotic stress on the critical environmental components, like
soil, water and forests. Consequently, this human trans-
formation process has brought about drastic changes in the
resource-use practices and land-use pattern of the region.
This study builds on, supports, and integrates many existing
disciplines and tools and provides new insight for river basin
management. It quantifies the decadal changes in land use
YJEMA 1027—8/9/2005—15:40—SPRIYA—163790—XML MODEL 5 – pp. 1–14
ROOF
patterns via the use of multi-temporal remote sensing
images and non-point source numerical modeling, thereby
providing a firm basis for assessing the impacts of soil
erosion and non-point source pollutant loading in the
coupled human and natural system. It involves consider-
ation of the natural and human dimensions of environmental
changes, including different configurations of socio-econ-
omic systems, changes in rainfall and runoff, movement of
people, and shifts in agricultural activities and cropping
patterns.
Research findings indicate that while the decadal
increase in orchards poses a significant threat to environ-
mental quality, the continual decrease in forested land has a
potential impact on non-point source pollution. Land
degradation along with soil erosion and non-point source
pollution, contributing to part of the downstream water
quality deterioration of the Kao-Ping River system in the
last decade, has resulted in an irreversible impact on the
natural system. It can be concluded that sustained
monitoring with respect to ecosystem features, environ-
mental quality indices, and climate change symptoms using
remote sensing should be a meaningful tool to aid in various
land use management programs. This multidisciplinary
approach using remote sensing to aid in decision making
can save time when planners are required to assess the land
use management policy with respect to soil erosion and non-
point source pollution impacts. Such information should
prove useful to watershed managers in the nexus of
sustainable development.
ED6. Uncited reference
Chang and Shaw, 2000.
References
Arhonditsis, G., Giourga, C., Loumou, A., 2000. Ecological patterns and
comparative nutrient dynamics of natural and agricultural mediterra-
nean-type ecosystems. Environmental Management 26 (5), 527–537.
Bailey, G.W., Swank Jr.., R.R., Nicholson, H.P., 1974. Predicting pesticide
runoff from agricultural lands: a conceptual model. Journal of
Environmental Quality 3, 95–102.
Bastian, O., Roder, M., 1998. Assessment of landscape change by land
evaluation of past and present situation. Landscape and Urban Planning
41 (3–4), 171–182.
Beasley, D.B., Huggins, L.F., 1982. ANSWERS (Aerial Nonpoint Source
Watershed Environmental Response Simulation) User Manual, Agri-
cultural Engineering Department. Purdue University, Indiana.
Chang, N.B., Shaw D.G., 2000. The optimal strategies of waste load
diminution and management policy in a watershed. EPA-89-U1G1-03-
117, ROC. EPA, Taipei, Taiwan (in Chinese).
Cohen, W.B., Maiersperger, T.K., Yang, Z., Gower, S.T., Turner, D.P.,
Ritts, W.D., Berterretche, M., Running, S.W., 2003. Comparisons of
land cover and LAI estimates derived from ETMC andMODIS for four
sites in North America: a quality assessment of 2000/2001 provisional
MODIS products. Remote Sensing of Environment 88 (3), 233–255.

T
YJ
S.-K. Ning et al. / Journal of Environmental Management xx (xxxx) 1–1414
DTD 5 ARTICLE IN PRESS
1457
1458
1459
1460
1461
1462
1463
1464
1465
1466
1467
1468
1469
1470
1471
1472
1473
1474
1475
1476
1477
1478
1479
1480
1481
1482
1483
1484
1485
1486
1487
1488
1489
1490
1491
1492
1493
1494
1495
1496
1497
1498
1499
1500
1501
1502
1503
1504
1505
1506
1507
1508
1509
1510
1511
1512
1513
1514
1515
1516
1517
1518
1519
1520
1521
1522
1523
1524
1525
1526
1527
1528
1529
1530
1531
1532
1533
1534
1535
1536
1537
1538
1539
1540
1541
1542
1543
1544
1545
1546
1547
1548
1549
1550
1551
1552
1553
1554
1555
1556
1557
RREC
Congalton, R., 1991. A review of assessing the Accuracy of Classifications
of Remotely Sensed data. Remote sensing of Environment 37, 35–46.
Dikshit, A.K., Loucks, D.P., 1995. Estimating non-point pollutant loading
I: a geographical-information-based non-point source simulation
model. Journal of Environmental Systems 24 (4), 395–408.
Dikshit, A.K., Loucks, D.P., 1996. Estimating non-point pollutant loading
II: a case study in the Fall Creek Watershed, New York. Journal of
Environmental Systems 25 (1), 81–95.
Donigian, A.S., Imhoff, J.C., Davis, H.H., 1980. Users Manual for
Hydrological Simulation Program - Fortran (HSPF). EPA-600/9-80-
015, USEPA, Washington, D.C.
Donigian Jr.., A.S., Huber, W.C., Barnwell Jr.., T.O., 1996. Models of non-
point source water quality for watershed assessment and management,
Proceedings Watershed ’96, Moving ahead Together Technical
Conference and Exposition, vol. 12. Baltimore, Maryland, USA.
ERDAS, 1999., fifth ed. ERDAS Field Guide ERDAS, Inc., Atlanta,
Georgia p. 671.
Faulkner, H., Ruiz, J., Zukowskyj, P., Downward, S., 2003. Erosion risk
associated with rapid and extensive agricultural clearances on
dispersive materials in southeast Spain. Environmental Science &
Policy 6, 115–127.
Foody, G.M., 2002. Status of land cover classification accuracy assessment.
Remote Sensing of Environment 80 (1), 185–201.
Goodchild, M.F., Steyaert, L.T., Parks, B.O., Johnston, C.J., Maidment, D.,
Crane, M., Glendinning, S. (Eds.), 1996. GIS and Environmental
Modeling: Progress and Recent Research. GIS World, Inc., Fort
Collins, CO, USA.
Haith, D.A., Reynolds, J.E., Landre, P.T., Richard, T.L., 1992. Sludge
loading rates for land. Journal of Environmental Engineering, ASCE
118 (2), 196–208.
Hashiba, H., Kameda, K., Uesugi, S., Tanaka, S., 2000. Landuse change
analysis of Tama River Basin with different spatial resolution sensor
data by Landsat/MSS and TM. Advances in Space Research 26 (7),
1069–1073.
Helmschrot, J., Flugel, W.A., 2002. Land use characterisation and change
detection analysis for hydrological model parameterisation of large
scale afforested areas using remote sensing. Physics and Chemistry of
the Earth, Parts A/B/C 27 (9–10), 711–718.
Hoffmann, J., 1998. Assessing the effects of environmental changes in a
landscape by means of ecological characteristics of plant species.
Landscape and Urban Planning 41 (3–4), 239–248.
Khawlie, M., Awad, M., Shaban, A., Kheir, R.B., Abdallah, C., 2002.
Remote sensing for environmental protection of the eastern Mediterra-
nean rugged mountainous areas, Lebanon. ISPRS Journal of Photo-
grammetry and Remote Sensing 57 (1–2), 13–23.
Kornecki, T.S., Sabbagh, G.J., Storm, D.E., 1999. Evaluation of runoff,
erosion, and phosphorus modeling system-SIMPLE. Journal of the
American Water Resources Association 35 (4), 807–820.
Liang, S., Chen, C.Y., 1995. Conjunctive use of GIS and watershed model
for environmental protection, Proceedings of 1995 International
Symposium on Geographic Information System for Environmental
Protection, March 16–17, Taipei, Taiwan 1995 pp. 188–207.
Licznar, P., Nearing, M.A., 2003. Artificial neural networks of soil erosion
and runoff prediction at the plot scale. Catena 51, 89–114.
UNCO
EMA 1027—8/9/2005—15:40—SPRIYA—163790—XML MODEL 5 – pp. 1–14
ED PROOF
Miller, A.B., Bryant, E.S., Birnie, R.W., 1998. An analysis of land changes
in the Northern Forest of New England using multi-temporal Landsat
MSS data. International Journal of Remote Sensing 19 (2), 255–265.
Ning, S.K., Chang, N.B., Yang, L., Chen, H.W., Hsu, H.Y., 2001. Assessing
pollution prevention program by QUAL2E simulation analysis for
water quality management in the Kao-Ping River Basin, Taiwan.
Journal of Environmental Management 61 (1), 61–76.
Ning, S.K., Cheng, K.Y., Chang, N.B., 2002. Evaluation of non-point
sources pollution impacts by integrated 3S information technologies
and GWLF model in the Kao-ping River Basin, Taiwan,”. Water
Science and Technology 46 (6), 217–224.
Pal, M., Mather, P.M., 2003. An assessment of the effectiveness of decision
tree methods for land cover classification. Remote Sensing of
Environment 86 (4), 554–565.
Riebsame, W.E., Meyer, W.B., Turner II.., B.L., 1994. Modeling land-use
and cover as part of global environmental change. Climate Change 28,
45.
Safe, A.K., Choudhury, P.R., 1998. Integrated remote sensing and GIS for
groundwater exploration and identification of artificial recharge sites.
International Journal of Remote Sensing 19 (10), 1825–1841.
Shoemaker, L., Lahlou, M., Bryer, M., Kumar, D., Kratt, K., 1997.
Compendium of tools for watershed assessment and TMDL develop-
ment. US EPA, Washington, D.C. (EPA 841-B-97-006).
Sivertun, A., Prange, L., 2003. Non-point sources critical area analysis in
the Gissela watershed using GIS. Environmental Modeling and
Software 18, 887–898.
Skidmore, A.K., 1989. Unsupervised training area selection in forests using
a nonparametric distance measure and spatial information. International
Journal of Remote Sensing 10 (1), 133–146.
Soil Conservation Service, 1986. Urban hydrology for small watersheds,
technical release no. 55. US Department of Agriculture, Washington,
D.C.
Steele, B.M., 2000. Combining multiple classifiers: an application using
spatial and remotely sensed information for land cover type mapping.
Remote Sensing of Environment 74 (3), 545–555.
Tapiador, F.J., Casanova, J.L., 2003. Land use mapping methodology using
remote sensing for the regional planning directives in Segovia, Spain.
Landscape and Urban Planning 62 (2), 103–115.
Tarboton, D.G., 1997. A new method for the determination of flow
directions and upslope areas in grid digital elevation models. Water
Resources Research 33 (2), 309–319.
Vanoni, V.A., 1975. Sedimentation Engineering. ASCE, New York, USA.
Warren, A., Batterbury, S., Henny Osbahr, H., 2001. Soil erosion in the
West African Sahel: a review and an application of a “local political
ecology” approach in South West Niger. Global Environmental Change
11, 79–95.
Yool, S.R., 1998. Land cover classification in rugged areas using simulated
moderate-resolution remote sensor data and artificial neural network.
International Journal of Remote Sensing 19 (1), 85–95.
Young, R.A., Onstad, C.A., Bosch, D.D., Anderson, W.P., 1989. AGNPS: a
non-point source pollution model for evaluating agricultural water-
sheds. Journal of Soil and Water Conservation 44 (2), 168–173.
1558
1559
1560
1561
1562
1563
1564
1565
1566
1567
1568