
A non arbitrary definition of rain event: the case of stratiform rain
Upload
khangminh22Category
view
1download
0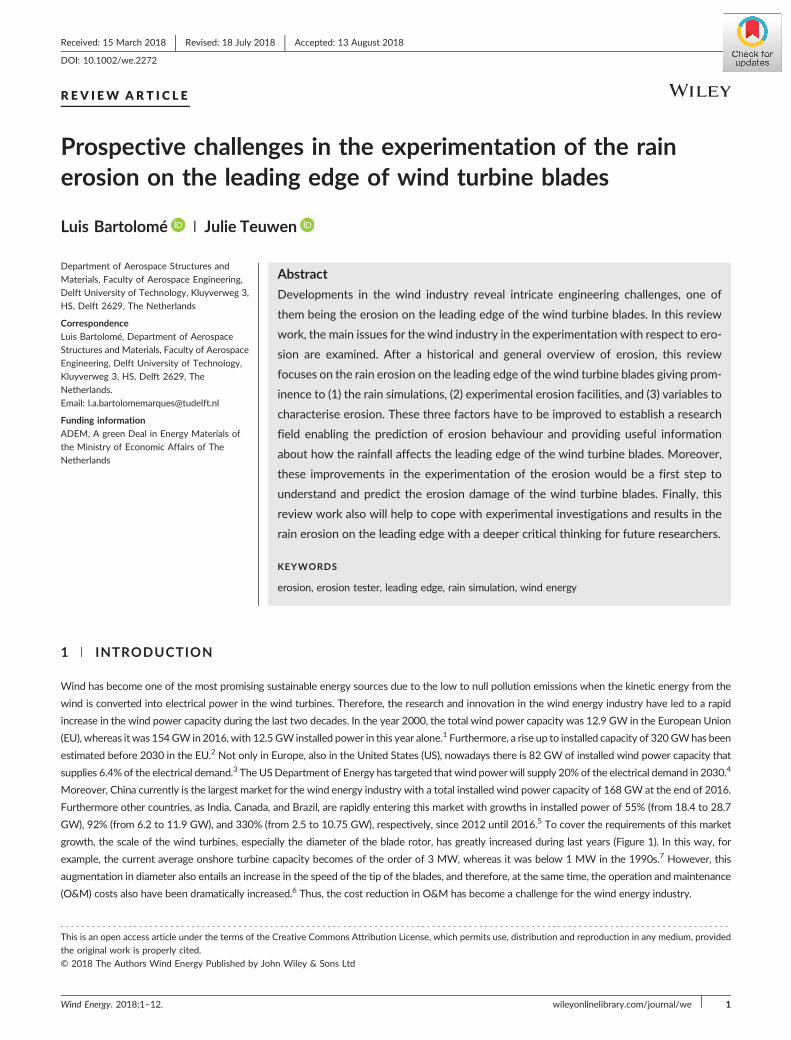
Received: 15 March 2018 Revised: 18 July 2018 Accepted: 13 August 2018
DOI: 10.1002/we.2272
R E V I EW AR T I C L E
Prospective challenges in the experimentation of the rainerosion on the leading edge of wind turbine blades
Luis Bartolomé | Julie Teuwen
Department of Aerospace Structures and
Materials, Faculty of Aerospace Engineering,
Delft University of Technology, Kluyverweg 3,
HS, Delft 2629, The Netherlands
Correspondence
Luis Bartolomé, Department of Aerospace
Structures and Materials, Faculty of Aerospace
Engineering, Delft University of Technology,
Kluyverweg 3, HS, Delft 2629, The
Netherlands.
Email: [email protected]
Funding information
ADEM, A green Deal in Energy Materials of
the Ministry of Economic Affairs of The
Netherlands
- - - - - - - - - - - - - - - - - - - - - - - - - - - - - - - - - - - - - - -
This is an open access article under the terms of th
the original work is properly cited.
© 2018 The Authors Wind Energy Published by J
Wind Energy. 2018;1–12.
Abstract
Developments in the wind industry reveal intricate engineering challenges, one of
them being the erosion on the leading edge of the wind turbine blades. In this review
work, the main issues for the wind industry in the experimentation with respect to ero-
sion are examined. After a historical and general overview of erosion, this review
focuses on the rain erosion on the leading edge of the wind turbine blades giving prom-
inence to (1) the rain simulations, (2) experimental erosion facilities, and (3) variables to
characterise erosion. These three factors have to be improved to establish a research
field enabling the prediction of erosion behaviour and providing useful information
about how the rainfall affects the leading edge of the wind turbine blades. Moreover,
these improvements in the experimentation of the erosion would be a first step to
understand and predict the erosion damage of the wind turbine blades. Finally, this
review work also will help to cope with experimental investigations and results in the
rain erosion on the leading edge with a deeper critical thinking for future researchers.
KEYWORDS
erosion, erosion tester, leading edge, rain simulation, wind energy
1 | INTRODUCTION
Wind has become one of the most promising sustainable energy sources due to the low to null pollution emissions when the kinetic energy from the
wind is converted into electrical power in the wind turbines. Therefore, the research and innovation in the wind energy industry have led to a rapid
increase in the wind power capacity during the last two decades. In the year 2000, the total wind power capacity was 12.9 GW in the European Union
(EU), whereas it was 154GW in 2016, with 12.5 GW installed power in this year alone.1 Furthermore, a rise up to installed capacity of 320GWhas been
estimated before 2030 in the EU.2 Not only in Europe, also in the United States (US), nowadays there is 82 GW of installed wind power capacity that
supplies 6.4% of the electrical demand.3 The USDepartment of Energy has targeted that wind powerwill supply 20% of the electrical demand in 2030.4
Moreover, China currently is the largest market for the wind energy industry with a total installed wind power capacity of 168 GW at the end of 2016.
Furthermore other countries, as India, Canada, and Brazil, are rapidly entering this market with growths in installed power of 55% (from 18.4 to 28.7
GW), 92% (from 6.2 to 11.9 GW), and 330% (from 2.5 to 10.75 GW), respectively, since 2012 until 2016.5 To cover the requirements of this market
growth, the scale of the wind turbines, especially the diameter of the blade rotor, has greatly increased during last years (Figure 1). In this way, for
example, the current average onshore turbine capacity becomes of the order of 3 MW, whereas it was below 1 MW in the 1990s.7 However, this
augmentation in diameter also entails an increase in the speed of the tip of the blades, and therefore, at the same time, the operation and maintenance
(O&M) costs also have been dramatically increased.6 Thus, the cost reduction in O&M has become a challenge for the wind energy industry.
- - - - - - - - - - - - - - - - - - - - - - - - - - - - - - - - - - - - - - - - - - - - - - - - - - - - - - - - - - - - - - - - - - - - - - - - - - - - - - - - - - - - - - - - -
e Creative Commons Attribution License, which permits use, distribution and reproduction in any medium, provided
ohn Wiley & Sons Ltd
wileyonlinelibrary.com/journal/we 1
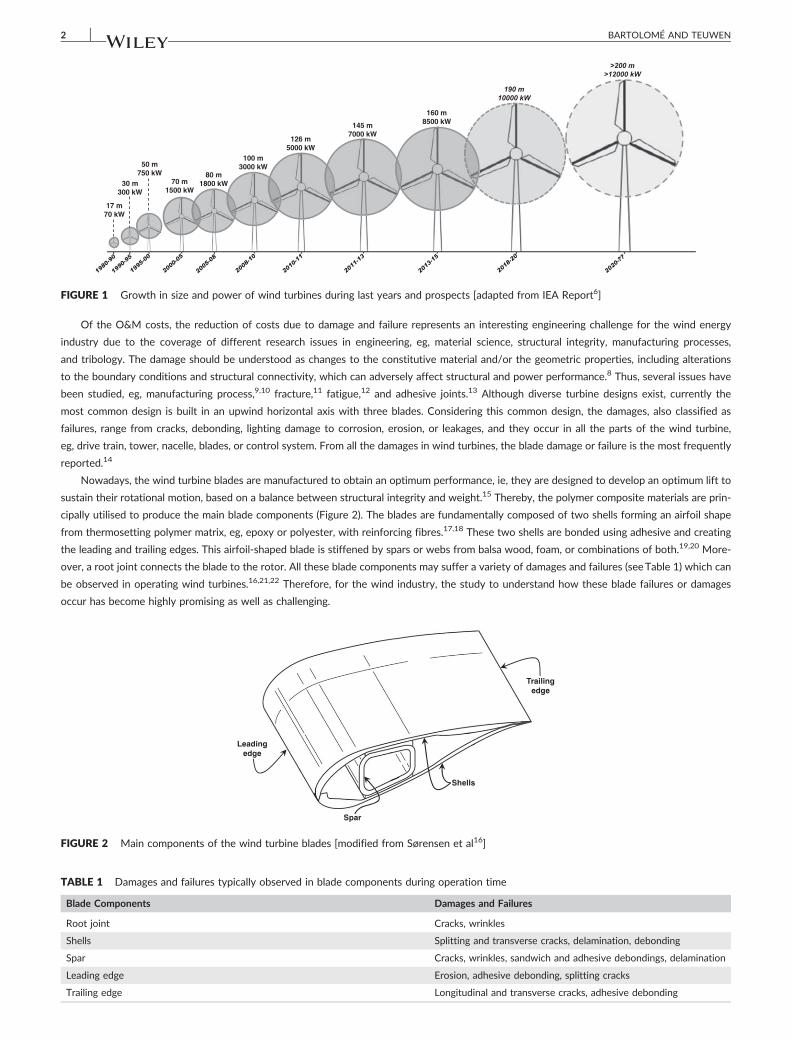
FIGURE 1 Growth in size and power of wind turbines during last years and prospects [adapted from IEA Report6]
2 BARTOLOMÉ AND TEUWEN
Of the O&M costs, the reduction of costs due to damage and failure represents an interesting engineering challenge for the wind energy
industry due to the coverage of different research issues in engineering, eg, material science, structural integrity, manufacturing processes,
and tribology. The damage should be understood as changes to the constitutive material and/or the geometric properties, including alterations
to the boundary conditions and structural connectivity, which can adversely affect structural and power performance.8 Thus, several issues have
been studied, eg, manufacturing process,9,10 fracture,11 fatigue,12 and adhesive joints.13 Although diverse turbine designs exist, currently the
most common design is built in an upwind horizontal axis with three blades. Considering this common design, the damages, also classified as
failures, range from cracks, debonding, lighting damage to corrosion, erosion, or leakages, and they occur in all the parts of the wind turbine,
eg, drive train, tower, nacelle, blades, or control system. From all the damages in wind turbines, the blade damage or failure is the most frequently
reported.14
Nowadays, the wind turbine blades are manufactured to obtain an optimum performance, ie, they are designed to develop an optimum lift to
sustain their rotational motion, based on a balance between structural integrity and weight.15 Thereby, the polymer composite materials are prin-
cipally utilised to produce the main blade components (Figure 2). The blades are fundamentally composed of two shells forming an airfoil shape
from thermosetting polymer matrix, eg, epoxy or polyester, with reinforcing fibres.17,18 These two shells are bonded using adhesive and creating
the leading and trailing edges. This airfoil‐shaped blade is stiffened by spars or webs from balsa wood, foam, or combinations of both.19,20 More-
over, a root joint connects the blade to the rotor. All these blade components may suffer a variety of damages and failures (seeTable 1) which can
be observed in operating wind turbines.16,21,22 Therefore, for the wind industry, the study to understand how these blade failures or damages
occur has become highly promising as well as challenging.
FIGURE 2 Main components of the wind turbine blades [modified from Sørensen et al16]
TABLE 1 Damages and failures typically observed in blade components during operation time
Blade Components Damages and Failures
Root joint Cracks, wrinkles
Shells Splitting and transverse cracks, delamination, debonding
Spar Cracks, wrinkles, sandwich and adhesive debondings, delamination
Leading edge Erosion, adhesive debonding, splitting cracks
Trailing edge Longitudinal and transverse cracks, adhesive debonding

BARTOLOMÉ AND TEUWEN 3
The causes of the failures and damages in blades are mostly related to design, manufacturing, environmental effects, and ageing. Some of the
failures and damages, eg, wrinkles, and debonding, are basically inherent to the design and manufacturing processes whereas other ones, eg, ero-
sion and splitting cracks, are more related to environmental effects, wild life, and ageing.23 The regions along the axial locations of 30% to 35% and
70% of blade length from the root joint are more prone to the failures and damages due to the design and manufacturing processes.14 However,
the leading edge is more prone to the damage due to the environmental effects and wild life.
A variety of environmental effects, eg, hailstorms, snow, rain showers, wind gusts, icing, extreme temperatures, lightning, seawater, ultraviolet light,
and sandy winds, degrade the blades of wind turbines over their working lifetimes. This degradation leads to reduction in aerodynamic efficiency and
power production, eg, the degradation caused by erosion on the leading edge affects the drag and the lift. Depending on the drag increase and lift
decrease, the loss of the annual energy production of wind turbines can range from 2% to 25%.24 Therefore, the reduction of erosion is a meaningful
engineering challenge even more so taking into account that a relatively small degree of leading edge erosion can cause a large increase in drag.
This review assesses the current developments in research of the leading edge erosion and also some of the issues and challenges that should
be coped in the near future for establishing a more rigorous scientific framework which provides a better understanding of and solutions for erosion
to the wind energy industry. Therefore, the next section describes the main aspects of the erosion and some of the historical problems that arise
during the study of erosion. The third section focuses on the erosion on the leading edge and which are the main issues, in for instance rain sim-
ulations, erosion test facilities, and variables of erosion analysis, to be considered to improve the scientific rigour of the research in the rain erosion
of the wind turbine blades. Finally, the main conclusions along with the approaches to some of these issues are recapitulated in the last section.
2 | EROSION
Erosion is defined as the progressive material loss from a solid surface due to repeated impacts of solid or fluid particles. Unlike wear, in erosion,
there is a fluid contribution to the mechanical phenomenon that is producing the material loss.25
Due to the complexity of the erosion, an erosion theory from first principles, ie, which relies on basic laws of nature without additional
assumptions or empirical models, is strongly difficult to derive.26 The complex phenomenon of material removal makes barely possible the direct
establishing of a proper predictive theory. For similar reasons, general relationships between erosive removal and macroscopic mechanical prop-
erties are highly complicated to establish. Considering that a completely theoretical predictive model is unlikely to be oncoming, a semi‐empirical
model is a logical approach. Therefore, the access to quality experimental work which contributes to this semi‐empirical approach becomes essen-
tial to comprehend the erosion. Consequently, throughout the years, the creation and improvement of experimental facilities have played a sig-
nificant role in erosion research. Different purposes can be established in the erosion analyses. Frequently, the aim is simply to compare the
relative erosive resistance of one material with other materials.27,28 But another aim can be to detect and define the damage mechanisms so
the intrinsic erosive resistance of a material can be improved.29,30
2.1 | Forms of erosion
Although the erosion is an effect that can be easily identified due to the surface damage, the erosion presents itself in different forms. The fore-
most forms are caused by solid particles, slurries, impingements, droplets, and cavitation.25 All these forms are not presented on the leading edge,
but briefly explaining them could help to provide an overall context and to understand the additional forms of erosion on the leading edge, eg,
erosion due to sand or salt water. The solid particle erosion is the caused damage on the surface of a body by the successive impacts of solid par-
ticles which are driven within a gas.31,32 The solid particle erosion is relevant to, among others, comminution devices, mining, gas extraction,
cyclone separators, and aircraft propellers. The slurry erosion is similar to the solid particle erosion, but the particles are driven within a liquid.33,34
This erosion form is important in mining, extraction of petroleum, and piping. The impingement erosion is mainly caused when a liquid stream
impacts on a solid surface causing fracture, which can be conjoint with corrosion. The impingement erosion is especially relevant in the chemistry
industry when chemicals are transported in pipelines or introduced into vessels.35,36 The droplet erosion is also caused by liquid flow but com-
posed of drops.37,38 In this case, the rain erosion is the main kind and therefore it is significant in outside industrial applications, eg, aircraft
and wind turbine industries. Finally, the cavitation erosion is caused when entrained gas cavities or bubbles within a liquid collapse.25 Cavitation
erosion occurs in many industrial applications, eg, concrete spillway, hydroelectric dams, when a liquid flows in piping and pumps39 and jewellery
industry for cleaning purposes.40
2.2 | Historical industrial relevance of erosion
The study of erosion as a damage concern goes back to the early 20th century when materials with high erosion resistance were sought to be used
in steam turbine blades.41,42 The blades of steam turbines rotate at supersonic velocities within wet steam environments suffering water droplet
impacts and hence erosion. These early studies were trying to relate erosion performance to mechanical properties of different materials. How-
ever, even if the lack of accurate experimental facilities is not considered, the achieved success was reduced due to the complexity of erosion
as a mechanical process.43 During the 1940s, erosion was also detected as a severe damage phenomenon by the aeronautical industry.44,45
The erosion was particularly intense on the forward facing components of aircrafts, eg, leading edges and radomes.46 Actually, the aircraft industry
has developed metallic shields and polymeric coatings or tapes to mitigate the erosion on the exposed parts. These solutions are developed for the

4 BARTOLOMÉ AND TEUWEN
aircraft industry where inspections of the wing leading edge can be carried out when the airplane is on the ground, but they can be unfit for other
industries, eg, in wind industry where inspections are more spaced out over time due to limited accessibility and to reduce the O&M costs.
During the last decades, a wide range of disciplines and industries have also been greatly interested in erosion as wear phenomenon, eg, high‐
speed cutting materials, chemical plants, mining surface cleaning, or medical sciences. The erosion is very widespread and is involved in a consid-
erable number of processes. The extraction of minerals and oil produces erosion on the drilling tools.47,48 The sand‐, dirt‐, dust‐laden air causes
erosion on the propellers, impellers, and fan drives.49,50 The cutting tools in high speed manufacturing are also affected by erosion.51,52 The rain-
drop impacts erode the exposed surfaces of the aircrafts, eg, leading edge of wings.53 In farming, the tillage tools are eroded by soil and rocks.54,55
In dentistry, the erosion is used for teeth cleaning, but also some of the dentist instruments induce erosion on the teeth to prepare them for dental
treatments.56 Consequently, due to the large quantity of erosive applications that can be found in different industrial fields, the erosion has a great
economic impact. Currently, due to the effect in the energy production and therefore in the economic profit, the research in erosion, specifically in
rain erosion, has become a problem subjected to a broad undergoing interest due to the development in wind turbine industry during the last
decades.
3 | RAIN EROSION IN BLADE LEADING EDGE
This section focuses on the rain erosion on the leading edge of the wind turbine blades and how its experimental research should cope with sev-
eral challenges to characterise the erosion caused by the raindrops with proper scientific rigour.
Erosion occurs on the leading edge of wind turbine blades that have been in operation because of various environmental conditions. Atmo-
spheric particles, raindrops, hail,37 and sand57 impacting the wind turbine blades rotating at high speeds is the primary cause of surface erosion on
the leading edges. These impacts start modifying the surface roughness, then changing the shape, ie, the aerodynamic profile, of the leading edge
and in the end damaging the integrity of the blade material. Wind speed and rotational velocity of the blade determine the impact velocity of the
erosive particles and hence the erosion capacity, ie, the power to cause erosion. Although the tip of the blade is the most prone part to suffer
erosion due to the maximum rotational velocity is at this part, erosion can be also found in parts closer to the hub along the leading edge. More-
over, the extent of erosion also depends on the environmental temperature and humidity.58
Among all the causes of erosion on the leading edge of the wind turbine blades, rain is one of the most important because it causes erosion
since the first moment the wind turbines start working, eg, Wood59 found that, although the blades are expected to run more than 20 years, ero-
sion can occur after only 2 years of operation. Initially, the raindrops cause change only in superficial roughness, ie, no visual effects can be found
and gravimetrically no significant changes can be measured. This time is usually referred to as incubation period.60 To the wind industry, this
period will be of great importance as its enlargement will prolong the time of full power capacity of the wind turbines. During this period, the
microstructural characteristics of the material at the leading edge yield nucleation points for the initiation of the material removal.61 Therefore,
after the incubation period, the erosion begins to be visible and the loss of mass can be measured. The first observable effects on the surface
of the leading edge are irregularly distributed pitting (Figure 3A), then the increasing density of pitting makes surface pits combine and thus cracks
can be formed easily starting the cracking (Figure 3B). After that, severe erosion begins when cratering (Figure 3C) appears due to the high con-
centration of cracks at some points. Finally, the cluster of cracks becomes a failure of the material integrity, ie, the complete removal of the coating
layer exposes the laminates and thus delamination (Figure 3D) occurs. All these stages of erosion do not have to strictly occur in this order because
factors, eg, manufacturing, transport, and installation, also may induce small tears or scratches which play a role as initiation points of erosion alter-
ing the natural process of erosion on the leading edge of wind turbine blades.62
Although the study of the rain erosion on the leading edge has become an essential issue for the wind turbine industry to reduce maintenance
costs and to increase the annual energy production, the available literature about the cause and the mechanisms of rain erosion is very limited.
Mainly, the reasons for this scarce literature are that the sources, as manufacturers, operators, and maintenance and repair companies, rarely pro-
vide details about the issue of rain erosion on the leading edge and, when they provide them, the information is referred to the first‐hand expe-
riences with anecdotal reports.63-65 However, during the last years, the monitoring and recording of the erosion have been carried out to detect
the correlations between the leading edge erosion and the climate and operating conditions by wind industry.66 Although these databases will be
able to provide useful and practical information for wind industry, some experimental challenges in the erosion of the leading edge need to be
addressed from a scientific point of view to promote a research field which will be really productive and with the capacity of prediction for the
wind industry. Some of these main experimental challenges are in rain simulation, experimental test facilities, and variables for rain erosion.
3.1 | Rain simulation
The erosion on the leading edge of the blades is caused mainly by rain. Therefore rain, and more specifically the amount of rain water, ie, the rain
load, in each rainfall event, is interesting to experimental research, and many works can be found in the literature to handle rain data,67,68 but rain
is a natural phenomenon which is strongly complex to simulate. This complexity is derived from several factors, the most important being size,
shape, and velocity of the raindrops.69
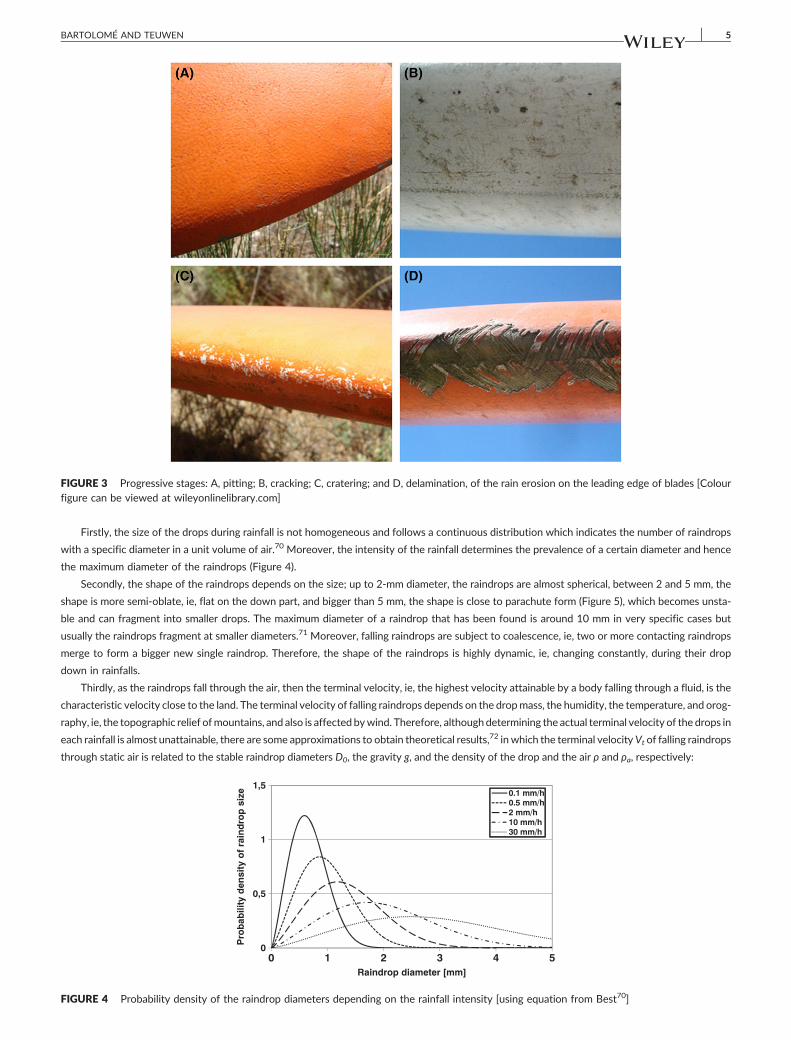
FIGURE 3 Progressive stages: A, pitting; B, cracking; C, cratering; and D, delamination, of the rain erosion on the leading edge of blades [Colourfigure can be viewed at wileyonlinelibrary.com]
BARTOLOMÉ AND TEUWEN 5
Firstly, the size of the drops during rainfall is not homogeneous and follows a continuous distribution which indicates the number of raindrops
with a specific diameter in a unit volume of air.70 Moreover, the intensity of the rainfall determines the prevalence of a certain diameter and hence
the maximum diameter of the raindrops (Figure 4).
Secondly, the shape of the raindrops depends on the size; up to 2‐mm diameter, the raindrops are almost spherical, between 2 and 5 mm, the
shape is more semi‐oblate, ie, flat on the down part, and bigger than 5 mm, the shape is close to parachute form (Figure 5), which becomes unsta-
ble and can fragment into smaller drops. The maximum diameter of a raindrop that has been found is around 10 mm in very specific cases but
usually the raindrops fragment at smaller diameters.71 Moreover, falling raindrops are subject to coalescence, ie, two or more contacting raindrops
merge to form a bigger new single raindrop. Therefore, the shape of the raindrops is highly dynamic, ie, changing constantly, during their drop
down in rainfalls.
Thirdly, as the raindrops fall through the air, then the terminal velocity, ie, the highest velocity attainable by a body falling through a fluid, is the
characteristic velocity close to the land. The terminal velocity of falling raindrops depends on the dropmass, the humidity, the temperature, and orog-
raphy, ie, the topographic relief ofmountains, and also is affected bywind. Therefore, althoughdetermining the actual terminal velocity of the drops in
each rainfall is almost unattainable, there are some approximations to obtain theoretical results,72 in which the terminal velocity Vt of falling raindrops
through static air is related to the stable raindrop diameters D0, the gravity g, and the density of the drop and the air ρ and ρa, respectively:
FIGURE 4 Probability density of the raindrop diameters depending on the rainfall intensity [using equation from Best70]
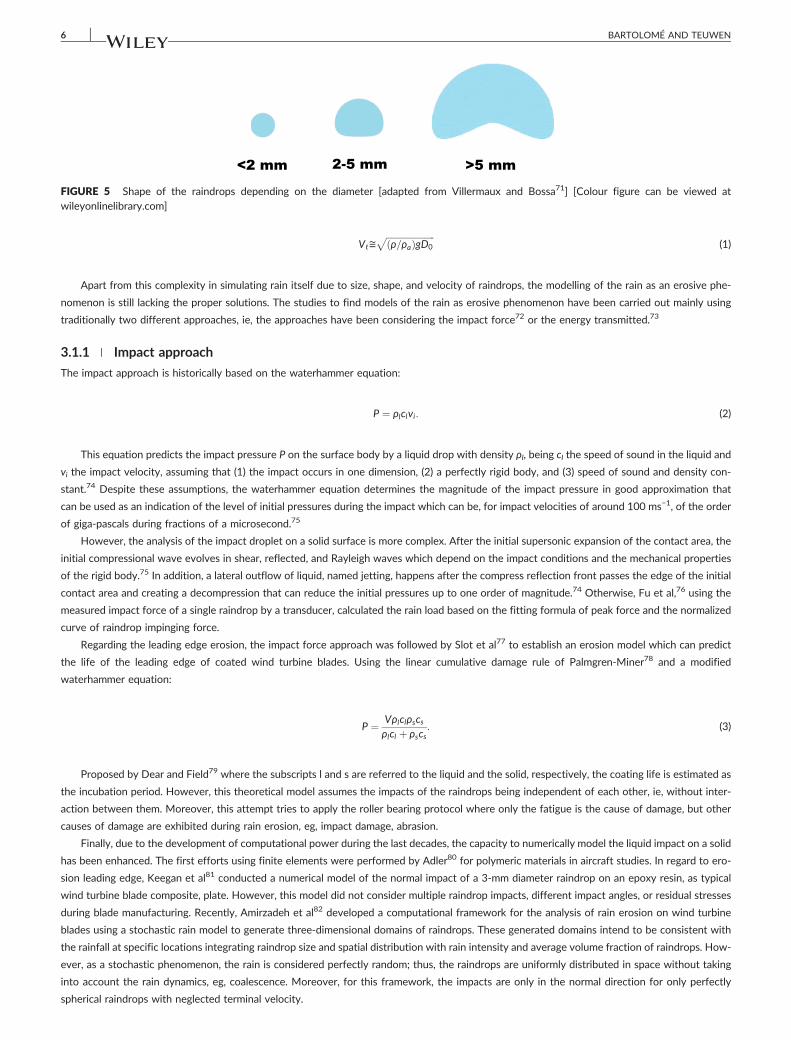
FIGURE 5 Shape of the raindrops depending on the diameter [adapted from Villermaux and Bossa71] [Colour figure can be viewed atwileyonlinelibrary.com]
6 BARTOLOMÉ AND TEUWEN
Vt≅ffiffiffiffiffiffiffiffiffiffiffiffiffiffiffiffiffiffiffiffiffiffiρ=ρað ÞgD0
p(1)
Apart from this complexity in simulating rain itself due to size, shape, and velocity of raindrops, the modelling of the rain as an erosive phe-
nomenon is still lacking the proper solutions. The studies to find models of the rain as erosive phenomenon have been carried out mainly using
traditionally two different approaches, ie, the approaches have been considering the impact force72 or the energy transmitted.73
3.1.1 | Impact approach
The impact approach is historically based on the waterhammer equation:
P ¼ ρlclvi: (2)
This equation predicts the impact pressure P on the surface body by a liquid drop with density ρl, being cl the speed of sound in the liquid and
vi the impact velocity, assuming that (1) the impact occurs in one dimension, (2) a perfectly rigid body, and (3) speed of sound and density con-
stant.74 Despite these assumptions, the waterhammer equation determines the magnitude of the impact pressure in good approximation that
can be used as an indication of the level of initial pressures during the impact which can be, for impact velocities of around 100 ms−1, of the order
of giga‐pascals during fractions of a microsecond.75
However, the analysis of the impact droplet on a solid surface is more complex. After the initial supersonic expansion of the contact area, the
initial compressional wave evolves in shear, reflected, and Rayleigh waves which depend on the impact conditions and the mechanical properties
of the rigid body.75 In addition, a lateral outflow of liquid, named jetting, happens after the compress reflection front passes the edge of the initial
contact area and creating a decompression that can reduce the initial pressures up to one order of magnitude.74 Otherwise, Fu et al,76 using the
measured impact force of a single raindrop by a transducer, calculated the rain load based on the fitting formula of peak force and the normalized
curve of raindrop impinging force.
Regarding the leading edge erosion, the impact force approach was followed by Slot et al77 to establish an erosion model which can predict
the life of the leading edge of coated wind turbine blades. Using the linear cumulative damage rule of Palmgren‐Miner78 and a modified
waterhammer equation:
P ¼ Vρlclρscsρlcl þ ρscs
: (3)
Proposed by Dear and Field79 where the subscripts l and s are referred to the liquid and the solid, respectively, the coating life is estimated as
the incubation period. However, this theoretical model assumes the impacts of the raindrops being independent of each other, ie, without inter-
action between them. Moreover, this attempt tries to apply the roller bearing protocol where only the fatigue is the cause of damage, but other
causes of damage are exhibited during rain erosion, eg, impact damage, abrasion.
Finally, due to the development of computational power during the last decades, the capacity to numerically model the liquid impact on a solid
has been enhanced. The first efforts using finite elements were performed by Adler80 for polymeric materials in aircraft studies. In regard to ero-
sion leading edge, Keegan et al81 conducted a numerical model of the normal impact of a 3‐mm diameter raindrop on an epoxy resin, as typical
wind turbine blade composite, plate. However, this model did not consider multiple raindrop impacts, different impact angles, or residual stresses
during blade manufacturing. Recently, Amirzadeh et al82 developed a computational framework for the analysis of rain erosion on wind turbine
blades using a stochastic rain model to generate three‐dimensional domains of raindrops. These generated domains intend to be consistent with
the rainfall at specific locations integrating raindrop size and spatial distribution with rain intensity and average volume fraction of raindrops. How-
ever, as a stochastic phenomenon, the rain is considered perfectly random; thus, the raindrops are uniformly distributed in space without taking
into account the rain dynamics, eg, coalescence. Moreover, for this framework, the impacts are only in the normal direction for only perfectly
spherical raindrops with neglected terminal velocity.
BARTOLOMÉ AND TEUWEN 7
3.1.2 | Energetic approach
The energetic approach is based on the kinetic energy transmitted, and this approach tries to relate erosion to mechanical properties of the
impacted body. Nevertheless, the difficulty lies in quantifying the total transferred energy to the bulk of the body through the surface. Although
this approach has been explored in other cases such as steam blade turbines,83,84 energetic‐based studies regarding the erosion on the leading
edge are lacking in the scientific literature. Therefore, studies on this approach are promising because it tries to analyse the erosive capacity of
the rain as a whole avoiding the actual assumptions, eg, the impact effects are independent of each other, the shape of the raindrops as a perfect
sphere, etc.
3.2 | Experimental test facilities
Throughout the years, many experimental test facilities and instruments have been developed to investigate erosion.25 Nowadays, to study the
rain erosion, principally two kinds of experimental facilities are employed: the jet erosion test facilities and the whirling arm test facilities, although
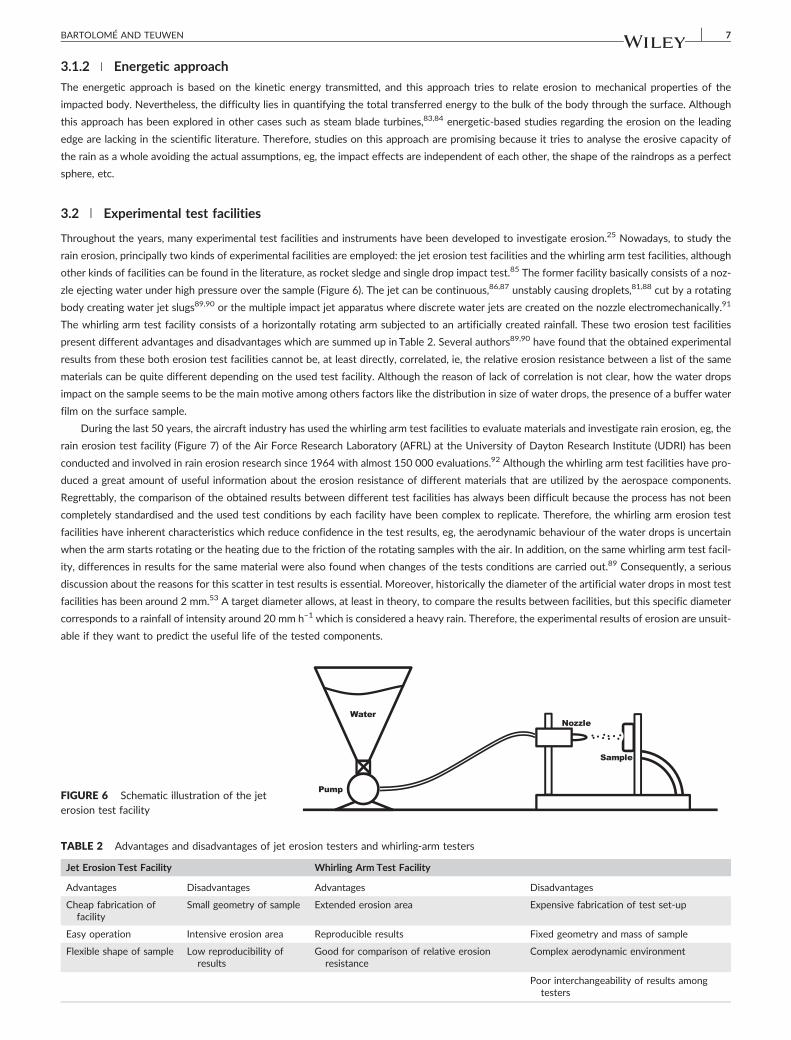
other kinds of facilities can be found in the literature, as rocket sledge and single drop impact test.85 The former facility basically consists of a noz-
zle ejecting water under high pressure over the sample (Figure 6). The jet can be continuous,86,87 unstably causing droplets,81,88 cut by a rotating
body creating water jet slugs89,90 or the multiple impact jet apparatus where discrete water jets are created on the nozzle electromechanically.91
The whirling arm test facility consists of a horizontally rotating arm subjected to an artificially created rainfall. These two erosion test facilities
present different advantages and disadvantages which are summed up in Table 2. Several authors89,90 have found that the obtained experimental
results from these both erosion test facilities cannot be, at least directly, correlated, ie, the relative erosion resistance between a list of the same
materials can be quite different depending on the used test facility. Although the reason of lack of correlation is not clear, how the water drops
impact on the sample seems to be the main motive among others factors like the distribution in size of water drops, the presence of a buffer water
film on the surface sample.
During the last 50 years, the aircraft industry has used the whirling arm test facilities to evaluate materials and investigate rain erosion, eg, the
rain erosion test facility (Figure 7) of the Air Force Research Laboratory (AFRL) at the University of Dayton Research Institute (UDRI) has been
conducted and involved in rain erosion research since 1964 with almost 150 000 evaluations.92 Although the whirling arm test facilities have pro-
duced a great amount of useful information about the erosion resistance of different materials that are utilized by the aerospace components.
Regrettably, the comparison of the obtained results between different test facilities has always been difficult because the process has not been
completely standardised and the used test conditions by each facility have been complex to replicate. Therefore, the whirling arm erosion test
facilities have inherent characteristics which reduce confidence in the test results, eg, the aerodynamic behaviour of the water drops is uncertain
when the arm starts rotating or the heating due to the friction of the rotating samples with the air. In addition, on the same whirling arm test facil-
ity, differences in results for the same material were also found when changes of the tests conditions are carried out.89 Consequently, a serious
discussion about the reasons for this scatter in test results is essential. Moreover, historically the diameter of the artificial water drops in most test
facilities has been around 2 mm.53 A target diameter allows, at least in theory, to compare the results between facilities, but this specific diameter
corresponds to a rainfall of intensity around 20 mm h−1 which is considered a heavy rain. Therefore, the experimental results of erosion are unsuit-
able if they want to predict the useful life of the tested components.
TABLE 2 Advantages and disadvantages of jet erosion testers and whirling‐arm testers
Jet Erosion Test Facility Whirling Arm Test Facility
Advantages Disadvantages Advantages Disadvantages
Cheap fabrication offacility
Small geometry of sample Extended erosion area Expensive fabrication of test set‐up
Easy operation Intensive erosion area Reproducible results Fixed geometry and mass of sample
Flexible shape of sample Low reproducibility ofresults
Good for comparison of relative erosionresistance
Complex aerodynamic environment
Poor interchangeability of results amongtesters
FIGURE 6 Schematic illustration of the jeterosion test facility
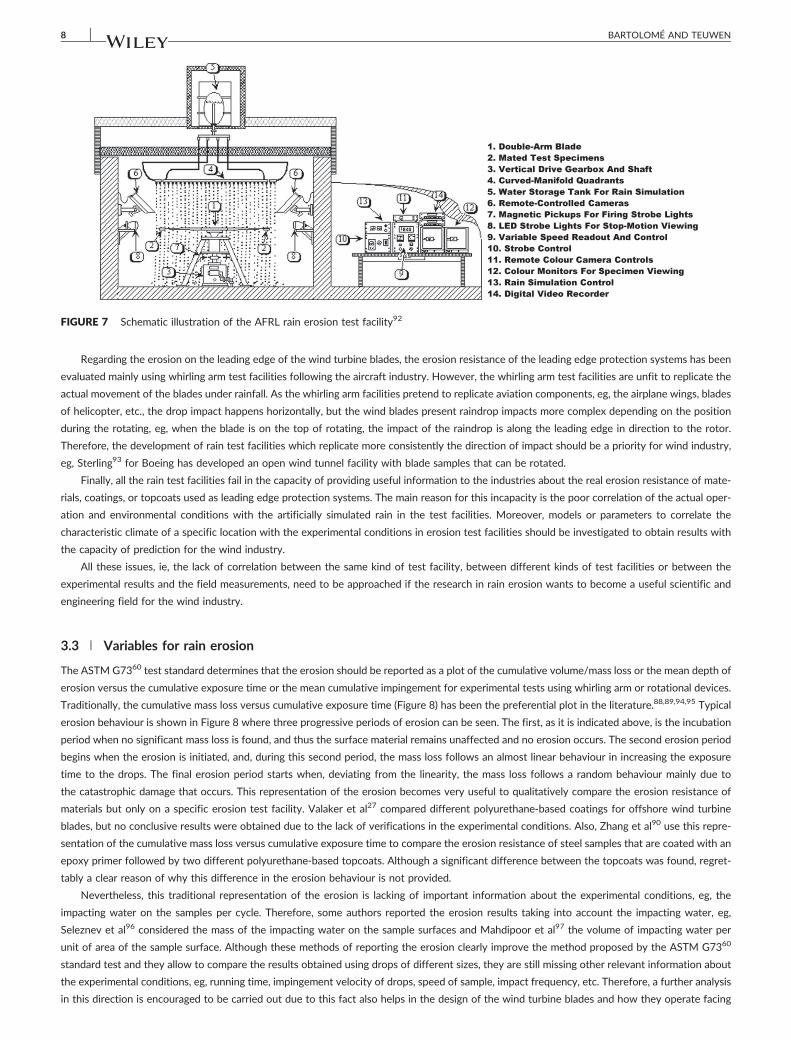
FIGURE 7 Schematic illustration of the AFRL rain erosion test facility92
8 BARTOLOMÉ AND TEUWEN
Regarding the erosion on the leading edge of the wind turbine blades, the erosion resistance of the leading edge protection systems has been
evaluated mainly using whirling arm test facilities following the aircraft industry. However, the whirling arm test facilities are unfit to replicate the
actual movement of the blades under rainfall. As the whirling arm facilities pretend to replicate aviation components, eg, the airplane wings, blades
of helicopter, etc., the drop impact happens horizontally, but the wind blades present raindrop impacts more complex depending on the position
during the rotating, eg, when the blade is on the top of rotating, the impact of the raindrop is along the leading edge in direction to the rotor.
Therefore, the development of rain test facilities which replicate more consistently the direction of impact should be a priority for wind industry,
eg, Sterling93 for Boeing has developed an open wind tunnel facility with blade samples that can be rotated.
Finally, all the rain test facilities fail in the capacity of providing useful information to the industries about the real erosion resistance of mate-
rials, coatings, or topcoats used as leading edge protection systems. The main reason for this incapacity is the poor correlation of the actual oper-
ation and environmental conditions with the artificially simulated rain in the test facilities. Moreover, models or parameters to correlate the
characteristic climate of a specific location with the experimental conditions in erosion test facilities should be investigated to obtain results with
the capacity of prediction for the wind industry.
All these issues, ie, the lack of correlation between the same kind of test facility, between different kinds of test facilities or between the
experimental results and the field measurements, need to be approached if the research in rain erosion wants to become a useful scientific and
engineering field for the wind industry.
3.3 | Variables for rain erosion
The ASTM G7360 test standard determines that the erosion should be reported as a plot of the cumulative volume/mass loss or the mean depth of
erosion versus the cumulative exposure time or the mean cumulative impingement for experimental tests using whirling arm or rotational devices.
Traditionally, the cumulative mass loss versus cumulative exposure time (Figure 8) has been the preferential plot in the literature.88,89,94,95 Typical
erosion behaviour is shown in Figure 8 where three progressive periods of erosion can be seen. The first, as it is indicated above, is the incubation
period when no significant mass loss is found, and thus the surface material remains unaffected and no erosion occurs. The second erosion period
begins when the erosion is initiated, and, during this second period, the mass loss follows an almost linear behaviour in increasing the exposure
time to the drops. The final erosion period starts when, deviating from the linearity, the mass loss follows a random behaviour mainly due to
the catastrophic damage that occurs. This representation of the erosion becomes very useful to qualitatively compare the erosion resistance of
materials but only on a specific erosion test facility. Valaker et al27 compared different polyurethane‐based coatings for offshore wind turbine
blades, but no conclusive results were obtained due to the lack of verifications in the experimental conditions. Also, Zhang et al90 use this repre-
sentation of the cumulative mass loss versus cumulative exposure time to compare the erosion resistance of steel samples that are coated with an
epoxy primer followed by two different polyurethane‐based topcoats. Although a significant difference between the topcoats was found, regret-
tably a clear reason of why this difference in the erosion behaviour is not provided.
Nevertheless, this traditional representation of the erosion is lacking of important information about the experimental conditions, eg, the
impacting water on the samples per cycle. Therefore, some authors reported the erosion results taking into account the impacting water, eg,
Seleznev et al96 considered the mass of the impacting water on the sample surfaces and Mahdipoor et al97 the volume of impacting water per
unit of area of the sample surface. Although these methods of reporting the erosion clearly improve the method proposed by the ASTM G7360
standard test and they allow to compare the results obtained using drops of different sizes, they are still missing other relevant information about
the experimental conditions, eg, running time, impingement velocity of drops, speed of sample, impact frequency, etc. Therefore, a further analysis
in this direction is encouraged to be carried out due to this fact also helps in the design of the wind turbine blades and how they operate facing
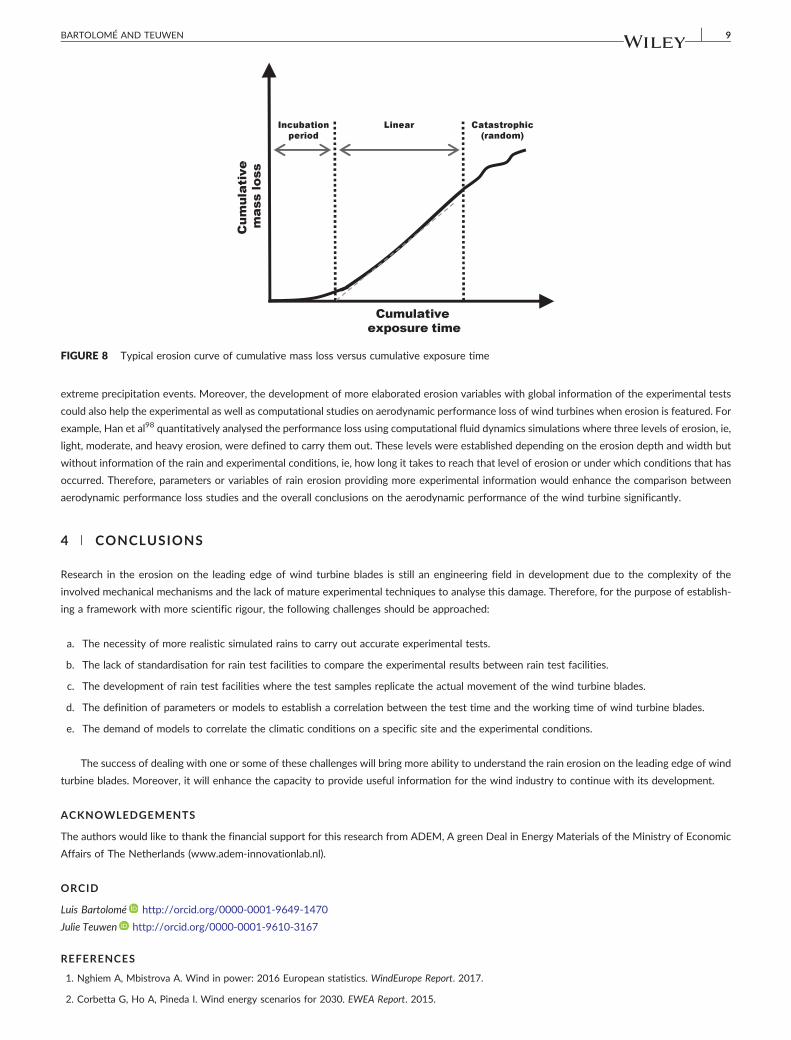
FIGURE 8 Typical erosion curve of cumulative mass loss versus cumulative exposure time
BARTOLOMÉ AND TEUWEN 9
extreme precipitation events. Moreover, the development of more elaborated erosion variables with global information of the experimental tests
could also help the experimental as well as computational studies on aerodynamic performance loss of wind turbines when erosion is featured. For
example, Han et al98 quantitatively analysed the performance loss using computational fluid dynamics simulations where three levels of erosion, ie,
light, moderate, and heavy erosion, were defined to carry them out. These levels were established depending on the erosion depth and width but
without information of the rain and experimental conditions, ie, how long it takes to reach that level of erosion or under which conditions that has
occurred. Therefore, parameters or variables of rain erosion providing more experimental information would enhance the comparison between
aerodynamic performance loss studies and the overall conclusions on the aerodynamic performance of the wind turbine significantly.
4 | CONCLUSIONS
Research in the erosion on the leading edge of wind turbine blades is still an engineering field in development due to the complexity of the
involved mechanical mechanisms and the lack of mature experimental techniques to analyse this damage. Therefore, for the purpose of establish-
ing a framework with more scientific rigour, the following challenges should be approached:
a. The necessity of more realistic simulated rains to carry out accurate experimental tests.
b. The lack of standardisation for rain test facilities to compare the experimental results between rain test facilities.
c. The development of rain test facilities where the test samples replicate the actual movement of the wind turbine blades.
d. The definition of parameters or models to establish a correlation between the test time and the working time of wind turbine blades.
e. The demand of models to correlate the climatic conditions on a specific site and the experimental conditions.
The success of dealing with one or some of these challenges will bring more ability to understand the rain erosion on the leading edge of wind
turbine blades. Moreover, it will enhance the capacity to provide useful information for the wind industry to continue with its development.
ACKNOWLEDGEMENTS
The authors would like to thank the financial support for this research from ADEM, A green Deal in Energy Materials of the Ministry of Economic
Affairs of The Netherlands (www.adem‐innovationlab.nl).
ORCID
Luis Bartolomé http://orcid.org/0000-0001-9649-1470
Julie Teuwen http://orcid.org/0000-0001-9610-3167
REFERENCES
1. Nghiem A, Mbistrova A. Wind in power: 2016 European statistics. WindEurope Report. 2017.
2. Corbetta G, Ho A, Pineda I. Wind energy scenarios for 2030. EWEA Report. 2015.

10 BARTOLOMÉ AND TEUWEN
3. Wiser R, Bolinger M. 2016 wind technologies market report. Report of the US Department of Energy. 2016.
4. US Department of Energy. Wind vision: a new era for wind power in the United States. Report of the US Department of Energy. 2015.
5. Global Wind Energy Council. Global wind report 2016. GWEC Report. 2016.
6. International Energy Agency. Wind energy: technology roadmap. IEA Report. 2013.
7. McKenna R, Ostman YD, Leye P, Fichtner W. Key challenges and prospects for large wind turbines. Renew Sustain Energy Rev. 2016;53:1212‐1221.
8. Farrar CR, Worden K. An introduction to structural health monitoring. Philos Trans R Soc London, Ser A. 2007;365(1851):303‐315.
9. Nelson JW, Cairns DS, Riddle TW. Manufacturing defects common to composite wind turbine blades: effects of defects. Proceedings of the AIAAaerospace science meeting, wind energy symposium; January 4–7, 2011. Orlando (FL, US).
10. Cairns DS, Riddle T, Nelson J. Wind turbine composite blade manufacturing: the need for understanding defect origins, prevalence, implications andreliability. SANDIA report: SAND2011–1094.2011.
11. Eder MA, Bitsche RD, Nielsen M, Branner K. A practical approach to fracture analysis at the trailing edge of wind turbine rotor blades. Wind Energy.2014;17(3):483‐497.
12. Niezrecki C, Avitabile P, Chen J, et al. Inspection and monitoring of wind turbine blade‐embedded wave defects during fatigue testing. Struct HealthMonit. 2014;13(6):629‐643.
13. Eder MA, Bitsche RD. Fracture analysis of adhesive joints in wind turbine blades. Wind Energy. 2015;18(6):1007‐1022.
14. Ciang CC, Lee J, Bang H. Structural health monitoring for a wind turbine system: a review of damage detection methods. Meas Sci Technol.2008;19(12):122001.
15. McGugan M, Pereira G, Sørensen BF, Toftegaard H, Branner K. Damage tolerance and structural monitoring for wind turbine blades. Philos Trans R SocLond A. 2015;373(2035):20140077.
16. Sørensen BF, Jørgensen E, Debel CP et al. Improved design of large wind turbine blade of fibre composites based on studies of scale effects: summaryreport. Risø Laboratory Report: Risø‐R‐1390(EN). 2004.
17. Jackson KJ, Zuteck MD, van Dam CP, Standish KJ, Berry D. Innovative design approaches for large wind turbine blades. Wind Energy.2004;8(2):141‐171.
18. Mishnaevsky JL, Brøndsted P, Mijssen R, Lekou DJ, Philippidis TP. Materials of large wind turbine blades: recent results in testing and modelling. WindEnergy. 2011;15(1):83‐97.
19. Jensen FM, Puri AS, Dear JP, Branner K, Morris A. Investigating the impact of non‐linear geometrical effects on wind turbine blades Part 1: Currentstatus of design and test methods and future challenges in design optimization. Wind Energy. 2011;14(2):239‐254.
20. Goch G, Knapp W, Hartig F. Precision engineering for wind energy systems. CIRP Ann. 2012;61(2):611‐634.
21. Toft HS, Branner K, Berring P, Sørensen JD. Defect distribution and reliability assessment of wind turbine blades. Eng Struct. 2011;33(1):171‐180.
22. Ataya S, Ahmed MMZ. Damages of wind turbine blade trailing edge: forms, location, and root causes. Eng Fail Anal. 2013;35:480‐488.
23. Shohag MAS, Hammel EC, Olawale DO, Okoli OI. Damage mitigation techniques in wind turbine blades: a review. Wind Eng. 2017;41(3):185‐210.
24. Sareen A, Sapre CA, Selig MS. Effects of leading edge erosion on wind turbine blade performance. Wind Energy. 2014;17(10):1531‐1542.
25. Budinski KG. Guide to Friction, Wear, and Erosion Testing. West Conshohocken, PA: ASTM International; 2007.
26. Adler WF. Particulate impact damage predictions. Wear. 1995;186–187:35‐44.
27. Valaker EA, Armada S, Wilson S. Droplet erosion protection coatings for offshore wind turbine blades. Energy Procedia. 2015;80:263‐275.
28. Zhang S, Dam‐Johansen K, Bernard P Jr, Kiil S. Rain erosion of wind turbine blade coatings using discrete water jets: effects of water cushioning,substrate geometry, impact distance, and properties. Wear. 2015;328–329:140‐148.
29. Luiset B, Sanchette F, Billard A, Schuster D. Mechanisms of stainless steels erosion by water droplets. Wear. 2013;303:459‐464.
30. Kamkar N, Bridier F, Jedrzejowski P, Bocher P. Water droplet impact erosion damage initiation in forged Ti‐6Al‐4V. Wear. 2015;322–323:192‐202.
31. Merrison JP. Sand transport, erosion and granular electrification. Aeolian Res. 2012;4:1‐16.
32. Parsi M, Najmi K, Najafifard F, Hassani S, McLaury BS, Shirazi SA. A comprehensive review of solid particle erosion modeling for oil and gas wells andpipelines applications. J Nat Gas Sci Eng. 2014;21:850‐873.
33. Padhy MK, Saini RP. A review on silt erosion in hydro‐turbines. Renew Sustain Energy Rev. 2008;12:1974‐1987.
34. Tarodiya R, Gandhi BK. Hydraulic performance and erosive wear of centrifugal slurry pumps‐A review. Powder Technol. 2017;305:27‐38.
35. Ashraful Alam MM, Matsuo S, Setoguchi T. Effect of non‐equilibrium homogeneous condensation on the self‐induced flow oscillation of supersonicimpinging jets. Int J Therm Sci. 2010;49:2078‐2092.
36. Harmand S, Pellé J, Poncet S, Shevchuck IV. Review of fluid flow and convective heat transfer within rotating disk cavities with impinging jet. Int JTherm Sci. 2013;67:1‐30.
37. Keegan MH, Nash DH, Stack MM. On erosion issues associated with the leading edge of wind turbine blades. J Phys D Appl Phys. 2013;46(38):383001.
38. Cao Y, Wu Z, Xu Z. Effects of rainfall on aircraft aerodynamics. Prog Aerosp Sci. 2014;71:85‐127.
39. Sreedhar BK, Albert SK, Pandit AB. Cavitation damage: theory and measurements—a review. Wear. 2017;372–373:177‐196.
40. Verhaagen B, Fernandez‐Rivas D. Measuring cavitation and its cleaning effect. Ultrason Sonochem. 2016;29:619‐628.
41. Honegger E. Tests on erosion caused by jets. Brown Boveri Rev. 1927;14:95‐104.
42. Cook SS. Water‐hammer erosion in turbines. Proc Univ Durham Philos Soc. 1929;8:88‐100.
43. Hengstenberg TF. Accelerated tests reveal erosion‐resisting metals. Power. 1932;76:118‐120.
44. Pierpoint TR. Electric motor water spray tests of various helicopter rotor blade abrasion resistant leading edge specimens. United States Air ForceTechnical Report No.5495.1946.
45. Long JK, Ramke WG. Rain erosion of aircraft plastics. United States Air Force Technical Report No. 5948. 1950.

BARTOLOMÉ AND TEUWEN 11
46. Fyall AA, Strain RN. Rain erosion of materials with special references to radomes. Royal Aircraft Establishment. Report Chemistry 502.1955.
47. Arefi B, Settari A, Angman P. Analysis and simulation of erosion in drilling tools. Wear. 2005;259:263‐270.
48. Hu G, Zhang P, Wang G, Zhu H, Li Q, Zhao S. Performance study of erosion resistance on throttle valve of managed pressure drilling. J Pet Sci Technol.2017;156:29‐40.
49. Hamed AA, Tabakoff W, Rivir RB, Das K, Arora P. Turbine blade surface deterioration by erosion. J Turbomach. 2005;127:445‐452.
50. Han Z, Yin W, Zhang J, Jiang J, Niu S, Ren L. Erosion‐resistant surfaces inspired by tumarisk. J Bionic Eng. 2013;10:479‐487.
51. Yussefian NZ, Koshy P, Buchholz S, Klocke F. Electro‐erosion edge honing of cutting tools. CIRP Ann Manuf Technol. 2010;59:215‐218.
52. Liu C, Liu Z, Wang B. Modification of surface morphology to enhance tribological properties for CVD coated cutting tools through wet micro‐blastingpost‐process. Ceram Int. 2018;44:3430‐3439.
53. Gohardani O. Impact of erosion testing aspects on current and future flight conditions. Prog Aerosp Sci. 2011;47:280‐303.
54. Karmakar S, Kushwaha RL, Stilling DSD. Soil failure associated with crack propagation for an agricultural tillage tool. Soil Tillage Res. 2005;84:119‐126.
55. Barzegar M, Hashemi SJ, Nazokdast H. Karimi R. Evaluating the draft force and soil‐tool adhesion of a UHMW‐PE coated furrower. Soil Tillage Res2016;163:160–167.
56. Ahmed W, Sein H, Jackson M, Rego C, Hassan I, Subramani K. Surface engineering of dental tools with diamond for enhanced life and performance. In:Subramani K, Ahmed W, eds. Emerging Nanotechnologies in Dentistry. 2nd ed. Amsterdam, The Netherlands: Elsevier Inc; 2008:251‐288.
57. Fiore G, Selig MS. Simulation of damage progression on wind turbine blades subject to particle erosion. 54th AIAA Aerospace Sciences Meeting; January4–8, 2016. San Diego (CA, US).
58. Dalili N, Edrisy A, Carriveau R. A review of surface engineering issues critical to wind turbine performance. Renew Sustain Energy Rev. 2007;13:428‐438.
59. Wood, K. Blade repair: closing the maintenance gap. Compos. World. 2011. https://www.compositesworld.com/articles/blade‐repair‐closing‐the‐main-tenance‐gap Accessed November 11, 2017.
60. ASMT International. ASTM G73–10: Standard Test Method for Liquid Impingement Erosion Using Rotating Apparatus. West Conshohocken, PA. 2017 doi:https://doi.org/10.1520/G0073‐10R17.
61. Adler WF. Rain impact retrospective and vision for the future. Wear. 1999;233–235:25‐38.
62. Rempel L. Rotor blade leading edge erosion—real life experiences. Wind Systems. 2012. http://www.windsystemsmag.com/article/detail/426/rotor‐blade‐leading‐‐edge‐erosion‐‐real‐‐life‐experiences Accessed. November 25, 2017
63. Haag MD. Secure annual energy production by a leap in leading edge protection of wind turbine blades. Sandia Blade Workshop. 2014. https://www.slideshare.net/sandiaecis/haag‐38936510 Accessed September 15, 2017.
64. Dvorak P, Chandrabaian S. Effective ways to prevent wind blade erosion. Windpower Eng Dev. 2017. https://www.slideshare.net/WindpowerEngineering/effective‐ways‐to‐prevent‐wind‐blade‐erosion Accessed. October 22, 2017
65. Quiévy N. Experience from the field—main aspects for improved blade lifetime. 6th International Conference Advances in Rotor Blades for wind Turbines;April 5–7, 2017. Bremen (Germany).
66. Jacobsen TK, Haag MD. Towards a design standard for leading edge protection. Conference Wind Turbine Blade Manufacture; November 30–December2, 2015. Düsseldorf (Germany).
67. Dunkerley D. Rain event properties in nature and in rainfall simulation experiments: a comparative review with recommendations for increasinglysystematic study and reporting. Hydrol Process. 2008;22:4415‐4435.
68. Abudi I, Carmi G, Berliner P. Rainfall simulator for field runoff studies. J Hydrol. 2012;454–455:76‐81.
69. Kathiravelu G, Lucke T, Nichols P. Rain drop measurement techniques: a review. Watermark. 2016;8(1):29.
70. Best AC. The size distribution of raindrops. Q J Roy Meteorol Soc. 1950;76:16‐36.
71. Villermaux E, Bossa B. Single‐drop fragmentation determines size of distribution of raindrops. Nat Phys. 2009;5:697‐702.
72. Woods RD. Screening of surface waves in soils. J Soil Mech Found Div. 1968;94:951‐980.
73. Busch H, Hoff G, Langbein G, et al. Rain erosion properties of materials. Philos Trans R Soc London, Ser A. 1966;1110:168‐181.
74. Heymann FJ. High‐speed impact between a liquid drop and a solid surface. J Appl Phys. 1969;40:5113‐5122.
75. Coad E, Field JE. The liquid impact resistance of CVD diamond and other infrared materials. Proc SPIE Int Soc Opt Eng. 1997;3060:169‐180.
76. Fu X, Hong‐Nan Li HN, Yang YB. Calculation of rain load based on single raindrop impinging experiment and applications. J Wind Eng Ind Aerodyn.2015;147:85‐94.
77. Slot HM, Gelinck ERM, Rentrop C, van der Heide E. Leading edge erosion of coated wind turbine blades: review of coating life models. Renew Energy2015;80:827–848.
78. Miner MA. Cumulative damage in fatigue. J Appl Mech. 1945;12:A159‐A164.
79. Dear JP, Field JE. High‐speed photography of surface geometry effects in liquid/solid impact. J Appl Phys. 1988;63:1015‐1021.
80. Adler WF. Waterdrop impact modelling. Wear. 1995;186–187:341‐351.
81. Keegan MH, Nash D, Stack M. Modelling rain drop impact of offshore wind turbine blades. ASME TURBO EXPO; June, 2012. Copenhagen (Denmark).
82. Amirzadeh B, Louhghalam A, Raessi M, Tootkaboni M. A computational framework for the analysis of rain‐induced erosion in wind turbine blades, partI: Stochastic rain texture model and drop impact simulations. J Wind Eng Ind Aerodyn. 2017;163:33‐43.
83. Ahmad M, Casey M, Sürken M. Experimental assessment of droplet impact erosion resistance of steam turbine blade materials. Wear.2009;9–10:1605‐1618.
84. Kirols HS, Mahdipoor MS, Kevorkov D, Uihlein A, Medraj M. Energy based approach for understanding water droplet erosion. Mater Des.2016;104:76‐86.
85. Lesser MB, Field JE. The impact of compressible liquids. Ann Rev Fluid Mech. 1983;15:97‐122.
86. Obara T, Bourne NK, Field JE. Liquid‐jet impact on liquid and solid surfaces. Wear, 1995;186–187:388‐394.

12 BARTOLOMÉ AND TEUWEN
87. Briscoe BJ, Pickles MJ, Julian KS, Adams MJ. Erosion of polymer‐particle composite coatings by liquid water jets. Wear. 1997;203–204:88‐97.
88. Ahmad M, Schatz M, Casey MV. Experimental investigation of droplet size influence on low pressure steam turbine blade erosion. Wear.2013;1–2:83‐86.
89. Tobin EF, Young TM, Raps D, Rohr O. Comparison of liquid impingement results from whirling‐arm and water‐jet rain erosion test facilities. Wear.2011;271:2625‐2631.
90. Zhang S, Dam‐Johansen K, Nørkjær S, Bernard P Jr, Kiil S. Rain erosion of wind turbine blade coatings—design and analysis of jet‐based laboratoryequipment for performance evaluation. Prog Org Coat. 2015;78:103‐115.
91. Gohardani O, Williamson DM, Hammond DW. Multiple liquid impacts on polymeric matrix composites reinforced with carbon‐nanotubes. Wear.2012;294–295:336‐346.
92. UDRI, University of Dayton Research Institute. Rain erosion test apparatus: use policies, operating procedures & specimen configurations. Report of Airforce research laboratory materials and manufacturing. 2016.
93. Sterling DE, inventor; Boing Co, assignee. Wind tunnel for erosion testing. US Patent US 9816895B2, November 14, 2017.
94. Springer GS, Yang CI, Larsen PS. Analysis of rain erosion of coated materials. J Compos Mater. 1974;8:229‐252.
95. Lee‐Sullivan P, Lu G. Erosion of impact‐notched holes in GFRP composites. Wear. 1994;176:81‐88.
96. Seleznev LI, Ryzhenkov VA, Mednikoy AF. Phenomenology of erosion wear of constructional steels and alloys by liquid particles. Therm Eng.2010;57:741‐745.
97. Mahdipoor MS, Tarasi F, Moreau C, Dolatabadi A, Medraj M. HVOF sprayed coatings of nano‐agglomerated tungsten‐carbide/cobalt powders for waterdroplet erosion application. Wear. 2015;330–331:338‐347.
98. Han W, Kim J, Kim B. Effects of contamination and erosion at the leading edge of blade tip airfoils on the annual energy production of wind turbines.Renew Energy. 2017;115:817‐823.
How to cite this article: Bartolomé L, Teuwen J. Prospective challenges in the experimentation of the rain erosion on the leading edge of
wind turbine blades. Wind Energy. 2018;1–12. https://doi.org/10.1002/we.2272
Copyright © 2022 FDOKUMEN