Surface and subsurface drainage evolution of the Corfino and Soraggio Karst areas (Tuscany, Italy)
Upload
independentCategory
view
3download
0
Assessment of surface and sub-surface waterlogged areas inirrigation command areas of Bihar state using remotesensing and GIS
V.M. Chowdary a, R. Vinu Chandran a, N. Neeti b,*, R.V. Bothale c,Y.K. Srivastava a, P. Ingle a, D. Ramakrishnan d, D. Dutta a,A. Jeyaram a, J.R. Sharma c, Ravindra Singh e
aRegional Remote Sensing Service Centre, IIT Campus, Kharagpur, IndiabDepartment of Geography, Clark University, Worcester, MA, USAcRegional Remote Sensing Service Centre, CAZRI Campus, Jodhpur, IndiadDepartment of Earth Sciences, IIT, Mumbai, IndiaeCentral Water Commission, New Delhi, India
a g r i c u l t u r a l w a t e r m a n a g e m e n t 9 5 ( 2 0 0 8 ) 7 5 4 – 7 6 6
avai lable at www.sc iencedi rec t .com
journal homepage: www.e lsev ier .com/ locate /agwat
a r t i c l e i n f o
Article history:
Received 12 July 2006
Accepted 4 February 2008
Published on line 1 April 2008
Keywords:
Waterlogging
Remote sensing
GIS
Irrigation command areas
Indo-Gangetic Plain
a b s t r a c t
Satellite remote sensing coupled with Geographical Information Systems (GIS) offers an
excellent alternative to conventional mapping techniques in monitoring and mapping of
surface and sub-surface waterlogged areas. In the present study, pre-monsoon and post-
monsoon surfacewaterlogged areas weredelineatedinall the 132 irrigation commandareasof
the Bihar State, India using Indian Remote Sensing (IRS-1D) Linear Imaging Self Scanning
Sensor (LISS-III) data acquired during the period 2002–2003. Normalized Difference Water
Index (NDWI) was used primarily to delineate surface waterlogged areas. Perennial water-
logged and seasonal waterlogged areas were identified for the study area by integrating the
waterlogged areas derived for both the pre- and post-monsoon seasons under GIS environ-
ment. Results show that the total surface waterlogged area in Bihar is 628 � 103 ha, which is
10.57% of command area (5939 � 103 ha) and spread over 132 command areas. Perennial
surface inundation covers 2.95% of the waterlogged area in all the command areas. Maximum
waterlogged area is observed in Gandak command (212 � 103 ha) followed by Eastern Kosi
irrigation scheme (116 � 103 ha) and Sone modernization scheme (82� 103 ha), respectively.
Further, waterlogged areas induced by rise in groundwater level were also assessed spatially
under GIS environment using the ground water level data pertaining to pre- and post-
monsoon seasons of the year 2002–2003 which were spread all over the study area. The
analysis of pre- and post-monsoon groundwater levels indicates that the area under non-
critical category during pre-monsoon period was reduced from 4287 � 103 ha (72.72% of
command) to 1391 � 103 ha (23.42%) in the post-monsoon. Area under most critical category
during post-monsoon period increased from 0.083 � 103 ha of command area in pre-monsoon3 he study demonstrates utility of integration of remote sensing and GIS
ment of waterlogged areas particularly in regions where waterlogging
techniques for assessperiod to 50 � 10 ha. T
conditions occur both due to excessive irrigation and accumulation of rain and floodwaters.
# 2008 Elsevier B.V. All rights reserved.
* Corresponding author.E-mail address: [email protected] (N. Neeti).
0378-3774/$ – see front matter # 2008 Elsevier B.V. All rights reserved.doi:10.1016/j.agwat.2008.02.009

a g r i c u l t u r a l w a t e r m a n a g e m e n t 9 5 ( 2 0 0 8 ) 7 5 4 – 7 6 6 755
1. Introduction
The introduction of canal irrigation in India has resulted in
almost 7 � 106 ha of cultivated land becoming affected by soil
salinity and waterlogging (Joshi and Tyagi, 1994). In India, the
National Commission for Irrigation (1972), National Commis-
sion on Agriculture (1976), and the Ministry of water resources
(1991) have estimated the extent of waterlogged area as 4.84,
6.00 and 2.46 � 106 ha, respectively. Bhattacharya, 1992
reported that the total area suffering from waterlogging in
India is estimated to be about 3.3 � 106 ha and the state of
Bihar alone constitutes an area of nearly 0.9 � 106 ha. In Bihar,
waterlogging problem is stated to be serious in the Gandak and
Kosi command areas lying in the lower reaches of the Gandak
basin (Second Bihar State Irrigation Commission, 1994).
Particularly, large parts of the Indo-Gangetic Plain (IGP) in
India and Pakistan and to some extent in Bangladesh were
already affected by soil salinity and waterlogging (Joshi et al.,
2002). Hoffman and Durnford (1999) reported how soil salinity
and waterlogging problems have developed worldwide, and
the speed with which they are advancing at present. Plants
that are waterlogged are very susceptible to salinity, especially
in their early growth stages (Barrett-Lennard, 2002). The
development of extensive areas of secondary salinisation and
waterlogging has been a feature of agricultural parts of south-
west western Australia for over 100 years (Bennett and
Macpherson, 1983; McFarlane and Williamson, 2002). Thus,
waterlogging and salinity problems pose a serious threat to the
world’s productive agricultural land.
Disturbance of the natural balance by introducing irriga-
tion causes a rising water table, where natural drainage sinks
cannot cope with the increase in ground water recharge
(Gowing and Wyseure, 1992). Recharge to deep aquifers is
closely linked to the incidence of waterlogging (Moore and
McFarlane, 1998) and to the development of land salinisation.
The major artificial causes of waterlogging in the command
areas are seepage from water conveyance systems (Brahmab-
hatt et al., 2000), breakages of regulatory structure, silting and
weed growth in canals (Dutta et al., 2004). Lack of surface and
sub-surface drainage, poor maintenance of drainage system,
over irrigation and growing water intensive crops are some of
major causes of poor realization of benefits from the irrigation
systems (Choubey, 1997). Wildman (1982) indicated that due to
the accumulation of organic matter, soil color is generally
darker in poorly drained areas than well drained soils. Thus, a
proper assessment of these waterlogged areas is a prerequisite
for finding a solution to the problem.
In general, for mapping of waterlogged areas, conventional
technique such as ground survey is used. For regional studies,
these techniques are neither cost effective nor time effective.
Satellite remote sensing coupled with Geographical Informa-
tion Systems (GIS) offer an excellent alternative to conven-
tional techniques in monitoring and assessing the extent of
waterlogged areas in real time. The integration of remotely
sensed data and the use of GIS can serve as a useful guide for
the selection of training areas for classification, and to update
a database for the assessment of spatially and temporally
dynamic phenomena. In the past, several studies have
demonstrated the usefulness of remote sensing and GIS
techniques in detecting and monitoring waterlogged and
saline/alkaline soils (Bouwer et al., 1990; Choubey, 1996;
Lohani et al., 1999; Dwivedi et al., 2001; Dwivedi and Sreenivas,
2002; Chatterjee et al., 2003). Passive optical remote sensing is
a valuable tool in providing synoptic information on a number
of water parameters as surface water absorbs a major part of
the electromagnetic radiation in the visible range and almost
all of it in near infrared range (Claassen, 1990; Van Stokkom
et al., 1993). In visual interpretation of satellite data, high soil
moisture and surface waterlogged areas are identified as deep
dark grey to light black in color (Brahmabhatt et al., 2000;
Mandal and Sharma, 2001).
There is growing concern about the decline in soil
fertility, changes in water table depth, deterioration in the
quality of irrigation water and rising salinity in the Bihar
state. During monsoon period, nearly 74% of the total
geographical area of the state is affected by the flood
hazards (NBSS and LUP, 1997). The waterlogging and
drainage problem over vast agricultural lands of this eastern
region of India is of a magnitude that requires immediate
attention. Hence, in the present study, a systematic attempt
has been made for rapid, reliable assessment and delinea-
tion of the surface and sub-surface waterlogged areas in all
the irrigation command areas of Bihar state using remote
sensing and GIS techniques for both monsoon (kharif) and
non-monsoon (rabi) seasons.
2. Study area description
The study area, i.e. Bihar state is a part of Eastern Gangetic
Plain which is now considered as the bread basket for much of
South Asia (Aggarwal et al., 2004). Geographically, study area is
situated in the eastern part of India and is a land-locked state
with Nepal in the north, West Bengal in the east, Uttar Pradesh
in the west and Jharkhand in the south. It is situated between
218300–278310N latitude and 828190–888170E longitude covering
an area of about 94,800 km2 (Fig. 1). The overall climate of the
study area can be classified as tropical to sub-humid tropical.
The average annual rainfall in the study area is around
1200 mm and 85% of the rainfall occurs during 4 months
spanning from June to October. Often, rainfall exceeds
1800 mm in the northern and north-western fringes of the
study area. The mean relative humidity varies from a
minimum of 40% in April to a maximum of 85% in the month
of July. The mean minimum temperature is generally of the
order of 10.6 8C though some places record much lower
temperature. The highest temperature is often registered in
May, which is the hottest month in the state and the mean
maximum temperature is around 41 8C.
The major cropping pattern in the study area is cereal
based and rice, maize and wheat are the dominant crops.
Besides this, some cash crops such as sugarcane and tobacco
are also grown in the area. Under irrigated situations, rice–
wheat or rice–rice constitutes the most important crop
rotation practice. The major land use/cover statistics of the
study area are presented in Table 1. The study area is endowed
with rich water resources from monsoon and snow fed rivers
and canals. In general, irrigation is provided through extensive
canal networks which are fed through diversion of river flows.
To supplement the uncertainties in surface water supplies

Fig. 1 – Location map of study area.
a g r i c u l t u r a l w a t e r m a n a g e m e n t 9 5 ( 2 0 0 8 ) 7 5 4 – 7 6 6756
farmers use groundwater to meet irrigation requirements
during the rabi season.
Hydro-geologically, the various litho-units of the study area
can be grouped as unconsolidated/alluvial formation; semi-
consolidated formations and consolidated/fissured forma-
tions. The main alluvial tract covers entire north Bihar and a
sizeable area south of the Ganga river. These alluvial
formations constitute prolific aquifers where the tube well
can yield between 120 and 247 m3/h. The potentiality of these
aquifers decreases due south in the marginal tract. Auto flow
conditions occur in the sub-Tarai region of Madhubani,
Sitamarhi and west Champaran districts. In these areas, bore
wells located near lineaments/fractures can yield between 10
and 50 m3/h. The annual groundwater draft of Bihar state is
around 10.77 � 109 m3/year (http://cgwb.gov.in/gw_profiles/
st_Bihar.htm). The over utilization of groundwater and the
vast canal network has led to waterlogging and soil salinity in
many parts of the study area. The major soil types in the study
area are; (i) soils of piedmont plains, (ii) soils of active alluvial
plains, (iii) soils of recent alluvial plains, (iv) soils of old alluvial
plain, (v) soils of alluvial cone (NBSS and LUP, 1997). The
alluvium plain was formed by the deposition of alluvium
brought from the southern hills by the rivers viz., Sone,
Punpun, Paimar, Phalgu and Chandan. More than 90% area of

Table 1 – Major land use/land cover statistics of the studyarea
S. no. Category Area (ha) Area (%)
1 Forest land 676400 7.18
2 Land under misc.
tree, groves
211709 2.25
3 (a) Current fallow 256783 2.73
(b) Other fallow 687570 7.30
(c) Cultivable waste 179319 0.84
4 Net area under
cultivation
5570425 59.53
5 Barren land and
permanent pasture
503381 5.35
6 Area under non
agricultural use
1395340 14.82
Total 9480927 100
(Source: http://bihar.bih.nic.in/biharweb/WRD/land_use.html,
State irrigation department)
a g r i c u l t u r a l w a t e r m a n a g e m e n t 9 5 ( 2 0 0 8 ) 7 5 4 – 7 6 6 757
study area is characterized by level to very gently sloping soils
(0–3%) (NBSS and LUP, 1997). The detailed description of the
study area about soils and geology of the study area is
presented in NBSS and LUP, 1997.
3. Data used
3.1. Remote sensing data
Digital data from Indian Remote Sensing (IRS-1D) Linear
Imaging Self Scanning Sensor (LISS-III) sensor for the year
2002–2003 are used for delineation of pre- and post-monsoon
surface waterlogged areas in the study area (Table 2). Each
satellite data scene has information of four spectral bands
which correspond to green (G) (0.52–0.59 m), red (R) (0.62–
0.68 m), near infrared (NIR) (0.77–0.86 m) and middle infrared
(MIR) (1.55–1.70 m). The spatial resolution for the G, R and NIR
bands is 23.5 m, while the spatial resolution of MIR band is
70.9 m. In the present study, false color composite (FCC)
constituted by three bands NIR, R and G bands corresponding
to both pre- and post-monsoon seasons were used for
delineation of surface waterlogged areas in all the irrigation
command areas of study area.
Table 2 – List of IRS-1D LISS-III satellite data used in thepresent study
S. no. Path Row Satellite data acquisitiondate
Kharif season Rabi season
1. 103 52 27.10.2002 20.04.2003
2. 103 53, 54, 55 21.11.2002 20.04.2003
3. 104 53, 54, 55 18.11.2002 17.04.2003
4. 105 53 15.11.2002 04.05.2003
5. 105 54 15.11.2002 25.01.2000
6. 106 53, 54, 55 07.12.2002 06.05.2003
7. 107 53 09.11.2002 16.01.2000
8. 107 54 09.11.2002 04.05.2002
3.2. Groundwater data
To assess the waterlogged areas induced by rise in the ground
water level near to the surface in the study area, ground water
table data pertaining to pre- and post-monsoon seasons of the
year 2002–2003 were collected for all the observation wells
monitored by State Ground Water Department (SGWD) and
Central Ground Water Board (CGWB) which are spread all over
the study area (Fig. 2).
3.3. Collateral data
Survey of India toposheets at 1:50000 scale was used for
preparation of the base maps and for remote sensing data
interpretation. Further, irrigation command area maps around
132 were collected from Water Resources Department,
Government of Bihar (Second Bihar State Irrigation Commis-
sion, 1994) and these command areas were grouped under 74
groups for generation of waterlogging statistics. The list of
command area names in the study area along with their area
statistics is given in Table 3.
4. Methodology
4.1. Image geo-referencing
Pre-monsoon season satellite data were geo-referenced with
respect to the control points taken from Survey of India map
on 1:50000 scale. Distinct control points such as sharp road
intersections, canal–road intersections were taken as ground
control points, as they appear clearly both on the map and
satellite image, respectively. Efforts were made to ensure that
the ground control points are uniformly distributed on the
image. A second order polynomial model was generated with
root mean square error less than a half pixel. Subsequently,
post-monsoon season satellite data were geo-referenced with
respect to the pre-monsoon season data. Lambert Conformal
Conic (LCC) projection with spheroid and datum as modified
Everest was considered in the present study.
4.2. Mapping of surface waterlogged areas
The digital data of IRS-1D LISS-III sensor for the year 2002–
2003 are processed and analyzed for delineation of the
surface waterlogged area using the ERDAS Imagine 8.7 digital
image processing software (ERDAS, 1997). FCC images
constituted by NIR, R and G bands were analyzed visually
for probable areas of waterlogging from image tone, texture
and association for both the seasons. In general, the
waterlogged areas exhibit sharp contrast with the adjacent
areas on the satellite data and these spectral properties of
waterlogged areas can be easily picked by visible and
infrared domain of optical sensors. The standing water
areas appear as dark blue to black depending upon the depth
of water, while the wet areas appear as dark grey to light grey
in color/tone on the imagery. Spatial and temporal varia-
bility in the ground water levels were studied by integrating
the ground water level data with satellite data observation
under GIS environment.

Table 3 – List of command area names in the study area
CNC Command name Area ( 103 ha) CNC Command name Area ( 103 ha)
1 Adhwara barrage scheme 51.19 38 Kaurinard 22.97
2 Ausane weir scheme 0.99 39 Khalkhala Irrigation scheme 2.26
3 Azan 6.68 40 Khandbihari weir scheme 1.65
4 Baghel weir 0.17 41 Kulthi weir and Sakari
irrigation scheme
21.23
5 Baghmati irrigation project 170.83 42 Lokain weir 3.13
6 Baglati pyne weir 0.66 43 Lower Kiul weir 36.99
7 Bagmati barrage scheme 79.25 44 Lower Lilajan and Golari weir 5.72
8 Bajan weir 3.52 45 Lower Morhar irrigation schemee 36.22
9 Balan weir scheme 3.09 46 Mahabodhi weir 1.24
10 Barnar reservoir 18.62 47 Mahadeopur pump canal 13.00
11 Belharna, Badua, Mohane
link and Bagra
60.8 48 Mahmuda weir scheme and Gebua 1.76
12 Bersoi and Phulhar lift
irrigation scheme
35.56 49 Mahmuda weir-I 4.86
13 Bhena weir 1.19 50 Mahugain weir and Kadhar weir 2.31
14 Bhutanda reservoir scheme 0.46 51 Manindra weir 0.93
15 Bilasi reservoir scheme 13.38 52 Mechi weir scheme 11.79
16 Bunduni reservoir 2.23 53 Mohane weir scheme 0.6
17 Chandan weir schemea 88.41 54 Morhar barrage 68.74
18 Dakra pump canal I&II 13.34 55 Morwe weir, Baskund, Jalkund 3.9
19 Dakra reservoir scheme 3.98 56 Nagi reservoir 1.9
20 Dhanarji reservoir 5.82 57 Nakati reservoir 1.08
21 Durgawati weirb 990.53 58 Natane weir 0.9
22 Eastern Kosi irrigation schemec 950.94 59 Nischalganj, Sansi, Paimer weir 31.98
23 Firangi bigha weir 1.78 60 Orni reservoir scheme 3.5
24 Gandak, Tribeni, Dhaka canals 1631.83 61 Panchane phase-I 9.54
25 Ganga pump canal and
Bateshwaran pump scheme
290.08 62 Panchane weir phase-II 3.72
26 Ghora katora reservoir 8.69 63 Paura weir 5.57
27 Gogha weir scheme 10.73 64 Phulwaria reservoir 16.45
28 Gokhula weir 7.76 65 Punasi reservoir scheme 5.9
29 Gothwa Weir 11.03 66 Punpun barragef 322
30 Gulsakari weir 1.17 67 Sindhwarni reservoir scheme
and Kharagpur lake
1.21
31 Job, Purain and
Kolmahadeo reservoir
5.12 68 Sirkhindig 1.34
32 Kailash weir and Tarkol weir 1.18 69 Sirnawa weir 3.22
33 Kamla irrigation scheme 121.35 70 Tati weir 2.57
34 Kankai and Mahananda 389.73 71 Tilaiya dhadhar diversion
scheme, Sohjana
67.4
35 Kao reservoir scheme 0.83 72 Trisula weir scheme 2.95
36 Kapasi weir 2.97 73 Udrasthan, Bharthuanandan weir 8.71
37 Kararua weir 1.92 74 Western Kosi Irrigation scheme 222.21
a Chandan weir scheme, Sukhnia weir scheme, Dakri weir, Tribeni weir, Chausa pump, Harna weir, Sonahula weir, Sundar weir and
Kamarganj pump canal.b Durgawati weir, Durgawati reservoir, Khoria reservoir, Zamania pump scheme (Larma), Surara weir, Sone canal modernization scheme,
Sone high level canal, Kumber weir, Sone low level canal.c Eastern Kosi irrigation scheme and Rajpur canals.d Kaurinar, Nata and Chourdargha weir.e Lower Morhar irrigation scheme, Lilajan weir, Chariari, Upper Jamuna, Kanak Bigha.f Punpun barrage, Upper Morhar, Batane, Adri, Tekari, Mansare, Hilua, Madar, Dhawa, Sinane, Chotki, Chor Danda.g Sirkhindi, Amrit, Kundgat reservoir scheme, CNC = Command area Name Code.
a g r i c u l t u r a l w a t e r m a n a g e m e n t 9 5 ( 2 0 0 8 ) 7 5 4 – 7 6 6758
For delineation of water spread area, various digital image
processing techniques such as thresholding, modeling tech-
niques and classification techniques were used in the past
(Nagarajan et al., 1993; Sharma et al., 1996; Manju et al., 2005).
Goel et al., 2002 used multiband modeling criteria for
identification of water spread areas, in order to avoid
confusion between land and water boundary. Though,
conventional maximum likelihood classification technique
can be used for surface water mapping, but is not always
appropriate as the identification of water pixels at the water/
soil interface is difficult and depends on the interpretative
ability of the analyst. Further, misclassification of shallow
water as soil and saturated soil as water may induce
classification errors in maximum likelihood classification
technique. Often, the land/water demarcation is confusing
in a single NIR band, and hence, two band data such as G and
NIR bands can be used in such situations. Thus, ratioing of the
two band data takes advantage of the difference in the

Fig. 2 – Location of observation wells in the study area.
a g r i c u l t u r a l w a t e r m a n a g e m e n t 9 5 ( 2 0 0 8 ) 7 5 4 – 7 6 6 759
reflectances of different wavelengths in enhancing a parti-
cular feature from the satellite data. Hence, in the present
study, the Normalized Difference Water Index (NDWI) devel-
oped by McFeeters (1996) was used for delineation of water-
logged areas and to enhance their presence in remotely sensed
digital imagery while simultaneously eliminating soil and
terrestrial vegetation features. This index is calculated as
follows:
NDWI ¼ RG � RNIR
RG þ RNIR
� �(1)
where, RG is spectral reflectance in G band and RNIR is spectral
reflectance in NIR band. The range of NDWI is from zero to
one. The selection of these wavelengths was done to: (1)
maximize the typical reflectance of water features by using
G band; (2) minimize the low reflectance of NIR by water
features and (3) take advantage of the high reflectance of
NIR by terrestrial vegetation and soil features (McFeeters,
1996). Thus, positive and negative NDWI values indicate
water features and vegetation features on the satellite data
respectively due to higher reflectance of NIR band than G band
(McFeeters, 1996). Subsequently, the resulting ratioed images
were density sliced for delineation of waterlogged areas.
Density slicing is a technique where the entire grey values
of pixels occurring in the image are divided into a series of
analyst specified intervals for segregating the image into
waterlogged and saturated areas. For segregating the image,
threshold NDWI value was fixed for each satellite image
based on the visual interpretation of raw data. The threshold
NDWI value is likely to change with different overpass dates,
and needs to be fixed for each data independently. In the
present study, it was found that the threshold limit of NDWI
values varied 0.28–0.34. Chatterjee et al., 2005 found that the
NDWI for water is either equal to or greater than 0.32. Further,
on screen editing was done when water surface is covered
with aquatic vegetation.
4.3. Delineation of sub-surface waterlogged areas
The collected ground water data pertaining to the year 2002–
2003 was checked for anomaly/inconsistency (e.g. depth-
post > depthpre, abrupt changes in the depth, location, absence
of location, etc.). Subsequently, sub-sets of the original data,
which are consistent in all respects were used for generating
point coverage in GIS and projected to desired projection. Point
attributes such as pre-monsoon water table depth and post-
monsoon water table depths were added to all the points. The
water table depth values for both the pre- and post-monsoon
seasons were extrapolated spatially using the point locations
in Arc/info 7.4.1 GIS (using TOPOGRID function) to generate
Digital Water Depth Grid (DWDG) at a grid/cell size of
100 m � 100 m. The TOPOGRID command is an interpolation
method specifically designed for the creation of digital
elevation models (DEMs) and is based upon the ANUDEM
program developed by Hutchinson (1989). This method uses
an iterative finite difference interpolation technique and is
optimized to have the computational efficiency of local
interpolation methods such as inverse distance weighted
interpolation, without losing the surface continuity of global
interpolation methods such as kriging and splines. The DWDG
is seamless ground water table representation and was
reclassified into four classes viz. most critical (GWT < 1 m),
critical (1 < GWT < 2), less critical (2 < GWT < 3) and not
critical (GWT > 3) (Dutta et al., 2004).
5. Results
The pre-monsoon and post-monsoon surface waterlogged
areas in the study area for the year 2002–2003 are delineated
for all the major and medium irrigation command areas of
entire Bihar state and the integrated map is shown in Fig. 3. In
the present study, four categories of waterlogging viz. surface
inundation (seasonal), perennial waterlogging, saturated
profile (seasonal), saturated profile (perennial) have been
demarcated in the state. Surface inundation (seasonal) is the
waterlogged area where land is not available for cultivation in
rabi season, but by summer surface water is drained. Perennial
waterlogged areas are those where land remains waterlogged
throughout the year. Seasonal saturated profile is the land,
which might be inundated in kharif, but water is drained
during rabi leaving the soil moist. Perennial saturated profile is
the land, which remains saturated all throughout the year but
is used for agriculture with some constraints.
Spatially distributed surface waterlogged areas for both
pre- and post-monsoon seasons are delineated using remote
sensing data and overlaid with irrigation command area
boundaries (Fig. 3). Further, command area wise surface
waterlogged areas and saturated areas in the study area are
estimated in GIS environment and are presented as Fig. 4a and
b. From the Fig. 4a and b, it is observed that 20 command areas/
command groups have waterlogged area less than 1% of
command area, 16 have between 1 and 5%, 13 have between 5
and 10%, 14 have between 10 and 20% and 11 command areas/
command groups have waterlogged area more than 20% of
their respective command area. If we consider different stages
of waterlogging, then 90.2% of the waterlogged area is under
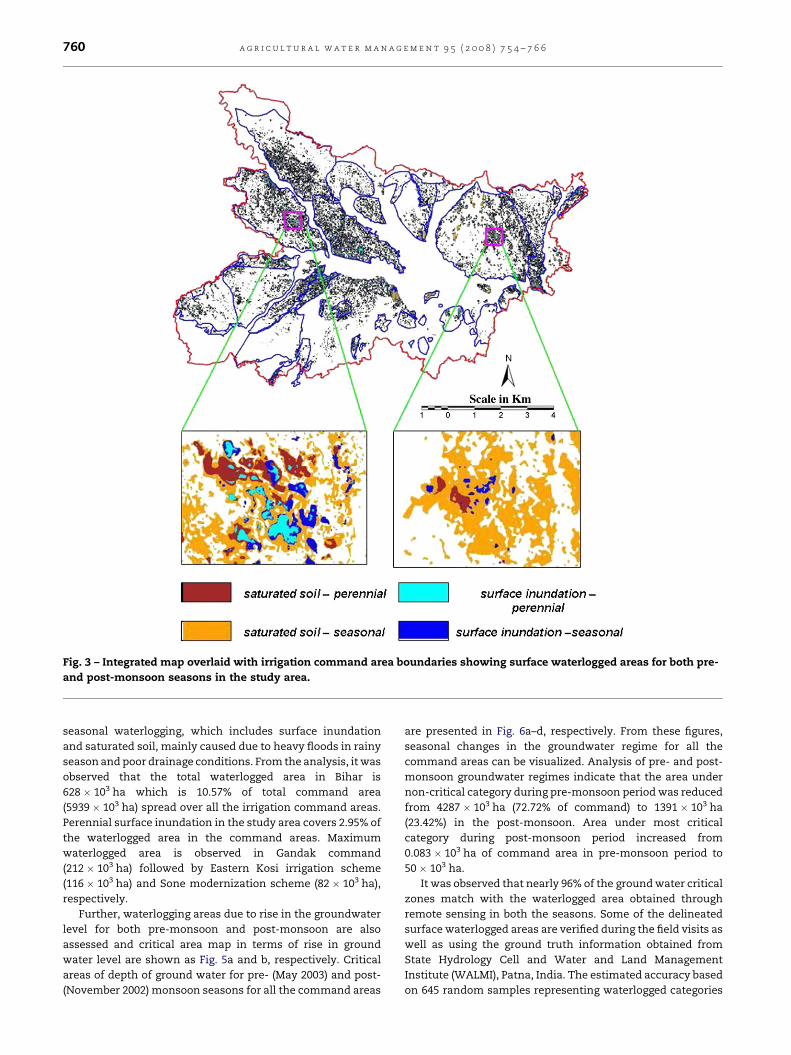
Fig. 3 – Integrated map overlaid with irrigation command area boundaries showing surface waterlogged areas for both pre-
and post-monsoon seasons in the study area.
a g r i c u l t u r a l w a t e r m a n a g e m e n t 9 5 ( 2 0 0 8 ) 7 5 4 – 7 6 6760
seasonal waterlogging, which includes surface inundation
and saturated soil, mainly caused due to heavy floods in rainy
season and poor drainage conditions. From the analysis, it was
observed that the total waterlogged area in Bihar is
628 � 103 ha which is 10.57% of total command area
(5939 � 103 ha) spread over all the irrigation command areas.
Perennial surface inundation in the study area covers 2.95% of
the waterlogged area in the command areas. Maximum
waterlogged area is observed in Gandak command
(212 � 103 ha) followed by Eastern Kosi irrigation scheme
(116 � 103 ha) and Sone modernization scheme (82 � 103 ha),
respectively.
Further, waterlogging areas due to rise in the groundwater
level for both pre-monsoon and post-monsoon are also
assessed and critical area map in terms of rise in ground
water level are shown as Fig. 5a and b, respectively. Critical
areas of depth of ground water for pre- (May 2003) and post-
(November 2002) monsoon seasons for all the command areas
are presented in Fig. 6a–d, respectively. From these figures,
seasonal changes in the groundwater regime for all the
command areas can be visualized. Analysis of pre- and post-
monsoon groundwater regimes indicate that the area under
non-critical category during pre-monsoon period was reduced
from 4287 � 103 ha (72.72% of command) to 1391 � 103 ha
(23.42%) in the post-monsoon. Area under most critical
category during post-monsoon period increased from
0.083 � 103 ha of command area in pre-monsoon period to
50 � 103 ha.
It was observed that nearly 96% of the ground water critical
zones match with the waterlogged area obtained through
remote sensing in both the seasons. Some of the delineated
surface waterlogged areas are verified during the field visits as
well as using the ground truth information obtained from
State Hydrology Cell and Water and Land Management
Institute (WALMI), Patna, India. The estimated accuracy based
on 645 random samples representing waterlogged categories
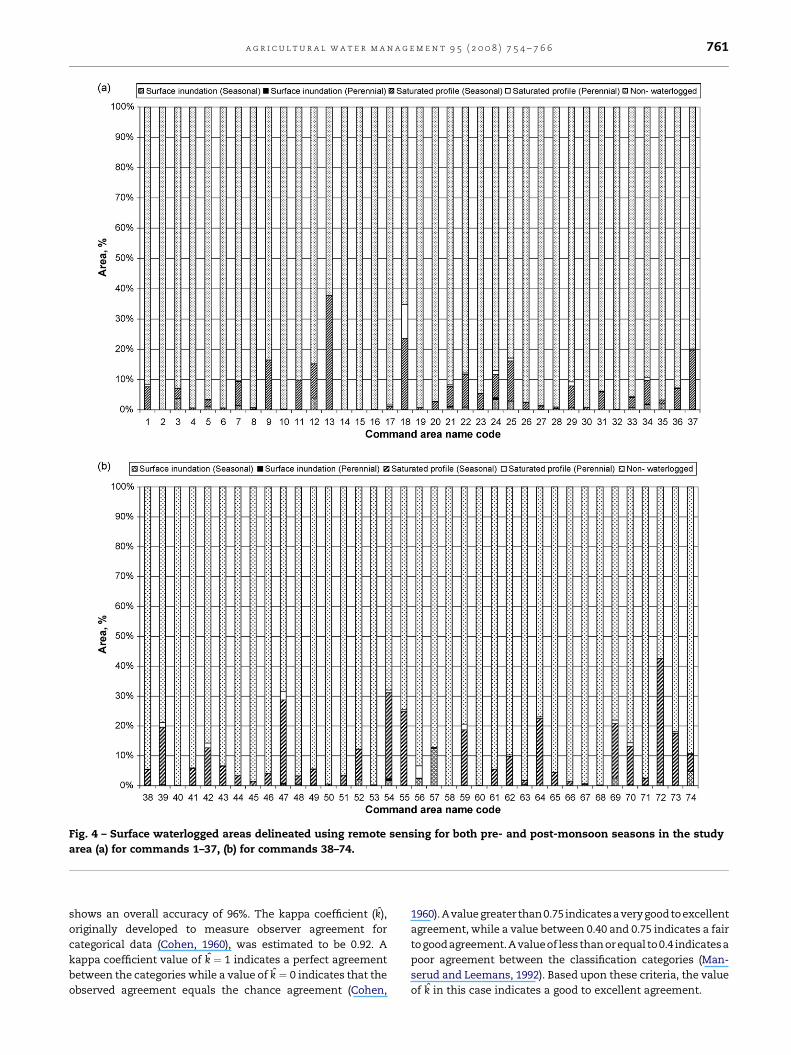
Fig. 4 – Surface waterlogged areas delineated using remote sensing for both pre- and post-monsoon seasons in the study
area (a) for commands 1–37, (b) for commands 38–74.
a g r i c u l t u r a l w a t e r m a n a g e m e n t 9 5 ( 2 0 0 8 ) 7 5 4 – 7 6 6 761
shows an overall accuracy of 96%. The kappa coefficient (k̂),
originally developed to measure observer agreement for
categorical data (Cohen, 1960), was estimated to be 0.92. A
kappa coefficient value of k̂ ¼ 1 indicates a perfect agreement
between the categories while a value of k̂ ¼ 0 indicates that the
observed agreement equals the chance agreement (Cohen,
1960).Avalue greater than0.75 indicatesa verygoodtoexcellent
agreement, while a value between 0.40 and 0.75 indicates a fair
togoodagreement.A valueof lessthan orequal to0.4 indicatesa
poor agreement between the classification categories (Man-
serud and Leemans, 1992). Based upon these criteria, the value
of k̂ in this case indicates a good to excellent agreement.

Fig. 5 – Critical areas for pre- and post-monsoon (in terms
of depth of ground water) overlaid with irrigation
command area boundaries: (a) pre-monsoon (May 2003),
(b) post-monsoon (November 2002).
a g r i c u l t u r a l w a t e r m a n a g e m e n t 9 5 ( 2 0 0 8 ) 7 5 4 – 7 6 6762
6. Discussion
The waterlogging problem is serious in the Gandak command
lying in the lower reaches of the Gandak basin. The major
causes of waterlogging in the Gandak command include
superfluous irrigation supplies, seepage losses from canal,
impeded sub-surface drainage and lack of proper land
development (Chatterjee et al., 2005). Further, soils of recent
alluvial plains which cover major portion of the Gandak
command area are also responsible to waterlogging. These
soils are very deep, imperfectly to poorly drained and fine
loamy to fine in texture. However, some portion of the
command area mainly located in west Champaran district
(upper reaches) is covered by soils of piedment plains and is
generally very deep, moderately well to well drained, fine
loamy to coarse loamy in texture. In case of Kosi command
area, dominant soils occurring in this landscape are very deep,
imperfectly to moderately well drained, loamy to sandy in
texture and are subjected to moderate to sever flooding. Old
alluvial plains are mainly located in the Sone command area
and these soils are very deep, imperfectly to poorly drained,
fine loamy to fine in texture. Overall, waterlogging problems in
most of irrigation command areas can also be attributed to the
seepage losses from the extensive unlined or poorly canal
network present in the study area. Further, the designed
capacity of canals has been reduced considerably due to silt
deposition in the canal. Although, soils are permeable in
general but many places internal drainage is blocked causing
rise in ground water table. Further, the accumulation of rain
and floodwaters in depressions have aggravated the situation
(Chatterjee et al., 2005). Some known as ‘Chaurs’, i.e. bottom
lands created by seismic disturbance in the earthquake of
1934; others known as ‘Mauns’ were created due to shifting of
river courses and consequent deposition of heavy sediment
loads. During high floods these depressions having no
drainage outlet to river form a sprawling sheet of water
rendering kharif cultivation impossible. Formation of mean-
ders, ox-bow lakes, abandoned channels and sand bars in the
Ganges and its tributaries also cause waterlogging and
saturation of soil.
In most of the command areas, river bank itself lies high,
and the tributaries are flooded and pushed back at the high
water level. Specifically, the Punpun valley, parallel to the
stream Sone on the east, is thus annually flooded. The
construction of railways across the drainage both in the north
and south of Ganges, causes local but sometimes disastrous
waterlogging and flooding. Specifically, seasonal surface
inundation in the command areas located in the Baghmati
river basin can be attributed to the differential drainage
pattern on both sides of the Baghmati river, i.e. floodwater
drained faster in the left bank than that of right bank. The
flood prone right bank of the Baghmati river is a topographic
low sandwiched between Kosi and Burhi Gandak and flows at
higher elevation than the right bank area (Chandran et al.,
2006). Further, the embankment constructed along the course
(Baghmati and Burhi Gandak) is found to impede the recession
of floodwater. Overall, the discharge from the tributaries is
heavily silt-loaded during floods which when deposited in
favourable environment, creates more problems of floods and
the river channel oscillates between the two banks damaging
the existing protective measures. It is reported that the Kosi
river has progressively shifted westwards by a distance of
112 km in 225 years. However, after the construction of Kosi
Barrage and the flood embankments, the flood problem has
been minimized and westward swing has been checked. Thus,
low topography, low carrying capacity and avulsive behavior
of the river system are attributed herein to frequent and
prolonged flooding in some of the irrigation commands.
Poor performance in the command areas can be attributed
to the failure of public sector management, a significant factor
being the inability to provide adequately for the cost of
operation and maintenance. The problem is even more severe
in public drainage schemes, as drainage does not generate
more income, but simply aims to protect existing income, so
farmers are reluctant to pay much to support such schemes
(Gowing and Wyseure, 1992; Konukcu et al., 2006). Other major
problems that play important role in waterlogging include (i)
availability of main/public drains, (ii) high cost involved in
connecting individual farm drainage systems to the public
drain, (iii) resistance by neighbouring land owners to drainage
effluent passing across their fields, (iv) environmental con-
cerns, (v) salt loading of rivers and (vi) availability of drainage
sinks in closed basins (Konukcu et al., 2006). Thus, the
execution of irrigation projects with provision of adequate

Fig. 6 – Status of groundwater levels in the study area during pre- and post-monsoon seasons (a) for commands 1–18, (b) for
commands 19–37, (c) for commands 38–56, (d) for commands 57–74.
a g r i c u l t u r a l w a t e r m a n a g e m e n t 9 5 ( 2 0 0 8 ) 7 5 4 – 7 6 6 763
drainage system will certainly bring the equilibrium between
the groundwater recharge and discharge resulting in the
control of groundwater table in the command areas of Bihar
state.
In recent years, there have been attempts to identify
solutions, which will work within environmental constraints
and will also be economically viable (Hanson, 1989; Gowing
and Wyseure, 1992; Sharma and Tyagi, 2004). Practical
Fig. 6. (Continued) .
a g r i c u l t u r a l w a t e r m a n a g e m e n t 9 5 ( 2 0 0 8 ) 7 5 4 – 7 6 6764
significance of dry-drainage systems which means that part of
the available land is set-aside as a sink for excess groundwater
and for salt transported with the groundwater has been
recognized for some time and it has also received some
attention in field studies in Australia and Africa (Greenwood
et al., 1992, 1994; WARDA, 1997; Konukcu et al., 2006). Though,
management practices and technologies are available in the
irrigation command areas where these problems are more
common, their adoption is constrained due to lack of
appropriate institutional arrangements. Another major pro-
blem in the assessment of waterlogging areas in the command
areas is the discrepancy in the extent of waterlogging areas

a g r i c u l t u r a l w a t e r m a n a g e m e n t 9 5 ( 2 0 0 8 ) 7 5 4 – 7 6 6 765
reported by different agencies. The differences are due to
evaluation criteria, time of observation and methods used for
delineation of waterlogging. These surveys do not allow a clear
identification of the waterlogged areas at higher scale which
usually serve as guiding tool to the planners/decision makers
on the functioning of an irrigation system and on its
agricultural productivity. Normally, the conventional techni-
que of surface waterlogged area mapping uses ground survey
data. This technique not only is time consuming and requires
much more labour, but is not accurate as well. Satellite remote
sensing coupled with geographical systems becomes a great
promise in monitoring and mapping of surface waterlogged
areas. Advantages of the spectral measurements made by
sensors onboard satellite are synoptic coverage and repetivity
which allows the comparison and assessment of changes in
dynamic phenomena like surface waterlogging before, and
after monsoons.
7. Conclusion
Reliable assessment of waterlogged areas forms a crucial
element in the irrigation command area development pro-
gram. In the present study space borne multispectral satellite
data was successfully employed for assessment of spatially
and temporally distributed waterlogged areas in order to
evaluate the impact of canal irrigation. However, this analysis
can be carried out at frequent intervals to study the dynamics
of these phenomena and to evaluate the impact of irrigated
agriculture. Further, such analysis facilitates the adminis-
trators and planners in planning and implementing corrective
and preventive measures for optimal utilization of available
land and water resources for sustainable development of
irrigated lands. Hyperspectral data from the Earth Observation
System (EOS) in the optical region of the spectrum and
microwave data may further improve assessment of the
hydrological condition of irrigated lands. The study demon-
strates utility of integration of remote sensing and GIS
techniques for assessment of waterlogged areas particularly
in regions where waterlogging conditions occur both due to
excessive irrigation and accumulation of rain and floodwaters.
Acknowledgements
The study team gratefully acknowledge Dr.V.Jayaraman,
Director (EOS/NNRMS) and Mr.B.D.Pateria Chief Engineer,
Central Water Commission, New Delhi for providing necessary
support and fund for carrying out this research. The data and
other help provided by Commissioner and Secretary, Water
Resources Department, Patna, Mr. Tapas Kumar Sinha, CE
(Monitoring), Mr. D. Rajak, Engineer in Chief, Mr. B.B.P. Singh,
SE (Monitoring), Mr. Mohd Sohail, Under Secretary, CAD and
Mr. Laxman Mishra, TPA, to SE, Water Resources Department,
Patna are duly acknowledged. Without their help and support it
would not have become possible to collect the information
about different command areas in the state. The data provided
by Mr. Lala Rajak, Director, Bihar Ground Water Board, Patna.
Mr. C.M. Diwan, Deputy Director, GWD, Patna and Mr. A.K.
Aggarwal, CGWB, MER, Patna are also acknowledged.
r e f e r e n c e s
Aggarwal, P.K., Joshi, P.K., Ingram, J.S.I., Gupta, R.K., 2004.Adapting food systems of the Indo-gangetic plains to globalenvironmental change: key information needs to improvepolicy formulation. Environ. Sci. Policy 7, 487–498.
Barrett-Lennard, E., 2002. Restoration of saline land throughrevegetation. Agric. Water Manage. 53, 13–26.
Bennett, D., Macpherson, D.K., 1983. A History of Salinity inWestern Australia—Important (and Some Unimportant)Dates, Technical Memorandum 83/1. CSIRO Division ofGroundwater Research, Wembley, Western Australia.
Bhattacharya, A.K., 1992. Status paper on waterlogged/drainageaffected areas’. In: Proc. on Drainage Congestion inNorthern Bihar, Vols. I and II, Water and Land ManagementInstitute, Patna, Bihar, India.
Bouwer, H., Dedric, A.R., Jaynes, D.B., 1990. Irrigationmanagement for ground water quality protection. IrrigationDrainage Syst. 4, 375–383.
Brahmabhatt, V.S., Dalwadi, G.B., Chhabra, S.B., Ray, S.S.,Dadhwal, V.K., 2000. Land use/land cover change mappingin Mahi canal command area, Gujarat, using multi-temporal satellite data. J. Indian Soc. Remote Sensing 28 (4),221–232.
Chandran, V.R., Ramakrishnan, D., Chowdary, V.M., Jeyaram,A., Jha, A.M., 2006. Flood mapping and analysis usingairborne sysnthetic aperture radar: a case study of July 2004flood in Baghmati river basin, Bihar. Curr. Sci. 90 (2),249–256.
Chatterjee, C., Kumar, R., Chakravorthy, B., Lohani, A.K., Kumar,S., 2005. Integrating remote sensing and GIS techniques withgroundwater flow modeling for assessment of waterloggedareas. Int. J. Water Resour. Manage. 19, 539–554.
Chatterjee, C., Kumar, R., Mani, P., 2003. Delineation of surfacewaterlogged areas in parts of Bihar using IRS-1C LISS-IIIdata. J. Indian Soc. Remote Sensing 31 (1), 57–65.
Choubey, V.K., 1996. Assessment of waterlogging in Tawacommand area by remote sensing techniques. Asian-PacificRemote Sensing. GIS J. 9 (1), 31–38.
Choubey, V.K., 1997. Detection and delineation of Waterloggingby remote sensing techniques. J. Indian Soc. RemoteSensing 25 (2), 123–135.
Claassen, T.H.L., 1990. Eutrophication observed by remotesensing; a distant point of view. In: Hooghart, J.C. (Ed.), Watermanagement and remote sensing. TNO committee onhydrological research, proceedings and information no. 42(The Hague) pp. 39–60.
Cohen, J., 1960. A coefficient of agreement of nominal scales.Educ. Psychol. Meas. 20, 37–46.
Dutta, D., Sharma, J.R., Bothale, R.V., Bothale, V., 2004.Assessment of waterlogging and salt affected soils in thecommand areas of all major and medium irrigation projectin India. Technical document. Regional Remote SensingService Centre, Jodhpur, India. 1–74.
Dwivedi, R.S., Ramana, K.V., Thammappa, S.S., Singh, A.N.,2001. The utility of IRS-1C and LISS-III and PAN-Merged datafor mapping salt-affected soils. Photogrammetric Eng.Remote Sensing 67 (10).
Dwivedi, R.S., Sreenivas, K., 2002. The vegetation andwaterlogging dynamics as derived from space bornemultispectral and multitemporal data. Int. J. RemoteSensing 23 (4), 2729–2740.
ERDAS Inc., 1997. ERDAS Imagine Tour Guides. ERDAS Inc.,Atlanta, Georgia, USA.
Goel, M.K., Jain, S.K., Agarwal, P.K., 2002. Assessment ofsediment deposition rate in Bargi reservoir using digitalimage processing. Hydrol. Sci. 47 (S), S81–S92.

a g r i c u l t u r a l w a t e r m a n a g e m e n t 9 5 ( 2 0 0 8 ) 7 5 4 – 7 6 6766
Gowing, J.W., Wyseure, G.C.L., 1992. Dry-drainage a sustainableand cost-effective solution to waterlogging andsalinisation. In: Proceedings of 5th InternationalDrainage Workshop, vol. 3, ICID-CIID, Lahore Pakistan, pp.6.26–6.34.
Greenwood, E.A.N., Biddiscombe, E.F., Rogers, A.L., Beresford,J.D., Watson, G.D., 1994. The influence of groundwaterlevels and salinity of a multi-spaced tree plantation in the500mm rainfall region of South-Western Australia. Agric.Water Manage. 25, 185–200.
Greenwood, E.A.N., Milligan, A., Biddiscombe, E.F., Rogers, A.L.,Beresford, J.D., Watson, G.D., Wright, K.D., 1992. Hydrologicand salinity changes associated with plantations in a salineagricultural catchment in South-Western Australia. Agric.Water Manage. 22, 307–323.
Hanson, B.R., 1989. A system approach to drainage reduction inthe San Joaquin Valley. Agric. Water Manage. 16, 97–108.
Hoffman, G.J., Durnford, D.S., 1999. Drainage design for salinitycontrol. In: Skaggs, R.W., van Schilfgaarde, J. (Eds.),Agricultural Drainage. Agronomy No.: 38. American Societyof Agronomy, pp. 579-614.Khouri, N., 1998. Potential of dry-drainage for controlling soil salinity. Canadian Journal ofCivil Engineering. 25, 195–205.
Hutchinson, M.F., 1989. A new procedure for gridding elevationand stream line data with automatic removal of spuriouspits. J. Hydrol. 106, 211–232.
Joshi, P.K., Gulati, A., Tiwari, L., Birthal, P.S., 2002. Diversificationof Agriculture in South Asian countries. MSSD Discussionpaper. International Food Policy Research Institute,Washington, DC, USA.
Joshi, P.K., Tyagi. N.K., 1994. Salt affected and waterlogged soilsin India: a review. In: Svendsen, M., Gulati, A. (Eds.),Strategic Change in Indian Irrigation. ICAR, New Delhi, andIFPRI, Washington, DC, USA, pp. 237–252.
Konukcu, F., Gowing, J.W., Rose, D.A., 2006. Dry drainage: asustainable solution to waterlogging and soil salinityproblems in irrigation areas? Agric. Water Manage. 83 (1–2),1–12.
Lohani, A.K., Jaiswal, R.K., Jha, R., 1999. Waterlogged areamapping of Mokama group of Tals using remote sensingand GIS. J. Inst. Eng. (India) 80, 133–137.
Mandal, A.K., Sharma, R.C., 2001. Mapping of waterlogged areasand salt affected soils in the IGNP command area. J. IndianSoc. Remote Sensing 29 (4), 229–235.
Manju, G., Chowdary, V.M., Srivastava, Y.K., Selvamani, S.,Jeyaram, A., Adiga, S., 2005. Mapping and characterizationof inland wetlands using remote sensing and GIS. J. IndianSoc. Remote Sensing 33 (1), 45–54.
Manserud, R.A., Leemans, R., 1992. Comparing global vegetationmaps with the kappa statistics. Ecol. Model. 62, 275–279.
McFarlane, D.J., Williamson, D.R., 2002. An overview ofwaterlogging and salinity in southwest Australia as relatedto the ‘Ucarro’ experimental catchment. Agric. WaterManage. 53, 5–29.
McFeeters, S.K., 1996. The use of Normalised Difference WaterIndex (NDWI) in the delineation of open water features. Int.J. Remote Sensing 17 (7), 1425–1432.
Ministry of water resources, 1991. Waterlogging, soil salinityand alkalinity. GOI, New Delhi, India.
Moore, G.A., McFarlane, D.J., 1998. Waterlogging. In: Moore, G.(Ed.), Soil Guide—A Handbook for Understanding andManaging Agricultural Soils. Agriculture Western Australia,South Perth, WA.
Nagarajan, R., Marathe, T., Collins, W.G., 1993. Identification offlood prone regions of Rapti river using temporal remotelysensed data. Int. J. Remote Sensing 14 (7), 1297–1303.
National Commission for Irrigation, 1972. Ministry of Irrigationand Power, GOI. New Delhi, India.
National Commission on Agriculture, 1976. Ministry ofAgriculture, GOI. New Delhi, India.
NBSS & LUP, 1997. Soils of Bihar for optimizing land use. NBSSpublication. 50. Soils of India series, National Bureau of SoilSurvey & Land Use Planning. ICAR, Nagpur, India.
Second Bihar State Irrigation Commission, 1994. Flood anddrainage problems of Bihar and their remedial measures(Vol. V). Second Bihar State Irrigation Commission,Government of Bihar, India.
Sharma, D.P., Tyagi, N.K., 2004. On-farm management of salinedrainage water in arid and semi-arid regions. IrrigationDrainage 53, 87–103.
Sharma, P.K., Chopra, R., Verma, V.K., Thomas, A., 1996. Floodmanagement using remote sensing technology: the Punjab(India) experience. Int. J. Remote Sensing 17 (17), 3511–3521.
Van Stokkom, H.T.C., Stockman, G.N.M., Hovenier, J.W., 1993.Quantitative use of passive optical remote sensing overcoastal and inland water bodies. Int. J. Remote Sensing 14(3), 541–563.
WARDA (West African Rice Development Association), 1997.Annual Report of West Africa Rice Development Association(available at http://www.warda.org/publications/wardar97.pdf).
Wildman, W.E., 1982. Detection and management of soil,irrigation management in Mendoza. In: Menenti, M. (Ed.),Argentina. Remote Sensing in Evaluation and Managementof irrigation. Institute Nacional De Cienciay TenicasHidricas Mendoza, Argentina, pp. 37–58.
Copyright © 2022 FDOKUMEN