Appendix - TU Chemnitz
59
C C o o g g n n i i t t i i e e a a b b i i l l i i t t y y m m e e a a s s u u re re re s s Sources and combination P P I I SA SA SA Rindermann, H. (2018). Cognitive capitalism: Human capital and the wellbeing of nations. Cambridge: Cambridge University Press. doi:10.1017/9781107279339 Internet: www.cambridge.org/core/books/cognitive-capitalism-and-the-wealth-of- nations/7C10B724756D97F00B7AF0515B800CC5 Appendix Cognitie ability measures Sources and combination Data from student assessment studies (SAS) and psychometric intelligence test studies (psychometric IQ) were used to calculate country cognitie ability esti mates. Means indicate differences between countries, standard deiations dif ferences within countries: In countries with a high aerage leel there are also persons with ery low cognitie ability, howeer comparatiely few; and in coun tries with a low aerage leel there are also persons with ery high cognitie ability, howeer also comparatiely few. The larger the standard deiations, the larger are the shares of the extremes, the larger are the low and/or high ability groups, and the less indicatie is the country mean for any indiidual. And countries with a large population size can hae ery large absolute numbers in the shares of the extremes; for instance India, in spite of a low aerage leel, has a quantitatiely numerous cognitie elite. Student assessment studies – data and within study combination PISA (Programme for International Student Assessment) measures competence (general literacy, not depending on curriculum) in reading, mathematics and science for 15yearold students. The sureys began in 2000 and hae been re peated eery three years, with increasing country participation in each wae. The sureys are organised by the OECD (Organisation for Economic Co operation and Deelopment). PISA data from 2000 to 2012 were used (2000, 2003, 2006, 2009 and 2012). The reports can be found on the OECDPISA home pages. Peculiarities: In 2003 and 2012 problemsoling was additionally measured. Because in 2012 the country sample for problemsoling was smaller than for the other competence measures (44 s. 65 countries) problemsoling was ex cluded. In PISA 2009 and 2012 for China only results for the proince of Shang hai were reported. In order to use them as indicators for whole China we applied a regional correction based on information presented at the Anatoly Karlin web
-
Upload
khangminh22 -
Category
Documents
-
view
0 -
download
0
Transcript of Appendix - TU Chemnitz

CCCooogggnnniiitttiii eee aaabbbiiillliiitttyyy mmmeeeaaasssuuurereresss
SSSooouuurrrccceeesss aaannnddd cccooommmbbbiiinnnaaatttiiiooonnn
PPPIIISASASA
Rindermann, H. (2018). Cognitive capitalism: Human capital and the wellbeing of nations. Cambridge: Cambridge University Press. doi:10.1017/9781107279339 Internet: www.cambridge.org/core/books/cognitive-capitalism-and-the-wealth-of-nations/7C10B724756D97F00B7AF0515B800CC5
Appendix
Cogniti e ability measures
Sources and combination
Data from student assessment studies (SAS) and psychometric intelligence test studies (psychometric IQ) were used to calculate country cogniti e ability esti mates. Means indicate differences between countries, standard de iations dif ferences within countries: In countries with a high a erage le el there are also persons with ery low cogniti e ability, howe er comparati ely few; and in coun tries with a low a erage le el there are also persons with ery high cogniti e ability, howe er also comparati ely few. The larger the standard de iations, the larger are the shares of the extremes, the larger are the low and/or high ability groups, and the less indicati e is the country mean for any indi idual. And countries with a large population size can ha e ery large absolute numbers in the shares of the extremes; for instance India, in spite of a low a erage le el, has a quantitati ely numerous cogniti e elite.
Student assessment studies – data and within study combination
PISA (Programme for International Student Assessment) measures competence (general literacy, not depending on curriculum) in reading, mathematics and science for 15yearold students. The sur eys began in 2000 and ha e been re peated e ery three years, with increasing country participation in each wa e. The sur eys are organised by the OECD (Organisation for Economic Co operation and De elopment). PISA data from 2000 to 2012 were used (2000, 2003, 2006, 2009 and 2012). The reports can be found on the OECDPISA home pages.
Peculiarities: In 2003 and 2012 problemsol ing was additionally measured. Because in 2012 the country sample for problemsol ing was smaller than for the other competence measures (44 s. 65 countries) problemsol ing was ex cluded. In PISA 2009 and 2012 for China only results for the pro ince of Shang hai were reported. In order to use them as indicators for whole China we applied a regional correction based on information presented at the Anatoly Karlin web
TTTIIIMMMSSSSSS
Compilation
page (Karlin, 2012a), on a erage –57 SASQ equi alent –8.55 IQ. We cannot pre clude the further possibility, that in Shanghai schools were positi ely selected (Chinese students report such rumours). Also, according to Lo eless (2013), Chinese migrants from rural regions li ing in Shanghai are excluded from regular schools in Shanghai (they attend “hukou” schools or no schools) and from participation in PISA. According to an Internet based sur ey with self se lected participants the ShanghaiChinadifference is –3 IQ (equi alent –20 SASQ; Lynn & Cheng, 2013), smaller than our –8.55 IQ correction. But self se lection processes can artificially reduce regional differences.
Similar corrections were necessary for regional sur eys in India (–10 SASQ equi alent –1.50 IQ) and Venezuela (–15 SASQ equi alent –2.25 IQ); corrections are based on information on education and the general de elopmental le el of regions (SAS data from Walker, 2011). If results were presented for Dubai and the entire Emirates, the results of the Emirates were used. If only results were gi en for Dubai the results were down corrected to take them as measures for the Emirates, –29.33 SASQ equi alent to –4.40 IQ, the correction is based on studies presenting for both territories results.
Calculation: First, PISA scales were simply a eraged within sur ey years across different scales (reading, mathematics, science, 2003: also problem sol ing) without any adaptation of scales. Second, on a common scale standard ised PISA results were a eraged across different sur ey years. The final PISA grand mean and standard de iation (SD) were orientated towards a raw grand mean and SD (N=74, M=456, SD=59, no study recei ed a stronger weight).
TIMSS (Trends in International Mathematics and Science Study) measures competence in mathematics and science for mostly fourth, eighth, and twelfth graders and, depending on school enrolment age, for third and se enth graders in some countries. TIMSS focuses on core aspects of curricula in different coun tries, with greater emphasis on the curricula of de eloped countries. The sur eys started in 1995, are repeated e ery four years with increasing country par ticipation in each wa e. The sur eys are organised by the International Associa tion for the E aluation of Educational Achie ement (IEA). Data from 1995 to 2011 were used (1995, 1999, 2003, 2007, and 2011).
Peculiarities: Parts of the TIMSS 2003 math sur ey were also applied in two Indian states (Das & Zajonc, 2010). Results standing for India were corrected based on information on education and the general de elopmental le el of par ticipating states (+7 SASQ equi alent +1.05 IQ). There is a doubtful contradictory result in TIMSS 2007 for Kazakhstan: In 4th grade TIMSS the re sult was 541 SASQ, but in PISA 2009 for 15yearold students only 398 SASQ, a difference of 143 points or 21 IQ. The TIMSS result for Kazakhstan is also ery different to the ones of comparable countries. Finally, Mullis et al. (2008, p. 34) described sample anomalies. Therefore the TIMSS 2007 Kazakhstan result was deleted. In 2011 in fi e countries tests were applied in higher grades (instead of in grade 4 in grade 6: Botswana, Honduras; instead of grade 8 in grade 9: Bot swana, Honduras, South Africa). For these countries the results were corrected based on results on annual SAS gains (schoolbased and nonschoolbased gains,
2

PPPIIIRRRLLLSSS
Appendix
annually 51.5 SASQ between grade 4 and 6, annually 34 SASQ between grade 8 and 9; case Yemen with measures in grade 4 and 6, Mullis et al., 2012a; Rindermann, 2011a).
For some countries only data for regions are presented (e.g. only for England and North Ireland but not for Wales and Scotland and not for United Kingdom, for some pro inces of Canada). Because we do not ha e e idence for stable within de iations for these countries, the results were simply a eraged. If within Belgium only Flanders participated the results were corrected to repre sent entire Belgium (–29 SASQ equi alent –4.35 IQ, based on common sur eys for Flanders and Wallonia in TIMSS 1995).
Calculation: First, scales were simply a eraged within grade and sur ey year across different scales (mathematics, science) without any adaptation of scales. Second, they were a eraged on a common scale within sur ey year across differ ent grades (4th and 8th grade). Third, on a common scale standardised TIMSS results were a eraged across different sur ey years. The final grand mean and SD were orientated towards a TIMSS raw grand mean and SD (N=80, M=464, SD=73).
PIRLS (Progress in International Reading Literacy Study) measures compe tence in reading for fourth graders and, depending on enrolment age, for third graders in some countries. The sur eys are repeated e ery fi e years (2001ff.), with more countries participating in each wa e. The sur eys are organised by the IEA (International Association for the E aluation of Educational Achie e ment). Data from 2001 to 2011 were used (2001, 2006, and 2011). The reports can be found on the IEAPIRLS and TIMSS homepages.
Peculiarities: In 2011 in four countries solely different testing procedures were used (an easier PrePIRLS test, or the usual PIRLS test was applied in stead of in grade 4 in grade 6). For these four countries (South Africa, Botswana, Honduras, Kuwait) the results were transformed based on results on countries ha ing both, in PrePIRLS and PIRLS, or in 4th and 6th grade, results and on general information on age and grade increases (Rindermann, 2011a): PrePIRLS to PIRLS, −135 SASQ; 6 to 4, −106 SASQ.
Calculation: Because there is only one scale and grade no within sur ey year a eraging was necessary. On a common scale standardised PIRLS results were a eraged across different sur ey years. The final grand mean and standard de iation were orientated towards a PIRLS raw grand mean and SD (N=58, M=490, SD=72).
Student assessment studies – combinations and older studies
The results of the two gradeorientated IEA studies PIRLS and TIMSS were a eraged on a common scale (N=84, M=468, SD=75). Then IEA and OECD studies (PIRLSTIMSS and PISA) were a eraged on a common scale (N=98, M=451, SD=70).
PISA, PIRLS and TIMSS are higher quality student assessment studies re garding sample size, sample representati ity (for students), comparability of age and grade across countries and reliability of tests, sample selection, testing pro
3

LLLLLLEEECCCEEE
Compilation
cedure, international calibration of a common standard and calculation of coun try estimates for students (youth being in school). To add data for de eloping countries we used also older and regional studies. Their results were only con sidered if there were no data from PISA, PIRLS and TIMSS:
There are two older IEA studies from the 1990s: IEAReading Literacy Study 19901991 (Elley, 1992) and IAEPII 1991 (International Assessment of Educa tional Progress, mathematics and science; Lapointe, Askew & Mead, 1992, Lapointe, Mead & Askew, 1992). Both studies of 9yearold and 14yearold stu dents were combined according to the usual procedures (standardisation using common countries, adaptation to the international SASQ scale). Only one coun try ha ing no data in PISA, PIRLS and TIMSS, but in older IEA studies, Mo zambique, was added.
LLECE (Laboratorio Latinoamericano de E aluación de la Calidad de la Edu cación) measured twice, 1997 and 20052006, in 19 countries in third to sixth grade reading, mathematics and science (LLECE, 2000, 2008).1 Both sur eys were combined according to the usual procedures (standardisation using com mon countries, adaptation to the international SASQ scale). Results for se en countries were added: Boli ia, Dominican Republic, Ecuador, Guatemala, Hon duras, Nicaragua and Paraguay.
Peculiarities: The highly di erging LLECEresults of Cuba were excluded (lo cal SASQ of 651, about IQ 106). These ery high Cuban results do not corre spond to intelligence test results (Lynn & Vanhanen, 2012, IQ 85; Malloy, 2013, IQ 90), to obser ations in the 1990s in Cuba of people’s beha iour in e eryday life cogniti e tasks and proficiency in Spanish orthography. In the past in other for society rele ant attributes Communist countries ha e dressed up their sta tistics.2
The final not for age and grade corrected student assessment sum gi es in formation on cogniti e ability for 108 countries (M=444, SD=72; see Table A.1). It is difficult to precisely ascertain what the SASQ scale of defined M=500 and SD=100 stands for. PISA is calibrated for participating OECD countries. Read ing is based on participating OECD countries in the year 2000, mathematics on participating OECD countries 2003 and science on participating OECD coun tries 2006 (OECD, 2012, p. 143). TIMSS and PIRLS are constantly oriented to the chosen country samples in 1995 and 2001 (Foy, Brossman & Galia, 2012, p. 4). We tried to preser e the original scaling (PISA scale and TIMSSPIRLS scale equally a eraged). Howe er, the results needed to be standardised before com
1 There was recently published also a newer data set (TERCE) which is not used here. 2 Malloy (2013): “International rankings can ser e as a propaganda tool for non Democratic go ernments. This in ites a certain skepticism when oneparty states like Cuba, North Korea, and China are intermediaries to statistics which are unusually impressi e or inconsistent with results shown by multiple, inde pendent research teams.”
4

Appendix
bination. So M=500 stands for the past mean of abo e a erage, o erwhelmingly “First World” countries.
Additional SASbased ability measures are the intellectual or cogniti e classes ability le el, precisely, the ability
le el of the 95th percentile or the lower threshold of the top 5%, and the le el of the least smart group, 5th percentile or the upper threshold
of the lowest 5%. This information was only gi en in PISA, PIRLS and TIMSS. Also SASbased are ability measures for nati es and immigrants: Combining PISA, PIRLS and TIMSS data and using their definitions an immi grant is a person with two foreign born parents or “one and a half” foreign born parents meaning ha ing three foreign born grandparents or not more than one nati e born grandparent. All others are defined as nati es. Not all student as sessment studies pro ided information on nati es’ and immigrants’ ability le els (only: PISA 2000, 2003, 2006, 2009 and 2012, PIRLS 2001 and 2006, TIMSS 1995 and 2007). And among the studies sometimes only results for nati es and the total group were gi en, but not for immigrants. In these cases from a erages and shares the missing results for immigrants were calculated. Howe er, due to a missing alue group, the group of students not gi ing information on their parents’ origin, for nearly all studies and countries the abilities of nati es and immigrants multiplied with their percentages did not result in the exact country mean (see Rindermann & Thompson, 2016). Therefore, multiple corrections were applied.
Psychometric intelligence test studies
Richard Lynn and Tatu Vanhanen collected single intelligence test studies from all o er the world. The sur eys were conducted with different tests, in different age groups, in different years and with differently large and representati e samples. Test results were normed to one common benchmark, a erage of Brit ain 1979 called “GreenwichIQ”. For the different sur ey years Lynn and Van hanen applied FLynn corrections assuming a roughly homogenous historic trend in different countries. The last ersion (Lynn & Vanhanen, 2012) co ers 134 countries.
Peculiarities: A mistake for Bosnia was corrected by me (instead of total IQ 83.2 now 93.1). Their old rough Vietnam estimate (IQ 94) based on Indochina immigrants in the US was substituted by a newer Vietnam sample result (IQ 99; Rindermann, Hoang & Baumeister, 2013). The IQ samples are usually smaller and less representati e than student assessment samples. A eraging across tests, age groups, sur ey years and studies of different authors increases the alidity of country measures.
Our student assessment and their psychometric intelligence test results cor relate with r=.85 (N=89). SAS correlates with our final cogniti e ability grand mean with r=.99 (N=108), psychometric IQs with r=.96 (N=136), in the same
5

Compilation
sample of 89 nations the correlations are rSASCAtot=.98 and rpIQCAtot=.92. The high correlations make larger errors improbable, howe er, smaller errors as er rors of researchers in data compiling are quite usual in statistical analyses (in about 88% of all published studies; Panko, 1998) and systematic biases (e.g. due to study selection, cultural biases) cannot be excluded. For the proof of the last we need a comparison with other sources of e idence (see Chapter 4).
Further cogniti e ability estimates and combination
The SASQ mean was transformed to the more con entional IQ scale by arithme tic transformation (simply used instead of a SASQscale with M=500 and SD=100 now an IQ scale with M=100 and SD=15, the same was done for the 95%, 05%, nati e and migrant measures) and then rescaled on the Greenwich IQ with UK nati es set at M=100. SAS and psychometric intelligence test re sults were combined (standardisation using common countries). Because SAS samples are usually larger and more systematically collected student assess ment studies get in this combination a weight of 3, psychometric intelligence a weight of 1. Data are pro ided for 155 countries (M=86, SD=11, in IQ points).
Countries differ more (larger crosscountry SDs) in student assessment than in psychometric intelligence test results. For the same 89 country sample the means and standard de iations are MSAS=89.27, SDSAS=10.88, MIQ=90.86, SDIQ=9.32 (UK: MSAS=99.60 or MIQ=100.00). Student achie ement tests meas uring – compared to psychometric intelligence tests – more crystallised knowl edge loaden cogniti e ability are more sensible for effects of educational and en ironmental quality than psychometric intelligence tests measuring – compared to student assessment tests – more fluid intelligence. International differences are more stressed by student assessment than by psychometric intelligence tests. Ironically, intelligence tests tend to iron out differences.
The African data base is quite unsatisfactory: Samples are rather small and frequently not representati e, there are only ery few internationally compara ble SAS (Wicherts, Dolan & Maas, 2010; Rindermann, 2013). Therefore data for African countries were added from three studies: (1) SACMEQ (Southern and Eastern Africa Consortium for Monitoring Educational Quality; reading and mathematics in sixth grade 19951998, 19992004, 2007, N=14; Makuwa, 2010; Hungi et al., 2010), (2) MLA (Monitoring Learning Achie ement; literacy, nu meracy and life skills in fourth grade 1999, N=11; Chinapah et al., 2000) and (3) PASEC (Programme d’Analyse des Systèmes Éducatifs; French and mathemat ics in second and fifth grade, due to low comparability we used only mathemat ics, N=11; Conference, 2008). Each study was standardised on the 2012 Lynn and Vanhanen total score (comprising SAS and psychometric IQ studies). That means, because the regional African studies did not use an internationally com parable scale, we applied as a benchmark the only data set gi ing measured and estimated results for a large enough sample for countries within and outside Africa. The a erage of the three African studies SACMEQ, MLA and PASEC is gi en for 29 countries. These are all student assessment studies, but the usually information gi en by SAS publications, especially on age, participation and school attendancy rates, is missing. The representati ity of data is unclear; an
6
CCCooorrrrrreeeccctttiiiooonnnsss
Appendix
international norm was not gi en. Therefore, we did not include them in our in ternational SAS measure. Howe er, con entional SAS are not gi en for the ma jority of African countries and psychometric intelligence test samples are not always con incing. Thus we used this data set for all African countries and added them to our cogniti e ability grand mean (CA total). By adding them we ha e a broader data base for African countries. For the combination we used psychometric IQ data. Using three different benchmark approaches Sandefur (2016) came with results between 200 to 300 SASQ (TIMSS mathematics 8th
grade 1995, in IQ about 55 to 70) to somewhat lower results. Finally, only for those eight countries without any data but participation in
the International Mathematical Olympiad (IMO) IMO results were added (Be larus, Brunei, Cambodia, KoreaNorth, Mauritania, Tajikistan, Turkmenistan, Uzbekistan). At IMO only the best six math students of a country below 20 years of age participate. IMO ranks were transformed to IQ scale and combined (adapted to the international IQ scale; Rindermann, 2011b). The final cogniti e ability alue (CA total), all with measured data, is gi en for 173 countries (M=85, SD=12). This alue is standardised on a GreenwichIQ scale with British nati es (in the PISA, PIRLS and TIMSS) definition set at 100 (therefore, the UK a erage is here slightly lower with 99.60 IQ points).
The number of studies, an indicator of data quality of the cogniti e ability to tal measure, is counted in this way: Each single student assessment study per year and grade was gi en a 1, also psychometric intelligence test results (for one country 1 or 0), IEAReading and IEAP (age groups 9 and 14 years) was each gi en a 0.20, also for LLECE (max. 0.20), African studies a 0.15 (together), IMO a 0.10. Within study quality differences were not considered (e.g. only pro inces, small sample size; for psychometric IQ, Lynn & Vanhanen, 2012, pp. 2029, ga e more information). The highest alue would be 19.25. Howe er, because no country could participate in mutually exclusi e regional studies (e.g. Latin America and Africa), this alue could not be achie ed. The highest alues are achie ed by Hungary and the US (both 18.90), followed by Hong Kong (18.50), New Zealand, UK and Norway (all 17.50). Participation and CA total are corre lated (rDQCAtot=.68, N=173): Countries with a higher ability le el participated in more studies.
Older studies before 1991 were not used for calculating ability means in tended to indicate current ability le els.
Corrections
Due to systematic differences in age (in gradele el oriented studies as PIRLS and TIMSS) students in different countries are differently old. Countries with older students ha e due to maturation and more learning time an ad antage, countries with younger students a disad antage. Additionally, ability is a de el opmental characteristic; achie ing at younger age an ability le el stands for a plus in ability and in the to be expected ability de elopment later on. Therefore, an agecorrection is necessary for students.
7

Compilation
Second, countries differ in school attendance rates. Attending school leads to higher cogniti e abilities; youth attending school is positi ely selected in ability and human capital; societies ensuring high attendance rates will more likely pro ide fa ourable conditions for further cogniti e de elopment. If we want to use student assessment results as an indicator for a) the ability le el of the pre sent youth, b) the ability le el of the present population and c) the ability le el of the coming workforce and citizens, all rele ant for economy, society and cul ture, we need a measure for a not positi ely selected sample.
Van Damme, Liu, Vanhee and Pustjens (2010, pp. 62, 56) recommended to split the a erage gain of around 41 SASQ points per year in an one third age gain (around 14 SASQ) and a two third school gain (around 27 SASQ).3 This is roughly comparable to a psychometric IQgain of around 5.62 per year (in SASQ 37 points; Rindermann, 2011a). Knowledgebased crystallised intelligence gains are larger than knowledgereduced fluid intelligence gains (6.12 s. 3.58 IQ, equi alent to 41 and 24 SASQ; Rindermann, 2011a). Similarly, student assess ment gains are larger than general IQ gains and comparable to crystallised IQ gains. Therefore we subtracted 14 SASQ (1/3 age gain) for each year being older than the a erage or added 14 SASQ for each year younger than a erage.4 14 SASQ correspond to 2.10 IQ.
In psychometric intelligence tests youth’s ability increases by ca. 3 IQ points per school attendance year (equi alent to 20 SASQ; Winship & Korenman, 1997; Falch & SandgrenMassih, 2011; Brinch & Galloway, 2012). These school gains are larger in student assessment and crystallised intelligence tests compared to fluid intelligence tests (factor 1.5, e.g. 4.5 IQ s. 3 IQ; Stelzl, Merz, Remer & Ehlers, 1995). We subtracted for each percentage of age cohort not attending school 1.5 SASQ points (equi alent 0.225 IQ points).5 For example, a country with 50% school attendance rate get subtracted 75 SASQ (or 11.25 IQ). This cor rection assumes a large difference of 22.50 IQ between school attendees and nonattendees, larger than a one year loss of around 3 IQ – why? First, we can not assume that youth not at school loses merely one year of education. More probably, they lose more years. If a 10 year old child does not attend school, it could lose around 6 years (≅18 IQ). Maybe it attends school later again, in young adulthood, but ability increases in higher age are smaller (e.g. for the US: Arum & Roksa, 2011; Cunha, Heckman, Lochner & Mastero , 2006). Second, there is not only an effect of lost positi e school education, but also an effect of negati e
3 Van Damme et al. (2010) confirm with their results my older assumptions of a 42 SASQ gain per year (Rindermann, 2007a). 4 Still more specific procedures should be de eloped in the future because gains depend on age (larger gains in younger age), on le el (larger gains for the more intelligent), on schoolquality (larger gains for better schools and school systems, smaller losses in worse school systems) and on general en ironmental quality (larger gains for better nutrition and health care). Genes may further gains. 5 Our school attendance correction of 1% → 0.225 IQ points is somewhat larger than the one assumed by Hanushek & Woessmann (2015a, p. 69) with 1% → 0.15 IQ points.
8
Appendix
selection: Youth not attending school is not identical to youth attending school in abilities and other attributes rele ant for de elopment. Except for rare high potentials, differences between them are magnified by different school atten dance, but not created. Third, societies with low school enrolment rates will ha e other for cogniti e de elopment detrimental conditions, e.g. worse health care or ci il wars. Empirically, the effect of this correction is identical to the one chosen by Das and Zajonc (2010, p. 181) for India.
According to Van de Vij er and Brouwers (2009) school attendance gains dif fer across countries, for instance in Malawi they are below <1 IQ for one year of school attendance. We assume that in countries with lower ability le el youth not at school loses less de elopmental chances by not attending school than youth in countries with higher ability le el: First, their school quality is usually lower (rSASSQ=.63, N=94; see Chapter 9). Second, if a child loses only one year of school education (e.g. grade 10), the negati e effect of this one lost year is larger than the negati e effect of losing additionally one more year after already ha ing lost e.g. four other years before (e.g. loosing grades 69 plus loosing grade 10; law of marginal utility, diminishing returns). Third, the lower the ability le el the closer people come to a more or less common biological lower threshold of cogniti e ability. Fourth, stimulation in e eryday life buffers school losses.
Therefore, we applied a milder correction in a smoothed way; the lower the country ability le el, the smaller the correction. Two examples: Albania has in the PISA grand mean an uncorrected result of 385 SASQ, without lowability mitigation a corrected 330 SASQ would result, with the applied lowability miti gation a corrected 341 SASQ is estimated (in IQmetric: 83, 75 and 76). Or South Africa achie ed in the PIRLSTIMSS grand mean an uncorrected result of 296 SASQ, without lowability mitigation a corrected 249 SASQ, with the ap plied lowability mitigation a corrected 255 SASQ (in IQ 69, 62 and 63). Ne er theless, because in countries at lower student assessment le els students in comparable grades are somewhat older (r=–.26, N=87) and more youth is not attending school (r=.71, N=101) the corrections are still higher than for coun tries at higher ability le els with usually not too old students and high enrol ment rates.
Additionally, it is reasonable to assume that in primary school age school at tendance rates are not appropriately documented by international statistics: The majority of youth not in regular primary school is unlikely to be excluded from school education, often they will attend other forms of school as special schools or the school attendance is only interrupted. The reduction represents here only a difference of 15.39 IQ between school attendees and nonattendees.
In studies where information on age and school attendance was not presented the information was estimated from other student assessment studies or by the mean of other countries in the same region. The corrections were identically ap plied for nati es and immigrants. Because we assume no school attendance has a smaller negati e impact at the lowest ability le el (5% percentile) than at the highest ability le el (95% percentile) – youth at the lowest ability le el is nearer to the biological lower threshold of cogniti e ability – we reduced the correction
9

Compilation
for this group (5% percentile) at their lower alues. For the intellectual classes ability le el not attending school should be particularly detrimental (if not com pensated by pri ate instruction). The a erage corrections across countries were for the 05% le el −11.57 SASQ (−1.73 IQ) and for the 95% le el −18.97 SASQ (−2.85 IQ).
Also the estimates of Lynn and Vanhanen (2012) were corrected. They pro ided psychometric intelligence test results for 134 countries and estimates for 65 countries. Their estimates are based on student assessment results (if gi en) or on results of neighbouring countries. We assume that if countries did not par ticipate in psychometric intelligence test or student assessment studies, the general conditions for cogniti e de elopment are less than optimal. They ha e no psychological research, they are opposed to cogniti e ability and/or its re search, they ha e had wars, the general de elopmental le el is ery low. There fore, if the estimates of Lynn and Vanhanen are based on neighbouring coun tries, we deducted 3 IQ points.6 Corrected SAS and corrected psychometric IQ correlate with r=.86 (N=108). This correlation is somewhat problematic, because the estimated IQs from Lynn and Vanhanen are based in few countries on SAS. If we take the older corrected alues from Lynn and Vanhanen (2006, no SAS based estimations) the correlation is similarly high: r=.84 (N=104).
All corrections are more conser ati e (smaller) compared to the ones in the 2007 o er iew paper (Rindermann, 2007a). Reasons: The old 42 SASQ per one year of age corrections did not distinguish between school attendance and age increases (reduced from 42 SASQ to 14 SASQ). The old corrections for not at tending school o erestimated school effects; old: SAScorr=SAS ((100PartSAS) ×2); new: SAScorr=SAS ((100PartSAS) ×1.5) in secondary and ×1.3 in primary. The 2007 correction represented a 30 IQ difference between school attendees and nonattendees, the new for secondary school applies a 22.50 IQ difference, in primary school 15.39 IQ.7 Comparisons between then missing countries in IQ and later added ones re ealed smaller differences between countries ha ing or not ha ing data (from –5 to –3 IQ if no data gi en). Additionally, countries with data in SAS but not in IQ were not corrected downwards.
6 Some small countries, not participating due to their smallness, for instance Andorra, maybe are o ercorrected. Howe er, countries as Liechtenstein or Macau ha e participated. 7 A correction of 22.50 or 15.39 IQs for not attending (any more) school sounds rather large. Howe er, to gi e only one example, in Germany with a tracked school system the difference between the cogniti e more demanding track, Gymnasium, and the cogniti e less demanding track, Hauptschule, is on a er age in PISA 2000 and 2003 about 179 SASQ or 27 IQ points (Prenzel et al., 2004). In the CogAT intelligence test the difference is in South Germany about 41 (total score) or 25 (figural) IQ points (Heller & Perleth, 2000). On a erage there is a difference of 31 IQ points between differently schooled children – how large would be the difference between schooled and not (any more) schooled children?
10

OOOlllddd ssstttuuudddeeennnttt aaasssssseeessssssmmmeeennnttt ssstttuuudddiiieeesss fffrrrooommm 111999666000sss aaannnddd 111999777000sss
Appendix
Countries with the largest gains due to all corrections are (for CA total): Brunei (+6 IQ points), Belize and Tunisia (+5), Comoros and Cambodia (+3) and KoreaNorth (+2). The greatest downward corrections are obser able for: Tajiki stan and Uzbekistan (–7), Vietnam (–6), Mauritania and Gabon (–5), and Be larus (–4). Per definition, there is no change for the benchmark United Kingdom (0). The United States has a correction of –0.18 IQ points, Germany of –0.38.
Why countries with single measured or estimated alues in psychometric in telligence tests do not ha e the same result in the psychometric and the CA total measure? For instance Afghanistan (LynnVanhanen: 73, CA total 71) or Angola (LV 69, CA total 67)? Some countries ha e results in African regional studies or in IMO. Howe er, more important is, that SAS and psychometric test results are rescaled to the UK nati es mean of 100. We should not forget that SAS or IQs, independent of their terms and scaling, theoretical background and used tasks, are de iation measures from a reference sample. There is no material mètre des archi es like in Paris for the metre.
Old student assessment studies from 1960s and 1970s
These older studies were taken for calculating a past cogniti e ability measure to be used in longitudinal analyses. IEA’s first international study of students’ competences in mathematics was conducted in 11 countries during 1963 and 1964, sur eying two agegrade groups: age 13 (US eighth grade) and the last year of secondary education (US twelfth grade). The other older studies meas ured competences in reading and science of students between 10 and 14 years of age or in the last year of secondary education in 197273.
The results were collected in one summary table by Lee and Barro (2001), the data table was published 1997.8 We took from 1964: IEAMathematics 13year old students, eighth grade; IEAMathematics at the end of secondary school. From 1972: Reading 13year old students; science 10year old students; science 14year old students; science at the end of secondary school. The mean correla tion among these studies with weighted N and after Fisherztransformation is r=.62.
The final a erage was standardised according to new student assessment re sults and IQ measures (corrected total a erage). UK was not rescaled to 100 (so a historical de elopment is possible to obser e). No corrections were applied (no information is gi en on age etc.). The complete sample for old student assess ment studies includes 19 nations: Australia, Belgium, Chile, Finland, France,
8 World Bank, Table 2, International Test Scores, http://econ.worldbank.org/WBSITE/EXTERNAL/EXTDEC/EXTRESEARCH/0,,content MDK:20699068~pagePK:64214825~piPK:64214943~theSitePK:469382,00.html.
11

Compilation
Germany, Hungary, India, Iran, Israel, Italy, Japan, Malawi, Netherlands, New Zealand, Sweden, Thailand, United Kingdom, USA.
12

Appendix
Table A.1: Uncorrected cogniti e ability measures Country CA total SASQ SAS-IQ 95%-IQ 05%-IQ Nat-IQ Mig-IQ LyVa-IQ Data-Q Afghanistan – – – – – – – – 0 Albania 85 411 84 107 57 84 78 – 3.10 Algeria 83 390 81 98 63 82 77 – 2.10 Andorra – – – – – – – – 0 Angola – – – – – – – – 0 Antigua-Barbuda – – – – – – – – 0 Argentina 87 398 82 106 57 82 77 96 6.30 Armenia 92 459 91 114 68 91 94 92 7.10 Australia 99 519 100 121 77 100 100 98 16.10 Austria 99 512 99 118 77 100 92 100 12.10 Azerbaijan 88 430 87 106 68 87 86 – 4.10 Bahamas – – – – – – – – 0 Bahrain 85 418 85 107 62 85 85 81 5.10 Bangladesh 80 – – – – – – 81 1.10 Barbados 79 – – – – – – 80 1.00 Belarus 100 – – – – – – – 0.10 Belgium 99 510 99 118 76 100 92 99 10.50 Belize 66 267 62 88 41 63 61 – 1.00 Benin (Dahomey) 64 – – – – – – – 0.25 Bermuda 89 – – – – – – 90 1.00 Bhutan – – – – – – – – 0 Bolivia 83 382 79 – – – – 87 1.30 Bosnia 92 457 91 110 70 91 89 94 2.10 Botswana 73 322 70 92 49 71 65 71 6.35 Brazil 86 417 85 107 62 85 77 87 6.50 Brunei 76 – – – – – – – 0.10 Bulgaria 94 479 94 117 68 94 86 93 12.10 Burkina Faso 65 – – – – – – – 0.15 Burma (Myanmar) – – – – – – – – 0 Burundi 73 – – – – – – – 0.15 Cambodia 82 – – – – – – – 0.10 Cameroon 68 – – – – – – 64 1.15 Canada 101 528 101 121 81 102 100 100 14.90 Cape Verde – – – – – – – – 0 Central Afric R 62 – – – – – – 64 1.00 Chad 67 – – – – – – – 0.15 Chile 88 429 86 108 65 87 81 91 9.30 China 103 536 102 120 82 103 93 106 3.30 Colombia 84 405 83 103 62 83 75 84 9.30 Comoros 67 – – – – – – – 0.15 Congo (Brazz) 72 – – – – – – 73 1.00 Congo (Zaire) 67 – – – – – – 68 1.15 Cook Islands 88 – – – – – – 89 1.00
13

Data tables
Costa Rica 89 444 89 108 71 89 86 86 3.30 Cote d’Ivoire 65 – – – – – – 71 1.25 Croatia 98 499 97 115 78 97 95 99 6.10 Cuba 84 – – – – – – 85 1.10 Cyprus 92 460 91 113 66 92 89 – 8.50 Czech Republic 99 516 99 119 78 100 97 98 14.10 Denmark 99 512 99 118 78 100 92 98 11.50 Djibouti – – – – – – – – 0 Dominica 65 – – – – – – 67 1.00 Dominican Repub 76 328 71 – – – – 82 1.20 East Timor – – – – – – – – 0 Ecuador 81 359 76 – – – – 88 1.30 Egypt 83 396 82 107 54 83 72 81 3.00 El Salvador 80 370 78 96 59 78 72 – 2.30 Equat. Guinea – – – – – – – – 0 Eritrea 74 – – – – – – 76 1.00 Estonia 101 535 102 121 84 103 99 99 5.10 Ethiopia 67 – – – – – – 69 1.00 Fiji 84 – – – – – – 85 1.00 Finland 101 540 103 121 84 104 95 97 10.50 France 98 506 98 117 76 99 93 98 10.70 Gabon 73 – – – – – – – 0.15 Gambia 60 – – – – – – 62 1.00 Georgia 86 418 85 107 61 85 74 – 7.10 Germany 99 515 99 119 77 101 93 99 12.50 Ghana 67 271 63 90 37 64 54 70 4.00 Greece 94 485 95 116 72 96 90 92 9.50 Greenland – – – – – – – – 0 Grenada – – – – – – – – 0 Guatemala 78 353 75 – – – – 79 1.30 Guinea-Bissau – – – – – – – – 0 Guinea 65 – – – – – – 67 1.00 Guyana – – – – – – – – 0 Haiti – – – – – – – – 0 Honduras 74 312 69 86 51 – – 81 3.30 Hong Kong 105 545 104 122 83 104 103 108 18.50 Hungary 98 513 99 119 77 99 94 97 18.90 Iceland 98 495 96 116 75 97 89 101 10.50 India 80 369 77 103 52 – – 82 3.10 Indonesia 85 404 83 102 63 83 73 87 12.30 Iran 85 413 84 105 62 84 80 84 13.10 Iraq 86 – – – – – – 87 1.00 Ireland 98 518 100 120 78 100 100 93 10.90 Israel 95 482 94 118 67 95 94 95 13.50 Italy 97 500 97 117 75 98 92 97 16.90 Jamaica 70 – – – – – – 71 1.00
14

Appendix
Japan 104 549 104 124 82 105 95 105 15.10 Jordan 86 428 86 109 61 86 87 84 8.20 Kazakhstan 91 453 90 111 69 90 90 – 4.10 Kenya 76 – – – – – – 74 1.15 Kiribati – – – – – – – – 0 Korea-North 97 – – – – – – – 0.10 Korea-South 106 561 106 125 86 107 97 106 13.50 Kuwait 79 345 74 96 51 74 72 87 9.10 Kyrgyzstan 77 349 74 99 50 74 77 – 2.10 Laos 88 – – – – – – 89 1.00 Latvia 98 506 98 117 78 98 97 – 13.10 Lebanon 84 410 84 106 62 84 80 82 4.00 Lesotho 65 – – – – – – – 0.15 Liberia – – – – – – – – 0 Libya 84 – – – – – – 85 1.00 Liechtenstein 101 528 101 120 80 103 98 – 5.10 Lithuania 96 499 97 116 77 97 91 92 15.10 Luxembourg 99 511 99 119 76 102 95 – 6.10 Macau 101 526 101 118 83 100 101 – 4.10 Macedonia 87 420 85 108 61 86 77 – 6.10 Madagascar 78 – – – – – – 82 1.15 Malawi 60 – – – – – – 60 1.15 Malaysia 90 451 90 110 69 90 81 89 7.10 Maldives – – – – – – – – 0 Mali 70 – – – – – – 70 1.15 Malta 94 465 92 116 64 92 90 97 5.00 Mariana Islands 80 – – – – – – 81 1.00 Marshall Islands 83 – – – – – – 84 1.00 Mauritania 79 – – – – – – – 0.10 Mauritius 85 434 87 110 62 – – 89 2.15 Mexico 88 436 88 108 67 88 80 88 6.30 Micronesia – – – – – – – – 0 Moldova 90 444 89 110 66 89 89 – 6.10 Mongolia 92 438 88 107 67 – – 100 3.10 Montenegro 88 428 86 108 64 86 87 – 3.10 Morocco 79 322 70 94 49 71 63 84 11.25 Mozambique 76 426 86 – – – – 64 1.45 Namibia 68 – – – – – – 72 1.15 Nepal 77 – – – – – – 78 1.00 Nether Antilles 86 – – – – – – 87 1.00 Netherlands 101 528 101 119 82 102 96 100 15.50 New Caledonia 84 – – – – – – 85 1.00 New Zealand 99 516 100 122 75 100 99 99 17.50 Nicaragua 80 368 77 – – – – – 0.20 Niger 65 – – – – – – – 0.15 Nigeria 77 365 77 – – – – 71 1.30
15

Data tables
Norway 97 493 96 115 75 97 91 100 17.50 Oman 81 377 79 103 54 79 73 85 5.00 Pakistan 83 – – – – – – 84 1.10 Palestine 83 388 80 106 53 81 74 86 4.00 Panama 83 392 81 105 56 81 78 – 1.30 Papua N-Guinea 82 – – – – – – 83 1.00 Paraguay 81 378 79 – – – – 84 1.30 Peru 83 386 80 104 56 80 74 85 4.30 Philippines 80 352 75 101 50 – – 90 4.30 Poland 97 500 97 117 76 97 89 95 9.10 Portugal 96 495 96 116 75 97 94 95 10.90 Puerto Rico 82 – – – – – – 83 1.10 Qatar 81 375 78 104 53 74 82 83 10 Romania 91 457 91 113 68 91 81 91 13.10 Russia 98 506 98 118 77 98 96 97 16.50 Rwanda 75 – – – – – – 76 1.00 Saint Helena – – – – – – – – 0 Saint Lucia 60 – – – – – – 62 1.00 Samoa-West 87 – – – – – – 88 1.00 Sao Tome/Princi – – – – – – – – 0 Saudi Arabia 81 389 80 102 58 80 81 79 6.10 Senegal 69 – – – – – – 71 1.15 Serbia 92 468 92 114 70 92 92 89 8.10 Seychelles 81 – – – – – – – 0.15 Sierra Leone 62 – – – – – – 64 1.00 Singapore 106 555 105 127 81 105 106 109 15.50 Slovakia 98 502 97 118 75 98 88 98 13.10 Slovenia 98 508 98 118 77 99 94 96 16.90 Solomon Islands – – – – – – – – 0 Somalia – – – – – – – – 0 South Africa 69 285 65 97 41 67 56 72 7.25 Spain 96 492 96 115 75 96 91 97 10.90 Sri Lanka 78 – – – – – – 79 1.10 St. Kitts & Nevis – – – – – – – – 0 St. Vincent/Gre 70 – – – – – – 71 1.00 Sudan 76 – – – – – – 78 1.00 Suriname 88 – – – – – – 89 1.00 Swaziland 76 – – – – – – – 0.15 Sweden 99 514 99 119 78 100 94 99 15.50 Switzerland 100 520 100 120 78 102 95 101 7.70 Syria 82 388 80 103 61 81 75 81 4.10 Taiwan 103 539 103 123 81 103 94 105 13.50 Tajikistan 89 – – – – – – – 0.10 Tanzania 74 – – – – – – 73 1.15 Thailand 90 455 90 110 71 91 83 88 12.30 Tibet 91 – – – – – – 92 1.00
16

Appendix
Togo – – – – – – – – 0 Tonga 85 – – – – – – 86 1.00 Trinidad Tobago 88 431 87 112 60 87 87 – 3.50 Tunisia 86 402 82 102 62 83 74 84 12.25 Turkey 89 445 89 111 68 89 80 89 10.10 Turkmenistan 85 – – – – – – – 0.10 Uganda 72 – – – – – – 72 1.15 Ukraine 94 475 93 114 71 94 92 95 4.10 United Arab Emi 87 439 88 112 64 81 91 83 8.10 United Kingdom 100 517 100 121 77 100 97 100 17.50 United States 99 511 99 120 76 100 95 98 18.90 Uruguay 91 444 89 112 63 89 79 96 5.30 Uzbekistan 89 – – – – – – – 0.10 Vanuatu – – – – – – – – 0 Venezuela 86 419 85 108 58 – – 84 2.70 Vietnam 100 527 101 118 84 101 92 99 2.10 Yemen 70 265 62 83 41 63 59 83 4.00 Zambia 69 – – – – – – 75 1.15 Zimbabwe 72 331 72 – – – – 72 1.45 Country CA total SASQ SAS-IQ 95%-IQ 05%-IQ Nat-IQ Mig-IQ LyVa-IQ Data-Q Mean 84.68 444.03 88.70 111.00 67.56 90.74 86.03 86.06 4.61 Standard Deviat. 11.52 71.51 10.73 9.09 11.27 10.50 10.98 11.29 5.34 Number countries 173 108 108 99 99 93 93 136 200
Notes: CA total: grand mean of student assessment and psychometric intelli gencestudies in IQ metric; SASQ: mean of student assessment studies (PISA, PIRLS, TIMSS, IEA, 19912011) in SASQscale with M=500 and SD=100; SASIQ: mean of student assessment studies in IQ scale; 95%IQ: ability at the 95%le el in PISA, PIRLS, TIMSS (cogniti e classes) in IQ scale; 05%IQ: ability at the 05%le el in PISA, PIRLS, TIMSS in IQ scale; NatIQ: nati es’ mean of student assessment studies (PISA, PIRLS, TIMSS) in IQ scale; MigIQ: immigrants’ mean of student assessment studies (PISA, PIRLS, TIMSS) in IQ scale; LyVaIQ: Lynn and Vanhanen’s measured psychometric intelligence test mean; DataQ: number of studies, less reliable studies with weights<1; norm scale: GreenwichIQ with UK nati es as 100 and UK standard de iation as 15; for United Kingdom (Great Britain) the exact country a erages in CA total and SASIQ are 99.60, for nati es by definition 100.00; for further information see “Sources and procedure”. Data compiled March 22, 2014.
17

Data tables
Table A.2: Corrected cogniti e ability measures including estimates Country CA totc SAS-IQc 95%-IQc 05%-IQc Nat-IQc Mig-IQc N-M-Diff Migr-gain LyVa-IQc Afghanistan 71 – – – – – – – 73 Albania 83 77 100 52 78 72 5.74 −0.19 83 Algeria 84 80 98 62 81 77 4.08 −0.92 85 Andorra 94 – – – – – – – 95 Angola 67 – – – – – – – 69 Antigua-Barbuda 70 – – – – – – – 72 Argentina 87 80 103 56 80 75 5.74 −0.47 96 Armenia 90 86 107 64 85 89 −3.37 0.31 92 Australia 99 99 120 77 99 100 −0.84 0.30 98 Austria 99 98 117 77 99 92 7.82 −1.41 100 Azerbaijan 88 86 105 68 86 86 0.24 −0.19 86 Bahamas 81 – – – – – – – 82 Bahrain 86 85 107 62 85 85 0.60 −0.29 81 Bangladesh 80 – – – – – – – 81 Barbados 79 – – – – – – – 80 Belarus 96 – – – – – – – 93 Belgium 99 99 118 76 100 92 7.91 −1.54 99 Belize 71 60 86 40 61 58 2.55 −1.13 78 Benin (Dahomey) 66 – – – – – – – 69 Bermuda 89 – – – – – – – 90 Bhutan 74 – – – – – – – 76 Bolivia 83 76 – – – – – – 87 Bosnia 92 88 107 68 89 87 1.45 −0.18 94 Botswana 73 65 87 46 65 59 5.88 −0.65 71 Brazil 85 80 102 59 80 72 8.23 −0.30 87 Brunei 82 – – – – – – – 90 Bulgaria 93 92 115 67 92 84 8.38 −0.09 93 Burkina Faso 66 – – – – – – – 68 Burma (Myanmar) 82 – – – – – – – 83 Burundi 70 – – – – – – – 70 Cambodia 85 – – – – – – – 90 Cameroon 67 – – – – – – – 64 Canada 101 101 120 81 102 100 1.39 −0.30 100 Cape Verde 72 – – – – – – – 74 Central Afric R 62 – – – – – – – 64 Chad 64 – – – – – – – 64 Chile 89 85 105 64 85 80 5.18 −0.16 91 China 101 99 116 79 100 90 9.66 −0.38 106 Colombia 82 76 96 57 76 68 8.33 −0.38 84 Comoros 70 – – – – – – – 75 Congo (Brazz) 71 – – – – – – – 73 Congo (Zaire) 67 – – – – – – – 68 Cook Islands 88 – – – – – – – 89
18

Appendix
Costa Rica 87 84 103 67 84 81 3.30 −0.31 86 Cote d’Ivoire 66 – – – – – – – 71 Croatia 97 96 114 76 96 94 2.35 −0.32 99 Cuba 84 – – – – – – – 85 Cyprus 93 92 114 67 92 89 2.91 −0.36 93 Czech Republic 99 99 118 78 99 96 2.86 −0.12 98 Denmark 98 98 117 77 99 92 7.20 −0.78 98 Djibouti 71 – – – – – – – 73 Dominica 65 – – – – – – – 67 Dominican Repub 78 70 – – – – – – 82 East Timor 82 – – – – – – – 83 Ecuador 82 73 – – – – – – 88 Egypt 84 80 106 54 82 70 11.60 −1.81 81 El Salvador 79 72 91 55 73 66 6.28 −0.68 79 Equat. Guinea 65 – – – – – – – 67 Eritrea 74 – – – – – – – 76 Estonia 100 101 119 83 102 98 3.59 −0.46 99 Ethiopia 67 – – – – – – – 69 Fiji 84 – – – – – – – 85 Finland 101 103 121 84 104 95 8.30 −0.55 97 France 98 97 116 76 98 92 6.30 −1.20 98 Gabon 68 – – – – – – – 67 Gambia 60 – – – – – – – 62 Georgia 87 83 105 60 83 72 11.12 −0.53 88 Germany 99 99 118 76 100 92 8.26 −1.59 99 Ghana 64 51 81 32 52 43 9.34 −0.79 70 Greece 95 95 116 73 96 90 5.89 −0.75 92 Greenland 88 – – – – – – – 89 Grenada 70 – – – – – – – 72 Guatemala 79 72 – – – – – – 79 Guinea-Bissau 65 – – – – – – – 67 Guinea 65 – – – – – – – 67 Guyana 78 – – – – – – – 79 Haiti 63 – – – – – – – 65 Honduras 75 65 84 49 – – – – 81 Hong Kong 104 103 120 82 103 102 0.65 −0.25 108 Hungary 98 98 118 76 98 93 4.72 −0.10 97 Iceland 98 97 117 76 98 90 7.80 −0.49 101 India 78 69 94 47 – – – – 82 Indonesia 84 79 98 60 79 69 10.32 −0.37 87 Iran 85 81 102 60 81 78 3.80 −0.06 84 Iraq 86 – – – – – – – 87 Ireland 97 99 119 78 99 99 0.13 −0.04 93 Israel 95 93 116 66 93 93 0.13 −0.06 95 Italy 98 97 118 75 98 92 5.99 −0.52 97 Jamaica 69 – – – – – – – 71
19

Data tables
Japan 104 104 124 82 105 95 9.65 −0.31 105 Jordan 87 85 107 61 84 86 −1.69 0.48 84 Kazakhstan 90 88 109 68 88 88 0.29 −0.10 86 Kenya 74 – – – – – – – 74 Kiribati 82 – – – – – – – 83 Korea-North 99 – – – – – – – 103 Korea-South 105 106 124 85 106 97 9.81 −0.60 106 Kuwait 79 69 92 49 70 68 2.23 −0.48 87 Kyrgyzstan 77 71 96 48 71 74 −3.05 0.29 76 Laos 88 – – – – – – – 89 Latvia 97 97 115 77 97 95 1.61 −0.17 97 Lebanon 83 78 99 58 78 74 4.37 −0.46 82 Lesotho 66 – – – – – – – 67 Liberia 64 – – – – – – – 66 Libya 84 – – – – – – – 85 Liechtenstein 99 99 117 78 101 95 5.48 −1.96 101 Lithuania 95 95 113 75 95 89 6.15 −0.34 92 Luxembourg 97 98 118 75 101 94 7.29 −3.37 96 Macau 98 96 112 79 96 97 −0.86 0.66 101 Macedonia 86 80 102 57 80 72 8.45 −0.48 91 Madagascar 77 – – – – – – – 82 Malawi 61 – – – – – – – 60 Malaysia 90 87 107 67 88 78 9.67 −0.48 89 Maldives 78 – – – – – – – 79 Mali 69 – – – – – – – 70 Malta 94 91 114 63 91 89 2.29 −0.30 97 Mariana Islands 80 – – – – – – – 81 Marshall Islands 83 – – – – – – – 84 Mauritania 74 – – – – – – – 72 Mauritius 86 84 105 59 – – – – 89 Mexico 86 81 100 62 81 73 8.20 −0.39 88 Micronesia 81 – – – – – – – 82 Moldova 90 87 107 65 87 87 −0.54 0.15 93 Mongolia 91 84 103 65 – – – – 100 Montenegro 88 86 107 64 86 87 −1.37 0.33 87 Morocco 76 63 88 44 63 55 8.35 −0.61 84 Mozambique 77 77 – – – – – – 64 Namibia 68 – – – – – – – 72 Nepal 77 – – – – – – – 78 Nether Antilles 86 – – – – – – – 87 Netherlands 101 101 119 82 102 96 6.79 −0.98 100 New Caledonia 84 – – – – – – – 85 New Zealand 99 99 121 75 100 99 0.91 −0.22 99 Nicaragua 81 74 – – – – – – 82 Niger 66 – – – – – – – 68 Nigeria 75 69 – – – – – – 71
20

Appendix
Norway 98 97 116 75 97 91 5.68 −0.54 100 Oman 80 72 96 50 73 66 6.71 −0.84 85 Pakistan 83 – – – – – – – 84 Palestine 83 77 102 52 78 71 7.35 −0.86 86 Panama 82 76 100 54 77 73 3.55 −0.32 81 Papua N-Guinea 81 – – – – – – – 83 Paraguay 82 75 – – – – – – 84 Peru 83 77 100 54 77 70 6.46 −0.17 85 Philippines 80 70 96 47 – – – – 90 Poland 97 97 117 76 97 89 8.57 −0.16 95 Portugal 95 95 114 74 95 92 2.77 −0.22 95 Puerto Rico 81 – – – – – – – 83 Qatar 83 78 104 53 74 82 –7.88 4.21 83 Romania 91 88 109 66 88 79 9.65 −0.29 91 Russia 97 97 117 76 97 95 2.63 −0.32 97 Rwanda 75 – – – – – – – 76 Saint Helena 83 – – – – – – – 84 Saint Lucia 60 – – – – – – – 62 Samoa-West 87 – – – – – – – 88 Sao Tome/Princi 63 – – – – – – – 65 Saudi Arabia 81 77 98 55 76 77 −0.72 0.12 79 Senegal 69 – – – – – – – 71 Serbia 91 91 111 68 90 91 −0.31 0.11 89 Seychelles 81 – – – – – – – 85 Sierra Leone 62 – – – – – – – 64 Singapore 105 105 126 81 105 106 −1.14 0.27 109 Slovakia 98 97 117 75 97 87 9.99 −0.36 98 Slovenia 97 98 117 77 98 93 5.40 −0.67 96 Solomon Islands 80 – – – – – – – 81 Somalia 68 – – – – – – – 70 South Africa 70 59 92 39 61 51 10.50 −1.90 72 Spain 96 95 114 75 96 90 5.74 −0.56 97 Sri Lanka 78 – – – – – – – 79 St. Kitts & Nevis 70 – – – – – – – 72 St. Vincent/Gre 69 – – – – – – – 71 Sudan 76 – – – – – – – 78 Suriname 88 – – – – – – – 89 Swaziland 74 – – – – – – – 76 Sweden 99 99 118 78 100 94 6.50 −1.08 99 Switzerland 100 100 119 78 102 95 7.30 −2.19 101 Syria 82 77 99 58 78 71 6.04 −0.67 81 Taiwan 103 103 123 81 103 94 9.77 −0.31 105 Tajikistan 82 – – – – – – – 78 Tanzania 72 – – – – – – – 73 Thailand 89 87 106 68 87 79 7.74 −0.23 88 Tibet 91 – – – – – – – 92
21

Data tables
Togo 66 – – – – – – – 68 Tonga 85 – – – – – – – 86 Trinidad Tobago 88 85 110 59 85 85 0.08 −0.08 87 Tunisia 91 82 102 62 82 74 8.64 −0.41 84 Turkey 87 82 103 62 82 73 9.17 −0.24 89 Turkmenistan 82 – – – – – – – 81 Uganda 71 – – – – – – – 72 Ukraine 93 91 111 69 91 89 2.02 −0.25 95 United Arab Emi 89 88 112 64 81 91 −10.18 7.42 83 United Kingdom 100 100 121 77 100 97 3.06 −0.40 100 United States 98 98 119 76 99 95 4.11 −0.82 98 Uruguay 90 85 107 60 85 75 9.65 −0.33 96 Uzbekistan 82 – – – – – – – 78 Vanuatu 81 – – – – – – – 82 Venezuela 83 77 99 53 – – – – 84 Vietnam 94 91 104 74 91 82 9.64 −0.28 99 Yemen 69 53 77 37 53 50 3.71 −0.68 83 Zambia 69 – – – – – – – 75 Zimbabwe 70 64 – – – – – – 72 Country CA totc SAS-IQc 95%-IQc 05%-IQc Nat-IQc Mig-IQc N-M-Diff Migr-gain LyVa-IQc Mean 82.93 86.01 108.16 65.82 88.41 83.70 4.71 −0.35 84.07 Standard Deviat. 11.52 12.50 10.52 12.07 12.17 12.78 4.24 1.12 11.27 Number countries 200 108 99 99 93 93 93 93 200
Notes: See also Table A.1, student assessment alues corrected for age (students older or younger than international a erage) and school attendance rates (if below 100%); Lynn and Vanhanen’s IQ estimates (if no measured data) corrected downwards for assumed critical social conditions in countries without any student assessment and psychometric intelligence research; N MDiff: difference between nati es’ minus immigrants’ a erage IQs; Migr gain: gains or losses through immigration for country competence mean; for United Kingdom the exact country a erages in CA totc and SASIQc are 99.60, for nati es by definition 100.00. Data compiled at March 22, 2014.
22

AAAttttttririribbbuuuttteeesss ooofff ssstttuuudddeeennntttsss (((pppuuupppiiilllsss))),,, iiinnnssstttruruructctctiiiooonnn,,, ssschchchoooooolllsss aaannndddeeeddduuucacacatttiiiooonnnaaalll sssyyysssttteeemmmsss
SSSooouuurrrccceeesss aaannnddd cccooommmbbbiiinnnaaatttiiiooonnn
Appendix
Attributes of students (pupils), instruction, schools and educational systems
Sources and combination
Data mostly stem from student assessment studies (SAS). In some cases other sources were used as collections from economists (based on sources as UNESCO or World Bank). Variables were selected for theoretical rele ance and supply. For example classroom olume wouldn’t be an important attribute, but percent age of attenti e learning time per lesson – what was ne er reported and we therefore cannot use.
The approach followed here is similar to the prior one for cogniti e abilities, to collect data for as many countries as possible based on different sources and combine them to achie e higher representati ity, reliability and alidity. At the end information is gi en for many countries from a wide range of cultural, eco nomic and geographical factors allowing a fairly robust and meaningful judge ment of distributions, relationships and effects. The limitation is that frequently rather heterogeneous operationalisations are combined leading at the end to ery global constructs. The alternati e would be to do more narrow single sur ey studies (e.g. using only data from PISA 2009 for the gi en countries) or, bet ter, to do the same kind of single sur ey studies se eral times (within PISA, TIMSS and PIRLS sur eys) and then integrate the results. It would be ery in formati e if for some educational attributes such comparisons would be done in future.
Because we also deal with results from reports and ratings (“schools whose principal reported”, “disciplinary climate”), the data basis is shakier than any achie ement test (SAS, IQ) data basis. Additionally, because there is some dis cretion and subjecti ity in selecting ariables and judging them as being alid indicators of a concept (especially the case for “discipline”), other researchers may come to somewhat different results. Finally, in combining data technical errors can be made. Again, comparisons with results of other researchers would be informati e and useful for scientific progress and for educational policy sug gestions.
In combining data it was tried to preser e a meaningful scale. Final scales should still be interpreted carefully. One example: In order to create one general scale for kindergarten attendance three different operationalisations and corre sponding data, all coming from SAS studies, had to be merged: a erage years attending kindergarten, percentage of pupils with more than one year in kin dergarten, an abstract kindergarten attendance index. The final gi en scale is therefore only a rough yardstick supporting a better understanding. More reli able than the absolute meaning (e.g. Sweden on a erage 1.65 years kindergar ten attendance) is the relati e crosscountry meaning (e.g. in Sweden with 1.65 years much more kindergarten education than in Turkey with 0.57 years).
23

Data tables
For some ariables there was no meaningful scale at all (relati e educational expenditures, being young in high grades, amount of education, school quality sum, educational le el of society). Here we standardised the data applying the United Kingdom as benchmark (“Greenwich”; M=0) and the standard de iation within “First World Countries” (Europe, North America, TransTasman and East Asia; N=56 countries; SD=1).
Education expenditures (per capita)
Education expenditures describe how much is spent for education. Expenditures for education per pupil (ppp, purchasing power parity corrected) are based on: PISA 2009, “cumulati e expenditure by educational institutions per student aged 6 to 15, 10,000 US dollars con erted using ppps” (OECD, 2010c, p. 150). Expenditures in USDollars per student, data of IEAReadingLiteracystudy 1990/91 (Elley, 1992, p. 9), N=30. Expenditures per student (pupils at school, ppp), for primary and secondary schools and 1985 and 1990 aggregated (α=.95), data from Lee and Barro (1997), N=108. The last two were aggregated and stan dardised in adaptation to PISA 2009, fewer (and older); Elley data were only used for countries without PISA or LeeBarro data (Nigeria) (α=.91, N=116). Expenditures depend strongly on gross national product.
Education expenditures (wealthrelated, relati e to GDP)
Education expenditures relati e to GDP describe whether countries relati ely more or less spend for education. Education expenditures (relati e to GDP per capita) come from: TIMSS 2007, “public expenditure on education (% of GDP)” (Mullis et al., 2008, p. 23), N=47. PIRLS 2006, “public expenditure on education (% of GDP)” (Mullis et al., 2007, p. 27), N=39. Both combined and adapted to the TIMSS scale (because TIMSS has more countries; α=.92, N=59).
IEAReading 1991 (Elley, 1992,. p. 9, fraction of expenditures and GDP), N=30. IAEP II 1991, “percent of gross national product spent on education, age 13” (Lapointe et al., 1992a, p. 76), N=18. Both old and similar studies were com bined and adapted to the IAEP scale (a gi en scale; α=.84, N=36). Data for 1985 and 1990 from Lee and Barro (1997), N=108. These older sources combined and adapted to the IAEP scale (is newer; α=.64, N=110).
Finally, TIMSSPIRLS was combined with the older studies, the correlations for an identical ariable were low (r=.29, α=.45). Data are gi en for N=127 coun tries. Results were restandardised to UK M=0 and First World countries SD=1.
Teacher salary (relati e to GDP per capita)
Are teachers relati e to other jobs well paid? The relati e teacher salary meas ure stems from PISA 2009, “teachers’ salaries relati e to GDP/capita: weighted a erage of upper and lower secondary school teachers (ratio)” (OECD, 2010c, p. 150). We took only information from the more recently and reliable student as sessment studies, not older ones from the 1980s or 1990s. We could not find other published data in PISA, TIMSS or PIRLS. Information is gi en for N=40 countries.
24

Appendix
Kindergarten attendance
Kindergarten attendance or preschool education stands for the a erage years children recei ing in age three to six institutional preschool education usually called “kindergarten”. Sources: PISA 2003 (OECD, 2004, p. 244), attendance of preschool or kindergarten more than one year, percentages, N=40. PISA 2009 (OECD, 2010b, p. 190), an age index built upon the percentages of the groups ha e not, one year or more than one year attended kindergarten, N=65. PISA 2012 (OECD, 2013e, p. 363), an age index built upon the percentages of the groups ha e not, one year or more than one year attended kindergarten, N=65. PISA combined (standardisation oriented towards PISA 2012, α=.96, N=69).
From TIMSS we ha e data only for 2011, grade 4, (Mullis et al., 2012a, p. 198f.), a like by PISA constructed ageindex, N=35. Data from PIRLS are in dexes like constructed by PISA: PIRLS 2001 (Mullis et al., 2003, p. 130), N=29; PIRLS 2006 (Mullis et al., 2007, p. 162), N=38; PIRLS 2011 (Mullis et al., 2012b, p. 128f.), N=47. PIRLS combined (α=.92, N=57). TIMSS and PIRLS combined (α=.98, N=57).
Aggregation to an a erage alue of IEATIMSSPIRLS and OECDPISA (standardisation oriented towards PISA), r=.86, α=.92. Data are gi en for N=82 countries.
School enrolment age
Age of enrolment at school co ers, depending on source, the typical entry age or the actual entry age. Sources PISA: PISA 2000 (OECD, 2003, p. 270, total N=42), PISA 2003 (OECD, 2004, N=30), PISA 2009 (OECD, 2010c, p. 63, N=65), PISA 2012 (OECD, 2013e, p. 74, N=64), a eraged oriented to the 2012 results (Cronbachα=.90). Unfortunately the data are imprecise (e.g. “6”, exact would be “6;3”, six years and three month) and may not be indicati e of the actual ages of the children, but only the official guideline of the school authorities (“typical en try age”, OECD, 2003, p. 270). Therefore the effects of enrolment age are proba bly underestimated.
Sources TIMSS: TIMSS 1995 (Baumert & Lehmann, 1997, p. 182, N=37), TIMSS 2003 (Mullis et al., 2004, pp. 2024, N=46), TIMSS 2007 (Mullis et al., 2008, pp. 378380, N=59), a eraged oriented to the 2007 results (α=.87). Sources PIRLS: PIRLS 2001 (Mullis et al., 2003, p. 131, N=29) and PIRLS 2006 (Mullis et al., 2007, p. 163, N=38), a eraged oriented to 2006 results (α=.98). PIRLS gi e empirical and more precise results on school entry age. IEAstudies were first combined (TIMSS and PIRLSmeans, a eraged oriented to the more empirical PIRLS results, TIMSS was more official school entry age; α=.78). Then OECD and IEA studies (PISA with TIMSSPIRLS, a eraged oriented to the more coun tries co ering IEA results; α=.91). For countries without PISA, TIMSS or PIRLS data we added information from the source IAEPII 1991 (Lapointe et al., 1992b, p. 20). This was only Mozambique.
The homogeneity (Cronbachα) among different sources is for an identical characteristic low (effects may be underestimated). In the statistical analysis
25

Data tables
the school entry age was re ersed; a high numerical alue corresponds to young age. Finally we ha e data for N=96 countries.
Age in grade (being young in high grade)
Being young in a gi en grade and being in a high grade at gi en age are indica tors of an efficient educational system. Countries with a high alue in this ari able ha e an “ageefficient” school system and “timeefficient” students. Sources PISA, ageoriented study: Mean grade of 15 years old students in PISA 2000 (Baumert et al., 2001, p. 413, N=32), in PISA 2009 (OECD, 2010a, p. 180, N=65) and in PISA 2012 (OECD, 2013e, p. 218, N=65); a eraged oriented to the 2012 results (Cronbachα=.96).
Sources gradeoriented TIMSS: TIMSS 1995, country’s de iation from mean age in grades 4 and 8 (Martin et al., 1999, p. 11, N4=25 and N8=39), the same for TIMSS 1999 in grade 8 (Mullis et al., 2000, p. 11, N8=38), TIMSS 2003 in grades 4 and 8 (Mullis et al., 2004, pp. 2024, N4=25 and N8=46), TIMSS 2007 in grades 4 and 8 (Mullis et al., 2008, pp. 34f., 379, N4=37 and N8=50), TIMSS 2011 in grades 4 and 8 (Mullis et al., 2012a, pp. 430434, N4=56 and N8=48); a eraged oriented to 2011 results (α=.84). Sources gradeoriented PIRLS: PIRLS 2001, country’s de iation from mean age in grade 4 (Mullis et al., 2003, p. 26, N=34), PIRLS 2006 (Mullis et al., 2007, p. 37, N=39), PIRLS 2011 (Mullis et al., 2012b, p. 262265, N=48); a eraged oriented to 2011 results (α=.96).
IEAstudies were combined (TIMSS and PIRLS, α=.90). For countries without data (Nigeria, Zimbabwe, Venezuela) results from IEAReading (Elley, 1992) were added. Finally, OECD and IEAdata were combined (α=.79). We ha e data for N=100 countries. Results were restandardised to UK M=0 and First World countries SD=1.
Amount of instruction per year
The ariable amount of instruction per year seems to be at first glance a ery clear and easily to measure construct: hours of instruction at school per year. This is not the case, because there is a gap between officially announced and actually realised instruction (teacher shortage, illness, training, administration, absence), because there are different times of instruction s. only super ision and because many pupils recei e additional instruction outside the main school. We took the gi en official amount of instruction per year at the main school (not included instruction at additional cram schools).
Sources: PISA 2000, a erage instructional time per year (Baumert et al., 2001, p. 417), N=31. PISA 2003, product of instructional weeks per year and in structional time per week in hours (OECD, 2004, p. 242 & 431), N=39. PISA 2009, mean of regular lessons at school in language of instruction, mathematics and science, time student spent for learning per week (minutes) (OECD, 2010c, p. 234), N=65. PISA 2012, total class periods per week (OECD, 2013e, p. 344), N=65. The four ariables are not identical, but they co er the same global meaning, amount of instruction. Howe er, homogeneity is ery low (α=.08, N=69). Only the indicators of PISA 2003 and PISA 2012 correlate with r=.47
26

Appendix
nearly reasonably high. We took all because all intended to measure amount of instruction.
TIMSS 1995, days taught per year in grades 4 and 8 (α=.90; Martin et al., 1999, p. 67), N=32. TIMSS 1999, amount of total time in school in hours per year a eraged across students in grade 8 (Mullis et al., 2000, p. 293), N=34. TIMSS 2007, yearly amount of implemented time in instruction in grades 4 and 8 based on information for mathematics and science (α=.53; Mullis et al., 2008, pp. 194f.; Martin et al., 2008, pp. 206f.), N=55. TIMSS 2011, total instructional hours in all subjects per year in grades 4 and 8 (α=.88; Mullis et al., 2012a, pp. 342f., 344f.), N=63. Combination, orientated towards grade 8 and TIMSS 2011 (α=.82, N=76).
PIRLS 2001, total hours of instructional time per year in primary school (Mullis et al., 2003, p. 145), N=32. PIRLS 2006, implemented weekly instruc tional time (for language and reading), a erage hours of instructional time per week (Mullis et al., 2007, p. 181), N=38. PIRLS 2011, instructional time spent on language and reading, reported by principals and teachers, instructional hours per year, total (Mullis et al., 2012b, pp. 214f.), N=46. Combination, orientated towards 2011 (more countries, entire year; α=.98, N=57). IEA studies TIMSS and PIRLS combined in orientation to TIMSS (more countries, all subjects; α=.87, N=79).
Finally, OECD and IEAstudies were combined in orientation to IEA (more countries, more reasonable data; α=.53, N=96). Because the PISA data base seems to be less reliable we ha e later done also analyses with data only from TIMSS and PIRLS.
Amount of education
Amount of education co ers all recei ed education until around age 15 years, in many countries the end of compulsory education. This index was formed from kindergarten attendance, attendance of high grades at a young age, amount of instruction and attendance of additional (cram) schools (PISA 2000, 2003, 2009; α=.86, N=69). Homogeneity (α=.18, N=101) is low because kindergarten and cram school attendance are negati ely correlated (r=–.31, N=69); howe er, both increase total education recei ed. Results were restandardised to UK M=0 and First World countries SD=1.
Tracking age
Tracking between schools (not within) in young age is an aggregation of differ ent sources: Initially we took data from the PISA 2000 (OECD, 2003, p. 221) and PISA 2003 studies (OECD, 2004, p. 262). We initially combined them and then supplemented and corrected them based on further information: OECD data contain ob ious errors: Hong Kong’s tracking age is not 19 years, but 12 (Marsh, Kong & Hau, 2000, p. 339f.); Switzerland is not 15, but depending on canton be tween 10 and 12 (Büeler & Merki, 2003; OECD, 1999, p. 30; Woschek, 2005, re ported age 12.58). Singapore was added with 10 years, also Netherlands with 12 years.
27

Data tables
USA and Japan were missing in the OECDPISAtables. USA is difficult to categorize; officially it is characterized by a comprehensi e school system until age 16 and mandatory attendance (PISA 2003), but with regular streaming within schools, with unofficial tracking according to residential area and finan cial situation of parents (indirectly correlated with education, knowledge and intelligence of parents and their children) and e en some unofficial tracking at kindergarten! According to Dronkers (2006, p. 69) “the United States has the significantly highest ethnic school segregation” compared to European countries.
Japan has officially and largely realised until grade 9 (14 year old students) comprehensi e schools. Below 15 years pri ate schools with entrance exams and ability selection are attended only by a small minority of students. Howe er, about twothirds of the students additionally attend pri ate cram schools (“Juku”) during afternoons, at e ening and weekend; and that attendance and the di ision within cram schools depend on ability and parental income (fees per month ca. 600 to 900 €; Haasch, 2000, p. 199). Schümer (1998, p. 215, 219) de scribed a formal tracking of cram schools according to ability (“select according to achie ement”, “selecti e cram schools”). As a result there is tracking in secon dary school age (grades 79, ages 1214) outside public schools. In addition there are reports of informal tracking with entrance exams in primary schools and e en in kindergarten (Haasch, 2000, pp. 144, 168, 183) and preparatory training for these exams! The Japanese educational system cannot be understood, if these additional tracked cram schools are not considered. Because of this we chose for Japan a tracking age of 14 and not 15 (and, if anything, it could be set to an e en younger age). Moreo er, it is ob ious, that the difference in compe tences following school attributes is greatest worldwide for 15yearold students (“effect of schools’ economic, social and cultural status”; OECD, 2004, p. 188) and that there are according to OECD many pri ate schools (OECD, 2004, p. 251). Finally, Schaub and Zenke (2004, p. 298) reported for Japan informal differen tiation along prestige, fees, and competences.
Further tracking data come from Schaub and Zenke (2004), sometimes differ ent to OECDsources: The tracking ages of Argentina and Brazil were reduced from 18 (OECD) to 15 (Schaub & Zenke; end of compulsory education, after that different tracks, that correction reduces positi e effects of early tracking); Bul garia from 14 to 13 (onset of ocational schools); Great Britain from 16 to 11 (England: Grammar Schools admit 11 year old pupils after entrance exam, com prehensi e schools use tests for admission or streaming, Schaub & Zenke, p. 177, similar for Northern Ireland; this correction increases the positi e early tracking effect); Ireland from 15 to 12 (like England, Grammar Schools); Israel from 12 to 15 (tracking starts at age 15); Japan 14 years (not 15 years see abo e); Canada from 13 to 16 (reducing tracking effect); Luxemburg from 13 to 12; Malta 11 years (beginning of Grammar School); Russia from 15 to 14, here the decision was difficult, because in Russia Grammar Schools are a ailable al ready for 6 year olds, but only attended by 4% of the students (Döbert, Hörner, Kopp & Mitter, 2004); Switzerland 12 years as the mean between 10, 12 and sometimes 15 (not 15 as in OECDlists; see abo e and Schaub & Zenke, 2004, p. 499); Slo akia, Czechia and Hungary from 11 to 10 (beginning of Grammar
28

Appendix
Schools); South Africa has comprehensi e schools (16 years), but seems to be segregated informally by residential area and race. USA is difficult, it was taken 13 years (from age 12 or 14 on tracking, High Schools in age 14 with entrance exam, large ariance in competences between schools depending on parents; Martin et al., 2000a, p. 76ff., Martin et al., 2004, p. 193).
Finally, the data base was completed by newer data from PISA 2006, “First age of selection in the education system” (OECD, 2007, p. 162): Azerbaijan, Jor dan, KoreaSouth, Liechtenstein, Serbia, Kyrgyzstan, Colombia, Macau, Monte negro, Qatar, Thailand, Tunisia and Uruguay (Switzerland was coded by OECD as 12 years, as we ha e corrected it before). Taiwan was slightly corrected from 15 to 14 years (important additional instruction in pri ate cram schools); and PISA 2012 (OECD, 2013e, p. 78): Albania, Chile, China, Estonia, Malaysia, Slo enia, Czech Republic, United Arab Emirates and Vietnam.
In the statistical analysis the tracking age was re ersed; a high numerical alue corresponds to young age. We ha e data for N=72 countries.
Share of immigrants
On the definition of nati es and immigrants see Section 10.3.5 and Rindermann and Thompson (2016).
PISA: Percentages of nati es (born in country of assessment with at least one parent born in the same country) and immigrants (firstgeneration or second generation immigrant students, nonnati e students) are gi en from PISA 2000, 2003, 2006, 2009 and 2012.
TIMSS: Percentages of nati es (both parents born in country) and immigrants (one parent born in country, neither parent born in country) are gi en from TIMSS 1995 and 2007 (2007 fourth and eighth grade).
PIRLS: TIMSS and PIRLS use the same system of categorisation of nati es and immigrants. Percentages are gi en from PIRLS 2001 and 2006.
The different definitions of being a migrant and the increases in immigration make it essential to adapt and standardise the arying results of different stud ies before a eraging across studies. The a erage presented here is for immi grants with two foreign born parents or “one and a half” foreign born parents meaning ha ing not more than one nati e born grandparent (the nati e country of the student itself is irrele ant). In all studies and for nearly all countries the competences of nati es and immigrants multiplied with their percentages did not result in the exact country mean (for examples see Rindermann & Thomp son, 2016). The most likely explanation for this is that there is a missing alue group, the group of students not gi ing information on their parents’ origin. For this group results are not presented in the SAS reports. This made the nati e, immigrant and country mean competence and percentage estimates mathemati cally contradictory. Therefore the differences were corrected, step by step, for (first) percentages and (second) means leading at the end to mathematically cor rect and (as assumed) empirically more eridical results (N=93). For a more de tailed explanation of the procedure see Rindermann and Thompson (2016).
29

Data tables
Language spoken at home and in school is identical
Similar to the portion of migrants the identity of languages spoken at home and in school are no quality indicators of educational systems but features of stu dents influencing instruction and its success. Data are based on: PISA 2012: Sum of “nonimmigrant students who speak another language at home, in erted” and “immigrant students who speak another language at home, in erted” (OECD, 2013d, Table II.3.5, p. 232). Sources TIMSS: TIMSS 2007: Stu dents speak the language of the test at home, always or almost always, grades 4 and 8 (Mullis et al., 2008, pp. 148, 149, α=.99, N=58). TIMSS 2011, 4th grade “students spoke the language of the test before starting school, percent of stu dents” (Mullis et al., 2012a, p. 186), “schools with students ha ing the language of the test as their nati e language, reported by principals, more than 90% of students, percent of students” (Mullis et al., 2012a, p. 218f.), 8th grade: “students speak the language of the test at home, reported by students, always or almost always, percent of students” (Mullis et al., 2012a, p. 188f.) and “schools with students ha ing the language of the test as their nati e language, reported by principals, more than 90% of students, percent of students” (Mullis et al., 2012a, p. 220f.). TIMSS 2011 together α=.94, N=62. TIMSS combined α=.92, N=70. Sources PIRLS: PIRLS 2001: Students speak language of the test at home (Mul lis et al., 2003, p. 101, N=34). PIRLS 2006: Students speak language of the test at home (Mullis et al., 2007, p. 135, N=38). PIRLS 2011: “Schools with students ha ing the language as their nati e language, more than 90% of students, per cent of students” (Mullis et al., 2012b, p. 144f., N=47). PIRLS sur eys were com bined, standardisation oriented towards the newer and larger 2011 sample (α=.65, N=57). PIRLS was combined with TIMSS, standardisation oriented to wards the larger TIMSS sample (α=.91, N=78).
Finally, IEA and OECD studies were combined (α=.93, N=91). For countries lacking data information from the source IAEPII 1991 was added (13 years old, same language home and school; Lapointe et al., 1992b, p. 69, N=18). This was only Mozambique. The final alue is gi en for total N=92 countries.
Class size and pupilperteacher ratio
The standard model is one teacher and one class and all teachers are in front of class teaching. Howe er, that is not always the case, there are sometimes se eral teachers in one class or additional teachers are outside class working in administration, counselling or coaching. Teacherpupil ratios ha ing an impact on general educational quality should be also considered.
Sources: PISA 2000, class sizes for students age 15 (OECD, 2003, p. 363), N=40 countries. PISA 2009, a erage class size for the language of instruction (OECD, 2010c, p. 150), N=65 countries. PISA 2012, studentteacher ratio in the school (OECD, 2013e, p. 321), N=64 countries. PISA combined orientated to 2009 (more countries, intended ariable; α=.90, N=70).
TIMSS 1995, a erage studentteacher ratio and class size in grades 4 and 8 (α=.90; Martin et al., 1999, p. 45f.; Mullis 1997, p. 163), N=36. TIMSS 1999, class size in grade 8 (Mullis et al., 2000, p. 203), N=37. TIMSS 2003, class size in
30

Appendix
grades 4 and 8 in mathematics and science (α=.99; Mullis et al., 2004, p. 266f.), N=45. TIMSS 2007, class size in grades 4 and 8 in mathematics and science (α=.97; Mullis et al., 2008, pp. 268f.; Martin et al., 2008, pp. 288ff.). TIMSS com bined orientated to 2007 (more countries, intended ariable; α=.93, N=73).
PIRLS 2001, class size (Mullis et al., 2003, p. 158), N=34. PIRLS 2006, class size for reading and language instruction (Mullis et al., 2007, p. 188), N=39. PIRLS combined orientated to 2006 (more countries, newer; α=.96, N=46).
TIMSS and PIRLS combined orientated to TIMSS (more countries, also higher grades; α=.95, N=78). PISA and TIMSSPIRLS combined orientated to TIMSSPIRLS (more countries, more studies; α=.88, N=94).
For countries lacking data information was added from the following sources: IEAReadingLiteracystudy 1990/91, number of students per class for age 9, (Scheerens & Bosker, 1997, p. 249), N=26; IAEPII 1992 class size (Lapointe et al, 1992b, p. 19), N=19; pupilteacherratio by Lee and Barro (1997), 1985 and 1990 aggregated for primary and secondary schools (α=.89), N=143; primary school studentteacher ratio by Kurian (2001, pp. 360f., based on UNESCO), N=176. The final ariable is gi en for N=190 countries. For controlling possible bias effects by these older data sets also an analysis only based on more recent PISA, TIMSS and PIRLSdata was done.
Repetition rates
Among the student assessment studies only PISA gi es information (no infor mation found in TIMSS and PIRLS reports): PISA 2003, proportion of repeaters among 15yearolds in primary and secondary schools summed up (OECD, 2004, p. 262, N=30); PISA 2006, proportion of repeaters in participating schools, lower secondary education and upper secondary education summed up (OECD, 2007, p. 162, N=55), PISA 2009 same ariable (OECD, 2010c, p. 63, N=65), PISA 2012 same ariable (OECD, 2013e, p. 74, N=64), a eraged oriented to the 2012 re sults (Cronbachα=.97). This aggregated score is gi en for N=68 countries.
Discipline
Discipline is defined as schoolappropriate beha iour of students supporting learning. Sources PISA: PISA 2000: Not skipping class in the last two weeks, not arri ing late for school in the last two weeks, both students’ selfreport (OECD, 2003, pp. 290, 291, α=.49, N=41). PISA 2003: Percentage of students in schools where the principals report that the following hinders students’ learning to some extent or a lot: student absenteeism and students skipping classes, dis cipline problems in class, deri ed from “disruption of classes by students”, “the teacher has to wait a long time for students to quieten down” and “students don’t start working for a long time after the lesson begins”, always positi ely in erted (OECD, 2004, pp. 407, 409, α=.69, N=40). PISA 2006: No information gi en in reports. PISA 2009: Index of disciplinary climate (OECD, 2010c, p. 253, N=65). PISA 2012: The a erage of percentage of students who had arri ed late at least once (in erted, OECD, 2013e, p. 168) and index of disciplinary climate based on
31

Data tables
students’ reports (OECD, 2013e, p. 168, N=64). All scales were standardised and combined (α=.83).
Sources TIMSS: TIMSS 1995: Not being absent and not lea ing school before the end of the school year (“Percent of students who are absent on a typical school day, schools with less than 5% absent”, “schools with less than 5% lea ing before year end, percent of students” grades 4 and 8, director’s assessment, Mar tin et al., 1999, pp. B11 and B12, B14 and B15, α=.83, N=37). TIMSS 1999: Low problems with school and class attendance (index of “seriousness of attendance problems at school”, “arri ing late at school, absenteeism, skipping class”; per centage of students with high attendance) and in classroom (“classroom distur bance”; percentage of students whose schools reported that disturbances occur at least weekly) (grade 8, Mullis et al., 2000, pp. 240, 244, α=.40, N=37). TIMSS 2003: Index of good school and class attendance (“principals‘ responses to three questions about the seriousness of attendance problems in the school: arri ing late at school; absenteeism; and skipping class”, grades 4 and 8, Mullis et al., 2004, pp. 324f., α=.78, N=45). TIMSS 2007: Index of good attendance at school in grade 4 and 8 (principals’ responses to three questions about attendance problems in the school: arri ing late at school; absenteeism; and skipping class; high means no problem, Mullis et al., 2008, p. 328, α=.72, N=58). TIMSS 2011, based on 4th and 8th grade: “School discipline and safety, reported by principals, a erage scale score” (Mullis et al., 2012a, p. 270f., 272f.), “students in classrooms where teachers report instruction is limited by disrupti e students, some or not at all, percent of students, mathematics” (Mullis et al., 2012a, p. 386f., 388f.), “students in classrooms where teachers report instruction is limited by disrup ti e students, some or not at all, percent of students, science” (Martin et al., 2012, p. 396f., 398f.), “percent of students whose principals spend ‘a lot of time’ addressing disrupti e student beha iour, in erted” (Martin et al., 2012, p. 262f., 264f.); α=.92, N=63. The discipline indicators of the fi e TIMSSsur eys were combined (α=.64).
Sources PIRLS: PIRLS 2001: Percentage of students with absenteeism in schools (moderate or serious problem, in erted; Mullis et al., 2003, p. 243, N=34). PIRLS 2006: Seriousness of absenteeism in schools, not a problem (Mullis et al., 2007, p. 268, N=38). PIRLS 2011: “percent of students whose principals spend ‘a lot of time’ addressing disrupti e student beha iour, in erted” (Mullis et al., 2012b, p. 170f.), “school discipline and safety, reported by principals, hardly any problems, percent of students” (Mullis et al., 2012b, p. 178f.), “students in class rooms where teachers report instruction is limited by disrupti e students, some or not at all, percent of students” (Mullis et al., 2012b, p. 232.); α=.52, N=48. The three PIRLS sur eys combined (larger numbers standing for more discipline) ha e Cronbachα=.82, N=57.
PISA, TIMSS and PIRLS combined Cronbachα=.70. Finally, we ha e data for N=95 countries.
32

Appendix
Direct instruction
Amount of direct instruction represents lecturestyle presentation by teachers. Data are only gi en from TIMSS. Typical items are: “work together as a class with teacher teaching the whole class”, “lecturestyle presentation by teacher”, “listening to lecturestyle presentations”, or “direct teacher guidance”. Sources: TIMSS 1995 (α=.92; Mullis et al., 1997, p. 164f., Beaton et al., 1996a, p. 154f., Beaton et al., 1996b, p. 146f.), N=37; TIMSS 1999 (α=.88; Mullis et al., 2000, p. 205, Martin et al., 2000b, p. 219), N=38; TIMSS 2003 (α=.95; Mullis et al., 2004, p. 286288, Martin et al., 2004, p. 310), N=45; TIMSS 2007 (4th and 8th grade, α=.92; Mullis et al., 2008, pp. 292ff.), N=58; TIMSS 2011 (4th and 8th grade, α=.85; Mullis et al., 2012a, pp. 398ff.), N=63. Always teacher’s iew of the por tion of lesson time in mathematics and in science instruction of 4th and 8th
grades, all sur eys combined, α=.82, N=80 countries.
Use of achie ement tests
The use of achie ement tests co ers the use of such tests and the use of their results for student admission or placement, frequently in combination with the use of grades for such measures. Sources PISA: PISA 2000 no information is gi en. PISA 2003: Directors’ statements: School admission depends on ability (“percentage of students in schools where the principals consider the following statements as a ‘prerequisite’ or a ‘high priority’ for admittance at school: stu dents’ academic records including placement tests”; OECD, 2004, pp. 417 a. 314, N=37), results of achie ement tests are used for streaming (“use of assessment results and student performance in mathematics: group students for instruc tional purposes”; OECD, 2004, p. 421, N=38), tests are used by school for infor mation of parents about the achie ement of their children (“use of assessment results and student performance in mathematics: inform parents about their child’s progress”; OECD, 2004, p. 421, N=38). The three measures were com bined (α=.21, N=39). PISA 2006: Existence of standardsbased external exami nations (OECD, 2007, p. 163, N=56). PISA 2009: Existence of standardsbased external examinations (OECD, 2010c, p. 229, N=62). PISA 2012: “Percentage of students in schools whose principal reported that the following factors are con sidered for admission to school, students’ records of academic performance, al ways” (OECD, 2013e, p. 282) and “profiles of assessments and examinations across countries and economies, 2: assessment in lower secondary, national ex ams in upper secondary, few fields requiring tertiary exams, 1: only national exams in lower and upper secondary + National or other nonnational examina tions in lower or upper secondary, 0: no national or other examinations, most fields requiring tertiary exams” (OECD, 2013e, p. 148), α=.40, N=65. The four PISA sur eys were combined oriented to the 2012 measure (α=.72).
Sources TIMSS: Only information from TIMSS 1995 and TIMSS 2011. TIMSS 1995 8th grade for tracking/streaming decisions (“factors that are moderately or ery important in deciding courses of study in mathematics, standardised tests”; Martin et al., 1999, p. 64, N=20). TIMSS 2011 8th grade “classroom assessment, reported by teachers, percentage of students whose teachers gi e mathematics
33

Data tables
tests or examinations, e ery 2 weeks or more” (Mullis et al., 2012b, p. 410f., N=46). Both together α=.51, N=54. Source PIRLS: Only information from PIRLS 2006, “emphasis on sources to monitor students’ progress in reading, percentage of students whose teachers reported placing major emphasis on arious sources, national or regional achie ement tests” (Mullis et al., 2007, p. 238, N=37). Both IEAstudies together α=.32, N=64.
OECD and IEAapproach together α=.21. Altogether data for N=88 countries.
Central exams and tests
The use of central exams and objecti e tests in educational systems by schools and in entry exams of uni ersities are used in order to define an objecti e stan dard. Data come from Bishop (1997) and Woessmann (2002, p. 15). The pro ided information is for mathematics and sciences in school systems (r=.84, sum alue α=.91). Bishop’s numbers stand for the relati e number of secondary school graduates who participated in central exams. Two modifications were made: 1. China was added (following Heine et al., 2006, central exams “Gao Kao”) and 2. the USA were put not at 07 but at 70 on a scale from 0 to 100, because the ad mission to colleges and uni ersities in the USA is regulated by central and ob jecti e competence tests (SAT and ACT), the majority of pupils go at least to colleges and the foundation courses there represent a kind of higher secondary school education in contents and age of pupils. The ariable represents the use of central exams (independent from proximity to a gi en curriculum) in schools or at the end of school education for uni ersity entrance (sum alue N=54).
School autonomy
School autonomy means that schools can decide on finances, curriculum or teacher recruitment. Measures based on PISA: PISA 2003: Autonomy in ap pointing teachers, in dismissing teachers, in formulating the school budget and in establishing student disciplinary policies (OECD, 2004, pp. 425, 426, α=.74, N=36). PISA 2009: Index of school responsibility for resource allocation and in dex of school responsibility for curriculum and assessment (OECD, 2010c, pp. 213, 216, α=.70, N=64). PISA 2012: “School autonomy o er resource allocation, index of school responsibility for resource allocation, mean index” (OECD, 2013e, p. 131, N=63). Altogether α=.86, N=72.
Teacher quality and teacher competence
Teacher quality and teacher competence are indicated by the educational le el of teachers (there are no ability test assessments for teachers). Sources: PISA 2012, two indicators, percentage of teachers with a uni ersityle el degree and percentage of certified teachers (α=.24; OECD, 2013e, p. 99), N=63.
TIMSS 1999, three indicators, percentage of students taught by certified teachers, ha ing mathematics as the major area of study in their BA, MA or teacher training program or both teacher certification and mathematics or sci ence as the major area of study, for mathematics and science, 8th grade (α=.97; Mullis et al., 2000, p. 189, Martin et al., 2000b, pp. 200f.), N=38. TIMSS 2007, percentage of students by completed postgraduate uni ersity degree in mathe
34

Appendix
matics and science in 4th and 8th grade (α=.97; Mullis et al., 2008, pp. 248f., Mar tin et al., 2008, pp. 264f.), N=57. TIMSS 2011, completed postgraduate uni er sity degree in mathematics and science in 4th and 8th grade (α=.95; Mullis et al., 2012a, pp. 284f., 286f., Martin et al., 2012, pp. 288f., 290f.), N=62. TIMSS com bined orientated towards 2011 (newest, most countries, α=.64), N=75.
PIRLS 2011, completed postgraduate uni ersity degree of teacher in reading (Mullis et al., 2012b, pp. 188f.), N=47. TIMSS and PIRLS combined orientated towards TIMSS (more countries, α=.94), N=75. PISA and TIMSSPIRLS com bined orientated towards PISA (more sensible scale, α=.38), N=92.
Pri ate schools
Pri ate schools are schools in pri ate go ernance. Varying across countries they are pri ately or publicly funded and more or less similar in curriculum to public schools. Sources: PISA 2000, percentage of students in go ernmentindependent pri ate schools (OECD, 2003, p. 221), N=28. PISA 2003, percentage of students enrolled in pri ate schools (OECD, 2004, p. 253), N=28. PISA 2009, Pri ate schools (proportion) (OECD, 2010c, p. 148), N=63. PISA 2012, go ernment de pendent and independent pri ate schools (OECD, 2013e, p. 56), N=46. PISA combined orientated towards PISA 2009 (most countries, best scale; α=.80), N=68.
Homework
Amount of homework is based in these sources: PISA 2000, time spent on homework from ery high (5) to ery low (1) (Baumert et al., 2001, p. 417), N=32. PISA 2003, homework or other study set by their teachers in hours per week (OECD, 2004, p. 431), N=40. PISA 2012, homework or other study set by teachers in minutes (OECD, 2013e, p. 111), N=64. PISA combined orientated towards 2012 (most countries and most exact scale; α=.92), N=64.
TIMSS 2007, index of time students spend doing homework (high) in mathe matics and science in 4th and 8th grade (α=.91; Mullis et al., 2008, pp. 170f., Mar tin et al., 2008, pp. 166f.), N=58. TIMSS 2011, weekly time students spend on mathematics homework, reported by students, percent of students in 8th grade (Mullis et al., 2008, pp. 170f.), N=45. Both scales, combined orientated towards 2011 (more countries; α=.87), N=63.
PIRLS 2006, percentage of students ha ing high index of reading for home work (Mullis et al., 2007, p. 236), N=38. TIMSS and PIRLS combined orientated towards TIMSS (more studies and countries; α=.80), N=71.
PISA combined with TIMSSPIRLS orientated towards PISA (more natural scale; α=.80), N=89. For countries lacking data in newer student assessment studies were added information from IEAReading (N=26; Scheerens & Bosker, 1997, p. 253) and IAEPII (homework 2 h/d or more, percentages of 9 and 13 year old pupils, α=.70; Lapointe et al., 1992b, pp. 73, 100), both together α=.51, N=35 (added countries: Mozambique, Venezuela). Data from newer and older SAS correlate with r=.45.
Finally, we ha e data for N=91 countries.
35

Data tables
O erall index: Mean of schooleducation quality
This indicator includes all ariables with theoretical and empirical support for impact on competence de elopment (similarly Rindermann & Ceci, 2009): a) Kindergarten attendance rate, b) attendance of high grades at a young age, c) tracking at a young age, d) low repetition rates, e) discipline, f) direct instruc tion, g) standardised achie ement tests and achie ementbased decisions, h) use of central exams and objecti e tests, i) school autonomy, j) teacher quality (edu cational le el) and k) proportion of pri ate schools (α=.74, total N=96). For some countries the index is based on single or only few ariables and studies. Results were restandardised to UK M=0 and First World countries SD=1.
O erall index: Adult education mean (educational le el of society)
The adult education mean is no characteristic of schools or students but an out come ariable of the educational system. It represents the general educational le el of society. Education is frequently used as a proxy of cogniti e competence by many scholars and paradigms.
The standardised alues of three measures were a eraged: 1. Adult literacy rate, the ability to read and write a simple sentence or similar basic literacy as fill out an application form, 15 years old or older, from Kurian (2001, pp. 349f., N=195). 2. Percentage of persons between 12 and 19 years old 19601985 (in the inter al of student assessment studies from the 1990s on they are adults) ha ing graduated from secondary school (N=117), from Mankiw, Romer and Weil (1992). 3. The mean of years of schooling of persons being 25 years or older for 1990, 1995 and 2000 (N=107), from Barro and Lee (2000). All authors used data from UNO or similar sources. The sum (α=.93 in 101 common countries) is gi en for N=195 countries. Results were restandardised to UK M=0 and First World countries SD=1.
Background indicator: Number of books at home
Number of books at home co ers a family’s amount of books, of children and parents, and ser ers as an indicator of interest and practice of education and intellectual interests. Sources: There is no information from OECDPISA, but from IEA studies. TIMSS 1995, percentages ha ing more than 200 books at home in 4th and 8th grade (α=.97; Beaton et al., 1996a, p. 95; Martin et al., 1997, p. 102), N=36. TIMSS 1999, percentages ha ing more than 200 books in 8th
grade (Mullis et al., 2000, p. 252), N=38. TIMSS 2003, percentages ha ing more than 200 books in 4th and 8th grade (α=.94; Mullis et al., 2004, p. 136ff.), N=45. TIMSS 2007, percentages ha ing more than 200 books in 4th and 8th grade (α=.91; Mullis et al., 2008, p. 156ff.), N=58. TIMSS 2011, percentages ha ing more than 100 books in 4th and 8th grade (information for more than 200 books not gi en, α=.96; Mullis et al., 2012a, p. 178f., 184f.), N=63. All TIMSstudies combined orientated towards 2011 (newest and largest data base; α=.94), N=78.
PIRLS 2001, parents ha ing more than 200 books and children ha ing more than 100 books together (α=.88; Bos et al., 2003), N=34. PIRLS 2006, number calculated based on parents’ reports of children’s books in the home, more than
36

Appendix
100 books or 51100 books (Mullis et al., 2007, p. 114), N=38. PIRLS 2011, Per cent of students with more than 100 books in their home (Mullis et al., 2012b, pp. 114f.), N=48. PIRLstudies combined orientated towards 2006 (more reason able scale; α=.96), N=58.
TIMSS and PIRLS combined orientated towards PIRLS (more reasonable scale; α=.94), N=82. For countries where there is no data in these newer student assessment studies but in older IEA (Brazil, China, Mozambique) were added information from IAEPII (13year old pupils, Lapointe et al., 1992a, pp. 63). Data from newer and older SAS correlate with r=.64. Finally, we ha e data for N=85 countries.
37

Data tables
Table A.3: Educational attributes Country EEa EEr TSr Kig SEA YHG AIn AEd Trac Mi% LanI CS RR Disc DirI AchT CenE SAut TeQa Priv Hom SQM AdE Book Afghanistan – – – – – – – – – – – 39 – – – – – – – – – – -8.12 – Albania – – – 1.24 6.25 -1.92 790 -1.36 15 4 – 30 4 74 – 46 – 50 77 8 304 -1.78 -1.10 – Algeria 357 0.63 – – 5.98 -1.84 953 -1.20 – 23 52 34 – 65 42 – – – 43 – 431 -3.83 -4.77 5 Andorra – – – – – – – – – – – – – – – – – – – – – – -0.01 – Angola – – – – – – – – – – – 42 – – – – – – – – – – -7.26 – Antigua-Barbuda – – – – – – – – – – – 36 – – – – – – – – – – -1.34 – Argentina 277 -2.2 – 1.45 5.89 -1.72 780 -1.31 15 9 86 28 37 53 – 14 – 57 47 26 223 -4.48 -1.62 30 Armenia – – – – 6.91 -2.63 926 -1.32 – 12 94 29 – 66 45 46 – – 97 – 428 -1.02 -0.17 87 Australia 729 -0.39 1.27 1.28 5.24 -0.81 925 -0.05 16 32 80 25 7 63 38 62 81 71 86 37 273 -1.08 0.69 126 Austria 926 0.52 1.13 1.82 6.08 -1.96 876 -0.35 10 18 75 21 13 69 42 37 0 49 57 6 231 -2.42 -0.45 76 Azerbaijan – – – 0.53 6.54 -1.83 911 -1.41 15 10 93 18 4 77 48 54 – 67 67 0 – -2.04 -0.37 11 Bahamas – – – – – – – – – – – 28 – – – – – – – – – – -0.25 – Bahrain – – – – 5.93 -1.42 1022 -1.10 – 23 76 31 – 59 54 79 – – 73 – 318 -0.41 -0.95 60 Bangladesh 251 -1.1 – – – – – – – – – 65 – – – – – – – – – – -6.73 – Barbados – – – – – – – – – – – 27 – – – – – – – – – – 0.68 – Belarus – – – – – – – – 16 – – 19 – – – – – – – – – – -0.29 – Belgium 840 0.42 1.45 1.98 5.92 -1.43 876 -0.15 12 20 69 19 31 69 45 50 0 74 64 – 271 -1.91 -0.05 76 Belize – – – 1.00 5.21 -0.51 941 -1.21 – 44 37 30 – 48 – – – – – – – -3.72 -3.97 34 Benin (Dahomey) – – – – – – – – – – – 52 – – – – – – – – – – -7.34 – Bermuda – – – – – – – – – – – 28 – – – – – – – – – – -0.42 – Bhutan – – – – – – – – – – – 41 – – – – – – – – – – -7.72 – Bolivia 249 -1.8 – – – – – – – – – 33 – – – – – – – – – – -3.26 – Bosnia – – – – 5.98 -2.64 848 -1.38 – 12 94 24 – 70 70 – – – 37 – 309 -3.10 -1.81 9 Botswana 356 3.18 – 0.80 6.20 -3.05 1041 -1.39 – 11 17 37 – 52 44 40 – – 54 – 377 -4.98 -4.56 26 Brazil 240 -1.8 – 1.22 7.06 -2.35 591 -0.42 15 4 91 43 36 54 – 17 – 56 76 14 251 -4.03 -3.65 34 Brunei – – – – – – – – – – – 24 – – – – – – – – – – -1.64 – Bulgaria 852 2.06 1.00 1.65 6.81 -2.97 739 -1.40 13 3 80 22 6 56 59 47 100 88 91 2 380 -1.16 -0.29 89 Burkina Faso 257 3.27 – – – – – – – – – 66 – – – – – – – – – – -9.36 – Burma (Myanmar) – – – – – – – – – – – 41 – – – – – – – – – – -4.65 – Burundi 297 9.10 – – – – – – – – – 64 – – – – – – – – – – -8.04 –
38

Appendix
Cambodia – – – – – – – – – – – 58 – – – – – – – – – – -4.64 – Cameroon 258 -0.84 – – – – – – – – – 54 – – – – – – – – – – -5.39 – Canada 990 0.84 – 1.19 5.67 -0.97 950 -0.27 16 30 74 27 10 59 38 53 51 67 75 6 301 -2.30 1.03 106 Cape Verde – – – – – – – – – – – 40 – – – – – – – – – – -3.80 – Central Afric R 242 0.29 – – – – – – – – – 86 – – – – – – – – – – -6.39 – Chad 238 1.36 – – – – – – – – – 71 – – – – – – – – – – -7.44 – Chile 266 -1.8 – 1.13 5.91 -1.45 1101 -1.18 16 4 96 37 23 55 52 39 0 77 58 46 221 -3.02 -1.09 30 China 343 -1.5 1.74 1.83 6.68 -1.91 1041 -1.12 15 4 91 34 8 84 – 54 100 75 83 8 831 -0.30 -2.80 69 Colombia 234 -1.0 1.36 1.11 5.94 -2.45 874 -1.38 15 5 91 38 28 57 37 38 0 58 59 13 386 -3.98 -2.70 16 Comoros 246 1.02 – – – – – – – – – 49 – – – – – – – – – – -5.70 – Congo (Brazz) 244 -2.6 – – – – – – – – – 73 – – – – – – – – – – -4.24 – Congo (Zaire) – – – – – – – – – – – 48 – – – – – – – – – – -4.70 – Cook Islands – – – – – – – – – – – – – – – – – – – – – – – – Costa Rica 329 -0.78 – 1.20 6.47 -2.80 1204 -1.21 – 9 91 36 33 54 – 46 – 59 70 10 211 -3.76 -1.90 – Cote d’Ivoire – – – – – – – – – – – 51 – – – – – – – – – – -7.15 – Croatia 346 – 0.38 1.25 6.60 -2.74 741 -1.45 14 15 94 26 4 65 54 54 – 72 72 2 355 -1.83 -0.45 40 Cuba – – – – – – – – – – – 19 – – – – – – – – – – -0.58 – Cyprus 561 0.40 – 1.68 5.76 -0.61 899 -1.12 15 12 78 21 – 64 42 18 0 43 63 – 351 -3.30 -0.57 56 Czech Republic 448 -1.3 0.94 1.83 6.15 -2.06 827 -0.02 11 5 92 24 5 65 51 54 100 95 90 4 201 -0.24 -0.01 92 Denmark 957 1.92 1.16 1.83 6.74 -3.13 847 -0.35 16 11 88 20 4 64 24 39 100 76 73 22 273 -2.15 0.86 99 Djibouti – – – – – – – – – – – – – – – – – – – – – – -7.18 – Dominica – – – – – – – – – – – 35 – – – – – – – – – – -1.34 – Dominican Repub 231 -2.9 – – – – – – – – – 49 – – – – – – – – – – -3.17 – East Timor – – – – – – – – – – – – – – – – – – – – – – – – Ecuador 273 -1.8 – – – – – – – – – 38 – – – – – – – – – – -1.90 – Egypt 272 -1.1 – – 6.20 -1.54 1278 -0.91 – 17 78 38 – 80 50 – – – 70 – 460 -0.20 -4.35 21 El Salvador – -2.4 – – 7.07 -3.48 893 -1.44 – 11 91 31 – 46 34 – – – 45 – 467 -6.90 -4.33 9 Equat. Guinea – – – – – – – – – – – 69 – – – – – – – – – – -2.88 – Eritrea – – – – – – – – – – – 54 – – – – – – – – – – -10.7 – Estonia 430 – – 1.71 6.88 -3.81 890 -1.37 15 13 87 24 6 57 31 56 – 82 81 1 416 -2.26 -0.05 194 Ethiopia – – – – – – – – – – – 47 – – – – – – – – – – -7.97 – Fiji 341 -0.96 – – – – – – – – – 37 – – – – – – – – – – -1.07 – Finland 819 0.15 1.15 1.53 6.75 -2.87 747 -0.56 16 6 89 18 3 64 30 39 100 62 86 4 190 -2.19 1.02 103 France 740 0.14 1.05 1.97 5.95 -1.56 812 0.16 15 19 83 25 34 62 51 44 50 52 79 14 280 -2.23 -0.43 77
39

Data tables
Gabon 352 -0.72 – – – – – – – – – 56 – – – – – – – – – – -5.48 – Gambia 246 0.22 – – – – – – – – – 39 – – – – – – – – – – -7.50 – Georgia – -3.0 – 1.36 6.07 -1.19 718 -1.32 – 5 95 23 – 61 48 52 – – 100 – 466 -0.52 -0.08 79 Germany 668 -0.49 1.69 1.86 6.10 -2.47 862 -0.31 10 19 82 25 19 69 43 40 35 48 74 4 291 -2.03 0.00 94 Ghana 232 -0.98 – – 6.20 -5.45 1051 -1.54 – 9 20 40 – 54 48 74 – – 41 – 364 -4.90 -4.64 24 Greece 438 -1.4 1.13 1.60 6.09 -0.43 742 -1.21 15 13 89 21 7 61 57 15 0 50 75 6 397 -2.62 -0.84 50 Greenland – – – – – – – – – – – 17 – – – – – – – – – – -0.01 – Grenada 277 -0.78 – – – – – – – – – 35 – – – – – – – – – – -2.01 – Guatemala – – – – – – – – – – – 38 – – – – – – – – – – -6.00 – Guinea-Bissau 245 0.59 – – – – – – – – – 28 – – – – – – – – – – -6.02 – Guinea – – – – – – – – – – – 50 – – – – – – – – – – -8.56 – Guyana 259 -0.57 – – – – – – – – – 40 – – – – – – – – – – -0.41 – Haiti 226 -2.3 – – – – – – – – – 36 – – – – – – – – – – -6.72 – Honduras 256 -1.0 – 1.09 – -2.92 1023 -1.34 – – 97 48 – 59 64 53 – – 57 – – -3.04 -4.50 5 Hong Kong 458 -1.6 2.34 1.91 6.00 -1.55 1013 -1.09 12 46 79 37 14 77 61 50 100 86 80 48 328 0.23 -0.83 49 Hungary 459 0.11 0.92 1.98 6.50 -2.64 753 1.21 10 4 93 25 10 63 44 56 100 89 81 10 391 -0.64 0.02 105 Iceland 841 0.02 0.75 1.96 6.16 -0.37 756 -0.14 16 6 84 21 2 67 20 39 50 84 78 85 255 -0.77 .14 119 India 244 -1.3 – – – -3.88 – -1.74 14 – – 65 – – – – – – – – – -4.48 -4.91 – Indonesia 253 -3.1 – 0.88 6.28 -2.04 972 -1.34 15 4 30 36 13 57 48 42 100 72 61 58 330 -2.28 -3.85 9 Iran 293 -1.1 – 0.79 6.28 -1.86 804 -1.43 14 1 58 30 – 64 43 44 100 46 59 – 340 -2.97 -3.68 30 Iraq – – – – – – – – – – – 33 – – – – – – – – – – -4.10 – Ireland 647 -0.11 1.26 1.12 5.45 -1.87 839 0.04 12 14 81 26 10 68 54 55 100 67 80 47 400 -0.78 0.63 89 Israel 559 1.61 0.82 1.76 6.04 -1.13 995 -1.10 15 31 80 29 4 57 47 60 100 76 72 11 315 -1.26 0.00 87 Italy 733 -0.52 1.13 1.88 5.90 -0.77 950 -0.31 14 9 80 20 16 63 61 45 100 48 62 5 406 -1.73 -1.50 65 Jamaica 282 -1.2 – – – – – – – – – 40 – – – – – – – – – – -1.43 – Japan 741 -0.91 1.44 1.98 5.97 -1.49 996 3.70 14 3 95 34 1 77 71 47 100 70 81 29 195 0.07 0.73 63 Jordan 314 0.11 – 0.93 5.82 -0.84 950 -1.25 16 25 88 34 8 66 52 56 100 46 66 16 311 -1.97 -0.96 38 Kazakhstan – -2.4 – 0.60 6.51 -2.52 838 -1.49 – 18 80 22 2 79 59 59 – 56 73 1 512 -1.68 -0.34 36 Kenya 270 1.87 – – – – – – – – – 38 – – – – – – – – – – -4.78 – Kiribati – – – – – – – – – – – 41 – – – – – – – – – – -1.34 – Korea-North – – – – – – – – – – – 18 – – – – – – – – – – -0.68 – Korea-South 485 -0.69 2.01 1.78 5.93 -1.38 977 2.12 14 6 94 38 2 77 82 55 100 62 84 54 192 0.48 0.60 104 Kuwait 705 0.18 – 1.21 5.94 -1.38 902 -1.26 – 21 71 28 – 49 42 39 0 48 71 – 331 -3.84 -1.62 47 Kyrgyzstan 30 – 1.02 0.52 6.72 -2.69 912 -1.48 15 9 – 22 5 77 – 64 – 65 – 3 – -1.94 -0.41 –
40

Appendix
Laos – – – – – – – – – – – 39 – – – – – – – – – – -5.80 – Latvia – 0.11 – 1.40 6.82 -3.05 779 0.41 15 13 82 21 9 60 49 48 50 86 65 1 406 -2.48 -0.08 106 Lebanon – -2.4 – – 6.20 -1.99 930 -1.24 – 11 14 27 – 86 43 76 – – 63 – 381 0.32 -1.02 37 Lesotho 317 5.27 – – – – – – – – – 55 – – – – – – – – – – -4.92 – Liberia – – – – – – – – – – – 36 – – – – – – – – – – -6.98 – Libya – – – – – – – – – – – 19 – – – – – – – – – – -3.18 – Liechtenstein – – – 1.91 6.29 -3.18 992 -0.22 11 35 79 15 20 73 – 62 – 72 68 6 215 -1.19 -0.01 – Lithuania – 0.11 – 1.29 6.76 -3.00 789 -1.44 14 5 91 22 4 63 50 49 100 87 77 0 386 -1.66 -0.08 51 Luxembourg 1337 0.00 1.18 1.46 6.00 -3.62 807 -0.16 12 47 15 18 33 65 56 45 – 54 68 14 254 -2.71 -1.98 90 Macau – – 1.23 1.80 6.09 -2.73 1155 -1.13 12 79 78 36 37 69 – 28 – 100 83 96 366 -0.59 -1.41 – Macedonia – -1.6 – 1.00 6.75 -2.60 741 -1.48 15 8 86 30 – 63 58 42 0 80 72 1 459 -2.82 -1.46 35 Madagascar 232 -1.4 – – – – – – – – – 46 – – – – – – – – – – -4.34 – Malawi 278 6.75 – – – – – – – – – 66 – – – – – – – – – – -6.58 – Malaysia 381 0.15 – 1.17 6.78 -1.36 937 -1.25 15 5 51 31 0 60 50 40 100 55 73 0 354 -2.12 -1.89 25 Maldives – – – – – – – – – – – – – – – – – – – – – – -0.92 – Mali 297 9.50 – – – – – – – – – 60 – – – – – – – – – – -8.25 – Malta 386 -0.85 – 1.52 4.89 -0.51 885 -1.15 11 13 16 21 – 69 52 41 – – 68 – 386 -0.81 -1.35 76 Mariana Islands – – – – – – – – – – – – – – – – – – – – – – – – Marshall Islands – – – – – – – – – – – – – – – – – – – – – – – – Mauritania 332 8.26 – – – – – – – – – 53 – – – – – – – – – – -7.51 – Mauritius 359 -1.1 – – – – – – – – – 30 – – – – – – – – – – -2.78 – Mexico 248 -2.5 – 1.58 6.03 -1.98 789 0.22 12 5 89 43 19 65 – 29 – 66 48 15 331 -2.84 -2.07 – Micronesia – – – – – – – – – – – – – – – – – – – – – – -3.12 – Moldova – -0.57 – 1.62 6.59 -2.90 860 -1.33 – 15 84 24 – 50 36 99 100 – 47 – 551 -2.30 -0.45 35 Mongolia – -0.23 – – 7.61 -3.48 – -1.64 – – – 34 – – – – – – – – – – -2.29 – Montenegro – – 1.34 1.03 6.57 -2.65 595 -1.56 14 14 92 30 6 68 – 43 – 72 80 1 260 -2.07 – – Morocco 368 2.15 – 1.15 6.38 -2.89 1004 -1.33 – 10 54 32 – 47 50 37 100 – 56 – 383 -4.01 -6.34 19 Mozambique 277 3.17 – – 7.00 – 772 -1.44 – – 69 59 – – – – – – – – 252 – -7.81 19 Namibia – – – – – – – – – – – 42 – – – – – – – – – – -3.24 – Nepal – – – – – – – – – – – 46 – – – – 100 – – – – – -7.74 – Nether Antilles – – – – – – – – – – – 30 – – – – – – – – – – -0.84 – Netherlands 757 -0.25 1.35 1.72 5.69 -1.81 893 -1.21 12 15 85 26 25 67 33 59 100 93 61 74 232 -0.85 0.49 80 New Caledonia – – – – – – – – – – – – – – – – – – – – – – -5.62 – New Zealand 538 0.36 1.42 1.64 5.14 0.20 888 -0.10 16 29 77 27 5 61 21 66 100 85 76 6 252 -1.13 1.66 116
41

Data tables
Nicaragua 282 0.29 – – – – – – – – – 45 – – – – – – – – – – -4.16 – Niger – – – – – – – – – – – 44 – – – – – – – – – – -9.16 – Nigeria 392 12.2 – – – -2.72 – -1.47 – – – 47 – – – – – – – – – – -6.01 – Norway 1043 1.51 0.66 1.80 5.97 -0.62 749 -0.40 16 10 85 21 1 66 43 42 65 67 74 1 273 -1.56 1.17 116 Oman 491 -0.64 – 0.85 5.98 -0.96 955 -1.27 – 13 84 31 – 64 48 37 – – 67 – 308 -2.69 -5.72 50 Pakistan 238 -1.9 – – – – – – – – – 42 – – – – – – – – – – -6.78 – Palestine – 6.20 – – 5.66 -0.82 852 -1.17 – 12 89 38 – 57 53 67 – – 65 – 358 -1.22 – 27 Panama 307 -1.1 – 1.08 5.70 -1.97 741 -1.42 – 9 – 31 30 65 – 14 – 58 – 17 – -3.88 -0.11 – Papua N-Guinea – – – – – – – – – – – 43 – – – – – – – – – – -5.79 – Paraguay 229 -3.0 – – – – – – – – – 31 – – – – – – – – – – -2.79 – Peru 246 -2.5 0.97 1.41 5.98 -1.26 944 -1.20 15 4 86 33 27 60 – 16 – 69 72 15 327 -3.10 -1.56 – Philippines 233 -2.4 – – 6.42 -2.02 1140 -1.07 – – – 50 – 53 49 – 0 – 73 – – -3.53 -0.34 21 Poland 391 0.44 0.96 1.26 6.30 -1.91 778 0.67 15 2 95 24 6 63 64 42 – 81 95 3 367 -1.23 0.56 64 Portugal 516 -0.65 1.55 1.48 6.01 -1.71 832 -0.11 15 9 92 21 36 65 51 38 0 49 71 8 261 -3.15 -2.90 53 Puerto Rico – – – – – – – – – – – 32 – – – – – – – – – – -1.38 – Qatar – -2.5 0.50 0.95 5.98 -0.83 961 -1.24 15 51 55 27 16 55 53 51 – 60 75 28 282 -2.19 -2.76 67 Romania 244 -2.4 – 1.76 6.77 -3.22 704 -1.42 15 3 92 25 5 64 54 43 50 49 74 1 508 -2.39 -0.45 46 Russia 175 -0.56 – 1.63 6.47 -2.30 791 0.49 14 14 84 23 4 65 57 64 100 82 87 0 543 -0.67 -0.28 74 Rwanda 270 2.59 – – – – – – – – – 61 – – – – – – – – – – -6.74 – Saint Helena – – – – – – – – – – – – – – – – – – – – – – – – Saint Lucia – – – – – – – – – – – 35 – – – – – – – – – – -2.41 – Samoa-West 249 -2.1 – – – – – – – – – 38 – – – – – – – – – – -0.01 – Sao Tome/Princi – – – – – – – – – – – 47 – – – – – – – – – – -6.12 – Saudi Arabia – 1.91 – 0.55 5.66 -1.17 942 -1.34 – 17 83 29 – 61 52 52 – – 65 – 282 -2.78 -5.28 42 Senegal 282 1.29 – – – – – – – – – 62 – – – – – – – – – – -7.47 – Serbia 432 -0.52 – 1.21 6.91 -3.10 761 -1.47 14 18 91 25 5 58 61 40 – 76 51 1 294 -2.90 -0.98 33 Seychelles 524 3.86 – – – – – – – – – 24 – – – – – – – – – – -2.12 – Sierra Leone 234 -1.7 – – – – – – – – – 36 – – – – – – – – – – -7.69 – Singapore 457 -1.3 1.67 1.88 6.45 -1.67 1195 -1.01 10 22 33 36 6 72 55 64 100 60 76 2 443 -0.31 -1.11 71 Slovakia 322 -1.4 – 1.75 6.13 -1.87 811 -1.26 10 4 85 24 5 62 50 51 100 87 90 10 294 -0.36 -0.01 59 Slovenia 779 -0.63 1.18 1.54 6.46 -0.98 730 -1.27 14 13 84 23 5 63 55 41 100 78 72 1 265 -1.34 -0.01 63 Solomon Islands – – – – – – – – – – – 34 – – – – – – – – – – -6.13 – Somalia – – – – – – – – – – – 28 – – – – – – – – – – -8.74 – South Africa – -0.57 – 1.30 6.77 -4.33 1052 -1.39 16 21 44 47 – 50 38 41 100 – 67 – 400 -4.02 -3.22 27
42

Appendix
Spain 584 -1.6 1.49 1.82 5.85 -1.30 852 0.46 16 11 71 25 36 66 53 45 0 55 76 30 366 -2.35 -1.24 79 Sri Lanka 258 -1.8 – – – – – – – – – 37 – – – – – – – – – – -1.78 – St. Kitts & Nevis – – – – – – – – – – – 28 – – – – – – – – – – -1.22 – St. Vincent/Gre – – – – – – – – – – – 29 – – – – – – – – – – -0.54 – Sudan 276 1.37 – – – – – – – – – 43 – – – – – – – – – – -6.97 – Suriname 454 2.31 – – – – – – – – – 27 – – – – – – – – – – -1.10 – Swaziland 310 0.05 – – – – – – – – – 39 – – – – – – – – – – -3.83 – Sweden 1042 1.75 0.92 1.65 6.82 -2.90 794 -0.53 16 17 81 22 4 64 41 45 50 91 75 8 203 -2.00 0.29 120 Switzerland 1144 0.65 1.58 1.64 6.49 -2.20 856 -0.39 12 30 75 19 19 70 40 31 0 76 65 6 231 -2.50 -0.80 80 Syria 288 -2.0 – – 5.98 -0.64 663 -1.30 – 11 85 32 – 49 46 46 – – 47 – 402 -3.70 -2.69 19 Taiwan 258 -1.6 1.55 1.71 6.60 -1.51 1039 -1.11 14 4 69 37 2 76 80 53 100 79 79 31 326 0.21 -0.66 80 Tajikistan – – – – – – – – – – – 23 – – – – – – – – – – -0.32 – Tanzania – – – – – – – – – – – 42 – – – – – – – – – – -6.08 – Thailand 391 -1.0 2.19 1.79 6.07 -1.62 1106 -1.07 16 3 58 37 4 67 46 59 100 74 76 20 376 -0.98 -2.73 17 Tibet – – – – – – – – – – – – – – – – – – – – – – – – Togo 247 0.71 – – – – – – – – – 57 – – – – – – – – – – -6.11 – Tonga – – – – – – – – – – – 31 – – – – – – – – – – -0.97 – Trinidad Tobago 549 0.14 – 1.46 5.17 -1.64 971 -1.20 – 11 96 27 28 57 58 55 – 55 60 9 388 -2.70 -0.77 67 Tunisia 344 1.06 – 0.81 5.85 -2.12 915 -1.39 16 5 67 29 45 50 36 26 100 44 61 2 317 -4.65 -4.70 21 Turkey 208 -1.5 – 0.57 6.44 -1.37 814 -1.42 11 3 85 34 13 57 67 43 100 42 74 1 290 -2.25 -3.36 30 Turkmenistan – – – – – – – – – – – 20 – – – – – – – – – – -0.32 – Uganda – – – – – – – – – – – 43 – – – – – – – – – – -6.14 – Ukraine – 0.84 – – 7.07 -1.44 732 -1.34 10 17 68 25 – 65 47 69 – – 67 – 437 -0.33 -0.22 59 United Arab Emi – – – 1.20 5.76 -0.70 990 -1.17 15 73 56 26 12 64 48 53 – 88 77 55 345 -0.85 -2.78 55 United Kingdom 816 0 1.28 1.34 5.07 0 914 0 11 15 85 27 3 67 32 66 100 99 82 18 271 0 0 102 United States 1043 0.57 – 1.35 6.04 -1.27 913 -0.14 13 23 77 26 14 61 46 62 70 83 84 6 320 -1.17 1.74 86 Uruguay 299 -1.9 – 1.54 5.90 -2.19 772 -1.34 12 3 90 28 41 59 – 19 – 47 29 16 309 -4.69 -1.40 – Uzbekistan – – – – – – – – – – – 19 – – – – – – – – – – -0.38 – Vanuatu 327 1.91 – – – – – – – – – 35 – – – – – – – – – – -6.29 – Venezuela 335 -0.68 – – – -3.41 – -1.63 – – – 30 – – – – – – – – 300 – -2.25 – Vietnam – – – 1.53 6.11 -1.20 861 -1.22 15 3 90 34 8 83 – 66 – 57 71 4 351 -0.77 -0.85 – Yemen – – – – 6.20 -3.88 919 -1.47 – 20 88 51 – 48 44 – – – 51 – 462 -6.20 -7.68 15 Zambia 255 1.00 – – – – – – – – – 46 – – – – – – – – – – -4.24 – Zimbabwe 292 1.06 – – – -3.13 – -1.56 – – – 48 – – – – – – – – – – -3.55 –
43

Data tables
Country EEa EEr TSr Kig SEA YHG AIn AEd Trac Mi% LanI CS RR Disc DirI AchT CenE SAut TeQa Priv Hom SQM AdE Book Mean 423 0.08 1.25 1.41 6.20 -2.01 888 -0.88 14 15 77 35 14 63 49 47 69 68 70 16 340 -2.15 -2.90 59 Standard Deviat. 246 2.50 0.41 0.39 0.49 1.02 129 0.83 2 14 20 13 12 8 11 15 42 15 13 21 98 1.49 2.84 36 Number countries 116 127 40 82 96 100 96 101 72 93 92 189 68 95 80 88 54 72 92 68 91 96 192 85
Notes: Eea: Education expenditures (absolute, cumulati e per student aged 6 to 15, in 100 US$); EEr: Education expen ditures (relati e to GDP/c, UK M=0, “First World” SD=1); TSr: Teacher salary (relati e to GDP/c); Kig: Kindergar ten (roughly in years); SEA: Young school enrolment (here presented as age, not in erted); YHG: Young in high grade (UK M=0, “First World” SD=1); AIn: Amount of instruction (roughly in hours per year); AEd: Amount of edu cation (UK M=0, “First World” SD=1); Trac: Tracking at a young age (here as age, not in erted); Mi%: Share of mi grants; LanI: Language identical; CS: Class size/pupilteacher ratio; RR: Repetition rate (percentage); Disc: Disci pline (roughly percentage of disciplined pupils); DirI: Direct instruction (percentage of pupils in e ery lesson re cei ing direct instruction); AchT: Use of achie ement tests (roughly percentage of pupils for whom achie ement tests are considered for admission); CenE: Central exams and tests (percentage of pupils); SAut: School autonomy (percentage of pupils whose schools can decide e.g. on teacher recruitment); TeQa: Teacher quality (roughly per centage of teachers ha ing uni ersity degree); Pri : Pri ate schools (percentage); Hom: Homework (roughly minutes per week); SQM: School quality mean (UK M=0, “First World” SD=1); AdE: Adult education mean (UK M=0, “First World” SD=1); Book: Number of books. Data compiled 28. September 2014.
44

SSSooocicicieeetttyyy aaattttttririribbbuuuttteeesss::: BBBaaackckckgggrororouuunnnddd fffaaactctctooorsrsrs
Appendix
Society attributes: Background factors
Data are presented for culture (indicator religions weighted for education, ra tionality, thinking and meritoric orientations, see Section 10.8) and e olution (indicators skin lightness, cranial capacity and Gfactor of e olution not includ ing consanguinity; see Section 10.7).
Table A.4: Culture and e olution (global background factors) Country Culture
(weighted religion)
Skin lightness
Cranial capacity
G factor evolution
Afghanistan −39.60 25.54 1355.00 0.649 Albania −19.00 28.00 1325.00 0.469 Algeria −39.60 26.79 1325.00 0.369 Andorra 46.40 29.50 1350.00 0.913 Angola −13.00 12.40 1275.00 −1.461 Antigua-Barbuda 35.00 14.36 1295.59 −1.035 Argentina 49.60 27.81 1350.77 0.782 Armenia 17.20 28.00 1325.00 0.469 Australia 67.00 29.78 1348.66 0.919 Austria 41.50 31.00 1330.00 0.782 Azerbaijan −36.20 26.20 1325.00 0.320 Bahamas 51.50 14.28 1294.74 −1.054 Bahrain −32.00 22.00 1325.00 −0.028 Bangladesh −39.60 19.00 1323.68 −0.293 Barbados 59.00 13.77 1293.00 −1.118 Belarus 16.00 31.00 1375.00 1.356 Belgium 50.00 29.68 1375.00 1.247 Belize 52.50 21.36 1177.65 −1.962 Benin (Dahomey) −71.50 13.00 1350.00 −0.454 Bermuda 55.80 19.75 1312.78 −0.370 Bhutan 5.00 19.00 1375.00 0.362 Bolivia 20.00 23.31 1339.09 0.260 Bosnia −2.70 28.00 1325.00 0.469 Botswana −28.50 16.33 1305.00 −0.752 Brazil 20.00 24.89 1332.79 0.311 Brunei −34.20 22.00 1325.00 −0.028 Bulgaria 12.00 28.00 1325.00 0.469 Burkina Faso −57.00 13.36 1325.00 −0.743 Burma (Myanmar) 17.40 25.00 1315.00 0.093 Burundi −9.00 13.00 1275.00 −1.411 Cambodia 7.30 21.68 1225.00 −1.331 Cameroon −42.50 10.95 1280.00 −1.518 Canada 53.00 30.31 1353.70 1.027 Cape Verde −20.00 – – –
45

Data tables
Central Afric R −11.00 13.60 1285.00 −1.234 Chad −44.00 11.07 1320.00 −0.997 Chile 50.00 27.54 1353.20 0.791 China 51.00 26.70 1421.93 1.599 Colombia 39.00 24.46 1336.75 0.326 Comoros −44.00 – – – Congo (Brazz) −33.00 13.03 1275.00 −1.409 Congo (Zaire) −4.00 13.25 1275.00 −1.391 Cook Islands 72.70 28.00 – – Costa Rica 43.50 26.01 1341.34 0.513 Cote d’Ivoire −39.60 13.60 1277.50 −1.330 Croatia 40.70 28.00 1325.00 0.469 Cuba 23.00 25.87 1342.18 0.512 Cyprus 8.40 28.00 – – Czech Republic 25.10 31.00 1325.00 0.718 Denmark 87.00 31.00 1375.00 1.356 Djibouti −39.50 14.03 1275.00 −1.326 Dominica 27.50 14.25 1256.01 −1.550 Dominican Repub 30.00 21.55 1322.14 −0.102 East Timor 50.50 19.00 1325.00 −0.276 Ecuador 20.00 23.96 1337.27 0.292 Egypt −34.20 22.50 1370.00 0.588 El Salvador 40.00 25.51 1342.09 0.481 Equat. Guinea −10.00 13.00 1275.00 −1.411 Eritrea −16.00 16.00 1275.00 −1.163 Estonia 51.00 31.00 1375.00 1.356 Ethiopia −31.00 14.56 1272.25 −1.317 Fiji 11.10 23.59 1308.89 −0.102 Finland 85.00 31.00 1375.00 1.356 France 42.00 31.00 1360.00 1.165 Gabon −23.00 13.30 1275.00 −1.387 Gambia −47.70 10.00 1325.00 −1.021 Georgia 12.20 28.00 1325.00 0.469 Germany 47.30 30.56 1362.50 1.160 Ghana −50.80 12.85 1280.00 −1.360 Greece 18.80 28.00 1325.00 0.469 Greenland 70.00 – – – Grenada 28.50 14.38 1295.35 −1.038 Guatemala 50.00 25.09 1334.58 0.350 Guinea-Bissau −66.50 10.00 1325.00 −1.021 Guinea −51.50 11.50 1325.00 −0.897 Guyana −21.00 17.02 1263.23 −1.229 Haiti −20.00 13.84 – – Honduras 44.00 24.71 1339.09 0.377 Hong Kong 75.00 28.00 1425.00 1.746 Hungary 59.00 30.40 1325.00 0.668
46

Appendix
Iceland 93.00 31.00 – – India −37.60 18.79 1208.75 −1.778 Indonesia −38.30 20.73 1325.00 −0.133 Iran −39.60 24.58 1325.00 0.186 Iraq −39.30 24.86 1325.00 0.209 Ireland 49.00 30.08 1325.00 0.642 Israel 58.20 26.07 1340.54 0.508 Italy 49.00 29.50 1325.00 0.594 Jamaica 27.50 13.79 1292.48 −1.122 Japan 62.50 26.30 1325.00 0.329 Jordan −34.60 23.82 1325.00 0.123 Kazakhstan −8.00 28.00 1375.00 1.108 Kenya 18.00 14.24 1269.00 −1.385 Kiribati 28.50 27.72 – – Korea-North 38.90 28.00 1425.00 1.746 Korea-South 27.30 28.00 1425.00 1.746 Kuwait −40.00 22.00 1325.00 −0.028 Kyrgyzstan −31.00 27.01 1375.00 1.026 Laos −28.00 19.60 1307.50 −0.450 Latvia 40.00 31.00 1375.00 1.356 Lebanon −19.00 24.03 1325.00 0.140 Lesotho −9.00 13.00 1325.00 −0.773 Liberia −36.00 12.94 1275.00 −1.416 Libya −31.40 21.36 1325.00 −0.081 Liechtenstein 47.00 31.00 1375.00 1.356 Lithuania 41.50 31.00 1375.00 1.356 Luxembourg 48.30 31.00 1375.00 1.356 Macau 45.50 28.00 1425.00 1.746 Macedonia 1.40 28.00 1325.00 0.469 Madagascar −42.50 15.70 – – Malawi 14.50 12.23 1275.00 −1.475 Malaysia −29.60 21.70 1257.08 −0.920 Maldives −38.00 – – – Mali −49.00 14.61 1325.00 −0.640 Malta 49.00 – – – Mariana Islands 20.00 22.97 – – Marshall Islands 0.00 25.00 – – Mauritania −44.80 19.15 1325.00 −0.264 Mauritius −19.60 – – – Mexico 39.50 24.46 1346.89 0.456 Micronesia 5.00 28.00 1370.00 1.044 Moldova 19.60 29.01 1325.00 0.553 Mongolia 22.40 28.00 1462.50 20.225 Montenegro 9.50 28.00 1325.00 0.469 Morocco −38.10 25.57 1325.00 0.268 Mozambique −49.00 10.47 1275.00 −1.621
47

Data tables
Namibia 9.00 12.86 1322.50 −0.816 Nepal −34.40 20.71 1375.00 0.504 Nether Antilles 26.00 – – – Netherlands 34.50 30.67 1375.00 1.329 New Caledonia 32.50 21.49 1365.43 0.446 New Zealand 65.50 29.41 1355.08 0.970 Nicaragua 45.00 24.36 1335.10 0.296 Niger −51.50 16.00 1325.00 −0.525 Nigeria −37.50 12.42 1300.00 −1.140 Norway 86.00 31.00 1375.00 1.356 Oman −40.00 19.45 1325.00 −0.239 Pakistan −38.60 23.85 1356.98 0.534 Palestine −32.80 25.00 1325.00 0.221 Panama 47.50 24.80 1348.79 0.508 Papua N-Guinea −35.00 15.38 1325.00 −0.576 Paraguay 40.00 25.15 1341.13 0.439 Peru 26.00 24.21 1335.02 0.283 Philippines 29.60 23.07 – – Poland 48.70 31.00 1365.00 1.228 Portugal 46.60 28.00 1340.33 0.665 Puerto Rico 35.00 25.58 1223.81 −1.023 Qatar −39.10 22.00 1325.00 −0.028 Romania 27.40 28.60 1325.00 0.519 Russia 7.10 27.12 1387.50 1.194 Rwanda 21.60 13.00 1275.00 −1.411 Saint Helena – – – – Saint Lucia 45.50 14.24 1292.74 −1.082 Samoa-West 53.00 25.03 1374.89 0.860 Sao Tome/Princi 20.00 – – – Saudi Arabia −40.00 22.39 1325.00 0.005 Senegal −47.60 10.53 1325.00 −0.978 Serbia 9.50 28.00 1325.00 0.469 Seychelles 41.50 – 1341.13 – Sierra Leone −51.00 13.00 1300.00 −1.092 Singapore 30.90 26.03 1378.97 0.995 Slovakia 38.80 31.00 1325.00 0.718 Slovenia 37.70 31.00 1325.00 0.718 Solomon Islands 29.50 – – – Somalia −43.40 13.00 1275.00 −1.411 South Africa −14.00 17.67 1298.68 −0.722 Spain 46.20 28.96 1340.33 0.744 Sri Lanka 7.60 13.00 1225.00 −20.050 St. Kitts & Nevis 27.50 13.26 1291.34 −1.181 St. Vincent/Gre 61.50 15.87 1267.77 −1.266 Sudan −51.50 14.23 1287.50 −1.150 Suriname −4.40 19.25 1279.96 −0.831
48

Appendix
Swaziland −22.50 14.24 1275.00 −1.309 Sweden 86.60 31.00 1375.00 1.356 Switzerland 63.00 31.00 1350.00 1.037 Syria −33.00 26.21 1325.00 0.321 Taiwan 72.90 25.00 1425.00 1.498 Tajikistan −34.00 26.50 1375.00 0.984 Tanzania −27.00 12.31 1275.00 −1.468 Thailand 8.00 22.00 1265.00 −0.794 Tibet −16.00 25.75 1385.00 1.049 Togo −55.10 13.00 1290.00 −1.220 Tonga −12.00 25.00 1375.00 0.859 Trinidad Tobago 7.00 15.11 1249.33 −1.564 Tunisia −38.90 26.28 1325.00 0.327 Turkey −39.30 27.25 1325.00 0.407 Turkmenistan −33.80 27.70 1330.00 0.508 Uganda 7.60 11.50 1257.50 −1.759 Ukraine 18.00 29.01 1350.00 0.872 United Arab Emi −38.50 22.00 1325.00 −0.028 United Kingdom 65.50 30.13 1325.00 0.645 United States 69.40 28.30 1342.33 0.715 Uruguay 35.60 27.18 1346.94 0.682 Uzbekistan −33.40 28.00 1371.25 1.060 Vanuatu 12.50 13.00 1375.00 −0.134 Venezuela 43.00 – – – Vietnam 26.00 23.79 1285.00 −0.390 Yemen −39.60 16.30 1325.00 −0.500 Zambia −20.00 12.40 1275.00 −1.461 Zimbabwe −63.60 13.00 1275.00 −1.411 Country Culture
(weighted religion)
Skin lightness
Cranial capacity
G factor evolution
Mean 7.46 22.31 1325.62 −0.002 Standard Deviat. 39.96 6.63 43.09 0.991 Number countries 199 188 180 179
Notes: Variables and sources explained in Sections 10.7 and 10.8.
49

FFFuuutttuuurerere cococogggnnniiitttiii eee aaabbbiiillliiitttyyy eeessstttiiimmmaaattteeesss
Data tables
Future cogniti e ability estimates
Table A.5: Estimates of future cogniti e ability and effects Country Cogn.
ability 2100
Asymmetry effect
Migration effect
Environ. improv.
effect
Diff. 2100-2010
IQ gain per decade (‘10−100)
Afghanistan 86.70 −5.13 −0.12 20.67 15.42 1.71 Albania 92.60 −5.13 −0.75 15.87 9.99 1.11 Algeria 90.73 −5.13 −1.27 12.63 6.23 0.69 Angola 80.46 −5.13 −1.56 20.02 13.33 1.48 Argentina 95.24 −5.13 −0.88 13.82 7.81 0.87 Armenia 96.80 −5.13 0.36 11.92 7.14 0.79 Australia 99.23 −5.13 0.17 5.24 0.27 0.03 Austria 93.22 −5.13 −5.10 4.87 −5.37 −0.60 Azerbaijan 91.24 −5.13 0.12 8.18 3.17 0.35 Bahrain 89.77 −5.13 −0.25 8.81 3.43 0.38 Bangladesh 88.61 −5.13 −0.12 14.15 8.90 0.99 Belarus 96.33 −5.13 −1.10 6.61 0.38 0.04 Belgium 94.00 −5.13 −4.01 4.34 −4.80 −0.53 Benin (Dahomey) 80.20 −5.13 −1.56 20.88 14.19 1.58 Bolivia 88.63 −5.13 −0.80 11.78 5.86 0.65 Bosnia 95.87 −5.13 −0.39 9.69 4.17 0.46 Botswana 88.51 −5.13 −1.01 21.69 15.55 1.73 Brazil 93.02 −5.13 −0.89 14.13 8.11 0.90 Bulgaria 93.73 −5.13 −1.46 6.92 0.33 0.04 Burkina Faso 80.17 −5.13 −1.56 21.01 14.32 1.59 Burma (Myanmar) 89.83 −5.13 −0.12 13.40 8.15 0.91 Burundi 81.07 −5.13 −1.56 17.90 11.21 1.25 Cambodia 89.27 −5.13 −0.63 10.17 4.41 0.49 Cameroon 80.46 −5.13 −1.56 20.00 13.31 1.48 Canada 98.36 −5.13 −0.63 3.55 −2.20 −0.24 Cape Verde 81.63 −5.13 −1.56 16.00 9.31 1.03 Central Afric R 79.30 −5.13 −1.56 23.96 17.27 1.92 Chad 79.81 −5.13 −1.56 22.23 15.54 1.73 Chile 93.12 −5.13 −0.85 10.32 4.35 0.48 China 101.16 −5.13 −1.19 6.71 0.39 0.04 Colombia 91.96 −5.13 −1.77 16.91 10.01 1.11 Comoros 81.10 −5.13 −1.56 17.81 11.13 1.24 Congo (Brazz) 81.42 −5.13 −1.56 16.72 10.03 1.11 Congo (Zaire) 80.42 −5.13 −1.56 20.13 13.44 1.49 Costa Rica 91.72 −5.13 −0.98 10.63 4.53 0.50 Cote d'Ivoire 80.10 −5.13 −1.56 21.24 14.56 1.62 Croatia 95.32 −5.13 −2.23 5.55 −1.80 −0.20 Cuba 88.88 −5.13 −0.80 10.94 5.01 0.56
50
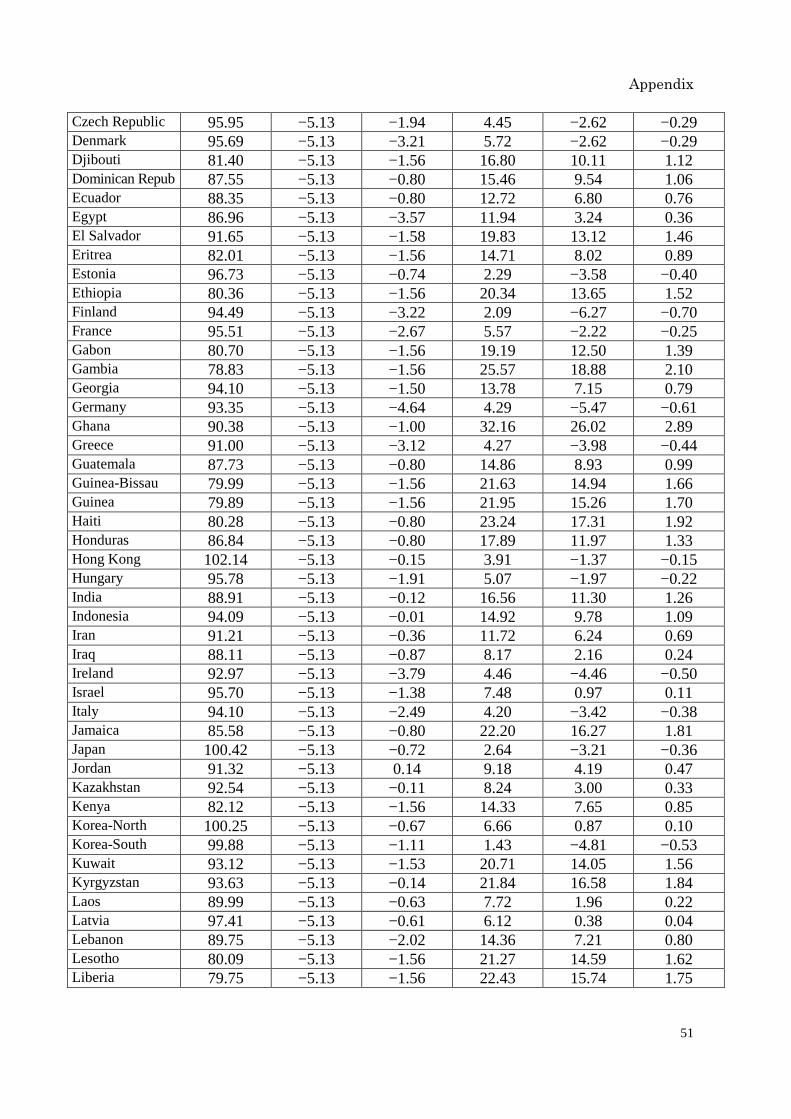
Appendix
Czech Republic 95.95 −5.13 −1.94 4.45 −2.62 −0.29 Denmark 95.69 −5.13 −3.21 5.72 −2.62 −0.29 Djibouti 81.40 −5.13 −1.56 16.80 10.11 1.12 Dominican Repub 87.55 −5.13 −0.80 15.46 9.54 1.06 Ecuador 88.35 −5.13 −0.80 12.72 6.80 0.76 Egypt 86.96 −5.13 −3.57 11.94 3.24 0.36 El Salvador 91.65 −5.13 −1.58 19.83 13.12 1.46 Eritrea 82.01 −5.13 −1.56 14.71 8.02 0.89 Estonia 96.73 −5.13 −0.74 2.29 −3.58 −0.40 Ethiopia 80.36 −5.13 −1.56 20.34 13.65 1.52 Finland 94.49 −5.13 −3.22 2.09 −6.27 −0.70 France 95.51 −5.13 −2.67 5.57 −2.22 −0.25 Gabon 80.70 −5.13 −1.56 19.19 12.50 1.39 Gambia 78.83 −5.13 −1.56 25.57 18.88 2.10 Georgia 94.10 −5.13 −1.50 13.78 7.15 0.79 Germany 93.35 −5.13 −4.64 4.29 −5.47 −0.61 Ghana 90.38 −5.13 −1.00 32.16 26.02 2.89 Greece 91.00 −5.13 −3.12 4.27 −3.98 −0.44 Guatemala 87.73 −5.13 −0.80 14.86 8.93 0.99 Guinea-Bissau 79.99 −5.13 −1.56 21.63 14.94 1.66 Guinea 79.89 −5.13 −1.56 21.95 15.26 1.70 Haiti 80.28 −5.13 −0.80 23.24 17.31 1.92 Honduras 86.84 −5.13 −0.80 17.89 11.97 1.33 Hong Kong 102.14 −5.13 −0.15 3.91 −1.37 −0.15 Hungary 95.78 −5.13 −1.91 5.07 −1.97 −0.22 India 88.91 −5.13 −0.12 16.56 11.30 1.26 Indonesia 94.09 −5.13 −0.01 14.92 9.78 1.09 Iran 91.21 −5.13 −0.36 11.72 6.24 0.69 Iraq 88.11 −5.13 −0.87 8.17 2.16 0.24 Ireland 92.97 −5.13 −3.79 4.46 −4.46 −0.50 Israel 95.70 −5.13 −1.38 7.48 0.97 0.11 Italy 94.10 −5.13 −2.49 4.20 −3.42 −0.38 Jamaica 85.58 −5.13 −0.80 22.20 16.27 1.81 Japan 100.42 −5.13 −0.72 2.64 −3.21 −0.36 Jordan 91.32 −5.13 0.14 9.18 4.19 0.47 Kazakhstan 92.54 −5.13 −0.11 8.24 3.00 0.33 Kenya 82.12 −5.13 −1.56 14.33 7.65 0.85 Korea-North 100.25 −5.13 −0.67 6.66 0.87 0.10 Korea-South 99.88 −5.13 −1.11 1.43 −4.81 −0.53 Kuwait 93.12 −5.13 −1.53 20.71 14.05 1.56 Kyrgyzstan 93.63 −5.13 −0.14 21.84 16.58 1.84 Laos 89.99 −5.13 −0.63 7.72 1.96 0.22 Latvia 97.41 −5.13 −0.61 6.12 0.38 0.04 Lebanon 89.75 −5.13 −2.02 14.36 7.21 0.80 Lesotho 80.09 −5.13 −1.56 21.27 14.59 1.62 Liberia 79.75 −5.13 −1.56 22.43 15.74 1.75
51

Data tables
Libya 87.64 −5.13 −0.87 9.78 3.77 0.42 Lithuania 97.05 −5.13 −0.03 7.49 2.33 0.26 Macedonia 97.25 −5.13 −0.10 16.38 11.15 1.24 Madagascar 82.59 −5.13 −1.56 12.72 6.03 0.67 Malawi 79.03 −5.13 −1.56 24.90 18.21 2.02 Malaysia 91.36 −5.13 −1.26 8.08 1.69 0.19 Mali 80.89 −5.13 −1.56 18.52 11.83 1.31 Mauritania 81.97 −5.13 −1.56 14.86 8.17 0.91 Mauritius 84.63 −5.13 −1.56 5.75 −0.94 −0.10 Mexico 93.57 −5.13 −0.32 13.14 7.70 0.86 Moldova 96.16 −5.13 −0.31 11.12 5.68 0.63 Mongolia 92.91 −5.13 −0.67 7.85 2.05 0.23 Montenegro 94.83 −5.13 −0.31 11.82 6.38 0.71 Morocco 94.01 −5.13 −2.83 26.01 18.05 2.01 Mozambique 82.59 −5.13 −1.56 12.72 6.04 0.67 Namibia 80.59 −5.13 −1.56 19.56 12.87 1.43 Nepal 88.68 −5.13 −0.12 17.34 12.09 1.34 Netherlands 93.50 −5.13 −4.42 2.47 −7.08 −0.79 New Zealand 98.65 −5.13 −0.51 5.12 −0.51 −0.06 Nicaragua 88.13 −5.13 −0.80 13.49 7.56 0.84 Niger 80.11 −5.13 −1.56 21.18 14.50 1.61 Nigeria 82.18 −5.13 −1.56 14.14 7.45 0.83 Norway 97.49 −5.13 −2.36 7.08 −0.42 −0.05 Oman 89.95 −5.13 −3.49 18.48 9.85 1.09 Pakistan 89.31 −5.13 −0.12 11.74 6.49 0.72 Palestine 92.33 −5.13 −0.42 14.46 8.91 0.99 Panama 92.27 −5.13 −0.71 16.60 10.76 1.20 Paraguay 88.39 −5.13 −0.80 12.60 6.68 0.74 Peru 93.23 −5.13 −0.84 16.49 10.52 1.17 Philippines 88.26 −5.13 −0.63 13.63 7.87 0.87 Poland 96.86 −5.13 −0.58 5.72 0.01 0.00 Portugal 93.61 −5.13 −2.99 6.25 −1.87 −0.21 Puerto Rico 88.29 −5.13 −0.80 12.95 7.02 0.78 Qatar 96.62 −5.13 2.89 15.74 13.50 1.50 Romania 94.89 −5.13 −0.60 9.86 4.12 0.46 Russia 95.88 −5.13 −1.88 5.63 −1.38 −0.15 Rwanda 82.13 −5.13 −1.56 14.31 7.62 0.85 Sao Tome/Princi 79.51 −5.13 −1.56 23.24 16.55 1.84 Saudi Arabia 91.70 −5.13 0.24 15.51 10.62 1.18 Senegal 80.84 −5.13 −1.56 18.71 12.02 1.34 Serbia 93.33 −5.13 −1.19 8.18 1.86 0.21 Sierra Leone 79.30 −5.13 −1.56 23.96 17.27 1.92 Singapore 102.68 −5.13 0.56 2.28 −2.29 −0.25 Slovakia 97.58 −5.13 −0.57 5.70 0.00 0.00 Slovenia 95.96 −5.13 −1.44 5.12 −1.45 −0.16 Somalia 80.69 −5.13 −1.56 19.21 12.53 1.39
52

Appendix
South Africa 87.84 −5.13 −2.66 25.49 17.70 1.97 Spain 93.39 −5.13 −3.65 5.80 −2.98 −0.33 Sri Lanka 88.91 −5.13 −0.12 16.54 11.29 1.25 Sudan 82.48 −5.13 −1.56 13.10 6.41 0.71 Swaziland 82.09 −5.13 −1.56 14.43 7.74 0.86 Sweden 95.37 −5.13 −3.51 5.02 −3.63 −0.40 Switzerland 91.79 −5.13 −6.24 3.15 −8.22 −0.91 Syria 91.07 −5.13 −0.42 14.95 9.40 1.04 Tajikistan 89.94 −5.13 −0.12 13.03 7.78 0.86 Tanzania 81.63 −5.13 −1.56 16.02 9.33 1.04 Thailand 92.06 −5.13 −0.62 8.57 2.81 0.31 Togo 80.22 −5.13 −1.56 20.82 14.13 1.57 Trinidad Tobago 92.89 −5.13 0.05 9.71 4.64 0.52 Tunisia 94.10 −5.13 −2.62 11.03 3.28 0.36 Turkey 92.00 −5.13 −0.63 10.99 5.23 0.58 Turkmenistan 89.81 −5.13 −0.12 13.48 8.23 0.91 Uganda 81.30 −5.13 −1.56 17.12 10.43 1.16 Ukraine 97.42 −5.13 −1.31 10.54 4.10 0.46 United Arab Emi 93.25 −5.13 0.39 9.41 4.67 0.52 United Kingdom 95.67 −5.13 −2.84 4.05 −3.93 −0.44 United States 95.77 −5.13 −2.37 4.93 −2.56 −0.28 Uruguay 95.03 −5.13 −0.14 10.15 4.88 0.54 Uzbekistan 89.93 −5.13 −0.12 13.05 7.79 0.87 Venezuela 88.65 −5.13 −0.80 11.71 5.79 0.64 Vietnam 99.48 −5.13 −0.61 10.80 5.06 0.56 Yemen 96.50 −5.13 −0.23 33.73 27.90 3.10 Zambia 80.87 −5.13 −1.56 18.62 11.93 1.33 Zimbabwe 81.12 −5.13 −1.56 17.76 11.07 1.23 Country Cogn.
ability 2100
Asymmetry effect
Migration effect
Environ. improv.
effect
Diff. 2100-2010
IQ gain per decade (‘10−100)
Mean 89.67 −5.13 −1.27 13.07 6.67 0.74 Standard Deviat. 6.36 0 1.15 6.59 6.86 0.76 Number countries 158 158 158 158 158 158
Notes: Asymmetry effect: differential children (reproduction) rates and differ ences in generation length; ariables explained in Section 13.2.6, based on Table 13.7. Migration effect does not include the effects of the 2014ff. mi gration wa es to Europe.
53

FFFuuutttuuurrreee wwweeeaaalllttthhh eeessstttiiimmmaaattteeesss (((aaannnnnnuuuaaalll GGGDDDPPP pppeeerrr cccaaapppiiitttaaa)))
Data tables
Future wealth estimates (annual GDP per capita)
Table A.6: Estimates of future wealth (GDP per capita) Country Growth
Advant. backw.
GDP 2100 Advant. backw.
Growth Complexity
GDP 2100 Complexity
Growth Risk
factors
GDP 2100 Risk
factors
Growth Regional
effects (final)
GDP 2100 Regional (final est.)
Afghanistan 4.58 65,788 2.74 13,318 2.24 8,574 2.63 12,081 Albania 3.54 111,111 1.86 25,493 1.69 21,936 1.92 26,798 Algeria 2.83 44,520 2.01 21,660 1.69 16,329 1.82 18,350 Angola 4.09 65,695 1.88 9,507 1.51 6,875 1.33 5,859 Argentina 2.90 139,317 1.58 43,461 1.47 39,452 1.42 37,741 Armenia 4.06 392,504 2.16 74,657 1.95 61,900 1.93 60,672 Australia 2.78 296,682 2.46 224,020 2.24 183,979 2.20 178,537 Austria 2.54 227,698 1.39 82,904 1.31 76,902 1.26 73,383 Azerbaijan 5.51 1,056,000 2.47 76,467 2.16 58,266 1.48 31,904 Bahrain 2.83 76,300 1.66 27,166 1.36 20,868 1.28 19,323 Bangladesh 3.71 35,999 2.70 14,972 2.44 11,864 2.61 13,827 Belarus 4.02 453,074 2.54 124,932 2.27 98,379 2.59 130,563 Belgium 2.52 220,212 1.52 91,073 1.42 82,831 1.43 83,858 Benin (Dahomey) 2.49 15,358 1.44 6,099 1.21 4,939 1.30 5,356 Bolivia 2.90 40,847 1.90 1,6984 1.70 14,230 2.48 28,229 Bosnia 4.07 228,687 2.71 69,858 2.37 51,787 2.34 50,212 Botswana 3.04 72827 1.23 14,838 1.13 13,563 0.63 8,649 Brazil 2.83 82547 1.73 31,343 1.60 27,949 1.85 34,761 Bulgaria 3.23 155,457 2.02 54,090 1.91 48,971 2.10 58,054 Burkina Faso 2.94 17,605 1.78 6,351 1.51 5,002 1.60 5,418 Burma (Myanmar) 4.85 250,259 2.19 24,702 1.87 18,697 1.53 13,856 Burundi 2.27 6,020 2.02 4,802 1.76 3,823 2.17 5,518
54

Appendix
Cambodia 4.53 139,712 2.75 29,702 2.42 22,176 2.52 24,316 Cameroon 2.19 9,404 1.58 5,476 1.29 4,247 1.53 5,236 Canada 2.56 241,037 2.29 189,670 2.06 155,470 2.04 152,424 Cape Verde 3.62 72,926 1.61 12,509 1.54 11,777 1.08 7,793 Central Afric R 1.83 4,372 1.57 3,469 1.30 2,715 1.90 4,647 Chad 3.86 30,746 2.21 7,287 1.73 4,740 1.96 5,807 Chile 3.07 205,076 1.42 48,017 1.35 45,105 1.16 38,057 China 5.27 753,783 4.88 542,408 4.44 369,824 4.38 351,886 Colombia 2.91 88,910 1.41 23,884 1.25 20,592 1.64 29,195 Comoros 2.15 5,868 1.98 5,023 1.85 4,516 2.21 6,163 Congo (Brazz) 2.33 19,269 1.35 8,074 1.13 6,632 1.03 6,079 Congo (Zaire) 2.19 2,928 2.19 2,928 1.73 1,948 2.75 4,811 Costa Rica 2.98 112,902 1.54 31,664 1.44 29,074 1.56 32,378 Cote d'Ivoire 1.49 4,898 1.17 3,695 0.95 3,033 1.45 4,722 Croatia 2.98 131,756 2.49 85,658 2.28 71,278 2.36 76,551 Cuba 3.26 71,176 1.97 23,001 1.73 18,487 2.25 29,380 Czech Republic 3.09 200,456 2.78 151,776 2.64 135,069 2.91 171,064 Denmark 2.43 206,816 1.68 106,861 1.63 101,647 1.65 103,731 Djibouti 2.23 11,280 1.64 6,688 1.44 5,603 1.64 6,701 Dominican Repub 3.26 89,677 1.33 16,417 1.21 14,789 1.74 23,754 Ecuador 2.90 60,610 1.48 17,299 1.33 15,209 1.98 27,017 Egypt 3.38 81,798 1.74 19,346 1.51 15,787 1.56 16,465 El Salvador 2.67 33,809 1.78 15,504 1.57 12,866 2.48 28,784 Eritrea 1.65 4,060 1.65 4,060 1.26 2,893 1.95 5,301 Estonia 3.27 348,776 2.70 212,342 2.55 185,292 2.45 169,930 Ethiopia 3.53 26,666 2.11 7,637 1.68 5,247 1.70 5,344 Finland 2.66 249,444 1.86 123,959 1.83 120,626 1.70 107,350 France 2.48 195,661 1.64 93,619 1.52 84,335 1.54 85,155 Gabon 1.55 15,930 0.76 7,952 0.67 7,293 0.49 6,237 Gambia 2.28 10,187 1.35 4,484 1.20 3,908 1.44 4,854 Georgia 3.29 113,177 1.87 32,524 1.66 27,023 2.30 47,419
55

Data tables
Germany 2.50 189,808 1.57 83,368 1.47 76,499 1.48 76,744 Ghana 3.01 27,807 1.70 8,788 1.53 7,549 1.50 7,345 Greece 2.69 167,382 1.37 52,182 1.29 48,976 1.42 54,648 Guatemala 2.65 47,768 1.30 14,486 1.10 12,211 1.92 25,149 Guinea-Bissau 1.94 5,247 1.59 3,841 1.40 3,251 1.89 5,001 Guinea 2.58 9,270 1.88 5,038 1.63 4,024 1.91 5,176 Haiti 1.50 3,809 1.36 3,345 1.16 2,808 2.69 10,897 Honduras 2.74 29,258 1.65 11,209 1.51 9,895 2.58 25,573 Hong Kong 3.38 611,462 3.22 533,298 2.94 416,395 2.77 361,583 Hungary 3.03 130,695 2.82 109,377 2.67 95,691 3.32 168,471 India 3.90 102,509 1.77 15,994 1.57 13,381 1.59 13,621 Indonesia 3.59 111,677 2.23 34,022 2.04 28,780 2.01 27,945 Iran 3.04 99,751 1.59 27,811 1.36 22,825 1.20 19,752 Iraq 2.35 11,992 2.28 11,237 1.91 8,082 2.83 18,186 Ireland 2.90 321,761 1.45 90,027 1.39 85,448 1.35 82,348 Israel 2.80 221,010 1.56 74,272 1.41 64,730 1.33 60,337 Italy 2.33 151,524 1.51 73,069 1.43 68,167 1.43 68,195 Jamaica 1.69 16,963 0.96 8,868 0.83 7,874 1.57 15,171 Japan 2.66 234,248 2.66 234,248 2.55 213,227 2.97 307,512 Jordan 3.34 110,496 1.84 29,690 1.60 23,911 1.39 19,922 Kazakhstan 3.96 369,936 1.86 58,982 1.58 45,999 0.93 25,887 Kenya 2.67 13,591 2.15 8,585 1.84 6,560 1.85 6,596 Korea-North 2.39 11,915 2.38 11,736 1.99 8,320 3.86 42,928 Korea-South 3.83 603,937 3.53 465,480 3.31 383,314 3.19 346,554 Kuwait 2.57 123,720 0.92 28,692 0.74 24,390 0.49 19,533 Kyrgyzstan 2.73 33,947 2.12 19,876 1.91 16,443 1.97 17,417 Laos 4.45 97,539 3.31 36,388 2.74 22,171 2.96 26,817 Latvia 3.25 236,301 2.64 138,924 2.46 117,971 2.71 147,057 Lebanon 3.44 97,261 1.77 22,448 1.47 17,236 1.47 17,202 Lesotho 2.82 27,172 1.30 7,098 1.22 6,572 1.08 5,818 Liberia 1.52 4,289 1.29 3,503 1.02 2,767 1.61 4,679
56

Appendix
Libya 2.68 34,929 1.84 16,649 1.66 14,114 1.88 17,217 Lithuania 3.32 209,979 2.49 101,796 2.38 92,171 2.84 138,252 Macedonia 2.94 70,790 2.94 70,790 2.48 46,908 3.05 77,294 Madagascar 2.22 6,168 2.18 5,953 1.83 4,399 2.27 6,478 Malawi 2.65 9,332 1.86 4,680 1.64 3,831 1.95 5,046 Malaysia 3.34 194,955 1.67 45,190 1.48 38,274 1.20 29,757 Mali 3.09 19,394 2.06 7,836 1.83 6,368 1.78 6,119 Mauritania 2.86 20,151 1.91 8,726 1.63 6,786 1.67 7,073 Mauritius 2.91 189,746 0.98 34,371 0.93 32,847 0.44 21,269 Mexico 2.60 79,497 1.72 36,521 1.58 32,399 1.76 37,840 Moldova 3.50 87,492 3.50 87,492 3.22 68,209 3.61 96,272 Mongolia 3.63 32,137 3.63 32,137 3.40 26,226 5.13 117,408 Montenegro 3.11 114,878 2.01 43,928 1.84 37,638 2.28 55,496 Morocco 3.13 61,876 1.74 18,255 1.52 14,983 1.70 17,534 Mozambique 3.92 80,339 1.96 14,366 1.62 10,725 1.21 7,454 Namibia 2.41 40,505 0.91 10,691 0.77 9,429 0.42 6,915 Nepal 3.34 27,446 2.46 12,712 2.10 9,293 2.37 11,723 Netherlands 2.55 234,070 1.67 107,343 1.57 98,339 1.48 90,739 New Zealand 2.79 220,874 2.69 202,810 2.42 160,412 2.56 181,687 Nicaragua 2.53 18,478 2.10 12,617 1.83 10,001 3.02 2,8236 Niger 2.29 5,158 2.10 4,366 1.84 3,472 2.37 5,574 Nigeria 3.27 33,414 1.96 10,571 1.58 7,534 1.52 7,178 Norway 2.63 288,588 1.94 157,487 1.89 150,731 1.69 125,590 Oman 2.83 112,069 1.02 22,713 0.88 20,041 0.74 17,718 Pakistan 3.43 51,702 2.36 20,412 2.03 15,160 2.03 15,249 Palestine 1.35 8,135 1.35 8,135 1.16 6,872 2.21 17,346 Panama 3.09 104,739 1.39 23,352 1.27 21,084 1.63 28,990 Paraguay 2.73 39,775 1.63 15,031 1.51 13,563 2.32 27,608 Peru 3.28 103,043 1.77 27,298 1.57 22,939 1.90 30,868 Philippines 2.98 43,336 1.70 14,101 1.53 12,098 2.15 20,944 Poland 3.43 218,199 2.92 139,783 2.81 126,368 3.13 166,586
57

Data tables
Portugal 2.52 134,514 1.56 57,506 1.48 53,684 1.63 61,287 Puerto Rico 2.22 107,595 0.71 28,012 0.66 26,750 0.77 29,611 Qatar 3.96 481,205 1.65 63,829 1.34 48,584 0.78 29,321 Romania 3.42 99,978 3.03 71,094 2.84 60,537 3.15 79,321 Russia 3.30 165,561 2.88 114,048 2.52 83,722 3.15 145,150 Rwanda 3.58 31,298 2.44 11,539 2.07 8,307 1.86 6,948 Sao Tome/Princi 2.55 17,091 1.28 5,562 1.17 5,043 1.22 5,240 Saudi Arabia 2.41 79,652 1.07 24,370 0.93 21,464 0.79 18,993 Senegal 2.47 14,576 1.60 6,769 1.46 5,961 1.46 5,968 Serbia 3.28 101,564 2.61 56,571 2.31 43,519 2.72 62,396 Sierra Leone 3.11 15,641 1.99 5,844 1.72 4,625 1.85 5,206 Singapore 3.79 800,658 3.66 715,939 3.14 454,688 2.73 318,376 Slovakia 3.29 236,374 3.01 186,032 2.88 165,707 3.00 183,869 Slovenia 2.86 224,749 2.10 114,799 1.97 102,215 2.32 139,442 Somalia 2.25 9,488 1.72 5,935 1.42 4,559 1.80 6,349 South Africa 2.31 39,207 1.00 12,293 0.87 10,929 0.47 7,652 Spain 2.62 185,089 1.43 64,715 1.35 60,602 1.37 61,483 Sri Lanka 3.28 95,467 1.31 16,801 1.17 14,827 0.99 12,681 Sudan 3.99 83,217 1.96 14,162 1.54 9,784 1.28 7,722 Swaziland 2.58 33,397 1.24 10,203 1.06 8,721 0.78 6,754 Sweden 2.59 245,327 1.74 116,207 1.68 110,105 1.60 102,924 Switzerland 2.37 203,160 1.33 81,721 1.22 73,631 1.19 72,171 Syria 2.77 95,760 1.18 23,570 1.04 20,688 0.91 18,419 Tajikistan 3.62 42,686 2.75 20,063 2.47 15,604 2.51 16,190 Tanzania 3.69 24,169 2.68 10,038 2.24 6,787 2.18 6,486 Thailand 3.40 183,543 1.75 43,399 1.61 38,140 1.38 31,183 Togo 2.00 5,440 1.65 4,022 1.38 3,143 1.87 4,885 Trinidad Tobago 3.25 369,776 1.28 65,595 1.13 57,416 0.70 38,956 Tunisia 3.31 118,152 2.30 48,585 2.09 40,533 1.67 27,910 Turkey 2.96 113,114 1.49 30,974 1.38 28,027 1.41 28,837 Turkmenistan 3.84 133,967 1.70 20,584 1.51 17,275 1.31 14,507
58

Appendix
Uganda 3.64 30,875 2.30 9,529 1.89 6,672 1.80 6,118 Ukraine 3.62 119,272 3.62 119,272 3.30 89,986 4.05 172,651 United Arab Emi 2.18 101,737 1.04 37,017 0.86 31,529 0.52 23,271 United Kingdom 2.60 236,897 1.99 138,771 1.86 122,876 1.68 105,363 United States 2.45 268,355 1.47 113,029 1.32 98,866 1.48 114,033 Uruguay 3.01 154,084 1.77 51,734 1.70 4,8585 1.53 41,784 Uzbekistan 3.31 107,236 1.45 20,904 1.26 17,691 1.06 14,826 Venezuela 2.29 78,129 0.95 23,908 0.86 22,080 1.16 28,893 Vietnam 4.70 200,716 4.69 199,231 4.11 120,761 4.35 147,578 Yemen 2.87 38,904 2.03 18,610 1.60 12,732 1.99 18,004 Zambia 2.89 12,600 2.21 6,931 1.87 5,164 2.03 5,914 Zimbabwe 0.78 1,849 0.78 1,849 0.63 1,621 1.73 4,297 Country Growth
Advant. backw.
GDP 2100 Advant. backw.
Growth Complexity
GDP 2100 Complexity
Growth Risk
factors
GDP 2100 Risk
factors
Growth Regional
effects (final)
GDP 2100 Regional (final est.)
Mean 2.97 129,271 1.94 58,463 1.73 47,843 1.89 51,823 Standard Deviat. 0.73 154,666 0.69 97,496 0.63 72,789 0.80 70,117 Number countries 158 158 158 158 158 158 158 158
Notes: see Section 13.3.3 and Table 13.12.
59