Appendix A Data Review and Modeling Approach – Klamath ...
148
Appendix A Data Review and Modeling Approach – Klamath and Lost Rivers TMDL Development Prepared By Tetra Tech Water Resources and TMDL Center
-
Upload
khangminh22 -
Category
Documents
-
view
1 -
download
0
Transcript of Appendix A Data Review and Modeling Approach – Klamath ...
Appendix A
Data Review and Modeling Approach – Klamath and Lost Rivers TMDL
Development
Prepared By
Tetra Tech
Water Resources and TMDL Center

This Page Intentionally Left Blank

Data Review and Modeling Approach
Klamath and Lost Rivers TMDL Development
April 23, 2004
Prepared for: U.S. Environmental Protection Agency Region 10 U.S. Environmental Protection Agency Region 9
Oregon Department of Environmental Quality North Coast Regional Water Quality Control Board
Prepared by: Tetra Tech, Inc.
Data Review and Modeling Approach
Table of Contents TOC-1
TABLE OF CONTENTS 1.0 INTRODUCTION .................................................................................................................................. 1
1.2 Data Availability and Data Needs....................................................................................................... 1 2.0 WATERSHED CHARACTERIZATION............................................................................................... 5
2.1 Physical Characteristics of the Klamath River Watershed.................................................................. 5 2.1.1 Location ....................................................................................................................................... 5 2.1.2 Climate......................................................................................................................................... 7 2.1.3 Hydrology .................................................................................................................................. 11
2.1.3.1 Klamath River Flow Data - Main Stem .............................................................................. 11 2.1.3.2 Klamath River Flow Data - Tributaries .............................................................................. 13
2.1.6 Major Land Resource Areas ...................................................................................................... 16 2.1.7 Land Use and Land Cover ......................................................................................................... 16
2.2 Physical Characteristics of the Lost River Watershed ...................................................................... 20 2.2.1 Location ..................................................................................................................................... 20 2.2.2 Major Land Resource Areas ...................................................................................................... 20 2.2.3 Land Use and Land Cover ......................................................................................................... 20
3.0 WATER QUALITY CONCERNS AND STATUS.............................................................................. 25 3.1 Oregon 303(d) List Status ................................................................................................................. 25 3.2 California 303(d) List Status............................................................................................................. 25 3.3 Applicable Water Quality Standards................................................................................................. 32
3.3.1 Oregon Standards....................................................................................................................... 32 3.3.1.1 Temperature ........................................................................................................................ 32 3.3.1.2 Dissolved Oxygen............................................................................................................... 34 3.3.1.3 pH........................................................................................................................................ 34 3.3.1.4 Bacteria (Fecal Coliform) ................................................................................................... 34 3.3.1.5 Chlorophyll a ...................................................................................................................... 34 3.3.1.6 Ammonia............................................................................................................................. 35
3.3.2 California Standards................................................................................................................... 35 3.3.2.1 Temperature ........................................................................................................................ 36 3.3.2.2 Dissolved Oxygen............................................................................................................... 36 3.3.2.3 pH........................................................................................................................................ 36
3.3.3 Comparison of Oregon and California Standards for the Klamath River .................................. 36 3.3.3.1 Temperature ........................................................................................................................ 37 3.3.3.2 Dissolved Oxygen............................................................................................................... 38 3.3.3.3 pH........................................................................................................................................ 38 3.3.3.4 Nutrients.............................................................................................................................. 38 3.3.3.5 Ammonia............................................................................................................................. 38
3.3.4 Comparison of Oregon and California Standards for the Lost River......................................... 39 3.3.4.1 Temperature ........................................................................................................................ 39 3.3.4.2 Dissolved Oxygen............................................................................................................... 40 3.3.4.3 pH........................................................................................................................................ 40 3.3.4.4 Bacteria ............................................................................................................................... 40 3.3.4.5 Nutrients.............................................................................................................................. 40 3.3.4.6 Ammonia............................................................................................................................. 40 3.3.4.7 Chlorophyll a ...................................................................................................................... 41
3.4 Water Quality Impairment Status ..................................................................................................... 41 3.4.1 Klamath River ............................................................................................................................ 42
3.4.1.1 Klamath River above Iron Gate Dam.................................................................................. 42 3.4.1.2 Klamath River below Iron Gate Dam ................................................................................. 42
3.4.1.2.1 Temperature ................................................................................................... 43
Data Review and Modeling Approach
TOC-2 Table of Contents
3.4.1.2.2 Nutrients......................................................................................................... 46 3.4.1.2.3 Dissolved Oxygen.......................................................................................... 48 3.4.1.2.4 Chlorophyll a ................................................................................................. 49
3.4.2 Lost River................................................................................................................................... 50 3.4.2.1 Temperature ........................................................................................................................ 50 3.4.2.2 Bacteria ............................................................................................................................... 54 3.4.2.3 Dissolved Oxygen............................................................................................................... 55 3.4.2.4 Chlorophyll a ...................................................................................................................... 58 3.4.2.5 Nutrients.............................................................................................................................. 60 3.4.2.6 Oxygen Consuming Constituents........................................................................................ 61
3.4.3 Tule Lake, Lower Klamath Lake National Wildlife Refuge and the Klamath Straits Drain ..... 63 3.4.3.1 Temperature ........................................................................................................................ 63 3.4.3.2 Dissolved Oxygen............................................................................................................... 66 3.4.3.3 Chlorophyll a ...................................................................................................................... 68 3.4.3.4 pH........................................................................................................................................ 68 3.4.3.4 Ammonia Toxicity .............................................................................................................. 69 3.4.3.5 Nutrients.............................................................................................................................. 70 3.4.3.6 Oxygen Consuming Constituents........................................................................................ 70
4.0 Technical Approach .............................................................................................................................. 72 4.1 Klamath River Proposed Approach .................................................................................................. 72
4.1.1 Overview.................................................................................................................................... 72 4.1.2 Model Background..................................................................................................................... 73 4.1.3 Model Configuration.................................................................................................................. 74 4.1.4 Alternative Approach................................................................................................................. 80
4.2 Lost River Proposed Approach ......................................................................................................... 81 4.2.1 Overview.................................................................................................................................... 81 4.2.2 Model Configuration.................................................................................................................. 82 4.2.3 Alternative Approach................................................................................................................. 87
4.2.3.1 Model Background.............................................................................................................. 88 4.2.3.2 Overview............................................................................................................................. 90
4.2 TMDL Analysis ................................................................................................................................ 91 4.2.1 TMDL Targets ........................................................................................................................... 92 4.2.2 Scenarios .................................................................................................................................... 92 4.2.3 Allocations ................................................................................................................................. 94
REFERENCES ........................................................................................................................................... 97 Appendix A: Major Land Resource Areas Data Description........................................................................ 1 Appendix B: Multi-Resolution Land Characteristics (MRLC) Consortium Data Description..................... 1 Appendix C: Data Summary for Stations Above Iron Gate Dam................................................................. 1 Appendix D: Lost River Model Configuration and Model Review.............................................................. 1 Appendix E: Klamath Model Configuration................................................................................................. 1
Data Review and Modeling Approach
Table of Contents TOC-3
FIGURES Figure 2-1. Location of the Klamath River watershed................................................................................. 6 Figure 2-2. Distribution of NOAA climate stations in the Klamath River watershed. ................................ 8 Figure 2-3. Climagraph for CA9053 (Tule Lake). ..................................................................................... 10 Figure 2-4. Climagraph for CA4577 (Klamath River Mouth). .................................................................. 10 Figure 2-5. USGS Stations on the Klamath River and tributaries downstream of Iron Gate Dam............ 12 Figure 2-6. Average daily flows at four USGS gages on the main stem of the Klamath River (below Iron
Gate Dam). .......................................................................................................................................... 13 Figure 2-7. Average Monthly Flow, USGS11517500 Shasta River near Yreka, CA (1911-1992). .......... 14 Figure 2-8. Average Monthly Flow, USGS11519500 Scott River near Fort Jones, CA (1941-2002). ..... 14 Figure 2-9. Average Monthly Flow, USGS11522500 Salmon River at Somes Bar, CA (1911-2002). ... 15 Figure 2-10 Average Monthly Flow, USGS1153000 Trinity River near Hoopa, CA (1911-2002). ......... 15 Figure 2-11. MLRAs in the Klamath River watershed. ............................................................................. 17 Figure 2-12. Land Use and Land Cover in the Klamath River watershed. ................................................ 18 Figure 2-13. Location of the Lost River watershed. .................................................................................. 22 Figure 2-14. MLRAs in the Lost River watershed..................................................................................... 23 Figure 2-15. Land Use and Land Cover in the Lost River watershed........................................................ 24 Figure 3-1. Location of the Oregon and California impaired segments for the Klamath River. ............... 30 Figure 3-2. Location of Oregon and California impaired segments for the Lost River. ............................ 31 Figure 3-3. Sampling sites along the Klamath River. ................................................................................ 44 Figure 3-4. June average and maximum temperature along the Klamath River........................................ 45 Figure 3-5. July average and maximum temperature along the Klamath River. ....................................... 45 Figure 3-6. August average and maximum temperature along the Klamath River.................................... 46 Figure 3-7. Sampling sites along the Lost River........................................................................................ 52 Figure 3-8. June average and maximum temperatures along the Lost River. ............................................ 53 Figure 3-9. July average and maximum temperatures along the Lost River.............................................. 53 Figure 3-10. August average and maximum temperatures along the Lost River....................................... 54 Figure 3-11. July average and minimum DO concentrations along the Lost River................................... 57 Figure 3-12. August average and minimum DO concentrations along the Lost River. ............................. 57 Figure 3-13. September average and minimum DO concentrations along the Lost River. ....................... 58 Figure 3-14. Monthly average chlorophyll a concentration and range for LREW (Lost River at East West
Road)................................................................................................................................................... 60 Figure 3-15. Sampling sites in Tule Lake, Lower Klamath Lake and Klamath Straits Drain ................... 64 Figure 3-16. June average and maximum temperature along the Klamath Straits Drain .......................... 65 Figure 3-17. July average and maximum temperature along the Klamath Straits Drain ........................... 65 Figure 3-18. August average and maximum temperature along the Klamath Straits Drain ...................... 66 Figure 3-19. July average and minimum DO along the Klamath Straits Drain ......................................... 67 Figure 3-20. August average and minimum DO along the Klamath Straits Drain .................................... 67 Figure 3-21. September average and minimum DO along the Klamath Straits Drain............................... 68 Figure 4-1. RMA-11 Water Quality Representation.................................................................................. 77 Figure 4-2. CE-QUAL-W2 Water Quality Representation ....................................................................... 78 Figure 4-3. Schematic of the Lost River System. ...................................................................................... 83 Figure 4-4. EFDC Water Quality Model Components. ............................................................................. 89 Figure 4-5. Kinetic Structure in the WASP/EUTRO Model...................................................................... 90

Data Review and Modeling Approach
TOC-4 Table of Contents
TABLES Table 1-1. Geographic or Locational Information ........................................................................................ 2 Table 1-2. Monitoring Data .......................................................................................................................... 3 Table 1-3. Land Practices and Activities ...................................................................................................... 4 Table 2-1. NOAA climate stations located within the Klamath River watershed. ...................................... 9 Table 2-2. Selected USGS stream gages on the main stem of the Klamath River..................................... 11 Table 2-3. Selected USGS gages on tributary streams in the Klamath River watershed........................... 13 Table 2-4. MLRAs of the Klamath River watershed. ................................................................................ 16 Table 2-5. Land use and land cover in the Klamath River watershed. ...................................................... 19 Table 2-6. MLRAs of the Klamath River watershed. ................................................................................ 20 Table 2-7. Land use and land cover in the Lost River watershed. ............................................................. 21 Table 3-1. Oregon 2002 303(d) for the Klamath River watershed. ........................................................... 25 Table 3-2. California 2002 303(d) list for the Klamath River watershed. ................................................. 26 Table 3-3. Beneficial uses designated for the Klamath Basin, Oregon....................................................... 32 Table 3-4. Existing and Potential Beneficial Uses Designated for the Klamath River and Lost River
Basins in California............................................................................................................................. 35 Table 3-5. Comparison of Oregon Water Quality Standards and California Water Quality Objectives for
the Klamath River ............................................................................................................................... 37 Table 3-6. Comparison of Oregon Water Quality Standards and California Water Quality Objectives for
the Lost River...................................................................................................................................... 39 Table 3-7. Datasets containing water quality observations on the Klamath River and tributaries. ............ 41 Table 3-8. Datasets containing water quality observations on the Lost River and tributaries (including the
Klamath Straits Drain). ....................................................................................................................... 42 Table 3-9. Summary of temperature data, Klamath River (°C). ................................................................ 43 Table 3-10. Summary of total phosphorous, Klamath River (mg/L). ........................................................ 47 Table 3-11. Summary of orthophosphate, dissolved, Klamath River (mg/L as P). ................................... 47 Table 3-12. Summary of NH3, dissolved data, Klamath River (mg/L as N)............................................. 48 Table 3-13. Summary of NH3, total data, Klamath River (mg/L as N)..................................................... 48 Table 3-14. Summary of DO data, Klamath River (mg/L). ....................................................................... 49 Table 3-15. Summary of chlorophyll a data, Klamath River (ug/L).......................................................... 50 Table 3-16. Summary of temperature data, Lost River (°C)...................................................................... 51 Table 3-17. Summary of temperature data, tributaries to Lost River (°C)................................................. 54 Table 3-18. Summary of E. coli data, Lost River (MPN/100 mL or CFU/100 mL).................................. 55 Table 3-19. Summary of E. coli exceedances at stations on the Lost River. ............................................. 55 Table 3-20. Summary of E. coli data, tributaries to Lost River (MPN/100 mL). ...................................... 55 Table 3-21. Summary of DO data, Lost River (mg/L)............................................................................... 56 Table 3-22. Summary of DO data, tributaries to Lost River (°C).............................................................. 58 Table 3-23. Summary of chlorophyll a data, Lost River (mg/L). .............................................................. 59 Table 3-24. Summary of chlorophyll a exceedances, Lost River. ............................................................. 59 Table 3-25. Summary of chlorophyll a data, tributaries to Lost River (mg/L). ......................................... 60 Table 3-26. Summary of total phosphorous data, Lost River (mg/L) ....................................................... 61 Table 3-27. Summary of orthophosphate data, Lost River (mg/L asP) .................................................... 61 Table 3-28. Summary of total nitrogen data, Lost River (mg/L) .............................................................. 61 Table 3-29. Summary of orthophosphate data, tributaries to Lost River (mg/L as P). .............................. 61 Table 3-30. Summary of BOD data, Lost River (mg/L). ........................................................................... 62 Table 3-31. Summary of COD data, Lost River (mg/L). ........................................................................... 62 Table 3-32. Summary of temperature data, Klamath Straits Drain (°C).................................................... 63 Table 3-33. Summary of DO data, Klamath Straits Drain (mg/L)............................................................. 66 Table 3-34. Summary of chlorophyll a data, Klamath Straits Drain (mg/L). ............................................ 68 Table 3-35. Summary of pH data, Tule Lake, Lower Klamath Lake and Klamath Straits Drain.............. 69
Data Review and Modeling Approach
Table of Contents TOC-5
Table 3-36. Summary of pH exceedances, Tule Lake, Lower Klamath Lake and Klamath Straits Drain.69 Table 3-37. Summary of ammonia data, Klamath Straits Drain (mg/L as N). .......................................... 69 Table 3-38. Summary of ammonia toxicity exceedances, Klamath Straits Drain. .................................... 70 Table 3-39. Summary of total phosphorous data, Klamath Straits Drain (mg/L) ..................................... 70 Table 3-40. Summary of orthophosphate data, Klamath Straits Drain (mg/L as P) ................................. 70 Table 3-41. Summary of total nitrogen data, Klamath Straits Drain (mg/L as P) .................................... 70 Table 3-42. Summary of BOD, BOD5 and BOD20 data, Klamath Straits Drain (mg/L)........................... 71 Table 3-43. Summary of COD data, Klamath Straits Drain (mg/L) ......................................................... 71 Table 4-1. Proposed model components. ................................................................................................... 72 Table 4-2. Summary of Precipitation Data at the Klamath River Mouth and............................................ 76 Tule Lake for 1996-2002 ............................................................................................................................ 76 Table 4-3. Lost River Model Components – Alternative Approach.......................................................... 91 Table 4-4. Potential Modeling Scenarios ................................................................................................... 92 Table 4-5. Permitted Facilities in Lost River and Lower Klamath River Watersheds............................... 95
Data Review and Modeling Approach
Executive Summary ES-1
EXECUTIVE SUMMARY The Oregon DEQ (ODEQ) and the North Coast RWQCB (NCRWQCB) have both included the Klamath and Lost Rivers on their corresponding 303d Lists as a result of observed water quality criteria exceedances. As such, the states are required to develop TMDLs for applicable water quality parameters. To support the TMDL development effort, data from numerous sources have been compiled and a preliminary data analysis has been performed. In addition to evaluating available data (with a focus on flow and water quality spatial and temporal variability), proposed and alternative modeling approaches for both the Klamath and Lost Rivers have been developed. Water quality data for the Klamath and Lost Rivers obtained from ODEQ, USBR, NCRWQCB, City of Klamath Falls, USGS, and PacifiCorp Inc. are included in this document. Additional data have been received since the document was produced, including data from USFWS, the Karuk Tribe, the Yurok Tribe, BLM, and KRIS Klamath Trinity Version 3.0. While these critical datasets are not summarized in this document, they have been compiled in the water quality database and will be used to support model and TMDL development. The period of record varied significantly for each data source, but covered the overall period from 1950 to 2003 for both rivers. Temperature, dissolved oxygen, nutrients, chlorophyll a, bacteria, and pH data were evaluated in the most detail. General statistics, such as minimum, maximum, and mean (or median, log mean, or geometric mean) values were calculated for monitoring stations along the lengths of both rivers to better understand spatial variability and extreme conditions. In many cases, water quality data were also compared directly to prescribed water quality criteria to identify the extent of impairment. For temperature and dissolved oxygen, spatial plots for critical summer months were additionally developed to provide insight into problems at specific locations and potential sources contributing to impairments. As data continue to be compiled and included in the master Klamath River and Lost River databases and model preparation begins, additional spatial and temporal data analyses will be performed to ultimately support model calibration. A proposed modeling approach and an alternative modeling approach were developed for both the Klamath River (from Upper Klamath Lake to the Pacific Ocean) and the Lost River (from Malone Dam through the Klamath Straits Drain) to support TMDL development. These approaches were developed based on a review of available data, reports, and existing models, and they are subject to approval of the TMDL Workgroup. The proposed approach for the Klamath River is to combine a series of alternating 1-dimensional models for riverine sections and 2-dimensional models for impoundments and tidal regions. Specifically, the RMA-2 and RMA-11 models will be applied for Link River, Keno Dam to J.C. Boyle Reservoir, Bypass Reach, the Full Flow Reach, and Iron Gate Dam to Turwar. RMA-2 simulates hydrodynamics while RMA-11 represents water quality processes. The CE-QUAL-W2 model will be applied for Lake Ewauna-Keno Dam, J.C. Boyle Reservoir, Copco Reservoir, Iron Gate Reservoir, and the Klamath River from Turwar to the Pacific Ocean. Application of the CE-QUAL-W2 model to the Klamath River downstream of Turwar is subject to the availability of bathymetric data and sufficient water quality monitoring data to support model calibration. The alternative approach for Klamath River modeling is to develop a model using only CE-QUAL-W2. This model would also be configured for the length of the Klamath River from Upper Klamath Lake to the Pacific Ocean, however, it would be a single, integrated model. The proposed approach for Lost River TMDL modeling is to develop a CE-QUAL-W2 model for the entire Lost River system from Malone Dam to the outlet of the Klamath Straits Drain (into the Klamath River). The model will include the Lost River itself, Tule Lake (and Tule Lake Sump), the P Canal, the Lower Klamath Lakes, and the Klamath Straits Drain. All other canals and drains in the Klamath Project will be incorporated into the modeling framework as time-series flow and water quality inputs at discrete
Data Review and Modeling Approach
ES-2 Executive Summary
locations (based on available monitoring data and literature, as necessary). These canals and drains will not be explicitly simulated in the modeling framework. The alternative approach is to develop a modeling framework using a 1-dimensional version of EFDC (Environmental Fluid Dynamics Code) for riverine portions of the Lost River (from Malone Diversion Dam to Tule Lake) and WASP/EUTRO box models for Tule Lake/Tule Lake Sump and Lower Klamath Lake. Based on the review of available data to date, a number of critical data gaps/needs have been identified. It is important to fill these gaps to support the modeling effort, either by accessing the data from appropriate sources (assuming the data already exists in some state) or by targeting these gaps during data collection efforts over the upcoming year. Key data sets that are needed include:
• Cross-section and slope data along the main channel of the Lost River • Data for all impoundments/reservoirs on the Lost River, including bathymetric data (width, depth,
etc.), dam size, dam height (up- and down-stream of the dam), rating curves, and operation data • Return flow information, including the locations of drains, flow rates, water quality
concentrations (temperature, DO, Ortho-P, NH3, NO2/NO3, CBODu [or CBOD5 and CBOD20], Org-N, Org-P, pH, and conductivity), and corresponding sources (i.e., contributing areas, crops, original irrigation water source, etc.)
• Flow and water quality data (temperature, DO, Ortho-P, NH3, NO2/NO3, CBODu [or CBOD5 and CBOD20], Org-N, Org-P, Chl-a [phytoplankton], pH, and conductivity) for:
o the Lost River downstream of Malone Dam o Miller Creek upstream of the confluence with Lost River o Bonanza Creek upstream of the confluence with Lost River o Buck Creek upstream of the confluence with Lost River o “E” canal upstream of the confluence with Lost River o “F-1” canal upstream of the confluence with Lost River o Lost River diversion channel upstream of the confluence with Lost River o “P” canal downstream of Pump “D” o “A” canal at its starting point at Link Dam o ADY Canal before entering Lower Klamath Lake and at its source on the Klamath River o New North canal at its source on the Klamath River and at the point before discharging
for irrigation o Cottonwood, Sheepy, and Willow Creeks before entering Lower Klamath Lake. o From the Lost River to the J Canal
• Pumping (flow) data for: o the main pump stations along the Lost River o Tule Lake Sump o Lower Klamath Lake
• Periphyton, phytoplankton, and macrophyte information to characterize primary productivity and determine species presence and dominance (e.g., information regarding distribution between blue-greens, diatoms, and green algae species)
Once the modeling approaches are finalized and data gaps are filled, the Klamath and Lost River modeling systems will be constructed, calibrated, and validated. Upon completion of model calibration and validation, sensitivity analyses will be conducted to better understand the response of the systems to variations in external loadings and kinetic parameters. Ultimately, the tested models will be run for a series of scenarios aimed at achieving prescribed TMDL targets, based on input from the TMDL Workgroup.
Data Review and Modeling Approach
Introduction 1
1.0 INTRODUCTION The Oregon DEQ (ODEQ) and the North Coast RWQCB (NCRWQCB) have both included the Klamath and Lost Rivers on their corresponding 303d Lists as a result of observed water quality criteria exceedances. As such, the states are required to develop TMDLs for applicable water quality parameters. The first steps in the TMDL development process include compilation of available data; evaluation of monitoring data to identify the extent, location, and timing of water quality impairments; and development of a technical approach to analyze the relationship between source pollutant loading contributions and in-stream response. This document addresses these steps for the Klamath and Lost Rivers. The first sections provide background information for the Klamath River Basin and its impairments and summarize data that are currently available for the Klamath and Lost Rivers, with a focus on the Lost River and data downstream of Upper Klamath Lake for the Klamath River. The summary includes a description of most monitoring data compiled to date (although a number of datasets were not received with enough lead time to include in the analysis) as well as reports and geographic data sets currently available. Water quality data for the Klamath and Lost Rivers obtained from ODEQ, USBR, NCRWQCB, City of Klamath Falls, USGS, and PacifiCorp Inc. are included in this document. Additional data have been received since the document was produced, including data from USFWS, the Karuk Tribe, the Yurok Tribe, BLM, and KRIS Klamath Trinity Version 3.0. While these critical datasets are not summarized in this document, they have been compiled in the water quality database and will be used to support model and TMDL development. Results of a preliminary and ongoing data analysis are then presented. The goal of this analysis is to gain insight into the characteristics of water quality impairments in the Klamath and Lost Rivers, including the timing, locations, and extent of impairment. Therefore the analysis includes temporal and spatial summaries of water quality data and comparisons of historical conditions to state water quality criteria. The primary focus of the analysis is on the Lost River since a number of reports by PacifiCorp and others have served to characterize conditions in the Klamath River. Where data are presented for the Klamath River, the focus is on the river downstream of Iron Gate Dam, since the first phase of the Klamath modeling effort focuses on this region. Data upstream of the dam will continue to be collected and evaluated over the course of this effort. Following the data analysis is a proposed technical approach for linking source contributions to in-stream response for each of the rivers. An alternative approach is also presented for each. 1.2 Data Availability and Data Needs The following tables outline the key datasets that are needed for the TMDL modeling effort. The information ranges from geographical/political information such as County boundaries and land use to water quality and flow data. The “currently available to Tetra Tech” column identifies the information already obtained. The “Local Data Sources” identifies additional datasets that may be available and would be useful for the analysis. The “Priority” column identifies the highest priority of the outstanding data needed to support the analysis.

Data Review and Modeling Approach
2 Introduction
Table 1-1. Geographic or Locational Information Data Type Currently Available to Tetra Tech Local Data Sources Priority
Reservoir boundaries and stream network
EPA BASINS Reach File coverages (RF1, RF3), NHD, USGS 7.5’ Quads, USBR drains
ODEQ, NCRWQCB, or other digitized stream network, reservoir boundaries
County boundaries, cities/towns, populated places
BASINS
Land use (including % impervious)
USGS Multi-Resolution Land Characteristics (MRLC) - developed early 1990s
Local watershed land use information, e.g. County coverages
Soils STATSGO (entire state), SSURGO (select counties) County soil surveys
Watershed boundaries USGS Hydrologic Unit Boundaries (8-digit)
Agency-specific watershed boundaries
Topographic relief and elevation data
USGS 7.5 minute Topos, Digital Elevation Models
Water quality and biological monitoring station locations
EPA STORET See section 3.4 – Tables 3-8 and 3-9 for a list of datasets received
Agency-specific monitoring station locations (spatial coverages, if available, or coordinates)
Y
Meteorological station locations NOAA-NCDC, EarthInfo Data
Local weather stations, e.g. County; The Pacific Northwest Agricultural Weather Network PacifiCorp weather data
Y
Permitted facility locations
EPA’s Permit Compliance System (PCS)
ODEQ and NCRWQCB discharge locations (spatial coverages, if available, or coordinates)
Y
Hazardous waste sites BASINS - CERCLIS and TRI data
CAFOs Not yet obtained
Active and abandoned mine locations Not yet obtained
Dam locations BASINS Dam size, type, difference in up- and downstream of dam elevation, rating curve
Water intakes/withdrawals/diversions
USBR, PacifiCorp Klamath Model Y
CSO and storm water inflows
No data for Lost River PacifiCorp Klamath Model
County outfall locations Y
Septic/Sewer spatial coverages Not yet obtained County surveys and coverages

Data Review and Modeling Approach
Introduction 3
Table 1-2. Monitoring Data Data Type Currently Available to Tetra Tech Local Data Sources Priority
Flow data
USGS historical streamflow data, see section 2.1.3
Report: Klamath Project Historical Water Use Analysis, Davids Engineering 1998
Agency-specific continuous and instantaneous flow data in Lost River system, especially at each major tributary (and canal) influence, upstream boundary, return flow, and pumping flow
Y
Meteorological data NOAA-NCDC, EarthInfo, see section 2.1.2
Local weather data, e.g. County; precipitation, temperature, solar radiation, dew point, wind speed, humidity, cloud cover, etc.
Y
Water quality data (including ambient, lake monitoring, sediment, fish tissue, and special study data)
STORET, see section 3.4 – Tables 3-8 and 3-9
Agency-specific: Historical and current water quality monitoring data for the reservoirs, main-stem rivers and upstream tributary stations, upstream tributaries (canals) and return flows. Preferred all the WQ data stations to be associated with the flow data. Include temperature, diel D.O. data, chlorophyll a, limiting nutrients, and other data (sediment, fish tissue, conductivity, etc.)
Y
Biomonitoring and habitat data Data obtained not yet reviewed
Agency-specific: Historical and current biomonitoring data (benthic macroinvertebrate data, fish community data, periphyton, etc.) Also habitat data, including aquatic vegetation biomass, algal data, primary production rates, habitat surveys, riparian vegetation buffer widths, sediment characteristics, etc.
Periphyton and other macrophyte data are of priority
Reservoir, Canals, etc. physical data
Volume, surface area, discharge characteristics, water balance, bathymetry, other information
Y
Stream channel data (for rivers and upstream tributaries)
Some cross section data obtained, not yet reviewed
Rating curves, cross sectional data, slope, other physical characteristics
Y
Permitted facilities PCS, see previous page ODEQ, NCRWQCB: permit limits, design flow, DMR data, information other discharges
Y

Data Review and Modeling Approach
4 Introduction
Table 1-3. Land Practices and Activities Data Type Currently Available to Tetra Tech Local Data Sources Priority
Septic systems and illicit discharges U.S. Census (county information
available)
Public health agency: septic population, failure rates, short-circuited systems, illicit discharge data, etc.
Livestock and wildlife
USDS-NRCS Agricultural Census
Livestock population estimates, livestock management (confinement, grazing, stream access), wildlife population estimates & habitat information
Major crops, rotation, management
USDA-NRCS Agricultural Census,
Report: Farming Practices and Water Quality in the Upper Klamath Basin, Kaffka et al., 2002
Cropping practices, major crops, tillage
Manure application, fertilizer, pesticide use, biosolids
USDS-NRCS Agricultural Census
Public health agency: manure application rates and lands applied to, fertilizer use information, pesticide use, biosolids
Timber practices Not yet obtained U.S. Forest Service, State Forest Services: timber harvest activities
Mining activities, reservoir dredging Not yet obtained
Surface mining information, reservoir dredging history, etc.
Data Review and Modeling Approach
Watershed Characterization 5
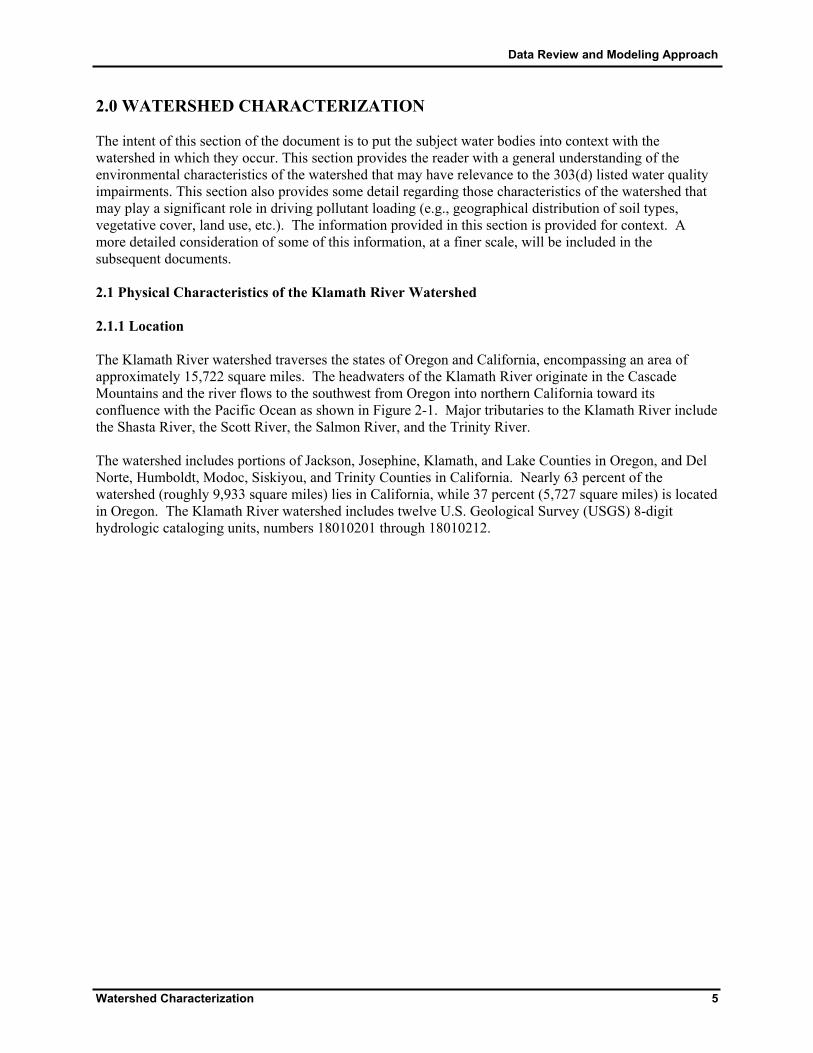
2.0 WATERSHED CHARACTERIZATION The intent of this section of the document is to put the subject water bodies into context with the watershed in which they occur. This section provides the reader with a general understanding of the environmental characteristics of the watershed that may have relevance to the 303(d) listed water quality impairments. This section also provides some detail regarding those characteristics of the watershed that may play a significant role in driving pollutant loading (e.g., geographical distribution of soil types, vegetative cover, land use, etc.). The information provided in this section is provided for context. A more detailed consideration of some of this information, at a finer scale, will be included in the subsequent documents. 2.1 Physical Characteristics of the Klamath River Watershed 2.1.1 Location
The Klamath River watershed traverses the states of Oregon and California, encompassing an area of approximately 15,722 square miles. The headwaters of the Klamath River originate in the Cascade Mountains and the river flows to the southwest from Oregon into northern California toward its confluence with the Pacific Ocean as shown in Figure 2-1. Major tributaries to the Klamath River include the Shasta River, the Scott River, the Salmon River, and the Trinity River. The watershed includes portions of Jackson, Josephine, Klamath, and Lake Counties in Oregon, and Del Norte, Humboldt, Modoc, Siskiyou, and Trinity Counties in California. Nearly 63 percent of the watershed (roughly 9,933 square miles) lies in California, while 37 percent (5,727 square miles) is located in Oregon. The Klamath River watershed includes twelve U.S. Geological Survey (USGS) 8-digit hydrologic cataloging units, numbers 18010201 through 18010212.

Data Review and Modeling Approach
6 Watershed Characterization
60 0 60 120 Miles
N
EW
S
Source: USGS EPA BASINSProjection: Lambert Conformal Conic
#
#
#
LAKE
SISKIYOU
KLAMATH
LASSEN
MODOC
SHASTA
TRINITY
TEHAMA
JACKSONCURRY
JOSEPHINE
DEL NORTE
OREGON
CALIFORNIA
Klamath Falls
Klamath GlenTulelake
.-,5
.-,5
"!1 40
"!1 40"!1 40
"!2 99
"!3
"!39
"!96
"!96 (/9 7
(/232
(/97
HUMBOLDT
HUC180102011801020218010203180102041801020518010206180102071801020818010209180102101801021118010212
StreamsCountiesMajor Roads
# Cities
Figure 2-1. Location of the Klamath River watershed.
Data Review and Modeling Approach
Watershed Characterization 7
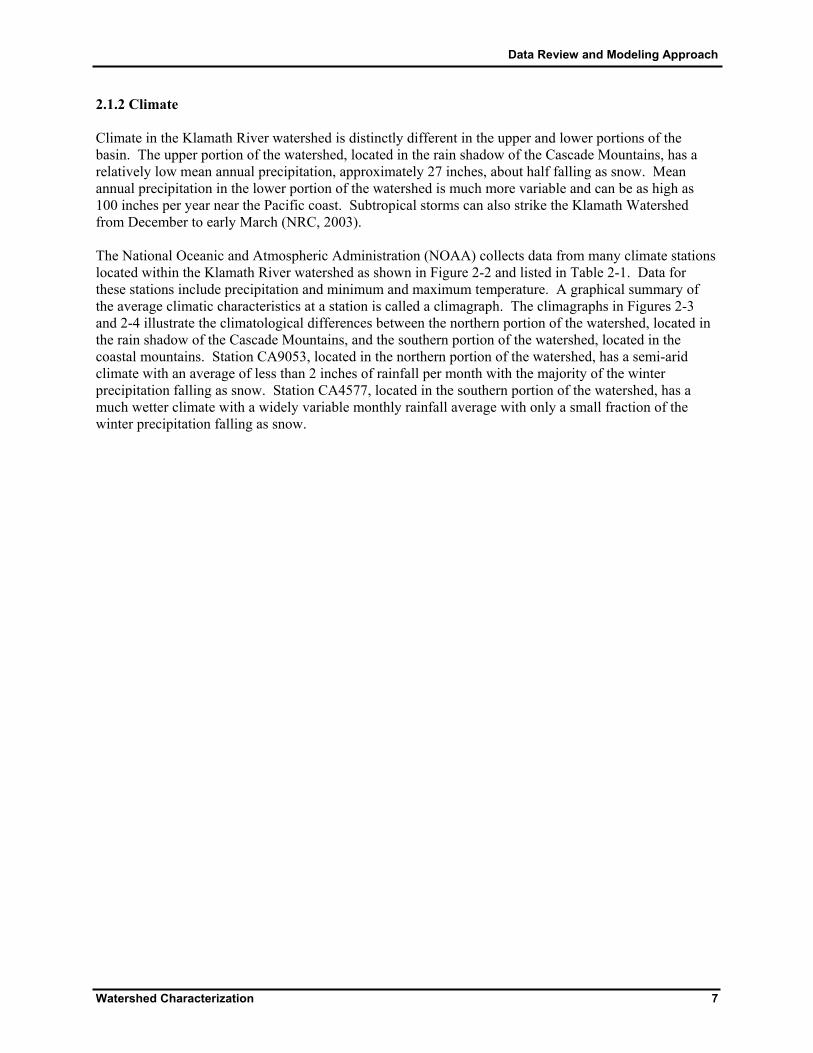
2.1.2 Climate Climate in the Klamath River watershed is distinctly different in the upper and lower portions of the basin. The upper portion of the watershed, located in the rain shadow of the Cascade Mountains, has a relatively low mean annual precipitation, approximately 27 inches, about half falling as snow. Mean annual precipitation in the lower portion of the watershed is much more variable and can be as high as 100 inches per year near the Pacific coast. Subtropical storms can also strike the Klamath Watershed from December to early March (NRC, 2003). The National Oceanic and Atmospheric Administration (NOAA) collects data from many climate stations located within the Klamath River watershed as shown in Figure 2-2 and listed in Table 2-1. Data for these stations include precipitation and minimum and maximum temperature. A graphical summary of the average climatic characteristics at a station is called a climagraph. The climagraphs in Figures 2-3 and 2-4 illustrate the climatological differences between the northern portion of the watershed, located in the rain shadow of the Cascade Mountains, and the southern portion of the watershed, located in the coastal mountains. Station CA9053, located in the northern portion of the watershed, has a semi-arid climate with an average of less than 2 inches of rainfall per month with the majority of the winter precipitation falling as snow. Station CA4577, located in the southern portion of the watershed, has a much wetter climate with a widely variable monthly rainfall average with only a small fraction of the winter precipitation falling as snow.

Data Review and Modeling Approach
8 Watershed Characterization
60 0 60 120 Mil
N
EW
S
Source: NOAA, EPA BASINSProjection: Lambert Conformal Conic
Klamath River WatershedStreams
#Y NOAA Stations
#Y
#Y
#Y
#Y
#Y
#Y
#Y
#Y
#Y #Y
#Y
#Y
#Y
#Y
#Y
Oregon
California#
CA3761
#
CA5785
#
OR1946
#
OR0853
#
OR3232
#
CA9053
#
CA3182
#
CA2899#
CA1886
#
CA8025
#
CA9490#
CA4191
#
CA4089
#
CA4577#
CA6513
Figure 2-2. Distribution of NOAA climate stations in the Klamath River watershed.

Data Review and Modeling Approach
Watershed Characterization 9
Table 2-1. NOAA climate stations located within the Klamath River watershed. California Station Name Coop-ID Period of Record Elevation (ft)COFFEE CREEK R S CA1886 1960-2000 2500.0 ETNA CA2899 1948-2000 2950.0 FORT JONES 6 ESE CA3176 1948-1976 3323.0 FORT JONES RANGER STN CA3182 1976-2000 2725.0 HAPPY CAMP RANGER STN CA3761 1848-2000 1120.0 HOOPA CA4082 1948-1974 361.0 HOOPA CA4089 1971-2000 333.0 HYAMPOM CA4191 1948-2000 1275.0 KLAMATH CA4577 1948-2000 25.0 MONTAGUE 5 NE CA5785 1948-2001 2635.0 OREGON MOUNTAIN CA6495 1973-1974 3832.0 ORLEANS RS CA6513 1971-2000 430.0 SAWYERS BAR RS CA8025 1971-2000 2169.0 TRINITY CENTER RANGER S CA9023 1948-1960 2303.0 TULELAKE CA9053 1948-2000 4035.0 WEAVERVILLE CA9490 1948-2000 2040.0 Oregon Station Name Coop-ID Period of Record Elevation (ft)BLY RANGER STN OR0853 1948-2000 4390.0 BLY 3 NW OR0854 1950-1950 4378.0 CRATER LAKE NATL PARK H OR1946 1949-2000 6475.0 GERBER DAM OR3232 1958-2000 4850.0 KLAMATH FALLS AG STA OR4511 1948-1951 4092.0
Data Review and Modeling Approach
10 Watershed Characterization
0.0
2.0
4.0
6.0
8.0
10.0
12.0
14.0
16.0
Jan Feb Mar Apr May Jun Jul Aug Sep Oct Nov Dec
Month
Prec
ipita
tion
(inch
es)
0.0
10.0
20.0
30.0
40.0
50.0
60.0
Tem
pera
ture
(F)
Monthly Avg. Snowfall (in) Monthly Avg. Precipitation (in) Average Temperature
Figure 2-3. Climagraph for CA9053 (Tule Lake).
0.0
2.0
4.0
6.0
8.0
10.0
12.0
14.0
16.0
Jan Feb Mar Apr May Jun Jul Aug Sep Oct Nov Dec
Month
Prec
ipita
tion
(inch
es)
0.0
10.0
20.0
30.0
40.0
50.0
60.0
Tem
pera
ture
(F)
Monthly Avg. Snowfall (in) Monthly Avg. Precipitation (in) Average Temperature
Figure 2-4. Climagraph for CA4577 (Klamath River Mouth).
Data Review and Modeling Approach
Watershed Characterization 11
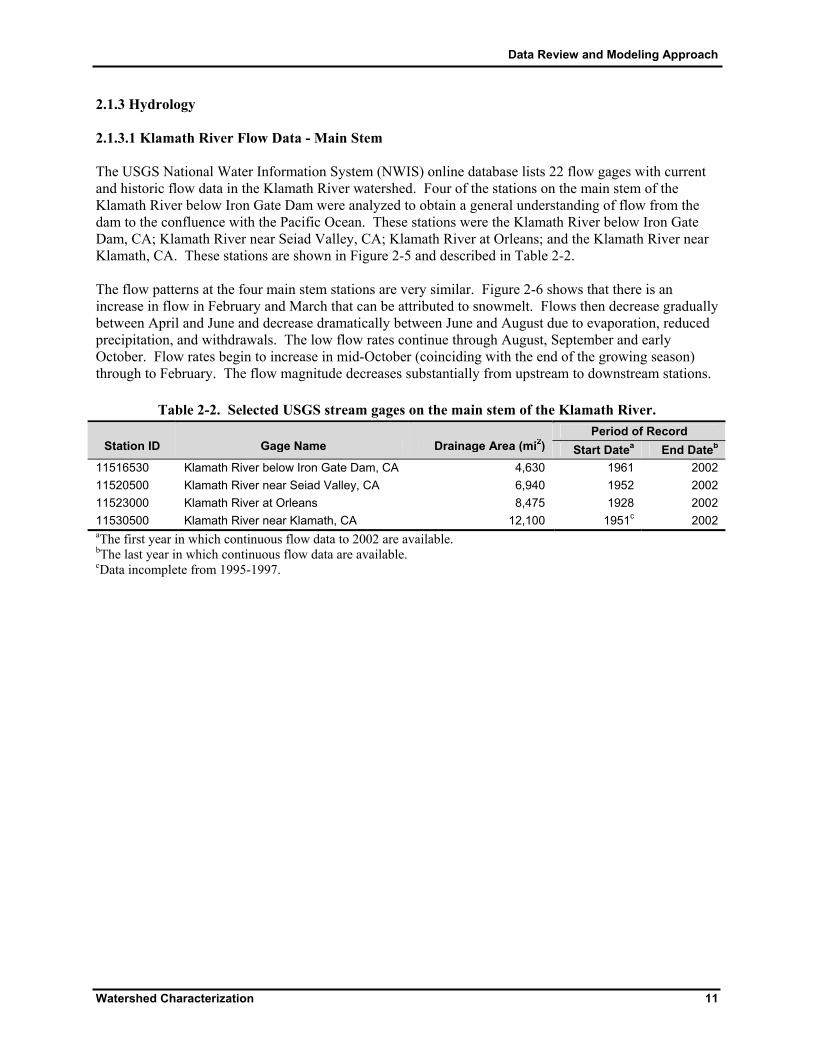
2.1.3 Hydrology 2.1.3.1 Klamath River Flow Data - Main Stem The USGS National Water Information System (NWIS) online database lists 22 flow gages with current and historic flow data in the Klamath River watershed. Four of the stations on the main stem of the Klamath River below Iron Gate Dam were analyzed to obtain a general understanding of flow from the dam to the confluence with the Pacific Ocean. These stations were the Klamath River below Iron Gate Dam, CA; Klamath River near Seiad Valley, CA; Klamath River at Orleans; and the Klamath River near Klamath, CA. These stations are shown in Figure 2-5 and described in Table 2-2. The flow patterns at the four main stem stations are very similar. Figure 2-6 shows that there is an increase in flow in February and March that can be attributed to snowmelt. Flows then decrease gradually between April and June and decrease dramatically between June and August due to evaporation, reduced precipitation, and withdrawals. The low flow rates continue through August, September and early October. Flow rates begin to increase in mid-October (coinciding with the end of the growing season) through to February. The flow magnitude decreases substantially from upstream to downstream stations.
Table 2-2. Selected USGS stream gages on the main stem of the Klamath River. Period of Record
Station ID Gage Name Drainage Area (mi2) Start Datea End Dateb 11516530 Klamath River below Iron Gate Dam, CA 4,630 1961 2002 11520500 Klamath River near Seiad Valley, CA 6,940 1952 2002 11523000 Klamath River at Orleans 8,475 1928 2002 11530500 Klamath River near Klamath, CA 12,100 1951c 2002 aThe first year in which continuous flow data to 2002 are available. bThe last year in which continuous flow data are available. cData incomplete from 1995-1997.

Data Review and Modeling Approach
12 Watershed Characterization
(X(X
(X
(X
(X
(X(X
(X
#
USGS11516530
#
USGS11520500
#
USGS11523000
#USGS11530500
#
USGS11517500
#
USGS11519500
#
USGS11522500
#
USGS11530000
TRINITY R
SALMON R
SCOTT R
SHASTA R
KLAMATH R
Oregon
California
Klamath River WatershedStreams
(X USGS Flow Stations
Source: USGS EPA BASINSProjection: Lambert Conformal Conic
N
EW
S
60 0 60 120 Miles
Figure 2-5. USGS Stations on the Klamath River and tributaries downstream of Iron Gate Dam.

Data Review and Modeling Approach
Watershed Characterization 13
0
10,000
20,000
30,000
40,000
50,000
60,000
Jan Feb Mar Apr May Jun Jul Aug Sep Oct Nov Dec
Ave
rage
Dai
ly F
low
(cfs
)
11523000 11530500 11516530 11520500
Figure 2-6. Average daily flows at four USGS gages on the main stem of the Klamath River (below Iron Gate Dam).
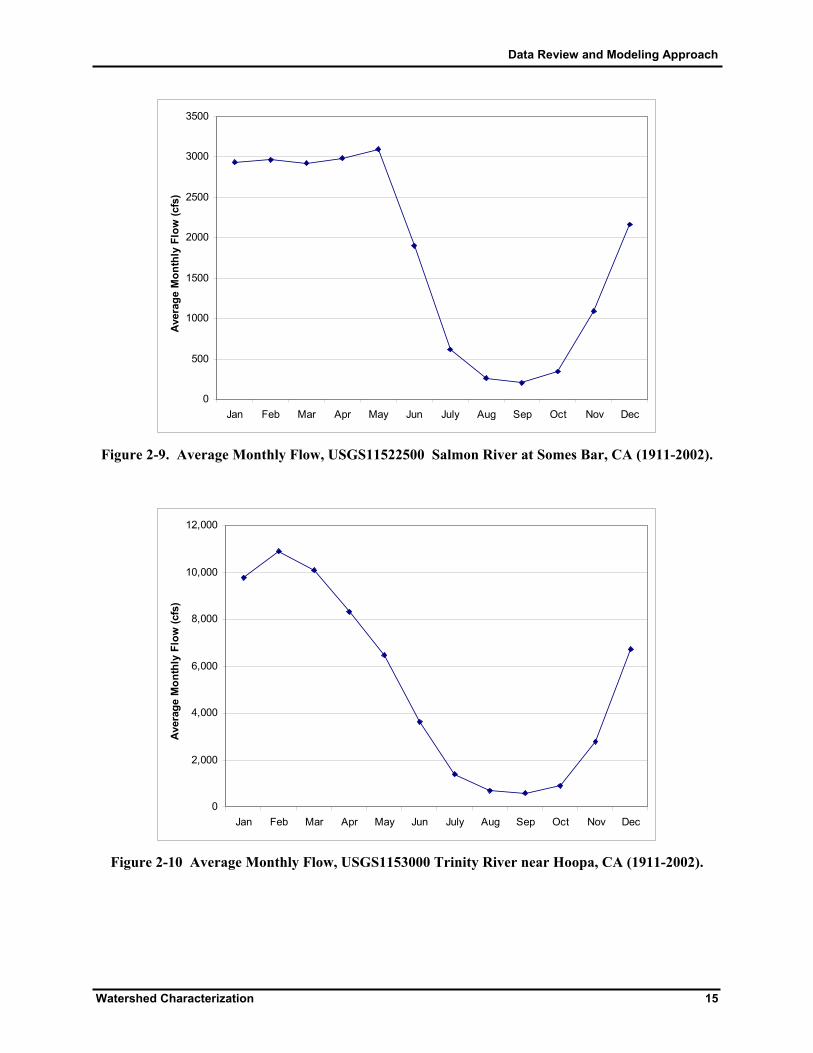
2.1.3.2 Klamath River Flow Data - Tributaries The USGS National Water Information System (NWIS) online database lists 4 flow gages with current and historic flow data for the four major tributaries of the Klamath River below Iron Gate Dam. These were analyzed to obtain a general understanding of flow contributions to be expected from these tributaries. These stations were the Shasta River near Yreka, CA; Scott River near Fort Jones, CA; Salmon River at Somes Bar, CA; and Trinity River near Hoopa, CA. These stations are shown in Figure 2-5 and described in Table 2-3. The average monthly flow at these stations is shown in Figure 2-7 through 2-10. The flow patterns at the four stations are very similar. The Shasta River and Trinity River had their highest monthly flows in February while the Scott River and Salmon had their highest monthly flows in May. The Salmon, Scott and Trinity Rivers all experiences a sharp decrease in flow rate between May and July due to evaporation, reduced precipitation, and withdrawals.
Table 2-3. Selected USGS gages on tributary streams in the Klamath River watershed. Period of Record
Station ID Gage Name Drainage Area
(mi2) Start Datea End Dateb 11517500 Shasta River near Yreka, CA 793 1933 2002 11519500 Scott River near Fort Jones, CA 653 1941 2002 11522500 Salmon River at Somes Bar, CA 751 1911 2002 11530000 Trinity River near Hoopa, CA 2,853 1911 2002 aThe first year in which continuous flow data are available. bThe last year in which continuous flow data are available.

Data Review and Modeling Approach
14 Watershed Characterization
0
50
100
150
200
250
300
350
400
Jan Feb Mar Apr May Jun July Aug Sep Oct Nov Dec
Aver
age
Mon
thly
Flo
w (c
fs)
Figure 2-7. Average Monthly Flow, USGS11517500 Shasta River near Yreka, CA (1911-1992).
0
200
400
600
800
1000
1200
1400
Jan Feb Mar Apr May Jun July Aug Sep Oct Nov Dec
Aver
age
Mon
thly
Flo
w (c
fs)
Figure 2-8. Average Monthly Flow, USGS11519500 Scott River near Fort Jones, CA (1941-2002).
Data Review and Modeling Approach
Watershed Characterization 15
0
500
1000
1500
2000
2500
3000
3500
Jan Feb Mar Apr May Jun July Aug Sep Oct Nov Dec
Aver
age
Mon
thly
Flo
w (c
fs)
Figure 2-9. Average Monthly Flow, USGS11522500 Salmon River at Somes Bar, CA (1911-2002).
0
2,000
4,000
6,000
8,000
10,000
12,000
Jan Feb Mar Apr May Jun July Aug Sep Oct Nov Dec
Aver
age
Mon
thly
Flo
w (c
fs)
Figure 2-10 Average Monthly Flow, USGS1153000 Trinity River near Hoopa, CA (1911-2002).
Data Review and Modeling Approach
16 Watershed Characterization
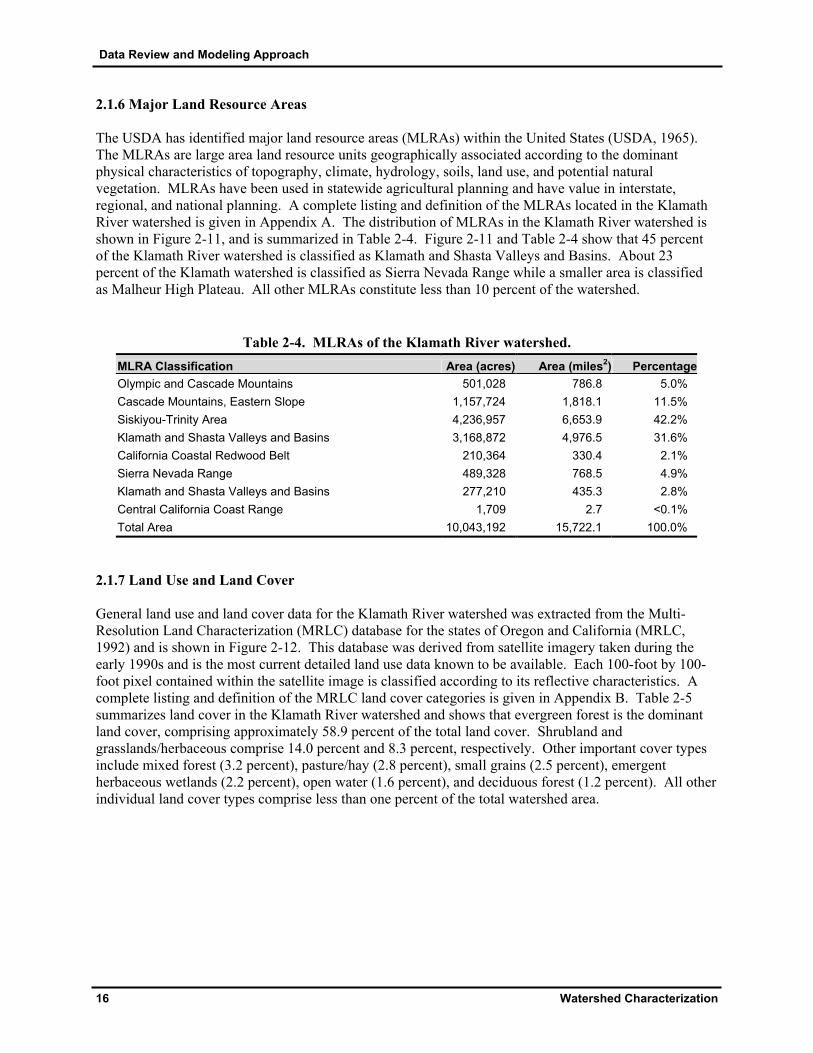
2.1.6 Major Land Resource Areas The USDA has identified major land resource areas (MLRAs) within the United States (USDA, 1965). The MLRAs are large area land resource units geographically associated according to the dominant physical characteristics of topography, climate, hydrology, soils, land use, and potential natural vegetation. MLRAs have been used in statewide agricultural planning and have value in interstate, regional, and national planning. A complete listing and definition of the MLRAs located in the Klamath River watershed is given in Appendix A. The distribution of MLRAs in the Klamath River watershed is shown in Figure 2-11, and is summarized in Table 2-4. Figure 2-11 and Table 2-4 show that 45 percent of the Klamath River watershed is classified as Klamath and Shasta Valleys and Basins. About 23 percent of the Klamath watershed is classified as Sierra Nevada Range while a smaller area is classified as Malheur High Plateau. All other MLRAs constitute less than 10 percent of the watershed.
Table 2-4. MLRAs of the Klamath River watershed. MLRA Classification Area (acres) Area (miles2) PercentageOlympic and Cascade Mountains 501,028 786.8 5.0% Cascade Mountains, Eastern Slope 1,157,724 1,818.1 11.5% Siskiyou-Trinity Area 4,236,957 6,653.9 42.2% Klamath and Shasta Valleys and Basins 3,168,872 4,976.5 31.6% California Coastal Redwood Belt 210,364 330.4 2.1% Sierra Nevada Range 489,328 768.5 4.9% Klamath and Shasta Valleys and Basins 277,210 435.3 2.8% Central California Coast Range 1,709 2.7 <0.1% Total Area 10,043,192 15,722.1 100.0%
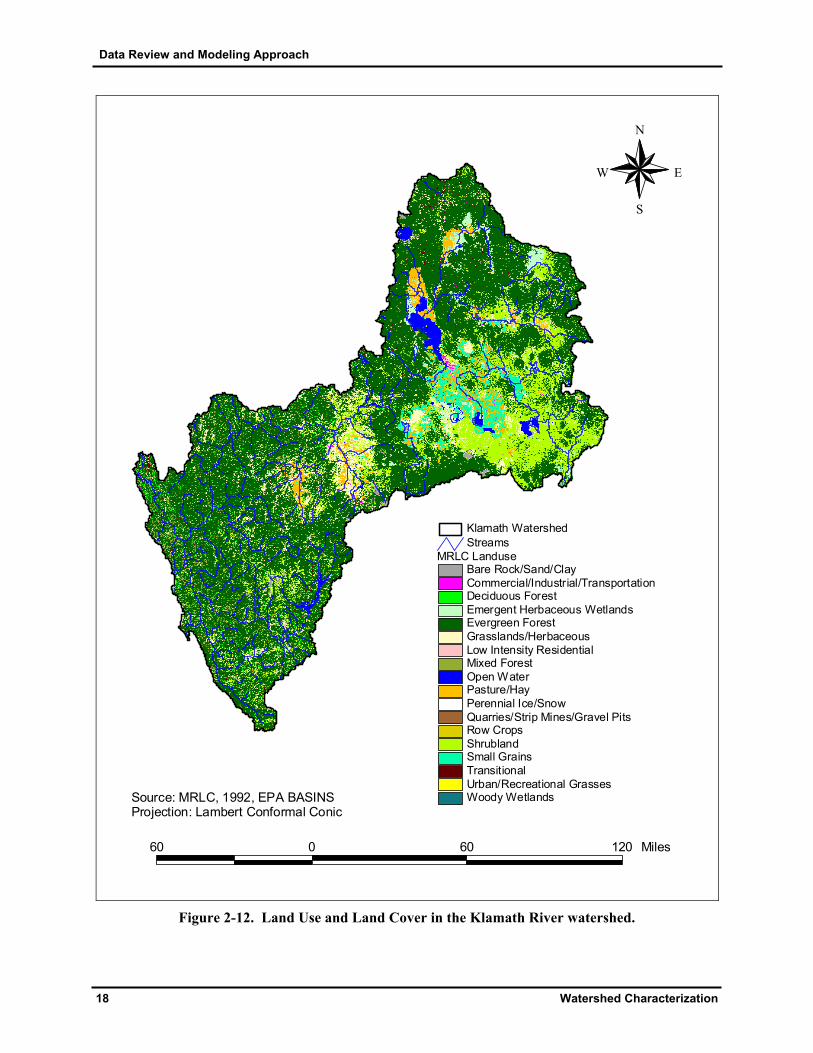
2.1.7 Land Use and Land Cover General land use and land cover data for the Klamath River watershed was extracted from the Multi-Resolution Land Characterization (MRLC) database for the states of Oregon and California (MRLC, 1992) and is shown in Figure 2-12. This database was derived from satellite imagery taken during the early 1990s and is the most current detailed land use data known to be available. Each 100-foot by 100-foot pixel contained within the satellite image is classified according to its reflective characteristics. A complete listing and definition of the MRLC land cover categories is given in Appendix B. Table 2-5 summarizes land cover in the Klamath River watershed and shows that evergreen forest is the dominant land cover, comprising approximately 58.9 percent of the total land cover. Shrubland and grasslands/herbaceous comprise 14.0 percent and 8.3 percent, respectively. Other important cover types include mixed forest (3.2 percent), pasture/hay (2.8 percent), small grains (2.5 percent), emergent herbaceous wetlands (2.2 percent), open water (1.6 percent), and deciduous forest (1.2 percent). All other individual land cover types comprise less than one percent of the total watershed area.

Data Review and Modeling Approach
Watershed Characterization 17
N
EW
S
Source: USDA, EPA BASINSProjection: Lambert Conformal Conic
Major Land Resource AreaCalifornia Coastal Redwood BeltCascade Mountains, Eastern SlopeCentral California Coast RangeKlamath and Shasta Valleys and BasinsOlympic and Cascade MountainsSierra Nevada RangeSiskiyou-Trinity Area
Streams
60 0 60 120 Miles
Figure 2-11. MLRAs in the Klamath River watershed.
Data Review and Modeling Approach
18 Watershed Characterization
Source: MRLC, 1992, EPA BASINSProjection: Lambert Conformal Conic
N
EW
S
MRLC LanduseBare Rock/Sand/ClayCommercial/Industrial/TransportationDeciduous ForestEmergent Herbaceous WetlandsEvergreen ForestGrasslands/HerbaceousLow Intensity ResidentialMixed ForestOpen WaterPasture/HayPerennial Ice/SnowQuarries/Strip Mines/Gravel PitsRow CropsShrublandSmall GrainsTransitionalUrban/Recreational GrassesWoody Wetlands
StreamsKlamath Watershed
60 0 60 120 Miles
Figure 2-12. Land Use and Land Cover in the Klamath River watershed.

Data Review and Modeling Approach
Watershed Characterization 19
Table 2-5. Land use and land cover in the Klamath River watershed. Area
Land Use/Land Cover Acres Square Miles Percent of Watershed
Evergreen Forest 6,228,663 9,750.7 62.0% Shrubland 1410,263 2,207.7 14.0% Grasslands/Herbaceous 834,866 1,306.9 8.3% Mixed Forest 315,894 494.5 3.2% Pasture/Hay 285,668 447.2 2.8% Small Grains 253,466 396.8 2.5% Emergent Herbaceous Wetlands 217,219 340.0 2.2% Open Water 157,451 246.5 1.6% Deciduous Forest 121,454 190.1 1.2% Bare Rock/Sand/Clay 73,010 114.3 0.7% Transitional 56,921 89.1 0.6% Row Crops 50,734 79.4 0.5% Commercial/Industrial/Transportation 16,503 25.8 0.2% Woody Wetlands 11,088 17.4 0.1% Low Intensity Residential 7,363 11.5 0.1% Quarries/Strip Mines/Gravel Pits 1,241 1.9 <0.1% Urban Recreational Grasses 849 1.3 <0.1% Perennial Ice/Snow 539 0.8 <0.1% Total 10,043,192 15,722.1 100.0%

Data Review and Modeling Approach
20 Watershed Characterization
2.2 Physical Characteristics of the Lost River Watershed 2.2.1 Location
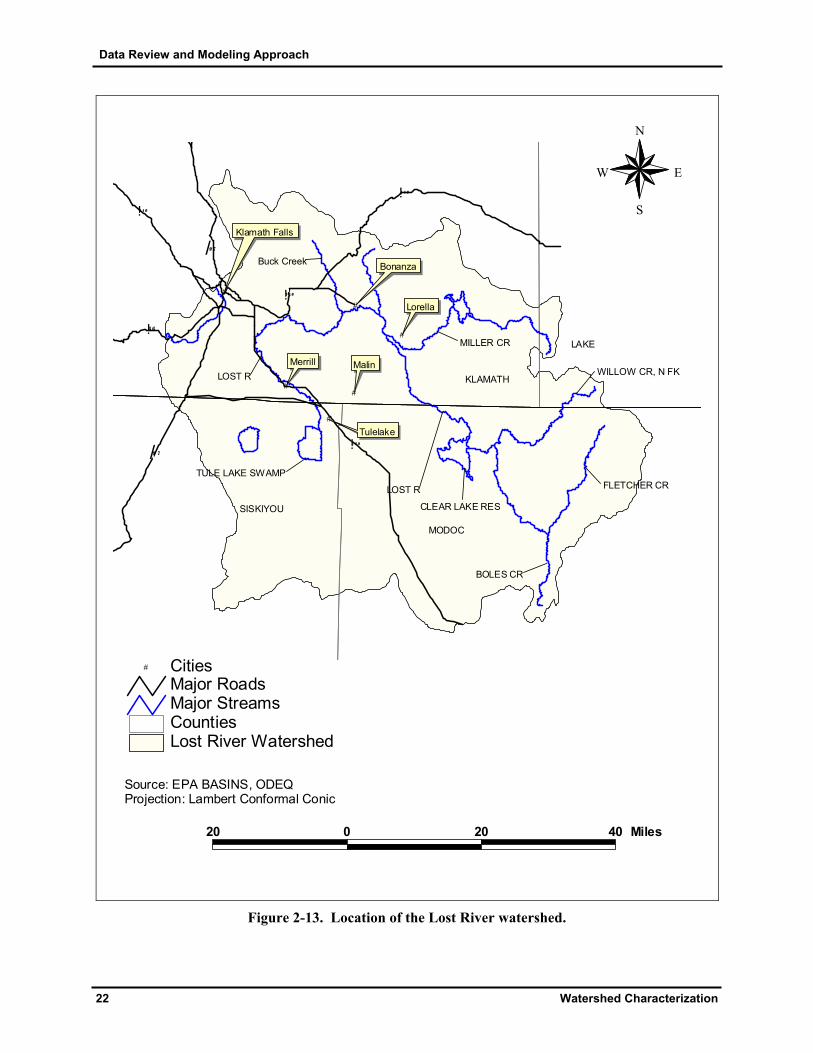
The Lost River watershed traverses the states of Oregon and California, encompassing an area of approximately 2,996 square miles. The headwaters of the Lost River originate from the tributaries leading into Clear Lake in California (including Willow Creek, Fletcher Creek, Boles Creek and Mowitz Creek). The river flows north into Oregon until it reaches the town of Bonanza where it turns and flows west until it reaches the Wilson Reservoir, where it turns south and flows into Tule Lake in California (as shown in Figure 2-13). Major natural tributaries to the Lost River include Miller Creek, Big Springs, and Buck Creek. The watershed includes portions of Klamath and Lake Counties in Oregon, and Modoc and Siskiyou in California. Approximately 56 percent of the watershed (roughly 1,667 square miles) lies in California, while 46 percent (roughly 1,328 square miles) is located in Oregon. The Lost River watershed includes one U.S. Geological Survey (USGS) 8-digit hydrologic cataloging unit, 18010204. 2.2.2 Major Land Resource Areas A complete listing and definition of the MLRAs located in the Lost River watershed is given in Appendix A. The distribution of MLRAs in the Lost River watershed is shown in Figure 2-14, and is summarized in Table 2-6. Figure 2-14 and Table 2-6 show that about 92 percent of the Lost River watershed is classified as Klamath and Shasta Valleys and Basins. All other MLRA constitute less than 10 percent of the watershed.
Table 2-6. MLRAs of the Lost River watershed. MLRA Classification Area (acres) Area (miles2) PercentageKlamath and Shasta Valleys and Basins 1,888,608 2,951.0 98.5% Sierra Nevada Range 28,597 44.7 1.5% Total Area 1,917,205 2,995.6 100.0%
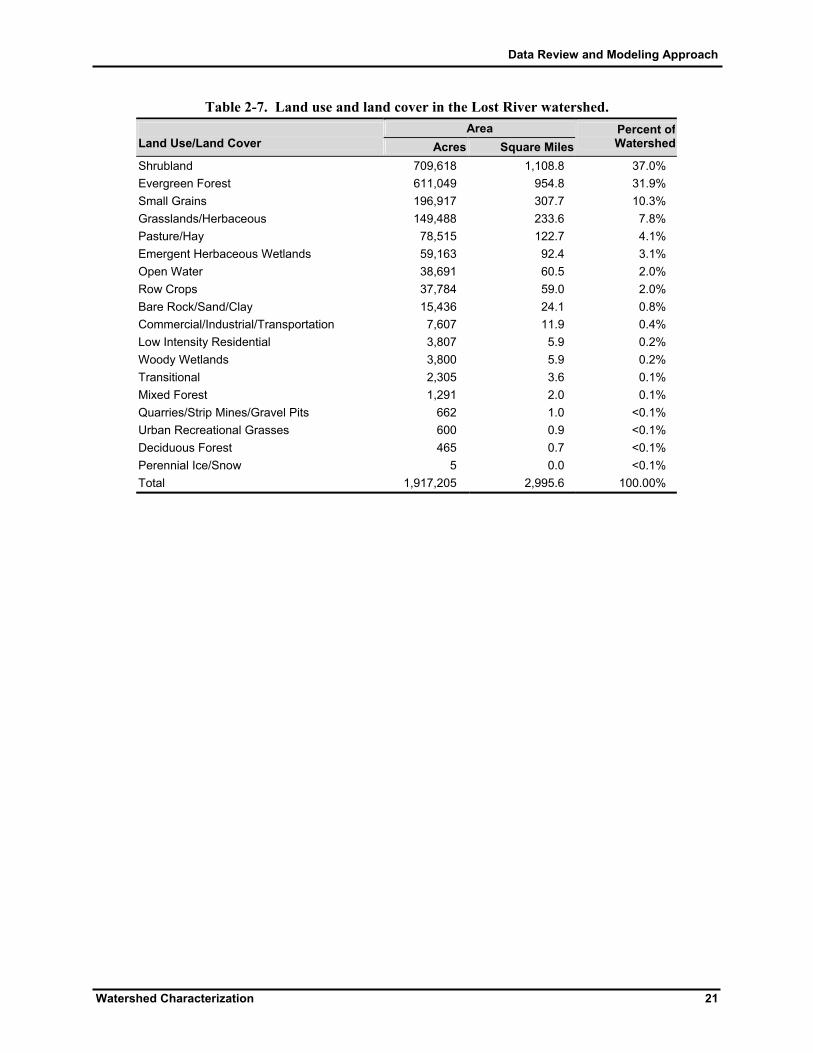
2.2.3 Land Use and Land Cover Figure 2-15 shows the land cover in the Lost River watershed, based on MRLC, while Table 2-7 summarizes the various land covers. Table 2-7 shows that shrubland is the dominant land cover, comprising approximately 37.0 percent of the total land cover. Evergreen forest and small grains comprise 31.9 percent and 10.3 percent, respectively. Other important cover types include grasslands/herbaceous (7.8 percent), pasture/hay (4.1 percent), emergent herbaceous wetlands (3.1 percent), open water (2.0 percent) and row crops (2.0 percent). All other individual land cover types comprise less than one percent of the total watershed area.
Data Review and Modeling Approach
Watershed Characterization 21
Table 2-7. Land use and land cover in the Lost River watershed. Area
Land Use/Land Cover Acres Square Miles Percent of Watershed
Shrubland 709,618 1,108.8 37.0% Evergreen Forest 611,049 954.8 31.9% Small Grains 196,917 307.7 10.3% Grasslands/Herbaceous 149,488 233.6 7.8% Pasture/Hay 78,515 122.7 4.1% Emergent Herbaceous Wetlands 59,163 92.4 3.1% Open Water 38,691 60.5 2.0% Row Crops 37,784 59.0 2.0% Bare Rock/Sand/Clay 15,436 24.1 0.8% Commercial/Industrial/Transportation 7,607 11.9 0.4% Low Intensity Residential 3,807 5.9 0.2% Woody Wetlands 3,800 5.9 0.2% Transitional 2,305 3.6 0.1% Mixed Forest 1,291 2.0 0.1% Quarries/Strip Mines/Gravel Pits 662 1.0 <0.1% Urban Recreational Grasses 600 0.9 <0.1% Deciduous Forest 465 0.7 <0.1% Perennial Ice/Snow 5 0.0 <0.1% Total 1,917,205 2,995.6 100.00%
Data Review and Modeling Approach
22 Watershed Characterization
Lost River WatershedCountiesMajor StreamsMajor Roads
# Cities
#
#
#
#
##
LAKE
MODOC
KLAMATH
SISKIYOU
"!1 4 0
"!1 4 0
"!1 4 0
(/9 7
"!66
(/9 7
Merrill
Lorella
Bonanza
"!1 3 9Tulelake
Klamath Falls
Malin
#
MILLER CR
#Buck Creek
#
LOST R
#
LOST R#
WILLOW CR, N FK
#
FLETCHER CR
#
BOLES CR
#
CLEAR LAKE RES
#
TULE LAKE SWAMP
20 0 20 40 Miles
N
EW
S
Source: EPA BASINS, ODEQProjection: Lambert Conformal Conic
Figure 2-13. Location of the Lost River watershed.

Data Review and Modeling Approach
Watershed Characterization 23
Source: USDA, EPA BASINSProjection: Lambert Conformal Conic
N
EW
S
20 0 20 40 Miles
Major Land Resource AreaKlamath and Shasta Valleys and BasinsSierra Nevada Range
Major Streams
Figure 2-14. MLRAs in the Lost River watershed.

Data Review and Modeling Approach
24 Watershed Characterization
20 0 20 40 Miles
N
EW
S
MRLC Landuse
Mixed Forest
Major Streams
Bare Rock/Sand/ClayCommercial/Industrial/TransportationDeciduous ForestEmergent Herbaceous WetlandsEvergreen ForestGrasslands/ HerbaceousLow Intensity Residential
Lost River WatershedOpen WaterPasture/HayPerennial Ice/SnowQuarries/Strip Mines/Gravel PitsRow CropsShrublandSmall GrainsTransitionalUrban/Recreational GrassesWoody Wetlands
Source: MRLC, 1992, EPA BASINSProjection: Lambert Conformal Conic
Figure 2-15. Land Use and Land Cover in the Lost River watershed.

Data Review and Modeling Approach
Water Quality Data Review 25
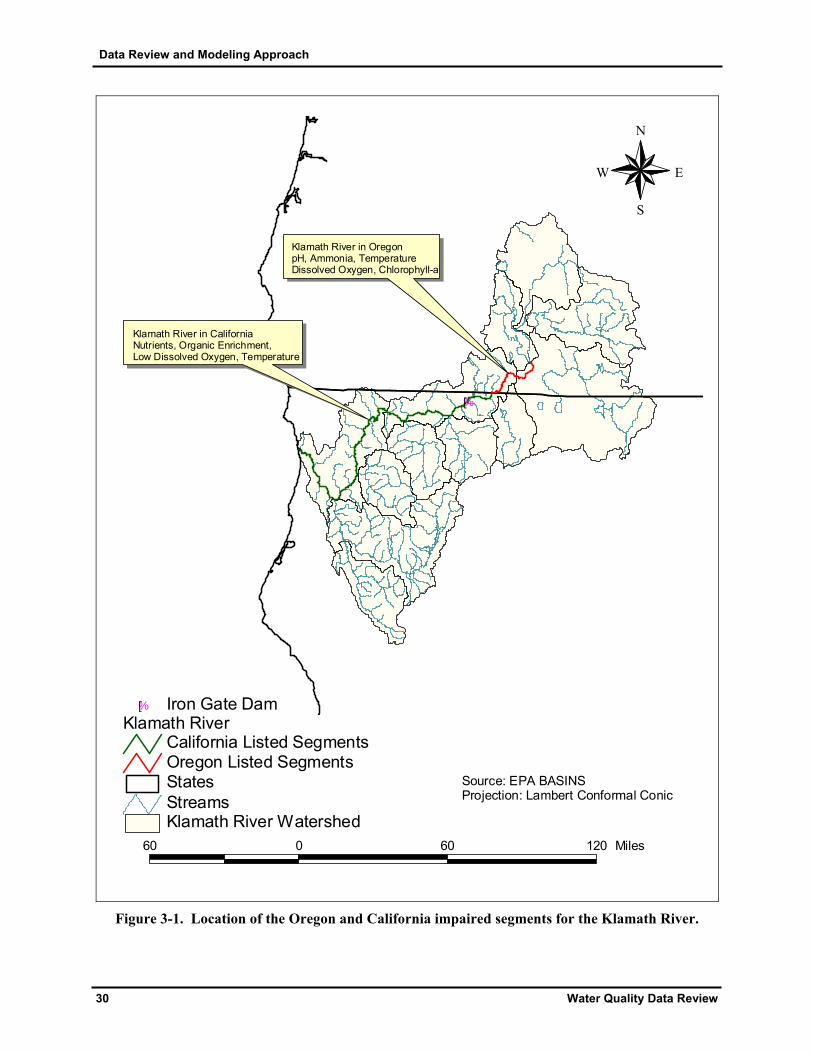
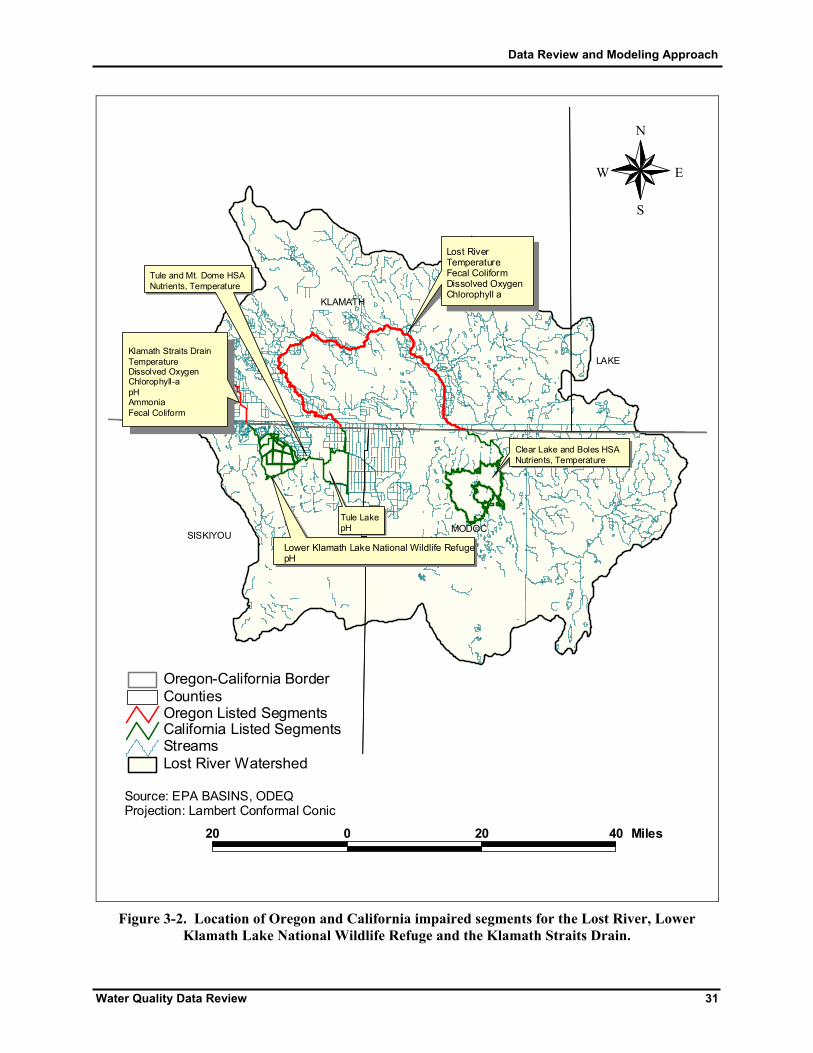
3.0 WATER QUALITY CONCERNS AND STATUS This section of the document first presents the 303(d) list status of all listed water bodies (i.e., which water bodies are listed as impaired or threatened and for which pollutants). This is followed by a description of the parameters of concern, the applicable water quality standards, and a water body by water body review of available water quality data. 3.1 Oregon 303(d) List Status The Oregon 2002 303(d) list reported that beneficial uses in the Klamath and Lost Rivers were impaired for a variety of reasons (Table 3-1). Figure 3-1 shows the location of the Klamath River watershed, major streams, and the impaired river segments from the 2002 303(d) list. Figure 3-2 shows the Lost River watershed, major streams and the impaired river segments from the 2002 303(d) list.
Table 3-1. Oregon 2002 303(d) for the Klamath River watershed.
Waterbody Name River Mile Parameter Season List Date
Listing Status
Klamath River 231 to 250 pH Summer 1998 303(d) List
Klamath River 250 to 251 pH Summer 1998 303(d) List
Klamath River 231 to 250 Ammonia Winter/Summer 1998 303(d) List
Klamath River 207 to 231 Temperature Summer 1998 303(d) List
Klamath River 231 to 250 Temperature Summer 1998 303(d) List
Klamath River 250 to 251 Temperature Summer 1998 303(d) List
Klamath River 231 to 250 Dissolved Oxygen Spring/Summer/Fall 1998 303(d) List
Klamath River 231 to 250 Chlorophyll a Summer 1998 303(d) List
Klamath River 250 to 251 Chlorophyll a Summer 1998 303(d) List
Klamath Straits Drain 0 to 0 Temperature Summer 1998 303(d) Klamath Straits Drain 0 to 0 Fecal Coliform Summer 1998 303(d) Klamath Straits Drain 0 to 0 Dissolved Oxygen Year Around 1998 303(d) Klamath Straits Drain 0 to 0 Chlorophyll a Summer 1998 303(d) Klamath Straits Drain 0 to 0 pH Summer 1998 303(d) Klamath Straits Drain 0 to 0 Ammonia Summer 1998 303(d) Lost River 0 to 59.7 Temperature Summer 1998 303(d) Lost River 0 to 59.7 Fecal Coliform Winter/Spring/Fall 1998 303(d) Lost River 0 to 59.7 Dissolved Oxgyen Summer 1998 303(d) Lost River 0 to 59.7 Chlorophyll a Summer 1998 303(d) Lost River 0 to 59.7 Fecal Coliform Summer 1998 303(d)
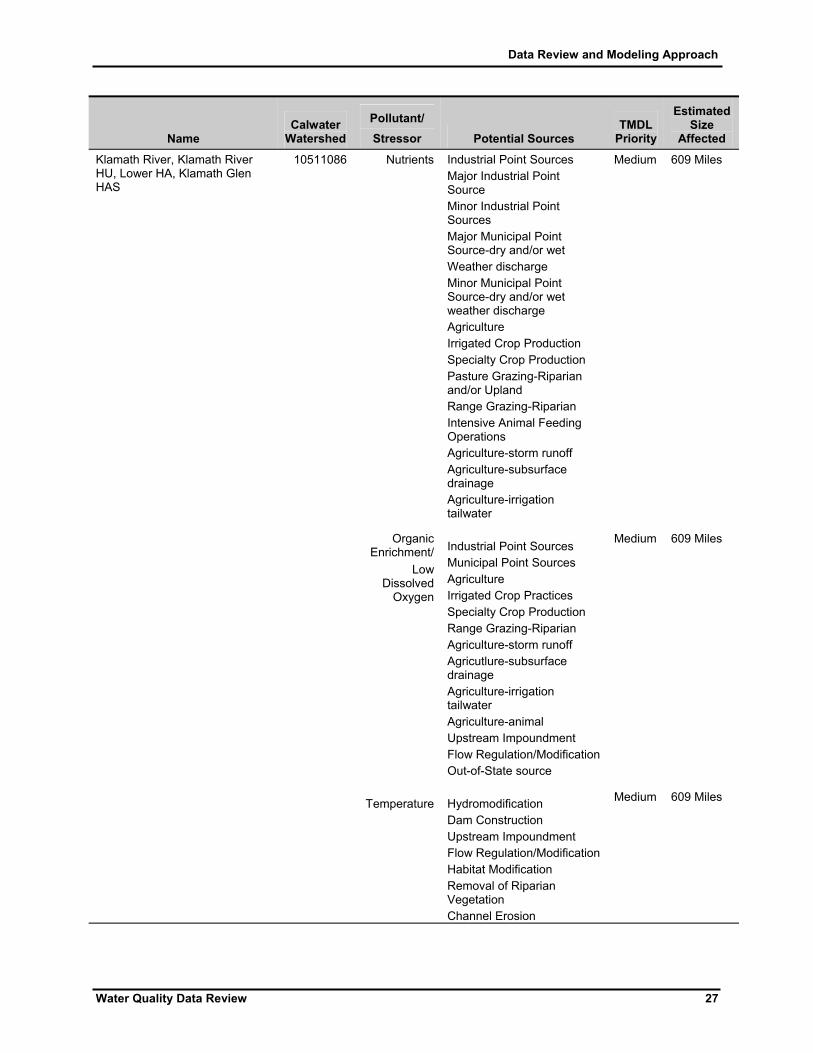
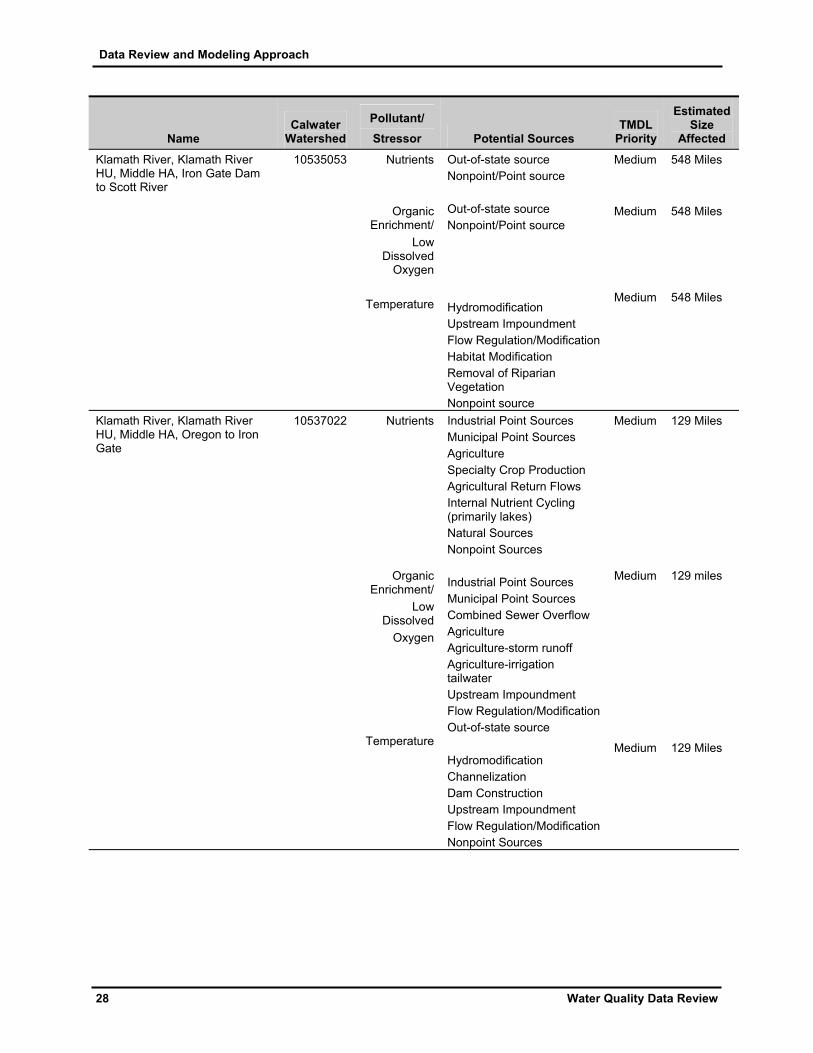
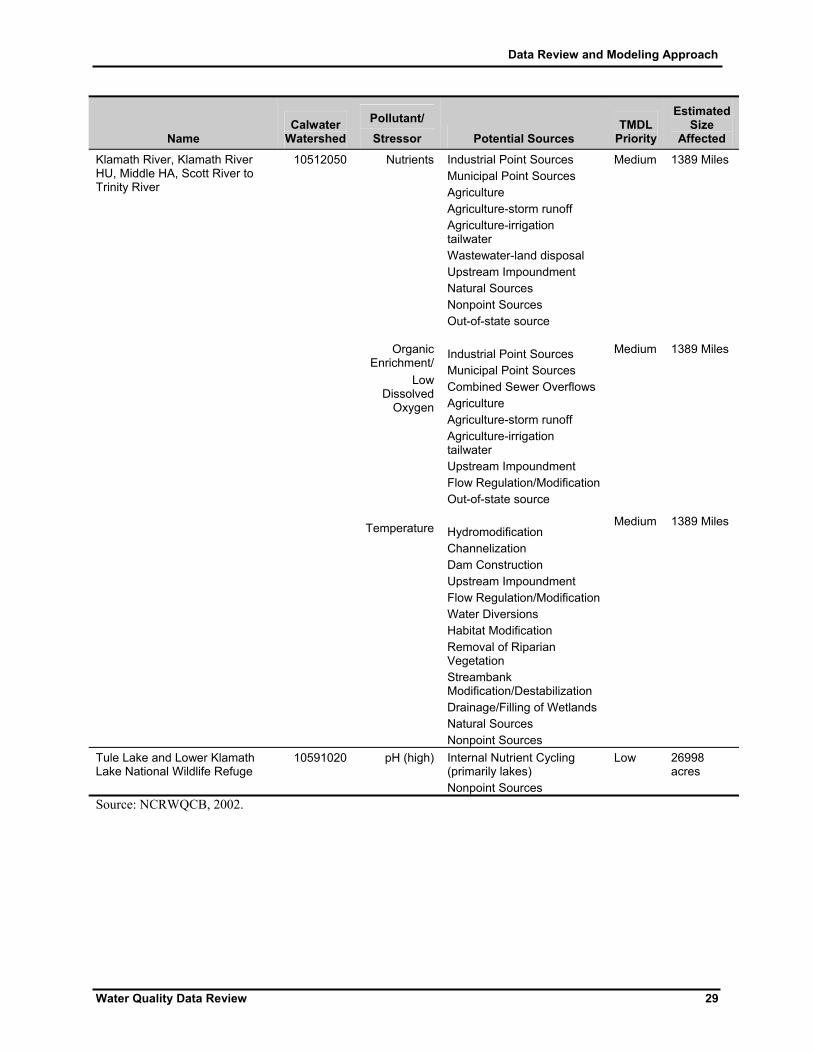
Source: ODEQ, 2002. 3.2 California 303(d) List Status The California 2002 303(d) list also reported that beneficial uses in the Klamath and Lost Rivers were impaired for a variety of reasons. The listing information from the report is shown in Table 3-2. Figure 3-1 shows the location of the Klamath River watershed, major streams, and the impaired river segments from the 2002 303(d) list. Figure 3-2 shows the location of the Lost River watershed, major streams and the impaired river segments from the 2002 303(d) list.

Data Review and Modeling Approach
26 Water Quality Data Review
Table 3-2. California 2002 303(d) list for the Klamath River watershed.
Name Calwater
Watershed
Pollutant/ Stressor Potential Sources
TMDL Priority
Estimated Size
Affected
Klamath River, Klamath River HU, Lost River HA, Clear Lake, Boles HSAs
10593011 Nutrients
Temperature
Hydromodification Nonpoint Source Hydromodification Dam Construction Upstream Impoundment Flow Regulation/Modification Water Diversions Agricultural Water Diversion Nonpoint Source
Medium Medium
601 Miles 601 Miles
Klamath River, Klamath River HU, Lost River HA, Tule Lake and Mt Dome HSAs
10591063 Nutrients
Temperature
Agriculture Specialty Crop Production Agriculture-subsurface drainage Agriculture-irrigation tailwater Water Diversions Agricultural Water Diversion Habitat Modification Removal of Riparian Vegetation Drainage/Filling of Wetlands Natural Sources Nonpoint Sources Hydromodifcation Channelization Flow Regulation/Modification Water Diversions Agricultural Water Diversion Habitat Modification Removal of Riparian Vegetation Drainage/Filling of Wetlands Nonpoint Source
Medium Medium
612 Miles 612 Miles
Data Review and Modeling Approach
Water Quality Data Review 27
Name Calwater
Watershed
Pollutant/ Stressor Potential Sources
TMDL Priority
Estimated Size
Affected
Klamath River, Klamath River HU, Lower HA, Klamath Glen HAS
10511086 Nutrients
Organic Enrichment/
Low Dissolved
Oxygen
Temperature
Industrial Point Sources Major Industrial Point Source Minor Industrial Point Sources Major Municipal Point Source-dry and/or wet Weather discharge Minor Municipal Point Source-dry and/or wet weather discharge Agriculture Irrigated Crop Production Specialty Crop Production Pasture Grazing-Riparian and/or Upland Range Grazing-Riparian Intensive Animal Feeding Operations Agriculture-storm runoff Agriculture-subsurface drainage Agriculture-irrigation tailwater Industrial Point Sources Municipal Point Sources Agriculture Irrigated Crop Practices Specialty Crop Production Range Grazing-Riparian Agriculture-storm runoff Agricutlure-subsurface drainage Agriculture-irrigation tailwater Agriculture-animal Upstream Impoundment Flow Regulation/Modification Out-of-State source Hydromodification Dam Construction Upstream Impoundment Flow Regulation/Modification Habitat Modification Removal of Riparian Vegetation Channel Erosion
Medium Medium Medium
609 Miles 609 Miles 609 Miles
Data Review and Modeling Approach
28 Water Quality Data Review
Name Calwater
Watershed
Pollutant/ Stressor Potential Sources
TMDL Priority
Estimated Size
Affected
Klamath River, Klamath River HU, Middle HA, Iron Gate Dam to Scott River
10535053 Nutrients
Organic Enrichment/
Low Dissolved
Oxygen
Temperature
Out-of-state source Nonpoint/Point source Out-of-state source Nonpoint/Point source Hydromodification Upstream Impoundment Flow Regulation/Modification Habitat Modification Removal of Riparian Vegetation Nonpoint source
Medium Medium Medium
548 Miles 548 Miles 548 Miles
Klamath River, Klamath River HU, Middle HA, Oregon to Iron Gate
10537022 Nutrients
Organic Enrichment/
Low Dissolved
Oxygen
Temperature
Industrial Point Sources Municipal Point Sources Agriculture Specialty Crop Production Agricultural Return Flows Internal Nutrient Cycling (primarily lakes) Natural Sources Nonpoint Sources Industrial Point Sources Municipal Point Sources Combined Sewer Overflow Agriculture Agriculture-storm runoff Agriculture-irrigation tailwater Upstream Impoundment Flow Regulation/Modification Out-of-state source Hydromodification Channelization Dam Construction Upstream Impoundment Flow Regulation/Modification Nonpoint Sources
Medium Medium Medium
129 Miles 129 miles 129 Miles
Data Review and Modeling Approach
Water Quality Data Review 29
Name Calwater
Watershed
Pollutant/ Stressor Potential Sources
TMDL Priority
Estimated Size
Affected
Klamath River, Klamath River HU, Middle HA, Scott River to Trinity River
10512050 Nutrients
Organic Enrichment/
Low Dissolved
Oxygen
Temperature
Industrial Point Sources Municipal Point Sources Agriculture Agriculture-storm runoff Agriculture-irrigation tailwater Wastewater-land disposal Upstream Impoundment Natural Sources Nonpoint Sources Out-of-state source Industrial Point Sources Municipal Point Sources Combined Sewer Overflows Agriculture Agriculture-storm runoff Agriculture-irrigation tailwater Upstream Impoundment Flow Regulation/Modification Out-of-state source Hydromodification Channelization Dam Construction Upstream Impoundment Flow Regulation/Modification Water Diversions Habitat Modification Removal of Riparian Vegetation Streambank Modification/Destabilization Drainage/Filling of Wetlands Natural Sources Nonpoint Sources
Medium Medium Medium
1389 Miles 1389 Miles 1389 Miles
Tule Lake and Lower Klamath Lake National Wildlife Refuge
10591020 pH (high) Internal Nutrient Cycling (primarily lakes) Nonpoint Sources
Low 26998 acres
Source: NCRWQCB, 2002.
Data Review and Modeling Approach
30 Water Quality Data Review
Klamath River WatershedStreamsStates
Klamath River California Listed SegmentsOregon Listed Segments
%[ Iron Gate Dam
Source: EPA BASINSProjection: Lambert Conformal Conic
N
EW
S
60 0 60 120 Miles
%[
Klamath River in OregonpH, Ammonia, TemperatureDissolved Oxygen, Chlorophyll-a
Klamath River in CaliforniaNutrients, Organic Enrichment,Low Dissolved Oxygen, Temperature
Figure 3-1. Location of the Oregon and California impaired segments for the Klamath River.
Data Review and Modeling Approach
Water Quality Data Review 31
Source: EPA BASINS, ODEQProjection: Lambert Conformal Conic
N
EW
S
Lost River WatershedStreamsCalifornia Listed SegmentsOregon Listed SegmentsCountiesOregon-California Border
20 0 20 40 Miles
Lost RiverTemperatureFecal ColiformDissolved OxygenChlorophyll a
Lower Klamath Lake National Wildlife RefugepH
KLAMATH
LAKE
MODOCSISKIYOU
Klamath Straits DrainTemperatureDissolved OxygenChlorophyll-apHAmmoniaFecal Coliform
Tule LakepH
Tule and Mt. Dome HSANutrients, Temperature
Clear Lake and Boles HSANutrients, Temperature
Figure 3-2. Location of Oregon and California impaired segments for the Lost River, Lower
Klamath Lake National Wildlife Refuge and the Klamath Straits Drain.
Data Review and Modeling Approach
32 Water Quality Data Review
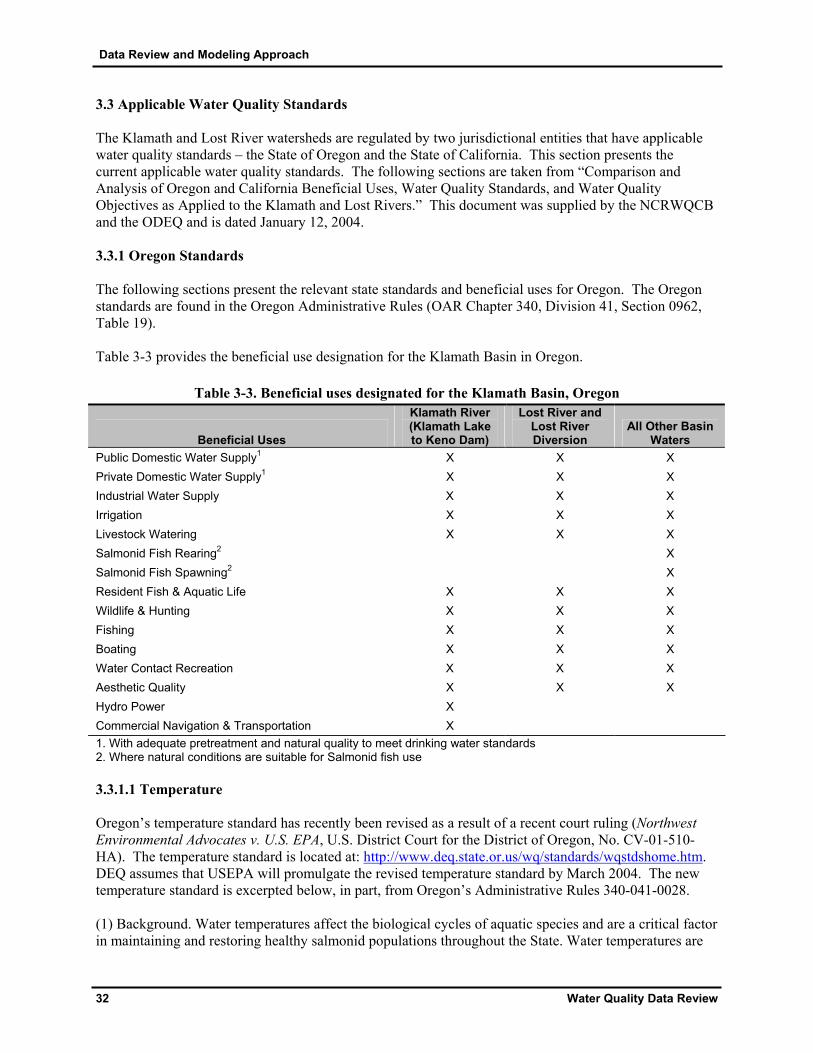
3.3 Applicable Water Quality Standards The Klamath and Lost River watersheds are regulated by two jurisdictional entities that have applicable water quality standards – the State of Oregon and the State of California. This section presents the current applicable water quality standards. The following sections are taken from “Comparison and Analysis of Oregon and California Beneficial Uses, Water Quality Standards, and Water Quality Objectives as Applied to the Klamath and Lost Rivers.” This document was supplied by the NCRWQCB and the ODEQ and is dated January 12, 2004. 3.3.1 Oregon Standards The following sections present the relevant state standards and beneficial uses for Oregon. The Oregon standards are found in the Oregon Administrative Rules (OAR Chapter 340, Division 41, Section 0962, Table 19). Table 3-3 provides the beneficial use designation for the Klamath Basin in Oregon.
Table 3-3. Beneficial uses designated for the Klamath Basin, Oregon
Beneficial Uses
Klamath River (Klamath Lake to Keno Dam)
Lost River and Lost River Diversion
All Other Basin Waters
Public Domestic Water Supply1 X X X Private Domestic Water Supply1 X X X Industrial Water Supply X X X Irrigation X X X Livestock Watering X X X Salmonid Fish Rearing2 X Salmonid Fish Spawning2 X Resident Fish & Aquatic Life X X X Wildlife & Hunting X X X Fishing X X X Boating X X X Water Contact Recreation X X X Aesthetic Quality X X X Hydro Power X Commercial Navigation & Transportation X 1. With adequate pretreatment and natural quality to meet drinking water standards 2. Where natural conditions are suitable for Salmonid fish use 3.3.1.1 Temperature Oregon’s temperature standard has recently been revised as a result of a recent court ruling (Northwest Environmental Advocates v. U.S. EPA, U.S. District Court for the District of Oregon, No. CV-01-510-HA). The temperature standard is located at: http://www.deq.state.or.us/wq/standards/wqstdshome.htm. DEQ assumes that USEPA will promulgate the revised temperature standard by March 2004. The new temperature standard is excerpted below, in part, from Oregon’s Administrative Rules 340-041-0028. (1) Background. Water temperatures affect the biological cycles of aquatic species and are a critical factor in maintaining and restoring healthy salmonid populations throughout the State. Water temperatures are

Data Review and Modeling Approach
Water Quality Data Review 33
influenced by solar radiation, stream shade, ambient air temperatures, channel morphology, groundwater inflows, and stream velocity, volume, and flow. Surface water temperatures may also be warmed by anthropogenic activities such as discharging heated water, changing stream width or depth, reducing stream shading, and water withdrawals. (2) Policy. It is the policy of the Commission to protect aquatic ecosystems from adverse warming and cooling caused by anthropogenic activities. The Commission intends to minimize the risk to cold-water aquatic ecosystems from anthropogenic warming, to encourage the restoration and protection of critical aquatic habitat, and to control extremes in temperature fluctuations due to anthropogenic activities. The Commission recognizes that some of the State’s waters will, in their natural condition, not provide optimal thermal conditions at all places and at all times that salmonid use occurs. Therefore, it is especially important to minimize additional warming due to anthropogenic sources. In addition, the Commission acknowledges that control technologies, best management practices and other measures to reduce anthropogenic warming are evolving and that the implementation to meet these criteria will be an iterative process. Finally, the Commission notes that it will reconsider beneficial use designations in the event that man-made obstructions or barriers to anadromous fish passage are removed and may justify a change to the beneficial use for that water body. (3) Purpose. The purpose of the temperature criteria in this rule is to protect designated temperature-sensitive, beneficial uses, including specific salmonid life cycle stages in waters of the State. (4) Biologically Based Numeric Criteria. Unless superseded by the natural conditions criteria described in section (8) of this rule, or by subsequently adopted site-specific criteria approved by EPA, the temperature criteria for State waters supporting salmonid fishes are as follows: (4)(e) The seven-day-average maximum temperature of a stream identified as having Lahontan cutthroat trout or redband trout use on subbasin maps and tables set out in OAR 340-041-0101 to OAR 340-041-0340: Tables 120B, 140B, 190B, and 250B, and figures 180A, 201A, and 260A may not exceed 20.0 degrees Celsius (68.0 degrees Fahrenheit); (5) Unidentified Tributaries. For waters that are not identified on the fish use maps and tables referenced in section (4) of this rule, the applicable criteria for these waters are the same criteria as is applicable to the nearest downstream water body depicted on the applicable map. (8) Natural Conditions Criteria. Where the department determines that the natural thermal potential of all or a portion of a water body exceeds the biologically-based criteria in section (4) of this rule, the natural thermal potential temperatures supersede the biologically-based criteria, and are deemed to be the applicable temperature criteria for that water body. (9) Cool Water Species. Waters that support cool water species may not be warmed by more than 0.3 degrees Celsius (0.5 degrees Fahrenheit) above the ambient condition unless a greater increase would not reasonably be expected to adversely affect fish or other aquatic life. Cool waters of the State are described on subbasin tables set out in OAR 340-041-0101 to OAR 340-041-0340: Tables 140B, 180B, 201B, and 250B. Oregon administrative rule, OAR 340-04l-0002(12), defines "Cool-Water Aquatic Life" as aquatic organisms that are physiologically restricted to cool waters, including but not limited to native sturgeon, pacific lamprey, suckers, chub, sculpins and certain species of cyprinids (minnows). Figure 180A indicates that the mainstem of the Lost River, the Klamath River from Upper Klamath Lake to Keno Dam and the Klamath Straits Drain are designated for the protection of cool water species. The mainstem of the Klamath River from Keno Dam to the state line is designated as redband trout.

Data Review and Modeling Approach
34 Water Quality Data Review
3.3.1.2 Dissolved Oxygen The dissolved oxygen standard is excerpted below, in part, from Oregon’s Administrative Rules 340-041-0965(2)(a). (a) For waterbodies identified by ODEQ as providing salmonid spawning, during the periods from spawning until fry emergence from the gravels, the following criteria apply: (A) The dissolved oxygen shall not be less than 11.0 mg/L. However, if the minimum intergravel dissolved oxygen, measured as a spatial median, is 8.0 mg/l or greater, then the DO criterion is 9.0 mg/l; (b) For waterbodies identified by ODEQ as providing cold-water aquatic life, the dissolved oxygen shall not be less than 8.0 mg/l as an absolute minimum. Where conditions of barometric pressure, altitude, and temperature preclude attainment of the 8.0 mg/l, dissolved oxygen shall not be less than 90 percent of saturation. At the discretion of ODEQ, when it is determined that adequate information exists, the dissolved oxygen shall not fall below 8.0 mg/l as a 30-day mean minimum, 6.5 mg/l as a seven-day minimum mean, and shall not fall below 6.0 mg/l as an absolute minimum; (c) For waterbodies identified by ODEQ as providing cool-water aquatic life, the dissolved oxygen shall not be less than 6.5 mg/l as an absolute minimum. At the discretion of ODEQ, when it is determined that adequate information exists, the dissolved oxygen shall not fall below 6.5 mg/l as a 30-day mean minimum, 5.0 mg/l as a seven-day minimum mean, and shall not fall below 4.0 mg/l as an absolute minimum; (d) For waterbodies identified by ODEQ as providing warm-water aquatic life, the dissolved oxygen shall not be less than 5.5 mg/l as an absolute minimum. At the discretion of ODEQ, when it is determined that adequate information exists, the dissolved oxygen shall not fall below 5.5 mg/l as a 30-day mean minimum, and shall not fall below 4.0 mg/l as an absolute minimum. 3.3.1.3 pH The pH standard is excerpted below, in part, from Oregon’s Administrative Rules 340-041-0965(2)(d). Fresh waters (except Cascade lakes): pH values shall not fall outside the range of 6.5 to 9.0. 3.3.1.4 Bacteria (Fecal Coliform) The bacteria standard is excerpted below, in part, from Oregon’s Administrative Rules 340-041-0965(2)(e)(A). Numeric Criteria: Organisms of the coliform group commonly associated with fecal sources (MPN or equivalent membrane filtration using a representative number of samples) shall not exceed the criteria described in subparagraphs (i) and (ii) of this paragraph. Freshwaters:
(i) A 30-day log mean of 126 E. coli organisms per 100 ml.
(ii) No single sample shall exceed 406 E. coli organisms per 100 ml.
3.3.1.5 Chlorophyll a The chlorophyll a standard is excerpted below, in part, from Oregon’s Administrative Rules 340-041-0150(1)(b).
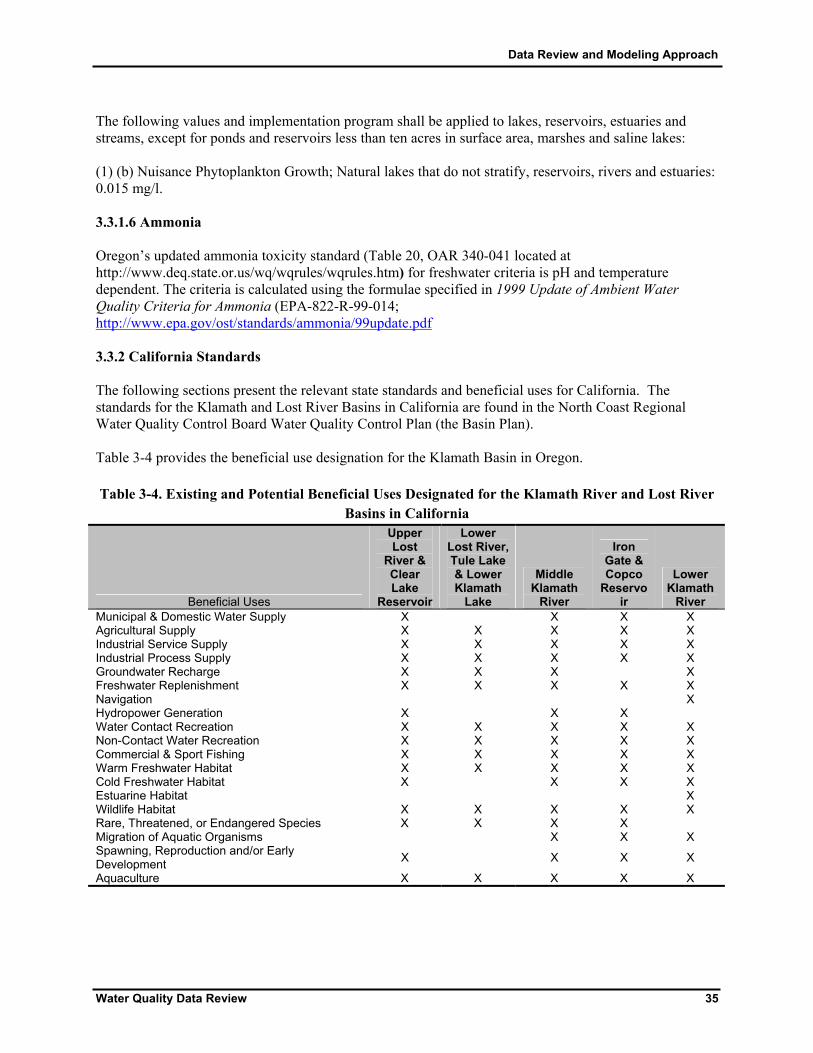
Data Review and Modeling Approach
Water Quality Data Review 35
The following values and implementation program shall be applied to lakes, reservoirs, estuaries and streams, except for ponds and reservoirs less than ten acres in surface area, marshes and saline lakes: (1) (b) Nuisance Phytoplankton Growth; Natural lakes that do not stratify, reservoirs, rivers and estuaries: 0.015 mg/l. 3.3.1.6 Ammonia Oregon’s updated ammonia toxicity standard (Table 20, OAR 340-041 located at http://www.deq.state.or.us/wq/wqrules/wqrules.htm) for freshwater criteria is pH and temperature dependent. The criteria is calculated using the formulae specified in 1999 Update of Ambient Water Quality Criteria for Ammonia (EPA-822-R-99-014; http://www.epa.gov/ost/standards/ammonia/99update.pdf 3.3.2 California Standards The following sections present the relevant state standards and beneficial uses for California. The standards for the Klamath and Lost River Basins in California are found in the North Coast Regional Water Quality Control Board Water Quality Control Plan (the Basin Plan). Table 3-4 provides the beneficial use designation for the Klamath Basin in Oregon. Table 3-4. Existing and Potential Beneficial Uses Designated for the Klamath River and Lost River
Basins in California
Beneficial Uses
Upper Lost
River & Clear Lake
Reservoir
Lower Lost River, Tule Lake & Lower Klamath
Lake
Middle Klamath
River
Iron Gate & Copco
Reservoir
Lower Klamath
River Municipal & Domestic Water Supply X X X X Agricultural Supply X X X X X Industrial Service Supply X X X X X Industrial Process Supply X X X X X Groundwater Recharge X X X X Freshwater Replenishment X X X X X Navigation X Hydropower Generation X X X Water Contact Recreation X X X X X Non-Contact Water Recreation X X X X X Commercial & Sport Fishing X X X X X Warm Freshwater Habitat X X X X X Cold Freshwater Habitat X X X X Estuarine Habitat X Wildlife Habitat X X X X X Rare, Threatened, or Endangered Species X X X X Migration of Aquatic Organisms X X X Spawning, Reproduction and/or Early Development X X X X
Aquaculture X X X X X
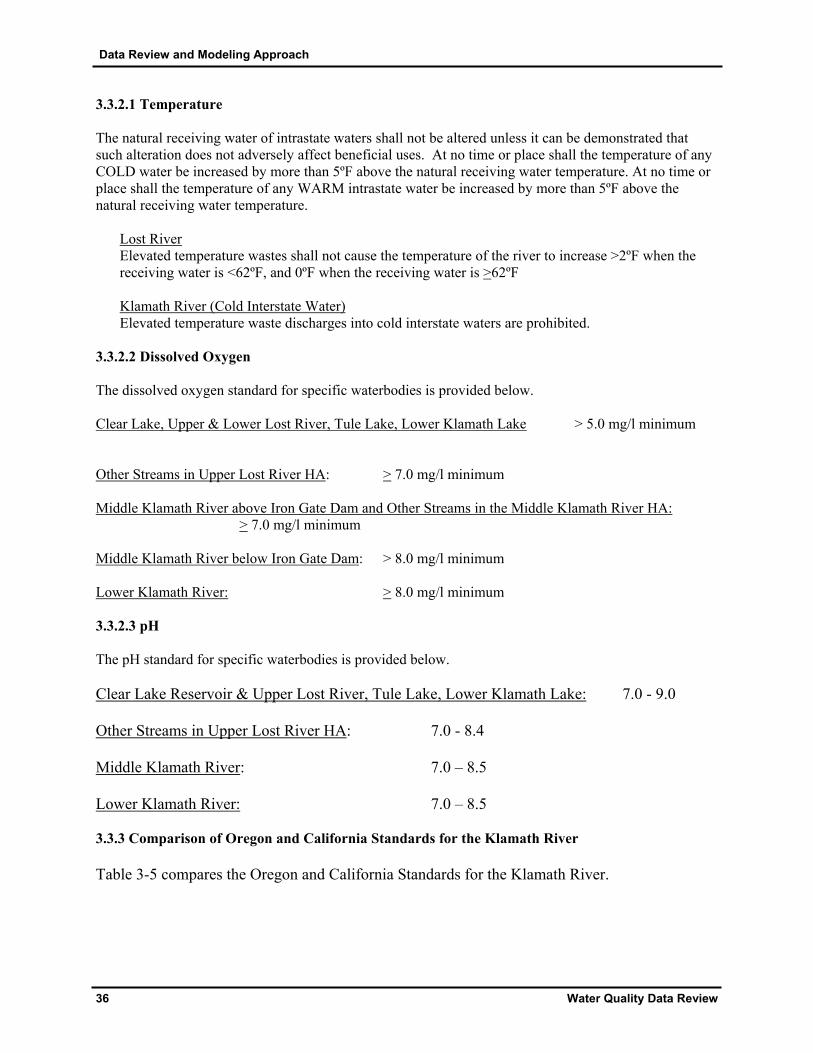
Data Review and Modeling Approach
36 Water Quality Data Review
3.3.2.1 Temperature The natural receiving water of intrastate waters shall not be altered unless it can be demonstrated that such alteration does not adversely affect beneficial uses. At no time or place shall the temperature of any COLD water be increased by more than 5ºF above the natural receiving water temperature. At no time or place shall the temperature of any WARM intrastate water be increased by more than 5ºF above the natural receiving water temperature.
Lost River Elevated temperature wastes shall not cause the temperature of the river to increase >2ºF when the receiving water is <62ºF, and 0ºF when the receiving water is >62ºF Klamath River (Cold Interstate Water) Elevated temperature waste discharges into cold interstate waters are prohibited.
3.3.2.2 Dissolved Oxygen The dissolved oxygen standard for specific waterbodies is provided below.
Clear Lake, Upper & Lower Lost River, Tule Lake, Lower Klamath Lake > 5.0 mg/l minimum
Other Streams in Upper Lost River HA: > 7.0 mg/l minimum
Middle Klamath River above Iron Gate Dam and Other Streams in the Middle Klamath River HA: > 7.0 mg/l minimum Middle Klamath River below Iron Gate Dam: > 8.0 mg/l minimum Lower Klamath River: > 8.0 mg/l minimum 3.3.2.3 pH The pH standard for specific waterbodies is provided below. Clear Lake Reservoir & Upper Lost River, Tule Lake, Lower Klamath Lake: 7.0 - 9.0
Other Streams in Upper Lost River HA: 7.0 - 8.4
Middle Klamath River: 7.0 – 8.5
Lower Klamath River: 7.0 – 8.5 3.3.3 Comparison of Oregon and California Standards for the Klamath River Table 3-5 compares the Oregon and California Standards for the Klamath River.

Data Review and Modeling Approach
Water Quality Data Review 37
Table 3-5. Comparison of Oregon Water Quality Standards and California Water Quality Objectives for the Klamath River
Parameter California Oregon
Temperature
No alteration that adversely affects beneficial uses. Max increase COLD <5F. Prohibition on discharge into interstate waters.
The seven-day-average maximum temperature of a stream identified redband trout use may not exceed 20.0 degrees Celsius (68.0 degrees Fahrenheit)
Dissolved Oxygen Above Iron Gate Dam: >7.0 mg/L. Below Iron Gate Dam: >8.0 mg/L
Cool water: 6.5 mg/l as a 30-day mean minimum, 5.0 mg/l as a seven-day minimum mean, and shall not fall below 4.0 mg/l as an absolute minimum
pH 7.0-8.5 6.5-9.0
Nutrients Not in amounts that promote aquatic growths that cause nuisance or affect beneficial uses.
No objective.
Ammonia NA pH and temperature dependent criteria using formula in EPA-822-R-99-014
chlorophyll-a No objective. Nuisance criteria: <0.015 mg/L
3.3.3.1 Temperature The Klamath river from RM 231 to 250, the Lost River and Klamath Straits Drain in Oregon were 303(d) listed in 2002 for temperature via a provision in Oregon’s old temperature standard which stated: “There shall be no measurable increase in temperature in Oregon waters when dissolved oxygen (DO) levels are within 0.5 mg/l or 10 percent of the water column or intergravel DO criterion for a given stream reach or subbasin.” This provision is no longer included in the revised temperature standard. However, temperature modeling will be required to meet California’s water quality standards and objectives for the Lost River. Temperature modeling will also be required for the Klamath River upstream of Keno Dam (RM 231) to support temperature TMDLs in the remaining segments (RM 207 to 231) of the Klamath River that are listed for redband trout rearing criteria of 20°C. California’s narrative objective calls for no alteration of natural receiving water temperatures. Application of this objective requires interpretation to characterize natural receiving water temperatures to assess the status of a water body with respect to the objective. Modeling results would likely play an important role in characterizing natural conditions and in assessing the potential for change. California also has a prohibition on thermal discharges to COLD interstate waters, including the Klamath mainstem. Oregon rules (OAR 340-04l-0002) adopt the term “Natural Thermal Potential” which means the determination of the thermal profile of a water body using best available methods of analysis and the best available information on the site potential riparian vegetation, stream geomorphology, stream flows and other measures to reflect natural conditions. In the case of temperature criteria, the natural condition of a subbasin or stream reach is the anticipated thermal potential of the subbasin or stream reach. Further, it is the policy of Oregon DEQ to protect aquatic ecosystems from adverse warming and cooling caused by anthropogenic activities. The Department recognizes that some of the State’s waters will, in their natural condition, not provide optimal thermal conditions at all places and at all times that salmonid use occurs. Therefore, it is especially important to minimize additional warming due to anthropogenic sources.
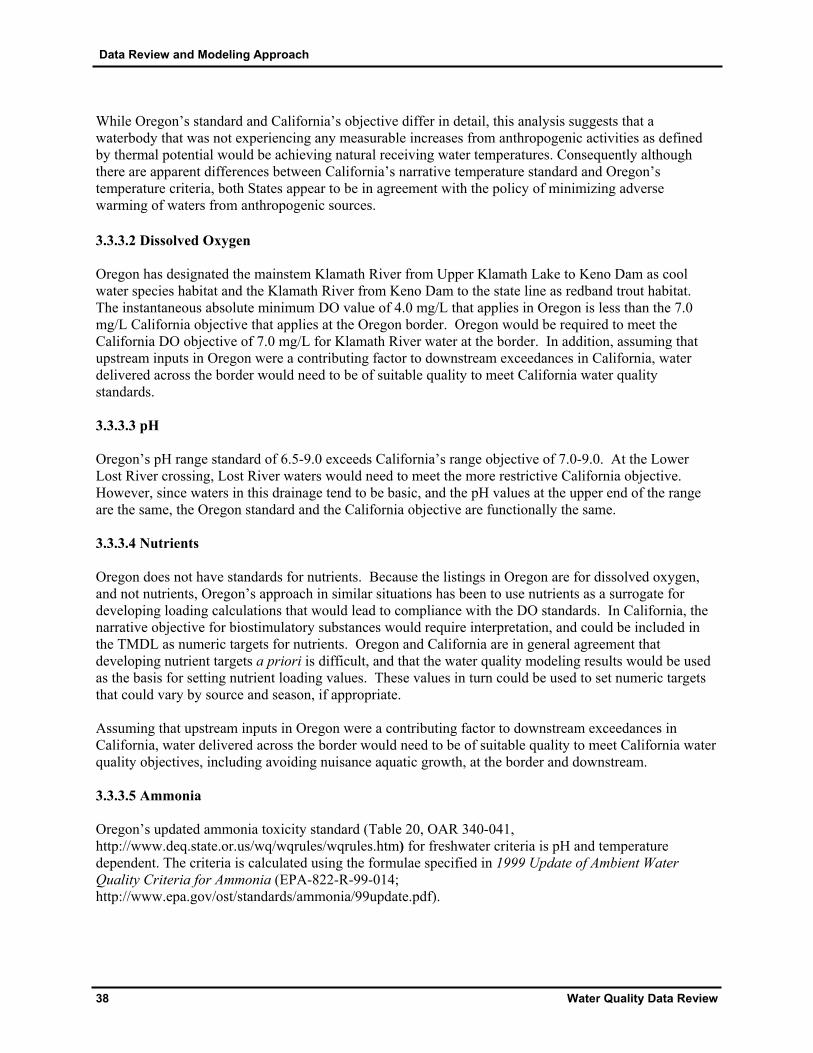
Data Review and Modeling Approach
38 Water Quality Data Review
While Oregon’s standard and California’s objective differ in detail, this analysis suggests that a waterbody that was not experiencing any measurable increases from anthropogenic activities as defined by thermal potential would be achieving natural receiving water temperatures. Consequently although there are apparent differences between California’s narrative temperature standard and Oregon’s temperature criteria, both States appear to be in agreement with the policy of minimizing adverse warming of waters from anthropogenic sources. 3.3.3.2 Dissolved Oxygen Oregon has designated the mainstem Klamath River from Upper Klamath Lake to Keno Dam as cool water species habitat and the Klamath River from Keno Dam to the state line as redband trout habitat. The instantaneous absolute minimum DO value of 4.0 mg/L that applies in Oregon is less than the 7.0 mg/L California objective that applies at the Oregon border. Oregon would be required to meet the California DO objective of 7.0 mg/L for Klamath River water at the border. In addition, assuming that upstream inputs in Oregon were a contributing factor to downstream exceedances in California, water delivered across the border would need to be of suitable quality to meet California water quality standards. 3.3.3.3 pH Oregon’s pH range standard of 6.5-9.0 exceeds California’s range objective of 7.0-9.0. At the Lower Lost River crossing, Lost River waters would need to meet the more restrictive California objective. However, since waters in this drainage tend to be basic, and the pH values at the upper end of the range are the same, the Oregon standard and the California objective are functionally the same. 3.3.3.4 Nutrients Oregon does not have standards for nutrients. Because the listings in Oregon are for dissolved oxygen, and not nutrients, Oregon’s approach in similar situations has been to use nutrients as a surrogate for developing loading calculations that would lead to compliance with the DO standards. In California, the narrative objective for biostimulatory substances would require interpretation, and could be included in the TMDL as numeric targets for nutrients. Oregon and California are in general agreement that developing nutrient targets a priori is difficult, and that the water quality modeling results would be used as the basis for setting nutrient loading values. These values in turn could be used to set numeric targets that could vary by source and season, if appropriate. Assuming that upstream inputs in Oregon were a contributing factor to downstream exceedances in California, water delivered across the border would need to be of suitable quality to meet California water quality objectives, including avoiding nuisance aquatic growth, at the border and downstream. 3.3.3.5 Ammonia Oregon’s updated ammonia toxicity standard (Table 20, OAR 340-041, http://www.deq.state.or.us/wq/wqrules/wqrules.htm) for freshwater criteria is pH and temperature dependent. The criteria is calculated using the formulae specified in 1999 Update of Ambient Water Quality Criteria for Ammonia (EPA-822-R-99-014; http://www.epa.gov/ost/standards/ammonia/99update.pdf).
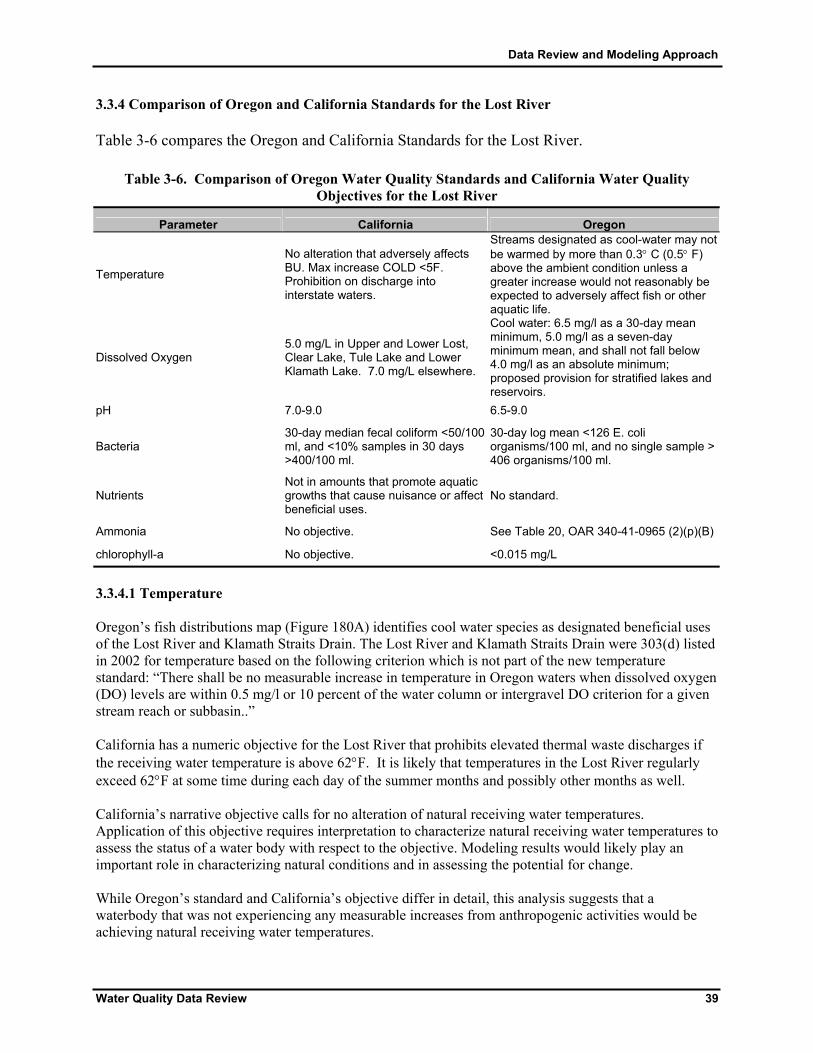
Data Review and Modeling Approach
Water Quality Data Review 39
3.3.4 Comparison of Oregon and California Standards for the Lost River Table 3-6 compares the Oregon and California Standards for the Lost River.
Table 3-6. Comparison of Oregon Water Quality Standards and California Water Quality Objectives for the Lost River
Parameter California Oregon
Temperature
No alteration that adversely affects BU. Max increase COLD <5F. Prohibition on discharge into interstate waters.
Streams designated as cool-water may not be warmed by more than 0.3° C (0.5° F) above the ambient condition unless a greater increase would not reasonably be expected to adversely affect fish or other aquatic life.
Dissolved Oxygen 5.0 mg/L in Upper and Lower Lost, Clear Lake, Tule Lake and Lower Klamath Lake. 7.0 mg/L elsewhere.
Cool water: 6.5 mg/l as a 30-day mean minimum, 5.0 mg/l as a seven-day minimum mean, and shall not fall below 4.0 mg/l as an absolute minimum; proposed provision for stratified lakes and reservoirs.
pH 7.0-9.0 6.5-9.0
Bacteria 30-day median fecal coliform <50/100 ml, and <10% samples in 30 days >400/100 ml.
30-day log mean <126 E. coli organisms/100 ml, and no single sample > 406 organisms/100 ml.
Nutrients Not in amounts that promote aquatic growths that cause nuisance or affect beneficial uses.
No standard.
Ammonia No objective. See Table 20, OAR 340-41-0965 (2)(p)(B)
chlorophyll-a No objective. <0.015 mg/L
3.3.4.1 Temperature Oregon’s fish distributions map (Figure 180A) identifies cool water species as designated beneficial uses of the Lost River and Klamath Straits Drain. The Lost River and Klamath Straits Drain were 303(d) listed in 2002 for temperature based on the following criterion which is not part of the new temperature standard: “There shall be no measurable increase in temperature in Oregon waters when dissolved oxygen (DO) levels are within 0.5 mg/l or 10 percent of the water column or intergravel DO criterion for a given stream reach or subbasin..” California has a numeric objective for the Lost River that prohibits elevated thermal waste discharges if the receiving water temperature is above 62°F. It is likely that temperatures in the Lost River regularly exceed 62°F at some time during each day of the summer months and possibly other months as well. California’s narrative objective calls for no alteration of natural receiving water temperatures. Application of this objective requires interpretation to characterize natural receiving water temperatures to assess the status of a water body with respect to the objective. Modeling results would likely play an important role in characterizing natural conditions and in assessing the potential for change. While Oregon’s standard and California’s objective differ in detail, this analysis suggests that a waterbody that was not experiencing any measurable increases from anthropogenic activities would be achieving natural receiving water temperatures.

Data Review and Modeling Approach
40 Water Quality Data Review
3.3.4.2 Dissolved Oxygen Oregon designated fish distribution for the mainstem Lost River as cool-water habitat, to which an absolute minimum of 6.5 mg/L DO would apply. California’s DO objective for both the Clear Lake Reservoir area and the Lower Lost River is a minimum value of 5.0 mg/L. California would be required to meet the Oregon DO objectives where the Lost crosses into Oregon above Malone Reservoir, and where the Klamath Straits Drain crosses out of California. Oregon’s standard exceeds California’s objective for the Lower Lost River, so water meeting Oregon’s standard would meet California’s objective. However, for either state, assuming that upstream inputs were a contributing factor to downstream exceedances, water delivered across the border would need to be of suitable quality to meet the other state’s water quality standards or objectives as appropriate. 3.3.4.3 pH Oregon’s pH range standard of 6.5-9.0 exceeds California’s range objective of 7.0-9.0. For the purpose of TMDL development, the Lost River at the OR/CA border, upstream of Tule Lake would need to meet the more restrictive California objective. 3.3.4.4 Bacteria The Lost River carries a listing for impairments related to bacteria. The Lost River in California is not listed as impaired for bacteria. Oregon’s standard is based on a 30-day log mean value, while California’s objective is based on a 30-day median value. It is not clear how these compare, and it may only be possible to make such a comparison on a case-by-case basis. In any case, the TMDL analysis would need to address the requirement that water crossing the border from Lower Klamath Lake and the Straits Drain into Oregon meet Oregon’s standard. Water crossing the border in the Lost River upstream of Tule Lake would need to meet California’s objective; this is a water quality compliance issue, however, and not a TMDL issue. 3.3.4.5 Nutrients Oregon does not have standards for nutrients. Because the listings in Oregon are for dissolved oxygen, and not nutrients, Oregon’s approach in similar situations has been to use nutrients as a surrogate for developing loading calculations that would lead to compliance with the DO standards. In California, the narrative objective for biostimulatory substances would require interpretation, and could be included in the TMDL as numeric targets for nutrients. Oregon and California are in general agreement that developing nutrient targets a priori is not appropriate and that the water quality modeling results will be used as the basis for setting nutrient loading capacity and load allocations. These values in turn could be used to set numeric targets that could vary by source and season, if appropriate. Assuming that upstream inputs in Oregon were a contributing factor to downstream exceedances in California, water delivered across the border just upstream of Tule Lake would need to be of suitable quality to meet California water quality objectives, including avoiding nuisance aquatic growth, at the border and downstream.
3.3.4.6 Ammonia Oregon’s ammonia toxicity standard would need to be met in water crossing the border above Malone Reservoir, and from Lower Klamath Lake into the Straits Drain. As part of the TMDL development, upstream anthropogenic impacts in California related to ammonia toxicity inputs in California would need to be addressed in order to meet Oregon’s ammonia standard at the OR/CA border.

Data Review and Modeling Approach
Water Quality Data Review 41
3.3.4.7 Chlorophyll a Oregon’s chlorophyll-a standard would need to be met in water crossing the border above Malone Reservoir, and from Lower Klamath Lake into the Straits Drain. Assuming that upstream inputs in California were a contributing factor to downstream exceedances in Oregon, water delivered across the border would need to be of suitable quality to meet Oregon water quality standards. 3.4 Water Quality Impairment Status This section presents separate summaries and evaluations of currently available water quality data for the Klamath and Lost Rivers (with the exception of data received with the last two months). Water quality impairments were determined using the standards and data available at the time that this report was written. Water chemistry data presented in the following sections were obtained from numerous sources including the ODEQ, USBR, NCRWQCB, City of Klamath Falls, USGS, and PacifiCorp Inc. Tables 3-7 and 3-8 below provide summaries of the datasets obtained including the source of the data, the dataset name (if applicable), the types of parameters sampled and the period of record. The database provided by PacifiCorp contains most of the readily available public water quality sampling data (including STORET) up to 1998. After 1998, the data is noted by PacifiCorp to be incomplete. The water quality database provided by PacifiCorp was used as a template to create a database for the Lost River data. Additional data obtained for the Klamath River will be added to the PacifiCorp database to provide a comprehensive database of samples collected on the Klamath River. Some datasets are listed in both tables as the dataset contained data for stations on both the Klamath and Lost Rivers.
Table 3-7. Datasets containing water quality observations on the Klamath River and tributaries.
Source Dataset Parameters Sampled* Period of Record
NCRWQCB 104b Sampling Data
DO, nutrients, pH, temperature, TDS, TSS, conductivity, BOD, COD 1996-1998
USBR Klamath Project Sampling
DO, nutrients, pH, temperature, TDS, conductivity, BOD, metals, turbidity, chlorophyll a, alkalinity 1972-2003
USGS DO, nutrients, pH, temperature, conductivity, metals, chlorophyll a, alkalinity, pheophytin a 2002-2003
ODEQ DO, nutrients, pH, temperature, conductivity, BOD, COD, metals, turbidity, chlorophyll a, alkalinity, pheophytin a, E. coli, fecal coliforms, total solids, TSS
1967-2003
SWAMP DO, nutrients, pH, temperature, conductivity, metals, alkalinity, chlorophyll a 2002-2003
PacifiCorp PacifiCorp Klamath Water Quality Database
DO, nutrients, pH, temperature, conductivity, BOD, COD, metals, turbidity, chlorophyll a, alkalinity, pheophytin a, E. coli, fecal coliforms, total solids, TSS
1950-2001
* list of parameters is not exhaustive

Data Review and Modeling Approach
42 Water Quality Data Review
Table 3-8. Datasets containing water quality observations on the Lost River and tributaries (including the Klamath Straits Drain).
Source Dataset Parameters Sampled* Period of Record
NCRWQCB 104b Sampling Data
DO, nutrients, pH, temperature, TDS, TSS, conductivity, BOD, COD 1996-1998, 2003
USBR Klamath Project Sampling
DO, nutrients, pH, temperature, TDS, conductivity, BOD, metals, turbidity, chlorophyll a, alkalinity 1972-2003
USGS DO, nutrients, pH, temperature, conductivity, metals, chlorophyll a, alkalinity, pheophytin a 2002
ODEQ DO, nutrients, pH, temperature, conductivity, BOD, COD, metals, turbidity, chlorophyll a, alkalinity, pheophytin a, E. coli, fecal coliforms, total solids, TSS,
1967-2003
UC – Davis nutrients, pH, temperature, conductivity, 1999-2000
PacifiCorp PacifiCorp Klamath Water Quality Database
DO, nutrients, pH, temperature, conductivity, BOD, COD, metals, turbidity, chlorophyll a, alkalinity, pheophytin a, E. coli, fecal coliforms, total solids, TSS
1950-2001
* list of parameters is not exhaustive 3.4.1 Klamath River The sections below describe the available water quality data for segments of the Klamath River. The Oregon 2002 303(d) list reported that the Klamath River from Upper Klamath Lake to the stateline was impaired because of pH, ammonia, nutrients, temperature, low dissolved oxygen and chlorophyll a (ODEQ, 2002). The California 2002 303(d) list reported that the entire length of the Klamath River was impaired from stateline to the river’s confluence with the Pacific Ocean because of nutrients, organic enrichment/low dissolved oxygen, and temperature. These causes of impairment were impairing agricultural, aquatic life, hydropower generation, industrial supply, wildlife habitat, aquaculture, drinking water, fishery, recreation, and swimmable uses. 3.4.1.1 Klamath River above Iron Gate Dam The focus of the current document is the Klamath River below Iron Gate Dam. As the river above Iron Gate Dam will be addressed in the near future, the data from the PacifiCorp database for stations above Iron Gate is summarized in Tables C-1 through C-14 in Appendix C. The new data for stations above Iron Gate Dam has not yet been analyzed. The tables provide summaries of the available data including the minimum value, maximum value and average value observed at each station in addition to the number of observations and the period of record. 3.4.1.2 Klamath River below Iron Gate Dam Data for stations below Iron Gate Dam was obtained from PacifiCorp’s database and from new data provided by ODEQ, NCRWQCB, and USBR. The different agencies often assigned different station names to similar sites. In the PacifiCorp database all data sampled at similar sites were analyzed together and only one Site ID is reported. Site IDs were also created for the new data that has been provided. As this new data has not yet been incorporated into the PacifiCorp database there are instances where two Site IDs exist for the same station, one in the PacifiCorp database and one in the new dataset. Due to time constraints, the datasets were analyzed separately and the tables below list both stations separately. Stations at the same location will have the same Site Name but different Site IDs. When all the data is received and incorporated into the database a set of unique Site IDs will be created for all future data

Data Review and Modeling Approach
Water Quality Data Review 43
analysis. The discussion below provides a review of available data to evaluate the water quality impairment status. 3.4.1.2.1 Temperature Temperature data for the Klamath River are available from 11 monitoring stations in California (Figure 3-3). Table 3-9 below provides a summary of the available temperature data including the minimum value, maximum value and average value observed at each station in addition to the number of observations and the period of record. The following table only includes stations with at least 10 temperature observations and includes only instantaneous temperature measurements not continuous observations from a data logger.
Table 3-9. Summary of temperature data, Klamath River (°C). Site ID Site Name Count Average Min Max Start Date End Date KR18973 Iron Gate Dam Outflow 34 17.10 7.1 22.6 4/5/1996 10/8/1997KRBIGD Klamath River below Iron Gate Dam 217 19.18 7.11 39.0 3/17/1998 6/18/2003KR18238 Klamath River u/s of Cottonwood Creek 33 17.59 9.2 25.7 4/5/1996 10/8/1997KRUSHR Klamath River u/s of Shasta River 19 22.27 19.0 24.8 8/7/2000 6/12/2003KR17607 Klamath River d/s of Shasta River 33 17.24 9.9 24.7 4/5/1996 10/8/1997KR16075 Klamath River d/s of Beaver Creek 33 16.61 5.4 23.4 4/3/1996 10/24/1997KRDEVC Klamath River d/s of Everill Creek 10 19.95 12.50 34.0 2/27/2002 6/17/2003KRUSCR Klamath River u/s of Scott River 16 22.03 17.50 26.26 6/5/2000 6/12/2003KR14260 Klamath River d/s of Scott River 33 17.14 9.3 23.4 4/3/1996 10/24/1997KRSV Klamath River at Seiad Valley 218 18.31 6.86 43 3/18/1998 6/17/2003KRWE Klamath River at Weithpec 20 17.70 9.5 26 2/25/2002 6/11/2003 Seven of the stations had temperature data for the critical summer months of June, July and August. Figure 3-4 through 3-6 show the average and maximum temperatures at these stations moving downstream along the Klamath River. In June the average temperatures are close together, ranging from about 17°C to about 21°C. In July the average temperatures ranged between 20°C and 25°C and that pattern continued into August.

Data Review and Modeling Approach
44 Water Quality Data Review
60 0 60 Miles
%[%[%[
%[
%[%[%[
#Y
#Y
#Y
#Y#Y#Y#Y#Y#Y #Y#Y#Y#Y#Y#Y#Y#Y#Y #Y
#Y#Y#Y#Y#Y#Y#Y
$T
$T$T$T$T
$T$T
$T$T$T$T $T$T
$T
$T$T$T$T $T$T $T$T$T $T$T
$T$T$T$T$T$T$T$T
IRON GATE
#
KR00579
#
KR00822
#
KR04039KR05912
#
KR08434
#
KR09415
#
KR10066
#
KR10839
#
KR12855
#
KR14174
#
KR14906
#
KR16075
#
KR17607
#
KR17923
#
KR18238
#
KR18334
#
KR18417
#
#
KRKG
#
KRWE
#
KROR
#
KRBIGD
#
KRUSHR
#
KRGRA
#
KRDEVC
#
KRUSCR
#
KRSV
#
KR18952
#
KR06593KR06608
#
KR08060
#
KR14260
OregonCalifornia
#
KR18973
N
EW
S
Source: EPA BASINSProjection: Decimal Degrees Klamath Watershed
Streams%[ Dams
CaliforniaOregon
#Y New Data Sampling Sites$T Pacificorp Database Sampling Sites
Figure 3-3. Sampling sites along the Klamath River.
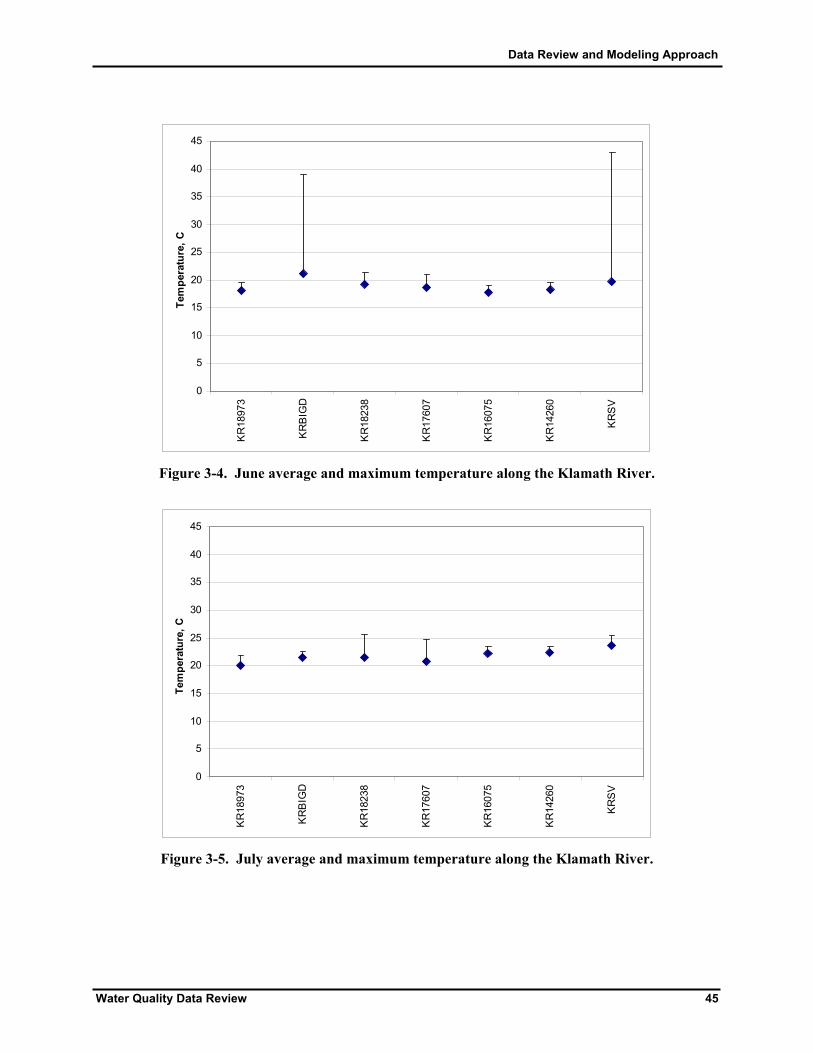
Data Review and Modeling Approach
Water Quality Data Review 45
0
5
10
15
20
25
30
35
40
45
KR
1897
3
KR
BIG
D
KR
1823
8
KR
1760
7
KR
1607
5
KR
1426
0
KR
SV
Tem
pera
ture
, C
Figure 3-4. June average and maximum temperature along the Klamath River.
0
5
10
15
20
25
30
35
40
45
KR
1897
3
KR
BIG
D
KR
1823
8
KR
1760
7
KR
1607
5
KR
1426
0
KR
SV
Tem
pera
ture
, C
Figure 3-5. July average and maximum temperature along the Klamath River.

Data Review and Modeling Approach
46 Water Quality Data Review
0
5
10
15
20
25
30
35
40
45
KR
1897
3
KR
BIG
D
KR
1823
8
KR
1760
7
KR
1607
5
KR
1426
0
KR
SV
Tem
pera
ture
, C
Figure 3-6. August average and maximum temperature along the Klamath River.
3.4.1.2.2 Nutrients Few states, including Oregon and California, have numeric nutrient standards. This is because natural concentrations of nutrients vary among streams. Also, aquatic life and stream response to nutrient concentrations vary with different systems. A summary of nutrient data in the Klamath River is presented in Tables 3-10 through 3-13. Sampling data was available for total phosphorous, dissolved orthophosphate and total ammonia and dissolved ammonia. Dissolved oxygen data can be used to help identify nutrient impairments in the Klamath River. Excess nutrients in a waterbody can lead to nuisance algal blooms and low DO concentrations. DO data for the Klamath River are summarized in the next section.
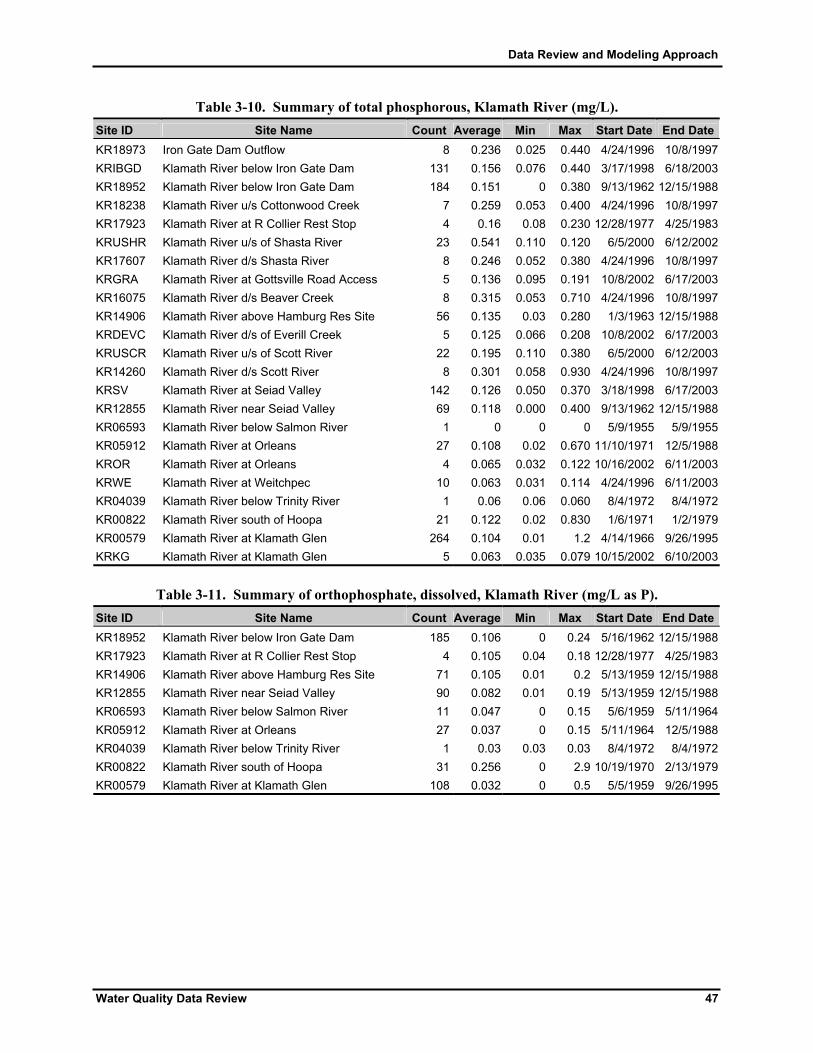
Data Review and Modeling Approach
Water Quality Data Review 47
Table 3-10. Summary of total phosphorous, Klamath River (mg/L). Site ID Site Name Count Average Min Max Start Date End DateKR18973 Iron Gate Dam Outflow 8 0.236 0.025 0.440 4/24/1996 10/8/1997KRIBGD Klamath River below Iron Gate Dam 131 0.156 0.076 0.440 3/17/1998 6/18/2003KR18952 Klamath River below Iron Gate Dam 184 0.151 0 0.380 9/13/1962 12/15/1988KR18238 Klamath River u/s Cottonwood Creek 7 0.259 0.053 0.400 4/24/1996 10/8/1997KR17923 Klamath River at R Collier Rest Stop 4 0.16 0.08 0.230 12/28/1977 4/25/1983KRUSHR Klamath River u/s of Shasta River 23 0.541 0.110 0.120 6/5/2000 6/12/2002KR17607 Klamath River d/s Shasta River 8 0.246 0.052 0.380 4/24/1996 10/8/1997KRGRA Klamath River at Gottsville Road Access 5 0.136 0.095 0.191 10/8/2002 6/17/2003KR16075 Klamath River d/s Beaver Creek 8 0.315 0.053 0.710 4/24/1996 10/8/1997KR14906 Klamath River above Hamburg Res Site 56 0.135 0.03 0.280 1/3/1963 12/15/1988KRDEVC Klamath River d/s of Everill Creek 5 0.125 0.066 0.208 10/8/2002 6/17/2003KRUSCR Klamath River u/s of Scott River 22 0.195 0.110 0.380 6/5/2000 6/12/2003KR14260 Klamath River d/s Scott River 8 0.301 0.058 0.930 4/24/1996 10/8/1997KRSV Klamath River at Seiad Valley 142 0.126 0.050 0.370 3/18/1998 6/17/2003KR12855 Klamath River near Seiad Valley 69 0.118 0.000 0.400 9/13/1962 12/15/1988KR06593 Klamath River below Salmon River 1 0 0 0 5/9/1955 5/9/1955KR05912 Klamath River at Orleans 27 0.108 0.02 0.670 11/10/1971 12/5/1988KROR Klamath River at Orleans 4 0.065 0.032 0.122 10/16/2002 6/11/2003KRWE Klamath River at Weitchpec 10 0.063 0.031 0.114 4/24/1996 6/11/2003KR04039 Klamath River below Trinity River 1 0.06 0.06 0.060 8/4/1972 8/4/1972KR00822 Klamath River south of Hoopa 21 0.122 0.02 0.830 1/6/1971 1/2/1979KR00579 Klamath River at Klamath Glen 264 0.104 0.01 1.2 4/14/1966 9/26/1995KRKG Klamath River at Klamath Glen 5 0.063 0.035 0.079 10/15/2002 6/10/2003
Table 3-11. Summary of orthophosphate, dissolved, Klamath River (mg/L as P). Site ID Site Name Count Average Min Max Start Date End DateKR18952 Klamath River below Iron Gate Dam 185 0.106 0 0.24 5/16/1962 12/15/1988KR17923 Klamath River at R Collier Rest Stop 4 0.105 0.04 0.18 12/28/1977 4/25/1983KR14906 Klamath River above Hamburg Res Site 71 0.105 0.01 0.2 5/13/1959 12/15/1988KR12855 Klamath River near Seiad Valley 90 0.082 0.01 0.19 5/13/1959 12/15/1988KR06593 Klamath River below Salmon River 11 0.047 0 0.15 5/6/1959 5/11/1964KR05912 Klamath River at Orleans 27 0.037 0 0.15 5/11/1964 12/5/1988KR04039 Klamath River below Trinity River 1 0.03 0.03 0.03 8/4/1972 8/4/1972KR00822 Klamath River south of Hoopa 31 0.256 0 2.9 10/19/1970 2/13/1979KR00579 Klamath River at Klamath Glen 108 0.032 0 0.5 5/5/1959 9/26/1995

Data Review and Modeling Approach
48 Water Quality Data Review
Table 3-12. Summary of NH3, dissolved data, Klamath River (mg/L as N). Site ID Site Name Count Average Min Max Start Date End DateKR18973 Iron Gate Dam Outflow 8 0.124 0.07 0.24 4/24/1996 10/8/1997KR18952 Klamath River below Iron Gate Dam 35 0.13 0 0.52 1/3/1979 6/12/1984KR18238 Klamath River u/s Cottonwood Creek 7 0.108 0.025 0.15 4/24/1996 10/8/1997KR17607 Klamath River d/s Shasta River 8 0.102 0.025 0.2 4/24/1996 10/8/1997KR16075 Klamath River d/s Beaver Creek 8 0.091 0.025 0.19 4/24/1996 10/8/1997KR14260 Klamath River d/s Scott River 8 0.091 0.025 0.16 4/24/1996 10/8/1997KR05912 Klamath River at Orleans 4 0.035 0 0.12 12/5/1983 5/1/1984KR00822 Klamath River south of Hoopa 1 0.02 0.02 0.02 1/2/1979 1/2/1979KR00579 Klamath River at Klamath Glen 95 0.027 0 0.29 10/25/1979 9/26/1995
Table 3-13. Summary of NH3, total data, Klamath River (mg/L as N). Site ID Site Name Count Average Min Max Start Date End DateKR18973 Iron Gate Dam Outflow 8 0.148 0.08 0.28 4/24/1996 10/8/1997KR18952 Klamath River below Iron Gate Dam 52 0.153 0.01 0.74 2/2/1977 6/2/1985KR18238 Klamath River u/s Cottonwood Creek 7 0.131 0.05 0.18 4/24/1996 10/8/1997KR17923 Klamath River at R Collier Rest Stop 1 0.78 0.78 0.78 12/28/1977 12/28/1977KR17607 Klamath River d/s Shasta River 8 0.119 0.025 0.23 4/24/1996 10/8/1997KR16075 Klamath River d/s Beaver Creek 8 0.154 0.025 0.43 4/24/1996 10/8/1997KR14260 Klamath River d/s Scott River 8 0.113 0.025 0.26 4/24/1996 10/8/1997KR05912 Klamath River at Orleans 5 0.08 0 0.2 11/10/1971 6/2/1985KR00822 Klamath River south of Hoopa 17 0.016 0 0.07 2/1/1977 11/6/1978KR00579 Klamath River at Klamath Glen 73 0.024 0 0.16 10/19/1977 11/17/1992 3.4.1.2.3 Dissolved Oxygen Dissolved oxygen data for the Klamath River are available from 30 monitoring stations in California. Table 3-14 below provides a summary of the available dissolved oxygen data including the minimum value, maximum value and average value observed at each station in addition to the number of observations and the period of record. The table includes all stations with at least 5 DO observations.

Data Review and Modeling Approach
Water Quality Data Review 49
Table 3-14. Summary of DO data, Klamath River (mg/L). Site ID Site Name Count Average Min Max Start Date End DateKR18973 Iron Gate Dam Outflow 35 8.29 6 10.8 1/9/1962 2/14/1989KRBIGD Klamath River below Iron Gate Dam 216 8.38 5.45 12.62 3/17/1998 6/18/2003KR18952 Klamath River below Iron Gate Dam 514 10.21 5 15.8 12/5/1961 4/4/1962KR18417 Klamath River at Klamathon Bar 5 11.06 10.7 11.7 5/15/1962 10/10/1972KR18334 Klamath River near Henley 82 10.43 7 13 4/5/1996 10/8/1997KR18238 Klamath River u/s of Cottonwood Creek 34 10.33 7.7 14.2 9/6/1973 8/20/1985KR17923 Klamath River at R Collier Rest Stop 31 9.43 6.6 13.5 4/5/1996 10/8/1997KRUSHR Klamath River u/s of Shasta River 19 8.48 6.45 10.52 8/7/2000 6/12/2003KR17607 Klamath River d/s of Shasta River 34 8.91 7.2 11.2 4/3/1996 10/24/1997KRGRA Klamath River at Gottsville Road Access 10 10.79 9.03 12.62 2/27/2002 6/17/2003KR16075 Klamath River d/s of Beaver Creek 33 9.4 6.9 10.8 12/2/1958 2/14/1989KR14906 Klamath River above Hamburg Res Site 287 10.45 4.5 14 4/3/1996 10/24/1997KRDEVC Klamath River d/s of Everill Creek 10 10.93 8.99 12.53 2/27/2002 6/17/2003KRUSCR Klamath River u/s of Scott River 14 8.46 6.83 9.76 6/5/200 6/12/2003KR14260 Klamath River d/s of Scott River 33 9.54 7 12.2 5/14/1985 1/22/1986KR14174 Klamath River at Sarah Totten Campground 6 11.73 10 12.4 9/10/1958 2/14/1989KRSV Klamath River at Seiad Valley 219 9.36 6.58 14.33 3/18/1998 6/17/2003KR12855 Klamath River near Seiad Valley 394 10.75 7.5 14.1 1/21/1986 1/22/1986KR10839 Klamath River above Happy Camp 5 12 11.7 12.3 8/14/1985 1/22/1986KR10066 Klamath River above Oak Flat Creek 6 11.7 8.7 12.4 8/14/1985 1/22/1986KR09415 Klamath River above Independence Creek 5 1.74 9.4 12.7 2/26/1985 1/23/1986KR08434 Klamath River above Dillon Creek 9 11.13 8.7 13.2 8/13/1985 1/23/1986KR08060 Klamath River above Ti Creek 6 11.2 8.5 12.5 1/22/1986 1/23/1986KR06608 Klamath River above Salmon River 5 12.92 12.4 13.3 4/10/1951 5/11/1964KR06593 Klamath River below Salmon River 90 10.69 7.2 14.2 1/16/1964 2/6/1989KR05912 Klamath River at Orleans 471 11.21 7.7 14.8 8/4/1972 8/4/1972KROR Klamath River at Orleans 5 12.64 10.85 14.7 10/16/2002 6/11/2003KR00822 Klamath River South of Hoopa 154 10.75 8 14 2/10/1965 3/13/1979KR00579 Klamath River at Klamath Glen 605 10.6 0.1 14.7 7/17/1951 9/26/1995KRKG Klamath River at Klamath Glen 5 11.39 9.77 13.79 10/15/2002 6/10/2003 3.4.1.2.4 Chlorophyll a Chlorophyll a data for the Klamath River are available from 5 monitoring stations in California. Table 3-15 below provides a summary of the available chlorophyll a data including the minimum value, maximum value and average value observed at each station in addition to the number of observations and the period of record. The table includes all stations with at least 5 chlorophyll a observations.

Data Review and Modeling Approach
50 Water Quality Data Review
Table 3-15. Summary of chlorophyll a data, Klamath River (ug/L). Site ID Site Name Count Average Min Max Start Date End DateKR18973 Iron Gate Dam Outflow 7 5.49 1.7 10 4/24/1996 10/8/1997KR18238 Klamath River u/s of Cottonwood Creek 7 9.63 1.7 33 4/24/1996 10/8/1997KR17607 Klamath River d/s of Shasta River 7 5.63 2.3 12 4/24/1996 10/8/1997KR16075 Klamath River d/s of Beaver Creek 7 5.54 2.3 14 4/24/1996 10/8/1997KR14260 Klamath River d/s of Scott River 7 6.03 2.1 17 4/24/1996 10/8/1997 3.4.2 Lost River The Oregon 2002 303(d) list reported that the Lost River (within Oregon) was impaired because of temperature, fecal coliforms, dissolved oxygen, and chlorophyll a. Public, private and industrial water supply, irrigation, livestock watering, resident fish and aquatic life, fishing, boating, hunting, water contact recreation and salmonid fish spawning and rearing beneficial uses were impaired by these causes in 2002. The discussion below provides a review of available data to evaluate the water quality impairment status. 3.4.2.1 Temperature Temperature data for the Lost River are available from 20 monitoring stations in Oregon and California (Figure 3-7). Table 3-16 below provides a summary of the available temperature data including the minimum value, maximum value and average value observed at each station in addition to the number of observations and the period of record. The stations are listed in downstream order starting downstream of Malone Dam. The table includes all stations with at least 10 temperature observations and includes only instantaneous temperature measurements not continuous measurements from a data logger.

Data Review and Modeling Approach
Water Quality Data Review 51
Table 3-16. Summary of temperature data, Lost River (°C). Site ID Site Name Count Average Min Max Start Date End Date LRDM Lost River d/s of Malone Dam 314 12.43 0.18 28.95 6/1/1993 11/12/2003LRJR Lost River at Johnson Road 232 12.66 0.42 30.43 6/1/1993 3/2/1999LRGR Lost River at Gift Road 207 12.63 -0.30 28.85 6/1/1993 3/2/1999LRCRF Lost River at Cheese Factory Road 191 12.10 1.00 26.95 6/1/1993 8/27/2003LRKB Lost River at Keller Bridge 328 12.86 0.21 25.40 6/1/1993 10/16/2003LR70 Lost River at Hwy 70 289 14.51 -0.21 28.09 6/1/1993 8/27/2003LRHRB Lost River at Harpold Road Bridge 421 14.93 3.99 27.76 6/1/1993 8/27/2003LRHD Lost River u/s of Harpold Dam 159 17.38 0.00 24.49 6/2/1993 11/10/2003LRHDB Lost River at Harpold Dam Bridge 507 14.87 3.35 27.76 6/1/1993 10/16/2003LRSP Lost River at Stevenson Park 11 14.16 2.52 23.28 8/1/2000 3/7/2001LROG Lost River at Olene Gap 356 14.41 1.17 27.49 6/1/1993 8/19/2003
LRWRC* Lost River at Wilson Reservoir at Crystal Springs Road 909 14.78 0.81 32.05 6/2/1993 11/14/2003
LRRR Lost River at Reeder Road 255 15.56 0.81 26.35 6/2/1993 9/19/2000LRDR Lost River at Dehlinger Road 44 15.54 1.74 25.06 1/181998 8/28/2003LRSB Lost River at Stukel Bridge 207 15.47 -0.26 25.47 6/2/1993 3/2/1999LR39 Lost River at Hwy 39 150 13.77 1.00 25.60 4/8/1970 8/27/2003LRFR Lost River at Falvey Road 34 14.62 0.02 24.47 3/4/1998 1/28/1999LRAR* Lost River at Anderson-Rose Reservoir 451 14.37 0.89 25.53 5/13/1993 11/13/2001LRMR Lost River at Malone Road 248 13.33 0.00 28.95 5/13/1993 11/12/2003LRWB Lost River at Wooden Bridge 260 14.54 1.55 26.08 6/2/1993 12/16/1998LRSR Lost River at Stateline Road 162 14.18 0.60 24.00 5/31/1996 10/16/2000LREW Lost River at East West Road 200 14.61 0.09 26.18 6/2/1993 9/19/2002*Includes all samples taken in reservoir at different depths Figures 3-8 through 3-10 show the average and maximum temperature at stations along the Lost River.

Data Review and Modeling Approach
52 Water Quality Data Review
Source: EPA BASINS, ODEQProjection: Lambert Conformal Conic
N
EW
S
20 0 20 40 Miles
#Y
#Y
#Y
#Y#Y
#Y#Y
#Y#Y
#Y
#Y#Y#Y#Y
#Y#Y#Y
#Y#Y#Y#Y
#Y
#Y#Y
#Y
#Y#Y#Y #Y#Y
#Y
#Y #Y
#Y
#Y
# LRDM
# LRJR
#
LRGR
#
MCNM
#
LRMC#
LD#
LRCFR#
IR70
#
LRKB
#
BS
#
LR70
#
LRHRB
#
BCBR
#
LRHD
#
LRHDB
#
LRHDD#
LRSP
#
LROG
#
LRWRC
#
LRWR
#
LRDD#
LRRR
#
ST48
#DR1
#LRDR
#
DR5 #
LR39#
LRFR
#
LRAR
#
LRARD
#
LRMR
#
LRWB
#
LRSR
#LREW
LOST R
TULE LAKE SWAMP
Buck Creek
MILLER CR#
LRSB
#5 Drain
#1 Drain
Oregon
California
Lost River WatershedState BoundaryMajor StreamsDrains
#Y Sampling Sites
Figure 3-7. Sampling sites along the Lost River
.

Data Review and Modeling Approach
Water Quality Data Review 53
0
5
10
15
20
25
30
35
LRD
M
LRJR
LRG
R
LRC
FR
LRK
B
LR70
LRH
RB
LRH
D
LRH
DB
LRO
G
LRW
RC
LRR
R
LRD
R
LRS
B
LR39
LRFR
LRA
R
LRM
R
LRW
B
LRS
R
LRE
W
Tem
pera
ture
, C
Figure 3-8. June average and maximum temperatures along the Lost River.
0
5
10
15
20
25
30
35
LRD
M
LRJR
LRG
R
LRC
FR
LRK
B
LR70
LRH
RB
LRH
D
LRH
DB
LRO
G
LRW
RC
LRR
R
LRD
R
LRS
B
LR39
LRFR
LRA
R
LRM
R
LRW
B
LRS
R
LRE
W
Tem
pera
ture
, C
Figure 3-9. July average and maximum temperatures along the Lost River.
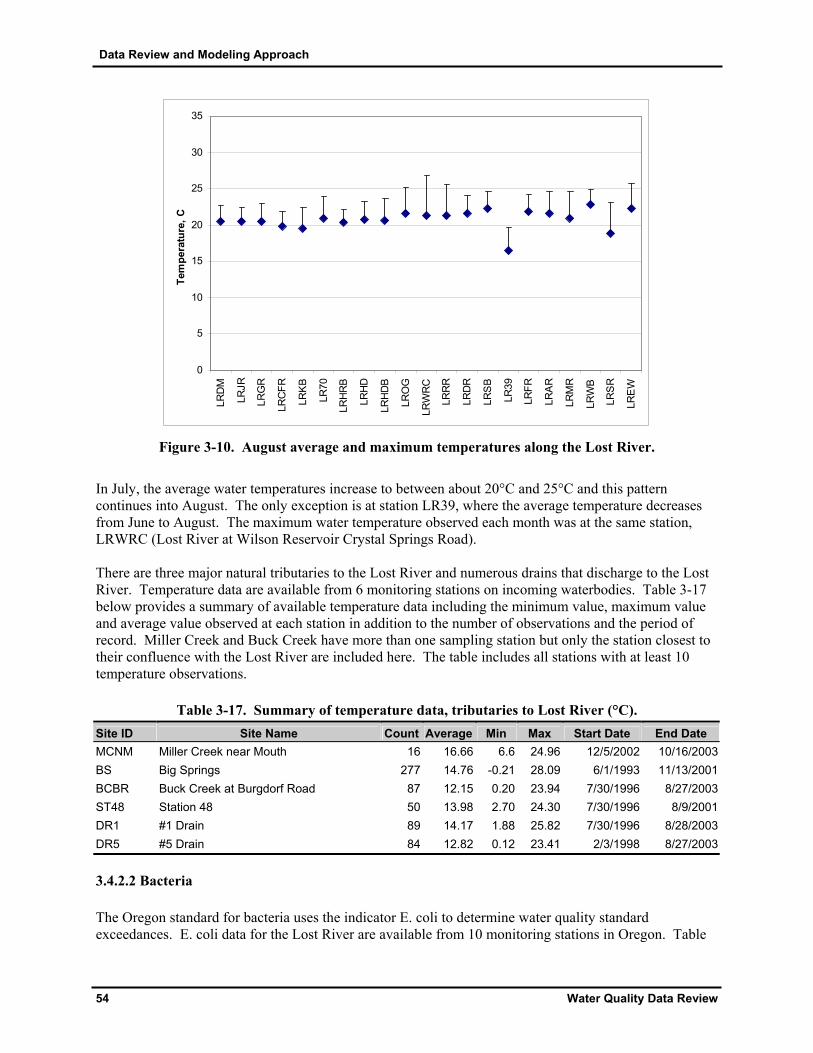
Data Review and Modeling Approach
54 Water Quality Data Review
0
5
10
15
20
25
30
35
LRD
M
LRJR
LRG
R
LRC
FR
LRK
B
LR70
LRH
RB
LRH
D
LRH
DB
LRO
G
LRW
RC
LRR
R
LRD
R
LRS
B
LR39
LRFR
LRA
R
LRM
R
LRW
B
LRS
R
LRE
W
Tem
pera
ture
, C
Figure 3-10. August average and maximum temperatures along the Lost River.
In July, the average water temperatures increase to between about 20°C and 25°C and this pattern continues into August. The only exception is at station LR39, where the average temperature decreases from June to August. The maximum water temperature observed each month was at the same station, LRWRC (Lost River at Wilson Reservoir Crystal Springs Road). There are three major natural tributaries to the Lost River and numerous drains that discharge to the Lost River. Temperature data are available from 6 monitoring stations on incoming waterbodies. Table 3-17 below provides a summary of available temperature data including the minimum value, maximum value and average value observed at each station in addition to the number of observations and the period of record. Miller Creek and Buck Creek have more than one sampling station but only the station closest to their confluence with the Lost River are included here. The table includes all stations with at least 10 temperature observations.
Table 3-17. Summary of temperature data, tributaries to Lost River (°C). Site ID Site Name Count Average Min Max Start Date End Date MCNM Miller Creek near Mouth 16 16.66 6.6 24.96 12/5/2002 10/16/2003BS Big Springs 277 14.76 -0.21 28.09 6/1/1993 11/13/2001BCBR Buck Creek at Burgdorf Road 87 12.15 0.20 23.94 7/30/1996 8/27/2003ST48 Station 48 50 13.98 2.70 24.30 7/30/1996 8/9/2001DR1 #1 Drain 89 14.17 1.88 25.82 7/30/1996 8/28/2003DR5 #5 Drain 84 12.82 0.12 23.41 2/3/1998 8/27/2003
3.4.2.2 Bacteria The Oregon standard for bacteria uses the indicator E. coli to determine water quality standard exceedances. E. coli data for the Lost River are available from 10 monitoring stations in Oregon. Table

Data Review and Modeling Approach
Water Quality Data Review 55
3-18 below provides a summary of the available E. coli data including the minimum value, maximum value and geometric mean value observed at each station in addition to the number of observations and the period of record. The table includes all stations with at least 2 E. coli observations. Table 3-19 below provides a summary of the stations with exceedances of the E. coli standard.
Table 3-18. Summary of E. coli data, Lost River (MPN/100 mL or CFU/100 mL). Site ID Site Name Count Geomean Min Max Start Date End Date LRCFR Lost River at Cheese Factory Road 3 331.5 194 754 5/21/2003 8/27/2003LRKB Lost River at Keller Bridge 3 79.9 31 135 5/21/2003 8/27/2003LR70 Lost River at Hwy 70 3 103.1 10 2382 5/21/2003 8/27/2003LRHD Lost River u/s of Harpold Dam 3 11.9 8 21 5/21/2003 8/27/2003LRHRB Lost River at Harpold Road Bridge 3 9.9 8 15 5/21/2003 8/27/2003
LRWRC Lost River at Wilson Reservoir Crystal Springs Road 3 12.1 8 28 5/21/2003 8/27/2003
LRDR Lost River at Dehlinger Road 4 82.3 41 216 5/21/2003 8/27/2003LRARD Lost River at Anderson-Rose Dam 4 354.2 86 3784 5/20/2003 8/27/2003LRMR Lost River at Malone Road 7 126.4 8 6867 5/20/2003 8/27/2003LR39 Lost River at Hwy 39 28 51.8 4 203 7/23/2002 8/27/2003LR39* Lost River at Hwy 39 66 42.9 2 660 5/14/1996 3/27/2002*E. coli reported in CFU/100 mL all others in MPN/100 mL
Table 3-19. Summary of E. coli exceedances at stations on the Lost River.
Site ID Site Name Time PeriodTotal Number of Samples
Number of Samples $
406
Percent of Samples $
406 LRCFR Lost River at Cheese Factory Road 5/22/2003 3 1 33%LR70 Lost River at Hwy 70 5/22/2003 3 1 33%LRARD Lost River at Anderson-Rose Dam 5/21-22/2003 4 2 50%LRMR Lost River at Malone Road 5/21-22/2003 7 2 29%LR39* Lost River at Hwy 39 5/13/1997 66 2 3%*E. coli reported in CFU/100 mL Table 3-20 below provides a summary of available E. coli data for the tributaries to the Lost River including the minimum value, maximum value and average value observed at each station in addition to the number of observations and the period of record. Miller Creek and Buck Creek have more than one sampling station but only the station closest to their confluence with the Lost River are included here.
Table 3-20. Summary of E. coli data, tributaries to Lost River (MPN/100 mL). Site ID Site Name Count Average Min Max Start Date End Date BCBR Buck Creek at Burgdorf Road 3 1375 42 3282 5/21/2003 8/27/2003DR1 #1 Drain 4 291 91 738 5/21/2003 8/28/2003DR5 #5 Drain 2 134.5 107 162 8/26/2003 8/27/2003
3.4.2.3 Dissolved Oxygen Dissolved oxygen data for the Lost River are available from 22 monitoring stations in Oregon and California. Table 3-21 below provides a summary of the available dissolved oxygen data including the minimum value, maximum value and average value observed at each station in addition to the number of

Data Review and Modeling Approach
56 Water Quality Data Review
observations and the period of record. The stations are listed in downstream order starting downstream of Malone Dam. The table includes all stations with at least 10 dissolved oxygen observations.
Table 3-21. Summary of DO data, Lost River (mg/L). Site ID Site Name Count Average Min Max Start Date End Date LRDM Lost River d/s of Malone Dam 314 9.27 4.75 12.78 6/1/1993 11/12/2002LRJR Lost River at Johnson Road 238 7.96 3.64 12.87 6/1/1993 3/2/1999LRGR Lost River at Gift Road 183 8.19 4.1 12.53 6/1/1993 3/2/1999LRCRF Lost River at Cheese Factory Road 187 9.07 5.05 14.22 6/1/1993 8/27/2003LRKB Lost River at Keller Bridge 332 8.21 3.76 14.27 6/1/1993 10/16/2003LR70 Lost River at Hwy 70 288 7.61 4.00 11.70 6/1/1993 8/27/2003LRHRB Lost River at Harpold Road 430 7.47 1.08 12.80 6/1/1993 8/27/2003LRHD* Lost River u/s of Harpold Dam 163 6.99 0.29 14.40 6/2/1993 11/10/2003LRHDB* Lost River at Harpold Dam Bridge 501 7.95 1.08 13.83 6/1/1993 10/16/2003LROG Lost River at Olene Gap 359 7.36 0.03 13.82 6/1/1993 8/19/2003
LRWRC* Lost River at Wilson Reservoir at Crystal Springs Road 1076 6.71 0.01 24.6 5/16/1972 11/14/2003
LRRR Lost River at Reeder Road 264 7.57 0.68 24.60 06/2/1993 9/19/2000LRDR Lost River at Dehlinger Road 43 7.17 2.70 13.00 1/8/1998 8/28/2003LRSB Lost River at Stukel Bridge 210 7.43 1.84 16.71 6/2/1993 3/2/1999LR39 Lost River at Hwy 39 150 8.12 1.80 21.00 4/8/1970 8/27/2003LRFR Lost River at Falvey Road 32 7.19 3.36 11.19 3/4/1998 1/28/1999LRAR* Lost River at Anderson-Rose Reservoir 642 7.21 0.24 20.79 5/16/1972 6/3/2003LRMR Lost River at Malone Road 252 8.90 0.84 16.13 5/13/1993 11/12/2003LRWB Lost River at Wooden Bridge 255 9.26 1.68 17.2 6/2/1993 12.16/1998LRSR Lost River at Stateline Road 30 8.55 3.70 15.60 5/31/1996 6/24/1998LREW Lost River at East West Road 191 9.75 0.60 18.14 6/2/1993 9/19/2002*Includes all samples taken in reservoir at different depths Figures 3-11 through 3-13 show the average dissolved oxygen concentration at each of the above stations along with the minimum DO observed and Oregon’s absolute minimum standard for DO for the critical summer months of July, August and September.
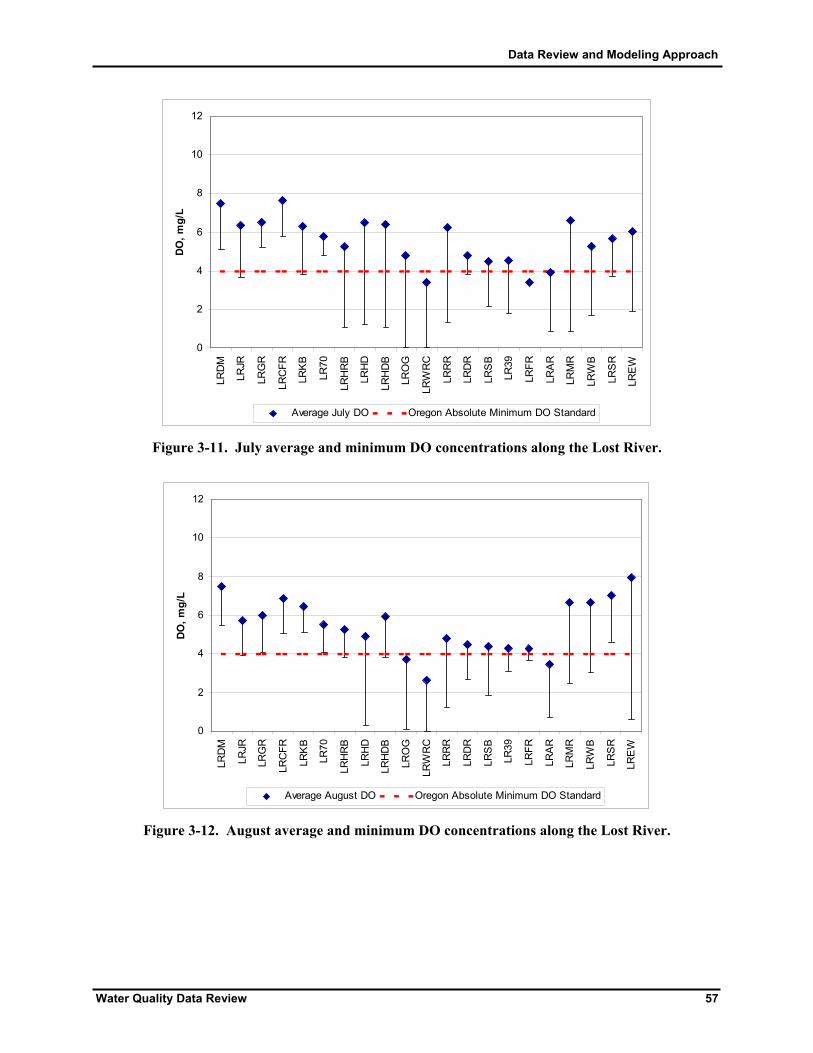
Data Review and Modeling Approach
Water Quality Data Review 57
0
2
4
6
8
10
12
LRD
M
LRJR
LRG
R
LRC
FR
LRK
B
LR70
LRH
RB
LRH
D
LRH
DB
LRO
G
LRW
RC
LRR
R
LRD
R
LRS
B
LR39
LRFR
LRA
R
LRM
R
LRW
B
LRS
R
LRE
W
DO, m
g/L
Average July DO Oregon Absolute Minimum DO Standard
Figure 3-11. July average and minimum DO concentrations along the Lost River.
0
2
4
6
8
10
12
LRD
M
LRJR
LRG
R
LRC
FR
LRK
B
LR70
LRH
RB
LRH
D
LRH
DB
LRO
G
LRW
RC
LRR
R
LRD
R
LRS
B
LR39
LRFR
LRA
R
LRM
R
LRW
B
LRS
R
LRE
W
DO, m
g/L
Average August DO Oregon Absolute Minimum DO Standard
Figure 3-12. August average and minimum DO concentrations along the Lost River.
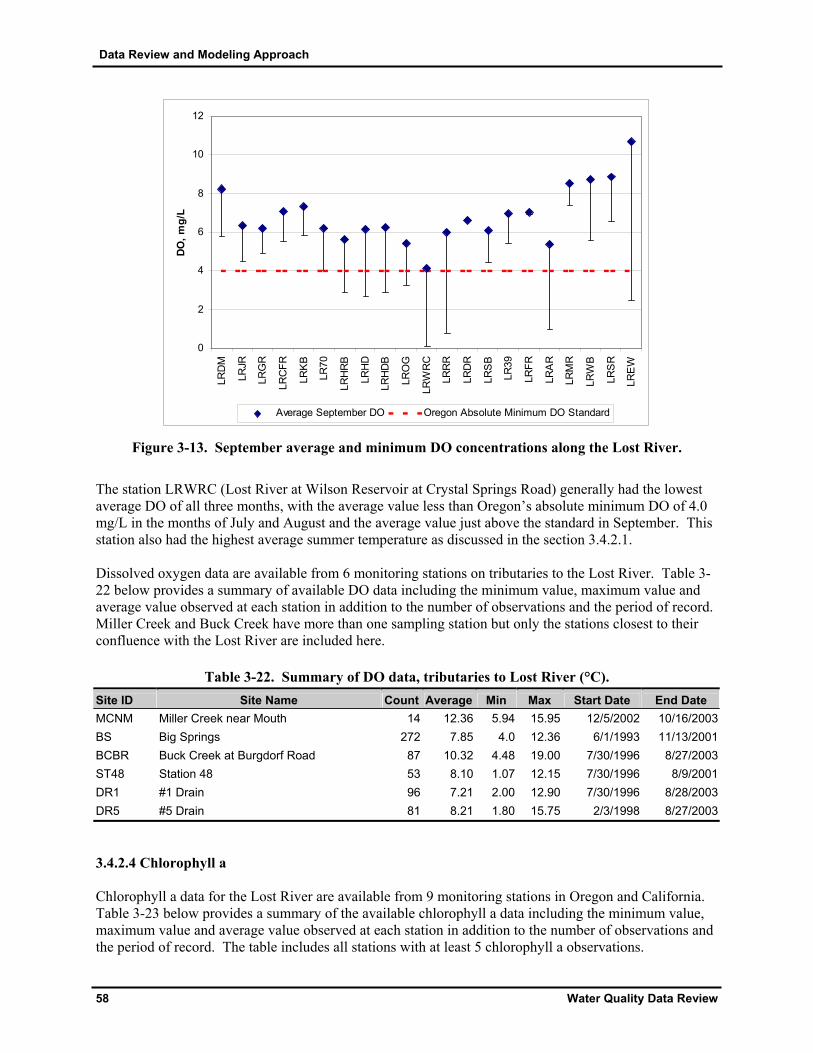
Data Review and Modeling Approach
58 Water Quality Data Review
0
2
4
6
8
10
12
LRD
M
LRJR
LRG
R
LRC
FR
LRK
B
LR70
LRH
RB
LRH
D
LRH
DB
LRO
G
LRW
RC
LRR
R
LRD
R
LRS
B
LR39
LRFR
LRA
R
LRM
R
LRW
B
LRS
R
LRE
W
DO, m
g/L
Average September DO Oregon Absolute Minimum DO Standard
Figure 3-13. September average and minimum DO concentrations along the Lost River.
The station LRWRC (Lost River at Wilson Reservoir at Crystal Springs Road) generally had the lowest average DO of all three months, with the average value less than Oregon’s absolute minimum DO of 4.0 mg/L in the months of July and August and the average value just above the standard in September. This station also had the highest average summer temperature as discussed in the section 3.4.2.1. Dissolved oxygen data are available from 6 monitoring stations on tributaries to the Lost River. Table 3-22 below provides a summary of available DO data including the minimum value, maximum value and average value observed at each station in addition to the number of observations and the period of record. Miller Creek and Buck Creek have more than one sampling station but only the stations closest to their confluence with the Lost River are included here.
Table 3-22. Summary of DO data, tributaries to Lost River (°C). Site ID Site Name Count Average Min Max Start Date End Date MCNM Miller Creek near Mouth 14 12.36 5.94 15.95 12/5/2002 10/16/2003BS Big Springs 272 7.85 4.0 12.36 6/1/1993 11/13/2001BCBR Buck Creek at Burgdorf Road 87 10.32 4.48 19.00 7/30/1996 8/27/2003ST48 Station 48 53 8.10 1.07 12.15 7/30/1996 8/9/2001DR1 #1 Drain 96 7.21 2.00 12.90 7/30/1996 8/28/2003DR5 #5 Drain 81 8.21 1.80 15.75 2/3/1998 8/27/2003
3.4.2.4 Chlorophyll a Chlorophyll a data for the Lost River are available from 9 monitoring stations in Oregon and California. Table 3-23 below provides a summary of the available chlorophyll a data including the minimum value, maximum value and average value observed at each station in addition to the number of observations and the period of record. The table includes all stations with at least 5 chlorophyll a observations.

Data Review and Modeling Approach
Water Quality Data Review 59
Table 3-23. Summary of chlorophyll a data, Lost River (mg/L). Site ID Site Name Count Average Min Max Start Date End Date LRKB Lost River at Keller Bridge 52 0.0106 0.0019 0.200 5/12/1999 8/27/2003LRHDB* Lost River at Harpold Dam Bridge 51 0.0072 0.0005 0.034 5/12/1999 11/13/2001LROG Lost River at Olene Gap 19 0.0089 0.0016 0.036 6/20/2000 11/13/2001
LRWRC* Lost River at Wilson Reservoir at Crystal Springs Road 81 0.0122 0.0020 0.120 8/12/1999 8/27/2003
LRRR Lost River at Reeder Road 27 0.0188 0.0025 0.120 5/12/1999 9/19/2000LR39 Lost River at Hwy 39 72 0.0161 0.0015 0.1182 7/20/1993 8/27/2003LRAR* Lost River at Anderson-Rose Reservoir 93 0.0220 0.0020 0.016 5/12/1999 11/13/2001LRMR Lost River at Malone Road 6 0.0048 0.0013 0.0081 5/20/2003 8/27/2003LREW Lost River at East West Road 54 0.0259 0.0005 0.160 5/12/1999 9/19/2002*Includes all samples taken in reservoir at different depths Oregon’s standard for chlorophyll a is 0.015 mg/L. Eight of the above stations exceeded the chlorophyll a standard during the period of record. Table 3-24 below provides a summary of the chlorophyll a exceedances.
Table 3-24. Summary of chlorophyll a exceedances, Lost River.
Site ID Site Name Number of Samples
Number of Samples
>0.015 mg/L
Total % of Exceedances
LRKB Lost River at Keller Bridge 52 4 7.7%LRHDB* Lost River at Harpold Dam Bridge 51 4 7.8%LROG Lost River at Olene Gap 19 3 15.8%
LRWRC* Lost River at Wilson Reservoir at Crystal Springs Road 81 17 21.0%
LRRR Lost River at Reeder Road 27 10 37.0%LR39 Lost River at Hwy 39 72 20 27.8%LRAR* Lost River at Anderson-Rose Reservoir 93 21 22.6% The station with the highest chlorophyll a concentrations was LREW (Lost River at East West Road). Figure 3-14 shows the average monthly concentration and range of the chlorophyll a observations at that station.

Data Review and Modeling Approach
60 Water Quality Data Review
0.00
0.02
0.04
0.06
0.08
0.10
0.12
0.14
0.16
0.18
1 2 3 4 5 6 7 8 9 10 11 12
Month
Chlo
roph
yll a
, mg/
L
Monthly Average Chlorophyll a, mg/L
Figure 3-14. Monthly average chlorophyll a concentration and range for LREW (Lost River at East West Road).
Chlorophyll a data are available from 6 monitoring stations on the tributaries to the Lost River. Table 3-25 below provides a summary of available chlorophyll a data including the minimum value, maximum value and average value observed at each station in addition to the number of observations and the period of record. Miller Creek and Buck Creek have more than one sampling station but only the station closest to their confluence with the Lost River is included here. The table includes all stations with at least 5 chlorophyll a observations.
Table 3-25. Summary of chlorophyll a data, tributaries to Lost River (mg/L). Site ID Site Name Count Average Min Max Start Date End Date BS Big Springs 45 0.00638 0.0015 0.083 5/12/1999 11/13/2001BCBR Buck Creek at Burgdorf Road 55 0.01250 0.0014 0.072 5/12/1999 8/27/2003ST48 Station 48 44 0.01747 0.0025 0.1126 5/12/1999 8/9/2001DR1 #1 Drain 55 0.01976 0.002 0.110 5/12/1999 8/28/2003DR5 #5 Drain 53 0.03218 0.002 0.270 5/12/1999 8/27/2003
3.4.2.5 Nutrients Although the Lost River is not listed as impaired for nutrients, high nutrient concentrations can cause organic enrichment and low dissolved oxygen levels. Tables 3-26 through 3-28 below provide summaries of the available nutrient data including the minimum value, maximum value and average value observed at each station in addition to the number of observations and the period of record. Also included in Table 3-29 is the only available nutrient data (orthophosphate) for the tributaries to the Lost River.
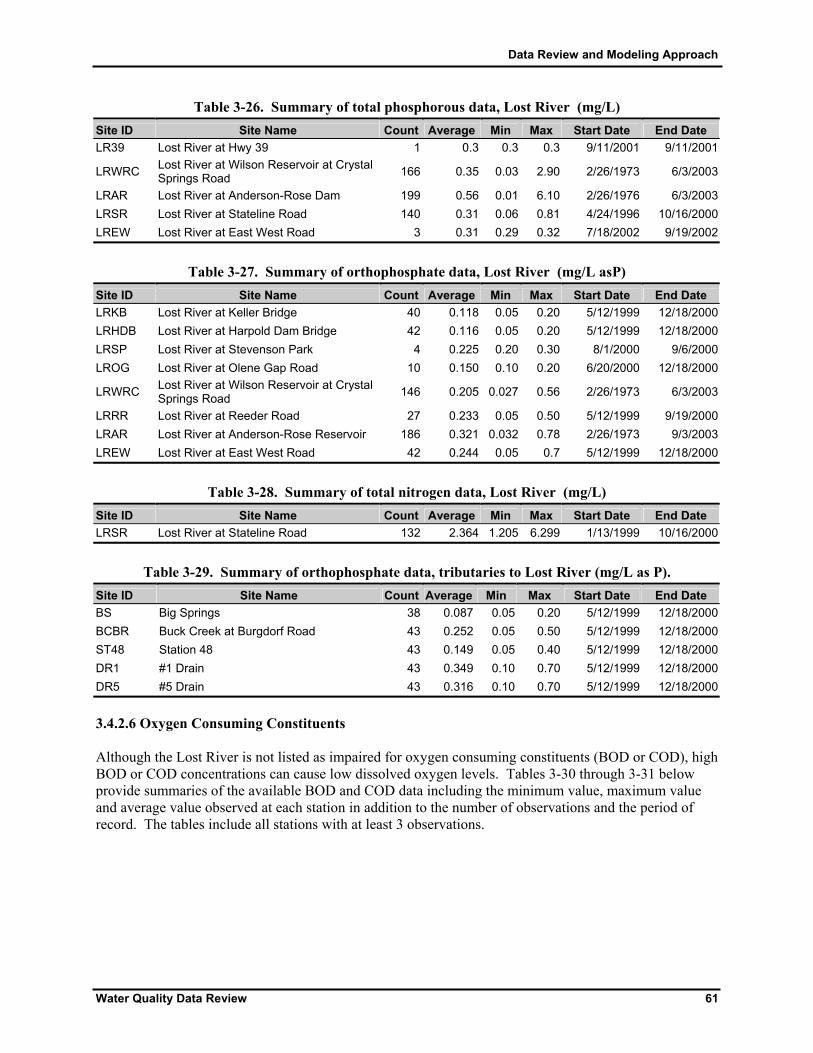
Data Review and Modeling Approach
Water Quality Data Review 61
Table 3-26. Summary of total phosphorous data, Lost River (mg/L) Site ID Site Name Count Average Min Max Start Date End Date LR39 Lost River at Hwy 39 1 0.3 0.3 0.3 9/11/2001 9/11/2001
LRWRC Lost River at Wilson Reservoir at Crystal Springs Road 166 0.35 0.03 2.90 2/26/1973 6/3/2003
LRAR Lost River at Anderson-Rose Dam 199 0.56 0.01 6.10 2/26/1976 6/3/2003LRSR Lost River at Stateline Road 140 0.31 0.06 0.81 4/24/1996 10/16/2000LREW Lost River at East West Road 3 0.31 0.29 0.32 7/18/2002 9/19/2002
Table 3-27. Summary of orthophosphate data, Lost River (mg/L asP)
Site ID Site Name Count Average Min Max Start Date End Date LRKB Lost River at Keller Bridge 40 0.118 0.05 0.20 5/12/1999 12/18/2000LRHDB Lost River at Harpold Dam Bridge 42 0.116 0.05 0.20 5/12/1999 12/18/2000LRSP Lost River at Stevenson Park 4 0.225 0.20 0.30 8/1/2000 9/6/2000LROG Lost River at Olene Gap Road 10 0.150 0.10 0.20 6/20/2000 12/18/2000
LRWRC Lost River at Wilson Reservoir at Crystal Springs Road 146 0.205 0.027 0.56 2/26/1973 6/3/2003
LRRR Lost River at Reeder Road 27 0.233 0.05 0.50 5/12/1999 9/19/2000LRAR Lost River at Anderson-Rose Reservoir 186 0.321 0.032 0.78 2/26/1973 9/3/2003LREW Lost River at East West Road 42 0.244 0.05 0.7 5/12/1999 12/18/2000
Table 3-28. Summary of total nitrogen data, Lost River (mg/L)
Site ID Site Name Count Average Min Max Start Date End Date LRSR Lost River at Stateline Road 132 2.364 1.205 6.299 1/13/1999 10/16/2000
Table 3-29. Summary of orthophosphate data, tributaries to Lost River (mg/L as P).
Site ID Site Name Count Average Min Max Start Date End Date BS Big Springs 38 0.087 0.05 0.20 5/12/1999 12/18/2000BCBR Buck Creek at Burgdorf Road 43 0.252 0.05 0.50 5/12/1999 12/18/2000ST48 Station 48 43 0.149 0.05 0.40 5/12/1999 12/18/2000DR1 #1 Drain 43 0.349 0.10 0.70 5/12/1999 12/18/2000DR5 #5 Drain 43 0.316 0.10 0.70 5/12/1999 12/18/2000
3.4.2.6 Oxygen Consuming Constituents Although the Lost River is not listed as impaired for oxygen consuming constituents (BOD or COD), high BOD or COD concentrations can cause low dissolved oxygen levels. Tables 3-30 through 3-31 below provide summaries of the available BOD and COD data including the minimum value, maximum value and average value observed at each station in addition to the number of observations and the period of record. The tables include all stations with at least 3 observations.
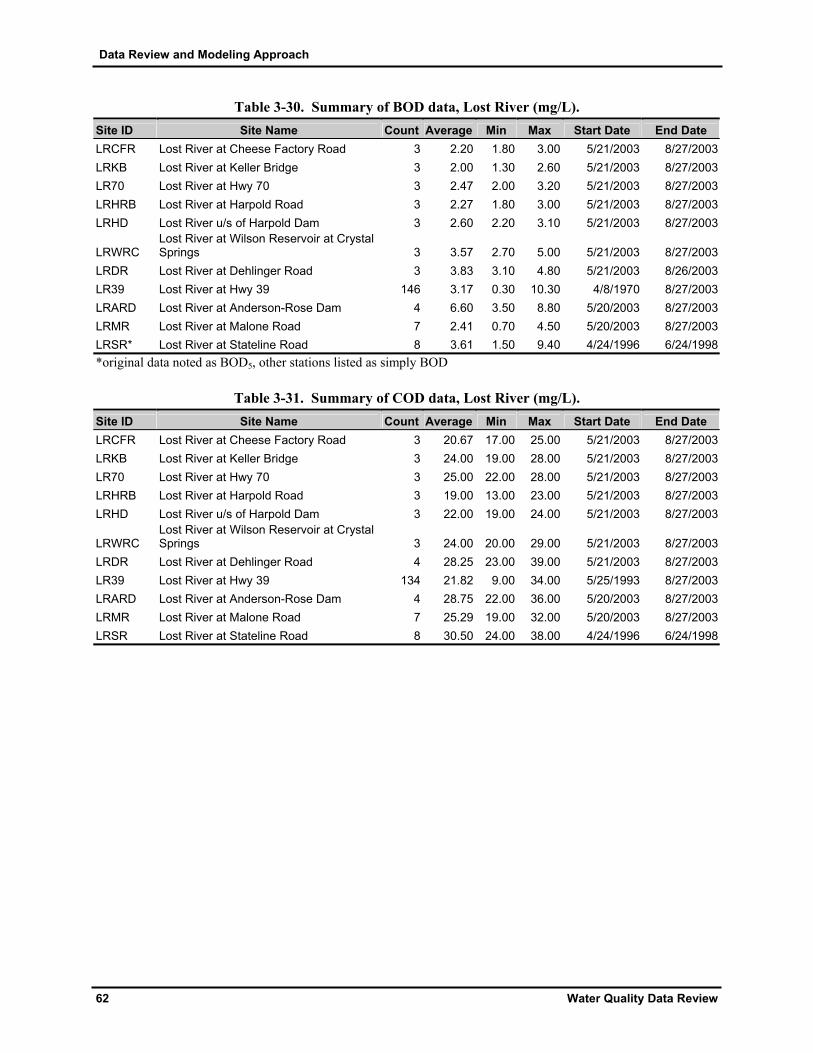
Data Review and Modeling Approach
62 Water Quality Data Review
Table 3-30. Summary of BOD data, Lost River (mg/L). Site ID Site Name Count Average Min Max Start Date End Date LRCFR Lost River at Cheese Factory Road 3 2.20 1.80 3.00 5/21/2003 8/27/2003LRKB Lost River at Keller Bridge 3 2.00 1.30 2.60 5/21/2003 8/27/2003LR70 Lost River at Hwy 70 3 2.47 2.00 3.20 5/21/2003 8/27/2003LRHRB Lost River at Harpold Road 3 2.27 1.80 3.00 5/21/2003 8/27/2003LRHD Lost River u/s of Harpold Dam 3 2.60 2.20 3.10 5/21/2003 8/27/2003
LRWRC Lost River at Wilson Reservoir at Crystal Springs 3 3.57 2.70 5.00 5/21/2003 8/27/2003
LRDR Lost River at Dehlinger Road 3 3.83 3.10 4.80 5/21/2003 8/26/2003LR39 Lost River at Hwy 39 146 3.17 0.30 10.30 4/8/1970 8/27/2003LRARD Lost River at Anderson-Rose Dam 4 6.60 3.50 8.80 5/20/2003 8/27/2003LRMR Lost River at Malone Road 7 2.41 0.70 4.50 5/20/2003 8/27/2003LRSR* Lost River at Stateline Road 8 3.61 1.50 9.40 4/24/1996 6/24/1998*original data noted as BOD5, other stations listed as simply BOD
Table 3-31. Summary of COD data, Lost River (mg/L). Site ID Site Name Count Average Min Max Start Date End Date LRCFR Lost River at Cheese Factory Road 3 20.67 17.00 25.00 5/21/2003 8/27/2003LRKB Lost River at Keller Bridge 3 24.00 19.00 28.00 5/21/2003 8/27/2003LR70 Lost River at Hwy 70 3 25.00 22.00 28.00 5/21/2003 8/27/2003LRHRB Lost River at Harpold Road 3 19.00 13.00 23.00 5/21/2003 8/27/2003LRHD Lost River u/s of Harpold Dam 3 22.00 19.00 24.00 5/21/2003 8/27/2003
LRWRC Lost River at Wilson Reservoir at Crystal Springs 3 24.00 20.00 29.00 5/21/2003 8/27/2003
LRDR Lost River at Dehlinger Road 4 28.25 23.00 39.00 5/21/2003 8/27/2003LR39 Lost River at Hwy 39 134 21.82 9.00 34.00 5/25/1993 8/27/2003LRARD Lost River at Anderson-Rose Dam 4 28.75 22.00 36.00 5/20/2003 8/27/2003LRMR Lost River at Malone Road 7 25.29 19.00 32.00 5/20/2003 8/27/2003LRSR Lost River at Stateline Road 8 30.50 24.00 38.00 4/24/1996 6/24/1998

Data Review and Modeling Approach
Water Quality Data Review 63
3.4.3 Tule Lake, Lower Klamath Lake National Wildlife Refuge and the Klamath Straits Drain The Oregon 2002 303(d) list reported that the Klamath Straits Drain was impaired because of temperature, dissolved oxygen, pH, chlorophyll a and ammonia toxicity. The California 303(d) list reported that Tule Lake and the Lower Klamath Lake National Wildlife Refuge was impaired because of pH. Livestock watering, water supply, resident fish and aquatic life, water contact recreation, anadromous fish passage, and salmonid fish spawning and rearing beneficial uses were impaired by these causes in 2002. The discussion below provides a review of available data to evaluate the water quality impairment status. 3.4.3.1 Temperature Temperature data for the Klamath Straits Drain are available from 5 monitoring stations in Oregon (Figure 3-15). Table 3-32 below provides a summary of the available temperature data including the minimum value, maximum value and average value observed at each station in addition to the number of observations and the period of record. The table includes all available temperature observations.
Table 3-32. Summary of temperature data, Klamath Straits Drain (°C). Site ID Site Name Count Average Min Max Start Date End Date KSDSR Klamath Straits Drain at Stateline Road 160 16.30 1.00 27.60 5/31/1996 8/28/2003KSDTR Klamath Straits Drain at Township Road 19 13.96 4.05 23.99 3/23/1999 11/30/1999KSDPSF Klamath Straits Drain at Pump Station F 282 14.71 1.00 28.40 5/7/1968 8/27/2003KSD97 Klamath Straits Drain at Hwy 97 250 14.83 0.60 25.48 3/17/1998 11/14/2000KSDM Klamath Straits Drain at mouth 1 5.00 5.00 5.00 3/1/2000 3/1/2000
Figures 3-16 through 3-18 show the average and maximum temperature at stations along the Klamath Straits Drain.
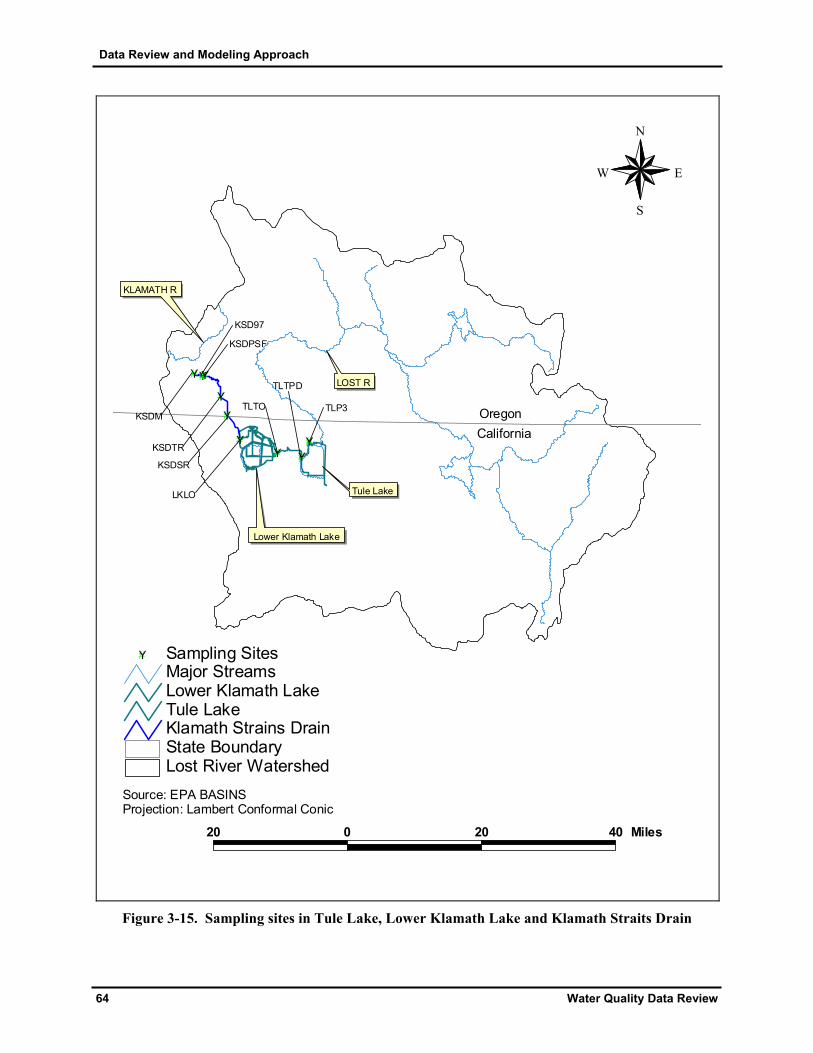
Data Review and Modeling Approach
64 Water Quality Data Review
Lost River WatershedState BoundaryKlamath Strains DrainTule LakeLower Klamath LakeMajor Streams
#Y Sampling Sites
#Y
#Y
#Y
#Y#Y
#Y
#Y#Y#Y
#
KSDSR
#
KSDTR
#
KSDPSF
#
KSD97
#
KSDM
Lower Klamath Lake
Tule Lake
LOST R
KLAMATH R
OregonCalifornia
#
LKLO
#
TLTO
#
TLTPD
#
TLP3
20 0 20 40 Miles
N
EW
S
Source: EPA BASINSProjection: Lambert Conformal Conic
Figure 3-15. Sampling sites in Tule Lake, Lower Klamath Lake and Klamath Straits Drain

Data Review and Modeling Approach
Water Quality Data Review 65
0
5
10
15
20
25
30
KSDS
R
KSDT
R
KSDP
SF
KSD9
7
Tem
pera
ture
, C
Figure 3-16. June average and maximum temperature along the Klamath Straits Drain
0
5
10
15
20
25
30
KSDS
R
KSDT
R
KSDP
SF
KSD9
7
Tem
pera
ture
, C
Figure 3-17. July average and maximum temperature along the Klamath Straits Drain

Data Review and Modeling Approach
66 Water Quality Data Review
0
5
10
15
20
25
30
KSDS
R
KSDT
R
KSDP
SF
KSD9
7
Tem
pera
ture
, C
Figure 3-18. August average and maximum temperature along the Klamath Straits Drain
3.4.3.2 Dissolved Oxygen Dissolved oxygen data for the Klamath Straits Drain are available from 5 monitoring stations in Oregon and California. Table 3-33 below provides a summary of the available dissolved oxygen data including the minimum value, maximum value and average value observed at each station in addition to the number of observations and the period of record. The table includes all available DO observations.
Table 3-33. Summary of DO data, Klamath Straits Drain (mg/L). Site ID Site Name Count Average Min Max Start Date End Date KSDSR Klamath Straits Drain at Stateline Road 101 7.88 0.93 21.04 2/23/1994 8/28/2003KSDTR Klamath Straits Drain at Township Road 19 7.05 2.28 11.39 3/23/1999 11/30/1999KSDPSF Klamath Straits Drain at Pump Station F 573 6.36 0.30 15.30 2/23/1994 8/28/2003KSD97 Klamath Straits Drain at Hwy 97 219 6.41 0.60 16.40 5/16/1972 6/3/2003KSDM Klamath Straits Drain at mouth 1 10.1 10.1 10.1 3/1/2000 3/1/2000
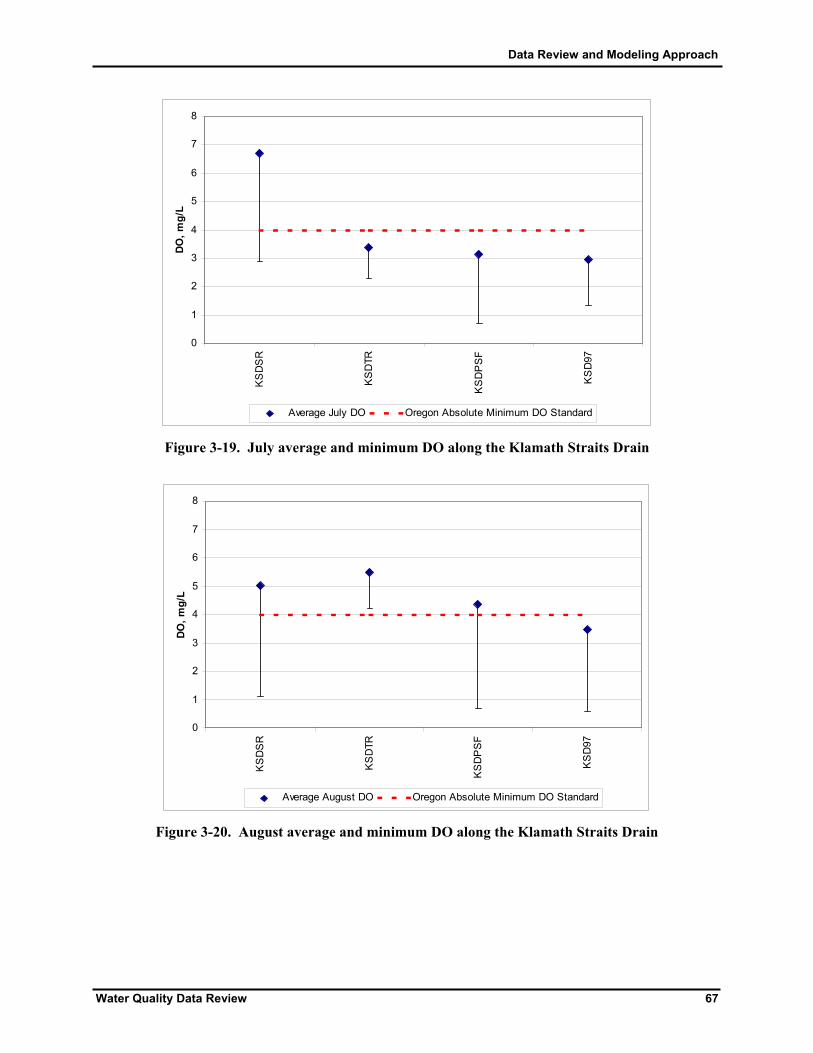
Data Review and Modeling Approach
Water Quality Data Review 67
0
1
2
3
4
5
6
7
8
KS
DS
R
KS
DTR
KS
DP
SF
KS
D97
DO, m
g/L
Average July DO Oregon Absolute Minimum DO Standard
Figure 3-19. July average and minimum DO along the Klamath Straits Drain
0
1
2
3
4
5
6
7
8
KS
DS
R
KS
DTR
KS
DP
SF
KS
D97
DO, m
g/L
Average August DO Oregon Absolute Minimum DO Standard
Figure 3-20. August average and minimum DO along the Klamath Straits Drain
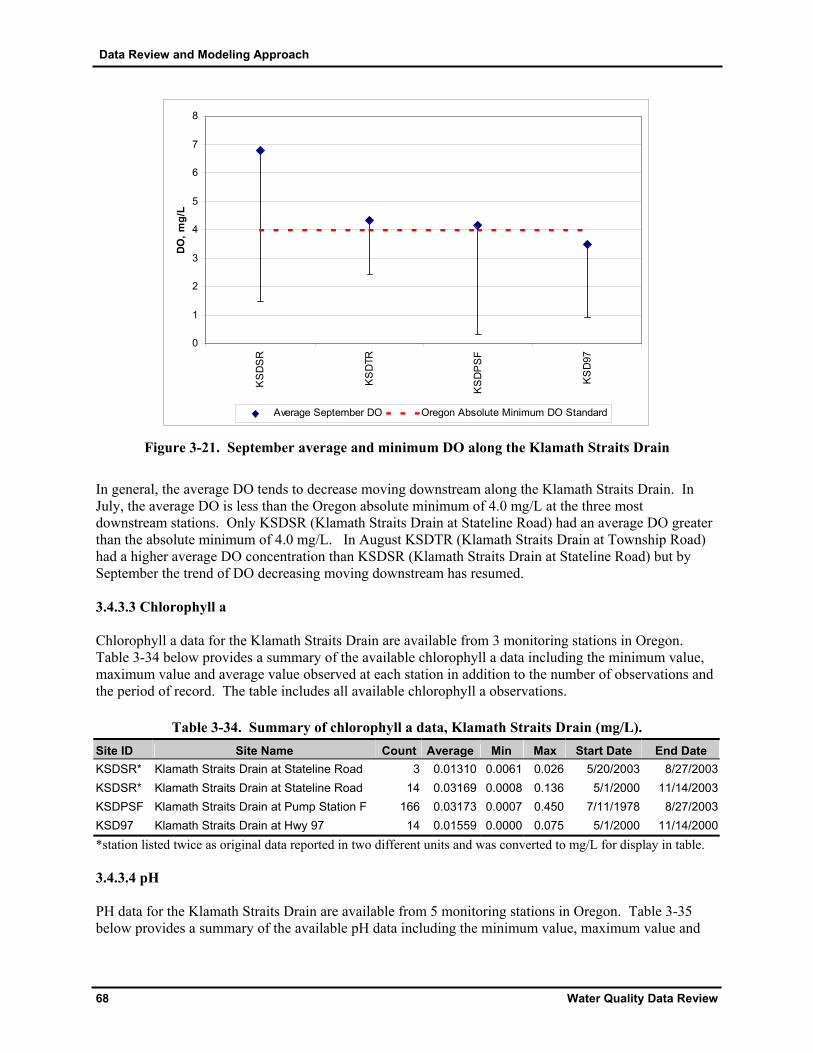
Data Review and Modeling Approach
68 Water Quality Data Review
0
1
2
3
4
5
6
7
8
KS
DS
R
KS
DTR
KS
DP
SF
KS
D97
DO, m
g/L
Average September DO Oregon Absolute Minimum DO Standard
Figure 3-21. September average and minimum DO along the Klamath Straits Drain
In general, the average DO tends to decrease moving downstream along the Klamath Straits Drain. In July, the average DO is less than the Oregon absolute minimum of 4.0 mg/L at the three most downstream stations. Only KSDSR (Klamath Straits Drain at Stateline Road) had an average DO greater than the absolute minimum of 4.0 mg/L. In August KSDTR (Klamath Straits Drain at Township Road) had a higher average DO concentration than KSDSR (Klamath Straits Drain at Stateline Road) but by September the trend of DO decreasing moving downstream has resumed. 3.4.3.3 Chlorophyll a Chlorophyll a data for the Klamath Straits Drain are available from 3 monitoring stations in Oregon. Table 3-34 below provides a summary of the available chlorophyll a data including the minimum value, maximum value and average value observed at each station in addition to the number of observations and the period of record. The table includes all available chlorophyll a observations.
Table 3-34. Summary of chlorophyll a data, Klamath Straits Drain (mg/L). Site ID Site Name Count Average Min Max Start Date End Date KSDSR* Klamath Straits Drain at Stateline Road 3 0.01310 0.0061 0.026 5/20/2003 8/27/2003KSDSR* Klamath Straits Drain at Stateline Road 14 0.03169 0.0008 0.136 5/1/2000 11/14/2003KSDPSF Klamath Straits Drain at Pump Station F 166 0.03173 0.0007 0.450 7/11/1978 8/27/2003KSD97 Klamath Straits Drain at Hwy 97 14 0.01559 0.0000 0.075 5/1/2000 11/14/2000*station listed twice as original data reported in two different units and was converted to mg/L for display in table. 3.4.3.4 pH PH data for the Klamath Straits Drain are available from 5 monitoring stations in Oregon. Table 3-35 below provides a summary of the available pH data including the minimum value, maximum value and

Data Review and Modeling Approach
Water Quality Data Review 69
average value observed at each station in addition to the number of observations and the period of record. Table 3-36 provides a summary of the exceedances of the pH standard.
Table 3-35. Summary of pH data, Tule Lake, Lower Klamath Lake and Klamath Straits Drain. Site ID Site Name Count Average Min Max Start Date End Date TLP3 Tule Lake Pump 3 (Iin) 31 8.10 7.20 9.40 4/24/1996 6/24/1998TLTPD Tule Lake Tunnel at Pump Station D 301 8.95 6.70 10.83 5/16/1972 6/3/2003TLTO Tule Lake Tunnel Outlet 31 9.25 8.30 9.90 3/23/1999 11/14/2000LKLO Lower Klamath Refuge Outlet at Hwy 120 8.10 6.09 9.40 1/13/1999 9/20/2000KSDSR Klamath Straits Drain at Stateline Road 195 8.43 6.59 10.26 2/23/1994 8/28/2003KSDTR Klamath Straits Drain at Township Road 19 8.36 7.44 9.13 3/23/1999 11/30/1999KSDPSF Klamath Straits Drain at Pump Station F 635 8.19 0.05 9.60 5/7/1968 8/27/2003KSD97 Klamath Straits Drain at Hwy 97 398 8.13 6.10 10.26 5/16/1972 6/3/2003KSDM Klamath Straits Drain at mouth 1 8.20 8.20 8.20 3/1/2000 3/1/2000
Table 3-36. Summary of pH exceedances, Tule Lake, Lower Klamath Lake and Klamath Straits
Drain.
Site ID Site Name Number of Samples
Number of Samples
<6.5
Number of Samples
>9.0
Total % of Exceedances
TLP3 Tule Lake Pump 3 31 0 1 3.2%TLTPD Tule Lake Tunnel at Pump Station D 301 1 135 45.2%TLTO Tule Lake Tunnel Outlet 31 0 23 74.2%LKLO Lower Klamath Lake Outlet 120 12 13 20.8%KSDSR Klamath Straits Drain at Stateline Road 195 0 54 27.7%KSDTR Klamath Straits Drain at Township Road 19 0 3 15.8%KSDPSF Klamath Straits Drain at Pump Station F 635 2 48 7.9%KSD97 Klamath Straits Drain at Hwy 97 398 5 56 15.35
3.4.3.4 Ammonia Toxicity Ammonia data for the Klamath Straits Drain are available from 5 monitoring stations in Oregon. Table 3-37 below provides a summary of the available ammonia data including the minimum value, maximum value and average value observed at each station in addition to the number of observations and the period of record. Table 3-38 provides a summary of the exceedances of the ammonia toxicity acute standard.
Table 3-37. Summary of ammonia data, Klamath Straits Drain (mg/L as N). Site ID Site Name Count Average Min Max Start Date End Date KSDSR Klamath Straits Drain at Stateline Road 150 0.28 0.0009 5.58 2/23/1994 8/27/2003KSDTR Klamath Straits Drain at Township Road 18 0.31 0.09 0.61 3/23/1999 11/30/1999KSDPSF Klamath Straits Drain at Pump Station F 313 0.63 0.02 11.30 5/7/1968 8/27/2003KSD97 Klamath Straits Drain at Hwy 97 245 0.31 0.001 3.68 2/23/1994 6/3/2003KSDM Klamath Straits Drain at mouth 1 0.13 0.13 0.13 3/1/2000 3/1/2000
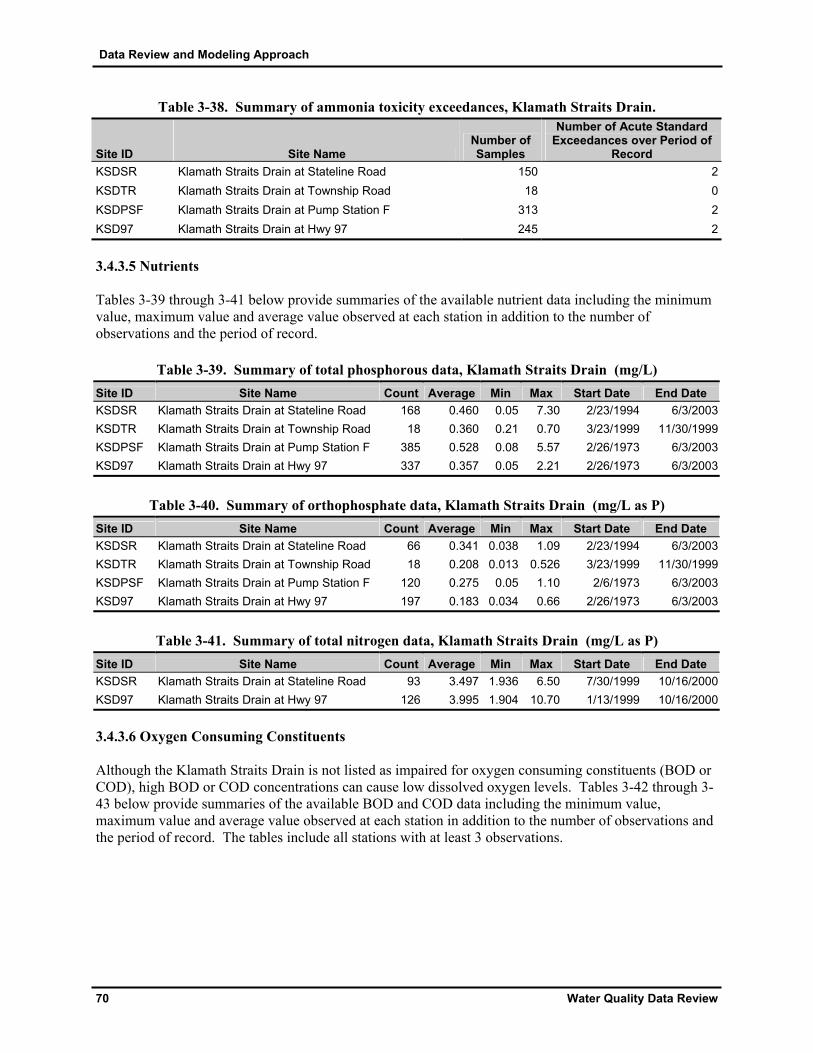
Data Review and Modeling Approach
70 Water Quality Data Review
Table 3-38. Summary of ammonia toxicity exceedances, Klamath Straits Drain.
Site ID Site Name Number of Samples
Number of Acute Standard Exceedances over Period of
Record KSDSR Klamath Straits Drain at Stateline Road 150 2KSDTR Klamath Straits Drain at Township Road 18 0KSDPSF Klamath Straits Drain at Pump Station F 313 2KSD97 Klamath Straits Drain at Hwy 97 245 2
3.4.3.5 Nutrients Tables 3-39 through 3-41 below provide summaries of the available nutrient data including the minimum value, maximum value and average value observed at each station in addition to the number of observations and the period of record.
Table 3-39. Summary of total phosphorous data, Klamath Straits Drain (mg/L) Site ID Site Name Count Average Min Max Start Date End Date KSDSR Klamath Straits Drain at Stateline Road 168 0.460 0.05 7.30 2/23/1994 6/3/2003KSDTR Klamath Straits Drain at Township Road 18 0.360 0.21 0.70 3/23/1999 11/30/1999KSDPSF Klamath Straits Drain at Pump Station F 385 0.528 0.08 5.57 2/26/1973 6/3/2003KSD97 Klamath Straits Drain at Hwy 97 337 0.357 0.05 2.21 2/26/1973 6/3/2003
Table 3-40. Summary of orthophosphate data, Klamath Straits Drain (mg/L as P)
Site ID Site Name Count Average Min Max Start Date End Date KSDSR Klamath Straits Drain at Stateline Road 66 0.341 0.038 1.09 2/23/1994 6/3/2003KSDTR Klamath Straits Drain at Township Road 18 0.208 0.013 0.526 3/23/1999 11/30/1999KSDPSF Klamath Straits Drain at Pump Station F 120 0.275 0.05 1.10 2/6/1973 6/3/2003KSD97 Klamath Straits Drain at Hwy 97 197 0.183 0.034 0.66 2/26/1973 6/3/2003
Table 3-41. Summary of total nitrogen data, Klamath Straits Drain (mg/L as P)
Site ID Site Name Count Average Min Max Start Date End Date KSDSR Klamath Straits Drain at Stateline Road 93 3.497 1.936 6.50 7/30/1999 10/16/2000KSD97 Klamath Straits Drain at Hwy 97 126 3.995 1.904 10.70 1/13/1999 10/16/2000
3.4.3.6 Oxygen Consuming Constituents Although the Klamath Straits Drain is not listed as impaired for oxygen consuming constituents (BOD or COD), high BOD or COD concentrations can cause low dissolved oxygen levels. Tables 3-42 through 3-43 below provide summaries of the available BOD and COD data including the minimum value, maximum value and average value observed at each station in addition to the number of observations and the period of record. The tables include all stations with at least 3 observations.
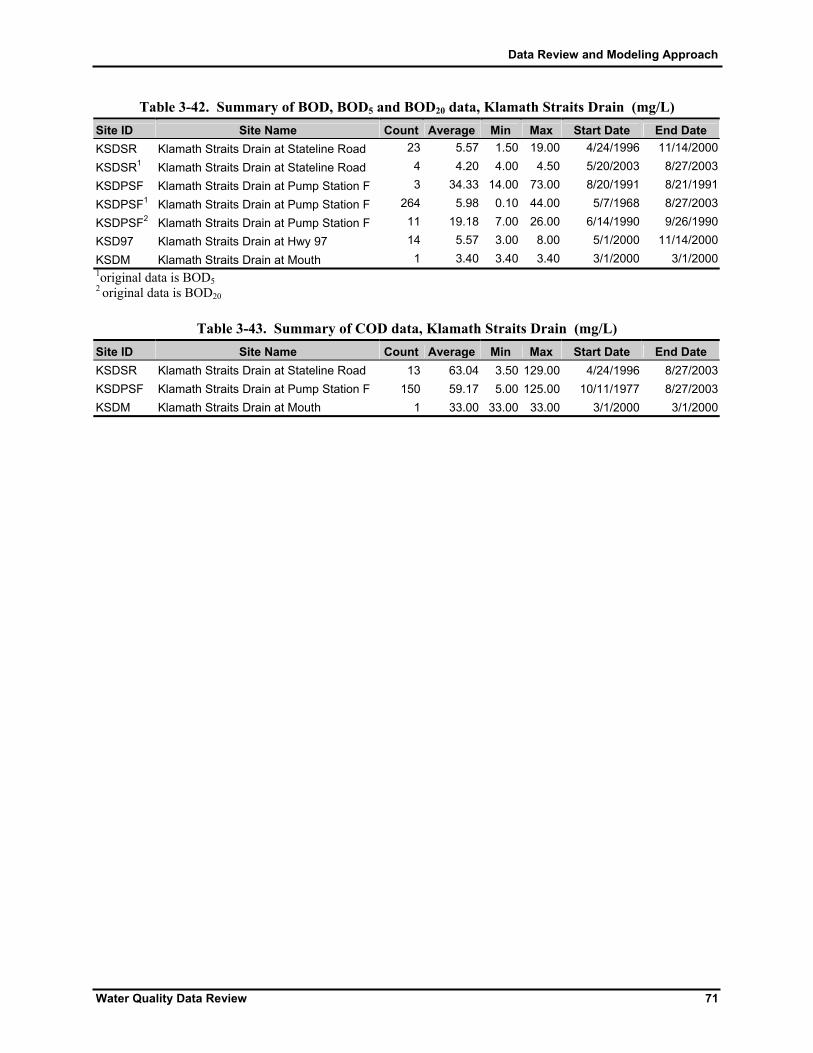
Data Review and Modeling Approach
Water Quality Data Review 71
Table 3-42. Summary of BOD, BOD5 and BOD20 data, Klamath Straits Drain (mg/L) Site ID Site Name Count Average Min Max Start Date End Date KSDSR Klamath Straits Drain at Stateline Road 23 5.57 1.50 19.00 4/24/1996 11/14/2000
KSDSR1 Klamath Straits Drain at Stateline Road 4 4.20 4.00 4.50 5/20/2003 8/27/2003KSDPSF Klamath Straits Drain at Pump Station F 3 34.33 14.00 73.00 8/20/1991 8/21/1991
KSDPSF1 Klamath Straits Drain at Pump Station F 264 5.98 0.10 44.00 5/7/1968 8/27/2003
KSDPSF2 Klamath Straits Drain at Pump Station F 11 19.18 7.00 26.00 6/14/1990 9/26/1990KSD97 Klamath Straits Drain at Hwy 97 14 5.57 3.00 8.00 5/1/2000 11/14/2000
KSDM Klamath Straits Drain at Mouth 1 3.40 3.40 3.40 3/1/2000 3/1/20001original data is BOD5 2 original data is BOD20
Table 3-43. Summary of COD data, Klamath Straits Drain (mg/L) Site ID Site Name Count Average Min Max Start Date End Date KSDSR Klamath Straits Drain at Stateline Road 13 63.04 3.50 129.00 4/24/1996 8/27/2003KSDPSF Klamath Straits Drain at Pump Station F 150 59.17 5.00 125.00 10/11/1977 8/27/2003KSDM Klamath Straits Drain at Mouth 1 33.00 33.00 33.00 3/1/2000 3/1/2000

Data Review and Modeling Approach
72 Technical Approach
4.0 TECHNICAL APPROACH This section presents proposed modeling approaches for Klamath and Lost River TMDL development. A proposed approach and an alternative approach are first presented for the Klamath River, with primary emphasis on the proposed approach. These are followed by proposed and alternative approaches for modeling the Lost River. All approaches are based on evaluation of technical, regulatory, and user criteria for the Klamath and Lost River systems. Technical criteria refer to the model’s simulation of the physical system in question, including watershed and/or stream characteristics/processes and constituents of interest. Regulatory criteria make up the constraints imposed by regulations, such as water quality standards or procedural protocol. User criteria comprise the operational or economical constraints imposed by the end-user and include factors such as hardware/software compatibility and financial resources. Specifics regarding each criterion will be included throughout the following sections. 4.1 Klamath River Proposed Approach 4.1.1 Overview To develop TMDLs for the Klamath River downstream of Upper Klamath Lake, it is recommended that a dynamic modeling framework be implemented. The proposed approach is to combine a series of alternating 1-dimensional models for riverine sections and 2-dimensional models for impoundments and tidal regions. Specifically, the RMA-2 and RMA-11 models will be applied for Link River, Keno Dam to J.C. Boyle Reservoir, Bypass Reach, the Full Flow Reach, and Iron Gate Dam to Turwar. RMA-2 simulates hydrodynamics while RMA-11 represents water quality processes. The CE-QUAL-W2 model will be applied for Lake Ewauna-Keno Dam, J.C. Boyle Reservoir, Copco Reservoir, Iron Gate Reservoir, and the Klamath River from Turwar to the Pacific Ocean. Table 4-1 identifies the proposed modeling elements. Application of the CE-QUAL-W2 model to the Klamath River downstream of Turwar is subject to the availability of bathymetric data and sufficient water quality monitoring data to support model calibration. To date, insufficient data have been identified to support the model’s application, however, data collection over the upcoming year is anticipated to provide the required data.
Table 4-1. Proposed model components. Modeling Segment Segment Type Model(s)
Link River River RMA-2/RMA-11 Lake Ewauna-Keno Dam Reservoir CE-QUAL-W2 Keno Dam to J.C. Boyle Reservoir River RMA-2/RMA-11 J.C. Boyle Reservoir Reservoir CE-QUAL-W2 Bypass Reach River RMA-2/RMA-11 Full Flow Reach River RMA-2/RMA-11 Copco Reservoir Reservoir CE-QUAL-W2 Iron Gate Reservoir Reservoir CE-QUAL-W2 Iron Gate Dam to Turwar River RMA-2/RMA-11 Turwar to Pacific Ocean Estuary CE-QUAL-W2 The linkages between the riverine and reservoir/estuary models identified above will be made by transferring time-variable flow and water quality from one model to the next (e.g. output from the Link River model becomes input for the Lake Ewauna-Keno Dam model). This proposed modeling framework will be consistent with available models appropriate for application to riverine/reservoir systems and will include a review of previous modeling approaches (e.g., PacifiCorp Klamath River model). Selected algorithms will be considered for augmentation of the modeling framework to address specific processes. Enhancements to the basic code for RMA and CE-QUAL-W2 will be considered for

Data Review and Modeling Approach
Technical Approach 73
processes such as periphyton simulation. We have developed several such algorithms used in previous TMDL studies and will also consider adapting documented PacifiCorp processes from earlier studies. As necessary, we will review and evaluate relevant elements of the PacifiCorp model and will determine (on a case-by-case basis) their utility for application to developing the TMDL model. There are many advantages to implementing a dynamic modeling framework that considers similar processes and functions as existing applications for the Klamath River, such as the PacifiCorp model, including:
• The models are capable of predicting hydrodynamics, nutrient cycles, dissolved oxygen, temperature, and other parameters and processes pertinent to the TMDL development effort.
• The models are capable of simulating the multiple flow control structures along the length of the Klamath River.
• The framework is dynamic (time-variable) and thus capable of representing the highly variable flow and water quality conditions within years and between years.
• The model is capable of considering the steep channel slope of the Klamath River. • This framework uses hydrodynamic and water quality models with a proven track record in the
environmental arena, including historical application to the Klamath River. • Most stakeholders in the watershed are already familiar with the previously applied models. • Model results can be directly compared to ODEQ and NRWQCB water quality criteria. • The PacifiCorp modeling framework has been previously calibrated for the Klamath River and its
applicability demonstrated. • Previously developed and applied modifications to RMA code for simulation of periphyton
growth in the Klamath River can be incorporated into the TMDL modeling framework. • The multi-model framework allows independent river/reservoir sections to be simulated
independently, making it more efficient for calibration and TMDL scenario assessment. • The modeling system developed for the TMDL application using the public domain versions of
CE-QUAL-W2 and RMA can be distributed to the public. Potential limitations that have currently been identified include:
• While the multi-model framework may be efficient for calibration, it is also cumbersome in terms of data management and transfer between models. Additionally, due to differences in algorithms and state parameters for RMA and CE-QUAL-W2 (e.g., for nutrient components), conversion of pollutant loads between models may potentially result in slight inaccuracies.
• Although the RMA model can be distributed to the public, it may require additional expenses for public users.
• The RMA model is a finite element-based numerical model, which means it may be computationally intensive and time-consuming to apply.
• There may be limitations in representing DO levels for groundwater contributions.
4.1.2 Model Background RMA The hydrodynamic component of the RMA modeling suite, RMA-2, is a model specifically designed to assess flow response in complex river systems (Deas, 2000). RMA-2 solves the full-flow equations, known as the St. Venant Equations. These equations use all terms of the conservation of momentum formulation and provide a complete description of dynamic flow conditions. The model has been widely applied (it is one of the most used full hydrodynamic models in the United States) to a variety of river and estuary systems in the United States as well as internationally.
Data Review and Modeling Approach
74 Technical Approach
The water quality component, RMA-11, is a general-purpose water quality model, compatible in geometry with the configuration of the RMA-2 hydrodynamic model. The model simulates advective heat transport and air-water heat exchange processes, as well as fate and transport of water quality parameters, to produce dynamic descriptions of temperature and constituent concentration along the river reach. Input requirements include temperatures and quality of boundary flows, and meteorological data defining atmospheric conditions governing heat exchange at the air-water interface. Model output is in the form of longitudinal profiles of temperature and quality parameters along river reaches, or time series at fixed locations. CE-QUAL-W2 The U.S. Army Corps of Engineers’ CE-QUAL-W2 is a two-dimensional, longitudinal/vertical (laterally averaged), hydrodynamic and water quality model (Cole et al 2000). The model allows for application to streams, reservoirs, and estuaries with variable grid spacing, time-variable boundary conditions, and multiple inflows and outflows from point/nonpoint sources and precipitation. The two major components of the model include hydrodynamics and water quality kinetics. Both of these components are coupled, i.e. the hydrodynamic output is used to drive the water quality at every timestep. The hydrodynamic portion of the model predicts water surface elevations, velocities, and temperature. The ULTIMATE-QUICKEST numerical scheme used in the CE-QUAL-W2 model is designed to reduce the numerical diffusion in the vertical direction to a minimum and in areas of high gradients reduce the undershoots and overshoots which may produce small negative concentrations. The water quality portion can simulate 21 constituents including dissolved oxygen (DO), nutrients, and phytoplankton interactions, and pH. 4.1.3 Model Configuration Spatial scale The modeling framework will include the entire Klamath River from Link Dam (at the outlet of the Upper Klamath Lake) to the Pacific Ocean. The river is impounded by five dams along its length: Keno, J.C. Boyle, Copco, Copco 2, and Iron Gate Dam. The modeling framework will be composed of 10 separate modeling components as described above. Within each of these separate modeling components, the primary waterbody (either a Klamath River section or a reservoir) will be subdivided into higher resolution elements. It is anticipated that the TMDL modeling framework components will be segmented similarly to the existing PacifiCorp model. For the reservoir/lake models in the existing PacifiCorp model (Lake Ewauna, J.C. Boyle Reservoir, Copco Reservoir, and Iron Gate Reservoir), the corresponding CE-QUAL-W2 models have layer thicknesses ranging from 0.61 to 2.5 meters and segment lengths ranging from 37 to 714 meters. For the riverine reaches (Link River, Keno reach, Bypass/full flow reach downstream of J.C. Boyle Reservoir, and Klamath River from Iron Gate Dam to Turwar), the corresponding finite element model RMA has node distances ranging from 75 to approximately 300 meters (and are assumed to be homogeneous in the vertical direction). It is anticipated that the tidal portion of the Klamath River from Turwar to the Pacific Ocean, which is not included in the existing PacifiCorp model, will be segmented into approximately 20 segments with layer thicknesses ranging from 0.5 to 2 meters. This segmentation is subject to the availability of bathymetric data and flow and water quality monitoring data that to date have not been identified.

Data Review and Modeling Approach
Technical Approach 75
A special feature of the tidally-influenced estuarine portion is bi-directional flow (in contrast to the uni-directional flow for the upstream river sections). The tidal water will not only transport saline water into the estuary and change the density flow pattern and DO saturation level, but it will also cause a significant amount of organic matter to settle. This may result in elevated sediment oxygen demand (SOD) levels. In addition, unlike the rapid flow environment upstream, the estuary will provide a condition for phytoplankton to flourish, given sufficient nutrients. Only the main-stem Klamath River and its reservoirs will be simulated within the TMDL modeling framework. All tributaries to the river will be represented as boundary conditions (i.e., they will not be explicitly modeled). More detailed information regarding the specific tributaries to be included or inflows to the model are included in Appendix D. They will be represented by flow and water quality constituent time series based on historical monitoring data or possibly results from other modeling efforts. Thus, the tributaries can ultimately be given allocations, however, the variability of flow and water quality within each tributary cannot be evaluated. Source-based allocations can only be provided for individual tributaries if sufficient data are available to distinguish between source contributions. This is further described in the TMDL Analysis section of this document. The resolution offered by the proposed modeling framework is sufficient to meet the regulatory requirements identified by ODEQ and NRWQCB. As identified by the agencies, output is needed from the following locations:
• Link River • Upstream and downstream of Lost River Diversion and Klamath Straits Drain • Upstream and downstream of point source discharges (Spring Street and South Suburban STPs,
Collins Forest Products Columbia Plywood) • Upstream and downstream of Keno and JC Boyle Dams • Downstream of JC Boyle powerhouse • Upstream of regional spring discharges in the JC Boyle bypass reach • Downstream of Shovel Creek • OR/CA state line • Upstream and downstream of Copco Reservoirs 1 and 2 • Upstream and downstream of Iron Gate Dam • Upstream and downstream of Shasta River • Downstream of Walker Creek • Upstream and downstream of Scott River • Downstream of Seiad Creek • Upstream of Salmon River • Downstream of Salmon River • Downstream of Orleans • Upstream of Trinity River • Downstream of Trinity River • Downstream of Blue Slide Creek • Downstream of Klamath Glen • Klamath River Estuary
Time Step The current modeling system operates on a sub-hourly time-step. Based on the resolution of the modeling grids, it is anticipated that the modeling timestep will be between 60 seconds and 2 minutes. Therefore,
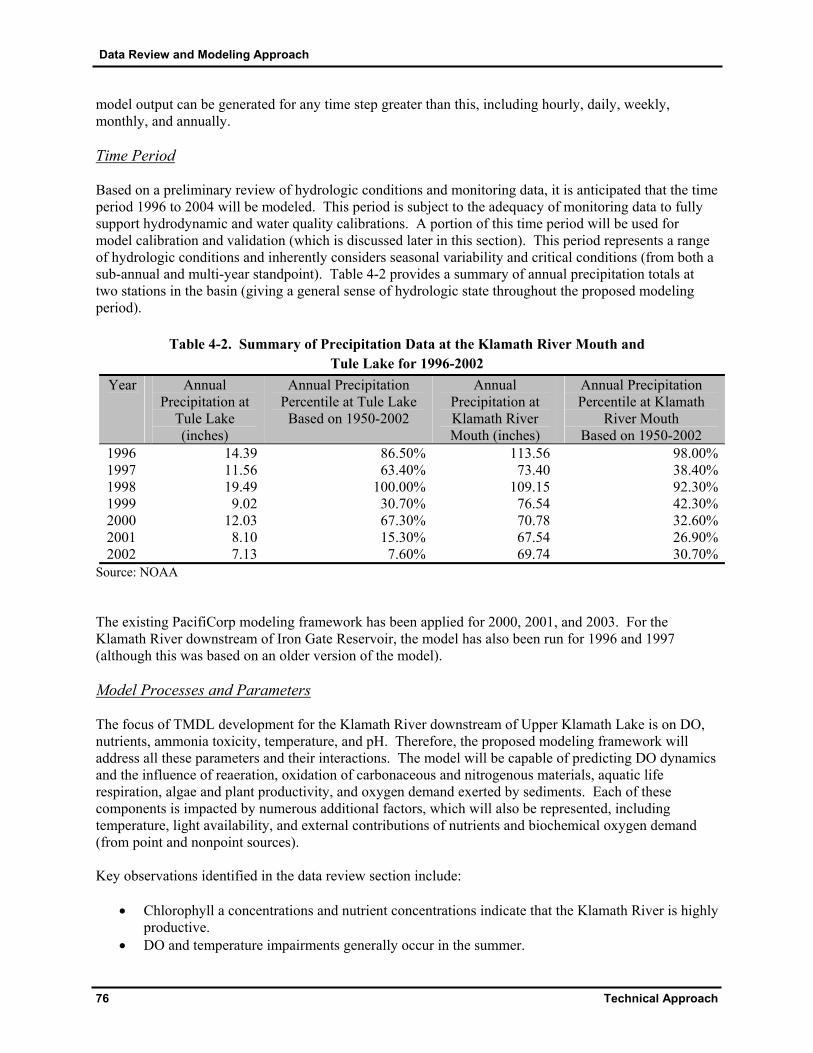
Data Review and Modeling Approach
76 Technical Approach
model output can be generated for any time step greater than this, including hourly, daily, weekly, monthly, and annually. Time Period Based on a preliminary review of hydrologic conditions and monitoring data, it is anticipated that the time period 1996 to 2004 will be modeled. This period is subject to the adequacy of monitoring data to fully support hydrodynamic and water quality calibrations. A portion of this time period will be used for model calibration and validation (which is discussed later in this section). This period represents a range of hydrologic conditions and inherently considers seasonal variability and critical conditions (from both a sub-annual and multi-year standpoint). Table 4-2 provides a summary of annual precipitation totals at two stations in the basin (giving a general sense of hydrologic state throughout the proposed modeling period).
Table 4-2. Summary of Precipitation Data at the Klamath River Mouth and Tule Lake for 1996-2002
Year Annual Precipitation at
Tule Lake (inches)
Annual Precipitation Percentile at Tule Lake
Based on 1950-2002
Annual Precipitation at Klamath River Mouth (inches)
Annual Precipitation Percentile at Klamath
River Mouth Based on 1950-2002
1996 14.39 86.50% 113.56 98.00%1997 11.56 63.40% 73.40 38.40%1998 19.49 100.00% 109.15 92.30%1999 9.02 30.70% 76.54 42.30%2000 12.03 67.30% 70.78 32.60%2001 8.10 15.30% 67.54 26.90%2002 7.13 7.60% 69.74 30.70%
Source: NOAA The existing PacifiCorp modeling framework has been applied for 2000, 2001, and 2003. For the Klamath River downstream of Iron Gate Reservoir, the model has also been run for 1996 and 1997 (although this was based on an older version of the model). Model Processes and Parameters The focus of TMDL development for the Klamath River downstream of Upper Klamath Lake is on DO, nutrients, ammonia toxicity, temperature, and pH. Therefore, the proposed modeling framework will address all these parameters and their interactions. The model will be capable of predicting DO dynamics and the influence of reaeration, oxidation of carbonaceous and nitrogenous materials, aquatic life respiration, algae and plant productivity, and oxygen demand exerted by sediments. Each of these components is impacted by numerous additional factors, which will also be represented, including temperature, light availability, and external contributions of nutrients and biochemical oxygen demand (from point and nonpoint sources). Key observations identified in the data review section include:
• Chlorophyll a concentrations and nutrient concentrations indicate that the Klamath River is highly productive.
• DO and temperature impairments generally occur in the summer.
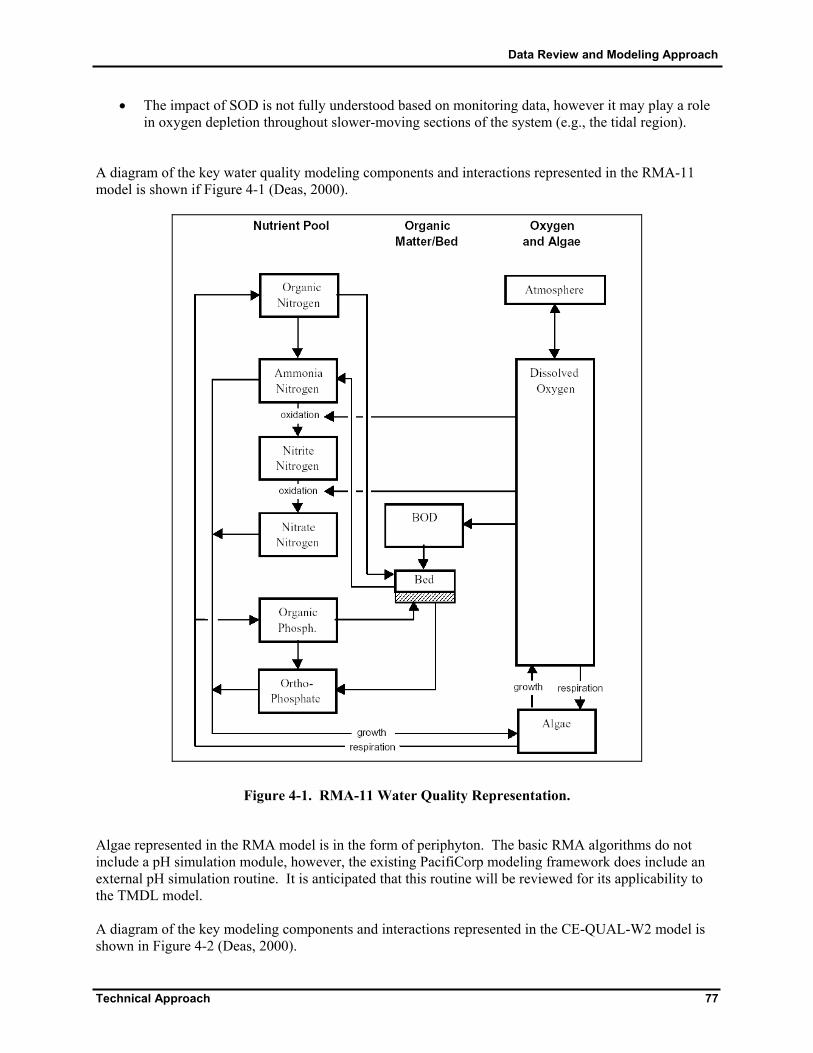
Data Review and Modeling Approach
Technical Approach 77
• The impact of SOD is not fully understood based on monitoring data, however it may play a role in oxygen depletion throughout slower-moving sections of the system (e.g., the tidal region).
A diagram of the key water quality modeling components and interactions represented in the RMA-11 model is shown if Figure 4-1 (Deas, 2000).
Figure 4-1. RMA-11 Water Quality Representation.
Algae represented in the RMA model is in the form of periphyton. The basic RMA algorithms do not include a pH simulation module, however, the existing PacifiCorp modeling framework does include an external pH simulation routine. It is anticipated that this routine will be reviewed for its applicability to the TMDL model. A diagram of the key modeling components and interactions represented in the CE-QUAL-W2 model is shown in Figure 4-2 (Deas, 2000).

Data Review and Modeling Approach
78 Technical Approach
Figure 4-2. CE-QUAL-W2 Water Quality Representation
For the reservoirs and the estuarine portion of the Klamath River, it is possible that sediment oxygen demand (SOD) plays a major role in oxygen depletion. This is possible due to the low velocities and high contribution of organics to the system. In the event that the CE-QUAL-W2 modeling framework is insufficient for conducting predictive routines (with regards to SOD), due to its use of a relatively static SOD factor, a dynamic sediment diagenesis subroutine may be built into the model. The need for this routine will be determined during the model calibration process.

Data Review and Modeling Approach
Technical Approach 79
Source Representation Primary sources of pollution to the Klamath must be accurately represented in the modeling process. Accurate representation of contributions from permitted point sources and nonpoint source contributions from urban, agricultural, and natural areas is critical in properly representing the system and ultimately evaluating potential load reduction scenarios. For each model in the proposed Klamath modeling framework, the upstream boundary flow and concentration will be provided based on the simulation results of the immediate upstream model. Major tributaries to the main-stem rivers and its reservoirs will be represented at discrete points by time-variable flow and water quality concentrations based on monitoring data (or potentially, watershed modeling results), in a manner consistent with the existing PacifiCorp modeling framework. Point source contributions will also be represented at discrete points along the main-stem river and represented by time-variable flow and water quality. Nonpoint source contributions will be represented in two ways: 1) as lateral inflows directly to the main-stem river (for “intervening zones” or zones that don’t first feed into a tributary prior to draining into the Klamath River) and 2) inherently through major tributary time-series inputs. Individual nonpoint source categories are not represented explicitly in the proposed modeling framework, because major tributaries are only represented as distinct time-series inputs and lateral inflows are represented as gross loads for each segment. In order to distinguish among contributing sources, a separate analysis will be necessary or a watershed model must be implemented. The proposed modeling framework will enable identification of critical load contributions to the system (tributaries, point sources, upstream contributions, etc.) so that spatial allocations can be performed. An additional source/input that will be represented is the Lost River, which contributes to the Klamath River via the Lost River Diversion Channel (depending on the time of year) and the Klamath Straits Drain. Flow data monitored in the Diversion Channel will be used to represent outflow to the Lost River during the spring, summer, and fall. Incoming flow and water quality constituents transported through the Diversion Channel and Klamath Straits Drain will be predicted by the Lost River Model, which is being developed concurrently. Calibration The RMA and CE-QUAL-W2 models will be calibrated and validated for both hydrodynamics and water quality. Steps will include checking the water balance, calibrating the hydrodynamics and temperature, and calibrating water quality compartments. The water balance will be calibrated through comparison of predicted surface water elevation to measured elevation. After the water budget is checked, the temperature, dissolved oxygen, and other parameters simulated by the models will be compared with monitoring data. Necessary adjustments to model parameters will then be made. Calibration will likely be performed for the same years the PacifiCorp modeling framework was calibrated (2000 and 2001). It will be validated for a longer time period, in order to ensure its applicability to a wider range of hydrologic conditions (1996 – 1999 and 2002 – 2004). This assumes that hydrodynamic and water quality monitoring data are adequate throughout this period. Model calibration and validation results will be presented in both statistical and graphical form. Graphical results will consist of modeled time series plots for each constituent (including water surface elevation, temperature, DO, NH3, NO3/NO2, PO4, algae [chlorophyll a], and pH) compared to observation data. Statistical comparisons will additionally be made. These statistical analyses may include non-parametric pair-wise comparisons among predicted and observed constituent concentrations
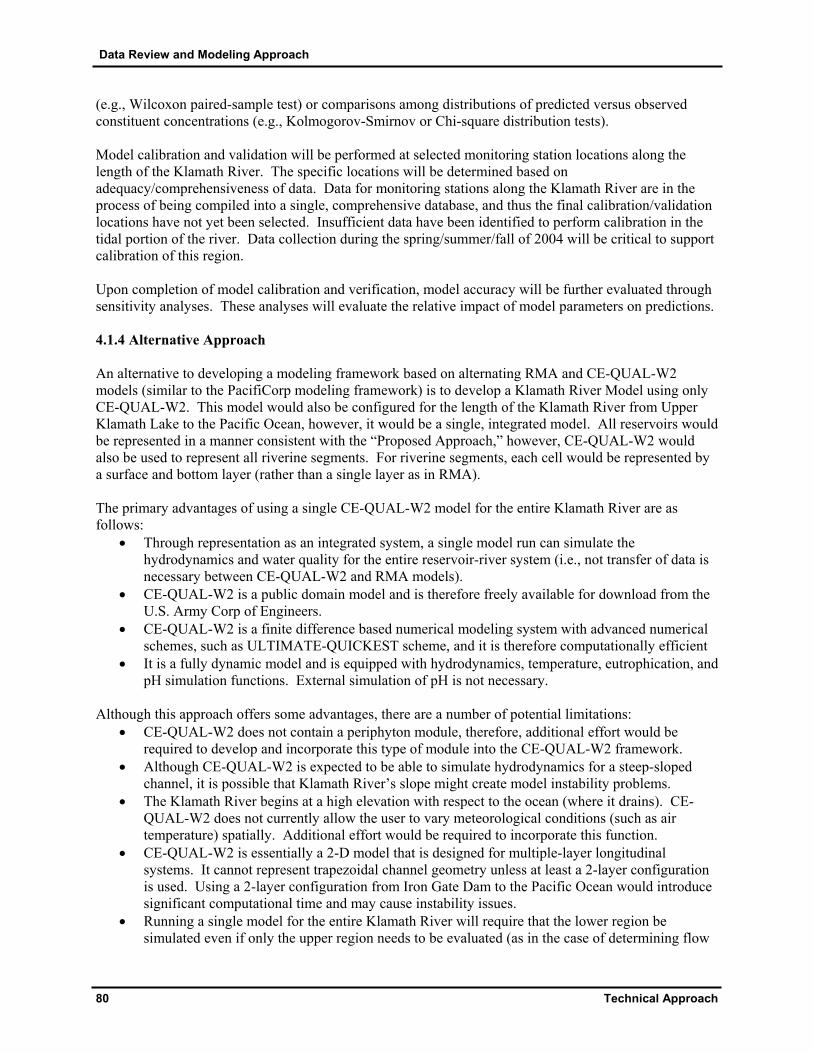
Data Review and Modeling Approach
80 Technical Approach
(e.g., Wilcoxon paired-sample test) or comparisons among distributions of predicted versus observed constituent concentrations (e.g., Kolmogorov-Smirnov or Chi-square distribution tests). Model calibration and validation will be performed at selected monitoring station locations along the length of the Klamath River. The specific locations will be determined based on adequacy/comprehensiveness of data. Data for monitoring stations along the Klamath River are in the process of being compiled into a single, comprehensive database, and thus the final calibration/validation locations have not yet been selected. Insufficient data have been identified to perform calibration in the tidal portion of the river. Data collection during the spring/summer/fall of 2004 will be critical to support calibration of this region. Upon completion of model calibration and verification, model accuracy will be further evaluated through sensitivity analyses. These analyses will evaluate the relative impact of model parameters on predictions. 4.1.4 Alternative Approach An alternative to developing a modeling framework based on alternating RMA and CE-QUAL-W2 models (similar to the PacifiCorp modeling framework) is to develop a Klamath River Model using only CE-QUAL-W2. This model would also be configured for the length of the Klamath River from Upper Klamath Lake to the Pacific Ocean, however, it would be a single, integrated model. All reservoirs would be represented in a manner consistent with the “Proposed Approach,” however, CE-QUAL-W2 would also be used to represent all riverine segments. For riverine segments, each cell would be represented by a surface and bottom layer (rather than a single layer as in RMA). The primary advantages of using a single CE-QUAL-W2 model for the entire Klamath River are as follows:
• Through representation as an integrated system, a single model run can simulate the hydrodynamics and water quality for the entire reservoir-river system (i.e., not transfer of data is necessary between CE-QUAL-W2 and RMA models).
• CE-QUAL-W2 is a public domain model and is therefore freely available for download from the U.S. Army Corp of Engineers.
• CE-QUAL-W2 is a finite difference based numerical modeling system with advanced numerical schemes, such as ULTIMATE-QUICKEST scheme, and it is therefore computationally efficient
• It is a fully dynamic model and is equipped with hydrodynamics, temperature, eutrophication, and pH simulation functions. External simulation of pH is not necessary.
Although this approach offers some advantages, there are a number of potential limitations:
• CE-QUAL-W2 does not contain a periphyton module, therefore, additional effort would be required to develop and incorporate this type of module into the CE-QUAL-W2 framework.
• Although CE-QUAL-W2 is expected to be able to simulate hydrodynamics for a steep-sloped channel, it is possible that Klamath River’s slope might create model instability problems.
• The Klamath River begins at a high elevation with respect to the ocean (where it drains). CE-QUAL-W2 does not currently allow the user to vary meteorological conditions (such as air temperature) spatially. Additional effort would be required to incorporate this function.
• CE-QUAL-W2 is essentially a 2-D model that is designed for multiple-layer longitudinal systems. It cannot represent trapezoidal channel geometry unless at least a 2-layer configuration is used. Using a 2-layer configuration from Iron Gate Dam to the Pacific Ocean would introduce significant computational time and may cause instability issues.
• Running a single model for the entire Klamath River will require that the lower region be simulated even if only the upper region needs to be evaluated (as in the case of determining flow

Data Review and Modeling Approach
Technical Approach 81
and water quality transfer between the Klamath and Lost Rivers). This will result in significant unnecessary computational burden.
The general procedure for developing and applying an integrated CE-QUAL-W2 modeling framework for the Klamath River is similar to that for the “Proposed Approach.” Configuration would involve using a longitudinal-vertical 2-D model for the entire system. Modeling segment lengths would likely range from 100 to 1,000 meters (depending on river/reservoir geometry and water quality characteristics). Spatially variable layer thicknesses would be implemented. Two layers would likely be used to represent riverine segments while more than 2 layers would be used for reservoir and estuarine portions (similar to that in the existing PacifiCorp Modeling Framework). The modeling time period would be consistent with that in the “Proposed Approach.” CE-QUAL-W2 has the capability of auto-stepping, therefore the time step could be adjusted internally by the model during a simulation (depending on the flow and loading conditions). Thus, it may not require a 60-second timestep for the entire modeling period. Model processes and parameters would be consistent with those described previously for the CE-QUAL-W2 model, except that a periphyton module would be additionally implemented. Sources would be represented in the same manner as for the “Proposed Approach” (i.e., major tributaries including the Lost River and point sources represented as discrete time-series inputs to the system). No transfer of data and conversion of loadings from one set of model state variables to another would be necessary since only one model would be implemented. Model calibration and validation would be identical to that described for the “Proposed Approach.” 4.2 Lost River Proposed Approach 4.2.1 Overview A dynamic modeling framework is also recommended to support TMDL development for the Lost River. The proposed approach is to develop a CE-QUAL-W2 model for the entire Lost River system from Malone Dam to the outlet of the Klamath Straits Drain (into the Klamath River). The model will include the Lost River itself, Tule Lake (and Tule Lake Sump), the P Canal, the Lower Klamath Lakes, and the Klamath Straits Drain. All other canals and drains in the Klamath Project will be incorporated into the modeling framework as time-series flow and water quality inputs at discrete locations (based on available monitoring data and literature, as necessary). These canals and drains will not be explicitly simulated in the modeling framework. The proposed dynamic modeling framework will ultimately be linked to the proposed dynamic model of the Klamath River (from Upper Klamath Lake to the Pacific Ocean) via transfer of modeled time-variable flow and water quality constituents. There are several advantages to implementing a dynamic modeling framework using CE-QUAL-W2:
• CE-QUAL-W2 is proposed for simulation of the Lake Ewauna model in both the “Proposed” and “Alternative” modeling frameworks for the Klamath River. Therefore, the linkage between the Lost River and Klamath River modeling frameworks (via the Lost River Diversion and Klamath Straits Drain) can be made using identical base models.
• CE-QUAL-W2 is capable of predicting hydrodynamics, nutrient cycles, dissolved oxygen, temperature, and other parameters and processes pertinent to the TMDL development effort.
• CE-QUAL-W2 is capable of simulating the multiple flow control structures along the length of the Lost River (i.e., dams and pumping stations).

Data Review and Modeling Approach
82 Technical Approach
• CE-QUAL-W2 is dynamic (time-variable) and thus capable of representing the highly variable flow and water quality conditions within years and between years.
• CE-QUAL-W2 has a proven track record in the environmental arena. • Most stakeholders in the watershed are already familiar with CE-QUAL-W2 and its application to
the Klamath River. • Model results can be directly compared to ODEQ and NRWQCB water quality criteria. • CE-QUAL-W2 is a public domain model and is therefore freely available for download from the
U.S. Army Corp of Engineers. • CE-QUAL-W2 is a finite difference based numerical modeling system with advanced numerical
schemes, such as ULTIMATE-QUICKEST scheme, and it is therefore computationally efficient. Potential limitations include:
• CE-QUAL-W2 does not contain a periphyton module, therefore, additional effort will be required to develop and incorporate this type of module into the CE-QUAL-W2 framework.
• CE-QUAL-W2 is essentially a 2-D model that is designed for multiple-layer longitudinal systems. It cannot represent trapezoidal channel geometry unless at least a 2-layer configuration is used.
4.2.2 Model Configuration Spatial scale The modeling framework will include the entire Lost River (from Malone Dam to Tule Lake), Tule Lake and Sump, P Canal, Lower Klamath Lake, and the Klamath Straits Drain. Although the entire Lost River system will be represented under a single framework, it will be divided internally into separate waterbodies, in order to address the different characteristics of the river segments and reservoirs. A schematic that identifies the primary components and key inputs and withdrawals is included is shown in Figure 4-3.
Data Review and Modeling Approach
Technical Approach 83
Figure 4-3. Schematic of the Lost River System.
For the Lost River (from Malone Diversion Dam to Tule Lake), segment lengths are expected to be between 100 and 1,000 meters. At least two layers will be configured to represent the channel (wider for the top segment than the bottom), and layer thickness will be determined based on the depth of water and computational requirements. Cross-sectional data have not yet been obtained for the Lost River. In the event that sufficient cross-sectional data are not acquired, segment widths and depths will be derived from USGS Quad Maps, aerial photos, and assumptions relating surface width to bottom width. In sections of the river where dams are located (Harpold Dam, the Lost River Diversion Dam, and the Anderson-Rose Dam), unique layer thicknesses will be instituted to represent the characteristics of each reservoir. The dam discharge/spill flow will be set as an internal boundary condition, in order to link upstream and downstream river sections. Tule Lake and Lower Klamath Lake will be configured as two separate waterbodies linked using the pumping flow time series at Pump Station D, in order to provide the ability to estimate a rough assimilative capacity for TMDL purposes. For each lake, a one-segment model will be configured to represent the water quality dynamics without detailed consideration of transport. Representation of these lakes with multiple elements is limited by the available water quality data. Tule Lake will receive water from the Lost River and drainage return flow.

Data Review and Modeling Approach
84 Technical Approach
Only the main-stem Lost River (including the lake created by Harpold Dam, Wilson Reservoir, and Anderson-Rose Lake), Tule Lake and Tule Lake Sump, the P Canal, the Lower Klamath Lake, and the Klamath Straits Drain will be simulated within the TMDL modeling framework. All tributaries, canals, and drains feeding into the river will be represented as boundary conditions (i.e., they will not be explicitly modeled). More detailed information regarding representation of models inflows and outflows are is included in Appendix E. This appendix also identifies more detailed information regarding data availability and limitation for modeling support. They will be represented by flow and water quality constituent time series based on historical flow and monitoring data. In some situations, it may be necessary to represent multiple drains and/or canals as a single input due to water quality monitoring data limitations. That is, not every canal and tributary has sufficient monitoring data to estimate time-variable flow and water quality. The tributaries, canals, and drains (or combinations of multiple canals and/or drains) can ultimately be given allocations, however, the variability of flow and water quality within each waterbody cannot be fully evaluated. Source-based allocations can only be provided for individual tributaries, canals, and drains if sufficient data are available to distinguish between source contributions. Alternatively, a watershed model may be implemented (although the current project scope does not include development watershed model at this time) or literature values for various source categories can be used to support a more detailed source allocation. The resolution offered by the proposed modeling framework is sufficient to meet the regulatory requirements identified by ODEQ and NRWQCB. As identified by the agencies, output is needed from the following locations:
• Malone Dam to Harpold Dam • Harpold Dam to Anderson-Rose Dam • Lost River at the OR/CA Border • Tule Lake and Tule Lake Sump (E/W Bridge and D Pump) • Klamath Wildlife Refuge (P Canal and Klamath Straits Drain at Stateline) • Klamath Straits Drain Outlet to the Klamath River
Time Step Using CE-QUAL-W2’s autostepping capability, a fixed time step will not be required. Instead, the model will determine the most appropriate time step for simulation and will adjust accordingly. A maximum time step of 1 hour will be specified. Time Period The Lost River will be simulated for the same time period as the Klamath River modeling framework (1996 to 2004) due to the interaction between the two river systems (assuming data adequacy). The models must ultimately be synchronized to generate appropriate boundary conditions for one another. As with the Klamath model, a portion of this time period will be used for model calibration and validation (which is discussed later in this section). This period represents a range of hydrologic conditions and inherently considers seasonal variability and critical conditions (from both a sub-annual and multi-year standpoint). Model Processes and Parameters The focus of TMDL development for the Lost River is similar to that for the Klamath River (DO, nutrients, ammonia toxicity, temperature, and pH), with the addition of bacteria. Therefore, the proposed modeling framework will address all these parameters and their interactions. The model will be capable

Data Review and Modeling Approach
Technical Approach 85
of predicting DO dynamics and the influence of reaeration, oxidation of carbonaceous and nitrogenous materials, aquatic life respiration, algae and plant productivity, and oxygen demand exerted by sediments. Each of these components is impacted by numerous additional factors, which will also be represented, including temperature, light availability, and external contributions of nutrients and biochemical oxygen demand (from point and nonpoint sources). Bacteria transport and die-off will also be simulated. Key observations identified in the data review section are similar to those for the Klamath River and include:
• Chlorophyll a concentrations and nutrient concentrations indicate that the Lost River is highly productive.
• DO and temperature impairments generally occur in the summer. • The impact of SOD is not fully understood based on monitoring data, however it may play a role
in oxygen depletion throughout slower-moving sections of the system (e.g., impounded areas). This is evidenced by the fact that DO is generally lowest in the impounded areas.
A diagram of the key modeling components and interactions represented in the CE-QUAL-W2 model was shown in Figure 4-1. As noted earlier in this document, it will likely be necessary to incorporate an algorithm for simulation of periphyton into the CE-QUAL-W2 code. Further data review and monitoring will provide greater insight into this potential need. Additionally, further monitoring of SOD and the benthic nutrient flux is necessary to determine their role in Lost River oxygen depletion. As with periphyton, if a dynamic sediment diagenesis module or improvement of the first-order formulation currently in CE-QUAL-W2 is deemed necessary, updates to the CE-QUAL-W2 code will be made. Another key aspect of the system that must be accurately represented in the modeling framework is irrigation withdrawal and return. The Lost River water is highly utilized for irrigation and is often used and reused multiple times during its transport throughout the system. Thus, the return flow water quality is dependent not only on the local farming practices, but also on the water quality from where it is originally diverted. This direct correlation must be considered in the modeling framework to accurately represent scenarios. The CE-QUAL-W2 model will be upgraded with an appropriate function to track the use and reuse of water throughout the system. A look-up table will be formulated to associate the return flow water quality with the source water concentration and its location. Source Representation Primary sources of pollution to the Lost River must be accurately represented in the modeling process. Accurate representation of contributions from permitted point sources and nonpoint source contributions from urban, agricultural, and natural areas is critical in properly representing the system and ultimately evaluating potential load reduction scenarios. Major tributaries, canals, and drains to (and diversions from) the main-stem river and its reservoirs will be represented at discrete points by time-variable flow and water quality concentrations based on monitoring data (or potentially, watershed modeling results). The amount of irrigation flow and return flow will be estimated based on the Bureau or Reclamations flow records (currently being analyzed), through a flow balance approach calculated for river sections, and/or using irrigation efficiency coefficients. The irrigation flow will be configured as outflow at the diversion or pumping location, while return flows will be represented as inflows at appropriate locations.
Data Review and Modeling Approach
86 Technical Approach
Point source contributions will also be represented at discrete points along the main-stem river and represented by time-variable flow and water quality. Nonpoint source contributions will be represented in two ways: 1) as lateral inflows directly to the main-stem river (for “intervening zones” or zones that don’t first feed into a tributary prior to draining into the Lost River) and 2) inherently through major tributary time-series inputs. Individual nonpoint source categories are not represented explicitly in the proposed modeling framework, because major tributaries are only represented as distinct time-series inputs and lateral inflows are represented as gross loads for each segment. In order to distinguish among contributing sources, a separate analysis will be necessary or a watershed model must be implemented. An upstream boundary condition will be defined at the Malone Diversion Dam. The proposed modeling framework will enable identification of critical load contributions to the system (tributaries, point sources, upstream contributions, etc.) so that spatial allocations can be performed. An additional source/input that will be represented is the Klamath River, which contributes to the Lost River via the A Canal and the Lost River Diversion Channel (depending on the time of year). Flow data monitored in these canals will be used to represent inflow to the Lost River (and will be consistent with the values used in the Klamath model) during the spring, summer, and fall. Linkage to the Klamath River Model The linkage between the Klamath and Lost River Models will be implemented using the following “alternating scheme” (using the year 2000 as an example):
• The Lost River Model will be run from day 1 of the year 2000 until the beginning of irrigation period. The water quality concentrations at the locations where the Lost River Diversion Dam is located will be saved.
• The Klamath River Model (from the Link River Dam through Lake Ewauna) will be run from day 1 of the year 2000 until the end of irrigation season using the boundary conditions generated above at the Lost River Diversion Dam.
• The Lost River Model will then be run from the beginning of the irrigation season until the beginning of the irrigation season for the next year using the boundary conditions obtained for the Lost River Diversion Dam using the Klamath River Model in the previous step.
The above process will be repeated in order to cover the complete simulation time period. Calibration The CE-QUAL-W2 model will be calibrated and validated for both hydrodynamics and water quality as described in the “Proposed” and “Alternative” Klamath models above. Steps will include checking the water balance, calibrating the hydrodynamics and temperature, and calibrating water quality compartments. The water balance will be calibrated through comparison of predicted surface water elevation to measured elevation. After the water budget is checked, the temperature, dissolved oxygen, and other parameters simulated by the models will be compared with monitoring data. Necessary adjustments to model parameters will then be made. Calibration will be performed for the same years as the Klamath Model (2000 and 2001), assuming data are sufficient. Based on a preliminary review of the data, this appears plausible. It will be validated for a longer time period, in order to ensure its applicability to a wider range of hydrologic conditions (1996 – 1999 and 2002 – 2004). This assumes monitoring data are adequate.

Data Review and Modeling Approach
Technical Approach 87
Model calibration and validation results will be presented in both statistical and graphical form. Model calibration and validation will be performed at selected monitoring station locations along the length of the Lost River. The specific locations will be determined based on adequacy/comprehensiveness of data. Upon completion of model calibration and verification, model accuracy will be further evaluated through sensitivity analyses. These analyses will evaluate the relative impact of model parameters on predictions. 4.2.3 Alternative Approach An alternative to developing a modeling framework based on CE-QUAL-W2 is to develop a Lost River Model using a 1-dimensional version of EFDC (Environmental Fluid Dynamics Code) for riverine portions of the Lost River (from Malone Diversion Dam to Tule Lake) and WASP/EUTRO box models for Tule Lake/Tule Lake Sump and Lower Klamath Lake. Advantages of this approach include:
• EFDC is capable of predicting hydrodynamics, nutrient cycles, dissolved oxygen, temperature, and other parameters and processes pertinent to the TMDL development effort for the riverine section, while WASP/EUTRO can represent the nutrient cycles, dissolved oxygen, and other pertinent parameters for the lake TMDL analyses.
• EFDC is capable of simulating the multiple flow control structures along the length of the Lost River (i.e., dams and pumping stations).
• Both models are dynamic (time-variable) and thus capable of representing the highly variable flow and water quality conditions within years and between years.
• Both models have a proven track record in the environmental arena – particularly with regard to TMDLs.
• Model results can be directly compared to ODEQ and NRWQCB water quality criteria. • Both models are EPA-endorsed and supported and are included in the EPA TMDL Modeling
Toolbox. They are public domain models, fully transparent (i.e., model code), and are available free of charge. EPA also provides training and support on their application free of charge.
• The EFDC water quality module possesses a fully numerical sediment diagenesis module to predict SOD and benthic nutrient flux based on organic loading to the water body. Tetra Tech has also upgraded WASP/EUTRO5 to include predictive sediment diagenesis capabilities. This improves the reliability of the models for DO and nutrient TMDLs.
Potential limitations include:
• WASP/EUTRO does not have hydrodynamic prediction capabilities internally; therefore, if higher resolution of information (such as spatial gradient of pollutant concentrations, water circulation patterns, or mass transport) are needed, it is unsuitable.
• WASP/EUTRO does not contain a periphyton module, therefore, additional effort will be required to develop and incorporate this type of module into the model code.
• While the multi-model framework may be efficient for calibration, it is also cumbersome in terms of data management and transfer between models. Additionally, due to differences in algorithms and state parameters for EFDC and WASP/EUTRO, conversion of pollutant loads between models may potentially result in slight inaccuracies.
• EFDC is best-suited to simulation of multi-dimensions. When it is applied to 1-D configuration, it only provides for a rectangular approximation to the river channel.
• Neither the EFDC nor the WASP/EUTRO models have the capability of simulating pH. Additional code modifications would be required for both.

Data Review and Modeling Approach
88 Technical Approach
4.2.3.1 Model Background EFDC EFDC is a general purpose modeling package for simulating one- or multi-dimensional flow, transport, and bio-geochemical processes in surface water systems including rivers, lakes, estuaries, reservoirs, wetlands, and coastal regions. The EFDC model was originally developed at the Virginia Institute of Marine Science for estuarine and coastal applications and is considered public domain software. This model is now being supported by US Environmental Protection Agency (EPA) and has been used extensively to support TMDL development throughout the country. In addition to hydrodynamic, salinity, and temperature transport simulation capabilities, EFDC is capable of simulating cohesive and non-cohesive sediment transport, near field and far field discharge dilution from multiple sources, eutrophication processes, the transport and fate of toxic contaminants in the water and sediment phases, and the transport and fate of various life stages of finfish and shellfish. The EFDC model has been extensively tested, documented, and applied to environmental studies world-wide by universities, governmental agencies, and environmental consulting firms. The structure of the EFDC model includes four major modules: (1) a hydrodynamic model, (2) a water quality model, (3) a sediment transport model, and (4) a toxics model. The water quality portion of the model simulates the spatial and temporal distributions of 22 water quality parameters including dissolved oxygen, suspended algae (3 groups), attached algae, various components of carbon, nitrogen, phosphorus and silica cycles, and fecal coliform bacteria (Figure 4-4). Salinity, water temperature, and total suspended solids are needed for computation of the twenty-two state variables, and they are provided by the hydrodynamic model. The sediment process model uses a slightly modified version of the Chesapeake Bay three-dimensional model. Upon receiving the particulate organic matter deposited from the overlying water column, it simulates their diagenesis and the resulting fluxes of inorganic substances (ammonium, nitrate, phosphate and silica) and sediment oxygen demand back to the water column. The coupling of the sediment process model with the water quality model not only enhances the model's predictive capability of water quality parameters but also enables it to simulate the long-term changes in water quality conditions in response to changes in nutrient loads.

Data Review and Modeling Approach
Technical Approach 89
Figure 4-4. EFDC Water Quality Model Components.
WASP/EUTRO WASP/EUTRO is a general modeling framework designed to simulate the fate and transport of nutrients and corresponding biological response in receiving waterbodies in any spatial dimension (Ambrose et al., 1993). WASP/EUTRO allows users to interpret and predict water quality response due to natural and man-made impacts for water quality management. It is a dynamic finite segment modeling system for aquatic systems and includes both the water column and underlying sediment column. The WASP portion of the model represents time-variable advection, dispersion, point and distributed mass loading, and boundary exchanges of mass. The EUTRO module represents the kinetic reactions of nutrients, organic matter, and dissolved oxygen. The combination of mass transport and bio-chemical reaction simulation results in an integrated modeling framework for representing receiving water processes for conventional pollutants. The reactions involved in the standard WASP/EUTRO model can be described by four interacting systems: • phytoplankton kinetics, • the phosphorus cycle,
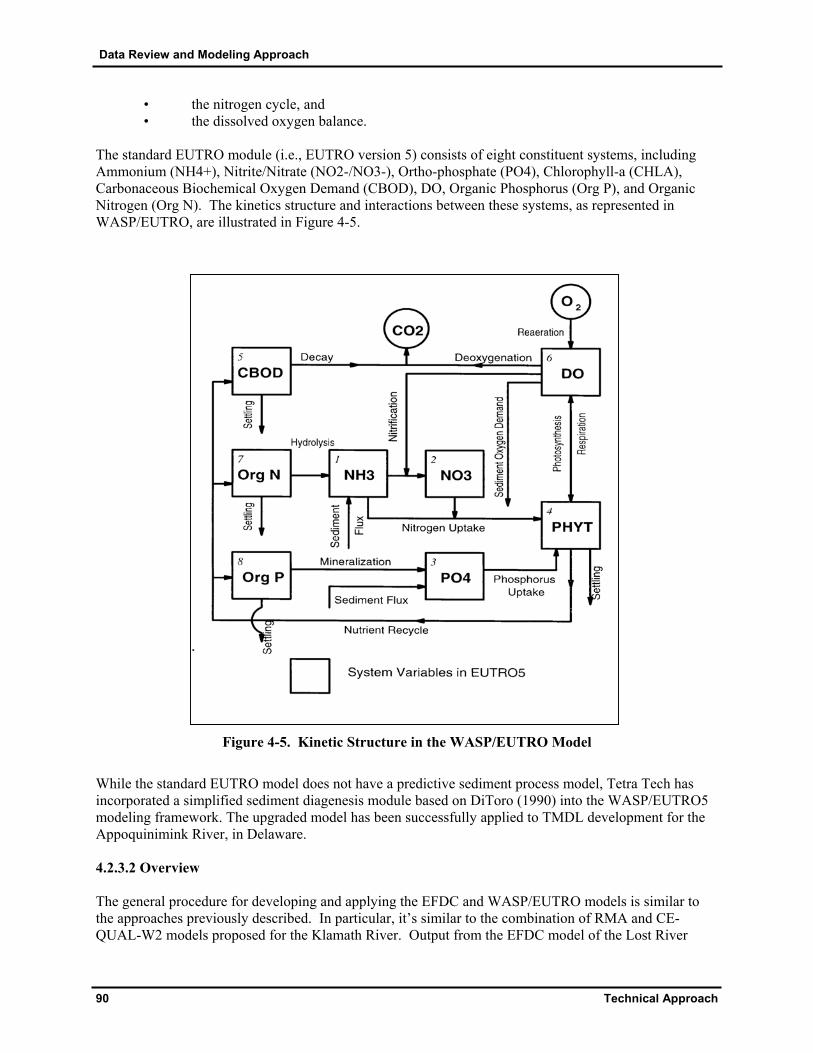
Data Review and Modeling Approach
90 Technical Approach
• the nitrogen cycle, and • the dissolved oxygen balance. The standard EUTRO module (i.e., EUTRO version 5) consists of eight constituent systems, including Ammonium (NH4+), Nitrite/Nitrate (NO2-/NO3-), Ortho-phosphate (PO4), Chlorophyll-a (CHLA), Carbonaceous Biochemical Oxygen Demand (CBOD), DO, Organic Phosphorus (Org P), and Organic Nitrogen (Org N). The kinetics structure and interactions between these systems, as represented in WASP/EUTRO, are illustrated in Figure 4-5.
Figure 4-5. Kinetic Structure in the WASP/EUTRO Model
While the standard EUTRO model does not have a predictive sediment process model, Tetra Tech has incorporated a simplified sediment diagenesis module based on DiToro (1990) into the WASP/EUTRO5 modeling framework. The upgraded model has been successfully applied to TMDL development for the Appoquinimink River, in Delaware. 4.2.3.2 Overview The general procedure for developing and applying the EFDC and WASP/EUTRO models is similar to the approaches previously described. In particular, it’s similar to the combination of RMA and CE-QUAL-W2 models proposed for the Klamath River. Output from the EFDC model of the Lost River

Data Review and Modeling Approach
Technical Approach 91
(from the Malone Diversion Dam to Tule Lake) would become input for the WASP/EUTRO model of Tule Lake and the Tule Lake Sump. Output from Tule Lake and the Tule Lake Sump would become input for an EFDC model of the P Canal. P Canal EFDC model output would, in turn, become input for a WASP/EUTRO model of Lower Klamath Lake, and Lower Klamath Lake output would become input for an EFDC model of the Klamath Straits Drain. This model configuration is presented in Table 4-3.
Table 4-3. Lost River Model Components – Alternative Approach Modeling Segment Segment Type Model(s)
Lost River (Malone Dam to Tule Lake) River/Reservoir EFDC Tule Lake and Tule Lake Sump Reservoir WASP/EUTRO P Canal River EFDC Lower Klamath Lake Reservoir WASP/EUTRO Klamath Straits Drain River EFDC Application of EFDC will require segmentation of the Lost River into multiple grid cells and definition of hydraulic characteristics and boundary conditions. A 1-dimensional representation with segment lengths of 100 to 1,000 meters depending on the channel dimensions and flow regime will be used. The three dams will be configured as internal flow control structures. Boundary conditions for all major tributaries, canals, and diversions would be instituted in the same manner as for the “Proposed” Lost River approach. However, due to the inherent solutions of the EFDC water quality model, it will be necessary to utilize Total Organic Carbon (TOC) data rather than BOD data. The standard version of EFDC does not have a pH state variable, however, modification of the model code to incorporate pH simulation capability can be pursued. Tule Lake, Tule Lake Sump, and Lower Klamath Lake will be configured as single box models due to their shapes and depths, the need for an estimate of assimilative capacity for each, and monitoring data limitations. Alternatively, a vertical 1-dimensional representation can be used (if depth-variable water quality is highly variable and critical to the TMDL analysis). The WASP/EUTRO code will be updated to include periphyton simulation, and sediment diagenesis (as necessary). Although WASP/EUTRO does not simulate pH, a modification to the code can be implemented to link the pH simulation with external loading and internal dynamics such as algae growth and respiration. The modeling time period for this alternative approach would be consistent with that in the “Proposed Approach.” The time step for this modeling approach is expected to be between 10 seconds and 100 seconds for the river model and longer (likely minute or hourly) for the lake models. Model processes and parameters would be consistent with those described previously for the CE-QUAL-W2 model, except that a pH module would be additionally implemented. Sources would be represented in the same manner as for the “Proposed Approach” (i.e., major tributaries including the Lost River and point sources represented as discrete time-series inputs to the system). Minor efforts regarding transfer of data and conversion of loadings from one set of model state variables to another would be necessary. Model calibration and validation would be identical to that described for the “Proposed Approach.” 4.2 TMDL Analysis The ultimate goal of the TMDL is to determine the assimilative capacities of the Klamath River (from Upper Klamath Lake to the Pacific Ocean) and the Lost River system (from Malone Diversion Dam through the Klamath Straits Drain) and ensure that the rivers and their reservoirs meet prescribed water quality criteria along its length. The TMDL process involves selection of appropriate targets and development of source loading scenarios that meet the targets.

Data Review and Modeling Approach
92 Technical Approach
4.2.1 TMDL Targets ODEQ and NCRWQCB have identified TMDL targets for the 303d-listed water quality constituents, as described earlier in this document. Numeric targets have been identified for temperature, DO, nutrients, ammonia toxicity, pH, and bacteria. Each of these targets must be met throughout the entire length of the Klamath River under all conditions (including critical conditions). Critical conditions are the set of environmental conditions for which controls designed to protect water quality will ensure attainment of objectives for all other conditions. This is typically the period of time in which the waterbody exhibits the most vulnerability. Although no numerical chlorophyll a water quality criteria exist for OR or CA, targets to achieve may be identified by ODEQ and NCRWQCB. The proposed and alternative models presented for the Klamath and Lost Rivers are capable of predicting time-variable (hourly or more frequently) water quality conditions and thus can be compared directly to the TMDL targets. Even averaging periods, such as the 30-day median and 30-day log mean calculations required by OR’s and CA’s water quality standards for bacteria (respectively) can be accommodated. The Klamath and Lost River models will be run for a length of time that covers a range of potential hydrologic conditions (i.e., the calibration and validation years: 1996 – 2004), in order to ensure that critical conditions are sufficiently represented. Time-series model results for the entire system will first be compared to the prescribed water quality targets (i.e., state water quality criteria) and reviewed to identify water quality target exceedance locations and time periods. The sensitivity analyses conducted for the models will help to identify the critical influences on water column water quality and will provide a basis for selecting appropriate inputs to reduce. For example, phosphorus may be identified as the primary factor influencing algae growth, while organic matter may be the most critical influence on DO levels. Once the impairment locations and time periods have been identified for each constituent, and the most sensitive input parameters have been identified, a series of hypothetical scenarios will be simulated. 4.2.2 Scenarios A preliminary list of scenarios has been provided by ODEQ and NCRWQCB. This list includes a range of scenarios to potentially be simulated with the fully-calibrated and validated modeling systems. The TMDL Workgroup will prioritize the scenarios and identify those to run under the current project scope. Table 4-4 identifies the scenarios and describes the anticipated steps in conducting the scenario analysis.
Table 4-4. Potential Modeling Scenarios Scenario Approach
1: Iterative load reduction (TMDL compliance) scenarios
Lost River: Maintain current flow levels for tributaries, canals, drains, dams, and pumps. Adjust temperature and constituent concentrations for incoming tributaries, canals, and drains; and perform iterative runs until TMDL targets are met under all conditions throughout the system. These scenarios must be implemented in conjunction with updated boundary conditions based on the Klamath River scenario analysis.

Data Review and Modeling Approach
Technical Approach 93
Scenario Approach Klamath River: Maintain current flow levels for tributaries and
dams. Adjust temperature and constituent concentrations for incoming tributaries; and perform iterative runs until TMDL targets are met under all conditions throughout the system. These scenarios must be implemented in conjunction with updated boundary conditions based on the Lost River scenario analysis. Lost River: Boundary conditions (including flow, temperature, and water quality concentrations) for canals and drains feeding into the Lost River system will be adjusted according to BOR’s 10-year operation plan. An iterative load reduction (TMDL compliance) analysis will then be performed in the same manner as Scenario 1.
2: Modification of Klamath Project flows – 10-year operation plan
Klamath River: Boundary conditions for the Klamath Straits Drain and Lost River Diversion Dam (and potentially Link River Dam) will vary depending on results of the Lost River modeling for this scenario. An iterative load reduction (TMDL compliance) analysis will then be performed in the same manner as Scenario 1. Lost River: 3. Modified hydro facility operations Klamath River: Lost River: Boundary conditions for canals and drains feeding into the Lost River system will be adjusted according to the Hardy Phase 1 analysis. An iterative load reduction (TMDL compliance) analysis will then be performed in the same manner as Scenario 1.
4: Modification of Klamath Project flows – Hardy Phase 2 flows
Klamath River: Boundary conditions for the Klamath Straits Drain and Lost River Diversion Dam (and potentially Link River Dam) will vary depending on results of the Lost River modeling for this scenario. An iterative load reduction (TMDL compliance) analysis will then be performed in the same manner as Scenario 1. Lost River: Boundary conditions for canals and drains feeding into the Lost River system will be adjusted according to BOR’s undepleted natural flows. An iterative load reduction (TMDL compliance) analysis will then be performed in the same manner as Scenario 1.
5: Modification of Klamath Project flows – BOR’s undepleted natural flows
Klamath River: Boundary conditions for the Klamath Straits Drain and Lost River Diversion Dam (and potentially Link River Dam) will vary depending on results of the Lost River modeling for this scenario. An iterative load reduction (TMDL compliance) analysis will then be performed in the same manner as Scenario 1. Lost River: Flow conditions for each dam will be set prescribed by ODEQ and NCRWQCB (e.g., to maintain specified outflow levels or water surface elevations). An iterative load reduction (TMDL compliance) analysis will then be performed in the same manner as Scenario 1.
6: Flow modification for Malone, Harpold, Lost River Diversion, and Anderson-Rose Dams
Klamath River: Boundary conditions for the Klamath Straits Drain and Lost River Diversion Dam (and potentially Link River Dam) will vary depending on results of the Lost River modeling for this scenario. An iterative load reduction (TMDL compliance) analysis will then be performed in the same manner as Scenario 1.
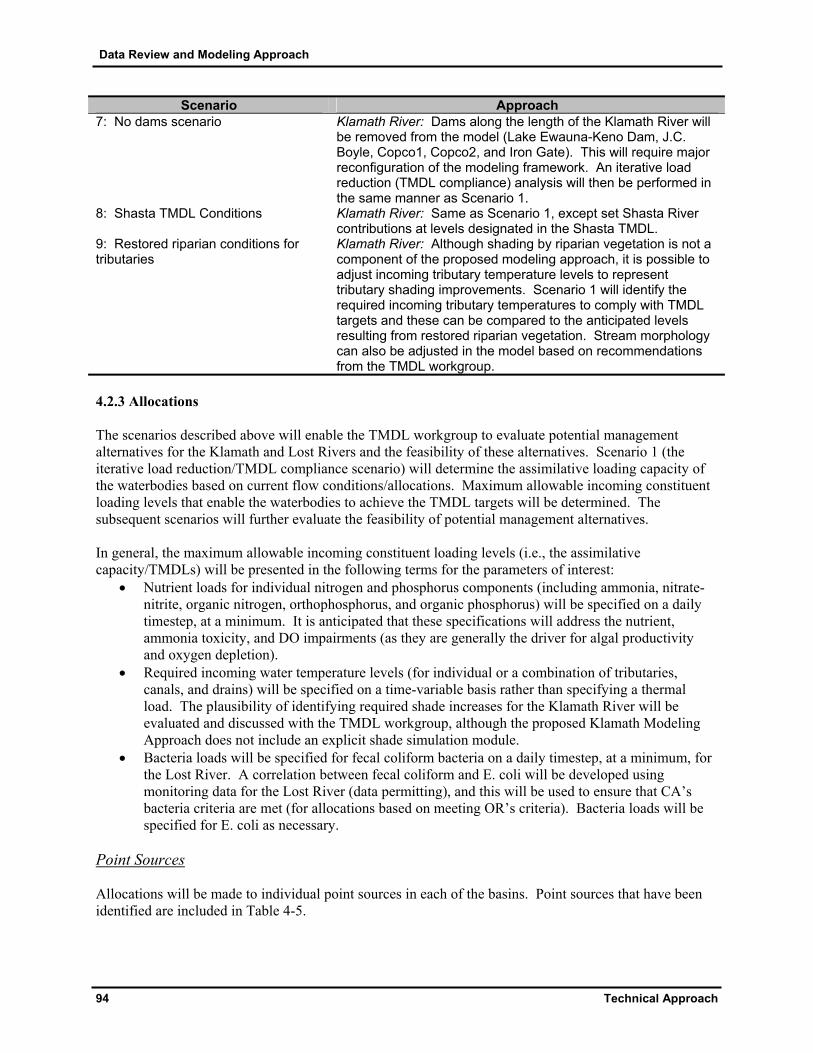
Data Review and Modeling Approach
94 Technical Approach
Scenario Approach 7: No dams scenario Klamath River: Dams along the length of the Klamath River will
be removed from the model (Lake Ewauna-Keno Dam, J.C. Boyle, Copco1, Copco2, and Iron Gate). This will require major reconfiguration of the modeling framework. An iterative load reduction (TMDL compliance) analysis will then be performed in the same manner as Scenario 1.
8: Shasta TMDL Conditions Klamath River: Same as Scenario 1, except set Shasta River contributions at levels designated in the Shasta TMDL.
9: Restored riparian conditions for tributaries
Klamath River: Although shading by riparian vegetation is not a component of the proposed modeling approach, it is possible to adjust incoming tributary temperature levels to represent tributary shading improvements. Scenario 1 will identify the required incoming tributary temperatures to comply with TMDL targets and these can be compared to the anticipated levels resulting from restored riparian vegetation. Stream morphology can also be adjusted in the model based on recommendations from the TMDL workgroup.
4.2.3 Allocations The scenarios described above will enable the TMDL workgroup to evaluate potential management alternatives for the Klamath and Lost Rivers and the feasibility of these alternatives. Scenario 1 (the iterative load reduction/TMDL compliance scenario) will determine the assimilative loading capacity of the waterbodies based on current flow conditions/allocations. Maximum allowable incoming constituent loading levels that enable the waterbodies to achieve the TMDL targets will be determined. The subsequent scenarios will further evaluate the feasibility of potential management alternatives. In general, the maximum allowable incoming constituent loading levels (i.e., the assimilative capacity/TMDLs) will be presented in the following terms for the parameters of interest:
• Nutrient loads for individual nitrogen and phosphorus components (including ammonia, nitrate-nitrite, organic nitrogen, orthophosphorus, and organic phosphorus) will be specified on a daily timestep, at a minimum. It is anticipated that these specifications will address the nutrient, ammonia toxicity, and DO impairments (as they are generally the driver for algal productivity and oxygen depletion).
• Required incoming water temperature levels (for individual or a combination of tributaries, canals, and drains) will be specified on a time-variable basis rather than specifying a thermal load. The plausibility of identifying required shade increases for the Klamath River will be evaluated and discussed with the TMDL workgroup, although the proposed Klamath Modeling Approach does not include an explicit shade simulation module.
• Bacteria loads will be specified for fecal coliform bacteria on a daily timestep, at a minimum, for the Lost River. A correlation between fecal coliform and E. coli will be developed using monitoring data for the Lost River (data permitting), and this will be used to ensure that CA’s bacteria criteria are met (for allocations based on meeting OR’s criteria). Bacteria loads will be specified for E. coli as necessary.
Point Sources Allocations will be made to individual point sources in each of the basins. Point sources that have been identified are included in Table 4-5.

Data Review and Modeling Approach
Technical Approach 95
Table 4-5. Permitted Facilities in Lost River and Lower Klamath River Watersheds Klamath River Lost River
OR0023876 - South Suburban Sanitary District OR0020486 - City of Merrill – STP (activated sludge) OR0002542 - Collins Products Klamath Falls Plant
CA0023272 - City of Tulelake
The individual permits and discharge monitoring reports (DMRs) for each of these permits will be further reviewed to ascertain their historical and permitted contributions and to confirm that they contribute to the Lost and Klamath River systems. During the sensitivity analysis and scenario analysis phases, the impact of each permitted facility’s contribution to in-stream water quality will be evaluated. Ultimately, wasteload allocations will be made for each facility based on input from the TMDL workgroup. In addition to the individual permits identified above, allocations must also be given to storm water discharges from separate storm sewer systems (MS4s). EPA's stormwater permitting regulations require municipalities to obtain permit coverage for all storm water discharges from MS4s. Implementation of these regulations are phased such that large and medium sized municipalities were required to obtain storm water permit coverage in 1990 and small municipalities by March 2003. Allocations can be provided for these permits to be consistent with ODEQ and NCRWQCB policy. The potential influences from these permits can be evaluated in much the same manner that they are evaluated for the permitted facilities identified above. It should be noted, however, that because a watershed model is not proposed for incorporation into the Lost or Klamath River modeling efforts at this stage, the potential contributions from MS4s will need to be estimated based on literature and available monitoring data. Confined Animal Feeding Operations (CAFO) also exist in the Lost River subbasin. The CAFO facilities existing in the Lost River subbasins are regulated by Oregon Department of Agriculture (ODA). Each CAFO has an NPDES permit that stipulates no discharge to surface water and/or groundwater. The overall goal of Oregon's CAFO program is to prevent discharge of CAFO waste to waters of the state. Nonpoint Sources The proposed Klamath and Lost River modeling approaches will enable allocations to be made to major tributaries, drains, and canals (or combinations of drains and canals), as well as lateral (intervening zone) nonpoint source contributions. The proposed modeling framework will not explicitly simulate loading dynamics from different landuse categories. For example, it will not explicitly simulate processes such as the application of fertilizer to irrigated lands, the percolation of nutrient-laden water through the subsurface, or the uptake of nutrients by vegetation. It will, however, distinguish between load contributions on a spatial basis. A source-specific analysis can be performed externally to provide higher allocation resolution for source categories (such as irrigated agriculture, non-irrigated agriculture, residential/urban, and forested/undeveloped areas). For example, the load allocated to a tributary can be distributed to the various landuse/source categories contributing to the tributary based on the landuse distribution and typical loading rates from the appropriate landuse categories. In the event that more detailed source-specific allocations are necessary, a watershed model may be implemented (although the current project scope does not include development watershed model). A watershed model can predict time-variable source-specific loadings (from a sub-hourly timestep to a seasonal timestep depending on model complexity) contributing to tributaries, drains, and canals. Predictions are generally made using a combination of algorithms that predict surface and subsurface hydrology (driven by meteorological monitoring data such as precipitation and evapotranspiration); application or accumulation of a water quality constituent based on land practices; and washoff of constituents based on meteorological conditions. Watershed models provide the capability of predicting

Data Review and Modeling Approach
96 Technical Approach
source-based loadings under both historical and hypothetical scenarios. A watershed model would also help to provide a more detailed allocation to MS4s in the contributing watershed. A simple, dynamic watershed model that would be applicable to the Klamath and Lost River systems for estimation of agricultural and background water quality constituent loadings is the Generalized Watershed Loading Functions (GWLF) model. The P8 model is a simple, dynamic watershed model that is applicable to urbanized watersheds. If higher resolution model output and consideration of snowfall/snowmelt impacts on hydrology and pollutant transport are necessary, a number of models are applicable, including LSPC (a modernized version of the HSPF model), HSPF, SWAT, and SWMM. Each of these models has its own advantages and limitations, however they all generally require significant monitoring data to support calibration.

Data Review and Modeling Report
References 97
REFERENCES Ambrose, R.B., T.A. Wool, and J.L. Martin. 1993. The water quality analysis and simulation program, WASP5: Part A, model documentation version 5.1. U.S. Environmental Protection Agency, Environmental Research Laboratory, Athens, GA, 210 pp. Cole, T.M. and S. A. Wells. 2000. CE-QUAL-W2: A two-dimensional, laterally averaged, Hydrodynamic and Water Quality Model, Version 3.0, Instruction Report EL-2000, US Army Engineering and Research Development Center, Vicksburg, MS. Deas, M.L, 2002. Application of Numerical water quality models in ecological assessment. Department of Civil and Environmental Engineering, University of California, Davis. DiToro, D.M, P.R. Paquin, K.Subburamu, and D.A. Gruber, 1990. Sediment oxygen demand model: methane and ammonia oxidation. Journal of Environmental Engineering, 116(5), 945-986. Kaffka, Stephen and Earl Danosky. 2002. Farming Practices and Water Quality in the Upper Klamath Basin. Final Report to the California State Water Resources Control Board. Hamrick, J.M. 1992. A Three-Dimensional Environmental Fluid Dynamics Computer Code: Theoretical and Computational Aspects, Special Report 317. The College of William and Mary, Virginia Institute of Marine Science. 63 pp. MRLC (Multi- Resolution Land Characteristics). 1992. Land use data available for the Multi-Resolution Land Characteristics Consortium. Land use data produced mainly from the 1992 Landsat TM meter coverage (30 m resolution). NRC. 2003. Endangered and Threatened Fishes in the Klamath River Basin, Causes of Decline and Strategies for Recovery. Committee on Endangered and Threatened Fishes in the Klamath River Basin, Board on Environmental Studies and Toxicology, Division on Earth and Life Studies, National Research Council, Washington D.C. USDA (United States Department of Agriculture) 1965. Agriculture Handbook No. 296, Land Resource Regions and Major Land Resource Areas of the United States. USDA United States Department of Agriculture) 1995. State Soil Geographic (STATSGO) Data Base – Data Use Information. Miscellaneous Publication Number 1492 [PDF Format]. U.S. Department of Agriculture, Natural Resources Conservation Service, Fort Worth, Texas. Woods, Philip and Gerald Orlob. 1963. The Lost River System – A Water Quality Management Investigation. Sanitary Engineering Research Laboratory, College of Engineering and School of Public Health, University of California – Berkeley.
Data Review and Modeling Report
Appendix A A-1
APPENDIX A: MAJOR LAND RESOURCE AREAS DATA DESCRIPTION
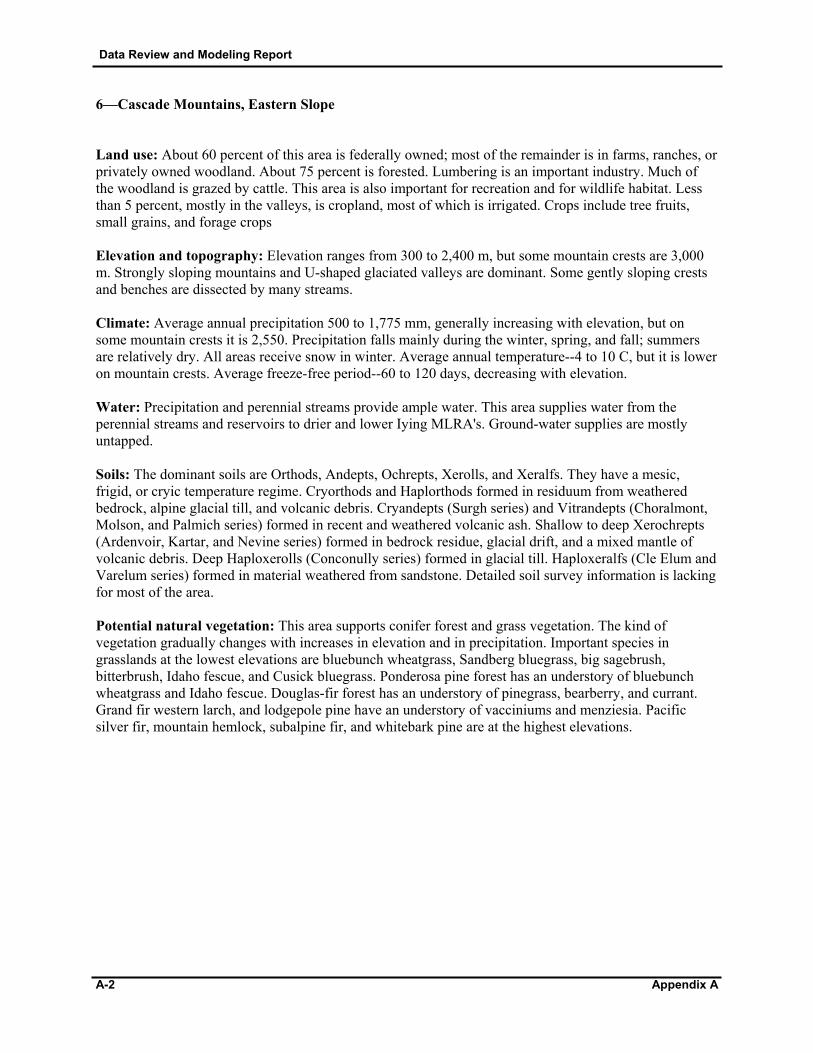
Data Review and Modeling Report
A-2 Appendix A
6—Cascade Mountains, Eastern Slope Land use: About 60 percent of this area is federally owned; most of the remainder is in farms, ranches, or privately owned woodland. About 75 percent is forested. Lumbering is an important industry. Much of the woodland is grazed by cattle. This area is also important for recreation and for wildlife habitat. Less than 5 percent, mostly in the valleys, is cropland, most of which is irrigated. Crops include tree fruits, small grains, and forage crops Elevation and topography: Elevation ranges from 300 to 2,400 m, but some mountain crests are 3,000 m. Strongly sloping mountains and U-shaped glaciated valleys are dominant. Some gently sloping crests and benches are dissected by many streams. Climate: Average annual precipitation 500 to 1,775 mm, generally increasing with elevation, but on some mountain crests it is 2,550. Precipitation falls mainly during the winter, spring, and fall; summers are relatively dry. All areas receive snow in winter. Average annual temperature--4 to 10 C, but it is lower on mountain crests. Average freeze-free period--60 to 120 days, decreasing with elevation. Water: Precipitation and perennial streams provide ample water. This area supplies water from the perennial streams and reservoirs to drier and lower Iying MLRA's. Ground-water supplies are mostly untapped. Soils: The dominant soils are Orthods, Andepts, Ochrepts, Xerolls, and Xeralfs. They have a mesic, frigid, or cryic temperature regime. Cryorthods and Haplorthods formed in residuum from weathered bedrock, alpine glacial till, and volcanic debris. Cryandepts (Surgh series) and Vitrandepts (Choralmont, Molson, and Palmich series) formed in recent and weathered volcanic ash. Shallow to deep Xerochrepts (Ardenvoir, Kartar, and Nevine series) formed in bedrock residue, glacial drift, and a mixed mantle of volcanic debris. Deep Haploxerolls (Conconully series) formed in glacial till. Haploxeralfs (Cle Elum and Varelum series) formed in material weathered from sandstone. Detailed soil survey information is lacking for most of the area. Potential natural vegetation: This area supports conifer forest and grass vegetation. The kind of vegetation gradually changes with increases in elevation and in precipitation. Important species in grasslands at the lowest elevations are bluebunch wheatgrass, Sandberg bluegrass, big sagebrush, bitterbrush, Idaho fescue, and Cusick bluegrass. Ponderosa pine forest has an understory of bluebunch wheatgrass and Idaho fescue. Douglas-fir forest has an understory of pinegrass, bearberry, and currant. Grand fir western larch, and lodgepole pine have an understory of vacciniums and menziesia. Pacific silver fir, mountain hemlock, subalpine fir, and whitebark pine are at the highest elevations.

Data Review and Modeling Report
Appendix A A-3
15—Central California Coast Range Land use: More than four-fifths of this area is in farms and ranches; most of the remainder is federally owned. About 10 percent is dry-farmed to grain, and slightly more that 50 percent is in range of native grasses and brush. Open woodland, also used for grazing, makes up nearly 35 percent of the area. Small acreages are forests and urban areas. The erosion hazard is severe in dry-farmed orchards and grainfields. If the plant cover is removed from the soils by fire, overgrazing, cultivation, or logging, the hazard of erosion is severe because of steep slopes and high-intensity rainfall. Elevation and topography: Elevation ranges from sea level to 800 m in most of the area, but it is 1,500 m in some mountains. Gently sloping to steep low mountains underlain mostly by shale and sandstone and partly by igneous and volcanic rocks cover most of the area. Coastal plains are narrow and discontinuous, and stream valleys are narrow and widely separated. Climate: Average annual precipitation 300 to 1,025 mm, but it is 375 to 750 mm in most of the area. Precipitation is evenly distributed throughout fall, winter, and spring but is very low in summer. Coastal areas receive some moisture from fog in summer. Average annual temperature 13 to 18 C. Average freeze-free period--120 to 270 days. Water: The low to moderate rainfall and moderate streamflow limit agriculture to dryfarming in most of the area. Ground-water supplies are limited. Soils: The dominant soils are Xererts, Xerolls, Ochrepts, Xeralfs, Orthents, and Psamments. They have a thermic temperature regime (mesic at the highest elevations). Soils on hills are the rolling to steep Chromoxererts (Altamont series), Argixerolls (Chamise and Los Osos series), Xerochrepts (Millsholm series), Haploxeralfs (Dibble series), and Haploxerolls (San Benito, Linne, and Santa Lucia series). Also on hills are the gently sloping to steep Palexeralfs (Spreckles series), Xerorthents (Shedd series), and Haploxerolls (Nacimiento series). Soils on uplands are the strongly sloping to steep Xeropsamments (Arnold series), Xerorthents (Gaviota series), Argixerolls (Los Gatos, Gilroy, and Henneke series), Haploxerolls (Montara, Sheridan, and Sur series), Xerochrepts (Maymen and Toomes series), and Haploxeralfs (Vallecitos series). Rock outcrop is common. Potential natural vegetation: This area supports grasses, grass-oak, and shrub vegetation. Naturalized annuals, including soft chess, bromes, fescues, wild oats, filaree, and burclover characterize the open and oak grasslands. Blue oak, valley oak, and canyon live oak are the dominant trees. California sagebrush, coyotebrush, chamise, manzanita, ceanothus, and scrub oak are the major brush species. Along the west side of the Coast Range are forests of Douglasfir, madrone, grand fir, tanoak, bigleaf maple, and a few remnant stands of redwood trees. Stands of ponderosa pine with madrone, black oak, live oaks, California buckeye, manzanita, and ceanothus are on drier sites.

Data Review and Modeling Report
A-4 Appendix A
21—Klamath and Shasta Rivers Valleys and Basins Land use: About one-half of this area is federally owned; the remainder is in farms and ranches. Between 5 and 10 percent of the land is irrigated and used for growing potatoes, grain, seed crops, hay, and pasture. An additional 1 or 2 percent is dryfarmed to grain. Most of the remaining land, both privately and publicly owned, is grazed. Some forest trees are harvested for lumber. Maintaining good drainage is the principal concern of management in the valley basins. Some sites need protection from overflow, and others are affected by alkali. The erosion hazard is slight except for gullying and flood scour. Elevation and topography: Elevation ranges from 800 to 1,400 m, but on some mountain peaks it is 1,800 m or more. Lava plateaus and many valleys and basins make up most of the area. Steep mountain spurs and rimrock escarpments surround the plateaus. Climate: Average annual precipitation 250 to 500 mm in most of the area but as much as 750 mm at higher elevations. Summers are dry. Average annual temperature 7 to 11 C. Average freeze-free period—70 to 140 days, decreasing with elevation. Water: The low precipitation and the consequent erratic flow of local streams limit the supply of water for agriculture. Ground water is scarce in the dense lava rocks underlying much of the area. On sites underlain by more porous rocks, ground-water supplies are large but mostly untapped. Soils: The dominant soils are Xerolls, Aquolls, Aquepts, Aquents, Xererts, Albolls, and Argids. They have a mesic or frigid temperature regime. Soils in basins and on flood plains and terraces are Andaquepts (Tulana series), Argialbolls (Goose Lake series), Pelloxererts (Pitts series), Durargids (Trosi series), Halaquepts (Lolak series), Natrargids (Rumbo series), Durixerolls (Bieber series), Haploxerolls (Mottsville series), Argixerolls (Trojan, Galeppi, and Drews series), and Haplaquolls (Ramelli and Deven series). Soils on upland plateaus and mountains are Argixerolls (McQuarrie series), Haplargids (Casuse and Saralegui series), Chromoxererts (Karcal series), and Durargids (Packwood series). Large areas of rock outcrop are on the plateaus and in the mountains. Potential natural vegetation: This area supports a cover of shrubs interspersed with annual and perennial grasses. Nevada bluegrass, Sandberg bluegrass, Idaho fescue, bluebunch wheatgrass, and cheatgrass are major species. Soils in basins and meadows have a cover of sedges, wiregrass, slender wheatgrass, creeping wildrye, and bluegrass. Sagebrush, rabbitbrush, bitterbrush, and mountainmahogany are the dominant shrubs. Western juniper is common, and scattered ponderosa pine grows in places where precipitation is less than 375 mm. In zones where precipitation is higher than 375 mm, there are forests of ponderosa pine, Douglas-fir, white fir, and California red fir, and bitterbrush and ceanothus are in the understory.
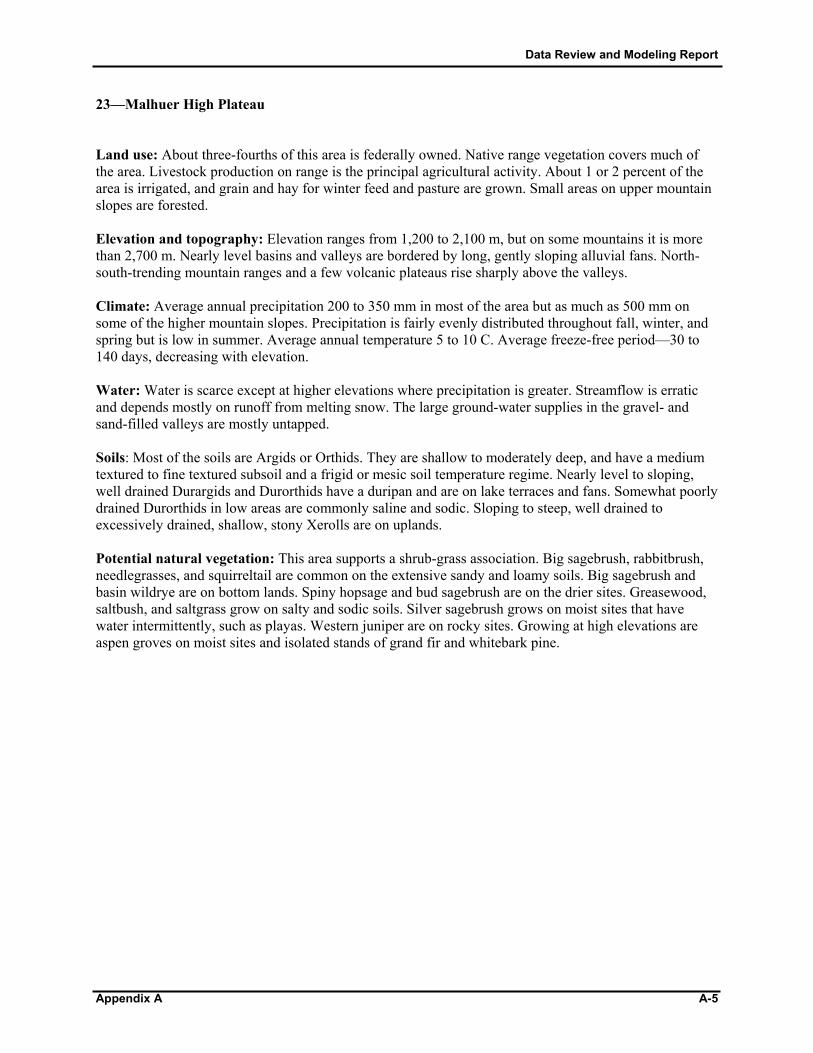
Data Review and Modeling Report
Appendix A A-5
23—Malhuer High Plateau Land use: About three-fourths of this area is federally owned. Native range vegetation covers much of the area. Livestock production on range is the principal agricultural activity. About 1 or 2 percent of the area is irrigated, and grain and hay for winter feed and pasture are grown. Small areas on upper mountain slopes are forested. Elevation and topography: Elevation ranges from 1,200 to 2,100 m, but on some mountains it is more than 2,700 m. Nearly level basins and valleys are bordered by long, gently sloping alluvial fans. North-south-trending mountain ranges and a few volcanic plateaus rise sharply above the valleys. Climate: Average annual precipitation 200 to 350 mm in most of the area but as much as 500 mm on some of the higher mountain slopes. Precipitation is fairly evenly distributed throughout fall, winter, and spring but is low in summer. Average annual temperature 5 to 10 C. Average freeze-free period—30 to 140 days, decreasing with elevation. Water: Water is scarce except at higher elevations where precipitation is greater. Streamflow is erratic and depends mostly on runoff from melting snow. The large ground-water supplies in the gravel- and sand-filled valleys are mostly untapped. Soils: Most of the soils are Argids or Orthids. They are shallow to moderately deep, and have a medium textured to fine textured subsoil and a frigid or mesic soil temperature regime. Nearly level to sloping, well drained Durargids and Durorthids have a duripan and are on lake terraces and fans. Somewhat poorly drained Durorthids in low areas are commonly saline and sodic. Sloping to steep, well drained to excessively drained, shallow, stony Xerolls are on uplands. Potential natural vegetation: This area supports a shrub-grass association. Big sagebrush, rabbitbrush, needlegrasses, and squirreltail are common on the extensive sandy and loamy soils. Big sagebrush and basin wildrye are on bottom lands. Spiny hopsage and bud sagebrush are on the drier sites. Greasewood, saltbush, and saltgrass grow on salty and sodic soils. Silver sagebrush grows on moist sites that have water intermittently, such as playas. Western juniper are on rocky sites. Growing at high elevations are aspen groves on moist sites and isolated stands of grand fir and whitebark pine.

Data Review and Modeling Report
A-6 Appendix A
17—Sacramento and San Joaquin Valleys Land use: More than 90 percent of this MLRA is in farms and ranches. Much of the remainder is federally owned. About 2 or 3 percent is urban, and the acreage used for this purpose is increasing rapidly. Slightly more than half the area is cropland, three-fourths or more of which is irrigated. The cropland in this MLRA represents 60 percent of the cropland in California, and the irrigated cropland is 80 percent of the irrigated land in the state. Cotton, fruits, nuts, grapes, hay, grain, pasture, rice, alfalfa, citrus, and tomatoes are among the principal crops grown on irrigated land. The more sloping, nonirrigated cropland is dry-farmed to grain. About a third of the area is in native grasses, brush, and open woodland and is used mostly for grazing. If the plant cover on sloping soils on terraces is removed, erosion is a hazard. The hazard of wind erosion is severe on the sandy, wind-modified soils in the San Joaquin Valley if a plant cover is not maintained. Elevation and topography: Elevation ranges from sea level to 200 m. This area includes the valley basins adjacent to the Sacramento and San Joaquin Rivers, fans and flood plains of tributary streams, and terraces around the edge of the valley. Climate: Average annual precipitation--l25 to 625 mm. Summers are long, hot, and dry, and winters are cool and rainy. Average annual temperature 16 to 19 C in most of the area but as low as 13 C in the north. Average freeze-free period--230 to 350 days, increasing from north to south. Water: Because of the low rainfall and relatively small streamflow, water is scarce in many parts of the area. Water for irrigated crops comes from stream diversions, wells, and canals of organized irrigation districts that obtain most of their water from state and federal water systems. Soils: The dominant soils are Xeralfs, Xerolls, Xererts, Aquents, Aquolls, Ochrepts, Orthents, Fluvents, Psamments, and Argids. They have a thermic temperature regime. Soils in basins are Xerofluvents (Columbia series), Pelloxererts (Willows and Clear Lake series), Chromoxererts (Capay series), Haploxerolls (Merced series), Natrixeralfs (Solano and Pescadero series), Haploxeralfs (Traver series), Haplaquents (Tulare series), and Haplaquolls (Sacramento series). Soils on fans and flood plains are Xerorthents (Yolo and Hanford series), Haploxerolls (Chino and Grangeville series), Torriorthents (Panoche series), Xerofluvents (San Emigdio series), Haploxerolls (Sorrento series), Natrargids (Lethent series), Haploxeralfs (Wyman and Zamora series), and Haplargids (Panhill series). Soils on low terraces are Durixeralfs (Fresno and Madera series) and Durochrepts (El Peco series). Soils on terraces are Durixeralfs (SanJoaquin, Exeter, and Redding series) and Palexeralfs (Red Bluff and Corning series). Sandy soils in the San Joaquin Valley are Xeropsamments (Delhi, Calhi, and Tujunga series). Potential natural vegetation: This area supports naturalized annuals and scattered trees. Wild barley, wild oats, soft chess, ripgut brome, red brome, foxtail fescue, burclover, and filaree are dominant species. Scattered oaks on terraces and oak, willow, and cottonwood grow along the rivers and streams and in the overflow areas. Saltgrass, along with such shrubs as iodinebush and Australian saltbush, grow on saline-sodic soils on terraces and in basins.
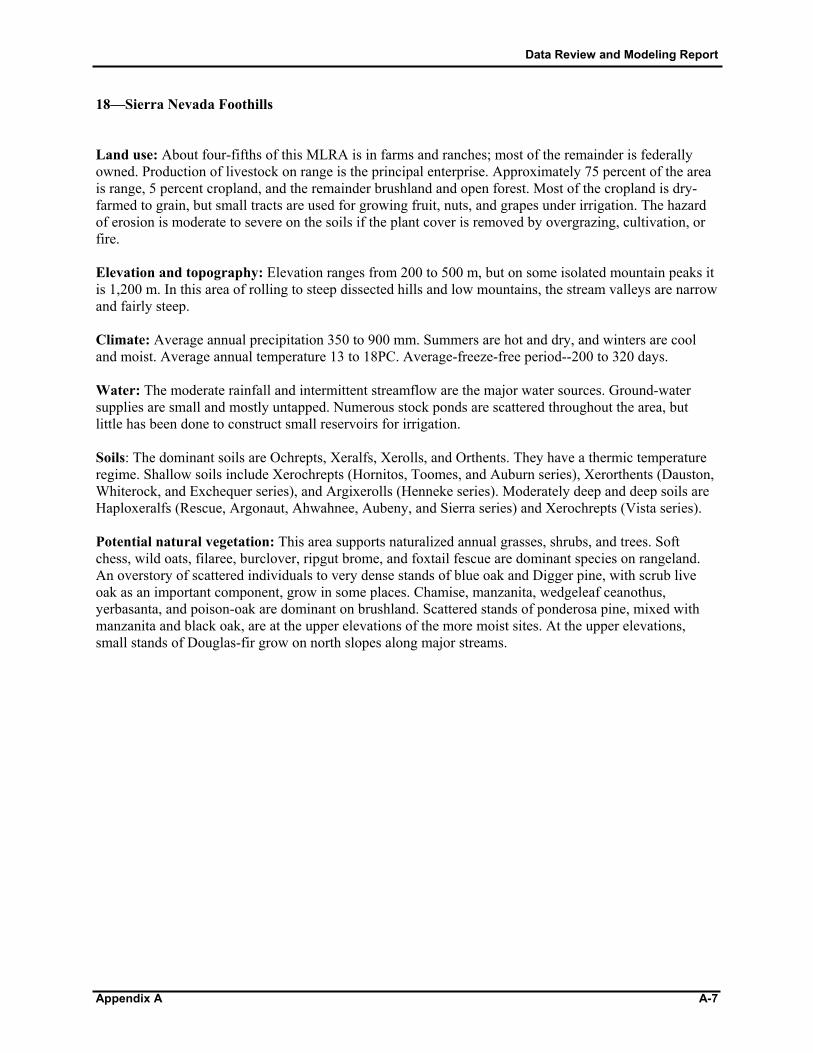
Data Review and Modeling Report
Appendix A A-7
18—Sierra Nevada Foothills Land use: About four-fifths of this MLRA is in farms and ranches; most of the remainder is federally owned. Production of livestock on range is the principal enterprise. Approximately 75 percent of the area is range, 5 percent cropland, and the remainder brushland and open forest. Most of the cropland is dry-farmed to grain, but small tracts are used for growing fruit, nuts, and grapes under irrigation. The hazard of erosion is moderate to severe on the soils if the plant cover is removed by overgrazing, cultivation, or fire. Elevation and topography: Elevation ranges from 200 to 500 m, but on some isolated mountain peaks it is 1,200 m. In this area of rolling to steep dissected hills and low mountains, the stream valleys are narrow and fairly steep. Climate: Average annual precipitation 350 to 900 mm. Summers are hot and dry, and winters are cool and moist. Average annual temperature 13 to 18PC. Average-freeze-free period--200 to 320 days. Water: The moderate rainfall and intermittent streamflow are the major water sources. Ground-water supplies are small and mostly untapped. Numerous stock ponds are scattered throughout the area, but little has been done to construct small reservoirs for irrigation. Soils: The dominant soils are Ochrepts, Xeralfs, Xerolls, and Orthents. They have a thermic temperature regime. Shallow soils include Xerochrepts (Hornitos, Toomes, and Auburn series), Xerorthents (Dauston, Whiterock, and Exchequer series), and Argixerolls (Henneke series). Moderately deep and deep soils are Haploxeralfs (Rescue, Argonaut, Ahwahnee, Aubeny, and Sierra series) and Xerochrepts (Vista series). Potential natural vegetation: This area supports naturalized annual grasses, shrubs, and trees. Soft chess, wild oats, filaree, burclover, ripgut brome, and foxtail fescue are dominant species on rangeland. An overstory of scattered individuals to very dense stands of blue oak and Digger pine, with scrub live oak as an important component, grow in some places. Chamise, manzanita, wedgeleaf ceanothus, yerbasanta, and poison-oak are dominant on brushland. Scattered stands of ponderosa pine, mixed with manzanita and black oak, are at the upper elevations of the more moist sites. At the upper elevations, small stands of Douglas-fir grow on north slopes along major streams.
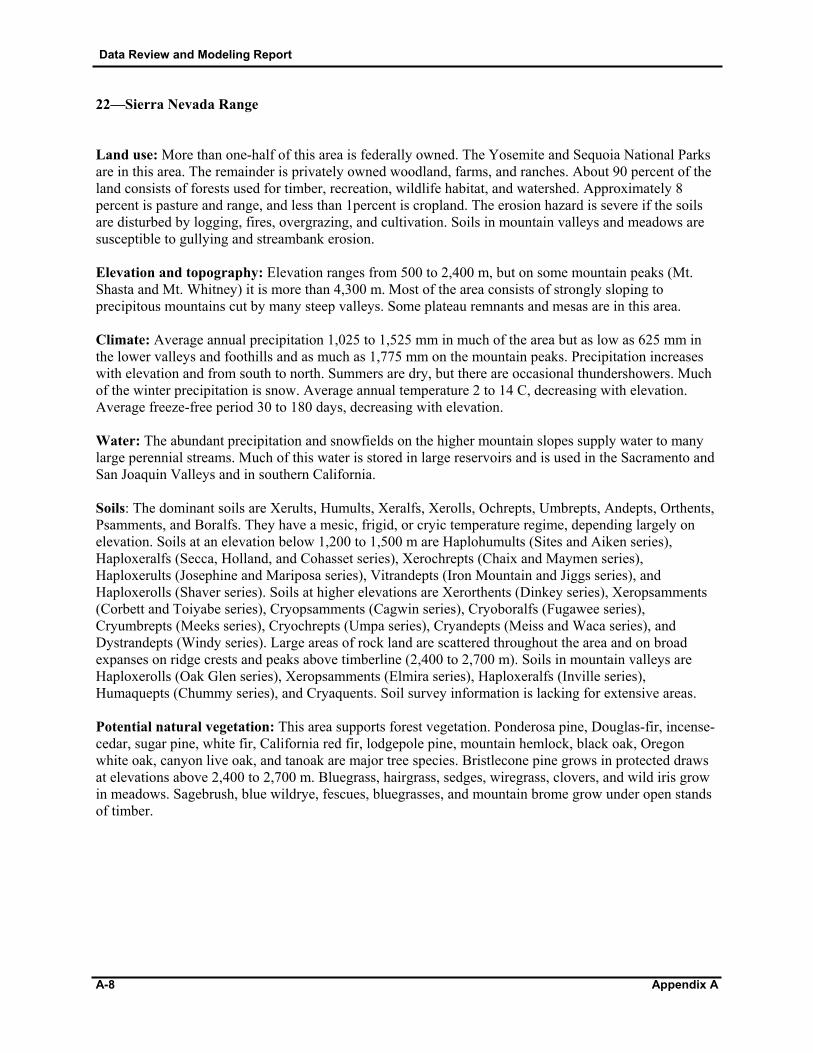
Data Review and Modeling Report
A-8 Appendix A
22—Sierra Nevada Range Land use: More than one-half of this area is federally owned. The Yosemite and Sequoia National Parks are in this area. The remainder is privately owned woodland, farms, and ranches. About 90 percent of the land consists of forests used for timber, recreation, wildlife habitat, and watershed. Approximately 8 percent is pasture and range, and less than 1percent is cropland. The erosion hazard is severe if the soils are disturbed by logging, fires, overgrazing, and cultivation. Soils in mountain valleys and meadows are susceptible to gullying and streambank erosion. Elevation and topography: Elevation ranges from 500 to 2,400 m, but on some mountain peaks (Mt. Shasta and Mt. Whitney) it is more than 4,300 m. Most of the area consists of strongly sloping to precipitous mountains cut by many steep valleys. Some plateau remnants and mesas are in this area. Climate: Average annual precipitation 1,025 to 1,525 mm in much of the area but as low as 625 mm in the lower valleys and foothills and as much as 1,775 mm on the mountain peaks. Precipitation increases with elevation and from south to north. Summers are dry, but there are occasional thundershowers. Much of the winter precipitation is snow. Average annual temperature 2 to 14 C, decreasing with elevation. Average freeze-free period 30 to 180 days, decreasing with elevation. Water: The abundant precipitation and snowfields on the higher mountain slopes supply water to many large perennial streams. Much of this water is stored in large reservoirs and is used in the Sacramento and San Joaquin Valleys and in southern California. Soils: The dominant soils are Xerults, Humults, Xeralfs, Xerolls, Ochrepts, Umbrepts, Andepts, Orthents, Psamments, and Boralfs. They have a mesic, frigid, or cryic temperature regime, depending largely on elevation. Soils at an elevation below 1,200 to 1,500 m are Haplohumults (Sites and Aiken series), Haploxeralfs (Secca, Holland, and Cohasset series), Xerochrepts (Chaix and Maymen series), Haploxerults (Josephine and Mariposa series), Vitrandepts (Iron Mountain and Jiggs series), and Haploxerolls (Shaver series). Soils at higher elevations are Xerorthents (Dinkey series), Xeropsamments (Corbett and Toiyabe series), Cryopsamments (Cagwin series), Cryoboralfs (Fugawee series), Cryumbrepts (Meeks series), Cryochrepts (Umpa series), Cryandepts (Meiss and Waca series), and Dystrandepts (Windy series). Large areas of rock land are scattered throughout the area and on broad expanses on ridge crests and peaks above timberline (2,400 to 2,700 m). Soils in mountain valleys are Haploxerolls (Oak Glen series), Xeropsamments (Elmira series), Haploxeralfs (Inville series), Humaquepts (Chummy series), and Cryaquents. Soil survey information is lacking for extensive areas. Potential natural vegetation: This area supports forest vegetation. Ponderosa pine, Douglas-fir, incense-cedar, sugar pine, white fir, California red fir, lodgepole pine, mountain hemlock, black oak, Oregon white oak, canyon live oak, and tanoak are major tree species. Bristlecone pine grows in protected draws at elevations above 2,400 to 2,700 m. Bluegrass, hairgrass, sedges, wiregrass, clovers, and wild iris grow in meadows. Sagebrush, blue wildrye, fescues, bluegrasses, and mountain brome grow under open stands of timber.

Data Review and Modeling Report
Appendix A A-9
5—Siskiyou and Trinity Area Land use: Nearly half of this area is federally owned. Most of the land is in conifer forests that are important for lumbering, wildlife habitat, and recreation. About 10 percent of the area is grazed, and a smaller acreage is cropped. Livestock is the principal farm enterprise. Truck crops are important in valleys where the water is adequate. On the more sloping parts of the valleys, small grains, hay, and pasture are grown as feed for dairy cattle and other livestock. The erosion hazard is high because of steep slopes, erodible soils, and high rainfall. The erosion hazard is severe if the plant cover is removed. Mass movement in the form of landslides is a serious problem and a major source of sediment in the rivers. Elevation and topography: Elevation ranges from 100 to 1,400 m, but on some mountain peaks it is 2,700 m. Rounded but steeply sloping mountains that are underlain mainly by sandstone and shale but in some places by granodiorite, gabbro, and other intrusive rocks are dominant. The narrow valleys have gently sloping flood plains and alluvial fans and are bordered by strongly sloping foothills. Climate: Average annual precipitation 450 mm in some valleys to 2,150 mm in the mountains. Precipitation is low in summer but is evenly distributed throughout the rest of the year. Average annual temperature 7 to 13 C. Average freeze-free period 60 to 250 days, decreasing with elevation. Water: The moderate to high precipitation provides enough water in the mountains and higher valleys and, through streamflow, supplies irrigation water in the drier valleys. Ground water is abundant in alluvial deposits in most valleys. Soils: The dominant soils are Ochrepts, Xerults, Orthents, Xeralfs, and Umbrepts. They have a mesic temperature regime and a xeric moisture regime. Principal soils of the mountains are Xerochrepts (Sheetiron and Hugo series), Haploxerults (Josephine series), shallow Xerorthents and Xerochrepts (Etsel and Maymen series), Haploxeralfs (Holland and Dubakella series), and Xerumbrepts (Masterson series). Xerothents and Xerofluvents are on flood plains and alluvial fans. Detailed soil survey information is lacking for much of the area. Potential natural vegetation: This area supports forest, open forest, and prairie vegetation. Douglas-fir, ponderosa pine, sugar pine, incense-cedar, white fir, red fir, tanoak, Oregon white oak, California black oak, canyon live oak, and madrone are the dominant tree species. Poison-oak, snowberry, ceanothus, manzanita, rose, and whipplea characterize the forest understory. Blue wildrye, fescues, bluegrass, mountain brome, and some browse species are in the understory in open stands of timber. Soft chess, wild oats, burclover, fescues, and bromes are major prairie species.

Data Review and Modeling Report
Appendix B B-1
APPENDIX B: MULTI-RESOLUTION LAND CHARACTERISTICS (MRLC) CONSORTIUM DATA DESCRIPTION

Data Review and Modeling Report
B-2 Appendix B
Land Cover Classes: Water 11 Open Water 12 Perennial Ice/Snow Developed 21 Low-Intensity Residential 22 High-Intensity Residential 23 Commercial/Industrial/Transportation Barren 31 Bare Rock/Sand/Clay 32 Quarries/Strip Mines/Gravel Pits 33 Transitional Vegetated Natural Forested Upland 41 Deciduous Forest 42 Evergreen Forest 43 Mixed Forest Shrubland 51 Shrubland Nonnatural Woody 61 Orchards/Vineyards/Other Herbaceous Upland 71 Grasslands/Herbaceous Herbaceous Planted/Cultivated 81 Pasture/Hay 82 Row Crops 83 Small Grains 84 Fallow 85 Urban/Recreational Grasses Wetlands 91 Woody Wetlands 92 Emergent Herbaceous Wetlands
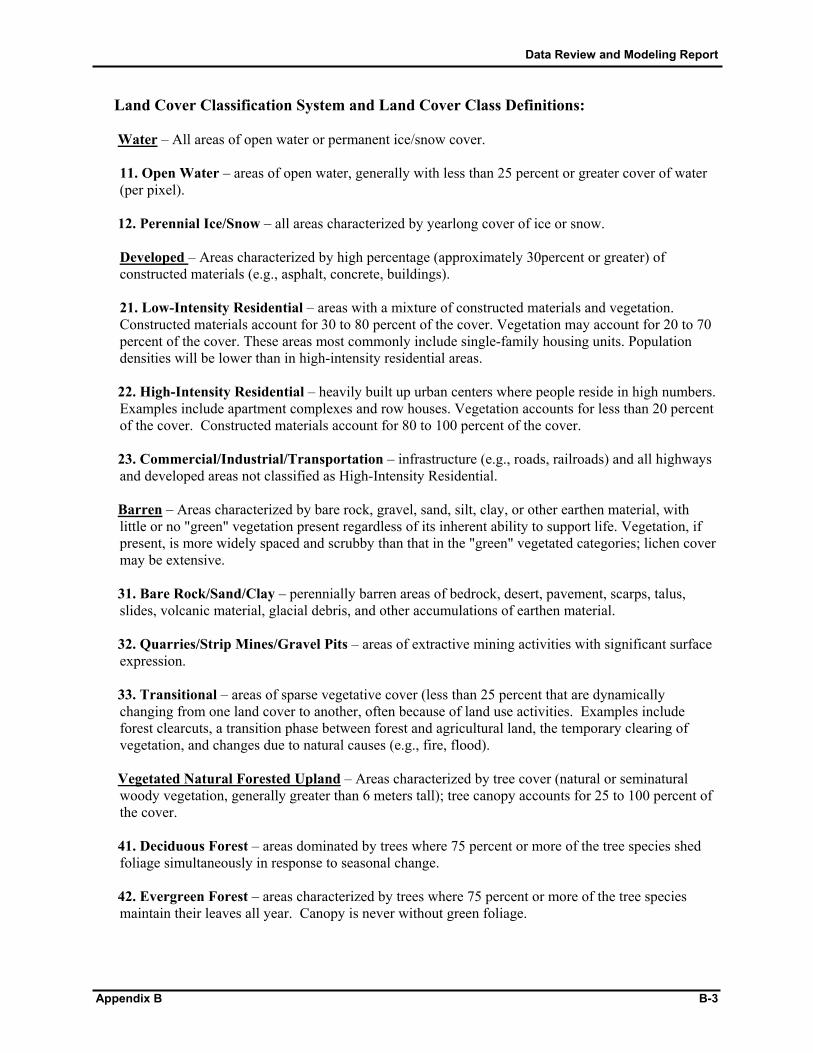
Data Review and Modeling Report
Appendix B B-3
Land Cover Classification System and Land Cover Class Definitions: Water – All areas of open water or permanent ice/snow cover.
11. Open Water – areas of open water, generally with less than 25 percent or greater cover of water (per pixel).
12. Perennial Ice/Snow – all areas characterized by yearlong cover of ice or snow.
Developed – Areas characterized by high percentage (approximately 30percent or greater) of constructed materials (e.g., asphalt, concrete, buildings).
21. Low-Intensity Residential – areas with a mixture of constructed materials and vegetation.
Constructed materials account for 30 to 80 percent of the cover. Vegetation may account for 20 to 70 percent of the cover. These areas most commonly include single-family housing units. Population densities will be lower than in high-intensity residential areas.
22. High-Intensity Residential – heavily built up urban centers where people reside in high numbers.
Examples include apartment complexes and row houses. Vegetation accounts for less than 20 percent of the cover. Constructed materials account for 80 to 100 percent of the cover.
23. Commercial/Industrial/Transportation – infrastructure (e.g., roads, railroads) and all highways
and developed areas not classified as High-Intensity Residential. Barren – Areas characterized by bare rock, gravel, sand, silt, clay, or other earthen material, with
little or no "green" vegetation present regardless of its inherent ability to support life. Vegetation, if present, is more widely spaced and scrubby than that in the "green" vegetated categories; lichen cover may be extensive.
31. Bare Rock/Sand/Clay – perennially barren areas of bedrock, desert, pavement, scarps, talus,
slides, volcanic material, glacial debris, and other accumulations of earthen material. 32. Quarries/Strip Mines/Gravel Pits – areas of extractive mining activities with significant surface
expression. 33. Transitional – areas of sparse vegetative cover (less than 25 percent that are dynamically
changing from one land cover to another, often because of land use activities. Examples include forest clearcuts, a transition phase between forest and agricultural land, the temporary clearing of vegetation, and changes due to natural causes (e.g., fire, flood).
Vegetated Natural Forested Upland – Areas characterized by tree cover (natural or seminatural
woody vegetation, generally greater than 6 meters tall); tree canopy accounts for 25 to 100 percent of the cover.
41. Deciduous Forest – areas dominated by trees where 75 percent or more of the tree species shed
foliage simultaneously in response to seasonal change. 42. Evergreen Forest – areas characterized by trees where 75 percent or more of the tree species
maintain their leaves all year. Canopy is never without green foliage.
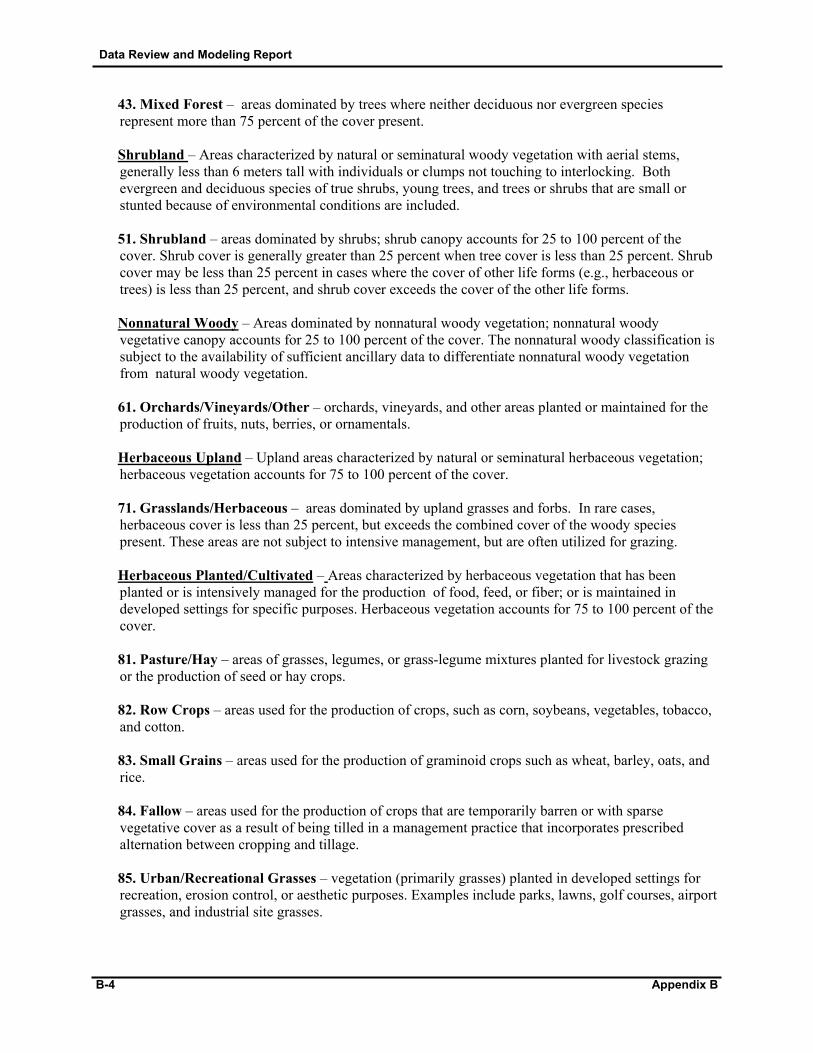
Data Review and Modeling Report
B-4 Appendix B
43. Mixed Forest – areas dominated by trees where neither deciduous nor evergreen species represent more than 75 percent of the cover present.
Shrubland – Areas characterized by natural or seminatural woody vegetation with aerial stems,
generally less than 6 meters tall with individuals or clumps not touching to interlocking. Both evergreen and deciduous species of true shrubs, young trees, and trees or shrubs that are small or stunted because of environmental conditions are included.
51. Shrubland – areas dominated by shrubs; shrub canopy accounts for 25 to 100 percent of the
cover. Shrub cover is generally greater than 25 percent when tree cover is less than 25 percent. Shrub cover may be less than 25 percent in cases where the cover of other life forms (e.g., herbaceous or trees) is less than 25 percent, and shrub cover exceeds the cover of the other life forms.
Nonnatural Woody – Areas dominated by nonnatural woody vegetation; nonnatural woody
vegetative canopy accounts for 25 to 100 percent of the cover. The nonnatural woody classification is subject to the availability of sufficient ancillary data to differentiate nonnatural woody vegetation from natural woody vegetation.
61. Orchards/Vineyards/Other – orchards, vineyards, and other areas planted or maintained for the
production of fruits, nuts, berries, or ornamentals. Herbaceous Upland – Upland areas characterized by natural or seminatural herbaceous vegetation;
herbaceous vegetation accounts for 75 to 100 percent of the cover. 71. Grasslands/Herbaceous – areas dominated by upland grasses and forbs. In rare cases,
herbaceous cover is less than 25 percent, but exceeds the combined cover of the woody species present. These areas are not subject to intensive management, but are often utilized for grazing.
Herbaceous Planted/Cultivated – Areas characterized by herbaceous vegetation that has been
planted or is intensively managed for the production of food, feed, or fiber; or is maintained in developed settings for specific purposes. Herbaceous vegetation accounts for 75 to 100 percent of the cover.
81. Pasture/Hay – areas of grasses, legumes, or grass-legume mixtures planted for livestock grazing
or the production of seed or hay crops. 82. Row Crops – areas used for the production of crops, such as corn, soybeans, vegetables, tobacco,
and cotton. 83. Small Grains – areas used for the production of graminoid crops such as wheat, barley, oats, and
rice. 84. Fallow – areas used for the production of crops that are temporarily barren or with sparse
vegetative cover as a result of being tilled in a management practice that incorporates prescribed alternation between cropping and tillage.
85. Urban/Recreational Grasses – vegetation (primarily grasses) planted in developed settings for
recreation, erosion control, or aesthetic purposes. Examples include parks, lawns, golf courses, airport grasses, and industrial site grasses.

Data Review and Modeling Report
Appendix B B-5
Wetlands – Areas where the soil or substrate is periodically saturated with or covered with water as defined by Cowardin et al.
91. Woody Wetlands - areas where forest or shrubland vegetation accounts for 25 to 100 percent of
the cover, and the soil or substrate is periodically saturated with or covered with water. 92. Emergent Herbaceous Wetlands – areas where perennial herbaceous vegetation accounts for 75
to 100 percent of the cover, and the soil or substrate is periodically saturated with or covered with water

Data Review and Modeling Report
Appendix C C-1
APPENDIX C: Data Summary for Stations Above Iron Gate Dam
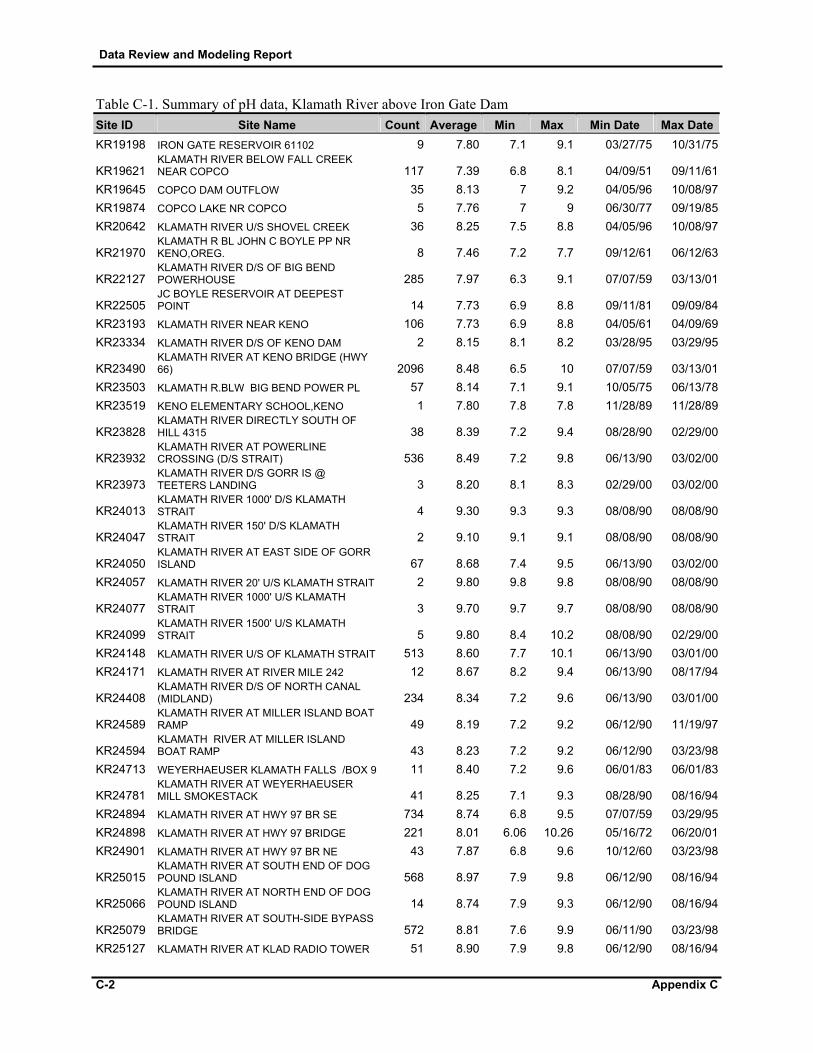
Data Review and Modeling Report
C-2 Appendix C
Table C-1. Summary of pH data, Klamath River above Iron Gate Dam Site ID Site Name Count Average Min Max Min Date Max DateKR19198 IRON GATE RESERVOIR 61102 9 7.80 7.1 9.1 03/27/75 10/31/75
KR19621 KLAMATH RIVER BELOW FALL CREEK NEAR COPCO 117 7.39 6.8 8.1 04/09/51 09/11/61
KR19645 COPCO DAM OUTFLOW 35 8.13 7 9.2 04/05/96 10/08/97KR19874 COPCO LAKE NR COPCO 5 7.76 7 9 06/30/77 09/19/85KR20642 KLAMATH RIVER U/S SHOVEL CREEK 36 8.25 7.5 8.8 04/05/96 10/08/97
KR21970 KLAMATH R BL JOHN C BOYLE PP NR KENO,OREG. 8 7.46 7.2 7.7 09/12/61 06/12/63
KR22127 KLAMATH RIVER D/S OF BIG BEND POWERHOUSE 285 7.97 6.3 9.1 07/07/59 03/13/01
KR22505 JC BOYLE RESERVOIR AT DEEPEST POINT 14 7.73 6.9 8.8 09/11/81 09/09/84
KR23193 KLAMATH RIVER NEAR KENO 106 7.73 6.9 8.8 04/05/61 04/09/69KR23334 KLAMATH RIVER D/S OF KENO DAM 2 8.15 8.1 8.2 03/28/95 03/29/95
KR23490 KLAMATH RIVER AT KENO BRIDGE (HWY 66) 2096 8.48 6.5 10 07/07/59 03/13/01
KR23503 KLAMATH R.BLW BIG BEND POWER PL 57 8.14 7.1 9.1 10/05/75 06/13/78KR23519 KENO ELEMENTARY SCHOOL,KENO 1 7.80 7.8 7.8 11/28/89 11/28/89
KR23828 KLAMATH RIVER DIRECTLY SOUTH OF HILL 4315 38 8.39 7.2 9.4 08/28/90 02/29/00
KR23932 KLAMATH RIVER AT POWERLINE CROSSING (D/S STRAIT) 536 8.49 7.2 9.8 06/13/90 03/02/00
KR23973 KLAMATH RIVER D/S GORR IS @ TEETERS LANDING 3 8.20 8.1 8.3 02/29/00 03/02/00
KR24013 KLAMATH RIVER 1000' D/S KLAMATH STRAIT 4 9.30 9.3 9.3 08/08/90 08/08/90
KR24047 KLAMATH RIVER 150' D/S KLAMATH STRAIT 2 9.10 9.1 9.1 08/08/90 08/08/90
KR24050 KLAMATH RIVER AT EAST SIDE OF GORR ISLAND 67 8.68 7.4 9.5 06/13/90 03/02/00
KR24057 KLAMATH RIVER 20' U/S KLAMATH STRAIT 2 9.80 9.8 9.8 08/08/90 08/08/90
KR24077 KLAMATH RIVER 1000' U/S KLAMATH STRAIT 3 9.70 9.7 9.7 08/08/90 08/08/90
KR24099 KLAMATH RIVER 1500' U/S KLAMATH STRAIT 5 9.80 8.4 10.2 08/08/90 02/29/00
KR24148 KLAMATH RIVER U/S OF KLAMATH STRAIT 513 8.60 7.7 10.1 06/13/90 03/01/00KR24171 KLAMATH RIVER AT RIVER MILE 242 12 8.67 8.2 9.4 06/13/90 08/17/94
KR24408 KLAMATH RIVER D/S OF NORTH CANAL (MIDLAND) 234 8.34 7.2 9.6 06/13/90 03/01/00
KR24589 KLAMATH RIVER AT MILLER ISLAND BOAT RAMP 49 8.19 7.2 9.2 06/12/90 11/19/97
KR24594 KLAMATH RIVER AT MILLER ISLAND BOAT RAMP 43 8.23 7.2 9.2 06/12/90 03/23/98
KR24713 WEYERHAEUSER KLAMATH FALLS /BOX 9 11 8.40 7.2 9.6 06/01/83 06/01/83
KR24781 KLAMATH RIVER AT WEYERHAEUSER MILL SMOKESTACK 41 8.25 7.1 9.3 08/28/90 08/16/94
KR24894 KLAMATH RIVER AT HWY 97 BR SE 734 8.74 6.8 9.5 07/07/59 03/29/95KR24898 KLAMATH RIVER AT HWY 97 BRIDGE 221 8.01 6.06 10.26 05/16/72 06/20/01KR24901 KLAMATH RIVER AT HWY 97 BR NE 43 7.87 6.8 9.6 10/12/60 03/23/98
KR25015 KLAMATH RIVER AT SOUTH END OF DOG POUND ISLAND 568 8.97 7.9 9.8 06/12/90 08/16/94
KR25066 KLAMATH RIVER AT NORTH END OF DOG POUND ISLAND 14 8.74 7.9 9.3 06/12/90 08/16/94
KR25079 KLAMATH RIVER AT SOUTH-SIDE BYPASS BRIDGE 572 8.81 7.6 9.9 06/11/90 03/23/98
KR25127 KLAMATH RIVER AT KLAD RADIO TOWER 51 8.90 7.9 9.8 06/12/90 08/16/94
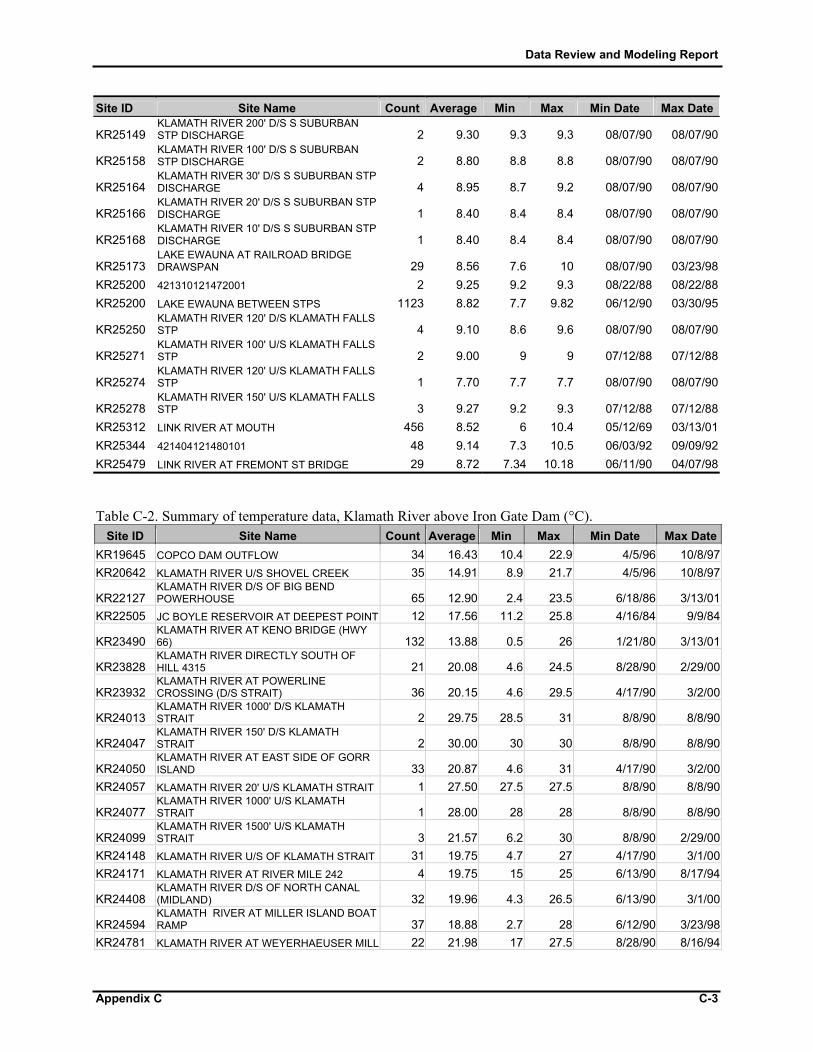
Data Review and Modeling Report
Appendix C C-3
Site ID Site Name Count Average Min Max Min Date Max Date
KR25149 KLAMATH RIVER 200' D/S S SUBURBAN STP DISCHARGE 2 9.30 9.3 9.3 08/07/90 08/07/90
KR25158 KLAMATH RIVER 100' D/S S SUBURBAN STP DISCHARGE 2 8.80 8.8 8.8 08/07/90 08/07/90
KR25164 KLAMATH RIVER 30' D/S S SUBURBAN STP DISCHARGE 4 8.95 8.7 9.2 08/07/90 08/07/90
KR25166 KLAMATH RIVER 20' D/S S SUBURBAN STP DISCHARGE 1 8.40 8.4 8.4 08/07/90 08/07/90
KR25168 KLAMATH RIVER 10' D/S S SUBURBAN STP DISCHARGE 1 8.40 8.4 8.4 08/07/90 08/07/90
KR25173 LAKE EWAUNA AT RAILROAD BRIDGE DRAWSPAN 29 8.56 7.6 10 08/07/90 03/23/98
KR25200 421310121472001 2 9.25 9.2 9.3 08/22/88 08/22/88KR25200 LAKE EWAUNA BETWEEN STPS 1123 8.82 7.7 9.82 06/12/90 03/30/95
KR25250 KLAMATH RIVER 120' D/S KLAMATH FALLS STP 4 9.10 8.6 9.6 08/07/90 08/07/90
KR25271 KLAMATH RIVER 100' U/S KLAMATH FALLS STP 2 9.00 9 9 07/12/88 07/12/88
KR25274 KLAMATH RIVER 120' U/S KLAMATH FALLS STP 1 7.70 7.7 7.7 08/07/90 08/07/90
KR25278 KLAMATH RIVER 150' U/S KLAMATH FALLS STP 3 9.27 9.2 9.3 07/12/88 07/12/88
KR25312 LINK RIVER AT MOUTH 456 8.52 6 10.4 05/12/69 03/13/01KR25344 421404121480101 48 9.14 7.3 10.5 06/03/92 09/09/92KR25479 LINK RIVER AT FREMONT ST BRIDGE 29 8.72 7.34 10.18 06/11/90 04/07/98 Table C-2. Summary of temperature data, Klamath River above Iron Gate Dam (°C).
Site ID Site Name Count Average Min Max Min Date Max DateKR19645 COPCO DAM OUTFLOW 34 16.43 10.4 22.9 4/5/96 10/8/97KR20642 KLAMATH RIVER U/S SHOVEL CREEK 35 14.91 8.9 21.7 4/5/96 10/8/97
KR22127 KLAMATH RIVER D/S OF BIG BEND POWERHOUSE 65 12.90 2.4 23.5 6/18/86 3/13/01
KR22505 JC BOYLE RESERVOIR AT DEEPEST POINT 12 17.56 11.2 25.8 4/16/84 9/9/84
KR23490 KLAMATH RIVER AT KENO BRIDGE (HWY 66) 132 13.88 0.5 26 1/21/80 3/13/01
KR23828 KLAMATH RIVER DIRECTLY SOUTH OF HILL 4315 21 20.08 4.6 24.5 8/28/90 2/29/00
KR23932 KLAMATH RIVER AT POWERLINE CROSSING (D/S STRAIT) 36 20.15 4.6 29.5 4/17/90 3/2/00
KR24013 KLAMATH RIVER 1000' D/S KLAMATH STRAIT 2 29.75 28.5 31 8/8/90 8/8/90
KR24047 KLAMATH RIVER 150' D/S KLAMATH STRAIT 2 30.00 30 30 8/8/90 8/8/90
KR24050 KLAMATH RIVER AT EAST SIDE OF GORR ISLAND 33 20.87 4.6 31 4/17/90 3/2/00
KR24057 KLAMATH RIVER 20' U/S KLAMATH STRAIT 1 27.50 27.5 27.5 8/8/90 8/8/90
KR24077 KLAMATH RIVER 1000' U/S KLAMATH STRAIT 1 28.00 28 28 8/8/90 8/8/90
KR24099 KLAMATH RIVER 1500' U/S KLAMATH STRAIT 3 21.57 6.2 30 8/8/90 2/29/00
KR24148 KLAMATH RIVER U/S OF KLAMATH STRAIT 31 19.75 4.7 27 4/17/90 3/1/00KR24171 KLAMATH RIVER AT RIVER MILE 242 4 19.75 15 25 6/13/90 8/17/94
KR24408 KLAMATH RIVER D/S OF NORTH CANAL (MIDLAND) 32 19.96 4.3 26.5 6/13/90 3/1/00
KR24594 KLAMATH RIVER AT MILLER ISLAND BOAT RAMP 37 18.88 2.7 28 6/12/90 3/23/98
KR24781 KLAMATH RIVER AT WEYERHAEUSER MILL 22 21.98 17 27.5 8/28/90 8/16/94

Data Review and Modeling Report
C-4 Appendix C
Site ID Site Name Count Average Min Max Min Date Max DateSMOKESTACK
KR24894 KLAMATH RIVER AT HWY 97 BR SE 23 20.63 17 26 4/17/90 8/16/94
KR24901 KLAMATH RIVER AT HWY 97 BR NE 12 15.13 2.7 26.5 4/17/90 3/23/98
KR25015 KLAMATH RIVER AT SOUTH END OF DOG POUND ISLAND 26 20.98 17 28 6/12/90 8/16/94
KR25066 KLAMATH RIVER AT NORTH END OF DOG POUND ISLAND 5 18.70 17 24.5 6/12/90 8/16/94
KR25079 KLAMATH RIVER AT SOUTH-SIDE BYPASS BRIDGE 25 18.86 2.7 28 6/13/90 3/23/98
KR25127 KLAMATH RIVER AT KLAD RADIO TOWER 27 20.11 16.5 26.5 4/17/90 8/16/94
KR25149 KLAMATH RIVER 200' D/S S SUBURBAN STP DISCHARGE 1 26.00 26 26 8/7/90 8/7/90
KR25158 KLAMATH RIVER 100' D/S S SUBURBAN STP DISCHARGE 1 25.00 25 25 8/7/90 8/7/90
KR25164 KLAMATH RIVER 30' D/S S SUBURBAN STP DISCHARGE 1 27.00 27 27 8/7/90 8/7/90
KR25166 KLAMATH RIVER 20' D/S S SUBURBAN STP DISCHARGE 1 28.00 28 28 8/7/90 8/7/90
KR25173 LAKE EWAUNA AT RAILROAD BRIDGE DRAWSPAN 12 15.45 2.8 25.5 8/7/90 3/23/98
KR25200 421310121472001 1 18.50 18.5 18.5 8/22/88 8/22/88KR25200 LAKE EWAUNA BETWEEN STPS 24 19.88 15 27.5 6/12/90 8/16/94
KR25250 KLAMATH RIVER 120' D/S KLAMATH FALLS STP 2 23.75 23.5 24 8/7/90 8/7/90
KR25271 KLAMATH RIVER 100' U/S KLAMATH FALLS STP 1 22.00 22 22 7/12/88 7/12/88
KR25278 KLAMATH RIVER 150' U/S KLAMATH FALLS STP 1 22.00 22 22 7/12/88 7/12/88
KR25312 LINK RIVER AT MOUTH 134 12.85 -2 25.4 1/21/80 3/13/01KR25344 421404121480101 46 19.95 14 28 6/3/92 9/9/92KR25479 LINK RIVER AT FREMONT ST BRIDGE 29 13.13 1.31 23.25 6/11/90 4/7/98 Table C-3. Summary of total ammonia nitrogen data, Klamath River above Iron Gate Dam (mg/L as N). Site ID Site Name Count Average Min Max Min Date Max DateKR19198 IRON GATE RESERVOIR 61102 12 0.15 0.03 0.22 3/27/75 10/31/75KR19645 COPCO DAM OUTFLOW 12 0.16 0.025 0.29 4/17/96 10/8/97KR19856 KLAMATH RIVER 0611A2 12 0.23 0.045 0.59 11/16/74 11/8/75KR19874 COPCO LAKE NR COPCO 5 0.19 0.03 0.69 9/22/77 5/11/78KR20642 KLAMATH RIVER U/S SHOVEL CREEK 12 0.17 0.025 0.42 4/17/96 10/8/97
KR22127 KLAMATH RIVER D/S OF BIG BEND POWERHOUSE 165 0.32 0.01 4.3 7/7/59 9/15/97
KR23334 KLAMATH RIVER D/S OF KENO DAM 2 0.05 0.05 0.05 3/28/95 3/29/95
KR23490 KLAMATH RIVER AT KENO BRIDGE (HWY 66) 299 0.57 0.01 3.75 7/7/59 9/15/97
KR23503 KLAMATH R.BLW BIG BEND POWER PL 13 0.36 0.04 1.14 10/5/75 1/16/78KR23519 KENO ELEMENTARY SCHOOL,KENO 1 0.02 0.02 0.02 11/28/89 11/28/89
KR23828 KLAMATH RIVER DIRECTLY SOUTH OF HILL 4315 17 0.59 0.04 1.03 8/28/90 8/17/94
KR23932 KLAMATH RIVER AT POWERLINE CROSSING (D/S STRAIT) 34 0.37 0.03 0.97 4/17/90 3/29/95
KR24013 KLAMATH RIVER 1000' D/S KLAMATH STRAIT 2 0.13 0.11 0.14 8/8/90 8/8/90
KR24047 KLAMATH RIVER 150' D/S KLAMATH STRAIT 2 0.22 0.21 0.23 8/8/90 8/8/90
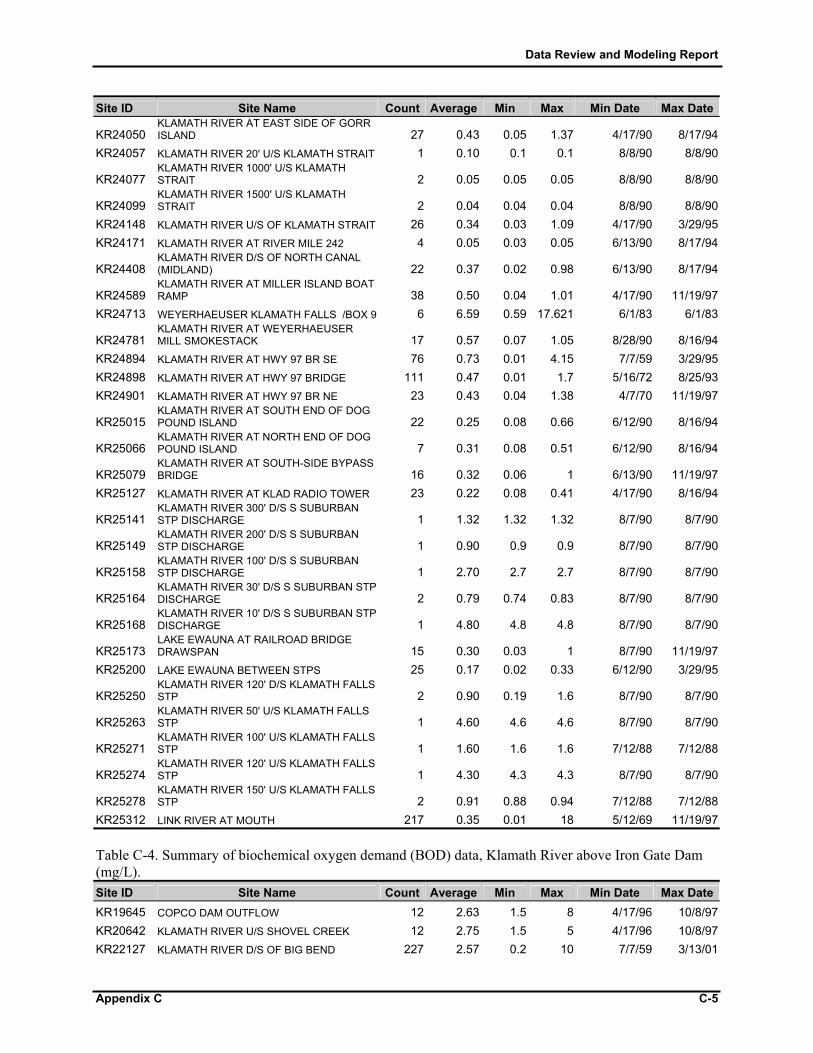
Data Review and Modeling Report
Appendix C C-5
Site ID Site Name Count Average Min Max Min Date Max Date
KR24050 KLAMATH RIVER AT EAST SIDE OF GORR ISLAND 27 0.43 0.05 1.37 4/17/90 8/17/94
KR24057 KLAMATH RIVER 20' U/S KLAMATH STRAIT 1 0.10 0.1 0.1 8/8/90 8/8/90
KR24077 KLAMATH RIVER 1000' U/S KLAMATH STRAIT 2 0.05 0.05 0.05 8/8/90 8/8/90
KR24099 KLAMATH RIVER 1500' U/S KLAMATH STRAIT 2 0.04 0.04 0.04 8/8/90 8/8/90
KR24148 KLAMATH RIVER U/S OF KLAMATH STRAIT 26 0.34 0.03 1.09 4/17/90 3/29/95KR24171 KLAMATH RIVER AT RIVER MILE 242 4 0.05 0.03 0.05 6/13/90 8/17/94
KR24408 KLAMATH RIVER D/S OF NORTH CANAL (MIDLAND) 22 0.37 0.02 0.98 6/13/90 8/17/94
KR24589 KLAMATH RIVER AT MILLER ISLAND BOAT RAMP 38 0.50 0.04 1.01 4/17/90 11/19/97
KR24713 WEYERHAEUSER KLAMATH FALLS /BOX 9 6 6.59 0.59 17.621 6/1/83 6/1/83
KR24781 KLAMATH RIVER AT WEYERHAEUSER MILL SMOKESTACK 17 0.57 0.07 1.05 8/28/90 8/16/94
KR24894 KLAMATH RIVER AT HWY 97 BR SE 76 0.73 0.01 4.15 7/7/59 3/29/95KR24898 KLAMATH RIVER AT HWY 97 BRIDGE 111 0.47 0.01 1.7 5/16/72 8/25/93KR24901 KLAMATH RIVER AT HWY 97 BR NE 23 0.43 0.04 1.38 4/7/70 11/19/97
KR25015 KLAMATH RIVER AT SOUTH END OF DOG POUND ISLAND 22 0.25 0.08 0.66 6/12/90 8/16/94
KR25066 KLAMATH RIVER AT NORTH END OF DOG POUND ISLAND 7 0.31 0.08 0.51 6/12/90 8/16/94
KR25079 KLAMATH RIVER AT SOUTH-SIDE BYPASS BRIDGE 16 0.32 0.06 1 6/13/90 11/19/97
KR25127 KLAMATH RIVER AT KLAD RADIO TOWER 23 0.22 0.08 0.41 4/17/90 8/16/94
KR25141 KLAMATH RIVER 300' D/S S SUBURBAN STP DISCHARGE 1 1.32 1.32 1.32 8/7/90 8/7/90
KR25149 KLAMATH RIVER 200' D/S S SUBURBAN STP DISCHARGE 1 0.90 0.9 0.9 8/7/90 8/7/90
KR25158 KLAMATH RIVER 100' D/S S SUBURBAN STP DISCHARGE 1 2.70 2.7 2.7 8/7/90 8/7/90
KR25164 KLAMATH RIVER 30' D/S S SUBURBAN STP DISCHARGE 2 0.79 0.74 0.83 8/7/90 8/7/90
KR25168 KLAMATH RIVER 10' D/S S SUBURBAN STP DISCHARGE 1 4.80 4.8 4.8 8/7/90 8/7/90
KR25173 LAKE EWAUNA AT RAILROAD BRIDGE DRAWSPAN 15 0.30 0.03 1 8/7/90 11/19/97
KR25200 LAKE EWAUNA BETWEEN STPS 25 0.17 0.02 0.33 6/12/90 3/29/95
KR25250 KLAMATH RIVER 120' D/S KLAMATH FALLS STP 2 0.90 0.19 1.6 8/7/90 8/7/90
KR25263 KLAMATH RIVER 50' U/S KLAMATH FALLS STP 1 4.60 4.6 4.6 8/7/90 8/7/90
KR25271 KLAMATH RIVER 100' U/S KLAMATH FALLS STP 1 1.60 1.6 1.6 7/12/88 7/12/88
KR25274 KLAMATH RIVER 120' U/S KLAMATH FALLS STP 1 4.30 4.3 4.3 8/7/90 8/7/90
KR25278 KLAMATH RIVER 150' U/S KLAMATH FALLS STP 2 0.91 0.88 0.94 7/12/88 7/12/88
KR25312 LINK RIVER AT MOUTH 217 0.35 0.01 18 5/12/69 11/19/97 Table C-4. Summary of biochemical oxygen demand (BOD) data, Klamath River above Iron Gate Dam (mg/L). Site ID Site Name Count Average Min Max Min Date Max DateKR19645 COPCO DAM OUTFLOW 12 2.63 1.5 8 4/17/96 10/8/97KR20642 KLAMATH RIVER U/S SHOVEL CREEK 12 2.75 1.5 5 4/17/96 10/8/97KR22127 KLAMATH RIVER D/S OF BIG BEND 227 2.57 0.2 10 7/7/59 3/13/01

Data Review and Modeling Report
C-6 Appendix C
Site ID Site Name Count Average Min Max Min Date Max DatePOWERHOUSE
KR23193 KLAMATH RIVER NEAR KENO 83 4.13 1.1 8.6 4/5/61 4/9/69KR23334 KLAMATH RIVER D/S OF KENO DAM 2 4.60 3.7 5.5 3/28/95 3/29/95
KR23490 KLAMATH RIVER AT KENO BRIDGE (HWY 66) 334 3.74 0.3 20 7/7/59 3/13/01
KR23503 KLAMATH R.BLW BIG BEND POWER PL 1 0.70 0.7 0.7 7/10/77 7/10/77
KR23828 KLAMATH RIVER DIRECTLY SOUTH OF HILL 4315 21 3.45 1.6 10 9/25/90 2/29/00
KR23932 KLAMATH RIVER AT POWERLINE CROSSING (D/S STRAIT) 28 4.73 1.8 12 4/17/90 3/2/00
KR23973 KLAMATH RIVER D/S GORR IS @ TEETERS LANDING 3 3.47 2.3 5.7 2/29/00 3/2/00
KR24050 KLAMATH RIVER AT EAST SIDE OF GORR ISLAND 25 4.67 0.1 11.7 4/17/90 3/2/00
KR24099 KLAMATH RIVER 1500' U/S KLAMATH STRAIT 1 4.30 4.3 4.3 2/29/00 2/29/00
KR24148 KLAMATH RIVER U/S OF KLAMATH STRAIT 22 5.10 1.6 11.7 4/17/90 3/1/00KR24171 KLAMATH RIVER AT RIVER MILE 242 2 6.40 6.4 6.4 8/17/94 8/17/94
KR24408 KLAMATH RIVER D/S OF NORTH CANAL (MIDLAND) 13 5.43 2.1 15 9/26/90 3/1/00
KR24589 KLAMATH RIVER AT MILLER ISLAND BOAT RAMP 13 5.47 1.4 17 4/17/90 8/17/94
KR24594 KLAMATH RIVER AT MILLER ISLAND BOAT RAMP 13 5.50 1.4 17 4/17/90 8/17/94
KR24713 WEYERHAEUSER KLAMATH FALLS /BOX 9 14 43.82 5 156.4 6/1/83 6/1/83
KR24781 KLAMATH RIVER AT WEYERHAEUSER MILL SMOKESTACK 18 9.58 1.2 40 9/26/90 8/16/94
KR24894 KLAMATH RIVER AT HWY 97 BR SE 78 4.93 1.4 15 7/7/59 3/29/95KR24901 KLAMATH RIVER AT HWY 97 BR NE 17 2.90 0.5 7.2 4/7/70 3/28/95
KR25015 KLAMATH RIVER AT SOUTH END OF DOG POUND ISLAND 14 8.03 2.7 19 9/26/90 8/16/94
KR25066 KLAMATH RIVER AT NORTH END OF DOG POUND ISLAND 9 7.78 2 17 9/26/90 8/16/94
KR25079 KLAMATH RIVER AT SOUTH-SIDE BYPASS BRIDGE 6 3.27 2.9 3.9 8/16/94 8/16/94
KR25127 KLAMATH RIVER AT KLAD RADIO TOWER 22 13.35 1.4 46 4/17/90 8/16/94
KR25173 LAKE EWAUNA AT RAILROAD BRIDGE DRAWSPAN 4 3.90 3.5 4.3 8/16/94 8/16/94
KR25200 LAKE EWAUNA BETWEEN STPS 13 9.54 3.6 26 9/26/90 3/29/95KR25312 LINK RIVER AT MOUTH 287 5.36 0.7 20 5/12/69 3/13/01 Table C-5. Summary of total Kjeldahl nitrogen (TKN) data, Klamath River above Iron Gate Dam (mg/L as N). Site ID Site Name Count Average Min Max Min Date Max DateKR19198 IRON GATE RESERVOIR 61102 13 0.98 0.4 1.5 3/27/75 10/31/75KR19645 COPCO DAM OUTFLOW 12 1.00 0.65 1.35 4/17/96 10/8/97KR19856 KLAMATH RIVER 0611A2 12 1.37 0.8 2 11/16/74 11/8/75KR19874 COPCO LAKE NR COPCO 9 1.09 0.8 1.8 6/30/77 9/19/85KR20642 KLAMATH RIVER U/S SHOVEL CREEK 12 1.10 0.46 2 4/17/96 10/8/97
KR22127 KLAMATH RIVER D/S OF BIG BEND POWERHOUSE 165 1.08 0.3 3.4 1/16/77 3/13/01
KR23193 KLAMATH RIVER NEAR KENO 39 1.57 0.1 7.7 12/6/64 9/29/68KR23334 KLAMATH RIVER D/S OF KENO DAM 2 1.70 1.5 1.9 3/28/95 3/29/95KR23490 KLAMATH RIVER AT KENO BRIDGE (HWY 326 2.10 0.05 17 2/6/73 3/13/01

Data Review and Modeling Report
Appendix C C-7
Site ID Site Name Count Average Min Max Min Date Max Date66)
KR23503 KLAMATH R.BLW BIG BEND POWER PL 2 1.23 0.75 1.7 8/1/76 1/16/78KR23519 KENO ELEMENTARY SCHOOL,KENO 1 0.20 0.2 0.2 11/28/89 11/28/89
KR23828 KLAMATH RIVER DIRECTLY SOUTH OF HILL 4315 33 2.51 1 3.9 8/28/90 2/29/00
KR23932 KLAMATH RIVER AT POWERLINE CROSSING (D/S STRAIT) 66 2.37 0.9 4.2 4/17/90 3/2/00
KR23973 KLAMATH RIVER D/S GORR IS @ TEETERS LANDING 3 0.87 0.8 1 2/29/00 3/2/00
KR24013 KLAMATH RIVER 1000' D/S KLAMATH STRAIT 4 1.30 1 1.6 8/8/90 8/8/90
KR24047 KLAMATH RIVER 150' D/S KLAMATH STRAIT 4 1.80 1.4 2.2 8/8/90 8/8/90
KR24050 KLAMATH RIVER AT EAST SIDE OF GORR ISLAND 54 2.42 0.8 3.2 4/17/90 3/2/00
KR24057 KLAMATH RIVER 20' U/S KLAMATH STRAIT 2 2.90 2.9 2.9 8/8/90 8/8/90
KR24077 KLAMATH RIVER 1000' U/S KLAMATH STRAIT 3 1.63 1.5 1.7 8/8/90 8/8/90
KR24099 KLAMATH RIVER 1500' U/S KLAMATH STRAIT 5 2.12 0.9 3.9 8/8/90 2/29/00
KR24148 KLAMATH RIVER U/S OF KLAMATH STRAIT 50 2.28 0.7 5.1 4/17/90 3/1/00KR24171 KLAMATH RIVER AT RIVER MILE 242 8 1.43 0.9 2 6/13/90 8/17/94
KR24408 KLAMATH RIVER D/S OF NORTH CANAL (MIDLAND) 44 2.12 0.8 3.6 6/13/90 3/1/00
KR24589 KLAMATH RIVER AT MILLER ISLAND BOAT RAMP 37 2.26 0.8 5.1 4/17/90 11/19/97
KR24594 KLAMATH RIVER AT MILLER ISLAND BOAT RAMP 34 2.26 0.8 5.1 4/17/90 3/23/98
KR24781 KLAMATH RIVER AT WEYERHAEUSER MILL SMOKESTACK 32 2.75 1.9 5.9 8/28/90 8/16/94
KR24894 KLAMATH RIVER AT HWY 97 BR SE 44 2.24 0.8 4 4/17/90 3/29/95KR24898 KLAMATH RIVER AT HWY 97 BRIDGE 70 2.41 0.05 28.7 4/17/73 6/20/01KR24901 KLAMATH RIVER AT HWY 97 BR NE 23 1.91 0.7 3 4/17/90 3/23/98
KR25015 KLAMATH RIVER AT SOUTH END OF DOG POUND ISLAND 41 2.13 0.7 4.3 6/12/90 8/16/94
KR25066 KLAMATH RIVER AT NORTH END OF DOG POUND ISLAND 13 2.40 1.1 3.8 6/12/90 8/16/94
KR25079 KLAMATH RIVER AT SOUTH-SIDE BYPASS BRIDGE 31 2.21 0.7 3.4 6/13/90 3/23/98
KR25127 KLAMATH RIVER AT KLAD RADIO TOWER 46 2.50 0.7 7.7 4/17/90 8/16/94
KR25149 KLAMATH RIVER 200' D/S S SUBURBAN STP DISCHARGE 2 3.20 3.2 3.2 8/7/90 8/7/90
KR25158 KLAMATH RIVER 100' D/S S SUBURBAN STP DISCHARGE 2 5.80 5.8 5.8 8/7/90 8/7/90
KR25164 KLAMATH RIVER 30' D/S S SUBURBAN STP DISCHARGE 4 2.40 1.6 3.2 8/7/90 8/7/90
KR25166 KLAMATH RIVER 20' D/S S SUBURBAN STP DISCHARGE 1 9.40 9.4 9.4 8/7/90 8/7/90
KR25168 KLAMATH RIVER 10' D/S S SUBURBAN STP DISCHARGE 1 9.40 9.4 9.4 8/7/90 8/7/90
KR25173 LAKE EWAUNA AT RAILROAD BRIDGE DRAWSPAN 28 2.23 0.7 4.1 8/7/90 3/23/98
KR25200 LAKE EWAUNA BETWEEN STPS 43 2.00 0.6 4.7 6/12/90 3/29/95
KR25250 KLAMATH RIVER 120' D/S KLAMATH FALLS STP 4 2.80 2.5 3.1 8/7/90 8/7/90
KR25271 KLAMATH RIVER 100' U/S KLAMATH FALLS STP 2 4.00 4 4 7/12/88 7/12/88
KR25274 KLAMATH RIVER 120' U/S KLAMATH FALLS STP 1 6.00 6 6 8/7/90 8/7/90

Data Review and Modeling Report
C-8 Appendix C
Site ID Site Name Count Average Min Max Min Date Max Date
KR25278 KLAMATH RIVER 150' U/S KLAMATH FALLS STP 3 2.97 2.9 3 7/12/88 7/12/88
KR25312 LINK RIVER AT MOUTH 306 2.16 0.05 5.6 2/6/73 3/13/01KR25479 LINK RIVER AT FREMONT ST BRIDGE 4 1.08 0.9 1.3 6/11/90 6/11/90 Table C-6. Summary of total phosphorous (TP) data, Klamath River above Iron Gate Dam (mg/L). Site ID Site Name Count Average Min Max Min Date Max DateKR19198 IRON GATE RESERVOIR 61102 16 0.186 0.096 0.298 3/27/75 10/31/75
KR19621 KLAMATH RIVER BELOW FALL CREEK NEAR COPCO 2 0.115 0.03 0.2 9/3/54 5/12/55
KR19645 COPCO DAM OUTFLOW 12 0.324 0.0735 0.71 4/17/96 10/8/97KR19856 KLAMATH RIVER 0611A2 12 0.163 0.09 0.23 11/16/74 11/8/75KR19874 COPCO LAKE NR COPCO 9 0.246 0.1 0.47 6/30/77 9/19/85KR20642 KLAMATH RIVER U/S SHOVEL CREEK 12 0.342 0.025 1.16 4/17/96 10/8/97
KR22127 KLAMATH RIVER D/S OF BIG BEND POWERHOUSE 165 0.194 0.08 0.5 1/16/77 3/13/01
KR22505 JC BOYLE RESERVOIR AT DEEPEST POINT 8 1.665 0.258 3.3 9/11/81 9/9/84
KR23193 KLAMATH RIVER NEAR KENO 40 0.165 0.04 0.33 12/6/64 9/29/68KR23334 KLAMATH RIVER D/S OF KENO DAM 2 0.215 0.19 0.24 3/28/95 3/29/95
KR23490 KLAMATH RIVER AT KENO BRIDGE (HWY 66) 367 0.248 0.09 0.724 2/26/73 3/13/01
KR23503 KLAMATH R.BLW BIG BEND POWER PL 3 0.173 0.141 0.2 6/6/76 1/16/78KR23519 KENO ELEMENTARY SCHOOL,KENO 1 0.040 0.04 0.04 11/28/89 11/28/89
KR23828 KLAMATH RIVER DIRECTLY SOUTH OF HILL 4315 33 0.244 0.13 0.3 8/28/90 2/29/00
KR23932 KLAMATH RIVER AT POWERLINE CROSSING (D/S STRAIT) 66 0.294 0.11 0.56 4/17/90 3/2/00
KR23973 KLAMATH RIVER D/S GORR IS @ TEETERS LANDING 3 0.120 0.11 0.13 2/29/00 3/2/00
KR24013 KLAMATH RIVER 1000' D/S KLAMATH STRAIT 4 0.130 0.1 0.16 8/8/90 8/8/90
KR24047 KLAMATH RIVER 150' D/S KLAMATH STRAIT 4 0.225 0.16 0.29 8/8/90 8/8/90
KR24050 KLAMATH RIVER AT EAST SIDE OF GORR ISLAND 54 0.289 0.1 1 4/17/90 3/2/00
KR24057 KLAMATH RIVER 20' U/S KLAMATH STRAIT 2 0.260 0.26 0.26 8/8/90 8/8/90
KR24077 KLAMATH RIVER 1000' U/S KLAMATH STRAIT 3 0.130 0.13 0.13 8/8/90 8/8/90
KR24099 KLAMATH RIVER 1500' U/S KLAMATH STRAIT 5 0.174 0.08 0.28 8/8/90 2/29/00
KR24148 KLAMATH RIVER U/S OF KLAMATH STRAIT 50 0.230 0.1 0.49 4/17/90 3/1/00KR24171 KLAMATH RIVER AT RIVER MILE 242 8 0.168 0.16 0.18 6/13/90 8/17/94
KR24408 KLAMATH RIVER D/S OF NORTH CANAL (MIDLAND) 44 0.203 0.1 0.34 6/13/90 3/1/00
KR24589 KLAMATH RIVER AT MILLER ISLAND BOAT RAMP 37 0.226 0.12 0.42 4/17/90 11/19/97
KR24594 KLAMATH RIVER AT MILLER ISLAND BOAT RAMP 34 0.226 0.1 0.42 4/17/90 3/23/98
KR24713 WEYERHAEUSER KLAMATH FALLS /BOX 9 4 1.405 0.3 4.405 6/1/83 6/1/83
KR24781 KLAMATH RIVER AT WEYERHAEUSER MILL SMOKESTACK 31 0.254 0.2 0.42 8/28/90 8/16/94
KR24894 KLAMATH RIVER AT HWY 97 BR SE 44 0.320 0.12 1.93 4/17/90 3/29/95
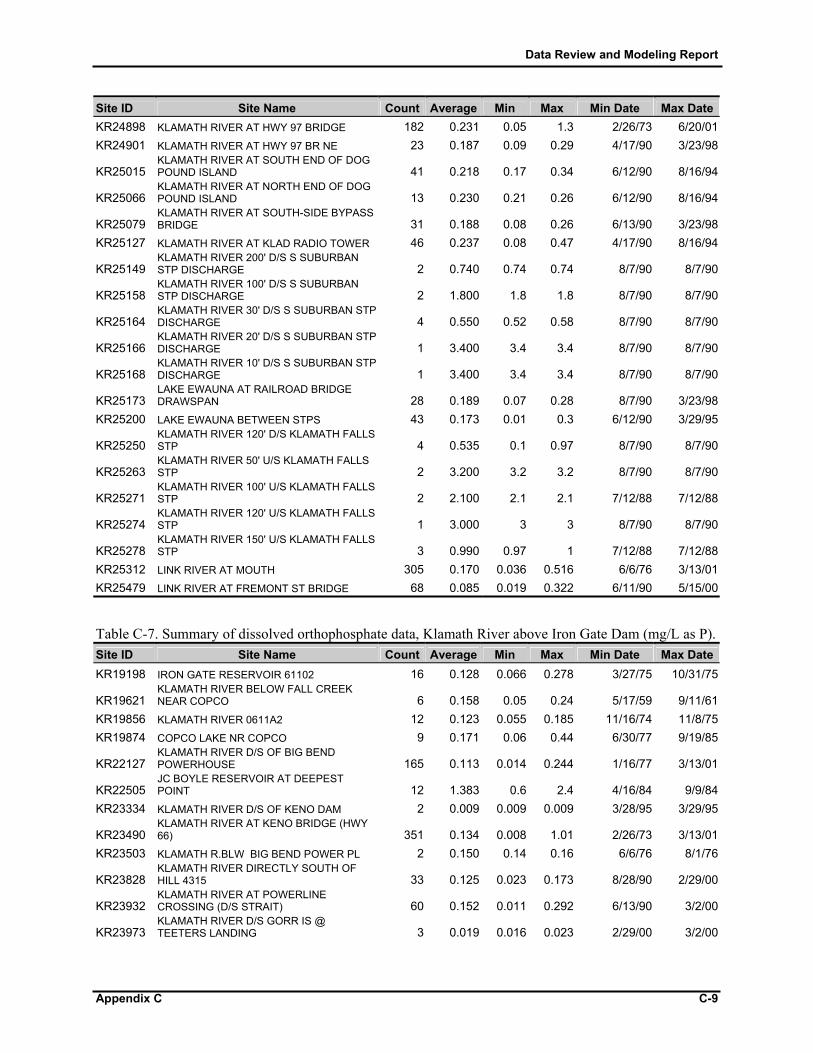
Data Review and Modeling Report
Appendix C C-9
Site ID Site Name Count Average Min Max Min Date Max DateKR24898 KLAMATH RIVER AT HWY 97 BRIDGE 182 0.231 0.05 1.3 2/26/73 6/20/01KR24901 KLAMATH RIVER AT HWY 97 BR NE 23 0.187 0.09 0.29 4/17/90 3/23/98
KR25015 KLAMATH RIVER AT SOUTH END OF DOG POUND ISLAND 41 0.218 0.17 0.34 6/12/90 8/16/94
KR25066 KLAMATH RIVER AT NORTH END OF DOG POUND ISLAND 13 0.230 0.21 0.26 6/12/90 8/16/94
KR25079 KLAMATH RIVER AT SOUTH-SIDE BYPASS BRIDGE 31 0.188 0.08 0.26 6/13/90 3/23/98
KR25127 KLAMATH RIVER AT KLAD RADIO TOWER 46 0.237 0.08 0.47 4/17/90 8/16/94
KR25149 KLAMATH RIVER 200' D/S S SUBURBAN STP DISCHARGE 2 0.740 0.74 0.74 8/7/90 8/7/90
KR25158 KLAMATH RIVER 100' D/S S SUBURBAN STP DISCHARGE 2 1.800 1.8 1.8 8/7/90 8/7/90
KR25164 KLAMATH RIVER 30' D/S S SUBURBAN STP DISCHARGE 4 0.550 0.52 0.58 8/7/90 8/7/90
KR25166 KLAMATH RIVER 20' D/S S SUBURBAN STP DISCHARGE 1 3.400 3.4 3.4 8/7/90 8/7/90
KR25168 KLAMATH RIVER 10' D/S S SUBURBAN STP DISCHARGE 1 3.400 3.4 3.4 8/7/90 8/7/90
KR25173 LAKE EWAUNA AT RAILROAD BRIDGE DRAWSPAN 28 0.189 0.07 0.28 8/7/90 3/23/98
KR25200 LAKE EWAUNA BETWEEN STPS 43 0.173 0.01 0.3 6/12/90 3/29/95
KR25250 KLAMATH RIVER 120' D/S KLAMATH FALLS STP 4 0.535 0.1 0.97 8/7/90 8/7/90
KR25263 KLAMATH RIVER 50' U/S KLAMATH FALLS STP 2 3.200 3.2 3.2 8/7/90 8/7/90
KR25271 KLAMATH RIVER 100' U/S KLAMATH FALLS STP 2 2.100 2.1 2.1 7/12/88 7/12/88
KR25274 KLAMATH RIVER 120' U/S KLAMATH FALLS STP 1 3.000 3 3 8/7/90 8/7/90
KR25278 KLAMATH RIVER 150' U/S KLAMATH FALLS STP 3 0.990 0.97 1 7/12/88 7/12/88
KR25312 LINK RIVER AT MOUTH 305 0.170 0.036 0.516 6/6/76 3/13/01KR25479 LINK RIVER AT FREMONT ST BRIDGE 68 0.085 0.019 0.322 6/11/90 5/15/00 Table C-7. Summary of dissolved orthophosphate data, Klamath River above Iron Gate Dam (mg/L as P). Site ID Site Name Count Average Min Max Min Date Max DateKR19198 IRON GATE RESERVOIR 61102 16 0.128 0.066 0.278 3/27/75 10/31/75
KR19621 KLAMATH RIVER BELOW FALL CREEK NEAR COPCO 6 0.158 0.05 0.24 5/17/59 9/11/61
KR19856 KLAMATH RIVER 0611A2 12 0.123 0.055 0.185 11/16/74 11/8/75KR19874 COPCO LAKE NR COPCO 9 0.171 0.06 0.44 6/30/77 9/19/85
KR22127 KLAMATH RIVER D/S OF BIG BEND POWERHOUSE 165 0.113 0.014 0.244 1/16/77 3/13/01
KR22505 JC BOYLE RESERVOIR AT DEEPEST POINT 12 1.383 0.6 2.4 4/16/84 9/9/84
KR23334 KLAMATH RIVER D/S OF KENO DAM 2 0.009 0.009 0.009 3/28/95 3/29/95
KR23490 KLAMATH RIVER AT KENO BRIDGE (HWY 66) 351 0.134 0.008 1.01 2/26/73 3/13/01
KR23503 KLAMATH R.BLW BIG BEND POWER PL 2 0.150 0.14 0.16 6/6/76 8/1/76
KR23828 KLAMATH RIVER DIRECTLY SOUTH OF HILL 4315 33 0.125 0.023 0.173 8/28/90 2/29/00
KR23932 KLAMATH RIVER AT POWERLINE CROSSING (D/S STRAIT) 60 0.152 0.011 0.292 6/13/90 3/2/00
KR23973 KLAMATH RIVER D/S GORR IS @ TEETERS LANDING 3 0.019 0.016 0.023 2/29/00 3/2/00
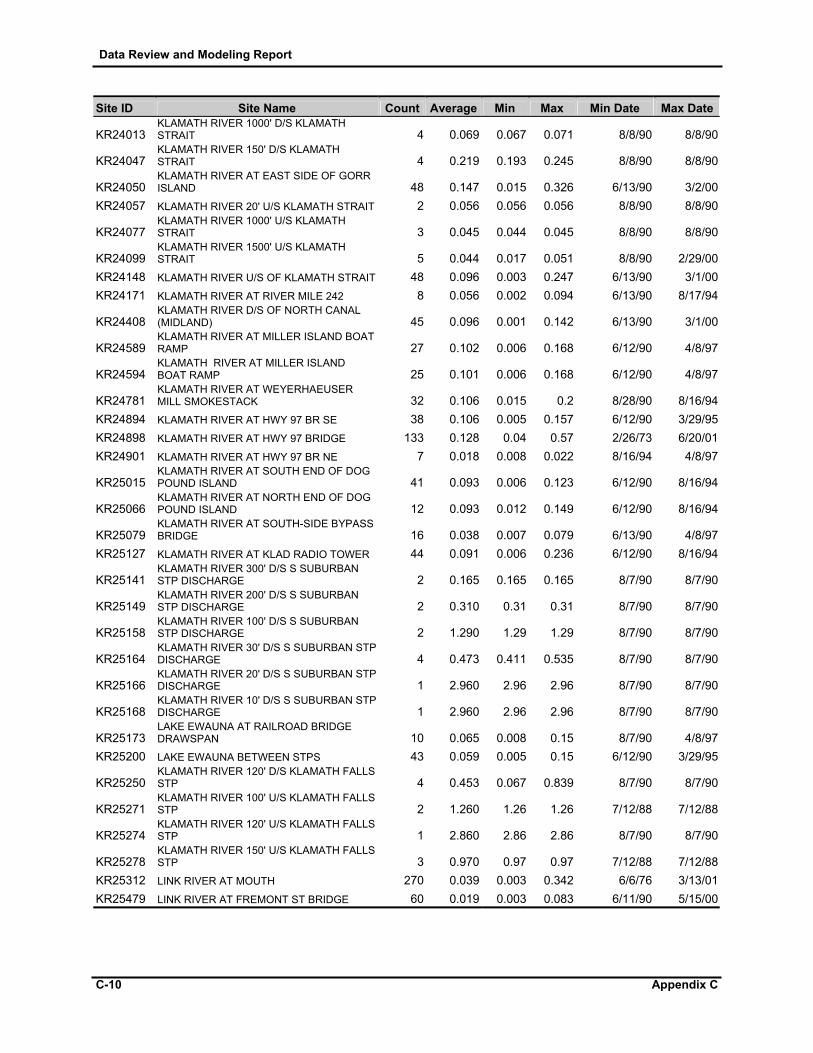
Data Review and Modeling Report
C-10 Appendix C
Site ID Site Name Count Average Min Max Min Date Max Date
KR24013 KLAMATH RIVER 1000' D/S KLAMATH STRAIT 4 0.069 0.067 0.071 8/8/90 8/8/90
KR24047 KLAMATH RIVER 150' D/S KLAMATH STRAIT 4 0.219 0.193 0.245 8/8/90 8/8/90
KR24050 KLAMATH RIVER AT EAST SIDE OF GORR ISLAND 48 0.147 0.015 0.326 6/13/90 3/2/00
KR24057 KLAMATH RIVER 20' U/S KLAMATH STRAIT 2 0.056 0.056 0.056 8/8/90 8/8/90
KR24077 KLAMATH RIVER 1000' U/S KLAMATH STRAIT 3 0.045 0.044 0.045 8/8/90 8/8/90
KR24099 KLAMATH RIVER 1500' U/S KLAMATH STRAIT 5 0.044 0.017 0.051 8/8/90 2/29/00
KR24148 KLAMATH RIVER U/S OF KLAMATH STRAIT 48 0.096 0.003 0.247 6/13/90 3/1/00KR24171 KLAMATH RIVER AT RIVER MILE 242 8 0.056 0.002 0.094 6/13/90 8/17/94
KR24408 KLAMATH RIVER D/S OF NORTH CANAL (MIDLAND) 45 0.096 0.001 0.142 6/13/90 3/1/00
KR24589 KLAMATH RIVER AT MILLER ISLAND BOAT RAMP 27 0.102 0.006 0.168 6/12/90 4/8/97
KR24594 KLAMATH RIVER AT MILLER ISLAND BOAT RAMP 25 0.101 0.006 0.168 6/12/90 4/8/97
KR24781 KLAMATH RIVER AT WEYERHAEUSER MILL SMOKESTACK 32 0.106 0.015 0.2 8/28/90 8/16/94
KR24894 KLAMATH RIVER AT HWY 97 BR SE 38 0.106 0.005 0.157 6/12/90 3/29/95KR24898 KLAMATH RIVER AT HWY 97 BRIDGE 133 0.128 0.04 0.57 2/26/73 6/20/01KR24901 KLAMATH RIVER AT HWY 97 BR NE 7 0.018 0.008 0.022 8/16/94 4/8/97
KR25015 KLAMATH RIVER AT SOUTH END OF DOG POUND ISLAND 41 0.093 0.006 0.123 6/12/90 8/16/94
KR25066 KLAMATH RIVER AT NORTH END OF DOG POUND ISLAND 12 0.093 0.012 0.149 6/12/90 8/16/94
KR25079 KLAMATH RIVER AT SOUTH-SIDE BYPASS BRIDGE 16 0.038 0.007 0.079 6/13/90 4/8/97
KR25127 KLAMATH RIVER AT KLAD RADIO TOWER 44 0.091 0.006 0.236 6/12/90 8/16/94
KR25141 KLAMATH RIVER 300' D/S S SUBURBAN STP DISCHARGE 2 0.165 0.165 0.165 8/7/90 8/7/90
KR25149 KLAMATH RIVER 200' D/S S SUBURBAN STP DISCHARGE 2 0.310 0.31 0.31 8/7/90 8/7/90
KR25158 KLAMATH RIVER 100' D/S S SUBURBAN STP DISCHARGE 2 1.290 1.29 1.29 8/7/90 8/7/90
KR25164 KLAMATH RIVER 30' D/S S SUBURBAN STP DISCHARGE 4 0.473 0.411 0.535 8/7/90 8/7/90
KR25166 KLAMATH RIVER 20' D/S S SUBURBAN STP DISCHARGE 1 2.960 2.96 2.96 8/7/90 8/7/90
KR25168 KLAMATH RIVER 10' D/S S SUBURBAN STP DISCHARGE 1 2.960 2.96 2.96 8/7/90 8/7/90
KR25173 LAKE EWAUNA AT RAILROAD BRIDGE DRAWSPAN 10 0.065 0.008 0.15 8/7/90 4/8/97
KR25200 LAKE EWAUNA BETWEEN STPS 43 0.059 0.005 0.15 6/12/90 3/29/95
KR25250 KLAMATH RIVER 120' D/S KLAMATH FALLS STP 4 0.453 0.067 0.839 8/7/90 8/7/90
KR25271 KLAMATH RIVER 100' U/S KLAMATH FALLS STP 2 1.260 1.26 1.26 7/12/88 7/12/88
KR25274 KLAMATH RIVER 120' U/S KLAMATH FALLS STP 1 2.860 2.86 2.86 8/7/90 8/7/90
KR25278 KLAMATH RIVER 150' U/S KLAMATH FALLS STP 3 0.970 0.97 0.97 7/12/88 7/12/88
KR25312 LINK RIVER AT MOUTH 270 0.039 0.003 0.342 6/6/76 3/13/01KR25479 LINK RIVER AT FREMONT ST BRIDGE 60 0.019 0.003 0.083 6/11/90 5/15/00
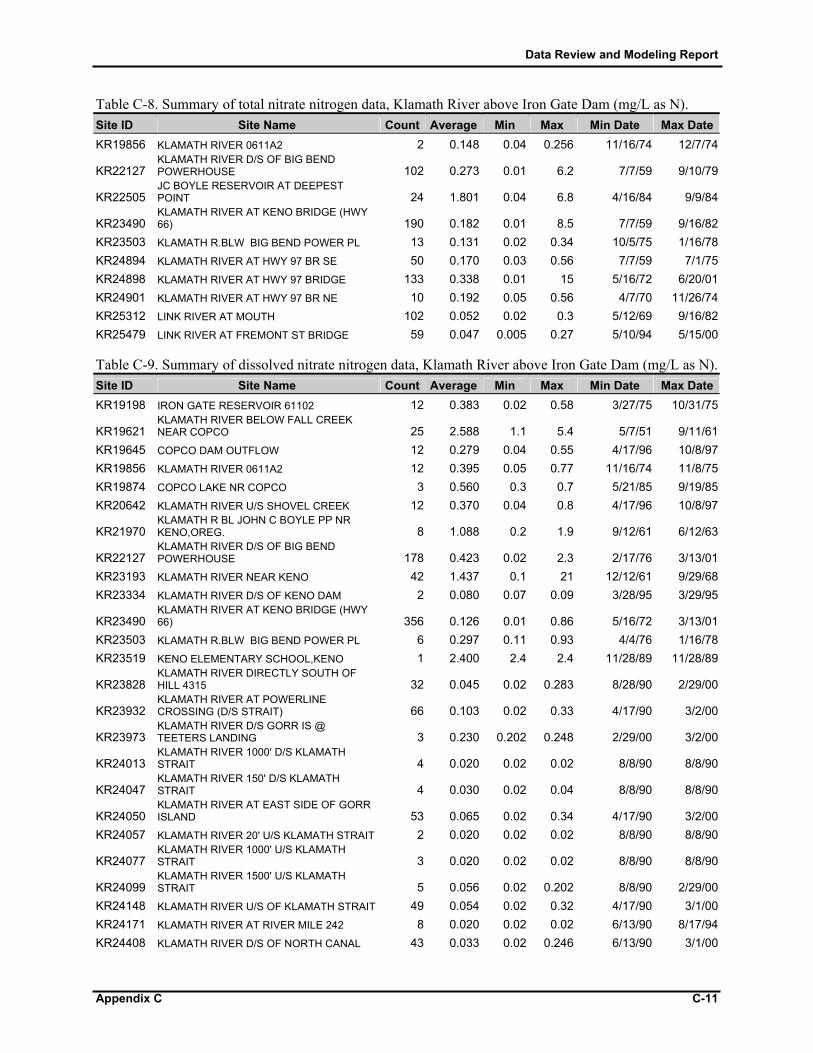
Data Review and Modeling Report
Appendix C C-11
Table C-8. Summary of total nitrate nitrogen data, Klamath River above Iron Gate Dam (mg/L as N). Site ID Site Name Count Average Min Max Min Date Max DateKR19856 KLAMATH RIVER 0611A2 2 0.148 0.04 0.256 11/16/74 12/7/74
KR22127 KLAMATH RIVER D/S OF BIG BEND POWERHOUSE 102 0.273 0.01 6.2 7/7/59 9/10/79
KR22505 JC BOYLE RESERVOIR AT DEEPEST POINT 24 1.801 0.04 6.8 4/16/84 9/9/84
KR23490 KLAMATH RIVER AT KENO BRIDGE (HWY 66) 190 0.182 0.01 8.5 7/7/59 9/16/82
KR23503 KLAMATH R.BLW BIG BEND POWER PL 13 0.131 0.02 0.34 10/5/75 1/16/78KR24894 KLAMATH RIVER AT HWY 97 BR SE 50 0.170 0.03 0.56 7/7/59 7/1/75KR24898 KLAMATH RIVER AT HWY 97 BRIDGE 133 0.338 0.01 15 5/16/72 6/20/01KR24901 KLAMATH RIVER AT HWY 97 BR NE 10 0.192 0.05 0.56 4/7/70 11/26/74KR25312 LINK RIVER AT MOUTH 102 0.052 0.02 0.3 5/12/69 9/16/82KR25479 LINK RIVER AT FREMONT ST BRIDGE 59 0.047 0.005 0.27 5/10/94 5/15/00 Table C-9. Summary of dissolved nitrate nitrogen data, Klamath River above Iron Gate Dam (mg/L as N). Site ID Site Name Count Average Min Max Min Date Max DateKR19198 IRON GATE RESERVOIR 61102 12 0.383 0.02 0.58 3/27/75 10/31/75
KR19621 KLAMATH RIVER BELOW FALL CREEK NEAR COPCO 25 2.588 1.1 5.4 5/7/51 9/11/61
KR19645 COPCO DAM OUTFLOW 12 0.279 0.04 0.55 4/17/96 10/8/97KR19856 KLAMATH RIVER 0611A2 12 0.395 0.05 0.77 11/16/74 11/8/75KR19874 COPCO LAKE NR COPCO 3 0.560 0.3 0.7 5/21/85 9/19/85KR20642 KLAMATH RIVER U/S SHOVEL CREEK 12 0.370 0.04 0.8 4/17/96 10/8/97
KR21970 KLAMATH R BL JOHN C BOYLE PP NR KENO,OREG. 8 1.088 0.2 1.9 9/12/61 6/12/63
KR22127 KLAMATH RIVER D/S OF BIG BEND POWERHOUSE 178 0.423 0.02 2.3 2/17/76 3/13/01
KR23193 KLAMATH RIVER NEAR KENO 42 1.437 0.1 21 12/12/61 9/29/68KR23334 KLAMATH RIVER D/S OF KENO DAM 2 0.080 0.07 0.09 3/28/95 3/29/95
KR23490 KLAMATH RIVER AT KENO BRIDGE (HWY 66) 356 0.126 0.01 0.86 5/16/72 3/13/01
KR23503 KLAMATH R.BLW BIG BEND POWER PL 6 0.297 0.11 0.93 4/4/76 1/16/78KR23519 KENO ELEMENTARY SCHOOL,KENO 1 2.400 2.4 2.4 11/28/89 11/28/89
KR23828 KLAMATH RIVER DIRECTLY SOUTH OF HILL 4315 32 0.045 0.02 0.283 8/28/90 2/29/00
KR23932 KLAMATH RIVER AT POWERLINE CROSSING (D/S STRAIT) 66 0.103 0.02 0.33 4/17/90 3/2/00
KR23973 KLAMATH RIVER D/S GORR IS @ TEETERS LANDING 3 0.230 0.202 0.248 2/29/00 3/2/00
KR24013 KLAMATH RIVER 1000' D/S KLAMATH STRAIT 4 0.020 0.02 0.02 8/8/90 8/8/90
KR24047 KLAMATH RIVER 150' D/S KLAMATH STRAIT 4 0.030 0.02 0.04 8/8/90 8/8/90
KR24050 KLAMATH RIVER AT EAST SIDE OF GORR ISLAND 53 0.065 0.02 0.34 4/17/90 3/2/00
KR24057 KLAMATH RIVER 20' U/S KLAMATH STRAIT 2 0.020 0.02 0.02 8/8/90 8/8/90
KR24077 KLAMATH RIVER 1000' U/S KLAMATH STRAIT 3 0.020 0.02 0.02 8/8/90 8/8/90
KR24099 KLAMATH RIVER 1500' U/S KLAMATH STRAIT 5 0.056 0.02 0.202 8/8/90 2/29/00
KR24148 KLAMATH RIVER U/S OF KLAMATH STRAIT 49 0.054 0.02 0.32 4/17/90 3/1/00KR24171 KLAMATH RIVER AT RIVER MILE 242 8 0.020 0.02 0.02 6/13/90 8/17/94KR24408 KLAMATH RIVER D/S OF NORTH CANAL 43 0.033 0.02 0.246 6/13/90 3/1/00

Data Review and Modeling Report
C-12 Appendix C
(MIDLAND)
KR24589 KLAMATH RIVER AT MILLER ISLAND BOAT RAMP 38 0.046 0.02 0.25 4/17/90 11/19/97
KR24594 KLAMATH RIVER AT MILLER ISLAND BOAT RAMP 35 0.049 0.02 0.25 4/17/90 3/23/98
KR24713 WEYERHAEUSER KLAMATH FALLS /BOX 9 2 0.660 0.57 0.75 6/1/83 6/1/83
KR24781 KLAMATH RIVER AT WEYERHAEUSER MILL SMOKESTACK 32 0.032 0.02 0.06 8/28/90 8/16/94
KR24894 KLAMATH RIVER AT HWY 97 BR SE 44 0.059 0.02 0.12 4/17/90 3/29/95KR24898 KLAMATH RIVER AT HWY 97 BRIDGE 103 0.207 0.01 1.04 5/16/72 8/25/93KR24901 KLAMATH RIVER AT HWY 97 BR NE 31 0.299 0.02 2.5 10/12/60 3/23/98
KR25015 KLAMATH RIVER AT SOUTH END OF DOG POUND ISLAND 41 0.068 0.02 0.16 6/12/90 8/16/94
KR25066 KLAMATH RIVER AT NORTH END OF DOG POUND ISLAND 13 0.058 0.03 0.12 6/12/90 8/16/94
KR25079 KLAMATH RIVER AT SOUTH-SIDE BYPASS BRIDGE 33 0.068 0.02 0.23 6/13/90 3/23/98
KR25127 KLAMATH RIVER AT KLAD RADIO TOWER 46 0.067 0.02 0.2 4/17/90 8/16/94
KR25149 KLAMATH RIVER 200' D/S S SUBURBAN STP DISCHARGE 2 0.190 0.19 0.19 8/7/90 8/7/90
KR25158 KLAMATH RIVER 100' D/S S SUBURBAN STP DISCHARGE 2 0.170 0.17 0.17 8/7/90 8/7/90
KR25164 KLAMATH RIVER 30' D/S S SUBURBAN STP DISCHARGE 4 0.185 0.16 0.21 8/7/90 8/7/90
KR25166 KLAMATH RIVER 20' D/S S SUBURBAN STP DISCHARGE 1 0.100 0.1 0.1 8/7/90 8/7/90
KR25168 KLAMATH RIVER 10' D/S S SUBURBAN STP DISCHARGE 1 0.100 0.1 0.1 8/7/90 8/7/90
KR25173 LAKE EWAUNA AT RAILROAD BRIDGE DRAWSPAN 30 0.101 0.02 0.32 8/7/90 3/23/98
KR25200 LAKE EWAUNA BETWEEN STPS 43 0.054 0.02 0.16 6/12/90 3/29/95
KR25250 KLAMATH RIVER 120' D/S KLAMATH FALLS STP 4 0.280 0.04 0.52 8/7/90 8/7/90
KR25271 KLAMATH RIVER 100' U/S KLAMATH FALLS STP 2 2.500 2.5 2.5 7/12/88 7/12/88
KR25274 KLAMATH RIVER 120' U/S KLAMATH FALLS STP 1 2.500 2.5 2.5 8/7/90 8/7/90
KR25278 KLAMATH RIVER 150' U/S KLAMATH FALLS STP 3 1.167 1.1 1.2 7/12/88 7/12/88
KR25312 LINK RIVER AT MOUTH 319 0.101 0.005 0.76 2/6/74 3/13/01KR25479 LINK RIVER AT FREMONT ST BRIDGE 4 0.038 0.02 0.06 6/11/90 6/11/90 Table C-10. Summary of total ammonia nitrogen data, Klamath River above Iron Gate Dam (mg/L as N). Site ID Site Name Count Average Min Max Min Date Max DateKR19198 IRON GATE RESERVOIR 61102 12 0.153 0.03 0.22 3/27/75 10/31/75KR19645 COPCO DAM OUTFLOW 12 0.155 0.025 0.29 4/17/96 10/8/97KR19856 KLAMATH RIVER 0611A2 12 0.231 0.045 0.59 11/16/74 11/8/75KR19874 COPCO LAKE NR COPCO 5 0.190 0.03 0.69 9/22/77 5/11/78KR20642 KLAMATH RIVER U/S SHOVEL CREEK 12 0.166 0.025 0.42 4/17/96 10/8/97
KR22127 KLAMATH RIVER D/S OF BIG BEND POWERHOUSE 165 0.321 0.01 4.3 7/7/59 9/15/97
KR23334 KLAMATH RIVER D/S OF KENO DAM 2 0.050 0.05 0.05 3/28/95 3/29/95
KR23490 KLAMATH RIVER AT KENO BRIDGE (HWY 66) 299 0.573 0.01 3.75 7/7/59 9/15/97
KR23503 KLAMATH R.BLW BIG BEND POWER PL 13 0.359 0.04 1.14 10/5/75 1/16/78KR23519 KENO ELEMENTARY SCHOOL,KENO 1 0.020 0.02 0.02 11/28/89 11/28/89KR23828 KLAMATH RIVER DIRECTLY SOUTH OF 17 0.585 0.04 1.03 8/28/90 8/17/94
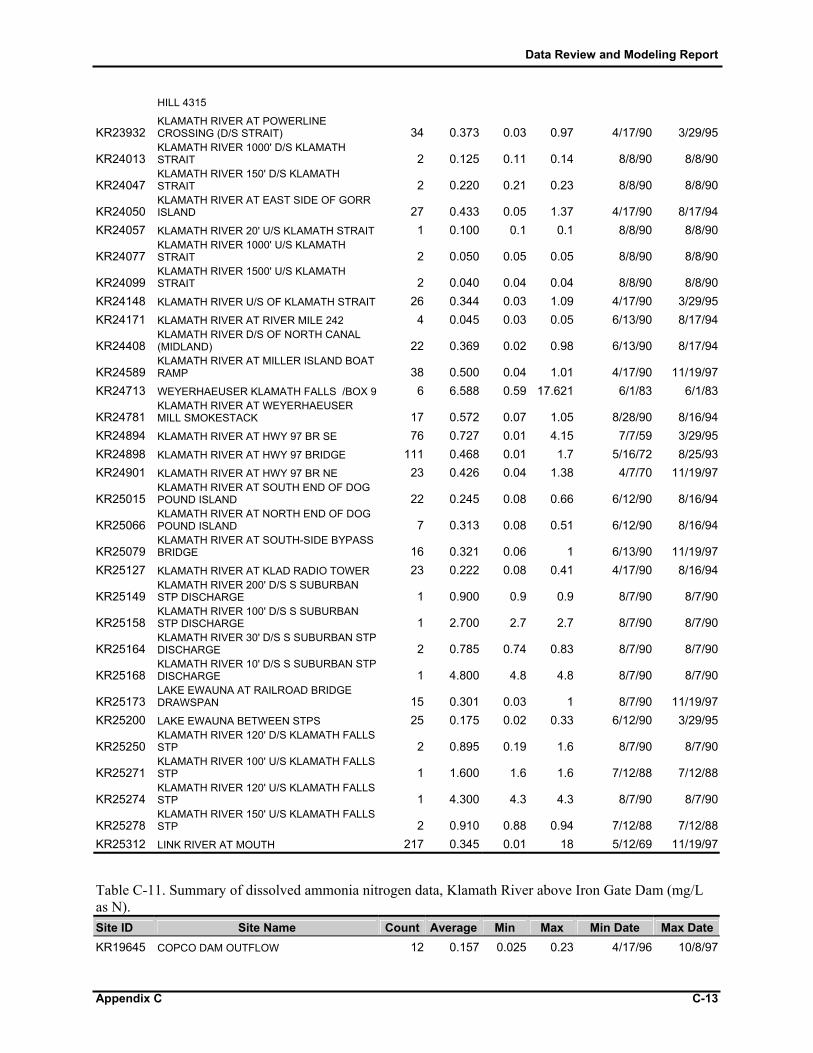
Data Review and Modeling Report
Appendix C C-13
HILL 4315
KR23932 KLAMATH RIVER AT POWERLINE CROSSING (D/S STRAIT) 34 0.373 0.03 0.97 4/17/90 3/29/95
KR24013 KLAMATH RIVER 1000' D/S KLAMATH STRAIT 2 0.125 0.11 0.14 8/8/90 8/8/90
KR24047 KLAMATH RIVER 150' D/S KLAMATH STRAIT 2 0.220 0.21 0.23 8/8/90 8/8/90
KR24050 KLAMATH RIVER AT EAST SIDE OF GORR ISLAND 27 0.433 0.05 1.37 4/17/90 8/17/94
KR24057 KLAMATH RIVER 20' U/S KLAMATH STRAIT 1 0.100 0.1 0.1 8/8/90 8/8/90
KR24077 KLAMATH RIVER 1000' U/S KLAMATH STRAIT 2 0.050 0.05 0.05 8/8/90 8/8/90
KR24099 KLAMATH RIVER 1500' U/S KLAMATH STRAIT 2 0.040 0.04 0.04 8/8/90 8/8/90
KR24148 KLAMATH RIVER U/S OF KLAMATH STRAIT 26 0.344 0.03 1.09 4/17/90 3/29/95KR24171 KLAMATH RIVER AT RIVER MILE 242 4 0.045 0.03 0.05 6/13/90 8/17/94
KR24408 KLAMATH RIVER D/S OF NORTH CANAL (MIDLAND) 22 0.369 0.02 0.98 6/13/90 8/17/94
KR24589 KLAMATH RIVER AT MILLER ISLAND BOAT RAMP 38 0.500 0.04 1.01 4/17/90 11/19/97
KR24713 WEYERHAEUSER KLAMATH FALLS /BOX 9 6 6.588 0.59 17.621 6/1/83 6/1/83
KR24781 KLAMATH RIVER AT WEYERHAEUSER MILL SMOKESTACK 17 0.572 0.07 1.05 8/28/90 8/16/94
KR24894 KLAMATH RIVER AT HWY 97 BR SE 76 0.727 0.01 4.15 7/7/59 3/29/95KR24898 KLAMATH RIVER AT HWY 97 BRIDGE 111 0.468 0.01 1.7 5/16/72 8/25/93KR24901 KLAMATH RIVER AT HWY 97 BR NE 23 0.426 0.04 1.38 4/7/70 11/19/97
KR25015 KLAMATH RIVER AT SOUTH END OF DOG POUND ISLAND 22 0.245 0.08 0.66 6/12/90 8/16/94
KR25066 KLAMATH RIVER AT NORTH END OF DOG POUND ISLAND 7 0.313 0.08 0.51 6/12/90 8/16/94
KR25079 KLAMATH RIVER AT SOUTH-SIDE BYPASS BRIDGE 16 0.321 0.06 1 6/13/90 11/19/97
KR25127 KLAMATH RIVER AT KLAD RADIO TOWER 23 0.222 0.08 0.41 4/17/90 8/16/94
KR25149 KLAMATH RIVER 200' D/S S SUBURBAN STP DISCHARGE 1 0.900 0.9 0.9 8/7/90 8/7/90
KR25158 KLAMATH RIVER 100' D/S S SUBURBAN STP DISCHARGE 1 2.700 2.7 2.7 8/7/90 8/7/90
KR25164 KLAMATH RIVER 30' D/S S SUBURBAN STP DISCHARGE 2 0.785 0.74 0.83 8/7/90 8/7/90
KR25168 KLAMATH RIVER 10' D/S S SUBURBAN STP DISCHARGE 1 4.800 4.8 4.8 8/7/90 8/7/90
KR25173 LAKE EWAUNA AT RAILROAD BRIDGE DRAWSPAN 15 0.301 0.03 1 8/7/90 11/19/97
KR25200 LAKE EWAUNA BETWEEN STPS 25 0.175 0.02 0.33 6/12/90 3/29/95
KR25250 KLAMATH RIVER 120' D/S KLAMATH FALLS STP 2 0.895 0.19 1.6 8/7/90 8/7/90
KR25271 KLAMATH RIVER 100' U/S KLAMATH FALLS STP 1 1.600 1.6 1.6 7/12/88 7/12/88
KR25274 KLAMATH RIVER 120' U/S KLAMATH FALLS STP 1 4.300 4.3 4.3 8/7/90 8/7/90
KR25278 KLAMATH RIVER 150' U/S KLAMATH FALLS STP 2 0.910 0.88 0.94 7/12/88 7/12/88
KR25312 LINK RIVER AT MOUTH 217 0.345 0.01 18 5/12/69 11/19/97 Table C-11. Summary of dissolved ammonia nitrogen data, Klamath River above Iron Gate Dam (mg/L as N). Site ID Site Name Count Average Min Max Min Date Max DateKR19645 COPCO DAM OUTFLOW 12 0.157 0.025 0.23 4/17/96 10/8/97
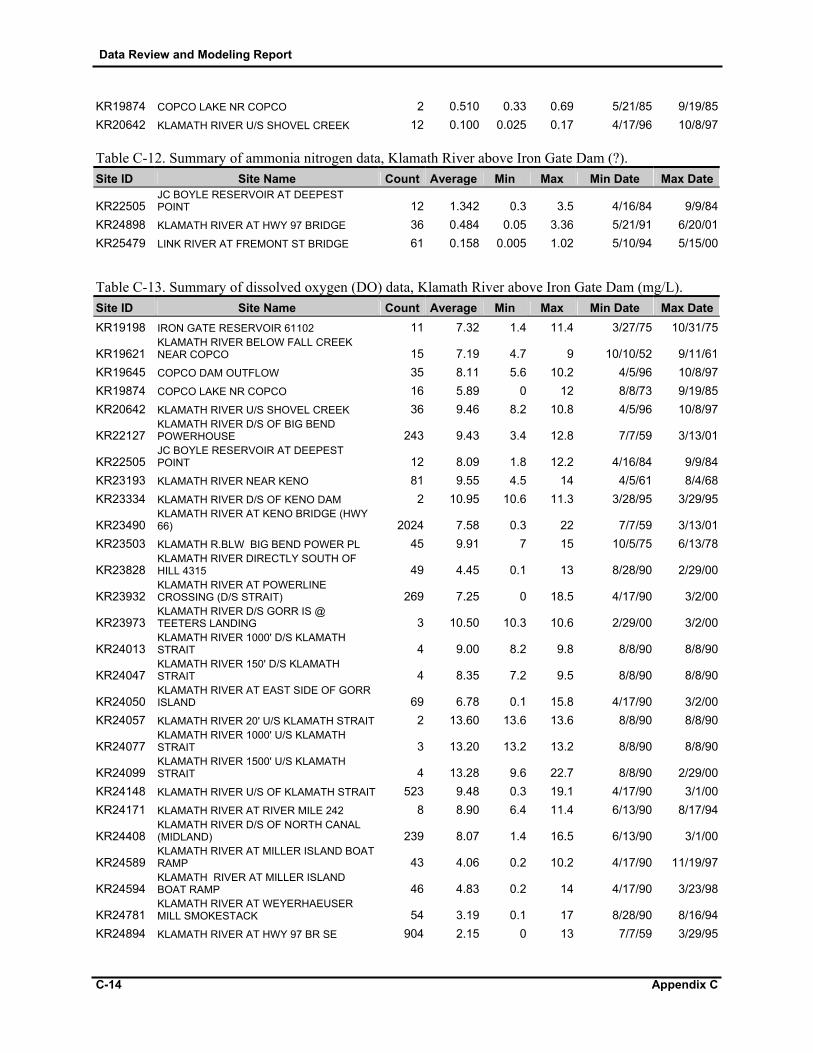
Data Review and Modeling Report
C-14 Appendix C
KR19874 COPCO LAKE NR COPCO 2 0.510 0.33 0.69 5/21/85 9/19/85KR20642 KLAMATH RIVER U/S SHOVEL CREEK 12 0.100 0.025 0.17 4/17/96 10/8/97 Table C-12. Summary of ammonia nitrogen data, Klamath River above Iron Gate Dam (?). Site ID Site Name Count Average Min Max Min Date Max Date
KR22505 JC BOYLE RESERVOIR AT DEEPEST POINT 12 1.342 0.3 3.5 4/16/84 9/9/84
KR24898 KLAMATH RIVER AT HWY 97 BRIDGE 36 0.484 0.05 3.36 5/21/91 6/20/01KR25479 LINK RIVER AT FREMONT ST BRIDGE 61 0.158 0.005 1.02 5/10/94 5/15/00 Table C-13. Summary of dissolved oxygen (DO) data, Klamath River above Iron Gate Dam (mg/L). Site ID Site Name Count Average Min Max Min Date Max DateKR19198 IRON GATE RESERVOIR 61102 11 7.32 1.4 11.4 3/27/75 10/31/75
KR19621 KLAMATH RIVER BELOW FALL CREEK NEAR COPCO 15 7.19 4.7 9 10/10/52 9/11/61
KR19645 COPCO DAM OUTFLOW 35 8.11 5.6 10.2 4/5/96 10/8/97KR19874 COPCO LAKE NR COPCO 16 5.89 0 12 8/8/73 9/19/85KR20642 KLAMATH RIVER U/S SHOVEL CREEK 36 9.46 8.2 10.8 4/5/96 10/8/97
KR22127 KLAMATH RIVER D/S OF BIG BEND POWERHOUSE 243 9.43 3.4 12.8 7/7/59 3/13/01
KR22505 JC BOYLE RESERVOIR AT DEEPEST POINT 12 8.09 1.8 12.2 4/16/84 9/9/84
KR23193 KLAMATH RIVER NEAR KENO 81 9.55 4.5 14 4/5/61 8/4/68KR23334 KLAMATH RIVER D/S OF KENO DAM 2 10.95 10.6 11.3 3/28/95 3/29/95
KR23490 KLAMATH RIVER AT KENO BRIDGE (HWY 66) 2024 7.58 0.3 22 7/7/59 3/13/01
KR23503 KLAMATH R.BLW BIG BEND POWER PL 45 9.91 7 15 10/5/75 6/13/78
KR23828 KLAMATH RIVER DIRECTLY SOUTH OF HILL 4315 49 4.45 0.1 13 8/28/90 2/29/00
KR23932 KLAMATH RIVER AT POWERLINE CROSSING (D/S STRAIT) 269 7.25 0 18.5 4/17/90 3/2/00
KR23973 KLAMATH RIVER D/S GORR IS @ TEETERS LANDING 3 10.50 10.3 10.6 2/29/00 3/2/00
KR24013 KLAMATH RIVER 1000' D/S KLAMATH STRAIT 4 9.00 8.2 9.8 8/8/90 8/8/90
KR24047 KLAMATH RIVER 150' D/S KLAMATH STRAIT 4 8.35 7.2 9.5 8/8/90 8/8/90
KR24050 KLAMATH RIVER AT EAST SIDE OF GORR ISLAND 69 6.78 0.1 15.8 4/17/90 3/2/00
KR24057 KLAMATH RIVER 20' U/S KLAMATH STRAIT 2 13.60 13.6 13.6 8/8/90 8/8/90
KR24077 KLAMATH RIVER 1000' U/S KLAMATH STRAIT 3 13.20 13.2 13.2 8/8/90 8/8/90
KR24099 KLAMATH RIVER 1500' U/S KLAMATH STRAIT 4 13.28 9.6 22.7 8/8/90 2/29/00
KR24148 KLAMATH RIVER U/S OF KLAMATH STRAIT 523 9.48 0.3 19.1 4/17/90 3/1/00KR24171 KLAMATH RIVER AT RIVER MILE 242 8 8.90 6.4 11.4 6/13/90 8/17/94
KR24408 KLAMATH RIVER D/S OF NORTH CANAL (MIDLAND) 239 8.07 1.4 16.5 6/13/90 3/1/00
KR24589 KLAMATH RIVER AT MILLER ISLAND BOAT RAMP 43 4.06 0.2 10.2 4/17/90 11/19/97
KR24594 KLAMATH RIVER AT MILLER ISLAND BOAT RAMP 46 4.83 0.2 14 4/17/90 3/23/98
KR24781 KLAMATH RIVER AT WEYERHAEUSER MILL SMOKESTACK 54 3.19 0.1 17 8/28/90 8/16/94
KR24894 KLAMATH RIVER AT HWY 97 BR SE 904 2.15 0 13 7/7/59 3/29/95
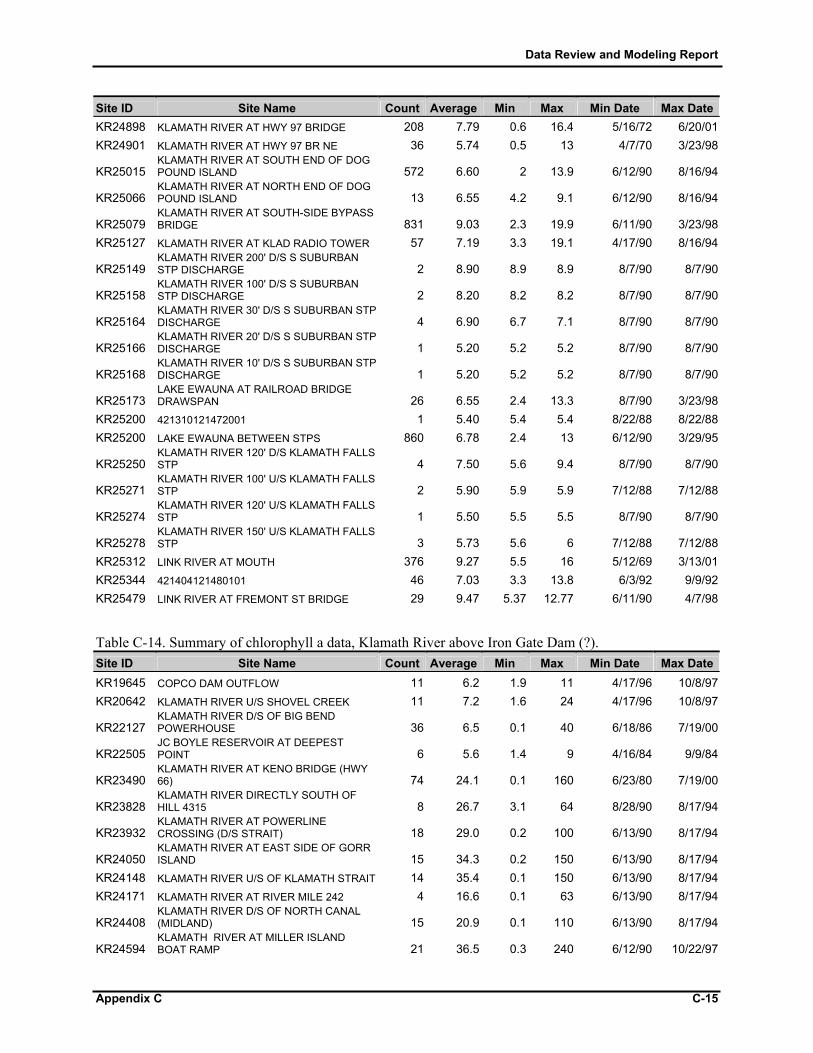
Data Review and Modeling Report
Appendix C C-15
Site ID Site Name Count Average Min Max Min Date Max DateKR24898 KLAMATH RIVER AT HWY 97 BRIDGE 208 7.79 0.6 16.4 5/16/72 6/20/01KR24901 KLAMATH RIVER AT HWY 97 BR NE 36 5.74 0.5 13 4/7/70 3/23/98
KR25015 KLAMATH RIVER AT SOUTH END OF DOG POUND ISLAND 572 6.60 2 13.9 6/12/90 8/16/94
KR25066 KLAMATH RIVER AT NORTH END OF DOG POUND ISLAND 13 6.55 4.2 9.1 6/12/90 8/16/94
KR25079 KLAMATH RIVER AT SOUTH-SIDE BYPASS BRIDGE 831 9.03 2.3 19.9 6/11/90 3/23/98
KR25127 KLAMATH RIVER AT KLAD RADIO TOWER 57 7.19 3.3 19.1 4/17/90 8/16/94
KR25149 KLAMATH RIVER 200' D/S S SUBURBAN STP DISCHARGE 2 8.90 8.9 8.9 8/7/90 8/7/90
KR25158 KLAMATH RIVER 100' D/S S SUBURBAN STP DISCHARGE 2 8.20 8.2 8.2 8/7/90 8/7/90
KR25164 KLAMATH RIVER 30' D/S S SUBURBAN STP DISCHARGE 4 6.90 6.7 7.1 8/7/90 8/7/90
KR25166 KLAMATH RIVER 20' D/S S SUBURBAN STP DISCHARGE 1 5.20 5.2 5.2 8/7/90 8/7/90
KR25168 KLAMATH RIVER 10' D/S S SUBURBAN STP DISCHARGE 1 5.20 5.2 5.2 8/7/90 8/7/90
KR25173 LAKE EWAUNA AT RAILROAD BRIDGE DRAWSPAN 26 6.55 2.4 13.3 8/7/90 3/23/98
KR25200 421310121472001 1 5.40 5.4 5.4 8/22/88 8/22/88KR25200 LAKE EWAUNA BETWEEN STPS 860 6.78 2.4 13 6/12/90 3/29/95
KR25250 KLAMATH RIVER 120' D/S KLAMATH FALLS STP 4 7.50 5.6 9.4 8/7/90 8/7/90
KR25271 KLAMATH RIVER 100' U/S KLAMATH FALLS STP 2 5.90 5.9 5.9 7/12/88 7/12/88
KR25274 KLAMATH RIVER 120' U/S KLAMATH FALLS STP 1 5.50 5.5 5.5 8/7/90 8/7/90
KR25278 KLAMATH RIVER 150' U/S KLAMATH FALLS STP 3 5.73 5.6 6 7/12/88 7/12/88
KR25312 LINK RIVER AT MOUTH 376 9.27 5.5 16 5/12/69 3/13/01KR25344 421404121480101 46 7.03 3.3 13.8 6/3/92 9/9/92KR25479 LINK RIVER AT FREMONT ST BRIDGE 29 9.47 5.37 12.77 6/11/90 4/7/98 Table C-14. Summary of chlorophyll a data, Klamath River above Iron Gate Dam (?). Site ID Site Name Count Average Min Max Min Date Max DateKR19645 COPCO DAM OUTFLOW 11 6.2 1.9 11 4/17/96 10/8/97KR20642 KLAMATH RIVER U/S SHOVEL CREEK 11 7.2 1.6 24 4/17/96 10/8/97
KR22127 KLAMATH RIVER D/S OF BIG BEND POWERHOUSE 36 6.5 0.1 40 6/18/86 7/19/00
KR22505 JC BOYLE RESERVOIR AT DEEPEST POINT 6 5.6 1.4 9 4/16/84 9/9/84
KR23490 KLAMATH RIVER AT KENO BRIDGE (HWY 66) 74 24.1 0.1 160 6/23/80 7/19/00
KR23828 KLAMATH RIVER DIRECTLY SOUTH OF HILL 4315 8 26.7 3.1 64 8/28/90 8/17/94
KR23932 KLAMATH RIVER AT POWERLINE CROSSING (D/S STRAIT) 18 29.0 0.2 100 6/13/90 8/17/94
KR24050 KLAMATH RIVER AT EAST SIDE OF GORR ISLAND 15 34.3 0.2 150 6/13/90 8/17/94
KR24148 KLAMATH RIVER U/S OF KLAMATH STRAIT 14 35.4 0.1 150 6/13/90 8/17/94KR24171 KLAMATH RIVER AT RIVER MILE 242 4 16.6 0.1 63 6/13/90 8/17/94
KR24408 KLAMATH RIVER D/S OF NORTH CANAL (MIDLAND) 15 20.9 0.1 110 6/13/90 8/17/94
KR24594 KLAMATH RIVER AT MILLER ISLAND BOAT RAMP 21 36.5 0.3 240 6/12/90 10/22/97

Data Review and Modeling Report
C-16 Appendix C
Site ID Site Name Count Average Min Max Min Date Max Date
KR24781 KLAMATH RIVER AT WEYERHAEUSER MILL SMOKESTACK 9 78.7 11 320 8/28/90 8/16/94
KR24894 KLAMATH RIVER AT HWY 97 BR SE 13 25.6 0.1 92 6/12/90 8/16/94KR24901 KLAMATH RIVER AT HWY 97 BR NE 7 18.3 7.4 42 8/16/94 10/22/97
KR25015 KLAMATH RIVER AT SOUTH END OF DOG POUND ISLAND 13 31.8 0.1 140 6/12/90 8/16/94
KR25066 KLAMATH RIVER AT NORTH END OF DOG POUND ISLAND 5 53.5 1.5 130 6/12/90 8/16/94
KR25079 KLAMATH RIVER AT SOUTH-SIDE BYPASS BRIDGE 12 29.3 0.1 84 6/13/90 10/22/97
KR25127 KLAMATH RIVER AT KLAD RADIO TOWER 14 65.9 0.9 160 6/12/90 8/16/94
KR25173 LAKE EWAUNA AT RAILROAD BRIDGE DRAWSPAN 6 26.7 7.4 59 8/16/94 10/22/97
KR25200 LAKE EWAUNA BETWEEN STPS 13 23.6 0.1 110 6/12/90 8/21/91KR25312 LINK RIVER AT MOUTH 76 48.5 0.1 440 5/19/80 7/19/00KR25479 LINK RIVER AT FREMONT ST BRIDGE 41 67.5 3.7 299 6/11/90 2/18/97
Data Review and Modeling Report
Appendix D D-1
APPENDIX D: Lost River Model Configuration and Model Review

Data Review and Modeling Report
Appendix D D-2
A preliminary evaluation of existing data and data needs was conducted to support TMDL model development for the Lost River. It was focused on the availability and needs for water quality and quantity data in the Lost River (primarily from Malone Dam to Tule Lake, although Tule Lake, Tule Lake Sump, Lower Klamath Lake, and Klamath Straits Drain will also be included in the modeling effort) and water entering the Klamath Project. Overall, the evaluation of data compiled to date identified substantial data/information gaps. Many of these gaps may be easily filled with existing data that have simply not yet been accessed. The rest of the data gaps may be filled with future data collection and/or estimations based on surrogate data sets. Flow data are available at the following locations: downstream of Malone Dam, Keller Bridge, and downstream of Harpold Dam for the Lost River, as well as within the Lost River Diversion Channel. In order to develop the Lost River model, flow data for incoming tributaries, pumping records, canals, and irrigation returns are needed. The summary of data needs for each segment is presented in tabular format on the following pages (after presentation of the critical model inputs that will be represented in the proposed or alternative modeling frameworks). The locations discussed in the tables are presented graphically on a modified version of a figure obtained from Woods and Orlob, 1963. Water quality data (nutrients, temperature, DO, etc.) are also needed for the water entering into the Lost River through canals, tributaries, and irrigation drains. Due to the presence of a large number of hydraulic structures, the Lost River system likely exhibits organic enrichment and oxygen depletion related to sediment diagenesis. However, there is currently no information to understand these in-stream processes. More detailed data for water quality are essential to successfully developing a model of the Lost River system.

Data Review and Modeling Report
Appendix D D-3
Lost River Major Sources and Sink for Modeling
Model Component ID Source/Sink Lost River Main Channel 1 Inflow at Malone Dam Lost River Main Channel 2 Miller Creek Lost River Main Channel 3 Irwin and Big Springs pumps Lost River Main Channel 4 Bonanza creek Lost River Main Channel 5 Nichols and Bonanza pumps Lost River Main Channel 6 Buck Creek Lost River Main Channel 7 Harpold dam pump-out (including Sutton, Lytle, and Harrison pumps) Lost River Main Channel 8 "E" canal inflow Lost River Main Channel 9 "F-1" canal inflow Lost River Main Channel 10 Lost River diversion outflow to Klamath River Lost River Main Channel 11 Lost River diversion inflow from Klamath River Lost River Main Channel 12 "J" canal irrigation flow Lost River Main Channel 13 Return flows from irrigation (number and locations unidentified yet) Lost River Main Channel 14 Boundary condition at Tule Lake Tule Lake 1 Inflow from Lost River Tule Lake 2 Return flows from irrigation Tule Lake 3 Pump-out flow at Sump "P" canal 1 Inflow from Tule Lake "P" canal 2 Outflow at Lower Klamath Lake Lower Klamath Lake 1 Inflow from "P" canal Lower Klamath Lake 2 irrigation return flow Lower Klamath Lake 3 Inflow from ADY canal Lower Klamath Lake 4 Pump-out flow from pumps E and F Lower Klamath Lake 5 Flows from Cottonwood, Sheepy, and Willow Creeks Klamath Straits Drains 1 Return flow from irrigation land Klamath Straits Drains 2 Flow pumped from Lower Klamath Lake Klamath Straits Drains 3 Flow discharge back to Klamath River (Ewauna Reservoir)

Data Review and Modeling Report
Appendix D D-4
Location Water Quality Data
Segm
ent
Description Points
Flow Data
DO Temperature Nutrients
Discussion on Data Requirements
1 From Malone Dam to Miller Creek Influence
P1 - P2 Flow Data is available d/s of Malone Dam. Data appears to reflect flow control by Malone Dam. Median flow is high in March and steadily decreases till the beginning of winter. In the winter, median flow is very low till the end when the flow increases rapidly. Mean and Median flows vary substantially from winter to early summer.
High DO in Winter and LOW DO in Summer. In general, the segment meets the DO standard.
No abnormal trend. No data available. • Need data on nutrients in the segment
• Need data on quality and quantity of water entering the Malone Dam (Baseline information or Background data)
• Flow data needs clarification on standing water vs running water
2 From Miller Creek Influence to Pumps Irwin and Big Spring
P2 - P3 Flow Data is available at Keller Bridge. Median Flow is low in winter and high in summer. Large difference between mean and median in late winter and spring flow indicates that during these periods flow may have been primarily influenced by natural extreme events or dam releases. During these periods the flow is slightly higher than that of Malone dam. The difference is due to the flow from Miller creek. However, in the summer, the flow is about 5 - 10 higher than that of Malone dam. It indicates a substantial return of irrigation flow at this location.
High DO in Winter and LOW DO in Summer. In general, the segment meets the DO standard.
No abnormal trend. Overall nutrient data indicate high values in August and low values in May.
• Need data on quantity and quality entering Lost River from Miller Creek, and irrigation returns fed by North and West Canals
3 From Pumps Irwin and Big Spring to Bonanza Creek
P3 - P4 No Data No Data No Data No Data • Need data on quantity of water pumped by Irwin and Big Spring pumps
• In-stream water quality and quantity in the segment
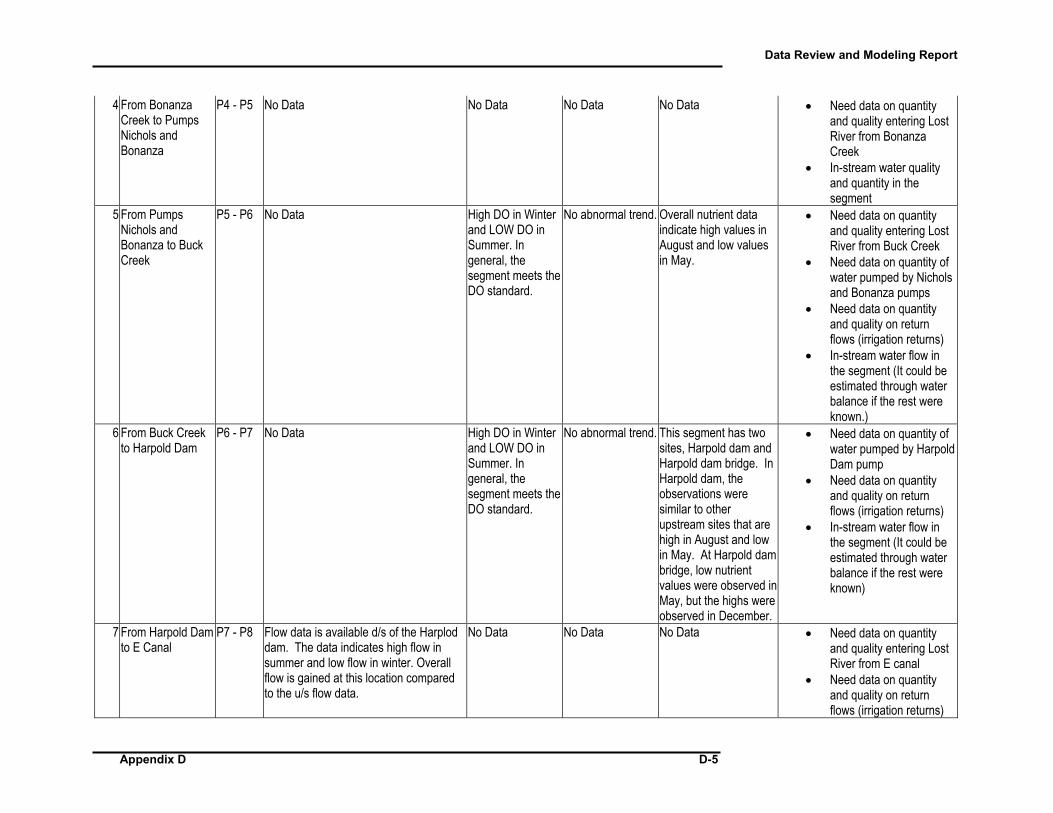
Data Review and Modeling Report
Appendix D D-5
4 From Bonanza Creek to Pumps Nichols and Bonanza
P4 - P5 No Data No Data No Data No Data • Need data on quantity and quality entering Lost River from Bonanza Creek
• In-stream water quality and quantity in the segment
5 From Pumps Nichols and Bonanza to Buck Creek
P5 - P6 No Data High DO in Winter and LOW DO in Summer. In general, the segment meets the DO standard.
No abnormal trend. Overall nutrient data indicate high values in August and low values in May.
• Need data on quantity and quality entering Lost River from Buck Creek
• Need data on quantity of water pumped by Nichols and Bonanza pumps
• Need data on quantity and quality on return flows (irrigation returns)
• In-stream water flow in the segment (It could be estimated through water balance if the rest were known.)
6 From Buck Creek to Harpold Dam
P6 - P7 No Data High DO in Winter and LOW DO in Summer. In general, the segment meets the DO standard.
No abnormal trend. This segment has two sites, Harpold dam and Harpold dam bridge. In Harpold dam, the observations were similar to other upstream sites that are high in August and low in May. At Harpold dam bridge, low nutrient values were observed inMay, but the highs were observed in December.
• Need data on quantity of water pumped by Harpold Dam pump
• Need data on quantity and quality on return flows (irrigation returns)
• In-stream water flow in the segment (It could be estimated through water balance if the rest were known)
7 From Harpold Dam to E Canal
P7 - P8 Flow data is available d/s of the Harplod dam. The data indicates high flow in summer and low flow in winter. Overall flow is gained at this location compared to the u/s flow data.
No Data No Data No Data • Need data on quantity and quality entering Lost River from E canal
• Need data on quantity and quality on return flows (irrigation returns)

Data Review and Modeling Report
Appendix D D-6
• In-stream water quality in the segment
8 From E Canal to F-1 Canal
P8 - P9 No Data High DO in Winter and LOW DO in Summer. In summer, the segment fails to meet the DO standard.
No abnormal trend. This segment has two sites, at Olene Gap and Wilson Reservoir at Crystal Spring Road. At Wilson Reservoir site, the minimum value was observed in February and Maximum was observed in August. But at the Olene Gap, minimum was in June and maximum in December.
• Need data on quantity and quality entering Lost River from F1 canal
• Need data on quantity and quality on return flows (irrigation returns)
• In-stream water flow in the segment (It could be estimated through water balance if the rest were known)
9 From F-1 Canal to LR Diversion Dam
P9 - P10 No Data on Lost River flow. Data available on flow through diversion channel.
No Data on in-stream DO. However, WQ at station 48 indicates the flow entering Lost River through station 48 has low DO in summer and high in winter. In general, it meets the DO standard.
No abnormal trend. No Data • In-stream water flow in the segment (It could be estimated through water balance if the rest were known)
• Need data on nutrients in the segment
10 From LR Diversion Dam to Klamath Return point
P10 - P11
No Data on Lost River flow. Data available to estimate the flow from Klamath.
High DO in Winter and LOW DO in Summer. In general, the segment meets the DO standard.
No abnormal trend. Overall nutrient data indicate high values in September and low values in May.
• In-stream water flow in the segment (It could be estimated through water balance if the rest were know.)

Data Review and Modeling Report
Appendix D D-7
11 From Klamath Return point to J Canal
P11 - P12
No Data High DO in Winter and Low DO in Summer. DO values decrease along the LS from u/s to d/s within this segment. D/S sites fail to meet the standard.
Though the temperature follows the seasonal pattern, large error bars were observed at many sites in November. Also the observations substantially vary among the sites.
The nutrient observations vary substantially among the sites in the segment.
• Need data on quantity and quality entering Lost River from VAN BRIMMER DITCH CO.
• Need data on quantity of water pumped by ADAMS PUMP PLANT and water transported by J Canal
• Need data on quantity and quality on return flows (irrigation returns)
• In-stream water flow in the segment (It could be estimated through water balance if the rest were known)
12 From J Canal to Tule Lake
P12 - Tule Lake
No Data High DO in Winter and LOW DO in Summer. In general, the segment meets the DO standard.
No abnormal trend. The nutrient observations vary substantially among the sites in the segment.
• Need data on quantity and quality on return flows (irrigation returns)
• In-stream water flow in the segment

Data Review and Modeling Report
Appendix D D-8
Data Review and Modeling Report
Appendix E E-1
APPENDIX E: Klamath Model Configuration
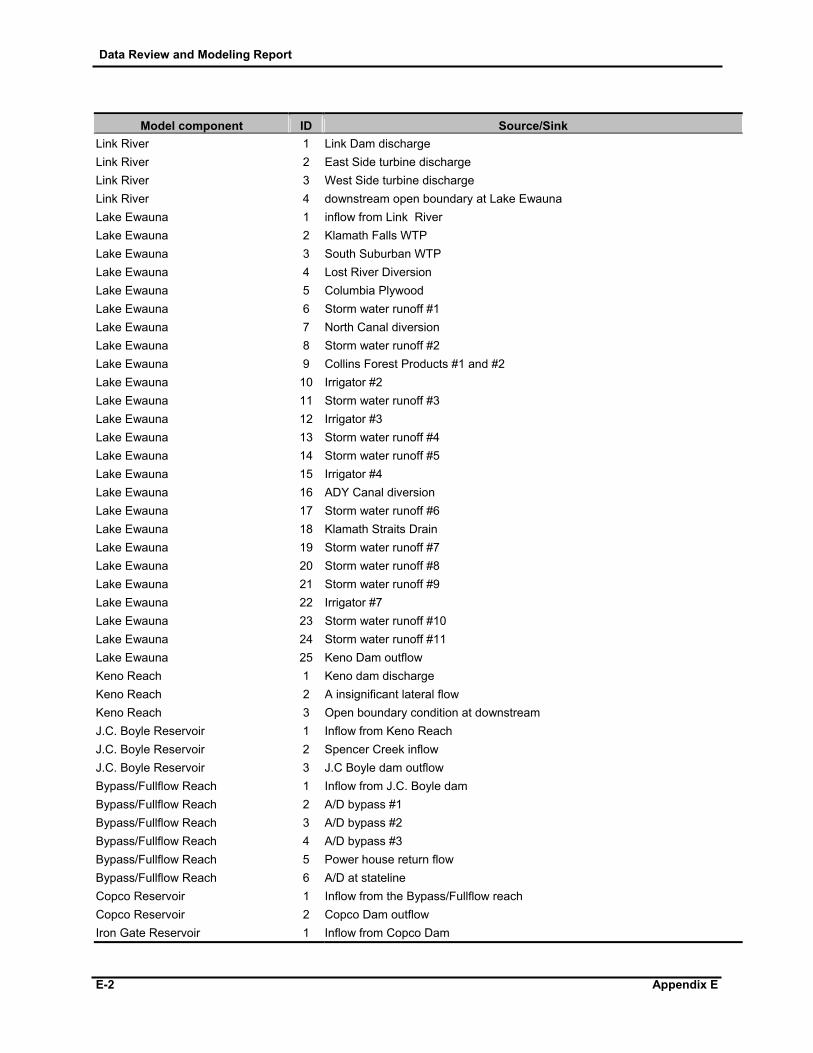
Data Review and Modeling Report
E-2 Appendix E
Model component ID Source/Sink
Link River 1 Link Dam discharge Link River 2 East Side turbine discharge Link River 3 West Side turbine discharge Link River 4 downstream open boundary at Lake Ewauna Lake Ewauna 1 inflow from Link River Lake Ewauna 2 Klamath Falls WTP Lake Ewauna 3 South Suburban WTP Lake Ewauna 4 Lost River Diversion Lake Ewauna 5 Columbia Plywood Lake Ewauna 6 Storm water runoff #1 Lake Ewauna 7 North Canal diversion Lake Ewauna 8 Storm water runoff #2 Lake Ewauna 9 Collins Forest Products #1 and #2 Lake Ewauna 10 Irrigator #2 Lake Ewauna 11 Storm water runoff #3 Lake Ewauna 12 Irrigator #3 Lake Ewauna 13 Storm water runoff #4 Lake Ewauna 14 Storm water runoff #5 Lake Ewauna 15 Irrigator #4 Lake Ewauna 16 ADY Canal diversion Lake Ewauna 17 Storm water runoff #6 Lake Ewauna 18 Klamath Straits Drain Lake Ewauna 19 Storm water runoff #7 Lake Ewauna 20 Storm water runoff #8 Lake Ewauna 21 Storm water runoff #9 Lake Ewauna 22 Irrigator #7 Lake Ewauna 23 Storm water runoff #10 Lake Ewauna 24 Storm water runoff #11 Lake Ewauna 25 Keno Dam outflow Keno Reach 1 Keno dam discharge Keno Reach 2 A insignificant lateral flow Keno Reach 3 Open boundary condition at downstream J.C. Boyle Reservoir 1 Inflow from Keno Reach J.C. Boyle Reservoir 2 Spencer Creek inflow J.C. Boyle Reservoir 3 J.C Boyle dam outflow Bypass/Fullflow Reach 1 Inflow from J.C. Boyle dam Bypass/Fullflow Reach 2 A/D bypass #1 Bypass/Fullflow Reach 3 A/D bypass #2 Bypass/Fullflow Reach 4 A/D bypass #3 Bypass/Fullflow Reach 5 Power house return flow Bypass/Fullflow Reach 6 A/D at stateline Copco Reservoir 1 Inflow from the Bypass/Fullflow reach Copco Reservoir 2 Copco Dam outflow Iron Gate Reservoir 1 Inflow from Copco Dam
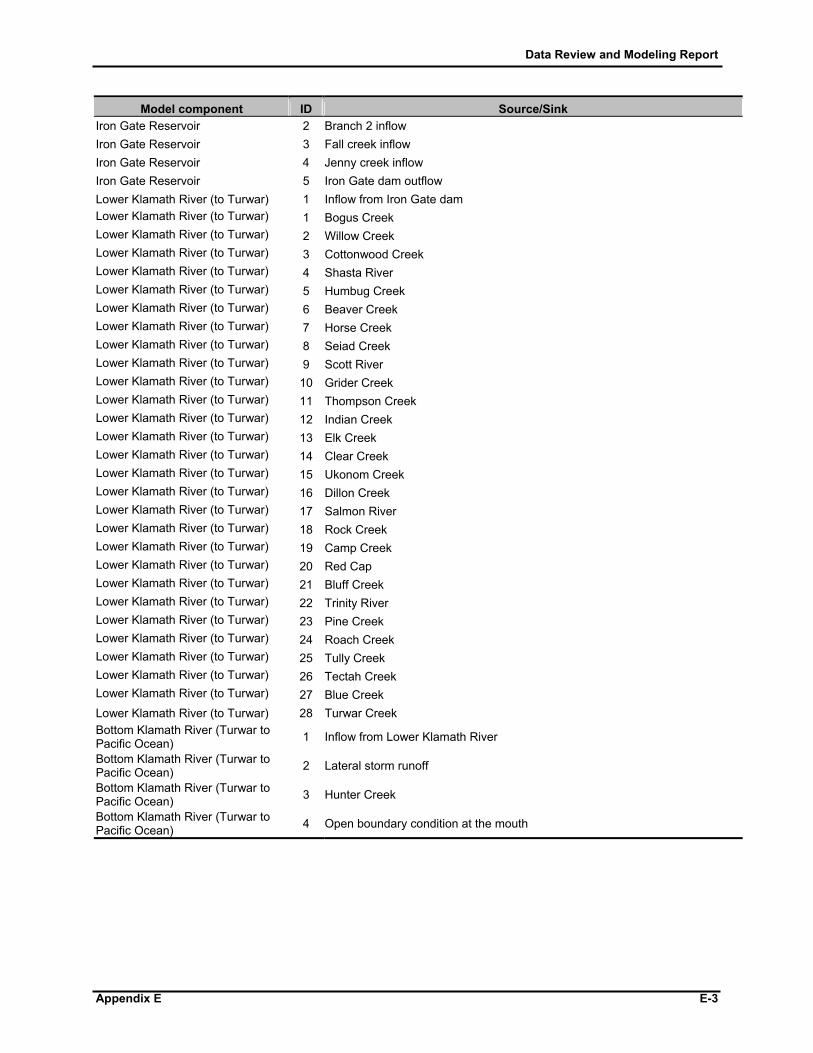
Data Review and Modeling Report
Appendix E E-3
Model component ID Source/Sink Iron Gate Reservoir 2 Branch 2 inflow Iron Gate Reservoir 3 Fall creek inflow Iron Gate Reservoir 4 Jenny creek inflow Iron Gate Reservoir 5 Iron Gate dam outflow Lower Klamath River (to Turwar) 1 Inflow from Iron Gate dam Lower Klamath River (to Turwar) 1 Bogus Creek Lower Klamath River (to Turwar) 2 Willow Creek Lower Klamath River (to Turwar) 3 Cottonwood Creek Lower Klamath River (to Turwar) 4 Shasta River Lower Klamath River (to Turwar) 5 Humbug Creek Lower Klamath River (to Turwar) 6 Beaver Creek Lower Klamath River (to Turwar) 7 Horse Creek Lower Klamath River (to Turwar) 8 Seiad Creek Lower Klamath River (to Turwar) 9 Scott River Lower Klamath River (to Turwar) 10 Grider Creek Lower Klamath River (to Turwar) 11 Thompson Creek Lower Klamath River (to Turwar) 12 Indian Creek Lower Klamath River (to Turwar) 13 Elk Creek Lower Klamath River (to Turwar) 14 Clear Creek Lower Klamath River (to Turwar) 15 Ukonom Creek Lower Klamath River (to Turwar) 16 Dillon Creek Lower Klamath River (to Turwar) 17 Salmon River Lower Klamath River (to Turwar) 18 Rock Creek Lower Klamath River (to Turwar) 19 Camp Creek Lower Klamath River (to Turwar) 20 Red Cap Lower Klamath River (to Turwar) 21 Bluff Creek Lower Klamath River (to Turwar) 22 Trinity River Lower Klamath River (to Turwar) 23 Pine Creek Lower Klamath River (to Turwar) 24 Roach Creek Lower Klamath River (to Turwar) 25 Tully Creek Lower Klamath River (to Turwar) 26 Tectah Creek Lower Klamath River (to Turwar) 27 Blue Creek Lower Klamath River (to Turwar) 28 Turwar Creek Bottom Klamath River (Turwar to Pacific Ocean) 1 Inflow from Lower Klamath River
Bottom Klamath River (Turwar to Pacific Ocean) 2 Lateral storm runoff
Bottom Klamath River (Turwar to Pacific Ocean) 3 Hunter Creek
Bottom Klamath River (Turwar to Pacific Ocean) 4 Open boundary condition at the mouth