Convergence of TTS Iterative Method for Non-Hermitian Positive Definite Linear Systems
Upload
khangminh22Category
view
2download
0
June 2018
Definite Plan for the Lower Klamath Project

Definite Plan
2 June 2018
This page intentionally left blank.

Definite Plan
June 2018 3
Prepared for:
Klamath River Renewal Corporation
Prepared by:
KRRC Technical Representative:
AECOM Technical Services, Inc.
300 Lakeside Drive, Suite 400
Oakland, California 94612
CDM Smith
1755 Creekside Oaks Drive, Suite 200
Sacramento, California 95833
River Design Group
311 SW Jefferson Avenue
Corvallis, Oregon 97333

Definite Plan
4 June 2018
This page intentionally left blank.

Definite Plan
June 2018 Table of Contents 5
Table of Contents List of Appendices ........................................................................................ 10
List of Tables ................................................................................................. 11
List of Figures ............................................................................................... 12
Acronyms and Abbreviations ...................................................................... 15
Definitions ..................................................................................................... 20
Executive Summary...................................................................................... 23
1. Objectives and Background ................................................................ 27
1.1 Objectives ...................................................................................................................... 27 1.2 Project Description ......................................................................................................... 29
1.2.1 Project Area and Other Definitions...................................................................... 31 1.3 Compliance with Applicable Laws ..................................................................................... 32
1.3.1 Federal ............................................................................................................ 32 1.3.2 State and Local Permits .................................................................................... 38 1.3.3 Further Consultation ......................................................................................... 40
1.4 Elevations and Measurement Corrections ......................................................................... 41 1.5 Document Organization ................................................................................................... 43
2. Existing Feature Descriptions ............................................................ 47
2.1 J.C. Boyle Dam and Powerhouse ...................................................................................... 47 2.1.1 Reservoir ......................................................................................................... 47 2.1.2 Dam, Spillway, and Diversion Culverts ................................................................ 47 2.1.3 Intake, Fish Screens, and Fish Ladder ................................................................ 49 2.1.4 Water Conveyance to Powerhouse...................................................................... 49 2.1.5 Powerhouse ..................................................................................................... 53 2.1.6 Site Access ...................................................................................................... 54 2.1.7 Recreation Facilities.......................................................................................... 54
2.2 Copco No. 1 Dam and Powerhouse .................................................................................. 55 2.2.1 Reservoir ......................................................................................................... 55 2.2.2 Dam, Spillway, and Diversion Tunnel .................................................................. 55 2.2.3 Water Conveyance to Powerhouse...................................................................... 58

Definite Plan
6 Table of Contents June 2018
2.2.4 Powerhouse ..................................................................................................... 59 2.2.5 Site Access ...................................................................................................... 60 2.2.6 Recreation Facilities.......................................................................................... 60
2.3 Copco No. 2 Dam and Powerhouse .................................................................................. 60 2.3.1 Reservoir ......................................................................................................... 60 2.3.2 Dam and Spillway ............................................................................................. 60 2.3.3 Water Conveyance to Powerhouse...................................................................... 62 2.3.4 Powerhouse ..................................................................................................... 63 2.3.5 Site Access ...................................................................................................... 64 2.3.6 Recreation Facilities.......................................................................................... 64
2.4 Iron Gate Dam and Powerhouse....................................................................................... 64 2.4.1 Reservoir ......................................................................................................... 65 2.4.2 Dam, Spillway, and Diversion Tunnel .................................................................. 65 2.4.3 Water Conveyance to Powerhouse...................................................................... 67 2.4.4 Powerhouse ..................................................................................................... 68 2.4.5 Fish Trapping and Holding Facilities.................................................................... 68 2.4.6 Iron Gate Fish Hatchery ..................................................................................... 69 2.4.7 Site Access ...................................................................................................... 70 2.4.8 Recreation Facilities.......................................................................................... 70
3. FERC Compliance and Dam Safety .................................................... 73
3.1 Board of Consultants ...................................................................................................... 73 3.2 Part 12 Requirements ..................................................................................................... 74
3.2.1 Potential Failure Modes Analysis Background...................................................... 74 3.2.2 Supplemental PFMA.......................................................................................... 74
3.3 FERC Required Plans and Submittals ............................................................................... 77
4. Reservoir Drawdown and Diversion Plan .......................................... 81
4.1 Introduction ................................................................................................................... 81 4.2 Diversion Facilities.......................................................................................................... 82
4.2.1 J.C. Boyle Reservoir........................................................................................... 84 4.2.2 Copco Lake ...................................................................................................... 84 4.2.3 Iron Gate Reservoir ........................................................................................... 87 4.2.4 Drawdown Controls ........................................................................................... 88
4.3 Flood Frequency Analysis ................................................................................................ 89 4.4 Summer Flow Frequency Analysis..................................................................................... 91

Definite Plan
June 2018 Table of Contents 7
4.4.1 Iron Gate Reservoir ........................................................................................... 91 4.4.2 J.C. Boyle Reservoir........................................................................................... 97
4.5 Drawdown Timing ......................................................................................................... 101 4.6 Reservoir Drawdown Releases ....................................................................................... 102
4.6.1 Detailed Modeling........................................................................................... 103 4.6.2 J.C. Boyle Reservoir......................................................................................... 106 4.6.3 Copco Lake .................................................................................................... 114 4.6.4 Iron Gate Reservoir ......................................................................................... 123 4.6.5 Downstream of Iron Gate................................................................................. 130
4.7 Monitoring During Reservoir Drawdown .......................................................................... 144 4.8 Best Management Practices to Implement During Reservoir Drawdown ............................. 144
4.8.1 Blockage of Diversion Facilities ........................................................................ 144 4.8.2 Stability of Embankments ................................................................................ 145
4.9 Stability of Reservoir Rim............................................................................................... 145 4.10 Potential for Effects Downstream of the Project ............................................................... 146
4.10.1 Previous Modeling Results and Limitations ....................................................... 146 4.10.2 Aggradation and Tributary Confluences............................................................. 147 4.10.3 Pool Depths ................................................................................................... 147 4.10.4 Lateral Migration ............................................................................................ 147 4.10.5 Water Quality and Suspended Sediment ........................................................... 148 4.10.6 Water Quality and Sediment Contaminants ....................................................... 148 4.10.7 Flooding and Slope Instability .......................................................................... 150
5. Dam Removal Approach .................................................................... 153
5.1 Introduction ................................................................................................................. 153 5.2 J.C. Boyle Dam and Powerhouse .................................................................................... 154
5.2.1 Removal Limits............................................................................................... 154 5.2.2 Construction Access........................................................................................ 156 5.2.3 Staging Areas, and Disposal Sites .................................................................... 163 5.2.4 J.C. Boyle Dam and Powerhouse Removal ......................................................... 165 5.2.5 Demolition Methods, Estimated Equipment and Workforce................................. 167 5.2.6 Imported Materials ......................................................................................... 169 5.2.7 Waste Disposal............................................................................................... 169
5.3 Copco No. 1 Dam and Powerhouse ................................................................................ 171 5.3.1 Removal Limits............................................................................................... 171

Definite Plan
8 Table of Contents June 2018
5.3.2 Construction Access........................................................................................ 172 5.3.3 Staging Areas and Disposal Sites ..................................................................... 181 5.3.4 Copco No. 1 Dam and Powerhouse Removal ..................................................... 182 5.3.5 Demolition Methods, Estimated Equipment and Workforce................................. 184 5.3.6 Imported Materials ......................................................................................... 186 5.3.7 Waste Disposal............................................................................................... 186
5.4 Copco No. 2 Dam and Powerhouse ................................................................................ 187 5.4.1 Removal Limits............................................................................................... 187 5.4.2 Construction Access........................................................................................ 188 5.4.3 Staging Areas and Disposal Sites ..................................................................... 190 5.4.4 Copco No. 2 Dam and Powerhouse Removal ..................................................... 191 5.4.5 Demolition Methods, Estimated Equipment and Workforce................................. 193 5.4.6 Imported Materials ......................................................................................... 194 5.4.7 Waste Disposal............................................................................................... 194
5.5 Iron Gate Dam and Powerhouse..................................................................................... 196 5.5.1 Removal Limits............................................................................................... 196 5.5.2 Construction Access........................................................................................ 197 5.5.3 Staging Areas and Disposal Sites ..................................................................... 200 5.5.4 Iron Gate Dam and Powerhouse Removal ......................................................... 201 5.5.5 Demolition Methods, Estimated Equipment and Workforce................................. 203 5.5.6 Imported Materials ......................................................................................... 206 5.5.7 Waste Disposal............................................................................................... 206
6. Reservoir and Other Restoration ..................................................... 211
6.1 Reservoir Restoration.................................................................................................... 211 6.1.1 Measures to Manage Remaining Sediment ....................................................... 211 6.1.2 Measures to Monitor Remaining Sediment........................................................ 214 6.1.3 Measures to Restore the Klamath River within Reservoirs .................................. 215
6.2 Restoration Activities Outside of Reservoir ...................................................................... 216
7. Other Project Components ............................................................... 221
7.1 Overview ...................................................................................................................... 221 7.2 Aquatic Resources ........................................................................................................ 223
7.2.1 Klamath Population Status Updates ................................................................. 223 7.2.2 Understanding of Fish Diseases ....................................................................... 234 7.2.3 Aquatic Resources Measures........................................................................... 239
Definite Plan
June 2018 Table of Contents 9
7.3 Terrestrial Resources Measures ..................................................................................... 243 7.4 Road Improvements...................................................................................................... 244
7.4.1 Construction Access Improvements .................................................................. 249 7.4.2 Ongoing and Post-Project Maintenance Activities ............................................... 249 7.4.3 Long Term Road Infrastructure Improvements ................................................... 249
7.5 Yreka Water Supply....................................................................................................... 254 7.5.1 Water Supply Pipeline ..................................................................................... 255 7.5.2 Water Supply Intake........................................................................................ 259
7.6 Recreation Facilities Removal & Draft Plan...................................................................... 261 7.6.1 J.C. Boyle Reservoir......................................................................................... 261 7.6.2 Copco Lake .................................................................................................... 263 7.6.3 Iron Gate Reservoir ......................................................................................... 264 7.6.4 Dispersed Recreation Sites in the Study Area .................................................... 268 7.6.5 Draft Recreation Plan ...................................................................................... 268
7.7 Downstream Flood Control Improvements....................................................................... 269 7.7.1 Habitable Structures ....................................................................................... 269 7.7.2 River Crossings............................................................................................... 270
7.8 Fish Hatchery Plan ........................................................................................................ 273 7.8.1 Existing IGH Facility and Operations.................................................................. 274 7.8.2 Existing Fall Creek Hatchery............................................................................. 276 7.8.3 Proposed Fish Hatchery Plan ........................................................................... 276
7.9 Cultural Resources Plan ................................................................................................ 294 7.10 Other Plans .................................................................................................................. 294
8. Project Costs and Schedule.............................................................. 299
8.1 Objectives .................................................................................................................... 299 8.2 Cost Categories ............................................................................................................ 299 8.3 Construction Procurement Approach .............................................................................. 301 8.4 Basis of Estimate.......................................................................................................... 301
8.4.1 Construction Pricing ........................................................................................ 301 8.4.2 Consulting Services Pricing .............................................................................. 301 8.4.3 Escalation ...................................................................................................... 301 8.4.4 Design and Construction Contingency............................................................... 302 8.4.5 Monte Carlo Analysis....................................................................................... 302 8.4.6 Ongoing Due Diligence .................................................................................... 303

Definite Plan
10 Table of Contents June 2018
8.5 Estimate Results Summary ............................................................................................ 303 8.6 Construction Schedule .................................................................................................. 304
9. References .......................................................................................... 309
List of Appendices Appendix A Risk Management Plan
Appendix B Figures – CONTAINS CEII - DO NOT RELEASE
Appendix C Figures – Other
Appendix D Dam Stability Analyses
Appendix E Reservoir Rim Stability Analyses
Appendix F Reservoir Drawdown Analysis
Appendix G Copco Foundation Removal Appendix H Reservoir Area Management Plan
Appendix I Aquatic Resources Measures
Appendix J Terrestrial Resources Measures
Appendix K Road and Bridge Structure Data and Long-Term Improvements
Appendix L Cultural Resources Plan
Appendix M Water Quality Monitoring Plan
Appendix N Groundwater Well Management Plan
Appendix O Construction Related Plans
Appendix P Estimate of Project Costs Report
Appendix Q Draft Recreation Plan

Definite Plan
June 2018 Table of Contents 11
List of Tables Table 1.4-1 Elevation Conversion Factors ........................................................................................... 41 Table 1.4-2 River Mile Comparison .................................................................................................... 41 Table 3.3-1 FERC Required Plans and Submittals ............................................................................... 77 Table 4.1-1 End Date for Power Generation ........................................................................................ 82 Table 4.2-1 Facilities to be Used for Reservoir Lowering and Diversion .................................................. 83 Table 4.3-1 U.S. Geological Survey Streamflow Gaging Stations Analyzed .............................................. 90 Table 4.3-2 Annual Flood Frequency Results ...................................................................................... 90 Table 4.4-1 USGS Gauge Data Used in the Summer Flows Frequency Analysis....................................... 91 Table 4.4-2 Monthly Flood Frequency Flow at Iron Gate Reservoir......................................................... 95 Table 4.4-3 Maximum Water Surface Elevation in Iron Gate Reservoir................................................... 95 Table 4.4-4 Monthly Flood Frequency Flow at J.C. Boyle Reservoir ........................................................ 99 Table 4.4-5 Maximum Water Surface Elevation in J.C. Boyle Reservoir .................................................. 99 Table 4.6-1 Range of Release Flows from Reservoirs due to Drawdown .............................................. 103 Table 4.6-2 Comparison of Flows Downstream of Iron Gate Dam with and without Drawdown ............... 133 Table 5.2-1 J.C. Boyle Dam and Powerhouse, Removal Requirements ................................................. 154 Table 5.2-2 J.C. Boyle Dam and Powerhouse, Estimated Equipment List ............................................. 168 Table 5.2-3 Waste Disposal for Full Removal of J.C. Boyle Dam .......................................................... 170 Table 5.2-4 Waste Disposal Facilities near J.C. Boyle Dam ................................................................. 170 Table 5.3-1 Copco No. 1 Dam and Powerhouse, Removal Requirements ............................................. 171 Table 5.3-2 Copco No. 1 Dam and Powerhouse, Estimated Equipment List.......................................... 185 Table 5.3-3 Waste Disposal for Full Removal of Copco No. 1 Dam ...................................................... 186 Table 5.3-4 Waste Disposal Facilities near Copco No. 1 Dam ............................................................. 187 Table 5.4-1 Copco No. 2 Dam and Powerhouse, Removal Requirements ............................................. 187 Table 5.4-2 Copco No. 2 Dam and Powerhouse, Estimated Equipment List.......................................... 193 Table 5.4-3 Waste Disposal for Full Removal of Copco No. 2 Dam ...................................................... 195 Table 5.4-4 Waste Disposal Facilities near Copco No. 2 Dam ............................................................. 195 Table 5.5-1 Iron Gate Dam and Powerhouse, Removal Requirements ................................................. 196 Table 5.5-2 Iron Gate Dam and Powerhouse, Estimated Equipment List .............................................. 205 Table 5.5-3 Waste Disposal for Full Removal of Iron Gate Dam........................................................... 206 Table 5.5-4 Waste Disposal Facilities near Iron Gate Dam ................................................................. 207 Table 6.1-1 Preliminary Goals, Objectives, and Restoration Activities for Reservoir Area Restoration ...... 212 Table 7.1-1 Summary of Other Project Components1 ......................................................................... 221 Table 7.2-1 Summary of estimates of annual-level C. shasta infection prevalence for wild and/or
unknown origin juvenile Chinook salmon passing the Kinsman rotary screw trap site (RM 147.6). ................................................................................................................. 237
Table 7.4-1 Roadway and Access Improvements ............................................................................... 245 Table 7.7-1 Changes in River Stage with Dam Removal ..................................................................... 270 Table 7.8-1 Comparison of Previous Mitigation Goals and Revised NMFS/CDFW Production
Recommendation ......................................................................................................... 277 Table 7.8-2 Estimated Water Needs at IGH rearing 3.4 million Chinook smolts (cfs) ............................. 278 Table 7.8-3 Observed minimum, maximum, and 4-year average flow in cfs by month in Bogus Creek
from 8/8/2013 to 4/16/2018 ...................................................................................... 280 Table 7.8-4 April Juvenile Rearing Water Availability and Requirements............................................... 280 Table 7.8-5 May Juvenile Rearing Water Availability and Requirements ............................................... 281 Table 7.8-6 October Adult Holding Water Availability and Requirements .............................................. 281

Definite Plan
12 Table of Contents June 2018
Table 7.8-7 November Adult Holding Water Availability and Requirements........................................... 282 Table 7.8-8 Estimated Water Needs at FCH rearing 115,000 Chinook yearlings and 75,500 Coho
(cfs)............................................................................................................................. 292 Table 7.10-1 Summary of Other Plans for Construction, Water Quality and Groundwater Management .... 295 Table 8.5-1 Results Summary - Full Removal .................................................................................... 304 Table 8.5-2 Results Summary - Partial Removal ................................................................................ 304
List of Figures Figure 1.1-1 Klamath River Watershed and Development Locations.................................................... 28 Figure 1.1-2 Project Vicinity and Access (Appendix C) ......................................................................... 28 Figure 2.1-1 J.C. Boyle Dam Existing Features (Appendix C) ................................................................ 47 Figure 2.1-2 J.C. Boyle Dam............................................................................................................. 48 Figure 2.1-3 Cross Section of J.C. Boyle Dam (Appendix B) ................................................................. 48 Figure 2.1-4 Elevation of J.C. Boyle Spillway and Diversion Culverts (Appendix B).................................. 48 Figure 2.1-5 Cross Section of J.C. Boyle Dam Spillway (Appendix B)..................................................... 49 Figure 2.1-6 J.C. Boyle Intake Structure ............................................................................................ 49 Figure 2.1-7 J.C. Boyle Power Canal (left) and Klamath River Bypass Reach (right)................................ 50 Figure 2.1-8 Forebay Overflow Chute and Upper Portion of Scour Hole ................................................ 51 Figure 2.1-9 J.C. Boyle Forebay and Tunnel Trash Rack (rear) ............................................................. 52 Figure 2.1-10 J.C. Boyle Penstocks..................................................................................................... 53 Figure 2.1-11 J.C. Boyle Powerhouse.................................................................................................. 54 Figure 2.2-1 Copco No. 1 and Copco No. 2 Dams Existing Features (Appendix C).................................. 55 Figure 2.2-2 Copco No. 1 Dam (right) and Powerhouse (left) ............................................................... 56 Figure 2.2-3 Cross Section of Copco No. 1 Spillway (Appendix B)......................................................... 56 Figure 2.2-4 Cross Section of Copco No. 1 Dam (Appendix B) ............................................................. 57 Figure 2.2-5 Copco No. 1 Diversion Tunnel Downstream Portal ........................................................... 57 Figure 2.2-6 Copco No. 1 10-ft (left and middle) and 14-ft (right) Penstocks......................................... 58 Figure 2.2-7 Copco No. 1 Powerhouse .............................................................................................. 59 Figure 2.3-1 Copco No. 2 Dam from Downstream Side....................................................................... 61 Figure 2.3-2 Layout of Copco No. 2 Dam Features (Appendix B) .......................................................... 61 Figure 2.3-3 Cross Section of Copco No. 2 Dam (Appendix B) ............................................................. 61 Figure 2.3-4 Elevation of Copco No. 2 Dam (Appendix B) .................................................................... 61 Figure 2.3-5 Copco No. 2 Dam from Upstream Side Showing Intake (at water level) and Crib Wall
(high) on Left Abutment ................................................................................................ 62 Figure 2.3-6 Copco No. 2 Wood-Stave Penstock ................................................................................ 63 Figure 2.3-7 Copco No. 2 Powerhouse .............................................................................................. 64 Figure 2.4-1 Iron Gate Dam Existing Features (Appendix C) ................................................................ 65 Figure 2.4-2 Iron Gate Dam, Spillway (left), and Powerhouse (right) ..................................................... 66 Figure 2.4-3 Elevation of Iron Gate Dam (Appendix B) ........................................................................ 66 Figure 2.4-4 Cross Section of Iron Gate Dam (Appendix B).................................................................. 66 Figure 2.4-5 Iron Gate Diversion Tunnel Outlet (center-right, in shadow) .............................................. 67 Figure 2.4-6 Iron Gate Powerhouse .................................................................................................. 68 Figure 2.4-7 Iron Gate Fish Holding Tanks and Spawning Building....................................................... 69 Figure 4.2-1 J.C. Boyle Diversion Facilities (Appendix B) ..................................................................... 84 Figure 4.2-2 Discharge Rating Curve and Stage-Storage Curve for J.C. Boyle ........................................ 84

Definite Plan
June 2018 Table of Contents 13
Figure 4.2-3 Discharge Rating Curve and Stage-Storage Curve for Copco No. 1 .................................... 85 Figure 4.2-4 Copco No. 1 Diversion Modification, Intake Structure (Appendix B) ................................... 86 Figure 4.2-5 Copco No. 1 Diversion Modification, Tunnel (Appendix B)................................................. 86 Figure 4.2-6 Copco No. 1 Diversion Modification, New Gate Structure (Appendix B) .............................. 87 Figure 4.2-7 Discharge Rating Curve and Stage-Storage Curve for Iron Gate ........................................ 88 Figure 4.2-8 Iron Gate Diversion Modification (Appendix B) ................................................................ 88 Figure 4.4-1 Relationship between Annual Maximum Flows and Daily Average Flow at the USGS
Iron Gate Gauge .......................................................................................................... 94 Figure 4.4-2 Predicted 100-year Flood Flow at Iron Gate for the Period May through September ............ 96 Figure 4.4-3 Frequency of Reservoir Levels at Iron Gate Dam for Summer Flows .................................. 96 Figure 4.4-4 Relationship between Annual Maximum Flows and Daily Average Flow at the USGS
J.C. Boyle Powerhouse Gauge........................................................................................ 98 Figure 4.4-5 Predicted 100-year Flood Flow at J.C. Boyle for the Period May through September ......... 100 Figure 4.4-6 Frequency of Reservoir Levels at J.C. Boyle Dam for Summer Flows................................ 100 Figure 4.6-1 Comparison of Gauged Flows at Keno to Modeled Flows in SRH-1D................................ 105 Figure 4.6-2 J.C. Boyle Reservoir Drawdown, Water Year 1966 (Wettest Year) .................................... 108 Figure 4.6-3 J.C. Boyle Reservoir Drawdown, Water Year 2006 (Wet Year) ......................................... 109 Figure 4.6-4 J.C. Boyle Reservoir Drawdown, Water Year 1986 (Wet Year) ......................................... 110 Figure 4.6-5 J.C. Boyle Reservoir Drawdown, Water Year 1970 (Above Normal Year)........................... 111 Figure 4.6-6 J.C. Boyle Reservoir Drawdown, Water Year 1973 (Normal Year) .................................... 112 Figure 4.6-7 J.C. Boyle Reservoir Drawdown, Water Year 1979 (Dry Year) .......................................... 113 Figure 4.6-8 Copco No. 1 Reservoir Drawdown, Water Year 1966 (Wettest Year) ................................ 117 Figure 4.6-9 Copco No. 1 Reservoir Drawdown, Water Year 2006 (Wet Year) ..................................... 118 Figure 4.6-10 Copco No. 1 Reservoir Drawdown, Water Year 1986 (Wet Year) ..................................... 119 Figure 4.6-11 Copco No. 1 Reservoir Drawdown, Water Year 1970 (Above Normal Year) ....................... 120 Figure 4.6-12 Copco No. 1 Reservoir Drawdown, Water Year 1973 (Median Year) ................................ 121 Figure 4.6-13 Copco No. 1 Reservoir Drawdown, Water Year 1979 (Dry Year) ...................................... 122 Figure 4.6-14 Iron Gate Reservoir Drawdown, Water Year 1966 (Wettest Year) .................................... 124 Figure 4.6-15 Iron Gate Reservoir Drawdown, Water Year 2006 (Wet Year).......................................... 125 Figure 4.6-16 Iron Gate Reservoir Drawdown, Water Year 1986 (Wet Year).......................................... 126 Figure 4.6-17 Iron Gate Reservoir Drawdown, Water Year 1970 (Above Normal Year) ........................... 127 Figure 4.6-18 Iron Gate Reservoir Drawdown, Water Year 1973 (Median Year) .................................... 128 Figure 4.6-19 Iron Gate Reservoir Drawdown, Water Year 1979 (Dry Year) .......................................... 129 Figure 4.6-20 Comparison of Flows Downstream of Iron Gate Dam – Water Year 1964 (Model Year
1965) ....................................................................................................................... 134 Figure 4.6-21 Comparison of Flows Downstream of Iron Gate Dam – Water Year 1965 (Model Year
1966) ....................................................................................................................... 135 Figure 4.6-22 Comparison of Flows Downstream of Iron Gate Dam – Water Year 1970 (Model Year
1970) ....................................................................................................................... 136 Figure 4.6-23 Comparison of Flows Downstream of Iron Gate Dam – Water Year 1974 (Model Year
1974) ....................................................................................................................... 137 Figure 4.6-24 Comparison of Flows Downstream of Iron Gate Dam – Water Year 1980 (Model Year
1980) ....................................................................................................................... 138 Figure 4.6-25 Comparison of Flows Downstream of Iron Gate Dam – Water Year 1985 (Model Year
1985) ....................................................................................................................... 139 Figure 4.6-26 Comparison of Flows Downstream of Iron Gate Dam – Water Year 1986 (Model Year
1986) ....................................................................................................................... 140 Figure 4.6-27 Comparison of Flows Downstream of Iron Gate Dam – Water Year 1997 (Model Year
1997) ....................................................................................................................... 141

Definite Plan
14 Table of Contents June 2018
Figure 4.6-28 Comparison of Flows Downstream of Iron Gate Dam – Water Year 2000 (Model Year 2000) ....................................................................................................................... 142
Figure 4.6-29 Comparison of Flows Downstream of Iron Gate Dam – Water Year 2006 (Model Year 2006) ....................................................................................................................... 143
Figure 5.1-1 Project Limits of Work and Access (Appendix C) ............................................................ 153 Figure 5.2-1 J.C. Boyle Dam Removal Features and Limits (Appendix C)............................................. 154 Figure 5.2-2 US97 and Keno Worden Rd ........................................................................................ 157 Figure 5.2-3 Spencer Bridge (OR66) ............................................................................................... 158 Figure 5.2-4 Topsy Grade Road – Causeway Road ........................................................................... 159 Figure 5.2-5 Timber Bridge at J.C. Boyle.......................................................................................... 161 Figure 5.2-6 Power Canal Access Road ........................................................................................... 162 Figure 5.2-7 Right Abutment Access Road ...................................................................................... 163 Figure 5.2-8 J.C. Boyle Right Abutment Disposal Site Plan & Sections (Appendix C)............................. 164 Figure 5.2-9 J.C. Boyle Forebay Spillway Scour Hole Backfill Plan & Sections (Appendix C)................... 164 Figure 5.2-10 J.C. Boyle Dam Removal (Appendix B) .......................................................................... 166 Figure 5.2-11 J.C. Boyle Forebay Backfill Plan and Sections (Appendix C)............................................. 166 Figure 5.2-12 Project Transmission Line Removal (Appendix B)........................................................... 167 Figure 5.3-1 Copco No. 1 and Copco No. 2 Dams Removal Features and Limits (Appendix C) .............. 171 Figure 5.3-2 Copco Road Temporary Structure at Dry Creek ............................................................. 174 Figure 5.3-3 Jenny Creek Bridge .................................................................................................... 175 Figure 5.3-4 Fall Creek Bridge on Copco Road................................................................................. 177 Figure 5.3-5 Fall Creek Bridge Replacement ................................................................................... 177 Figure 5.3-6 Copco Road Bridge..................................................................................................... 179 Figure 5.3-7 Copco Access Road .................................................................................................... 181 Figure 5.3-8 Copco No. 1 & Copco No. 2 Disposal Site Plan & Sections (Appendix C) .......................... 182 Figure 5.3-9 Copco No. 1 Dam Removal (Appendix B) ...................................................................... 183 Figure 5.4-1 Daggett Road Bridge Replacement .............................................................................. 190 Figure 5.4-2 Copco No. 2 Dam Removal (Appendix B) ...................................................................... 192 Figure 5.5-1 Iron Gate Dam Removal Features and Limits (Appendix C) ............................................. 197 Figure 5.5-2 Lakeview Road .......................................................................................................... 198 Figure 5.5-3 Lakeview Road Bridge Replacement ............................................................................ 199 Figure 5.5-4 Iron Gate Disposal Site Plan & Sections (Appendix C) .................................................... 201 Figure 5.5-5 Iron Gate Spillway Backfill Plan & Sections (Appendix C) ................................................ 201 Figure 5.5-6 Iron Gate Dam Removal (Appendix B) .......................................................................... 203 Figure 7.2-1 Total run size estimates for Klamath Basin spring Chinook salmon from 2007-2016. ...... 224 Figure 7.2-2 Estimated natural spring Chinook salmon spawners based on summer resting pool
counts for the Salmon River from 2008-2017............................................................... 225 Figure 7.2-3 Total run size estimates for the fall Chinook salmon for the Klamath Basin from
2007-2016. .............................................................................................................. 227 Figure 7.2-4 Natural fall Chinook salmon spawner estimates in the Klamath River and selected
tributaries from 2011-2016. ....................................................................................... 228 Figure 7.2-5 Total run size estimate for Klamath Basin coho salmon from 2006-2015........................ 229 Figure 7.2-6 Estimates for coho salmon natural spawners in the mainstem Klamath River and
selected tributaries from 2011-2015. .......................................................................... 229 Figure 7.2-7 Returns of coho salmon to the Iron Gate Hatchery from 2011-2016. .............................. 230 Figure 7.2-8 Yearling coho salmon releases from the Iron Gate Hatchery from 2011-2017. ................ 231 Figure 7.2-9 Summer steelhead counts on tributaries to the middle Klamath River from
2006-2015. .............................................................................................................. 232

Definite Plan
June 2018 Table of Contents 15
Figure 7.2-10 Counts of holding summer steelhead on tributaries to the middle Klamath River from 2011-2015. .............................................................................................................. 232
Figure 7.2-11 Video counts of adult steelhead on Bogus Creek, Shasta River, and Scott River from 2007-2016. .............................................................................................................. 233
Figure 7.2-12 Adult steelhead returns to Iron Gate Hatchery from 2007-2016. .................................... 234 Figure 7.2-13 A conceptual model of variables and processes influencing C. shasta infection and
mortality of juvenile Chinook salmon............................................................................ 236 Figure 7.4-1 Copco Road Realignment and Jenny Creek Bridge Replacement .................................... 252 Figure 7.4-2 Temporary Culverts and Detour Road at Camp Creek .................................................... 253 Figure 7.4-3 Temporary Culvert and Detour Road at Scotch Creek .................................................... 254 Figure 7.5-1 City of Yreka Pipeline Crossing .................................................................................... 256 Figure 7.5-2 Alignments for Klamath River Crossing (Appendix C)...................................................... 257 Figure 7.5-3 Profiles for Klamath River Crossing (Appendix C) ........................................................... 257 Figure 7.7-1 Structures in 100-Year Floodplain Following Dam Removal (Appendix C) ......................... 270 Figure 7.7-2 Pedestrian Bridge #1 ................................................................................................. 271 Figure 7.7-3 Pedestrian Bridge #2 ................................................................................................. 272 Figure 7.7-4 Rail Road Bridge ........................................................................................................ 273 Figure 7.8-1 Iron Gate Hatchery ..................................................................................................... 276 Figure 7.8-2 Conceptual Layout of Iron Gate Hatchery Improvements ................................................ 279 Figure 7.8-3 Bogus Creek Continuous Water Temperature for 2015 (CDFW) ...................................... 288 Figure 7.8-4 Conceptual Layout of Fall Creek Hatchery Improvements ............................................... 290 Figure 7.8-5 Potential Settling Pond Locations for FCH..................................................................... 293 Figure 8.6-1 Summary Construction Schedule................................................................................. 306
Acronyms and Abbreviations ACHP Advisory Council on Historic Preservation ACM Asbestos Containing Material ADA Americans with Disabilities Act AR Aquatic Resources ATWG Aquatic Technical Work Group BCE before the Common Era BLM Bureau of Land Management CA California Caltrans California Department of Transportation CDFW California Department of Fish and Wildlife CDM Camp Dresser and McKee CE California Endangered CEII Critical Energy/Electric Infrastructure Information CEQA California Environmental Quality Act CESA California Endangered Species Act cfs cubic feet per second

Definite Plan
16 Table of Contents June 2018
CFM Cubic Feet per Minute CFR Code of Federal Regulations CHP California Highway Patrol CHR Cultural and Historic Resources CMP Corrugated Metal Pipe CNDDB California Natural Diversity Database COD Chemical Oxygen Demand CORP Central Oregon and Pacific Railroad CRHR California Register of Historical Resources CSSC California Species of Special Concern CT California Threatened CWT coded wire tag CY cubic yards D Diameter DDT Dichlorodiphenyltrichloroethane DEM Digital Elevation Model DRE Dam Removal Entity DSOD California Division of Safety of Dams DSSMP Dam Safety Surveillance and Monitoring Plan DWR California Department of Water Resources EAP Emergency Action Plans EIR Environmental Impact Report EIS/R Environmental Impact Statement/Report EM Engineering Manual EPA Environmental Protection Agency ESA Endangered Species Act ESU Evolutionarily significant unit FC Federal Candidate Species FE Federal Endangered FEMA Federal Emergency Management Agency FERC Federal Energy Regulatory Commission FP Fully protected FSC Federal Species of Concern FT Federal Threatened ft2 feet squared GHG Green House Gas GIS Geographic Information System

Definite Plan
June 2018 Table of Contents 17
GPS Global Positioning System GW Groundwater H Horizontal HABS Historic American Building Survey HAER Historic American Engineering Record HALS Historic American Landscape Survey HEC-RAS Hydrologic Engineering Center River Analysis System HGMP Hatchery and Genetics Management Plan hp horsepower I Interstate IEV Invasive Exotic Vegetation IGH Iron Gate Hatchery IM Interim Measure IPaC Information for Planning and Conservation JPBO Joint Preliminary Biological Opinion KBMP Klamath Basin Monitoring Program KBRA Klamath Basin Restoration Agreement KHHD Klamath Hydroelectric Historic District KHP Klamath Hydroelectric Project (FERC Project no. 2082) KHSA Klamath Hydroelectric Settlement Agreement (2010, as amended 2016) KIP Klamath Irrigation Project KRRC Klamath River Renewal Corporation kV kilovolt kVA kilovolt amperes KWAPA Klamath Water and Power Authority lb pound LBP Lead Based Paint LiDAR Light Detection and Ranging LKP Lower Klamath Project MBTA Migratory Bird Treaty Act MOA Memorandum of Agreement MPH Most Probable High MPL Most Probable Low MVA Megavolt-amperes MW Megawatt N/A Not Applicable NAGPRA Native American Graves Protection and Repatriation Act

Definite Plan
18 Table of Contents June 2018
NAHC Native American Heritage Commission NAVD North American Vertical Datum NISIMS National Invasive Species Information Management System NGVD National Geodetic Vertical Datum NMFS National Marine Fisheries Service No. Number NPDES National Pollutant Discharge Elimination System NRHP National Register of Historic Places NSO Northern Spotted Owl NW Northwest OC Candidate listing by ODA ODA Oregon Department of Agriculture ODC Other Direct Cost ODEQ Oregon Department of Environmental Quality ODFW Oregon Department of Fish and Wildlife ODOT Oregon Department of Transportation OE Listed as endangered by ODA or ODFW ONHP Oregon Natural Heritage Program OR Oregon ORBIC Oregon Biodiversity Information Center ORS Oregon Revised Statute OSS Oregon Sensitive Species OT Listed as threatened by ODFW OWRD Oregon Water Resources Department PAH Polynuclear aromatic hydrocarbons PCB Polychlorinated biphenyls PFMA Potential Failure Modes Analysis PIT Passive Integrated Transponder PRO Partial Removal Option QA Quality Assurance QAP Quality Assurance Plan QC Quality Control QCIP Quality Control Inspection Program RL Reporting limit RM River Mile RSET Regional Sediment Evaluation Team RSL Regional screening levels

Definite Plan
June 2018 Table of Contents 19
RT Round Trip RV Recreational Vehicle RWQCB Regional Water Quality Control Board RWS Reservoir Water Surface SAP Sampling Analysis Plan SE Southeast SEF Sediment Evaluation Framework SDOR Secretarial Determination Overview Report SIR Supplemental Information Report SL Screening level SLV Screening level values SONCC Southern Oregon Northern California Coast sUAS Small Unmanned Aircraft System SVOC Semi-volatile organic compound SWPPP Storm Water Pollution Prevention Plan SWRCB California State Water Resources Control Board SPT Standard Penetration Test TCPs Traditional Cultural Properties TER Terrestrial Resources TMP Transportation Management Plan TSS Total Suspended Sediments UKBCA Upper Klamath Basin Comprehensive Agreement U.S. United States USACE United States Army Corps of Engineers USBR United States Bureau of Reclamation USFS United States Forest Service USFWS United States Fish and Wildlife Service USGS United States Geological Survey V Vertical VOC Volatile organic compound WQ Water Quality WSE Water Surface Elevation WUMA Water User Mitigation Authority WY Water Year

Definite Plan
20 Table of Contents June 2018
Definitions The following definitions are provided for use throughout this report:
• Decommissioning means PacifiCorp’s physical removal from a facility of any equipment and personal property that PacifiCorp determines has salvage value, and physical disconnection of the facility from PacifiCorp’s transmission grid. KHSA section 1.4.
• Detailed Plan means U.S. Bureau of Reclamation Detailed Plan for Dam Removal – Klamath River Dams – Klamath Hydroelectric Project – FERC License No. 2082 – Oregon-California (July 2012). See also KHSA section 7.2.2.
• 2012 EIS/R means U.S. Department of the Interior and California Department of Fish and Wildlife, Klamath Facilities Removal: Final Environmental Impact Statement/Environmental Impact Report (December 2012), State Clearinghouse # 2010062060.
• Facilities Removal means physical removal of all or part of each of the Facilities to achieve at a minimum a free-flowing condition and volitional fish passage, site remediation and restoration, including previously inundated lands, measures to avoid or minimize adverse downstream impacts, and all associated permitting for such actions. KHSA section 1.4. For this purpose, Facilities are: Iron Gate Dam, Copco No. 1 Dam, Copco No. 2 Dam, J.C. Boyle Dam, and appurtenant works currently licensed to PacifiCorp. KHSA section 1.4.
• Klamath Hydroelectric Project means FERC Project No. 2082. As originally licensed, the project consisted of eight developments: East Side, West Side, Keno, Fall Creek, J.C. Boyle, Copco No. 1, Copco No. 2, and Iron Gate, and appurtenant works. Federal Power Commission, “In the Matters of the California Oregon Power Company,” 13 FPC 1 (January 28, 1954), as amended by “Order Adopting Decision of Presiding Examiner,” 23 FPC 59 (January 13, 1960). In 2018 FERC amended the license for this project to remove J.C. Boyle, Copco No. 1, Copco No. 2, and Iron Gate Developments and appurtenant works. FERC, “Order Amending License and Deferring Consideration of the Transfer Application,” 162 FERC 61,236 (March 15, 2018).
• Klamath River Renewal Project means Facilities Removal consistent with the terms of the KHSA.
• Lower Klamath Project means the J.C. Boyle, Copco No. 1, Copco No. 2, and Iron Gate Developments and appurtenant works. FERC has stayed the effectiveness of the license for the Lower Klamath Project, pending its final action on the transfer application. The Definite Plan uses the term Lower Klamath Project for ease of reference. See, “Order Granting Stay and Dismissing Request for Rehearing,” 163 FERC 61,208 (June 21, 2018). The Definite Plan uses the term “Lower Klamath Project” for ease of reference.

Definite Plan
June 2018 Table of Contents 21
Executive Summary

Definite Plan
22 Table of Contents June 2018
This page intentionally left blank.

Definite Plan
June 2018 Table of Contents 23
EXECUTIVE SUMMARY The Definite Plan for the Lower Klamath Project prepared by the Klamath River Renewal Corporation (KRRC) implements the Klamath Hydroelectric Settlement Agreement (2010, as amended 2016) (KHSA). The KHSA resolved disputes among numerous parties regarding the relicensing of the Klamath Hydroelectric Project (FERC No. 2082) (KHP). The parties include: U.S. Departments of Interior and Commerce; States of California and Oregon; Humboldt County, California; Yurok and Karuk Tribes; Upper Klamath Water Users Association; conservation and fishing groups; and PacifiCorp, as the licensee for the KHP.
In the KHSA, the parties agreed to a process whereby PacifiCorp and a dam removal entity, now KRRC, would apply to the Federal Energy Regulatory Commission (FERC) to split the KHP into two projects, the KHP and the Lower Klamath Project, and proceed with the actions necessary to achieve dam removal, a free-flowing condition on the Klamath River, and volitional fish passage. The KHP was constructed between 1911 and 1962 and includes eight developments: East Side, West Side, Keno (non-generating), J.C. Boyle, Copco No. 1, Copco No. 2, Fall Creek, and Iron Gate. PacifiCorp operated the KHP under a 50-year license issued by FERC, until the license expired in 2006. PacifiCorp continues to operate the developments under an annual license.
In September 2016, PacifiCorp and KRRC submitted an application to FERC to amend the existing license for the KHP, establish an original license for the Lower Klamath Project consisting of four developments (J.C. Boyle, Copco No. 1, Copco No. 2, and Iron Gate), and transfer the original license for the Lower Klamath Project to the KRRC. At that time, the KRRC also applied to surrender the license for the Lower Klamath Project, including removal of the four developments. Now that the applications have been filed, KRRC is moving forward with the Definite Plan in accordance with Section 7.2 of the KHSA.
Proposed Action
The KRRC proposes to remove four hydroelectric developments: J.C. Boyle, Copco No. 1, Copco No. 2, Iron Gate, along with appurtenant facilities (the Project). The purpose of the Project is to achieve a free-flowing condition and volitional fish passage in the Klamath River, in the reaches currently occupied by these developments (river miles 193.1 to 234.1). Under the KHSA, the Project consists of measures to remove the four developments; remediate and restore the reservoir sites; avoid or minimize adverse impacts downstream; assure completion of the Project with committed funds; and avoid damages and liabilities for PacifiCorp, the States, and third parties. The Project also proposes a schedule for decommissioning of the developments, which may commence on January 1, 2021 without payment to PacifiCorp for foregone power generation, and subsequent removal.
As outlined in Section 7.2 of the KHSA, KRRC’s Definite Plan provides a comprehensive statement of the methods and other specifications to implement the Project. The Definite Plan states the scientific and engineering analyses that support those specifications. The Definite Plan will be a basis for FERC’s hearing of the license transfer application for the Lower Klamath Project, subsequent hearing of the surrender

Definite Plan
24 Table of Contents June 2018
application, reviews by other regulatory agencies with jurisdiction over certain portions of the Project, and public comment. KRRC expects to revise the Definite Plan over the next year, as a result of (1) regulatory hearings; (2) the engagement of a Board of Consultants, required by FERC to provide an independent review, starting in August 2018; and (3) the KRRC’s engagement of a general contractor, as well as insurers and similar entities for risk management, by early 2019. The KRRC will propose to incorporate the Definite Plan, in its final form, into all regulatory authorizations, including license surrender, to implement the Project.
Definite Plan Components
The Definite Plan is comprised of nine Sections, seventeen appendices, and numerous figures and tables:
• Section 1 describes the KRRC’s objective for the Definite Plan and provides a Project description and background, corrections to elevation and river miles from previous documents, and document organization.
• Section 2 describes the existing features and developments of the four dams and their powerhouses.
• Section 3 provides an explanation of KRRC’s proposed program to comply with FERC dam safety requirements and engineering guidelines.
• Section 4 describes the drawdown facilities, process, flows and sediment releases, anticipated downstream effects, monitoring, and adaptive management measures.
• Section 5 describes the removal limits, construction access, staging and disposal areas, removal process, demolition methods and equipment, imported materials, and waste disposal for the four dams and powerhouses.
• Section 6 describes the restoration plan for the former reservoir areas and other areas disturbed by the Project.
• Section 7 describes other features of the Project including proposed aquatic and terrestrial resources measures, long-term road improvements, City of Yreka water supply infrastructure improvements, recreation facilities demolition/restoration, and other resource management plans.
• Section 8 provides the latest understanding of project costs and construction schedules.
• Section 9 provides citations for references used in the Definite Plan document.
• The appendices, figures and tables are listed in the table of contents of the Definite Plan.

Definite Plan
June 2018 Table of Contents 25
Chapter 1: Objectives and Background

Definite Plan
26 01 | Objectives and Background June 2018
This page intentionally left blank.

Definite Plan
June 2018 01 | Objectives and Background 27
1. OBJECTIVES AND BACKGROUND 1.1 Objectives This Definite Plan for the Lower Klamath Project (Definite Plan) provides information that the Federal Energy Regulatory Commission (FERC) requires to act on the transfer and surrender applications for the Lower Klamath Project. The Definite Plan serves as a basis for all other regulatory approvals required to implement the Klamath Hydroelectric Settlement Agreement (2010, as amended 2016) (KHSA). The Definite Plan is consistent with the requirements of Section 7.2 of the KHSA.
The Klamath basin’s hydrologic system consists of a complex of inter-connected rivers, lakes, marshes, dams, diversions, wildlife refuges, and wilderness areas. Alterations to the natural hydrologic system began in the late 1800s, accelerating in the early 1900s, including water diversions by private water users, water diversions by and to the United States Bureau of Reclamation’s (USBR) Klamath Irrigation Project and by hydroelectric developments operated by PacifiCorp.
PacifiCorp’s Klamath Hydroelectric Project (KHP) (FERC No. 2082) was constructed between 1911 and 1962. The KHP included eight developments: East Side, West Side, Keno (non-generating), J.C. Boyle, Copco No. 1, Copco No. 2, Fall Creek, and Iron Gate. PacifiCorp operated the KHP under a 50-year license issued by FERC, until the license expired in 2006. PacifiCorp continues to operate the developments under an annual license. In March 2018, FERC amended the KHP license to remove four developments (J.C. Boyle, Copco No. 1, Copco No. 2, and Iron Gate), which now comprise the Lower Klamath Project. In June 2018, FERC stayed the effective date of the Lower Klamath Project license pending its final decision on the joint license transfer request. As noted in the definitions above, the term “Lower Klamath Project” is used in this document for ease of reference.
The KRRC proposes to decommission and remove the Lower Klamath Project consistent with the terms of the KHSA (the Project). This Definite Plan provides the blue print to achieve this purpose. The Definite Plan delineates the (i) methods to be undertaken to effect dam removal and a timetable for dam removal; (ii) plans for management, removal, and disposal of sediment, debris, and other materials; (iii) plans for site remediation and restoration; (iv) plans for measures to avoid or minimize adverse downstream impacts; (v) a plan for compliance with all applicable laws; (vi) a detailed statement of the estimated costs of dam removal; and (vii) measures to reduce risks of cost overruns, delays, or other impediments to dam removal. The purpose of the Project is to provide for a free-flowing river with volitional fish passage from Keno Dam to the Pacific Ocean.
Figure 1.2-1 provides an overview of the Klamath River watershed and the locations of the four dams. Figure 1.2-2 (Appendix C) provides an overview of the Project area and the major access routes to the area.

Definite Plan
28 01 | Objectives and Background June 2018
Figure 1.1-1 Klamath River Watershed and Development Locations
Figure 1.1-2 Project Vicinity and Access (Appendix C)

Definite Plan
June 2018 01 | Objectives and Background 29
1.2 Project Description The KRRC proposes a Project which is the physical removal of the four dam developments of the Lower Klamath Project (Iron Gate, Copco No. 1 and No. 2, and J.C. Boyle), consistent with the terms of the KHSA, to achieve at a minimum a free-flowing condition and volitional fish passage. The Project also includes site remediation and restoration, including previously inundated lands, and measures to avoid or minimize adverse downstream impacts, and all associated permitting for such actions. The Project is located on the Klamath River approximately 200 miles from the Pacific Ocean in the states of Oregon and California (see Figure 1.1-1).
The Definite Plan describes “Full Removal” as the proposed Project. Full Removal involves the complete removal of dams, power generation facilities, water intake structures, canals, pipelines, and ancillary buildings, of the Lower Klamath Project. The Definite Plan also describes a “Partial Removal” alternative for purposes of environmental review. Under the Partial Removal alternative, portions of each dam could remain in place, along with ancillary buildings and structures such as powerhouses, foundations, tunnels, and pipes, while still achieving the project purpose to achieve a free-flowing condition and volitional fish passage.
Prior to removal of the hydropower developments, KRRC (through its contractor) will draw down the water surface elevation in each reservoir as low as possible to facilitate accumulated sediment evacuation and to create a dry work area for development removal activities. Section 4 describes the drawdown timing and duration, as well as any infrastructure modifications necessary to facilitate drawdown. In general, drawdown will begin on or about January 1, 2021, and will extend through March 15, 2021.
After drawdown is accomplished, remaining reservoir sediments will be stabilized to the extent feasible, as described in Section 6, and dam and hydropower development removal will begin. Section 5 details the development removal and summarizes pertinent activities, material volumes, truck trips and other construction means and methods information.
Full reservoir area restoration will also be accomplished as described in Section 6, and will begin after drawdown, and extend throughout the year, and possibly extend into the subsequent year. Vegetation establishment could extend several years.
Other key project components include measures to reduce project-related effects to aquatic and terrestrial resources, road and bridge improvements, relocation of the City of Yreka’s pipeline across Iron Gate Reservoir and associated diversion facility improvements, demolition of various recreation facilities adjacent to the reservoirs, recreation improvements, downstream flood control improvements, groundwater system improvements, water supply improvements, fish hatchery modification and improvements, and measures to protect identified historic, cultural, and tribal resources. Section 7 summarizes these other project components.
Since the development of the Detailed Plan by USBR as part of the 2012 EIS/R process, the KRRC assessed whether the new information resulted in any changes to the project description as new information became

Definite Plan
30 01 | Objectives and Background June 2018
available. The numbered list below, and further detailed in the referenced sections of this document, summarizes changes or refinements to the project description relative to the Detailed Plan resulting from new information or analyses.
1. Copco No. 1 Dam Modifications: The Detailed Plan (USBR 2012b) included sequential dam notching activities as part of the reservoir drawdown. Due to constructability and schedule risks associated with this activity, it is no longer the preferred plan for demolition of the Copco No. 1 development. The modification activities at Copco No. 1 now include a larger new gate installed on the downstream end of the existing diversion tunnel, to be used as the primary mechanism for reservoir drawdown. Sections 5.2 and 4 provide additional detail on the refined approach and the issues associated with the discarded notching option.
2. Maximum Reservoir Drawdown Rate: Based on the stability analyses and assessments in Appendices D and E, the maximum recommended drawdown rate is 5 feet per day. Section 4 describes associated drawdown plans for each development.
3. Material Quantities: Material quantities have been refined and updated to reflect the latest understanding of the work. Sections 5.2, 5.3, 5.4 and 5.5 summarize material quantities in text and table format for each development.
4. Partial Removal Alternatives: While KRRC proposes full removal at each development location, an alternative for leaving some existing infrastructure is included as an alternative for purposes of environmental review. A list of these alternatives is included in table format at the beginning of Sections 5.2, 5.3, 5.4 and 5.5.
5. Aquatic and Terrestrial Resource Measures: Aquatic and terrestrial resource measures have been refined from the previous AR and TER mitigation measures included in the 2012 EIS/R (USBR and CDFW 2012), and these measures are now included in the project description. The refinement process included collaboration with state and federal fisheries, other biological resource agencies, and tribes, to develop measures that have the highest potential to reduce project-related effects, using the latest science and case studies available. Sections 7.2 and 7.3, with further detail provided in Appendices I and J, summarize the measures.
6. Road and Bridge Improvements: Field and technical assessments concerning road and bridge improvements required for construction access, or to address project-related effects, have updated the understanding of what is required for the Project. Section 5 summarizes refined construction access improvements, while Section 7.4 summarizes road improvements required to address project-related effects.
7. City of Yreka Waterline Relocation: The Detailed Plan (USBR 2012b) included an overhead pipe bridge as the pipeline relocation solution for the Project. Due to ongoing technical assessments and discussions with the City of Yreka, there are three possible options for waterline relocation included in this document. Section 7.5 describes each option that KRRC will analyze for possible implementation.
8. Recreation Facilities Removal and Development Plan: The Project includes demolishing existing recreation facilities and restoring the areas to native habitat, and the Project will provide new

Definite Plan
June 2018 01 | Objectives and Background 31
recreation facilities. Section 7.6 provides additional information on the recreation facilities and proposed recreation plan.
9. Downstream Flood Control Improvements: For those habitable structures and river crossings downstream along the Klamath River that the Project will impact, flood control improvements will be constructed to maintain the current level of flood control. See additional information provided in Section 7.7.
10. Fish Hatchery Improvements: The Project will implement the agency-developed hatchery plan to meet agency expectations and requirements associated with fish production. See additional information provided in Section 7.8.
11. Cultural Resources Plan: The Project will comply with all local, state, and federal laws, including those for cultural and tribal resources. Section 7.9 and Appendix L outline the plan for compliance.
To the extent that there is conflicting information in this document relative to the 2012 Detailed Plan, the information in this document supersedes the information in the Detailed Plan.
1.2.1 Project Area and Other Definitions
The Definite Plan and appendices use several terms to describe the location of the Project in its environs. The following summarizes these terms and their uses in the Definite Plan.
• Project area: refers to the area defined by the boundaries of the Lower Klamath Project. Such boundaries encompass lands and waters between the upper reach of J.C. Boyle Reservoir (RM 234.1) and the toe of Iron Gate Dam (RM 193.1). This definition of Project area is used for purposes of the Definite Plan. It may be revised for purposes of environmental review under the National Environmental Policy Act, the California Environmental Quality Act, or other applicable laws, in future procedures.
• Limits of work: refers to the physical extent of on-the-ground construction activities (i.e., demolition and removal) and restoration activities proposed as part of the Project, to occur within the Project area.
• Construction area: refers to areas where construction activities will occur in the Project area.
• Action area: this term has a specific meaning under Section 7(a)(2) of the Endangered Species Act and will be defined in the biological assessment.
• Area of Potential Effects: this term has a specific meaning under the Section 106 of National Historic Preservation Act and will be defined in the appropriate Section 106 document.

Definite Plan
32 01 | Objectives and Background June 2018
1.3 Compliance with Applicable Laws The following text summarizes the KRRC’s plan for compliance with applicable laws and regulations. This portion of the Definite Plan is responsive to the requirements of Section 7.2.2 E of the KHSA.
1.3.1 Federal
Federal Power Act
Pursuant to Sections 7.1.5 and 7.1.7 of the KHSA, on September 23, 2016 PacifiCorp and KRRC filed a “Joint Application for Approval of License Amendment and License Transfer” (Transfer Application) seeking a separate license for the J.C. Boyle, Copco No. 1, Copco No. 2, and Iron Gate developments (the Lower Klamath Project) and to transfer the license for the Lower Klamath Project from PacifiCorp to KRRC. Concurrently with this filing, the KRRC filed an Application for Surrender of License for Major Project and Removal of Project Works (Surrender Application) seeking FERC’s approval of an application to surrender the license for the Lower Klamath Project and to achieve, by implementation of the Definite Plan, a free-flowing condition and volitional fish passage through the portions of the Klamath River that are currently occupied by the Lower Klamath Project.
FERC noticed the Transfer Application and the Surrender Application on November 10, 2016. FERC initiated informal consultation with: (a) the U.S. Fish and Wildlife Service (USFWS) and National Marine Fisheries Service (NMFS) under Section 7 of the Endangered Species Act and the joint agency implementing regulations at 50 C.F.R. Part 402; (b) NMFS under Section 305(b) of the Magnuson-Stevens Fishery Conservation and Management Act and implementing regulations at 50 C.F.R. § 600.920; and (c) the California and Oregon State Historic Preservation Officers, as required by Section 106 of the National Historic Preservation Act, and the implementing regulations of the Advisory Council on Historic Preservation at 36 C.F.R. Part 800. FERC also designated PacifiCorp and the KRRC as the Commission’s non-federal representatives for carrying out informal consultation, pursuant to Section 7 of the Endangered Species Act, Section 305(b) of the Magnuson-Stevens Fishery Conservation and Management Act, and Section 106 of the National Historic Preservation Act and the Advisory Council’s regulations at 36 C.F.R. § 800.2(c)(4). KRRC is undertaking such consultations as the non-federal representative.
On March 15, 2018, FERC amended the KHP license. It created the Lower Klamath Project, consisting of J.C. Boyle, Copco No. 1, Copco No. 2, and Iron Gate Developments. On June 21, 2018, FERC stayed the effectiveness of the license for the Lower Klamath Project, pending its final action on the transfer application. The Definite Plan uses the term Lower Klamath Project for ease of reference.
Transfer Application
In making its decision on the Transfer Application, FERC will evaluate and determine whether KRRC is qualified to be a licensee and whether the transfer of the License from PacifiCorp to KRRC is in the public interest (18 C.F.R. § 9.3). FERC may impose conditions relating to the KRRC’s legal, technical, and financial capacity to fulfill its responsibilities as a licensee. KRRC will accept the license subject to Section 7.1.4 of

Definite Plan
June 2018 01 | Objectives and Background 33
the KHSA, which provides that “[b]efore the FERC license transfer to the DRE [Dam Removal Entity] will become effective, the DRE must demonstrate to PacifiCorp’s and the States’ reasonable satisfaction that the DRE has met the obligations in KHSA Appendix L and the following conditions:
A. The DRE has provided Notices required under Section 7.2.1.B of the KHSA;
B. The DRE has met the requirements of Section 7.1.3 and Appendix L of the KHSA;
C. PacifiCorp and the States agree that the DRE has made sufficient and Timely progress in obtaining necessary permits and approvals to effectuate Facilities Removal;
D. The DRE, the States, and PacifiCorp are assured that sufficient funding is available to carry out Facilities Removal;
E. The DRE, the States, and PacifiCorp are each assured that their respective risks associated with Facilities Removal have been sufficiently mitigated consistent with Appendix L of the KHSA;
F. The DRE, the States, and PacifiCorp agree that no order of a court or FERC is in effect that would prevent Facilities Removal;
G. The DRE and PacifiCorp have executed documents conveying the property and rights necessary to carry out Facilities Removal; and
H. The DRE accepts license transfer under the conditions specified by FERC in its order approving transfer.”
If the conditions of transfer are acceptable to KRRC and satisfy the above requirements to the reasonable satisfaction of PacifiCorp and the States, KRRC will accept the license and comply with all terms and conditions of the license and the transfer order in connection with its implementation of the Definite Plan.
Surrender Application
In taking action on the Surrender Application, FERC will evaluate and determine whether surrender and decommissioning are in the public interest. It has the authority to impose conditions necessary to protect the public interest in connection with project decommissioning and, as in this case, dam removal. However, there is generally no public interest in keeping a decommissioned project under the Commission's jurisdiction for an extended time. Surrender is not effective upon the issuance of a surrender order, but when the licensee fulfills all the conditions of the surrender order. KRRC expects that implementation of the Definite Plan (as proposed) is in the public interest and does not anticipate that FERC will impose any conditions that conflict with, or are inconsistent with the Definite Plan. Additionally, Section 7.1.8 of the KHSA states: “The DRE will perform Facilities Removal in accordance with the Definite Plan, as approved and as may be modified by the FERC surrender order and other applicable Regulatory Approvals.”

Definite Plan
34 01 | Objectives and Background June 2018
On October 5, 2017, FERC issued a directive to PacifiCorp and KRRC to convene an Independent Board of Consultants (BOC) to review and assess various aspects of the proposed dam removal process. FERC approved the BOC on May 22, 2018. The BOC is a six-member fully independent body that includes three members with experience in civil engineering (with specialized experience in dam construction and removal of both concrete and embankment dams, hydrology, hydraulics, and stream diversion) and geotechnical engineering. In addition, the BOC includes members with experience in aquatic and terrestrial biology, and a heavy civil construction cost estimator with experience in dam removal and restoration activities. KRRC anticipates that the BOC will commence its review of the Definite Plan in August of 2018. Initially, the BOC is called upon to review and provide recommendations regarding the adequacy of available funding and reasonableness of updated cost estimates for the most probable cost and maximum cost for implementation of the Definite Plan. The BOC is also called upon to review and provide recommendations regarding the adequacy of amounts and types of insurance coverage and bonding arrangements for dam removal, and to review and provide recommendations regarding other technical aspects of the Definite Plan to better define and understand the plans, schedules, specifications, staging, and sequencing for taking on the responsibilities for dam removal and decommissioning of the Lower Klamath Project. KRRC will incorporate the BOC recommendations into a revised Definite Plan and will provide FERC with a greater level of detail of the various project elements proposed in the Definite Plan. These recommendations will build upon and improve the Definite Plan and assist KRRC in maintaining compliance with the Federal Power Act, and in particular, FERC dam safety requirements and engineering guidelines.
FERC’s decision on the Surrender Application requires compliance with additional regulatory requirements. Section 7.1.4 of the KHSA requires that before the FERC license transfer to KRRC will become effective, the KRRC must demonstrate to PacifiCorp’s and the States’ reasonable satisfaction that the KRRC has made sufficient and timely progress in obtaining necessary permits and approvals to effectuate Facilities Removal. As a means to provide such assurances to PacifiCorp and the States with respect to the following requirements, KRRC will pursue a proactive approach with each agency to develop draft terms and conditions of approval that are consistent with the Definite Plan.
National Environmental Policy Act (NEPA):
FERC will act as lead agency for purposes of securing compliance with NEPA. In order to provide FERC sufficient information to undertake environmental review, KRRC provided FERC as part of its Surrender Application “Exhibit E” (Environmental Report) comprised of: the Klamath Facilities Removal Environmental Impact Statement/Report (2012), published by the U.S. Department of Interior and California Department of Fish and Wildlife; the Klamath Dam Removal Overview Report for the Secretary of the Interior: An Assessment of Science and Technical Information (2013); the Detailed Plan for Dam Removal – Klamath River Dams, Klamath Hydroelectric Project, FERC License No. 2082, Oregon – California (2012); and a contact list for property owners pursuant to 18 C.F.R. § 4.32(a)(3). This “Exhibit E” information is supplemented by this Definite Plan (updating, replacing and superseding the 2012 Detailed Plan) and KRRC’s responses to FERC’s July 14, 2017 Request for Additional Information. KRRC intends to further supplement Exhibit E with the Draft Environmental Impact Report (EIR) being prepared by the California State Water Resources Control Board (SWRCB) in compliance with the California Environmental Quality Act (CEQA). The plan and schedule approved by FERC for the BOC states that if the Commission approves the
Definite Plan
June 2018 01 | Objectives and Background 35
transfer, FERC will issue a public notice of the surrender application inviting comments, interventions, and protests. Based on any comments received, FERC will then determine if there is a need to further supplement the environmental record.
Section 401 of the Clean Water Act (CWA):
Activities that may result in any discharge into navigable waters require certification from the State in which the discharge will originate that any such discharge will comply with the applicable provisions of the Clean Water Act (CWA) (i.e., effluent limitations, other limitations necessary to assure compliance with provisions of the CWA, and appropriate state law requirements). No federal license or permit shall be granted until the water quality certification required by Section 401 of the CWA has been obtained from the state agency authorized to administer the CWA. Appropriate conditions of a water quality certification as determined by such state agency are binding upon FERC, and FERC must include them in the surrender order. See generally, PUD No. 1 of Jefferson City. v. Washington Dep't of Ecology, 511 U.S. 700 (1994).
KRRC has requested a water quality certification from the SWRCB and from the Oregon Department of Environmental Quality (ODEQ). Both agencies have released draft certifications for public comment. Before it can issue a water quality certification, the SWRCB, as lead agency in California, must also comply with the requirements of CEQA.
On May 23, 2018, ODEQ issued a proposed water quality certification identifying the requirements of state and federal law that are applicable to the certification. The proposed certification states that the Project, as proposed, will comply with the applicable provisions of Sections 301, 302, 303, 306 and 307 of the Clean Water Act, Oregon Administrative Rules, Chapter 340, Division 41 and other appropriate requirements of state law, provided KRRC conducts activities as proposed and implements the Section 401 conditions proposed in the certification.
On June 7, 2018, SWRCB issued a draft water quality certification identifying the requirements of state and federal law that are applicable to the certification. The draft certification states that the Project, as proposed, will comply with Sections 301, 302, 303, 306, and 307 of the CWA, and with applicable requirements of California State law, provided KRRC conducts activities as proposed and implements the Section 401 conditions proposed in the certification.
Exhibit E to KRRC’s Surrender Application and the Definite Plan, as augmented by additional information that was requested and provided to the SWRCB, provide a basis for CEQA compliance. SWRCB is developing a draft EIR that will be released for public review and comment in 2018. Prior to drafting final conditions for certification and taking a final action on the certification application, SWRCB will consider public comments, issue and certify a final EIR, and make relevant CEQA findings. KRRC will submit comments on the Draft EIR, as appropriate. As noted above, KRRC will also file the Final EIR with FERC as a supplement to Exhibit E to KRRC’s Surrender Application.

Definite Plan
36 01 | Objectives and Background June 2018
Endangered Species Act and Magnuson-Stevens Fishery Conservation and Management Act:
KRRC is serving as FERC’s designated non-federal representative for carrying out informal consultation with the USFWS and NMFS under Section 7 of the Endangered Species Act and with NMFS under Section 305(b) of the Magnuson-Stevens Fishery Conservation and Management Act. The KRRC is working informally with NMFS and USFWS to confirm species lists, the definition of the proposed action, identification of the Action Area, effects analysis methods, environmental baseline conditions, and to identify the best available science. These compliance efforts are ongoing. The complete list of terrestrial federal and state-listed, proposed, candidate, and petitioned for listing species that are known to occur or that may be present in the Action area is found in Appendix J. Identification of critical habitat and essential fish habitat that may be present in the Project Area will be described in a Biological Assessment that KRRC will submit to USFWS and NMFS in 2018.
KRRC anticipates that any measures that may be determined by the U.S. Fish and Wildlife Service and NMFS to comply with the Endangered Species Act and the Magnuson-Stevens Fishery Conservation and Management Act will be consistent with the Definite Plan and that FERC will include them in the surrender order. Sections 6, 7.2, 7.3, 7.8, and Appendices H, I, and J of the Definite Plan are responsive to these regulatory requirements.
National Historic Preservation Act
KRRC is serving as FERC’s designated non-federal representative for carrying out consultation with the California and Oregon State Historic Preservation Officers (SHPOs), Tribal Historic Preservation Officers (THPOs), and other interested parties as required by Section 106 of the National Historic Preservation Act (NHPA). These efforts are ongoing. The information provided in Appendix L discusses efforts to comply the NHPA and its regulatory requirements.
Native American Graves Protection and Repatriation Act
The Native American Graves Protection and Repatriation Act (NAGPRA), 32 U.S.C.§ 3001, et seq. establishes the ownership of cultural items excavated or discovered on federal or tribal land lies with the lineal descendants and culturally affiliated Indian tribes and Native Hawaiian organizations and, among other things, establishes procedures for the inadvertent discovery or planned excavation of Native American cultural items on federal or tribal lands. Information on compliance with NAGPRA is included in Appendix L.
Section 404 of CWA
Implementation of the Definite Plan will result in fill and/or dredging of jurisdictional waters of the United States, including wetlands, within and adjacent to the Klamath River during construction activities. These activities will require a Section 404 individual permit from the United States Army Corps of Engineers (USACE).
KRRC representatives attended a pre-application meeting with the USACE on May 25, 2017, and KRRC is providing periodic informal updates to the USACE’s assigned project manager. At this juncture, USACE has

Definite Plan
June 2018 01 | Objectives and Background 37
not identified any issues that give rise to any concern that the USACE cannot issue an individual permit on terms and conditions that are consistent with the Definite Plan. KRRC believes that the preferred and best means to achieve this result is to continue pre-application meetings and discussion with the USACE, and to review a draft application with the USACE when KRRC is ready to do so. The application may be available for submittal in mid-to-late 2018, although KRRC has not established a firm date for a submittal. Issuance of a Section 404 individual permit by the USACE is contingent upon the issuance of the 401 water quality certifications, completing the Section 106 consultation, as well as the completion of Section 7 consultation with USFWS and NMFS. KRRC will pursue a proactive approach with USACE and seek to develop draft terms and conditions of approval that are consistent with the Definite Plan and can be shared with the States and PacifiCorp.
Section 402 of CWA
Implementation of the Definite Plan will require coverage under National Pollutant Discharge Elimination System (NPDES) Construction Stormwater General Permits for construction-related stormwater discharges to surface waters in California and Oregon. NPDES permit applications for general construction stormwater discharges are required to be submitted at least 30 days prior to commencement of land disturbance. The selected dam removal construction contractor will likely prepare the applications by February of the year prior to reservoir drawdown, with submission to each state agency planned for the end of March in the year that pre-drawdown construction activities are planned to occur. KRRC does not anticipate any significant issues or concerns in connection with securing and complying with these permits.
Section 10 of the Rivers and Harbors Act
Section 10 of the Rivers and Harbors Act prohibits the obstruction or alteration of navigable waters without a permit from the USACE. KRRC will monitor whether any project components require a Section 10 permit, and will obtain such permit from the USACE as needed.
Wild and Scenic Rivers Act
The National Park Service designates two segments of the Klamath River as Wild and Scenic Rivers (WSRs), one in Oregon and one in California. The Oregon segment commences 0.25 miles downstream of the J.C. Boyle Powerhouse and flows 11 miles to the Oregon/California state line. The California section commences 3,600 feet downstream of Iron Gate Dam and ends 189 miles later at its confluence with the Pacific Ocean.
A Section 7(a) determination of the WSRA for a proposed project is required if there could be a potential to unreasonably diminish the scenic, recreational, fish, or wildlife values present within a designated river from its date of designation. The National Park Service will develop a determination following the evaluation procedure under the direct and adverse effects standard for existing projects licensed by FERC, or other federally assisted projects inside the designated river (Section 7(a)). Permits, such as the 404 permit, may not be issued until any adverse effects are eliminated. KRRC has initiated discussions with the National Park Service and will provide requested documentation in 2018.

Definite Plan
38 01 | Objectives and Background June 2018
1.3.2 State and Local Permits
The Federal Power Act, 16 U.S.C. 791 et seq. vests FERC with broad authority to regulate hydropower facilities and establishes that state and local regulation of matters to be decided by FERC with respect to such hydropower facilities is preempted by operation of the Supremacy Clause of the U.S. Constitution. California v. FERC, 495 U.S. 490 (1990); First Iowa Hydro-Electric Cooperative v. Federal Power Commission, 328 U.S. 152 (1946). This preemptive authority extends to license surrender and project decommissioning decisions. For example, in the case of PacifiCorp, 115 FERC ¶ 61,194 (2006), FERC ruled:
It is well-established that the FPA preempts all state and local law concerning hydroelectric licensing apart from those adjudicating proprietary water rights. Furthermore, since the determination of whether a license should be surrendered is an action taken pursuant to the FPA, and the Commission retains jurisdiction over the Project until the license surrender is accepted and becomes effective, federal preemption applies to a license surrender.
However, in this case, FERC stated the licensee has a responsibility to work with state and local jurisdictions and address state and local requirements in an appropriate manner:
We prefer for our licensees to be good citizens of the communities in which projects are located, and thus to comply with state and local requirements, where possible. However, to the extent that state or local regulations make compliance with our orders impossible or unduly difficult, we will conclude that such regulations are preempted.
Consistent with FERC’s preference, KRRC will address state and local interests by reaching out to state and local agencies and pursuing mutually acceptable means and methods to address their interests in the FERC process.
The first step in this process has been to meet and consult with state and local jurisdictions to develop a better understanding of their interests and concerns. Outside of general public meetings, KRRC has held numerous working group workshops to discuss aquatic resources, terrestrial resources, cultural resources, and the restoration plan. Applicable regulatory agencies and other stakeholders attended these workshops.
Based on this outreach and the information obtained from state and local jurisdictions and other stakeholders, KRRC has made changes or modifications to the Definite Plan to address these agencies’ and stakeholders’ interests and concerns. Changes that fall under this category include revisions to the aquatic resource measures, terrestrial resource measures, the restoration plan, and the fish hatchery plan. Specifically, this includes Sections 6, 7.2, 7.3, 7.8, and Appendices H, I, and J. This outreach and iterative process is ongoing and is “business as usual” for purposes of the development and implementation of the Definite Plan.
KRRC also understands that in a given instance, the specific actions to be taken, or avoided, to address state and local regulatory requirements may need to be documented outside of the Definite Plan and presented to FERC as recommended conditions of approval. In such circumstances, KRRC proposes that

Definite Plan
June 2018 01 | Objectives and Background 39
KRRC and the relevant state or local agency enter into an agreement to submit joint recommendations to FERC regarding terms and conditions that should be adopted by FERC as conditions of approval.
The parameters for such agreements are limited only by the requirements of applicable law, consistency with the KHSA, and the requirements that the KHSA established for the Definite Plan. The factual nexus of any recommended condition to implementation of the Definite Plan, as well as the reasonableness of any recommendations that would be contained in the agreement, are further considerations just as they would be in any regulatory context. These “good neighbor” agreements with state and/or local agencies would specify reasonable measures that the parties agree are appropriate to recommend that would address the state and local regulatory requirements that are otherwise preempted by the Federal Power Act. These agreements will commit both parties to propose and advocate for these recommended measures to FERC in the surrender proceeding.
California
As noted above, KRRC has requested a water quality certification from the SWRCB pursuant to Section 401 of the Clean Water Act. Before the SWRCB can issue a water quality certification, the SWRCB must comply with the requirements of CEQA. As part of CEQA, SWRCB must also consult with California Native American tribes pursuant to Assembly Bill 52 (AB 52). SWRCB’s CEQA review and AB 52 consultation remain ongoing.
California state law requirements preempted by FERC’s authority under the FPA include California Fish and Game Code Sections 1602 and 2081. Implementation of the Definite Plan may require local permits and approvals for construction traffic, road maintenance, grading, minor road widening, tree trimming and similar activities at various locations. KRRC will first seek to address these state and local interests in the context of its ongoing outreach efforts through incorporation of measures included in the Definite Plan. Should there be outstanding issues that otherwise would be addressed through state and local permitting outside of the FERC context, KRRC will pursue “good neighbor” agreements with the jurisdictions that view this mechanism as an appropriate and effective means to address their interests. In the event that these state and local requirements are not addressed in the FERC Surrender Order and such requirements are deemed to not be preempted by the Federal Power Act, KRRC’s contractor will be instructed to apply for any additional local permits that may be required at the appropriate time.
Oregon
As noted above, KRRC has requested a water quality certification from the ODEQ under Section 401 of the Clean Water Act. In connection with this pending request, KRRC filed Findings In Support Of Land Use Compatibility For Removal Of John C. Boyle Dam “[a]n exhibit that … includes land use compatibility findings for the activity prepared by the local planning jurisdiction (OAR 340-048-0020(2)(i)(A))” with ODEQ on May 10, 2018 to demonstrate that the Project is compatible with the applicable comprehensive plan and land use regulations of Klamath County. ODEQ found the material submitted by KRRC in lieu of a Land Use Compatibility Statement (LUCS) from Klamath County adequately identifies and addresses specific provisions of local land use and the implementing regulations applicable to the proposed activity and

Definite Plan
40 01 | Objectives and Background June 2018
demonstrates project conformity with local land use regulations. KRRC will continue to consult with Klamath County as a means to fully and satisfactorily address Klamath County’s interests through the FERC process.
Oregon state law requirements preempted by FERC’s authority under the FPA include Oregon Fill/Removal permit from Oregon Department of State Lands and the Oregon Fish Passage Approval. Implementation of the Definite Plan may require local permits and approvals for construction traffic, road maintenance, grading, minor road widening, tree trimming and similar activities at various locations. KRRC will first seek to address these state and local interests in the context of its ongoing outreach efforts through incorporation of measures included in the Definite Plan. Should there be outstanding issues that otherwise would be addressed through state and local permitting outside of the FERC context, KRRC will pursue “good neighbor” agreements with the jurisdictions that view this mechanism an appropriate and effective means to address their interests. In the event that FERC does not address these requirements in the surrender order and such requirements are deemed to not be preempted by the Federal Power Act, KRRC’s contractor will be instructed to apply for any additional permits that may be required.
1.3.3 Further Consultation This Definite Plan includes many measures that, as of the date of publication, are subject to further consultation. As non-federal representative under certain laws, and under the good neighbor policy described in Section 1.3.2, KRRC will undertake further consultation in an effort to reach agreements on measures that will protect resources affected by the Project. Such consultation will include the following entities:
• Federal and state agencies which have permitting or regulatory jurisdiction over the Project, including USFWS, NMFS, USACE, and the SWRCB. Consultations with these agencies will be complete prior to FERC’s decision on the surrender application.
• KRRC will also consult with a number of state agencies, including ODFW and CDFW, that may not have jurisdiction over the Project; however, KRRC understands that these state agencies are important stakeholders in the process.
• Federally recognized tribes in the Klamath Basin, specifically, Cher’Ae Heights of the Trinidad Rancheria, Hoopa Valley Tribe, Karuk Tribe, Klamath Tribes, Modoc Tribe of Oklahoma, Quartz Valley Indian Reservation, and Yurok Tribe; and other tribes, including Shasta Nation and Shasta Indian Nation pursuant to Section 106 of the NHPA and California AB 52. These consultations will be complete prior to issuance of the FERC surrender and SWRCB decisions, respectfully.
• Siskiyou, Del Norte, and Humboldt Counties, California; and Klamath County, Oregon.
• City of Yreka, California.
• Other consulting parties designated or required under applicable procedures.

Definite Plan
June 2018 01 | Objectives and Background 41
1.4 Elevations and Measurement Corrections Previous documents and reports prepared for the project developments used older datum sources and outdated measurement techniques. When applicable, KRRC has updated numbers cited in this report. Some project record drawings note elevations in “project datum”, which is the National Geodetic Vertical Datum of 1929 (NGVD29). Elevations were converted from project datum to North American Vertical Datum of 1988 (NAVD88) according to Table 1.4-1. In addition, some older documents provide elevations in “local datum” (a datum relevant to only specific locations in the Lower Klamath Project), and elevations were converted from local datum to NAVD88 according to Table 1.4-1.
River miles (the distance a river feature or location is demarked from the Pacific Ocean in river miles (RMs)) were previously incorrectly calculated; the river mile locations noted in this report have also been updated using a river route that aligns with the channel thalweg shown in the 2018 bathymetry surveys of Iron Gate Reservoir and Copco Lake. The river route in J.C, Boyle Reservoir will be updated in summer 2018 based on the latest bathymetric survey of that reservoir. Table 1.4-2 provides a sampling of river mile conversions from those noted in the Detailed Plan (U.S. Bureau of Reclamation (USBR) 2012). KRRC has also used GIS to update areas and acreages previously reported.
Table 1.4-1 Elevation Conversion Factors
Location From project datum (NGVD29) to NAVD88
From local datum1 to NAVD88
J.C. Boyle + 3.71 feet Copco No. 1 + 3.48 feet + 2414.48 feet Copco No. 2 + 3.48 feet +2214.48 feet
Iron Gate + 3.33 feet Note: 1. Local datums were used during design and construction of Copco No. 1 and No. 2
Table 1.4-2 River Mile Comparison
Location River Mile in Detailed Plan
River Mile in Definite Plan
Upstream end of J.C. Boyle Reservoir 228 234.1 J.C. Boyle Dam 224.7 230.6 J.C. Boyle Powerhouse 220 226.0 Upstream end of Copco Lake 204 209.0
Copco No. 1 Dam 198 202.2 Copco No. 2 Dam 199 201.8 Copco No. 2 Powerhouse 196 200.3 Upstream end of Iron Gate Reservoir 197 200.3

Definite Plan
42 01 | Objectives and Background June 2018
Location River Mile in Detailed Plan
River Mile in Definite Plan
Iron Gate Dam 190 193.1

Definite Plan
June 2018 01 | Objectives and Background 43
1.5 Document Organization The document is organized into the following sections:
• Section 1 –Objectives & Background: describes the objectives of the Definite Plan, background on the Project, corrections to elevations and river miles from previous documents, and document organization.
• Section 2 – Existing Feature Descriptions: describes the existing features and developments of the four dams and their powerhouses.
• Section 3 – FERC Compliance & Dam Safety: provides an explanation of KRRC’s proposed program to comply with FERC dam safety requirements and engineering guidelines
• Section 4 – Reservoir Drawdown & Diversion Plan: describes the drawdown facilities, process, flows and sediment releases, anticipated downstream effects, monitoring, and adaptive management measures.
• Section 5 – Dam Removal Approach: describes the removal limits, construction access, staging and disposal areas, removal process, demolition methods and equipment, imported materials, and waste disposal for the four dams and powerhouses.
• Section 6 – Reservoir and Other Restoration: describes the restoration plan for the former reservoir areas and other areas disturbed by the Project.
• Section 7 – Other Project Components: describes other features of the Project including proposed aquatic and terrestrial resources measures, long-term road improvements, Yreka water supply improvements, recreation facilities demolition/restoration, and other resource management plans.
• Section 8 – Project Costs and Schedule: provides the latest understanding of project costs and construction schedules
• Section 9 – References: provides citations for references used in the document.
• Figures: the document includes figures throughout text as well as in two appendices. Figures throughout the document are numbered according to their respective subsection and then sequentially. Figures that can be found in an appendix are noted after the figure number with a letter in parentheses. For example, Figure 2.1-2 is associated with the text of Section 2.1 and can be found in the text; whereas, Figure 2.1-3 (B) can be found in Appendix B.
+ Appendix B includes figures designated as Critical Energy Infrastructure Information (CEII) that is not generally available to the public. Information in Appendix B will only be provided to specific agencies and individuals according to FERC rules and regulations.
+ Appendix C includes figures that do not contain CEII.

Definite Plan
44 01 | Objectives and Background June 2018
This page intentionally left blank.

Definite Plan
June 2018 02 | Existing Feature Descriptions 45
Chapter 2: Existing Feature Descriptions

Definite Plan
46 02 | Existing Feature Descriptions June 2018
This page intentionally left blank.

Definite Plan
June 2018 02 | Existing Feature Descriptions 47
2. EXISTING FEATURE DESCRIPTIONS
This section describes the four dam developments (Iron Gate, Copco No. 1 and No. 2, and J.C. Boyle) KRRC will remove as part of the Project. The purpose of this description is to support our analyses, described in later sections, and to support the surrender application. The April 2015 Supporting Technical Information Documents prepared by PacifiCorp for FERC provide additional detail on the four developments.
2.1 J.C. Boyle Dam and Powerhouse The J.C. Boyle Development (originally known as the Big Bend Development) consists of a reservoir, combination embankment and concrete gravity dam, gated spillway, diversion culvert, water conveyance system, and powerhouse located on the Klamath River between RM 234.1 and RM 226.0, in Klamath County, Oregon. Refer to Figure 2.1-1 (C) for plan views of these features.
Figure 2.1-1 J.C. Boyle Dam Existing Features (Appendix C)
California-Oregon Power Company completed J.C. Boyle Dam in 1958 at RM 203.6, and is downstream of Keno Dam and upstream of Copco No. 1 Dam. The primary purpose of the development is to generate hydroelectric power. Structures at the site include an office building (known as the Red Barn), maintenance shop, fire protection building, communications building, two occupied PacifiCorp-owned residences near the dam, and a large warehouse near the powerhouse.
2.1.1 Reservoir
J.C. Boyle Dam impounds a narrow reservoir (J.C. Boyle Reservoir) of 350 acres based on 2010 aerial imagery (Woolpert 2010), and according to a 2003 bathymetric survey (Eilers and Gubala 2003), provides approximately 2,267 acre-feet of total storage capacity at reservoir water surface (RWS) elevation 3797.2. 1 The maximum and minimum operating levels are between RWS elevations 3796.7 and 3791.7, a vertical operating range of 5 feet, although the reservoir is normally maintained at RWS elevation 3796.7, or 0.5 foot below the top of the spillway gates.
2.1.2 Dam, Spillway, and Diversion Culverts
The dam is composed of an earthen embankment section, fish ladder, spillway and diversion culverts, intake to the powerhouse, and concrete gravity section (from right abutment to left abutment, looking downstream). Figure 2.1-2 shows the dam. 1 All elevations in this Definite Plan are in NAVD88 vertical datum. Previously reported elevations were in project datum. See Table 1.3-1 for conversion factors.

Definite Plan
48 02 | Existing Feature Descriptions June 2018
Credit: River Design Group
Figure 2.1-2 J.C. Boyle Dam
The earthfill embankment portion is 68 feet tall (on the dam axis at its maximum height above the original streambed elevation 3735.7) with a 15-foot-wide crest and a crest length of 413.5 feet at elevation 3803.7 (Figure 2.1-3 (B)). The zoned embankment has a central impervious clay core flanked by upstream and downstream shells composed of compacted sand and gravel, with a downstream filter blanket. The upstream face above elevation 3783.7 has a 2½H:1V slope with a 3-foot-thick riprap layer, and a 3H:1V slope below elevation 3783.7. The downstream face has a 2½H:1V slope, with a 2-foot-thick riprap layer below approximately elevation 3771.7. The dam includes a 3-foot-high concrete cutoff wall along the bedrock foundation about 7 feet upstream of the dam axis.
Figure 2.1-3 Cross Section of J.C. Boyle Dam (Appendix B)
The concrete portion of the dam is 279 feet long and from right to left (looking downstream) is composed of a 117-foot-long spillway section, a 48-foot-long intake structure, and a 114-foot-long concrete gravity section with a maximum height of 23 feet (Figure 2.1-4 (B)).
Figure 2.1-4 Elevation of J.C. Boyle Spillway and Diversion Culverts (Appendix B)
The spillway section is a concrete gravity overflow structure with three 36-foot-wide by 12-foot-high radial gates and upstream stoplog slots (Figure 2.1-5 (B)). The spillway crest is at elevation 3785.2, with the top of gates at elevation 3797.2 (0.5 feet above the normal operating level). The spillway includes a traveling gate hoist for operation of the spillway gates. The spillway bays discharge onto a 13-foot-long concrete apron
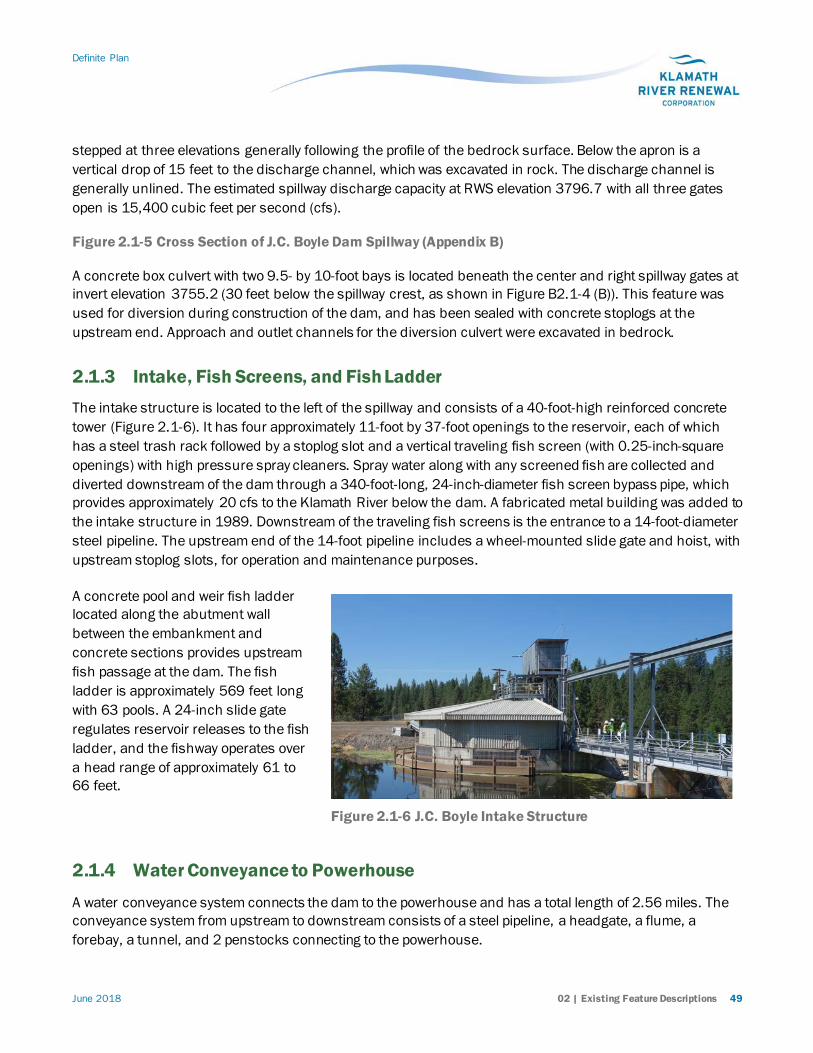
Definite Plan
June 2018 02 | Existing Feature Descriptions 49
stepped at three elevations generally following the profile of the bedrock surface. Below the apron is a vertical drop of 15 feet to the discharge channel, which was excavated in rock. The discharge channel is generally unlined. The estimated spillway discharge capacity at RWS elevation 3796.7 with all three gates open is 15,400 cubic feet per second (cfs).
Figure 2.1-5 Cross Section of J.C. Boyle Dam Spillway (Appendix B)
A concrete box culvert with two 9.5- by 10-foot bays is located beneath the center and right spillway gates at invert elevation 3755.2 (30 feet below the spillway crest, as shown in Figure B2.1-4 (B)). This feature was used for diversion during construction of the dam, and has been sealed with concrete stoplogs at the upstream end. Approach and outlet channels for the diversion culvert were excavated in bedrock.
2.1.3 Intake, Fish Screens, and Fish Ladder The intake structure is located to the left of the spillway and consists of a 40-foot-high reinforced concrete tower (Figure 2.1-6). It has four approximately 11-foot by 37-foot openings to the reservoir, each of which has a steel trash rack followed by a stoplog slot and a vertical traveling fish screen (with 0.25-inch-square openings) with high pressure spray cleaners. Spray water along with any screened fish are collected and diverted downstream of the dam through a 340-foot-long, 24-inch-diameter fish screen bypass pipe, which provides approximately 20 cfs to the Klamath River below the dam. A fabricated metal building was added to the intake structure in 1989. Downstream of the traveling fish screens is the entrance to a 14-foot-diameter steel pipeline. The upstream end of the 14-foot pipeline includes a wheel-mounted slide gate and hoist, with upstream stoplog slots, for operation and maintenance purposes.
A concrete pool and weir fish ladder located along the abutment wall between the embankment and concrete sections provides upstream fish passage at the dam. The fish ladder is approximately 569 feet long with 63 pools. A 24-inch slide gate regulates reservoir releases to the fish ladder, and the fishway operates over a head range of approximately 61 to 66 feet.
2.1.4 Water Conveyance to Powerhouse
A water conveyance system connects the dam to the powerhouse and has a total length of 2.56 miles. The conveyance system from upstream to downstream consists of a steel pipeline, a headgate, a flume, a forebay, a tunnel, and 2 penstocks connecting to the powerhouse.
Figure 2.1-6 J.C. Boyle Intake Structure

Definite Plan
50 02 | Existing Feature Descriptions June 2018
From the intake structure at the dam, the water flows through a 638–foot-long, 14-foot-diameter steel pipeline, supported on steel frames where it spans the Klamath River. The downstream end of the pipeline is equipped with a 14- by 14-foot automated fixed-wheel gate within a concrete headgate structure completed in 2002, which discharges into an open concrete-lined flume (the power canal).
The power canal is nearly 2.2 miles long and located along a bench cut in the slope of the river canyon (Figure 2.1-7). Depending on the terrain, the power canal either has walls on the down-slope side only or on both the down-slope and up-slope sides. The power canal is a concrete flume approximately 17 feet wide and 12 feet high, with shotcrete applied to the canyon walls where exposed. It has overflow structures at the upstream end (consisting of a siphon pipe) and at the downstream forebay (consisting of a gated overflow weir).
Figure 2.1-7 J.C. Boyle Power Canal (left) and Klamath River Bypass Reach (right)
The forebay is a somewhat enlarged area at the end of the power canal that connects to the tunnel, the next downstream component in the water conveyance system. The forebay has an overflow or spillway equipped with two float-operated automatic spill gates, which release water from the power canal during a hydraulic surge following any load rejection at the powerhouse. The released water discharges through a short,

Definite Plan
June 2018 02 | Existing Feature Descriptions 51
concrete-lined chute and returns to the bypass reach of the Klamath River (between the dam and powerhouse) via a large eroded channel (or scour hole) in the hillside (Figure 2.1-8). A forebay sluiceway pipe has been abandoned in place.
Figure 2.1-8 Forebay Overflow Chute and Upper Portion of Scour Hole
A 60-foot-wide and 17.9-foot-high trash rack with 2-inch bar spacing draws water for power generation from the forebay (Figure 2.1-9) into a 15.5-foot-diameter, concrete-lined, horseshoe-shaped tunnel, which is 1,644 feet long. The last 57-foot length of the tunnel before the downstream portal is steel-lined with the liner bifurcating into two 10.5-foot-diameter steel penstocks. A concrete anchor block encases the bifurcation and includes a 78-foot-high, 30-foot-diameter steel surge tank.

Definite Plan
52 02 | Existing Feature Descriptions June 2018
Figure 2.1-9 J.C. Boyle Forebay and Tunnel Trash Rack (rear)
Descending to the powerhouse, the penstocks reduce in two steps to 9 feet in diameter. Ring girders seated on concrete footings support each 956-foot-long penstock (Figure 2.1-10). The downstream end of each penstock includes a 108-inch-diameter butterfly valve.

Definite Plan
June 2018 02 | Existing Feature Descriptions 53
Figure 2.1-10 J.C. Boyle Penstocks
2.1.5 Powerhouse
A conventional outdoor-type reinforced concrete peaking powerhouse (Figure 2.1-11) is located on the right bank of the river and approximately 4.6 river miles downstream of the dam, at RM 226.0, and is the largest power generating development in the Lower Klamath Project. The two turbines are vertical-shaft, Francis-type units with a total rated discharge capacity of 2,850 cfs. The turbines are rated at 75,700 horsepower (hp) for Unit 1 (replaced in 1994) and 63,900 hp for Unit 2, with a net head of 440 feet. The system provides no bypass capacity. Four draft tube bulkhead gates and slots, with two hoists, are provided downstream of the units. A single 150-ton gantry crane is currently located at the J.C. Boyle powerhouse, but can also be used at the Iron Gate powerhouse.

Definite Plan
54 02 | Existing Feature Descriptions June 2018
Figure 2.1-11 J.C. Boyle Powerhouse
The generators are rated at 53 megavolt-amperes (MVA) for Unit 1, with a 0.95 power factor (50 megawatts (MW)), and 50 MVA for Unit 2, with a 0.95 power factor (48 MW). The power from the powerhouse is transmitted a very short distance to the adjoining J.C. Boyle substation. Two three-phase transformers step up the generator voltage for transmission interconnection. Line No. 58 (to Lone Pine) and Line No. 59 (to Klamath Falls) extend from the J.C. Boyle substation to a line tie. There is also a third line that pre-dates the substation. The 0.24-mile 69-kV transmission line (PacifiCorp Line No. 98) connects the J.C. Boyle powerhouse to a tap point on PacifiCorp’s Line No. 18, but based on field observation and aerial photos this line appears to have been removed.
2.1.6 Site Access
Oregon Route 66 (OR66, Green Springs Highway) and Topsy Grade Road provide site access via a network of unpaved project access roads. A small timber bridge crosses the Klamath River downstream of the dam.
2.1.7 Recreation Facilities Recreation facilities include Topsy Campground and boat launch (managed by the Bureau of Land Management, BLM), Pioneer Park east and west units and boat launches (managed by PacifiCorp), Spring

Definite Plan
June 2018 02 | Existing Feature Descriptions 55
Island whitewater boating launch (managed by BLM), and numerous smaller dispersed shoreline recreation sites, including two picnic areas, thirteen campsites, and eleven shoreline access points. Section 7.6 provides additional detail on the facilities.
2.2 Copco No. 1 Dam and Powerhouse The Copco No. 1 Development consists of a reservoir, concrete dam, gated spillway, diversion tunnel, intake structure, and powerhouse located on the Klamath River between approximately RM 209.0 and RM 202.2, in Siskiyou County, California. Refer to Figure 2.2-1 (C) for plan views of these features.
Figure 2.2-1 Copco No. 1 and Copco No. 2 Dams Existing Features (Appendix C)
Siskiyou Power and Light Company then California-Oregon Power Company constructed Copco No. 1 Dam between 1911 and 1922 at RM 202.2, and which is downstream of J.C. Boyle Dam and upstream of Copco No. 2 Dam. The primary purpose of the development is to generate hydroelectric power. Structures at the site include an occupied residence with small garage, a vacant house, and a maintenance building.
2.2.1 Reservoir
Copco No. 1 Dam impounds a reservoir (Copco Lake) of approximately 972 acres based on 2010 aerial imagery (Woolpert 2010), and according to a 2003 bathymetric survey (Eilers and Gubala 2003), provides approximately 33,724 acre-feet of total storage capacity at RWS elevation 2611.0. 2 The maximum and minimum reservoir operating levels are between RWS elevations 2611.0 and 2604.5, a vertical operating range of 6.5 feet, although the reservoir is normally maintained at RWS elevation 2609.5, or 1.5 feet below the top of the spillway gates.
2.2.2 Dam, Spillway, and Diversion Tunnel
The dam is composed of a concrete gravity arch which also functions as a spillway, diversion culverts, and intakes to the powerhouse. Figure 2.2-2 shows the dam.
2 All elevations in this Definite Plan are in NAVD88 vertical datum. Previously reported elevations were in project datum. See Table 1.3-1 for conversion factors.
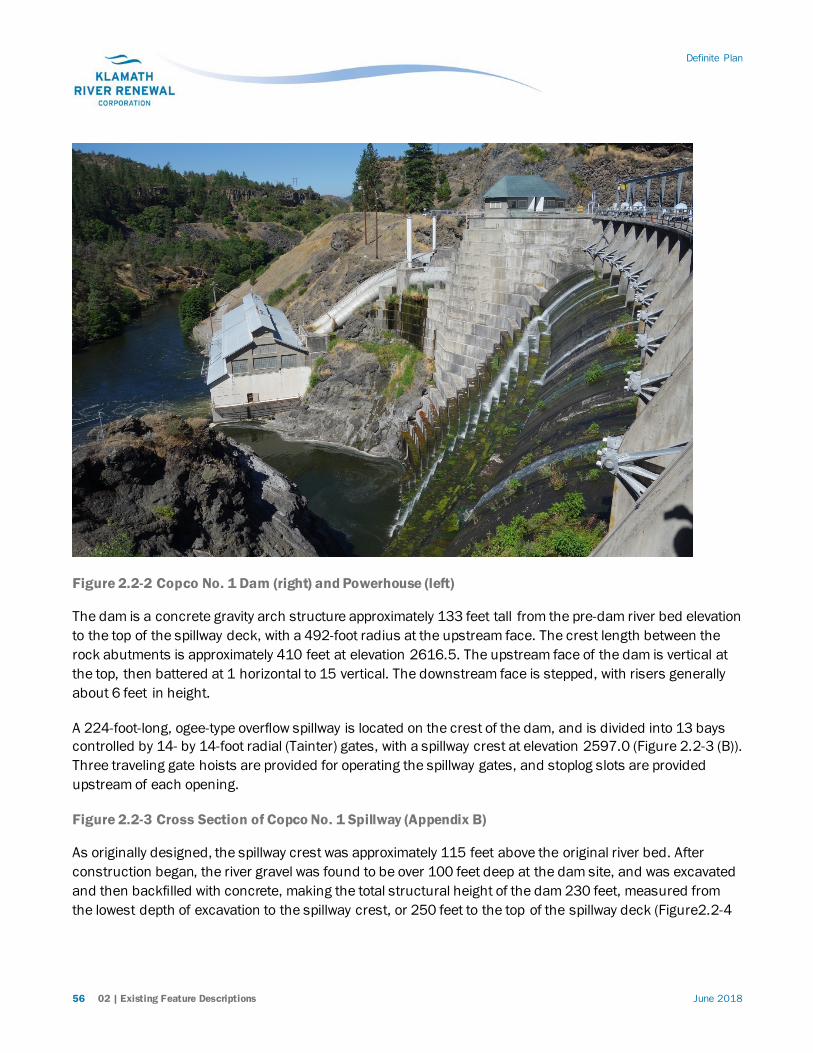
Definite Plan
56 02 | Existing Feature Descriptions June 2018
Figure 2.2-2 Copco No. 1 Dam (right) and Powerhouse (left)
The dam is a concrete gravity arch structure approximately 133 feet tall from the pre-dam river bed elevation to the top of the spillway deck, with a 492-foot radius at the upstream face. The crest length between the rock abutments is approximately 410 feet at elevation 2616.5. The upstream face of the dam is vertical at the top, then battered at 1 horizontal to 15 vertical. The downstream face is stepped, with risers generally about 6 feet in height.
A 224-foot-long, ogee-type overflow spillway is located on the crest of the dam, and is divided into 13 bays controlled by 14- by 14-foot radial (Tainter) gates, with a spillway crest at elevation 2597.0 (Figure 2.2-3 (B)). Three traveling gate hoists are provided for operating the spillway gates, and stoplog slots are provided upstream of each opening.
Figure 2.2-3 Cross Section of Copco No. 1 Spillway (Appendix B)
As originally designed, the spillway crest was approximately 115 feet above the original river bed. After construction began, the river gravel was found to be over 100 feet deep at the dam site, and was excavated and then backfilled with concrete, making the total structural height of the dam 230 feet, measured from the lowest depth of excavation to the spillway crest, or 250 feet to the top of the spillway deck (Figure2.2-4

Definite Plan
June 2018 02 | Existing Feature Descriptions 57
(B)). The estimated spillway discharge capacity at RWS elevation 2611.0 with all 13 gates fully open is 35,000 cfs.
Figure 2.2-4 Cross Section of Copco No. 1 Dam (Appendix B)
A 16- by 18-foot diversion tunnel was excavated through the left abutment for streamflow diversion during construction, but was later sealed by the construction of a concrete plug approximately 200 feet upstream from the downstream tunnel portal (Figure 2.2-5). A gated concrete intake structure, which regulated flows during construction, is located at the upstream end of the tunnel and has three 72-inch-diameter flap (or clack) valves, three 72-inch-diameter butterfly regulating valves, and three 12-inch-diameter filling lines with valves. All valves were manually-operated using gate stems and wire ropes from hoists located on a concrete deck upstream of the left abutment of the dam. The current condition of the valves and upstream tunnel is unknown as they are submerged by reservoir sediment. The existing hoists, stems, and wire ropes were abandoned in place and are not currently operational.
Figure 2.2-5 Copco No. 1 Diversion Tunnel Downstream Portal
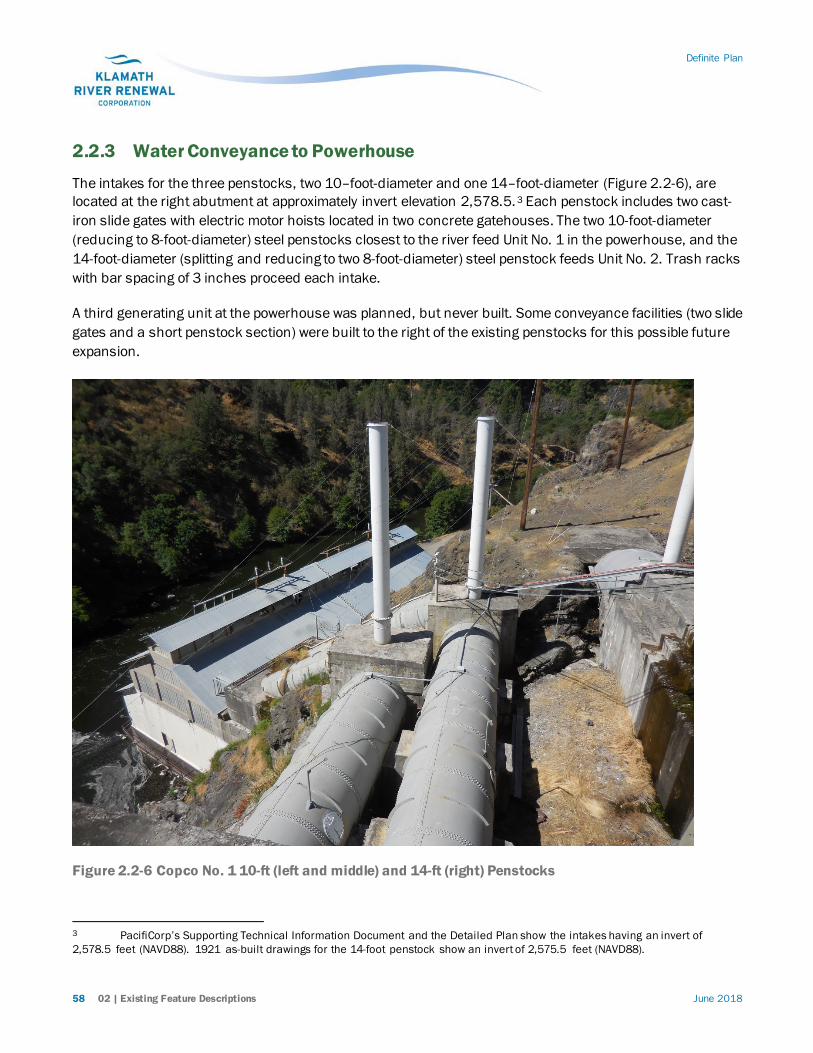
Definite Plan
58 02 | Existing Feature Descriptions June 2018
2.2.3 Water Conveyance to Powerhouse
The intakes for the three penstocks, two 10–foot-diameter and one 14–foot-diameter (Figure 2.2-6), are located at the right abutment at approximately invert elevation 2,578.5. 3 Each penstock includes two cast-iron slide gates with electric motor hoists located in two concrete gatehouses. The two 10-foot-diameter (reducing to 8-foot-diameter) steel penstocks closest to the river feed Unit No. 1 in the powerhouse, and the 14-foot-diameter (splitting and reducing to two 8-foot-diameter) steel penstock feeds Unit No. 2. Trash racks with bar spacing of 3 inches proceed each intake.
A third generating unit at the powerhouse was planned, but never built. Some conveyance facilities (two slide gates and a short penstock section) were built to the right of the existing penstocks for this possible future expansion.
Figure 2.2-6 Copco No. 1 10-ft (left and middle) and 14-ft (right) Penstocks
3 PacifiCorp’s Supporting Technical Information Document and the Detailed Plan show the intakes having an invert of 2,578.5 feet (NAVD88). 1921 as-built drawings for the 14-foot penstock show an invert of 2,575.5 feet (NAVD88).

Definite Plan
June 2018 02 | Existing Feature Descriptions 59
2.2.4 Powerhouse
The Copco No. 1 Powerhouse (Figure 2.2-7) is a reinforced-concrete substructure with a concrete and steel superstructure located at the base of Copco No. 1 Dam, on the right bank of the river. It operates as peaking powerhouse. The two turbines are horizontal-shaft, double-runner Francis-type units with a total rated discharge capacity of 3,650 cfs. The turbines have a rated output of 21,759 hp and 18,600 hp for unit 1 and 2, respectively, with a net head of 125 feet. The system provides no bypass capacity.
The generators are each rated at 12,500 kilovolt-amperes (kVA) with a 0.8 power factor (10 MW). Unit 1 has three indoor, single-phase 5,000-kVA, 2,300/72,000-volt (V) transformers, and Unit 2 has three indoor, single-phase 4,165-kVA, 2,300/72,000-V transformers, to step up the generator voltage for transmission interconnection.
The Copco No. 1 Powerhouse has four associated 69-kV transmission lines. PacifiCorp Line Nos. 26-1 and 26-2 are each approximately 0.07 mile long and connect the Copco No. 1 Powerhouse to the Copco No. 1 switchyard, located on the right abutment upslope of the powerhouse. PacifiCorp Line No. 15 is approximately 1.23 miles long and connects the Copco No. 1 switchyard to the Copco No. 2 Powerhouse, and Line No. 3 is approximately 1.66 miles long and connects the Copco No. 1 switchyard to the Fall Creek powerhouse.
Figure 2.2-7 Copco No. 1 Powerhouse

Definite Plan
60 02 | Existing Feature Descriptions June 2018
2.2.5 Site Access
Copco Road from Interstate 5 provides site access, and access continues via a steep and narrow access road to the dam right abutment and powerhouse. Copco Road provides access to the north side of the reservoir. Ager-Beswick Road provides access to the south side of the reservoir, and is an extension of the Topsy Grade Road in Oregon.
2.2.6 Recreation Facilities Recreation facilities include Mallard Cove and Copco Cove each with boat launches (both managed by PacifiCorp), and smaller dispersed shoreline recreation sites. Additional detail on the facilities is provided in Section 7.6.
2.3 Copco No. 2 Dam and Powerhouse The Copco No. 2 Development consists of a small reservoir, concrete diversion dam, embankment section, gated spillway, water conveyance system, and powerhouse located on the Klamath River between approximately RM 202.2 and RM 200.3, in Siskiyou County, California. Refer to Figure 2.2-1 (C) for plan views of these features.
California-Oregon Power Company completed the dam in 1925 approximately 0.4 mile downstream of Copco No. 1 Dam at RM 201.8, while the powerhouse is located at RM 200.3, just upstream of Iron Gate Reservoir. The purpose of the development is to generate hydroelectric power.
Structures near the powerhouse include a control center building, maintenance building, and oil and gas storage building. The nearby PacifiCorp-owned Copco Village includes a former cookhouse/bunkhouse, modern bunkhouse, garage/storage building, bungalow with garage, three occupied modular houses, four older ranch-style houses, and a school house/community center, all of which are within the FERC project boundary.
2.3.1 Reservoir The reservoir created by Copco No. 2 Dam is approximately 0.3 miles long (unnamed), and has a total storage capacity of approximately 70 acre-feet at the normal operating RWS elevation 2486.5. 4
2.3.2 Dam and Spillway
The dam is composed of a concrete gravity section which also functions as a spillway, an earthen embankment section, a small penetration for bypass flows, and a water conveyance intake for the powerhouse. Figure 2.3-1 shows the dam.
4 All elevations in this Definite Plan are in NAVD88 vertical datum. Previously reported elevations were in project datum. See Table 1.3-1 for conversion factors.

Definite Plan
June 2018 02 | Existing Feature Descriptions 61
Figure 2.3-1 Copco No. 2 Dam from Downstream Side
The dam is a concrete gravity structure with a gated side intake to a water conveyance tunnel at the left abutment, a central 145-foot-long spillway section with five 26- by 11-foot radial (Tainter) gates, and a 100-foot-long earthen embankment with gunite cutoff wall on the right abutment (Figures 2.3-2 (B), 2.3-3 (B), and 2.3-4 (B)). The dam is 32 feet high, with an overall crest length of 305 feet and a crest width of 9 feet at elevation 2496.5.
Figure 2.3-2 Layout of Copco No. 2 Dam Features (Appendix B)
Figure 2.3-3 Cross Section of Copco No. 2 Dam (Appendix B)
Figure 2.3-4 Elevation of Copco No. 2 Dam (Appendix B)
A manually-operated slide gate controls a small sluiceway adjacent to the intake, but is not currently believed to be operational. A small corrugated metal half-pipe provides approximately 5 cfs of flow to the bypass reach below the dam. The concrete gravity spillway crest is at elevation 2476.5, with a downstream apron at elevation 2459.5, between two concrete retaining walls. The estimated spillway discharge capacity at RWS elevation 2486.5 is 13,500 cfs with the five spillway gates fully open.
The remnant of a cofferdam is located upstream of the dam below the normal waterline. An old rock-filled timber crib is located high above the left abutment of the dam (Figure 2.3-5).

Definite Plan
62 02 | Existing Feature Descriptions June 2018
Figure 2.3-5 Copco No. 2 Dam from Upstream Side Showing Intake (at water level) and Crib Wall (high) on Left Abutment
2.3.3 Water Conveyance to Powerhouse
Water conveyance to the powerhouse is via the intake at the dam to a first tunnel, then through a wood-stave penstock, a second tunnel, and into a pair of steel penstocks to the powerhouse.
The intake structure incorporates a large trash rack and a 20- by 20-foot roller-mounted (caterpillar) gate at invert elevation 2459.5. The trash rack is 36.5 by 48 feet with 4-inch bar spacing.
The water conveyance system for the powerhouse includes 2,500 feet of concrete-lined tunnel (including an adit and an air vent shaft), 1,330 feet of wood-stave pipeline (Figure 2.3-6), an additional 1,110 feet of concrete-lined tunnel, an underground surge tank (including an air vent and overflow spillway), and two steel penstocks. The diameter of the tunnel and wood stave pipeline sections is 16 feet. The two penstocks, one 405 feet long and one 410 feet long, range from 16 feet in diameter at the upstream ends to 8 feet in diameter at the turbine spiral casings. A 138-inch butterfly valve is provided near the downstream end of each penstock.

Definite Plan
June 2018 02 | Existing Feature Descriptions 63
Figure 2.3-6 Copco No. 2 Wood-Stave Penstock
2.3.4 Powerhouse
The Copco No. 2 Powerhouse (Figure 2.3-7) is a reinforced-concrete structure located 1.6 miles downstream of Copco No. 2 Dam on the left bank of the river. It operates as peaking powerhouse. The two turbines are vertical-shaft, Francis-type units with a total rated discharge capacity of 2,786 cfs. Each turbine has a rated output of 26,285 hp and 20,000 for Units 1 and 2, respectively, with a net head of 145 feet and 140 feet for Units 1 and 2, respectively. No bypass capacity is provided.
The synchronous generators are each rated at 15,000 kVA with a 0.9 power factor (13.5 MW). There are three outdoor, single-phase 10/20-MVA, 6,600/72,000-V transformers for each generator to step up the voltage. There are also three outdoor, single-phase 10/20-MVA, 73,800/230,000-V step-up transformers for interconnection to the transmission system.
A 69-kV transmission line (also Line No. 15) is approximately 0.20 miles long and connects the Copco No. 2 Powerhouse to the Copco No. 2 switchyard. A distribution line approximately 0.21 miles long connects to Copco No. 2 Dam. Line No. 62 runs along the north side of Iron Gate reservoir for approximately 6.32 miles, from the Iron Gate powerhouse to the Copco No. 2 switchyard. Drawings provided by PacifiCorp also note Lines 1, 2, 4, 14, 18, 19, and 67 connecting to the Copco No. 2 switchyard.

Definite Plan
64 02 | Existing Feature Descriptions June 2018
Figure 2.3-7 Copco No. 2 Powerhouse
2.3.5 Site Access
Copco Road from Interstate 5 provides site access. Access to the dam is via a steep and narrow access road; the same access road as for Copco No. 1. Access to the powerhouse is via the Daggett Road crossing of the Klamath River on a single-lane bridge.
2.3.6 Recreation Facilities
Two water access points exist directly upstream of the Copco No. 2 dam, but they are not publically accessible.
2.4 Iron Gate Dam and Powerhouse The Iron Gate Development consists of a reservoir, embankment dam, side-channel spillway, diversion tunnel, intake structures, and powerhouse located on the Klamath River between RM 200.3 and RM 193.1, about 17 miles northeast of Yreka, California, in Siskiyou County. Refer to Figure 2.4-1 (C) for plan views of these features.

Definite Plan
June 2018 02 | Existing Feature Descriptions 65
Figure 2.4-1 Iron Gate Dam Existing Features (Appendix C)
California-Oregon Power Company completed the development in 1962 at RM 193.1. It is the farthest downstream hydroelectric development of the Project. The primary purpose of the Iron Gate development is to generate hydroelectric power. Structures at the site include a communications building, a restroom building, a maintenance shop, two occupied residences, and a fish spawning building.
2.4.1 Reservoir
Iron Gate Dam impounds a reservoir of 942 acres (Iron Gate Reservoir) and according to a 2003 bathymetric survey (Eilers and Gubala 2003), provides approximately 50,941 acre-feet of total storage capacity at RWS elevation 2331.3. 5 The maximum and minimum operating levels are between RWS elevations 2331.3 and 2327.3, a vertical operating range of 4 feet.
2.4.2 Dam, Spillway, and Diversion Tunnel
The dam is composed of a side channel spillway, earthen embankment section, diversion tunnel, intake to Iron Gate hatchery water supply, and intake to the powerhouse (from right abutment to left abutment, looking downstream) (Figure 2.4-2). A fish ladder and trapping and holding facilities are located at the downstream base of the dam.
The dam is a zoned earthfill embankment with a current height of 189 feet from the rock foundation (elevation 2157.5) to the dam crest at elevation 2346.3. The dam crest is 20 feet wide and approximately 740 feet long (Figure 2.4-3 (B)). The embankment includes a central impervious clay core, with filter zones and a downstream drain, and is flanked by compacted pervious shells. The upstream face has a 2H:1V slope above elevation 2331.3, a 2½H:1V slope between elevations 2331.3 and 2303.3, and a 3H:1V slope below elevation 2303.3, with a 29-foot-wide bench at elevation 2278.3. The upstream face includes a 10-foot-thick riprap layer for slope protection (Figure 2.4-4 (B)).
The downstream face has a 1.75H:1V slope above and a 2H:1V slope below elevation 2326.3, with a 10-foot-wide bench at elevation 2278.3. The downstream face includes a 5-foot-thick riprap layer for slope protection. The dam is founded on a sound basalt rock foundation, with a grout curtain beneath the impervious core.
5 All elevations in this Definite Plan are in NAVD88 vertical datum. Previously reported elevations were in project datum. See Table 1.3-1 for conversion factors.

Definite Plan
66 02 | Existing Feature Descriptions June 2018
Figure 2.4-2 Iron Gate Dam, Spillway (left), and Powerhouse (right)
Figure 2.4-3 Elevation of Iron Gate Dam (Appendix B)
Figure 2.4-4 Cross Section of Iron Gate Dam (Appendix B)
PacifiCorp completed modifications in 2003 to raise the dam crest five feet from elevation 2341.3 to elevation 2346.3 by over-steepening the upstream and downstream slopes and decreasing the crest width from 30 feet to 20 feet. A sheet pile wall was also driven upstream of the dam centerline to extend five feet above the dam crest to provide freeboard in addition to the 5-foot crest raise. The top of the sheet pile wall is at elevation 2351.3. Additional riprap materials were placed on the upstream face of the dam to protect those areas inundated by the higher reservoir elevations during large flood events.
The spillway is excavated in rock on the right abutment, and consists of an ungated side-channel spillway crest with a concrete-lined chute. The spillway crest is at elevation 2331.5, or 15 feet below the raised dam crest. The spillway crest is 727 feet long and consists of a concrete ogee crest and slab placed over the excavated rock ridge. Concrete partly lines the upper part of the channel. The downstream end of the spillway crest includes a 10- by 8-foot hinged trash/sluice gate for sluicing sediments and debris.
A flip-bucket terminal structure is located at the downstream end of the spillway chute. The spillway has an estimated discharge capacity of 22,350 cfs at RWS elevation 2336.3. The modifications completed in 2003 included shotcrete protection at the top of the spillway crest and chute.
The diversion tunnel used during construction of the dam was driven through bedrock in the right abutment and terminates in a reinforced concrete outlet structure near the downstream toe of the dam (Figure 2.4-5). The diversion tunnel intake is a reinforced concrete structure equipped with four 10- by 33-foot trash racks and is located approximately 520 feet upstream from the dam axis near the upstream toe. A two-piece
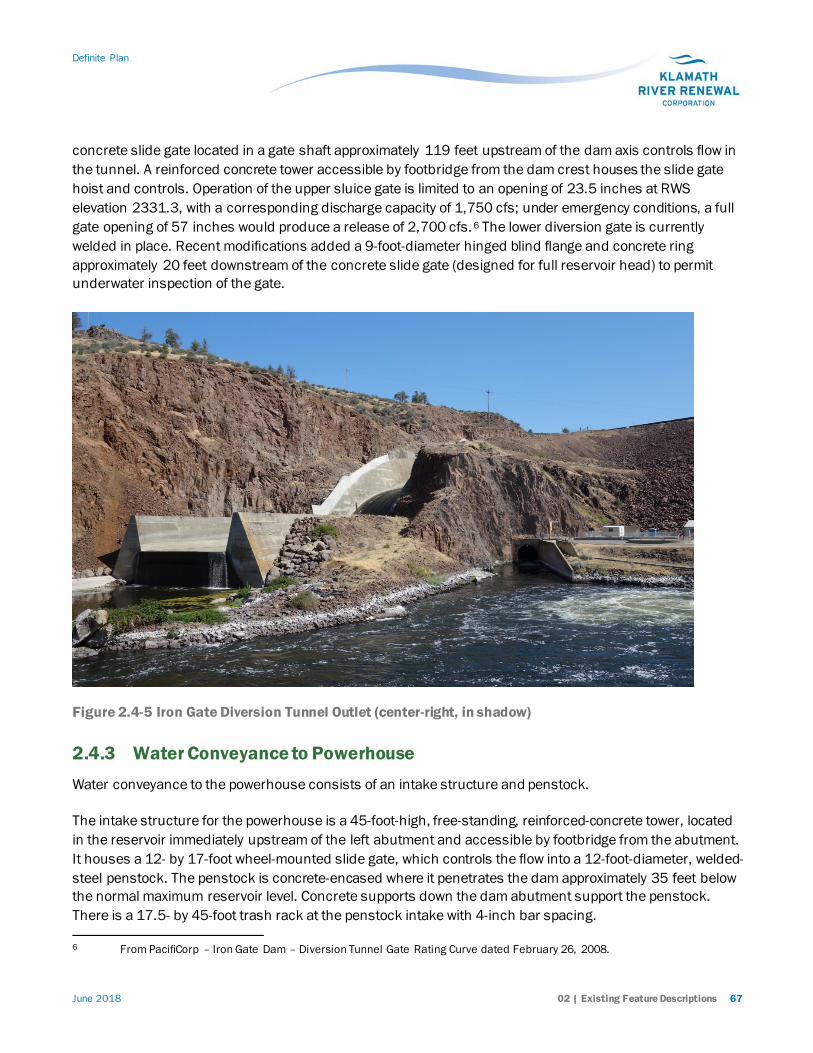
Definite Plan
June 2018 02 | Existing Feature Descriptions 67
concrete slide gate located in a gate shaft approximately 119 feet upstream of the dam axis controls flow in the tunnel. A reinforced concrete tower accessible by footbridge from the dam crest houses the slide gate hoist and controls. Operation of the upper sluice gate is limited to an opening of 23.5 inches at RWS elevation 2331.3, with a corresponding discharge capacity of 1,750 cfs; under emergency conditions, a full gate opening of 57 inches would produce a release of 2,700 cfs. 6 The lower diversion gate is currently welded in place. Recent modifications added a 9-foot-diameter hinged blind flange and concrete ring approximately 20 feet downstream of the concrete slide gate (designed for full reservoir head) to permit underwater inspection of the gate.
Figure 2.4-5 Iron Gate Diversion Tunnel Outlet (center-right, in shadow)
2.4.3 Water Conveyance to Powerhouse Water conveyance to the powerhouse consists of an intake structure and penstock.
The intake structure for the powerhouse is a 45-foot-high, free-standing, reinforced-concrete tower, located in the reservoir immediately upstream of the left abutment and accessible by footbridge from the abutment. It houses a 12- by 17-foot wheel-mounted slide gate, which controls the flow into a 12-foot-diameter, welded-steel penstock. The penstock is concrete-encased where it penetrates the dam approximately 35 feet below the normal maximum reservoir level. Concrete supports down the dam abutment support the penstock. There is a 17.5- by 45-foot trash rack at the penstock intake with 4-inch bar spacing. 6 From PacifiCorp – Iron Gate Dam – Diversion Tunnel Gate Rating Curve dated February 26, 2008.

Definite Plan
68 02 | Existing Feature Descriptions June 2018
2.4.4 Powerhouse
The Iron Gate Powerhouse is an outdoor-type development located at the downstream toe of the dam on the left bank (Figure 2.4-6), and consists of a single vertical-shaft, Francis-type turbine with a rated discharge capacity of 1,735 cfs. The turbine has a rated output of 25,000 hp with a net head of 154 feet. In the event of a turbine shutdown, a synchronized Howell-Bunger bypass valve located immediately upstream of the turbine diverts water around the turbine to maintain flows downstream of the dam. The synchronous generator is rated at 18,975 kVA with a 0.95 power factor (18 MW).
There is a single outdoor, three-phase 19-MVA, 6,600/69,000-V step-up transformer at the powerhouse for interconnection to the transmission system. A 69-kV transmission line is approximately 0.21 miles long and connects the Iron Gate switchyard to Tower P 2/007. A second 69-kV transmission line is approximately 0.33 miles long and connects the Iron Gate switchyard to the Iron Gate Hatchery tie-in. Two distribution lines totaling 0.21 miles provide local distribution around the dam and powerhouse area.
Figure 2.4-6 Iron Gate Powerhouse
2.4.5 Fish Trapping and Holding Facilities
There are fish trapping and holding facilities (Figure 2.4-7) located on “random fill”7 at the downstream toe of the dam. The top of the random fill area is at elevation 2192.3. The fish facilities at the dam include six
7 This is the type of material shown on the construction drawings used to fill in the area.

Definite Plan
June 2018 02 | Existing Feature Descriptions 69
fish holding tanks, a spawning building, a fish ladder, and an aerator for the hatchery water supply. High- (elevation 2313.3) and low- (elevation 2253.3) level intakes for the fish facility cold water supply are incorporated in the dam on the left abutment.
Figure 2.4-7 Iron Gate Fish Holding Tanks and Spawning Building
2.4.6 Iron Gate Fish Hatchery
The Iron Gate fish hatchery was constructed in 1966 and is located on the left bank downstream of Iron Gate Dam, adjacent to the Bogus Creek tributary. The hatchery complex includes an office, warehouse, hatchery/incubator building, four fish rearing ponds, a fish ladder with trap, visitor information center, and four employee residences. Up to 50 cfs of water is diverted from the Iron Gate reservoir to supply the 32 raceways and fish ladder. The hatchery provides the capacity to capture, hold, and spawn adult returning Chinook salmon, steelhead trout, and Coho salmon and to hatch and rear fish until their release. The California Department of Fish and Wildlife (CDFW) operates the hatchery, with a large portion of the operations and maintenance costs currently funded by PacifiCorp. See Section 8.11 for a more detailed description of the existing facility and operation.
Definite Plan
70 02 | Existing Feature Descriptions June 2018
2.4.7 Site Access
Site access is provided from Interstate 5 via Copco Road and then by Lakeview Road to the dam crest and reservoir area, or by a project access road to the powerhouse. The single-lane Lakeview Road Bridge crosses the Klamath River downstream of the dam.
2.4.8 Recreation Facilities Recreation facilities include Fall Creek day-use area and boat launch, Jenny Creek campground, Wanaka Springs day-use area and campground, Camp Creek campground and boat launch, Juniper Point campground, Mirror Cove campground, Overlook Point day-use area, and Long Gulch campground and boat launch (each managed by PacifiCorp), and smaller dispersed shoreline recreation sites. Among the referenced facilities there exist a visitors’ center at Iron Gate hatchery, two interpretive displays, five boat launches, one fishing platform, two picnics areas, six campgrounds (with sixty-six campsites), five dispersed camping areas (with 20 campsites), and four other water access points. Section 7.6 provides additional detail on each of the facilities.

Definite Plan
June 2018 03 | FERC Compliance and Dam Safety 71
Chapter 3: FERC Compliance and Dam Safety

Definite Plan
72 03 | FERC Compliance and Dam Safety June 2018
This page intentionally left blank.
Definite Plan
June 2018 03 | FERC Compliance and Dam Safety 73
3. FERC COMPLIANCE AND DAM SAFETY
This section explains KRRC’s proposed program to comply with FERC dam safety requirements and Engineering Guidelines.
KRRC is developing a dam safety program to allow removal of the Project to be undertaken in a manner that minimizes risk to people, structures, infrastructure, and the natural resources of the Klamath River Basin. Such removal will fully comply with FERC’s dam safety requirements, and will be consistent with FERC Engineering Guidelines (FERC 2017). Additionally, KRRC will seek the review and recommendations of the Oregon Water Resources Department and the California Department of Water Resources, Division of Dam Safety to the full extent of any state agency jurisdiction over the decommissioning and removal of the hydroelectric facilities that comprise the Lower Klamath Project.
3.1 Board of Consultants On October 5, 2017, FERC issued a directive to PacifiCorp and KRRC to convene an Independent Board of Consultants (BOC) to review and assess various aspects of the proposed dam removal process. The BOC was approved on May 22, 2018 The BOC is a six-member fully independent body that includes three members with experience in civil engineering (with specialized experience in dam construction and removal of both concrete and embankment dams, hydrology, hydraulics, and stream diversion) and geotechnical engineering. In addition, the BOC includes members with experience in aquatic and terrestrial biology, and a heavy civil construction cost estimator with experience in dam removal and restoration activities.
KRRC anticipates that the BOC will commence its review of the Definite Plan in August 2018. Initially, FERC has requested that the BOC review and provide recommendations regarding the adequacy of available funding and reasonableness of updated cost estimates for the most probable cost and maximum cost for implementation of the Definite Plan. FERC has also requested that the BOC review and provide recommendations regarding the adequacy of amounts and types of insurance coverage and bonding arrangements for dam removal, and to review and provide recommendations regarding other technical aspects of the Definite Plan to better define and understand the plans, schedules, specifications, staging, and sequencing for taking on the responsibilities for dam removal and decommissioning of the Lower Klamath Project.
The BOC recommendations will be incorporated into a revised Definite Plan and will provide FERC with a greater level of detail of the various project elements proposed in the Definite Plan. These recommendations will build upon and improve the Definite Plan and assist KRRC in maintaining compliance with the Federal Power Act, and in particular, FERC dam safety requirements and engineering guidelines.

Definite Plan
74 03 | FERC Compliance and Dam Safety June 2018
In advance of their review, the BOC will be provided project documents including the Potential Failure Mode Analyses, Part 12D Independent Consultant Inspection Reports and the Supporting Technical Information Documents, to understand project-specific aspects that could be significant to the dam removal process. KRRC will also provide the BOC copies of monthly construction reports, and any additional information or analysis requested by the BOC within the scope of their review. The BOC will play a significant role in reviewing the dam safety program described below and in evaluating project risks.
3.2 Part 12 Requirements KRRC proposes a general schedule and approach for compliance with these requirements below.
3.2.1 Potential Failure Modes Analysis Background
The KRRC will complete a Potential Failure Modes Analysis (PFMA), which is a dam and project safety evaluation tool developed by FERC to be used in the Part 12, Subpart D program of dam and safety evaluations for FERC regulated projects. Since initiation of the PFMA program, a PFMA has been performed for all FERC regulated dams that are required to undergo Independent Consultant Safety Inspections as defined in 18 CFR Part 12, Subpart D. Iron Gate, Copco No. 1, and J.C. Boyle fall under these regulations, and Part 12D Reports and PFMAs have been performed accordingly. As Copco No. 2 does not meet the requirements for a Part 12D Independent Consultant’s inspection, PacifiCorp has not performed a PFMA for this dam.
The following sections outline the process and steps the KRRC will go through to complete the PFMA for the Project.
3.2.2 Supplemental PFMA
FERC’s Engineering Guidelines indicate that Supplemental PFMAs shall be conducted for dams that will be undergoing major modifications, remedial work or are scheduled to have substantial changes, including removal. One purpose of this Supplemental PFMA is to evaluate the recommended dam removal plan prior to demolition. Thus, KRRC will perform supplemental PFMAs for Iron Gate, Copco No. 1, and J.C. Boyle, and for the previously unevaluated Copco No. 2.
The KRRC has reviewed dam safety submittals for the Powerdale (FERC Project No. 2659) and Condit (FERC Project No. 2342) decommissioning projects, which involved recent FERC regulated dams in the region that share similarities based on size, type, and location. For both examples, a separate Core Team was assembled, and a supplemental PFMA workshop was held. KRRC will assemble a PFMA Core Team for the Project.
For the PFMA to be comprehensive, consistent, and complete, the following outline describes the dam safety approach the KRRC will employ when carrying out the Supplemental PFMA.

Definite Plan
June 2018 03 | FERC Compliance and Dam Safety 75
Step 1: Collection of Background Data
The KRRC will collect all data, removal plans, studies and information on the investigation, design, construction, analysis, performance and operation of the Project in preparation for review by the PFMA Core Team. A listing will be made of the data available for review and considered in the PFMA. The list will be included in any PFMA documentation. Data requests made of PacifiCorp in April of 2017 will provide the fundamental background information for the Core Team. Additionally, KRRC will make the Definite Plan available to the PFMA Core Team members for review prior to the PFMA session. If any dam safety incident reports exist, KRRC will also make them available to the PFMA Core Team for review.
Based on the estimated time to gather all the data, 60 days for FERC Regional Office review, and the time to perform the PFMA workshops, the process should begin 1 year prior to the planned construction contract award date, and/or negotiation of the guaranteed maximum price. The goal of the proposed PFMA schedule is to complete the session in accordance with FERC Guidelines, provide FERC with adequate time to complete their review and provide any comments to the KRRC without impacting the project schedule.
Studies conducted in preparation for development removal are relevant to the activities of the PFMA Core Team. In particular, the PFMA report will incorporate:
• Updated slope stability analysis and any recent surveys of new or previously unidentified landslides along the reservoir rims.
• An evaluation of the rock in the area of the planned dam removal and breaching.
• A structural evaluation of any facilities needed to support heavy equipment (e.g., cranes) to verify support for anticipated loads.
Step 2: Selection of the PFMA Core Team
The PFMA Core Team members will have knowledge and experience related to dam safety evaluations and will consist of the applicants’ Technical Representatives, FERC Inspector, Facilitator, Independent Consultant (if available), and a geologist or geotechnical engineer. FERC’s participation and involvement will be guided by FERC’s ex parte rule, as applicable. Considering that the Project is in both Oregon and California, KRRC will invite the state dam safety organizations located in those states to participate. In addition to the PFMA Core Team members, key project staff will be available during the PFMA session so they may answer questions from the PFMA Core Team, to clarify operating rules, and provide key site-specific information.
The BOC, discussed in Section 3.1, will have a role in PFMA proceedings. This group is distinct from the Core Team in that they are to provide independent, expert opinions on matters related to their subject area. The Supplemental PFMA process is an opportune time to educate the BOC about the Project and discuss risks; KRRC will provide more detail on their role when the KRRC finalizes their plan for the BOC.
Step 3: Site Visit
Typically, the PFMA Core Team is assembled at the time of the review, and depending on the PFMA Core Team’s familiarity with the Project, a site visit may be requested. For a site visit, the Team Leader will

Definite Plan
76 03 | FERC Compliance and Dam Safety June 2018
prepare an advanced review package for the participants to get familiarized with the Project. At the site, the Facilitator will review the basic concepts of the PFMA process for the PFMA Core Team, the objectives, and answer any questions the participants may have. The PFMA Core Team will complete the site visit just before it conducts a comprehensive review of the background material.
Step 4: Comprehensive Review
The PFMA Core Team begins the PFMA session with review of the gathered data on the developments. The review will take place at a convenient location that allows the PFMA Core Team to review all the necessary data and have collaboration on items that may need clarification. KRRC has not yet identified this location.
Step 5: PFMA Session
The Facilitator begins the session by outlining the goals and ground rules, ensures the PFMA Core Team follows the process and performs the PFMA following the FERC Engineering Guidelines. The session will then move on to a brief review of the existing PFMAs compiled from previous PFMA sessions with an emphasis on dam removal. The group will then focus on potential new failure modes that could occur as part of dam removal.
Step 6: Evaluation of Surveillance and Monitoring
The Core Team members will assess the dam safety surveillance and monitoring plan (DSSMP) for the dams considering potential failure modes and develop a DSSMP for any “highlighted” potential failure modes and any selected “not highlighted” potential failure modes.
Step 7: Documentation
The KRRC will document the Major Findings and Understandings and prepare the draft PFMA Report which documents the PFMA session, surveillance and monitoring, and/or risk reduction opportunities identified by the PFMA. The PFMA report will be prepared following the outline contained in FERC’s Engineering Guidelines. KRRC will send a draft report to the PFMA Core Team members for review and comment. After receiving the PFMA Core Team’s comments, KRRC will finalize the report and provide it to the BOC. KRRC will address and incorporate BOC recommendations and provide them to FERC.

Definite Plan
June 2018 03 | FERC Compliance and Dam Safety 77
3.3 FERC Required Plans and Submittals Table 3.1-1 indicates the plans and submittals to be provided by the KRRC to the BOC and then to FERC.
Table 3.3-1 FERC Required Plans and Submittals
Plan Name Coffer Dams • Coffer Dam Design
• Coffer Dam Certification
Temporary Construction Emergency Action Plan Quality Control Inspection Program (QCIP) Dam Stability Analysis (Iron Gate and J.C. Boyle) Blasting Plan Reservoir Rim Stability Analyses
Flood Routing Analysis and Inundation Study Rock quality evaluation in the areas of planned breaching
The KRRC will develop and submit specific plans and schedules for compliance at FERC’s direction, and consistent with any further recommendations as may be provided by the BOC.

Definite Plan
78 03 | FERC Compliance and Dam Safety June 2018
This page intentionally left blank.

Definite Plan
June 2018 04 | Reservoir Drawdown and Diversion Plan 79
Chapter 4: Reservoir Drawdown and Diversion Plan

Definite Plan
80 04 | Reservoir Drawdown and Diversion Plan June 2018
This page intentionally left blank.

Definite Plan
June 2018 04 | Reservoir Drawdown and Diversion Plan 81
4. RESERVOIR DRAWDOWN AND DIVERSION PLAN
4.1 Introduction KRRC proposes the following reservoir drawdown and streamflow diversion plan to facilitate the Project while minimizing flood risks and downstream impacts due to the release of impounded reservoir sediments. This plan results in drawdown of the reservoirs impounded by J.C. Boyle, Copco No. 1, and Iron Gate dams by March 15, 2021, to minimize downstream impacts resulting from the natural release and transport of impounded sediments. Section 2: Existing Hydrology Conditions in USBR’s Hydrology, Hydraulics, and Sediment Transport Studies for the Secretary’s Determination on Klamath River Dam Removal and Basin Restoration Klamath River, Oregon and California (USBR 2012c) provides historical daily and monthly streamflow data downstream of each of the dams.
Drawdown of the reservoirs will generally take place between January 1 and March 15, 2021. However, the proposed plan includes early drawdown of Copco No. 1 and delayed cessation of power generation at Copco No. 2. KRRC proposes early drawdown of Copco No. 1 for the reservoir drawdown to be completed by about March 15 (prior to spring salmonid migration). To offset lost revenue from shutting Copco No. 1 down prior to January 1, the KRRC proposes that generation of power at Copco No. 2 Dam (with sediment-laden flow) will continue for up to four months after January 1, 2021 (or until May 1, 2021). This assumes the Copco No. 2 generating equipment will be capable of operating under such conditions. The KRRC proposes that power generation at Copco No. 1 Dam will end after the reservoir reaches the minimum operating level at reservoir water surface (RWS) elevation 2604.5, which would be nearly 2 months before January 1, 2021. Reservoir drawdown below the minimum operating level will commence at each dam when power generation has ceased at that dam. The proposed plan assumes power generation at each of the dams will end as shown in Table 4.1-1.
The following sections describe the reservoir drawdown facilities (and infrastructure modifications required to facilitate drawdown), flood frequency flows, the anticipated drawdown rates (i.e., rate of elevation change and discharge rates) and timing of drawdown, and the portion of discharge associated with specific structures (spillways, diversion tunnels, etc.). Appendix F provides additional information and results beyond those presented here.

Definite Plan
82 04 | Reservoir Drawdown and Diversion Plan June 2018
Table 4.1-1 End Date for Power Generation
Location End Date J.C. Boyle January 1, 2021 Copco No. 1 November 1, 2020 Copco No. 2 May 1, 2021 Iron Gate January 1, 2021
The bulleted list below provides a roadmap for specific information related to drawdown:
• Description of structures used for drawdown operation and associated flows is provided in Section 4.2
• Physical modifications to the dams to facilitate drawdown are summarized in Section 4.2
• Additional information concerning the retrofit of the diversion tunnels is provided in Section 4.2
• Total anticipated discharge (cfs) associated with drawdown for each reservoir is discussed in Section 4.4
• Proposed duration and timing of drawdown operations is discussed in Sections 4.4 and 4.5
• Schedule and sequence for drawdown of all Lower Klamath Project dams is provided in Sections 4.4 and 4.5
• Proposed reservoir elevation change per day is provided in Section 4.5
• Strategies for managing drawdown under low, medium and high flow conditions are provided in Section 4.5
• Slope stability monitoring during and after reservoir drawdown is discussed in Section 4.6
• Studies conducted to verify reservoir drawdown rates are protective of slope stability and potential flooding are discussed in Section 4.7
• Description of measures associated with possible tunnel failure is provided in Section 4.7.1
• Measures to implement if slope stability issues are identified are discussed in Sections 4.7.2 and 4.7.3
4.2 Diversion Facilities Table 4.2-1 shows facilities that KRRC will use for drawing down the reservoirs and diverting Klamath River flows around J.C. Boyle, Copco No. 1, and Iron Gate dams. The major drawdown facilities at J.C. Boyle are the spillway, power intake, and diversion culverts beneath the dam. At Copco No. 1, drawdown facilities are the spillway and a modified diversion tunnel. 8 At Iron Gate, the drawdown will occur via the spillway and a modified diversion tunnel. The penstocks at Copco No. 1 and Iron Gate provide only a minor amount of 8 KRRC analyzed two options for diversion at Copco No. 1 Dam, as described later in this section. Option 1 used the spillway, diversion tunnel, and dam notches, and Option 2 used the spillway and a modified diversion tunnel. Option 2 is the proposed action, and Option 1 is only discussed for comparison purposes.

Definite Plan
June 2018 04 | Reservoir Drawdown and Diversion Plan 83
potential additional diversion, and KRRC assumes they will be closed when power generation ceases, so they are not included in the drawdown modeling.
Table 4.2-1 Facilities to be Used for Reservoir Lowering and Diversion
(a) (b) (c) Location Diversion Facility Invert
Elevation Notes
J.C. Boyle Dam Normal operating elevation 3796.7 Spillway 3785.2 Power Intake 3771.7
Power Canal, Tunnel, and Turbines
-- Pass power intake flows through turbines without generating power
Diversion Culvert – Bay 1 3755.2 Diversion Culvert – Bay 2 3755.2 Copco No. 1 Dam Normal operating elevation 2609.5
Option 1 Spillway 2597.0 For comparison purposes only Modified Diversion Tunnel 2485.51 Notches in Dam Varies Option 2 Spillway 2597.0 Proposed action New Gate in Diversion Tunnel 2485.51 Iron Gate Dam Normal operating elevation 2331.3
Spillway 2331.3 New Gate in Diversion Tunnel 2176.32
1. Estimated from Drawing 1475. 2. Drawing 8860 shows the invert at 2173 feet NGVD (2176.3 feet NAVD); Drawing 8862 shows invert at 2175 feet
NGVD (2178.3 feet NAVD).
The removal of Copco No. 1 and Iron Gate dams requires the successful completion of modifications to restore and increase the discharge capacity of the existing diversion tunnels for low-level releases. Both require underwater work that KRRC will need to perform the year prior to reservoir drawdown. The design and fabrication of large gates that are the major component of both modifications will also require a significant lead time (up to 10 months for design and fabrication) ahead of installation. KRRC does not expect impacts to power generation for the modification work.
The following sections describe the diversion facilities and any modifications required prior to reservoir drawdown.

Definite Plan
84 04 | Reservoir Drawdown and Diversion Plan June 2018
4.2.1 J.C. Boyle Reservoir
Water releases for reservoir drawdown at J.C. Boyle will be made through the gated spillway (crest elevation 3785.2), the power canal (intake invert elevation 3771.7), and through the two 9.5- by 10-foot diversion culverts (invert elevation 3755.2) located below the gated spillway (see Figure 4.2-1(B). Modifications of these facilities are not required prior to drawdown. Figure 4.2-2 shows discharge rating curves for the J.C. Boyle facilities, as well as the stage-storage curve for J.C. Boyle Reservoir.
Figure 4.2-1 J.C. Boyle Diversion Facilities (Appendix B)
Figure 4.2-2 Discharge Rating Curve and Stage-Storage Curve for J.C. Boyle
4.2.2 Copco Lake
KRRC analyzed two options for reservoir drawdown at Copco No. 1. Option 2 is the action proposed by KRRC, but Option 1 was also included in the drawdown analysis because it was the method originally proposed in the Detailed Plan.

Definite Plan
June 2018 04 | Reservoir Drawdown and Diversion Plan 85
Option 1 (for comparison only) includes making releases through a combination of the diversion tunnel modified to restore operation through three existing 6–foot-diameter pipes in the diversion tunnel intake structure, in addition to a series of notches sequentially excavated in the dam. Option 2 would make releases solely through the diversion tunnel modified to restore full use of the tunnel by installing a new large gate at the downstream end of the tunnel and removing the intake structure at the upstream end. Figure 4.2-3 shows discharge rating curves for the diversion facilities for the two Copco No. 1 options, as well as the stage-storage curve for Copco Lake.
Figure 4.2-3 Discharge Rating Curve and Stage-Storage Curve for Copco No. 1
The following sections provide a more detailed description of the diversion tunnel modifications analyzed for Option 1 and Option 2. KRRC will perform the Option 2 modification prior to reservoir drawdown, in 2020.
Option 1 (for comparison only) – Diversion Tunnel Modification to Restore Release Capacity
1. Design, fabricate, and deliver three new 6- by 6-foot slide gates. 2. Mobilize barge-mounted crane onto Copco Lake (assume normal RWS elevation 2609.5). Remove
deposited sediment from diversion tunnel intake using clamshell or suction dredge, as required.
Definite Plan
86 04 | Reservoir Drawdown and Diversion Plan June 2018
3. Remove three existing 72-inch flap gates on the upstream face of diversion intake structure (invert elevation 2485.5) under balanced head and no flow conditions, using hard hat divers (124-foot depth) (Figure 4.2-4 (B)). Upstream tunnel should be full of water (due to valve leakage since tunnel was plugged), but should be confirmed.
4. Install three new 6- by 6-foot slide gates with hydraulic operators and remote controls at upstream face of diversion structure using hard hat divers (see Figure 4.2-4(B)).
5. With new upstream slide gates and diversion intake closed, drill drain and air vent holes through concrete tunnel plug from downstream side to unwater tunnel (see Figure 4.2-5(B)). Remove concrete tunnel plug in dry conditions. Inspect the unlined diversion tunnel for possible reinforcement (lining with shotcrete or concrete) or repairs.
6. Remove (or open) three existing 72-inch butterfly valve disks from downstream side of inlet in dry conditions, after drilling drain and air vent holes through each disk. Determine need for air vent piping and provide as necessary for operation of upstream slide gates.
7. All work in the tunnel would be in compliance with local, state and federal codes and regulations (e.g., Title 29 of the Code of Federal Regulations (29 CFR 1926.800)) and would include safety provision of adequate ground control, flood control, air monitoring, ventilation, illumination, communication, personal protective equipment, access and egress procedures, mechanical equipment, and emergency procedures.
Figure 4.2-4 Copco No. 1 Diversion Modification, Intake Structure (Appendix B)
Figure 4.2-5 Copco No. 1 Diversion Modification, Tunnel (Appendix B)
Option 2 (proposed action) – Diversion Tunnel Modification to Increase Release Capacity
1. Design, fabricate, and deliver new 14- by 16-foot roller gate. 2. Construct new gate shaft with new gate structure and 14-foot by 16-foot roller gate at downstream
end of diversion tunnel (see Figure 4.2-6 (B)). 3. Mobilize barge-mounted crane onto Copco Lake (assume normal RWS elevation 2609.5). Remove
sediment from diversion tunnel (see Figure 4.2-4(B)) intake using clamshell or suction dredge, as required.
4. Remove three existing 72-inch flap (or “clack”) gates on upstream face of diversion intake structure (invert elevation 2485.5) under balanced head and no flow conditions, using hard hat divers (124-foot depth). Upstream tunnel should be full of water (due to valve leakage since tunnel was plugged), but should be confirmed. Install three new 6-foot blind flanges (see Figure 4-2.4(B)) using hard hat divers.
5. With new blind flanges in place, drill drain and air vent holes through concrete tunnel plug from downstream side to unwater tunnel (see Figure 4.2-5(B)). Remove concrete tunnel plug in dry conditions. Inspect the unlined diversion tunnel for possible reinforcement (lining with shotcrete or concrete) or repairs. Line tunnel with shotcrete or concrete, if determined to be necessary.

Definite Plan
June 2018 04 | Reservoir Drawdown and Diversion Plan 87
6. Remove three existing 72-inch butterfly valve disks from downstream side of inlet in dry conditions, after drilling drain and air vent holes through each disk.
7. Close new large gate and fill tunnel upstream of gate with water. 9 Under balanced head and no flow conditions, remove the 6-foot blind flanges at the inlet using hard hat divers.
8. Using hard hat divers, demolish intake structure and install grating to minimize potential for large debris entering the diversion tunnel.
9. Perform all work inside the tunnel in the same manner described for Copco No. 1 (Option 1).
Figure 4.2-6 Copco No. 1 Diversion Modification, New Gate Structure (Appendix B)
4.2.3 Iron Gate Reservoir
Reservoir drawdown at Iron Gate Dam will involve releases made solely through the diversion tunnel. KRRC will modify the diversion to restore full use of the tunnel by installing a new large gate in place of the current concrete bulkhead and gate. Figure 4.2-7shows discharge rating curves for the diversion facilities for Iron Gate Dam, as well as the stage-storage curve for Iron Gate Reservoir.
A detailed description of the Iron Gate diversion tunnel modifications includes the following:
1. Design, fabricate, and deliver new 14- by 16-foot roller gate. 2. With the existing gate closed, remove downstream stop-log structure and miscellaneous metalwork
from downstream tunnel in the dry. Maintain air vent pipe in tunnel crown if needed for final operation. Securely bolt existing blind flange to the reinforced concrete ring downstream of the concrete sluice gates (see Figure 4.2-8(B)) to retain full reservoir head. A preliminary assessment indicates the existing features are capable of accommodating this loading condition and KRRC’s contractor will verify this prior to construction.
3. Raise upper sluice gate slowly to fill portion of downstream tunnel between the gates and blind flange. Provide air vent and drain valve through downstream concrete ring as necessary. Close air vent when filling has been completed.
4. Mobilize a barge-mounted crane onto the reservoir in June 2020. Raise the upper sluice gate to top of control tower using the existing hoist and remove using barge-mounted crane. Send hard-hat divers to the bottom of wet-well shaft to install lifting device for lower diversion gate, and to cut welded connection along downstream seal of lower diversion gate.
5. Raise the lower diversion gate to the top of the control tower using existing hoist and remove using barge-mounted crane. Install new 16.5- by 18-foot roller gate into existing slots in gate shaft (with a 160-foot design head) using hard hat divers and barge-mounted crane. Install new gate operator with remote controls. Close new roller gate.
9 Tunnel filling could be accomplished several ways such as by inserting a small valve into the blind flange or by drilling a small opening into the tunnel adjacent to the intake structure.

Definite Plan
88 04 | Reservoir Drawdown and Diversion Plan June 2018
6. With new roller gate closed, drain downstream tunnel using air vent and drain valve provided at the blind flange. Remove blind flange and reinforced concrete ring.
Figure 4.2-7 Discharge Rating Curve and Stage-Storage Curve for Iron Gate
7. Inspect the downstream portion of the diversion tunnel for possible reinforcement (lining with shotcrete or concrete) or repairs (see Figure 4.2-8 (B)).
8. Perform all work inside the tunnel in the same manner described for Copco No. 1 (Option 1) in Section 4.2.2.
Figure 4.2-8 Iron Gate Diversion Modification (Appendix B)
4.2.4 Drawdown Controls
KRRC’s contractor will manage the drawdown of Copco No. 1 and Iron Gate reservoirs through automated gate control systems with operator oversight. Inputs to determine the amount of gate opening at each reservoir will include continuous measurement of reservoir levels by remote sensor. The gate control system will incrementally open (or close) the gate to increase (or decrease) flow through the diversion tunnel to

Definite Plan
June 2018 04 | Reservoir Drawdown and Diversion Plan 89
maintain the reservoir drawdown at an approximate constant rate as the inflows vary due to watershed response to storms or due to changes in drawdown rates of upstream reservoirs.
Once the Copco No. 1 and Iron Gate reservoirs have reached full drawdown, the gates will remain in the full open position to limit reservoir refilling during subsequent storm events. Storm inflows large enough to cause refilling of the reservoir will pass through the spillway.
For this analysis, KRRC assumed that the gates on the diversion tunnels would temporarily be closed during a large storm event once outflow over the spillway reached a pre-determined discharge level. The gates fully open again once discharge over the spillway dropped back below the pre-determined level. At Copco No. 1, this was assumed to be 13,000 cfs (between the 10-year and 20-year events) to help prevent downstream flooding of the Copco No. 2 powerhouse. At Iron Gate Dam, the discharge level was set to 15,000 cfs, which is just above the 10-year peak flow.
The spillway and then the capacity of the power intake will control the initial drawdown on J.C. Boyle Reservoir. Once the reservoir stabilizes with the spillway and intake fully open, the diversion culvert concrete stop logs in the culverts will be blasted, and flow will only be controlled by the capacity of the culverts, which is about 6,000 cfs at the spillway elevation (between the 2 and 5-year events). For storm flows that refill the reservoir before deconstruction, higher discharge rates will be experienced over the spillway.
4.3 Flood Frequency Analysis Flood frequency analyses were performed at four locations on the Klamath River using the USACE HEC-SSP software (V2.1), following the Bulletin 17B method for Log-Pearson Type III distributions (USGS 1982). 10 Table 4.3-1 provides details on the gauges. J.C. Boyle and Copco records correlate well with the Keno data. Therefore, KRRC extended the records at J.C. Boyle and Copco based on linear correlations with USGS gauge data at Keno to allow for a coincident period of analysis. Appendix F provides the correlations used to extend the data. KRRC could not obtain a good correlation with Keno data for Iron Gate gauge, likely due to significant tributary inflows. Therefore, KRRC used the historical period of record (1960 to 2017) for Iron Gate.
10 Log-Pearson Type III distributions are intended to fit the distribution of annual peak flows from natural watersheds (i.e., non-regulated watersheds). The Klamath Basin is highly regulated for irrigation water supplies and fishery flows, but the regulated flows primarily describe low flows (non-storm event flows) as there are no flood control reservoirs in the basin. We found that after ignoring the low flows in the data, the annual peak flow data fit well with the Log-Pearson Type III distribution.
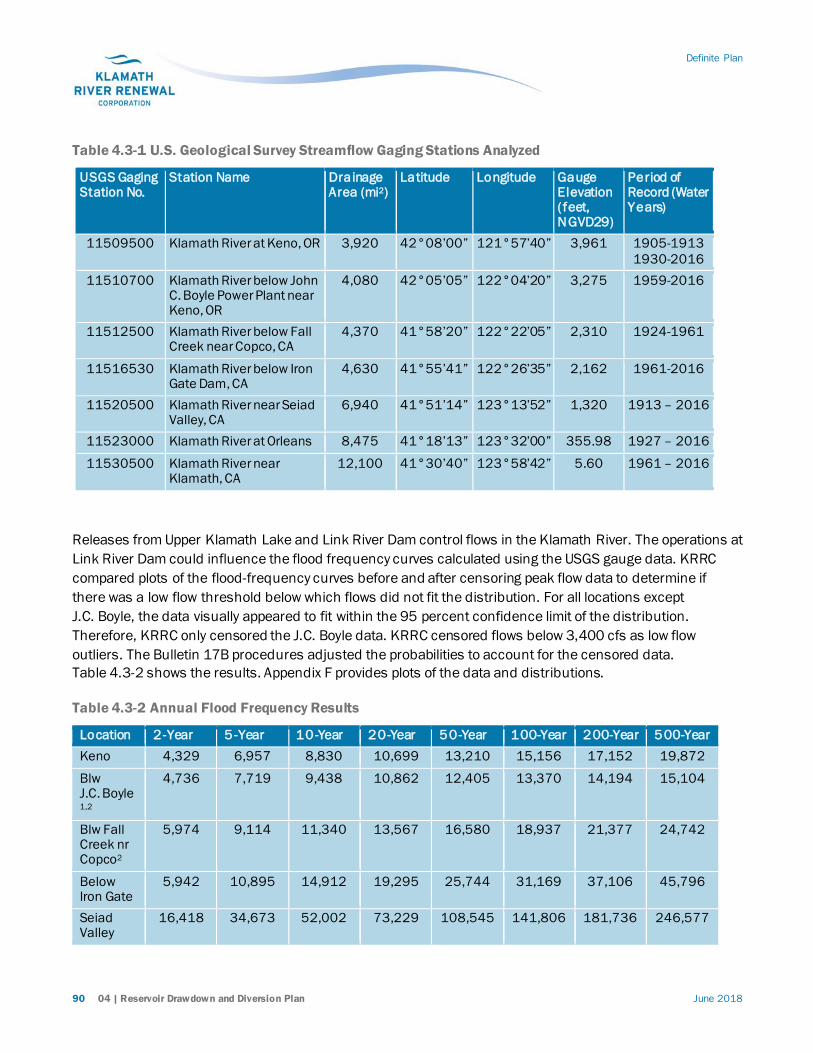
Definite Plan
90 04 | Reservoir Drawdown and Diversion Plan June 2018
Table 4.3-1 U.S. Geological Survey Streamflow Gaging Stations Analyzed
USGS Gaging Station No.
Station Name Drainage Area (mi2)
Latitude Longitude Gauge Elevation (feet, NGVD29)
Period of Record (Water Years)
11509500 Klamath River at Keno, OR 3,920 42°08’00” 121°57’40” 3,961 1905-1913 1930-2016
11510700 Klamath River below John C. Boyle Power Plant near Keno, OR
4,080 42°05’05” 122°04’20” 3,275 1959-2016
11512500 Klamath River below Fall Creek near Copco, CA
4,370 41°58’20” 122°22’05” 2,310 1924-1961
11516530 Klamath River below Iron Gate Dam, CA
4,630 41°55’41” 122°26’35” 2,162 1961-2016
11520500 Klamath River near Seiad Valley, CA
6,940 41°51’14” 123°13’52” 1,320 1913 – 2016
11523000 Klamath River at Orleans 8,475 41°18’13” 123°32’00” 355.98 1927 – 2016
11530500 Klamath River near Klamath, CA
12,100 41°30’40” 123°58’42” 5.60 1961 – 2016
Releases from Upper Klamath Lake and Link River Dam control flows in the Klamath River. The operations at Link River Dam could influence the flood frequency curves calculated using the USGS gauge data. KRRC compared plots of the flood-frequency curves before and after censoring peak flow data to determine if there was a low flow threshold below which flows did not fit the distribution. For all locations except J.C. Boyle, the data visually appeared to fit within the 95 percent confidence limit of the distribution. Therefore, KRRC only censored the J.C. Boyle data. KRRC censored flows below 3,400 cfs as low flow outliers. The Bulletin 17B procedures adjusted the probabilities to account for the censored data. Table 4.3-2 shows the results. Appendix F provides plots of the data and distributions.
Table 4.3-2 Annual Flood Frequency Results
Location 2-Year 5-Year 10-Year 20-Year 50-Year 100-Year 200-Year 500-Year Keno 4,329 6,957 8,830 10,699 13,210 15,156 17,152 19,872
Blw J.C. Boyle 1,2
4,736 7,719 9,438 10,862 12,405 13,370 14,194 15,104
Blw Fall Creek nr Copco2
5,974 9,114 11,340 13,567 16,580 18,937 21,377 24,742
Below Iron Gate
5,942 10,895 14,912 19,295 25,744 31,169 37,106 45,796
Seiad Valley
16,418 34,673 52,002 73,229 108,545 141,806 181,736 246,577

Definite Plan
June 2018 04 | Reservoir Drawdown and Diversion Plan 91
Orleans 61,712 114,819 157,209 202,710 268,332 322,432 380,576 463,907 Klamath 140,056 239,890 313,456 388,200 490,163 570,125 652,719 766,069
Notes: 1. Flows below 3,400 cfs were censored as low flow outliers due to the influence of Link River Dam. 2. The gauge record was extended to cover 1932 to 2017 based on the flows measured at the Keno gauge.
4.4 Summer Flow Frequency Analysis This section describes the analysis of summer flows into J.C. Boyle and Iron Gate reservoirs. KRRC conducted a frequency analysis of summer flows to determine the flow rates associated with low frequency events such as the 1% probable event for the months May through September. KRRC then used these results to calculate the peak water surface elevations in the reservoir associated with these events. The analysis used USGS measured stream flow data for the two gauges shown in Table 4.4-1.
Table 4.4-1 USGS Gauge Data Used in the Summer Flows Frequency Analysis
USGS Gauge Number
Gauge Name Annual Maximum and Daily Average Flow Period of Record
15 minute data, Period of Record1
11510700 Klamath River BLW John C Boyle Powerplant, Nr Keno OR
1/1/1959 -7/11/ 2017 5/1/1967 – 9/30/2017
11516530 Klamath River Below Iron Gate Dam, CA
10/1/1960 – 7/11/2017 5/1/1989 – 9/30/2017
1 Date range only includes summer data (May through September)
Annual maximum peak flow, average daily flow, and instantaneous (generally 15- to 30-minute intervals) flow data are available at both gauges. Since the maximum annual peak flow data generally occur in the winter, and peak summer flow data are required for this analysis, KRRC used the instantaneous flow data to estimate the annual peak flow for each month from May through September.
4.4.1 Iron Gate Reservoir
The Iron Gate gauge is located just downstream from Iron Gate Dam. It drains an area of 4,630 square miles. Bogus Creek is a small tributary located between Iron Gate Dam and the Iron Gate gauge. It drains an area of 52 square miles, which is approximately 1% of the Iron Gate gauge drainage area, so KRRC assumed it did not significantly affect the peak flow statistics for the Iron Gate gauge. Iron Gate reservoir is a run-of-the river reservoir used for power generation, and it is generally not used to store runoff. Therefore, it was assumed that the flow measured downstream of the dam is representative of the inflow to the reservoir, especially for infrequent events such as a 1% annual peak event (i.e., 100-year event).
Fifty-seven years (1961-2017) of average daily and instantaneous annual maximum flow rates are available at the Iron Gate gauge. In addition, 29 years (1989 – 2017) of 15-minute data are available. The Detailed Plan used the average daily flows to estimate the peak summer flows. Since instantaneous flows are larger

Definite Plan
92 04 | Reservoir Drawdown and Diversion Plan June 2018
than the average daily flows, the Detailed Plan used a correction factor based on comparing the annual maximum instantaneous flow to the average daily flow on the same day. Figure 4.4-1 compares the instantaneous flows to the daily average flow rates for the same day for the years 1961 to 2017. The comparison indicates that the annual maximum instantaneous flows are about 14% higher than the daily average flow for the same day using the relationship in Equation 4.4-1. For comparison, the Detailed Plan estimated instantaneous peaks from daily average values at the Iron Gate gauge using the relationship in Equation 4.4-2.
Equation 4.4-1
Qpeak = 1.1399 Qaverage – 161.08
Equation 4.4-2
Qpeak = 1.1408 Qaverage - 140.18
The difference between the relationships is the addition of 8 more years of data. As described below, KRRC used the 15-minute data for the flood frequency analysis. However, since the daily flow data has a longer period of record than was used in the Detailed Plan, results using the daily flow record are also presented in Figure 4.4-2 for comparison. KRRC calculated results using the regression equation shown in Figure 4.4-1 (Equation 4.4-1) for two periods: the same period as the 15-minute data (1989 – 2017) and the entire period of record (1961 – 2017). The results show that there is not much of a difference in the 100-year peak flows, regardless of the method or period of record used.
KRRC conducted a flood frequency analysis for each of the months from May through September using the peak flows based on the 15-minute data for each year within the period of record (1989 – 2017). Table 4.4-2 provides the flood frequency flows for the monthly peak flows for May through September. Table 4.4-3 provides the water surface elevations corresponding to the flows shown in Table 4.4-2. The diversion tunnel rating curve used in the drawdown study is the basis of these elevations. Note that the water surface elevations in the Detailed Plan were based on a slightly different rating curve.
The Detailed Plan used seasonal peak flow values for two seasons: June through October (representing June), and July through November (representing July). These periods were selected in the Detailed Plan because deconstruction of the Iron Gate and J.C. Boyle Dams will occur primarily from July 1 through November 30; and, the Detailed Plan did not permit any excavation of the embankment section of Iron Gate Dam until June 1 and required completion by September 30 to minimize hydrologic risk. For the Definite Plan, KRRC developed monthly flood frequency flows to better define the risk. However, Tables 4.4-2 and 4.4-3 also provide the seasonal flood frequency flows used in the Detailed Plan for comparison.
There were two very large storm events in the June data, one in 1993 (on June 5th) and one in 1998 (on June 1st). The 1993 peak flow in June was greater than any of the peak flows that occurred in May. In addition, there were a large number of low outliers in the May data (primarily in the first half of the month). Because of these large events in June and multiple low outliers in May, the extreme events in June (> 100-year) were greater than the similar extreme events in May.

Definite Plan
June 2018 04 | Reservoir Drawdown and Diversion Plan 93
The data indicate that there is a transition in the hydrology in June from winter to summer flows. Figure 4.4-2 shows the predicted 100-year event at Iron Gate for the period May through September (the predicted 100-year peak flows based on average daily values rather than 15-minute data are also provided for comparison since that method was used in the Detailed Plan). In May and the first half of June, the 100-year event is between approximately 8,000 and 10,000 cfs. It drops sharply in the second half of June through September when the 100-year event is between approximately 2,000 and 4,000 cfs.
Figure 4.4-3 plots the water surface elevations corresponding to the return periods shown in Table 4.4-3 for Iron Gate. Figure 4.4-3 clearly shows the reduced likelihood of higher reservoir levels starting in the middle of June.

Definite Plan
94 04 | Reservoir Drawdown and Diversion Plan June 2018
Figure 4.4-1 Relationship between Annual Maximum Flows and Daily Average Flow at the USGS Iron Gate Gauge

Definite Plan
June 2018 04 | Reservoir Drawdown and Diversion Plan 95
Table 4.4-2 Monthly Flood Frequency Flow at Iron Gate Reservoir
Exceed-ance Percent
Return Period
Maximum Peak Flow (cfs) USBR Studyd (cfs)
Y ears May June June (1-15)
June (16-30)
Jul y Aug Sept Aug Sept Jun - Oct
Jul - Nov
0.2 500 11,339 17,948 15,406 5,830 3,498 2,448 2,363 NA NA NA NA
0.5 200 10,212 12,549 11,348 4,837 3,081 2,237 2,201 NA NA NA NA
1 100 9,321 9,526 8,932 4,172 2,778 2,080 2,077 2585 3386 9647 8387
2 50 8,394 7,192 6,965 3,573 2,485 1,924 1,951 2503 3221 7724b 7095c
5 20a 7,100 4,903 4,918 2,868 2,107 1,718 1,779 2416 3052 6110 5914
10 10 6,054 3,622 3,700 2,388 1,825 1,558 1,641 2291 2816 4364 4497
20 5 4,923 2,629 2,703 1,943 1,538 1,390 1,492 NA NA NA NA
50 2 3,174 1,625 1,618 1,369 1,121 1,132 1,251 NA NA NA NA
a Detailed plan is for the 25-year event. b Detailed plan specifies to maintain a minimum flood release capacity of approximately 7,700 cfs in June (see Table
4.4-3 for elevation). c Detailed plan specifies to maintain a minimum flood release capacity of approximately 7,000 cfs in July (see Table
4.4-3 for elevation). d USBR Hydrology Studies for the Secretary’s Determination on Klamath River Dam Removal and Basin Restoration
(March 2011)
Table 4.4-3 Maximum Water Surface Elevation in Iron Gate Reservoir
Exceed-ance Percent
Return Period
Maximum Water Surface Elevation (ft, NAVD88)a Detailed Planb (ft, NAVD88)
Y ears May June June
(1-15) June
(16-30) Jul y Aug Sept Aug Sept Jun -
Oct Jul - Nov
0.2 500 2332.0 2335.3 2334.5 2236.3 2205.3 2196.4 2195.8 NA NA NA NA
0.5 200 2331.4 2332.5 2332.0 2221.2 2201.4 2195.0 2194.8 NA NA NA NA
1 100 2311.7 2317.2 2301.6 2212.7 2198.9 2194.0 2194.0 2193 2196 2294 2267
2 50 2288.3 2261.6 2257.0 2206.1 2196.7 2193.1 2193.3 2193 2195 2254 2243
5 20 2259.7 2222.1 2222.3 2199.6 2194.2 2192.1 2192.4 2192 2195 2227 2224
10 10 2240.1 2206.6 2207.4 2196.0 2192.6 2191.3 2191.7 2192 2194 2205 2207
20 5 2222.4 2197.7 2198.3 2193.2 2190.8 2187.4 2189.7 NA NA NA NA
50 2 2202.2 2191.6 2191.6 2187.2 2186.1 2186.2 2186.7 NA NA NA NA
a Bold values overtop the spillway at elevation 2331.5 feet NAVD88. b Elevations are from Appendix B in Detailed Plan – Iron Gate Diversion Capacities during Dam Removal. Values have
been rounded up to nearest foot and converted from NGVD29 to NAVD88 by adding 3.3 feet. c Detailed plan specifies to maintain a minimum flood release capacity of approximately 7,700 cfs in June which
corresponds to an elevation of 2254 feet NAVD88. d Detailed plan specifies to maintain a minimum flood release capacity of approximately 7,000 cfs in July which
corresponds to an elevation of between 2242 and 2243 feet NAVD88.

Definite Plan
96 04 | Reservoir Drawdown and Diversion Plan June 2018
Figure 4.4-2 Predicted 100-year Flood Flow at Iron Gate for the Period May through September
Figure 4.4-3 Frequency of Reservoir Levels at Iron Gate Dam for Summer Flows

Definite Plan
June 2018 04 | Reservoir Drawdown and Diversion Plan 97
4.4.2 J.C. Boyle Reservoir
The J.C. Boyle gauge is located 0.7 miles downstream from the J.C. Boyle powerhouse and 5 miles below the J.C. Boyle Dam. It drains an area of 4,080 square miles. There are no significant inputs to the river between the dam and the gauge. J.C. Boyle reservoir is a small run-of-the river reservoir used for power generation, and it does not store runoff. Therefore, it was assumed that the flow measured downstream of the dam is representative of the inflow to the reservoir, especially for infrequent events such as a 1% annual peak event (i.e., 100-year event).
Fifty nine years (1959-2017) of average daily and instantaneous annual maximum flow rates are available at the J.C. Boyle gauge. In addition, 30 years (1988 – 2017) of 15- to 30-minute data are available (data from 1967 are also available but were not used in the analysis). The Detailed Plan used the average daily flows to estimate the peak summer flows. Since instantaneous flows are larger than the average daily flows, the Detailed Plan used a correction factor based on comparing the annual maximum instantaneous flow to the average daily flow on the same day. Figure 4.4-4 compares the instantaneous flows to the daily average flow rates for the same day for the years 1959 to 2017 (the data only went to 2009 in the Detailed Plan). The comparison indicates that the annual maximum instantaneous flows are about 11% higher than the daily average flow for the same day using the relationship in Equation 4.4-3. For comparison, in the Detailed Plan estimated instantaneous peaks from daily average values at the J.C. Boyle gauge using the relationship in Equation 4.4-4.
Equation 4.4-3
Qpeak = 1.1142 Qaverage + 269.31
Equation 4.4-4
Qpeak = 1.0706 Qaverage + 863.66
For average daily flows less than about 3,200 cfs, the instantaneous peak flow is almost constant at about 2,800 cfs. This is likely due to flow controls from Upper Klamath Lake and Keno Dam. These values were not included in the regression relationship (i.e., data were censored). The Detailed Plan censored flows below 4,000 cfs when calculating the annual frequency distribution, but it did not state whether any censoring occurred as part of the seasonal frequency analysis. The regression plot [Figure 18 in the Hydrology Studies for the Secretary’s Determination on the Klamath River Dam Removal and Basin Restoration (USBR 2011b; Hydrology Report)] has significantly fewer data points than are found in the table of values in Appendix A of the same report. There are also no average daily flows less than 2,000 cfs or greater than 10,000 cfs shown on the plot in the Hydrology Report, though there are values of those magnitudes in the table of values in the appendix to the Hydrology Report. It appears that some data were censored but it is unclear which data and why.
KRRC conducted a flood frequency analysis for each of the months from May through September using the peak flows based on the 15- to 30-minute data for each year within the period of record (1988 – 2017). Table 4.4-4 provides the flood frequency flows for the monthly peak flows for May through September. Table

Definite Plan
98 04 | Reservoir Drawdown and Diversion Plan June 2018
4.4-5 provides the water surface elevations corresponding to the flows shown in in Table 4.4-4. The diversion tunnel rating curves used in the drawdown study are the basis for these elevations. Note that the water surface elevations in the Detailed Plan were based on a slightly different rating curve.
KRRC also conducted a flood frequency analysis using the maximum daily average flow for each of the months from May through September for comparison since that was the method used in the Detailed Plan. KRRC used the regression equation shown in Figure 4.4-4 with the monthly maximum daily average flows for two periods: the same period as the 15- to 30-minute data (1988 – 2017) and the entire period of record (1959 – 2017). Consistent with the results at Iron Gate, the results at J.C. Boyle also show that there is not much of a difference in the 100-year peak flows, regardless of the method or period of record used.
Similar to the results for Iron Gate, the data indicate that there is a transition in the hydrology in June from winter to summer flows. Figure 4.4-5 shows the predicted 100-year event at J.C. Boyle for the period May through September (the predicted 100-year peak flows based on average daily values rather than instantaneous data are also provided for comparison since that was used in the Detailed Plan). In May and the first half of June, the 100-year event is between approximately 7,000 and 11,000 cfs. It drops sharply in the second half of June through September when the 100-year event is between approximately 2,000 and 4,000 cfs.
Figure 4.4-6 plots the water surface elevations corresponding to the return periods shown in Table 4.4-5 for J.C. Boyle. Figure 4.4-6 clearly shows the reduced likelihood of higher reservoir levels starting in the middle of June.
Figure 4.4-4 Relationship between Annual Maximum Flows and Daily Average Flow at the USGS J.C. Boyle Powerhouse Gauge
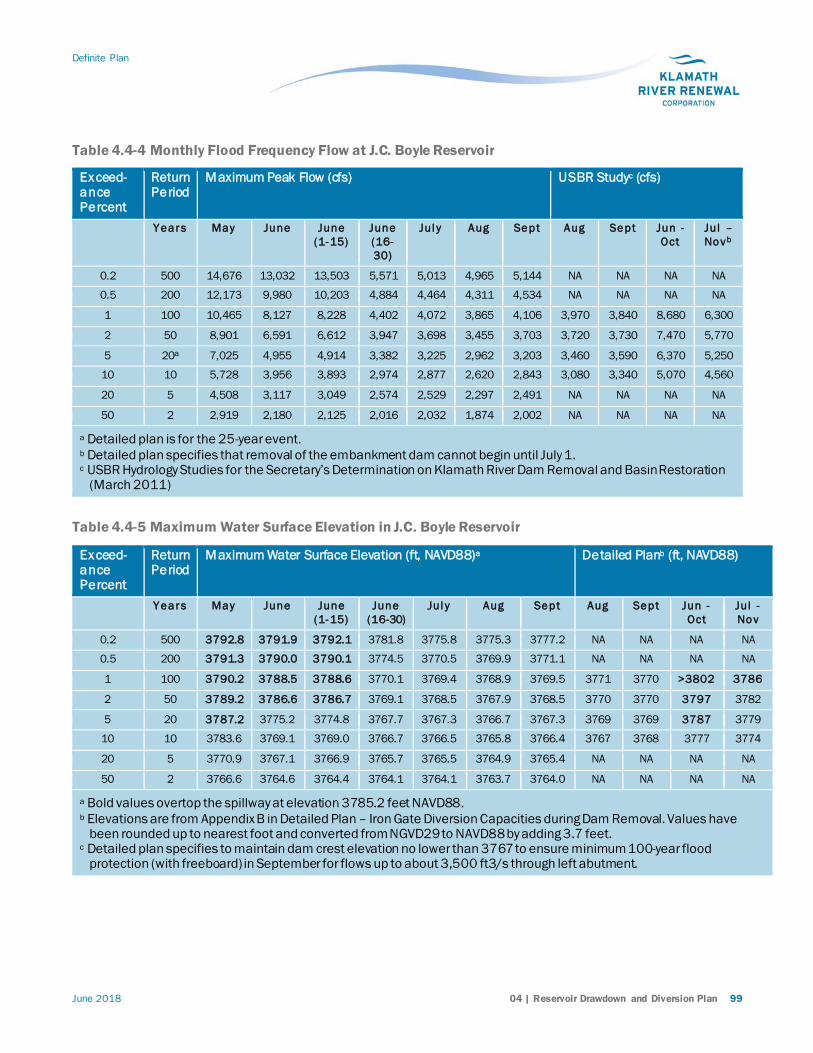
Definite Plan
June 2018 04 | Reservoir Drawdown and Diversion Plan 99
Table 4.4-4 Monthly Flood Frequency Flow at J.C. Boyle Reservoir
Exceed-ance Percent
Return Period
Maximum Peak Flow (cfs) USBR Studyc (cfs)
Y ears May June June (1-15)
June (16-30)
Jul y Aug Sept Aug Sept Jun - Oct
Jul – Novb
0.2 500 14,676 13,032 13,503 5,571 5,013 4,965 5,144 NA NA NA NA
0.5 200 12,173 9,980 10,203 4,884 4,464 4,311 4,534 NA NA NA NA
1 100 10,465 8,127 8,228 4,402 4,072 3,865 4,106 3,970 3,840 8,680 6,300
2 50 8,901 6,591 6,612 3,947 3,698 3,455 3,703 3,720 3,730 7,470 5,770
5 20a 7,025 4,955 4,914 3,382 3,225 2,962 3,203 3,460 3,590 6,370 5,250
10 10 5,728 3,956 3,893 2,974 2,877 2,620 2,843 3,080 3,340 5,070 4,560
20 5 4,508 3,117 3,049 2,574 2,529 2,297 2,491 NA NA NA NA
50 2 2,919 2,180 2,125 2,016 2,032 1,874 2,002 NA NA NA NA
a Detailed plan is for the 25-year event. b Detailed plan specifies that removal of the embankment dam cannot begin until July 1. c USBR Hydrology Studies for the Secretary’s Determination on Klamath River Dam Removal and Basin Restoration
(March 2011) Table 4.4-5 Maximum Water Surface Elevation in J.C. Boyle Reservoir
Exceed-ance Percent
Return Period
Maximum Water Surface Elevation (ft, NAVD88)a Detailed Planb (ft, NAVD88)
Y ears May June June
(1-15) June
(16-30) Jul y Aug Sept Aug Sept Jun -
Oct Jul - Nov
0.2 500 3792.8 3791.9 3792.1 3781.8 3775.8 3775.3 3777.2 NA NA NA NA
0.5 200 3791.3 3790.0 3790.1 3774.5 3770.5 3769.9 3771.1 NA NA NA NA
1 100 3790.2 3788.5 3788.6 3770.1 3769.4 3768.9 3769.5 3771 3770 >3802 3786
2 50 3789.2 3786.6 3786.7 3769.1 3768.5 3767.9 3768.5 3770 3770 3797 3782
5 20 3787.2 3775.2 3774.8 3767.7 3767.3 3766.7 3767.3 3769 3769 3787 3779
10 10 3783.6 3769.1 3769.0 3766.7 3766.5 3765.8 3766.4 3767 3768 3777 3774
20 5 3770.9 3767.1 3766.9 3765.7 3765.5 3764.9 3765.4 NA NA NA NA
50 2 3766.6 3764.6 3764.4 3764.1 3764.1 3763.7 3764.0 NA NA NA NA
a Bold values overtop the spillway at elevation 3785.2 feet NAVD88. b Elevations are from Appendix B in Detailed Plan – Iron Gate Diversion Capacities during Dam Removal. Values have
been rounded up to nearest foot and converted from NGVD29 to NAVD88 by adding 3.7 feet. c Detailed plan specifies to maintain dam crest elevation no lower than 3767 to ensure minimum 100-year flood
protection (with freeboard) in September for flows up to about 3,500 ft3/s through left abutment.

Definite Plan
100 04 | Reservoir Drawdown and Diversion Plan June 2018
Figure 4.4-5 Predicted 100-year Flood Flow at J.C. Boyle for the Period May through September
Figure 4.4-6 Frequency of Reservoir Levels at J.C. Boyle Dam for Summer Flows

Definite Plan
June 2018 04 | Reservoir Drawdown and Diversion Plan 101
4.5 Drawdown Timing KRRC proposes the simultaneous removal of the four dams with the dewatering periods scheduled to minimize sediment release into downstream areas during critical times for important aquatic species and life stages (e.g., anadromous fish spawning, rearing, and in- and out-migration). The deconstruction period, including site preparation, dewatering, and facilities removal, will occur over about 20 months. The drawdown period could vary depending on water year type, with longer drawdowns occurring during wet years and shorter drawdowns during dry years.
To reduce the uncertainty regarding the length of time over which flows with high suspended sediment concentrations will occur and potentially negatively affect aquatic resources, the Definite Plan includes an updated approach to the drawdown at Copco Lake. This updated approach (Option 2 summarized in Section 4.2) dewaters the reservoir via an upgraded diversion tunnel, and no longer relies on dam notching to complete the drawdown. In contrast, the dam notching proposed in the 2012 EIS/R and Detailed Plan could have caused delays during wet water years. Specifically, the Contractor would need to wait in wet years for the water level to drop below the crest to enable equipment access to the notch area to complete the next notch. These delays can be seen in the modeling results discussed further in Section 4.6.
Therefore, relying on the diversion tunnel at Copco No. 1, rather than notching, significantly increases the likelihood that drawdown, or at least an initial drawdown, will occur by the end of February. Thus, the release of the majority of suspended sediment during that period will reduce the likelihood of high suspended sediment concentrations after March 15.
Due to the improvement of the probability of drawdown being completed within the January 1 to March 15 time period, the potential effects on downstream environmental resources by deconstruction implementation during a wet year is considered to be similar to potential effects in a normal water year. The updated drawdown approach at Copco No. 1 significantly reduces the probability of an increase in the cost of deconstruction of Copco No. 1 due to the occurrence of a wet year because drawdown is much less likely affected by high flows.
In the proposed construction schedule, the embankment removals at Iron Gate Dam and J.C. Boyle Dam and the concrete dam removal at Copco No. 1 Dam within the river channel will all start between May and July and be completed by October, months when high flows have receded in most years. The embankment removal schedules assume that the minimum embankment height maintained through removal will accommodate a 0.01 chance (100-year) storm plus 3 feet of freeboard in any given month. If a wet year were to delay the start of embankment or concrete removal to July, KRRC’s Contractor will increase productivity to complete the removal on time.
Based on the discussions and analyses summarized above, the current drawdown schedule minimizes the release of sediment during the previously identified critical times for important species and life stages.

Definite Plan
102 04 | Reservoir Drawdown and Diversion Plan June 2018
4.6 Reservoir Drawdown Releases The following sections describe how KRRC will use the diversion facilities to draw down the reservoirs and release sediment, the timing of the discharges, the range of discharge rates anticipated, the portion of discharge associated with specific structures, and the change in reservoir elevation per day.
Copco No. 2 Dam does not impound a significant volume of sediment, and KRRC will remove it during the same year as the three larger dams. Drawdown of Copco No. 2 Reservoir will not be necessary until after Copco No. 1 Dam has been breached to final grade. No drawdown rate limitations will apply to the removal of Copco No. 2 Dam.
Analyses of the embankment and reservoir rims demonstrate the Project will maintain adequate factors of safety to prevent embankment slope instability provided the drawdown rate is controlled (see Appendices D and E). Based on analyses in Appendix E, the reservoir rim stability is independent of drawdown rate. Reservoir drawdown rates at Iron Gate, Copco No. 1, and J.C. Boyle (until diversion culverts are opened) will be limited to 5 feet per day; however, the actual drawdown rates may be less (or negative) during storm periods because of increased inflows to the reservoirs. For the modeling, KRRC assumed the starting elevations of Iron Gate and Copco No. 1 were at the spillway crest on January 1. 11 KRRC assumed the starting elevation at J.C. Boyle was the normal operating elevation on January 1.
To provide information on the range of flows that are likely to be released from the reservoirs during drawdown, a detailed analysis of the reservoir drawdown for water years 1961 through 2009 was completed. The purpose of this analysis was to provide information on the following points.
1. Anticipated discharges from each reservoir to the Klamath River in cfs associated with reservoir drawdown operations.
2. Description of structures used for reservoir drawdown operations including the flow (cfs) anticipated for each structure during drawdown operations.
3. Timing of reservoir drawdown operations. 4. For each reservoir, confirmation on proposed reservoir elevation change per day.
Section 4.6.1 describes the detailed analysis. Table 4.6-1 provides the range of approximate additional outflow due to minimum and maximum reservoir drawdown rates. The maximum drawdown rate is set at 5 feet per day until drained, and the minimum drawdown rate assumes it takes 59 days to drain the reservoir (January 1 to February 28). These flows will be in addition to the flows in the river from Keno Reservoir releases and tributary contributions. For comparison, Table 4.6-1 also provides the average release flows as a percentage of 2-year and 10-year peak flows in the Klamath River.
For J.C. Boyle, KRRC expects the increase in flow to the river due to drawdown to be from less than 1% up to 3%. For Copco No. 1, KRRC expects the increase to be between 3% and 13%, and for Iron Gate, KRRC
11 Copco Lake drawdown from normal operating elevation is assumed to begin on November 1 (prior to the January 1 drawdown process). The period from November 1 to January 1 is assumed sufficient to draw down from normal operating elevation to the spillway crest elevation (approximately 12.5 feet) with a maximum historic drawdown of 2 feet per day. The Copco Lake modeling starts on January 1 with the reservoir elevation at the spillway crest.

Definite Plan
June 2018 04 | Reservoir Drawdown and Diversion Plan 103
expects the increase to be between 3% and 14%. Note the minimum drawdown rate will likely occur during periods with large storm events, so the increase in flow will be closer to the <1% to 3% range during a storm event at the three reservoirs (see Column 8 in Table 4.6-1).
During dry periods the reservoirs can be drawn down quicker, resulting in a larger percent increase in flow to the river, but since the river flows are relatively small, the impacts are not necessarily greater (see column 10 in Table 4.6-1). For comparison, the 2-year flood downstream of J.C. Boyle is 4,700 cfs and at Iron Gate is 5,900 cfs. The 5-year flood event downstream of J.C. Boyle is 7,700 cfs and at Iron Gate is 10,900 cfs. Compared to these flood events, the incremental increase in flow due to reservoir drawdown is minimal.
Table 4.6-1 Range of Release Flows from Reservoirs due to Drawdown
Reservoir Ini tial WSE (ft, NAVD)
Invert El evation o f Di version Structure (ft, NAVD)
To tal Depth (feet)1
To tal Vo lume (acre-feet)2
Mi n Avg Re lease F l ow (cfs)3
Mi n Avg as % of 2-Y ear F l ow in Kl amath R i ver4
Mi n Avg as % of 10-Y ear F l ow in Kl amath R i ver5
Max Avg Re lease F l ow (cfs)6
Max Avg as % of 2-Y ear F l ow in Kl amath R i ver4
Max Avg as % of 10-Y ear F l ow in Kl amath R i ver5
(1) (2) (3) (4) (5) (6) (7) (8) (9) (10) (11) J.C. Boyle 3796.7 3755.2 41.5 2,267 19.4 0.4% 0.2% 138 3% 1% Copco 2597 2485.5 111.5 33,724 288 5% 3% 762 13% 7% Iron Gate 2331.3 2176.3 155 50,941 435 7% 3% 828 14% 6% Notes: 1. Depth calculated as difference between normal operating level (J.C. Boyle) or spillway elevation (Copco and Iron
Gate) and invert elevation of diversion structure. 2. These are total volumes based on a 2003 bathymetric survey (Eilers and Gubala 2003). See Sections 2.1.1, 2.2.1,
and 2.4.1 for total volumes associated with each reservoir. 3. Minimum assumes 59 days to drain reservoir. 4. Based on flood frequency results in Table 4.3-2 for 2-year flow (4,736 cfs for J.C. Boyle; 5,974 cfs for Copco; and
5,942 cfs for Iron Gate). 5. Based on flood frequency results in Table 4.3-2 for 10-year flow (9,438 cfs for J.C. Boyle; 11,340 cfs for Copco; and
14,912 cfs for Iron Gate). 6. Maximum assumes continuous drawdown of 5 feet per day for total reservoir depth.
4.6.1 Detailed Modeling KRRC conducted detailed analysis of the drawdown using the USACE Hydrologic Engineering Center River Analysis System (HEC-RAS) model (version 5.0.3). KRRC used the model to calculate flows and water levels due to the drawdown of J.C. Boyle Reservoir, Copco Lake, and Iron Gate Reservoir. For modeling stability purposes, KRRC divided the Klamath River into two modeling reaches. Reach 1 covers the J.C. Boyle Reservoir and extends from approximately 1 mile upstream of J.C. Boyle Reservoir to approximately 0.4 mile downstream of J.C. Boyle Dam. Reach 2 extends from approximately 1.5 miles upstream of Copco Lake to approximately 0.6 mile downstream of Iron Gate Dam.
The HEC-RAS model requires inputs for topography/bathymetry, inflow rates, and rating curves for dam outlets. The following sections discuss input sources and data.

Definite Plan
104 04 | Reservoir Drawdown and Diversion Plan June 2018
Topography/Bathymetry
KRRC generally obtained the cross-section bathymetry in the HEC-RAS model from the SRH1-D model provided by the USBR. The data were representative of Scenario 8 in USBR (2012). The bathymetry data extended from above J.C. Boyle to Happy Camp, CA, however KRRC only used the data for the two reaches listed above.
Inflow Rate
KRRC used inflow data based on the Klamath Basin Restoration Agreement (KBRA) flows as river flows (Keno flows). 12 KRRC obtained these flows from the SRH1-D model input files (USBR 2012c). The data were compared to the measured flows at the USGS gauge at Keno (gauge no. 11509500, Klamath River at Keno, OR). Figure 4.6-1 compares the USGS measured data at Keno to the SRH1-D data used in the model. As seen in the figure, the Keno flows closely follow the measured flows at the USGS Keno gauge but some of the variability has been “smoothed” out during non-storm periods when the Keno flows are relatively constant by month. During large storms the Keno flows data occasionally have a sharp peak that exceeds the USGS measured flows. These sharp peaks generally last a few days. During the winter (January – April), including the months when drawdown will occur, the flow frequency curve for the flows used in the model and the measured USGS flows are very similar. The data prior to 1969 appears to be time shifted or mislabeled by approximately 1 year.
KRRC simulated water years 1961 through 2009 in the model. Results are presented for 6 years representative of the various conditions that could occur during construction (results for the other years are provided in Appendix F). All simulations started on January 1 with J.C. Boyle at normal operating elevation and Copco Lake and Iron Gate reservoirs full to the spillway crest elevation. It is possible that during construction, water levels could be lower or higher depending upon the hydrologic conditions that occurred in the preceding December. The 6 years selected for discussion are summarized below:
• 1965: Largest storm of record occurred between December 1964 and April 1965 (Corresponds to water year 1966 in the SRH1-D and HEC-RAS output)
• 1970: Years drier than 1970 (based on ranking the maximum 15-day volume of flow between January and May at Keno) drained by March 1
• 1973: The median year based on ranking the maximum 15-day volume of flow between January and May at Keno
• 1979: Representative dry year
• 1986: Representative wet year
• 2006: Representative wet year
12 The 2013 Joint Biological Opinion for USBR’s Klamath Irrigation Project (NMFS and USFWS 2013) modified the flows from the 2010 KBRA. The 2013 Joint Biological Opinion slightly increases the annual average water supply by about 9,000 acre feet when compared with the KBRA Flows, and it maintains higher minimum summer flows in dry years. The changes to flows in January and February (during drawdown) are negligible. The small changes to flows in the 2013 Joint Biological Opinion will not affect the drawdown of the reservoirs, nor the level of flows released during drawdown. NMFS and USFWS are working on a new Joint Biological Opinion to be released in 2019, which may again alter flows released by USBR’s Klamath Irrigation Project.

Definite Plan
June 2018 04 | Reservoir Drawdown and Diversion Plan 105
Figure 4.6-1 Comparison of Gauged Flows at Keno to Modeled Flows in SRH-1D

Definite Plan
106 04 | Reservoir Drawdown and Diversion Plan June 2018
4.6.2 J.C. Boyle Reservoir
Drawdown Procedure
The following numbered list summarizes the drawdown procedure at J.C. Boyle:
1. Reservoir drawdown will begin on January 1, 2021 by making controlled releases through the gated spillway (crest elevation 3785.2) and the power intake (invert elevation 3771.7). Additional discharges to the river during drawdown using the spillway and power canal will be on the order of the values shown in Table 4.6-1 but these will be short-term. Once the reservoir drawdown elevation (dependent on base inflow) stabilizes with both the spillway and power intakes fully open, KRRC’s contractor will hold the reservoir elevation for about a week. However, because of the minimal storage available above the power intake invert, the water level in the reservoir will fluctuate in concert with the changing inflow. The maximum flow through the power intake is about 2,800 cfs. About 25% of the analyzed years for drawdown have an average flow in January greater than 2,800 cfs and almost 40% have a maximum flow greater than 2,800 cfs. Flows above about 2,800 cfs will go over the spillway.
2. With the reservoir at the lowest possible level (depending upon inflow) using spillway and power intake, drawdown will continue by removing the concrete stoplogs from one 9.5- by 10-foot bay of the 2-bay diversion culvert (invert elevation 3755.2) by blasting, if necessary.13 There is relatively little storage below the spillway crest elevation compared to storm volumes, so the elevation will change rapidly with changes in inflow rate. Additional drawdown releases will rapidly increase to a maximum of about 3,000 cfs for a short duration dropping back to near the inflow value over a period of a few hours. For reference, the 2-year and 5-year flow events downstream of J.C. Boyle Dam are 4,736 cfs and 7,719 cfs, respectively. The reservoir elevation will be allowed to stabilize and be held for one to two weeks to allow dissipation of pore pressures in the embankment and the reservoir rim.
3. With the reservoir at the lowest possible level (depending upon inflow), drawdown will continue by removing the concrete stoplogs from the remaining two 9.5- by 10-foot diversion culverts (invert elevation 3755.2) by blasting, if necessary.14 Additional drawdown releases will rapidly increase to a maximum of 1,000 to 2,000 cfs for a short duration, dropping back to the inflow value over a period of about an hour or less. This will provide the maximum reservoir drawdown possible prior to removal of the dam embankment section, except for the natural drawdown resulting from the subsequent reduction of streamflow. The reservoir drawdown should be completed by January 31, 2021 to minimize potential impacts at the downstream dam removal sites. KRRC assumes the potential formation of reservoir ice in January at this site will not impact reservoir drawdown significantly during this period. Reservoir releases at the dam will be maintained below any ice cover.
4. The timing of the removal of the stoplogs from either diversion culvert will take into consideration inflow conditions with a possibility of shifting stoplog removal to avoid contributing additional flow during very high flow conditions. The power intake gate will be closed once the reservoir is drawn
13 For modeling purposes, KRRC assumes the 1st culvert opens on January 14. 14 For modeling purposes, KRRC assumes the 2nd culvert opens on February 1.
Definite Plan
June 2018 04 | Reservoir Drawdown and Diversion Plan 107
down below the intake invert or following removal of the stoplogs from the second bay of the diversion culvert, whichever is earlier, and the power canal will be drained through the powerhouse turbines, not through the forebay spillway.
Results
Figures 4.6-2 through 4.6-7 show results from the HEC-RAS analysis for the six representative years discussed above. Because of the small size of the J.C. Boyle Reservoir, the reservoir will refill partially or completely during a storm until dam removal is complete. The capacity of the two diversion culverts for water levels below the spillway elevation is about 5,700 cfs. The results show about 15% of the years have a maximum January or February flow that exceeds 5,000 cfs and will result in reservoir refilling and associated flows over the spillway.
During the representative drier years (1973 and 1979, see Figures 4.6-6 and 4.6-7), the reservoir easily draws down in January, and it did not refill after that point.
During the representative wetter years of 196615, 2006 and 1986 (see Figures 4.6-2, 4.6-3 and 4.6-4), the reservoir completely draws down early (January to mid-February), but quickly refills later in the year when storms occur. The majority of the accumulated sediment will mobilize during the initial drawdown, and subsequent reservoir filling and drawdown is expected to cause only moderate increases in high suspended sediment (relative to background) (USBR 2012c).
For all water years, any increase in peak flows with drawdown compared to peak flows without drawdown is small due to the relatively limited amount of attenuation associated with the existing reservoir.
KRRC does not anticipate that sediment concentrations resulting from the proposed drawdown procedure and associated hydraulics will differ from those previously estimated (USBR 2012c).
15 Largest storm of record occurred between December 1964 and April 1965 in WY1965, but due to the data shift noted in Section 4.6.1, this corresponds to WY1966 in the modeling.

Definite Plan
108 04 | Reservoir Drawdown and Diversion Plan June 2018
Figure 4.6-2 J.C. Boyle Reservoir Drawdown, Water Year 1966 (Wettest Year)

Definite Plan
June 2018 04 | Reservoir Drawdown and Diversion Plan 109
Figure 4.6-3 J.C. Boyle Reservoir Drawdown, Water Year 2006 (Wet Year)

Definite Plan
110 04 | Reservoir Drawdown and Diversion Plan June 2018
Figure 4.6-4 J.C. Boyle Reservoir Drawdown, Water Year 1986 (Wet Year)
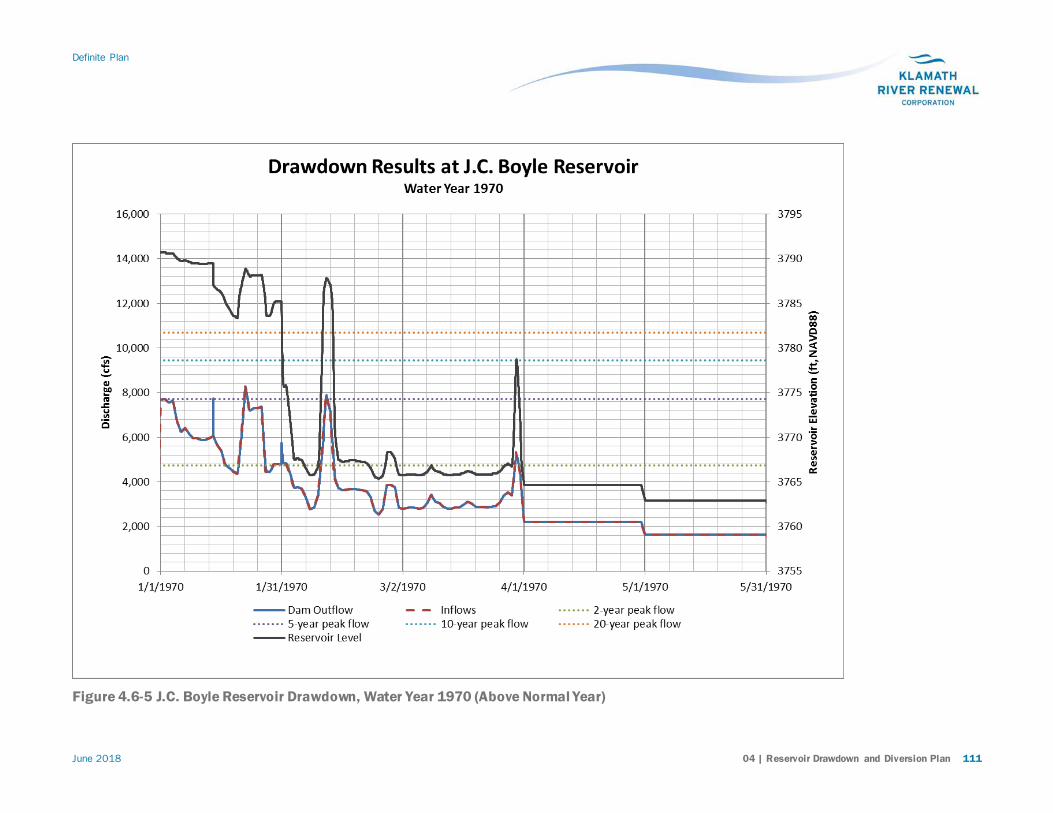
Definite Plan
June 2018 04 | Reservoir Drawdown and Diversion Plan 111
Figure 4.6-5 J.C. Boyle Reservoir Drawdown, Water Year 1970 (Above Normal Year)

Definite Plan
112 04 | Reservoir Drawdown and Diversion Plan June 2018
Figure 4.6-6 J.C. Boyle Reservoir Drawdown, Water Year 1973 (Normal Year)

Definite Plan
June 2018 04 | Reservoir Drawdown and Diversion Plan 113
Figure 4.6-7 J.C. Boyle Reservoir Drawdown, Water Year 1979 (Dry Year)

Definite Plan
114 04 | Reservoir Drawdown and Diversion Plan June 2018
4.6.3 Copco Lake
Drawdown Procedure
Drawdown of Copco Lake is discussed separately for the two tunnel modification options KRRC analyzed and described in Section 4.2.2.
Option 1 (for comparison only) – Diversion Tunnel Modified to Restore Capacity and Dam Notching:
The numbered list below summarizes the drawdown procedure at Copco Lake for Option 1:
1. Begin reservoir drawdown from normal operating elevation 2609.5 feet on November 1 in the year prior to the main drawdown by making controlled releases through the gated spillway (crest elevation 2597.0) and from the modified diversion tunnel. Continue releases to the powerhouse for power generation for as long as possible (minimum operating elevation 2604.5), although plant shutdown on November 1 has been assumed. Limit initial reservoir drawdown to the maximum historical drawdown rate of about 2 feet per day. KRRC expects no significant sediment release for this upper range of reservoir levels and rate of drawdown.
2. Once drawdown has begun, remove spillway features using a barge mounted crane (see Section 5.3).
3. Starting January 1, 2021, make controlled releases from the modified diversion tunnel. Limit reservoir drawdown to a maximum of 5 feet per day to maintain reservoir rim slope stability and to control drawdown releases from both reservoirs upstream of Iron Gate. Due to the limited capacity of the diversion tunnel modified to reuse the three 6-foot openings in the intake structure, the reservoir drawdown rate and reservoir elevation will be highly dependent on reservoir inflows, with full reservoir drawdown by March not possible for about 50 percent of historical flows between 1961 and 2008 (USBR 2012c).
4. To fully draw down the reservoir, notch the concrete dam with a series of 13 notches: an initial 24.5-foot notch, followed by 11 18–foot-deep notches (measured from lowered dam crest to notch elevation; sequentially lowering the notches in 6-foot increments), then a final notch of 22 feet down to the channel bed elevation. Proceed with lowering the dam crest in 6-foot lifts as the notching progresses. Bottom width of all notches is 8 feet. Locate the notches at the left abutment of the dam. Control instantaneous reservoir releases and drawdown rates during notching by excavating the notches in stages or by controlling the diversion tunnel discharge. The elevation of the first notch would be 2,572.5 feet. The elevation of the final notch would be at elevation 2484.5 (regardless of water year) with the lowered dam crest at elevation 2518.5. Target drawing down the reservoir to RWS elevation 2486.5 (reservoir level maintained by Copco No. 2 Dam) by March 15, 2021, to minimize downstream impacts due to sediment release. Retain Copco No. 2 Reservoir to permit continued power generation at the Copco No. 2 powerhouse.
5. Maximum additional discharge downstream of the dam due to drawdown activities is about 4,000 cfs immediately following opening of a notch (assuming an 18-foot-deep notch with a bottom width of 20 feet) with the additional flow due to drawdown decreasing as the reservoir level drops in
Definite Plan
June 2018 04 | Reservoir Drawdown and Diversion Plan 115
the notch. For reference, the 10-year, 20-year, 50-year, and 100-year flow events downstream of Copco No. 1 are about 11,300 cfs, 13,500 cfs, 16,560 cfs, and 18,950 cfs, respectively.
6. Successful reservoir drawdown using Option 1 is highly dependent on successful dam demolition and notching during January and February. There are several risks associated with Option 1 that should be considered: a) Safety of construction workers operating on very narrow, steep access roads during winter
months with wet and icy conditions. b) Weather impacts to production that are likely to be worse in the wettest years when reservoir
drawdown will rely on notching more than in dry years. c) During wet years, complete drawdown may not occur until notching is complete. If notching is
delayed, drawdown will be delayed by an equal amount. 16
Option 2 (proposed action) – Diversion Tunnel Modified to Increase Capacity
The numbered list below summarizes the drawdown procedure at Copco Lake for Option 2:
1. Begin reservoir drawdown from normal operating elevation 2609.5 feet on November 1 in the year prior to the main drawdown by making controlled releases through the gated spillway (crest elevation 2597.0) and from the modified diversion tunnel. Continue releases to the powerhouse for power generation for as long as possible (minimum operating elevation 2604.5), although plant shutdown on November 1 has been assumed. Limit initial reservoir drawdown to the maximum historical drawdown rate of about 2 feet per day. No significant sediment release is expected for this upper range of reservoir levels and rate of drawdown.
2. Once drawdown has begun, remove spillway features using a barge mounted crane (see Section 5.3).
3. Starting January 15, 2021, make controlled releases from the new gate structure. With Option 2, drawdown releases are delayed two weeks after drawdown releases begin at Iron Gate Dam (January 1) to create additional reservoir capacity at Iron Gate, 17 which will better handle drawdown releases from Copco Lake and help attenuate outflows from Iron Gate Reservoir due to storms. Limit reservoir drawdown to 5 feet per day to maintain reservoir rim slope stability and control drawdown releases from both reservoirs upstream of Iron Gate Reservoir.
4. Maximum additional discharge downstream of the dam due to drawdown activities is about 6,000 cfs when the gate is opened on January 15. During other times the increase is generally 1,000 to 2,000 cfs. The total discharge capacity of the new gate structure with the reservoir at the spillway crest elevation 2597.0 feet is nearly 12,000 cfs. As water levels increase above the spillway crest, the gate will be closed down to limit the total discharge to 13,000 cfs to avoid high water levels that will impact power production at Copco No. 2 powerhouse.
5. For reference, the 10-year, 20-year, 50-year, and 100-year flow events downstream of Copco No. 1 are 11,300 cfs, 13,500 cfs, 16,560 cfs, and 18,950 cfs, respectively.
16 For modeling, it was assumed a notch would be delayed if the water level was less than 1 foot below the lowered crest. 17 Without this delay, Iron Gate Reservoir would often remain full until Copco Lake is drawn down and outflows are decreasing because the increased Copco diversion tunnel capacity is similar to the Iron Gate diversion tunnel capacity.

Definite Plan
116 04 | Reservoir Drawdown and Diversion Plan June 2018
Results
Figures 4.6-8 through 4.6-13 show the drawdown results for Copco No. 1 for both drawdown options.
In general, Option 1 with notching performs worse than Option 2 in terms of minimizing peak flows and drawdown duration, particularly in wet years. Therefore, KRRC proposes to proceed with Option 2 for Copco No. 1 drawdown, and the remainder of the results discussion will focus on Option 2.
During the representative dry years (1973 and 1979, see Figures 4.6-12 and 4.6-13), the reservoir easily draws down by the end of February, and does not refill after that point.
For Option 2 during the wetter years of 1966, 2006, 1986, and 1970 (see Figures 4.6-8 and 4.6-11), the reservoir completely draws down by the end of Febrary, but in some cases partially refills later in the year when storms occur. The majority of the accumulated sediment will mobilize during the initial drawdown, and subsequent reservoir filling and drawdown is expected to cause only moderate increases in high suspended sediment (relative to background) (USBR 2012c).
For Option 2 during the wetter years of 1966, 2006, 1986, and 1970 (see Figures 4.6-8 and 4.6-11), flows are higher than what will be expected via the spillway alone (i.e., without drawdown), but the increases are limited to those periods when flows are below the 10-year flood elevation. As discussed above (see Figure 4.6-1), the peak inflows used in the model are occasionally greater than the measured USGS peak flow for that year. In those cases, the peak outflow from the reservoir during drawdown may exceed the peak flow recorded by USGS for that year. This is due to the use of larger inflows rather than due to an increase in flow in the river due to drawdown.
KRRC does not anticipate that sediment concentrations resulting from the proposed drawdown procedure and associated hydraulics will differ from those previously estimated (USBR 2012c).

Definite Plan
June 2018 04 | Reservoir Drawdown and Diversion Plan 117
Figure 4.6-8 Copco No. 1 Reservoir Drawdown, Water Year 1966 (Wettest Year)

Definite Plan
118 04 | Reservoir Drawdown and Diversion Plan June 2018
Figure 4.6-9 Copco No. 1 Reservoir Drawdown, Water Year 2006 (Wet Year)

Definite Plan
June 2018 04 | Reservoir Drawdown and Diversion Plan 119
Figure 4.6-10 Copco No. 1 Reservoir Drawdown, Water Year 1986 (Wet Year)

Definite Plan
120 04 | Reservoir Drawdown and Diversion Plan June 2018
Figure 4.6-11 Copco No. 1 Reservoir Drawdown, Water Year 1970 (Above Normal Year)

Definite Plan
June 2018 04 | Reservoir Drawdown and Diversion Plan 121
Figure 4.6-12 Copco No. 1 Reservoir Drawdown, Water Year 1973 (Median Year)

Definite Plan
122 04 | Reservoir Drawdown and Diversion Plan June 2018
Figure 4.6-13 Copco No. 1 Reservoir Drawdown, Water Year 1979 (Dry Year)
Definite Plan
June 2018 04 | Reservoir Drawdown and Diversion Plan 123
4.6.4 Iron Gate Reservoir
Drawdown Procedure
Begin reservoir drawdown from normal operating elevation 2331.3 feet on January 1, 2021 by making controlled releases through the modified diversion tunnel. Limit reservoir drawdown to a maximum of 5 feet per day to maintain reservoir rim slope stability. Maximum additional discharge downstream of the dam due to drawdown activities is about 4,000 cfs. The total discharge capacity of the modified diversion tunnel with the reservoir at spillway crest elevation 2331.3 is about 10,000 cfs. For reference, the 5-year flow event downstream of Iron Gate Dam is 10,900 cfs.
Results
Due to their close proximity, KRRC modeled the Iron Gate Reservoir drawdown in conjunction with the Copco Lake drawdown. Figures 4.6-14 through 4.6-19 show results from the HEC-RAS analysis for the six representative years. There are different results at Iron Gate Reservoir depending on which drawdown option at Copco No. 1 Dam is incorporated. References to Options 1 and 2 in the plots in this section are the resulting effects at Iron Gate based on either Option 1 or 2 being implemented at Copco No. 1 Dam. Since KRRC proposes Option 2 for the Project, the remaining results discuss only Option 2.
During the representative drier years (1973 and 1979, see Figures 4.6-18 and 4.6-19), the reservoir easily draws down by early February, and it did not refill after that point.
During the wetter years of 2006 and 1986 (see Figures 4.6-15 and 4.6-16), the reservoir draws down by the end of February, but partially refills later in the year when storms occurred. The majority of the accumulated sediment will mobilize during the initial drawdown, and subsequent reservoir filling and drawdown is expected to cause only moderate increases in high suspended sediment (relative to background) (USBR 2012c).
For the wettest year (1966, see Figure 4.6-14) the reservoir draws down by early March, but the probability of a storm of this magnitude occurring in the drawdown year is low.
During the wetter years of 1966, 2006, 1986, and 1970 (see Figures 4.6-14 and 4.6-17), flows are higher than what will be expected via the spillway alone (i.e., without drawdown), but the increases are mainly limited to those periods when flows are below the 10-year flood elevation. As discussed above (see Figure 4.6-1), the peak inflows used in the model are occasionally greater than the measured USGS peak flow for that year. In those cases, the peak outflow from the reservoir during drawdown may exceed the peak flow recorded by USGS for that year. This is due to the use of larger inflows rather than due to an increase in flow in the river due to drawdown.
KRRC does not anticipate that sediment concentrations resulting from the proposed drawdown procedure and associated hydraulics will differ from those previously estimated (USBR 2012c).

Definite Plan
124 04 | Reservoir Drawdown and Diversion Plan June 2018
References to Options 1 and 2 in the plots are the resulting effects at Iron Gate based on either Option 1 or 2 being implemented at Copco No. 1 Dam.
Figure 4.6-14 Iron Gate Reservoir Drawdown, Water Year 1966 (Wettest Year)

Definite Plan
June 2018 04 | Reservoir Drawdown and Diversion Plan 125
References to Options 1 and 2 in the plots are the resulting effects at Iron Gate based on either Option 1 or 2 being implemented at Copco No. 1 Dam.
Figure 4.6-15 Iron Gate Reservoir Drawdown, Water Year 2006 (Wet Year)

Definite Plan
126 04 | Reservoir Drawdown and Diversion Plan June 2018
References to Options 1 and 2 in the plots are the resulting effects at Iron Gate based on either Option 1 or 2 being implemented at Copco No. 1 Dam.
Figure 4.6-16 Iron Gate Reservoir Drawdown, Water Year 1986 (Wet Year)

Definite Plan
June 2018 04 | Reservoir Drawdown and Diversion Plan 127
References to Options 1 and 2 in the plots are the resulting effects at Iron Gate based on either Option 1 or 2 being implemented at Copco No. 1 Dam.
Figure 4.6-17 Iron Gate Reservoir Drawdown, Water Year 1970 (Above Normal Year)

Definite Plan
128 04 | Reservoir Drawdown and Diversion Plan June 2018
References to Options 1 and 2 in the plots are the resulting effects at Iron Gate based on either Option 1 or 2 being implemented at Copco No. 1 Dam.
Figure 4.6-18 Iron Gate Reservoir Drawdown, Water Year 1973 (Median Year)

Definite Plan
June 2018 04 | Reservoir Drawdown and Diversion Plan 129
References to Options 1 and 2 in the plots are the resulting effects at Iron Gate based on either Option 1 or 2 being implemented at Copco No. 1 Dam.
Figure 4.6-19 Iron Gate Reservoir Drawdown, Water Year 1979 (Dry Year)

Definite Plan
130 04 | Reservoir Drawdown and Diversion Plan June 2018
4.6.5 Downstream of Iron Gate
KRRC analyzed the response of the river flows at Seiad Valley, Orleans, and Klamath USGS gauge station locations to the flows discharged during the reservoir drawdown. The analysis shows that the drawdown has negligible effect on peak downstream flows during wet and above normal years for several reasons:
• The proportion of flow contributed by the Klamath River at Iron Gate is smaller than the flows contributed by tributaries downstream.
• The drawdown distributes the flow over a longer time span than a typical storm event and provides attenuation in the reservoir once drawdown is underway.
• The capacity of the Iron Gate spillway, which is activated during storm events in the gauge record, is much higher (30,000 cfs and greater) than the capacity of the diversion tunnel being used to control drawdown (10,000 cfs maximum).
For normal years (based on flow rate), the analysis showed that the drawdown can increase flows downstream, especially when the recorded peak flow at Iron Gate is less than the discharge capacity available during drawdown. The increase in flow in normal water years is small compared to the flow magnitude and does not cause flows to exceed the 5-year return interval flow at Iron Gate.
KRRC completed the analysis using model output from the drawdown model described in Section 4.6.1 along with the recorded gauge data for the Iron Gate, Seiad Valley, Orleans, and Klamath USGS gauges and then comparing the hydrographs for the following water years:
• 1964 (normal)18 • 1965 (wettest year on record)19
• 1970 (above normal)
• 1974 (above normal)
• 1980 (normal)
• 1985 (normal)
• 1986 (wet)
• 1997 (wet)
• 2000 (normal)
• 2006 (wet)
The determination of wet, above normal, and normal water years was based on ranking the annual maximum 15-day volume of flow at the Keno gauge during the January to May months for the years 1961 to 2009 (similar to the rating described in Section 4.6.1).
18 Water Year 1964 is model year 1965 due to the data shift described in Section 4.6.1. 19 Water Year 1965 is model year 1966 due to the data shift described in Section 4.6.1.

Definite Plan
June 2018 04 | Reservoir Drawdown and Diversion Plan 131
Analysis Timing
During a storm event, the worst flooding occurs during the peak flow, the highest flow in the river channel. To understand the full effects the drawdown could have on downstream flows and floods, KRRC analyzed the effects of drawdown during peak flows of the flood events. For the analysis, KRRC aligned the timing of the drawdown peak discharge from the model with the peak recorded at the Iron Gate gauge in most of the analysis years. KRRC completed the alignment by altering the dates of the drawdown model output until the drawdown peak flow occurred on the same day as the recorded peak flow. KRRC used this approach because future flood events could occur with timing different than in the historical gauge record, and the worst-case flooding effects will occur with coincident peak flows. It is important to capture the effects that peak drawdown could have on the peak river flow when referring to flooding effects.
In most of the analysis years, the annual peak flow recorded at Iron Gate occurred concurrently with the annual peaks recorded at Seiad Valley, Orleans, and Klamath USGS gauges. In two of the normal years, 1985 and 2000, the annual peak at Iron Gate occurred during a separate and unrelated event from the peaks recorded at Seiad Valley and downstream. In these 2 years, the recorded annual peaks at Iron Gate occurred months later. Therefore, KRRC aligned the timing of the drawdown peak discharge from the model with the peak recorded at the Seiad Valley gauge for these 2 years.
Analysis Setup
The analysis involved comparing, on a daily basis, the recorded hydrograph for each year and each location to a synthetic hydrograph created using the drawdown model output. KRRC downloaded the daily flows and the annual peak flows for each gauge location from the USGS National Water Information System for the analysis years. To generate more representative hydrographs, KRRC substituted the recorded annual peak for the daily flow value on the day that the peak occurred. This generated the recorded hydrograph.
KRRC created the synthetic hydrographs as follows. For the Iron Gate USGS gauge location, KRRC used the drawdown model output to represent the flows during drawdown. For Seiad Valley, Orleans, and Klamath USGS gauge locations, KRRC created the synthetic hydrographs by taking the gauge record of each location, subtracting the flow recorded at the Iron Gate gauge on that day, and adding the flow from the drawdown model for the same day (after the date shift described above). KRRC then plotted the recorded and synthetic hydrographs for each gauge together to show the effect of drawdown.
Results
Table 4.6-2 and Figures 4.6-20 to 4.6-29 provide the results of the analysis.
The water operations model prepared by USBR (2012) generates the input flows to the drawdown model, but these flows are not the same as the USGS record flows (refer to Figure 4.6-1). In a number of years, the operations model has higher peak flows than occurred in the record (analyzed water years 1965, 1986, 1997, 2000, and 2006). This is because of the way the operations model interprets the operations rules as well as that the upstream facilities may not have been operated according to the same rules during the record event. This difference has an effect on the results of the analysis in this section, and KRRC

Definite Plan
132 04 | Reservoir Drawdown and Diversion Plan June 2018
considered this when reviewing the results. As discussed below, the comparison between record flows downstream of Iron Gate and the modeled discharge during drawdown typically results in a decrease in flow; when increased peak flows are noted, they are mostly related to the difference between the record and modeled input flows at Keno Dam and not to drawdown.
The results of the analysis show that in wet and above normal years, drawdown typically decreases or does not change flows downstream of Iron Gate Dam. The largest percent increases occurred in 1997 and 2006 with flow increases at Iron Gate of 10% and 98%, respectively. Water year 1997 had 2% or less increases seen further downstream at Seiad Valley and Orleans, while 2006 had larger increases of 18% at Seiad Valley and 6% or less at Orleans and Klamath. For 1997, the increase at Iron Gate shifts the return interval from a 20-year event up to between a 20- and 50-year event. For 2006, the increase at Iron Gate shifts the return interval from between a 10- and 20-year to a 50-year event, and the increase at Seiad Valley in 2006 shifts the return interval from about a 20-year event to between a 20- and 50-year event.
Rather than these increases being the result of the drawdown operation, they are an artifact of the operations model input flows. The operations model shows higher flows in 1997 and 2006 than in the record (Figure 4.6-1) with an increase at Keno of 32% and 80%, respectively20. This means that the increase in flows shown in this analysis is related to the larger input flows from the operations model upstream, not from the effect of drawdown releases.
Even with the largest increases in flow at Iron Gate of 26% in 1964 and 40% in 2000, the drawdown releases remain below a 5-year event, well within the river channel capacity. Water year 2000 is also affected by the increase in inflows from the operations model as compared to the record, a 74% increase in 2000 at Keno. 21
In all cases, the percent change in flows seen at Iron Gate decreases in the downstream direction. At Orleans, the largest change was a 7% increase in 2000 to a less than 2-year event, and at Klamath the largest change was a 4% increase in 2006 to an event having between a 10- and 20-year return period.
20 Keno 1997 recorded peak flow is 9,200 cfs, but the operations model has a peak of 12,188 cfs. Keno 2006 recorded peak flow is 7,930 cfs, while the operations model has a peak of 14,307 cfs. 21 Keno 2000 recorded peak flow is 4,200 cfs, while the operations model has a peak of 7,230 cfs.
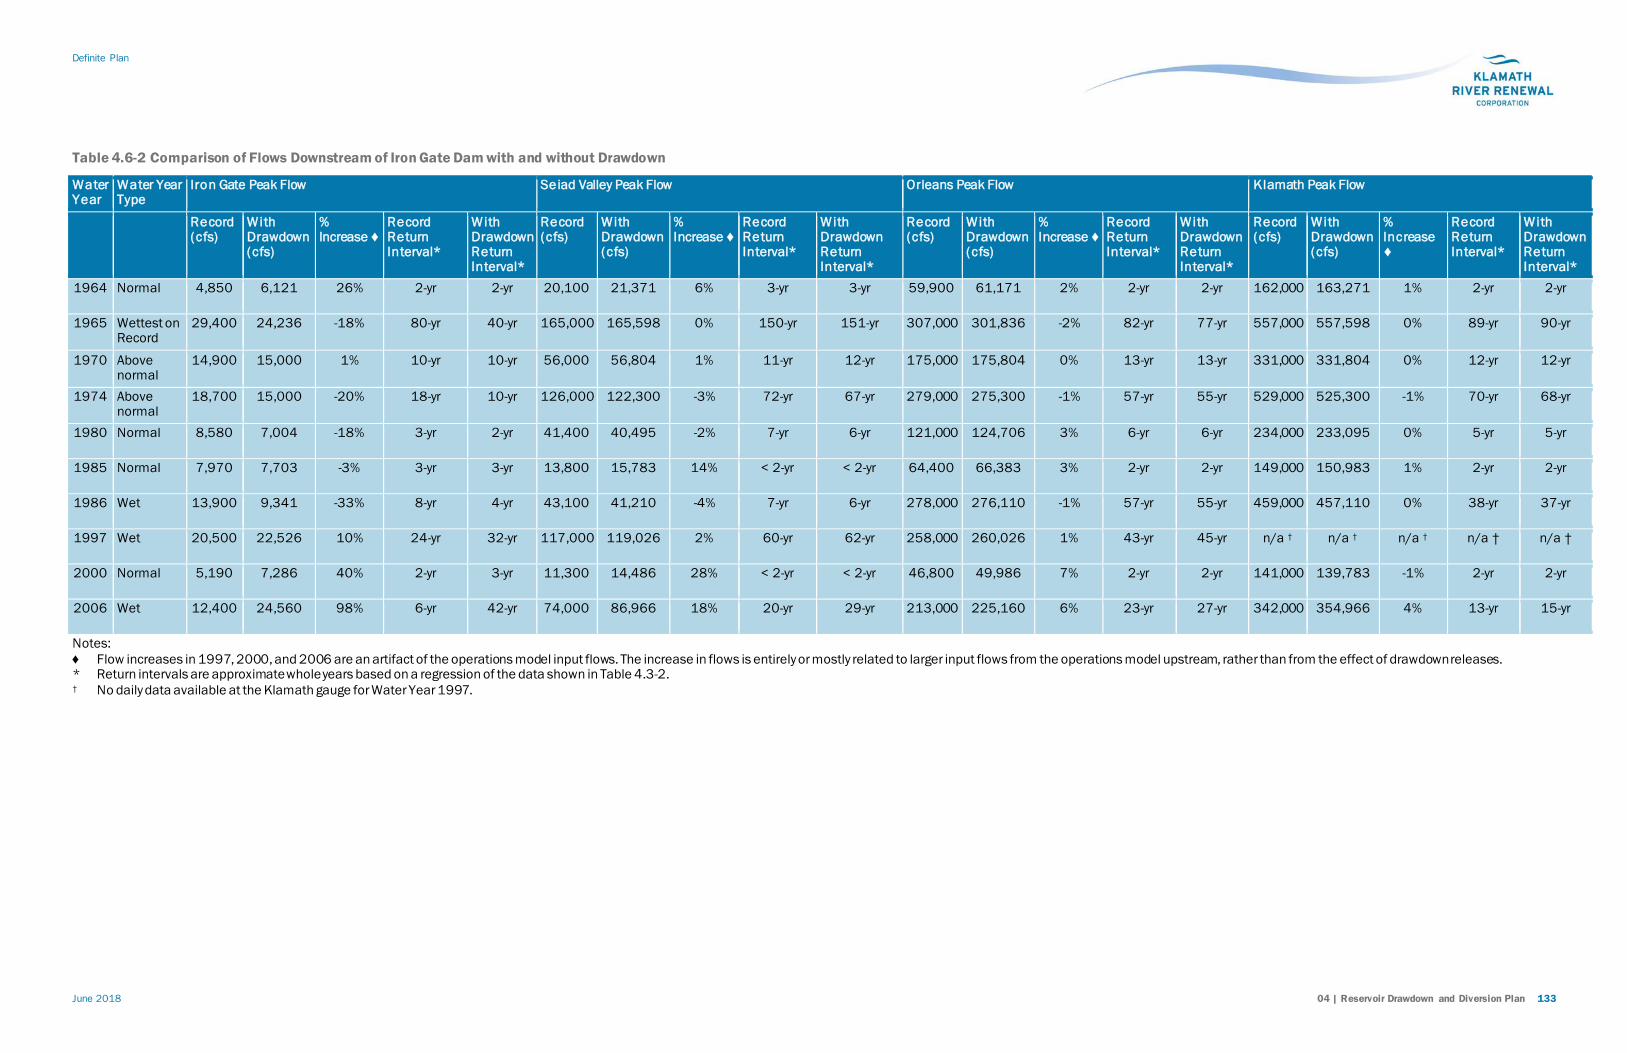
Definite Plan
June 2018 04 | Reservoir Drawdown and Diversion Plan 133
Table 4.6-2 Comparison of Flows Downstream of Iron Gate Dam with and without Drawdown
Water Year
Water Year Type
Iron Gate Peak Flow Seiad Valley Peak Flow Orleans Peak Flow Klamath Peak Flow
Record (cfs)
With Drawdown (cfs)
% Increase ♦
Record Return Interval*
With Drawdown Return Interval*
Record (cfs)
With Drawdown (cfs)
% Increase ♦
Record Return Interval*
With Drawdown Return Interval*
Record (cfs)
With Drawdown (cfs)
% Increase ♦
Record Return Interval*
With Drawdown Return Interval*
Record (cfs)
With Drawdown (cfs)
% Increase ♦
Record Return Interval*
With Drawdown Return Interval*
1964 Normal 4,850 6,121 26% 2-yr 2-yr 20,100 21,371 6% 3-yr 3-yr 59,900 61,171 2% 2-yr 2-yr 162,000 163,271 1% 2-yr 2-yr
1965 Wettest on Record
29,400 24,236 -18% 80-yr 40-yr 165,000 165,598 0% 150-yr 151-yr 307,000 301,836 -2% 82-yr 77-yr 557,000 557,598 0% 89-yr 90-yr
1970 Above normal
14,900 15,000 1% 10-yr 10-yr 56,000 56,804 1% 11-yr 12-yr 175,000 175,804 0% 13-yr 13-yr 331,000 331,804 0% 12-yr 12-yr
1974 Above normal
18,700 15,000 -20% 18-yr 10-yr 126,000 122,300 -3% 72-yr 67-yr 279,000 275,300 -1% 57-yr 55-yr 529,000 525,300 -1% 70-yr 68-yr
1980 Normal 8,580 7,004 -18% 3-yr 2-yr 41,400 40,495 -2% 7-yr 6-yr 121,000 124,706 3% 6-yr 6-yr 234,000 233,095 0% 5-yr 5-yr
1985 Normal 7,970 7,703 -3% 3-yr 3-yr 13,800 15,783 14% < 2-yr < 2-yr 64,400 66,383 3% 2-yr 2-yr 149,000 150,983 1% 2-yr 2-yr
1986 Wet 13,900 9,341 -33% 8-yr 4-yr 43,100 41,210 -4% 7-yr 6-yr 278,000 276,110 -1% 57-yr 55-yr 459,000 457,110 0% 38-yr 37-yr
1997 Wet 20,500 22,526 10% 24-yr 32-yr 117,000 119,026 2% 60-yr 62-yr 258,000 260,026 1% 43-yr 45-yr n/a † n/a † n/a † n/a † n/a †
2000 Normal 5,190 7,286 40% 2-yr 3-yr 11,300 14,486 28% < 2-yr < 2-yr 46,800 49,986 7% 2-yr 2-yr 141,000 139,783 -1% 2-yr 2-yr
2006 Wet 12,400 24,560 98% 6-yr 42-yr 74,000 86,966 18% 20-yr 29-yr 213,000 225,160 6% 23-yr 27-yr 342,000 354,966 4% 13-yr 15-yr
Notes: ♦ Flow increases in 1997, 2000, and 2006 are an artifact of the operations model input flows. The increase in flows is entirely or mostly related to larger input flows from the operations model upstream, rather than from the effect of drawdown releases. * Return intervals are approximate whole years based on a regression of the data shown in Table 4.3-2. † No daily data available at the Klamath gauge for Water Year 1997.

Definite Plan
134 04 | Reservoir Drawdown and Diversion Plan June 2018
Figure 4.6-20 Comparison of Flows Downstream of Iron Gate Dam – Water Year 1964 (Model Year 1965)

Definite Plan
June 2018 04 | Reservoir Drawdown and Diversion Plan 135
Figure 4.6-21 Comparison of Flows Downstream of Iron Gate Dam – Water Year 1965 (Model Year 1966)

Definite Plan
136 04 | Reservoir Drawdown and Diversion Plan June 2018
Figure 4.6-22 Comparison of Flows Downstream of Iron Gate Dam – Water Year 1970 (Model Year 1970)

Definite Plan
June 2018 04 | Reservoir Drawdown and Diversion Plan 137
Figure 4.6-23 Comparison of Flows Downstream of Iron Gate Dam – Water Year 1974 (Model Year 1974)

Definite Plan
138 04 | Reservoir Drawdown and Diversion Plan June 2018
Figure 4.6-24 Comparison of Flows Downstream of Iron Gate Dam – Water Year 1980 (Model Year 1980)

Definite Plan
June 2018 04 | Reservoir Drawdown and Diversion Plan 139
Figure 4.6-25 Comparison of Flows Downstream of Iron Gate Dam – Water Year 1985 (Model Year 1985)

Definite Plan
140 04 | Reservoir Drawdown and Diversion Plan June 2018
Figure 4.6-26 Comparison of Flows Downstream of Iron Gate Dam – Water Year 1986 (Model Year 1986)

Definite Plan
June 2018 04 | Reservoir Drawdown and Diversion Plan 141
Figure 4.6-27 Comparison of Flows Downstream of Iron Gate Dam – Water Year 1997 (Model Year 1997)

Definite Plan
142 04 | Reservoir Drawdown and Diversion Plan June 2018
Figure 4.6-28 Comparison of Flows Downstream of Iron Gate Dam – Water Year 2000 (Model Year 2000)

Definite Plan
June 2018 04 | Reservoir Drawdown and Diversion Plan 143
Figure 4.6-29 Comparison of Flows Downstream of Iron Gate Dam – Water Year 2006 (Model Year 2006)

Definite Plan
144 04 | Reservoir Drawdown and Diversion Plan June 2018
4.7 Monitoring During Reservoir Drawdown KRRC’s contractor will monitor Iron Gate Dam and the embankment section of J.C. Boyle Dam during reservoir drawdown for any evidence of embankment instability. Shallow slumps may occur on the upstream slope, but such occurrences would not compromise the safety of the embankments. Monitoring will include daily visual observations of the upstream slope for signs of instability such as cracking or slumping. KRRC’s contractor will install survey monuments and a minimum of two inclinometers in each embankment during the year prior to reservoir drawdown and will monitor them on a daily basis for evidence of deep failures within the upstream shell. KRRC’s contractor will also install piezometers in the upstream shell (a minimum of 2) and the core (a minimum of 2) of the embankments for monitoring during reservoir drawdown to confirm that changes in pore pressure during drawdown are similar to or greater than assumed in the analyses (see Appendix D).
KRRC will monitor portions of the reservoir rim at each development, as appropriate, by daily visual observations for signs of any instability such as cracking or slumping. KRRC will install survey monuments and inclinometers in areas of particular sensitivity (e.g., near residences and cultural resources) and will monitor them on a daily basis for evidence of potential slope failure. After drawdown, KRRC will complete monthly visual observations for 12 months to monitor inclinometers and look for evidence of potential slope failure. If KRRC finds no evidence or trends showing slope instability after the monitoring discussed above, KRRC will complete no further slope stability monitoring. Should KRRC identify evidence or trends of slope movement, monthly monitoring shall continue for another 12 months, and KRRC shall complete an assessment to determine the likelihood of slope failure and possible mitigation measures.
Appendix L discusses monitoring during drawdown related to cultural resources.
4.8 Best Management Practices to Implement During Reservoir Drawdown
4.8.1 Blockage of Diversion Facilities Diversion facility failure or blockage, particularly of the Iron Gate or Copco No. 1 diversion tunnels, during reservoir drawdown could impact the duration of drawdown. Failure modes of the diversion tunnels include: debris blocking the tunnel inlet, abutment instability and failure blocking the tunnel inlet, mechanical failure of the operating gate, and tunnel collapse. To avoid inlet blockages, Best Management Practices (BMPs) include installing large grates at the inlets and providing a mechanism to clear the grates using barge mounted equipment. Depending on the severity of the blockage or the mechanical failure, KRRC may suspend and delay reservoir drawdown to the following year after repairs are made.
Diversion facility failure or blockage of the Iron Gate diversion tunnel during dam removal could result in a condition where the dam no longer has an operable spillway. BMPs for this occurrence include conservative design criteria for the modification of the diversion tunnel to make inlet blockage, tunnel collapse, and

Definite Plan
June 2018 04 | Reservoir Drawdown and Diversion Plan 145
mechanical gate failure unlikely. In addition, by the time dam removal starts on June 1, the diversion tunnel will have been in full operation for 5 months demonstrating its operability.
Diversion facility failure or blockage of the Copco No. 1 diversion tunnel during dam removal will not prevent dam removal because flows that would have been diverted through the tunnel would flow through the spillway gates or over the lowered dam crest. Flow over the lowered crest at Copco No. 1 Dam would prevent access for further concrete removal; however, KRRC expects the lowered crest to be sufficient for overtopping flows, and does not present a safety hazard.
KRRC will update the existing Emergency Action Plans (EAPs) for the dams. The EAPs describe the notification process for impending catastrophic dam failure and include flood inundation mapping. KRRC will submit the EAP to the BOC for its independent review and recommendations.
4.8.2 Stability of Embankments
Instability of the upstream slope of the J.C. Boyle or Iron Gate embankment during reservoir drawdown could result in either loss of erosion protection or loss of freeboard due to a slope failure that encompasses a portion of the dam crest. In the case of shallow slumping that disrupts erosion protection, BMPs include stockpiling riprap materials during the season prior to reservoir drawdown for repairs. Likewise, in the unlikely event that a slope failure displaces a portion of the dam crest, BMPs include stockpiling embankment materials for emergency repairs of the crest of the embankments.
4.9 Stability of Reservoir Rim KRRC performed a reservoir rim stability evaluation that is provided in Appendix E. When discussing reservoir rim stability during drawdown at the various reservoir locations, it is important to differentiate between the potential for deep-seated large landslides along the reservoir rim that could impact roads or property, and slides of material beneath the current water surface, which would only impact resources within the local limited slide footprint.
Minor, shallow slides of existing material beneath the existing reservoir water surfaces are possible during drawdown at each reservoir location (Appendix E). These minor slides would not extend outside of the current reservoir footprint and would only potentially impact resources within the limited slide footprint (e.g. cultural resources). Within Copco No. 1 Reservoir, some larger deeper slides are also possible beneath the existing reservoir water surface, where submerged higher bluffs exist along the original Klamath River channel. These shallow slides and potential slides along the river channel in Copco No. 1 Reservoir pose no threat to roads or property, however, these areas will be monitored during and post-drawdown to assess any potential impact to existing cultural resources.
Based on the evaluation included in Appendix E, the potential for deep-seated large landslides along the reservoir rim is low at both J.C. Boyle and Iron Gate Reservoirs. At Copco No. 1 Reservoir, however, while the majority of the reservoir rim is expected to remain stable during drawdown, certain segments along the reservoir rim have a potential for slope failure that could impact existing roads and/or private property. In
Definite Plan
146 04 | Reservoir Drawdown and Diversion Plan June 2018
some areas, the impact could be relatively minor, while in other areas the impact could be greater. Based on the analysis in Appendix E, approximately 3,700 linear feet of slopes along Copco Road (approximately 10.7% of north shore length), and approximately 2,800 linear feet of slope adjacent to private property (approximately 8.7% of south shore length) require additional field investigation and analysis to gain a more refined understanding of slope stability in those areas. Up to eight parcels along the referenced-reservoir rim segments appear to have existing habitable structures that could potentially be impacted.
Additional field geologic data is required to confirm the potential for slope failure along the referenced-reservoir rim segments. KRRC expects to complete the additional field investigation in July and August of 2018, followed by completion of a series of material property laboratory tests. KRRC will use results from the field investigation and laboratory testing to update stability assessments in the rim segments of concern in fall 2018. Should additional study determine that there is a high probability of slope failure in any of these areas, KRRC will consider the following actions to offset potential impacts:
1. For segments along Copco Road: a) Re-align road segment away from rim slope b) Engineer structural slope improvements (e.g. drilled shafts or other structural elements that
could be installed to resist slope movement) 2. For segments adjacent to property or structures:
a) Move structure or purchase property b) Engineer structural slope improvements (e.g. drilled shafts or other structural elements that
could be installed to resist slope movement)
4.10 Potential for Effects Downstream of the Project The sections below discuss potential effects in the river channel downstream of Iron Gate Dam, including aggradation at tributaries, pool depths, lateral channel migration, water quality and slope instability. For a discussion of the effects on downstream flows, see Section 4.5.5 above.
4.10.1 Previous Modeling Results and Limitations
KRRC expects aggradation in the reach between Iron Gate Dam and Bogus Creek because this reach is immediately downstream of Iron Gate Dam and the relatively deep pools in this reach will fill with coarse sediment. This reach is artificially degraded because of the release of sediment-depleted, clear water flows from the dam.
USBR did not use the results of the two-dimensional model to quantify volumes of eroded reservoir sediment, sediment deposition in the downstream channel, or suspended sediment concentrations. USBR primarily used the two-dimensional model to help inform their revegetation plan for dam removal at Copco. USBR was interested in the general shape and location of the river channel post dam removal and the modeled shape and location corresponded well to the pre-dam maps. USBR eventually used the pre-dam maps to determine the most likely location of the post-dam removal channel.

Definite Plan
June 2018 04 | Reservoir Drawdown and Diversion Plan 147
4.10.2 Aggradation and Tributary Confluences
There are likely different responses for tributaries within the reservoir areas and for tributaries downstream of Iron Gate Dam. Within the reservoirs, previously deposited reservoir sediment may or may not be eroded during drawdown, depending upon the flows present in the tributaries and in the Klamath River. Should barriers form at these locations within the former reservoirs, KRRC will make efforts post-drawdown to remove the barrier and connect the tributary (see Section 6.1.3)
At tributaries downstream of Iron Gate Dam, there are several different possibilities for tributary response depending upon the relative balance of Klamath River flow, tributary flow, and sediment concentration. There are naturally-occurring, small depositional features at most tributary mouths along the Klamath River and having some deposition at these locations could take the form of a partial bar rather than fully blocking the tributary mouth and is not necessarily a negative impact.
4.10.3 Pool Depths
The reaches below Iron Gate Dam have all been unnaturally depleted of coarse and fine sediment due to the trapping of sediment within the reservoirs. Therefore, there has likely been some river bed degradation and river bed lowering caused by the depletion of coarse sediment. A return to pre-removal conditions in the pools downstream of the dams is not expected, nor desired. The pools are likely deeper and coarser than they would be under natural sediment supply conditions. There will be an immediate filling of pools after dam removal and an immediate fining of the river bed sediment. After one or two average floods, flows will remove most of the fine sediment from the pools and they will return to being dominated by a coarser substrate. However, the river will not recover full, pre-removal, pool depths and instead it will return to more natural pool depths. Numerical models are not able to reliably predict the pool-riffle formation and exact depths. USBR provided an estimate of the bed material response as part of the USBR (2012) report.
KRRC proposes a survey of the river bed downstream of Iron Gate Dam to Humbug Creek prior to dam removal, and every year after dam removal for the first 3 years. KRRC does not propose mechanical intervention in the main channel of the Klamath River at any substantial scale because the disturbance of the bed could cause more ecological impact than the sediment in the bed. Moreover, as mentioned above, KRRC does not believe that it is reasonable or prudent to want to recover pre-removal pool depths downstream of the dam.
4.10.4 Lateral Migration
Lateral migration is a natural part of all alluvial rivers and cannot be fully controlled throughout a large river. In fact, preventing lateral migration through bank protection can degrade the aquatic habitat of the river by causing channel bed degradation. That being said, the Klamath River is predominantly a bedrock-controlled river and naturally has very little migration and bank erosion. USBR (2012) compared mapping of terraces to one performed by Ayres (1999) and found very little difference in the plan form of the river over time. The risk of bank erosion would be higher when coarse sediment and large woody debris are introduced into the channel and deposits, which then forces the river to take a new path. An example of this process is the

Definite Plan
148 04 | Reservoir Drawdown and Diversion Plan June 2018
Elwha River dam removals where several locations of bank erosion were observed after dam removal. The risk of bank erosion on the Klamath River is much smaller for a variety of reasons: there is much less coarse sediment in the reservoirs, the banks are mostly bedrock controlled, and there is no large source of woody debris upstream of the reservoirs because of operations at Link River and Keno Dams. For these reasons, no monitoring or adaptive management associated with downstream lateral migration is proposed.
4.10.5 Water Quality and Suspended Sediment
USBR (2012) performed simulations for a variety of water year types, some of which result in release of suspended sediment after March 15, and USBR discusses effects in that report. As discussed in Section 4.4, the updated approach to drawdown at Copco No. 1 significantly reduces the likelihood of a prolonged drawdown and high sediment concentrations. Due to the low probability of a prolonged drawdown, there is minimal risk of any associated negative effects from suspended sediment post-drawdown.
4.10.6 Water Quality and Sediment Contaminants This summary is in reference to contaminant concentration analyses in Klamath River reservoir sediments and aquatic biota, and provides an evaluation of the results with respect to current USACE Sediment Evaluation Framework (SEF) for the Pacific Northwest (USACE, 2016) and U.S. Environmental Protection Agency (EPA) screening levels (SLs). The 2012 EIS/R summarizes sediment and aquatic biota testing completed by Camp Dresser and McKee (CDM) during or before 2011, a time period during which the Northwest Regional Sediment Evaluation Team (RSET) reviewed and finalized the freshwater contaminant screening levels. Although the 2009 SEF SLs and the EPA Regional Screening Levels (RSLs) were not the only thresholds considered in the 2011 analysis and result, an examination of previous results and conclusions with respect to the most recent SEF SLs and RSLs is necessary to ensure current science and regulatory standards are met.
The following review of the 2011 results under the 2016 SEF SLs and compliance with a Level 2B22 evaluation confirms the conclusions presented in the 2012EIS/R that the reservoir sediments in each reservoir are suitable for unconfined, aquatic disposal and exposure and that contamination risks are unlikely and/or are either lower than with the dams still in place and/or lower than background levels. The marine SLs are relatively unmodified from the 2009 SEF, and the most recent freshwater SLs in the 2016 SEF are typically less protective than standards set forth by, e.g., EPA RSLs and ODEQ Bioaccumulation Screening Level Values (SLVs) for fish consumption. As a result, any revisions to the standards have negligible impact on previous conclusions.
Testing Summary
To assess the risk of contamination in biota and humans from the release of reservoir sediments, an evaluation of the sediments from each reservoir was completed in 2011 and generally followed the tiered 22 A Level 2B assessment includes physical, chemical, biological, and other special evaluations completed to provide more empirical evidence regarding the potential for sediment contamination in the project area to have adverse effects on receptors (RSET 2016).

Definite Plan
June 2018 04 | Reservoir Drawdown and Diversion Plan 149
sediment evaluation framework presented in the 2009 SEF. The results and conclusions are summarized in the 2012 EIS/R and Klamath Dam Removal Overview Report for the Secretary of the Interior (SDOR). All steps required for a Level 2B evaluation were conducted, and they included a review of existing information (Level 1), screening assessment of sediment chemistry (Level 2A), bioassays and screening assessment of elutriate chemistry (Level 2B), and an additional examination of reservoir fish tissues. Additionally, concentrations were compared with the protective standards (i.e., low SLs) of the EPA RSLs and ODEQ SLVs for fish consumption. The contamination risk of concentrations in excess of the SLs was evaluated in consultation with several state and federal agencies and with respect to several contaminant exposure pathways from the sediments to biota and humans. The pathways included a “dams remain” option and four dam removal options: in the water column and in deposits in terrace and banks, the river bed, and near-shore marine environment. Additionally, values were compared with known background values for the area.
Previous Results
Based on the screening level evaluation, the previous analysis concluded that the risk of contamination to humans and freshwater, marine, and terrestrial biota along the four dam removal pathways was unlikely. In all but one case, contaminant concentrations above standards from the SLs, RSLs, or SLVs were at levels unlikely to cause adverse effects (see SDOR Figure 4.4.9-2). The one contaminant concentration determined to cause potential short-term minor to limited effect on freshwater biota was not a result of comparison with SEF SLs or EPA RSLs. With the exception of nickel in J.C. Boyle and Copco No. 1 and dieldrin in J.C. Boyle, the only contaminants reported in excess of the SEF standards were a result of the reporting limits (RLs) of the laboratory analysis in excess of the SLs, rather than detected concentrations of the contaminants in excess of the SLs. Exceedances based on reporting limits, rather than detected concentrations, included several polynuclear aromatic hydrocarbons (PAHs), phthalates, pesticides, and polychlorinated biphenyls (PCBs), but were generally not in excess of SL2 values.
The only exceedances of the EPA RSLs were the total carcinogenic RSLs for residential soils for arsenic and nickel in each reservoir. The EPA RSL threshold for lifetime exposure to humans to contaminated soils in residential settings for arsenic and nickel are 0.39 and 0.38 mg/kg, respectively, and, although exceeded, the exposure durations will be sufficiently low for exposure to be unlikely to lead to adverse effects. The results of the bioassays only indicated the potential for toxicity of reservoir sediments to benthic biota in J.C. Boyle reservoir, and CDM argued that increased toxicity in a dam removal scenario is unlikely given the dilution of the material. The lab results of contaminant testing for each reservoir are presented in EIS/R Appendix C and CDM (2011) Chapter 3 and Appendices A and B.
Current Screening Limit Standards and Reassessment of Results
KRRC reviewed previous results with respect to minor changes in SLs since 2011 and determined that the changes do not alter the previous conclusions. The updated SEF SLs in the current 2016 SEF Table 6-2 are generally similar to previous iterations of SEF SLs. The marine SLs are unchanged from the 2009 SEF with the exception of the pesticide dichlorodiphenyltrichloroethane (DDT), for which the SL was increased. The freshwater SL1 values from the 2016 SEF are generally similar to and typically higher than previous values, so the conclusions in the 2012 EIS/R regarding SEF SLs are still valid.

Definite Plan
150 04 | Reservoir Drawdown and Diversion Plan June 2018
KRRC reassessed the concentrations of the metals arsenic, chromium, nickel, and silver, for which the 2016 SEF SLs are lower than those used by CDM. For arsenic, chromium, and nickel, the lowest freshwater screening levels used by CDM were lower than the SEF SL1 value, so there is no change in the samples designated as exceeding the SLs criteria. Silver was not previously found to exceed any SLs. The standards of the EPA RSLs for the total carcinogenic RSLs for residential soils for arsenic and nickel are more protective than the SEF values, and the RSL values have not changed in a way that alters previous evaluations.
In the 2016 SEF, PAH SLs are defined as summed quantities rather than SLs for each contaminant as with the previous SLs. The maximum PAH RL values from the 2011 analysis are sufficiently low to not exceed the total PAH SL value in the 2016 SEF when summed. For 19 analytes (e.g., some PCBs, volatile organic compounds (VOCs), and semi-volatile organic compounds (SVOCs)) measured during 2009-2010, RLs were greater than SLs, so it remains undetermined if concentrations exceed revised SLs. However, it was determined that these contaminants were unlikely to contribute to risk of contamination, and this argument is unaffected by any revisions to SLs. The results of the bioassays are not impacted by any new standards or SLs.
4.10.7 Flooding and Slope Instability
KRRC considers the potential for significant flooding and slope instability downstream of Iron Gate Dam due to and during reservoir drawdown activities to be low and equivalent to (or better than) the existing condition. This is primarily due to the discharge capacity of the modified Iron Gate diversion tunnel, which is equivalent to a 5-year flood event. If the reservoir refills and spills during an event much larger than the 5-year flood event, this larger event would cause increased downstream flows even without the drawdown because the reservoirs are not used for flood control. For non-flood event periods, flows in the downstream channel will not exceed a 5-year flooding event; therefore, KRRC does not expect reservoir drawdown to cause erosion or subsequent slope instability downstream of Iron Gate Dam. In fact, during reservoir drawdown, Iron Gate Reservoir will actually attenuate larger flood events resulting in lower flood discharges than would occur under existing conditions.
Since drawdown will not result in flooding or slope instability, KRRC does not propose reconnaissance of potentially inundated areas downstream of Iron Gate Dam.

Definite Plan
June 2018 05 | Dam Removal Approach 151
Chapter 5: Dam Removal Approach

Definite Plan
152 05 | Dam Removal Approach June 2018
This page intentionally left blank.

Definite Plan
June 2018 05 | Dam Removal Approach 153
5. DAM REMOVAL APPROACH 5.1 Introduction The general strategy for dam removal assumes the natural release of sediment to the Klamath River from the three larger reservoirs (J.C. Boyle, Copco, and Iron Gate) will be initiated no earlier than January 1, 2021. KRRC will accomplish the reservoir drawdown and associated sediment release through regulated releases from the diversion facilities described in Section 4.2, to draw down the reservoirs in a controlled manner. Development removal, as defined by the KHSA, is to produce a free-flowing river at all four hydroelectric dam sites (J.C. Boyle, Copco No. 1, Copco No. 2, and Iron Gate) by the specified December 31 completion date.
The proposed Project (Full Removal alternative) achieves the project objectives of free-flowing river conditions and volitional fish passage by the complete removal of dams (except for buried features), power generation facilities, water intake structures, canals, pipelines, and ancillary buildings. The Partial Removal alternative, which KRRC presents for purposes of environmental review, also achieves the objectives of free-flowing river conditions and volitional fish passage, but portions of each dam would remain in place, along with ancillary buildings and structures such as powerhouses, foundations, tunnels, and pipes. The Partial Removal alternative is discussed in this section as the Partial Removal Options (PROs). PROs that will not be buried will be sealed or fenced to prevent unauthorized entry and for public safety, and will likely involve long-term maintenance costs. KRRC will remove hazardous materials from each dam site and from any PRO if it were to be implemented during construction.
Quantity estimates for all features removed by the Project, including earth fill volumes, concrete volumes and weights of mechanical and electrical equipment, have been carefully prepared using detailed engineering drawings provided by PacifiCorp, which are believed to represent current, as-built conditions. Members of the engineering design team have examined each dam site by to confirm the existence of project features for which quantities have been prepared for this level of design. However, KRRC has conducted no independent surveys or measurements of dam embankments, concrete structures, or equipment to confirm the PacifiCorp data. KRRC will use new topographic and bathymetric surveys to confirm earthwork quantities.
The following sections define the removal limits, PROs, access roads, staging areas, disposal sites, likely demolition methods, and waste disposal requirements for each dam and hydropower development. Drawings have been prepared for each development to define the proposed removal limits for the dam and for each appurtenant feature in plan and cross-sectional view, and are included in Appendix B (CEII) and Appendix C (non CEII). Figure 5.1-1(C) shows an overview of the work areas and major access routes.
Figure 5.1-1 Project Limits of Work and Access (Appendix C)
The bulleted list below provides a roadmap for specific waste disposal items:

Definite Plan
154 05 | Dam Removal Approach June 2018
• Sections 5.2.3 (J.C. Boyle), 5.3.3 (Copco No. 1), 5.4.3 (Copco No. 2) and 5.5.3 (Iron Gate) summarize location and size of disposal sites. Figures 5.2-1(C), 5.3-1(C), and 5.5-1(C) show disposal site location and approximate grading. Figures 5.2-8 (C), 5.2-9 (C), 5.3-8 (C), 5.5-4 (C), and 5.5-5(C) provide additional detail (plan and profile) for the disposal sites.
• Sections 5.2.7, 5.3.7, 5.4.7 and 5.5.7 provide description of materials (quantity and type) being buried at each disposal site.
• Sections 5.2.3, 5.3.3, 5.4.3 and 5.5.3 summarize measures and monitoring associated with disposal site erosion.
• Sections 5.2.7, 5.3.7, 5.4.7 and 5.5.7 provide description of materials (quantity and type) that will be disposed of at local landfills, including an estimate of truck trips.
• Sections 5.2.7, 5.3.7, 5.4.7 and 5.5.7 provide description of material (quantity and type) that will be recycled.
• Description of hazardous material (quantity and type) that may be encountered, and plans for safe handling and disposal is provided in Appendix O3.
5.2 J.C. Boyle Dam and Powerhouse
5.2.1 Removal Limits
J.C. Boyle Dam is located within a relatively narrow canyon on the Klamath River at RM 230.6. Minimum requirements for a free-flowing condition and volitional fish passage on the Klamath River through the J.C. Boyle dam site require the complete removal of the embankment section and concrete cutoff wall to the bedrock foundation, to ensure long-term stability of the site and to prevent the development of a potential fish barrier at the site in the future. Table 5.2-1 summarizes and Figure 5.2-1 (C) shows features the Project will remove or potentially retain as PROs.
Figure 5.2-1 J.C. Boyle Dam Removal Features and Limits (Appendix C)
Table 5.2-1 J.C. Boyle Dam and Powerhouse, Removal Requirements
Feature Full Removal
Partial Removal Options
Comments1
Embankment Dam, Cutoff Wall Remove Remove Spillway Gates and Crest Structure Remove Remove Concrete Box Diversion Culverts Remove Remove Fish Ladder and Diffusion Box Remove Remove Timber Bridge Remove Remove Steel Pipeline and Supports Remove Retain PRO: Retain as footbridge, supports will
remain in 100-year floodplain Canal Intake (Screen) Structure Remove Retain PRO: Seal openings, install security fence

Definite Plan
June 2018 05 | Dam Removal Approach 155
Feature Full Removal
Partial Removal Options
Comments1
Left Concrete Gravity Section Remove Retain Canal Headgate Structure Remove Retain PRO: Retain as observation point Power Canal (Flume) Remove Retain PRO: Retain invert slab Shotcrete Slope Protection Retain Retain Removal would destabilize excavated rock
slopes and increase potential for rock falls Forebay Spillway Control Structure and Discharge Chute
Remove Remove
Tunnel Inlet Portal Structure Remove Remove Surge Tank Remove Remove Potential future seismic stability Penstocks, Supports, Anchors Remove Remove Avoid maintenance, facilitate wildlife migration Tunnel Portals Plug Plug Plug with reinforced concrete Powerhouse Gantry Crane Remove Remove Powerhouse (incl. mechanical and electrical equipment)
Remove Retain PRO: Substructure below roadway, seal openings
Powerhouse Hazardous Materials (transformers, batteries, insulation, petroleum products)
Remove Remove
Tailrace Flume Walls Remove Remove Tailrace Channel Area Backfill Backfill Canal Spillway Scour Area Backfill Backfill Backfill to extent possible with concrete rubble
from dam, canal, and powerhouse Three 69-kV Transmission Lines, 2.8 mi total (incl. poles and transformers)
Remove Remove
Switchyard (incl. fencing, poles, and transformers)
Remove Remove
Buildings: office building (the Red Barn), maintenance shop, fire protection building, communications building, 2 residences, storage shed, reservoir level gauges house
Remove All
Retain PRO: Retain some structures
1. PROs would involve long-term maintenance costs, including the preservation of any exposed items with coatings containing heavy metals (such as the penstocks).
Retention of the portions of the J.C. Boyle powerhouse below the roadway as a PRO would require the structure to be sealed. KRRC assumes the paint on the downstream face of the concrete structure contains heavy metals and would be carefully removed. Mechanical and electrical equipment could be left in place with all power connections to the outside removed; however, any oil in the turbine governor and hydraulic control systems, transformers, oil storage tanks, or other equipment would be removed. KRRC’s contractor will also remove other potentially hazardous materials, such as batteries. The tailrace channel between the powerhouse and the river channel could be backfilled to the pre-construction contours if necessary, which

Definite Plan
156 05 | Dam Removal Approach June 2018
would eliminate the need to remove the concrete training walls. Retention of the lower portion of the powerhouse would not impact the 100-year floodplain.
5.2.2 Construction Access
Figures 5.1-1(C) and 5.2-1(C) show construction access roads and associated improvements that may be required for removal of J.C. Boyle Dam and Powerhouse. KRRC observed existing conditions of the highways, local roads, and structures in the field to identify deficiencies and determine if improvements are necessary for mobilization and/or hauling during construction and demolition activities. KRRC will complete access road improvements prior to associated construction and removal at the dam and powerhouse. The following sections summarize the assessment completed of each road or highway identified for use during construction, and specific improvements are identified, as appropriate.
The Dalles California Highway (US97)
The Dalles California Highway (US97) is classified as a rural principal arterial road that runs north-south in Oregon and intersects with Keno Worden Road. It is a two-lane undivided roadway with a posted speed limit of 65 mph. KRRC’s contractor will use this stretch of highway for mobilization of construction equipment and as a haul route to carry demolished materials other than earth and concrete rubble from the dam and powerhouse site to approved commercial landfills. The alignment and pavement are in good condition and well maintained. KRRC does not propose improvements and upgrades to this highway for mobilization or hauling of materials for the Project. Pavement rehabilitation will likely not be needed during or post-construction. KRRC’s contractor will obtain transportation permits, if required, from the Department of Transportation for mobilizing “wide-load” truck trailers with construction equipment. KRRC’s contractor will obtain hauling permits if US97 is used for carrying oversize loads of materials removed from the site.

Definite Plan
June 2018 05 | Dam Removal Approach 157
Figure 5.2-2 US97 and Keno Worden Rd
Oregon Route 66 (OR66, Green Springs Highway)
OR66 is a state highway classified as a rural minor arterial that runs east-west in Oregon and north of the Klamath River. It is a two-lane undivided roadway with posted limits of 35 to 45 mph. The highway’s western terminus is at Oregon 99 near Ashland and its eastern terminus is at The Dalles California Highway (US97) and Oregon 140 near Klamath Falls. KRRC’s contractor will use the segment of roadway between J.C. Boyle Dam/Powerhouse Access Road and US97 for mobilization and as a haul route for materials taken to commercial landfills. The pavement is in fair condition. KRRC does not propose improvements and upgrades to this highway for mobilization and hauling for the Project. Pavement rehabilitation will likely not be needed during or post-construction. This portion of OR66 includes Spencer Bridge (ODOT Bridge No. 19789).
Spencer Bridge
Spencer Bridge (OR66) is a 3-span continuous welded steel plate girder bridge that is approximately 558 feet long and 43 feet wide. It was built in 2005 for a HL-93 truck design load. The structure has a
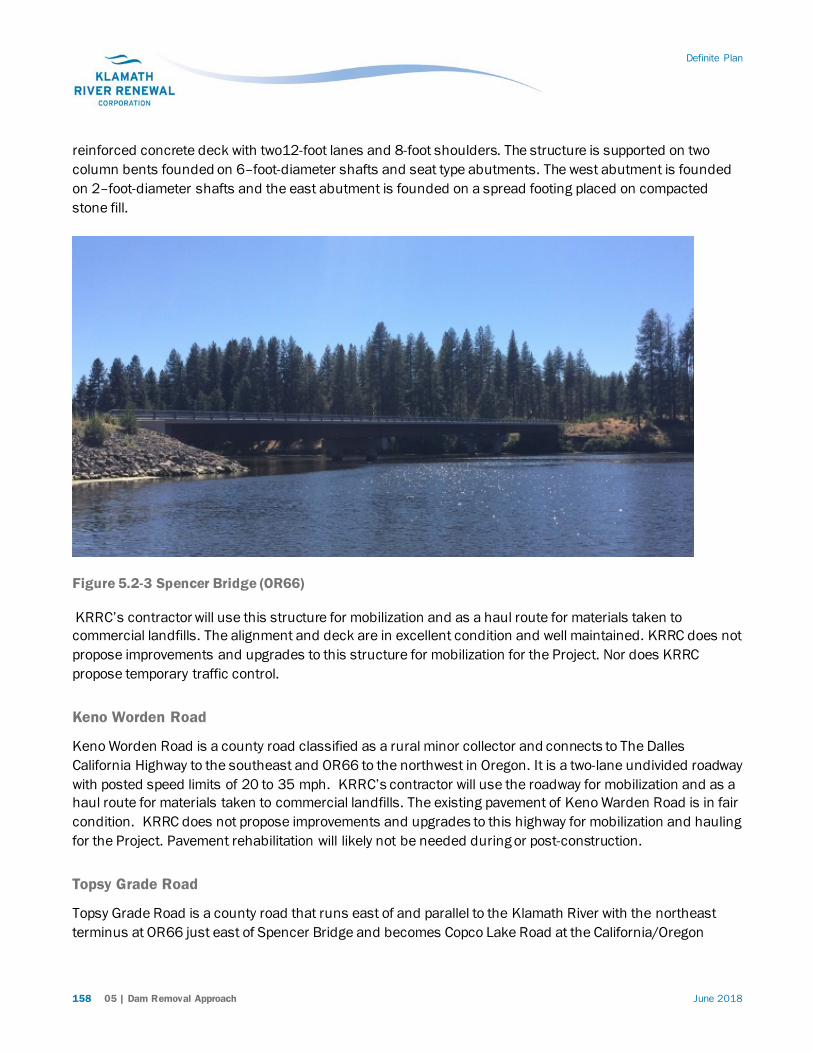
Definite Plan
158 05 | Dam Removal Approach June 2018
reinforced concrete deck with two12-foot lanes and 8-foot shoulders. The structure is supported on two column bents founded on 6–foot-diameter shafts and seat type abutments. The west abutment is founded on 2–foot-diameter shafts and the east abutment is founded on a spread footing placed on compacted stone fill.
Figure 5.2-3 Spencer Bridge (OR66)
KRRC’s contractor will use this structure for mobilization and as a haul route for materials taken to commercial landfills. The alignment and deck are in excellent condition and well maintained. KRRC does not propose improvements and upgrades to this structure for mobilization for the Project. Nor does KRRC propose temporary traffic control.
Keno Worden Road
Keno Worden Road is a county road classified as a rural minor collector and connects to The Dalles California Highway to the southeast and OR66 to the northwest in Oregon. It is a two-lane undivided roadway with posted speed limits of 20 to 35 mph. KRRC’s contractor will use the roadway for mobilization and as a haul route for materials taken to commercial landfills. The existing pavement of Keno Warden Road is in fair condition. KRRC does not propose improvements and upgrades to this highway for mobilization and hauling for the Project. Pavement rehabilitation will likely not be needed during or post-construction.
Topsy Grade Road
Topsy Grade Road is a county road that runs east of and parallel to the Klamath River with the northeast terminus at OR66 just east of Spencer Bridge and becomes Copco Lake Road at the California/Oregon

Definite Plan
June 2018 05 | Dam Removal Approach 159
border to the southwest. It is a two-way access road ranging in width between 14 feet and 18 feet. Most of the roadway is gravel and some short sections are asphalt, particularly near the Topsy Campground (managed by BLM) at J.C. Boyle Reservoir. KRRC’s contractor will use the section of roadway between the Topsy Recreation Site and OR66 for mobilization and material hauling. KRRC does not propose improvements and upgrades to this roadway for the Project. KRRC’s contractor may perform pavement rehabilitation during or post-construction. KRRC’s contractor will use temporary traffic control for any pavement rehabilitation.
Figure 5.2-4 Topsy Grade Road – Causeway Road
Access Road from OR66 to J.C. Boyle Dam
The Access Road from OR66 to J.C. Boyle Dam is a private gravel road ranging in width between 16 to 18 feet and is owned and maintained by PacifiCorp. The pavement is in fair condition. KRRC’s contractor will use this section of roadway for mobilization and material hauling. KRRC will improve parts of the road by regrading uneven or rutted areas. At the intersection with OR66, KRRC will perform tree removal and widening of the intersection on the access road approach, which will improve corner sight distance for

Definite Plan
160 05 | Dam Removal Approach June 2018
mobilization and hauling activities. In addition, KRRC will install advance signage to notify vehicles using OR66 of construction trucks entering/exiting at the intersection. KRRC’s contractor will use temporary traffic control during tree removal and intersection widening. This road will be left in place and will be used by both the future land owner and BLM, who uses it to access their adjacent property.
J.C. Boyle Powerhouse Road
The Powerhouse Access Road is an access road that runs between the J.C. Boyle Powerhouse and Dam sites. The majority of this road is owned by BLM, while a short length is owned by PacifiCorp. The full length, however, is maintained by PacifiCorp. It is a two-way undivided gravel road 16 to 22 feet wide. The existing gravel road condition is fair. KRRC’s contractor will use this section of roadway as a primary haul route to transport material from the powerhouse to the scour hole below the forebay, and to haul some excavated material from the dam to the tailrace. The average one-way haul distance from the powerhouse to the scour hole below the forebay is approximately 1.8 miles. The average one-way haul distance from the dam to the tailrace is approximately 4.2 miles. KRRC does not propose improvements and upgrades for this roadway for the Project. KRRC anticipates road maintenance in some areas during construction to ensure adequate accessibility, where the existing surface will be damaged due to construction vehicles. Temporary traffic control will not be required. This road will be left in place and will be used by both the future land owner and the public to access adjacent BLM property.
Timber Bridge
A private, PacifiCorp-owned timber bridge spans over the Klamath River just south of J.C. Boyle Dam. The structure is a single span rolled steel beam bridge that is 100–foot-long and 18 feet wide with a 16-foot travel lane. It was built in 2003 for a HS20-44 truck design load. It is used to access the power canal and powerhouse. The bridge has a timber deck supported on 4 beams that are welded to steel floor beam at the abutments. The floor beam is founded on 4 steel piles. The alignment and deck are in good condition and well maintained.
KRRC’s contractor will not use the bridge for mobilization of construction access, and improvements and upgrades to this structure are not required. Temporary traffic control will not be required. KRRC’s contractor will demolish this bridge post-construction, as described in Section 7.4.
Power Canal Access Road
The power canal access road runs between the dam and forebay spillway. The majority of this road is owned by BLM, while a short length is owned by PacifiCorp. The full length, however, is maintained by PacifiCorp. It is a gravel road immediately adjacent to the power canal and has a width of approximately 14 feet. The surface is in poor condition. KRRC’s contractor will use this section of roadway for construction access until the power canal has been completely removed. Minor periodic roadway maintenance such as re-grading will likely be required to address roadway deterioration during construction. KRRC does not propose temporary traffic control. This road will be left in place for continued use by BLM.

Definite Plan
June 2018 05 | Dam Removal Approach 161
Figure 5.2-5 Timber Bridge at J.C. Boyle
Disposal Access Road
The private, PacifiCorp-owned disposal access road runs between the dam and on-site disposal area just north of the dam. KRRC’s contractor will use this road will be used for material hauling. The average one-way haul distance is approximately 0.4 mile. Improvements for this roadway include regrading uneven and rutted areas and widening in some segments to facilitate two-way traffic. KRRC does not propose temporary traffic control as this is not a public road. KRRC’s contractor will demolish this road and restore it to native vegetation post-construction.
Right Abutment Access Road
The private, PacifiCorp-owned right abutment access road runs between the dam and Topsy Grade Road. It is a gravel road in fair condition. KRRC’s contractor will use the roadway for mobilization and material hauling. KRRC does not propose improvements to the road and does not propose temporary traffic control. KRRC’s contractor will demolish this road and restore it to native vegetation post-construction.

Definite Plan
162 05 | Dam Removal Approach June 2018
Figure 5.2-6 Power Canal Access Road
Penstock Access Roads
Several BLM-owned dirt roads extend from the J.C. Boyle Powerhouse Road up to various elevations along the penstocks. KRRC’s contractor will use that these roads to access the penstocks for demolition and related material hauling. KRRC does not propose improvements to the roads for the Project. KRRC does not propose temporary traffic control. KRRC’s contractor will demolish this road and restore it to native vegetation post-construction.

Definite Plan
June 2018 05 | Dam Removal Approach 163
Figure 5.2-7 Right Abutment Access Road
5.2.3 Staging Areas, and Disposal Sites
Figure 5.2-1(C) shows construction staging areas and disposal sites for removal of J.C. Boyle Dam and Powerhouse within the limits of work on and are discussed in the following sections. The contractor will mobilize construction equipment to the site by about October 2020 to prepare the staging areas and prepare the right abutment disposal site for dam removal post-drawdown.
Staging Areas
Equipment staging areas (Figure 5.2-1(C)) will be located at the left abutment of the dam and near the forebay and downstream powerhouse. Identified staging areas include a 4.7 acre area and a 5.6 acre area on the left abutment of the dam, a 1.0 acre area at the forebay, and a 1.7 acre area at the powerhouse. The contractor will prepare staging areas by clearing vegetation and minor grading. The staging areas will be restored post-construction by minor grading and hydroseeding. See Section 6 for additional detail associated with restoration.
Disposal Sites
The contractor will permanently bury earth materials generated from removal of the J.C. Boyle development on-site in a portion of the original borrow pit located on the right abutment of the dam (see Figure 5.2-1(C)
Definite Plan
164 05 | Dam Removal Approach June 2018
and sections in Figures 5.2-8(C) and 5.2-9(C)) within the project area. Excavated embankment materials will be hauled along existing access roads to the northwest portion of the former borrow pit just north of the cleared transmission line corridor, covering an area of approximately 6 acres. KRRC’s contractor will grade the disposed material as a hill (maximum fill height of about 35 feet) contoured to blend into the surrounding topography as shown in plan and section on Figure 5.2-1(C), Sheet 1. Preparation of the disposal site will include clearing of existing vegetation and stripping and stockpiling of what little topsoil is present. KRRC’s contractor will excavate the top 12 inches of the downstream face of the dam and stockpile it near the disposal site for later use as topsoil for restoration of the disposal site. Special precautions will be required for work below the high voltage transmission lines, but adequate clearance is available. After final grading for drainage and aesthetics, KRRC’s contractor will cover the disposal site with topsoil and hydroseed the area. Compaction other than by equipment travel will not be necessary. See Section 6 for additional detail associated with restoration. KRRC will complete erosion monitoring on an annual basis for 5 years following placement to assess whether significant erosion and slope deterioration has occurred. If significant erosion occurs, KRRC will repair the eroded area to the satisfaction of the appropriate regulatory agency.
Figure 5.2-8 J.C. Boyle Right Abutment Disposal Site Plan & Sections (Appendix C)
Figure 5.2-9 J.C. Boyle Forebay Spillway Scour Hole Backfill Plan & Sections (Appendix C)
Concrete rubble from the dam, flume, forebay, and powerhouse will be placed within the project property in the eroded scour hole below the forebay spillway structure (Figure 5.2-1(C), Sheet 8), and covered with 3 to 5 feet of rock and soil debris that has eroded and been moved downslope of the scour hole. KRRC’s contractor will use the previously eroded rock and soil, which they will obtain from the slope below the scour hole, as top cover so that the restored scour hole will blend more naturally into the adjacent slopes. The scour hole, which is approximately 100 feet deep with near vertical side slopes, was eroded into a steep slope (1.3H:1V to as steep as 1H:1V) of talus and colluvium. Filling of the scour hole to match the original slope and maintain an adequate factor of safety for slope stability will not be feasible. The concrete rubble, which has a high shear strength, will be spread in lifts and track walked with a small bulldozer to a finished slope of 1.5H:1V. The finished slope will have a factor of safety of more than 1.3. The volume of available concrete rubble will fill the hole to within about 66 feet of the top of the hole (Figure 5.2-1(C), Sheet 8). The vertical slopes extending above the finished fill grade will be flattened to 1H:1V. The fill will be shaped to drain toward the center of the fill, which will be rock lined to provide for erosion protection. Use of the previously eroded rock and soil debris will allow similar vegetative cover to be used for restoration as is currently present on the slopes upstream and downstream of the scour hole.
Rebar, mechanical and electrical equipment from the dam, power canal and powerhouse, in addition to building material and demolished powerline material will be disposed of at an approved landfill near Klamath Falls. Table 5.2-3 lists tonnage and volume of these materials.

Definite Plan
June 2018 05 | Dam Removal Approach 165
5.2.4 J.C. Boyle Dam and Powerhouse Removal
Dam Removal
Immediately following reservoir drawdown with the reservoir level below the spillway crest (see Section 4.2.1), KRRC’s contractor will remove all three spillway gates and operators, the spillway bridge deck, the spillway piers, and the log boom in the dry. KRRC’s contractor will retain the left abutment wall with fish ladder that supports the left side of the embankment for flood protection until after spring runoff when embankment removal could begin.
KRRC’s contractor will maintain sufficient embankment freeboard at all times between the elevation of the excavated embankment surface and the reservoir to reduce the potential for flood overtopping and potential embankment failure. The freeboard requirement will be to provide 100-year flood protection for the time of year that embankment dam removal is occurring (see Section 4.4). KRRC will not start excavation of the J.C. Boyle embankment section until July 1, 2021, and will complete excavation by September 30, 2021 to minimize hydrologic risk.
Removal of the remaining features at the dam will be as follows:
1. At the beginning of embankment excavation, reservoir inflows will have reduced to a level that is below the crown of the diversion culverts (elevation 3765.2).
2. Remove dam embankment in July and August to no lower than elevation 3770.7 (about 30 feet above bedrock at upstream toe) to provide an upstream cofferdam (Figure 5.2-10 (B)) sufficient to ensure minimum 100-year flood protection (with freeboard) in September for flows up to about 3,500 cfs through left abutment. Remove riprap from upstream and downstream slopes as embankment is removed and temporarily stockpile for later use on downstream slope of upstream cofferdam. Remove embankment materials downstream of upstream cofferdam limits to final channel grade, including concrete cutoff wall. Remove the left abutment wall with fish ladder concurrent with dam removal.
3. Place excavated rockfill (from stockpile) on downstream face of upstream cofferdam as required for controlled breach of cofferdam embankment to bedrock elevation 3740.7 at upstream toe.
4. Remove the concrete spillway crest structure down to the top of the diversion culvert, and remove the canal intake structure and the left gravity wall in July, concurrently with the beginning of embankment removal (Figure 5.2-10 (B)).
5. Prior to September 30, 2021, but following breaching of the upstream cofferdam at Iron Gate Dam (to minimize downstream impacts), breach the J.C. Boyle upstream cofferdam by notching below reservoir level (expected to be below RWS elevation 3763.7). Breaching will occur with a reservoir head behind the cofferdam of about 20 feet. Achieve final reservoir drawdown by natural erosion of the armored cofferdam to the original streambed level. The cofferdam breach at J.C. Boyle could release up to 5,000 cfs.
6. Following the cofferdam breach, remove any remaining embankment materials from river channel in the wet (during low flow period) as required, and remove remaining diversion culvert concrete in the dry.

Definite Plan
166 05 | Dam Removal Approach June 2018
7. Remove all other features (buildings, paving on access roads, etc.) as required. Restore dam site and right abutment disposal site as required, including the placement of topsoil and seeding.
Portions of the dam and hydropower demolition must be performed within the in-stream construction window negotiated with the regulatory agencies. See Section 8.6 of this Definite Plan for information pertaining to the construction schedule and timing of the various activities.
Figure 5.2-10 J.C. Boyle Dam Removal (Appendix B)
Canal Removal
Removal of the power canal will likely be from the downstream end to the upstream end but the contractor could alter the approach. In portions of the canal that are two-walled, both walls and the invert slab will be demolished using mechanical methods (e.g. hydraulic shears or hoe-ramming). In portions of the canal that are single-walled, KRRC’s contractor will demolish the wall and the invert slab, but shotcrete that may have been used to stabilize portions of the inside wall formed by exposed rock will be left in place. Removal of the shotcrete could destabilize the rock slope increasing the potential for rock falls during and after construction. KRRC’s contractor will remove reinforcement from the concrete as the demolition proceeds upstream. KRRC’s contractor will haul the concrete rubble and gravel underlying the invert slab downstream and place it in the forebay structure spillway scour hole (see Section 5.2.3.2). Following removal of the canal structure, KRRC’s contractor will restore the excavated bench the canal was built on by grading the bench to drain, armoring portions of the bench where drainage from uphill areas will cross the bench, and removing vehicular access to the bench. The outer portion of the bench (current location of the access road), will be decompacted using tines on the back of a motor grader and hydroseeded. As an alternative, KRRC may maintain the current access road for fishing access, if requested by BLM and subject to arrangements that are satisfactory to BLM and KRRC. KRRC’s contractor will regrade the forebay area to drain and to blend in with surrounding topography (see Figure 5.2-11). See Section 6 for additional detail associated with restoration.
Figure 5.2-11 J.C. Boyle Forebay Backfill Plan and Sections (Appendix C)
Powerhouse Removal
KRRC’s contractor will remove the downstream powerhouse, as required, any time after decommissioning by constructing a cofferdam in the tailrace channel for removal operations in the dry. Removal of the remaining features at the powerhouse will be as follows:
1. Use sump pumps to dewater area, as required. Retain the cofferdam as partial backfill for tailrace channel.
2. Remove penstocks and plug tunnel openings. 3. Remove switchyard and warehouse building. 4. Backfill the tailrace channel by removing up to 5 feet of alluvial material from upstream and
downstream of the tailrace channel (Figure 5.2-1(C), Sheet 9) that originally came from excavation of

Definite Plan
June 2018 05 | Dam Removal Approach 167
the powerhouse and tailrace and placing the material in the channel by pushing using a bulldozer or placement using a large excavator.
5. Place a turbidity curtain along the downstream edge of the channel to minimize water quality impacts to the river during placement of the backfill.
Transmission Line and Switchyard Removal
Transmission line removal at J.C. Boyle includes demolishing the J.C. Boyle switchyard, demolishing overhead distribution lines and associated poles or towers, as applicable, and installation of new connections to maintain the power grid (see Figure 5.2-12).
KRRC’s contractor will demolish approximately 2.8 miles of overhead transmission/distribution line and approximately 42 poles. Lines to be demolished include:
• 230 kV distribution lines between J.C. Boyle switchyard and J.C. Boyle Dam, including to the village houses near the dam
• 230 kV connections in the J. C. Boyle powerhouse area
Major switchyard demolition components include:
• Two (2) A-Frame Dead End Structures (typically ~60-80ft high)
• Two (2) large 230 kV Transformers
• Two (2) 230 kV Power Circuit Breakers
• One (1) 230 kV switchyard tie structure
• Approximately 600-ft of perimeter chain-link fence
PacifiCorp may salvage the transformers and other equipment for reuse at other facilities.
New connections include installation of two (2) new 230 kV strain transmission structures outside J.C. Boyle switchyard to tie the existing 230 kV transmission line north and south of J.C. Boyle switchyard together. Currently these lines loop in/out of J.C. Boyle, but continuity will be broken when the contractor removes the powerhouse and switchyard.
Figure 5.2-12 Project Transmission Line Removal (Appendix B)
5.2.5 Demolition Methods, Estimated Equipment and Workforce KRRC proposes the following demolition methods, estimated equipment requirements, and estimated workforce requirements for planning purposes based on similar projects and engineering judgment. Alternative methods, equipment, and workforce that would also meet project requirements are possible and could be refined by KRRC’s contractor.

Definite Plan
168 05 | Dam Removal Approach June 2018
Demolition Methods
KRRC’s contractor will remove the spillway gates and traveling hoists by a large crane for loading onto highway trucks and heavy-haul trailers, with the reservoir drawn down below the spillway crest. The reinforced concrete spillway bridge deck and piers could be removed in pieces by hydraulic excavators, or in sections by conventional or diamond-wire sawcutting. KRRC’s contractor will remove the upstream concrete stoplogs for the diversion by blasting if they cannot be pulled out of their slots by a crane under reservoir head.
KRRC’s contractor will remove the lower portion of the concrete spillway section by hoe-ramming or by drilling and blasting in the dry. Drilling for blasting will include small- to mid-sized hydraulic track drills and perhaps air-track drills supported by 850 to 1,200 cubic feet per minute (CFM) air compressors. Considerable jack-leg and similar hand drilling will supplement the machine drilling for special shots. Reinforced concrete in deck, wall, and floor slabs for remaining features to be removed (including fish ladder, canal intake structure, power canal, forebay structures, and powerhouse) will be excavated by mechanical methods (e.g. hydraulic shears or hoe-ramming), or possibly in sections by conventional or diamond-wire sawcutting. KRRC’s contractor will haul concrete rubble in 25 to 30 ton articulated off-road trucks or 12 to 15 ton tandem-axle highway trucks to the scour hole below the forebay. KRRC’s contractor will haul mechanical and electrical equipment and miscellaneous items in a mixture of 12 to 15 ton tandem-axle highway trucks, 25-ton rock trailers, and conventional heavy-haul trailers to an approved off-site disposal area.
Conventional earthmoving equipment required to remove the embankment will consist of up to eight 25 to 30 ton articulated off-road trucks with two 4 CY excavators to reach the required average production rate of 400 CY per hour, or 16,000 CY per week (5 days per week, single shift) for removal of the dam embankment within 8 to 9 weeks. KRRC expects the contractor to use dozers for knockdown and grading at the disposal sites as well as to support higher production, mass excavation operations.
Estimated Equipment and Workforce Requirements
The estimated equipment that will be used for the removal of J.C. Boyle Dam and Powerhouse and for restoration of the reservoir area pre- and post- drawdown are shown in Table 5.2-2.
Table 5.2-2 J.C. Boyle Dam and Powerhouse, Estimated Equipment List
Name of Equipment Pre-Drawdown
Post Drawdown
Crawler-mounted lattice boom crane, 150 to 200 ton, 160- to 200-foot boom X Rough terrain hydraulic crane, 35 to 75 ton X Hydraulic track excavators, 65,000 to 120,000 lb, with Cat H120 hoe-ram, thumb and shear attachments
X
Cat 966 or Cat 988 wheel-loaders, 4 CY bucket X Cat 740 articulated rear dump trucks, 30 ton (22 CY) X X D-6 or D-8 standard crawler dozers X X

Definite Plan
June 2018 05 | Dam Removal Approach 169
Name of Equipment Pre-Drawdown
Post Drawdown
Front-end wheel loader, integrated tool carrier, 25,000 lb X Cat TL943 rough terrain telescoping forklift X Rough terrain telescoping manlift X Truck-mounted seed sprayer, 2500 gallon X On-highway, light duty diesel pickup trucks, ½ ton and 1 ton crew X X On-highway flatbed truck with boom crane, 16,000 lb X On-highway truck tractors, 45,000 lb X Off-highway water tanker, 5,000 gallon X Engine generators, 6.5 KW to 40 KW, diesel or gasoline X Air compressors, 100 psi, 185 to 600 cfm, diesel X Hand-held drilling, cutting, and demolition equipment X Portable welders and acetylene torches X 4-inch submersible trash pumps, electric X
An estimated average workforce of 25 to 30 people will be required for the construction activities, for an estimated duration of 12 months from site mobilization to construction completion for either dam removal alternative. The peak workforce required during excavation of the dam embankment could reach 40 to 45 people.
5.2.6 Imported Materials
KRRC’s contractor will import some materials to the site to support dam removal. The most likely materials to be imported include gravel surfacing from a commercial quarry for temporary haul roads (approximately 2,800 tons, 100 truck trips), seed and mulch materials, and minor quantities of ready-mix concrete and reinforcing steel from local commercial sources for tunnel plugs.
5.2.7 Waste Disposal
Table 5.2-3 shows estimated quantities of materials generated during removal of J.C. Boyle Dam and Powerhouse, numbers of truck trips, and approximate haul distances for waste disposal. KRRC’s contractor will place excavated concrete in the scour hole below the emergency spillway. KRRC’s contractor will primarily place excavated embankment materials in the right abutment disposal area. KRRC’s contractor will separate reinforcing steel from the concrete prior to placement in the scour hole and haul it to a local recycling facility. KRRC’s contractor will haul all mechanical and electrical equipment to a suitable commercial landfill or salvage collection point.

Definite Plan
170 05 | Dam Removal Approach June 2018
Table 5.2-3 Waste Disposal for Full Removal of J.C. Boyle Dam
Waste Material In-Situ Quantity
Bulk Quantity 1 Disposal Site Peak Daily Trips 2 Total Trips 3
Earth 102,000 CY
7,100 CY
123,000 CY
7,800 CY
Onsite right abutment disposal area Onsite powerhouse tailrace
5 units/160 trips (unpaved road) 5 units/160 trips (unpaved road)
5,600 trips (1 mile RT)
360 trip (8 miles RT)5
Concrete at: Dam Power canal Powerhouse
4,700 CY
33,300 CY 1,900 CY
6,100 CY
43,200 CY 2,600 CY
Onsite forebay spillway scour hole
2 units/50 trips (unpaved road)
120 trips (4 miles RT)
1,810 trips (2 miles RT)
270 trips (4 miles RT) Rebar at: Dam Power canal Powerhouse
200 tons
3,800 tons 100 tons
--- Landfill near Klamath Falls
2 units/10 trips (OR66)
20 trips (44 miles RT) 380 trips (48 miles RT) 10 trips (52 miles RT)
Mech. and Elec at: Dam Power canal Powerhouse
700 tons 300 tons
1,500 tons
--- Landfill near Klamath Falls
2 units/10 trips (OR66)
90 trips (44 miles RT) 40 trips (48 miles RT) 200 trips (52 miles RT)
Building Waste 10 buildings 12,000 ft2
2,700 CY Landfill near Klamath Falls
2 units/10 trips (OR66)
270 trips (44 miles RT)
Power lines 2.8 miles of 69-kV --- Landfill near
Klamath Falls
Notes: 1. Volumes increased 30 percent for concrete rubble, 20 percent for loose earth materials. 2. Peak daily trips for each site are based on the number of vehicles (units) shown, operating within one 8-hour shift. 3. Total trips of earthfill and concrete assume off-highway articulated trucks with a nominal load capacity of 22 CY.
Total trips for hauling rebar using truck tractor-trailers is based on 10 tons per trip. Total trips for hauling mechanical and electrical items using truck tractor-trailers is based on 8 tons per trip. Total trips for building waste using truck tractor-trailers is based on 10 CY per trip.
Table 5.2-4 shows potential commercial landfills or salvage collection points and capacities. Appendix O3 discusses potential hazardous materials at J.C. Boyle Dam and Powerhouse and their disposal.
Table 5.2-4 Waste Disposal Facilities near J.C. Boyle Dam
Name of Facility
Location Distance from Site
Remaining Capacity
Materials Accepted
Klamath County landfill
Klamath Falls, OR
20 miles 435,000 CY (2010)
construction and demolition waste, asbestos, contaminated soils, and recyclables

Definite Plan
June 2018 05 | Dam Removal Approach 171
5.3 Copco No. 1 Dam and Powerhouse
5.3.1 Removal Limits
Copco No. 1 Dam is located within a narrow canyon on the Klamath River at RM 202.2. Minimum requirements for a free-flowing condition and volitional fish passage on the Klamath River through the Copco No. 1 Dam site requires the complete removal of the concrete gravity arch dam between the left abutment rock contact and the concrete intake structure on the right abutment, to approximate elevation 2463.5, or 20 feet below the existing streambed level at the dam (see Appendix G), to prevent the development of a potential fish barrier at the site in the future. Table 5.3-1 summarizes and Figure 5.3-1 (C) shows features the Project will remove or potentially retain as PROs.
Table 5.3-1 Copco No. 1 Dam and Powerhouse, Removal Requirements
Feature Full Removal
Partial Removal Options
Comments 2
Concrete Dam Remove 1 Remove 1 Spillway Gates, Deck, Piers Remove Remove
Penstocks Remove Retain PRO: Seal openings, install security fence Powerhouse Intake Structure Remove Retain PRO: Seal openings, install security fence Gate Houses on Right Abutment Remove Possible PRO: Likely to be removed for access and for
large crane for dam removal. Diversion Control Structure Retain Retain PRO: Remove gate hoists, stems, and wire
ropes, demolish unstable concrete Tunnel Portals Plug Plug Plug with reinforced concrete Powerhouse (incl. mechanical and electrical equipment)
Remove Retain PRO: If retained will remain in 100 year floodplain
Powerhouse Hazardous Materials (transformers, batteries, insulation)
Remove Remove
Four 69-kV Transmission Lines (3.0 mi total) (incl. poles and transformers)
Remove Remove
Switchyard Remove Remove Warehouse and Residence Remove Remove
Notes: 1. Remove to El. 2463.5 which is 20 feet below original channel bottom (see Appendix G). 2. PROs would involve long-term maintenance costs, including the preservation of any exposed items with coatings
containing heavy metals (such as the penstocks).
Figure 5.3-1 Copco No. 1 and Copco No. 2 Dams Removal Features and Limits (Appendix C)
Retention of the Copco No. 1 Powerhouse as a PRO will require the structure to be sealed and fenced. KRRC assumes the paint on the east (upstream) face of the concrete structure contains heavy metals and would

Definite Plan
172 05 | Dam Removal Approach June 2018
be carefully removed. Mechanical and electrical equipment could be left in place with all power connections to the outside removed; however, any oil in the turbine governor and hydraulic control systems, transformers, oil storage tanks, or other equipment would be removed. KRRC’s contractor will also remove other potentially hazardous materials, such as batteries and treated wood. KRRC’s contractor could place rockflll or concrete rubble along the right river bank just upstream of the powerhouse to improve the flow conditions past the structure.
5.3.2 Construction Access
Figures 5.1-1(C) and 5.3-1(C) show construction access roads and associated improvements that may be required for removal of Copco No. 1 Dam and Powerhouse, and associated work. KRRC observed existing conditions of the highways, local roads, and structures in the field to identify deficiencies, and determine if improvements are necessary for mobilization and/or hauling during construction and demolition activities. KRRC will complete access road improvements prior to associated construction and removal at the dam and powerhouse.
The delivery of off-road construction equipment, including cranes, large excavators, loaders, and large capacity dump trucks will be by special tractor-trailer vehicles operating under “wide load” restrictions and at appropriate speeds.
Interstate 5 (I-5)
The Cascade Wonderland Highway (I-5) is classified as an interstate freeway that runs north-south through California and Oregon. The existing Henley Hornbrook interchange (Exit 789) provides access from the freeway to Copco Road. I-5 is a divided roadway with two-lanes on each direction with paved shoulders with a posted speed limit of 70 mph. KRRC’s contractor will use I-5 for mobilization of construction equipment and as a haul route to carry demolished materials other than earth and concrete rubble from the dam and powerhouse site to approved commercial landfills. The alignment and pavement are in very good condition and well maintained. KRRC does not propose improvements and upgrades to this highway for mobilization or hauling of materials for the Project. Nor does KRRC propose temporary traffic control. KRRC’s contractor will obtain transportation permits, if needed, from the Department of Transportation for mobilizing “wide-load” truck trailers with construction equipment or for hauling oversize materials removed from the site.
Copco Road
Copco Road is a county road that runs east-west along the Klamath River. Copco Road provides access to various local access roads that lead to Iron Gate Dam and Powerhouse, Copco No. 1 Dam and Powerhouse, and Copco No. 2 Dam and Powerhouse. Copco Road will be a primary hauling and access road for all three California dam sites for transporting materials and equipment. Construction area signs will be required to provide advance warnings to trucks and other road users to improve safety. In addition, KRRC proposes road maintenance in some areas during construction, where existing pavement is damaged due to construction trucks.

Definite Plan
June 2018 05 | Dam Removal Approach 173
This report divides Copco Road into five sections for discussion of the existing conditions and proposed improvements needed for the Project.
Copco Road from I-5 to Ager Road (3.1 miles)
Copco Road from Interstate 5 to Ager Road is a County road and classified as a major collector. It is a two-way undivided road with pavement in good condition. KRRC does not propose improvements and upgrades to this highway for mobilization and hauling for the Project. KRRC’s contractor may perform pavement rehabilitation during or post-construction. KRRC’s contactor will use temporary traffic control for any pavement rehabilitation. This portion of Copco Road includes Cottonwood Creek Bridge.
Cottonwood Creek Bridge
Cottonwood Creek Bridge is a single span reinforced concrete slab bridge that is approximately 89 feet long and 32 feet wide. The structure has two 12-foot lanes and 4-foot shoulders. It was built in 1980 with an HS20-44 design loading. The structure is supported on pinned diaphragm abutments founded on spread footings. The alignment and deck are in good condition and well maintained. KRRC does not propose improvements and upgrades to this structure for mobilization for the Project. Temporary traffic control will not be required.
Copco Road from Ager Road to Lakeview Road (5 miles)
Copco Road from Ager Road to Lakeview Road is a County road and classified as a minor collector. It is a two-way undivided road with pavement in poor condition and a posted speed limit of 35 mph. KRRC does not propose improvements and upgrades to this highway for mobilization and hauling for the Project. KRRC’s contractor may perform pavement rehabilitation during or post-construction. KRRC’s contactor will use temporary traffic control for any pavement rehabilitation. This portion of Copco Road includes Dry Creek Bridge (Caltrans Bridge No. 2C0144).
Dry Creek Bridge
Dry Creek Bridge is a single span bridge that is approximately 24 feet long and 31 feet wide, and was built in 1960. It has timber beams and a timber deck with an asphalt overlay. The structure has two 14-foot lanes and no shoulders. The structure is supported by seat type abutments. No information is available regarding the foundation type.
The structural members of Dry Creek Bridge, which are over 55 years old, are inadequate to carry the current legal/permit loads as well as project mobilization and hauling trucks. KRRC’s contactor will construct a temporary structure and detour over Dry Creek, north of the existing bridge, to allow for mobilization and hauling truck access. The type of temporary structure over the Dry Creek will be determined during the design phase. Temporary structure options include temporary railcar bridge, box culvert or pipe culvert. Alternatively, KRRC’s contractor may implement bridge strengthening or bridge replacement. In the case of replacement, KRRC’s contactor would still construct a temporary bridge as described above during the construction of the replacement bridge at the current location. See Figure 5.3-2 for the existing bridge

Definite Plan
174 05 | Dam Removal Approach June 2018
location and proposed detour. KRRC anticipates minimal impact to the existing traffic for the planned improvements. Impact to traffic will be limited to the traffic switch from the existing road alignment to the detour and temporary structure.
Figure 5.3-2 Copco Road Temporary Structure at Dry Creek
Copco Road from Lakeview Road to Daggett Road (9.6 miles)
Copco Road from Lakeview Road to Daggett Road is a County road classified as a minor collector and runs along the norths side of the Klamath River. It is a two-way undivided county road about 24 feet wide with posted speed limit of 35 mph. Pavement condition along this stretch is poor and will require pavement maintenance during construction. KRRC does not propose improvements and upgrades for this road prior to dam removal. KRRC’s contractor may perform pavement rehabilitation during or post-construction. KRRC’s contactor will use temporary traffic control for any pavement rehabilitation. This portion of Copco Road includes Brush Creek Bridge (Caltrans No. 2C0280) and Jenny Creek Bridge (Caltrans No. 2C0280).
Brush Creek Bridge
Brush Creek Bridge is a single span 18–inch-deep reinforced concrete slab bridge that is approximately 25 feet long and 24 feet wide. It was built in 1976 with an HS20-44 design loading. The structure has two12-foot lanes and no shoulders. The structure is supported on strutted abutments founded on spread footings. The alignment and deck are in fair condition and well maintained. KRRC does not propose

Definite Plan
June 2018 05 | Dam Removal Approach 175
improvements and upgrades to this structure for mobilization for the Project. KRRC does not propose temporary traffic control. KRRC does not propose post-project erosion protection.
Jenny Creek Bridge
Jenny Creek Bridge is a single span precast pre-stressed deck bulb tee girder bridge that is approximately 114 feet long and 27 feet wide (Figure 5.3-3). It was built in 2008 with an HL-93 design loading. The deck has an asphalt overlay with two12-foot lanes with no shoulders. The structure is supported on seat type abutments founded on pile caps with steel H-piles. Abutment 2 has a portion of the previous abutment left in place in front of the new abutment.
Figure 5.3-3 Jenny Creek Bridge
The alignment and deck are in very good condition and well maintained. The bridge is suitable for the access and hauling requirements of the Project, but KRRC proposes replacing this bridge as a necessary long-term improvement to offset the effects of reservoir drawdown. Refer to Section 7.4.3.9 for more details.

Definite Plan
176 05 | Dam Removal Approach June 2018
Copco Road from Daggett Road to Copco Access Road (2.6 miles)
Copco Road from Daggett Road to Copco Access Road is classified as a minor collector with a roadway width of 14 to 22 feet. The surface starts out as asphalt and transitions to aggregate base 1.2 miles east of the Daggett Road intersection, and has very low traffic volume. KRRC does not propose improvements and upgrades prior to dam removal. KRRC’s contractor may perform road surface maintenance during or post-construction. KRRC’s contactor will use temporary traffic control for any road surface maintenance. This portion of Copco Road includes Fall Creek Bridge (Caltrans Bridge No. 2C0198).
Fall Creek Bridge
Fall Creek Bridge is a single span bridge with timber beams of unknown age and a concrete deck (Figure 5.3-4). The structure is supported on seat type abutments. No information is available regarding foundation type. Since the superstructure is timber beams of unknown age and the beams appear inadequate to carry the legal/permit loads as well as project mobilization and hauling trucks. KRRC proposes replacing this structure by a single span bridge of similar length and width as the existing structure. Alternatively, the contractor may implement other methods such as a temporary bridge over the existing bridge or structural strengthening of the existing bridge.
If KRRC opts for a new bridge, KRRC’s contactor will construct it at the existing bridge alignment in two phases to maintain traffic during construction of the replacement bridge. Given the topographic constraints at the site, constructing the bridge in two phases will result in less hillside excavation and impacts than providing a parallel temporary bridge and detour during construction. In the first phase, KRRC’s contactor will provide one-way traffic in the southern lane using flaggers, and KRRC’s contactor will construct the new northern lane. In the second phase, KRRC’s contactor will reverse the operation with one-way traffic in the northern lane and construction occurring on the new southern lane of the bridge. KRRC’s contactor will separate traffic from work with K-rails. See Figure 5.3-5 for the existing bridge location. Impact to traffic will involve one-way controlled traffic during the bridge replacement.
If KRRC opts for a temporary bridge, KRRC’s contractor will construct it over the existing bridge with placement of a longer temporary bridge supported landward of the existing bridge supports. Some graded fill placed on the roadway approaches may be necessary to transition from the existing bridge elevation to the slightly higher temporary bridge elevation. A temporary bridge will remain in place for the duration of construction, and KRRC’s contractor will remove it along with any fill on the approach roadways, leaving the existing bridge in place, at the end of construction.

Definite Plan
June 2018 05 | Dam Removal Approach 177
Figure 5.3-4 Fall Creek Bridge on Copco Road
Figure 5.3-5 Fall Creek Bridge Replacement

Definite Plan
178 05 | Dam Removal Approach June 2018
Copco Road from Copco Access Road to Copco Road Bridge (5.9 miles)
Copco Road from Copco Access Road to Copco Road Bridge is classified as a minor collector with a roadway width of 12 feet. The road surface is primarily dirt and has very low traffic volume. KRRC’s contractor will not use this portion of Copco Road for dam or powerhouse removal but will use it for construction access to various post construction improvements, such as culvert replacements and installing rock slope protection. See Section 7.4 for details. KRRC does not propose improvements and upgrades prior to dam removal. Nor does KRRC propose temporary traffic control. The east end of this segment of Copco Road crosses Copco Lake at Copco Road Bridge (Caltrans No. 2C0039).
Copco Road Bridge
Copco Road Bridge is a two-span cast-in-place post-tensioned concrete box girder bridge that is approximately 203 feet long and 25 feet wide (Figure 5.3-6). It was built in 1988 for a HS 20-44 truck design load. The structure has two 12-foot lanes and no shoulders. The structure is supported by a pier wall founded on a pile cap with steel H-piles that are grouted into rock. The abutments are diaphragm type founded on a pile cap with steel H-piles. KRRC’s contractor will not use this structure for mobilization of construction equipment. The alignment and pavement are in very good condition and well maintained. KRRC does not propose improvements and upgrades to this structure for mobilization. Nor does KRRC propose temporary traffic control.

Definite Plan
June 2018 05 | Dam Removal Approach 179
Figure 5.3-6 Copco Road Bridge
Copco Access Road
Copco Access Road is a private road between Copco Road and the dam that provides access to Copco No. 1 Dam and powerhouse sites and Copco No. 2 Dam site (Figure 5.3-7). The first approximate 0.1 mile of the road nearest Copco Road is on non-PacifiCorp private land, and the remaining approximate 0.9 miles is on PacifiCorp land. The road surface is primarily dirt with a roadway width of 14 feet up to the chain link gate, then past the gate the pavement type changes to asphalt concrete in good condition traversing through Copco No. 1 residential area. Past the residential area, the road surface changes to a dirt road with steep descending hilly terrain towards Copco No. 1 and Copco No. 2 dam sites. The Copco No. 1 Dam access portion is a dirt road with a hairpin bend. It appears landslides have occurred on the hillside above this hairpin bend. A second hairpin bend occurs on the segment down to Copco No. 2 Dam, and a third hairpin bend occurs if travelling between the top of Copco No. 1 Dam and the powerhouse.
The lower side of this access road is very steep with no barrier protection. KRRC proposes that this segment of the dirt/gravel road be regraded for construction access by clearing and grubbing the available space between the toe of the higher hillside and the existing edge of the dirt/gravel road to provide a wider road

Definite Plan
180 05 | Dam Removal Approach June 2018
section for construction and hauling trucks. KRRC assumes one-way traffic with turnouts for the access road. Turnarounds for haul trucks will be at the powerhouse and at the disposal site or the staging area. The average one-way haul distance from the base of the dam to the disposal site is 0.5 mile.
KRRC proposes construction area signage and some temporary traffic control devices to improve safety during construction. During mobilization, the contractor will off-load equipment in the staging area and the equipment will track down to the dam and powerhouse area. KRRC’s contractor will demolish the portions of the road on PacifiCorp property and restore the area with native vegetation post-construction.
Barge access to the outlet of the diversion tunnel for construction of a new gate structure will occur from the right bank just upstream of the Copco No. 2 Dam.
Barge access to Copco Lake will occur at an existing boat ramp located at Copco Cove on the western shore (Figure 5.1-1(C)). Access to the boat ramp will require minor improvement of the Copco Cove access road for placing the barge-mounted crane on the reservoir. The boat ramp will also require extension into the reservoir to be able to remove the barge following removal of the spillway structure.
Ager Beswick Road
Ager Beswick Road between Copco Road to the east and Ager Road to the west is classified as a minor collector road with a posted speed limit of 25mph. It is a two-way undivided County road with pavement condition ranging from fair to good. KRRC’s contractor will not use the road for hauling, but the contractor may use it for mobilization of a barge-mounted crane from the existing boat ramp at Mallard Cove on the southern shore. KRRC does not propose upgrades and improvements to this road prior to dam removal. Access to the boat ramp will require minor improvements to the access road off of Ager Beswick Road to enable placing a barge-mounted crane in the reservoir. The boat ramp will also require extension into the reservoir to be able to remove the barge following removal of the spillway structure. KRRC does not propose temporary traffic control.

Definite Plan
June 2018 05 | Dam Removal Approach 181
Figure 5.3-7 Copco Access Road
5.3.3 Staging Areas and Disposal Sites
Figure 5.3-1(C) shows construction staging areas and a disposal site for removal of Copco No. 1 Dam and Powerhouse within the limits of work, and these are discussed in the following sections. KRRC’s contractor will mobilize construction equipment to the site by about June 2020 to prepare the staging areas and disposal site, and construct the diversion tunnel improvements described in Section 4.2.
Staging Areas
The primary 2.3 acre staging area will be located on the right abutment near the existing switchyard as shown on Figure 5.3-1(C), Sheet 1. Two smaller staging areas are located in the same vicinity (0.6 acre across the road and 0.5 acre by the penstocks).
Disposal Sites
A single disposal site, located on the right abutment at the current location of a maintenance building and a vacant residence (Figure 5.3-1(C) and Figure 5.3-8(C)), will be used for concrete debris generated from the

Definite Plan
182 05 | Dam Removal Approach June 2018
removal of the dam and powerhouse. The disposal area covers an area of approximately 3.5 acres. KRRC’s contractor will grade the disposal site as a hill (maximum fill height of about 55 feet) contoured to blend into the surrounding topography as shown in plan and section on Figure 5.3-1(C), Sheet 1. Preparation of the disposal area will include clearing of vegetation, demolition of the two structures, removal of transmission lines, and stripping and stockpiling of excavated topsoil for later use. After placement of the concrete debris (without rail and rebar), the on-site disposal area will be covered with topsoil and the excavated embankment material from Copco No. 2 Dam (see Section 5.4), graded, sloped for drainage, and hydroseeded. Compaction of materials placed in the disposal area other than by bulldozers spreading the materials and equipment travel will not be required. See Section 6 for additional detail associated with restoration. KRRC will complete erosion monitoring on an annual basis for 5 years following placement to assess whether significant erosion and slope deterioration has occurred. If significant erosion occurs, KRRC will repair the eroded area to the satisfaction of the appropriate regulatory agency.
Rebar, mechanical and electrical equipment, building materials and demolished powerline material will be disposed of at an approved landfill near Yreka, CA. Tonnage and volume of these materials are listed in Table 5.3-3.
Figure 5.3-8 Copco No. 1 & Copco No. 2 Disposal Site Plan & Sections (Appendix C)
5.3.4 Copco No. 1 Dam and Powerhouse Removal
Dam and Powerhouse Removal
KRRC’s contractor will remove the spillway gates and operators, the spillway bridge deck, and the spillway piers in December 2020 as the reservoir is drawn down to below the spillway crest (completed January 1, 2021). With the reservoir drawn down to approximate elevation 2590, KRRC’s contractor will use a barge-mounted crane to remove all 13 spillway gates and operators, spillway bridge deck, and spillway gate piers in the dry. The contractor will then remove the barge-mounted crane from the site.
As the reservoir is drawn down through the new large gate structure at the downstream end of the diversion tunnel, the following work will be performed:
1. Close the penstock gates and demolish the right abutment gate houses and mobilize large crane to the right abutment above the dam to provide construction access and support for dam removal.
2. Demolish the penstocks, remove the mechanical and electrical equipment from the powerhouse, and demolish the above grade portion of the powerhouse and prepare it for use as a part of construction access to the downstream side of the dam.
3. Excavate the dam in lifts (assumed to be 12-foot high) between abutments in the dry (Figure 5.3-9(B)). Drop concrete rubble to the base of the dam to form a temporary access between the dam base and the powerhouse. Haul concrete rubble by truck from the base of the dam to the disposal site on right abutment (Figure 5.3-1(C), Sheet 1).

Definite Plan
June 2018 05 | Dam Removal Approach 183
4. Remove concrete powerhouse intake structure on the right abutment in the dry concurrent with dam demolition. Extend temporary access road to the dam toe upstream for removal of the concrete rubble from the intake structure.
5. Construct and maintain temporary cofferdams in the river channel as required for removal of the powerhouse and of the diversion control structure in the dry, during low flow period.
6. Demolish remaining portion of powerhouse and remove all rubble using trucks along access road. Use sump pumps to unwater low areas as required.
7. Remove cofferdams from river channel when no longer needed. 8. Plug upstream diversion tunnel intake. 9. Demolish new diversion gate structure and plug downstream portal of the diversion tunnel with
concrete. 10. Restore dam site, staging area, and concrete disposal site. Place topsoil and seed where required. 11. Demobilize from site.
Portions of the dam and hydropower demolition must be performed within the in-stream construction window negotiated with the regulatory agencies. See Section 8.6 of this Definite Plan for information pertaining to the construction schedule and timing of the various activities.
Figure 5.3-9 Copco No. 1 Dam Removal (Appendix B)
Transmission Line and Switchyard Removal
Transmission line removal at Copco No. 1 includes demolishing the Copco No. 1 switchyard, demolishing overhead distribution and transmission lines and associated poles or towers, as applicable, and installation of new connections to maintain the power grid (see Figure 5.2-12).
KRRC’s contractor will demolish approximately 3.7 miles of overhead transmission/distribution line and approximately 39 poles. Lines to be demolished include:
• 69 kV transmission lines between Copco No. 1 switchyard and Copco No. 1 powerhouse
• 69 kV transmission lines between Copco No. 1 switchyard and Copco No. 2 powerhouse, while maintaining poles with distribution underbuild
• Production lines in the general area of Copco No. 1 powerhouse
• Distribution lines supplying the two village houses near the dam • 69 kV transmission lines between Copco No. 1 switchyard and Fall Creek hydro-electric plant;
including removing transmission conductors (69 kV) on Poles “1X/001” and “2X/001” but keeping the distribution conductors intact
• Distribution lines between Copco No. 1 switchyard and Copco No. 2. Dam
Major switchyard demolition components include:

Definite Plan
184 05 | Dam Removal Approach June 2018
• Four (4) 69 kV Dead End Structures
• Two (2) 69 kV Circuit Breakers
• Four (4) 69 kV Disconnect Switches (on same structure as Circuit Breakers)
• All associated auxiliary equipment
New connections include relocation of existing poles in the proposed Copco disposal site to locations nearer the access road and reconnection of that distribution line.
5.3.5 Demolition Methods, Estimated Equipment and Workforce
KRRC proposes the following demolition methods, estimated equipment requirements, and estimated workforce requirements for planning purposes based on engineering judgment. Alternative methods, equipment, and workforce that will also meet project requirements are possible and could be refined by the selected contractor.
Demolition Methods
The concrete gravity arch dam was constructed with large (cyclopean) boulders placed in the concrete matrix, and reinforced throughout with an estimated 455 tons of 30-pound steel rails placed in horizontal mats and in vertical rows across construction joints (for an average weight of about 25 lb per CY of concrete). Dam demolition will likely be performed in horizontal lifts using conventional drilling and blasting methods. Drilling, using small air track or hydraulic track drills that could safely operate on the dam crest, will likely control overall production. Up to five drill crews will be required working two 8-hour shifts 5-days per week. KRRC assumes the need for redrilling where rail steel is encountered will impact production. KRRC estimates blasting an average of between three and six shots per day for up to 16 weeks.
KRRC assumes acetylene torches to cut rail steel in the dam. A large crawler-mounted crane will likely be used on the right abutment to help remove the rail steel from the dam. A sheet-pile or H-pile cofferdam will be constructed along the right bank of the river to isolate a portion of the dam toe and the powerhouse, providing an access road and a work pad to stage concrete rubble collection, loading, and hauling. Concrete rubble will likely be loaded into articulated off-road rock trucks having a haul capacity of 30 tons, using either a hydraulic track excavator or a front-end loader. Over 700 tons of concrete rubble could be removed per day using two trucks making 12 rounds each during one 8-hour shift, with nearly 70,000 tons (or 36,000 CY in-place volume) to be removed from the dam within approximately 16 weeks.
KRRC assumes removal of mass concrete in the right abutment intake structure in lifts, similar to the concrete in the dam, but at a slower rate due to the embedded penstock pipes and mechanical equipment. The contractor could remove the concrete rubble from the lift surface using a large crane, or from the bottom of the canyon using an extension of the lower haul road constructed for demolition of the dam, during the low flow period. KRRC’s contractor will excavate reinforced concrete in the powerhouse deck, wall, and floor slabs by mechanical methods (e.g. hydraulic shears and hoe-ramming).
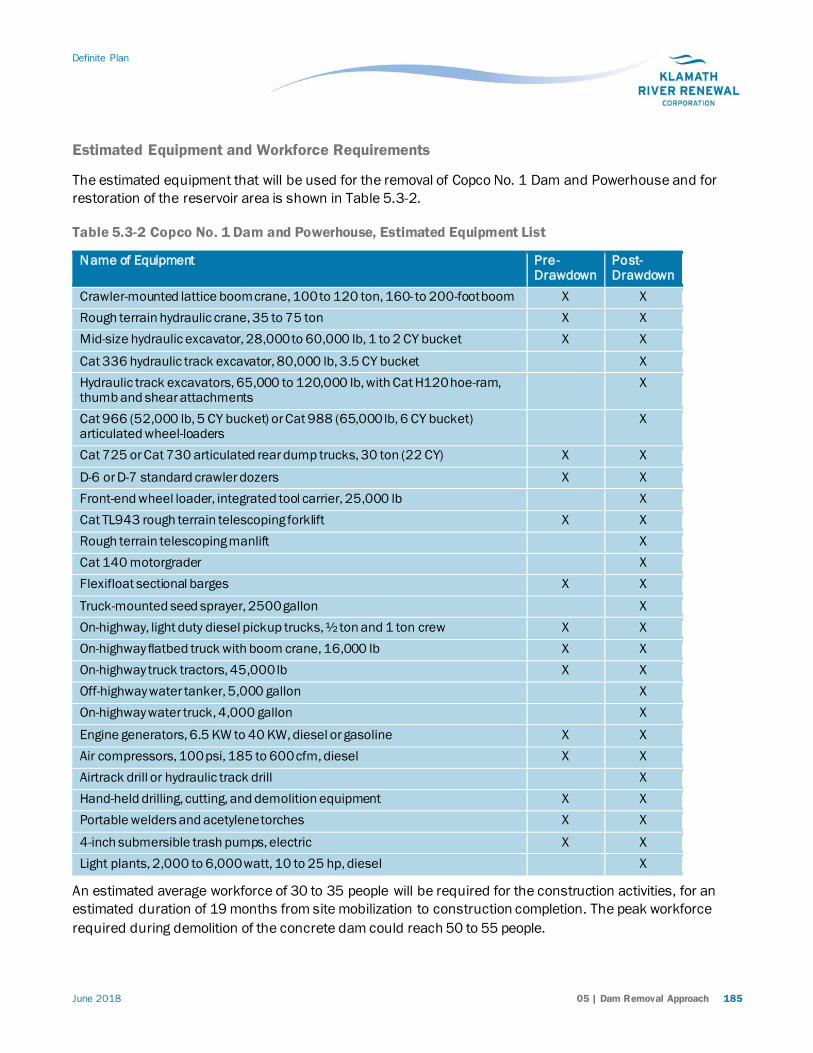
Definite Plan
June 2018 05 | Dam Removal Approach 185
Estimated Equipment and Workforce Requirements
The estimated equipment that will be used for the removal of Copco No. 1 Dam and Powerhouse and for restoration of the reservoir area is shown in Table 5.3-2.
Table 5.3-2 Copco No. 1 Dam and Powerhouse, Estimated Equipment List
Name of Equipment Pre- Drawdown
Post- Drawdown
Crawler-mounted lattice boom crane, 100 to 120 ton, 160- to 200-foot boom X X Rough terrain hydraulic crane, 35 to 75 ton X X Mid-size hydraulic excavator, 28,000 to 60,000 lb, 1 to 2 CY bucket X X
Cat 336 hydraulic track excavator, 80,000 lb, 3.5 CY bucket X Hydraulic track excavators, 65,000 to 120,000 lb, with Cat H120 hoe-ram, thumb and shear attachments
X
Cat 966 (52,000 lb, 5 CY bucket) or Cat 988 (65,000 lb, 6 CY bucket) articulated wheel-loaders
X
Cat 725 or Cat 730 articulated rear dump trucks, 30 ton (22 CY) X X
D-6 or D-7 standard crawler dozers X X Front-end wheel loader, integrated tool carrier, 25,000 lb X Cat TL943 rough terrain telescoping forklift X X Rough terrain telescoping manlift X Cat 140 motorgrader X Flexifloat sectional barges X X
Truck-mounted seed sprayer, 2500 gallon X On-highway, light duty diesel pickup trucks, ½ ton and 1 ton crew X X On-highway flatbed truck with boom crane, 16,000 lb X X On-highway truck tractors, 45,000 lb X X Off-highway water tanker, 5,000 gallon X On-highway water truck, 4,000 gallon X
Engine generators, 6.5 KW to 40 KW, diesel or gasoline X X Air compressors, 100 psi, 185 to 600 cfm, diesel X X Airtrack drill or hydraulic track drill X Hand-held drilling, cutting, and demolition equipment X X Portable welders and acetylene torches X X
4-inch submersible trash pumps, electric X X Light plants, 2,000 to 6,000 watt, 10 to 25 hp, diesel X
An estimated average workforce of 30 to 35 people will be required for the construction activities, for an estimated duration of 19 months from site mobilization to construction completion. The peak workforce required during demolition of the concrete dam could reach 50 to 55 people.

Definite Plan
186 05 | Dam Removal Approach June 2018
5.3.6 Imported Materials
KRRC’s contractor will need to import some materials to the site to support dam removal. The most likely materials to be imported include gravel surfacing from a commercial quarry for temporary haul roads (approximately 320 tons, 10 truck trips), sheetpile or H-piles for construction of cofferdams, topsoil (approximately 10,200 CY and 850 truck trips assuming 12 CY per truck or tractor trailer), seed and mulch materials, and minor quantities of ready-mix concrete and reinforcing steel from local commercial sources for tunnel plugs. Construction of the new gate structure in the year prior to dam removal will require importing mechanical equipment, and additional reinforcing steel and ready-mix concrete for lining the diversion tunnel and constructing the new gate structure.
5.3.7 Waste Disposal
Table 5.3-3 shows estimated quantities of materials generated during removal of Copco No. 1 Dam and Powerhouse, numbers of truck trips, and approximate haul distances for waste disposal. KRRC’s contractor will place excavated concrete in the on-site disposal site. KRRC’s contractor will separate rail and reinforcing steel from the concrete prior to placement in the disposal area and haul it to a local recycling facility. KRRC’s contractor will haul all mechanical and electrical equipment to a suitable commercial landfill or salvage collection point.
Table 5.3-4 shows potential commercial landfills or salvage collection points and capacities. Appendix O3 discusses potential hazardous materials at Copco No. 1 Dam and Powerhouse and their disposal.
Table 5.3-3 Waste Disposal for Full Removal of Copco No. 1 Dam
Waste Material In-Situ Quantity
Bulk Quantity 1 Disposal Site Peak Daily Trips 2 Total Trips 3
Concrete 75,900 CY 104,000 CY On-site 2 units/50 trips (unpaved road)
4,430 trips (2 miles RT)4
Rebar 1,000 tons --- Transfer station near Yreka
1 unit/5 trips (Copco Road)
100 trips (62 miles RT)
Mech. and Elec 1,100 tons --- Transfer station near Yreka
1 unit/5 trips (Copco Road)
140 trips (62 miles RT)
Building Waste 2 buildings 1,300 ft2
300 CY Transfer station near Yreka
1 unit/5 trips (Copco Road)
30 trips (62 miles RT)
Power lines 3.0 miles of 69-kV --- Transfer station
near Yreka
1. Volumes increased 30 percent for concrete rubble from reinforced concrete and 40 percent from mass concrete. 2. Peak daily trips for each site are based on the number of vehicles (units) shown, operating within one 8-hour shift. 3. Total trips of concrete assume off-highway articulated trucks with a nominal load capacity of 22 cubic yards. Total
trips for hauling rebar using truck tractor-trailers is based on 10 tons per trip. Total trips for hauling mechanical and electrical items using truck tractor-trailers is based on 8 tons per trip. Total trips for building waste using truck tractor-trailers is based on 10 CY per trip.
4. Truck trips for concrete disposal will only travel on project lands and private roads. These trips will not occur on public roads.

Definite Plan
June 2018 05 | Dam Removal Approach 187
Table 5.3-4 Waste Disposal Facilities near Copco No. 1 Dam
Name of Facility
Location Distance from Site
Remaining Capacity
Materials Accepted
Yreka Transfer Station
Yreka, CA 30 miles 3,924,000 CY (2010)
Class III sanitary landfill accepting construction and demolition waste and mixed municipal waste, and Medium volume transfer station accepting metals and mixed municipal recyclable materials
5.4 Copco No. 2 Dam and Powerhouse
5.4.1 Removal Limits
Copco No. 2 Dam is located within a narrow canyon on the Klamath River at RM 201.8. Minimum requirements for a free-flowing condition and volitional fish passage on the Klamath River through the Copco No. 2 Dam site will require the removal of the concrete gated spillway structure and concrete end sill between the existing sidewalls. Table 5.4-1 summarizes and Figure 5.3-1 (C) shows features the Project will remove or potentially retain as PROs.
Table 5.4-1 Copco No. 2 Dam and Powerhouse, Removal Requirements
Feature Full Removal Partial Removal Options
Comments1
Concrete Dam Remove Remove Spillway Gates, Structure Remove Remove Power Penstock Intake Structure and Gate
Remove Retain PRO: Seal openings, install security fence
Tunnel Portals Concrete Plug
Retain PRO: Intake structure gate could be closed
Embankment Section and right sidewall
Remove Remove
Basin Apron and End Sill Remove Remove Remnant Cofferdam Upstream of Dam
Remove Remove
Wood-stave Penstock Remove Remove
Concrete Pipe Cradles Remove Retain Steel Penstock, Supports, Anchors Remove Retain PRO: Could be retained for historic
purposes Seal openings, install security fence

Definite Plan
188 05 | Dam Removal Approach June 2018
Feature Full Removal Partial Removal Options
Comments1
Powerhouse (incl. mechanical and electrical equipment)
Remove Retain PRO: Could be retained for historic purposes Seal openings, install security fence
Powerhouse Hazardous Materials (transformers, batteries, insulation)
Remove Remove
Powerhouse Control Center Building, Maintenance Building, Oil and Gas Storage Building
Remove Remove
69-kV Transmission Line, 6.5 mi Remove Remove Switchyard Retain
Portions Retain Portions
Portions must remain in service with 230-kV switchyard on north side of river
Tailrace Channel Backfill Backfill Copco Village (incl. Former Cookhouse/Bunkhouse, Modern Bunkhouse, Garage/Storage Building, Bungalow with Garage, 3 Modular Houses, 4 Ranch-Style Houses, and School house/Community Center)
Remove Remove
Note: 1. Partial removal options would involve long-term maintenance costs, including the preservation of any exposed
items with coatings containing heavy metals (such as the penstocks).
Retention of the Copco No. 2 Powerhouse as a PRO would require the structure to be sealed and fenced. Mechanical and electrical equipment could be left in place with all power connections to the outside removed; however, any oil in the turbine governor and hydraulic control systems, transformers, oil storage tanks, or other equipment would need to be removed. KRRC’s contractor will also remove other potentially hazardous materials, such as batteries and treated wood.
5.4.2 Construction Access
Figures 5.1-1(C) and 5.3-1(C) show construction access roads and associated improvements that may be required for removal of Copco No. 2 Dam, which will be the same as for Copco No. 1 Dam and Powerhouse, and are discussed in Section 5.3.2. Figure 5.3-1(C) shows the construction access roads for removal of Copco No. 2 Powerhouse and the wood-stave penstock within the limits of work, and these are discussed in the following sections. KRRC will complete access road improvements prior to associated construction and removal at the dam and powerhouse.
Copco Road
Copco Road from I-5 provides the primary access to Copco No. 2 Dam and Powerhouse. Refer to Section 5.3.2 for more details. The main haul and access road included in that section is applicable to

Definite Plan
June 2018 05 | Dam Removal Approach 189
Copco No. 2 Dam. The average one-way haul distance from Copco No. 2 dam to the disposal site is approximately 0.3 mile.
The delivery of off-road construction equipment, including cranes, large excavators, and loaders will be by special tractor-trailer vehicles operating under “wide load” restrictions and at appropriate speeds. KRRC’s contractor will off-load equipment used for dam removal in the staging area and the equipment will track down to the dam under their own power.
Daggett Road
Copco No. 2 Powerhouse and the wood-stave penstock are accessed from Copco Road via Daggett Road. Daggett Road is a PacifiCorp-owned private gravel access road with a roadway width of 12 to 14 feet. Approximately 0.25 miles from Daggett Road Bridge, the surface becomes primarily dirt at 10 to 12 feet wide, and has very low traffic volume. KRRC assumes one-way traffic with turnouts for the access roads, for an average haul distance of 0.5 mile from the powerhouse to the bridge. KRRC does not propose improvements and upgrades prior to dam removal. KRRC’s contractor may perform road surface maintenance during or post-construction. Temporary traffic control will not be required because this is not a public road. This portion of Daggett Road includes Daggett Road Bridge.
The delivery of off-road construction equipment, including cranes, large excavators, and loaders will be by special tractor-trailer vehicles operating under “wide load” restrictions and at appropriate speeds. KRRC’s contractor will off-load equipment used for removal of the powerhouse and wood-stave penstock in Copco Village and the equipment will track down to the powerhouse area and wood-stave penstock under their own power.
Daggett Road Bridge
Daggett Road Bridge is PacifiCorp-owned, private four span continuous steel bridge that utilizes rolled beams in the approach spans and a riveted steel plate girder for the main span. The structure has a timber deck and railings and is approximately 233 feet long and 14 feet wide. It has one 12-foot lane and no shoulders. The structure is supported on concrete pier walls at Bents 3 and 4 that are founded on what appears to be rock masonry footings. Bent 1 is composed of steel H-pile extensions with a steel cap. The abutments are seat type. The main span girder and Bents 3 and 4 were constructed in, approximately, 1924 and incorporated into the reconstructed structure in 1983. The reconstructed structure was built for a HS20 truck design load. The structure has been posted with load limits based upon an unknown analysis. No information is available regarding the foundations.
KRRC’s contractor will use this structure for mobilization of construction equipment and for hauling of demolished materials to commercial landfills. Because the bridge has been posted with a reduced load limit that is less than the current legal/permit loads on bridges and the loads of vehicles that will use it for the Project, KRRC proposes replacing this structure with a bridge of similar length and width as the existing structure. Alternatively, the contractor may implement other methods such as a temporary bridge adjacent to the existing bridge or structural strengthening of the existing bridge.

Definite Plan
190 05 | Dam Removal Approach June 2018
KRRC’s contactor will construct either a new bridge structure or a temporary bridge adjacent to the existing bridge on a revised alignment. KRRC’s contactor will remove the old bridge only after completion of the new bridge structure. KRRC’s contactor will realign the approach roadway slightly for the new bridge or temporary bridge location (Figure 5.4-1). Impacts to traffic will be limited to the traffic switch from the existing road alignment to the new one. A new bridge will be left in place post-construction for future property owner access. A temporary bridge will remain in place for the duration of construction and will be removed, leaving the existing bridge in place, at the end of construction, and the approach roadways will be restored to the existing alignments,
Figure 5.4-1 Daggett Road Bridge Replacement
5.4.3 Staging Areas and Disposal Sites
Staging areas and disposal sites for removal of Copco No. 2 Dam will be the same as for Copco No. 1 Dam and Powerhouse as shown on Figure 5.3-1 (C) and as discussed in Section 5.3.3. Figure 5.3-1(C), Sheet 2 shows the staging areas and disposal sites for removal of Copco No. 2 Powerhouse and the wood-stave penstock within the limits of work on, and these are discussed in the following sections.

Definite Plan
June 2018 05 | Dam Removal Approach 191
Staging Areas
Equipment staging areas for dam removal will be the same as described for Copco No. 1 (see Section 5.3.3). Work areas for removal of the wooden lathe penstock and the powerhouse will be as shown on Figure 5.3-1(C), Sheets 2 and 3. An additional 0.9-acre staging area is located at the powerhouse.
Disposal Sites
KRRC’s contractor will permanently bury concrete rubble generated from removal of Copco No. 2 Dam in the disposal site described in Section 5.3.3.2 for Copco No. 1. KRRC’s contractor will use earth materials generated from removal of Copco No. 2 Dam as cover over the concrete rubble in the disposal site.
KRRC’s contractor will permanently bury concrete rubble generated from removal of the Copco No. 2 Powerhouse in the powerhouse tailrace covering an area of about 1 acre. After placement of the concrete rubble (sans rail and rebar), the on-site disposal area will be covered with materials excavated from nearby areas that were graded around the powerhouse facilities during original construction, graded, sloped for drainage, and hydroseeded. Compaction of materials placed in the tailrace channel other than by bulldozers spreading the materials and equipment travel will not be required. KRRC will complete erosion monitoring on an annual basis for 5 years following placement to assess whether significant erosion and slope deterioration has occurred. If significant erosion occurs, KRRC will repair the eroded area to the satisfaction of the appropriate regulatory agency.
Rebar, mechanical and electrical equipment, building materials, demolished powerline material and woodstave material will be disposed of at an approved landfill near Yreka, CA. Tonnage and volume of these materials are listed in Table 5.4-3.
5.4.4 Copco No. 2 Dam and Powerhouse Removal
Dam Removal
Dam removal will begin on about May 1, 2021 by closing the caterpillar gate at the power penstock intake structure to stop releases to Copco No. 2 Powerhouse and cease power generation. KRRC’s contractor will make controlled releases through the gated spillway (crest elevation 2476.5) during the low flow period to draw the reservoir down from RWS elevation 2486.5 to RWS elevation 2481.5 in one day using the two right-hand side spillway gates. Remove of the dam will include the following steps.
1. Remove equipment and concrete pad from dike crest to provide room for demolition equipment and for construction access.
2. Construct a temporary cofferdam within the river channel to isolate the two left-hand spillway bays and the power penstock intake structure (see Figure 5.4-2(B)). Remove the spillway gates, hoists, bridge deck, and concrete crest structure to elevation 2457.5 in the dry. Remove trash racks, caterpillar gate, and concrete structure, and construct tunnel plug in the dry. Restore left river bank. Remove temporary cofferdam and allow reservoir to stabilize at approximately RWS elevation 2463.5 through left-hand dam breach.

Definite Plan
192 05 | Dam Removal Approach June 2018
3. Construct a second temporary cofferdam within the river channel to isolate the three remaining spillway bays on the right-hand side (Figure 5.4-2 (B)). Remove the spillway gates, hoists, bridge deck, and concrete crest structure to elevation 2457.5 in the dry. Remove earth embankment. Remove temporary cofferdam.
4. Complete any remaining demolition work as required. Restore Dam site and on-site disposal area (shared with Copco No. 1 demolition) as required by October post-drawdown, including the placement of topsoil and seeding. Demobilize from site.
Portions of the dam and hydropower demolition must be performed within the in-stream construction window negotiated with the regulatory agencies. See Section 8.6 of this Definite Plan for information pertaining to the construction schedule and timing of the various activities.
Figure 5.4-2 Copco No. 2 Dam Removal (Appendix B)
Powerhouse and Wood-Stave Penstock
Removal of the wooden stave penstock and powerhouse will occur following closure of the caterpillar gate and shutdown of the powerhouse on about May 1, 2021, as follows:
1. Remove wood-stave penstock and concrete features and construct reinforced concrete tunnel plugs at the tunnel portal at each end of the wood-stave penstock.
2. Construct cofferdam in tailrace channel for removal of powerhouse in the dry during low flow period. Use sump pumps to unwater area. Leave cofferdam in place within tailrace channel and backflll to restore left river bank.
Transmission Line and Switchyard Removal
Transmission line removal at Copco No. 2 includes demolishing portions of the Copco No. 2 switchyard south of the river and demolishing overhead distribution and transmission lines and associated poles or towers, as applicable (see Figure 5.2-12). The Copco No. 2 switchyard north of the river will remain.
KRRC’s contactor will demolish approximately 6.7 miles of overhead transmission/distribution line and approximately 40 poles. Lines to be demolished include:
• Distribution lines between Copco No.2 powerhouse line and Copco No. 2 Dam
• 69 kV transmission lines between Copco No. 1 switchyard and Copco No.2 powerhouse branch line
• 69 kV transmission lines between Copco No. 2 powerhouse and Iron Gate switchyard
• Production lines in the general area of Copco No. 2 powerhouse
Major switchyard demolition components include:
• Two (2) 115 kV / MV transformers. (secondary voltage not known)
• Five (5) medium voltage circuit breakers
• One (1) MV / 12 kV transformer (primary voltage not known)
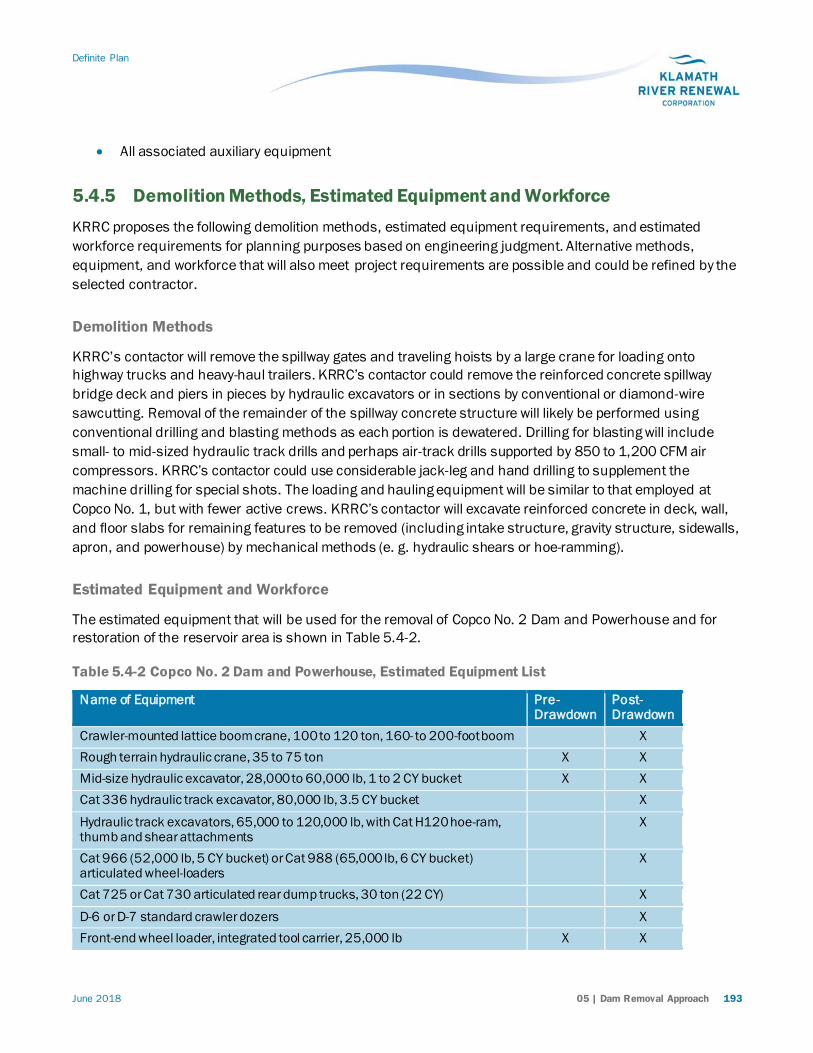
Definite Plan
June 2018 05 | Dam Removal Approach 193
• All associated auxiliary equipment
5.4.5 Demolition Methods, Estimated Equipment and Workforce KRRC proposes the following demolition methods, estimated equipment requirements, and estimated workforce requirements for planning purposes based on engineering judgment. Alternative methods, equipment, and workforce that will also meet project requirements are possible and could be refined by the selected contractor.
Demolition Methods
KRRC’s contactor will remove the spillway gates and traveling hoists by a large crane for loading onto highway trucks and heavy-haul trailers. KRRC’s contactor could remove the reinforced concrete spillway bridge deck and piers in pieces by hydraulic excavators or in sections by conventional or diamond-wire sawcutting. Removal of the remainder of the spillway concrete structure will likely be performed using conventional drilling and blasting methods as each portion is dewatered. Drilling for blasting will include small- to mid-sized hydraulic track drills and perhaps air-track drills supported by 850 to 1,200 CFM air compressors. KRRC’s contactor could use considerable jack-leg and hand drilling to supplement the machine drilling for special shots. The loading and hauling equipment will be similar to that employed at Copco No. 1, but with fewer active crews. KRRC’s contactor will excavate reinforced concrete in deck, wall, and floor slabs for remaining features to be removed (including intake structure, gravity structure, sidewalls, apron, and powerhouse) by mechanical methods (e. g. hydraulic shears or hoe-ramming).
Estimated Equipment and Workforce
The estimated equipment that will be used for the removal of Copco No. 2 Dam and Powerhouse and for restoration of the reservoir area is shown in Table 5.4-2.
Table 5.4-2 Copco No. 2 Dam and Powerhouse, Estimated Equipment List
Name of Equipment Pre- Drawdown
Post-Drawdown
Crawler-mounted lattice boom crane, 100 to 120 ton, 160- to 200-foot boom X Rough terrain hydraulic crane, 35 to 75 ton X X Mid-size hydraulic excavator, 28,000 to 60,000 lb, 1 to 2 CY bucket X X Cat 336 hydraulic track excavator, 80,000 lb, 3.5 CY bucket X
Hydraulic track excavators, 65,000 to 120,000 lb, with Cat H120 hoe-ram, thumb and shear attachments
X
Cat 966 (52,000 lb, 5 CY bucket) or Cat 988 (65,000 lb, 6 CY bucket) articulated wheel-loaders
X
Cat 725 or Cat 730 articulated rear dump trucks, 30 ton (22 CY) X
D-6 or D-7 standard crawler dozers X Front-end wheel loader, integrated tool carrier, 25,000 lb X X

Definite Plan
194 05 | Dam Removal Approach June 2018
Name of Equipment Pre- Drawdown
Post-Drawdown
Cat TL943 rough terrain telescoping forklift X X Rough terrain telescoping manlift X X On-highway, light duty diesel pickup trucks, ½ ton and 1 ton crew X X
On-highway flatbed truck with boom crane, 16,000 lb X X On-highway truck tractors, 45,000 lb X X Off-highway water tanker, 5,000 gallon X On-highway water truck, 4,000 gallon X X Engine generators, 6.5 KW to 40 KW, diesel or gasoline X X Air compressors, 100 psi, 185 to 600 cfm, diesel X X
Airtrack drill or hydraulic track drill X Hand-held drilling, cutting, and demolition equipment X X Portable welders and acetylene torches X X 4-inch submersible trash pumps, electric X X
An estimated average workforce of 25 to 30 people will be required for the construction activities, for an estimated duration of about 6 months from site mobilization to construction completion for either dam removal alternative. The peak workforce required during excavation of the dam and powerhouse could reach 35 to 40 people.
5.4.6 Imported Materials KRRC assumes import of some materials to the site to support dam removal. The most likely material that may be required for construction will include gravel surfacing for temporary haul roads, soil cover for concrete waste disposal, seed and mulch materials, and minor quantities of ready-mix concrete and reinforcing steel from local commercial sources for tunnel plugs.
5.4.7 Waste Disposal
Table 5.4-3 shows estimated quantities of materials generated during removal of Copco No. 2 Dam and Powerhouse, numbers of truck trips, and approximate haul distances for waste disposal. Concrete rubble generated during dam removal will be placed within the same on-site disposal area on the right abutment (Figure 5.3-1(C), Sheet 1) used for Copco No. 1 Dam. KRRC’s contactor will use excavated embankment material as topsoil to cover the on-site disposal area after grading and being sloped for drainage. KRRC’s contactor will bury concrete rubble resulting from demolition of the powerhouse within the existing tailrace channel. KRRC’s contactor will separate reinforcing steel from the concrete prior to placement in the disposal area or tailrace channel and haul it to a local recycling facility. KRRC’s contactor will haul all mechanical and electrical equipment to a suitable commercial landfill or salvage collection point.
Table 5.4-4 shows potential commercial landfills or salvage collection points and capacities. Appendix O3 discusses potential hazardous materials at Copco No. 2 Dam and Powerhouse and their disposal.

Definite Plan
June 2018 05 | Dam Removal Approach 195
Table 5.4-3 Waste Disposal for Full Removal of Copco No. 2 Dam
Waste Material In-Situ Quantity
Bulk Quantity 1
Disposal Site Peak Daily Trips 2 Total Trips 3
Earth 1,800 CY 2,100 CY On-site 2 units/50 trips (unpaved road) 100 trips (2 miles RT)4
Concrete at dam
6,600 CY
8,500 CY
On-site 2 units/50 trips (unpaved road)
390 trips (2 miles RT)4
Concrete at powerhouse
6,300 CY
8,100 CY
Onsite tailrace area
Dispose at site (no hauling)
0
Rebar at: Dam Powerhouse
300 tons 100 tons
--- Transfer station near Yreka, CA
1 unit/5 trips (Copco Road)
30 trips (62 miles RT) 10 trips (56 miles RT)
Mech. And Elec at: Dam Powerhouse
300 tons 1,900 tons
--- Transfer station near Yreka, CA
1 unit/5 trips (Copco Road)
40 trips (62 miles RT) 240 trips (56 miles RT)
Building Waste XX buildings 10,6000 ft2
2300 CY Transfer station near Yreka, CA
1 unit/5 trips (Copco Road)
230 trips (56 miles RT)
Treated wood (wood-stave penstock)
700 tons Landfill near Anderson, CA
1 unit/2 trips (Interstate 5)
70 trips(140 miles RT)
Power lines 6.5 miles of 69-kV
--- Transfer station near Yreka, CA
Notes: 1. Volumes increased 30 percent for concrete rubble, 20 percent for loose earth materials. 2. Peak daily trips for each site are based on the number of vehicles (units) shown, operating within one 8 hour shift. 3. Total trips of earthfill or concrete assume off-highway articulated trucks with a nominal load capacity of 22 CY.
Total trips for hauling rebar using truck tractor-trailers is based on 10 tons per trip. Total trips for hauling mechanical and electrical items using truck tractor-trailers is based on 8 tons per trip. Total trips for building waste using truck tractor-trailers is based on 10 CY per trip.
4. Truck trips for earth and concrete disposal will only travel on project lands and private roads. These trips will not occur on public roads.
Table 5.4-4 Waste Disposal Facilities near Copco No. 2 Dam
Name of Facility
Location Distance from Site
Remaining Capacity
Materials Accepted
Yreka Transfer Station
Yreka, CA 30 miles 3,924,000 CY (2010)
Class III sanitary landfill accepting construction and demolition waste and mixed municipal waste, and Medium volume transfer station accepting metals and mixed municipal recyclable materials

Definite Plan
196 05 | Dam Removal Approach June 2018
5.5 Iron Gate Dam and Powerhouse
5.5.1 Removal Limits
Iron Gate Dam is located in a relatively narrow canyon on the Klamath River at RM 193.1. Minimum requirements for a free-flowing condition and volitional fish passage on the Klamath River through the Iron Gate Dam site require the complete removal of the zoned earthfill embankment, concrete cutoff walls, and fish trapping and holding facilities located on random fill downstream of the dam between the rock abutments to the bedrock foundation, to ensure long-term stability of the site and to prevent the development of a potential fish barrier in the future Table 5.5-1 summarizes and Figure 5.5-1 (C) shows features the Project will remove or potentially retain as PROs.
The lower portion of the outdoor-type powerhouse, if retained as a PRO will be within the 100-year floodplain. Retention of the Iron Gate Powerhouse as a PRO would require the structure to be sealed. Mechanical and electrical equipment could be left in place with all power connections to the outside removed; however, KRRC’s contractor would remove any oil in the turbine governor and hydraulic control systems, transformers, oil storage tanks, or other equipment. KRRC’s contractor would also remove other potentially hazardous materials, such as batteries and treated wood. The short tailrace channel between the powerhouse and the river channel could be backfilled to the pre-construction contours if necessary, effectively burying the remaining structure.
Table 5.5-1 Iron Gate Dam and Powerhouse, Removal Requirements
Feature Full Removal Partial Removal Options
Comments 1
Embankment Dam, Cutoff Walls Remove Remove Penstock Intake Structure and Footbridge
Remove Remove
Penstock Remove Remove
Water Supply Pipes and Aerator Remove Remove Spillway Structure Retain Retain Bury to extent practicable Powerhouse (incl. mechanical and electrical equipment)
Remove Retain PRO: Lower portion with openings sealed
Powerhouse Hazardous Materials (transformers, batteries, insulation)
Remove Remove
Powerhouse Tailrace Area Backfill Backfill Fish Facilities on Dam (fish ladder and trapping and holding facilities)
Remove Remove
Fish Hatchery Retain Retain See Section 8.10 Switchyard Remove Remove 69-kV Transmission Line, 0.5 mi Remove Remove

Definite Plan
June 2018 05 | Dam Removal Approach 197
Feature Full Removal Partial Removal Options
Comments 1
Diversion Tunnel Intake Structure and Footbridge
Remove Remove
Diversion Tunnel Portals Concrete Plug
Concrete Plug
Diversion Tunnel Control Tower, Hoist, and Gate
Remove Remove
1. Partial removal options would involve long-term maintenance costs, including the preservation of any exposed items with coatings containing heavy metals (such as the penstocks).
Figure 5.5-1 Iron Gate Dam Removal Features and Limits (Appendix C)
5.5.2 Construction Access Figure 5.5-1(C) shows construction access roads and associated improvements required for removal of Iron Gate Dam and Powerhouse within the limits of work, and these are discussed in the following sections. Section 5.3.2 discusses the conditions and improvements needed for Copco Road. KRRC observed existing conditions of the local roads and structures in the field to identify deficiencies and determine if improvements are necessary for mobilization and/or hauling during construction and demolition activities of the Iron Gate Dam and Powerhouse. The assessments are discussed in the following sections. KRRC will complete access road improvements prior to associated construction and removal at the dam and powerhouse.
The delivery of off-road construction equipment, including cranes, large excavators, loaders, and large capacity dump trucks will be by special tractor-trailer vehicles operating under “wide load” restrictions and at appropriate speeds.
Lakeview Road between Copco Road and the Disposal Site
Lakeview Road is a county gravel road approximately 24 feet wide, running between Copco Road and the disposal site just east of Iron Gate Reservoir (Figure 5.5-2). The road continues beyond the disposal site into the Iron Gate Estates subdivision. The posted speed limit is 20 mph. The gravel road surface is in stable condition and suitable for construction use. The road (with the powerhouse access road) could be used for one-way hauling traffic with turnouts and will have an average one-way haul distance of 1.4 miles from the dam to the center of the disposal site. KRRC does not propose improvements and upgrades for mobilization and hauling for the Project. KRRC’s contractor may perform road surface maintenance during or post-construction. Temporary traffic controls will be required during roadway maintenance activities. This portion of Lakeview Road includes Lakeview Road Bridge (Caltrans Bridge No. 2C0255).

Definite Plan
198 05 | Dam Removal Approach June 2018
Lakeview Road Bridge
Lakeview Road Bridge is county-owned nine span simply supported rolled steel beam bridge constructed in 1960, and is approximately 272 feet long and 14.5 feet wide. It has a reinforced concrete deck with one 12-foot lane and no shoulders. The structure is posted with load limits following an investigation by the California Department of Transportation (Caltrans), Structure Maintenance and Investigation that was requested by the Siskiyou County Department of Public Works. The structure is supported on bents composed of timber pile extensions with timber or steel caps and timber abutments. No information is available regarding the foundations.
Because the bridge has been posted with a reduced load limit that is less than the current legal/permit loads on bridges and loads of vehicles that will use it for the Project, KRRC proposes replacing this structure for construction access. Alternatively, KRRC’s contractor may implement other methods such as a temporary bridge adjacent to the existing bridge or structural strengthening of the existing bridge.
KRRC’s contractor will construct either a new bridge or a temporary bridge of similar length and width on a revised alignment adjacent to the existing bridge (Figure 5.5-3). KRRC’s contractor will remove the old bridge after completion of the new bridge only. KRRC’s contractor will realign the approach roadway slightly for the new bridge or temporary bridge location. The impact to traffic will be limited to the switch from the existing road alignment to the new one. A temporary bridge will remain in place for the duration of construction, and KRRC’s contractor will remove it, leaving the existing bridge in place, at the end of construction, and KRRC’s contractor will restore the approach roadways to the existing alignments.
Figure 5.5-2 Lakeview Road
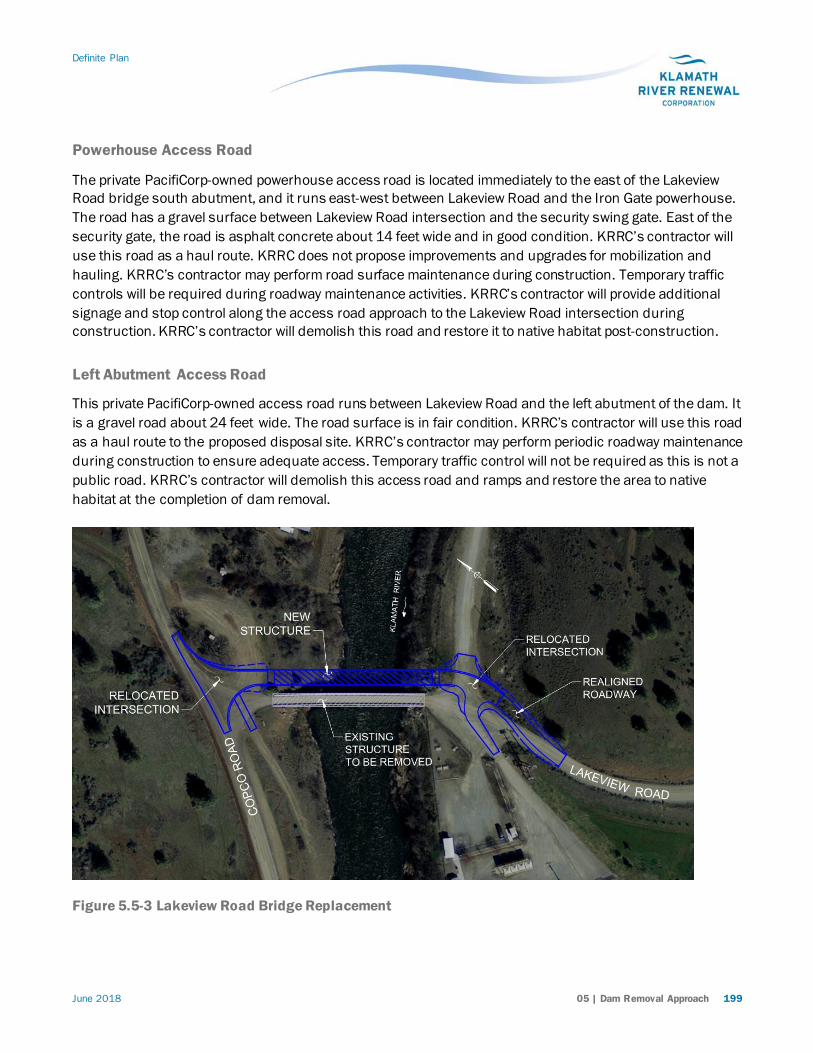
Definite Plan
June 2018 05 | Dam Removal Approach 199
Powerhouse Access Road
The private PacifiCorp-owned powerhouse access road is located immediately to the east of the Lakeview Road bridge south abutment, and it runs east-west between Lakeview Road and the Iron Gate powerhouse. The road has a gravel surface between Lakeview Road intersection and the security swing gate. East of the security gate, the road is asphalt concrete about 14 feet wide and in good condition. KRRC’s contractor will use this road as a haul route. KRRC does not propose improvements and upgrades for mobilization and hauling. KRRC’s contractor may perform road surface maintenance during construction. Temporary traffic controls will be required during roadway maintenance activities. KRRC’s contractor will provide additional signage and stop control along the access road approach to the Lakeview Road intersection during construction. KRRC’s contractor will demolish this road and restore it to native habitat post-construction.
Left Abutment Access Road
This private PacifiCorp-owned access road runs between Lakeview Road and the left abutment of the dam. It is a gravel road about 24 feet wide. The road surface is in fair condition. KRRC’s contractor will use this road as a haul route to the proposed disposal site. KRRC’s contractor may perform periodic roadway maintenance during construction to ensure adequate access. Temporary traffic control will not be required as this is not a public road. KRRC’s contractor will demolish this access road and ramps and restore the area to native habitat at the completion of dam removal.
Figure 5.5-3 Lakeview Road Bridge Replacement

Definite Plan
200 05 | Dam Removal Approach June 2018
Upstream Left Abutment Access Road
The private PacifiCorp-owned original haul route from an upstream borrow area to the dam will be reopened once the reservoir has been drawn down. This will allow two-way traffic to the north side of the disposal site with an average haul distance of 0.9 mile from the dam to the disposal site. As the dam embankment excavation descends, the original ramps out of the canyon that were used during original construction may be able to be reused. KRRC’s contractor will demolish this access road and ramps and restore the area to native habitat at the completion of dam removal.
Access Road from Long Gulch Recreation Facility to Lakeview Road
This private PacifiCorp-owned road is a gravel access road approximately 12 feet wide, running between Long Gulch Recreational Facility and Lakeview Road. The gravel road surface is in fair condition. KRRC’s contractor will use the road for one-way hauling traffic during removal of the Long Gulch Recreation Facility. KRRC does not propose improvements and upgrades for mobilization and hauling. KRRC’s contractor may perform road surface maintenance during construction. Temporary traffic controls will be required during roadway maintenance activities. KRRC’s contractor will demolish this access road and restore the area to native habitat at the completion of dam removal.
Access Road from Overlook Point Recreation Facility to Copco Road
This private PacifiCorp-owned road is a gravel access road approximately 12 feet wide, running between Overlook Point Recreation Facility and Copco Road. The gravel road surface is in fair condition. KRRC’s contractor will use the road for one-way hauling traffic during removal of the Overlook Point Recreation Facility. KRRC does not propose improvements and upgrades for mobilization and hauling. KRRC’s contractor may perform road surface maintenance during construction. KRRC’s contractor will provide temporary traffic controls during roadway maintenance activities. KRRC’s contractor will demolish this access road and restore the area to native habitat at the completion of dam removal.
5.5.3 Staging Areas and Disposal Sites
Figure 5.5-1(C), Sheets 1 and 2 show construction staging areas and disposal sites for removal of Iron Gate Dam and Powerhouse within the limits of work, and these are discussed in the following sections. The contractor will mobilize construction equipment to the site by June 2020 to prepare the staging and disposal areas, and to construct the diversion tunnel improvements described in Section 4.2 for subsequent dam removal after drawdown.
Staging Areas
Figure 5.5-1(C), Sheet 2 shows staging areas for equipment or material staging, including 7.7 acres above the left abutment of the dam, 1.4 acres southwest of the disposal site, and 1.4 acres northeast of the disposal site. Also shown on Figure 5.5-1(C), Sheet 1 is 1.9 acres near the right abutment downstream of the dam (currently occupied by two PacifiCorp residences and some outbuildings) that could be used for construction offices. KRRC’s contractor will prepare the staging areas by clearing vegetation and minor

Definite Plan
June 2018 05 | Dam Removal Approach 201
grading and will restore them by minor grading and hydroseeding. See Section 6 for additional detail concerning restoration. Staging of mechanical and electrical debris will likely occur at the downstream toe of the dam in the parking area and the area of the fish collection facilities.
Disposal Sites
KRRC’s contractor will permanently bury most of the earth materials and all of the concrete rubble generated from removal of the Iron Gate development on-site in a disposal site covering about 36 acres located on project property about 1 mile south of the dam. KRRC’s contractor will grade the disposed material to conform to the existing topography as shown in Figure 5.5-1(C), Sheet 2 and Figure 5.5-4 (C). KRRC’s contractor will place the disposed material to a maximum fill height of about 50 feet. KRRC’s contractor will cover concrete rubble by a minimum of 3 feet of earth materials. Final grading of the disposal site will include relatively flat slopes (8H:1V to 5H:1V) to reduce the potential for erosion. Preparation of the disposal site requires clearing of vegetation and stripping and stockpiling of topsoil for later use for restoration of the disposal site. After final grading for drainage and aesthetics, KRRC’s contractor will cover the disposal site with topsoil and hydroseeded. Compaction other than by equipment travel will not be necessary. See Section 6 for additional detail associated with restoration. KRRC will monitor erosion on an annual basis for 5 years following placement to assess whether significant erosion and slope deterioration has occurred. If significant erosion occurs, KRRC will repair the eroded area to the satisfaction of the appropriate regulatory agency.
Figure 5.5-4 Iron Gate Disposal Site Plan & Sections (Appendix C)
KRRC’s contractor will place up to 200,000 CY of earth materials excavated from the dam in the existing concrete-lined side-channel spillway, chute, and flip-bucket terminal structure (located on the right abutment of the dam) to the extent practicable for restoration. Figure 5.5-1(C), Sheet 1 and Figure 5.5-5(C) show plan and section of the backfilled spillway. Finished grades of the backfill will be no steeper than about 4H:1V. Following backfilling, the uphill portion of the spillway excavation will still be visible. After final grading for drainage and aesthetics, KRRC’s contractor will cover the disposal site with topsoil and hydroseeded. Compaction other than by equipment travel will not be necessary. See Section 6 for additional detail associated with restoration.
KRRC’s contractor will dispose of rebar, mechanical and electrical equipment, building materials and demolished powerline material of at an approved landfill near Yreka, CA. Table 5.5-3 lists tonnage and volume of these materials.
Figure 5.5-5 Iron Gate Spillway Backfill Plan & Sections (Appendix C)
5.5.4 Iron Gate Dam and Powerhouse Removal
Dam and Powerhouse Removal
Dam removal will begin following spring runoff on June 1, 2021. KRRC’s contractor will maintain sufficient freeboard to pass a 1% probable flood for that time of year (see Section 4.4) at all times between the

Definite Plan
202 05 | Dam Removal Approach June 2018
elevation of the excavated embankment surface and any remaining reservoir to reduce the potential for flood overtopping embankment. KRRC will not start excavation of the embankment section at Iron Gate Dam before June 1 (in-stream to begin on June 15), 2021, and will complete excavation by October 15, 2021 to minimize the risk of flood overtopping.
Dam removal will be as follows:
1. Drawdown reservoir, but maintain a minimum flood release capacity of approximately 7,700 cfs in June (RWS elevation 2254.3), to accommodate the passage of at least a 1% probable flood for that time of year.
2. Remove fish facilities near downstream toe of embankment (including fish ladder and holding tanks) and dam crest sheet piles in the dry.
3. Retain embankment dam crest at level needed for flood protection, and the existing access bridge to the gate control house for regulating tunnel releases.
4. Begin embankment excavation for dam removal (see Figure 5.5-6(B)), but maintain a minimum flood release capacity of approximately 7,000 cfs in July (RWS elevation 2242.3) and 3,000 cfs in August and September (RWS elevation 2194.3), to accommodate the passage of at least a 1% probable flood for that time of year.
5. Remove an estimated 150,000 CY (7,500 CY per day) in June, 285,000 CY (14,250 CY per day) in July, and 635,000 CY (16,000 CY per day) in August and early September leaving upstream cofferdam (Figure 5.5-6 (B)). Excavation assumes 2 shifts working 6 days per week. Temporarily stockpile rockfill during excavation for placement on downstream slope of cofferdam.
6. Provide access to gate control house between base of tower at elevation 2257.3 and deck at elevation 2341.3 (84 feet high — assume vertical stairway structure, or longer footbridge from spillway crest) throughout excavation for flow control.
7. Draw down reservoir to maximum extent (during minimum streamflow and with no upstream drawdown releases) by September 1, 2021. Place rockfill on downstream face of cofferdam (having a crest no lower than elevation 2194.3) for controlled breach of armored cofferdam embankment above the existing bedrock surface at elevation 2157.3.
8. Breach cofferdam at Iron Gate Dam prior to breach of cofferdam at J.C. Boyle Dam to minimize potential downstream impacts. Breach by notching below the reservoir level (expected to be below RWS elevation 2186.3. Maximum breach outflow from cofferdam at Iron Gate Dam is estimated to be approximately 5,000 cfs.
9. Following the cofferdam breach, remove any remaining embankment materials from river channel in the wet, during low flow period, as required.
10. Remove diversion tunnel intake structure (invert elevation 2175.3), topple gate control tower for removal (base elevation 2254.3), and plug tunnel and shaft portals with reinforced concrete. Topple and remove penstock intake structure, and plug openings. Remove water supply features for fish facilities.
11. Construct cofferdam in tailrace channel for removal of powerhouse. Use sump pumps to dewater area. Remove cofferdam when no longer needed.

Definite Plan
June 2018 05 | Dam Removal Approach 203
12. Remove all other features (buildings, switchyard, etc.) as required. Restore dam site and right abutment disposal site as required, including the placement of topsoil and seeding. See Section 6 for additional detail associated with restoration.
13. Demobilize from site when construction activities are complete.
Portions of the dam and hydropower demolition must be performed within the in-stream construction window negotiated with the regulatory agencies. See Section 8.6 of this Definite Plan for information pertaining to the construction schedule and timing of the various activities.
Figure 5.5-6 Iron Gate Dam Removal (Appendix B)
Transmission Line and Switchyard Removal
Transmission line removal at Iron Gate includes demolishing portions of the Iron Gate switchyard and demolishing overhead distribution and transmission lines and associated poles or towers, as applicable (see Figure 5.2-12).
KRRC’s contractor will demolish approximately 0.8 miles of overhead transmission/distribution line and approximately 10 poles. Lines to be demolished include:
• 69 kV transmission line between Iron Gate switchyard and distribution lines to remain in service
• 69 kV transmission lines between Iron Gate switchyard and Iron Gate hatchery tie-in
• Production lines in the general area of Iron Gate powerhouse
• Distribution lines supplying the two village houses near the dam
Major switchyard demolition components include:
• 69 kV/6.6 kV transformer
• 6.6 kV power circuit breaker
• Generator
• All associated auxiliary equipment
Iron Gate Hatchery located near the Klamath River downstream of Iron Gate Dam will require a new connection from PacifiCorp’s Hornbrook Substation (5G19). Details for connection requirements are unknown at this stage.
5.5.5 Demolition Methods, Estimated Equipment and Workforce
KRRC assumes the following demolition methods, estimated equipment requirements, and estimated workforce requirements for planning purposes based on engineering judgment. Alternative methods,

Definite Plan
204 05 | Dam Removal Approach June 2018
equipment, and workforce that will also meet project requirements are possible and could be refined by the selected contractor.
Demolition Methods
Dam removal requires the modification and operation of the diversion tunnel for low-level releases to allow controlled reservoir drawdown, and a high excavation production rate for removal of the embankment during the summer, low-flow months (June through September). The Iron Gate production assessment takes into consideration the approximate lift area by elevation and how many concurrent excavation operations could be occurring at that elevation. At the top, the lift surface is narrow and long and this work will progress at the low end of the overall average production rate. As the excavation descends, the footprint will become wider and KRRC’s contractor will add additional equipment to the equipment spread. The short and wide bottom lifts will also limit production, similar to the top. Consequently, KRRC’s contractor will implement high (above average) production rates for the larger middle lifts. KRRC’s contractor will likely complete the removal of the riprap as the embankment is excavated down. KRRC’s contractor will stockpile some rockfill for later use as slope protection for the upstream cofferdam.
KRRC’s contractor will likely use conventional earthmoving equipment consisting of excavators and off-road articulated or fixed-wheel haul units to reach the required average production rate of 16,000 CY per hour in August and September (Figure 5.5-6(B)). Key factors will be sizing the excavators to minimize the loading passes per haul unit, and selecting the maximum size haul units that can effectively negotiate the dam surface and haul route. KRRC’s contractor will utilize shift work to achieve the desired daily production rates. The potential for acceleration of the construction schedule is limited, if required, and may only be obtained by adding additional excavation time (increasing to 6 or 7 days per week, and/or longer shifts). The Definite Plan assumes 6 days per week and 2 shifts per day for 12 shifts per week, and assumes an average of 10,000 CY per 10-hour shift, to remove the dam embankment within about 16 weeks. It is interesting to note that the original placement of 1,100,000 CY of embankment material was completed within only 18 weeks in 1961.
KRRC’s contractor will likely excavate reinforced concrete in deck, wall, and floor slabs for any structures to be removed (including intake structures, control structures, fish handling facilities, and powerhouse) by mechanical methods (e.g. hydraulic shears or hoe-ramming). KRRC’s contractor may remove any mass concrete using conventional drilling and blasting methods.
Estimated Equipment and Workforce Requirements
Table 5.5-2 summarizes the estimated equipment for the removal of Iron Gate Dam and Powerhouse and for restoration of the reservoir area.

Definite Plan
June 2018 05 | Dam Removal Approach 205
Table 5.5-2 Iron Gate Dam and Powerhouse, Estimated Equipment List
Name of Equipment Pre-Drawdown
Post-Drawdown
Crawler-mounted lattice boom crane, 150 to 200 ton, 160- to 200-foot boom X Rough terrain hydraulic crane, 35 to 75 ton X X Hitachi hydraulic excavator, 180,000 to 240,000 lb, 6 to 8 CY bucket X Cat 336 hydraulic track excavator, 80,000 lb, 3.5 CY bucket Hydraulic track excavators, 65,000 to 100,000 lb, with Cat H120 hoe-ram, thumb and shear attachments
X
Cat 966 (52,000 lb, 5 CY bucket) or Cat 980 or Cat 988 (65,000 lb, 6 or 10 CY bucket) articulated wheel-loader
X X
Cat 740 articulated rear dump trucks, 30 ton (22 CY) or Cat 770 fixed haul unit, 40 ton (30 CY)
X X
D-7 or D-9 standard crawler dozers X X Front-end wheel loader, integrated tool carrier, 25,000 lb X D-8 support and knockdown dozer X Front-end wheel loader, integrated tool carrier, 25,000 lb X Cat TL943 rough terrain telescoping forklift X Rough terrain telescoping manlift X Cat 14 or Cat 16 motorgrader X X Flexifloat sectional barges X
Truck-mounted seed sprayer, 2500 gallon X On-highway, light duty diesel pickup trucks, ½ ton and 1 ton crew X X On-highway flatbed truck with boom crane, 16,000 lb X On-highway truck tractors, 45,000 lb X Off-highway water tanker, 5,000 to 9,000 gallon X Wheel-mounted asphalt paver X Self-propelled rubber tire and drum vibratory compactor, 5 to 15 ton X Engine generators, 6.5 KW to 40 KW, diesel or gasoline X Air compressors, 100 psi, 185 to 600 cfm, diesel X Hand-held drilling, cutting, and demolition equipment X Portable welders and acetylene torches X 4-inch submersible trash pumps, electric X Light plants, 2,000 to 6,000 watt, 10 to 25 hp, diesel X
An estimated average workforce of 35 to 40 people will be required for the construction activities, for an estimated duration of 19 months from site mobilization to construction completion for either dam removal alternative. The peak workforce required during excavation of the dam embankment could reach 75 to 80 people.

Definite Plan
206 05 | Dam Removal Approach June 2018
5.5.6 Imported Materials
KRRC’s contractor will import some materials to the site to support dam removal. The most likely materials to be imported include gravel surfacing from a commercial quarry for temporary haul roads (approximately 5,300 tons, 190 truck trips), seed and mulch materials, and minor quantities of ready-mix concrete and reinforcing steel from local commercial sources for tunnel plugs. Modification of the diversion tunnel will require importing mechanical equipment, and additional reinforcing steel and ready-mix concrete for lining the diversion tunnel and installing a new gate in the existing gate structure.
5.5.7 Waste Disposal
Table 5.5-3 shows estimated quantities of materials generated during removal of Iron Gate Dam and Powerhouse, numbers of truck trips, and approximate haul distances for waste disposal. KRRC’s contractor will place excavated concrete in the on-site disposal area. KRRC’s contractor will separate reinforcing steel from the concrete prior to placement in the disposal area and haul it to a local recycling facility. KRRC’s contractor will haul all mechanical and electrical equipment to a suitable commercial landfill or salvage collection point.
Table 5.5-3 Waste Disposal for Full Removal of Iron Gate Dam
Waste Material
In-Situ Quantity
Bulk Quantity 1 Disposal Site Peak Daily Trips 2 Total Trips 3
Earth 155,00 CY
912,000 CY
170,000 CY
1,087,00 CY
Onsite spillway Onsite disposal area
12 units/800 trips
(unpaved road)
8,640 trips (.5 mile RT)
48,640 trips (2 mile RT)
Concrete 15,800 CY 20,700 CY Onsite disposal area
2 units/50 trips (unpaved road)
950 trips (2 miles RT)
Rebar 700 tons --- Transfer station near Yreka, CA
1 unit/5 trips (Copco Road)
70 trips (54 miles RT)
Mech. And Elec
1,200 tons --- Transfer station near Yreka, CA
1 unit/5 trips (Copco Road)
150 trips (54 miles RT)
Building Waste
4 buildings 2,700 ft2
600 CY Transfer station near Yreka, CA
1 unit/5 trips (Copco Road)
60 trips (54 miles RT)
Power lines
0.5 miles of 69-kV
--- Transfer station near Yreka, CA
1. Volumes increased 30 percent for concrete rubble, 20 percent for loose earth materials. 2. Peak daily trips for each site are based on the number of vehicles (units) shown, operating within one 8-hour shift. 3. Total trips of earthfill assume off-highway articulated trucks with a nominal load capacity of 22 CY. Total trips of
concrete assume off-highway articulated trucks with a nominal load capacity of 20 CY. Total trips for hauling rebar using truck tractor-trailers is based on 10 tons per trip. Total trips for hauling mechanical and electrical items using truck tractor-trailers is based on 8 tons per trip. Total trips for building waste using truck tractor-trailers is based on 10 CY per trip.

Definite Plan
June 2018 05 | Dam Removal Approach 207
Table 5.5-4 shows potential landfills or salvage collection points and capacities. Appendix O3 discusses potential hazardous materials at Iron Gate Dam and Powerhouse and their disposal.
Table 5.5-4 Waste Disposal Facilities near Iron Gate Dam
Name of Facility
Location Distance from Site
Remaining Capacity
Materials Accepted
Yreka Transfer Station
Yreka, CA 25 miles 3,924,000 CY (2010)
Class III sanitary landfill accepting construction and demolition waste and mixed municipal waste, and Medium volume transfer station accepting metals and mixed municipal recyclable materials

Definite Plan
208 05 | Dam Removal Approach June 2018
This page intentionally left blank.

Definite Plan
June 2018 06 | Reservoir and Other Restoration 209
Chapter 6: Reservoir and Other Restoration

Definite Plan
210 06 | Reservoir and Other Restoration June 2018
This page intentionally left blank.

Definite Plan
June 2018 06 | Reservoir and Other Restoration 211
6. RESERVOIR AND OTHER RESTORATION
The purpose of this section is to summarize the proposed plan to stabilize remaining reservoir sediment post-drawdown and to restore the former reservoir areas at each development to native habitat. The full Reservoir Area Management Plan is provided in Appendix H.
6.1 Reservoir Restoration As part of the 2012 EIS/R and 2013 Secretarial Determination of Record (SDOR, DOI and NMFS 2013), a Reservoir Area Management Plan (USBR 2011c) was developed by the USBR with assistance from the NMFS and agencies from the Department of the Interior. The document describes anticipated conditions in the reservoir areas after removal of the four dams based on extensive hydraulic modeling, sediment characteristics, and several reservoir drawdown scenarios. The 2011 Plan provides goals and objectives developed with a multi-disciplinary team of professionals for restoration of the former reservoir areas. The 2011 Plan was developed primarily with the intent to minimize invasive vegetation and stabilize the remaining accumulated sediments not eroded during drawdown to reduce the likelihood of future undesirable sediment releases.
As part of the ongoing design and compliance processes, the KRRC assembled a working group of regulatory, tribal, and consulting professionals representing expert knowledge from recent dam removal restoration plans to provide recommendations for updating the 2011 Plan. The group held workshops in August and October 2017, and recommended updating the goals and objectives of the 2011 Plan based on current knowledge of reservoir restoration and experience gained from recent dam removal and restoration plans. Table 6.1-1 provides preliminary updates to the goals and objectives that are incorporated into the current Reservoir Area Management Plan in Appendix H.
6.1.1 Measures to Manage Remaining Sediment
J.C. Boyle Reservoir, Copco Lake, and Iron Gate Reservoir were well documented prior to construction of the dams. Each reservoir had a topographic survey and numerous pictures of conditions prior to construction of each dam as well as construction photos for each dam. As a result, ideal vegetation communities and site potential are easily discernable and techniques for stabilizing remaining sediments are readily apparent.
The 2011 Plan focused on control of invasive exotic vegetation (IEV) species and revegetation of the reservoir areas with native grasses, shrubs and trees as the primary method for restoration. This approach is consistent with nearly all dam removal and reservoir restoration plans in the past 10 years where restoration efforts have emphasized revegetation of newly exposed floodplain areas with native plants while actively controlling IEV. To implement this plan and manage the remaining reservoir area sediments, KRRC proposes

Definite Plan
212 06 | Reservoir and Other Restoration June 2018
a two-pronged approach that consists of revegetation and active habitat restoration with monitoring and adaptive management. The following sequence describes the activities and restoration features that will be implemented in the reservoir areas to manage remaining sediments not eroded during drawdown:
1. Pre-dam removal (1 to 2 years pre-drawdown): conduct pre-treatment of IEV species, collect seeds and grow-out of trees and shrubs by local nurseries.
2. Reservoir drawdown (January to March, year of drawdown): perform reservoir drawdown with natural erosion and evacuation of accumulated reservoir sediment deposits, stabilize sediments and exposed areas with hydroseeding.
3. Post-drawdown first summer/fall (dry season immediately after drawdown): conduct additional seeding application where needed for exposed areas and remaining reservoir deposits with grasses and ground cover, manual removal/treatment of IEV, and installation of riparian trees and shrubs.
4. Post-removal (year after dam removal is complete): maintain vegetation, continue to remove and treat IEV, install habitat features such as willow or log structures, as needed.
5. Establishment period (years 2 through 5 post-dam removal): continue monitoring and maintenance of vegetation, removal of IEV, fish passage monitoring, and enhancement of habitat features such as willow or log structures, as needed.
6. Long term (years 5 through 10 post-dam removal): continue monitoring and adaptive management, removal of IEV, and fish passage monitoring.
Table 6.1-1 Preliminary Goals, Objectives, and Restoration Activities for Reservoir Area Restoration
Period Goal Objective Restoration Activity
Pre-
cons
truct
ion
Perio
d
Prepare native plant materials for revegetation
Collect and propagate native plant seed and grow container plants
Identify potential seed collection, seed propagation, pole harvest cutting areas, and container plant grow contractors Perform surveys to identify and map seed collection and pole harvest areas
Prepare seed collection, seed propagation, container plant growing, and pole harvest contract documents Award and monitor native plant and seed contracts Develop revegetation contract documents
Reduce invasive exotic vegetation (IEV)
Reduce and minimize the local sources of IEV
Gather existing IEV data and perform EIV surveys Review potential herbicides and potential impact on fish and water quality
Implement an IEV management program
Create management plan and review with stakeholders
Procure local contractor to perform IEV removal Inspect and monitor IEV removal execution

Definite Plan
June 2018 06 | Reservoir and Other Restoration 213
Period Goal Objective Restoration Activity Understand evolution of reservoir post-removal and response to restoration and reservoir management
Conduct studies to fill in data gaps from 2011 Plan
Sample sediment and perform tests to investigate wetting and drying characteristics, plant nutrient availability, and natural revegetation
Perform revegetation pilot tests for native seed mixes Identify reference physical and ecological conditions in tributaries
Dam
rem
oval
per
iod
(0 to
1 ye
ar)
Allow natural erosion and transport of reservoir deposits and dispersal in the ocean
Maximize erosion of reservoir deposits during drawdown
Allow erosion of reservoir deposits during drawdown
Stabilize remaining reservoir sediments
Initiate native plant revegetation
Prepare and amend sediment based on pilot test plot results Install irrigation system Hydroseed sediment by planting zones
Install pole cuttings, acorns, and container plants
Restore volitional fish passage in mainstem and tributaries.
Monitor and rectify any non-natural fish passage barriers
Conduct field monitoring of mainstem/tributaries, fix non-natural barriers
Minimize IEVs Implement and monitor IEV removal during revegetation
Include criteria for IEV removal during revegetation implementation Bi-weekly inspections of revegetation areas to verify IEV compliance
Shor
t-ter
m
(1 to
5 ye
ars
afte
r rem
oval
)
Restore natural ecosystem processes
Continue native plant revegetation, maintenance and monitoring
Monitor establishment and adaptively replace failed pole cuttings, acorns, and container plants Maintain irrigation system Re-seed poorly established areas
Minimize IEV Continue IEV monitoring and removal
Include criteria for IEV removal during establishment Perform monthly inspections to verify IEV removal compliance
Restore volitional fish passage in mainstem and tributaries
Monitor and rectify any non-natural fish passage barriers
Conduct field monitoring of mainstem/tributaries, fix non-natural barriers
Long
-term
(5
to
10 ye
ars)
Restore natural ecosystem processes
Continue revegetation monitoring and adaptive management
Monitor establishment and adaptively replace failed pole cuttings, acorns, and container plants
Minimize IEV Continue IEV monitoring and removal
Perform quarterly site inspections and verify compliance

Definite Plan
214 06 | Reservoir and Other Restoration June 2018
Period Goal Objective Restoration Activity Restore volitional fish passage in mainstem and tributaries
Continue monitoring for non-natural fish passage barriers
Remove all non-natural fish passage barriers
The use of vegetation to stabilize reservoir sediments is a common practice and well documented approach to improve ecosystem processes. For instance, all of the dam removal and reservoir restoration plans that were reviewed as part of this work (Appendix H) had native vegetation establishment in reservoir areas as the primary component to provide long-term stabilization of exposed soils. Likewise, revegetation experiments, performed in 2008 by Ellen Mussman for the Elwha River dams, showed that vegetation reduced erosion of reservoir sediments by 33% and mulch could reduce erosion by as much as 99% (Mussman 2008).
KRRC also drew upon similar wildland restoration efforts found in wildfire area restoration, natural disaster areas (i.e. Mount St. Helens), and human-induced impacted areas since these altered and often barren landscapes are very similar to the remaining reservoir sediments. Establishment of native vegetation provides many important benefits for the stability of the remaining sediments in these disturbed areas. For instance, as described in Repairing Damaged Wildlands: A Process-Oriented, Landscape-Scale Approach, plants can reduce flow velocities, protect the soil surface from raindrop impact, increase soil stability, and increase the amount of water infiltrating into the soil (Whisenant 1999). A comprehensive update to the 2011 Plan is provided in Appendix H and outlines in detail the proposed revegetation for the reservoir areas. In addition, the updated plan outlines active restoration treatments that can be used to further improve sediment stability and long-term success for restoration.
To protect revegetation efforts and to replace the function of the reservoirs as natural barriers, cattle exclusion fencing is also included in the Reservoir Area Management Plan. It would prevent cattle access but would allow wildlife to pass. Based on the perimeters of the reservoirs, an approximate length of 34.5 miles may be required. Exclusion fencing will be placed, in accordance with applicable Federal, State, and county regulations and guidance, around the reservoir restoration areas where they abut grazing land. The portions of the reservoir perimeters that provide topographic (e.g., steep rocky terrain) or land use (e.g., residential areas, managed forests) barriers will not be fenced.
6.1.2 Measures to Monitor Remaining Sediment
Monitoring associated with the restoration aspects of the Project is designed to measure progress toward achieving the project goals, inform potential adaptive management and maintenance needs, and provide feedback into river and reservoir area conditions to determine if the sites are trending towards or away from achieving project goals. Based on the project goals and compliance with stated objectives, KRRC will use physical site characteristics as appropriate monitoring parameters to produce data to monitor and adaptively manage reservoir area restoration efforts.

Definite Plan
June 2018 06 | Reservoir and Other Restoration 215
After drawdown of the reservoirs and removal of the dams, the following actions are proposed to establish “baseline” or “initial conditions”. The initial conditions reference data will be used for monitoring and adaptive management related to reservoir restoration:
1. Permanent ground photo points will be established throughout the reservoir areas that enable sufficient vantage points of critical areas within the reservoirs. Photos will be taken to provide initial conditions for monitoring data to develop informed maintenance and corrective actions. Each photo ground point will be monumented with 5/8-inch rebar and aluminum cap for long-term stability and documented with a northing, easting, and elevation using a survey-grade GPS.
2. High resolution vertical aerial photos, sub-meter accuracy, will be completed for the reservoir areas. 3. KRRC will collect Light Detection and Ranging (LiDAR) data for the reservoir areas after sediment
evacuation and initial ground cover stabilization and use it to create initial conditions surface models.
Baseline data will provide a clear starting point for initial conditions in the project area to help evaluate reservoir restoration trends and trajectories. Appendix H contains the updated Reservoir Area Management Plan that has a comprehensive outline of parameters that will be monitored, which include: stability of remaining reservoir sediments, fish passage, invasive exotic vegetation, native plant revegetation, and restoration of natural ecosystem processes.
6.1.3 Measures to Restore the Klamath River within Reservoirs Review of historical photos of the reservoir areas prior to dam construction and inundation show river processes and conditions of the Klamath River pre-dams. The Klamath River was predominantly a narrow, volcanic bedrock dominated canyon with a single-thread river. Isolated areas within the canyon are wider such as in Copco Lake and the upper portion of the J.C. Boyle Reservoir. In these wider valley sections, the gravel-bed river planform is controlled by the locally resistant topography constraints and contains floodplains and off-channel features such as remnant channels and wetlands. Furthermore, there is little evidence of large wood playing a significant role in channel planform and characteristics throughout the river.
The Klamath River in the reservoir areas is expected to re-occupy the historical channel alignment due to geological constraints and the erosion of fine sediments accumulated in the reservoir bottoms. This conclusion was reached from both a geomorphic evaluation and two-dimensional hydraulic modeling analysis by USBR 2012c. Since the Klamath River channel was not altered since construction of the dams, it is anticipated that the river will return to a natural gravel-bed river and behave similar to pre-dam conditions. One exception is that riparian vegetation, primarily willows, will not be established on the banks but will be planted with the revegetation efforts. Appendix H provides a detailed riparian revegetation plan that will be implemented to restore the Klamath River in the reservoir areas and restart natural river processes.
Critical to restoring natural ecosystem processes and restoring the Klamath River is habitat restoration on the floodplains and tributaries that flow into the Klamath River in the reservoir areas. The following

Definite Plan
216 06 | Reservoir and Other Restoration June 2018
restoration techniques will be implemented in the reservoir areas as appropriate (see additional detail in Appendix H):
1. Tr ibutary Connectivity: Light equipment and manual labor will be used to move materials and enhance access and longitudinal connectivity of the tributaries with the mainstem Klamath River. In addition, large wood may be added to tributaries to promote habitat complexity.
2. Wetlands, Floodplain and Off-Channel Habitat Features: Incorporating floodplain features into exposed floodplains such as wetlands, floodplain swales, and side channels. a) Wetland restoration strategies for the reservoir areas include preservation of existing wetlands,
hydrologic connection of off-channel wetlands with the river, or creation of new wetlands at lower elevations corresponding to the post-dam removal surfaces and hydrologic regime.
b) Floodplain swales that vary in size and depth, but will not extend below the anticipated baseflow elevation.
c) Side channel restoration strategies include modifying inlet and outlet hydraulics, improving hydraulic complexity with structures or realignment, and delivery of water to higher floodplain surfaces.
3. Floodplain Roughness: KRRC will apply floodplain roughness as a strategy to exposed areas where frequent interaction with the river channel is anticipated. KRRC will create floodplain roughness using equipment to roughen the floodplain surface with microtopography and partially bury brush and woody debris in the soil.
4. Bank Stability and Channel Fringe Complexity: Introduce channel fringe complexity through the riparian revegetation and strategic addition of large wood.
5. Large Wood Habitat Features: Although historical photos do not show large wood as a predominant geomorphic feature, KRRC will use it to improve habitat and promote reservoir area conditions that restore natural ecosystem processes and protect vegetation during the initial years of establishment.
Appendix H contains maps and additional information on reservoir area restoration with these techniques and applicable locations for implementation.
6.2 Restoration Activities Outside of Reservoir Areas disturbed by construction activities, but outside of the former reservoir areas (e.g. staging areas, spoil disposal areas, temporary access roads, etc.) will be revegetated similarly to revegetation described in Appendix H for upland planting zone areas.
Disturbed areas outside of the former reservoir areas include the following:
1. Disposal sites for placement of embankment or concrete material: These areas typically include between 10 to 50 feet of fill, and KRRC will grade the disposal sites to match existing topographic features in the vicinity and will include a cover depth of topsoil material suitable for revegetation. KRRC will preserve and protect existing native vegetation where feasible. KRRC will not perform

Definite Plan
June 2018 06 | Reservoir and Other Restoration 217
ripping within twice the canopy diameter distance from protected tree trunks to protect existing roots.
2. Staging areas and temporary access road areas adjacent to demolition of other work areas: The majority of these areas are at elevations appropriate for upland planting, although in some cases they include a variety of planting zones. Many of these areas are already compacted to a high degree due to their current use, but regardless, KRRC will decompact all staging and temporary access road areas adjacent to demolition of other work areas by deep ripping and disking to facilitate seed germination and plant establishment. KRRC will preserve and protect existing native vegetation , where feasible, both during their active use and during revegetation. KRRC will not allow ripping, equipment and vehicle parking, or material storage within twice the canopy diameter distance from protected tree trunks to protect their existing roots from crushing.
3. Hydropower infrastructure demolition areas: KRRC will demolish the majority of PacifiCorp buildings and other hydropower infrastructure as part of the Project. In each former development location, after removal of all demolition debris and man-made materials, KRRC will decompact the remaining disturbed areas by deep ripping and disking, and restore them to native habitat. These areas occur in a variety of planting zones and will be restored accordingly as described in Appendix H. KRRC will preserve and protect existing native vegetation , as feasible. KRRC will not perform ripping within twice the canopy diameter distance from protected tree trunks to protect existing roots.
4. Former recreation areas: KRRC will remove some of the existing recreation areas around the reservoir rims completely, or in part. KRRC will restore all disturbed former recreation areas to native habitats. Many of these areas are heavily compacted because of their current use, but regardless of the degree of compaction, KRRC will decompact all recreation areas by deep ripping and disking to facilitate seed germination and plant establishment. KRRC will preserve and protect existing native vegetation, as feasible, and will not perform ripping within twice the canopy diameter distance from tree trunks to protect existing roots.
5. J.C. Boyle canal demolition area: KRRC will demolish the J.C. Boyle canal along its entire length. The former canal area will likely be heavily compacted from previous canal construction activities, but regardless of the degree of compaction, KRRC will decompact the canal demolition area by deep ripping and disking to facilitate seed germination and plant establishment. In addition, as part of the demolition activity, KRRC will excavate earthen materials from the river-side of the former canal width up to 3 feet and place the materials throughout the former canal width to support vegetation growth.
6. J.C. Boyle spillway scour hole: KRRC will fill the J.C. Boyle scour hole using onsite material as described in detail in Section 5.2.3. Final grading will be sloped to drain and the top 5 feet of fill will include local native material appropriate for vegetation establishment. The majority of the final graded slope is located at elevations suitable for upland seeding and planting (summarized in Appendix H). In general, KRRC will match restoration objectives, species lists and monitoring requirements with those identified for upland planting zone in Appendix H. Adjacent slopes will be utilized as a reference site for refining species lists and coverage objectives in this location.

Definite Plan
218 06 | Reservoir and Other Restoration June 2018
KRRC will implement short-term revegetation of these areas in compliance with the approved SWPPP/Erosion Control Plan. KRRC will perform long-term revegetation similarly as described for upland areas, however, KRRC will also decompact these areas by deep ripping and disking.

Definite Plan
June 2018 07 | Other Project Components 219
Chapter 7: Other Project Components

Definite Plan
220 07 | Other Project Components June 2018
This page intentionally left blank.

Definite Plan
June 2018 07 | Other Project Components 221
7. OTHER PROJECT COMPONENTS 7.1 Overview There are numerous project components that fall outside of the reservoir drawdown, dam removal, and reservoir restoration activities discussed in Sections, 4, 5 and 6. KRRC partially derived these additional project components from the previous list of mitigation measures found in the Detailed Plan (USBR 2012b) and the 2012 EIS/R. These components are incorporated into the Project as the most effective way to avoid or minimize impacts of the Project. KRRC will implement these components as part of the Project.
The numbered list below provides the work component categories and Table 7.1-1 provides an overview of each project component, with references to the 2012 EIS/R mitigation measure, where appropriate:
1. Aquatic Resource Measures: Surveys and other measures proposed to reduce project effects on aquatic resources
2. Terrestrial Resource Measures: Surveys and avoidance and minimization measures proposed to reduce project effects on terrestrial resources
3. Road Improvements: Road and bridge improvements to maintain a level of service comparable to existing conditions
4. Yreka Water Supply Improvements: Pipeline and diversion facility improvements to maintain a level of service comparable to existing conditions
5. Recreation Facilities Removal and Development Plan: Details on recreation facility removal and associated habitat restoration, as well as proposed recreation development
6. Downstream Flood Control Improvements: Flood control improvements will be constructed to maintain the current level of flood control
7. Cultural Resources Plan: details the plan for compliance with local, state, and federal laws for cultural and tribal resources
8. Other Plans: Management plans to provide a framework and initial requirements for traffic, water quality, groundwater, fire management, hazardous material management, emergency response, and noise and vibration
Table 7.1-1 Summary of Other Project Components1
Report Section
Project Component Description 2012 EIS/R Mitigation Measure Reference
Aquatic Resources 7.2 Mainstem spawning Surveys and associated protection measures AR-1

Definite Plan
222 07 | Other Project Components June 2018
Report Section
Project Component Description 2012 EIS/R Mitigation Measure Reference
7.2 Outmigrating juveniles Sampling and associated protection measures AR-2 7.2 Iron Gate Fish Hatchery Delayed fish release to avoid poor water quality AR-4 7.2 Suckers Surveys and relocation AR-6 7.2 Freshwater mussels Surveys and relocation AR-7
Terrestrial Resources 7.3, 6 Habitat restoration plan Plan to stabilize remaining sediments and restore
reservoir and other disturbed areas TER-1
7.3 Nesting bird surveys Surveys and avoidance and minimization measures TER-2 7.3 Bald and Golden Eagles Surveys and avoidance and minimization measures TER-3 7.3 Special-status plants Surveys and avoidance and minimization measures TER-4 7.3 Wetlands Delineation and incorporation of wetland features into
restoration plan, to the extent feasible TER-5
7.3 Special status bats Surveys and avoidance and minimization measures TER-6 7.3 Northern Spotted Owl Surveys and avoidance and minimization measures -
Transportation 7.4 Bridge and culvert relocations Improve roads, bridges and culverts affected by the
Project TR-1
Water Supply
7.5 Yreka water supply improvements
Relocate Yreka waterline and improve fish screens at diversion facility
-
Recreation 7.6 Recreation facility removal and
development plan Removal of numerous existing recreation facilities, and restoration with native vegetation
REC-1
Downstream Flood Improvement 7.7 Downstream Flood Control Maintain existing flood protection H-2
F ish Hatchery 7.8 Fish Hatchery Implement agency develop hatchery plan to meet fish
production expectations -
Cultural Resources
7.9 Cultural Resources Plan Framework for compliance with local, state, and federal cultural resources laws
CHR-1 to CHR-4
Management Plans App O Traffic Management Framework and initial requirements for traffic
management. Final plan to be developed by contractor -
App M Water Quality Water quality monitoring and analysis -

Definite Plan
June 2018 07 | Other Project Components 223
Report Section
Project Component Description 2012 EIS/R Mitigation Measure Reference
App N Groundwater Well Management Plan
Well monitoring GW-1
App O Fire Management Plan Framework and initial requirements for fire management. Final plan to be developed by contractor
PHS-2
App O Hazardous Material Management
Framework and initial requirements for hazardous materials management. Phase 1 assessment to be completed in 2017
-
App O Emergency response plan Framework and initial requirements for emergency response. Final plan to be developed by contractor
H-1
App O Noise and Vibration Control Plan
Framework and initial requirements for noise and vibration. Final plan to be developed by contractor
NV-1
1. 2012 EIS/R Mitigation Measures AR-3 and AR-5 were not incorporated in the Project because they were determined either to be unnecessary (AR-5) or infeasible (AR-3).
7.2 Aquatic Resources Section 7.2 includes background information pertaining to basin-specific fish populations, disease, passage and related water quality data and information. In addition, Section 7.2.5 summarizes the proposed aquatic resource measures to protect and benefit relevant species that the KRRC will implement as part of the Project. A full discussion of the aquatic resource measures is included in Appendix I.
7.2.1 Klamath Population Status Updates
The following section is intended to provide recent context on trends and estimated abundances of anadromous fish populations inhabiting the Klamath Basin downstream of Iron Gate Dam. This information provides an update on population data presented in the 2012 EIS/R. The population review includes spring and fall run Chinook salmon (Oncorhynchus tshawytscha), coho salmon (O. kisutch), and steelhead (O. mykiss). The discussion below contains the most recent 10 years of available population abundance metrics to provide additional context to the short-term trends.
Chinook Salmon
Chinook salmon that spawn upstream of the Klamath-Trinity Rivers confluence comprise the Upper Klamath and Trinity Rivers Chinook salmon Evolutionarily Significant Unit (ESU). Populations downstream of the confluence comprise the Southern Oregon /Northern California Coastal Chinook salmon ESU. Neither of these Chinook salmon ESUs are currently listed under the Endangered Species Act. While Chinook salmon continue to be the most abundant salmonid species in the Klamath Basin, recent declines in Chinook salmon populations have had widespread impacts and have led to restrictions on important tribal, commercial, and recreational fisheries that the ESUs have historically supported. Furthermore, recent

Definite Plan
224 07 | Other Project Components June 2018
advances in understanding of genetic structure of Chinook salmon populations could potentially result in creation of a new ESU and may lead to the listing of Klamath River and Trinity River spring Chinook salmon under the ESA.
Spring Chinook Salmon
Historically, runs of spring Chinook salmon in the Klamath Basin likely numbered greater than 100,000 (Moyle et al. 2017), and likely outnumbered fall-run Chinook salmon (Spier 1930, Snyder 1931), but spring run Chinook salmon have been extirpated from a large portion of their historical range due to lack of accessible habitats (Hamilton et al. 2005). Since the 2012 EIS/R, the remaining naturally-produced populations of Klamath River spring Chinook salmon in the Salmon River and across the Upper Klamath and Trinity River (UKTR) ESU have continued a precipitous decline (CDFW 2016a).
Total run size estimates from 2007-2016 (Figure 7.2-1) including both naturally and hatchery-produced spring Chinook salmon in the Klamath River basin, including the Trinity River, have ranged from a maximum of 35,326 in 2012 to a minimum of 8,815 in 2016, with an average of 18,817.
The recent 10-year average represented by the dotted red line is 18,817 fish.
Figure 7.2-1 Total run size estimates for Klamath Basin spring Chinook salmon from 2007-2016.
Only two viable naturally-spawned populations of wild spring Chinook salmon remain in the entirety of the Klamath Basin, one in the South Fork of the Trinity River, and the other in the Salmon River near Somes Bar, California. Summer holding pool adult counts have been conducted on the Salmon River annually for the past 23 years to estimate the total number of natural spring Chinook spawners available in that system. The contemporary effort includes snorkeling over 80 miles of the Salmon River mainstem, forks, and selected tributaries, and involves participation from federal and state agencies, tribes, watershed councils, and

Definite Plan
June 2018 07 | Other Project Components 225
volunteers (CalTrout 2017). These counts show downward trends over time with a maximum of 1,736 spring Chinook salmon in 2011 decreasing to a low of 110 spawners in 2017. The 10-year average is 918 spring Chinook salmon (Figure 7.2-2). The Salmon River represents the last remaining viable natural spawning population of spring Chinook salmon in the Klamath Basin above the confluence of the Trinity River, and the nearest population to historical habitat upstream of Iron Gate Dam.
The recent 10-year average represented by the dotted red line is 918 fish.
Figure 7.2-2 Estimated natural spring Chinook salmon spawners based on summer resting pool counts for the Salmon River from 2008-2017.
A 2013 status review of the UKTR Chinook salmon ESU conducted by NMFS in response to a petition for listing under the Endangered Species Act concluded that spring and fall run populations of Chinook salmon in the UKTR are included in a single ESU and that the ESU was at a low risk of extinction at the time of that determination (Williams et al. 2013). In their conclusions, the Biological Review Team included several concerns with Upper Klamath populations of spring Chinook salmon which provide additional insight into the overall status of the populations. The Biological Review Team concluded that the relatively few populations of spring Chinook salmon and the low number of spawners within those populations are limited by the availability and condition of currently accessible habitat. Deficient habitat restricts the expression of the spring run life history which typically provides diversity to the ESU. The Biological Review Team also stated that the low numbers of spring Chinook salmon are especially concerning given that the spring run life history was historically equal or larger than the fall run. In addition, the Biological Review Team suggested that the consequences of climate change may exert significant pressure on Chinook salmon populations in the UKTR unless habitat restoration and access to higher-elevation areas is achieved (Williams et al. 2013).
Recently published research by Prince et al. (2017) contests the current UKTR ESU configuration that defines spring and fall run Chinook salmon populations as a single ESU based on overall genetic structure

Definite Plan
226 07 | Other Project Components June 2018
that is primarily defined by geography. This configuration suggests that differences in premature (spring) versus mature (fall) migration timing within the same species and geographic range are replaceable in time frames that are consistent with conservation planning. The newly published research indicates that premature migration is defined by a single genetic variation that diverged approximately 15 million years ago, and that if the premature migration life history is lost in spring Chinook salmon or summer steelhead, it may not be replaceable for perhaps millions of years.
In November 2017, the Karuk Tribe and the Salmon River Watershed Council submitted a petition to NMFS to either list the UKTR Chinook ESU as endangered or threatened, or to create a new ESU for Klamath River spring Chinook salmon based on this new information. Without restored access to historical habitats that support the spring run life history, populations of spring Chinook salmon are expected to remain at a fraction of historical estimates (Moyle et al. 2008). Due to exceptionally low population abundance and the spatial distribution of existing populations being primarily located in the Salmon and Trinity rivers, it is likely that some intervention will be necessary to re-establish spring Chinook salmon populations in the Upper Klamath Basin (Goodman et al. 2011).
Fall Chinook Salmon
Run sizes of hatchery and naturally produced fall Chinook salmon in the Klamath Basin vary considerably from year to year. Current estimates of spawning escapement and run size are monitored by a combination of state, federal, and tribal agencies using a variety of methods including redd and carcass surveys, weir counts, and mark-recapture studies. Over 300,000 fall Chinook returned to the Klamath Basin in 2012 representing the largest recorded run since monitoring began in 1978 (CDFW 2016b). Conversely, preliminary data suggest that only approximately 27,000 fall Chinook salmon returned to the basin in 2016, representing the smallest run size during the same time period. The 2015 fall Chinook returns totaled approximately 84,000 which is substantially less than the recent 10-year average of approximately 140,000 fish (Figure 7.2-3).

Definite Plan
June 2018 07 | Other Project Components 227
The recent ten-year average is represented by the dotted red line and is 138,878.
Figure 7.2-3 Total run size estimates for the fall Chinook salmon for the Klamath Basin from 2007-2016.
Critical stressors on natural fall run Chinook salmon populations in the basin include water quality and quantity in the mainstem and spawning tributaries. Downstream of Iron Gate Dam, the mainstem Klamath River undergoes seasonal changes in flows, water temperature, dissolved oxygen, and nutrients, as well occasional blooms of Microcystis aeruginosa. During outmigration, juvenile Chinook salmon are vulnerable to contracting disease from pathogens, including the bacterium Flavobacterium columnare, and myxozoan parasites Parvicapsula minibicornis and Ceratomyxa shasta (USBR and CDFG 2012).
More recent trends show that the abundance of natural spawners is also variable between years, but have declined sharply since a large return of adult fall Chinook in 2014 (Figure 7.2-4). Estimates of naturally spawned fall Chinook salmon are based on monitoring surveys that include the mainstem Klamath River, the Salmon River basin, the Scott River basin, the Shasta River basin, Bogus Creek, and miscellaneous Klamath River tributaries on and above the Yurok Reservation (CDFW 2016b).

Definite Plan
228 07 | Other Project Components June 2018
Figure 7.2-4 Natural fall Chinook salmon spawner estimates in the Klamath River and selected tributaries from 2011-2016.
In 2017, the predicted run size was estimated at approximately 12,000 natural spawners, the lowest prediction on record, and substantially less than the 40,700 natural spawner escapement goal. Fisheries managers closed all recreational fishing for Chinook salmon in the Klamath and Trinity rivers for 2017 and tribal and commercial fisheries were severely restricted as well.
Coho Salmon
Coho salmon in the Klamath Basin are a component of the Southern Oregon/Northern California Coast (SONCC) coho salmon ESU, which was listed as federally threatened in 1997. All nine coho salmon populations within the Klamath basin (i.e., Upper, Middle, and Lower Klamath River populations, Upper and Lower Trinity River populations, Scott, Shasta and Salmon River populations, and the South Fork of the Trinity River population) have declined relative to historical levels (NMFS 2014) some of these populations may not be viable, and all have a moderate or high estimated extinction risk (NMFS 2016).
Estimates for the total run size of naturally and hatchery produced coho salmon for the Klamath Basin between 2006-2015 have ranged from a high of 21,155 (2006) to a low of 1,431 (2015) (CDFW 2016c; Figure 7.2-5). Total run size estimates for 2016 and 2017 were not available at the time of this writing.

Definite Plan
June 2018 07 | Other Project Components 229
The dotted red line represents the recent 10-year average of 9,157 fish.
Figure 7.2-5 Total run size estimate for Klamath Basin coho salmon from 2006-2015.
Estimates of natural spawners in the Klamath River and select tributaries show the variability between different year classes, but illustrate how weak two of the three brood year classes have been with the exception of the 2013 brood year class (Figure 7.2-6). Estimates of naturally spawned coho salmon are based on monitoring surveys that include the mainstem Klamath River, the Salmon River basin, the Scott River basin, the Shasta River basin, Bogus Creek, and miscellaneous Klamath River tributaries below the Yurok Reservation (CDFW 2016c).
Figure 7.2-6 Estimates for coho salmon natural spawners in the mainstem Klamath River and selected tributaries from 2011-2015.

Definite Plan
230 07 | Other Project Components June 2018
Hatchery coho production at Iron Gate Hatchery provides additional context to the status of populations within the Klamath River. The Iron Gate Hatchery coho program was initiated in the late 1960s to mitigate for impacts resulting from the construction of Iron Gate Dam, and currently operates to produce a program goal of 75,000 yearling coho salmon (California Hatchery Scientific Review Group 2012). The program currently operates under a Hatchery Genetics Management Plan finalized in 2014 to protect and conserve the genetic resources of the Upper Klamath River coho population unit (CDFW and PacifiCorp 2014).
Adult returns to Iron Gate Hatchery between 2011 and 2015 display similar patterns to the estimates of natural spawners, with one year class (2013) substantially stronger than the other two year classes (Figure 7.2-7).
The count of hatchery coho includes adult and grilse (reproductively mature after one ocean year) salmon.
Figure 7.2-7 Returns of coho salmon to the Iron Gate Hatchery from 2011-2016.
Similarly, releases of yearling coho salmon from hatchery production at Iron Gate Hatchery between 2011-2017 have only met production goals in three out of the last seven years (Figure 7.2-8).

Definite Plan
June 2018 07 | Other Project Components 231
The red dotted line represents the IGH production goal of 75,000 yearling coho.
Figure 7.2-8 Yearling coho salmon releases from the Iron Gate Hatchery from 2011-2017.
Steelhead
Klamath Basin summer and winter steelhead populations comprise the Klamath Mountain Province ESU. In 2001, NMFS determined the Klamath River Basin steelhead were not warranted for listing under the ESA, despite declining populations (NMFS 2001). Recent research completed by Hodge et al. (2016) identified a total of 38 life history categories at maturity for steelhead in the Klamath River. Klamath River steelhead populations have declined despite having high life history diversity, a characteristic that typically increases population stability.
Recent data on Klamath River Basin steelhead populations outside of the Trinity River are limited. Recent trends in abundance of Klamath River steelhead populations were examined primarily using three datasets; summer steelhead counts from the Orleans and Happy Camp Ranger Districts on tributary streams located of U.S. Forest Service (USFS) lands; video monitoring results from Bogus Creek and the Shasta River; and Iron Gate Hatchery returns, although the Iron Gate Hatchery steelhead program has not operated since 2013 due to low adult returns.
Since 1985, the Klamath Basin Collaborative Partnership has conducted summer steelhead holding counts on tributaries located on or adjacent to lands administered by the USFS Orleans and Happy Camp Ranger Districts in the middle Klamath River. Counts include adults and half pounders, and are a sum of the surveys conducted on Bluff Creek, Red Cap Creek, Camp Creek, Wooley Creek, Dillon Creek, Clear Creek, Elk Creek, Indian Creek, Thompson Creek, Grider Creek, and other small tributaries to the Klamath River located between Aikens Creek and Beaver Creek. Between 2006 and 2015, counts of adult and half pounder summer steelhead have ranged from a low of 384 to a high of 1255 with a recent 10-year average of 612 (Figure 7.2-9).
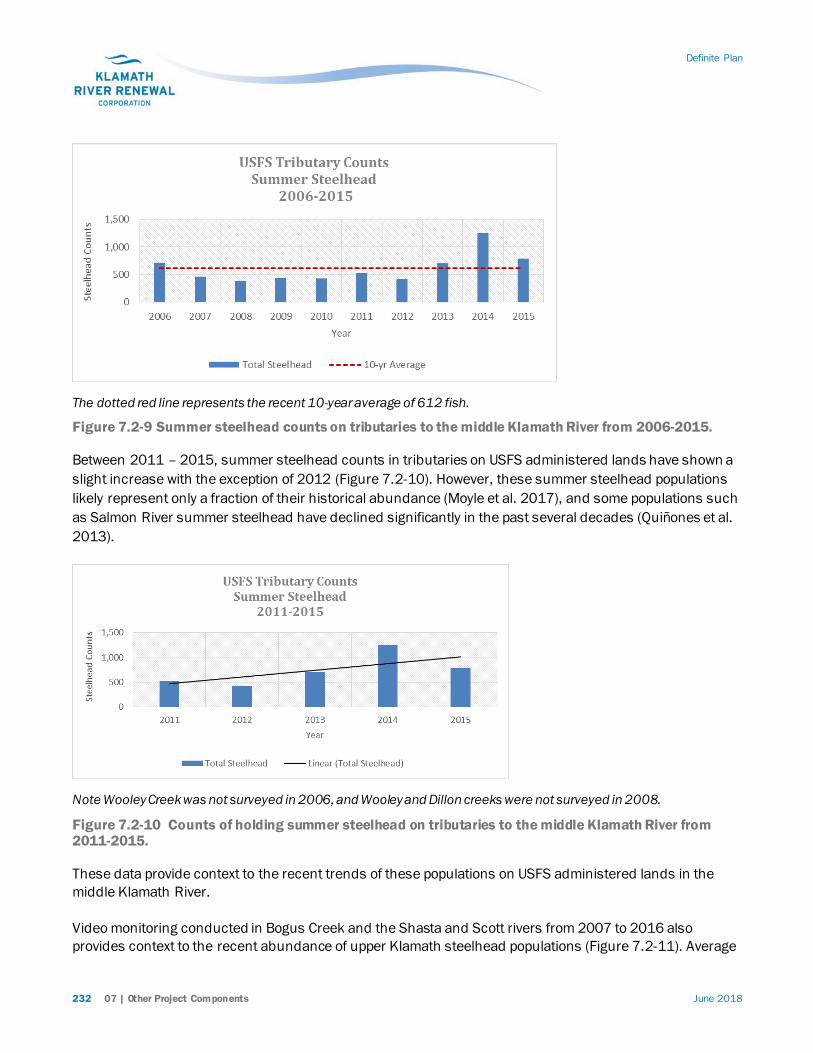
Definite Plan
232 07 | Other Project Components June 2018
The dotted red line represents the recent 10-year average of 612 fish.
Figure 7.2-9 Summer steelhead counts on tributaries to the middle Klamath River from 2006-2015.
Between 2011 – 2015, summer steelhead counts in tributaries on USFS administered lands have shown a slight increase with the exception of 2012 (Figure 7.2-10). However, these summer steelhead populations likely represent only a fraction of their historical abundance (Moyle et al. 2017), and some populations such as Salmon River summer steelhead have declined significantly in the past several decades (Quiñones et al. 2013).
Note Wooley Creek was not surveyed in 2006, and Wooley and Dillon creeks were not surveyed in 2008.
Figure 7.2-10 Counts of holding summer steelhead on tributaries to the middle Klamath River from 2011-2015.
These data provide context to the recent trends of these populations on USFS administered lands in the middle Klamath River.
Video monitoring conducted in Bogus Creek and the Shasta and Scott rivers from 2007 to 2016 also provides context to the recent abundance of upper Klamath steelhead populations (Figure 7.2-11). Average

Definite Plan
June 2018 07 | Other Project Components 233
returns of adult steelhead counted by video were 53 (Bogus Creek), 117 (Shasta River), and 265 (Scott River) during the 10-year period (CDFW, unpublished data, 2017). However, in many years, video monitoring was terminated in December or January and did not capture the full or peak steelhead migration period. In years where video monitoring or a combination of video counts and SONAR counts covered the full migration period (2013 and 2016 for Bogus Creek and 2012, 2015, and 2016 for Shasta River), total steelhead counted averaged 94 for Bogus Creek and 194 for the Shasta River (CDFW, unpublished data, 2017).
Note that most counts do not represent the peak of full steelhead migration periods.
Figure 7.2-11 Video counts of adult steelhead on Bogus Creek, Shasta River, and Scott River from 2007-2016.
Iron Gate Hatchery has produced steelhead since the early 1960s to mitigate for Iron Gate Dam impacts and to provide recreational fishing and harvest opportunities. Steelhead production has varied substantially over the years, with a high of approximately 643,000 yearlings in 1970 to a low of about 11,000 yearlings in 1997. The 200,000 yearling production goal was met in most years prior to 1991, but has not been achieved since then (California Hatchery Scientific Review Group 2012).
Adult steelhead returns to Iron Gate Hatchery typically ranged between 1,000 to 4,000 fish from the mid-1960s to the late 1980s. Returns declined substantially in 1990 and have steadily declined since (CDFW 2016d). Between 2007 and 2016, adult steelhead returns have ranged from a low of 4 (2016) to a high of 212 (2007) with a recent 10-year average of 104 fish (Figure 7.2-12). These returns have not been adequate to meet production goals for egg take and juvenile releases, and no steelhead have been produced at the Iron Gate Hatchery since 2012 (K. Pomeroy, CDFW, personal communication, 2017).

Definite Plan
234 07 | Other Project Components June 2018
The dotted red line represents the recent 10-year average of 104 fish.
Figure 7.2-12 Adult steelhead returns to Iron Gate Hatchery from 2007-2016.
Summary
The Klamath River Basin historically supported robust and resilient populations spring and fall run Chinook salmon, coho salmon, and steelhead. The remaining populations of anadromous fish in the Klamath River are present at a fraction of their historical estimates, and have declined significantly in abundance and viability over the last century (NMFS 2009). Most recently, and since the development of 2012 EIS/R, these populations have continued to experience further declines in abundance. Coho salmon are the only anadromous salmonid in the Klamath Basin listed under the ESA, the nine coho populations in the basin continue to decline, with most of them being at a high risk of extinction. New research published on Chinook salmon suggests that it may be appropriate to create a separate ESU to distinguish spring-run Chinook from fall-run Chinook in the current Upper Klamath – Trinity River ESU, and that designation will almost assuredly place Klamath Basin spring Chinook salmon on the endangered species list. Fall Chinook salmon runs have demonstrated great variability in year to year run sizes over the last decade with historically large runs in 2012 and 2014, and record low returns in 2015 and 2016. Forecasted predictions for 2017 were for even smaller returns than the record setting low run of 2016, and have led to widespread restrictions on West Coast fisheries. Steelhead populations show variability from year to year and are more difficult to assess than those of coho and Chinook salmon. Some populations such as summer steelhead populations on USFS lands appear to be relatively stable with modest increases over the last few monitoring years, while other populations such as those in the Shasta River and Bogus Creek continuing to decline.
7.2.2 Understanding of Fish Diseases
Fish diseases are widespread in the mainstem Klamath River during certain time periods, and in certain years, disease prevalence has been shown to adversely affect productivity of Chinook (Oncorhynchus tshawytscha) and coho salmon (O. kisutch). Since 2012, researchers have focused on developing a better

Definite Plan
June 2018 07 | Other Project Components 235
understanding of the life cycle, habitat characteristics, and effects of the myxozoan parasite Certonova shasta (previously Ceratomyxa shasta; C. shasta), and Parviscapsula minibicornis, on anadromous salmonids. P. minibicornis and C. shasta share the same invertebrate host, Manayunkia speciosa, and environmental variables such as temperature and flow are expected to affect parasite abundances similarly (Bartholomew and Foott 2010). The following document focuses on C. shasta as an indicator of mortality as a result of myxozoan infection in the Klamath River.
Certonova Shasta
Life Cycle
The parasite C. shasta is endemic to the Klamath Basin and is assumed to have co-evolved with the salmonid species it infects (Som et al. 2016a). The myxozoan parasite has a complex life cycle that includes two hosts and two spore stages. Waterborne actinospores released from the freshwater polychaete worm, M. speciosa, infect adult and juvenile salmonids and develop into myxospores that are then released from salmonids and infect the polychaete host.
C. shasta actinospores are released from infected polychaetes into the water column as temperatures rise above 10ºC in late March to early April (Bartholomew and Foott 2010). The actinospores are naturally buoyant and relatively short lived (days to weeks; Bjork 2010). Actinospores die unless they encounter a susceptible fish host. Fish become infected as the spores attach to the gills and travel through the bloodstream to reach the intestine. C. shasta infects the intestine of salmonids and can lead to necrosis of intestinal tissue that can be accompanied by a severe inflammatory reaction (enteronecrosis) and mortality (Bartholomew et al. 1989; Bartholomew et al. 2017). Myxospores develop within infected salmonids over a period of 18-25 days and are released into the environment at or soon after fish mortality (Benson 2014). Myxospores are denser than actinospores, allowing them to sink to the channel bed where they are consumed by suspension-feeding polychaetes (Bartholomew and Foott 2010). Consumption of myxospores infects polychaete worms, completing the C. shasta life cycle (Som et al. 2016a).
Habitat
The polychaete worm M. speciosa is adapted to life as a semi-sessile benthic invertebrate and inhabits many types of macro and microhabitats. Inhabited macrohabitats include channel habitat such as riffle runs, pools, channel margins, and reservoir inflow zones. Identified microhabitats include channel bed sediment, freshwater sponge, aquatic vegetation, and periphyton (Stocking and Bartholomew 2007). Through laboratory and field studies, researchers have concluded higher flows could directly influence the distribution of polychaetes by restricting habitat use to stable substrates (Som et al. 2016b). However, the mobility of M. speciosa and the species’ ability to persist after high flow events suggests M. speciosa is capable of moving to lower velocity, stable substrate habitats to avoid high flow effects (Alexander et al. 2014). Preliminary test results indicate that infected polychaetes are more likely to occur within a smaller range of peak flow depths and velocities than the general polychaete population, with infected polychaetes more associated with deeper and lower velocity depositional habitat (Som et al. 2016b).

Definite Plan
236 07 | Other Project Components June 2018
Juvenile Salmonid Infection
Annual prevalence of the myxozoan parasite C. shasta has been documented in emigrating juvenile salmon populations during spring and early summer in the Klamath River (True et al. 2016). C. shasta in out-migrating juvenile salmonids has been well-studied (True 2013; True et al. 2013) and the processes that influence C. shasta impacts on Klamath River salmon are increasingly understood.
C. shasta infection of juvenile salmonids causes enteronecrosis, often resulting in death. Fish infected by C. shasta may experience enteronecrosis mortality, but are also prone to mortality caused by other pathogens such as P. minibicornis. Enteronecrosis may also weaken juvenile salmonids making them more susceptible to predation, and may compromise osmoregulatory systems that are essential for successful ocean entry. C. shasta-related mortality has been linked to population declines in fall Chinook salmon in the Klamath River (Fujiwara et al. 2011; True et al. 2013).
C. shasta infection rates of juvenile Chinook salmon are influenced by C. shasta spore densities, water temperature, flow rate, and juvenile salmonid residence time in areas of high spore densities (Ray et al. 2014). Figure 7.2-13 includes a conceptual model illustrating the variables and processes influencing C. shasta infection and juvenile salmonid mortality. C. shasta infections generally progress to clinical enteronecrosis over a 7-18-day period, depending on exposure and the time period fish spend in the infectious zone during their outmigration (True 2013). Mortality may occur between 13 days and 25 days post-exposure to C. shasta (Bartholomew et al. 2017).
Source: Foott et al. 2011 cited in Som et al. 2016
Figure 7.2-13 A conceptual model of variables and processes influencing C. shasta infection and mortality of juvenile Chinook salmon.

Definite Plan
June 2018 07 | Other Project Components 237
Studies over the last decade have focused on developing a better understanding of the parasite life cycle and the parasite’s effects on juvenile salmonids in the Klamath River. Ray et al. (2014) evaluated in situ juvenile salmonid exposure using sentinel cages. Studies found that increasing parasite concentrations and water temperatures were positively associated with the proportion of juvenile fish that experienced infection and mortality. Spore concentration and water temperature were more important determinants of exposure and mortality of juvenile Chinook and coho salmon, than was river discharge. However, high velocities (Ray and Bartholomew 2013) and elevated flows may dilute spore densities and reduce transmission efficiency (Ray and Bartholomew 2013). Recent low water years associated with the 2013-2014 drought in California provided habitat conditions more favorable to C. shasta and P. minibicornis proliferation (True et al. 2015) compared to previous and subsequent higher flow years. Although high flow years may disrupt polychaete habitat, elevated flows may also redistribute polychaetes over a longer reach of the Klamath River (Bartholomew et al. 2017).
Table 7.2-1 includes a summary of juvenile Chinook salmon prevalence of infection over 10 years at the Kinsman rotary screw trap location (RM 147.6), located 45 river miles downstream from Iron Gate Dam (RM 193.1). The Kinsman trap is located between the Shasta River and the Scott River, a reach of the Klamath River often referenced as the “infectious zone” (True et al. 2015). The general pattern of annual parasite abundance in the Klamath River downstream from Iron Gate Dam remains relatively consistent from year to year, although the extent of the infectious zone and the magnitude of parasite densities change seasonally and annually (Bartholomew and Foott 2010; Bartholomew et al. 2017). Depending on river conditions (e.g., flow and water temperature) the infectious zone may extend from Iron Gate Dam to downstream of Seiad Valley (True 2013; Bartholomew et al. 2017). While high run-off years may reduce polychaete densities downstream of Iron Gate Dam, the redistribution of polychaetes by high flows may result in the downstream relocation of C. shasta ‘hot spots’ (Som et al. 2016c).
Table 7.2-1 Summary of estimates of annual-level C. shasta infection prevalence for wild and/or unknown origin juvenile Chinook salmon passing the Kinsman rotary screw trap site (RM 147.6).
Year Origin Prevalence of Infection
Infected Population Estimate Lower Confidence Limit
Infected Population Estimate
Infected Population Estimate Upper Confidence Limit
2005 All 0.41 0.26 0.38 0.47
2007 All 0.28 0.07 0.1 0.15 2008 All 0.6 0.43 0.51 0.58 2009 All 0.5 0.5 0.58 0.66 2010 Wild/Unknown 0.12/0.15 0.02 0.04 0.07 2011 Wild 0.2 0.07 0.11 0.17 2012 Wild/Unknown 0.06/0.00 0.04 0.08 0.14
2013 Wild 0.18 0.03 0.06 0.09 2014 Wild 0.67 0.12 0.18 0.26 2015 Wild/Unknown 0.66/0.96 0.2 0.29 0.39

Definite Plan
238 07 | Other Project Components June 2018
Note: The lower and upper confidence limits account for the estimation uncertainty in abundance and weekly prevalence of infection rates. Source: Som et al. (2016a).
Estimates of the annual proportion of infected Chinook salmon range from 2 percent to 66 percent (Som et al. 2016a). As the release of Iron Gate Hatchery juvenile Chinook salmon overlaps with the period of high infection potential, studies suggest that a high proportion of the Iron Gate Hatchery Chinook salmon stock can become infected with C. shasta (Som et al. 2016a). Infected juvenile fish that experience mortality lower in the Klamath River may become another source of myxospores to the lower Klamath River.
Spawner Influence on Prevalence of C. shasta
Returning adult salmon are exposed to myxospores when fish enter the Klamath River in the fall. Disease progression in adult fish is likely a function of temperature and infectious dose (Bartholomew and Foott 2010). Because adult fish have a low infection threshold, the prevalence of infection is high and infection rates may be high even in years of reduced infectious zone prevalence.
Adult salmonid carcasses play an important role in the lifecycle and prevalence of C. shasta in the infectious zone (Som et al. 2016a). Fall Chinook salmon returns to Iron Gate Hatchery and the blockage created by Iron Gate Dam, concentrate spawners and post-spawn carcass densities between Iron Gate Dam and the Shasta River confluence. Myxospore development occurs predominantly in decomposed carcasses rather than in recent post-spawned adults (Som et al. 2016a). Myxospore detection from carcasses ranges from 22 percent to 52 percent, however less than 13 percent of carcasses are significant contributors to myxospores production (produce >500,000 spores). Based on average adult returns to in the Shasta River to Iron Gate Dam reach, Chinook salmon carcasses potentially produce billions of myxospores. Myxospores remain viable in the channel bed sediments through the winter and early spring, and re-enter the water column over the winter when juvenile salmonids begin to emerge from the gravels.
Disease Reduction Benefits Associated with Dam Removal
Developments removal is expected to reduce fish disease in adult and juvenile salmon especially downstream from Iron Gate Dam. Among the salmon life stages, juvenile salmon tend to be most susceptible to P. minibicornis and C. shasta (Beeman et al. 2008). The main factors contributing to risk of infection by C. shasta and P. minibicornis include availability of habitat (pools, eddies, and sediment) and microhabitat characteristics (static flow and low velocities) for the polychaete intermediate host; polychaete proximity to spawning areas; increased planktonic food sources from Hydroelectric Reach reservoirs; water temperatures greater than 15°C (Bartholomew and Foott 2010); and juvenile salmonid residence time in the infectious zone (Som et al. 2016a).
Developments removal will restore natural channel processes including channel bed scour and sediment transport. Annual channel bed scour will disturb the habitat of the polychaete worm that hosts C. shasta

Definite Plan
June 2018 07 | Other Project Components 239
(FERC 2007). Reducing polychaete habitat will likely increase abundance of smolts by increasing outmigration survival, particularly for juvenile coho salmon (FERC 2007).
Dam removal will also broaden the distribution of adult pre-spawn fall Chinook salmon, reducing crowding and the concentration of disease pathogens that currently occurs in the reach between Iron Gate Dam and the Shasta River (Som et al. 2016a). A broader spawning distribution will also influence the distribution of post-spawn adult carcasses that contribute the bulk of the myxospores that enable the C. shasta life cycle within the infectious zone. Distributing adult carcasses over a longer reach of the Klamath River corridor will reduce myxospore densities likely leading to lower juvenile salmonid infection rates in the winter and spring rearing period (Som et al. 2016a). However, adult spawning upstream of the Klamath River dam sites could also expand habitat for M. speciosa and C. shasta effects. Both juvenile outmigrants and returning adult fish could be exposed to C. shasta over longer distances with dam removal.
In summary, water temperature and spore concentrations are positively correlated with infection and mortality of juvenile Chinook salmon and coho salmon. High spawner carcass concentrations downstream from Iron Gate Dam, contribute to high myxospore concentrations and the incidence of infection of juvenile fish. The timing of juvenile Chinook salmon from Iron Gate Hatchery and associated water temperatures may substantially contribute to the total myxospore load in the Klamath River. High spore concentrations in the Shasta River to Salmon River reach of the Klamath River, creates an “infectious zone” that increases outmigrating juvenile fish exposure to C. shasta. Developments removal is expected to reduce fish disease in adult and juvenile salmon especially downstream from Iron Gate Dam, by restoring natural channel processes (including channel bed scour and sediment transport), by broadening the distribution of adult pre-spawn fall Chinook salmon, and by broadening the distribution of post-spawn adult carcasses that contribute the bulk of the myxospores within the infectious zone.
7.2.3 Aquatic Resources Measures
The 2012 EIS/R identified significant short-term effects to the aquatic biological community. The 2012 EIS/R included aquatic resource (AR) measures to attempt to mitigate the possible short-term adverse effects of dam decommissioning. The Klamath River Renewal Corporation (KRRC) assembled an Aquatic Technical Work Group (ATWG) comprised of state and federal resource agencies, and tribal fisheries scientists in 2017 to review the 2010 EIS/R AR measures, determine the feasibility and effectiveness of those plans, and to provide input on refined proposed actions that would best meet the intent of the previous AR measures. The ATWG included fisheries scientists representing California Department of Fish and Wildlife (CDFW), Oregon Department of Fish and Wildlife (ODFW), U.S. Fish and Wildlife Service (USFWS), National Oceanic and Atmospheric Administration (NOAA Fisheries), Yurok Tribe, Hoopa Valley Tribe, Karuk Tribe, and the Klamath Tribes.
Through a series of nine meetings between April 28 and August 15, 2017, the KRRC and the ATWG reviewed recent similar dam removal projects and new scientific information that has been developed since the 2012 EIS/R to update the 2012 AR measures. Updated AR measures are proposed to be implemented as part of the Project. These measures are subject to consultation with aquatic resource agencies and negotiation of the final Biological Opinions for the Project.

Definite Plan
240 07 | Other Project Components June 2018
During the reservoir drawdown year, reservoirs will be drawn down by the end of March, followed by volitional fish passage by October 1, and free-flowing river conditions at all four facilities by December 31. Project effects are anticipated to be short-term in nature, with long-term benefits ultimately outweighing the project impacts to the aquatic biological community. The aquatic effects will primarily occur from the release of reservoir sediment during reservoir drawdown. Information in Appendix I – Aquatic Resource Measures, includes a review the 2012 EIS/R AR measures, lessons learned from other large dam removal projects, and provides the rationale for revising the AR plans to reduce the short-term project effects on aquatic resources.
Mainstem Spawning – Monitoring and Adaptive Management Plan
A monitoring and adaptive management plan is proposed to reduce effects to mainstem spawning. Survey and restoration actions included in the adaptive management plan are summarized below:
• Action 1: KRRC will evaluate tributary-mainstem confluences, four sites in the Hydroelectric Reach and five sites in the 8-mile reach from Iron Gate Dam (RM 193.1) to Cottonwood Creek (185.1), for 2 years (see Table 3-1 for proposed schedule). Monitoring frequency will be variable based on the season and year. Additionally, any 5-year flow event of 10,895 cfs or greater on the Klamath River recorded at the USGS Klamath River Below Iron Gate Dam CA gage (#11516530) within the first two years following reservoir drawdown, will trigger a monitoring effort. If tributary confluence blockages are identified during monitoring, necessary means will be employed to remove the obstructions to ensure volitional passage for adult Chinook salmon, coho salmon, steelhead, and Pacific lamprey. The ATWG will also convene periodically during the 2-year monitoring period to review monitoring frequency to ensure volitional passage is maintained between the Klamath River and select tributaries.
• Action 2: KRRC will complete a spawning habitat evaluation of the Hydroelectric Reach and newly accessible tributaries following reservoir drawdown. A target of 44,100 yd2 of mainstem spawning gravel will be required to offset the effects to 2,100 mainstem-spawning fall Chinook salmon redds. If mainstem spawning gravel availability is less than the target values following reservoir drawdown, KRRC will consult with the ATWG to plan and implement spawning gravel augmentation in the former Klamath River reservoirs and Hydroelectric Reach. A target of 4,700 yd2 of tributary spawning gravel is required to offset the effects to 179 tributary-spawning steelhead redds. If tributary spawning gravel habitat is less than the target values following reservoir drawdown, KRRC will meet with the ATWG to prioritize additional habitat restoration actions (e.g., gravel augmentation, gravel retention treatments) that will be implemented by KRRC to increase the amount of tributary habitat available to compensate for the loss of steelhead redds.
The proposed actions are intended to ensure adult salmonid and Pacific lamprey access to mainstem and tributary spawning habitat in the Hydroelectric Reach and between Iron Gate Dam and Cottonwood Creek following dam decommissioning.

Definite Plan
June 2018 07 | Other Project Components 241
Outmigrating Juveniles – Survey and Protective Measures
Surveys and measures proposed to reduce effects on conditions for outmigrating juveniles are summarized below:
• Action 1: KRRC will sample and salvage overwintering juvenile coho salmon from the Klamath River between Iron Gate Dam (RM 193.1) and the Trinity River (RM 43.4) confluence prior to reservoir drawdown. Sampling and salvage sites will focus primarily on alcoves, side channels, and backwatered floodplain features adjacent to the mainstem Klamath River. Up to 500 juvenile coho salmon are anticipated to be caught and relocated to off-channel ponds in order to protect this small, but important life history strategy in ESA-listed coho salmon population.
• Action 2: KRRC, with input from the ATWG, will prepare a monitoring and adaptive management plan to monitor tributary-mainstem connectivity. Beginning in January of the drawdown year and continuing for 2 years, tributary-mainstem confluences, including four sites in the Hydroelectric Reach and five sites in the 8-mile reach from Iron Gate Dam (RM 193.1) to Cottonwood Creek (RM 185.1), will be monitored with a variable frequency based on the season and year (see Table 4-1 for proposed schedule). Additionally, any 5-year flow event of 10,895 cfs or greater on the Klamath River recorded at the USGS Klamath River Below Iron Gate Dam CA gage (#11516530) within the first two years following reservoir drawdown, will trigger a monitoring effort. If KRRC identifies tributary confluence blockages during monitoring, KRRC will employ necessary means to remove the obstructions to ensure volitional passage for juvenile Chinook salmon, coho salmon, steelhead, and Pacific lamprey. Juvenile salmonids are expected to benefit from the Project because it will restore access to at least 13.9 miles of key tributary rearing habitats in the Hydroelectric Reach and several recognized thermal refugia areas including Jenny and Fall creeks.
• Action 3: KRRC will prepare and implement a monitoring and adaptive management plan that will include detailed information related to monitoring juvenile salmonids and water quality conditions in 13 key tributary confluences between Iron Gate Dam (RM 193.1) and the Trinity River (RM 43.4). Tributary water temperatures and mainstem suspended sediment concentrations will be monitored by KRRC from March 1 to July 1 of the drawdown year. If water quality triggers are exceeded, KRRC and the ATWG will convene to evaluate the data and determine if juvenile salmonids will be salvaged from the tributary confluences and relocated to cool water tributaries, existing off-channel ponds, and/or to the Klamath River downstream from the Trinity River confluence.
The proposed actions are intended to reduce project effects on juvenile salmonids and Pacific lamprey during reservoir drawdown.
Iron Gate Fish Hatchery – Delayed Releases to Avoid Lethal Water Quality Conditions
Hatchery-reared yearling coho salmon to be released in the spring of 2021 could be held at Iron Gate Hatchery or at another facility by CDFW until water quality conditions in the mainstem Klamath River improve to sublethal levels. Based on the current Iron Gate Hatchery release schedules and suspended sediment predictions in the Klamath River following dam decommissioning, yearling coho salmon releases could be delayed approximately 2 weeks to avoid lethal water quality conditions. Water quality monitoring stations

Definite Plan
242 07 | Other Project Components June 2018
established prior to reservoir drawdown will be used to determine when conditions in the mainstem Klamath River are suitable for the release of hatchery-reared coho salmon.
The proposed action is intended to reduce project effects on outmigrating hatchery-origin yearling coho salmon released from Iron Gate Hatchery. Whether the measure is ultimately adopted is within the discretion of CDFW, and KRRC will coordinate closely with CDFW on potential implementation of this measure.
Sucker – Survey and Protective Measures
Surveys and measures proposed to reduce effects to suckers are summarized below:
• Action 1: Lost River and shortnose suckers will be sampled in the Klamath River and in Hydroelectric Reach reservoirs in 2018, 2019, and 2020. River sampling will be completed in spring of 2019 and 2020, and reservoir sampling will be completed in fall of 2018 and 2019. Each sampling will require approximately 6 days for an estimated 24 days of sampling across the 2018 to 2020 period. The purpose of sampling is to document the abundance and genetics of Lost River and shortnose suckers in the Hydroelectric Reach. Captured fish will be marked with a passive integrated transponder (PIT) tag, fin clipped for genetic material, measured, and released. Recaptured fish will be used to estimate sucker abundance in the sampled reservoirs. Fin clips will be used to determine the genetics of the sampled fish. USFWS is currently developing genetic markers for Lost River and shortnose suckers.
• Action 2: Adult Lost River and shortnose suckers in reservoirs downstream from Keno Dam will be captured and relocated to isolated water bodies in the Klamath Basin. The proposed relocation of rescued suckers to isolated waterbodies is to ensure hybridized suckers do not mix with sucker populations designated as recovery populations in Upper Klamath Lake. An estimated 14 days will be required for salvage and release efforts. Due to the poor current understanding of Lost River and shortnose sucker populations in the reservoirs, we are unsure of the number of adult suckers inhabiting the reservoirs. Based on past study results (e.g., Desjardins and Markle 2000), we anticipate salvaging and translocating 100 adult Lost River and 100 adult shortnose suckers from each of the three Klamath River reservoirs (600 fish total). The number of translocated fish will not exceed 3,000 fish, which is the capacity of the currently identified recipient waterbody (Tule Lake). The proposed actions are intended to reduce project effects on Lost River and shortnose suckers inhabiting the Hydroelectric Reach reservoirs. The following sections provide additional detail on the proposed actions.
The proposed actions are intended to reduce project effects on Lost River and shortnose suckers inhabiting the Hydroelectric Reach reservoirs.
Freshwater Mussels – Survey and Protective Measures
Proposed surveys and other measures proposed to reduce effects to freshwater mussels are summarized below:

Definite Plan
June 2018 07 | Other Project Components 243
• Action 1: KRRC will complete a reconnaissance in 2019 to assess the distribution and density of freshwater mussels in the 8-mile long bedload deposition reach from Iron Gate Dam (RM 193.1) downstream to the Cottonwood Creek confluence (RM 185.1). The reconnaissance effort will determine if the mussel beds identified in the 2007-2010 surveys are still present, and estimate abundance of a subset of the mussel beds in the reach.
• Action 2: Based on the reconnaissance, KRRC will salvage and relocate a portion of the freshwater mussels located between Iron Gate Dam and Cottonwood Creek prior to drawdown to reduce project effects to the mussel community. Up to 20,000 mussels are planned for translocation to appropriate habitats in the Klamath River between the upstream extent of J.C. Boyle Reservoir (RM 234.1) and Keno Dam (RM 239.2).
The proposed actions are intended to reduce project effects on freshwater mussels located downstream from Iron Gate Dam.
7.3 Terrestrial Resources Measures KRRC has consulted with state and federal regulatory agencies and stakeholders to develop the following measures that KRRC proposes to reduce potential impacts to terrestrial resources. KRRC will implement these measures as part of the Project.
• Habitat Rehabilitation Plan: Section 6 and Appendix H summarize the restoration plan for the Project.
• Nesting Bird Surveys: Appendix J discusses surveys in several sections including Northern Spotted Owl, Bald and Golden Eagles, and Special Status Wildlife Species. KRRC will implement avoidance and minimization measures to the extent feasible, including monitoring, exclusion, buffers, and construction planning to time activities for less sensitive times of the year.
• Nesting Habitat of Bald and Golden Eagle and Other Migratory Birds: Appendix J discusses surveys for bald and golden eagles and special status wildlife species. KRRC will implement avoidance and minimization measures to the extent feasible, including monitoring, buffers, and construction planning to time activities for less sensitive times of the year.
• Special Status Plants: Appendix J discusses surveys for special status plant species. KRRC will implement avoidance and minimization measures to the extent feasible, including propagation and establishment in new locations as part of the site restoration as described in Section 6 and Appendix H.
• Wetlands at Reservoirs: KRRC will comply with regulatory requirements for delineating and protecting wetlands, as described in Appendix J in the Wetlands and Vegetation Communities section. KRRC will evaluate all areas within the limits of construction for the presence of wetlands in the project area, including potential disposal areas. KRRC will confirm the acreages through the field surveys. The restoration plans for the reservoir and non-reservoir areas, described in Sections 6.1 and 6.2, respectively, include designs for wetland and riparian habitat restoration to result in no net loss of wetland or riparian habitat functions.

Definite Plan
244 07 | Other Project Components June 2018
• Special Status Bats: The bats section of Appendix J describes the field surveys that KRRC has conducted and that KRRC plans for the remainder of 2018 and for 2019. KRRC will implement avoidance and minimization measures to the extent feasible, including monitoring, exclusion, seasonal restrictions on demolition, preservation of existing habitat, and development of alternative habitat.
• Northern Spotted Owl: Appendix J discusses survey protocols for the Northern Spotted Owl. KRRC will implement avoidance and minimization measures to the extent feasible, including seasonal restrictions on certain activities and a prohibition of aircraft or helicopter flights over sensitive areas as identified through the surveys. These restrictions will be incorporated into the project description and construction planning.
Appendix J discusses the full terrestrial resource work plans and planned avoidance and minimization measures.
7.4 Road Improvements This section describes the proposed road improvements the KRRC will implement as part of the Project. Sections 5.2.2, 5.3.2, 5.4.2 and 5.5.2 discuss construction access assessments and related transportation improvements and maintenance. This Section 7.4 discusses proposed post-construction transportation improvements and maintenance. Table 7.4-1 provides a summary of the all pertinent road segments, bridges, and culverts and the associated improvements.
Several road, intersection, structure and culvert improvements are proposed as part of the Project to:
• Facilitate access for project-related vehicles and equipment associated with dam removal (Section 5)
• Provide safety measures for both public and project roads used during the dam removals
• Return roads used by project-related vehicles to the respective owners and users in a state that equals or exceeds existing condition/function
KRRC performed a site visit and desktop study to assess the state of road infrastructure expected to be used throughout the Project. Tables in Appendix K show the findings of this assessment.
KRRC completed a further assessment of which elements require improvement for either construction access or post -construction restoration. KRRC will implement the improvements at various phases throughout the Project. Some will require completion prior to the dam removals, and others will be contingent on a future assessment of road elements once reservoir drawdown or hauling activities are complete. There will also be some ongoing activities throughout the Project to maintain roads heavily trafficked by project construction vehicles.

Definite Plan
June 2018 07 | Other Project Components 245
Table 7.4-1 Roadway and Access Improvements
Location Improvements Purpose Construction Access
Post-Drawdown
Road Rehabilitation
J.C. Boyle The Dalles California Highway (US97) • Potential pavement rehabilitation during or post-Project (Section 5.2.2) X
Green Springs Highway (OR66) • Potential pavement rehabilitation during or post-Project (Section 5.2.2) X
Spencer Bridge • None (Section 5.2.2)
Keno Worden Road • Potential pavement rehabilitation during or post-Project (Section 5.2.2) X
Keno Access Road • None (Section 5.2.2)
Unnamed Culvert at Unnamed Road near J.C. Boyle Reservoir
• None (Section 7.4.3)
Topsy Grade Road • Potential pavement rehabilitation during or post-Project (Section 5.2.2) X
Culvert at Unnamed Creek • Potential sediment removal and downstream erosion protection (Section 7.4.3)
X
J.C. Boyle Dam Access Road from OR66
• Regrading uneven or rutted areas (Section 5.2.2) X
Junction of OR66 and J.C. Boyle Dam Access Road
• Intersection widening (Section 5.2.2) • Tree removal (Section 5.2.2) • Signage (Section 5.2.2)
X
J.C. Boyle Powerhouse Road • None (Section 5.2.2)
Timber Bridge • Remove (Section 5.2.2) X
Power Canal Access Road • Periodic roadway maintenance grading during construction (Section 5.2.2) X
J.C. Boyle Disposal Access Road • Regrading (Section 5.2.2) • Minor widening (Section 5.2.2)
X
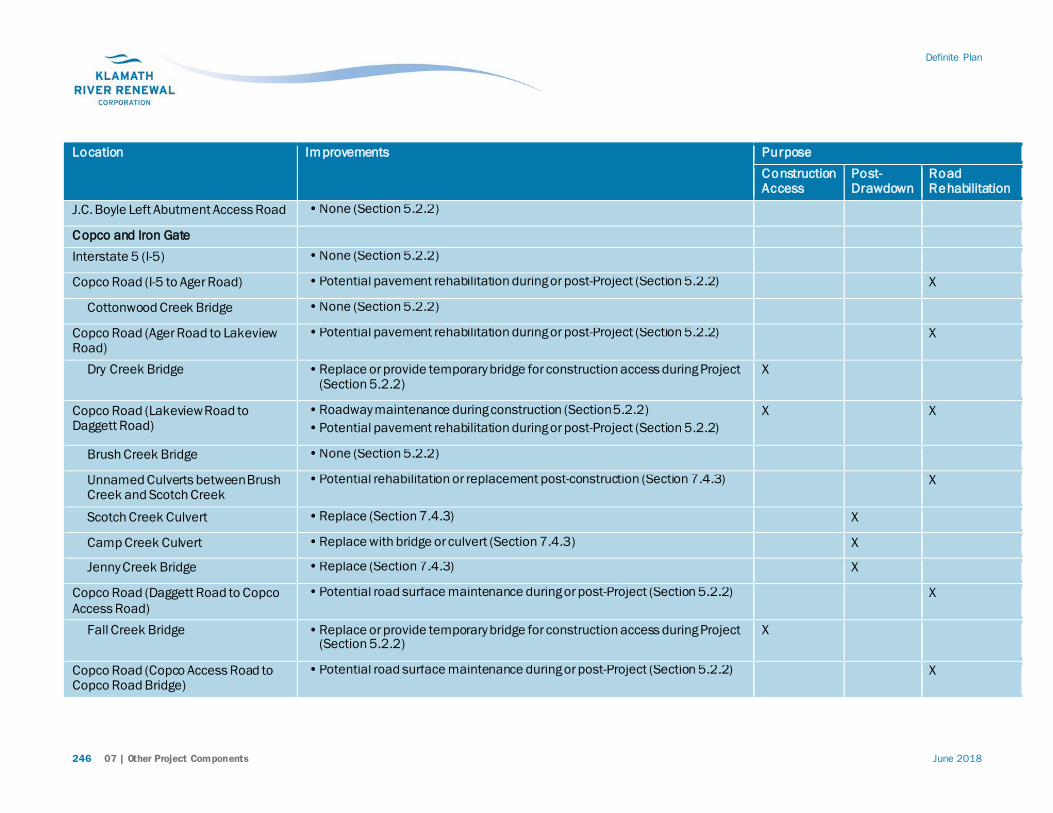
Definite Plan
246 07 | Other Project Components June 2018
Location Improvements Purpose Construction Access
Post-Drawdown
Road Rehabilitation
J.C. Boyle Left Abutment Access Road • None (Section 5.2.2)
Copco and Iron Gate Interstate 5 (I-5) • None (Section 5.2.2)
Copco Road (I-5 to Ager Road) • Potential pavement rehabilitation during or post-Project (Section 5.2.2) X
Cottonwood Creek Bridge • None (Section 5.2.2)
Copco Road (Ager Road to Lakeview Road)
• Potential pavement rehabilitation during or post-Project (Section 5.2.2) X
Dry Creek Bridge • Replace or provide temporary bridge for construction access during Project (Section 5.2.2)
X
Copco Road (Lakeview Road to Daggett Road)
• Roadway maintenance during construction (Section 5.2.2) • Potential pavement rehabilitation during or post-Project (Section 5.2.2)
X X
Brush Creek Bridge • None (Section 5.2.2)
Unnamed Culverts between Brush Creek and Scotch Creek
• Potential rehabilitation or replacement post-construction (Section 7.4.3) X
Scotch Creek Culvert • Replace (Section 7.4.3) X
Camp Creek Culvert • Replace with bridge or culvert (Section 7.4.3) X
Jenny Creek Bridge • Replace (Section 7.4.3) X
Copco Road (Daggett Road to Copco Access Road)
• Potential road surface maintenance during or post-Project (Section 5.2.2) X
Fall Creek Bridge • Replace or provide temporary bridge for construction access during Project (Section 5.2.2)
X
Copco Road (Copco Access Road to Copco Road Bridge)
• Potential road surface maintenance during or post-Project (Section 5.2.2) X

Definite Plan
June 2018 07 | Other Project Components 247
Location Improvements Purpose Construction Access
Post-Drawdown
Road Rehabilitation
Beaver Creek and E.F. Beaver Creek Culverts
• Potential erosion protection (Section 7.4.3) X
Raymond Gulch Culvert • Potential erosion protection (Section 7.4.3) X
Copco Road Bridge • Potential abutment erosion protection (Section 7.4.3) X
Copco Access Road • Clear, grub and regrade (Section 5.2.2) • Minor widening into hillside if possible (Section 5.2.2) • Maintain after construction is complete to allow access for monitoring
X
Copco Cove Access • Minor works to enable barge mobilization (Section 5.2.2) X
Patricia Avenue • None
Culverts at Unnamed Creeks (Copco Lake)
• Potential erosion protection (Section 7.4.3) X
Ager Beswick Road • None (Section 5.2.2)
Mallard Cove Boat Ramp Access • Minor works to enable barge mobilization (Section 5.2.2) X
Daggett Road • Minor grading improvements (Section 5.2.2) • Potential road surface maintenance during and post-Project (Section 5.2.2)
X X
Daggett Road Bridge • Replace (Section 5.2.2) X
Lakeview Road (Copco Road to Iron Gate disposal site)
• Potential road surface maintenance during and post-Project (Section 5.2.2) X
Lakeview Road Bridge • Replace or provide temporary bridge for construction access during Project (Section 5.2.2)
X
Iron Gate Powerhouse Access Road • Signage • Potential road surface maintenance during construction (Section 5.2.2) • Remove after construction is complete and restore area to native vegetation
(Section 5.2.2)
X X

Definite Plan
248 07 | Other Project Components June 2018
Location Improvements Purpose Construction Access
Post-Drawdown
Road Rehabilitation
Iron Gate Left Abutment Access Road • Remove after construction is complete and restore area to native vegetation (Section 5.2.2)
X
Iron Gate Upstream Left Abutment Access Road
• Remove after construction is complete and restore area to native vegetation (Section 5.2.2)
X

Definite Plan
June 2018 07 | Other Project Components 249
7.4.1 Construction Access Improvements
KRRC proposes various improvements to provide adequate access and haul routes associated with project construction. These all require completion prior to the commencement of dam removals. Sections 5.2.2, 5.3.2, 5.4.2, and 5.5.2 provide a detailed discussion.
7.4.2 Ongoing and Post-Project Maintenance Activities Some roads will require ongoing maintenance at various points throughout the Project or post-Project to maintain an acceptable road surface. See Table 7.4-1 for a list of the road segments where KRRC proposes pavement rehabilitation or road surface maintenance during or post-Project. Pavement rehabilitation is for asphalt concrete paved roads and includes overlay or localized pavement replacement. Road surface maintenance is for gravel and dirt roads and includes minor regrading and gravel placement.
KRRC’s contractor will conduct a baseline and a post-project pavement condition assessment to the determine extent of maintenance required. KRRC’s contractor will provide temporary traffic control on public roads during roadway surface maintenance, and this will involve one-way traffic control with flaggers and construction area signs.
7.4.3 Long Term Road Infrastructure Improvements
KRRC proposes some improvements to maintain existing roads in their pre-project condition. The proposed improvements will restore any reduction in functionality of road infrastructure caused by a reduction in flood protection or a reduction in embankment or culvert stability following the drawdown of the reservoirs and dam removal. The reservoir drawdown creates the potential for creek bed levels to readjust down to their pre-dam state. This will, in some areas, cause incision into fine sediments that have settled during the operation of the reservoirs. Where road infrastructure was constructed atop these sediments, the erosion of sediments from beneath or near road elements could result in damage or failure.
KRRC will complete the construction of improvements at various stages throughout the Project depending on the timeline for completion requirements, but many will require implementation prior to drawdown. The following sections summarize proposed permanent improvements to roads and bridges included in the Project.
Spencer Bridge (OR66/Green Springs Highway)
The Spencer Bridge left abutment embankment was constructed with highly pervious, strong basalt material, and it is expected that the embankment will remain stable during and following the drawdown of J.C. Boyle Reservoir, but some minor erosion of the riprap outer layer, not affecting stability, could occur. KRRC will inspect the embankment following the drawdown, and any damage to the riprap outer layer will be repaired. KRRC anticipates the restored Klamath River channel to locate between the 2nd and 3rd bridge bents, both of

Definite Plan
250 07 | Other Project Components June 2018
which were constructed on bedrock. KRRC does not anticipate scour at the bents following dam removal. Temporary traffic control will be required during these improvements.
Timber Bridge
A timber bridge spans the Klamath River immediately downstream of J.C. Boyle Dam. KRRC’s contractor will remove this structure after dam removal. KRRC does not propose traffic control as the bridge is not a public road.
Topsy Grade Road Culvert at Unnamed Creek
Topsy Grade Road crosses an unnamed creek, roughly 1,900 feet to the east of the J.C. Boyle Dam. The road is found on an embankment roughly 400 feet long with three 24-inch culverts draining a watershed of roughly 5 square miles. Reservoir sediment currently covers and obscures the culverts. The culverts may have been constructed prior to J.C Boyle Dam, and if so, they will likely not be impacted by reservoir sediment sloughing. However, the J.C. Boyle as-built drawings indicate that the culverts do not align with the original thalweg of the creek. KRRC’s contractor will monitor this location during and following drawdown. If erosion of reservoir sediments affects this culvert, KRRC’s contractor will install riprap armor on the downstream face of the embankment and remove sediment and debris from the culverts, if needed, to protect the road embankment. See Figure 5.1-1(C) for the limits of work associated with these improvements. KRRC’s contractor will provide minor temporary traffic control during these improvements.
Unnamed Culvert at Unnamed Road (near J.C. Boyle Reservoir)
Approximately 0.9 mile north of OR66, off Keno Access Road, an unnamed road crosses an unnamed creek. The road is found on an embankment, with two 36–inch-diameter corrugated metal pipe (CMP) culverts allowing drainage of the creek. The culverts are well above the reservoir water level, so KRRC does not anticipate they are built on reservoir sediments. The upstream and downstream ends have silt build-up. KRRC’s contractor will monitor this location during and following drawdown. If erosion of reservoir sediments affects this culvert, KRRC’s contractor will place riprap armor on the downstream face of the embankment and remove sediment and debris from the culvert, if needed, to protect the road embankment. KRRC’s contractor will provide minor temporary traffic control during these improvements.
Copco Road Bridge
Copco Road Bridge crosses Copco Lake immediately north of the junction of Copco Road and Ager Beswick Road. Section 5.3.2.2 includes additional information on the bridge. Both drawdown and post-project flows have the potential to cause erosion at the abutments or central pier. KRRC will further evaluate this during the detailed design phase, KRRC’s contractor will provide erosion protection at the abutments or pier, if needed. KRRC’s contractor will provide minor temporary traffic control during these improvements.

Definite Plan
June 2018 07 | Other Project Components 251
Copco Road Culvert at Raymond Gulch
A 60–inch-diameter CMP culvert pipe passes beneath Copco Road at Raymond Gulch adjacent to Copco Lake. The culvert is elevated well above the reservoir level, and KRRC does not expect that it is built on reservoir sediments. KRRC’s contractor will monitor this location during and following drawdown. If erosion of reservoir sediments affects this culvert, KRRC’s contractor will place riprap armor on the downstream face of the embankment. KRRC’s contractor will provide minor temporary traffic control during these improvements.
Copco Road Culverts at Beaver Creek
60–inch-diameter CMP culvert pipes pass beneath Copco Road at both Beaver Creek and East Fork Beaver Creek adjacent to Copco Lake. Both pipes are elevated well above the reservoir water level, and KRRC does not expect that it is built on reservoir sediments. KRRC’s contractor will monitor this location during and following drawdown. If erosion of reservoir sediments affects this culvert, KRRC’s contractor will place riprap armor on the downstream face of the embankment. KRRC’s contractor will provide minor temporary traffic control during these improvements.
Patricia Avenue Culverts at Unnamed Creek (Copco Lake)
Patricia Avenue passes over two unnamed creeks near Copco Lake and the Copco Lake Fire Department. Beneath each crossing is a 60–inch-diameter CMP culvert. The drainage culverts are elevated well above the reservoir water, and KRRC does not expect that it is built on reservoir sediments. KRRC’s contractor will monitor this location during and following drawdown. If erosion of reservoir sediments affects this culvert, KRRC’s contractor will place riprap armor on the downstream face of the embankment. KRRC’s contractor will provide minor temporary traffic control during these improvements.
Jenny Creek Bridge
Jenny Creek Bridge crosses the mouth of Jenny Creek at Iron Gate Reservoir. Section 5.3.2.2 includes further details of the bridge. The abutments are built on material deposited after the dam construction and the dam removal may cause significant erosion that could possibly undermine the abutments. KRRC’s contractor will construct a new bridge on the upstream side of the existing structure, on a modified alignment, to preclude damage to the structure after the drawdown (Figure 7.4-1).
The new bridge will be a multi-span bridge long enough to span over the creek sediments and/or reservoir deposited material and the design will found the bent supports on native soil or rock. The design will place the abutment supports for the replacement structure away from the area that is susceptible to reservoir sediment erosion. This approach will minimize realignment of the existing Copco Road and potential impacts to right of way. KRRC’s contractor will build the new bridge ‘offline’ so the impact to traffic will be limited to the traffic switch from the existing road alignment to the new realigned road.

Definite Plan
252 07 | Other Project Components June 2018
Figure 7.4-1 Copco Road Realignment and Jenny Creek Bridge Replacement
Copco Road Culverts at Camp Creek
A 10 foot diameter CMP arch culvert passes beneath Copco Road at Camp Creek adjacent Iron Gate Reservoir. KRRC anticipates erosion in this area following drawdown of the reservoir due to incision into reservoir sediments. Due to the difficulty in knowing exactly when the erosion will occur, KRRC will replace the culvert with a bridge, and provide suitable erosion protection to account for the potential drop in creek bed elevation, prior to drawdown. KRRC’s contractor will construct a temporary structure and detour road just upstream of the culvert to maintain through-traffic during the work. Figure 7.4-2 shows a potential temporary detour alignment.
Copco Road Culvert at Scotch Creek
A 120–inch-diameter CMP culvert passes beneath Copco Road at Scotch Creek, adjacent to Iron Gate Reservoir. KRRC anticipates erosion in the vicinity of the culvert following drawdown of the reservoir due to incision into reservoir sediments. KRRC will replace the culvert, and provide suitable erosion protection to account for the potential drop in creek bed elevation, prior to drawdown. KRRC’s contractor will construct a temporary structure and detour road just upstream of the culvert to maintain through-traffic during the work. Figure 7.4-3 shows a potential temporary detour alignment.

Definite Plan
June 2018 07 | Other Project Components 253
Figure 7.4-2 Temporary Culverts and Detour Road at Camp Creek
Copco Road Drainage Culverts between Brush Creek and Camp Creek
A number of culverts ranging in diameter from approximately 12–inch-to 18–inch-diameter pass beneath Copco Road between Brush Creek and Camp Creek. KRRC’s contractor will monitor this location during and following drawdown. If erosion of reservoir sediments affects these culverts, KRRC’s contractor will place riprap armor on the downstream faces of the embankments. KRRC’s contractor will provide minor temporary traffic control during these improvements.

Definite Plan
254 07 | Other Project Components June 2018
Figure 7.4-3 Temporary Culvert and Detour Road at Scotch Creek
7.5 Yreka Water Supply This section describes the proposed improvements to the City of Yreka water supply the KRRC will perform as part of the Project. There are three options for the water supply pipeline, and the KRRC will select one for implementation in consultation with the City of Yreka. A 24-inch-diameter water supply pipeline for the City of Yreka, California, crosses the Klamath River near the upstream end of the reservoir impounded behind Iron Gate Dam. The 24-inch-diameter steel water supply pipeline crosses the Klamath River near the upstream end of Iron Gate Reservoir as shown on Figure 7.5-1 and is minimally buried in the reservoir bed. When KRRC’s contractor removes Iron Gate Dam, high velocity river flows will expose the pipe, and it will likely sustain damage. During preparation of the Detailed Plan, USBR used a HEC-RAS model to estimate the hydraulic properties at the pipe crossing post-dam removal, and predicted scour ranged from 5 to 10 feet (USBR, 2012). KRRC will provide a replacement pipe crossing before dam removal and reservoir drawdown to ensure uninterrupted water supply for the City of Yreka.
The primary water intake for this water pipeline is at Dam A, located downstream of a PacifiCorp power plant near Fall Creek and diverts flow to a pumping station further downstream along Fall Creek. A secondary

Definite Plan
June 2018 07 | Other Project Components 255
intake at Dam B located on Fall Creek is used when the power plant is shut down and supplies water through a pipeline to the intake at Dam A. Based on the Detailed Plan (USBR, 2012), the existing flat panel fish screens for the water supply intakes at Dams A and B may not meet current regulatory agency screen criteria for anadromous fish. It appears that the fish screens have recently been updated, but their compliance with current regulatory agency screen criteria for anadromous fish still needs to be confirmed, and the screens will require updates, if found to be non-compliant.
7.5.1 Water Supply Pipeline
Existing Conditions
At the Klamath River crossing, the existing steel pipe is minimally buried in the reservoir bed. The published surface geology by USGS (Wagner and Saucedo 1987) on both sides of the Klamath River at the location of the existing Yreka Pipeline Crossing is mapped to be Western Cascade Volcanic (Tv) rock unit, predominantly Andesite with some basalt and dacite (Tva), Andesite and basalt intrusions and plugs (Tia) and Andesite tuff breccia (Tvp) units. The as-built records of the existing pipeline (Piemme, Neill, and Bryan and Clair A. Hill Associates, 1968) indicate that the existing pipeline was constructed by directly laying the pipe on the then existing reservoir bed within a riprap berm. The static and static & surge hydraulic internal pressures at this location on the Klamath River are approximately 306 and 374 psi, respectively (Drawing GP-3, Piemme, Neill, and Bryan and Clair A. Hill Associates 1968).
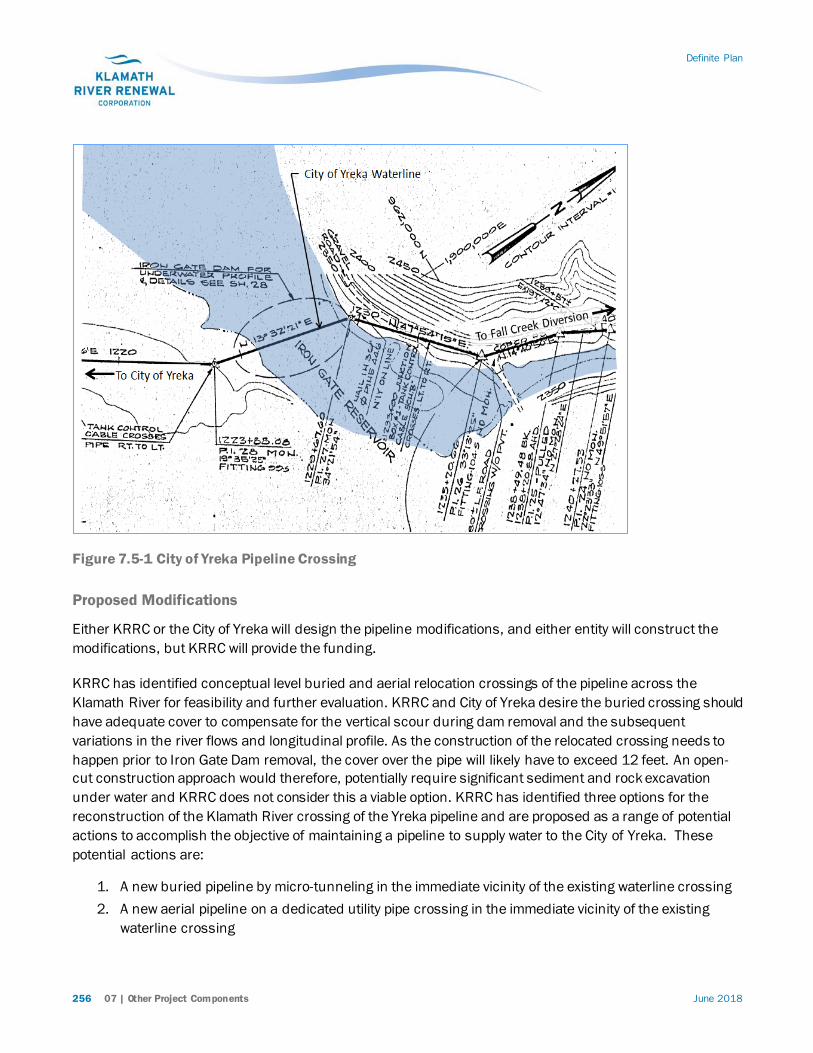
Definite Plan
256 07 | Other Project Components June 2018
Figure 7.5-1 City of Yreka Pipeline Crossing
Proposed Modifications
Either KRRC or the City of Yreka will design the pipeline modifications, and either entity will construct the modifications, but KRRC will provide the funding.
KRRC has identified conceptual level buried and aerial relocation crossings of the pipeline across the Klamath River for feasibility and further evaluation. KRRC and City of Yreka desire the buried crossing should have adequate cover to compensate for the vertical scour during dam removal and the subsequent variations in the river flows and longitudinal profile. As the construction of the relocated crossing needs to happen prior to Iron Gate Dam removal, the cover over the pipe will likely have to exceed 12 feet. An open-cut construction approach would therefore, potentially require significant sediment and rock excavation under water and KRRC does not consider this a viable option. KRRC has identified three options for the reconstruction of the Klamath River crossing of the Yreka pipeline and are proposed as a range of potential actions to accomplish the objective of maintaining a pipeline to supply water to the City of Yreka. These potential actions are:
1. A new buried pipeline by micro-tunneling in the immediate vicinity of the existing waterline crossing 2. A new aerial pipeline on a dedicated utility pipe crossing in the immediate vicinity of the existing
waterline crossing

Definite Plan
June 2018 07 | Other Project Components 257
3. A new buried pipeline and an aerial pipeline crossing on the existing timber traffic bridge along Daggett Road located approximately 2,000 feet upstream of the existing waterline crossing
Figure 7.5-2(C) shows the alignments for the three options, and detailed descriptions for each are presented below. KRRC will determine the preferred option in consultation with the City of Yreka.
Figure 7.5-2 Alignments for Klamath River Crossing (Appendix C)
Option 1 – Micro-tunneled Crossing
Option 1 consists of the installation of either a new 24-inch-diameter steel pipeline within a tunnel casing or a larger diameter carrier pipe constructed using a micro-tunnel construction approach. Figure 7.5-3 (C) shows the pipeline profile for this concept level alternative. The micro-tunnel will be approximately 550 feet long, at least 36-inch internal diameter, and will be at least 30 feet below the current bottom of Iron Gate Reservoir. The tunnel would be aligned parallel to, but offset approximately 25 feet downstream from the existing pipeline crossing to avoid damage to the existing pipe. The design would connect the new pipe to the existing pipeline on both the north and south sides of the Klamath River through new piping and fittings as shown in Figures 7.5-2(C) and 7.5-3(C). Based on the surface geology map and the rock outcrops observed at the site, portions of the entire micro-tunnel alignment will likely be through bedrock formations. Rock hardness and abrasiveness of the bedrock will have an impact on wear of cutting tools, which and type of the micro-tunnel equipment would impact the maximum drive length. Therefore, selection of the micro-tunnel diameter, type of the micro-tunnel equipment, and the actual elevation of the micro-tunnel crossing as well as the locations and depths of the driving and receiving shafts would depend on the subsurface profile and surface topography of the on-shore and off-shore ground surface. Based on the concept profile illustrated, the driving and receiving shafts would be approximately 58 feet and 56 feet deep, respectively.
Figure 7.5-3 Profiles for Klamath River Crossing (Appendix C)
To advance the final design, KRRC will complete a geotechnical subsurface investigation, topographic survey, and bathymetric survey of the site. Based on the subsurface investigation, KRRC will evaluate the location of the tunnel profile and selected to minimize the micro-tunneling installation risks and costs and to avoid or minimize and mitigate effects to cultural resources. Also, other types of trenchless approaches such as Direct Pipe, which is a hybrid method combining micro-tunneling and horizontal directional drilling (HDD) approaches, may become attractive alternatives with lower cost and/or risk. KRRC will complete on-shore borings at the proposed locations of the driving and receiving shafts and three off-shore borings to establish the subsurface profile along the tunnel alignment as part of the geotechnical explorations. These borings will extend to at least a depth 50 feet below the thalweg of the river (i.e., lowest elevation of the lake bed at the crossing location).
Option 2 – Aerial Crossing on New Utility Bridge
Option 2 is a prefabricated steel 7.5-foot-wide box truss bridge as was proposed in the Detailed Plan (USBR 2012b). This utility bridge would be just wide enough to accommodate the new 24-inch-diameter pipeline and an adjacent walkway for maintenance purposes. The height would provide a minimum of three feet of

Definite Plan
258 07 | Other Project Components June 2018
freeboard above the eventual water surface for the 100-year flood in the river channel. KRRC selected three bridge spans, with a center span of 200 feet and end spans of 100 feet each to minimize the height of the two concrete support piers. Reinforced concrete abutments would support the two ends. This option includes founding the bridge abutments and piers upon drilled shafts backfilled with concrete.
This option would align the bridge parallel to, but offset from the existing pipeline to avoid damage to the existing pipeline during construction. Access into the river for bridge pier construction would be from clean, dumped gravel access pads placed in the river and extending from the banks. The gravel access pads would be removed after construction. Figures 7.5-2(C) and 7.5-3(C) show the proposed alignment and profile for Option 2, respectively.
If this option moves forward, as in Option 1, KRRC will complete a geotechnical subsurface investigation, topographic survey, and bathymetric survey of the site to advance the final design. The geotechnical explorations will include on-shore borings near the proposed locations of the bridge abutments and three off-shore borings near the proposed locations of the bridge support piers. These borings will extend to at least an elevation 50 feet below the thalweg of the river (i.e., lowest elevation of the lake bed at the crossing location).
Option 3 – Aerial Crossing on Daggett Road Bridge
Option 3 is construction of an aerial crossing using the existing timber traffic bridge along the Daggett Road located approximately 2,000 feet upstream of the existing waterline crossing as was proposed in the Detailed Plan (USBR 2012b). However, USBR did not evaluate the suitability of the existing timber bridge to house this 24-inch pipeline during the development of the Detailed Plan.
Option 3 would also require that the pipeline crosses Fall Creek. The existing Fall Creek culvert under the Daggett Road has very little cover; therefore, placing the pipeline crossing above the culvert within the road fill is not viable without significant regrade of Daggett Road. Installing the new pipeline below the existing culvert using either a trenchless construction approach or open-cut construction approach is possible. Figures 7.5-2(C) and 7.5-3(C) show the proposed alignment and profile for Option 3, respectively
Option 3 includes an approximate 300-foot-long aerial portion and an approximate 3,600-foot-long realigned buried pipe, and it will be installed using open-cut construction approach, including Fall Creek crossing. Option 3 adds significant length to the relocated pipeline alignment. KRRC will provide either a new bridge or temporary bridge at Daggett Road due to structural deficiency for construction access, and the new bridge design and construction could incorporate this new pipeline option in the design.
Connections to Existing Pipeline
In all three options, KRRC’s or City of Yreka’s contractor would connect the new pipeline to the existing buried pipeline at each end of the river crossing. The design may replace adequate additional length along the existing pipeline with welded steel pipe to provide sufficient length of restrained piping to resist any thrust forces arising from the bends. The contractor could install valves at each end to divert water from the old to the new pipe crossings. Making final connections and installing valves on the new pipe crossing would

Definite Plan
June 2018 07 | Other Project Components 259
involve a short water delivery outage. After completion of the new pipe crossing, the City of Yreka will operate the valves to divert flow from the old to the new pipe. The contractor may remove the old pipeline after reservoir drawdown.
Permissible Water Delivery Outage
A short water delivery outage will be required to make the final connections following construction of any of the new pipe crossings. Based on preliminary discussions with City of Yreka (Taylor, R., Personal Communications, August 15, 2017), the permissible outage period will be planned and limited to 12 hours and should preferably occur during the winter to avoid a disruption to the City of Yreka water supply. KRRC or City of Yreka will base the permissible outage period on the available storage capacity for Yreka, which should be able to meet demand for up to 60 hours in the winter and 18 hours in the summer, and up to an additional 27 hours with implementation of water rationing in the summer.
7.5.2 Water Supply Intake
Existing Conditions
The City of Yreka’s water supply system diverts water from Fall Creek, a tributary to the Klamath River. The primary diversion, called Dam A, is located just downstream from the PacifiCorp Fall Creek powerhouse on a bypass reach from Fall Creek and consists of a low concrete dam with spillway notch and sluice gate. The dam provides head for diversion to a 24-inch-diameter supply pipe through a concrete headworks structure. The headworks structure has four 3-foot-wide bays. Removable fish screen panels screen up to three bays of the intake. Subsequent to the preparation of the Detailed Plan (USBR 2012b), the City of Yreka appears to have made some fish screen modifications, but their compliance to current regulatory agency screen criteria for anadromous fish needs to be determined. The bays at the headworks structure connect into a common channel leading to the gated supply pipeline. The City’s water right and diversion capacity at the site is 15 cfs.
City of Yreka uses a secondary diversion point on Fall Creek whenever the power plant is shut down. This diversion, called Dam B, supplies water through a pipeline to bay 4 within the headworks structure at Dam A. A manually-operated slide gate is opened at Dam B to discharge water through the Dam B trash-racked intake and into the pipeline. A bulkhead is opened in bay 4 at Dam A so that water can flow into the dam forebay, then through the Dam A fish screens to the City of Yreka water supply pipeline. Electric power is not currently provided to Dam B.
Proposed Modifications
Either KRRC or the City of Yreka will design the fish screen modifications, and either entity will construct the modifications, but KRRC will provide the funding.
The existing screens for the water supply intakes at Dam A need to be evaluated to confirm that the current regulatory agency screen criteria from NMFS, USFWS, and CDFW, for anadromous fish are met. If the
Definite Plan
260 07 | Other Project Components June 2018
existing fish screens are non-compliant, they will need to be updated. Dam B does not have a fish screen and is located about 100 feet downstream of the Fall Creek falls which are not passable by salmonids. Dam A is located in an artificially created bypass reach serving the powerhouse. Both streams feeding Dams A and B have little to no salmonid habitat. Ideally, both locations should be blocked to prevent anadromous fish migration into either of these reaches that contain limited viable habitat for redds or juveniles. If anadromous screens are required, the concepts presented in the Detailed Plan (USBR 2012b) for each intake will be used as described below.
The replacement fish screen at each dam location will consist of a cylindrical Tee screen having a diameter of 30 inches and a length of 128 inches. Each Tee screen will be sized for a design flow of 15 cfs. To meet the screen criteria, the Tee screen will provide an approach velocity not greater than 0.33 fps, and the screening cylinder at each end of the Tee will use stainless steel wedge or profile wire screen surfaces with 1.75-mm slot openings. Water flows through the screen cylinders, into the common screen header, and then into the intake bay. For cleaning, the cylinders rotate on their horizontal axis and are powered by internal geared propeller drives turned by water moving through the screen. Internal and external brushes remove trash from the screen surfaces as they rotate. The Tee screen is mounted onto a track frame and can be raised out of the water for maintenance and inspection using a battery-powered winch. During maintenance, a slide gate can be closed to stop flow from entering the intake or the flow can pass through the open slide gate and trash rack built into the screen track frame.
At Dam A, the contractor will remove the existing upstream slide gates/weirs and fish screen panels and seal bays 1, 2, and 4 by three steel bulkheads. The Tee screen will discharge through bay 3. The contractor will add a manually-operated 30- by 42-inch slide gate between bays 3 and 4 and opened when Dam B is used for diversions.
To install the Tee screen system for Dam A, the contractor will remove a small concrete deck over bay 3. KRRC assumes that all construction work at Dam A will be accomplished without the need for cofferdams. To accommodate the raising and lowering of the Tee screen, a new building enclosure will be required at Dam A with a roll-up door over the Tee screen. The contractor will demolish and replace the existing wood-frame building with a new 12- by 16-foot wood-frame building. The new building will have a second roll-up door on the opposite wall, similar to the existing building.
At Dam B, the contractor will modify the existing trash-racked intake to accommodate the cylindrical Tee screen system. The contractor will remove the existing trash racks and seal the bay with a steel bulkhead. The contractor will add an additional intake bay at the upstream end and cut a 2-footsquare opening through the upstream wall of the existing intake connecting the two bays. KRRC assumes that a cofferdam will be required in the stream at Dam B during construction, and that access improvements to the site will be required. The contractor will install the Tee screen and a 12-foot-long mounting track/frame at the new intake bay. The Tee screen would only be lowered into position when operation of the Dam B supply pipeline is required. A new fish screen at Dam B will require a new power line and drop connection.

Definite Plan
June 2018 07 | Other Project Components 261
7.6 Recreation Facilities Removal & Draft Plan This section describes the proposed recreation facilities removal and the Draft Recreation Plan, which the KRRC will finalize in 2019 as part of the Project. PacifiCorp currently provides recreation facilities at J.C. Boyle Reservoir, Copco Lake, and Iron Gate Reservoir. There are no recreation facilities associated with Copco No. 2 Dam. The following descriptions are based on the information presented in the Detailed Plan (USBR 2012b) and are not anticipated to change significantly through detailed design. Confirmation of facility features and removal components will occur during the Project detailed design phase.
The Project includes the transfer of approximately 8,000 acres of real property located in Klamath County, Oregon and Siskiyou County, California to the respective states (or to a state designated third-party transferee) for public interest purposes such as fish and wildlife habitat restoration and enhancement, public education, and public recreational access. KRRC will accomplish these property transfers in accordance with the procedures set forth in Section 7.6.4 of the KHSA.
7.6.1 J.C. Boyle Reservoir Developed recreation sites at J.C. Boyle Reservoir include campgrounds, day use areas, and boat launches (Figure 5.1-1(C)). The J.C. Boyle development also includes Spring Island boat access downstream of J.C. Boyle powerhouse (managed by BLM). The key elements of these recreation sites are summarized below, including a description of the recreation facilities available at these developed sites, and proposed removal requirements. Estimated annual use for 2014 was 15,500 recreation days for daytime visits and 1,700 recreation days for nighttime visits. Developed public recreation sites discussed in this section include the following:
• Pioneer Park (East and West units)
• Topsy Campground
• Spring Island River Access
Pioneer Park
Owned and managed by PacifiCorp, Pioneer Park consists of two separate day use areas on the western and eastern shoreline of J.C. Boyle Reservoir. Both sites have access from SR 66 and are located on each side (west and east) of the SR 66 Bridge over a narrow point of the reservoir.
Pioneer Park West has 12 picnic tables and 12 fire rings with grills. There are two portable toilets (one ADA-accessible), one trash receptacle, one trash dumpster, and informational signs at the site. The shoreline is used for fishing and an unimproved boat ramp is used primarily to launch car-top boats. The main access road into Pioneer Park West is 200 feet long and paved, but the undefined parking area is gravel and dirt and can accommodate approximately 25 vehicles without trailers.
Pioneer Park East has three interpretive signs with information regarding the Applegate Trail. The site had a concrete boat launch before the SR 66 bridge was replaced in 2005 by the Oregon Department of

Definite Plan
262 07 | Other Project Components June 2018
Transportation (ODOT). A large stretch of gravel along the shoreline provides car-top boat launching and shoreline fishing opportunities. The access road to Pioneer Park East and the parking area are gravel. While undefined, the parking area can accommodate approximately 40 vehicles without trailers or 15 to 20 vehicles with trailers.
KRRC will remove all features, and the access roads and parking areas will regrade, seed, and plant the approximate 4.5-acre affected area as described in Section 6.2.
Topsy Campground
Owned and managed by BLM, Topsy Campground (or Recreation Site) is located on the southeastern shoreline of J.C. Boyle Reservoir and can be accessed via the Topsy Grade Road off of SR 66. The site consists of a campground, small day use area, and a boat launch. All roads within the campground are asphalt. User fees are collected by BLM at the site.
Topsy Campground has approximately 15 campsites, all of which have some degree of ADA-accessibility. All but two of the campsites have tent pads. Additionally, there are restroom facilities, an RV dump station, five water faucets, two drinking fountains, 14 trash receptacles, and one trash dumpster associated with the campground. These facilities are also shared by the day use and boat launch areas at the site. The small day use area provides two sites with a picnic table and grill, one of which is an ADA-accessible site. The boat launch has two concrete lanes, a concrete abutment, and a floating dock. There is also an ADA-accessible fishing pier with two benches. A paved parking area near the boat launch can accommodate three vehicles with trailers for day use parking.
KRRC will remove the boat launch, floating dock, and fishing pier, including approximately 68 cubic yards of concrete, and will regrade, seed, and plant the approximate 0.5-acre affected area as described in Section 6.2. BLM will retain the remainder of the campground for public use.
Spring Island River Access
Spring Island River Access is a Special Recreation Management Area owned and managed by BLM-Klamath Falls Field Office. It is a small riverside recreation day-use site located approximately 0.3 miles downstream of J.C. Boyle powerhouse at the upstream terminus of the Upper Klamath Wild and Scenic River section. The site has informational signage, paved parking and carry down boat launch, picnic tables, and vault toilets. It is the primary staging area for the Upper Klamath whitewater boating trip, a popular and well-known destination activity. It serves as a portal to the Upper Klamath WSR corridor, and is also used by visitors for fishing, wildlife viewing, and picnicking.
This site will be retained for public use.

Definite Plan
June 2018 07 | Other Project Components 263
7.6.2 Copco Lake
Developed recreation sites at Copco Lake include camping areas, day use areas, and boat launches (Figure 5.5-1(C)). The key elements of these recreation sites are summarized below, including a description of the recreation facilities available at these developed sites, and proposed removal requirements. Estimated annual use for 2014 was 3,300 recreation days for daytime visits and 0 recreation days for nighttime visits. Developed public recreation sites discussed in this section include the following:
• Mallard Cove
• Copco Cove
Mallard Cove
Located on the south shore of Copco Lake, off Ager-Beswick Road at Keaton Cove, Mallard Cove is owned and managed by PacifiCorp. The site consists of a day use/picnic area and a boat launch. While not an official campground, this site is also used for camping. The naturally wooded site has 8 wood-plank picnic tables, 12 cooking grills, and seven concrete fire rings or foundations. There is a toilet building with two vault toilets and two trash receptacles at the site. The boat launch has a 100-foot-long, 25-footwide single-lane concrete ramp. The site also has a 25-foot-long, 5-foot-wide dock made of composite decking and poly floats, with concrete abutment, located adjacent to the boat ramp, and a 20-foot-long, 5-foot-wide gangway with aluminum frame and pipe railing. There are six informational signs with concrete bases at the site. The access road and parking area are gravel. The parking area, while undefined, has eight concrete wheel-stops and parking for approximately 25 vehicles.
KRRC will remove all features, including approximately 106 cubic yards of concrete, and will regrade, seed, and plant the approximate 2.5-acre affected area as described in Section 6.2.
Copco Cove
Owned and managed by PacifiCorp, Copco Cove is located on the western shoreline of Copco Lake, off Copco Road. The site has a picnic area and a boat launch. While not an official campground, this site is also used for camping. The picnic area is naturally wooded and has two wood-plank picnic tables with one user-defined fire ring at each. The site has one portable toilet and one trash receptacle. The boat launch has an 80–foot-long, 25–foot-wide single-lane concrete ramp. While the boat ramp is in good condition, the approach is steep and maintaining a proper turning radius is difficult when there are other vehicles parked at the site. There is also a 14-foot-long, 5-foot-wide concrete boat dock adjacent to the boat ramp, with pipe railing. There are six informational signs with concrete bases at the site. The access road and parking area are gravel. There are approximately five spaces for vehicles in the undefined parking area.
KRRC will remove all features, including approximately 84 cubic yards of concrete, and will regrade, seed, and plant the approximate 2.3-acre affected area as described in Section 6.2.

Definite Plan
264 07 | Other Project Components June 2018
7.6.3 Iron Gate Reservoir
Developed recreation sites at Iron Gate Reservoir include campgrounds, day use areas, and boat launches (Figure 5.5-1(C)). The key elements of these recreation sites are summarized below, including a description of the recreation facilities available at these developed sites, and proposed removal requirements. Estimated annual use for 2014 was 8,300 recreation days for daytime visits and 3,600 recreation days for nighttime visits. Developed public recreation sites discussed in this subsection include the following:
• Fall Creek (including Fall Creek Trail)
• Jenny Creek
• Wanaka Springs
• Camp Creek (including Dutch or Scotch Creek)
• Juniper Point
• Mirror Cove
• Overlook Point
• Long Gulch
• Iron Gate Fish Hatchery Public Use Areas
Fall Creek
Owned and managed by PacifiCorp, Fall Creek is located on the far northeast shore of Iron Gate Reservoir. The site is primarily a day use area, although some camping does occur. The site has two picnic tables, two cooking grills, two fire rings, and one user-defined fire ring. There is also one trash receptacle, an older single-vault toilet building (closed in 2002), and one portable toilet at the site. User-defined trails provide access to shoreline fishing opportunities. Parking at this site is undefined and generally occurs along the interior gravel road. Approximately eight vehicles could be accommodated at this site. A graveled boat launch is also provided. Large pine trees provide shade.
The recreation site at Fall Creek is located near the river channel and could be removed and restored or could be retained following the removal of Iron Gate Dam. A separate portion of the site is near the Fall Creek fish hatchery and provides access to the Fall Creek Trail, where visitors can hike up to Fall Creek Falls. The ultimate disposition of this facility is uncertain.
Jenny Creek
Located between Copco Road and Jenny Creek on the northern shoreline of Iron Gate Reservoir, Jenny Creek is owned and managed by PacifiCorp. The site provides primitive day use and camping opportunities. The site has six day-use/campsites, four of which are separated by boulders at the southern end of the parking area, while the remaining two are located along the shoreline of Jenny Creek. There are four steel frame/wood plank picnic tables and four user-defined fire rings at the site. Additionally, the site has two trash receptacles, a storage building, and a single-vault toilet building with a 25-foot-long wooden privacy screen. Several user-defined trails provide shoreline fishing access to Jenny Creek. There are two

Definite Plan
June 2018 07 | Other Project Components 265
informational signs with concrete bases at the site. The gravel parking area can accommodate approximately 20 vehicles.
There is also a large gravel parking area across from this site, on the shoreline of the reservoir that is used for shoreline fishing access. This parking area can accommodate about 12 vehicles, but is not considered to be part of the Jenny Creek recreation site.
The recreation site at Jenny Creek with adjoining parking area could be removed and restored or could be retained following the removal of Iron Gate Dam, as it provides a creekside setting for picnicking and bank fishing. However, the ultimate disposition of this facility is uncertain.
Wanaka Springs
Located on the north shore of Iron Gate Reservoir, Wanaka Springs is owned and managed by PacifiCorp. The naturally wooded site is used for day use and camping and consists of a small upper use area and a larger lower use area. The upper use area can be accessed by vehicle via a gravel road through the lower use area and has two wood-plank picnic tables, a concrete fire ring, a trash receptacle, and provides parking for about two vehicles. The lower use area has a large gravel parking area that can accommodate approximately 16 vehicles, three wood-plank picnic tables and one concrete picnic table, two concrete fire rings, a trash receptacle, two single-vault toilet buildings, and a portable toilet. A dirt pedestrian trail connects the upper and lower use areas and provides access to the vault toilets. Additionally, a dirt pedestrian trail provides access to a 25-foot-long, 5-foot-wide wooden dock with concrete pier and pipe railing, 15-foot-long gangplank, and a concrete walkway on the reservoir shoreline. There are three informational signs with concrete bases at the site.
KRRC will remove all features, including approximately 28 cubic yards of concrete, and will regrade, seed, and plant the approximate 4.5-acre affected area as described in Section 6.2.
Camp Creek
Camp Creek is located on Copco Road along the northern shoreline of Iron Gate Reservoir and is owned and managed by PacifiCorp. The site accommodates camping, day uses, and boat launching and is generally split into three use areas. The first use area is located on the shoreline and consists of developed campsites and a boat launch. The second use area is located across Copco Road from the first use area and is used as a day use area and for overflow camping and parking. The third use area is located on the shoreline to the northwest of the first use area and provides for day use activities, including ADA access to the shoreline, as well as overnight camping. There are seven informational signs with concrete bases at this site.
The first use area at Camp Creek has about 12 developed campsites each with a concrete picnic table, concrete fire ring, and a parking space. Three-foot boulders separate the campsites. There are two water faucets, a 10- by 16-foot concrete block well house, and six trash receptacles at this use area. There is also a boat launch with an 80-foot-long, 25-foot-wide single-lane concrete ramp, and a wooden walkway leading to a 25-footlong, 4-foot-wide boat dock with concrete abutment and piers, next to the boat ramp. The interior

Definite Plan
266 07 | Other Project Components June 2018
access road is used for parking and can accommodate approximately six to eight vehicles. Additionally, there are two 20-foot-long, 5-foot-wide floating boat docks with composite decking and aluminum frames located to the north and south (on an existing jetty) of the boat launch, each with a 20-foot-long, 5-foot-wide gangplank with composite decking and aluminum frame rails. Each of these boat docks provides shoreline fishing opportunities.
The second use area at Camp Creek is located directly across Copco Road from the first use area. The site has three concrete picnic tables and two steel frame/wood plank picnic tables with concrete foundations, two timber shelters for shade, one concrete fire ring, and at least five user-defined fire rings. An RV dump station with estimated 2,000-gallon buried concrete tank, a 10- by 16-foot wood-frame double toilet building, a portable toilet, a trash receptacle, and a water faucet are located in this area and are shared facilities with the other use areas at Camp Creek. Overflow camping occurs at this site when the developed campsites in the first use area are full. Additionally, a large grassy area provides overflow parking for the first use area. There is space for approximately 60 vehicles in the overflow parking area. There is an interpretive display at this use area that provides a brief discussion of the Wilkes Expedition that stopped at this site in 1841.
The third use area at Camp Creek is located along the reservoir shoreline to the northwest of the first use area, and has been referred to as the “Scotch Creek” or “Dutch Creek” site. This area is small and has one steel pipe/wood plank picnic table and a concrete fire ring. There is a 50-foot-long, 4-foot-wide ADA-accessible concrete fishing pier with pipe railing, and a boat ramp for launching car-top boats at this use area. This site often receives use as a single campsite and is occasionally used as a group campsite.
KRRC will remove all features, including electric power lines on three poles and approximately 110 cubic yards of concrete, and will regrade, seed, and plant the approximate 4.5-acre affected area as described in Section 6.2. Additional earthwork includes the removal or regrading of an estimated 180-foot-long, 16-foot-wide, and 8-foot-high earth jetty, and the burial of approximately 75 boulders.
Juniper Point
Located on the northwestern shoreline of Iron Gate Reservoir, Juniper Point is owned and managed by PacifiCorp and provides approximately nine semi-primitive campsites. The camping area has eight steel frame/wood plank and wooden picnic tables, one concrete picnic table, fifteen concrete fire rings and foundations, two 4- by 4-foot concrete single-vault toilets (located across Copco Road from this site), and two trash receptacles. There is also an I-shaped boat dock at this site for shoreline fishing opportunities, which consists of a 25-foot-long concrete abutment, a 50-foot-long composite dock with poly floats and pipe railing, and a 20-foot-long composite gangplank with pipe railing. There are four informational signs with concrete bases at the site. The gravel access road into this site is very steep.
KRRC will remove all features, including approximately 19 cubic yards of concrete, and will regrade, seed, and plant the approximate 2.5-acre affected area as described in Section 6.2. Additional earthwork will include the removal or burial of approximately 50 boulders.

Definite Plan
June 2018 07 | Other Project Components 267
Mirror Cove
Mirror Cove, owned and managed by PacifiCorp, is located on the western shoreline of Iron Gate Reservoir. The site has a camping area and a boat launch. The camping area has ten campsites, with 12 concrete fire rings and eight picnic tables, accessible by gravel road. This site has one 10- by 16-foot vault toilet building with concrete steps located across Copco Road, a portable toilet in the parking area, and four trash receptacles. The boat launch at Mirror Cove has an 80-foot-long, 25-foot-wide concrete ramp with two lanes. Two 30-foot-long, 5-foot-wide composite gangplanks with aluminum frames and pipe railing lead to a 30-foot-long concrete boat dock and abutment with pipe railing adjacent to the boat ramp. There are seven informational signs with concrete bases at the site. The gravel parking area at this site can accommodate approximately 20 vehicles.
KRRC will remove all features, including approximately 89 cubic yards of concrete, and will regrade, seed, and plant the approximate 3.0-acre affected area as described in Section 6.2. Additional earthwork will include the removal or burial of approximately 120 boulders.
Overlook Point
Overlook Point, owned and managed by PacifiCorp, is located on the western shoreline of Iron Gate Reservoir. The site has one concrete picnic table and one steel frame/wood plank picnic table. There are also one portable toilet and two trash receptacles at this site. An 800foot-long, steep gravel road provides access to the site. Parking at this site is undefined, but can generally accommodate approximately six vehicles.
KRRC will remove all features, and will regrade, seed, and plant the approximate 2.0-acre affected area as described in Section 6.2.
Long Gulch
Long Gulch, owned and managed by PacifiCorp, is located on the southern shoreline of Iron Gate Reservoir. The site has a picnic area that is occasionally used for camping and a boat launch. The picnic area has two steel frame/wood plank picnic tables and two user-defined fire rings. The boat launch has an 80-foot-long, 25-foot-wide two-lane concrete ramp. The site has one portable toilet and two trash receptacles. The undefined gravel parking area at this site can accommodate approximately 16 vehicles.
KRRC will remove all features, including approximately 25 cubic yards of concrete, and will regrade, seed, and plant the approximate 1.0-acre affected area as described in Section 6.2.
Iron Gate Hatchery Public Use Areas
The Iron Gate fish hatchery is located downstream of Iron Gate Dam and is owned by PacifiCorp and operated by CDFW, with PacifiCorp currently providing funding for 100 percent of the fish hatchery's annual operating expenses. A public day use area is provided adjacent to the fish hatchery and an undeveloped boat launch is located across the river from the hatchery. Fishing is prohibited in this area and to 3,500 feet

Definite Plan
268 07 | Other Project Components June 2018
downstream of the dam. The day use area has a covered picnic shelter, six picnic tables, three trash receptacles, a small visitor center/interpretive kiosk (providing information on dam construction, salmon, and regional wildlife), two flush toilets in restrooms, and an ADA-accessible trail to the river shoreline (near Bogus Creek). A gravel parking area provides spaces for approximately 20 vehicles. The undeveloped boat launch is used primarily to launch car-top boats (hand launch); however, the launch does receive some boat trailer use. The gravel shoulder along Copco Road provides undefined parking for the boat launch.
KRRC will not remove these recreation facilities.
7.6.4 Dispersed Recreation Sites in the Study Area
In addition to the developed recreation facilities in the study area, the undeveloped reservoir shorelines provide numerous dispersed recreational use opportunities, both for land-based and water-based activities. Many visitors and local residents use the reservoir shorelines for dispersed activities such as boating, fishing, swimming, sunbathing, and camping. Twenty-seven dispersed recreation sites or use areas on or adjacent to the reservoir or river shorelines were identified during a field inventory conducted in 2004. The majority (17) of dispersed sites were identified at J.C. Boyle Reservoir, while two were located at Copco Lake, and four were located at Iron Gate Reservoir. Many of the identified dispersed sites are located along roads on or near the reservoir shoreline, and appear to have been used for camping and day use activities, although camping is specifically prohibited at a few of the sites. Fires are limited seasonally at most dispersed sites in the study area. These sites do not have developed facilities such as picnic tables, grills, or boat launches. KRRC will not disturb or modify the dispersed recreational sites.
7.6.5 Draft Recreation Plan
The Draft Recreation Plan provided in Appendix Q identifies the types of recreation opportunities and facilities consistent with pre-hydropower development conditions that KRRC will develop to achieve the goals of the plan. The Draft Recreation Plan also describes the process envisioned by KRRC to evaluate these opportunities and identify the proposed facilities that will ultimately be recommended for implementation in the Final Recreation Plan.
Based on the anticipated removal of reservoir recreation sites and reduced whitewater rafting use under the Project, KRRC has identified the need to implement, in the Klamath River Basin, recreation facility upgrades and/or new facility developments to provide, at minimum, the types of facilities that are proposed in this Draft Recreation Plan. KRRC configured these proposed opportunities to offset the anticipated effects on recreation access associated with dam and associated reservoir removal.
Proposed Recreation Facilities
KRRC has identified two types of recreation access facilities that if developed will offset recreation access that will be eliminated by implementation of the Project – whitewater boat put-in/take-out sites and fishing access sites. KRRC also intends to collect input from stakeholders on new recreation opportunities beyond the new and upgraded access sites identified in this draft plan.

Definite Plan
June 2018 07 | Other Project Components 269
KRRC will develop these river access sites for whitewater boating to include at a minimum:
• An area near or along the adjacent roadway for the parking of trucks with trailers used to transport whitewater rafts, large passenger vans and buses for transporting commercial whitewater rafters,
• If necessary, an access road between any new parking areas and the adjacent existing roadway, and
• If necessary, developed paths from the area designated for parking to the river edge wide enough to support the portage of rafts.
KRRC will develop these river access sites for fishing to include at a minimum:
• An area near or on a road shoulder for the parking of personal vehicles,
• If necessary, an access road between any new parking areas and the adjacent existing roadway, and
• If necessary, developed trails from the area designated for parking to the river edge.
KRRC intends to continue to collect input on other recreation facilities in the Klamath River Basin from stakeholders that could be developed in addition to or potentially in place of the facilities identified for implementation in this draft plan to offset impacts on reservoir recreation and whitewater recreation access in the Hell’s Corner Reach associated with implementation of the Project.
7.7 Downstream Flood Control Improvements This section describes KRRC’s proposed flood control improvements.
7.7.1 Habitable Structures
USBR developed a preliminary 100-year floodplain map from Iron Gate Dam to Happy Camp for both the current conditions (i.e. existing conditions with dams) and for the with-project conditions (i.e. altered conditions without dams). USBR calculated reach-averaged changes in water surface elevation (WSE) and depth between the with-project conditions and current conditions as indicated in Table 7.7-1 below, based on estimates of sediment deposition.
KRRC has categorized structures in the affected area below Iron Gate Dam as follows:
1. Within the preliminary 100-year floodplain for current conditions with dams, as determined by USBR 2. Within the preliminary altered 100-year floodplain without dams, as determined by USBR
The structures and their appropriate categories were field checked and some of the structures were re-classified. KRRC only categorized the structures in the reaches between Iron Gate Dam (RM 193.1) and Humbug Creek (RM 174.0). This is because the tributaries below Iron Gate increasingly dominate the flood

Definite Plan
270 07 | Other Project Components June 2018
discharges as one travels downstream from Iron Gate, and the impact of dam removal on the 100-year flood is less than 0.5 foot23 below Humbug Creek.
Table 7.7-1 Changes in River Stage with Dam Removal
River Reach Average WSE Change (feet)
Iron Gate to Bogus Creek 1.65 Bogus Creek to Willow Creek 1.51 Willow Creek to Cottonwood Creek 0.90 Cottonwood Creek to Shasta River 0.72
Shasta River to Humbug Creek 0.58 Humbug Creek to Beaver Creek 0.45 Beaver Creek to Dona Creek 0.41 Dona Creek to Horse Creek 0.43 Horse Creek to Scott River 0.36
Scott River to Indian Creek 0.28 Indian Creek to Elk Creek 0.32 Elk Creek to Clear Creek 0.34
A total of 34 habitable structures are located within the preliminary 100-year floodplain for current conditions between Iron Gate Dam and Humbug Creek.24 These 34 structures will be subject to an increased risk of flooding following dam removal when compared to existing flood elevations. An estimated 2 additional habitable structures would be subject to flooding during a 100-year event following dam removal when compared to the existing floodplain (see Figure 7.7-1). A total of 36 habitable structures would be located within the preliminary altered 100-year floodplain between Iron Gate Dam and Humbug Creek following dam removal. KRRC will work with the owners of these structures to move or elevate legally established structures, where feasible. FEMA will make the final determination of the future 100-year floodplain after dam removal, and the KRRC is coordinating with FEMA to initiate the map revision process.
Figure 7.7-1 Structures in 100-Year Floodplain Following Dam Removal (Appendix C)
7.7.2 River Crossings An estimated three river crossings in the downstream reach between Iron Gate Dam and Humbug Creek could also be affected by the increase in flood depths: two pedestrian bridges and the Central Oregon and Pacific Railroad Bridge. Both pedestrian bridges are below the existing 100-year flood elevation, and there is
23 FEMA, the agency that will determine the future floodplain extent, does not recognize changes in flood elevations less than 1 foot. Utilizing a 6-inch change in flood elevation is a conservative approach to determining which structures are affected. 24 Note that the current FEMA mapped floodplain Zone A (effective 1/19/2011) is different from the floodplain modeled by Reclamation because the FEMA mapping was not prepared based on a detailed hydraulic study of the river.

Definite Plan
June 2018 07 | Other Project Components 271
a potential increase in scour depth at the railroad bridge. Pedestrian Bridge #1 is dilapidated and is not structurally safe. Pedestrian Bridge #2 and the railroad bridge are in good condition. KRRC proposes to remove Pedestrian Bridge #1, with the owners’ permission. KRRC proposes to consult with the owner of Pedestrian Bridge #2 during the detailed design phase to determine whether this bridge should be removed or replaced, at KRRC’s expense. KRRC proposes to perform more analysis to confirm the effects of scour on the railroad bridge. The following sections provide additional information on these proposals.
Pedestrian Bridge #1
Pedestrian Bridge #1 spans the Klamath River just upstream of the confluence with Cedar Gulch. The bridge is a cable suspension structure of unknown origin, with no connection to any approach roads. The bridge is in very poor condition. The bottom chord of the bridge is not high enough to pass neither the existing nor the anticipated 100-year flood following the removal of the dams. KRRC proposes to remove Pedestrian Bridge #1, with the owner’s permission.
Figure 7.7-2 Pedestrian Bridge #1

Definite Plan
272 07 | Other Project Components June 2018
Pedestrian Bridge #2
Pedestrian Bridge #2 is a cable suspension bridge that spans the Klamath River next to the Klamath River County Estates (KRCE). The structure is on the KRCE Campground private property on the north bank of the river. KRRC understands the structure was built by the previous owners of the campground and is maintained by the campground. The structure is in good condition and appears to be well maintained.
The bottom chord of the bridge is not high enough to pass the existing 100 year flood with any freeboard or the anticipated 100 year flood after the removal of the dams. KRRC will evaluate the structure during the detailed design phase. KRRC proposes to consult with the owner of Pedestrian Bridge #2 during the detailed design phase to determine whether this bridge should be removed or replaced, at KRRC’s expense.
Figure 7.7-3 Pedestrian Bridge #2
Central Oregon and Pacific Railroad (CORP) Bridge
The CORP Railroad Bridge is a 7-span ballasted concrete bridge that spans the Klamath River between the Ager Road Bridge and Cottonwood Creek. The structure is supported on stone masonry seat type abutments and the bents are composed of steel H-pile extensions with reinforced concrete caps. No information is available regarding foundation type.

Definite Plan
June 2018 07 | Other Project Components 273
The Detailed Plan estimated the Project will result in approximately 1.2 feet of scour at the bridge. KRRC anticipates this is unlikely to affect the structural integrity of the bridge; however, KRRC will perform a more detailed assessment at detailed design to confirm this, and KRRC will make any needed improvements.
Figure 7.7-4 Rail Road Bridge
7.8 Fish Hatchery Plan The existing Iron Gate fish hatchery (IGH) facilities are part of the Lower Klamath Project, and is operated by CDFW. KRRC proposes modifications or improvements to infrastructure and operation to the IGH facility as part of the hatchery plan for the Project. KRRC’s obligations with respect to IGH and Fall Creek Hatchery (FCH), and those of PacifiCorp and other parties to the KHSA, are summarized as follows:
• The IGH facilities shall be transferred to the State of California at the time of transfer to the DRE of the Iron Gate Hydro Development or such other time agreed by the Parties, and thereafter operated by the CDFW with funding from PacifiCorp.
• PacifiCorp will fund 100 percent of hatchery operations and maintenance necessary to fulfill annual mitigation goals developed by the CDFW in consultation with NMFS. This includes funding the IGH

Definite Plan
274 07 | Other Project Components June 2018
facility as well as funding of other hatcheries necessary (e.g. FCH) to meet ongoing mitigation goals following facilities removal.
• Funding will be provided for hatchery operations to meet mitigation requirements and will continue for eight years following the decommissioning of Iron Gate Dam.
• PacifiCorp will fund a study to evaluate hatchery production options that do not rely on the current IGH water supply.
• Based on the study results and with the approval of the CDFW and NMFS, PacifiCorp will provide one-time funding to construct and implement the measures identified as necessary to continue to meet agency-developed mitigation production objectives for a period of eight years following the decommissioning of Iron Gate Dam.
The KHSA establishes a framework to allow for CDFW’s continued hatchery operations at a level determined by NMFS and CDFW to be sufficient for purposes of implementation of the Definite Plan. The KHSA also establishes a source of funding that is needed to achieve this objective. KRRC’s role in accomplishing these objectives is to cooperate and facilitate the transfer of the IGH (and any improvement to be made to IGH or other hatcheries necessary to meet ongoing mitigation objectives) to CDFW, and to cooperate with CDFW in its implementation of the Definite Plan so as to facilitate ongoing hatchery operations for a period of eight years following the removal of Iron Gate Dam.
7.8.1 Existing IGH Facility and Operations
IGH was constructed in 1962 to mitigate for lost anadromous salmonid spawning and rearing habitat between Copco No. 2 Dam and Iron Gate Dam. The historic mitigation goals include a release of 6,000,000 Chinook salmon (5,100,000 fingerlings and 900,000 yearlings), 75,000 Coho salmon yearlings, and 200,000 steelhead trout yearlings, annually. The Southern Oregon Northern California Coast (SONCC) Coho salmon Evolutionarily Significant Unit (ESU), which includes Coho salmon produced at IGH, is listed as threatened under the California Endangered Species Act (CESA) and the federal Endangered Species Act (ESA). A Hatchery and Genetics Management Plan (HGMP) and Section 10(a)(1)(A) Enhancement of Survival Permit was issued to the CDFW in 2014 for the IGH Coho salmon artificial propagation program (Section 10(a)(1)(A) Permit 15755). Under the HGMP, the purpose of the Coho salmon program is to aid in the conservation and recovery of the Upper Klamath Population Unit of the SONCC Coho salmon ESU by conserving genetic resources and reducing short-term extinction risks prior to future restoration of fish passage above Iron Gate Dam. Adult steelhead returns declined dramatically during the 1990’s for unknown reasons and IGH has produced no steelhead since 2012. Chinook returns continue to be variable but generally sufficient broodstock return to IGH to produce the mitigation goals.
The IGH spawning/trapping facility is located approximately ½ mile downstream of Iron Gate Dam, adjacent to the Bogus Creek tributary. The main hatchery complex includes an office, incubator building, rearing/raceway ponds, fish ladder with trap, settling ponds, visitor information center, and four employee residences (see Figure 7.8-1). The collection facility is located at Iron Gate dam and includes a fish ladder
Definite Plan
June 2018 07 | Other Project Components 275
consisting of 20 ten-foot weir-pools that terminates in a trap, a spawning building and six 30-foot circular holding ponds.
The IGH operates with a gravity fed, flow-through system that has five discharge points into the Klamath River. The IGH obtains its water supply from Iron Gate Reservoir. Two subsurface influent points at a depth of seventeen feet and seventy feet deliver water to IGH. Up to 50 cfs is diverted from the Iron Gate Reservoir to supply the 32 raceways and fish ladder.
The existing spawning facility discharges through the main ladder, and steelhead return line. An overflow line drains excess water from the aeration tower. The hatchery facility also has a discharge at the tail race that supplies the auxiliary ladder or fish discharge pipe, and two flow-through settling ponds for hatchery effluent treatment which converge to a single discharge point.
CDFW operates IGH. Per the license, PacifiCorp must fund at least 80 percent of operations and maintenance costs, but PacifiCorp currently funds 100 percent of those costs pursuant to the KHSA.
KRRC will demolish the existing fish collection facility located at the toe of Iron Gate Dam as part of the Project.
Due to the reservoir drawdown and dam removal, the existing water supply intake will become unusable, as its elevation will be above the water level post-draw down and high suspended sediment concentrations during drawdown. KRRC’s contractor will demolish the water supply intake and associated infrastructure along with the dam and hydropower developments. These existing functions will be replaced by the reopening and operation of the Fall Creek Hatchery (FCH) by CDFW and by making improvements to IGH. The cost of these improvements will be borne by PacifiCorp, to the extent of its funding obligations under the KHSA.

Definite Plan
276 07 | Other Project Components June 2018
Figure 7.8-1 Iron Gate Hatchery
7.8.2 Existing Fall Creek Hatchery
California Oregon Power Company built the FCH in 1919 as compensation for lost of spawning grounds due to the construction of Copco No. 1 Dam. Six of the original rearing ponds remain (two above Copco Road and four below the road). CDFW last used these ponds from 1979 through 2003 to raise 180,000 Chinook salmon yearlings, which they released into the Klamath River at Iron Gate Hatchery. Although the raceways remain and CDFW continues to run water through them, they have not produced fish since 2003 when CDFW moved all mitigation fish production to IGH. The facility has retained its water rights but will need substantial renovation to become operational.
7.8.3 Proposed Fish Hatchery Plan
NMFS and CDFW have determined the priorities for the proposed Fish Hatchery Plan. As a state and federally listed species in the Klamath River, coho production is the highest priority for NMFS and CDFW, followed by Chinook salmon, which support tribal, sport, and commercial fisheries. Steelhead production is the lowest priority. Due to limited available water and rearing capacity to meet Chinook yearling mitigation goals, and recent low steelhead returns, NMFS and CDFW have determined that steelhead production will be discontinued.

Definite Plan
June 2018 07 | Other Project Components 277
NMFS and CDFW have recommended and KRRC proposes a Fish Hatchery Plan a plan for hatchery operations for the 8-year period following dam removal. In order to implement this plan, IGH and FCH must be operational prior to drawdown of the Iron Gate Reservoir. The Fish Hatchery Plan will be implemented in a manner that is consistent with the North Coast Regional Water Quality Control Board (RWQCB) “Policy in Support of Restoration in the North Coast Region.” The plan also requires CDFW to employ Best Management Practices to minimize discharge at IGH and FCH during hatchery operations.
Table 7.8-1 summarizes the NMFS/CDFW goals for fish production at IGH and FCH.
Table 7.8-1 Comparison of Previous Mitigation Goals and Revised NMFS/CDFW Production Recommendation
Species/Life Stage 1960’s Mitigation Goal (at IGH)
Production Goal Post-Dam Removal
Release Dates
Coho Yearlings 75,000 75,000 at FCH March 15 – May 1
Chinook Yearlings 900,000 115,000 at FCH Oct 15 – Nov 20 Chinook Smolts 5,100,000 3,400,000 at IGH April 1 – May 31 Steelhead 200,000 0 NA
Source: NOAA Fisheries and CDFW Technical Staff Recommendation for Klamath River Hatchery Operations in California Post-Dam Removal, May 31, 2018.
Improvements at IGH
PacifiCorp will transfer IGH to CDFW with funding provided by PacifiCorp under terms of the KHSA section 7.6.6 and 7.6.6 A. CDFW will continue to operate IGH. CDFW will retain operational components of IGH. To the extent necessary to maximize use of available water supplies, CDFW will implement water use efficiency improvements such as water aeration as it enters the pond headboxes, mid-raceway water aeration and water reuse. IGH will utilize a riparian water right and divert water from Bogus Creek to operate the hatchery incubation building, two 300-foot adult holding ponds configured from two existing raceways, three 400-foot raceways, and the auxiliary fish ladder and trap. IGH will use between 3.75 to 8.75 cfs from October through May (see Table 7.8-2) to rear a targeted goal of 3.4 million Chinook smolts for release in April through May of each year. Adult Coho salmon and Chinook salmon broodstock will be collected by CDFW using the existing auxiliary ladder and held at IGH in the adult trap and holding ponds. The Chinook salmon program will use a maximum of 4,000 adult Chinook broodstock fish to meet the production goals. The Coho salmon program will use a maximum of 270 adult broodstock fish to meet the conservation goals identified in the HGMP and Section 10(a)(1)(A) Permit 15755. A new spawning facility will be constructed at PacifiCorp expense that utilizes, to the extent possible, components of the spawning facility at Iron Gate Dam.

Definite Plan
278 07 | Other Project Components June 2018
Table 7.8-2 Estimated Water Needs at IGH rearing 3.4 million Chinook smolts (cfs)
Facility Jan Feb Mar April May June July Aug Sept Oct Nov Dec Rearing Ponds
2.25 2.25 2.25 6.75 6.75 0.00 0.00 0.00 0.00 0.00 0.00 2.25
Hatchery Building
1.50 1.50 1.50 1.50 1.50 0.00 0.00 0.00 0.00 1.50 1.50 1.50
Spawning 0.00 0.00 0.00 0.00 0.00 0.00 0.00 0.00 0.00 0.50 0.50 0.50 Adult Holding & Ladder
0.00 0.00 0.00 0.00 0.00 0.00 0.00 0.00 0.00 4.50 4.50 4.50
Total 3 .75 3.75 3.75 8.25 8.25 0.00 0.00 0.00 0.00 6.50 6.50 8.75 Source: NOAA Fisheries and CDFW Technical Staff Recommendation for Klamath River Hatchery Operations in California Post-Dam Removal, May 31, 2018.
Water Needs
As shown in Table 7.8-2, the maximum amount of Bogus Creek water necessary to meet IGH needs is 8.75 cfs in December and 8.25 cfs in April and May. In April and May, the IGH hatchery incubation building requires 1.5 cfs of water for Coho egg incubation and fry rearing. The three raceways will need up to 2.25 cfs each (6.75 cfs total). The adult trap and two raceway holding ponds will need 2.25 cfs each (4.50 cfs total) during October, November, and December. Because anadromous salmonids currently use Bogus Creek as a natural spawning area, the water supply from Bogus Creek will need to be filtered and treated with ultra violet (UV) light to reduce the potential threat of disease introduction into the hatchery. Figure 7.8-2 shows the potential footprint options for the treatment system.
To reduce the potential adverse effects of diverting water from Bogus Creek on naturally produced Coho salmon, the pump station for the hatchery water supply will be constructed as far downstream towards the Klamath River confluence as practicable. This will reduce the length of Bogus Creek rearing habitat affected by water withdrawals downstream of the pump station. Figure 7.8-2 shows an envelope for the potential pump station location on Bogus Creek system.
Water availability
CDFW will operate the Bogus Creek water diversion to maintain a minimum of 50% of the instream flow in the creek at the point of diversion. Table 7.8-3 includes a summary of Bogus Creek flows based on available monitoring data from August 2013 to April 2018. This limited data set indicates that there are four months where hatchery water needs could exceed 50 percent of instream flow (October, November, April, and May). The Fish Hatchery Plan includes measures (discussed below) that will be implemented by CDFW to address these shortages, if they occur. Tables 7.8-4 through 7.8-7 further separate the first and second half of each of these four months and compare the maximum, minimum, and average Bogus Creek flows to IGH flow requirements. Cells highlighted in grey indicate time periods when flows are insufficient to meet total hatchery demand and maintain minimum (50 percent) creek flow. Flow deficient periods over the 2013- 2018 data set include:

Definite Plan
June 2018 07 | Other Project Components 279
Figure 7.8-2 Conceptual Layout of Iron Gate Hatchery Improvements

Definite Plan
280 07 | Other Project Components June 2018
• In April 2014, minimum and average Bogus Creek flows fall below the hatchery requirement for both the first and second halves of the month. In 2015 the minimum flow rate for the first half of the month falls below the hatchery requirement and the minimum and average flows fall below the requirement for the second half of the month.
• In May, minimum hatchery flows were not available in all years for the first half of the month and maximum, minimum, and average flows were insufficient in 2014 and 2015. In the second half of the May 2014, the maximum, minimum, and average creek flows are insufficient to meet hatchery requirements while maintaining 50 percent creek flow.
• In October, the first half of the month creek flows are insufficient to meet hatchery requirements for all four years and average flows do not meet the requirement in 2014 and 2016. In the second half of October, minimum and maximum flows in 2014 do not meet hatchery requirements.
• In November, the first half of the month shows that the 2013 minimum and average flows and the 2014 minimum flow did not meet hatchery requirements. In the second half of November, minimum flows were insufficient to meet hatchery requirements in 2013 and 2014.
Table 7.8-3 Observed minimum, maximum, and 4-year average flow in cfs by month in Bogus Creek from 8/8/2013 to 4/16/2018
Flow Jan Feb Mar April May June July Aug Sept Oct Nov Dec Minimum 12.14 13.90 17.35 8.23 7.20 3.57 2.19 1.77 1.78 7.40 10.96 14.89
Maximum 253.2 184.9 144.3 80.94 48.85 28.99 11.53 11.49 28.00 52.10 32.94 288.6 4-year Average
32.92 39.26 37.30 28.97 18.92 9.94 5.46 5.72 8.98 16.99 20.80 27.79
Note: Minimum and maximum values represent the absolute minimum and maximum values observed in each month. Source: NOAA Fisheries and CDFW Technical Staff Recommendation for Klamath River Hatchery Operations in California Post-Dam Removal, May 31, 2018.
Table 7.8-4 April Juvenile Rearing Water Availability and Requirements
Year 1 s t Half April 2 nd Half April IGH
Req (cfs)
Total Flow (cfs) 50% of Flow (cfs) Total Flow (cfs) 50% of Flow (cfs) Max Min Ave Max Min Ave Max Min Ave Max Min Ave
2013 NA NA NA NA NA NA NA NA 0.00 NA NA NA
8.25 2014 18.61 9.77 16.01 9.30 4.89 8.01 19.56 8.23 13.31 9.78 4.12 6.65
2015 22.53 13.64 19.42 11.27 6.82 9.71 18.58 11.31 14.80 9.29 5.65 7.40
2016 42.95 32.77 36.45 21.48 16.39 18.23 36.52 23.94 30.66 18.26 11.97 15.33
2017 80.94 42.73 49.89 40.47 21.36 24.95 51.05 37.98 45.57 25.52 18.99 22.79
Notes: 2013 to 2018 dataset begun in August 2013; Greyed cells indicate Bogus Creek flow less than IGH requirement for 50% of base flow. Source: NOAA Fisheries and CDFW Technical Staff Recommendation for Klamath River Hatchery Operations in California Post-Dam Removal, May 31, 2018.
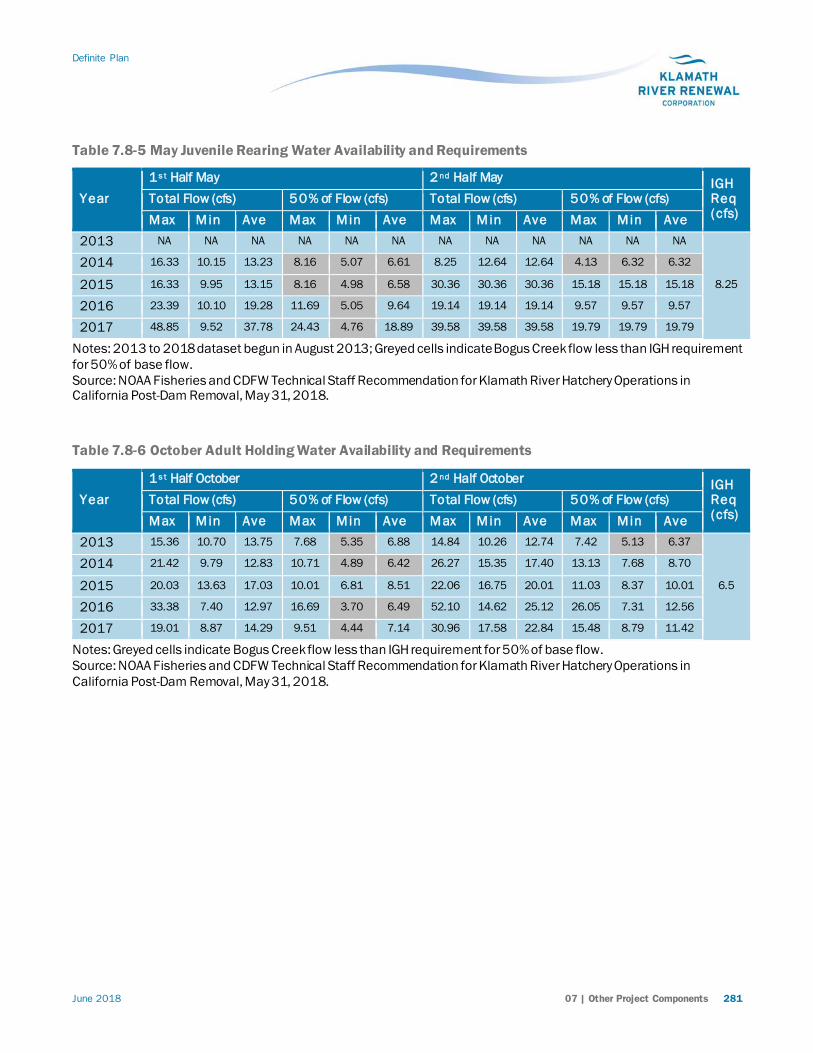
Definite Plan
June 2018 07 | Other Project Components 281
Table 7.8-5 May Juvenile Rearing Water Availability and Requirements
Year 1 s t Half May 2 nd Half May IGH
Req (cfs)
Total Flow (cfs) 50% of Flow (cfs) Total Flow (cfs) 50% of Flow (cfs) Max Min Ave Max Min Ave Max Min Ave Max Min Ave
2013 NA NA NA NA NA NA NA NA NA NA NA NA
8.25 2014 16.33 10.15 13.23 8.16 5.07 6.61 8.25 12.64 12.64 4.13 6.32 6.32
2015 16.33 9.95 13.15 8.16 4.98 6.58 30.36 30.36 30.36 15.18 15.18 15.18
2016 23.39 10.10 19.28 11.69 5.05 9.64 19.14 19.14 19.14 9.57 9.57 9.57
2017 48.85 9.52 37.78 24.43 4.76 18.89 39.58 39.58 39.58 19.79 19.79 19.79
Notes: 2013 to 2018 dataset begun in August 2013; Greyed cells indicate Bogus Creek flow less than IGH requirement for 50% of base flow. Source: NOAA Fisheries and CDFW Technical Staff Recommendation for Klamath River Hatchery Operations in California Post-Dam Removal, May 31, 2018.
Table 7.8-6 October Adult Holding Water Availability and Requirements
Year 1 s t Half October 2 nd Half October IGH
Req (cfs)
Total Flow (cfs) 50% of Flow (cfs) Total Flow (cfs) 50% of Flow (cfs) Max Min Ave Max Min Ave Max Min Ave Max Min Ave
2013 15.36 10.70 13.75 7.68 5.35 6.88 14.84 10.26 12.74 7.42 5.13 6.37
6.5 2014 21.42 9.79 12.83 10.71 4.89 6.42 26.27 15.35 17.40 13.13 7.68 8.70
2015 20.03 13.63 17.03 10.01 6.81 8.51 22.06 16.75 20.01 11.03 8.37 10.01
2016 33.38 7.40 12.97 16.69 3.70 6.49 52.10 14.62 25.12 26.05 7.31 12.56
2017 19.01 8.87 14.29 9.51 4.44 7.14 30.96 17.58 22.84 15.48 8.79 11.42
Notes: Greyed cells indicate Bogus Creek flow less than IGH requirement for 50% of base flow. Source: NOAA Fisheries and CDFW Technical Staff Recommendation for Klamath River Hatchery Operations in California Post-Dam Removal, May 31, 2018.

Definite Plan
282 07 | Other Project Components June 2018
Table 7.8-7 November Adult Holding Water Availability and Requirements
Year 1 s t Half November 2 nd Half November IGH
Req (cfs)
Total Flow (cfs) 50% of Flow (cfs) Total Flow (cfs) 50% of Flow (cfs) Max Min Ave Max Min Ave Max Min Ave Max Min Ave
2013 13.01 10.96 12.35 6.51 5.48 6.17 16.45 12.87 14.38 8.22 6.43 7.19
6.5 2014 16.89 12.75 13.87 8.44 6.38 6.94 25.50 12.72 15.23 12.75 6.36 7.62
2015 24.12 19.78 21.45 12.06 9.89 10.73 23.36 20.91 22.14 11.68 10.45 11.07
2016 28.61 28.61 28.61 14.31 14.31 14.31 28.61 28.61 28.61 14.31 14.31 14.31
2017 29.92 23.57 24.87 14.96 11.79 12.43 32.94 23.49 26.53 16.47 11.75 13.27
Notes: Greyed cells indicate Bogus Creek flow less than IGH requirement for 50% of base flow. Source: NOAA Fisheries and CDFW Technical Staff Recommendation for Klamath River Hatchery Operations in California Post-Dam Removal, May 31, 2018.
In summary, there were periods in all 5 years of Bogus Creek flow data in each of the four months where IGH flow requirements were not met if 50 percent of flow was maintained in Bogus Creek. Hatchery flows were met more often in April and November than May and October. The first halves of May and October met the hatchery requirements less often. It was not expected that the first half of May would show less availability than the second half of the month. This may be explained by the short duration of the dataset or drought conditions between 2013 and 2017 that may not represent long-term conditions. For these reasons, KRRC considers this analysis conservative and is indicative of the need for additional Bogus Creek flow data prior to dam removal and implementation of operational strategies to reduce hatchery water use during these shoulder months while maintaining hatchery production.
Water rights for water diverted from Bogus Creek are already secured as a riparian right available to the owner of the property at the time of diversion.
Shoulder Month Water Conservation Measures
As Bogus Creek flow data show, there may be times in April, May, October and November (shoulder months) where Bogus Creek provides inadequate flow for IGH while also maintaining 50 percent of base flow in the creek. If shortages occur, CDFW will implement the following measures to maintain creek flow and hatchery production objectives.
• Adult hold in October and November: As shown in Table 7.8-2, 4.5 cfs is needed for adult holding in October and November to operate two adult hold ponds. Individual adults return at different times beginning in October and lasting through December. Consequently, operating two adult hold ponds in the early return period (October to mid-November) may not be necessary in most years. During periods of low creek flow, adult salmon will be selectively collected (i.e. green spawners returned to the river, ripe spawners retained) and held in numbers/densities consistent with available flow and temperature in Bogus Creek so that a minimum of 50% of instream flow is maintained. As a guideline, if October daily average flows in Bogus Creek are less than 8.5 cfs, water will not be

Definite Plan
June 2018 07 | Other Project Components 283
diverted for adult holding. When flows reach a daily average of 8.5 cfs, one adult hold raceway would be operated at 2.25 cfs, with 1.5 cfs for the hatchery building and 0.5 cfs for spawning, for a total facility water need of 4.25 cfs. When flows reach a daily average 13 cfs or greater (second half of October in most years), two adult hold raceways could be operated (4.5 cfs) for a total facility water need of 6.5 cfs (see Table 7.8-6). CDFW will not implement these water diversion rates unless a daily average maximum water temperature trigger of 14 degrees C in Bogus Creek is met for egg incubation purposes.
• Juvenile rearing in April and May: As shown in Tables 7.8-4 and 7.8-5, 8.25 cfs is needed in April and May for juvenile rearing and Coho egg/fry production for Fall Creek. If insufficient water is available in Bogus Creek, CDFW may employ early release strategies to maintain 50 percent of the creek’s base flow. CDFW may also employ early release strategies if Bogus Creek and/or Klamath River water temperatures are above 18.3 degrees C (65 degrees F) for a prolonged period to assist with the survivability of juvenile fish. As with adult holding, CDFW will hold juvenile salmon in numbers/densities consistent with available flow and temperature in Bogus Creek. CDFW may also recirculate and reuse of a portion of the raceway tailwater to augment hatchery water supplies during low creek flow years, as further described below.
Water Aeration Needs
Since water used by IGH for post-dam removal operations will be pumped from Bogus Creek (Table 7.8-3), aeration at the head of the raceway ponds will be provided to dissipate unwanted gasses from the water supply. Aeration will off-gas the water and allow re-oxygenation. Additional mid-raceway aeration will also be needed to maintain dissolved oxygen levels near saturation.
Chinook Salmon Tagging and Marking
Application of Coded Wire Tags (CWTs) and adipose fin-clip marking will be conducted by CDFW at IGH as fish reach the minimum size for tagging (200 fish/lb). The mark and tag rate will be at the CDFW standard of 25%. CDFW anticipates tagging will occur between March and May. The existing tagging trailer is adequate to meet tagging and marking objectives for Chinook salmon.
Fish Feeding and Rearing
CDFW will feed fish a high-quality feed to optimize growth and improve health to meet a minimum marking/tagging size of 200 fish/lb on schedule. CDFW’s feed storage will be at IGH, for both IGH and FCH. IGH will continue to use the existing bulk feed bins and cool room storage.
Filtration and UV
The new facility will filter and UV disinfect water from Bogus Creek used within the rearing facilities. Anadromous salmonids bring disease and pathogens to the supply water, and water used for rearing of fish in the raceways must be filtered and UV disinfected to avoid spreading disease to the hatchery and hatchery produced fish. The hatchery building currently has a filtration and UV system in place for egg rearing. The adult holding pond, trap, and ladder will not require treatment.

Definite Plan
284 07 | Other Project Components June 2018
Specific design criteria for the treatment system are still under consideration. The filtering system will need to remove high Total Suspended Sediment (TSS) resulting from winter/spring storm events that can directly affect fish health, as well as remove low ambient TSS that can inhibit the effectiveness of the UV disinfection system. From 2008-2013, Bogus Creek exhibited average turbidity of 4.5 nephelometric turbidity units (NTU) equivalent to approximately 5- 11 mg/L TSS. On April 8, 2018, the Karuk Tribe measured Bogus Creek turbidity during a flushing flow event at Iron Gate Dam, where flow in Bogus Creek was greater than 100 cfs during a storm event. Turbidity in Bogus Creek was measured at 64 formazin nephelometric units (FNU). FNU is equivalent to NTU but uses a different method of measurement. The maximum turbidity in Bogus Creek resulting from a storm event is unknown and requires further monitoring.
To identify and evaluate the appropriate setting requirements and filtration technologies, the KRRC, NMFS, and CDFW will establish temporal TSS exposure goals for the rearing ponds and incubation that will include the 24-hour average, six-day average, 30-day average, 1-day maximum and instantaneous maximum. Exposure goals will be developed with an understanding of current IGH water quality criteria and through review of salmonid exposure to TSS in scientific literature (e.g. Newcombe and Jenson 1996; Bash, et. al.,2001). The KRRC’s goal is to identify a treatment process capable of removing TSS to a level protective of fish that is also not reliant upon settling or flocculating agents or chemicals (e.g. alum and potassium permanganate). Options include:
• Slow sand filtration
• Rapid media filtration
• Membrane or alternative filtration technology
CDFW will adopt the UV disinfection requirements from other CDFW hatcheries and will include target pathogens, levels of disinfection, UV transmittance, the need for redundancy and lamp fouling. Independent of the treatment technology used, KRRC, CDFW, and NMFS anticipate that the new equipment footprint (filtration and UV) will be entirely constructed within the footprint of the existing IGH facility.
In 2018-2019, comprehensive sampling and bench-scale testing will be conducted to characterize the particulates and settling rates of Bogus Creek storm water; and possibly pilot-scale filtration tests and UV effectiveness using Bogus Creek water.
Adult Collection and Holding
CDFW will use the existing fish ladder and auxiliary trap at IGH located south of the rearing raceways for adult trapping (See Figure 7.8-2). Extending the existing ladder into the river with a slight turn down river, may create better attraction water for the returning adults. However, this extension will occur within the approach channel to the auxiliary fish ladder and this channel has been excavated to a depth of approximately 20-feet, which could complicate the extension.
Definite Plan
June 2018 07 | Other Project Components 285
Adult fish will enter the ladder and be trapped in the adult collection area. The adult trap and hold area will consist of the existing fish ladder, adult collection pond trap and a fish-lift with a fish return line to the river. A submersible pump in the Klamath River will be added with a 1.5-inch line running to the top of the fish ladder to add Klamath River water for added attraction.
Using a mechanical crowder, fish that have entered the trap will be pushed into the fish-lift, where they will be sorted and slid into a truck for transport to the G or H adult holding raceways, depending on species. From the truck, a portable slide will be used to dump the fish from the truck into the raceways.
The adult holding ponds (ponds 1-3 of raceways G and H, see Figure 7.8-2) will have head box and head screens and provide adequate aeration with water flowing through screens and over wooden dam boards placed in double keyways every 25 feet. These existing raceway ponds will continue to have the standard grade of 0.5-foot elevation decrease over each 100-foot of pond length.
CDFW will segregate adult Chinook and Coho, with Coho in ponds 1 through 3 of raceway H and Chinook in ponds 1 through 3 of raceway G. Coho will be contained in PVC numbered tubes in pond H1, moved to G 3 and through an access door, lifted within the tubes into the spawning house. A barrier will be needed to be attached on the outside wall of H, and on the North side of center wall, and then outside wall of G ponds, possibly a 4-foot chain link fence, to keep fish from jumping out of their ponds. This also allows for use of the mechanical crowder within H ponds. Slide gates will be needed where each of the flumes enters piping under the spawning house. Screens will also be required to keep fish out of the pipes. Keyways at 25-foot intervals will be required in each of the raceways for screens and checkboards. The center wall will be cut just above each 25-foot keyway section to provide a 46-inch portal slot to move fish from G or H pond and crowded to the end of H-3 where the fish will enter the through a hinged door to the spawning house. Each portal slot will need keyways for boards, or screen, to create a barrier, plus a steel support will be needed over each portal slot to provide a sturdy surface for the mechanical crowder that rides atop the pond walls. Raceway flow should be at the established 2.25 cfs, for a total of 4.5 cfs for the two raceways. Pumped water from Bogus Creek will require an aeration tower to remove excess carbon dioxide and other gasses that may be entrained in the water during pumping. Mid-pond aerators may be required in the holding ponds if dissolved oxygen falls below required concentration. If needed, portable aerators can be acquired and used.
Spawning House
Once in the spawning building, CDFW will sort the fish by gender, mark/unmarked, jacks and sexual maturation. They will then be placed into the adult holding ponds, or if needed, returned to the river through the fish return line. The spawning house will be located over pond 4 of raceways G and H. Pond 4 flows will continue under the facility to convey flow to the tailrace; however, flow will be conveyed in pipes to eliminate the need for periodic cleaning. The new spawning house will be laid out in the same manner as the existing spawning house below the dam. It is anticipated at this time that all internal components of the existing fish trap and spawning building will be reused at the new facility at IGH as much as possible, including:
• Auxiliary trap lift
Definite Plan
286 07 | Other Project Components June 2018
• Sort apron
• Drug tank with submersible pump and UV disinfection
• Sort table
• Egg table
• Miscellaneous work table
• Storage closet
• KRP data area
• Electro-anesthesia (e-shock) tank • Rinse sink
• Water hardening tank
• 2-1/2-foot wide conveyor belt
• Access door of sufficient height and width to allow entry into the facility by a forklift.
The structure will be located on a slab spanning ponds G4 and H4. In addition to the house, the slab will include a lift for Chinook and door for the Coho tubes, a trap lift and an access ramp for a forklift or other vehicular access. The house itself will include a sorting apron, an electric anesthesia tank (e-shock tank), sort table with sides that connect to the conveyor belt, spawning table, storage area, egg rinsing and water hardening station, rinse sink for egg processing, e-shock equipment area, and flume water supply area to hold processed adults. A garage door and person-door will be provided at the front of the building for ease of access and equipment. CDFW will sort Coho prior to the e-shock tank and prevented from entering the tank. CDFW will sort Chinook after they have been anesthetized in the tank.
The auxiliary trap door will open inward so wet fish may slide down the sorting apron. Chinook, not Coho, will fall into a basket and be anesthetized in the e-shock tank. Then fish will be lifted onto the wet sorting table where some will be moved to the right for lethal research sampling and put on conveyor belt used to transport the fish out of the spawning house; others will be put onto the spawning table to be euthanized, rinsed, spawned, then put onto right side table for research sampling and then placed onto the conveyor belt out of the spawning house. This conveyor belt will extend beyond the tailrace to the driveway for storage and/or disposal.
CDFW will take egg collection pans from the spawning table to the egg processing stations where they will be rinsed, disinfected and water hardened for 1 hour. Eggs will then go directly to the hatchery building for processing.
Ponds G4 and H4, over which the spawning house will span, measure 97 feet by 10 feet; therefore, the spawning house can be as large as 20 feet wide by approximately 100 feet long. However, if the pond walls cannot support the house slab, it may have to extend beyond them. The roof line of the existing facility at the dam measures 47 feet by 24 feet. The new facility can measure slightly narrower (20 feet vs. 24 feet) and longer, if necessary. If a 24-foot width is needed, an additional 2 feet can be obtained on each side of the ponds. The driveways between the raceways are approximately 14 feet wide. If 2 feet is taken from the

Definite Plan
June 2018 07 | Other Project Components 287
driveway between raceways F and G, the remaining 12 feet should be adequate for most truck traffic. Although the width of the drive needs to accommodate the feed truck with its side extension tubes.
Coho Eggs
Based on an annual evaluation of rearing conditions, a decision will be made by CDFW and NMFS as to whether Coho salmon eggs and fry will be hatched and reared at FCH, IGH, or a portion at each facility. Coho salmon at IGH will be hatched and reared within the hatchery building existing rearing tanks until they reach a size of approximately 300 fish per pound. Coho salmon will then be transported to FCH for rearing until release.
Chinook Eggs
During the first through third years of operation post dam removal and potentially beyond, CDFW will incubate Chinook salmon eggs collected from broodstock within the IGH hatchery building. The hatchery building has an adequate filtration and UV system; however, sediment pretreatment will be needed to remove high TSS during storm events in Bogus Creek to protect the hatchery building filter from fouling. When Chinook return to Fall Creek, CDFW may collect and incubate eggs at Fall Creek to raise the approximately 140,000 Chinook yearlings at FCH. The entire smolt production (3.4 million) will occur at IGH and egg rearing for smolts will occur exclusively at IGH.
IGH Fish Releases
In general, CDFW will release Chinook salmon smolts between April 1 and May 31. However, early release of smolts prior to April 1st may occur based on water quality and quantity thresholds. Bogus Creek water reliability and quality can diminish in late spring and can exhibit very low flows in dry years that would be insufficient to operate the hatchery. In response, CDFW and NMFS have identified physical and biological parameter at IGH that would trigger early release of fish to reduce or avoid hatchery related fish mortality. These release thresholds include Bogus Creek water availability, Bogus Creek water temperatures, and threat of disease epizootics in rearing ponds. CDFW and NMFS will establish numeric trigger thresholds to determine whether CDFW will release some or all fish early (e.g. Bogus Creek 24-hour average water temperature exceeds 18 to 19 degrees C; see Figure 7.8-3). CDFW would also utilize water reuse/recirculation as described below to extend release dates when Bogus Creek flow is low, but water temperature is sufficient to recirculate in the raceways without exceeding trigger thresholds.

Definite Plan
288 07 | Other Project Components June 2018
Figure 7.8-3 Bogus Creek Continuous Water Temperature for 2015 (CDFW)
Bogus Creek Flow to IGH
NMFS and CDFW will coordinate to minimize effects of Bogus Creek diversions on Coho salmon and their critical habitat. CDFW will monitor water diversion rates from Bogus Creek to ensure at least 50% of creek flow remains in the creek at the point of diversion. However, CDFW and NMFS will evaluate Bogus Creek to assess habitat below the proposed hatchery diversion to determine the minimum amount of in-stream flow necessary to provide connectivity in Bogus Creek, and to ensure anadromous salmonid spawning and rearing habitat. CDFW and NMFS will conduct hydraulic modeling and a geomorphic assessment in conjunction with habitat assessment to site the approximately 4,000 gpm pump station. This assessment will include:
• Assessment of Bogus Creek habitat: NMFS and CDFW will examine the anadromous fish spawning and rearing habitat in Bogus Creek below the proposed diversion at various low-flow levels to determine effects to habitat of various levels of water diversion.
• Monitoring of flow and TSS: KRRC will monitor flow and develop stage discharge relationships at key transects to determine if adequate fish passage conditions are provided. Data collection will begin in the spring and summer of 2018 and will continue as natural flow conditions in the stream vary. KRRC will monitor winter storm conditions in 2018/2019 to understand TSS concentration and sediment grain size distribution to optimize a sediment removal treatment system.
• Geomorphic and hydraulic assessment: Using an open channel model like HEC-RAS will provide depth and velocity predictions to determine the ideal location for the pump station including a starting water surface elevation at the Klamath River confluence to determine any backwater effects that could occur during high flow.

Definite Plan
June 2018 07 | Other Project Components 289
• Coordination between agencies: Following the habitat assessment, NMFS and CDFW will determine the appropriate flow level or percentage of diversion permitted each month given seasonal hatchery needs and fish development.
• Adjustments to diversions: Based on the results of Bogus Creek evaluation, NMFS and CDFW may coordinate to change the percentage of flow permitted diverted from Bogus Creek to IGH so it is protective of both Bogus Creek habitat and the hatchery program.
• Reporting: NMFS and CDFW will coordinate to determine reporting specifications for Bogus Creek diversions.
Settling Pond Operations and Permitting
CDFW will use the existing settling ponds for hatchery operations and does not anticipate modifications in layout or function. The North Coast RWQCB will continue to permit IGH discharge to the Klamath River as part of the existing 13267 Order modified with the proposed modifications to the facility.
Water Reuse/Recirculation
CDFW may reuse water (recirculation) from the rearing raceways if Bogus Creek flows are insufficient to meet minimum operational needs while balancing flow requirements in the creek. Depending upon Bogus Creek water temperatures and flow, CDFW will recirculate a portion of the raceway discharge back through the raceways reducing reliance on Bogus Creek. CDFW will couple recirculation with the early release thresholds described above to extend the rearing period. Water temperatures are below 19 degrees C in May (see Figure 7.8-3), rising above 20 degrees C in June and 25 degrees C in July and hatchery staff report that water can warm approximately 2 degrees C when passed through the raceways. KRRC and CDFW will further analyze Bogus Creek water as part of the design process to understand the effectiveness of recirculation given annual variations in flow and temperature during the early release period (April 1 and May 31).
Improvements at FCH
To raise yearling Coho and Chinook salmon, the FCH facility will be upgraded by modifying plumbing to accommodate the installation of circular tanks and a UV treatment system, including primary filtration similar to the UV system used at IGH (collectively the UV system). KRRC and CDFW anticipate modifications will occur within the existing facility footprint (see Figure 7.8-4) to minimize environmental and cultural resource disturbances. The FCH UV system will treat and disinfect the egg incubation water source only. KRRC and CDFW do not propose UV treatment for rearing at this facility. CDFW will need additional space not depicted on Figure 7.8-4 for the purposes of operations (e.g. a settling basin, vehicle parking, pertinent buildings, tagging trailer, etc.); these, except for the settling basin, can be accommodated on existing developed or disturbed areas around the hatchery and powerhouse. Use of these spaces will require coordination and concurrence with PacifiCorp. Non-consumptive water diversion from Fall Creek will support hatchery operations using a combination of the existing CDFW water right on Fall Creek and riparian rights, and the water will return to the creek at the settling pond location or fish ladder, minimizing adverse effects to Fall Creek aquatic resources. To protect the quality of the City of Yreka’s water supply and prevent fish

Definite Plan
290 07 | Other Project Components June 2018
pathogen introduction into the hatchery, fish will not be allowed upstream of both Dam A (main diversion point) or Dam B (alternate diversion point).
CDFW may divert up to 10 cfs of water from PacifiCorp’s hydro-generation tail race canal supplied from either Dam A or B, below the City of Yreka’s diversion facility. Water will be gravity fed and plumbed to each rearing location and all circular tanks, pending KRRC’s confirmatory site survey. During periods when the powerhouse tail race is not flowing, hatchery water will be diverted from Dam B to Dam A. KRRC and CDFW will perform hydraulic analysis to assess depths and velocities in Fall Creek, which CDFW and NMFS will use to determine threshold criteria for resident and migrating Chinook and Coho salmon.
Figure 7.8-4 Conceptual Layout of Fall Creek Hatchery Improvements
Adult Collection and Holding
It is not anticipated that salmon will return to Fall Creek in sufficient numbers for broodstock until at least three years following dam removal (the first fish raised at FCH will return as three-year old’s in 2024).

Definite Plan
June 2018 07 | Other Project Components 291
Between 2021 and 2024, or until fish return to FCH, spawning and egg collection will occur at IGH. CDFW and NMFS will develop a separate protocol to transfer eggs to FCH from IGH to reduce transportation mortality. Once FCH salmon returns begin to occur, CDFW and NMFS have identified two options to collect fish:
• Option 1: An adult ladder and trap will be constructed in the lower rearing location. Adult holding will include one or two new 14-foot diameter or smaller circular tank(s). A new fish ladder and trap will allow fish access to this tank(s).
• Option 2: Adult trapping will be at the mouth of Fall Creek using a new picket weir and trap. Once adults are trapped they will be transferred either by truck, or possibly by a Whooshh™ fish transfer system, to the new adult fish ladder and trap located in the lower rearing area.
The fish ladder and adult holding tanks will be supplied with water from the lower tanks (4.33 cfs) excluding periods of cleaning, feeding, and therapeutic use when water will be discharged to the settling pond. If pass through water from the lower tanks is insufficient to meet fish ladder and adult holding needs, CDFW may need to divert additional water (UV treatment not required) into the fish ladder.
Spawning
CDFW will manage spawning at FCH to meet the joint program goals at both IGH and FCH. When adult Chinook and Coho return to Fall Creek, CDFW will sort the adults for ripeness and spawned according to production goals for Chinook salmon and conservation goals described in the HGMP for Coho salmon.
A facility needs to be designed and constructed for future spawning operations at FCH. Migrating Coho and Chinook salmon will need 3-4 years to imprint, so a FCH spawning house is not an immediate necessity; however, the design should be developed now.
Egg Incubation
CDFW will incubate Coho salmon and Chinook salmon eggs in a new incubator building using eight vertical flow incubator stacks. Each stack will use up to 10 gpm, for a total of 80 gpm (0.18 cfs). CDFW will treat the incubator water using a 100 gpm in-line UV system. CDFW will discharge water from egg incubation to the settling pond.
Circular Tanks
Rearing at FCH will occur in the upper and lower ponds. For each location, circular tanks will be installed within the existing concrete rearing pond footprints. The upper ponds will consist of three 20-foot circular tanks, two 14-foot circular tanks, and three four-foot circular tanks. The lower ponds will consist of twelve 14-foot circular tanks, and six 6-foot circular tanks. The incubation building, fish ladder, adult capture and holding ponds and spawning house will be located adjacent to the lower raceways (Figure 7.8-4). CDFW will discharge water from the rearing ponds either to Fall Creek through the fish ladder or if treatment is needed, to the settling pond as described below.

Definite Plan
292 07 | Other Project Components June 2018
Water Needs
CDFW will divert water from Dam A to provide 2.2 cfs to the upper rearing area, and 5.65 cfs to the lower rearing area. CDFW will divert up to 2.2 cfs for the fish ladder and adult capture area during the months of October through January. The maximum total flow of water required to operate the FCH is 9.24 cfs (Table 7.8-8) which occurs in November and includes additional water from unused tanks to operate the fish ladder and trapping area. The SWRCB has confirmed that CDFW’s non-consumptive water right permit of 10 cfs is valid for hatchery operations.
Table 7.8-8 Estimated Water Needs at FCH rearing 115,000 Chinook yearlings and 75,500 Coho (cfs)
Facility Jan Feb Mar April May June July Aug Sept Oct Nov Dec Round Tanks
1.26 1.29 1.58 1.66 1.08 0.58 1.01 1.48 2.29 3.30 4.06 1.14
Hatchery Building
0.18 0.18 0.18 0.18 0 0 0 0 0 0.18 0.18 0.18
Spawning 0 0 0 0 0 0 0 0 0 0.67 0.67 0.67 Adult Holding & Ladder
4.33 0 0 0 0 0 0 0 0 4.33 4.33 4.33
Total 5 .77 1.47 1.76 1.84 1.08 0.58 1.01 1.48 2.29 8.48 9.24 6.32 Source: NOAA Fisheries and CDFW Technical Staff Recommendation for Klamath River Hatchery Operations in California Post-Dam Removal, May 31, 2018.
Settling Pond
A settling pond will be constructed for FCH for post-use water treatment. However, the FCH footprint will not support a settling pond, so KRRC and CDFW identified two nearby sites, both located on Parcel B, for further evaluation as shown in Figure 7.8-5. These include:
1. A location approximately 1/2 mile downstream of the FCH lower raceways on the left Fall Creek overbank at the access road to the PacifiCorp electrical substation across from the City of Yreka chlorination facility.
2. A location also on the left Fall Creek overbank just north of and along Daggett Road, approximately 4,300 feet downstream of the of the lower FCH raceways. This site is also adjacent to the Klamath River. This site is located within the FEMA-designated approximate Zone A floodplain of the river.
Because these locations are offsite and downstream of the FCH, a conveyance pipeline with either minimum burial or at-grade, will be constructed to transport flows from the hatchery to the pond. Sufficient hydraulic head exists for gravity flow to all sites.

Definite Plan
June 2018 07 | Other Project Components 293
Figure 7.8-5 Potential Settling Pond Locations for FCH
The settling pond will treat water discharged from the incubation and spawning building at all times and from all circular tanks during cleaning, following feeding or use of therapeutics. Otherwise, CDFW will discharge water from the rearing tanks through the fish ladder located in the lower pond area. From the new pond location, CDFW will discharge water back to Fall Creek. At this time, KRRC and CDFW anticipate that the North Coast RWQCB will permit the discharge under the general NPDES permit for hatcheries with effluent discharge requirement phased in over eight years via a companion compliance order. Selection of a settling pond location and pond layout is pending cultural resources investigations and consultation with tribes with historic and cultural connection to the area.

Definite Plan
294 07 | Other Project Components June 2018
Coded Wire Tags and Marking
CDFW will apply CWTs and perform adipose fin clip marking of the Chinook salmon yearlings reared at FCH at the CDFW standard 25% constant fractional mark rate and are proposed to be processed by hand using Mk IV CWT tagging machines. CDFW can complete hand processing these Chinook yearlings with two CWT machines in 7 to 15 days. CDFW will mark 100% of Coho salmon with a left maxillary clip by hand and can complete this in roughly 10 to 20 days.
FCH Fish Releases
CDFW and NMFS are still evaluating release strategy for Coho and Chinook salmon produced at the FCH. CDFW and NMFS plan release dates of October 15 through November 20 for Chinook salmon yearlings, and March 15 through May 1 for Coho salmon yearlings. Options include direct release at FCH or IGH.
General Hatchery Plan Assumptions
KRRC makes the following assumptions regarding technical criteria at both IGH and FCH:
• For the purposes of planning and designing hatchery operations, all hatchery production at IGH and FCH is limited to the eight years following dam removal. After eight years, the hatcheries will cease operations and be decommissioned.
• IGH and FCH must be operational prior to draw down per the Klamath Hydroelectric Settlement Agreement (KHSA 2016, see section 7.6.6.B).
• CDFW will employ Best Management Practices to minimize discharges at IGH and FCH.
7.9 Cultural Resources Plan KRRC is preparing a Cultural Resources Plan. The tasks described in the Cultural Resources Plan in Appendix L provide FERC with a framework for understanding the cultural resources studies that KRRC has completed, those that are currently ongoing, and others that KRRC anticipates to comply with regulatory requirements under Section 106 of the NHPA as well as California’s AB 52. The plan also provides the status of consultation completed to date by KRRC and PacifiCorp, acting as FERC’s non-federal representatives, for carrying out consultation pursuant to Section 106 and the status of consultation with affected Indian Tribes and other tribal organizations. The plan also provides an update of the status of SWRCB’s consultation with California Native American tribes under AB 52.
7.10 Other Plans Several other plans are proposed and included in this Definite Plan to support the construction and management of effects from the Project. Table 7.10-1 provides a list of plans and their location in the appendices.

Definite Plan
June 2018 07 | Other Project Components 295
Table 7.10-1 Summary of Other Plans for Construction, Water Quality and Groundwater Management
Plan Location in Definite Plan
Fire Management Plan Appendix O1 Traffic Management Plan Appendix O2 Hazardous Materials Management Plan Appendix O3
Emergency Response Plan Appendix O4 Noise and Vibration Control Plan Appendix O5 Water Quality Monitoring Plan Appendix M Groundwater Well Management Plan Appendix N

Definite Plan
296 07 | Other Project Components June 2018
This page intentionally left blank.

Definite Plan
June 2018 08 | Project Costs and Schedule 297
Chapter 8: Project Costs and Schedule

Definite Plan
298 08 | Project Costs and Schedule June 2018
This page intentionally left blank.
Definite Plan
June 2018 08 | Project Costs and Schedule 299
8. PROJECT COSTS AND SCHEDULE This section provides a summary of the Estimate of Project Costs report, which is provided as Appendix P to this Definite Plan. The full report in Appendix P documents the estimated cost for the Project, which in addition to construction cost, includes costs for management, administration and legal support, environmental compliance and permitting, engineering design, procurement, mitigation and monitoring before, during and following construction, as well as construction management. The estimated project cost is based on the Definite Plan, in addition to ongoing coordination and consultation with project stakeholders and regulatory agencies.
8.1 Objectives Section 7.2 of the Klamath Hydroelectric Settlement Agreement, as amended (KHSA) sets forth required elements of the Definite Plan, which include:
• A detailed estimate of the actual or foreseeable costs associated with: the physical performance of Facilities Removal25 consistent with the Detailed Plan; each of the tasks associated with the performance of the [KRRC]’s obligations as stated in Section 7.1; seeking and securing permits and other authorizations; and insurance, performance bond, or similar measures, as set forth in Appendix L to this Settlement;
• The [KRRC]’s analysis demonstrating that the total cost of Facilities Removal is likely to be less than the State Cost Cap, which is the total of Customer Contribution and California Bond Funding as specified in Section 426; and
• A detailed statement of the estimated costs of Facilities Removal.
The full report in Appendix P addresses these elements of the KHSA and documents both the engineer’s opinion of construction cost, based on the project design elements and construction plan summary provided herein, as well document the total estimated project implementation cost. In addition to reporting the estimated project costs, Most Probable Low (MPL) and Most Probable High (MPH) estimates were prepared using a Monte Carlo analysis to account for uncertainties associated with the estimated project costs and identified project risks. The MPL and MPH estimates represent more optimistic and more conservative opinions of project costs, respectively.
8.2 Cost Categories For organizational purposes, the project costs have been summarized using the following cost categories:
25 “Facilities Removal” is defined in the KHSA as the “physical removal of all or part of each of the Facilities to achieve at a minimum a free-flowing condition and volitional fish passage, site remediation and restoration, including previously inundated lands, measures to avoid or minimize adverse downstream impacts, and all associated permitting for such actions.” 26 The State Cost cap is $450,000.000.

Definite Plan
300 08 | Project Costs and Schedule June 2018
• Project Oversight: Support services providing administration, project management and controls, contract management, BOC, outreach, insurance and legal support.
• Environmental Compliance and Permitting: Environmental compliance support and permitting.
• Engineering and Procurement: Field studies, engineering design, and construction procurement for the various project work packages. Design and procurement estimates assume a Progressive Design-Build (PDB), performance security, construction delivery method for the large dam removal work package.
• Construction Management: Full construction management services for implementation of all project components.
• Construction:
+ Dam removals: Sequential removal of all four dams, including dam modifications, reservoir drawdown and removal of all associated dam infrastructure (including spillways, fish ladders, intake structures, penstocks, turbine units, electrical installations, buildings)
+ Reservoir area improvements: Removal, grading and shaping of portions of reservoir sediment, bank stability measures
+ Reservoir area restoration: Seeding, planting, weeding, monitoring and maintenance. Hydroseeding methods include by barge along the reservoir bank, by helicopter along steep slopes, by airplane along uneven large areas and by trailer mounted blower for areas easily accessible by truck
+ Yreka water supply improvements: Improvements to the City of Yreka’s water supply intake and relocation of their water supply pipeline.
+ Transportation infrastructure: Improvements to, or replacement of, bridges, culverts and road resurfacing to mitigate any project or construction related impact
+ Recreation demolition: Demolition of existing recreation infrastructure and restoration of disturbed area to native vegetation
+ Recreation improvements: New recreation infrastructure (e,g, water access, day-use areas, etc.) to avoid or minimize project impacts
+ Downstream flood improvements: Improvements to existing structures and facilities to avoid or minimize adverse downstream flood-related impacts.
• Anticipated Mitigation Measures: Anticipated cultural resource measures, groundwater improvements, and water supply improvements required by regulatory agencies to mitigate project-related impacts.
• Monitoring and Reporting: Aquatic resource, terrestrial resource, water quality, and sediment monitoring and reporting.
Detailed summaries of methods, assumptions and results of the estimate development for the various cost categories and subcategories is provided in Section 3 of Appendix P.

Definite Plan
June 2018 08 | Project Costs and Schedule 301
8.3 Construction Procurement Approach KRRC based estimates for the various cost categories on a PDB construction procurement of the large dam removal work package, which includes construction access road and bridge accommodations, dam modifications, dam and hydropower facility removal, recreation demolition and reservoir and other restoration. KRRC will use a qualifications-based selection approach and hire a PDB contractor in late 2018/early 2019, followed by the PDB’s completion of the final design in 2019.
There is a possibility that smaller work packages, including downstream flood control improvements, City of Yreka water supply improvements and proposed recreation facilities, may be procured separately using a design-bid-build, or similar, procurement strategy. For these packages, final design will proceed in 2018 and 2019, with request for construction proposals being issued in mid- to late-2019.
8.4 Basis of Estimate
8.4.1 Construction Pricing
The construction estimates summarized herein are intended to capture the most current pricing for materials, wages and salaries, equipment, accepted productivity standards, and typical construction practices, procurement methods, current construction economic conditions, and site conditions for the current level of design. Detailed construction cost breakdowns for both Full Removal and Partial Removal alternatives are provided in Appendix P. Pay item cost detail worksheets, describing the calculation of individual cost estimate line items rates and prices are also provided in Appendix P.
Construction cost estimates were prepared based on less than complete designs, and have inherent levels of risk and uncertainties. Section 2.3 in Appendix P contains a detailed description of the methods and assumptions that were utilized to address Contractor direct costs, overhead, profit, risk markup, subcontractor markup, insurance markup and bond markup.
8.4.2 Consulting Services Pricing
Outside of construction costs, other implementation activities such as project oversight, field studies, design, permitting, mitigation measures and monitoring generally involve labor and associated other direct costs (ODCs). ODCs can include office space, travel, meals, postage, specialty reproduction, and vendor quotes for materials, supplies or services. For each of the implementation activities referenced above, KRRC developed independent estimates using standard labor rates and ODC values based on the latest understanding of the scope or work for the life of the Project. Details for each cost category are provided in Appendix P.
8.4.3 Escalation KRRC based estimates on contemporary market information at the time of estimate preparation. As such it is necessary to include escalation to account for cost increases over the duration of the Project, particularly

Definite Plan
302 08 | Project Costs and Schedule June 2018
as this Project spans multiple years. KRRC escalated each line item in the cost estimate based on scheduled construction and other implementation activities. KRRC utilized an escalation rate of 4% per year. This is based on cost index references and current cost trends observed in the industry, described in more detail in Appendix P.
8.4.4 Design and Construction Contingency
Design contingencies are intended to account for three types of uncertainties which directly affect the estimated cost of a project as it advances from the planning stage through final design. These include: (1) unlisted items, (2) design and scope changes, and (3) cost estimating refinements. Based upon the apparent completeness of the listed items for the dam removal estimates, the design contingency was set at ±10 percent of the construction cost, which is a typical value for a the level of design presented herein, particularly given the fact that a large percentage of the demolition work is means and methods driven, as opposed to detailed design.
The estimate of project costs includes a percentage allowance for construction contingencies to cover differences in actual and estimated quantities, unforeseeable difficulties at the site, changed site conditions, possible changes in plans, and other uncertainties during the construction period. The allowance is based on engineering judgment of the major pay items in the estimate, reliability of the data, adequacy of the estimated quantities, and general knowledge of the site conditions. KRRC used a value of ±20 percent of the construction cost for construction contingencies for the dam removal estimates, which is a typical value for this stage of project development.
KRRC applied the design and construction contingencies (total of 30%) discussed above as a percentage of the total construction cost, and added to the total estimate of project costs.
8.4.5 Monte Carlo Analysis
KRRC completed a Monte Carlo analysis to analyze uncertainties and risk, to be used as the basis for development of the MPL and MPH estimates.
The probabilistic range of costs for each estimate line item was determined with the use of ‘@Risk’ Monte Carlo analysis software. The Monte Carlo analysis involves determining the impact and likelihood of occurrence of identified and quantified uncertainties and risks by running simulations to identify the range of possible outcomes for a number of scenarios - 10,000 scenarios in the case of this Project. A random sampling is performed in the simulation by using uncertain risk variable inputs to generate the range of outcomes with a confidence measure for each outcome.
Levels of probability are described from P1 to P100, where the number following the ‘P’ represents the percentage of most probable outcomes. For example, the P1 estimate amount will only cover the lowest 1% of the possible cost outcomes, whereas P100 will cover the maximum estimate amount determined from running the 10,000 scenarios. A P80 estimate covers the most likely final project cost in 80% of all scenarios, and is often used by the construction industry (Barreras 2011), including the USACE (“Per

Definite Plan
June 2018 08 | Project Costs and Schedule 303
regulation and guidance, the P80 confidence level is the normal and accepted cost confidence level”), to calculate the amount of conservative risk contingency to carry on a project.
Due to the unique nature of this Project and theKRRC, KRRC selected a conservative P90 to represent the MPH for the Project. The P90 estimate would cover the most likely final project cost in 90% of all scenarios. A P10 was selected to represent the MPL.
8.4.6 Ongoing Due Diligence
General
KRRC is undertaking additional due diligence on construction costs, measures to lower construction costs, and measures to manage construction risk. KRRC will complete additional engineering, select a design-build contractor, negotiate a construction agreement with the Contractor, establish a guaranteed maximum price for the work to be performed, implement its insurance programs, and establish the requirements for all bid bonds, payment bonds, and the performance bond. Many risks considered in the Monte Carlo analysis that deal with design and regulatory compliance will be mitigated or better understood when this process is completed, likely lowering the MPH significantly.
Independent Board of Consultants (BOC)
The FERC approved the BOC for the Lower Klamath Project on May 22, 2018. Among other things, FERC’s letter of approval included a plan and schedule to obtain BOC review of the estimate of project costs and MPH estimates for the Full Removal alternative, adequacy of available funds for facilities removal, adequacy of the proposed contingency reserve, and adequacy of the proposed insurance and bonding arrangements. The five-member BOC FERC-approved list includes Dan Hertel, PE (Engineering Solutions, LLC), James Borg, PE (D&H Concepts, LLC), Craig Findlay, PhD, PE, GE (Findlay Engineering, Inc.), Mary Louise Keefe, PhD (R2 Resource Consultants, Inc.), Ted Chant, PE (Chant Limited) and Robert Muncil, ARM (Cool Insurance Agency, Inc.). KRRC plans to convene the BOC on or before August 1, 2018.
The Definite Plan will be further informed by the review and recommendations of the BOC. KRRC will incorporate recommendations of the BOC into a revised Definite Plan and Appendix P will be updated accordingly.
8.5 Estimate Results Summary Tables 8.5-1 and 8.5-2 below summarize the estimate of project costs, for both Full Removal and Partial Removal of the four dams.
Similar to previous project estimates, the results show probabilistic MPL and MPH costs based on the results of Monte Carlo simulations. The right-hand column indicates the estimated project costs, whereas the forecast range from MPL to MPH indicate the range of probabilistic outcomes. The MPL is P10 (likely final

Definite Plan
304 08 | Project Costs and Schedule June 2018
project cost in 10% of all scenarios) and the MPH is P90 (likely final project cost in 90% of all scenarios). Additional detail and cost breakdowns are provided in the full report in Appendix P.
Table 8.5-1 Results Summary - Full Removal
Cost Category Forecast Range Estimated Project
Cost MPL MPH Project Oversight $29,581,000 Environmental Compliance & Permitting $8,637,000 Engineering & Procurement $15,632,000 Construction Management $10,617,000
Construction $202,108,000 $268,560,000 $227,980,000 Anticipated Mitigation Measures $18,407,000 Monitoring & Reporting $18,405,000 Design & Construction Contingency $68,394,000 TOTAL $346,500,000 $507,100,000 $397,700,000
Table 8.5-2 Results Summary - Partial Removal
Cost Category Forecast Range Estimated Project
Cost MPL MPH Project Oversight $29,581,000
Environmental Compliance & Permitting $8,637,000 Engineering & Procurement $15,632,000 Construction Management $10,617,000 Construction $169,140,000 $229,250,000 $193,030,000 Anticipated Mitigation Measures $18,407,000 Monitoring & Reporting $18,405,000
Design & Construction Contingency $57,909,000 TOTAL $313,500,000 $467,800,000 $352,200,000
8.6 Construction Schedule The estimate is based on the construction schedule and the construction plan described below. The schedule is predicated on the following:
• Construction of City of Yreka water supply improvements would be completed in 2020 (prior to drawdown) and may be under a separate contract from the PDB Contract for the dam removal work
• Construction of downstream flood control improvements would be completed in 2020 (prior to drawdown) and may be under a separate contract from the PDB Contract for the dam removal work

Definite Plan
June 2018 08 | Project Costs and Schedule 305
• Construction of the access road improvements would be completed in 2020 (prior to drawdown)
• An effective Date of Agreement (guaranteed maximum price) for the dam removal PDB Contractor on or before February 15, 2020
• Lineal and concurrent activities
• Equipment application and production
• The ability to drawdown J.C. Boyle, Copco No. 1 and Iron Gate reservoirs at the beginning of 2021
• Major earthworks and removal activities are assumed to be performed using two 10-hour shifts, six days per week
• In-stream construction window in Oregon is assumed to be from July 1 through September 30 • In-stream construction window in California is assumed to be from June 15 through October 15
The duration of many of the schedule activities are determined from the labor and equipment productivity associated with the estimate pay item sheets.
The access road, dam modification, water supply, and downstream flood control construction would be completed during an estimated 6- to 8-month period in 2020, since these activities require completion prior to drawdown and facility removal. Subsequent dam removal and associated construction would occur during approximately 8 months of work in 2021, with restoration related construction activities likely extending through 2022. Monitoring and reporting would extend for 5 years after construction completion. Figure 8.6-1 below shows a summary schedule for construction activities.

Definite Plan
306 08 | Project Costs and Schedule June 2018
Figure 8.6-1 Summary Construction Schedule

Definite Plan
June 2018 09 | References 307
Chapter 9: References

Definite Plan
308 09 | References June 2018
This page intentionally left blank.
Definite Plan
June 2018 09 | References 309
9. REFERENCES Alexander, J. A., S. L. Hallett, R. W. Stocking, L. Xue, and J. L. Bartholomew 2014. Host and parasite
populations after a ten year flood: Manayunkia speciosa and Ceratonova (syn Ceratomyxa) shasta in the Klamath River. Northwest Science 88:219–233.
Bartholomew, J. L., C. E. Smith, J. S. Rohovec, and J. L. Fryer 1989. Characterization of a host response to the myxosporean parasite, Ceratomyxa shasta (Noble), by histology, scanning electron-microscopy and immunological techniques. Journal of Fish Diseases 12:509–522.
Barreras, A. J. 2011. Risk management: Monte Carlo simulation in cost estimating. Project Management Institute Conference Proceedings, 2011
Bartholomew, J.L., and J.S. Foott 2010. Compilation of information relating to myxozoan disease effects to inform the Klamath Basin Restoration Agreement. Department of Microbiology, Oregon State University, Corvallis, and U.S. Fish and Wildlife Service, California-Nevada Fish Health Center.
Bartholomew, J.L., S. Halett, R. Holt, J. Alexander, S. Atkinson, R. Craig, A. Javaheri, M. Babar-Sebens 2017. Klamath River Fish Health Studies: Salmon Disease Monitoring and Research. FY2016 Annual Report. 50 pp.
Beeman, J.W., G.M. Stutzer, S.D. Juhnke, and N.J. Hetrick 2008. Survival and migration behavior of juvenile coho salmon in the Klamath River relative to discharge at Iron Gate Dam, 2006. Open-File Report 2008-1332. U.S. Geological Survey.
Benson, S. 2014. Ceratomyxa Shasta: Timing of myxospore release from juvenile Chinook salmon. Humboldt State University
Bilby 1984. Bilby, R. E. Removal of woody debris may affect stream channel stability. Journal of Forestry. 82:609–613. 1984.
Bilby and Ward 1989. Bilby, R. E., and J. W. Ward. Changes in characteristics and function of woody debris with increasing size of streams in western Washington. Transactions of the American Fisheries Society. 118:368–378. 1989.
Bjork, S.J. 2010. Factors affecting the Ceratomyxa shasta infectious cycle and transmission to polychaete and salmonid hosts. PhD Thesis, Oregon State University, Corvallis, OR 223p. http://ir.library.oregonstate.edu/jspui/handle/1957/15435
Black and Veatch 1998. J.C. Boyle Development Klamath River Hydroelectric Project FERC Project No. 2082, Safety Inspection Report.

Definite Plan
310 09 | References June 2018
Bryant and Sedell 1995. Riparian forests, wood in the water, and fish habitat complexity. In Condition of the world’s aquatic habitats. Proceedings of the World Fisheries Congress, Theme. Vol. 1, pp. 202-224.
Buffington 1995. Effects of hydraulic roughness and sediment supply on surface textures of gravel-bedded rivers. Master's thesis, University of Washington.
Buffington and Montgomery 1999. Buffington, J. M., and D. R. Montgomery. Effects of hydraulic roughness on surface textures of gravel-bed rivers. Water Resources Research. 35:3507–3522. 1999.
CDFW 2016a. California Department of Fish and Wildlife. Klamath River Basin Spring Chinook Salmon Spawner Escapement, River Harvest and Run-size Estimates 1980-2016.
CDFW 2016b. California Department of Fish and Wildlife. Klamath River Basin Fall Chinook Salmon Spawner Escapement, River Harvest and Run-size Estimates 1978-2016.
CDFW 2016c. California Department of Fish and Wildlife. Klamath – Trinity Program Coho Salmon Megatable (Preliminary) 1978-2015.
CDFW 2016d. California Department of Fish and Wildlife. Annual Report – Iron Gate Hatchery, 2015 – 2016. 38 pp.
CDFW 2017. California Department of Fish and Wildlife Keith Pomeroy. Iron Gate Hatchery Production 2001 to 2017 spreadsheet and summary.
CDFW and PacifiCorp 2014. California Department of Fish and Wildlife and PacifiCorp. Hatchery and genetic management plan for Iron Gate Hatchery coho salmon. Prepared for National Oceanic and Atmospheric Administration – National Marine Fisheries Service. 163 pp.
California Hatchery Scientific Review Group [California HSRG] 2012. California Hatchery Review Report. Prepared for the US Fish and Wildlife Service and Pacific States Marine Fisheries Commission. June 2012. Appendix VIII.
California Oregon Power Company 1960a. Specifications for the Construction of the Iron Gate Earth Fill Regulating Dam.
California Oregon Power Company 1960b. Report on Investigation of Locally Available Materials for the Construction of Iron Gate Earth Fill Regulating Dam.
California Trout, ed. 2017 Upper Klamath-Trinity Rivers Spring Chinook Salmon. California Trout.
Chiaramonte L.V., R.A. Ray, R.A. Corum, T. Soto, S.L. Hallett and J.L. Bartholomew 2016. Klamath River thermal refuge provides juvenile salmon reduced exposure to the parasite Ceratonova shasta. Transactions of the American Fisheries Society 145: 810-820.

Definite Plan
June 2018 09 | References 311
Cross, S.P., H. Lauchstedt, M. Blankenship 1998. Numerical status of Townsend’s Big-eared Bats at Salt Caves in the Klamath River Canyon and other selected sites in Southern Oregon, 1997. Southern Oregon University, Ashland, Oregon.
DOI and NMFS 2013. Department of the Interior and Department of Commerce, National Marine Fisheries Service. Klamath Dam Removal Overview Report for the Secretary of the Interior – An Assessment of Science and Technical Information (a.k.a. the Secretarial Determination of Record (SDOR)). Version 1.1. March 2013.
Eilers and Gubala 2003. Bathymetry and Sediment Classification of the Klamath Hydropower Project Impoundments. Prepared for PacifiCorp by J.M. Eilers and C. P. Gubala, JC Headwaters, Inc. April 2003.
FERC 2007. Federal Energy Regulatory Commission. Final Environmental Impact Statement for Hydropower License, Klamath Hydroelectric Project, FERC Project No. 2082-027. FERC/EIS-0201F. FERC, Office of Energy Projects, Division of Hydropower Licensing, Washington, DC.
FERC 2017. Federal Energy Regulatory Commission. Engineering Guidelines for the Evaluation of Hydropower Projects. Available at: https://www.ferc.gov/industries/hydropower/safety/guidelines/eng-guide.asp
Ferro and Porto 2011. Ferro, V, and P. Porto. Predicting the equilibrium bed slope in natural streams using a stochastic model for incipient sediment motion. Earth Surface Processes and Landforms. Vol 36., pp.1007-1022.
Foott J.S., R. J.L. Barthomew, R. W. Perry, and C. E. Walker 2011. Conceptual Model for Disease Effects in the Klamath River. Whitepaper prepared for the Klamath Basin Restoration Agreement Secretarial Overview Report Process. 12 pp.
Fujiwara, M., M.S. Mohr, A. Greenberg, J.S. Foott, and J.L. Bartholomew 2011. Effects of ceratomyxosis on population dynamics of Klamath fall-run Chinook salmon. Transactions of the American Fisheries Society 140:1380–1391.
Geo-Studio 2016. SEEP/W computer program.
Goodman, D., M. Harvey, R. Hughes, W. Kimmerer, K. Rose, and G. Ruggerone 2011. Klamath River Expert Panel: Scientific Assessment of Two Dam Removal Alternatives on Chinook Salmon.
Hammond 1983. Hammond, P.E. Volcanic formations along the Klamath River near Copco Lake. California Geology. V. 36, no. 5, p. 99-109. 1983.
Hamilton, J.B., G.L. Curtis, S.M. Snedaker, and D.K. White 2005. Distribution of Anadromous Fishes in the Upper Klamath River Watershed Prior to Hydropower Dams – A Synthesis of the Historical Evidence. Fisheries 30(4):10-20.

Definite Plan
312 09 | References June 2018
Hayner, S. 2017. Unpublished Bald and Golden Eagle Nesting Data. Sent from Stephen Hayner, BLM to Jennifer Jones, CDM Smith by email on August 24, 2017.
Hodge, B. W., M. A. Wilzbach, W. G. Duffy, R. M. Quinones, and J. A. Hobbs 2016. Life history diversity in Klamath River steelhead. Transactions of the American Fisheries Society 145:227-238.
Holmquist-Johnson and Milhous 2010. Holmquist-Johnson, C.L. and Milhous, R.T. Channel maintenance and flushing flows for the Klamath River, California. U.S. Geological Survey Open File Report 2010-1086, 31 p.
Logomarsino, I. and N. J. Hetrick 2013. 2013 Fall Flow Release Recommendation. Joint NOAA Fisheries and Arcata Fish and Wildlife Office Technical Memorandum. Arcata, California.
Moyle, P.B., J.A. Israel, and S. E. Purdy 2008. Salmon, steelhead, and trout in California: status of an emblematic fauna. Center for Watershed Sciences, University of California,Davis.
Moyle, P., R. Lusardi, P. Samuel, and J. Katz 2017. State of the Salmonids: Status of California’s Emblematic Fishes 2017. Center for Watershed Sciences, University of California, Davis and California Trout, San Francisco, CA. 579 pp.
Mussman 2008. E.K. Mussman, D. Zabowski, and S. A. Acker. Predicting Secondary Reservoir Sediment Erosion and Stabilization Following Dam Removal. 2008.
NMFS 2001. National Marine Fisheries Service. Endangered and threatened species: final listing determination for Klamath Mountains Province steelhead. Federal Register 66:17845-17856.
NMFS 2009. National Marine Fisheries Service. Klamath River Basin 2009 Report to Congress. http://www.westcoast.fisheries.noaa.gov/klamath/salmon_management.html
NMFS 2010. National Marine Fisheries Service. Biological Opinion on the Operation of the Klamath Project between 2010 and 2018. Prepared for U.S. Bureau of Reclamation. Prepared by NMFS, Southwest Region. March 15, 2010.
NMFS 2014. National Marine Fisheries Service. Klamath River Basin 2014 Report to Congress. http://www.westcoast.fisheries.noaa.gov/klamath/salmon_management.html
NMFS 2016. National Marine Fisheries Service. 5-Year Review: Summary& Evaluation of Southern Oregon/Northern California Coast Coho Salmon National Marine Fisheries Service West Coast Region. Arcata, California.
NMFS and USFWS 2012. National Marine Fisheries Service and United States Fish and Wildlife Service. Joint Preliminary Biological Opinion on the Proposed Removal of Four Dams on the Klamath River. NMFS, Southwest Region and USFWS, Region 8. November 2012.

Definite Plan
June 2018 09 | References 313
NMFS and USFWS 2013. National Marine Fisheries Service and United States Fish and Wildlife Service. Biological Opinions on the Effects of Proposed Klamath Project Operations from May 31, 2013, through March 31, 2023, on Five Federally Listed Threatened and Endangered Species. NMFS file number: SWR-2012-9372; FWS file number: 08EKLA00-2013-F-0014. May 2013.
NRCS 2007. Natural Resources Conservation Service. National Engineering Handbook, Part 654. 2007. Stream Restoration Design. Technical Supplement 14B Scour Calculations.
PacifiCorp 2004. Terrestrial Resources Final Technical Report Klamath Hydroelectric Project. FERC No. 2082. February 2004.
PanGEO 2006. Technical Memorandum – Preliminary Assessment of Slope Stability, Iron Gate and Copco Dams and Reservoirs, Under Rapid Drawdown. To Dennis Gathard, River Resources. Prepared by Stephen H. Evans, L.E.G. Project No. 06-201. November 27, 2006.
PanGEO 2008. Geotechnical Report – Klamath River Dam Removal Project – California and Oregon. Project No. 07-153. Prepared for Philip Williams & Associates, Ltd. and California State Coastal Conservancy. August 2008.
Porto and Gessler 1999. Porto, P. and J. Gessler. Ultimate Bed Slope in Calabrian Streams upstream of Check Dams: Field Study. American Society of Civil Engineers, Journal of Hydraulic Engineering. December.
Ray, R.A., and J. L. Bartholomew 2013. Estimation of transmission dynamics of the Ceratomyxa shasta actinospore to the salmonid host. Journal of Parasitology 140:907–916.
Ray, R. A., Perry, R.W., Som, N.A., and J.L. Bartholomew 2014. Using Cure Models for Analyzing the Influence of Pathogens on Salmon Survival. Transactions of the American Fisheries Society, 143(2), 387-398. doi:10.1080/00028487.2013.862183
RSET 2016. Northwest Regional Sediment Evaluation Team. Sediment Evaluation Framework for the Pacific Northwest. July.
Sedell and Froggatt 1984. Sedell, J. R., and J. L. Froggatt. Importance of streamside forests to large rivers: the isolation of the Willamette River, Oregon, U.S.A., from its floodplain by snagging and streamside forest removal. Verhandlungen-Internationale Vereinigung für Theoretifche und Angewandte Limnologie. 22:1828–1834. 1984.
Snyder, J. 1931. Salmon of the Klamath River, California. California Fish and Game Bulletin, 34, 129.
Som, N.A., and N.J. Hetrick 2016a. Response to Request for Technical Assistance – Prevalence of C. shasta Infections in juvenile and adult salmonids. Unpublished memo to D. Hillemeier, Yurok Tribal Fisheries, and Craig Tucker, Karuk Department of Natural Resources. 17 pp.
Definite Plan
314 09 | References June 2018
Som, N.A., N.J. Hetrick, and J. Alexander 2016b. Response to Request for Technical Assistance – Polychaete distribution and infections. Unpublished memo to D. Hillemeier, Yurok Tribal Fisheries, and Craig Tucker, Karuk Department of Natural Resources. 11 pp.
Som, N.A., and N.J. Hetrick 2016c. Response to Request for Technical Assistance – Ceratonova shasta waterborne spore stages. Unpublished memo to D. Hillemeier, Yurok Tribal Fisheries, and Craig Tucker, Karuk Department of Natural Resources. 12 pp.
Spier, L. 1930. Klamath Ethnography. University of California Press, Berkeley.
Stocking, R.W. and Bartholomew, J.L. 2007. Distribution and habitat characteristics of Manayunkia speciosa and infection prevalence with the parasite, Ceratomyxa shasta, in the Klamath River, OR-CA, USA. Journal of Parasitology 93:78-88.
Thompson, J.N. 1994. The Coevolutionary Process. University of Chicago Press, Chicago.
True, K. 2013. FY2013 Technical Report: Pilot Study of the Effects of Saltwater Rearing on Ceratomyxa shasta Infections in Klamath River Juvenile Chinook Salmon, June-August 2013. Fish & Wildlife Service California – Nevada Fish Health Center, Anderson, CA.
True, K., A. Bolick, and J. S. Foott 2013. Myxosporean parasite (Ceratomyxa shasta and Parvicapsula minibicornis) prevalence of infection in Klamath River Basin juvenile Chinook salmon, April–August 2012. California–Nevada Fish Health Center, US Fish and Wildlife Service, Anderson, California. (Available from: https://www.fws.gov/canvfhc/CANVReports.html)
True, K., A. Bolick, and S. Foott 2015. Myxosporean Parasite (Ceratanova shasta and Parvicapsula minibicornis) Prevalence of Infection in Klamath River Basin Juvenile Chinook Salmon, April-August 2014
True, K., A. Voss, and J.S. Foott 2016. Myxosporean parasite Prevalence of infection in Klamath River Basin juvenile Chinook salmon, April–July 2015. California–Nevada Fish Health Center, US Fish and Wildlife Service, Anderson, California. (Available from: https://www.fws.gov/canvfhc/CANVReports.html).
USACE 2003. U.S. Army Corps of Engineers. Slope Stability – Engineer Manual. EM-110-2-1902. October 31, 2003.
USBR 2011a. U.S. Bureau of Reclamation. Final Biological Assessment and Final Essential Fish Habitat Determination for the Preferred Alternative of the Klamath Facilities Removal EIS/R. U.S. Bureau of Reclamation, October.
USBR 2011b. U.S. Bureau of Reclamation. Hydrology Studies for the Secretary’s Determination on the Klamath River Dam Removal and Basin Restoration.

Definite Plan
June 2018 09 | References 315
USBR 2011c. U.S. Bureau of Reclamation. Reservoir Area Management Plan for the Secretary’s Determination on Klamath River Dam Removal and Basin Restoration Klamath River, Oregon and California. Technical Report No. SRH-2011-19. Mid-Pacific Region. June 2011.
USBR 2012a. U.S. Bureau of Reclamation. Compiled Well Logs for Wells Identified Within 2.5 Miles of Dams from J.C. Boyle to Iron Gate.
USBR 2012b. U.S. Bureau of Reclamation. Detailed Plan for Dam Removal – Klamath River Dams – Klamath Hydroelectric Project – FERC License No. 2082 – Oregon-California. July 2012.
USBR 2012c. U.S. Bureau of Reclamation. Hydrology, Hydraulics, and Sediment Transport Studies for the Secretary’s Determination on Klamath River Dam Removal and Basin Restoration Klamath River, Oregon and California. Technical Report No. SRH-2011-02. Mid-Pacific Region. January 2012.
USBR 2012d. U.S. Bureau of Reclamation. Secretarial Determination Overview Report (SDOR) – Klamath Dam Removal Overview Report for the Secretary of the Interior- An Assessment of Science and Technical Information. Prepared by the U.S. Department of the Interior, U.S. Department of Commerce, National Marine Fisheries Service. August.
USBR and CDFW 2012. U.S. Bureau of Reclamation and California Department of Fish and Wildlife. Klamath Facilities Removal – Final Environmental Impact Statement/Environmental Impact Report (EIS/R). December.
USFWS 2008. U.S. Fish and Wildlife Service. Biological/Conference Opinion Regarding the Effects of the Bureau of Reclamation’s Proposed 10-year Operation Plan (April 1, 2008–March 31, 2018) for the Klamath Project and its Effects on the Endangered Lost River and Shortnose Suckers. U.S. Fish and Wildlife Service, Klamath Falls Fish and Wildlife Office, Klamath Falls, OR, and Yreka Fish and Wildlife Office, Yreka, CA.
USFWS-NMFS 2012. National Marine Fisheries Service Southwest Region and U.S. Fish and Wildlife Service Region 8. Joint Preliminary Biological Opinion on the Proposed Removal of Four Dams on the Klamath River. November.
USGS 1982. U.S. Geological Survey, Interagency Advisory Committee on Water Data. Guidelines for Determining Flood Flow Frequency – Bulletin #17B of the Hydrology Subcommittee. Revised September 1981, editorial corrections March 1982.
Walker, J. D., J. Kann, and W.W. Walker 2015. Spatial and temporal nutrient loading dynamics in the Sprague River Basin, Oregon. Prepared by Aquatic Ecosystem Sciences, J. D. Walker, and W. W. Walker for the Klamath Tribes Natural Resources Department. 73p. + appendices.
Walker, W.W., Walker, J.D., and Kann, J. 2012. Evaluation of water and nutrient balances for the Upper Klamath Lake Basin in water years 1992–2010. Technical Report Prepared by Aquatic Ecosystem Sciences for the Klamath Tribes Natural Resources Department, 50 p. plus appendixes.

Definite Plan
316 09 | References June 2018
Wherry, S.A., Wood, T.M., and Anderson, C.W. 2015. Revision and proposed modification of a total maximum daily load model for Upper Klamath Lake, Oregon: U.S. Geological Survey Scientific Investigations Report. 2015–5041, 55 p.
Whisenant 1999. S.G. Whisenant. Repairing Damaged Wildlands: A Process-Oriented, Landscape-Scale Approach. Cambridge University Press. 1st edition. November 28, 1999.
Williams 1949. Williams, H. Geology of the Macdoel Quadrangle. California Division of Mines Bulletin 151, scale 1:125,000. 1949.
Williams T. H., Garza J. C., Hetrick N. J., Lindley S. T., Mohr M. S., Myers J. M., O’Farrell M. R., Quiñones R. M. 2013 Upper Klamath and Trinity river Chinook Salmon biological review team report. US Department of Commerce, National Oceanic and Atmospheric Administration, National Marine Fisheries Service, Southwest Fisheries Science Center.
Willy, E. 2017. Unpublished Bald and Golden Eagle Nesting Data. Sent from Elizabeth Willy, USFWS to Jennifer Jones, CDM Smith by email on June 29, 2017.
Woolpert 2010. One foot color digital aerial imagery on the Klamath River from Link River Dam, OR to the confluence with Elk Creek south of Happy Camp, CA. Commissioned by USBR. Available at https://earthexplorer.usgs.gov/. March 19, 2010.
Wray, Simon. Wildlife Biologist, ODFW. Personal communication with Jennifer Jones, KRRC, June 22, 2017.

Definite Plan
June 2018 www.klamathrenewal.org
Copyright © 2022 FDOKUMEN