Anti-TRBC1 Antibody-Based Flow Cytometric Detection of T ...
19
cancers Article Anti-TRBC1 Antibody-Based Flow Cytometric Detection of T-Cell Clonality: Standardization of Sample Preparation and Diagnostic Implementation Noemí Muñoz-García 1,2 , Margarida Lima 3,4 , Neus Villamor 2,5 , F. Javier Morán-Plata 1,2 , Susana Barrena 1,2 , Sheila Mateos 1,2 , Carolina Caldas 1,2 , Ana Balanzategui 2,6 , Miguel Alcoceba 2,6 , Alejandro Domínguez 7 , Fabio Gómez 7 , Anton W. Langerak 8 , Jacques J. M. van Dongen 9 , Alberto Orfao 1,2,† and Julia Almeida 1,2, * ,† Citation: Muñoz-García, N.; Lima, M.; Villamor, N.; Morán-Plata, F.J.; Barrena, S.; Mateos, S.; Caldas, C.; Balanzategui, A.; Alcoceba, M.; Domínguez, A.; et al. Anti-TRBC1 Antibody-Based Flow Cytometric Detection of T-Cell Clonality: Standardization of Sample Preparation and Diagnostic Implementation. Cancers 2021, 13, 4379. https://doi.org/10.3390/ cancers13174379 Academic Editor: Aldo M. Roccaro Received: 14 July 2021 Accepted: 23 August 2021 Published: 30 August 2021 Publisher’s Note: MDPI stays neutral with regard to jurisdictional claims in published maps and institutional affil- iations. Copyright: © 2021 by the authors. Licensee MDPI, Basel, Switzerland. This article is an open access article distributed under the terms and conditions of the Creative Commons Attribution (CC BY) license (https:// creativecommons.org/licenses/by/ 4.0/). 1 Translational and Clinical Research Program, Centro de Investigación del Cáncer and IBMCC (CSIC-University of Salamanca), Cytometry Service, NUCLEUS, Department of Medicine, University of Salamanca (USAL) and Institute of Biomedical Research of Salamanca (IBSAL), 37007 Salamanca, Spain; [email protected] (N.M.-G.); [email protected] (F.J.M.-P.); [email protected] (S.B.); [email protected] (S.M.); [email protected] (C.C.); [email protected] (A.O.) 2 Biomedical Research Networking Centre Consortium of Oncology (CIBERONC), Instituto de Salud Carlos III, 28029 Madrid, Spain; [email protected] (N.V.); [email protected] (A.B.); [email protected] (M.A.) 3 Department of Hematology, Laboratory of Cytometry, Hospital de Santo António, Centro Hospitalar do Porto, 4099-001 Porto, Portugal; [email protected] 4 Unit for Multidisciplinary Research in Biomedicine (UMIB), Abel Salazar Institute of Biomedical Sciences (ICBAS), University of Porto, 4050-313 Porto, Portugal 5 Department of Pathology, Hematopathology Unit, Hospital Clínic, IDIBAPS, 08036 Barcelona, Spain 6 Hematology Service, University Hospital of Salamanca, Translational and Clinical Research Program, Centro de Investigación del Cáncer/IBMCC and IBSAL, 37007 Salamanca, Spain 7 Centro de Salud Miguel Armijo, Sanidad de Castilla y León (SACYL), 37007 Salamanca, Spain; [email protected] (A.D.); [email protected] (F.G.) 8 Department of Immunology, Laboratory Medical immunology, Erasmus MC, University Medical Center Rotterdam, 3015 GD Rotterdam, The Netherlands; [email protected] 9 Department of Immunology, Leiden University Medical Center (LUMC), 2333 ZA Leiden, The Netherlands; [email protected] * Correspondence: [email protected] † These authors have contributed equally to this study and should be both considered as last authors. Simple Summary: The anti-TRBC1 antibody JOVI-1 has recently been identified as a flow cytometry marker potentially useful for assessment of T-cell clonality. The aim of this study was to optimize a flow cytometric method for routine use of anti-TRBC1 to assess T-cell clonality and validate it in a large series of normal and pathological samples. Our results showed that the best resolution to accurately identify TRBC1 + cells was achieved by adding the CD3 antibody either simultaneously or after TRBC1. In addition, TRBC1 + /TRBC1 - ratios within different Tαβ-cell subsets are provided as expected reference ranges for polyclonal T-cells. Based on the optimized approach here proposed, we detected monoclonal Tαβ-cell populations with high specificity (96%) and a high analytical sensitivity/level of detection (≤10 -4 ), when clonal T-cells exhibited immunophenotypic aberrancies. These findings further support and extend previous observations about the utility of TRBC1 for the diagnostic screening and monitoring of clonal Tαβ-cell populations. Abstract: A single antibody (anti-TRBC1; JOVI-1 antibody clone) against one of the two mutually exclusive T-cell receptor β-chain constant domains was identified as a potentially useful flow- cytometry (FCM) marker to assess Tαβ-cell clonality. We optimized the TRBC1-FCM approach for detecting clonal Tαβ-cells and validated the method in 211 normal, reactive and pathological samples. TRBC1 labeling significantly improved in the presence of CD3. Purified TRBC1 + and TRBC1 - monoclonal and polyclonal Tαβ-cells rearranged TRBJ1 in 44/47 (94%) and TRBJ1+TRBJ2 in 48 of 48 (100%) populations, respectively, which confirmed the high specificity of this assay. Additionally, TRBC1 + /TRBC1 - ratios within different Tαβ-cell subsets are provided as reference Cancers 2021, 13, 4379. https://doi.org/10.3390/cancers13174379 https://www.mdpi.com/journal/cancers
-
Upload
khangminh22 -
Category
Documents
-
view
0 -
download
0
Transcript of Anti-TRBC1 Antibody-Based Flow Cytometric Detection of T ...

cancers
Article
Anti-TRBC1 Antibody-Based Flow Cytometric Detection ofT-Cell Clonality: Standardization of Sample Preparation andDiagnostic Implementation
Noemí Muñoz-García 1,2 , Margarida Lima 3,4, Neus Villamor 2,5, F. Javier Morán-Plata 1,2, Susana Barrena 1,2,Sheila Mateos 1,2, Carolina Caldas 1,2, Ana Balanzategui 2,6, Miguel Alcoceba 2,6 , Alejandro Domínguez 7,Fabio Gómez 7, Anton W. Langerak 8 , Jacques J. M. van Dongen 9 , Alberto Orfao 1,2,†
and Julia Almeida 1,2,*,†
�����������������
Citation: Muñoz-García, N.;
Lima, M.; Villamor, N.;
Morán-Plata, F.J.; Barrena, S.; Mateos,
S.; Caldas, C.; Balanzategui, A.;
Alcoceba, M.; Domínguez, A.; et al.
Anti-TRBC1 Antibody-Based Flow
Cytometric Detection of T-Cell
Clonality: Standardization of Sample
Preparation and Diagnostic
Implementation. Cancers 2021, 13,
4379. https://doi.org/10.3390/
cancers13174379
Academic Editor: Aldo M. Roccaro
Received: 14 July 2021
Accepted: 23 August 2021
Published: 30 August 2021
Publisher’s Note: MDPI stays neutral
with regard to jurisdictional claims in
published maps and institutional affil-
iations.
Copyright: © 2021 by the authors.
Licensee MDPI, Basel, Switzerland.
This article is an open access article
distributed under the terms and
conditions of the Creative Commons
Attribution (CC BY) license (https://
creativecommons.org/licenses/by/
4.0/).
1 Translational and Clinical Research Program, Centro de Investigación del Cáncer andIBMCC (CSIC-University of Salamanca), Cytometry Service, NUCLEUS, Department of Medicine, Universityof Salamanca (USAL) and Institute of Biomedical Research of Salamanca (IBSAL), 37007 Salamanca, Spain;[email protected] (N.M.-G.); [email protected] (F.J.M.-P.); [email protected] (S.B.);[email protected] (S.M.); [email protected] (C.C.); [email protected] (A.O.)
2 Biomedical Research Networking Centre Consortium of Oncology (CIBERONC), Instituto de Salud Carlos III,28029 Madrid, Spain; [email protected] (N.V.); [email protected] (A.B.);[email protected] (M.A.)
3 Department of Hematology, Laboratory of Cytometry, Hospital de Santo António, Centro Hospitalar doPorto, 4099-001 Porto, Portugal; [email protected]
4 Unit for Multidisciplinary Research in Biomedicine (UMIB), Abel Salazar Institute of BiomedicalSciences (ICBAS), University of Porto, 4050-313 Porto, Portugal
5 Department of Pathology, Hematopathology Unit, Hospital Clínic, IDIBAPS, 08036 Barcelona, Spain6 Hematology Service, University Hospital of Salamanca, Translational and Clinical Research Program, Centro
de Investigación del Cáncer/IBMCC and IBSAL, 37007 Salamanca, Spain7 Centro de Salud Miguel Armijo, Sanidad de Castilla y León (SACYL), 37007 Salamanca, Spain;
[email protected] (A.D.); [email protected] (F.G.)8 Department of Immunology, Laboratory Medical immunology, Erasmus MC, University Medical Center
Rotterdam, 3015 GD Rotterdam, The Netherlands; [email protected] Department of Immunology, Leiden University Medical Center (LUMC), 2333 ZA Leiden, The Netherlands;
[email protected]* Correspondence: [email protected]† These authors have contributed equally to this study and should be both considered as last authors.
Simple Summary: The anti-TRBC1 antibody JOVI-1 has recently been identified as a flow cytometrymarker potentially useful for assessment of T-cell clonality. The aim of this study was to optimizea flow cytometric method for routine use of anti-TRBC1 to assess T-cell clonality and validate it ina large series of normal and pathological samples. Our results showed that the best resolution toaccurately identify TRBC1+ cells was achieved by adding the CD3 antibody either simultaneously orafter TRBC1. In addition, TRBC1+/TRBC1− ratios within different Tαβ-cell subsets are provided asexpected reference ranges for polyclonal T-cells. Based on the optimized approach here proposed,we detected monoclonal Tαβ-cell populations with high specificity (96%) and a high analyticalsensitivity/level of detection (≤10−4), when clonal T-cells exhibited immunophenotypic aberrancies.These findings further support and extend previous observations about the utility of TRBC1 forthe diagnostic screening and monitoring of clonal Tαβ-cell populations.
Abstract: A single antibody (anti-TRBC1; JOVI-1 antibody clone) against one of the two mutuallyexclusive T-cell receptor β-chain constant domains was identified as a potentially useful flow-cytometry (FCM) marker to assess Tαβ-cell clonality. We optimized the TRBC1-FCM approachfor detecting clonal Tαβ-cells and validated the method in 211 normal, reactive and pathologicalsamples. TRBC1 labeling significantly improved in the presence of CD3. Purified TRBC1+ andTRBC1− monoclonal and polyclonal Tαβ-cells rearranged TRBJ1 in 44/47 (94%) and TRBJ1+TRBJ2in 48 of 48 (100%) populations, respectively, which confirmed the high specificity of this assay.Additionally, TRBC1+/TRBC1− ratios within different Tαβ-cell subsets are provided as reference
Cancers 2021, 13, 4379. https://doi.org/10.3390/cancers13174379 https://www.mdpi.com/journal/cancers
Cancers 2021, 13, 4379 2 of 19
for polyclonal cells, among which a bimodal pattern of TRBC1-expression profile was found for allTCRVβ families, whereas highly-variable TRBC1+/TRBC1− ratios were observed in more maturevs. naïve Tαβ-cell subsets (vs. total T-cells). In 112/117 (96%) samples containing clonal Tαβ-cellsin which the approach was validated, monotypic expression of TRBC1 was confirmed. Dilutionalexperiments showed a level of detection for detecting clonal Tαβ-cells of ≤10−4 in seven out of eightpathological samples. These results support implementation of the optimized TRBC1-FCM approachas a fast, specific and accurate method for assessing T-cell clonality in diagnostic-FCM panels, andfor minimal (residual) disease detection in mature Tαβ+ leukemia/lymphoma patients.
Keywords: TRBC1; JOVI-1; T-CLPD; Tαβ-cells; TRBJ1 and TRBJ2; TCRVβ; MRD1
1. Introduction
T-cell chronic lymphoproliferative disorders (T-CLPD) are uncommon lymphoidmalignancies (approximately 10–15% of all peripheral/mature lymphoid neoplasms world-wide) derived from post-thymic T-cells [1,2], which comprise a heterogeneous group ofentities with variable clinical behavior [1,3] and biologic features [4–8]. Diagnosis of T-CLPD in cases with lymphocytosis or suspected T-cell populations is often challenging dueto the lack of fast and reproducible routine diagnostic assays for T-cell clonality togetherwith the morphologic and immunophenotypic similarities between malignant/clonal T-cells and normal (reactive) polyclonal T-cells in a significant fraction of the patients. Thiscontrasts with assessment of B-cell clonality for which fast flow cytometry (FCM) ap-proaches, through demonstration of (either kappa or lambda) restricted expression of lightchain immunoglobulins, have been available for several decades [9]. Therefore, the avail-ability of a similarly simple, fast, and reliable approach for assessment of T-cell clonalitywould be strongly welcomed.
Currently, FCM-based T-cell receptor Vβ (TCRVβ) repertoire and/or polymerasechain reaction (PCR)-based TRB and/or TRG gene rearrangement analysis assays are usedto assess the clonal nature of suspicious T-cell populations in the diagnostic work-up ofT-CLPD [10]. However, both approaches show limitations for routine implementation.The TCRVβ-FCM assay is relatively expensive, labor-intensive, provides results whichmight be difficult to interpret for nonreference centers and unexperienced flow cytometrists(particularly in case of oligoclonal expansions and clones with dim TCR expression), andit has a limited sensitivity [11–13]. In turn, TR gene rearrangement analysis by PCRis relatively complex and time-consuming (requires experienced personnel and resultsare generally not available on the same day), does not provide accurate quantitation ofthe size of the T-cell clone, and/or lacks simultaneous information about the phenotypiccharacteristics of the expanded clone, which needs to be discriminated from the backgroundof polyclonal T-cells [14,15]; sometimes it might even require prior enrichment/isolation ofthe suspicious clonal T-cell population to reach enough sensitivity [14,16,17]. Furthermore,both FCM and PCR assays are not routinely available in many diagnostic laboratories dueto the low prevalence of T-CLPD.
Recently, a single antibody (TRBC1-binding monoclonal antibody, clone JOVI−1)against one of the two mutually exclusive TCR β chain constant domains (TRBC1 andTRBC2) randomly selected during rearrangement of the TRB gene, has been proposed asa potential marker for rapid assessment of Tαβ-cell clonality by FCM [18]. Normal, as wellas virus-specific Tαβ-cells, show an admixture of TRBC1-positive (37–51% and 36–52% ofnormal CD4+ and CD8+ T-cells, respectively) [18–22] and TRBC1-negative (presumablyTRBC2 positive) T-cells (polyclonal profile in GeneScan studies), whereas monoclonalTαβ-cells typically showed restricted (monotypic) TRBC1 expression [18–21,23–25]. Re-cent reports have further shown the potential utility of this antibody reagent for routineassessment of Tαβ-cell clonality in T-CLPD vs. normal/reactive conditions [18–21,23–26].Despite this, optimal standardization of the technique for routine use in diagnostic lab-

Cancers 2021, 13, 4379 3 of 19
oratories, and interpretation of the results based on normal reference TRBC1+/TRBC1−
ratios and ranges for both normal and reactive Tαβ-cells (and their subsets), have not beenprovided. Similarly, the demonstration of both the specificity and (analytical) sensitivity ofFCM assessment of the TRBC1-expression profile of Tαβ-cells for detecting clonal Tαβ-cells present at low numbers, including the validation of the TRBC1 assay against the goldstandard (i.e., PCR) in normal/reactive vs. pathological samples, are still missing.
In this study, we optimized the TRBC1-based FCM approach for identification ofclonal Tαβ-cells by: (i) standardizing the TRBC1 staining protocol; (ii) defining the TRBC1-expression profile (i.e., TRBC1+/TRBC1− ratios) of normal (total) Tαβ-cells and theirTαβ-cell subsets, defined according to CD4 and CD8 expression, TCRVβ family expressionand T-cell maturation stages, and (iii) evaluating its (analytical) sensitivity and speci-ficity for detection of clonal Tαβ-cells present at minimal disease levels. Our ultimategoal was to standardize and validate the utility of the optimized TRBC1-FCM assay forroutine detection of T-cell clonality by FCM in a large cohort of normal and reactive vs.pathological samples.
2. Materials and Methods2.1. Patients, Controls and Samples
A total of 211 EDTA-anticoagulated samples (from 211 different subjects) were col-lected between November 2019 and March 2021, consisting of 192 peripheral blood (PB),nine skin (SK), five bone marrow (BM), four lymph node (LN) and one abdominal mass(AM) specimens. From them, 92 PB samples were collected from adult healthy donors(HD), 10 of whom (11%) showed a clonal Tαβ-cell population, identified for the first timein this study by the new TRBC1 assay, and 32 from subjects with reactive expansions of Tlymphocytes. Their mean ages (±1SD) were 43 ± 10 years (y), 52 ± 13 y and 52 ± 21 y, forHD, otherwise-HD with a Tαβ-cell clone (HDc) and individuals with reactive lymphocyto-sis, respectively. The remaining 87 specimens were obtained from patients with differentdiagnostic subtypes of T-CLPD (mean age of 64 ± 16 y) (Table 1).
Table 1. Number of T-CLPD cases (n = 87), analyzed according to their WHO2017 diagnosis.
Diagnosis n. of Cases
T-PLL 10PCTCL-SS 16PCTCL-MF 6
PCTCL-NOS 1PTCL-AITL 2
Extranodal NK/T-lymphoma, nasal type 1PCTCLPD-small/medium CD4 2
Hemophagocytic syndrome 1PTCL-NOS 2
T-LGLL 40T-CLPD not classified 6
Abbreviations (alphabetical order): AITL, angioimmunoblastic T-cell lymphoma; CLPD, chronic lymphoprolifera-tive disorder; MF, mycosis fungoides; n., number; NOS, not otherwise specified; PCTCL, primary cutaneous T-celllymphoma; PCTCLPD, primary cutaneous T chronic lymphoproliferative disorder; PTCL, peripheral T-cell lym-phoma; SS, Sézary syndrome; T-LGLL, T-cell large granular lymphocyte leukemia; T-PLL, T-cell prolymphocyticleukemia; WHO, World Health Organization.
The precise distribution of samples and the study groups corresponding to the differ-ent sets of experiments performed are detailed in Supplementary Material (SupplementaryMethods and Figure S1).
2.2. General Immunophenotypic Approach
All samples were immunophenotyped using a direct immunofluorescence stain-and-then-lyse technique, based on the EuroFlow standard operating procedures (SOP) forstaining of cell surface markers only [27–29], with modifications described below for

Cancers 2021, 13, 4379 4 of 19
the different conditions tested during optimization of the TRBC1 assay. Immediately aftercompletion of sample preparation, stained cells were measured in FACSCanto II or LSR-Fortessa X-20 flow cytometers (Becton/Dickinson Biosciences (BD), San Jose, CA, USA)equipped with the FACSDivaTM software (BD), or in a 5-laser Cytek® Aurora spectral flowcytometer (Cytek Biosciences, Fremont, CA, USA), using the SpectroFlo® software (CytekBiosciences, Fremont, CA, USA). Instrument setup, calibration and daily quality control,as well as monitoring, were performed according to well-established EuroFlow proto-cols [28,29]. For data analysis, the INFINICYTTM software (Cytognos, Salamanca, Spain)was used.
2.3. Optimization of TRBC1 Staining for Flow Cytometry
In a first step, competition assays with distinct purified CD3 clones (SK7 or UCHT1)and fluorochrome-conjugated CD3 clones (SK7, REA613 and UCHT1) were performedin paired aliquots of six PB samples from HDs (Table S1A), as detailed in Supplemen-tary Methods.
The potential steric hinderance between surface membrane CD3 and TRBC1 wassubsequently tested in paired aliquots of 11 HD PB samples under four different stainingconditions: (a) staining with TRBC1 only; and with both CD3 and anti-TRBC1 reagentswhere CD3 was added; (b) 10 min after the anti-TRBC1 reagent; (c) simultaneously or(d) 10 min before TRBC1. Different fluorochrome-conjugated anti-TRBC1 and CD3 reagentswere tested. Additional conditions were evaluated to compare the number of washingsteps (1 vs. 2) and the time of staining after sample collection (immediately and at 24 h, 48 hand 72 h), as detailed in Supplementary Material (Supplementary Methods and Table S1).
The steric interaction between TCRVβ and TRBC1 was also evaluated in two PBsamples from HDs for each of the 24 TCRVβ families included in the IOTest® Beta MarkTCRVβ Repertoire Kit (Beckman Coulter, Brea, CA, USA) under three different incubationconditions (Supplementary Methods and Table S1E).
The sources and specificities of all Mab reagents used for the immunophenotypicassays are detailed in Table S2. For evaluation of TRBC1 staining, both the percentageof TRBC1-positive cells from all TCRαβ-cells, as well as their stain index (SI), were cal-culated [30]. The gating strategy employed for the identification of the different TRBC1-positive T-cell populations was carried out by selecting the most intense data peak in eithera single TRBC1 parameter histogram or a 2 D (CD3 or CD4 or CD8 vs. TRBC1) dot-plot.
2.4. PCR-Based Detection of TRBJ1 or TRBJ2 Gene Rearrangements in FACS-SortedTαβ-Cell Populations
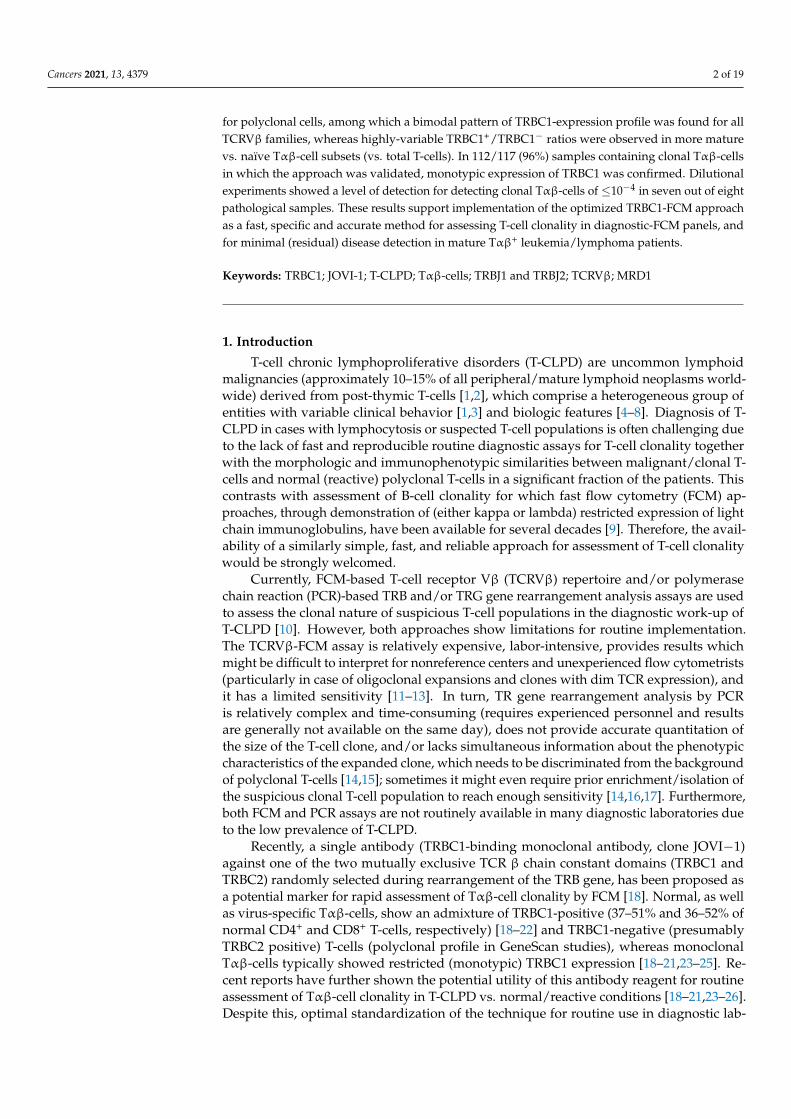
Confirmation of mutually exclusive TRBC1 vs. TRBC2 gene usage in different pop-ulations of Tαβ-cells with a TRBC1-positive vs. TRBC1-negative phenotype was as-sessed in genomic DNA extracted from 95 FACS-sorted (FACSAria III, BD Biosciences,San Jose, CA, USA) CD3+ TαβCD4+ and TαβCD8+ cell populations from 28 different indi-viduals (purity ≥ 95%) that showed optimal PCR amplification of the TRBJ gene productbased on the presence of single TRBJ1 vs. double TRBJ1+TRBJ2 gene rearrangement pat-terns, respectively. For this purpose, well-established EuroClonality/BIOMED-2 primers,protocols and criteria [15] were used, based on the fact that both TRBC genes are precededby the corresponding TRBJ genes (TRBC1 is preceded by six TRBJ1 genes while TRBC2 ispreceded by seven TRBJ2 genes; Figure 1) [31,32]. For these studies, either the GenEluteTM
Mammalian Genomic DNA Miniprep Kit (Sigma-Aldrich, St Louis, MO, USA) or the Ge-nomic Tissue DNA Kit (ThermoFisher Scientific, Waltham, MA, USA) were used, as perthe instructions of the manufacturers.

Cancers 2021, 13, 4379 5 of 19
(A)
(B)
(D)
(C)
Figure 1. Schematic representation of TRB gene rearrangement and interpretation of the TRBC1antibody (JOVI-1 clone)-based flow cytometry approach: (A) Mutually exclusive TRBC selectionduring TRB gene rearrangement in the thymus; (B,C) Representation of the two resulting TRBcomplex structures, composed of either the TRBC1 (B) or the TRBC2 (C) proteins, and specificbinding of the anti-TRBC1 antibody to TRBC1 but not to TRBC2; (D) Illustrative histograms ofTRBC1 staining of blood Tαβ-cells from: (I) one representative adult HD, showing the bimodalTRBC1 expression pattern, typical of polyclonal Tαβ-cells (TRBC1+ in light blue and TRBC1− ingreen); (II) one HDc showing a minor TRBC1+ (clonal) Tαβ-cell population (in red), among a majorityof polyclonal Tαβ-cells; and (III) one LGLL case with a major population of TRBC1− monoclonalTαβ-cells (in red) with a minor background of polyclonal Tαβ-cells. Monoclonal T-cells were selectedby the presence of a phenotypic aberrancy and/or expression of a single TCRVβ family, both in HDc(e.g., CD8+TCRVβ16+) and in LGLL (e.g., CD8+CD279++) cases. Abbreviations (alphabetical order):HD, healthy donor; HDc, healthy donor with a small Tαβ-cell clone in blood; LGLL, large granularlymphocytic leukemia.
2.5. Analysis of the TRBC1+/TRBC1− Ratio in Distinct Subsets of Normal Tαβ-Cells Defined bythe TCRVβ Family Expressed and Their Maturation Stage
Both within total Tαβ-cells and their major (TαβCD4+, TαβCD8+, TαβDP and TαβDNcells) subsets, the TRBC1+/TRBC1− ratio within each cell population defined by the ex-pression of the different TCRVβ families was analyzed in a group of 27 PB samples (12 HD,10 patients with reactive lymphocytosis and five HDc whose clonal T-cell populationswere excluded from the analysis), stained with the IOTest® Beta Mark TCRVβ RepertoireKit (Beckman Coulter), following the CD3-10 min-TRBC1 and the TRBC1-10 min-TCRVβ
conditions described in Supplementary Material (Table S1F).In turn, the TRBC1+/TRBC1− ratio for the distinct maturation-associated compart-
ments of normal Tαβ-cells (i.e., naïve, central memory, transitional memory, effectormemory, early effector and terminal effector T-cells and regulatory T-cells), identifiedaccording to the phenotypic profile shown in Table S3, was investigated in PB samplesfrom 10 HD (Table S1G).

Cancers 2021, 13, 4379 6 of 19
2.6. Assessment of T-Cell Clonality on FACS-Sorted Cell Populations for Patients with T-CLPD vs.Reactive Lymphocytosis and Healthy Donors
The (mono)clonal vs. polyclonal nature of Tαβ-cell populations from patients withT-CLPD and reactive lymphocytosis, as well as HD (including the small Tαβ-cells clonesfrom HDc, and the different maturation-associated compartments of Tαβ-cell populationsfrom HD) was assessed in highly-purified (≥95% purity) FACS-sorted cells (purified from3–5 mL of whole blood using a FACSAria-III cell sorter, BD Biosciences, San Jose, CA, USA),as previously described [10,14,15], based on the presence (vs. absence) of single vs. a fewdominant TRB and/or TRG gene rearrangements for clonal and oligoclonal/polyclonal cellsubsets, respectively. In one T-cell large granular lymphocyte leukemia (T-LGLL) patientand five T-cell prolymphocytic leukemia (T-PLL) patients, T-cell clonality was furtherestablished on purified cells through confirmation of the presence of STAT3 (somatic)mutations and the demonstration of TCL1 (or MTCP1) gene translocations, respectivelymboxciteB1-cancers-1320004,B33-cancers-1320004,B34-cancers-1320004.
2.7. Validation of the TRBC1-FCM Assay against Conventional Molecular and FCM Techniquesfor Detection of Clonal Tαβ-Cells
The specificity of the TRBC1-FCM assay for identification of (true) polyclonal vs.monoclonal cell populations was validated using different fluorochrome conjugates, BV421,BV480, dyomics (Dy) 634 or FITC, of the anti-TRBC1 antibody reagent in 24 poly/oligoclonaland 93 monoclonal samples, as determined by the TCRVβ Repertoire FCM Kit, PCR [15]and/or by the presence of specific gene mutations (e.g., STAT3 mutations in T-LGLL).Of the 89/93 (mono)clonal samples (96%) a final WHO diagnosis [1] was available in79 T-CLPD cases, while the other 10 cases concerned HDc samples.
2.8. Serial Dilution Experiments of Pathological Tαβ-Cells in Normal Blood Cells
The sensitivity of the TRBC1-FCM approach for detecting clonal Tαβ-cells was de-termined using both real and in silico serial dilutional experiments of PB samples (orFCM events) from T-CLPD tumor cells in normal PB. For this purpose, a total of eightexperiments were performed in six patients, including parallel real and in silico dilutionsin two out of six cases, and four in silico dilutions carried out in the other four cases. In allcases, dilution of the T-CLPD patient blood in PB samples from HD at 1:10, 1:100, 1:1000and 1:10,000 tumor cells/normal cell ratios were performed. In each case, the pathologicalpopulation was identified based on the presence of an aberrant phenotype (e.g., CD5−)plus restricted expression of a single TCRVβ family, without using the TRBC1 staining forselection of the suspicious cell population. Per dilutional experiment ≥500,000 target cellswere acquired and a minimum of 50 clustered cellular events were required to considerthem as a cell population.
2.9. Statistical Methods
The nonparametric Mann–Whitney U test and the Spearman’s correlation test (for con-tinuous variables), together with the Fisher exact test (for categorical variables), were used forgroup comparisons, performed with the IBM-SPSS software (v25.0; IBM, Armonk, NY, USA)and/or GraphPad Prism software (v5.01; GraphPad, San Diego, CA, USA). Prior to the com-parisons, conventional normality tests (Q-Q plots, P-P plots and Kolmogorov-Smirnovtest) were used to check for the normal (Gaussian) distribution of individual variables.p-values ≤ 0.05 were considered to be associated with statistical significance.
3. Results3.1. Optimization of TRBC1 Staining by FCM
A significant decline of median fluorescence intensity (MFI) values for the fluorochrome-conjugated SK7, REA613 and UCHT1 CD3 clones was observed when the purified (uncon-jugated) SK7 and UCHT1 clones had been added prior to staining for all antibody clonecombinations tested in the competition assays, compared to both simultaneous addition

Cancers 2021, 13, 4379 7 of 19
of a mixture of the purified (unconjugated) and fluorochrome-conjugated antibodies andparticularly, addition of fluorochrome-conjugated CD3 reagents 10 min before the purifiedantibodies (Figure 2A,B). These results support that all clones tested recognize the same (oroverlapping) CD3 epitope, as previously reported for e.g., SK7 and UCHT1 [35].
Cancers 2021, 13, 4379 7 of 20
3. Results 3.1. Optimization of TRBC1 Staining by FCM
A significant decline of median fluorescence intensity (MFI) values for the fluoro-chrome-conjugated SK7, REA613 and UCHT1 CD3 clones was observed when the puri-fied (unconjugated) SK7 and UCHT1 clones had been added prior to staining for all anti-body clone combinations tested in the competition assays, compared to both simultaneous addition of a mixture of the purified (unconjugated) and fluorochrome-conjugated anti-bodies and particularly, addition of fluorochrome-conjugated CD3 reagents 10 min before the purified antibodies (Figure 2A,B). These results support that all clones tested recog-nize the same (or overlapping) CD3 epitope, as previously reported for e.g., SK7 and UCHT1 [35].
Figure 2. Impact of CD3 and TCRVβ antibody staining on the expression profile of TRBC1. (A) Competition assays performed in 6 paired PB samples stained with different fluorochrome-conju-gated CD3 clones (n = 3, SK7, REA613 and UCHT1) and unconjugated (=purified) CD3 reagents (SK7 and UCHT1) clones, tested under three different incubation conditions: (a) addition of the conjugated reagent first followed by a 10 min incubation before the unconjugated antibody was added; (b) simultaneous addition of the fluorochrome-conjugated and unconjugated antibody
Figure 2. Impact of CD3 and TCRVβ antibody staining on the expression profile of TRBC1. (A) Competition assaysperformed in 6 paired PB samples stained with different fluorochrome-conjugated CD3 clones (n = 3, SK7, REA613 andUCHT1) and unconjugated (=purified) CD3 reagents (SK7 and UCHT1) clones, tested under three different incubationconditions: (a) addition of the conjugated reagent first followed by a 10 min incubation before the unconjugated antibodywas added; (b) simultaneous addition of the fluorochrome-conjugated and unconjugated antibody reagents; and (c) additionof the unconjugated reagent first (10 min before) followed by the fluorochrome-conjugated reagent (p-value ≤ 0.05 for¥ purified + conjugated vs. conjugated 10′ and then purified reagent, and for § purified 10′ and then conjugated vs.purified + conjugated reagent). (B) Illustrative graphical dot-plots of TαβCD4+ cells (pink dots) and B cells (dark greendots) stained in competition assays described in A; (C–E) percentage of TRBC1+ Tαβ-cells and the SI and MFI of TRBC1+
Tαβ-cells stained under four different conditions (staining with TRBC1 only vs. both CD3 and TRBC1 where CD3 was added10′ after, simultaneously or 10′ before TRCB1) (p-value ≤ 0.05 for * any condition vs. TRBC1 only and for # any conditionvs. CD3 10′ and then TRBC1); (F–G) Comparison of 3 different incubation conditions for the TRBC1 and TCRVβ antibodyreagents are displayed as SI for TRBC1 and TCRVβ reagents as readout, respectively. Symbols and color codes in panelsA-E are as follows: TRBC1-FITC, triangle; TRBC1-BV421, circle; CD3-APC-SK7, dark blue; CD3-PECy7-SK7, light blue;CD3-APC-REA613, dark red; CD3-PEVio770-REA613, orange; and CD3-APC-UCHT1, light green; gray identifies any CD3reagent. In the box-plot graphics, dots correspond to results from individual experiments while notched boxes represent25th and 75th percentile values, lines inside the box correspond to median values (50th percentile) and whiskers representminimum and maximum values. Stain index (SI) was calculated as (MFIPP −MFINP)/2 × rSDNP where MFI representsmedian fluorescence intensity values (arbitrary units scaled from 0 to 262,144), rSD is the robust standard deviation, and PPand NP are used as abbreviations for the TRBC1 positive and the TRBC1 negative Tαβ-cell populations, respectively. Otherabbreviations (alphabetical order): APC, allophycocyanin; BV, brilliant violet; Cy, cyanin; FITC, fluorescein-5-isothiocyanate;PacB, pacific blue; PB, peripheral blood; PE, phycoerythrin.

Cancers 2021, 13, 4379 8 of 19
Staining with TRBC1 in the absence of CD3 was associated with clear staining ofa fraction of the lymphocytes, but unwanted levels of background fluorescence in anothersubset of the lymphoid T-cells. This led to relatively low SI (Figure 2C, D). In turn, stainingfor TRBC1 in the presence (vs. absence) of CD3 was associated with a significantly im-proved discrimination between TRBC1+ vs. TRBC1− Tαβ-cells and significantly higher SI;despite this, absence of CD3 did not impact the percentage of TRBC1+ Tαβ-cells identified(Figure 2C,D). When we compared different incubation conditions for the CD3 and TRBC1double-staining on the TRBC1 expression profile in terms of both SI and MFI of the TRBC1+
and TRBC1− Tαβ-cell populations (Figure 2D,E), we found that addition of TRBC1 eitherprior or simultaneously to (but not after) CD3 was associated with the highest TRBC1SI on Tαβ-cells and, thereby, a more clear discrimination between TRBC1+ and TRBC1−
Tαβ-cells (Figure 2D) was observed, with progressively decreased MFI values of TRBC1+
at the expense of greater (p < 0.05) CD3 MFI values in Tαβ-cells (Figure 2E). Of note is thata similar staining profile was observed for the different CD3 clones, as well as CD3 andTRBC1 fluorochrome conjugates tested (Figures 2C–E and S2).
In contrast to the lower TRBC1 SI found when CD3 was added prior to TRBC1, noimpact (p > 0.05) was observed on the TRBC1 SI when TCRVβ reagents were added first(prior to TRBC1), for any of the other incubation conditions tested; likewise, the TCRVβ SIwas similar for all staining conditions evaluated (Figures 2F,G and S2).
Additional testing concerning the number of washing steps showed that performing1 vs. 2 washes after adding the lysing solution did not have an impact on the TRBC1 SI(Figure S2). Similarly, TRBC1-FITC labeling did not decrease with time (vs. 0 h) even whensample staining was performed 72 h after blood collection, while the TRBC1-BV421 SI wassignificantly reduced when samples were stained 48 h after collection or later (Figure S2).
3.2. TRBJ Gene Rearrangements in FACS-Sorted TRBC1+ and/or TRBC1− Tαβ+-Cell Populations
FACS-sorted TRBC1+ populations of total Tαβ+ cells showed functionally rearrangedTRBJ1 sequences in 44 of 47 cell populations (94%) investigated, while rearrangements con-firming the presence of the TRBJ1+TRBJ2 gene rearrangements were found in the remainingthree of 47 (6%) cell populations. In contrast, FACS-sorted TRBC1− cell populations showedrearranged genes containing both the TRBJ1 and TRBJ2 sequences in all 48 (100%) cell popu-lations tested at the DNA level, regardless of their clonal status (monoclonal, oligoclonal orpolyclonal populations) and, therefore, of the sample origin (HD, reactive lymphocytosis,HDc or T-CLPD) (Table 2).
Table 2. TRBJ gene rearrangements of FACS-sorted TRBC1 positive and/or TRBC1 negative Tαβ+
cell populations (n = 95).
TRBC1 Expressionby FCM
Clonality Status ofTRBC1 Stained Cell
Populations 1
TRBJ Rearrangement
JB1 JB1+JB2
Positive(n = 47)
Monoclonal (n = 4) 4 0Oligoclonal (n = 3) 3 0Polyclonal (n = 40) 37 3
TOTAL 44/47 (94%) 3/47 (6%)
Negative(n = 48)
Monoclonal (n = 3 2) 0 3Oligoclonal (n = 4) 0 4Polyclonal (n = 41) 0 41
TOTAL 0 48/48 (100%)All FACS-sorted cell populations (purity ≥ 95%) showed unequivocal expression of CD3 on the cell surfacemembrane by FCM with optimal PCR amplification of the TRBJ gene product. Monoclonal populations wereisolated from three HDc and four T-CLPD patients; oligoclonal populations from three reactive lymphocytosis,two HDc and one T-CLPD patient; and polyclonal populations from 13 HD, seven reactive lymphocytosis, fourHDc and two T-CLPD patients. 1 The clonal nature (mono vs. oligo vs. polyclonal) of each purified cell populationwas assessed by TRB gene rearrangement analysis. 2 One cell population had CD3high expression. Abbreviations(alphabetical order): FCM, flow cytometry; N, number; PCR, polymerase chain region; TR, T-cell receptor.

Cancers 2021, 13, 4379 9 of 19
3.3. Ranges for Polyclonal (Normal and Reactive) Tαβ-Cells and Major Tαβ-Cell Populations
Total Tαβ-cells from normal PB (n = 65 HD) showed a mean (±SD) percentage ofTRBC1+ cells of 39 ± 5.8%, which translated into a TRBC1+/TRBC1− ratio of 0.63 ± 0.062.Of note is this TRBC1+/TRBC1− ratio varied significantly for some of the major Tαβ-cell subsets in the same set of (normal) samples: TαβCD4+, 0.72 ± 0.062 (p = 0.003);TαβCD8+, 0.50± 0.081 (p < 0.0001); TαβDP, 0.51± 0.13 (p = 0.001); and TαβDN, 0.38± 0.11(p < 0.0001) (Table S4). In parallel, the percentage of TRBC1+ cells and the correspondingTRBC1+/TRBC1− ratios were also calculated for the same major PB subsets of Tαβ-cellsfrom subjects with reactive lymphocytosis (n = 18), with a similar distribution to thatobserved for normal PB Tαβ-cells (Table S4). Thereby, the percentage of TRBC1+ cells andthe TRBC1+/TRBC1− ratio of HD plus reactive lymphocytosis (n = 83) was calculated andused to derive normal range values for polyclonal (normal and reactive) cells (Table 3). Forthis purpose, the mean ± 3 standard deviations, which define intervals where 99.73% ofTRBC1+/TRBC1− ratios from polyclonal cells fall, were used as cut-off values for definingmonoclonal vs. polyclonal Tαβ-cell profiles (Table 3). Based on these cut-offs, the normalrange for the TRBC1+/TRBC1− ratio for total Tαβ-cells extended from 0.25 to 1.4; forTαβCD4+ cells it ranged from 0.31 to 1.6, and for TαβCD8+ from 0.091 to 1.6 (Table 3).
Table 3. Ranges for polyclonal (normal and reactive) total Tαβ-cells and their major Tαβ-cell populations in PB (n = 83) asdefined by the mean percentage of TRBC1+ cells and the mean TRBC1+/TRBC1− ratio ± 3 standard deviations (3 SD).
Tαβ-CellSubset
% TRBC1+ Cells * TRBC1+/TRBC1− RatioProbability (%) of Finding AClonal Tαβ Expansion When
TRBC1+/TRBC1− Ratio isOutside the Range Mean ± 3 SD
(ρ-Value)Mean ± 1 SD Range(Mean ± 3 SD) Mean ± 1 SD Range
(Mean ± 3 SD)
Tαβ cells 40 ± 6.7 20–60 0.66 ± 0.071 0.25–1.4
99.73%(<0.001)
Tαβ CD4+ 43 ± 6.3 24–62 0.75 ± 0.067 0.31–1.6Tαβ CD8+ 35 ± 8.8 8.3–61 0.53 ± 0.096 0.091–1.6
Tαβ DP 36 ± 12 1.6–71 0.57 ± 0.13 0.016–2.5Tαβ DN 29 ± 10 0-61 0.41 ± 0.12 0–1.5
* Conventional normality tests confirmed that this variable showed a Gaussian distribution. Abbreviations (alphabetical order): DN, doblenegative; DP, double positive; PB, peripheral blood; SD, standard deviation; TR, T-cell receptor.
3.4. TRBC1+/TRBC1− Ratio of Normal Polyclonal Tαβ-Cells and Their TCRVβ andMaturation-Associated Subsets in Normal Blood
For every TCRVβ subset of Tαβ-cells from HD, a bimodal distribution was observed,with both TRBC1+ and TRBC1− cells. However, TRBC1+ and TRBC1− Tαβ-cells weredifferentially distributed according to the TCRVβ family expressed (Figure 3A). Thus,the median TRBC1+/TRBC1− ratio observed for Tαβ-cell subsets that expressed oneof the 24 TCRVβ families ranged from 0.56 to 1.1 (Figure 3A). As expected, a bimodalTRBC1 expression profile was also observed when the analysis was restricted to the ma-jor subsets of Tαβ-lymphocytes expressing different TCRVβ families (Figure S3). Thus,TRBC1+/TRBC1− ratios for the major Tαβ-cell subsets of TαβCD4+, TαβCD8+, TαβDPand TαβDN cells, expressing different TCRVβ families ranged from 0.61 to 1.2, from 0.33to 0.85, from 0.25 to 1.4 and from 0.25 to 0.77, respectively (Figure S3).

Cancers 2021, 13, 4379 10 of 19
Cancers 2021, 13, 4379 10 of 20
3.4. TRBC1+/TRBC1− Ratio of Normal Polyclonal Tαβ-Cells and Their TCRVβ and Maturation-Associated Subsets in Normal Blood
For every TCRVβ subset of Tαβ-cells from HD, a bimodal distribution was observed, with both TRBC1+ and TRBC1- cells. However, TRBC1+ and TRBC1− Tαβ-cells were differ-entially distributed according to the TCRVβ family expressed (Figure 3A). Thus, the me-dian TRBC1+/TRBC1- ratio observed for Tαβ-cell subsets that expressed one of the 24 TCRVβ families ranged from 0.56 to 1.1 (Figure 3A). As expected, a bimodal TRBC1 ex-pression profile was also observed when the analysis was restricted to the major subsets of Tαβ-lymphocytes expressing different TCRVβ families (Figure S3). Thus, TRBC1+/TRBC1- ratios for the major Tαβ-cell subsets of TαβCD4+, TαβCD8+, TαβDP and TαβDN cells, expressing different TCRVβ families ranged from 0.61 to 1.2, from 0.33 to 0.85, from 0.25 to 1.4 and from 0.25 to 0.77, respectively (Figure S3).
Figure 3. TRBC1+/TRBC1− ratio of normal total Tαβ-cells according to the specific TCRVβ family member expressed and their maturation stage. (A) TRBC1+/TRBC1− ratio of total Tαβ-cells within each of the different TCRVβ families identified by immunophenotype in 12 HD (gray dots), 10 patients with reactive lymphocytosis (green dots) and 5 otherwise healthy individuals showing a clonal expansion of Tab cells in blood (HDc, red plots). In these latter subjects, the TCRVβ clonal population was removed from analysis. Colored horizontal lines are median values of the corre-sponding group of subjects (p-value ≤ 0.05 for * reactive lymphocytosis vs. HD and for # HDc vs. HD) (B,C) TRBC1+/TRBC1- ratio observed among normal Tαβ-cells from 10 HD, distributed into different maturation-associated compartments, represented both in individual ratio values per maturation stage (B) and their deviation from the median value (percentile 50 = 0; C) (¥ρ-value ≤ 0.05 vs. total Tαβ-cells) In all panels, dots correspond to results from individual experiments while notched boxes represent 25th and 75th percentile values, lines inside the box correspond to me-dian values (50th percentile) and whiskers represent minimum and maximum values. The contin-uous horizontal and dotted lines that cover the entire graph correspond to median values (percen-tile 50) and both the 5th and 95th percentiles (P5 and P95), respectively. Cases below P5 are de-picted in blue, while cases above P95 are colored as orange dots. Abbreviations (alphabetical or-der): CM, central memory; DN, double negative (TαβCD4-CD8-/lo) Tαβ-cells; DP, double positive (TαβCD4+CD8+) Tαβ-cells; EE, early effector; EM, effector memory; HD, healthy donor; HDc,
Figure 3. TRBC1+/TRBC1− ratio of normal total Tαβ-cells according to the specific TCRVβ familymember expressed and their maturation stage. (A) TRBC1+/TRBC1− ratio of total Tαβ-cells withineach of the different TCRVβ families identified by immunophenotype in 12 HD (gray dots), 10 patientswith reactive lymphocytosis (green dots) and 5 otherwise healthy individuals showing a clonalexpansion of Tab cells in blood (HDc, red plots). In these latter subjects, the TCRVβ clonal populationwas removed from analysis. Colored horizontal lines are median values of the correspondinggroup of subjects (p-value ≤ 0.05 for * reactive lymphocytosis vs. HD and for # HDc vs. HD) (B,C)TRBC1+/TRBC1− ratio observed among normal Tαβ-cells from 10 HD, distributed into differentmaturation-associated compartments, represented both in individual ratio values per maturationstage (B) and their deviation from the median value (percentile 50 = 0; (C)) (¥ ρ-value ≤ 0.05 vs. totalTαβ-cells) In all panels, dots correspond to results from individual experiments while notched boxesrepresent 25th and 75th percentile values, lines inside the box correspond to median values (50thpercentile) and whiskers represent minimum and maximum values. The continuous horizontal anddotted lines that cover the entire graph correspond to median values (percentile 50) and both the 5thand 95th percentiles (P5 and P95), respectively. Cases below P5 are depicted in blue, while casesabove P95 are colored as orange dots. Abbreviations (alphabetical order): CM, central memory; DN,double negative (TαβCD4−CD8−/lo) Tαβ-cells; DP, double positive (TαβCD4+CD8+) Tαβ-cells; EE,early effector; EM, effector memory; HD, healthy donor; HDc, healthy donor with a small Tαβ-cellclone in blood; TE, terminal effector; TM, transitional memory; Treg, regulatory T-cells.
Subsequently, we investigated the TRBC1+/TRBC1− ratio distribution within differentmaturation-associated compartments of Tαβ-cells from a subgroup of 10 HD (Figure 3B).Our results showed that at earlier maturation stages (i.e., naïve, central memory and transi-tional memory cells as well as regulatory Tαβ-cells) most samples were within the 5th and95th percentiles observed for the total population of Tαβ-cells in normal/reactive blood. Incontrast, at the more mature stages of effector memory, early effector and terminal effectorTαβ-cells, a statistically significant number of cases were outside the normal (5th and95th percentile) range observed for total Tαβ-cells (i.e., more dispersed TRBC1+/TRBC1−
ratios) (Figure 3B,C). A similar profile distribution was found for TRBC1+/TRBC1− ra-tios of the different Tαβ-cell subsets, meaning that in most samples earlier maturation

Cancers 2021, 13, 4379 11 of 19
stages (naïve and central/transitional memory stages) were inside the 5th and 95th per-centiles observed for the total population of TαβCD4+, TαβCD8+, TαβDP and TαβDNcells (Figure S3), while more mature cell subsets mostly fell outside the 5th and 95thpercentile values of total Tαβ-cells in blood samples from HD (Figure S3).
3.5. TRBC1+/TRBC1− Ratio of Polyclonal Tαβ-Cells Expressing Different TCRVβ Families inPatients with Reactive Lymphocytosis and HDc Blood
A bimodal distribution of TRBC1+ and TRBC1−, differentially distributed accordingto the specific TCRVβ family expressed, was observed among Tαβ-cells and their majorsubsets in reactive lymphocytosis and HDc samples (Figure 3A and Figure S3). Thus,the median TRBC1+/TRBC1− ratio observed for each of the 24 TCRVβ families of Tαβ-cells ranged from 0.64 to 1.6 in blood of patients with reactive lymphocytosis and from 0.54to 1.6 in HDc (Figure 3A), with nine of 24 values (38%) in reactive lymphocytosis casesand five of 24 values (21%) in HDc cases samples outside the 5th and 95th percentiles asobserved in HD (Figure 3 A). TRBC1+/TRBC1− ratios for the different Tαβ-cell subsets(TαβCD4+, TαβCD8+, TαβDP and TαβDN cells) expressing different TCRVβ familiesfrom reactive lymphocytosis and HDc are detailed in legend to Figure S3.
3.6. Comparison between the TRBC1-FCM Assay and Conventional TCRVβ-FCM and/orMolecular Techniques for Assessment of Tαβ-Cell Clonality
Upon comparing the TRBC1-FCM assay with the reference TCRVβ-FCM and/ormolecular techniques for assessment of Tαβ-cell clonality, concordant results were found in112 of 117 cases (96%) (Table 4). Concordant cases corresponded to 21 of 24 poly/oligoclonalcases (87%) that showed a polytypic TRBC1 profile by FCM and 91 of 93 monoclonal sam-ples (98%) that displayed a monotypic TRBC1-FCM pattern. There were only five of117 discrepant cases (4.3%), either because cases that were classified as poly/oligoclonal byPCR showed a monotypic pattern of TRBC1 (n = 3) or because monoclonal cases by PCRshowed a polytypic TRBC1 pattern (n = 2). Additional information on these five discrepantcases is provided in detail in Table S5 and Figure S4 and discussed below. Thus, two ofthree PCR polyclonal samples (cases #1 and #2) in whole blood, showed a monotypicTRBC1 expression with TRBC1+/TRBC1− ratios of <0.01 and >99 within the population(s)of phenotypically aberrant (CD2lo CD3lo CD5−/lo or ++) Tαβ-cells that represented 2.5%and 5.9% of all blood leukocytes, respectively. In the remining (discordant) sample (case#3) classified as oligoclonal by PCR (analyzed on FACS-purified cells), a monotypic ex-pression of TRBC1 with a TRBC1+/TRBC1− ratio of 8.0 was observed. This latter cellpopulation phenotypically consisted of terminal-effector cytotoxic Tαβ-cells in the absenceof an immunophenotypically aberrant phenotype. Conversely, two samples (cases #4 and#5) analyzed in whole PB were considered monoclonal by PCR but showed a polytypicpattern of expression of TRBC1 by FCM with TRBC1+/TRBC1− ratios of 0.45 and 0.37,respectively. One of these was diagnosed as reactive T-cell lymphocytosis associated withacute Epstein-Barr virus (EBV) infection (case #4) while the second was unclassifiable (case#5) in the absence of definitive diagnostic criteria for T-LGLL (Table S5 and Figure S4).
Table 4. Comparison between TRBC1 assay by FCM and the reference molecular and FCM techniquesused to assess Tαβ-cell clonality (n = 117).
Clonality Status byOther Techniques *
TRBC1 Expression Pattern by FCMp-ValuePolytypic
(n = 23)Monotypic
(n = 94)
Poly/oligoclonal (n = 24) 21/24 (87%) 3/24 (13%)<0.0001Monoclonal (n = 93) 2/93 (2%) 91/93 (98%)
Concordant cases are highlighted in bold. * Clonality assessed by PCR, TCRVβ family expression by FCM and/orgene mutation assays. Abbreviation: FCM, flow cytometry; PCR, polymerase chain region; TR, T-cell receptor.

Cancers 2021, 13, 4379 12 of 19
Patients that could be finally classified into a precise WHO diagnostic category ofT-CLPD (n = 79), as well as HD in whom a minor population of clonal Tαβ-cells wasdetected in blood in this study (n = 10), were divided into two groups according totheir TRBC1 expression profile for the clonal Tαβ-cells: TRBC1+ vs. TRBC1− (Table 5).Interestingly, while in T-PLL (postulated to derive from naïve/central memory cells)TRBC1+ only represented three of 10 (30%) cases investigated, among primary cutaneousT-cell lymphoma (PCTCL)-Sézary syndrome (SS) TRBC1+ cases represented 80% (12 of 15)of the patients, respectively (Table 5). In turn, a frequency of TRBC1+ cases of 50% and 56%was found among PCTCL-mycosis fungoides (MF) (three of six patients) and T-LGLL cases(22 of 39 patients) (Table 5). The TRBC1 expression pattern in other diagnostic categories ofT-CLPD is anecdotal, due to the low number of cases investigated. Among HDc, TRBC1was expressed in nine of 10 (90%) cases identified (Table 5).
Table 5. TRBC1 expression profile in different WHO diagnostic categories of SmCD3+ Tαβ-cell CLPD(n = 79) plus HDc (n = 10).
WHO 2017 Diagnosis TRBC1+
(n = 52)TRBC1−(n = 37)
T-PLL (n = 10) 3/10 (30%) 7/10 (70%)PCTCL-SS (n = 15) 12/15 (80%) 3/15 (20%)PCTCL-MF (n = 6) 3/6 (50%) 3/6 (50%)
PCTCL-NOS (n = 1) 0/1 (0%) 1/1 (100%)PTCL-AITL (n = 2) 0/2 (0%) 2/2 (100%)
Extranodal NK/T-lymphoma, nasal type (n = 1) 0/1 (0%) 1/1 (100%)PCTCLPD-small/medium CD4 (n = 2) 2/2 (100%) 0/2 (0%)
Hemophagocytic syndrome (n = 1) 0/1 (0%) 1/1 (100%)PTCL-NOS (n = 2) 1/2 (50%) 1/2 (50%)
T-LGLL (n = 39) 22/39 (56%) 17/39 (44%)HDc * (n = 10) 9/10 (90%) 1/10 (10%)
14/52 (27%) of TRBC1 positive cases were TRBC1lo, and 6/14 (43%) of TRBC1lo cases were CD3lo. * Informationabout the expression profile of TRBC1 is referred to clonal cells. Abbreviations (alphabetical order): AITL,angioimmunoblastic T-cell lymphoma; CLPD, chronic lymphoproliferative disorders; HD, healthy donor; HDc,healthy donor with a small Tαβ-cell clone in blood; MF, mycosis fungoides; NOS, not otherwise specified;PCTCL, primary cutaneous T-cell lymphomas; PCTCLPD, primary cutaneous T chronic lymphoproliferativedisorder; PTCL, peripheral T-cell lymphoma; Sm, surface membrane; SS, Sézary syndrome; T-LGLL, T-celllarge granular lymphocyte leukemia; T-PLL, T-cell prolymphocytic leukemia; TR, T-cell receptor; WHO, WorldHealth Organization.
3.7. Utility of TRBC1 for Sensitive FCM Detection of Clonal Tαβ-Cellsi in Serial DilutionExperiments of Pathological Tαβ-Cells in Normal Blood Cells
Serial dilution experiments (n = 8) of PB clonal Tαβ-cells in normal leukocytes, per-formed both directly and in silico (Figure S5), showed a high degree of correlation be-tween the percentage of clonal Tαβ-cells identified among cells that displayed an aber-rant/suspicious phenotype by monotypic expression of TRBC1 vs. expression of a specificTCRVβ region (R2 = 0.966; p < 0.001) with a sensitivity of at least 10−4 in seven of eight(88%) dilutional experiments (Figure 4). Further identification of clonal Tαβ-cells based onboth the pattern of expression of TRBC1 and a specific TCRVβ family (vs. TRBC1 alone)showed a slightly improved correlation (R2 = 0.999; p < 0.0001), with a sensitivity of at least10−4 in eight of eight (100%) experiments (Figure 4).

Cancers 2021, 13, 4379 13 of 19
Cancers 2021, 13, 4379 13 of 20
3.7. Utility of TRBC1 for Sensitive FCM Detection of Clonal Tαβ-Cellsi in Serial Dilution Experiments of Pathological Tαβ-Cells in Normal Blood Cells
Serial dilution experiments (n = 8) of PB clonal Tαβ-cells in normal leukocytes, per-formed both directly and in silico (Figure S5), showed a high degree of correlation be-tween the percentage of clonal Tαβ-cells identified among cells that displayed an aber-rant/suspicious phenotype by monotypic expression of TRBC1 vs. expression of a specific TCRVβ region (R2 = 0.966; p < 0.001) with a sensitivity of at least 10−4 in seven of eight (88%) dilutional experiments (Figure 4). Further identification of clonal Tαβ-cells based on both the pattern of expression of TRBC1 and a specific TCRVβ family (vs. TRBC1 alone) showed a slightly improved correlation (R2 = 0.999; p < 0.0001), with a sensitivity of at least 10−4 in eight of eight (100%) experiments (Figure 4).
Figure 4. Sensitivity of the TRBC1 marker for detection of clonal Tαβ-cells in serial dilutional exper-iments of clonal tumor cells in normal blood cells. Scatter plot showing the correlation between the percentage of TCRVβ+ vs. TRBC1+ cells (crosses and dotted line) and between the percentage of TCRVβ+ vs. (TRBC1+ and TCRVβ+) clonal cells (circles and solid line) within a specific T-cell popu-lation showing an aberrant/suspicious phenotype for both undiluted (total) samples and serially diluted (from 10−1 to 10−4) samples. TCRVβX refers to any of the specific (clonal) TCRVβ family ex-pressed by each case (e.g., TCRVβ22). For each correlation, the estimated linear regression equation, the Spearman’s Rho correlation coefficient and the corresponding p-values are shown (based on 8 dilution experiments).
4. Discussion Several recent reports have proposed the introduction of the TRBC1-based FCM as-
say as a potentially useful approach to assess Tαβ-cell clonality in the diagnostic work-up of patients suspicious of T-CLPD [18–21,23–26]. Despite this, optimization of the antibody staining conditions, as well as reference ranges for normal and reactive polyclonal Tαβ-cells and their major subsets, together with the sensitivity and specificity of the TRBC1 assay for detecting clonal Tαβ-cells, remain to be fully established prior to its diagnostic routine use. Here we defined the most appropriate staining conditions to obtain the best resolution between TRBC1+ and TRBC1- Tαβ-cells. In addition, we established, for the first time, reference TRBC1+/TRBC1− ranges in PB for normal and reactive polyclonal Tαβ-cells and their major Tαβ-cell populations. At the same time, we provide preliminary data on the distribution of TRBC1+ and TRBC1- Tαβ-cells according to the specific TCRVβ family expressed by total Tαβ-cells (and their major subsets) and their maturation stage. Finally, we confirm and extend on previous observations [18,21,25,26] about the analytical sensi-tivity and specificity of the assay for detecting monoclonal vs. poly/oligoclonal Tαβ-cell populations, even when present at low frequencies in blood.
Since both CD3 and anti-TRBC1 antibodies recognize physically close epitopes of the CD3/TCRαβ complex [36,37], we first tested the potential steric interaction between both groups of antibody reagents for optimization of the TRBC1 staining. Our results showed
Figure 4. Sensitivity of the TRBC1 marker for detection of clonal Tαβ-cells in serial dilutionalexperiments of clonal tumor cells in normal blood cells. Scatter plot showing the correlation betweenthe percentage of TCRVβ+ vs. TRBC1+ cells (crosses and dotted line) and between the percentageof TCRVβ+ vs. (TRBC1+ and TCRVβ+) clonal cells (circles and solid line) within a specific T-cellpopulation showing an aberrant/suspicious phenotype for both undiluted (total) samples and seriallydiluted (from 10−1 to 10−4) samples. TCRVβX refers to any of the specific (clonal) TCRVβ familyexpressed by each case (e.g., TCRVβ22). For each correlation, the estimated linear regression equation,the Spearman’s Rho correlation coefficient and the corresponding p-values are shown (based on8 dilution experiments).
4. Discussion
Several recent reports have proposed the introduction of the TRBC1-based FCM assayas a potentially useful approach to assess Tαβ-cell clonality in the diagnostic work-up ofpatients suspicious of T-CLPD [18–21,23–26]. Despite this, optimization of the antibodystaining conditions, as well as reference ranges for normal and reactive polyclonal Tαβ-cellsand their major subsets, together with the sensitivity and specificity of the TRBC1 assayfor detecting clonal Tαβ-cells, remain to be fully established prior to its diagnostic routineuse. Here we defined the most appropriate staining conditions to obtain the best resolutionbetween TRBC1+ and TRBC1− Tαβ-cells. In addition, we established, for the first time,reference TRBC1+/TRBC1− ranges in PB for normal and reactive polyclonal Tαβ-cellsand their major Tαβ-cell populations. At the same time, we provide preliminary dataon the distribution of TRBC1+ and TRBC1− Tαβ-cells according to the specific TCRVβ
family expressed by total Tαβ-cells (and their major subsets) and their maturation stage.Finally, we confirm and extend on previous observations [18,21,25,26] about the analyticalsensitivity and specificity of the assay for detecting monoclonal vs. poly/oligoclonalTαβ-cell populations, even when present at low frequencies in blood.
Since both CD3 and anti-TRBC1 antibodies recognize physically close epitopes ofthe CD3/TCRαβ complex [36,37], we first tested the potential steric interaction betweenboth groups of antibody reagents for optimization of the TRBC1 staining. Our resultsshowed that addition of CD3 blocked the (low affinity/unspecific) binding of the anti-TRBC1 reagent to TRBC1− (i.e., TRBC2+) Tαβ-cells [38], while similar percentages ofTRBC1+ cells were observed in the absence vs. presence of the CD3 Mab. This translatedinto an improved resolution between TRBC1+ and TRBC1− cells when CD3 was addedeither simultaneously or after (but never before) the anti-TRBC1 antibody. These resultswere consistent across the different CD3 clones tested (i.e., SK7 and UCHT1) and CD3fluorochrome-conjugated reagents. It should be noted that in some PB samples from HD,a population of Tαβ cells apparently showing very dim expression of TRBC1 was detected,even at different centers, (e.g., Salamanca and Porto), without paralleled low expression ofCD3 (data not shown); this could be due to nonspecific labeling or any other nonidentifiedtechnical issue related to CD3/TCRVβ and TRBC1 interactions, this population being hereconsidered as TRBC1−. Further studies in FACS-sorted populations are needed to confirm

Cancers 2021, 13, 4379 14 of 19
that these cells are indeed TRBC1− (i.e., TRBC2+). Of note is that while the TRBC1 stainingprofile remained stable for up to 48 hours when anti-TRBC1-FITC was used, decreasedTRBC1 labelling was observed for samples aged >48 h before staining with the TRBC1-BV421 antibody. These results are in line with previous observations pointing out the needto stain fresh (<48 h) samples, also for the CD3-TRBC1 antibody pairs [27,39].
Once staining had been optimized, we subsequently validated the specificity ofthe TRBC1-based FCM approach based on the demonstration of TRBJ1 gene rearrangementsin highly-purified TRBC1+ cell populations (either from monoclonal and oligo/polyclonalcases) vs. a double TRBJ1+TRBJ2 gene rearrangement pattern in purified TRBC1− Tαβ-cells, regardless of their clonal nature. Overall, our results showed a high degree of corre-lation between the pattern of TRBC1 protein expression and the TRBJ1 vs. TRBJ1+TRBJ2gene rearrangement profile, except for a few discrepant samples. Of note is that suchdiscrepant samples systematically consisted of TRBC1+ Tαβ-cells by FCM that displayeddouble TRBJ1+TRBJ2 gene rearrangements by PCR, which might be due to the presence ofincomplete TRB gene rearrangements in the first allele (TRB J1-C1 and TRB J2-C2), togetherwith a complete rearrangement of TRBJ1 on the second allele [15,40–42], as demonstratedhere. In turn, all TRBC1− populations by FCM showed a first nonproductive or incom-plete TRBJ1 rearrangement followed by a productive rearrangement of TRBJ2 at the DNAlevel of the same chromosome allele [15,40–42], which was fully consistent with the FCMassay results.
Similarly to the kappa/lambda ratio in B-CLPD [43,44], the availability of referenceTRBC1+/TRBC1− ratio ranges for polyclonal Tαβ-cells, including both normal and re-active cells, is critical for routine implementation of the new TRBC1-based FCM assayin the diagnostic work-up of T-CLPD. Thus, several studies have previously reportedpercentage values of TRBC1+ cells within total Tαβ-cells and their major TCD4+ andTCD8+ populations in normal blood samples [18,20,21]. However, different ranges arereported in these studies, due to the different nature of control samples used (HD vs.reactive blood), the limited numbers of samples investigated and/or the use of differentconfidence intervals (e.g., 95% CI vs. 99.7% CI) to define cut-offs for T-cell clonality. Herewe defined reference TRBC1+/TRBC1− ranges for polyclonal Tαβ-cells and all majorTαβ-cell populations, based on the largest cohort of controls reported so far (includingboth HD and reactive lymphocytosis patients). In addition, more strict cut-off values withlarger confidence intervals for normal cells were used for identification of clonal Tαβ-cellexpansions. Of note is that with the optimized TRBC1-FCM approach used here, smallTαβ-cell clones were detected in a significant fraction of all HD investigated, in line withprevious findings by Horna et al. [23–25]. Further molecular analysis performed hereon purified suspicious Tαβ-cells populations from these otherwise healthy individualsconfirmed that they systematically corresponded to clonal cells by PCR. The significanceof the presence of these T-cell clones in blood remains to be elucidated, but they could beeither the result of physiologically normal immune activation of T-cells [24,26], similar tothe monotypic expression of kappa or lambda in B-cells that can also be seen in skewedimmune responses, without additional abnormal marker expression [44], or persistentclonal (immunosenescent) cells that does not necessarily imply malignancy, in a similarway to low-count monoclonal B lymphocytosis [45].
In order to determine whether the above reference ranges could also be applied to othermajor and minor Tαβ-cell subsets, we further investigated for the first time the distributionof TRBC1+ cells within the different TCRVβ populations and maturation-associated subsetsof Tαβ-cells. Although different median TRBC1+/TRBC1− ratios were found among cellsexpressing each of the TCRVβ families identified (especially in reactive cases), TRBC1expression appeared to be independent of the specific TCRVβ family expressed among HD,as well as HDc and reactive lymphocytosis patients, i.e., a bimodal pattern was found forall families. These findings support the use of the TRBC1 expression profile as a surrogatemarker of clonality in Tαβ-cells and their major subsets, independently of the specificTCRVβ family expressed. In contrast, here we report for the first time significantly skewed

Cancers 2021, 13, 4379 15 of 19
TRBC1+/TRBC1− ratios depending on the maturation stage of Tαβ-cells. This is in contrastwith previous findings by other groups who did not find differences in the percentageof TRBC1+ cells among distinct maturation-associated subpopulations of Tαβ-cells, asdefined by the pattern of expression of CD5, CD7 and/or CD26 [20,21,24]. Thus, the overallnormal TRBC1+/TRBC1− ratio ranges of naïve, central memory, transitional memory andregulatory Tαβ-cell subsets overlapped with those of the whole Tαβ-cell populationsand/or their major TαβCD4+ and TαβCD8+ subsets, whereas more mature populations ofCD28+ and particularly CD28- effector memory, early effector, and terminal effector cells ofHD displayed more heterogeneous and clear skewed TRBC1+/TRBC1− ratios comparedwith those of total Tαβ-cells, regardless of the specific subset of, for example, TαβCD4+
or TαβCD8+ cells. These findings support an increasingly higher degree of oligoclonalityassociated with a progressively narrower TR repertoire, along the maturation of bloodTαβ-cells, due to the accumulation of effector T-cells specific for a relatively more limitednumber of antigens, including antigens from viruses that persist in the organism, such asEBV and cytomegalovirus [46]. The fact that the TRBC1+/TRBC1− ratio of more matureTαβ-cell populations usually deviates from those of total Tαβ-cells from the same subjectshould be considered in the diagnostic work-up of T-cell clonality by FCM, particularlyin the absence of phenotypic aberrations and when suspicious effector (e.g., LGL) Tαβ-cell populations are investigated. Further analysis including larger series of samples arerequired to establish the precise TRBC1+/TRBC1− ratios within the different maturationcompartments of Tαβ-cells, both in blood and in other tissues.
Validation of the pre-established normal cut-offs in a large cohort of samples, includ-ing HD, reactive lymphocytosis and T-CLPD patients, showed a high degree of correlationbetween the TRBC1-FCM approach and T-cell clonality results assessed by molecular andTCRVβ-FCM assays, except for a few discrepant cases, in line with previous observa-tions [18,21,25]. More detailed investigation of such discrepant cases showed that in threeof five patients (cases #1, #2 and #4), final diagnosis was concordant with the TRBC1-basedFCM assay results, with failure of PCR in two of three cases (cases #1 and #2) to detectT-cell clonality being due to the analysis of whole blood DNA instead of the FACS-sorted(suspicious) cell population DNA, in samples where the percentage of clonal cells in PBwas below the sensitivity limit of the molecular technique [15–17]. Although final diag-nosis at the referring center was inconclusive in the first case (case #1), the presence ofa clearly aberrant (CD2lo) Tαβ effector cell population associated with chronic neutropeniawould strongly support the diagnosis of T-LGLL [33], in line with monotypic expres-sion of TRBC1. In one of the remaining two discrepant cases (case #3), an expansion ofLGL with a normal Tαβ-effector cell phenotype (CD2+ CD7lo CD27− CD28− CD45RA−/+
cytoplasmic granzyme+) [33], but an elevated TRBC1+/TRBC1− ratio compared to nor-mal/reactive polyclonal TαβCD8+ cells was observed in the absence of clonality by PCR.In this case, the possibility that the altered TRBC1+/TRBC1− ratio might be due to an in-creased number of (activated-oligoclonal) senescent effector memory/terminal effectorTαβCD8+ cells [14,15] could not be ruled out, since similarly increased TRBC1+/TRBC1−
ratios were observed in normal and reactive blood when analysis was restricted to normaleffector memory/terminal effector TαβCD8+ cells. Finally, in the last discrepant case (case#5), an aberrant (CD2lo CD7-/lo) terminal-effector (CD28− CD45RA+ CD45RO−) phenotypesuggestive of a monoclonal expansion, confirmed by PCR (but not by TCRVβ-FCM analysisand the new TRBC1-FCM assay) was observed in the absence of a definitive explanationfor the discordant results.
Despite the low number of T-CLPD cases analyzed within each WHO2017 diagnosticcategory, our results showed a potentially skewed usage of TRBC2 vs. TRBC1 in T-PLL(derived from a naïve/central memory cell [1]), that contrast with PCTCL-SS (derivedfrom a central memory/transitional memory cell [1]) and HDc (in whom most clonescorresponded to effector memory/terminal effector), which more frequently involvedthe TRBC1 region. Our results support previous studies in which only one out of threeT-PLL cases studied were TRBC1+ [21], while differing from others, in which only 22% of

Cancers 2021, 13, 4379 16 of 19
HDc (14/63, named as T-cell clones of uncertain significance) were TRBC1+ [23] or lessthan 50% of SS plus MF cases (30 of 63) showed TRBC1+ [21,24]. More extensive studiesincluding larger series of a broader number of T-CLPD diagnostic categories are requiredto elucidate the potentially skewed usage of TRBC1 vs. TRBC2 in different diagnosticsubtypes of T-CLPD, and the precise biological significance of these findings.
Despite the diagnostic value of the new TRBC1 assay here optimized and validated, itshould be noted that occasionally clonal T-cell populations show dim or negative surfaceCD3/TCRVβ expression levels [26]. Among those T-CLPD patients with productive generearrangements upstream of TRBC1, expression of TRBC1 at the protein level would bealso low or negative. Thus, absence of TRBC1 expression in these patients would be dueto lack of surface CD3/TRBC1 expression rather than a gene rearrangement upstreamof TRBC2. In this regard, it should be noted that in nearly half of our TRBC1+ T-CLPDpatients concordantly low expression of SmCD3 and TRBC1 was observed. In contrast, inthe other half of our T-CLPD cases, clonal Tαβ-cells showed normal expression levels ofSmCD3/TCRVβ with abnormally low amounts of TRBC1 on the cell surface membrane,in the absence of an apparent cause that could explain such differences, as previouslyreported by other research groups [23,25,26].
As described above, assessment of the TRBC1 expression profile among phenotypi-cally aberrant populations of Tαβ-cells allowed sensitive identification of small Tαβ-cellclones, even among otherwise healthy donors, in line with previous findings [20,23–25].However, the precise analytical sensitivity of the new TRBC1 FMC assay remained tobe established. Thus, an additional objective of our study was to determine the level ofdetection of the TRBC1-based FCM approach for detecting clonal populations of Tαβ-cellsshowing an aberrant phenotype, whenever present at low frequencies in blood. Froma clinical point of view, a level of detection of 10−4 is currently considered sufficient forminimal/measurable (residual) disease (MRD) detection and monitoring in T-CLPD [27,47].In this regard, here we show that assessment of the pattern of expression of TRBC1 in smallpopulations of phenotypically aberrant Tαβ-cells from patients with distinct subtypesof T-CLPD provides a level of detection of ≤10−4, similar to that obtained once tumor-associated TCRVβ family-specific antibodies are used, as demonstrated by real and virtualdilutional experiments. However, combined assessment of both TRBC1 and TCRVβ familyexpression profiles slightly improved the sensitivity of detection of small Tαβ-cell clonesin one of our cases, and at the same time it provided more accurate MRD counts.
5. Conclusions
In summary, the here optimized TRBC1 approach is a useful, simple and fast FCMassay for assessment of Tαβ-cell clonality in blood of patients suspicious of T-CLPD. Atthe same time, the assay is cost-effective, since we have estimated an overall cost-saving ofaround 80–90% per sample compared to using either the whole TCRVβ Repertoire FCMKit or PCR-based techniques. In addition, once used in combination with tumor-associatedaberrant immunophenotypes, the TRBC1 expression profile (negative vs. positive) ofSmCD3+ cells shows a high sensitivity and specificity for detection of monoclonal Tαβ-cellsin patients suspicious of T-CLPD, at similar levels to those reached with the kappa/lambdaratio in the diagnostic work-up of B-CLPD [43,44,48]. Optimal assessment of clonalityby TRBC1 expression would require appropriate integration of the TRBC1/CD3 reagentsinto comprehensive lymphocyte screening panels for the diagnostic work-up of patientspresenting with lymphocytosis, as well as into the current T-CLPD classification and MRDmonitoring antibody panels.
Supplementary Materials: The following are available online at https://www.mdpi.com/article/10.3390/cancers13174379/s1. Supplementary Methods. Table S1: Fluorochrome-conjugated antibodypanels used in this study. Table S2: Sources and specificities of the monoclonal antibody reagentsused. Table S3: Phenotypic markers associated with different maturation subsets of T-cells andthe corresponding immunophenotypic profiles used for the identification of T-cell maturation stagesin adult healthy donor blood. Table S4: Distribution of TRBC1+ cells and the TRBC1+/TRBC1− T-cell

Cancers 2021, 13, 4379 17 of 19
ratio among normal and reactive Tαβ-cells and the major Tαβ-cell populations present in normal andreactive PB. Table S5: Detailed features of samples showing discrepant results between the pattern ofexpression of TRBC1 by FCM and the T-cell clonality status as assessed by the reference molecularand TCRVβ-FCM assays (n = 5/117; 4.3%). Figure S1: Flowchart illustrating the distribution ofsamples (n = 211, including 192 PB, 9 SK, 5 BM, 4 LN and 1 AM) and the study groups correspondingto the different sets of experiments performed. Figure S2: Pattern of expression of TRBC1 on bloodT-cells using different staining conditions. Figure S3: TRBC1+/TRBC1− ratio of normal Tαβ-cellsubsets defined within the major TCD4, TCD8, TDP and TDN cell populations based on the patternof expression of specific TCRVβ family members and their maturation stage. Figure S4: Illustrativedot-plot diagrams, clonality data and final diagnosis of cases showing discrepant results betweenthe pattern of expression of TRBC1 by FCM and the T-cell clonality status by conventional TCRVβ-FCM and/or molecular reference techniques (n = 5/117; 4.3%). Figure S5: Illustrative dot-plotdiagrams of a representative dilutional experiment of clonal Tαβ-cells from a T-LGLL patient innormal blood.
Author Contributions: Conceptualization, J.A.; A.O. and J.J.M.v.D. contributed to the conceptual-ization, designs, and supervision of the study, as well as to the recruitment of funding. N.M.-G.,F.J.M.-P., S.B., S.M., C.C., A.B., M.A., M.L. and N.V. performed the experiments (FCM, FACS-sorting,molecular biology assays), their validations and/or the analysis and the interpretations of the results.N.M.-G. coordinated the planning and execution of the experiments. N.M.-G., M.L., N.V., S.B., A.D.and F.J.M.-P. selected cases for the study and collected their relevant clinical information; A.W.L.contributed to the design of appropriate molecular assays; M.L. and A.W.L. also provided criticalinput on data interpretation; N.M.-G., A.O., F.G. and J.A. wrote the manuscript. All authors haveread and agreed to the published version of the manuscript.
Funding: This work was supported by the CB16/12/00400 (CIBERONC) and PI20-01346 grants,from the Instituto de Salud Carlos III, Ministerio de Ciencia e Innovación (Madrid, Spain) andFONDOS FEDER, and by the EuroFlow Foundation (Leiden, The Netherlands). N. Muñoz-Garcíais supported by a pre-doctoral grant (Ref. IBPredoc17/00012) from IBSAL (Salamanca, Spain). M.Lima, N. Villamor, A.W. Langerak, J.J.M. van Dongen, A. Orfao, and J. Almeida are members ofthe EuroFlow Consortium [29].
Institutional Review Board Statement: All patients and controls gave their written informed consentto participate in the study. The project was conducted according to the guidelines of the Declarationof Helsinki and approved by the Ethics Committees of the corresponding participating hospitals(University Hospital of Salamanca/IBSAL, Salamanca, Spain; Hospital de Santo António, CentroHospitalar do Porto, Porto, Portugal; and Hospital Clínic, Barcelona, Spain).
Informed Consent Statement: Informed consent was obtained from all subjects involved in the study.
Data Availability Statement: Exclude this statement as the study did not report any data.
Acknowledgments: The authors thank the following researchers for their assistance in collectingsamples and/or for technical guidance and support at different stages of the study: Alfonso Romero,Ana Helena Santos, Guillermo Oliva, João Rodrigues, María del Carmen García-Macias, MaríaJara-Acevedo, Maria Eugenia Sarasquete.
Conflicts of Interest: The authors declare no competing financial interests or any other conflictof interest.
References1. Campo, E.; Harris, N.L.; Jaffe, E.S.; Pileri, S.A.; Stein, H.; Thiele, J.; Vardiman, J.M. WHO Classification of Tumours of Haematopoietic
and Lymphoid Tissues; Swerdlow, S.H., Ed.; Revised 4 t.; WHO Press: Lyon, France, 2017.2. Armitage, J.O. A clinical evaluation of the International Lymphoma Study Group classification of non-Hodgkin’s lymphoma.
Blood 1997, 89, 3909–3918.3. Vose, J.M.; Neumann, M.; Harris, M.E. International peripheral T-cell and natural killer/T-cell lymphoma study: Pathology
findings and clinical outcomes international T-cell lymphoma project. J. Clin. Oncol. 2008, 26, 4124–4130. [CrossRef]4. Jamal, S.; Picker, L.J.; Aquino, D.B.; McKenna, R.W.; Dawson, D.B.; Kroft, S.H. Immunophenotypic analysis of peripheral T-cell
neoplasms: A multiparameter flow cytometric approach. Am. J. Clin. Pathol. 2001, 116, 512–526. [CrossRef]5. Gorczyca, W.; Weisberger, J.; Liu, Z.; Tsang, P.; Hossein, M.; Wu, C.D.; Dong, H.; Wong, J.Y.L.; Tugulea, S.; Dee, S.; et al.
An Approach to Diagnosis of T-cell Lymphoproliferative Disorders by Flow Cytometry. Clin. Cytom. 2002, 50, 177–190. [CrossRef]

Cancers 2021, 13, 4379 18 of 19
6. Jevremovic, D.; Olteanu, H. Flow Cytometry Applications in the Diagnosis of T/NK-Cell Lymphoproliferative Disorders. Cytom.Part B - Clin. Cytom. 2019, 96, 99–115. [CrossRef]
7. Went, P.; Agostinelli, C.; Gallamini, A.; Piccaluga, P.P.; Ascani, S.; Sabattini, E.; Bacci, F.; Falini, B.; Motta, T.; Paulli, M.; et al.Marker expression in peripheral T-cell lymphoma: A proposed clinical-pathologic prognostic score. J. Clin. Oncol. 2006, 24,2472–2479. [CrossRef]
8. Iqbal, J.; Amador, C.; McKeithan, T.W.; Chan, W.C. T-Cell and NK-Cell Lymphomas. From Biology to Novel Therapies - Chapter:Molecular and Genomic Landscape of Peripheral T-cell Lymphoma; Querfeld, C., Zain, J., Rosen, S.T., Eds.; Springer: Cham, Switzerland,2019; ISBN 9783319997155.
9. Flores-Montero, J.; Grigore, G.; Fluxá, R.; Hernández, J.; Fernandez, P.; Almeida, J.; Muñoz, N.; Böttcher, S.; Sedek, L.;van der Velden, V.; et al. EuroFlow Lymphoid Screening Tube (LST) data base for automated identification of blood lymphocytesubsets. J. Immunol. Methods 2019, 475, 112662. [CrossRef]
10. Langerak, A.W.; van den Beemd, R.; Wolvers-Tettero, I.L.M.; Boor, P.P.C.; van Lochem, E.G.; Hooijkaas, H.; van Dongen, J.J.M.Molecular and flow cytometric analysis of the VB repertoire for clonality assessment in mature TCRab T-cell proliferations. Blood2001, 98, 165–174. [CrossRef] [PubMed]
11. Morice, W.G.; Kimlinger, T.; Katzmann, J.A.; Lust, J.A.; Heimgartner, P.J.; Halling, K.C.; Hanson, C.A. Flow CytometricAssessment of TCR-Vβ Expression in the Evaluation of Peripheral Blood Involvement by T-Cell Lymphoproliferative Disorders:A Comparison with Conventional T-Cell Immunophenotyping and Molecular Genetic Techniques. Am. J. Clin. Pathol. 2004, 121,373–383. [CrossRef] [PubMed]
12. Beck, R.C.; Stahl, S.; O’Keefe, C.L.; Maciejewski, J.P.; Theil, K.S.; Hsi, E.D. Detection of Mature T-Cell Leukemias by FlowCytometry Using Anti-T-Cell Receptor Vβ Antibodies. Am. J. Clin. Pathol. 2003, 120, 785–794. [CrossRef] [PubMed]
13. Tembhare, P.; Yuan, C.M.; Xi, L.; Morris, J.C.; Liewehr, D.; Venzon, D.; Janik, J.E.; Raffeld, M.; Stetler-Stevenson, M. Flowcytometric immunophenotypic assessment of T-cell clonality by V β repertoire analysis: Detection of T-cell clonality at diagnosisand monitoring of minimal residual disease following therapy. Am. J. Clin. Pathol. 2011, 135, 890–900. [CrossRef]
14. Langerak, A.W.; Groenen, P.J.T.A.; Brüggemann, M.; Beldjord, K.; Bellan, C.; Bonello, L.; Boone, E.; Carter, G.I.; Catherwood, M.;Davi, F.; et al. EuroClonality/BIOMED-2 guidelines for interpretation and reporting of Ig/TCR clonality testing in suspectedlymphoproliferations. Leukemia 2012, 26, 2159–2171. [CrossRef] [PubMed]
15. van Dongen, J.J.M.; Langerak, A.W.; Brüggemann, M.; Evans, P.A.S.; Hummel, M.; Lavender, F.L.; Delabesse, E.; Davi, F.;Schuuring, E.; García-Sanz, R.; et al. Design and standardization of PCR primers and protocols for detection of clonal im-munoglobulin and T-cell receptor gene recombinations in suspect lymphoproliferations: Report of the BIOMED-2 concertedaction BMH4-CT98-3936. Leukemia 2003, 17, 2257–2317. [CrossRef]
16. Wang, H.W.; Raffeld, M. Molecular assessment of clonality in lymphoid neoplasms. Semin. Hematol. 2019, 56, 37–45. [CrossRef]17. Schumacher, J.A.; Duncavage, E.J.; Mosbruger, T.L.; Szankasi, P.M.; Kelley, T.W. A comparison of deep sequencing of TCRG
rearrangements vs. traditional capillary electrophoresis for assessment of clonality in t-cell lymphoproliferative disorders. Am. J.Clin. Pathol. 2014, 141, 348–359. [CrossRef]
18. Novikov, N.D.; Griffin, G.K.; Dudley, G.; Drew, M.; Rojas-Rudilla, V.; Lindeman, N.I.; Dorfman, D.M. Utility of a simple androbust flow cytometry assay for rapid clonality testing in mature peripheral T-Cell lymphomas. Am. J. Clin. Pathol. 2019, 151,494–503. [CrossRef]
19. Maciocia, P.M.; Wawrzyniecka, P.A.; Philip, B.; Ricciardelli, I.; Akarca, A.U.; Onuoha, S.C.; Legut, M.; Cole, D.K.; Sewell, A.K.;Gritti, G.; et al. Targeting the T cell receptor β-chain constant region for immunotherapy of T cell malignancies. Nat. Med. 2017,23, 1416–1423. [CrossRef]
20. Shi, M.; Jevremovic, D.; Otteson, G.E.; Timm, M.M.; Olteanu, H.; Horna, P. Single Antibody Detection of T-Cell Receptorαβ Clonality by Flow Cytometry Rapidly Identifies Mature T-Cell Neoplasms and Monotypic Small CD8-Positive Subsets ofUncertain Significance. Cytom. Part B - Clin. Cytom. 2020, 98, 99–107. [CrossRef] [PubMed]
21. Berg, H.; Otteson, G.E.; Corley, H.; Shi, M.; Horna, P.; Jevremovic, D.; Olteanu, H. Flow cytometric evaluation of TRBC1 expressionin tissue specimens and body fluids is a novel and specific method for assessment of T-cell clonality and diagnosis of T-cellneoplasms. Cytom. Part B - Clin. Cytom. 2020, 1–9. [CrossRef]
22. Kaewpreedee, P.; Boonrat, P.; Tansiri, Y.; Rowland-Jones, S.L.; Hansasuta, P. Dimorphism in the T-cell receptor constant regionaffects T-cell function, phenotype and HIV outcome. Aids 2019, 33, 1421–1429. [CrossRef] [PubMed]
23. Shi, M.; Olteanu, H.; Jevremovic, D.; He, R.; Viswanatha, D.; Corley, H.; Horna, P. T-cell clones of uncertain significance are highlyprevalent and show close resemblance to T-cell large granular lymphocytic leukemia. Implications for laboratory diagnostics.Mod. Pathol. 2020. [CrossRef] [PubMed]
24. Horna, P.; Shi, M.; Jevremovic, D.; Craig, F.E.; Comfere, N.I.; Olteanu, H. Utility of TRBC1 Expression in the Diagnosis ofPeripheral Blood Involvement by Cutaneous T-Cell Lymphoma. J. Invest. Dermatol. 2021, 141, 821–829.e2. [CrossRef] [PubMed]
25. Horna, P.; Olteanu, H.; Jevremovic, D.; Otteson, G.E.; Corley, H.; Ding, W.; Parikh, S.A.; Shah, M.V.; Morice, W.G.; Shi, M.Single-Antibody Evaluation of T-Cell Receptor β Constant Chain Monotypia by Flow Cytometry Facilitates the Diagnosis ofT-Cell Large Granular Lymphocytic Leukemia. Am. J. Clin. Pathol. 2021, 156, 139–148. [CrossRef] [PubMed]
26. Horna, P.; Shi, M.; Olteanu, H.; Johansson, U. Emerging role of t-cell receptor constant β chain-1 (TRBC1) expression in the flowcytometric diagnosis of t-cell malignancies. Int. J. Mol. Sci. 2021, 22, 1817. [CrossRef] [PubMed]

Cancers 2021, 13, 4379 19 of 19
27. van Dongen, J.J.; Lhermitte, L.; Böttcher, S.; Almeida, J.; van der Velden, V.H.; Flores-Montero, J.; Rawstron, A.; Asnafi, V.;Lécrevisse, Q.; Lucio, P.; et al. EuroFlow antibody panels for standardized n-dimensional flow cytometric immunophenotypingof normal, reactive and malignant leukocytes. Leukemia 2012, 26, 1908–1975. [CrossRef]
28. Kalina, T.; Flores-Montero, J.; van der Velden, V.H.J.; Martin-Ayuso, M.; Böttcher, S.; Ritgen, M.; Almeida, J.; Lhermitte, L.;Asnafi, V.; Mendonça, A.; et al. EuroFlow standardization of flow cytometer instrument settings and immunophenotypingprotocols. Leukemia 2012, 26, 1986–2010. [CrossRef]
29. EuroFlow. Available online: https://www.euroflow.org/ (accessed on 17 June 2021).30. Maecker, H.T.; Frey, T.; Nomura, L.E.; Trotter, J. Selecting fluorochrome conjugates for maximum sensitivity. Cytom. Part A 2004,
62, 169–173. [CrossRef]31. Langerak, A.; Wolvers-Tettero, I.; van Dongen, J. Detection of T cell receptor beta (TCRB) gene rearrangement patterns in T cell
malignancies by Southern blot analysis. Leukemia 1999, 13, 965–974. [CrossRef]32. Droese, J.; Langerak, A.W.; Groenen, P.J.T.A.; Brüggemman, M.; Neumann, P.; Wolvers-Tettero, I.L.M.; van Altena, M.C.;
Kneba, M.; van Dongen, J.J.M. Validation of BIOMED-2 multiplex PCR tubes for detection of TCRB gene rearrangements in T-cellmalignancies. Leukemia 2004, 18, 1531–1538. [CrossRef]
33. Muñoz-García, N.; Jara-Acevedo, M.; Caldas, C.; Bárcena, P.; López, A.; Puig, N.; Alcoceba, M.; Fernández, P.; Villamor, N.;Flores-Montero, J.A.; et al. STAT3 and STAT5B mutations in T/NK-cell chronic lymphoproliferative disorders of large granularlymphocytes (LGL): Association with disease features. Cancers 2020, 12, 3508. [CrossRef]
34. Laribi, K.; Lemaire, P.; Sandrini, J.; de Materre, A.B. Advances in the understanding and management of T-cell prolymphocyticleukemia. Oncotarget 2017, 8, 104664–104686. [CrossRef]
35. Kastrup, J.; Pedersen, L.; Dietrich, J.; Lauritsen, J.P.H.; Menné, C.; Geisler, C. In vitro production and characterization of partlyassembled human CD3 complexes. Scand. J. Immunol. 2002, 56, 436–442. [CrossRef] [PubMed]
36. Morath, A.; Schamel, W.W. αβ and γδ T cell receptors: Similar but different. J. Leukoc. Biol. 2020, 107, 1045–1055. [CrossRef][PubMed]
37. Natarajan, K.; Jiang, J.; May, N.A.; Mage, M.G.; Boyd, L.F.; McShan, A.C.; Sgourakis, N.G.; Bax, A.; Margulies, D.H. The role ofmolecular flexibility in antigen presentation and T cell receptor-mediated signaling. Front. Immunol. 2018, 9, 1657. [CrossRef][PubMed]
38. Tunnacliffe, A.; Kefford, R.; Milstein, C.; Forster, A.; Rabbitts, T.H. Sequence and evolution of the human T-cell antigen receptorβ-chain genes. Proc. Natl. Acad. Sci. USA 1985, 82, 5068–5072. [CrossRef] [PubMed]
39. Diks, A.M.; Bonroy, C.; Teodosio, C.; Groenland, R.J.; de Mooij, B.; de Maertelaere, E.; Neirynck, J.; Philippé, J.; Orfao, A.;van Dongen, J.J.M.; et al. Impact of blood storage and sample handling on quality of high dimensional flow cytometric data inmulticenter clinical research. J. Immunol. Methods 2019, 475, 112616. [CrossRef]
40. Duby, A.D.; Seidman, J.G. Abnormal recombination products result from aberrant DNA rearrangement of the human T-cellantigen receptor B-chain gene. Immunology 1986, 83, 4890–4894. [CrossRef]
41. TRBC2 Sequence. Available online: http://www.ensembl.org/Homo_sapiens/Gene/Summary?db=core;g=ENSG00000211772;r=7:142801041-142802748;t=ENST00000466254 (accessed on 28 June 2021).
42. TRBC1 Sequence. Available online: http://www.ensembl.org/Homo_sapiens/Gene/Summary?db=core;g=ENSG00000211751;r=7:142791694-142793368;t=ENST00000633705 (accessed on 17 June 2021).
43. Katzmann, J.A.; Clark, R.J.; Abraham, R.S.; Bryant, S.; Lymp, J.F.; Bradwell, A.R.; Kyle, R.A. Serum reference intervals anddiagnostic ranges for free κ and free λ immunoglobulin light chains: Relative sensitivity for detection of monoclonal light chains.Clin. Chem. 2002, 48, 1437–1444. [CrossRef]
44. Geary, W.; Frierson, H.; Innes, D.; Normansell, D. Quantitative criteria for clonality in the diagnosis of B-cell non-Hodgkin’slymphoma by flow cytometry. Mod. Pathol. 1993, 6, 155–161.
45. Criado, I.; Rodríguez-Caballero, A.; Gutiérrez, M.L.; Pedreira, C.E.; Alcoceba, M.; Nieto, W.; Teodosio, C.; Bárcena, P.; Romero, A.;Fernández-Navarro, P.; et al. Low-count monoclonal B-cell lymphocytosis persists after seven years of follow up and is associatedwith a poorer outcome. Haematologica 2018, 103, 1198–1208. [CrossRef]
46. Miron, M.; Meng, W.; Rosenfeld, A.M.; Dvorkin, S.; Meimei, M.; Poon, L.; Lam, N.; Kumar, B.V.; Louzoun, Y.; Prak, E.T.L.; et al.Maintenance of the human memory T cell repertoire by subset and tissue site. Genome Med. 2021, 13, 100. [CrossRef] [PubMed]
47. Flores-Montero, J.; Sanoja-Flores, L.; Paiva, B.; Puig, N.; García-Sánchez, O.; Böttcher, S.; Van Der Velden, V.H.J.; Pérez-Morán, J.J.;Vidriales, M.B.; García-Sanz, R.; et al. Next Generation Flow for highly sensitive and standardized detection of minimal residualdisease in multiple myeloma. Leukemia 2017, 31, 2094–2103. [CrossRef] [PubMed]
48. Davidson, B.; Risberg, B.; Berner, A.; Smeland, E.B.; Torlakovic, E. Evaluation of lymphoid cell populations in cytology specimensusing flow cytometry and polymerase chain reaction. Diagn. Mol. Pathol. 1999, 8, 183–188. [CrossRef] [PubMed]