County of Accomack, Virginia Fiscal Year 2013 Annual Fiscal ...
Upload
khangminh22Category
view
1download
0

1
ProfileTokai Tokyo Financial Holdings, Inc. is the holding company of the Tokai Tokyo Financial Group, centered on Tokai Tokyo Securities Co., Ltd. As a holding company, Tokai Tokyo Financial Holdings operates and manages the group companies and seeks to enhance their value by promoting its regional and alliance strategies -both vital for the group- toward a new era of the financial industry.
As of March 31, 2011, the Tokai Tokyo Financial Group consists of Tokai Tokyo Financial Holdings, 13 subsidiaries and three equity method affiliates in Japan, and four overseas subsidiaries. The group focuses on the securities business and provides financial products, services, and solutions that meet the needs of customers.
Contents Financial Highlights 2 To Our Shareholders 3
Consolidated Financial Statements Consolidated Balance Sheets 13 Consolidated Statements of Income 15 Consolidated Statements of Changes is Equity 17 Consolidated Statements of Cash Flows 18 Notes to Consolidated Financial Statements 19 Company Information Corporate Directory 53 Board of Directors and Corporate Auditors 53 Subsidiaries and Affiliates 54 Major Shareholders 55

2
Financial Highlights
Note: U.S. dollar amounts are translated for convenience only at the rate of ¥83.15=US$1
2011 2010 2011
Total revenues ¥ 52,403 ¥ 58,500 $ 630,221
Operating income 3,089 10,516 37,156
Net income 4,318 7,161 51,936
Total assets 664,376 664,767 7,990,091
Total equity 113,015 114,126 1,359,173
Per share of common stock
Basic net income ¥ 15.50 ¥ 26.33 $ 0.19
Cash dividends applicable to the year 8.00 15.00 0.10
Thousands of
U.S. dollars
U.S. dollarsYen
Millions of yen

3
To Our Shareholders
Facing the final year of The “Three-Year Business Plan”, we will strive to achieve the goal vowed under the Plan and build the solid business foundation that can weather challenges.
During the fiscal year 2010, the Japanese economy generally stayed on recovery path. Throughout the year, our economy suffered strong yen reflecting the fiscal concern over several Euro members including, among others, Greece. Yet the export to the US and Asia where the economies were both on upswing, led the recovery of Japan’s domestic economy offsetting the detriment of strengthening yen. Quantitative easing exercised by central banks of both Japan and the US brought forth the upturn of global stock market and Japanese stock market as well. The Japan’s economy then was about to leave a period of temporary halt for upward move. However, such a rising momentum was disrupted suddenly and heavily due to the East Japan Great Earthquake on March 11.
The above is a brief description of the circumstances in which we concluded the fiscal year 2010.
Under such an environment, the Tokai Tokyo Financial Group fared for the year as follows; Consolidated Total revenues of ¥52,403 million (a decrease of 10% over the previous year), Operating income of ¥3,089 million (a 71% drop over the previous year) and Net income of ¥4,318 million (a 40% decrease likewise)
In regards to the operation of Tokai Tokyo Securities, we deeply regret to have caused both inconvenience and anxiety to our valued shareholders due to the foul act found last year of its former employee that prompted the Financial Services Agency to issue their ‘Order to Improve Business Operations’ in September 2010. Dealing with this finding of embarrassment with utmost sincerity, we formed an in-house investigation team that includes outside expert in the matter in order to thoroughly identify the cause of the incident, and then we formulated effective measures for solution. We are now diligently putting all such measures into practice while our examination team is closely checking to see if the said measures truly work. The examination team is the one we set up internally for the recurrence prevention purpose.
We have conducted the operation over the year attempting to respond to ever-changing environment with agility by way of constant execution of various plans and measures adopted under “ Three-Year Business Plan” that we refer to as ‘TT Revolution’. We aim to grow up to the financial group with more strength and better adaptability.
We express our deepest sympathy toward the people who suffered the damage caused

4
by the earthquake and tsunami that hit Tohoku region. We are making a concerted effort as a team with all the employees and management personnel to help those who were affected by the disaster in whatever the way we find appropriate.
We set forth below the information in the format of Q&A dialogue with our CEO, hoping to help you better understand fiscal 2010 performance.
Questions to CEO
Q1: Can we hear from you a little bit more about your business environment for the fiscal 2010? How do you wrap it up?
A1: Japanese stock market had remained sluggish until October, which is, I mean, the middle of the fiscal year. Then, it reversed the trend and started rising, and almost in the end, all of a sudden, however, plunged again sharply due to, what else, the earthquake and tsunami. So, the market ended as a difficult one after all. The US stock market, on the other hand, has maintained a positive note since spring in 2010. But, the emerging markets like China, Brazil and India did not quite show strength probably affected by tightened monetary policy prevalent in each respective market.
RetailIn conducting our operation amid the said environment, we monitor at all times the trend of European and North American markets, particularly the US market, as well as emerging countries such as China, Brazil and India, in addition to the one in Japan. We made such efforts dedicating to our retail operations to meet the asset management needs of personal clients. We constantly ask ourselves how we should protect the value of financial asset of the clients. Talking about the products we actually handled, they were foreign stocks of European and North American countries,
Tateaki IshidaPresident & CEO

5
and emerging countries like in China, Brazil and India. Also, we dealt with the bonds in various foreign currencies and the structured bonds, for example, the one linked with stock price index. We consider the result satisfactory as we recognize, for instance, that the handling volume of foreign stock was doubled the level of previous year. Thus, we were able to help our clients to diversify their investment. Also, the sales offices with enhanced capabilities through integration such as Nagoya, Tokyo and Shibuya all performed well, leading the group’s sales activity.
Investment BankingIn our investment banking operation engaged in development and sales of products as well as trading and underwriting catering to corporate clients, we have over the years strengthened the capability to respond to ever-changing market environment based on the adequate risk management practice. Such endeavor, I think, was proven effective by the result of improved revenue generation that was made possible by proper order handling and suitable trading operation at the time of market fluctuation. For instance, even at the time of the Great East Japan Earthquake when stock price wildly moved, our staff involved in market operation managed to deal with the chaos promptly and suitably. In addition, our drive focused on underwriting business, I should say, manifested its payoff in the form of our ranking climb on the league-table where we now secured the top-ten position as opposed to somewhere around the fifteenth in previous years. We will keep our concentration on this specific business segment.
Q2: Can you update me on the progress of your ‘Three-Year Business Plan – TT Revolution’? Where are you now?
A2: We were in the second year stage of the Three-Year Business Plan, ‘TT Revolution’ during the fiscal 2010. We set up the plan to accomplish the evolution of ourselves to make a quantum leap as a financial service group built around its core securities company operation and we ultimately aim to become strong enough to withstand and prevail the competition and the economy that are both getting ever-harsher. For us to push the Plan, we decided to monitor constantly the progress of the initiative in light of the five key success factors that include 1) Growth (quantitative criterion regarding work, product, customer, investment and process), 2) Productivity (quantitative criterion), 3) Customer Loyalty (ethical criterion), 4) Communication (behavioral criterion) and 5) Super Community House (regional assimilation criterion). I am pleased now to report that we have made a steady and sure progress on all those five factors.
Further, as to the Growth, we are promoting the initiative mainly alongside alliance strategy and we started recognizing the difference even in terms of the Group’s overall performance.
About the Productivity, we have pursued its improvement of young employees, product and operating office and I can say that we are now being rewarded for our efforts.
The Customer Loyalty is the target we raised and are diligently in pursuit of since we thought it most important to win the trust from customers and eventually become their choice of securities firm. Another thing to mention in this reference is the company-wide contest organized at Tokai Tokyo Securities whereby each participating office assiduously competed under respectively set goal. The contest, in my evaluation, greatly stimulated the motivation of our employees.
Tokai Tokyo Securities, by the way, moved its headquarters to Nagoya in April 2010 and this relocation, I think, facilitated further enhancement of the relationship with regional clientele in

6
the course of our ultimate goal achievement, which is to become ‘Super Community House’. Fortunately, the progress seems to me encouraging already when I look at the material data such as number of new accounts opened and the assets under custody during the fiscal 2010. They are both indicating satisfactory increases.
The measures for the Communication factor actually deployed during the year include organizing various events and seminars to attract attention from customers as well as arranging IR meetings to promote active dialogue with the shareholders of our group.
Now, facing the concluding year of the ‘TT Revolution’, I think it crucial to go back to the point where we had initiated the journey in order to identify what remains now as unsolved or oversight. Then, we make it a primary management task for the fiscal year 2011 to solve the identified pending issues deploying suitable measures at each business unit. During the fiscal year 2011, we concentrate our efforts on the achievement of numerical targets as practical milestone pursuant to the ‘TT Revolution’, which are 1) 6 Trillion of assets under custody and 2) ROE of 10% or higher on consolidated. Yes, we prioritize the Growth over other factors in this final year for the ‘TT Revolution’ and we will do by all means what we consider necessary to meet those target.
Q3: Then, how about your ‘Alliance Strategy’ that you are said to be promoting both in Japan and overseas? Can you tell us about any progress you made?
A3: In taking on the Growth factor under the ‘TT Revolution’, we position the alliance strategy as our centerpiece undertaking and we are allocating our resources accordingly. On domestic end, joint operations of securities firm established by shared investment with regional banks began to help us steadily with profit generation. YM Securities that we established together with Yamaguchi Financial Group, now in its fourth year of operation, shows smooth business expansion and convinces us the possibility for further success. Hamagin Tokai Tokyo Securities that we similarly started with the Bank of Yokohama is now increasing the number of outlets at the premise of the Bank’s branches sharing the office space with such branches. We are hopeful that this joint venture operation will see the expansion as well hereafter. Further, Nishi-Nippon City Tokai Tokyo Securities, the one we set up jointly with Nishi-Nippon City Bank, also has made a very nice start and they will continuously open their new offices to lay the operating foundation across Fukuoka prefecture. We, the Tokai Tokyo Financial Group, are positively committed to assist those joint operations by offering products and information as well as staff training and system support.
A major development for the year, I think, was the merger between Tokai Tokyo Securities and Toyota Financial Services Securities, and we hope that the merger would help Tokai Tokyo Securities expand its business on the basis of the unique business model inherited from Toyota Financial Services Securities. The said model, among others, consists of the services specifically catered to the employees of Toyota group companies and the financial instruments intermediary business sourced from the car-buying clients of Toyota car dealers. Another benefit to be realized from the merger would be the synergy effect that will be achieved by the system integration scheduled in January 2012 in which Toyota’s legacy system that still separately operates now is converted to the one that Tokai Tokyo now uses.

7
Turning to our development in overseas, we have been aggressively undertaking several major actions. Particularly in Asia where a remarkable growth is being made and for that reason we placed our strategic regional priority, we opened a new operating foothold in Singapore in addition to already operating Tokai Tokyo Securities (Asia). The new company, Tokai Tokyo Investment Management Singapore Pte. Ltd. started its operation in May 2011. We expect that the new entity in Singapore facilitates first-hand information gathering in Asia to feed that back timely to the customers in Japan. Further, while the domestic alliance operations with several large regional banks are up-and-running, we will extend such alliance activity to Asia from now onward.
The market environment, I am afraid, will remain very difficult. In overseas, emerging markets that used to be brisk now appears relatively flat in general due to
tightened monetary policy administered by the authorities reining those markets. With regard to the US market, the easy-money policy, referred to as ‘QE2’, came to an end in June 2011 and the direction of the US economy and the market thereafter seem unpredictable.
The circumstances in Japan do not show any encouraging prospect either. Japan’s economy, which sustained a heavy damage from Great East Japan Earthquake, has yet to assure us its ability to regain strength, and Japanese securities market still remains unclear whether it will become energized again anytime soon.
In the face of such situation, I think it is our essential duty to protect and grow the value of customers’ financial assets, and toward this end, we will provide customers with products and services considered right from the global perspective based on adequate analysis of the US, the European and other foreign markets despite being physically a Japan-based firm.
In my view, what we cannot afford to lose for fulfilling business responsibility is the solid managerial foundation that can unfailingly surmount any hardship that may arise ahead. Therefore, what we will do is to further upgrade comprehensive risk management capability and to foster competent human resources with noticeable expertise, in addition to reinforce the company’s financial base that can withstand market fluctuations.
As the Great East Japan Earthquake has given an unprecedented damage to Japan’s economy, we are committed to offer support through what we are engaged in to the affected people and areas to the best of our ability. On our end, we will perform our duty with all our strength so that all the distressed parties can make their recoveries at the earliest possible timing and our nation’s economy radically changes and grows significantly in the end.
We sincerely appreciate the continuing guidance and support from each one of you as a valued shareholder.

8
Operating Result for fiscal 2010
Operating EnvironmentDuring the consolidated fiscal year under review (April 1, 2010–March 31, 2011), the Japanese economy on the whole maintained a stable recovery trend. Owing to the financial crisis that surfaced in Greece and some other European countries, investors’ aversion to risk became more apparent, which led to the appreciation of the yen, lasting until the beginning of autumn. While this contributed to negative growth in exports to a certain extent, the economic upswing in the United States and Asia helped push up Japanese exports for those regions, boosting the overall Japanese economy. In early autumn, the economy faced a temporary lull due to the scaling down of the government’s eco-point program for home electrical appliances and the termination of the Eco Car subsidy program. However, against the backdrop of globally higher stock prices fueled by the massive quantitative easing policies of both the U.S. and Japanese central banks, the U.S. Christmas season saw brisk sales, contributing to an increase in Japanese exports. However, the Great East Japan Earthquake that struck on March 11, 2011 caused colossal damage to the country, significantly derailing the economic recovery trend toward the end of the fiscal year.
While the stock market rebounded after a prolonged downward trend continuing until the end of the first half of the fiscal year, it plunged again immediately prior to the fiscal year-end. The Nikkei Stock Average rose to ¥11,408 in April 2010, but later fell to ¥8,796 in September 2010 due to the impact of the European financial crisis, the appreciation of the yen, China’s tighter monetary policy, among other factors. Later, the stock market rebounded and reached ¥10,891 in February 2011 in response to positive factors including currency interventions by the Japanese government and the Bank of Japan in buying U.S. dollars and selling Japanese yen, and the quantitative easing policies of the U.S. and Japanese central banks. However, the Nikkei Stock Average suffered a sharp decline to ¥8,227 in the wake of the Great East Japan Earthquake, closing at ¥9,755 on March 31. The daily average transaction value on the First Section of the Tokyo Stock Exchange during the one-year period from April 2010 to March 2011 was ¥1,532.4 billion, remaining almost unchanged from ¥1,529.9 billion recorded in the previous year.
The bond market fell reversing a robust trend. The market was firm until the beginning of autumn, as funds poured into Japanese government bonds (hereinafter, “JGBs”) as a safe haven, reflecting the sluggish stock market, the stronger yen, and investors’ aversion to risk, among other factors. The yield on the 10-year JGB, the benchmark of long-term interest rates, initially 1.40% at the beginning of the fiscal year under review, fell to 0.82% (meaning that the bond price rose) in October 2010. Subsequently, the interest rate increased (meaning that the bond price fell) to 1.35% in February 2011 due to higher stock prices, a slowdown in the appreciation of the yen, and a renewed economy. While stock prices plunged and long-term interest rate declined somewhat following the Great East Japan Earthquake, the prospect that borrowing demand in the private sector will increase after the earthquake prevented interest rate from further declining, and the yield ended the fiscal year at 1.25%.
Under these circumstances, Tokai Tokyo Securities Co., Ltd., the core company of the corporate group, has strengthened its operational base and striven to improve its presence in the Chubu region through efforts including the relocation of its headquarters to Nagoya City in April 2010, a merger with Toyota Financial Services Securities Corporation, and the opening of a large-scale branch office (the current Nagoya Branch) by integrating the Sakae and Nagoya Chuo branches. In the Kanto region, in order to meet the local customers’ needs, an outlet strategy was implemented to

9
upgrade Financial Plaza Shin-Urayasu, which had been operating as a sub-branch, to a full-scale branch (the current Shin-Urayasu Branch) in October 2010. In January 2011, a new multi-channel service was introduced to provide the customers with a wider range of products and services.
To increase shareholders, the Company launched a sponsored ADR (American Depositary Receipt) program in November 2010.
Under an alliance (strategic partnership) strategy, as one of the Company’s basic strategies, Nishi-Nippon City Tokai Tokyo Securities Co., Ltd., a joint corporation newly established in alliance with The Nishi-Nippon City Bank, Ltd., started its operation in May 2010, which is an addition to the two existing entities that include YM Securities Co., Ltd., a joint corporation established with Yamaguchi Financial Group, Inc., and Hamagin Tokai Tokyo Securities Co., Ltd., the one jointly established with The Bank of Yokohama, Ltd.
With regard to business development in the Asian region, the Group invested in the Hong Kong subsidiary of Guotai Junan Securities Co., Ltd. (which entered into a business alliance agreement with Tokai Tokyo Securities Co., Ltd. in 2002), one of the leading securities firms in China, in July 2010, to further strengthen its business alliances. In February 2011, the Group established a business tie-up with an Indian financial services holding company, Religare Enterprises Limited, to enhance its product lineup and reinforce its information-gathering capabilities in India. Furthermore, as part of its efforts to enhance its strategies in Asia, the Group also established a local corporation in Singapore for research and asset management in the Southeast Asian market, in March 2011.
As part of its measures to streamline business and reinforce the corporate functions of the Group, Tokai Tokyo Finance & Real Estate Co., Ltd. merged with Tokai Tokyo Investment Management Co., Ltd. in January 2011 (the new corporate name: Tokai Tokyo Asset Management Co., Ltd.). Both companies had previously focused on the management of customers’ assets and this merger aims to increase the efficiency of the company’s operations and improve its financial standing. In March 2011, the Group established Tokai Tokyo Academy Co., Ltd. to provide education and training services, focusing on the financial field both within and outside the Group.
Analysis of Operating Result (The figures quoted here are all on consolidated basis.)Under these circumstances, the Group’s consolidated operating results for the fiscal year ended March 31, 2011 were as follows: Total revenues were ¥52,403 million, a decrease of 10.4% year on year; Net revenues stood at ¥50,785 million, a drop of 11.1% year on year; and Selling, general and administrative expenses were ¥47,696 million, an increase of 2.4% year on year. As a result, Operating income was ¥3,089 million, a decline of 70.6% year on year; and Net income was ¥4,318 million, a drop of 39.7%.
(Commissions)In the consolidated fiscal year under review, Commissions declined 14.2% year on year, to ¥25,462 million. A breakdown is as follows:
(i) BrokerageThe equity brokerage volume handled by Tokai Tokyo Securities Co., Ltd., a consolidated subsidiary of the Company, was 2,466 million shares, a decline of 19.8% year on year, whereas the equity brokerage amount was ¥1,369.3 billion, a decline of 16.9% year on year. As a result, equity brokerage commission earned by the Group decreased, whereas overall Brokerage commission

10
remained at ¥7,798 million, a drop of 23.3% year on year.(ii) Underwriting and distributionThe group recorded Underwriting and distribution commission of ¥11,689 million, a decrease of 15.9% from the previous year. The Distribution commission for most part was earned from investment trust.(iii) OtherOther commissions were ¥5,975 million, an increase of 6.5% from the preceding year. Most of this amount was attributable to agency commission from investment trusts.
(Net gain on trading)In the fiscal year under review, Net gain on trading of stocks decreased slightly from the previous year. Net gain on trading of bonds and foreign exchanges also decreased. As a result, Net gain on trading totaled ¥23,910 million, down 8.9%.
(Net interest and dividend income)In the fiscal year under review, Interest and dividend income was ¥3,031 million, up 17.9% from the previous year. Meanwhile, Interest expense rose 16.4%, to ¥1,618 million. Hence, Net interest and dividend income was ¥1,413 million, an increase of 19.7%.
(Selling, general and administrative expenses)Selling, general and administrative expenses for the consolidated fiscal year under review were ¥47,696 million, up 2.4% year on year. Of that amount, Employees’ compensation and benefits remained at ¥22,971 million, a decrease of 4.6% year on year; Brokerage and other commissions amounted to ¥4,569 million, up 37.5%; Real estate expenses rose 2.8% year on year, to ¥6,051 million; and Data processing and office supplies increased 16.3% year on year, to ¥5,011 million.
(Other income and expenses)In the year under review, the most significant item of Other income was Rent income, representing ¥686 million. Likewise the biggest item of Other expenses was Allowance for doubtful accounts, amounting to ¥630 million.

11
Consolidated Financial StatementsTokai Tokyo Financial Holdings, Inc.
and Consolidated Subsidiaries
Years ended March 31, 2011 and 2010
with Independent Auditors’ Report

12

13
Consolidated Balance SheetsTokai Tokyo Financial Holdings, Inc. and Consolidated Subsidiaries
As of March 31, 2011 and 2010
See notes to consolidated financial statements.
ASSETS
Cash on hand and in banks (Notes 4, 8 and 15):
Cash and time deposits ¥ 62,243 ¥ 63,092 $ 748,564
19,095 19,675 229,644
81,338 82,767 978,208
Collateralized short-term financing agreements (Note 15):
Deposits paid for securities borrowed 234,168 166,792 2,816,207
Securities purchased under resell agreements 79,904 960,965
314,072 245,995 3,777,172
Trading assets:
Trading securities (Notes 5, 8 and 15) 172,241 245,276 2,071,444
Derivative assets (Notes 6 and 15) 4,583 1,920 55,122
176,824 247,196 2,126,566
Receivables:
Receivables from brokers, dealers and clearing organizations (Note 15) 14,828 7,986 178,329
Receivables from customers (Note 15) 456 411 5,487
Receivables related to margin transactions (Note 15) 30,017 36,043 360,999
Other 3,643 2,641 43,809
48,944 47,081 588,624
Less: allowance for doubtful accounts (36) (23) (434)
48,908 47,058 588,190
Short-term investment securities (Notes 5 and 15) 100 1,206
Investment securities (Notes 5 and 15) 15,898 13,516 191,203
Deferred tax assets (Note 13) 2,920 2,588 35,113
Other assets:
Property and equipment (Notes 8 and 9) 16,809 16,523 202,153
Less: accumulated depreciation (7,485) (6,948) (90,019)
9,324 9,575 112,134
Lease deposits 2,480 3,735 29,821
Other (Note 8) 13,702 12,818 164,794
25,506 26,128 306,749
Less: allowance for doubtful accounts (1,190) (581) (14,316)
24,316 25,547 292,433
Total assets ¥ 664,376 ¥ 664,767 $ 7,990,091
Cash segregated as deposits related to securities transactions
Thousands of
U.S. dollars
(Note 1)Millions of yen
2011 2010 2011
14
Consolidated Balance SheetsTokai Tokyo Financial Holdings, Inc. and Consolidated Subsidiaries
As of March 31, 2011 and 2010
See notes to consolidated financial statements.
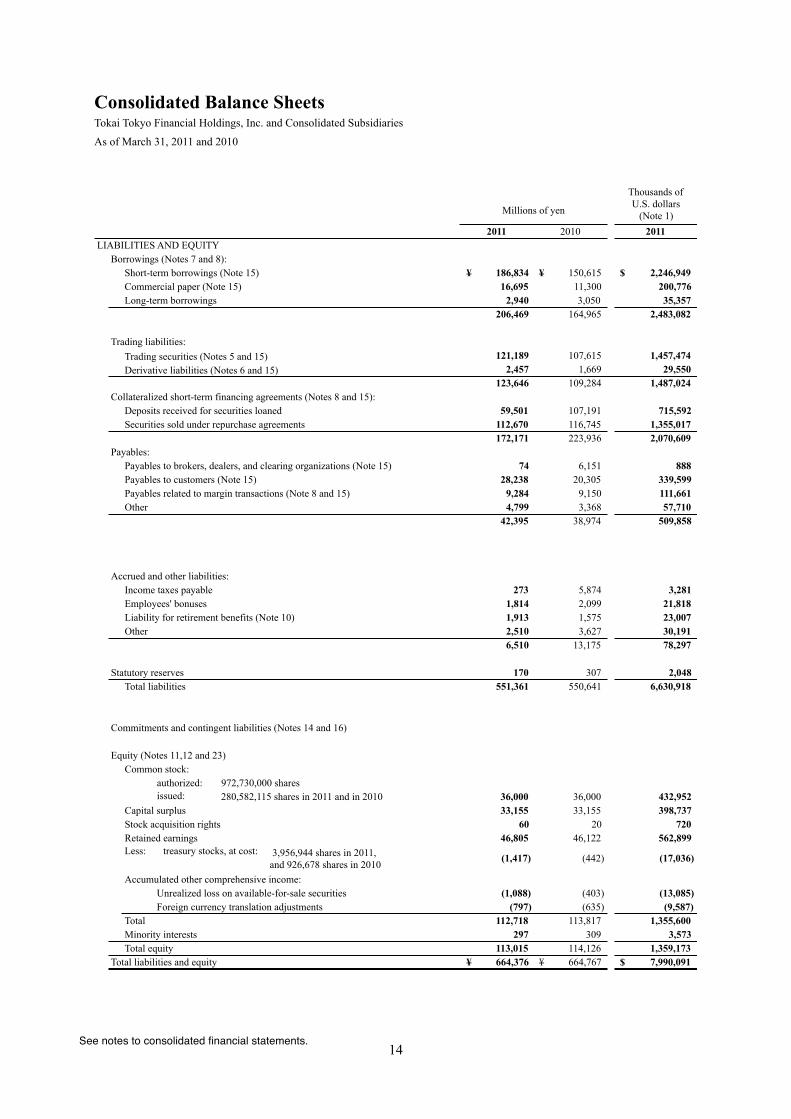
LIABILITIES AND EQUITY
Borrowings (Notes 7 and 8):
Short-term borrowings (Note 15) ¥ 186,834 ¥ 150,615 $ 2,246,949
Commercial paper (Note 15) 16,695 11,300 200,776
Long-term borrowings 2,940 3,050 35,357
206,469 164,965 2,483,082
Trading liabilities:
Trading securities (Notes 5 and 15) 121,189 107,615 1,457,474
Derivative liabilities (Notes 6 and 15) 2,457 1,669 29,550
123,646 109,284 1,487,024
Collateralized short-term financing agreements (Notes 8 and 15):
Deposits received for securities loaned 59,501 107,191 715,592
Securities sold under repurchase agreements 112,670 116,745 1,355,017
172,171 223,936 2,070,609
Payables:
Payables to brokers, dealers, and clearing organizations (Note 15) 74 6,151 888
Payables to customers (Note 15) 28,238 20,305 339,599
Payables related to margin transactions (Note 8 and 15) 9,284 9,150 111,661
Other 4,799 3,368 57,710
42,395 38,974 509,858
Accrued and other liabilities:
Income taxes payable 273 5,874 3,281
Employees' bonuses 1,814 2,099 21,818
Liability for retirement benefits (Note 10) 1,913 1,575 23,007
Other 2,510 3,627 30,191
6,510 13,175 78,297
Statutory reserves 170 307 2,048
Total liabilities 551,361 550,641 6,630,918
Commitments and contingent liabilities (Notes 14 and 16)
Equity (Notes 11,12 and 23)
Common stock:
authorized: 972,730,000 shares
issued: 36,000 36,000 432,952
Capital surplus 33,155 33,155 398,737
Stock acquisition rights 60 20 720
Retained earnings 46,805 46,122 562,899
Less:(1,417) (442) (17,036)
Accumulated other comprehensive income:
Unrealized loss on available-for-sale securities (1,088) (403) (13,085)
Foreign currency translation adjustments (797) (635) (9,587)
Total 112,718 113,817 1,355,600
Minority interests 297 309 3,573
Total equity 113,015 114,126 1,359,173
Total liabilities and equity ¥ 664,376 ¥ 664,767 $ 7,990,091
280,582,115 shares in 2011 and in 2010
treasury stocks, at cost: 3,956,944 shares in 2011,
and 926,678 shares in 2010
Thousands of
U.S. dollars
(Note 1)Millions of yen
2011 2010 2011

15
Consolidated Statements of IncomeTokai Tokyo Financial Holdings, Inc. and Consolidated Subsidiaries
For the years ended March 31, 2011 and 2010
See notes to consolidated financial statements.
Revenues:
Commissions (Note 17) ¥ 25,462 ¥ 29,673 $ 306,215
Net gain on trading 23,910 26,257 287,552
Interest and dividend income 3,031 2,570 36,454
Total revenues 52,403 58,500 630,221
Interest expense 1,618 1,390 19,455
Net revenues 50,785 57,110 610,766
Selling, general and administrative expenses (Note 18) 47,696 46,594 573,610
Operating income 3,089 10,516 37,156
Other income (expense), net (Note 19) 1,275 1,264 15,329
Income before income taxes and minority interests 4,364 11,780 52,485
Income taxes (Note 13):
Current 367 5,557 4,409
Deferred (332) (939) (3,990)
Total income taxes 35 4,618 419
Net income before minority interests 4,329 7,162 52,066
Minority interests in net income 11 1 130
Net income ¥ 4,318 ¥ 7,161 $ 51,936
Per share of common stock (Notes 2(q) and 21): U.S. dollars
Basic net income ¥ 15.50 ¥ 26.33 $ 0.19
Cash dividends applicable to the year 8.00 15.00 0.10
Yen
Thousands of
U.S. dollars
(Note 1)Millions of yen
2011 2010 2011

16
Consolidated Statements of Comprehensive Income Tokai Tokyo Financial Holdings, Inc. and Consolidated Subsidiaries
For the year ended March 31, 2011
Net income before minority interests ¥ 4,329 $ 52,066
Other comprehensive income (Note 20):
Unrealized loss on available-for-sale securities (686) (8,253)
Foreign currency translation adjustments (163) (1,959)
Comprehensive income (Note 20) ¥ 3,480 $ 41,854
Total comprehensive income attributable to (Note 20):
Owners of the parent ¥ 3,470 $ 41,737
Minority Interests 10 117
Millions of
yen
Thousands of
U.S. dollars
(Note 1)
2011 2011
See notes to consolidated financial statements.

17
Consolidated Statements of Changes in Equity Tokai Tokyo Financial Holdings, Inc. and Consolidated Subsidiaries
For the years ended March 31, 2011 and 2010
See notes to consolidated financial statements.
Common Treasury
stock stock
Balance as of March 31, 2009 285,582 20,183 ¥ 36,000 ¥ 37,569 ¥ - ¥ 41,217 ¥ (9,661) ¥ (408) ¥ (689) ¥ 104,028 ¥ 304 ¥ 104,332
Net income - - - - - - 7,161 - - - - 7,161 - 7,161
Cash dividends, ¥8.50per share - - - - - - (2,256) - - - - (2,256) - (2,256)
Purchase of treasury stock - 27 - - - - - (8) - - (8) - (8)
Disposal of treasury stock - (14,283) - (2,022) - - - 6,835 - - 4,813 - 4,813
Retirement of treasury stock - (5,000) - (2,392) - - - 2,392 - - - - -
Net change in the year - - - - 20 - - 5 54 79 5 84
Balance as of March 31, 2010 285,582 927 ¥ 36,000 ¥ 33,155 ¥ 20 ¥ 46,122 ¥ (442) ¥ (403) ¥ (635) ¥ 113,817 ¥ 309 ¥ 114,126
Net income - - - - - 4,318 - - - 4,318 - 4,318
Cash dividends, ¥13.00per share - - - - - (3,635) - - - (3,635) - (3,635)
Purchase of treasury stock - 3,030 - - - - (975) - - (975) - (975)
Disposal of treasury stock - (0) - (0) - - 0 - - 0 - 0
Net change in the year - - - - 40 - - (685) (162) (807) (12) (819)
Balance as of March 31, 2011 285,582 3,957 ¥ 36,000 ¥ 33,155 ¥ 60 ¥ 46,805 ¥ (1,417) ¥ (1,088) ¥ (797) ¥ 112,718 ¥ 297 ¥ 113,015
Balance as of March 31, 2010 $ 432,952 $ 398,737 $ 242 $ 554,685 $ (5,324) $ (4,844) $ (7,628) $ 1,368,820 $ 3,714 $ 1,372,534
Net income - - - 51,936 - - - 51,936 - 51,936
Cash dividends, $0.156per share - - - (43,722) - - - (43,722) - (43,722)
Purchase of treasury stock - - - - (11,714) - - (11,714) - (11,714)
Disposal of treasury stock - (0) - - 2 - - 2 - 2
Net change in the year - - 478 - - (8,241) (1,959) (9,722) (141) (9,863)
Balance as of March 31, 2011 $ 432,952 $ 398,737 $ 720 $ 562,899 $ (17,036) $ (13,085) $ (9,587) $ 1,355,600 $ 3,573 $ 1,359,173
Thousands of shares Millions of yen
Accumulated other comprehensive
income
Unrealized Foreign
gain (loss) on currency
Common Capital Stock acquisition Retained Treasury available-for-sale translation Minority Total
equity
Thousands of U.S. dollars (Note 1)
Accumulated other comprehensive
income
stock securities adjustments Totalstock surplus rights
Unrealized
interestsearnings
Foreign
Minority
gain on currency
translation
interests
Common Capital Stock acquisition Retained Treasury available-for-sale
equity
Total
stock Surplus rights earnings stock securities adjustments Total

18
Consolidated Statements of Cash FlowsTokai Tokyo Financial Holdings, Inc. and Consolidated Subsidiaries
For the years ended March 31, 2011 and 2010
See notes to consolidated financial statements.
Cash flows from operating activities:
Income before income taxes and minority interests ¥ 4,364 ¥ 11,780 $ 52,485
Income taxes - paid (5,658) (151) (68,041)
Depreciation and amortization 2,724 2,737 32,761
Provision for (reversal of) doubtful accounts 623 (100) 7,487
Provision for retirement benefits 338 300 4,059
Reversal of statutory reserves (137) (54) (1,647)
Net gains on sale of investment securities (22) (2) (261)
Gains on change in equity (647) - (7,777)
Losses on devaluation of fixed assets - 13 -
Losses on disposal of fixed assets 250 94 3,006
Net losses on sale of fixed assets 22 13 266
Losses on devaluation of investment securities 347 231 4,172
19 - 226
Gains from negative goodwill (13) - (151)
Changes in assets and liabilities:
Increase in receivables (1,843) (8,910) (22,169)
Increase in payables 2,830 13,464 34,037
Trading assets and liabilities 84,735 (53,077) 1,019,059
Collateralized short-term financing agreements (119,841) 22,086 (1,441,264)
Other, net (1,491) (2,137) (17,933)
Total adjustments (37,764) (25,493) (454,170)
Net cash used in operating activities (33,400) (13,713) (401,685)
Cash flows from investing activities:
Purchases of property and equipment (2,906) (1,762) (34,950)
Proceeds from sale of property and equipment 12 173 150
Proceeds from sale of other assets 2 - 21
Purchases of short-term investment securities (1) (100) (15)
Purchases of investment securities (2,061) (228) (24,791)
Purchases of subsidiary stock (8) - (96)
Proceeds from sales of subsidiary - 5 -
- 98 -
Proceeds from sale of investment securities 249 83 2,994
Other, net 1,215 (148) 14,614
Net cash used in investing activities (3,498) (1,879) (42,073)
Cash flows from financing activities:
Increase (decrease) in short-term borrowings - net 36,228 (2,434) 435,699
Proceeds from long-term borrowings - 810 -
Repayments of long-term borrowings (110) (100) (1,323)
Proceeds from commercial paper 64,095 84,000 770,830
Redemption of commercial paper (58,700) (86,100) (705,953)
Purchases of treasury stock (964) - (11,598)
Disposal of treasury stock - 4,813 -
Net increase in treasury stock (10) (8) (115)
Dividends paid (3,635) (2,256) (43,722)
Subscription money received from the minority shareholders 2,550 - 30,668
Dividends to minority shareholders (1) (1) (11)
Net cash provided by (used in) financing activities 39,453 (1,276) 474,475
Foreign currency translation adjustments on cash and cash equivalents (217) 60 (2,608)
Net increase (decrease) in cash and cash equivalents 2,338 (16,808) 28,109
(3,133) - (37,673)
Cash and cash equivalents at the beginning of year 62,521 79,329 751,907
Cash and cash equivalents at the end of year (Note 4) ¥ 61,726 ¥ 62,521 $ 742,343
Effect from the application of accounting
standard for asset retirement obligation (note 2(i))
Net cash flow from acquired subsidiary which
resulted in change in the scope of consolidation
Decrease in cash and cash equivalents
due to change in the scope of consolidation
Adjustments for:
Thousands of
U.S. dollars
(Note 1)Millions of yen
2011 2010 2011

19
Notes to Consolidated Financial Statements Tokai Tokyo Financial Holdings, Inc. and Consolidated SubsidiariesYears ended March 31, 2011 and 2010
1.aaBasis of presenting consolidated financial statements
The accompanying consolidated financial statements have been prepared by Tokai Tokyo Financial Holdings, Inc. (hereafter referred to as the “Company”) and its subsidiaries (together with the Company, hereafter referred to as the “Group”) in accordance with the provisions set forth in the Japanese Financial Instruments and Exchange Act and its related accounting regulations, and in conformity with accounting principles generally accepted in Japan, which are different in certain respects as to application and disclosure requirements of International Financial Reporting Standards.
Under Japanese GAAP, a consolidated statement of comprehensive income is required to be prepared from the fiscal year ended March 31, 2011 and has been presented herein. Accordingly, accumulated other comprehensive income is presented in the consolidated balance sheet and the consolidated statement of changes in equity. Information with respect to other comprehensive income for the year ended March 31, 2010 is disclosed in Note 20. In addition, “Net Income before Minority Interests” is disclosed in the consolidated statement of income from the year ended March 31, 2011.
In preparing the consolidated financial statements, certain reclassifications and rearrangements have been made to the consolidated financial statements issued in Japan in order to present them in a form which is more familiar to readers outside Japan. In addition, certain reclassifications have been made in the 2010 financial statements to conform to the classifications used in 2011.
The translation of yen amounts into U.S. dollars is included solely for the convenience of the reader, using the prevailing exchange rate at March 31, 2011, which was ¥83.15 to US$1. The amounts in yen are directly converted into U.S. dollar amounts even for the amounts presented only in millions of yen in the financial statements. As such, there are cases that the conversion of the amounts in millions of yen with the prevailing exchange rate are different from those in U.S. dollars shown in the financial statements. The translation should not be construed as a representation that the yen amounts have been, could have been or could be converted into U.S. dollars at that or any other rate.
2. Summary of significant accounting policies
a. Principles of consolidationThe consolidated financial statements as of March 31, 2011 include the accounts of the Company and its 16 (17 in 2010) subsidiaries.
Under the control or influence concept, those companies in which the Company, directly or indirectly, is able to exercise control over operations are fully consolidated, and those companies over which the Group has the ability to exercise significant influence are accounted for by the equity method.
Investments in three (two in 2010) affiliates are accounted for by the equity method. Investments in the remaining unconsolidated subsidiaries and affiliates are stated at cost. If the equity method of accounting had been applied to the investments in these companies, the effect on the accompanying consolidated financial statements would not be material.

20
The difference between the cost of an acquisition and the fair value of the net assets of the acquired subsidiaries at the date of acquisition is recognized as negative goodwill and amortized, using the straight-line method over a period of three to five years.
All significant intercompany balances and transactions have been eliminated in consolidation. All material unrealized profit included in assets resulting from transactions within the Group is eliminated.
Nishi-Nippon City Tokai Tokyo Securities Co., Ltd. (“Nishi-Nippon City TT Securities”) was previously included in the scope of consolidation. Upon issuance of new shares by Nishi-Nippon City TT Securities on May 6, 2010, the Company's shareholding ratio in Nishi-Nippon City TT Securities decreased. Therefore it was excluded from the scope of consolidation and included in associated companies accounted for using the equity method.
Toyota Financial Services Securities Corporation (“Toyota FS Securities”) was merged with Tokai Tokyo Securities Co., Ltd. (“Tokai Tokyo Securities”) effective April 5, 2010, with Tokai Tokyo Securities as the surviving company. As a result, Toyota FS Securities was excluded from the scope of consolidation.
Tokai Tokyo Investment Management Co., Ltd. (“TTIM”) merged with Tokai Tokyo Finance & Real Estate Co., Ltd. (“TTF&RE”) effective January 1, 2011, with TTF&RE as the surviving company. As a result, TTIM was excluded from the scope of consolidation. The surviving company changed its name to Tokai Tokyo Asset Management Co., Ltd. on the same date.
Following the establishments of Tokai Tokyo Investment Management Singapore Pte. Ltd. on March 1, 2011 and Tokai Tokyo Academy Co., Ltd. on March 2, 2011, the Company included these two companies in the scope of consolidation.
b. Unification of accounting policies applied to associated companies for the equity methodIn March 2008, the Accounting Standards Board of Japan (the“ASBJ”) issued ASBJ Statement No.16, “Accounting Standard for Equity Method of Accounting for Investments”, and ASBJ Practical Issues Task Force (“PITF”) No. 18, “Practical Solution on Unification of Accounting Policies Applied to Associates Accounted for Using the Equity Method”. The new standard requires adjustments to be made to conform the associate’s accounting policies for similar transactions and events under similar circumstances to those of the parent company when the associate’s financial statements are used in applying the equity method unless it is impracticable to determine adjustments. This standard was applicable to equity method of accounting for fiscal years beginning on or after April 1, 2010.The Company applied this accounting standard effective April 1, 2010. The effect of this change on the accompanying consolidated financial statements was immaterial.
c. Business combinationIn October 2003, the Business Accounting Council (the “BAC”) issued a Statement of Opinion, “Accounting for Business Combinations”, and in December 2005, the ASBJ issued ASBJ Statement No.7, “Accounting Standard for Business Divestitures” and ASBJ Guidance No.10, “Guidance for Accounting Standard for Business Combinations and Business Divestitures”. The accounting standard for business combinations allows companies to apply the pooling of interests method of accounting only when certain specific criteria are met such that the business combination is essentially regarded as a uniting-of-interests. For business combinations that do not meet the uniting-of-interests criteria, the business combination is considered to be an acquisition and the purchase method of accounting is required. This standard also prescribes the accounting for combinations of entities under common control and for joint ventures.
In December 2008, the ASBJ issued a revised accounting standard for business combinations, ASBJ Statement

21
No.21, “Accounting Standard for Business Combinations”. Major accounting changes under the revised accounting standard are as follows: (1) The revised standard requires accounting for business combinations only by the purchase method. As a result, the pooling of interests method of accounting is no longer allowed. (2) The current accounting standard accounts for the research and development costs to be charged to income as incurred. Under the revised standard, in-process research and development (IPR&D) acquired in the business combination is capitalized as an intangible asset. (3) The previous accounting standard provided for a bargain purchase gain (negative goodwill) to be systematically amortized over a period not exceeding 20 years. Under the revised standard, the acquirer recognizes the bargain purchase gain in profit or loss immediately on the acquisition date after reassessing and confirming that all of the assets acquired and all of the liabilities assumed have been identified after a review of the procedures used in the purchase allocation. This standard was applicable to business combinations undertaken on or after April 1, 2010 with early adoption permitted for fiscal years beginning on or after April 1, 2009.
d. Cash and cash equivalentsCash and cash equivalents disclosed in the consolidated statements of cash flows comprise cash on hand, demand deposits and ordinary deposits which can be easily liquidated on demand with original maturities of three months or less.
e. Financial instrumentsThe purpose of trading activities is to make profits or reduce losses from the short-term volatility and arbitrage between markets in stock prices, interest rates, foreign exchange rates and other market indices. The scope of trading activities is mainly consisted of the following:1) Buying and selling of securities2) Market transactions of derivatives3) Over-the-counter transactions of derivativesSecurities, derivative contracts and other financial instruments classified as trading assets and liabilities are stated at fair value based on the mark-to-market method.
Other securities are held for non-trading purposes as available-for-sale and classified as short-term investment securities and investment securities. Available-for-sale securities that have a market quotation are stated at the market price prevailing at the end of the fiscal year. Differences between the cost of securities held determined by the moving average method and the fair value less associated deferred taxes are recorded in the “Net unrealized loss on available-for-sale securities” in Equity on the consolidated balance sheets. Available-for-sale securities without a market quotation are stated at cost as determined by the moving average or are stated at amortized cost. Where available-for-sales securities have declined significantly and such impairment of value is deemed not temporary, such securities are written down to their fair value and the resulting losses are charged to income for the period.
f. Property and equipmentProperty and equipment are stated at cost. Depreciation of tangible fixed assets is calculated based on the declining-balance method. However, buildings (excluding leasehold improvements acquired by the Company and its domestic consolidated subsidiaries on or after April 1, 1998) are depreciated by using the straight-line method. The estimated useful lives of tangible fixed assets are mainly as follows: Buildings 2-50 years Fixtures and furniture 3-20 years
22
g. Long-lived assetsThe Group reviews its long-lived assets for impairment whenever events or changes in circumstance indicate the carrying amount of an asset or asset group may not be recoverable. An impairment loss would be recognized if the carrying amount of an asset or asset group exceeds the sum of the undiscounted future cash flows expected to result from the continued use and eventual disposition of the asset or asset group. The impairment loss would be measured as the amount by which the carrying amount of the asset exceeds its recoverable amount, which is the higher of the discounted cash flows from the continued use and eventual disposition of the asset or the net selling price at disposition.
h. Intangible fixed assetsAmortization of intangible fixed assets is calculated by the straight-line method. Software for internal use is amortized by the straight-line method over its economic useful life.
i. Retirement benefitsLiability for retirement benefits is provided for by the Company and its domestic consolidated subsidiaries based on projected benefit obligations and plan assets at the end of the fiscal year. Any actuarial differences are amortized by the straight-line method over ten years within the average of employees' remaining service period, starting in the fiscal year following the occurrence of such differences. Prior service cost is amortized by the straight-line method over ten years within the average of employees' remaining service period.The Company and its certain domestic consolidated subsidiaries account for the liability for retirement allowances for directors and corporate auditors in accordance with the internal rules to state the liability at the amount that would be required if all directors and corporate auditors retired at each balance sheet date.
j. Asset Retirement ObligationsIn March 2008, the ASBJ published the accounting standard for asset retirement obligations, ASBJ Statement No.18 “Accounting Standard for Asset Retirement Obligations” and ASBJ Guidance No.21 “Guidance on Accounting Standard for Asset Retirement Obligations”. Under this accounting standard, an asset retirement obligation is defined as a legal obligation imposed either by law or contract that results from the acquisition, construction, development and the normal operation of a tangible fixed asset and is associated with the retirement of such tangible fixed asset. The asset retirement obligation is recognized as the sum of the discounted cash flows required for the future asset retirement and is recorded in the period in which the obligation is incurred if a reasonable estimate can be made. If a reasonable estimate of the asset retirement obligation cannot be made in the period the asset retirement obligation is incurred, the liability should be recognized when a reasonable estimate of asset retirement obligation can be made. Upon initial recognition of a liability for an asset retirement obligation, an asset retirement cost is capitalized by increasing the carrying amount of the related fixed asset by the amount of the liability. The asset retirement cost is subsequently allocated to expense through depreciation over the remaining useful life of the asset. Over time, the liability is accreted to its present value each period. Any subsequent revisions to the timing or the amount of the original estimate of undiscounted cash flows are reflected as an increase or a decrease in the carrying amount of the liability and the capitalized amount of the related asset retirement cost. This standard was effective for fiscal years beginning on or after April 1, 2010.The Group applied this accounting standard effective April 1, 2010. The effect of this change was to decrease operating income by ¥10 million ($121 thousand) and income before income taxes and minority interests by ¥29 million ($347 thousand).
k. Statutory reservesThe Japanese Financial Instruments and Exchange Act and its related regulations require a securities company to set aside a reserve in proportion to its securities transactions and other related trading to cover possible customer losses incurred by default of the securities company on securities transactions, derivative transactions or other related trading.

23
l. Stock optionsThe ASBJ Statement No. 8, “Accounting Standard for Stock Options” and related guidance are applicable to stock options granted on and after May 1, 2006. This standard requires companies to recognize compensation expense for employee stock options based on the fair value at the date of grant and over the vesting period as consideration for receiving goods or services. The standard also requires companies to account for stock options granted to non-employees based on the fair value of either the stock option or the goods or services received. In the balance sheet, the stock option is presented as a stock acquisition right as a separate component of equity until exercised. The standard allows unlisted companies to measure options at their intrinsic value if they cannot reliably estimate fair value. The Group has applied the accounting standard for stock options to those granted on and after May 1, 2006.
m. LeasesIn March 2007, the ASBJ issued ASBJ Statement No. 13, “Accounting Standard for Lease Transactions” which revised the previous accounting standard for lease transactions issued in June 1993. The revised accounting standard for lease transactions was effective for fiscal years beginning on or after April 1, 2008.Under the previous accounting standard, finance leases that were deemed to transfer ownership of the leased property to the lessee were capitalized. However, other finance leases were permitted to be accounted for as operating lease transactions if certain “as if capitalized” information was disclosed in the note to the lessee’s financial statements. The revised accounting standard requires that all finance lease transactions be capitalized to recognize lease assets and lease obligations in the balance sheet. In addition, the revised accounting standard permits leases which existed at the transition date and do not transfer ownership of the leased property to the lessee to continue to be accounted for as operating lease transactions.The Group applied the revised accounting standard effective April 1, 2008. In addition, the Group continues to account for leases which existed at the transition date and do not transfer ownership of the leased property to the lessee as operating lease transactions. There was no effect of this change on the consolidated statement of income.All other leases are accounted for as operating leases.
n. Bonuses to directors and corporate auditorsBonuses to directors and corporate auditors are accrued at the year end to which such bonuses are attributable.
o. Income taxesThe provision for income taxes is computed based on the pretax income included in the consolidated statements of income. The asset and liability approach is used to recognize deferred tax assets and liabilities for the expected future tax consequences of temporary differences between the carrying amounts and the tax bases of assets and liabilities. Deferred taxes are measured by applying currently enacted tax laws to the temporary differences.
p. Foreign currency transactionsAll short-term and long-term monetary receivables and payables denominated in foreign currencies are translated into Japanese yen at the exchange rates at the balance sheet date. The foreign exchange gains and losses from translation are recognized in the statements of income to the extent that they are not hedged by forward exchange contracts.
q. Foreign currency financial statementsThe balance sheet and statement of income accounts of the consolidated foreign subsidiaries are translated into Japanese yen at the current exchange rate as of the balance sheet date except for equity, which is translated at the historical rate. Differences arising from such translation were shown as “Foreign currency translation adjustments” under accumulated other comprehensive income in a separate component of equity.

24
r. Per share informationBasic net income per share is computed by dividing net income available to common shareholders by the weighted-average number of common shares outstanding for the period.Cash dividends per share presented in the accompanying consolidated statements of income are dividends applicable to the respective year including dividends to be paid after the end of the year.
s. New Accounting PronouncementsAccounting changes and error correctionsIn December 2009, ASBJ issued ASBJ Statement No. 24 “Accounting Standard for Accounting changes and error corrections” and ASBJ Guidance No. 24 “Guidance on Accounting Standard for Accounting changes and error corrections”. Accounting treatments under this standard and guidance are as follows:(1) Changes in Accounting Policies:When a new accounting policy is applied with revision of accounting standards, the new policy is applied retrospectively unless the revised accounting standards include specific transitional provisions. When the revised accounting standards include specific transitional provisions, an entity shall comply with the specific transitional provisions. (2) Changes in PresentationsWhen the presentation of financial statements is changed, prior period financial statements are reclassified in accordance with the new presentation. (3) Changes in Accounting EstimatesA change in an accounting estimate is accounted for in the period of the change if the change affects that period only, and is accounted for prospectively if the change affects both the period of the change and future periods.(4) Corrections of Prior Period ErrorsWhen an error in prior period financial statements is discovered, those statements are restated.This accounting standard and the guidance are applicable to accounting changes and corrections of prior period errors which are made from the beginning of the fiscal year that begins on or after April 1, 2011.
3. Business combination
1. Issuance of new shares by Nishi-Nippon City TT Securities and change in the scope of consolidation The Board of Directors of Nishi-Nippon City TT Securities, a consolidated subsidiary of the Company,
approved on March 23, 2010 the allocation of new shares to The Nishi-Nippon City Bank, Ltd. (“Nishi-Nippon City Bank”). The new shares were issued and allocated on May 6, 2010.
Outline of the issuance and allotment of new shares (a) Subscription and allotment of new shares: By way of a third party allotment (b) Number of shares newly issued: (i) Common stock: 2,550 shares (ii) Issue price: ¥1 million ($12 thousand) per share (iii) Total issue price: ¥2,550 million ($30,667 thousand) (iv) Amount capitalized: Common stock: ¥1,275 million ($15,334 thousand) Capital surplus: ¥1,275 million ($15,334 thousand) (c) Due date for payment: May 6, 2010 (d) Purpose and outline of the company split:
The Company and Nishi-Nippon City Bank established Nishi-Nippon City TT Securities with the aim to make it become a leading securities company in Fukuoka Prefecture, the economic center

25
of Kyushu which has a population of over 5 million. The new securities company will leverage Nishi-Nippon City Bank's network of branches, which covers entire region of Fukuoka Prefecture, its solid customer base, and its community-based, well recognized brand. The new company will also benefit from the advanced expertise and resources that Tokai Tokyo Securities has developed as an independent securities company that carries full-line products. As such, the company is expected to become the securities company selected most by customers.To provide better community-suited products and services to the customers in Fukuoka, maximizing the effects of the alliance with Nishi-Nippon City Bank, and to concentrate the management resources of the Company, Tokai Tokyo Securities spun off its financial instruments business of Fukuoka Branch and transferred it to Nishi-Nippon City TT Securities effective May 6, 2010.
Details of transferred assets and liabilities were as follows:
Pursuant to the Shareholders’ Agreement entered into between the Company and Nishi-Nippon City Bank on March 25, 2010, Nishi-Nippon City Bank subscribed for all shares that Nishi-Nippon City TT Securities issued immediately after the split. As a result, Nishi-Nippon City TT Securities became a joint venture company of both companies. On May 6, 2010, Nishi-Nippon City TT Securities issued new shares and allotted them to Nishi-Nippon City Bank.
(e) Gain on change in equityWith the issuance of new shares by Nishi-Nippon City TT Securities, the Company's shareholding ratio decreased. As a result, during the current year, Nishi-Nippon City TT Securities became an associated company being accounted for using the equity method. ¥647 million ($7,777 thousand) of “gains on change in equity” (other income) was recognized.
Assets
(Millions
of yen
(Thousands of
U.S. dollars)
Cash on hand and in banks ¥ 0 $ 2
Cash segregated as deposits for customers 218 2,620
Receivables related to margin transactions 28 333
Others 0 3
Total current assets 246 2,958
Property and equipment 7 82
Intangible assets 3 45
Investments and other assets 28 336
Total fixed assets 38 463
Total ¥ 284 $ 3,421
Liabilities
(Millions of
yen)
(Thousands of
U.S. dollars)
Payables to customers ¥ 201 $ 2,423
Payables related to margin transactions 28 333
Guarantee deposits received 16 197
Others 0 0
Total current liabilities 245 2,953
Total ¥ 245 $ 2,953

26
2. Merger with Toyota FS SecuritiesTransactions under common control, etc.(1) Outline of the transactions
(a) Designated business and business activities Designated business: Financial instrument business of Toyota FS Securities Business activities: Buying, selling, underwriting, offering, and private offering of securities(b) Effective date of the business combination April 5, 2010(c) Legal form of the business combination An absorption-type merger, with Tokai Tokyo Securities as the surviving company and Toyota FS
Securities as the merging company(d) Company name after the merger Tokai Tokyo Securities (a consolidated subsidiary of the Company)(e) Outline of the transaction, including purpose of the transaction Toyota FS Securities has a solid customer base with 110,000 accounts, including those of the Toyota
Group, mainly in the Chubu region. It has been operating as a unique securities firm focusing on retail securities services, with internet transactions as its core service capability.
On the other hand, Tokai Tokyo Securities has a business base predominantly in the Chubu region and has launched a number of growth strategies, notable one of which is the formation of alliance with regional financial institutions. Tokai Tokyo Securities operates as an independent full-line securities company engaged in a broad array of securities business activities, ranging from face-to-face retail securities brokerage to an investment banking service for small and medium corporations.
The agreement was reached because both Toyota FS Securities and Tokai Tokyo Securities considered a merger of securities company operation to be the most effective way forward to develop a new stage of operations, by improving products, services, and functions and expanding operations, while leaving the strength of each company.
(2) Accounting treatment applied for this business combination This business combination was accounted for as transactions under common control in accordance
with “Accounting Standard for Business Combinations” (ASBJ Statement No.21, December 26, 2008) and “Guidance for Business Combinations and Business Divestitures” (ASBJ Statement No. 10, December 26, 2010).
4. Cash and cash equivalents
Reconciliation between cash and cash equivalents in the consolidated statements of cash flows and cash and time deposits in the consolidated balance sheets as of March 31, 2011 and 2010 is presented as follows:
(Millions of yen)
(Thousands of
U.S. dollars)
2011 2010 2011
Cash and time deposits ¥ 62,243 ¥ 63,092 $ 748,564
Time deposits with maturity of over three months (517) (571) (6,221)
Cash and cash equivalents ¥ 61,726 ¥ 62,521 $ 742,343

27
5. Securities
(1) Trading Securities as of March 31, 2011 and 2010 consisted of the following:
Short-term investment securities and investment securities as of March 31, 2011 and 2010 consisted of the following:
(Millions of yen)
(Thousands of
U.S. dollars)
2011 2010 2011
Trading assets:
Equity and warrants ¥ 7,473 ¥ 18,284 $ 89,878
Bonds 157,444 222,761 1,893,490
Beneficiary certificates of investment trust 7,161 3,965 86,123
Other 163 266 1,953
Total ¥ 172,241 ¥ 245,276 $ 2,071,444
Trading liabilities:
Equity and warrants ¥ 17,411 ¥ 20,431 $ 209,398
Bonds 103,203 87,184 1,241,161
Beneficiary certificates of investment trust
575 - 6,915
Total ¥ 121,189 ¥ 107,615 $ 1,457,474
(Millions of yen)
2011 2010
Balance
sheets
Acquisition
cost
Difference
Balance
sheets
Acquisition
cost
Difference
Available-for-sale securities
Securities with market value that
exceed acquisition cost:
¥ 1,143 ¥ 726 ¥ 417 ¥ 1,463 ¥ 998 ¥ 465
Stocks 1,143 726 417 1,453 988 465
Bonds - - - 10 10 0
Governmental/municipal bonds - - - 10 10 0
Securities with market value that
do not exceed acquisition cost:
3,622 4,926 (1,304) 3,172 3,942 (770)
Stocks 3,512 4,815 (1,303) 3,072 3,842 (770)
Bonds 110 111 (1) 100 100 (0)
Governmental/municipal bonds 110 111 (1) 100 100 (0)
¥ 4,765 ¥ 5,652 ¥ (887) ¥ 4,635 ¥ 4,940 ¥ (305)
(Thousands of U.S. dollars)
2011
Balance
sheets
Acquisition
cost Difference
Available-for-sale securities:
Securities with market value that
exceed acquisition cost: $ 13,752 $ 8,729 $ 5,022
Stocks 13,752 8,729 5,022
Bonds - - -
Governmental/municipal bonds - - -
Securities with market value that do
not exceed acquisition cost: 43,557 59,248 (15,691)
Stocks 42,231 57,911 (15,680)
Bonds 1,326 1,337 (11)
Governmental/municipal bonds 1,326 1,337 (11)
$ 57,309 $ 67,977 $ (10,669)

28
(2) The proceeds from sales of investment securities, gross realized gains and losses on investment securities for the years ended March 31, 2011 and 2010 were summarized as follows:
(3) The impairment losses on available-for-sale securities for the years ended March 31, 2011 and 2010 were ¥347 million ($4,172 thousand) and ¥ 231 million, respectively.
(4) The carrying values of debt securities with contractual maturities classified as available-for-sale at March 31, 2011 are as follows:
6. Derivatives
Derivative transactions to which hedge accounting is not applied
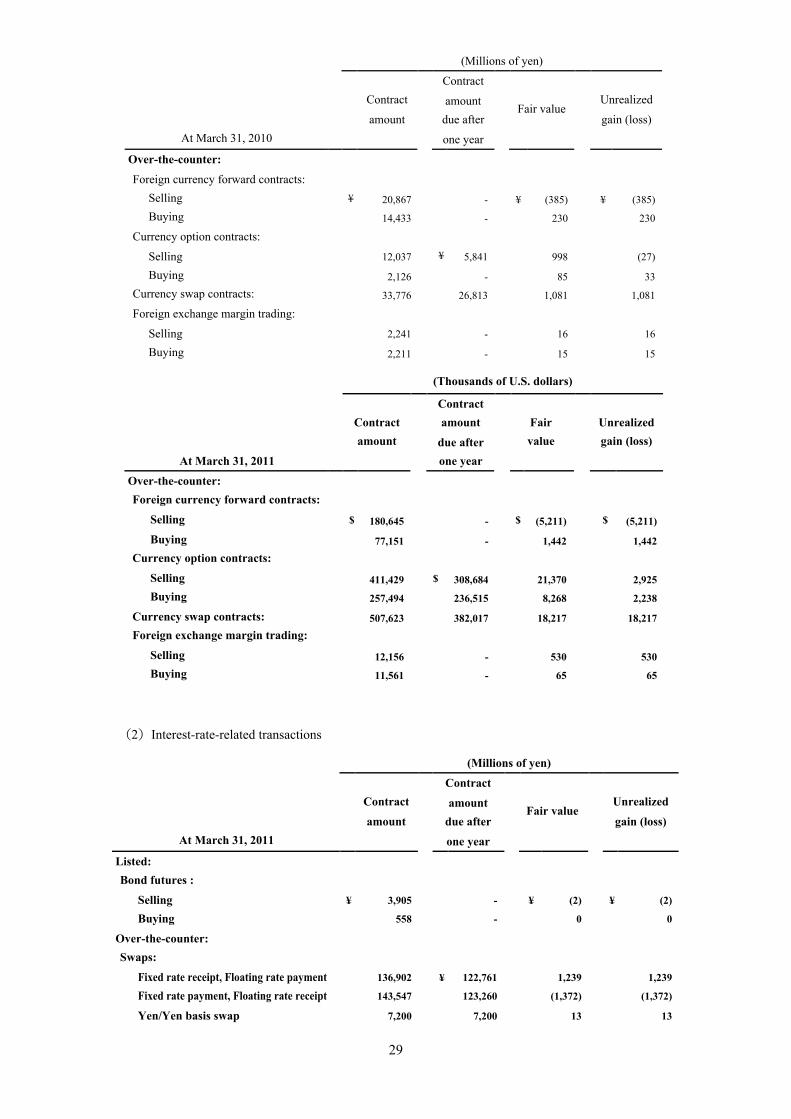
(1) Currency-related transactions
(Millions of yen)
(Thousands of
U.S. dollars)
2011 2010 2011
Proceeds from sales ¥ 245 ¥ 86 $ 2,950
Stocks 216 78 2,602
Bonds 10 - 120
Other 19 8 228
Gross realized gains 84 4 1,004
Gross realized losses (62) (1) (743)
(Millions of yen)
(Thousands of
U.S. dollars)
Available
for sale
Available
for sale
Due in one year or less ¥ 100 $ 1,206
Due after one year through five years 10 120
Due after five years through ten years - -
Due after ten years - -
Total ¥ 110 $ 1,326
(Millions of yen)
At March 31, 2011
Contract
amount
Contract
amount
due after
one year
Fair
value
Unrealized
gain (loss)
Over-the-counter:
Foreign currency forward contracts:
Selling ¥ 15,021 - ¥ (433) ¥ (433)
Buying 6,415 - 120 120
Currency option contracts:
Selling 34,210 ¥ 25,667 1,777 243
Buying 21,411 19,666 687 186
Currency swap contracts: 42,209 31,765 1,515 1,515
Foreign exchange margin trading:
Selling 1,011 - 44 44
Buying 961 - 5 5
29
(2)Interest-rate-related transactions
(Millions of yen)
At March 31, 2010
Contract
amount
Contract
amount
due after
one year
Fair value Unrealized
gain (loss)
Over-the-counter:
Foreign currency forward contracts:
Selling ¥ 20,867 - ¥ (385) ¥ (385)
Buying 14,433 - 230 230
Currency option contracts:
Selling 12,037 ¥ 5,841 998 (27)
Buying 2,126 - 85 33
Currency swap contracts: 33,776 26,813 1,081 1,081
Foreign exchange margin trading:
Selling 2,241 - 16 16
Buying 2,211 - 15 15
(Thousands of U.S. dollars)
At March 31, 2011
Contract
amount
Contract
amount
due after
one year
Fair
value
Unrealized
gain (loss)
Over-the-counter:
Foreign currency forward contracts:
Selling $ 180,645 - $ (5,211) $ (5,211)
Buying 77,151 - 1,442 1,442
Currency option contracts:
Selling 411,429 $ 308,684 21,370 2,925
Buying 257,494 236,515 8,268 2,238
Currency swap contracts: 507,623 382,017 18,217 18,217
Foreign exchange margin trading:
Selling 12,156 - 530 530
Buying 11,561 - 65 65
(Millions of yen)
At March 31, 2011
Contract
amount
Contract
amount
due after
one year
Fair value Unrealized
gain (loss)
Listed:
Bond futures :
Selling ¥ 3,905 - ¥ (2) ¥ (2)
Buying 558 - 0 0
Over-the-counter:
Swaps:
Fixed rate receipt, Floating rate payment 136,902 ¥ 122,761 1,239 1,239
Fixed rate payment, Floating rate receipt 143,547 123,260 (1,372) (1,372)
Yen/Yen basis swap 7,200 7,200 13 13

30
(Millions of yen)
At March 31, 2010
Contract
amount
Contract
amount
due after
one year
Fair value Unrealized
gain (loss)
Listed:
Bond futures :
Selling ¥ 5,957 -
¥ 14 ¥ 14
Buying 1,382 -
0 0
Bond futures option :
Selling 5,758 -
6 (2)
Buying 5,523 -
14 3
Over-the-counter:
Swaps:
Fixed rate receipt, Floating rate payment 102,005 ¥ 85,151 489 489
Fixed rate payment, Floating rate receipt 120,182 89,457 (755) (755)
Yen/Yen basis swap 2,200 2,200 8 8
Caps and Floors:
Selling 2,000 - - 4
Buying - - - -
(Thousands of U.S. dollars)
At March 31, 2011
Contract
amount
Contract
amount
due after
one year
Fair value Unrealized
gain (loss)
Listed:
Bond futures :
Selling $ 46,966 - $ (26) $ (26)
Buying 6,712 - 1 1
Over-the-counter:
Swaps:
Fixed rate receipt, Floating rate payment 1,646,447 $ 1,476,377 14,905 14,905
Fixed rate payment, Floating rate receipt 1,726,361 1,482,380 (16,498) (16,498)
Yen/Yen basis swap 86,590 86,590 162 162
31
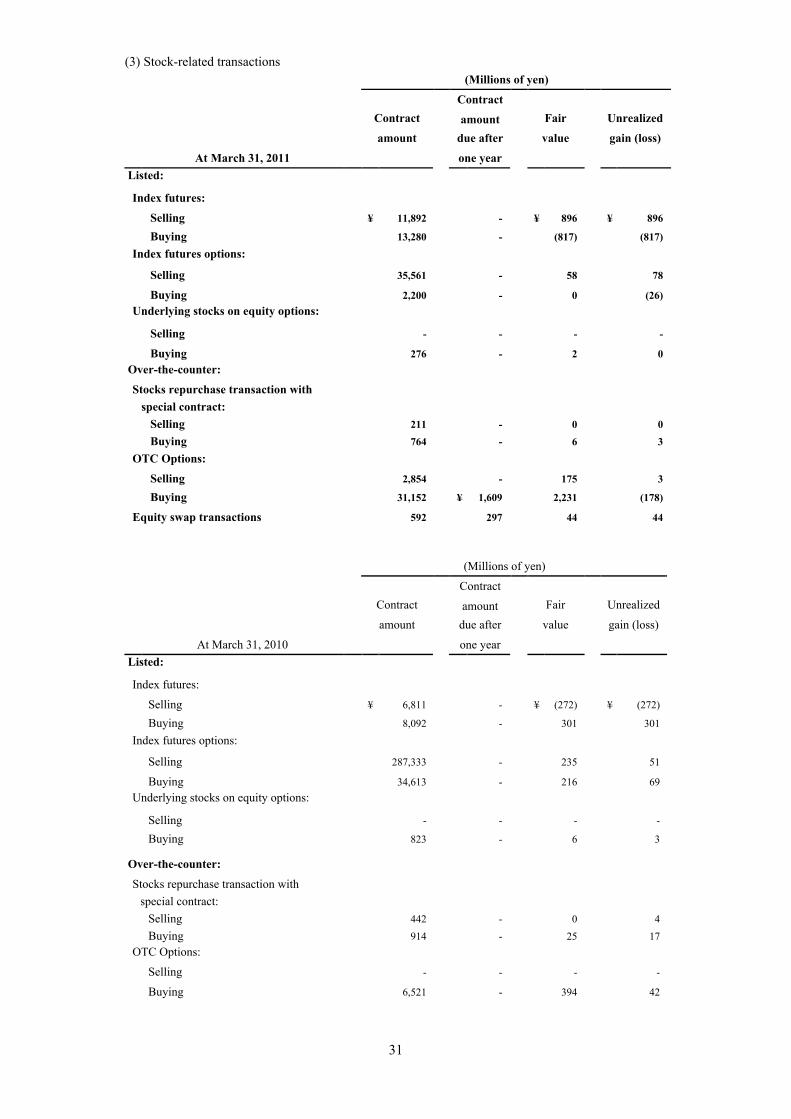
(3) Stock-related transactions (Millions of yen)
At March 31, 2011
Contract
amount
Contract
amount
due after
one year
Fair
value
Unrealized
gain (loss)
Listed:
Index futures:
Selling ¥ 11,892 - ¥ 896 ¥ 896
Buying 13,280 - (817) (817)
Index futures options:
Selling 35,561 - 58 78
Buying 2,200 - 0 (26)
Underlying stocks on equity options:
Selling - - - -
Buying 276 - 2 0
Over-the-counter:
Stocks repurchase transaction with
special contract:
Selling 211 - 0 0
Buying 764 - 6 3
OTC Options:
Selling 2,854 - 175 3
Buying 31,152 ¥ 1,609 2,231 (178)
Equity swap transactions 592 297 44 44
(Millions of yen)
At March 31, 2010
Contract
amount
Contract
amount
due after
one year
Fair
value
Unrealized
gain (loss)
Listed:
Index futures:
Selling ¥ 6,811 - ¥ (272) ¥ (272)
Buying 8,092 - 301 301
Index futures options:
Selling 287,333 - 235 51
Buying 34,613 - 216 69
Underlying stocks on equity options:
Selling - - - -
Buying 823 - 6 3
Over-the-counter:
Stocks repurchase transaction with
special contract:
Selling 442 - 0 4
Buying 914 - 25 17
OTC Options:
Selling - - - -
Buying 6,521 - 394 42

32
Derivative transactions to which hedge accounting is applied
There are no derivative transactions to which hedge accounting is applied.
(Thousands of U.S. dollars)
At March 31, 2011
Contract
amount
Contract
amount
due after
one year
Fair
value
Unrealized
gain (loss)
Listed:
Index futures:
Selling $ 143,016 - $ 10,771 $ 10,771
Buying 159,711 - (9,824) (9,824)
Index futures options:
Selling 427,673 - 696 944
Buying 26,458 - 5 (308)
Underlying stocks on equity options:
Selling - - - -
Buying 3,319 - 28 3
Over-the-counter:
Stocks repurchase transaction with
special contract:
Selling 2,532 - 0 0
Buying 9,182 - 71 39
OTC Options:
Selling 34,323 - 2,102 38
Buying 374,653 $ 19,354 26,834 (2,143)
Equity swap transactions 7,119 3,577 528 528

33
7. Borrowings
Borrowings as of March 31, 2011 and 2010 were as follows:
The aggregate annual maturities of long-term borrowings as of March 31, 2011 are as follows:
Year ending March 31
(Millions of yen)
(Thousands of U.S.
dollars)
2011 2011
2013 ¥ 110 $ 1,323
2014 110 1,323
2015 110 1,323
2016 2,610 31,388
Total ¥ 2,940 $ 35,357
(Millions of yen)
(Thousands of
U.S. dollars)
(Weighted
average interest
rate)
2011 2010 2011 2011
Short-term borrowings:
Call money ¥ 5,000 ¥ 5,000 $ 60,133
Borrowings from financial institutions 180,094 143,875 2,165,890
Borrowings from securities finance
companies
1,630 1,630 19,603
Subtotal ¥ 186,724 ¥ 150,505 $ 2,245,626 0.25
Current portion of long-term borrowings 110 110 1,323 2.03
Total ¥ 186,834 ¥ 150,615 $ 2,246,949
Commercial paper
Short-term bond ¥ 9,000 ¥ 11,300 $ 108,238 0.20~0.35%
Straight bond 7,400 - 88,996 0.45~0.85%
Exchangeable bond 295 - 3,542 1.00~12.00%
Total ¥ 16,695 ¥ 11,300 $ 200,776
Long-term borrowings
Borrowings from financial institutions 2,940 3,050 35,357 2.03%
Total borrowings ¥ 206,469 ¥ 164,965 $ 2,483,082

34
8. Assets pledged as collateral
(1) Assets pledged as collateral for borrowings as of March 31, 2011 and 2010 were summarized as follows:
(Millions of yen)
Pledged assets
2011
Obligations
secured by
pledged assets
Cash on
hand and in
banks
Trading
securities Other assets Total
Short-term borrowings ¥ 140,230 - ¥ 160,926 - ¥ 160,926
Payables related to margin
transactions
6,111 - 1,399 - 1,399
Deposits received for
securities loaned
59,501 - 21,625 - 21,625
Securities sold under
repurchase agreements
112,670 - 4,999 - 4,999
Long-term borrowings
(Current portion of
Long-term borrowings)
3,050
(110)
¥ 142 - ¥ 5,387 5,529
Total ¥ 321,562 ¥ 142 ¥ 188,949 ¥ 5,387 ¥ 194,478
(Millions of yen)
Pledged assets
2010
Obligations
secured by
pledged assets
Cash on hand
and in banks
Trading
securities
Other assets
(Other) Total
Short-term borrowings ¥ 98,930 - ¥ 105,269 - ¥ 105,269
Payables related to margin
transactions
4,903 - - - -
Deposits received for
securities loaned
107,191 - 103,998 - 103,998
Securities sold under
repurchase agreements
116,745 - 116,507 - 116,507
Long-term borrowings
(Current portion of
Long-term borrowings)
3,160
110
¥ 146 - ¥ 5,558 5,704
Total ¥ 330,929 ¥ 146 ¥ 325,774 ¥ 5,558 ¥ 331,478

35
(*1) In addition to the above, the followings are pledged as collateral for the above obligations:
(*2) The following assets are pledged as initial margin for futures transactions:
(*3) “Cash on hand and in banks” and “Other assets (Other)” pledged as guarantee for long-term debts are beneficiary certificates of investments trust, which include “Accrued and other liabilities (Other)” of ¥53 million ($632 thousand).
(Millions of yen)
(Thousands of
U.S. dollars)
2011 2010 2011
Stocks received as collateral from customers
under self-financing margin transactions
¥ 2,008 ¥ 3,854 $ 24,153
Stocks received as collateral from customers for
securities borrowed
108,998 2,949 1,310,865
Securities purchased under resell agreement 36,128 - 434,488
(Millions of yen)
(Thousands of
U.S. dollars)
2011 2010 2011
Cash in banks - ¥ 300 -
Trading securities ¥ 6,348 5,914 $ 76,344
Property and equipment 283 288 3,406
Stocks received from self-financing on margin
transactions
117 82 1,402
(Thousands of U.S. dollars)
Pledged assets
2011
Obligations
secured by
pledged assets
Cash on
hand and in
banks
Trading
securities
Other assets
(Other) Total
Short-term borrowings $ 1,686,470 - $ 1,935,368 - $ 1,935,368
Payables related to
margin transactions
73,487 - 16,832 - 16,832
Deposits received for
securities loaned
715,592 - 260,067 - 260,067
Securities sold under
repurchase agreements
1,355,017 - 60,118 - 60,118
Long-term borrowings
(Current portion of
Long-term borrowings)
36,681
1,323
$ 1,707 - $ 64,793 66,500
Total $ 3,867,247 $ 1,707 $ 2,272,385 $ 64,793 $ 2,338,885

36
(2) The fair value of securities pledged and received as collateral at March 31, 2011 and 2010 were as follows:
9. Investment property
On November 28, 2008, the ASBJ issued ASBJ Statement No. 20 “Accounting Standard for Investment Property and Related Disclosures” and issued ASBJ Guidance No. 23 “Guidance on Accounting Standard for Investment Property and Related Disclosures”. This accounting standard and the guidance were applicable to investment property and related disclosures at the end of the fiscal years ending on or after March 31, 2010. The Group applied the accounting standard and guidance effective March 31, 2010.
The Company owns certain rental properties such as office buildings in Aichi Prefecture and other areas. Net of rental income and rental costs for those rental properties was ¥ 259 million ($3,114 thousand) which is included in “Other income (expense), net” for the fiscal year ended March 31, 2011.
The carrying amounts, changes in such balances and market prices of such properties are as follows:
(Millions of yen)
(Thousands of
U.S. dollars)
2011 2010 2011
Pledged securities:
Securities loaned to customers for margin transactions ¥ 1,824 ¥ 3,357 $ 21,934
Securities pledged as collateral to securities finance
companies or securities exchange brokers for margin
transactions
7,557 6,377 90,886
Securities loaned for collateralized short-term financing
agreements
59,343 106,976 713,686
Securities pledged related to securities sold under
repurchase agreements
112,421 116,507 1,352,025
Securities pledged as collateral for short-term guarantees 9,771 10,433 117,508
Received securities:
Securities received from customers for loans under margin
transactions
¥ 17,128 ¥ 21,054 $ 205,984
Securities borrowed from finance companies or securities
exchange brokers for margin transactions
11,189 15,339 134,569
Short-term securities borrowed 233,998 167,133 2,814,170
Securities purchased under resell agreement 79,788 78,616 959,566
Securities received as collateral for short-term guarantees 31,775 36,622 382,141
Other 654 722 7,864
(Millions of yen)
Carrying amount Fair value
April 1, 2010 Increase/(Decrease) March 31, 2011 March 31, 2011
¥ 7,224 ¥ (211) ¥ 7,013 ¥ 6,836
(Millions of yen)
Carrying amount Fair value
April 1, 2009 Increase/(Decrease) March 31, 2010 March 31, 2010
¥ 6,564 ¥ 660 ¥ 7,224 ¥ 6,942
(Thousands of U.S. dollars)
Carrying amount Fair value
April 1, 2010 Increase/(Decrease) March 31, 2011 March 31, 2011
$ 86,879 $ (2,542) $ 84,337 $ 82,214

37
Notes:1) Carrying amount recognized in the balance sheet is net of accumulated depreciation and accumulated impairment losses, if any.2) Decrease during the fiscal year ended March 31, 2011 primarily represents the depreciation of ¥212 million ($2,553 thousand).3) Fair value of properties as of March 31, 2011 is measured by the Group in accordance with its Real-estate Appraisal Standard.
10. Retirement benefits
The Company and its domestic subsidiaries had a qualified retirement annuity plan in the form of a defined benefit plan. In April 2011, they implemented a defined benefit corporate pension plan and a defined contribution pension plan and terminated the former retirement annuity plan. Upon the transfer to the new plans, prior service cost of ¥509 million ($6,120 thousand) was recognized. There are some cases in which extra retirement benefits are paid to employees when they retire. The Company set up a retirement benefit trust in June 2005.
In addition, retirement benefits to directors and corporate auditors of ¥108 million ($1,299 thousand) and ¥95 million at March 31, 2011 and 2010, respectively were included in “Liability for retirement benefits” on the consolidated balance sheets.
The following table sets forth the changes in benefit obligation, plan assets and funded status of the Group as of March 31, 2011 and 2010:
The components of retirement benefit expenses for the years ended March 31, 2011 and 2010 were outlined as follows:
(Millions of yen)
(Thousands of
U.S. dollars)
2011 2010 2011
Projected benefit obligations ¥ (10,444) ¥ (10,526) $ (125,600)
Plan assets including benefit trusts 6,767 6,743 81,385
Unfunded retirement benefit obligation (3,677) (3,783) (44,215)
Unrecognized net prior service cost (496) - (5,967)
Unrecognized net actuarial differences 2,368 2,303 28,474
Net liability for retirement benefits ¥ (1,805) ¥ (1,480) $ (21,708)
(Millions of yen)
(Thousands of
U.S. dollars)
2011 2010 2011
Service cost ¥ 670 ¥ 659 $ 8,059
Interest cost 195 191 2,345
Expected return on plan assets (90) 75 (1,082)
Amortization of prior service cost (13) - (153)
Amortization of actuarial differences 398 518 4,790
Net periodic expenses ¥ 1,160 ¥ 1,293 $ 13,959
Contribution to defined contribution benefit plan 195 180 2,345
Total ¥ 1,355 ¥ 1,473 $ 16,304

38
The assumptions used in accounting for the defined retirement benefit plans for the years ended March 31, 2011 and 2010 were as follows:
11. Equity
Japanese companies are subject to the Companies Act of Japan (the “Companies Act”). The significant provisions in the Companies Act that affect financial and accounting matters are summarized below:
(a) Dividends Under the Companies Act, companies can pay dividends at any time during the fiscal year in addition
to the year-end dividend upon resolution at the shareholders meeting. For companies that meet certain criteria such as; (1) having the Board of Directors, (2) having independent auditors, (3) having the Board of Corporate Auditors, and (4) the term of service of the directors is prescribed as one year rather than two years of normal term by its articles of incorporation, the Board of Directors may declare dividends (except for dividends in kind) at any time during the fiscal year if the company has prescribed so in its articles of incorporation. However, the Company cannot do so because it does not meet all the above criteria.
The Companies Act permits companies to distribute dividends-in-kind (non-cash assets) to shareholders subject to a certain limitation and additional requirements. Semiannual interim dividends may also be paid once a year upon resolution by the Board of Directors if the articles of incorporation of the company so stipulate. The Companies Act provides certain limitations on the amounts available for dividends or the purchase of treasury stock. The limitation is defined as the amount available for distribution to the shareholders, but the amount of net assets after dividends must be maintained at no less than ¥3 million.
(b) Increases / decreases and transfer of common stock, reserve and surplus The Companies Act requires that an amount equal to 10% of dividends must be appropriated as a
legal reserve (a component of retained earnings) or as additional paid-in capital (a component of capital surplus) depending on the equity account charged upon the payment of such dividends until the total of aggregate amount of legal reserve and additional paid-in capital equals 25% of the common stock. Under the Companies Act, the total amount of additional paid-in capital and legal reserve may be reversed without limitation. The Companies Act also provides that common stock, legal reserve, additional paid-in capital, other capital surplus and retained earnings can be transferred among the accounts under certain conditions upon resolution of the shareholders.
(c) Treasury stock and treasury stock acquisition rights The Companies Act also provides for companies to purchase treasury stock and dispose of such treasury
stock by resolution of the Board of Directors. The amount of treasury stock purchased cannot exceed the amount available for distribution to the shareholders which is determined by specific formula. Under the Companies Act, stock acquisition rights are now presented as a separate component of equity. The Companies Act also provides that companies can purchase both treasury stock acquisition rights and treasury stock. Such treasury stock acquisition rights are presented as a separate component of equity or deducted directly from stock acquisition rights.
2011 2010
Discount rates 2.00 2.00
Expected rate of return on plan assets 2.00 2.00
Amortization period of actuarial differences 10 years 10 years
Amortization period of prior service cost 10 years -

39
12. Stock options
The stock options outstanding as of March 31, 2011 were as follows:
The stock option activity was as follows:
The assumption used to measure fair value of 2011-1 Stock Option
Stock
option
Persons
granted
Number of
options
granted
Date of
grant Exercise price Exercise period
2 directors
4 officers
13 employees
18 directors and advisors
of subsidiaries
2009-1
106 employees of
subsidiaries
667,000
shares
August 31,
2009
¥358
($4.31)
From September 1, 2011
to August 31, 2014
3 officer and advisor 2009-2
19 employees
100,000
shares
December 29,
2009
¥378
($4.55)
From January 1, 2012
to December 31, 2014
2 directors
7 officers
8 employees
24 directors and officers
of subsidiaries
2011-1
144 employees of
subsidiaries
863,000
shares
January 5,
2011
¥332
($3.99)
From February 1, 2013
to January 31, 2016
2009-1
option
2009-2
option
2011-1
option
For the year ended March 31, 2011 (Shares) (Shares) (Shares)
Non-vested
March 31, 2010 - Outstanding 667,000 100,000 -
Granted - - 863,000
Canceled - - -
Vested - - -
March 31, 2011 - Outstanding 667,000 100,000 863,000
¥358 ¥378 ¥332 Exercise price
($4.31) ($4.55) ($3.99)
¥84.20 ¥86.69 ¥67.59
Fair value price at grant date ($1.01) ($1.04) ($0.81)
2011-1
option
Estimate method: Black-Scholes option pricing model
Volatility of stock price: 41.77 %
Estimated remaining outstanding period: 3.58 years
Estimated dividend: ¥12.5 per share
Risk free interest rate: 0.28 %

40
13. Income taxes
The significant components of deferred tax assets and liabilities as of March 31, 2011 and 2010 were as follows:
A reconciliation between the effective income tax rate reflected in the accompanying consolidated statements of income and the effective statutory tax rate for the year ended March 31, 2011 was as follows:Such information for the year ended March 31, 2010 is not presented as the difference is less than 5% of the effective statutory tax rate.
(Millions of yen)
(Thousands of
U.S. dollars)
2011 2010 2011
Deferred tax assets:
Retirement benefits to employees ¥ 2,264 ¥ 2,138 $ 27,223
Allowance for doubtful accounts 472 239 5,679
Loss on devaluation of investment securities 399 344 4,796
Loss on impairment of fixed assets 829 843 9,976
Statutory reserves 69 122 830
Retirement benefits to directors and
corporate auditors
94
103 1,133
Employees' bonuses 732 834 8,801
Accounts payable - other 308 - 3,710
Enterprise tax payable 54 532 646
Other 1,113 1,235 13,386
Sub total 6,334 6,390 76,180
Tax loss carried forward 586 974 7,046
Deferred tax assets 6,920 7,364 83,226
Valuation allowance (2,681) (3,510) (32,246)
Total deferred tax assets ¥ 4,239 ¥ 3,854 $ 50,980
Deferred tax liabilities:
Gain on contribution of securities to
employees’ retirement benefit trust
¥ 1,253 ¥ 1,253 $ 15,070
Unrealized gain on available-for-sale
Securities
- 0 -
Other 66 13 797
Deferred tax liabilities 1,319 1,266 15,867
Valuation allowance (0) (0) (0)
Total deferred tax liabilities ¥ 1,319 ¥ 1,266 $ 15,867
Net deferred tax assets ¥ 2,920 ¥ 2,588 $ 35,113

41
14. Lease transactions
As discussed in Note 2 (l), the Company accounts for leases which existed at the transition date and do not transfer ownership of the leased property to the lessee as operating lease transactions. Pro forma information of such leases existing at the transition date was as follows:
Acquisition cost, accumulated depreciation and net book value:
Obligations under finance leases:
Depreciation expense, interest expense and other information under finance leases:
Depreciation expense and interest expense, which are not reflected in the accompanying statements of income, are computed by the straight line method and the interest method, respectively.
(Millions of yen)
(Thousands of
U.S. dollars)
2011 2010 2011
Acquisition cost ¥ 39 ¥ 86 $ 469
Accumulated depreciation 35 67 418
Net book value at year end ¥ 4 ¥ 19 $ 51
(Millions of yen)
(Thousands of
U.S. dollars)
2011 2010 2011
Due in one year or less ¥ 4 ¥ 15 $ 60
Due after one year 1 6 6
Total ¥ 5 ¥ 21 $ 66
(Millions of yen)
(Thousands of
U.S. dollars)
2011 2010 2011
Depreciation expense ¥ 13 ¥ 25 $ 158
Interest expense 1 2 10
Total 14 27 168
Lease payments ¥ 15 ¥ 29 $ 184
2011
Effective statutory tax rate 39.55
Increase (decrease) due to:
Permanent differences, such as entertainment expenses 4.55
Permanently non-taxable items, such as dividend income (45.14)
Deficit carried forward (10.77)
Inhabitants tax per capita levy 1.48
Gain on change in interest in an equity investee (5.86)
Equity in gain of affiliated company (3.20)
Valuation allowance (25.19)
Adjustment for unrealized profit resulting from transactions
within the Group and other - net 43.63
Other 1.75
Effective income tax rate 0.80

42
15. Financial instruments and related disclosures
In March 2008, the ASBJ revised ASBJ Statement No. 10 “Accounting Standard for Financial Instruments” and issued ASBJ Guidance No. 19 “Guidance on Accounting Standard for Financial Instruments and Related Disclosures”. This accounting standard and the guidance were applicable to financial instruments and related disclosures at the end of the fiscal years ending on or after March 31, 2010. The Group applied the revised accounting standard and the new guidance effective March 31, 2010.
(1) Policy for financial instruments
The Group own financial instruments in conducting the financial instruments trading business such as trading securities, intermediary of trading of securities, underwriting and offer of securities, solicitation and offer of securities, private offer of securities and other financial instruments trading business including services related or incidental to financial instruments trading business.
To raise funds for the operation of financial instruments trading business, in addition to the indirect financing such as bank loans, the Group issues commercial paper, taking into account the market conditions and the balance of maturities of loans.
(2) Nature and extent of risks arising from financial instruments
The financial assets and liabilities held by the Group are comprised of followings:
(a) Securities such as stocks and bonds held for trading with customers or for proprietary trading; derivatives publicly traded on exchanges such as futures and options based on stock price indices and futures and options based on bonds; derivatives traded on outside exchanges, such as bonds with options, over-the-counter securities options, foreign exchange forward contracts, currency rate swaps, interest rate swaps; and securities such as stock held for investment;
(b) Loan receivables from customers related to margin transactions, borrowings from securities finance company incidental to the loan receivables; and
(c) Deposit paid for securities borrowed / deposit received for securities loaned based on the collateralized financing agreement with institutional investors; loan receivables as considerations for purchases of bonds under resell agreements / borrowings as proceeds from sale of securities under repurchase agreements.
The securities held and transaction balances of derivatives are exposed to market risks triggered by changes in market values of stock, interest rate and foreign exchange rate. Receivables related to margin transactions, deposits paid for securities borrowed, loan receivables for purchases of bonds under resell agreements and over-the-counter derivative transactions are exposed to the credit risks that occur when counterparties of transactions becomes in default of contracts. In addition, due to a lack of liquidity, some of these financial instruments are exposed to market liquidity risks that trigger losses due to market turmoil, resulting in the inability to transact in the market or transactions at the significantly unfavorable price.
Also, with regards to the funding side, the Group owns financial liabilities such as commercial paper and borrowings from financial institutions. As a result of downturn in our business or other reasons, these financial instruments are exposed to liquidity risk resulting in encountering an obstacle to raising the fund or being forced to borrow at significantly higher interest rate than usual, leading to the loss.

43
(3) Risk management for financial instruments
(a) Comprehensive risk management Due to the complexity and diversification of product line such as rapid advances of derivative transactions,
the Company regards market, credit and liquidity risk management as being extremely important in conducting our financial instruments trading operation, the main business line of our group. The Company puts risk management for entire group and each group company as one of the first priority challenges of business. The Company established risk management basic policy in order for us to control appropriately by identifying, analyzing, and managing risks at own responsibility of each group company and to maintain soundness of business for a long period of time.
In accordance with this risk management basic policy, Total Risk Management Committee is set up to provide the framework for securing financial soundness and profits through gathering, managing and controlling information on various risks inhering within our group or each group. The committee discusses risk management within our group, status of compliance and disaster risk management. Total Risk Management Committee is held monthly to monitor the implementation status and to provide the framework of reporting of necessary information to board of directors.
(b) Management of market risk Tokai Tokyo Securities, a class I financial instruments trader in our group, sets basic policies relating
to market risk management based on our risk management rules and manages the proprietary trading operations conducted by investment banking division.
The board of directors of Tokai Tokyo Securities sets market risk limit within the ceiling of risk that is derived by “target of controlled equity ratio” that should be maintained minimally.
In addition, in order to structure management system that checks excessive risk taking actions, Tokai Tokyo Securities also enhances functions of overall risk management including; to the extent of market risk limit of Group, Risk Management Committee restricts the market risk by setting the VaR (Value at Risk) based position limit on each department holding the proprietary trading positions, taking into account the budget and profits performance of each department; setting loss limits and alert line of losses for each department during the period in order to prevent increasing the losses; and maintain our internal rules.
The management method of market risk for the positions held by dealing department and trading department includes; management based on VaR (10 days holding period with confidence interval of 99%, observation period 750 days) computed using historical simulation method; measurement of stress value (one day and 10 days holding periods, observation period 750 days); stress test assuming unforeseeable market swings in the past such as Lehman Shock; and daily back test of relationship between the VaR (holding period one day) data and daily profit/loss data.
The risk limit set and allocated to related departments, uses of loss limit, profit and loss, result of stress tests and status of market liquidity risk positions are analyzed, managed on a daily basis and reported to top management by organizationally and physically independent department from proprietary dealing department. Also, analysis of market risk management and overall report are made at Risk Management Committee on a monthly basis. In addition, status of market risk management is reported monthly to the board of directors.
The estimated amount of market risk (estimated amount of loss) of proprietary trading of Tokai Tokyo Securities as of March 31, 2011 is ¥72 million ($872 thousand) in aggregate. VaR measures the amount of market risk with a certain probability which is statistically calculated based on
44
the historical market fluctuations. Therefore, the risk may not be fully captured under the market environment that changes drastically.
(c) Credit risk management Based on our risk management rules, Tokai Tokyo Securities, a class I financial instruments trader in
our group, controls the risk of suffering damages arising from default of contract by counterparties of transactions or other reasons within the predetermined limit. The Risk Management Committee manages risks by setting credit risk limits on each financial product. Further, credit risk limit is also set on each counterparty of transaction.
Depending upon the nature of products, current exposure method or potential exposure method is adopted in calculating credit risks. The credit risk is analyzed and managed on a daily basis and reported to top management by the department organizationally and physically independent from execution department. Also, status of credit risk management and overall report are made at Risk Management Committee on a monthly basis. In addition, status of credit risk management is reported monthly to the board of directors.
(d) Liquidity risk management Based on our liquidity risk management rules, the Company and Tokai Tokyo Securities, a class
I financial instruments trader, set and operate basic policies for risk management framework of appropriate funding.
The Company develops the strategy for the liquidity risk of funding through gathering and analyzing information such as stock price and reputation to recognize and assess liquidity risks for funding that may impact on our funding. To manage funding risk, the Company will implement necessary measures, taking into account the situation in managing the funding risk depending upon the possibility of cash flow problems of consolidated subsidiaries impacting on our funding based on the subsidiaries’ performances.
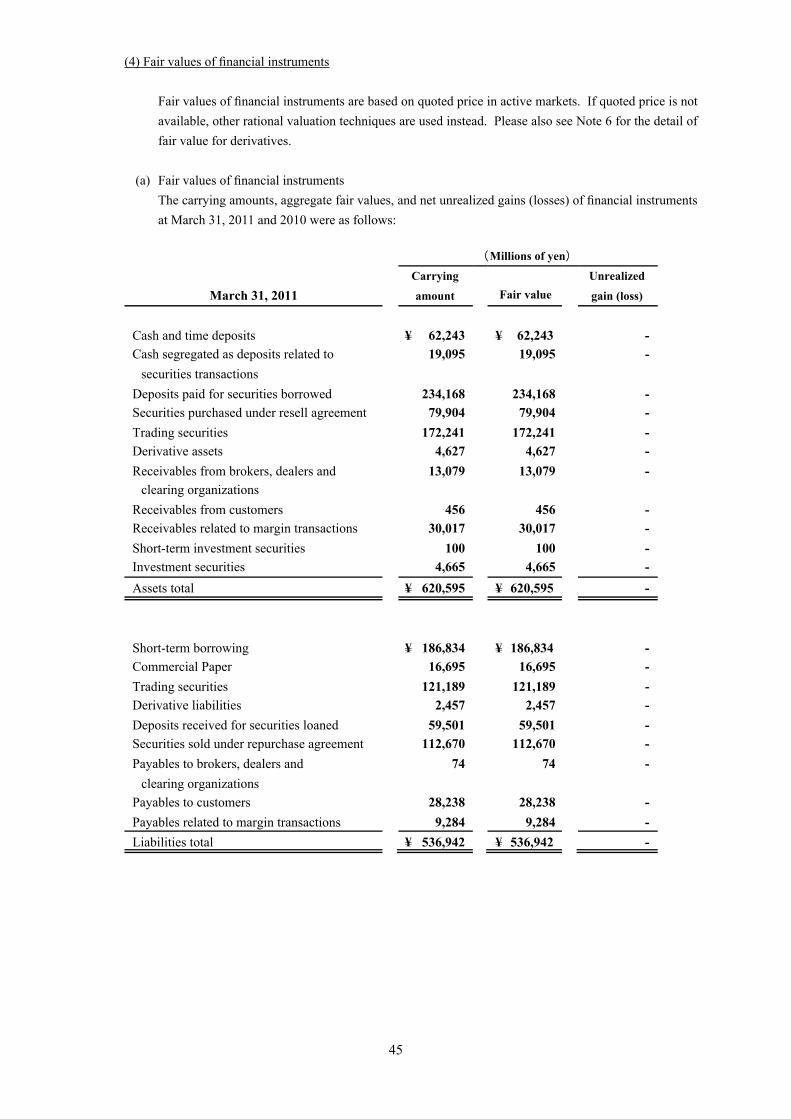
45
(4) Fair values of financial instruments
Fair values of financial instruments are based on quoted price in active markets. If quoted price is not available, other rational valuation techniques are used instead. Please also see Note 6 for the detail of fair value for derivatives.
(a) Fair values of financial instruments The carrying amounts, aggregate fair values, and net unrealized gains (losses) of financial instruments
at March 31, 2011 and 2010 were as follows:
Millions of yen
March 31, 2011
Carrying
amount Fair value
Unrealized
gain (loss)
Cash and time deposits ¥ 62,243 ¥ 62,243 -
Cash segregated as deposits related to
securities transactions
19,095 19,095 -
Deposits paid for securities borrowed 234,168 234,168 -
Securities purchased under resell agreement 79,904 79,904 -
Trading securities 172,241 172,241 -
Derivative assets 4,627 4,627 -
Receivables from brokers, dealers and
clearing organizations
13,079 13,079 -
Receivables from customers 456 456 -
Receivables related to margin transactions 30,017 30,017 -
Short-term investment securities 100 100 -
Investment securities 4,665 4,665 -
Assets total ¥ 620,595 ¥ 620,595 -
Short-term borrowing ¥ 186,834 ¥ 186,834 -
Commercial Paper 16,695 16,695 -
Trading securities 121,189 121,189 -
Derivative liabilities 2,457 2,457 -
Deposits received for securities loaned 59,501 59,501 -
Securities sold under repurchase agreement 112,670 112,670 -
Payables to brokers, dealers and
clearing organizations
74 74 -
Payables to customers 28,238 28,238 -
Payables related to margin transactions 9,284 9,284 -
Liabilities total ¥ 536,942 ¥ 536,942 -

46
Millions of yen
March 31, 2010
Carrying
amount Fair value
Unrealized
gain (loss)
Cash and time deposits ¥ 63,092 ¥ 63,092 -
Cash segregated as deposits related to
securities transactions
19,675 19,675 -
Deposits paid for securities borrowed 166,792 166,792 -
Securities purchased under resell agreement 79,203 79,203 -
Trading securities 245,276 245,276 -
Derivative assets 1,920 1,920 -
Receivables from brokers, dealers and
clearing organizations
7,986 7,986 -
Receivables from customers 411 411 -
Receivables related to margin transactions 36,043 36,043 -
Short-term investment securities 100 100 -
Investment securities 4,535 4,535 -
Assets total ¥ 625,033 ¥ 625,033 -
Short-term borrowing ¥ 150,615 ¥ 150,615 -
Commercial Paper 11,300 11,300 -
Trading securities 107,615 107,615 -
Derivative liabilities 1,677 1,677 -
Deposits received for securities loaned 107,191 107,191 -
Securities sold under repurchase
agreement
116,745 116,745 -
Payables to brokers, dealers and
clearing organizations
31 31 -
Payables to customers 20,305 20,305 -
Payables related to margin transactions 9,150 9,150 -
Liabilities total ¥ 524,629 ¥ 524,629 -

47
Methods for determining fair values of financial instruments for the year ended March 31, 2011 and 2010 were as follows:Cash and time deposits, Cash segregated as deposits related to securities transactions, Deposits paid for securities borrowed, Securities purchased under resell agreement, Receivables from brokers, dealers and clearing organizations, Receivables from customers, and Receivables related to margin transactions
The carrying values of these financial instruments approximate fair values because they settle in a short period.
Trading securities, Derivative assets, and Derivative liabilities The fair values of these financial instruments are determined in accordance with the internal rules of
fair value assessment.Short-term investment securities and Investment securities
The fair values of these financial instruments are measured at the quoted market price in active markets, in accordance with the internal rules.
Short-term borrowing, Commercial paper, Deposits received for securities loaned, Securities sold under repurchase agreement, Payables to brokers, dealers and clearing organizations, Payables to customers, and Payables related to margin transactions
(Thousands of U.S. dollars)
March 31, 2011
Carrying
amount Fair value
Unrealized
gain (loss)
Cash and time deposits $ 748,564 $ 748,564 -
Cash segregated as deposits related to
securities transactions
229,644 229,644 -
Deposits paid for securities borrowed 2,816,207 2,816,207 -
Securities purchased under resell
agreement
960,965 960,965 -
Trading securities 2,071,444 2,071,444 -
Derivative assets 55,649 55,649 -
Receivables from brokers, dealers and
clearing organizations
157,300 157,300 -
Receivables from customers 5,487 5,487 -
Receivables related to margin transactions 360,999 360,999 -
Short-term investment securities 1,206 1,206 -
Investment securities 56,103 56,103 -
Assets total $ 7,463,568 $7,463,568 -
Short-term borrowing $ 2,246,949 $2,246,949 -
Commercial Paper 200,776 200,776 -
Trading securities 1,457,474 1,457,474 -
Derivative liabilities 29,550 29,550 -
Deposits received for securities loaned 715,592 715,592 -
Securities sold under repurchase
agreement
1,355,017 1,355,017 -
Payables to brokers, dealers and
clearing organizations
888 888 -
Payables to customers 339,599 339,599 -
Payables related to margin transactions 111,661 111,661 -
Liabilities total $ 6,457,506 $6,457,506 -

48
The carrying values of these financial instruments approximate fair values because they settle in a short period.
Derivatives The information of the fair value for derivatives is included in Note 6.
(b) Carrying amount of financial instruments whose fair values cannot be reliably determined
The fair values of unlisted stocks are not included in “Short-term investment securities” or “Investment securities” in the table (a), as they do not have a quoted market price in active markets, the amount of future cash flows cannot be estimated, and their fair values cannot be reliably determined.
(5) Maturity analysis for financial assets and securities with contractual maturities
Please see Note 7 for annual maturities of long-term borrowings and Note 14 for obligations under finance leases.
(Millions of yen)
(Thousands of
U.S. dollars)
2011 2010 2011
Investment in affiliates ¥ 5,621 ¥ 3,999 $ 67,604
Available-for-sale securities
Stocks (non-listed) 4,108 3,802 49,408
Other 1,504 1,181 18,088
Total ¥ 11,233 ¥ 8,982 $ 135,100
(Millions of yen)
Due in
one year
or less
Due after
one year
through
five years
Due after
five years
through
ten years
Due after
ten
years
Cash and time deposit ¥ 989 - - -
Short-term investment securities and Investment securities
Available-for-sale Securities
with maturity date - - - -
Government Bonds 100 ¥ 10 - -
Total ¥ 1,089 ¥ 10 - -
(Thousands of U.S. dollars)
Due in one
year or less
Due after
one year
through
five years
Due after
five years
through
ten years
Due after
ten
years
Cash and time deposit $ 11,889 - - -
Short-term investment securities and Investment securities
Available-for-sale Securities
with maturity date - - - -
Government Bonds 1,206 $ 120 - -
Total $ 13,095 $ 120 - -

49
16. Commitments and contingent liabilities
Contingent liabilities as of March 31, 2011 are summarized as follows:
17. Commissions
Commissions earned for the years ended March 31, 2011 and 2010 consisted of the following:
18. Selling, general and administrative expenses
Selling, general and administrative expenses for the years ended March 31, 2011 and 2010 consisted of the following:
(Millions of yen)
(Thousands of
U.S. dollars)
2011 2010 2011
Brokerage ¥ 7,798 ¥ 10,163 $ 93,781
Underwriting and distribution 11,689 13,900 140,577
Other 5,975 5,610 71,857
Total ¥ 25,462 ¥ 29,673 $ 306,215
(Millions of yen)
(Thousands of
U.S. dollars)
Guarantees for employees’ borrowings from
a financial institution
¥ 5
$ 61
(Millions of yen)
(Thousands of
U.S. dollars)
2011 2010 2011
Employees’ compensation and benefits ¥ 22,971 ¥ 24,083 $ 276,256
Brokerage and other commissions 4,569 3,323 54,950
Communication and transportation 2,827 2,952 34,000
Real estate expenses 6,051 5,886 72,769
Data processing and office supplies 5,011 4,308 60,267
Taxes other than income taxes 513 714 6,164
Depreciation 921 1,078 11,075
Amortization 1,803 1,659 21,686
Other 3,030 2,591 36,443
Total ¥ 47,696 ¥ 46,594 $ 573,610

50
19. Other income and expenses
The components of “Other income (expense), net” in the consolidated statements of income for the years ended March 31, 2011 and 2010 were as follows:
(*1) The Group applied ASBJ Statement No. 18 “Accounting Standard for Asset Retirement Obligations” and ASBJ Guidance No. 21 “Guidance on Accounting Standard for Asset Retirement Obligations” effective April 1, 2010. The effect of this application was included in “Effect resulting from application of new accounting standard”.
(*2) With respect to the fraudulent activities, including the misappropriation of customer assets, committed by a former employee of Tokai Tokyo Securities, a subsidiary of the Company, the Company recorded liabilities for subrogation claims for losses suffered by the customers, and receivable from the former employee for reimbursement. Allowance for doubtful account is provided for this receivable.
(*3) Amortization of negative goodwill included in “Other” amounted to ¥147 million ($1,773 thousand) and ¥47 million for the years ended March 31, 2011 and 2010, respectively. In addition, “Other” includes gains from negative goodwill of ¥13 million ($151 thousand) for the year ended March 31, 2011.
20. Comprehensive Income
Other comprehensive income for the year ended March 31, 2010 consisted of the following:
Total comprehensive income for the year ended March 31, 2010 comprised of the following:
(Millions of yen)
2010
Other comprehensive income:
Unrealized gain on available-for-sale securities ¥ 4
Foreign currency translation adjustments 54
Total other comprehensive income ¥ 58
(Millions of yen)
2010
Total comprehensive income attributable to:
Owners of the parent ¥ 7,220
Minority interests (0)
Total comprehensive income ¥ 7,220
(Millions of yen)
(Thousands of
U.S. dollars)
2011 2010 2011
Dividend income ¥ 449 ¥ 309 $ 5,398
Rent income 686 630 8,249
Equity in gains of an affiliated company 353 384 4,251
Net loss on sales and devaluation of investment securities (325) (228) (3,911)
Reversal of statutory reserves 137 54 1,647
Gains on change in equity 647 - 7,777
Losses on disposal of fixed assets (250) (94) (3,006)
Effect resulting from application of new accounting
standard (*1)
(19) - (226)
Allowance for doubtful account (*2) (630) - (7,579)
Other (*3) 227 209 2,729
Total ¥ 1,275 ¥ 1,264 $ 15,329

51
21. Per share information
Basic net income per share (“EPS”) for the years ended March 31, 2011 and 2010 is as follows:
Diluted net income per share is not disclosed because it is anti-dilutive.
22. Subsequent event
For the year ended March 31, 2011 In March 2008, the ASBJ revised ASBJ Statement No. 17 “Accounting Standard for Segment
Information Disclosures” and issued ASBJ Guidance No. 20 “Guidance on Accounting Standard for Segment Information Disclosures”. Under the standard and guidance, an entity is required to report financial and descriptive information about its reportable segments. Reportable segments are operating segments or aggregations of operating segments that meet specified criteria. Operating segments are components of an entity about which separate financial information is available and such information is evaluated regularly by the chief operating decision maker in deciding how to allocate resources and in assessing performance. Generally, segment information is required to be reported on the same basis as is used internally for evaluating operating segment performance and deciding how to allocate resources to operating segments. This accounting standard and the guidance are applicable to segment information disclosures for the fiscal years beginning on or after April 1, 2010.
(1) Information about sales, profit, assets, liabilities and other items by reportable segments
This information is not presented, as the Group operates as a single reportable segment in investment and financial service business.
For the year ended March 31, 2010
Information about business segments, geographical segments and overseas sales of the Group for the year ended March 31, 2010 is as follows:
(1) Business segments The Group conducts worldwide business activities, centering on securities transactions, such as: (a)
securities trading; (b) acting as an agency to entrust agents with on-commission trading of securities; (c) underwriting and offering securities; (d) dealing in securities subscription and offering; and (e)
(Millions of
yen)
(Thousands
of shares) (Yen) (U.S. dollars)
Net
income
Weighted
average
shares
EPS
For the year ended March 31, 2011:
Basic EPS
Net income available to common shareholders ¥ 4,319 278,648 ¥ 15.50 $ 0.19
For the year ended March 31, 2010:
Basic EPS
Net income available to common shareholders ¥ 7,161 271,957 ¥ 26.33

52
handling transactions of securities private placement. The above business activities involve provision of financial and other services, and the Group earns profits through marketing activities that are integrated with these services. Hence, the Group’s business segment belongs only to the “investment and financial service business.”
(2) Geographical segments Geographical segment information for the year ended March 31, 2010 was as follows:
(3) Overseas sales Information about overseas sales for the years ended March 31, 2010 was omitted as they accounted for
less than 10% of consolidated net sales.
23. Subsequent event
(1) Appropriation of Retained Earnings
On June 29, 2011, the shareholders approved the appropriation of retained earnings as follows:
(Millions of yen)
(Thousands of
U.S. dollars)
Cash dividends (¥4.00 $0.05 per share) ¥ 1,107 $ 13,307
(Millions of yen)
2010
Japan Europe Others
Eliminations/
Corporate Consolidated
Sales to customers ¥ 56,620 ¥ 381 ¥ 109 - ¥ 57,110
Inter area transfer (71) (35) 184 ¥ (78) -
Total sales 56,549 346 293 (78) 57,110
Operating expenses 46,147 247 278 (78) 46,594
Operating income ¥ 10,402 ¥ 99 ¥ 15 - ¥ 10,516
Total assets ¥664,634 ¥ 142,938 ¥ 1,333 ¥ (144,138) ¥ 664,767

53
Company InformationCorporate Directory (as of June 29, 2011)
Company Name Tokai Tokyo Financial Holdings, Inc.
Head Office 6-2, Nihonbashi 3-chome, Chuo-ku,Tokyo 103-0027, JapanTel: +81-3-3517-8100 (General Inquiries)Fax: +81-3-3517-8314
Date of Incorporation June 19, 1929
Common Stock ¥36,000,000,000
Total Outstanding Shares 280,582,115 shares (as of March 31, 2011)
Number of Employees (Consolidated base) 2,286 (as of March 31, 2011)
Board of Directors and Corporate Auditors (as of June 29, 2011)
Directors Tateaki Ishida, President & CEO (Representative Director)
Tadashi Kaneko, Deputy President (Representative Director)
Takuji Ikuta, Director & Senior Managing Executive Officer
Ikuo Suzuki, Director
Nobuhiro Morisue, Director
Takuo Sasaki, Director
Corporate Auditors Akira Takeuchi (full-time)
Hiroichi Wakita
Shigeo Kashiwagi
Kazuyoshi Tanaka
Eiichiro Kinoshita
(Notes) Ikuo Suzuki, Nobuhiro Morisue and Takuo Sasaki are outside directors stipulated in paragraph 15, Article 2, of the Company Law.(Notes) Shigeo Kashiwagi, Kazuyoshi Tanaka and Eiichiro Kinoshita are outside auditors stipulated in paragraph 16, Article 2 of the Company Law.

54
Subsidiaries and Affiliates (as of July 1, 2011)
Overseas Subsidiaries Tokai Tokyo Securities (Asia) LTD.Rooms 2103-4, Wing On Centre, 111 Connaught Road, Central, Hong KongTel: +852-2810-0822Fax: +852-2810-0394Tokai Tokyo Securities Europe LimitedCity Tower, 40 Basinghall Street, London EC2V 5DE,United KingdomTel: +44-207-070-4600Fax: +44-207-070-4649
Tokai Tokyo Securities (USA), Inc.330 Madison Avenue, New York, NY 10017 USATel: +1-646-495-5490Fax: +1-646-495-5491
Tokai Tokyo Investment Management Singapore Pte. Ltd.8 Shenton Way #40-02 AXA Tower Singapore 068811Tel: +65-6436-4250Fax: +65-6327-9268
Domestic Subsidiaries and Affiliates Tokai Tokyo Securities Co., Ltd.Utsunomiya Securities Co., Ltd.Tokai Tokyo Asset Management Co., Ltd.Tokai Tokyo-Sumishin Wealth Partners & Consulting Co., Ltd.Tokai Tokyo Investment Co., Ltd.Tokai Tokyo Research Center Co., Ltd.Tokai Tokyo Academy Co., Ltd.Tokai Tokyo Services Co., Ltd.Tokai Tokyo Business Service Co., Ltd.YM Securities Co., Ltd.Hamagin Tokai Tokyo Securities Co., Ltd.Nishi-Nippon City Tokai Tokyo Securities Co., Ltd.
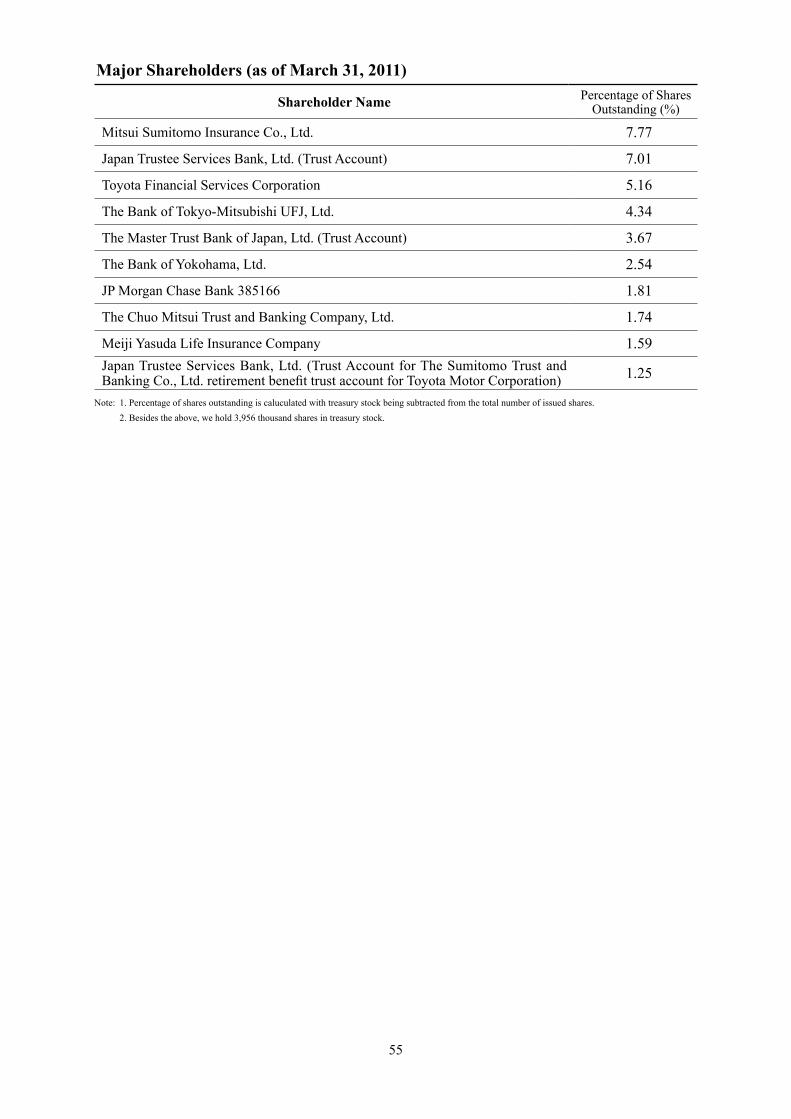
55
Major Shareholders (as of March 31, 2011)
Shareholder Name Percentage of SharesOutstanding (%)
Mitsui Sumitomo Insurance Co., Ltd. 7.77
Japan Trustee Services Bank, Ltd. (Trust Account) 7.01
Toyota Financial Services Corporation 5.16
The Bank of Tokyo-Mitsubishi UFJ, Ltd. 4.34
The Master Trust Bank of Japan, Ltd. (Trust Account) 3.67
The Bank of Yokohama, Ltd. 2.54
JP Morgan Chase Bank 385166 1.81
The Chuo Mitsui Trust and Banking Company, Ltd. 1.74
Meiji Yasuda Life Insurance Company 1.59Japan Trustee Services Bank, Ltd. (Trust Account for The Sumitomo Trust and Banking Co., Ltd. retirement benefit trust account for Toyota Motor Corporation) 1.25
Note: 1. Percentage of shares outstanding is caluculated with treasury stock being subtracted from the total number of issued shares. 2. Besides the above, we hold 3,956 thousand shares in treasury stock.

Copyright © 2022 FDOKUMEN