County of Accomack, Virginia Fiscal Year 2013 Annual Fiscal ...
Upload
khangminh22Category
view
1download
0
Securities Report for the Fiscal Year
Ended March 31, 2009
(The English Translation of the “Yukashoken-Houkokusho” for the Fiscal Year Ended March 31, 2009)
Hino Motors, Ltd.
(Translation) Hino Motors, Ltd. (E02146) Securities Report for the Fiscal Year Ended March 31, 2009
- 1 -
Report Data
[Document type] Securities Report (regulatory filing)
[Mandatory provision] Financial Instruments and Exchange Law, Article 24 Paragraph 1
[Filing submitted to] Director, Kanto Local Finance Bureau
[Date of submission] June 24, 2009
[Fiscal term] April 1, 2008 to March 31, 2009 (97th fiscal term)
[Company name] Hino Motors, Ltd.
[Representative] Yoshio Shirai, President and member of the board
[Head office address] 1-1, Hinodai 3-chome, Hino-shi, Tokyo, Japan
[Telephone] +81-(0)42-586-5111
[Administrative contact] Shinichi Sato, General Manager, Finance & Accounting Div.
[Nearest available location] 1-1, Hinodai 3-chome, Hino-shi, Tokyo, Japan
[Telephone] +81-(0)42-586-5085
[Administrative contact] Shinichi Sato, General Manager, Finance & Accounting Div.
[Locations where filings are available for Tokyo Stock Exchange Group, Inc.:
public inspection] 2-1, Nihonbashi-Kabutocho, Chuo-ku, Tokyo
Nagoya Stock Exchange, Inc.:
8-20, Sakae 3-chome, Naka-ku, Nagoya-shi, Aichi, Japan
(Translation) Hino Motors, Ltd. (E02146) Securities Report for the Fiscal Year Ended March 31, 2009
- 2 -
Part A. Company Information
Section 1. General Information
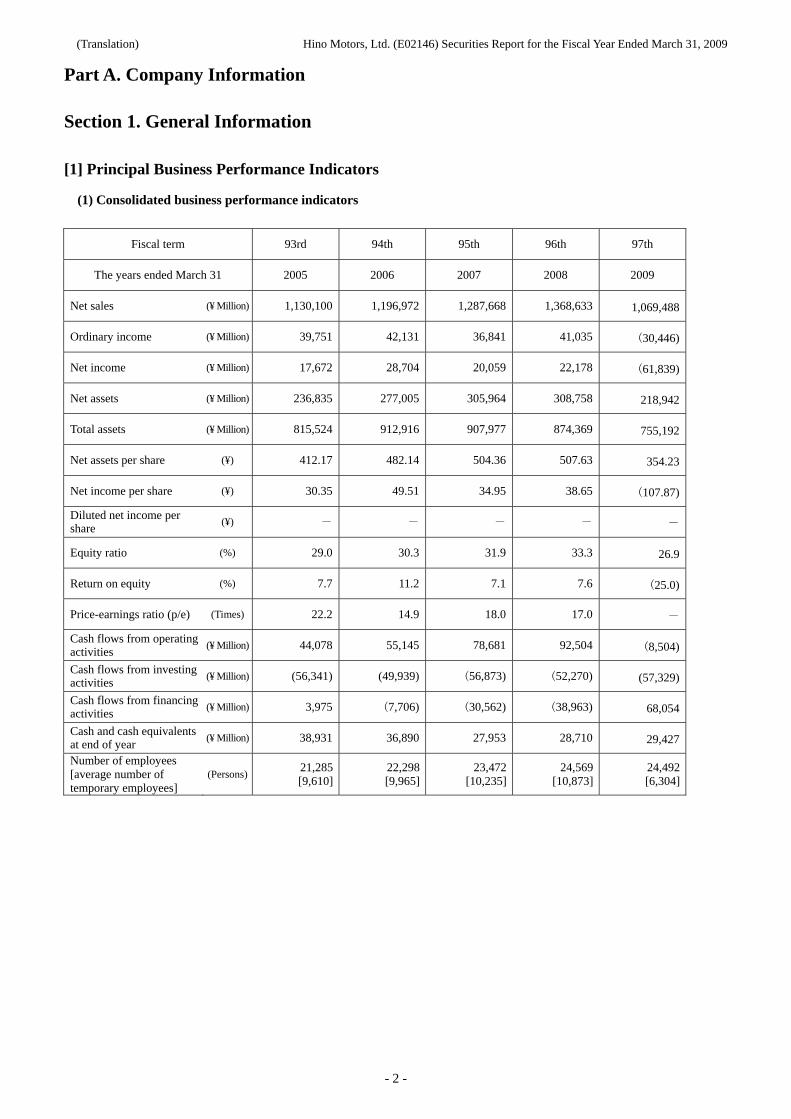
[1] Principal Business Performance Indicators
(1) Consolidated business performance indicators
Fiscal term 93rd 94th 95th 96th 97th
The years ended March 31 2005 2006 2007 2008 2009
Net sales (¥ Million) 1,130,100 1,196,972 1,287,668 1,368,633 1,069,488
Ordinary income (¥ Million) 39,751 42,131 36,841 41,035 (30,446)
Net income (¥ Million) 17,672 28,704 20,059 22,178 (61,839)
Net assets (¥ Million) 236,835 277,005 305,964 308,758 218,942
Total assets (¥ Million) 815,524 912,916 907,977 874,369 755,192
Net assets per share (¥) 412.17 482.14 504.36 507.63 354.23
Net income per share (¥) 30.35 49.51 34.95 38.65 (107.87)
Diluted net income per share
(¥) - - - - -
Equity ratio (%) 29.0 30.3 31.9 33.3 26.9
Return on equity (%) 7.7 11.2 7.1 7.6 (25.0)
Price-earnings ratio (p/e) (Times) 22.2 14.9 18.0 17.0 -
Cash flows from operating activities
(¥ Million) 44,078 55,145 78,681 92,504 (8,504)
Cash flows from investing activities
(¥ Million) (56,341) (49,939) (56,873) (52,270) (57,329)
Cash flows from financing activities
(¥ Million) 3,975 (7,706) (30,562) (38,963) 68,054
Cash and cash equivalents at end of year
(¥ Million) 38,931 36,890 27,953 28,710 29,427
Number of employees [average number of temporary employees]
(Persons) 21,285 [9,610]
22,298 [9,965]
23,472 [10,235]
24,569 [10,873]
24,492 [6,304]
(Translation) Hino Motors, Ltd. (E02146) Securities Report for the Fiscal Year Ended March 31, 2009
- 3 -
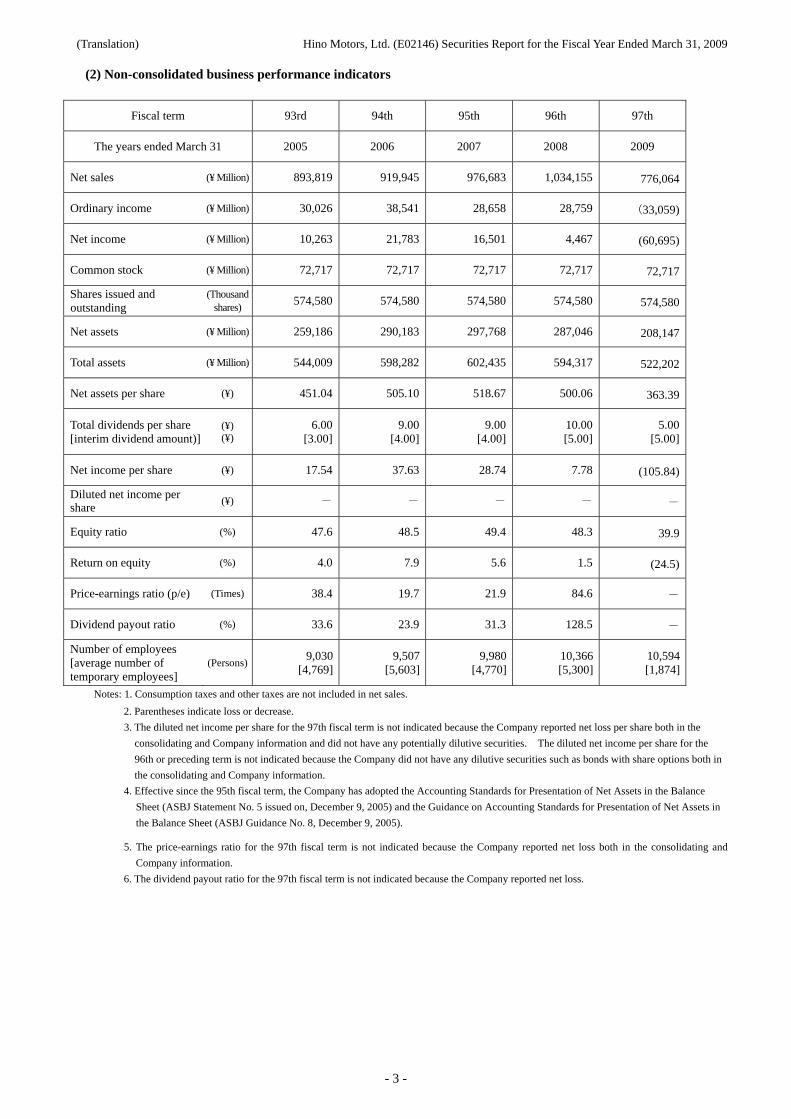
(2) Non-consolidated business performance indicators
Fiscal term 93rd 94th 95th 96th 97th
The years ended March 31 2005 2006 2007 2008 2009
Net sales (¥ Million) 893,819 919,945 976,683 1,034,155 776,064
Ordinary income (¥ Million) 30,026 38,541 28,658 28,759 (33,059)
Net income (¥ Million) 10,263 21,783 16,501 4,467 (60,695)
Common stock (¥ Million) 72,717 72,717 72,717 72,717 72,717
Shares issued and outstanding
(Thousand shares)
574,580 574,580 574,580 574,580 574,580
Net assets (¥ Million) 259,186 290,183 297,768 287,046 208,147
Total assets (¥ Million) 544,009 598,282 602,435 594,317 522,202
Net assets per share (¥) 451.04 505.10 518.67 500.06 363.39
Total dividends per share [interim dividend amount)]
(¥) (¥)
6.00[3.00]
9.00 [4.00]
9.00 [4.00]
10.00 [5.00]
5.00 [5.00]
Net income per share (¥) 17.54 37.63 28.74 7.78 (105.84)
Diluted net income per share
(¥) - - - - -
Equity ratio (%) 47.6 48.5 49.4 48.3 39.9
Return on equity (%) 4.0 7.9 5.6 1.5 (24.5)
Price-earnings ratio (p/e) (Times) 38.4 19.7 21.9 84.6 -
Dividend payout ratio (%) 33.6 23.9 31.3 128.5 -
Number of employees [average number of temporary employees]
(Persons) 9,030
[4,769]9,507
[5,603] 9,980
[4,770] 10,366 [5,300]
10,594 [1,874]
Notes: 1. Consumption taxes and other taxes are not included in net sales.
2. Parentheses indicate loss or decrease.
3. The diluted net income per share for the 97th fiscal term is not indicated because the Company reported net loss per share both in the
consolidating and Company information and did not have any potentially dilutive securities. The diluted net income per share for the
96th or preceding term is not indicated because the Company did not have any dilutive securities such as bonds with share options both in
the consolidating and Company information.
4. Effective since the 95th fiscal term, the Company has adopted the Accounting Standards for Presentation of Net Assets in the Balance
Sheet (ASBJ Statement No. 5 issued on, December 9, 2005) and the Guidance on Accounting Standards for Presentation of Net Assets in
the Balance Sheet (ASBJ Guidance No. 8, December 9, 2005).
5. The price-earnings ratio for the 97th fiscal term is not indicated because the Company reported net loss both in the consolidating and
Company information.
6. The dividend payout ratio for the 97th fiscal term is not indicated because the Company reported net loss.
(Translation) Hino Motors, Ltd. (E02146) Securities Report for the Fiscal Year Ended March 31, 2009
- 4 -
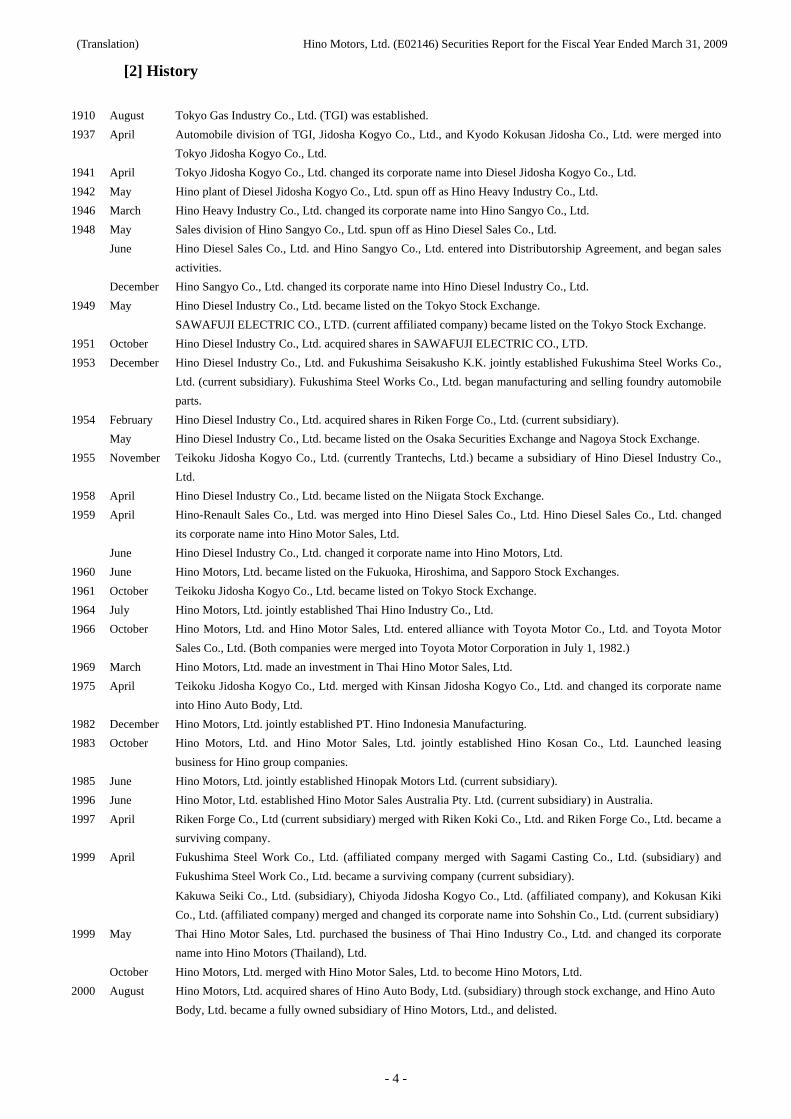
[2] History
1910 August Tokyo Gas Industry Co., Ltd. (TGI) was established.
1937 April Automobile division of TGI, Jidosha Kogyo Co., Ltd., and Kyodo Kokusan Jidosha Co., Ltd. were merged into
Tokyo Jidosha Kogyo Co., Ltd.
1941 April Tokyo Jidosha Kogyo Co., Ltd. changed its corporate name into Diesel Jidosha Kogyo Co., Ltd.
1942 May Hino plant of Diesel Jidosha Kogyo Co., Ltd. spun off as Hino Heavy Industry Co., Ltd.
1946 March Hino Heavy Industry Co., Ltd. changed its corporate name into Hino Sangyo Co., Ltd.
1948 May Sales division of Hino Sangyo Co., Ltd. spun off as Hino Diesel Sales Co., Ltd.
June Hino Diesel Sales Co., Ltd. and Hino Sangyo Co., Ltd. entered into Distributorship Agreement, and began sales
activities.
December Hino Sangyo Co., Ltd. changed its corporate name into Hino Diesel Industry Co., Ltd.
1949 May Hino Diesel Industry Co., Ltd. became listed on the Tokyo Stock Exchange.
SAWAFUJI ELECTRIC CO., LTD. (current affiliated company) became listed on the Tokyo Stock Exchange.
1951 October Hino Diesel Industry Co., Ltd. acquired shares in SAWAFUJI ELECTRIC CO., LTD.
1953 December Hino Diesel Industry Co., Ltd. and Fukushima Seisakusho K.K. jointly established Fukushima Steel Works Co.,
Ltd. (current subsidiary). Fukushima Steel Works Co., Ltd. began manufacturing and selling foundry automobile
parts.
1954 February Hino Diesel Industry Co., Ltd. acquired shares in Riken Forge Co., Ltd. (current subsidiary).
May Hino Diesel Industry Co., Ltd. became listed on the Osaka Securities Exchange and Nagoya Stock Exchange.
1955 November Teikoku Jidosha Kogyo Co., Ltd. (currently Trantechs, Ltd.) became a subsidiary of Hino Diesel Industry Co.,
Ltd.
1958 April Hino Diesel Industry Co., Ltd. became listed on the Niigata Stock Exchange.
1959 April
Hino-Renault Sales Co., Ltd. was merged into Hino Diesel Sales Co., Ltd. Hino Diesel Sales Co., Ltd. changed
its corporate name into Hino Motor Sales, Ltd.
June Hino Diesel Industry Co., Ltd. changed it corporate name into Hino Motors, Ltd.
1960 June Hino Motors, Ltd. became listed on the Fukuoka, Hiroshima, and Sapporo Stock Exchanges.
1961 October Teikoku Jidosha Kogyo Co., Ltd. became listed on Tokyo Stock Exchange.
1964 July Hino Motors, Ltd. jointly established Thai Hino Industry Co., Ltd.
1966 October Hino Motors, Ltd. and Hino Motor Sales, Ltd. entered alliance with Toyota Motor Co., Ltd. and Toyota Motor
Sales Co., Ltd. (Both companies were merged into Toyota Motor Corporation in July 1, 1982.)
1969 March Hino Motors, Ltd. made an investment in Thai Hino Motor Sales, Ltd.
1975 April Teikoku Jidosha Kogyo Co., Ltd. merged with Kinsan Jidosha Kogyo Co., Ltd. and changed its corporate name
into Hino Auto Body, Ltd.
1982 December Hino Motors, Ltd. jointly established PT. Hino Indonesia Manufacturing.
1983 October Hino Motors, Ltd. and Hino Motor Sales, Ltd. jointly established Hino Kosan Co., Ltd. Launched leasing
business for Hino group companies.
1985 June Hino Motors, Ltd. jointly established Hinopak Motors Ltd. (current subsidiary).
1996 June Hino Motor, Ltd. established Hino Motor Sales Australia Pty. Ltd. (current subsidiary) in Australia.
1997 April Riken Forge Co., Ltd (current subsidiary) merged with Riken Koki Co., Ltd. and Riken Forge Co., Ltd. became a
surviving company.
1999 Fukushima Steel Work Co., Ltd. (affiliated company merged with Sagami Casting Co., Ltd. (subsidiary) and
Fukushima Steel Work Co., Ltd. became a surviving company (current subsidiary).
April
Kakuwa Seiki Co., Ltd. (subsidiary), Chiyoda Jidosha Kogyo Co., Ltd. (affiliated company), and Kokusan Kiki
Co., Ltd. (affiliated company) merged and changed its corporate name into Sohshin Co., Ltd. (current subsidiary)
1999 May Thai Hino Motor Sales, Ltd. purchased the business of Thai Hino Industry Co., Ltd. and changed its corporate
name into Hino Motors (Thailand), Ltd.
October Hino Motors, Ltd. merged with Hino Motor Sales, Ltd. to become Hino Motors, Ltd.
2000 August Hino Motors, Ltd. acquired shares of Hino Auto Body, Ltd. (subsidiary) through stock exchange, and Hino Auto
Body, Ltd. became a fully owned subsidiary of Hino Motors, Ltd., and delisted.
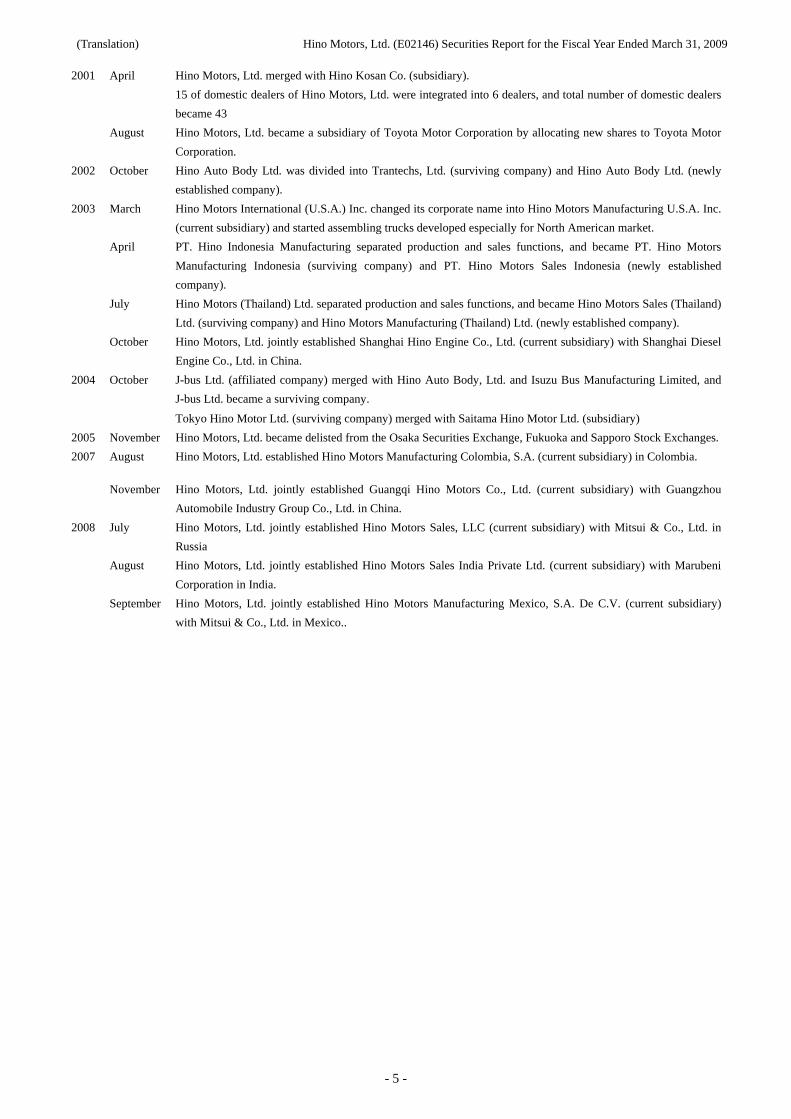
(Translation) Hino Motors, Ltd. (E02146) Securities Report for the Fiscal Year Ended March 31, 2009
- 5 -
2001 April Hino Motors, Ltd. merged with Hino Kosan Co. (subsidiary).
15 of domestic dealers of Hino Motors, Ltd. were integrated into 6 dealers, and total number of domestic dealers
became 43
August Hino Motors, Ltd. became a subsidiary of Toyota Motor Corporation by allocating new shares to Toyota Motor
Corporation.
2002 October Hino Auto Body Ltd. was divided into Trantechs, Ltd. (surviving company) and Hino Auto Body Ltd. (newly
established company).
2003 March Hino Motors International (U.S.A.) Inc. changed its corporate name into Hino Motors Manufacturing U.S.A. Inc.
(current subsidiary) and started assembling trucks developed especially for North American market.
April PT. Hino Indonesia Manufacturing separated production and sales functions, and became PT. Hino Motors
Manufacturing Indonesia (surviving company) and PT. Hino Motors Sales Indonesia (newly established
company).
July Hino Motors (Thailand) Ltd. separated production and sales functions, and became Hino Motors Sales (Thailand)
Ltd. (surviving company) and Hino Motors Manufacturing (Thailand) Ltd. (newly established company).
October Hino Motors, Ltd. jointly established Shanghai Hino Engine Co., Ltd. (current subsidiary) with Shanghai Diesel
Engine Co., Ltd. in China.
2004 J-bus Ltd. (affiliated company) merged with Hino Auto Body, Ltd. and Isuzu Bus Manufacturing Limited, and
J-bus Ltd. became a surviving company.
October
Tokyo Hino Motor Ltd. (surviving company) merged with Saitama Hino Motor Ltd. (subsidiary)
2005 November Hino Motors, Ltd. became delisted from the Osaka Securities Exchange, Fukuoka and Sapporo Stock Exchanges.
2007 August
Hino Motors, Ltd. established Hino Motors Manufacturing Colombia, S.A. (current subsidiary) in Colombia.
November Hino Motors, Ltd. jointly established Guangqi Hino Motors Co., Ltd. (current subsidiary) with Guangzhou
Automobile Industry Group Co., Ltd. in China.
2008 July Hino Motors, Ltd. jointly established Hino Motors Sales, LLC (current subsidiary) with Mitsui & Co., Ltd. in
Russia
August Hino Motors, Ltd. jointly established Hino Motors Sales India Private Ltd. (current subsidiary) with Marubeni
Corporation in India.
September Hino Motors, Ltd. jointly established Hino Motors Manufacturing Mexico, S.A. De C.V. (current subsidiary)
with Mitsui & Co., Ltd. in Mexico..
(Translation) Hino Motors, Ltd. (E02146) Securities Report for the Fiscal Year Ended March 31, 2009
- 6 -
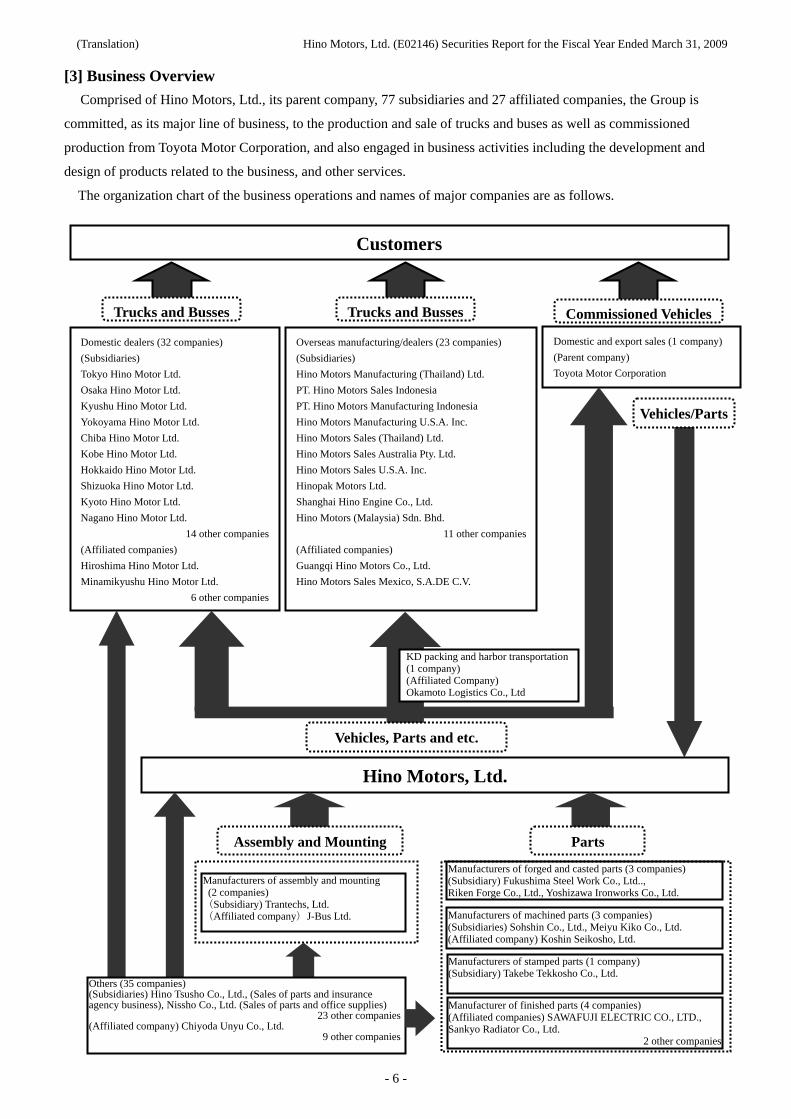
[3] Business Overview Comprised of Hino Motors, Ltd., its parent company, 77 subsidiaries and 27 affiliated companies, the Group is
committed, as its major line of business, to the production and sale of trucks and buses as well as commissioned
production from Toyota Motor Corporation, and also engaged in business activities including the development and
design of products related to the business, and other services.
The organization chart of the business operations and names of major companies are as follows.
Customers
Commissioned Vehicles
Domestic dealers (32 companies)
(Subsidiaries)
Tokyo Hino Motor Ltd.
Osaka Hino Motor Ltd.
Kyushu Hino Motor Ltd.
Yokoyama Hino Motor Ltd.
Chiba Hino Motor Ltd.
Kobe Hino Motor Ltd.
Hokkaido Hino Motor Ltd.
Shizuoka Hino Motor Ltd.
Kyoto Hino Motor Ltd.
Nagano Hino Motor Ltd.
14 other companies
(Affiliated companies)
Hiroshima Hino Motor Ltd.
Minamikyushu Hino Motor Ltd.
6 other companies
Overseas manufacturing/dealers (23 companies)
(Subsidiaries)
Hino Motors Manufacturing (Thailand) Ltd.
PT. Hino Motors Sales Indonesia
PT. Hino Motors Manufacturing Indonesia
Hino Motors Manufacturing U.S.A. Inc.
Hino Motors Sales (Thailand) Ltd.
Hino Motors Sales Australia Pty. Ltd.
Hino Motors Sales U.S.A. Inc.
Hinopak Motors Ltd.
Shanghai Hino Engine Co., Ltd.
Hino Motors (Malaysia) Sdn. Bhd.
11 other companies
(Affiliated companies)
Guangqi Hino Motors Co., Ltd.
Hino Motors Sales Mexico, S.A.DE C.V.
Domestic and export sales (1 company)
(Parent company)
Toyota Motor Corporation
Vehicles, Parts and etc.
Hino Motors, Ltd.
Manufacturers of assembly and mounting (2 companies) (Subsidiary) Trantechs, Ltd. (Affiliated company)J-Bus Ltd.
Others (35 companies) (Subsidiaries) Hino Tsusho Co., Ltd., (Sales of parts and insurance agency business), Nissho Co., Ltd. (Sales of parts and office supplies)
23 other companies(Affiliated company) Chiyoda Unyu Co., Ltd.
9 other companies
Manufacturers of machined parts (3 companies) (Subsidiaries) Sohshin Co., Ltd., Meiyu Kiko Co., Ltd. (Affiliated company) Koshin Seikosho, Ltd.
Manufacturer of finished parts (4 companies) (Affiliated companies) SAWAFUJI ELECTRIC CO., LTD., Sankyo Radiator Co., Ltd.
2 other companies
Manufacturers of forged and casted parts (3 companies) (Subsidiary) Fukushima Steel Work Co., Ltd.., Riken Forge Co., Ltd., Yoshizawa Ironworks Co., Ltd.
Manufacturers of stamped parts (1 company) (Subsidiary) Takebe Tekkosho Co., Ltd.
Assembly and Mounting Parts
KD packing and harbor transportation (1 company) (Affiliated Company) Okamoto Logistics Co., Ltd
Trucks and Busses Trucks and Busses
Vehicles/Parts
(Translation) Hino Motors, Ltd. (E02146) Securities Report for the Fiscal Year Ended March 31, 2009
- 7 -
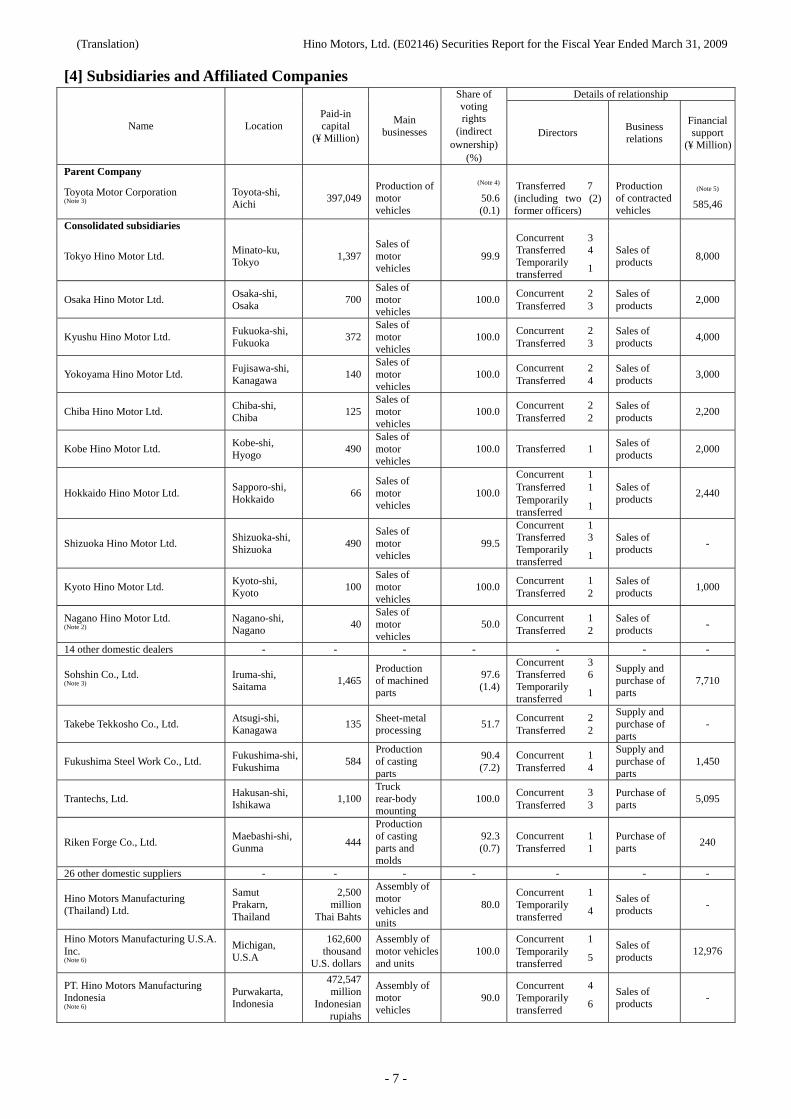
[4] Subsidiaries and Affiliated Companies Details of relationship
Name Location Paid-in capital
(¥ Million)
Main businesses
Share of voting rights
(indirect ownership)
(%)
Directors Business relations
Financial support
(¥ Million)
Parent Company
Toyota Motor Corporation (Note 3)
Toyota-shi, Aichi
397,049Production of motor vehicles
(Note 4)
50.6(0.1)
Transferred 7 (including two (2) former officers)
Production of contracted vehicles
(Note 5) 585,46
Consolidated subsidiaries
Tokyo Hino Motor Ltd. Minato-ku, Tokyo
1,397Sales of motor vehicles
99.9
Concurrent 3 Transferred 4 Temporarily transferred
1
Sales of products
8,000
Osaka Hino Motor Ltd. Osaka-shi, Osaka
700Sales of motor vehicles
100.0Concurrent 2 Transferred 3
Sales of products
2,000
Kyushu Hino Motor Ltd. Fukuoka-shi, Fukuoka
372Sales of motor vehicles
100.0Concurrent 2 Transferred 3
Sales of products
4,000
Yokoyama Hino Motor Ltd. Fujisawa-shi, Kanagawa
140Sales of motor vehicles
100.0Concurrent 2 Transferred 4
Sales of products
3,000
Chiba Hino Motor Ltd. Chiba-shi, Chiba
125Sales of motor vehicles
100.0Concurrent 2 Transferred 2
Sales of products
2,200
Kobe Hino Motor Ltd. Kobe-shi, Hyogo
490Sales of motor vehicles
100.0 Transferred 1 Sales of products
2,000
Hokkaido Hino Motor Ltd. Sapporo-shi, Hokkaido
66Sales of motor vehicles
100.0
Concurrent 1 Transferred 1 Temporarily transferred
1
Sales of products
2,440
Shizuoka Hino Motor Ltd. Shizuoka-shi, Shizuoka
490Sales of motor vehicles
99.5
Concurrent 1 Transferred 3 Temporarily transferred
1
Sales of products
-
Kyoto Hino Motor Ltd. Kyoto-shi, Kyoto
100Sales of motor vehicles
100.0Concurrent 1 Transferred 2
Sales of products
1,000
Nagano Hino Motor Ltd. (Note 2)
Nagano-shi, Nagano
40Sales of motor vehicles
50.0Concurrent 1 Transferred 2
Sales of products
-
14 other domestic dealers - - - - - - -
Sohshin Co., Ltd. (Note 3)
Iruma-shi, Saitama
1,465Production of machined parts
97.6(1.4)
Concurrent 3 Transferred 6 Temporarily transferred
1
Supply and purchase of parts
7,710
Takebe Tekkosho Co., Ltd. Atsugi-shi, Kanagawa
135Sheet-metal processing
51.7Concurrent 2 Transferred 2
Supply and purchase of parts
-
Fukushima Steel Work Co., Ltd. Fukushima-shi, Fukushima
584Production of casting parts
90.4(7.2)
Concurrent 1 Transferred 4
Supply and purchase of parts
1,450
Trantechs, Ltd. Hakusan-shi, Ishikawa
1,100Truck rear-body mounting
100.0Concurrent 3 Transferred 3
Purchase of parts
5,095
Riken Forge Co., Ltd. Maebashi-shi, Gunma
444
Production of casting parts and molds
92.3(0.7)
Concurrent 1 Transferred 1
Purchase of parts
240
26 other domestic suppliers - - - - - - -
Hino Motors Manufacturing (Thailand) Ltd.
Samut Prakarn, Thailand
2,500 million
Thai Bahts
Assembly of motor vehicles and units
80.0Concurrent 1 Temporarily transferred
4
Sales of products
-
Hino Motors Manufacturing U.S.A. Inc. (Note 6)
Michigan, U.S.A
162,600 thousand
U.S. dollars
Assembly of motor vehicles and units
100.0Concurrent 1 Temporarily transferred
5
Sales of products
12,976
PT. Hino Motors Manufacturing Indonesia (Note 6)
Purwakarta, Indonesia
472,547 million
Indonesian rupiahs
Assembly of motor vehicles
90.0Concurrent 4 Temporarily transferred
6
Sales of products
-
(Translation) Hino Motors, Ltd. (E02146) Securities Report for the Fiscal Year Ended March 31, 2009
- 8 -
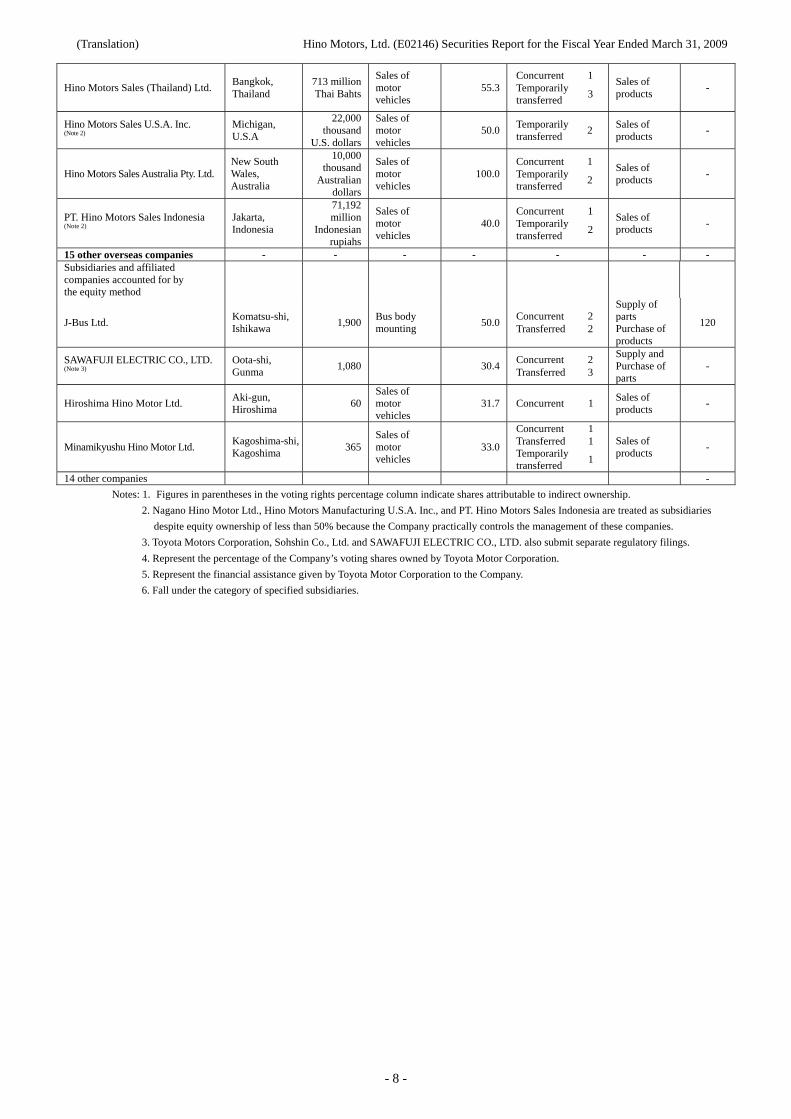
Hino Motors Sales (Thailand) Ltd. Bangkok, Thailand
713 million Thai Bahts
Sales of motor vehicles
55.3Concurrent 1 Temporarily transferred
3
Sales of products
-
Hino Motors Sales U.S.A. Inc. (Note 2)
Michigan, U.S.A
22,000 thousand
U.S. dollars
Sales of motor vehicles
50.0Temporarily transferred
2
Sales of products
-
Hino Motors Sales Australia Pty. Ltd. New South Wales, Australia
10,000 thousand
Australian dollars
Sales of motor vehicles
100.0Concurrent 1 Temporarily transferred
2
Sales of products
-
PT. Hino Motors Sales Indonesia (Note 2)
Jakarta, Indonesia
71,192 million
Indonesian rupiahs
Sales of motor vehicles
40.0Concurrent 1 Temporarily transferred
2
Sales of products
-
15 other overseas companies - - - - - - - Subsidiaries and affiliated companies accounted for by the equity method
J-Bus Ltd. Komatsu-shi, Ishikawa
1,900Bus body mounting
50.0Concurrent 2 Transferred 2
Supply of parts Purchase of products
120
SAWAFUJI ELECTRIC CO., LTD. (Note 3)
Oota-shi, Gunma
1,080 30.4Concurrent 2 Transferred 3
Supply and Purchase of parts
-
Hiroshima Hino Motor Ltd. Aki-gun, Hiroshima
60Sales of motor vehicles
31.7 Concurrent 1 Sales of products
-
Minamikyushu Hino Motor Ltd. Kagoshima-shi, Kagoshima
365Sales of motor vehicles
33.0
Concurrent 1 Transferred 1 Temporarily transferred
1
Sales of products
-
14 other companies -
Notes: 1. Figures in parentheses in the voting rights percentage column indicate shares attributable to indirect ownership.
2. Nagano Hino Motor Ltd., Hino Motors Manufacturing U.S.A. Inc., and PT. Hino Motors Sales Indonesia are treated as subsidiaries
despite equity ownership of less than 50% because the Company practically controls the management of these companies.
3. Toyota Motors Corporation, Sohshin Co., Ltd. and SAWAFUJI ELECTRIC CO., LTD. also submit separate regulatory filings.
4. Represent the percentage of the Company’s voting shares owned by Toyota Motor Corporation.
5. Represent the financial assistance given by Toyota Motor Corporation to the Company.
6. Fall under the category of specified subsidiaries.
(Translation) Hino Motors, Ltd. (E02146) Securities Report for the Fiscal Year Ended March 31, 2009
- 9 -
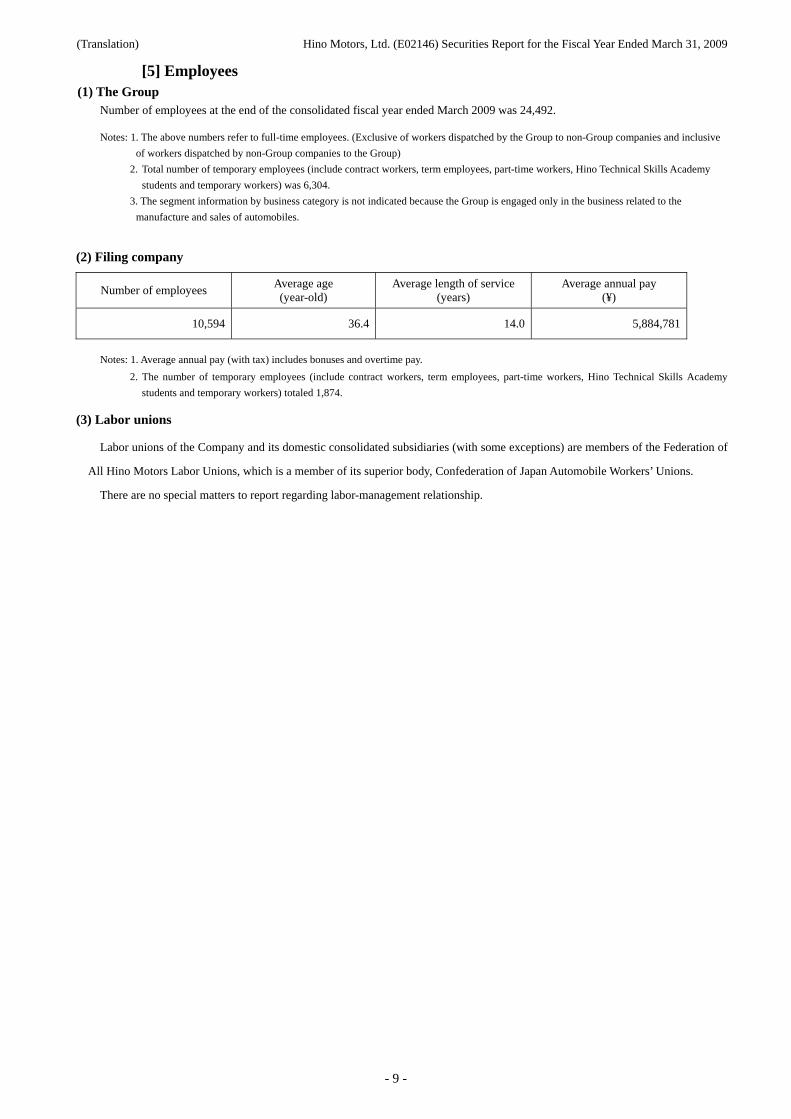
[5] Employees
(1) The Group Number of employees at the end of the consolidated fiscal year ended March 2009 was 24,492.
Notes: 1. The above numbers refer to full-time employees. (Exclusive of workers dispatched by the Group to non-Group companies and inclusive
of workers dispatched by non-Group companies to the Group)
2. Total number of temporary employees (include contract workers, term employees, part-time workers, Hino Technical Skills Academy
students and temporary workers) was 6,304.
3. The segment information by business category is not indicated because the Group is engaged only in the business related to the
manufacture and sales of automobiles.
(2) Filing company
Number of employees Average age (year-old)
Average length of service (years)
Average annual pay (¥)
10,594 36.4 14.0 5,884,781
Notes: 1. Average annual pay (with tax) includes bonuses and overtime pay.
2. The number of temporary employees (include contract workers, term employees, part-time workers, Hino Technical Skills Academy
students and temporary workers) totaled 1,874.
(3) Labor unions
Labor unions of the Company and its domestic consolidated subsidiaries (with some exceptions) are members of the Federation of
All Hino Motors Labor Unions, which is a member of its superior body, Confederation of Japan Automobile Workers’ Unions.
There are no special matters to report regarding labor-management relationship.
(Translation) Hino Motors, Ltd. (E02146) Securities Report for the Fiscal Year Ended March 31, 2009
- 10 -
Section 2. Business Information
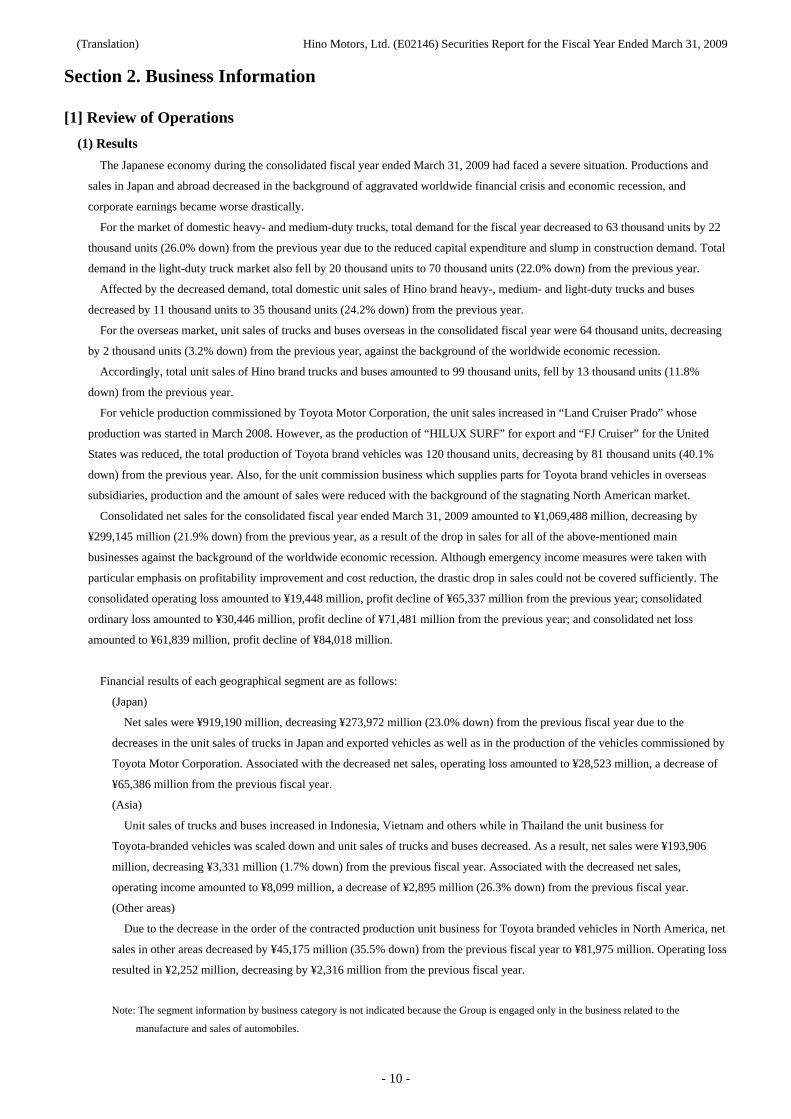
[1] Review of Operations
(1) Results
The Japanese economy during the consolidated fiscal year ended March 31, 2009 had faced a severe situation. Productions and
sales in Japan and abroad decreased in the background of aggravated worldwide financial crisis and economic recession, and
corporate earnings became worse drastically.
For the market of domestic heavy- and medium-duty trucks, total demand for the fiscal year decreased to 63 thousand units by 22
thousand units (26.0% down) from the previous year due to the reduced capital expenditure and slump in construction demand. Total
demand in the light-duty truck market also fell by 20 thousand units to 70 thousand units (22.0% down) from the previous year.
Affected by the decreased demand, total domestic unit sales of Hino brand heavy-, medium- and light-duty trucks and buses
decreased by 11 thousand units to 35 thousand units (24.2% down) from the previous year.
For the overseas market, unit sales of trucks and buses overseas in the consolidated fiscal year were 64 thousand units, decreasing
by 2 thousand units (3.2% down) from the previous year, against the background of the worldwide economic recession.
Accordingly, total unit sales of Hino brand trucks and buses amounted to 99 thousand units, fell by 13 thousand units (11.8%
down) from the previous year.
For vehicle production commissioned by Toyota Motor Corporation, the unit sales increased in “Land Cruiser Prado” whose
production was started in March 2008. However, as the production of “HILUX SURF” for export and “FJ Cruiser” for the United
States was reduced, the total production of Toyota brand vehicles was 120 thousand units, decreasing by 81 thousand units (40.1%
down) from the previous year. Also, for the unit commission business which supplies parts for Toyota brand vehicles in overseas
subsidiaries, production and the amount of sales were reduced with the background of the stagnating North American market.
Consolidated net sales for the consolidated fiscal year ended March 31, 2009 amounted to ¥1,069,488 million, decreasing by
¥299,145 million (21.9% down) from the previous year, as a result of the drop in sales for all of the above-mentioned main
businesses against the background of the worldwide economic recession. Although emergency income measures were taken with
particular emphasis on profitability improvement and cost reduction, the drastic drop in sales could not be covered sufficiently. The
consolidated operating loss amounted to ¥19,448 million, profit decline of ¥65,337 million from the previous year; consolidated
ordinary loss amounted to ¥30,446 million, profit decline of ¥71,481 million from the previous year; and consolidated net loss
amounted to ¥61,839 million, profit decline of ¥84,018 million.
Financial results of each geographical segment are as follows:
(Japan)
Net sales were ¥919,190 million, decreasing ¥273,972 million (23.0% down) from the previous fiscal year due to the
decreases in the unit sales of trucks in Japan and exported vehicles as well as in the production of the vehicles commissioned by
Toyota Motor Corporation. Associated with the decreased net sales, operating loss amounted to ¥28,523 million, a decrease of
¥65,386 million from the previous fiscal year.
(Asia)
Unit sales of trucks and buses increased in Indonesia, Vietnam and others while in Thailand the unit business for
Toyota-branded vehicles was scaled down and unit sales of trucks and buses decreased. As a result, net sales were ¥193,906
million, decreasing ¥3,331 million (1.7% down) from the previous fiscal year. Associated with the decreased net sales,
operating income amounted to ¥8,099 million, a decrease of ¥2,895 million (26.3% down) from the previous fiscal year.
(Other areas)
Due to the decrease in the order of the contracted production unit business for Toyota branded vehicles in North America, net
sales in other areas decreased by ¥45,175 million (35.5% down) from the previous fiscal year to ¥81,975 million. Operating loss
resulted in ¥2,252 million, decreasing by ¥2,316 million from the previous fiscal year.
Note: The segment information by business category is not indicated because the Group is engaged only in the business related to the
manufacture and sales of automobiles.
(Translation) Hino Motors, Ltd. (E02146) Securities Report for the Fiscal Year Ended March 31, 2009
- 11 -
(2) Cash flows
The cash and cash equivalents (hereinafter referred to as “Cash”) at the end of the consolidated fiscal year ended March 31, 2009
increased by ¥717 million (2.5%) from the end of the previous fiscal year to ¥29,427 million due to the decreased trade notes and
accounts receivable, increased interest-bearing debts and others although it was partly offset by certain factors including decreased
trade notes and accounts payable and acquisition of fixed assets.
(Cash flows from operating activities)
Cash used by operating activities for the fiscal year was ¥8,504 million (an increase of ¥92,504 million in the previous fiscal year).
The main factors were a ¥79,380 million decrease in trade notes and accounts receivable (3.8 times of the previous year), net loss of
¥35,037 million before income taxes and minority interests (net income of ¥36,885 million in the previous year), and a ¥74,953
million decrease in trade notes and accounts payable (a ¥7,059 million increase in the previous year).
(Cash flows from investing activities)
Cash used by investing activities for the fiscal year was ¥57,329 million (9.7% up). The main factor was ¥55,191 million (40.4%
up) for the acquisition of production facility and other tangible fixed assets.
(Cash flows from financing activities)
Cash provided by financing activities for the fiscal year was ¥68,054 million (cash of ¥38,963 million was used in the previous
fiscal year). The main factors were ¥24,122 million (10.9% down) for repayment of long-term loan and a ¥34,133 million (83.7%
up) proceed from long-term loan receivable.
[2] Production, Orders Received and Sales
(1) Production
Production values by business segment were as follows.
FY2008 FY2009 Change
(%) Name of business segment
Units ¥ Million Units ¥ Million Units ¥ Million
Trucks and busses 110,279 - 90,935 - (19,344) -
Toyota brand vehicles
Vehicles 200,929 - 120,271 - (80,658) -
Parts for overseas manufacturing - 6,134 - 6,091 - (43)
Engines 28,166 - 25,882 - (2,284) -
Supplies, parts and others - 130,214 - 125,625 - (4,589)Note: Figures are based on standard wholesale prices.
(2) Orders received
The Group has adopted a make-to-stock production system based on certain data including actual and projected sales at home and
overseas.
Toyota brand vehicles are based on the manufacturing commissioned by Toyota Motor Corporation.
(Translation) Hino Motors, Ltd. (E02146) Securities Report for the Fiscal Year Ended March 31, 2009
- 12 -
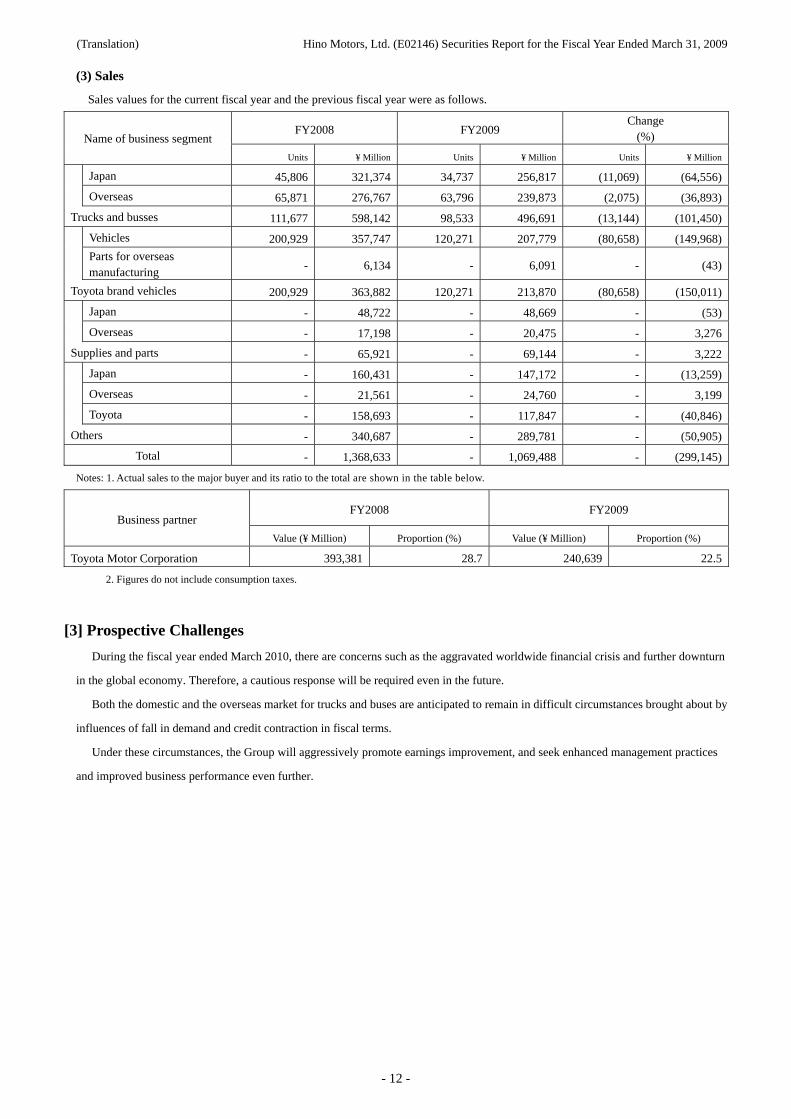
(3) Sales
Sales values for the current fiscal year and the previous fiscal year were as follows.
FY2008 FY2009 Change
(%) Name of business segment
Units ¥ Million Units ¥ Million Units ¥ Million
Japan 45,806 321,374 34,737 256,817 (11,069) (64,556)
Overseas 65,871 276,767 63,796 239,873 (2,075) (36,893)
Trucks and busses 111,677 598,142 98,533 496,691 (13,144) (101,450)
Vehicles 200,929 357,747 120,271 207,779 (80,658) (149,968)
Parts for overseas manufacturing
- 6,134 - 6,091 - (43)
Toyota brand vehicles 200,929 363,882 120,271 213,870 (80,658) (150,011)
Japan - 48,722 - 48,669 - (53)
Overseas - 17,198 - 20,475 - 3,276
Supplies and parts - 65,921 - 69,144 - 3,222
Japan - 160,431 - 147,172 - (13,259)
Overseas - 21,561 - 24,760 - 3,199
Toyota - 158,693 - 117,847 - (40,846)
Others - 340,687 - 289,781 - (50,905)
Total - 1,368,633 - 1,069,488 - (299,145)
Notes: 1. Actual sales to the major buyer and its ratio to the total are shown in the table below.
FY2008 FY2009 Business partner
Value (¥ Million) Proportion (%) Value (¥ Million) Proportion (%)
Toyota Motor Corporation 393,381 28.7 240,639 22.5
2. Figures do not include consumption taxes.
[3] Prospective Challenges
During the fiscal year ended March 2010, there are concerns such as the aggravated worldwide financial crisis and further downturn
in the global economy. Therefore, a cautious response will be required even in the future.
Both the domestic and the overseas market for trucks and buses are anticipated to remain in difficult circumstances brought about by
influences of fall in demand and credit contraction in fiscal terms.
Under these circumstances, the Group will aggressively promote earnings improvement, and seek enhanced management practices
and improved business performance even further.
(Translation) Hino Motors, Ltd. (E02146) Securities Report for the Fiscal Year Ended March 31, 2009
- 13 -
[4] Business Risks
With respect to certain matters contained in the securities report including the information on business and information on
accounting, the following may have a significant impact on the judgment by investors.
Please note that any matter concerning the future in the text is based on the Group’s judgment as of the filing date of the securities
report (June 24, 2009).
(1) Changes in total demand and prices
Domestic sales of trucks as our primary revenue stream may be significantly affected by demand changes depending on whether
or not any tighter environmental regulations are implemented by the national and/or local governments. Future demand of trucks is
expected to decrease due to the downturn in the domestic freight transport and the progress of logistics reform. Price competition
with competitors may cause price changes in our products.
(2) Changes in material prices
The Group procures materials such as steel, parts and others from multiple domestic and overseas manufacturers to produce trucks,
buses, engines and other products. Prices of these materials, which are increasing according to the industry’s demand increase and
price changes in materials, cause the cost increase of the products produced by the Group. Soaring material prices and prolongation
thereof may adversely affect the Group’s business results and financial standing.
(3) Changes in the foreign exchange
The Company prepares consolidated financial statements in Japanese yen. Net sales, expenses, assets and others denominated in
local currencies overseas are translated into Japanese yen when the statements are prepared. Therefore, exchange rates at the time of
translation may affect the yen-denominated values after the translation.
In terms of product exports from Japan to other countries around the world, the yen appreciation against foreign currencies may
have a negative impact on the Group’s business results. In order to minimize this exchange risk, we partly use forward-exchange
contracts. As a result, we may lose the profits which otherwise could be obtained.
(4) Bad debts risk
The Group sells the trucks and buses produced by the Company to various customers through our sales companies across the
country. If any unexpected bad debts risk emerges in any of these customers due to credit uncertainty or otherwise and requires the
Group to post an additional loss or reserve, the Group’s business results and financial standing may be adversely affected.
(5) Transactions with the parent company
The Group is entrusted by its parent company, Toyota Motor Corporation with the production of light-duty trucks and others,
which accounts for 22.5% of the net sales for the year ended March 31, 2009.
Please note that the transactions with Toyota Motor Corporation are indicated in the “Information on related parties.”
(6) Overseas business activities
The Group conducts its business in Asia and the rest of the world. These business activities are usually exposed to certain risks
including presence or occurrence of unfavorable economic factors such as unexpected changes in laws and regulations, vulnerability
of industrial infrastructure, or difficulties in hiring and retaining human resources, or social or political disorder caused by terrorism,
wars or other factors. If any of these risks emerges and interferes with the Group’s overseas business activities, its business results
(Translation) Hino Motors, Ltd. (E02146) Securities Report for the Fiscal Year Ended March 31, 2009
- 14 -
and future plans may be affected.
Please note that the Group’s business activities in different regions of the world are indicated in the “Segment information by
geography.”
(7) Product liability (PL); laws and regulations, etc.
In the course of the Group’s business operation, a risk of a large-scale product recall or damages arising from defective products
may become a reality and cause a situation beyond the insurance coverage. Laws and regulations of the countries where the Group
conducts business may restrict its activities. If any of these risks emerges, the Group’s business results and financial standing may be
adversely affected.
[5] Legal and Contractual Matters
(1) Business partnership with Toyota Motor Corporation
Through the business partnership with Toyota Motor Corporation since October 1966, the Company is currently entrusted with the
production of Toyota’s passenger cars, “HILUX SURF,” “LAND CRUISER PRADO” and “FJ CRUISER” and light-duty trucks
“DYNA TOYOACE” and “QUICK DELIVERY.” The two companies seek to develop and strengthen their partnership in various
aspects such as reciprocal supplementary transactions of products, joint capital investment to a joint venture in Taiwan (Kuozui
Motors, Ltd.) and sales of the Company’s products through Toyota’s export network.
(2) Execution of a shareholders agreement with Isuzu Motors Limited
A shareholders agreement was entered into as of September 12, 2003 between the Company and Isuzu Motors Limited for the
purpose of assigning the shares of Hino Body Co., Ltd. and Isuzu Bus Manufacturing Limited, both of which were bus
manufacturing subsidiaries owned by the Company and Isuzu Motors Limited, to J-Bus Ltd. a fifty-fifty joint venture of the two
companies to prepare for the integration of the bus operations, and agreeing to basic matters for the integration.
In order to maximize the effect of the integration, a merger agreement was entered into as of July 30, 2004 between J-Bus Ltd. and
the two bus manufacturing subsidiaries under the control of J-Bus and the merger came into effect as of October 1, 2004.
(3) Execution of a cooperation agreement with Scania AB in Sweden
The Company and Scania AB, a Swedish heavy-duty truck and bus manufacturer decided to, through the business cooperation by
utilizing their mutually complementary relationship in products and sales territories, enhance their product appeal and cost
competitiveness, increase their net sales and revenue, and reinforce their advantage in this field by combining know-how on
environmental technologies. Accordingly, a cooperation agreement was entered into as of March 25, 2002 between the two
companies.
(4) Execution of an agreement for supplying medium-size engines and others to Nissan Diesel Motor Co., Ltd.
A master business agreement was entered into as of December 1, 2003 between the Company and Nissan Diesel Motor Co., Ltd.
in order to supply the Company’s medium-size engines, exhaust-gas aftertreatment devices and other parts to Nissan Diesel Motor
for the purpose of installing them in trucks and buses for the Japanese market and trucks for the U.S. market.
(5) Execution of a joint venture agreement for Shanghai Hino Engine Co., Ltd. in China
The Company signed a joint venture agreement on August 6, 2003 with Shanghai Diesel Engine Co., Ltd., a Chinese engine
(Translation) Hino Motors, Ltd. (E02146) Securities Report for the Fiscal Year Ended March 31, 2009
- 15 -
manufacturer in order to establish a fifty-fifty joint venture for the local production and sales of engines in China, a potential major
market of trucks and buses in the future. In accordance with this agreement, the joint venture was established as of October 8, 2003.
As all the shares owned by Shanghai Diesel Engine Co., Ltd. were assigned to Shanghai Electric (Group) Corp. in September 2007, a
modified joint venture agreement was entered into between the Company and Shanghai Electric (Group) Corp.
(6) Execution of a joint venture agreement with Guangzhou Automobile Group Co., Ltd. in China
The Company signed a joint venture agreement on August 10, 2007 with Guangzhou Automobile Group Co., Ltd., whose core
business was to manufacture and sell automobiles in China, to establish a fifty-fifty joint venture for the purposes of developing,
designing, producing, selling and servicing commercial vehicles, chassis, engines and other parts in China. As a result, Guangqi Hino
Motors Co., Ltd. was established as of November 28, 2007.
[6] Research and Development
In conformity with its corporate philosophy called "The Hino Credo", “making the world a better place to live by helping people and
goods get where they need to go” and “developing and maintaining innovative technologies that enable us to provide customers with
useful products and services,” the Group carries out active research and development activities to adapt to changing social needs and to
provide safe and environmentally-friendly products.
The Company promotes its research and development in close cooperation with subsidiaries and affiliated companies. In the field of
basic research, the Technical Research Laboratory plays a central role to work on research and development in environmental, safety
and material areas.
The Company conducts product and technological development, aiming for adding better value to the vehicles supporting the
transport of people and goods as well as contributing to the reduction of environmental burdens and traffic accidents.
[Most recent new products]
The following new products were placed on the market during the year ended March 31, 2009.
The Company launched:
1) On April 21, 2008, the “HINO 300 Series” of light-duty trucks in the Vietnamese market;
2) On May 12, 2008, “HINO SELEGA HYBRID” as a result of a full model change on the only large-sized sightseeing bus in
Japan;
3) On August 25, 2008, “Hino Compass,” a telematics product for heavy-, medium- and light-duty trucks which allows real-time
bidirectional communications between vehicles and traffic administrators and supports advanced operation;
4) On September 25, 2008, an additional 4-ton class of the “Hino Ranger Series” medium-duty trucks, in which the “Pro Shift 6”
electronically-controlled fully-automatic transmission is installed; and
5) On December 18, 2008, a “Hino Compass” telematics product with new functions including the enhanced fuel-saving driving
support.
[Most recent major outcomes]
With respect to technological development, we developed the following new technologies contributing to reduced
environmental burdens and improved safety.
(Translation) Hino Motors, Ltd. (E02146) Securities Report for the Fiscal Year Ended March 31, 2009
- 16 -
1) “Noncontact power-supply hybrid bus” provided as shuttle bus for the Hokkaido Toyako Summit
<Features>
The noncontact power-supply device allows fast large-capacity charging. This bus runs mainly on an electric motor and emits
less CO2 while running. The electric motor provides comfortable ride with less noise and less vibration.
2) “Pro Shift 6” electronically-controlled fully-automatic transmission installed in medium-duty trucks
<Features>
The two-pedal system allows easy driving eliminating the need of the clutch operation and gear change operation and
contributes to reduced driver fatigue and safe driving. The automatic gear shifting to ensure fuel-efficient conditions lessens the
fuel consumption variance caused by drivers’ inconsistent operation and contributes to the reduction of operational cost.
3) The Company’s first telematics product, “Hino Compass”
<Features>
Operation control, fuel-saving driving support and safe driving evaluation and other functions are incorporated.
Consequently, the research and development cost for the current fiscal year amounted to ¥40,927 million.
Note: The segment information by business category is not indicated because the Group is engaged only in the business related to the manufacture
and sales of automobiles.
[7] Analysis of Financial Position and Performance
(1) Financial position
Total assets at the end of the consolidated fiscal year ended March 31, 2009 decreased by ¥119,176 million (13.6% down) to
¥755,192 million from the previous year end.
Current assets decreased ¥96,616 million (24.1% down) from the previous fiscal year end to ¥303,498 million. This was because of
the decrease of ¥89,072 million in trade notes and accounts receivable and the decrease of ¥12,104 million in deferred tax assets mainly
due to weak sales.
Fixed assets fell ¥22,560 million (4.8% down) from the previous fiscal year end to ¥451,693 million. This was primarily attributable
to the decrease of ¥24,692 million in investment securities due to falls in stock prices.
Liabilities dropped ¥29,360 million (5.2% down) from the previous fiscal year end to ¥536,250 million. This was mainly because
associated with reduced production, trade notes and accounts payable decreased ¥85,468 million while interest-bearing debts increased
¥63,798 million.
Net assets amounted to ¥218,942 million, a decrease of ¥89,816 million (29.1% down) from the previous fiscal year end. This was
primarily attributable to the dividend payment of ¥5,740 million and the reported net loss of ¥61,839 million as well as the decrease of
¥13,736 million in valuation difference on listed securities due to falls in stock prices.
(Translation) Hino Motors, Ltd. (E02146) Securities Report for the Fiscal Year Ended March 31, 2009
- 17 -
(2) Business results
1) Net sales
Net sales for the consolidated fiscal year ended March 31, 2009 amounted to ¥1,069,488 million, a decrease of ¥299,145
million (21.9% down) from the previous fiscal year.
Net sales of domestic trucks and buses decreased by ¥64,556 million (20.1% down) from the previous fiscal year to ¥256,817
million mainly due to the reduced capital expenditure and slump in construction demand.
Net sales of overseas trucks and buses decreased by ¥36,893 million (13.3% down) from the previous year to ¥239,873 million,
against the background of the worldwide economic recession.
As for the vehicle production commissioned by Toyota Motor Corporation, more units were produced in “LAND CRUISER
PRADO” with full-fledged production after its initial production in March 2008. However, fewer units were produced in “FJ
CRUISER” mainly for the United States and “HILUX SURF” for export. As a result, net sales amounted to ¥213,870 million, a
decrease of ¥150,011 million (41.2% down) from the previous fiscal year.
Net sales for supplies, parts and others decreased ¥47,683 million (11.7% down) to ¥358,925 million, mainly because the unit
commission business which supplies parts for Toyota brand vehicles in overseas subsidiaries were reduced with the background of
the stagnating North American market.
2) Operating income (loss)
Due to some factors including the stronger yen and soaring material prices in addition to the significant drop in net sales due to
slumping market, operating loss for the fiscal year under review was ¥19,448 million, a drop of ¥65,337 million from the previous
fiscal year.
Cost of sales to net sales was 88.4%, or 2.7 percentage points worsened from the previous year, and selling, general and
administrative expenses to net sales was 13.4%, or 2.5 percentage points worsened from the previous year.
3) Ordinary income (loss)
Ordinary loss amounted to ¥30,446 million, profit decline of ¥71,481 million from the previous year, mainly because foreign
exchange loss increased by ¥3,460 million and investment loss of foreign exchange worsened by ¥2,399 million.
4) Net income (loss) before income taxes and minority interests
Gains on the sale of investment securities increased by ¥2,653 million from the previous year to ¥2,688 million, while a ¥2,822
million loss from revision of retirement benefit plan was recorded followed by the revision of the Company’s retirement benefit plan.
As a result, net loss before income taxes and minority interests resulted in ¥35,037 million, profit decline of ¥71,923 million from
the previous year.
5) Net income (loss)
Tax expenses (the net amount of income taxes and deferred income taxes) during the consolidated fiscal year ended March 31,
2009 increased by ¥13,041 million from the previous fiscal year to ¥26,118 million mainly due to reversal of deferred tax assets.
Minority interests decreased by ¥946 million from the previous year to ¥683 million.
As a result, consolidated net loss amounted to ¥61,839 million, a decrease of ¥84,018 million from the previous fiscal year.
(Translation) Hino Motors, Ltd. (E02146) Securities Report for the Fiscal Year Ended March 31, 2009
- 18 -
Section 3. Facilities and Capital Expenditure
[1] Outline of Capital Expenditure
The Group invested ¥58,422 million in plants and equipment including arrangements of new products, construction of new plants, and
renewal of equipment for rationalization.
The production division for vehicles and parts spent ¥52,041 million for capital expenditure to construct new plants overseas, enhance
the equipment for new products of commissioned vehicles, reinforce the production capacity and promote the streamlined production
equipment. The sales and service division made capital investments of ¥3,260 million primarily to improve their bases for higher sales
capabilities and renew facilities for improved after-sales service such as automobile inspection and maintenance.
Other divisions (information, administration, welfare, etc.) spent ¥3,120 million mainly for renewal and repair of information
equipment.
[2] Major Facilities
Major facilities of the Group are shown in the table below.
(1) The Company
Book value (¥ Million) Office
name (Location)
Business type
Facility type/purpose
Buildings and
structures
Machineryand
equipment
Land [thousand m2]
Leased assets
Other Total
Number of employees(persons)
Hino Plant (Hino-shi, Tokyo)
Production Truck and engine production facilities
18,216
<88>
19,930
<0>
44
[428]
<0>
295,328
<10>
43,549
<99>4,715
Hamura Plant (Hamura-shi, Tokyo)
Production
Truck and Toyota brand vehicles production facilities (Note 3)
12,517
<9>
19,271
<1>
1,767
[750]
<5>
635,545
<17>
35,545
<17>3,013
Nitta Plant (Ohta-shi, Gumma)
Production Engine and parts production facilities
10,423 23,575
2,156
[393]
<40>
7482
<1>
36,645
<41>1,376
(Translation) Hino Motors, Ltd. (E02146) Securities Report for the Fiscal Year Ended March 31, 2009
- 19 -
(2) Domestic subsidiaries
Book value (¥ Million) Office
name (Location)
Business type
Facility type/purpose Buildings and
structures Machinery
and equipmentLand
[thousand m2]Leased assets Other Total
Number of employees(persons)
Sohshin Co., Ltd. (Iruma-shi, Saitama)
Production
Parts production facilities
(Note 3)
2,941 4,449 2,114[124] 848 234 10,589 765
Trantechs, Ltd. (Hakusan-shi, Ishikawa)
Production
Truck body production and
mounting facilities
1,600 908 3,132[114] - 91 5,732 580
Fukushima Steel Work Co., Ltd. (Fukushima-shi, Fukushima)
Production Parts
production (Note 3)
2,406 3,421 4,276[172] 593 337 11,035 657
Tokyo Hino Motor Ltd. (Minato-ku, Tokyo)
Sales Sales facilities (Note 3)
3,929<15>
42711,106
[113]<19>
44 193 15,700
<34>727
Kyushu Hino Motor Ltd. (Higashi-ku, Fukuoka-shi, Fukuoka)
Sales Sales facilities 2,480 1776,557[166]
<695>- 33
9,249<695>
499
Yokohama Hino Motor Ltd. (Fujisawa-shi, Kanagawa)
Sales Sales facilities
(Note 3) 1,808 266 5,149[37] 15 38 7,277 268
Osaka Hino Motor Ltd. (Nishiyodogawa-ku, Osaka-shi, Osaka)
Sales Sales facilities 1,376 158 5,554[44] 28 56 7,175 393
Chiba Hino Motor Ltd. (Mihama-ku, Chiba-shi, Chiba)
Sales Sales facilities
(Note 3) 1,321 174 4,375[56] 23 26 5,921 271
Kobe Hino Motor Ltd.(Higashinada-ku, Kobe-shi, Hyogo)
Sales Sales facilities
(Note 3) 1,246 74 2,563[28] 27 32 3,944 226
(3) Overseas subsidiaries
Book value (¥ Million) Office
name (Address)
Business segment
Facility type/purpose Buildings and
structures Machinery
and equipmentLand
[thousand m2]Leased assets Other Total
Number of employees(persons)
Hino Motors Manufacturing (Thailand) Ltd. (Samut Prakan, Thailand)
Production Truck, bus and
parts production facilities
2,943 8,382 2,734[362] - 246 14,307 1,435
Hino Motors Manufacturing U.S.A. Inc. (Michigan, U.S.A.)
Production Truck and parts
production facilities
137 2,069 - 15,773 60 18,040 634
Notes: 1. Book values in the “Others” column refer to the total for tools, fixtures and furnishings and leased assets, and do not include construction in
progress.
2. Figures in <brackets> in the “Land” column refer to leased assets to non-consplidated companies.
3. Part of land and buildings are leased. The land leased from non-consolidated companies is 65,000 square meters in area and the annual rents of
land and buildings are ¥375 million.
4. There were no principal facilities that were not in operation as of March 31, 2009.
(Translation) Hino Motors, Ltd. (E02146) Securities Report for the Fiscal Year Ended March 31, 2009
- 20 -
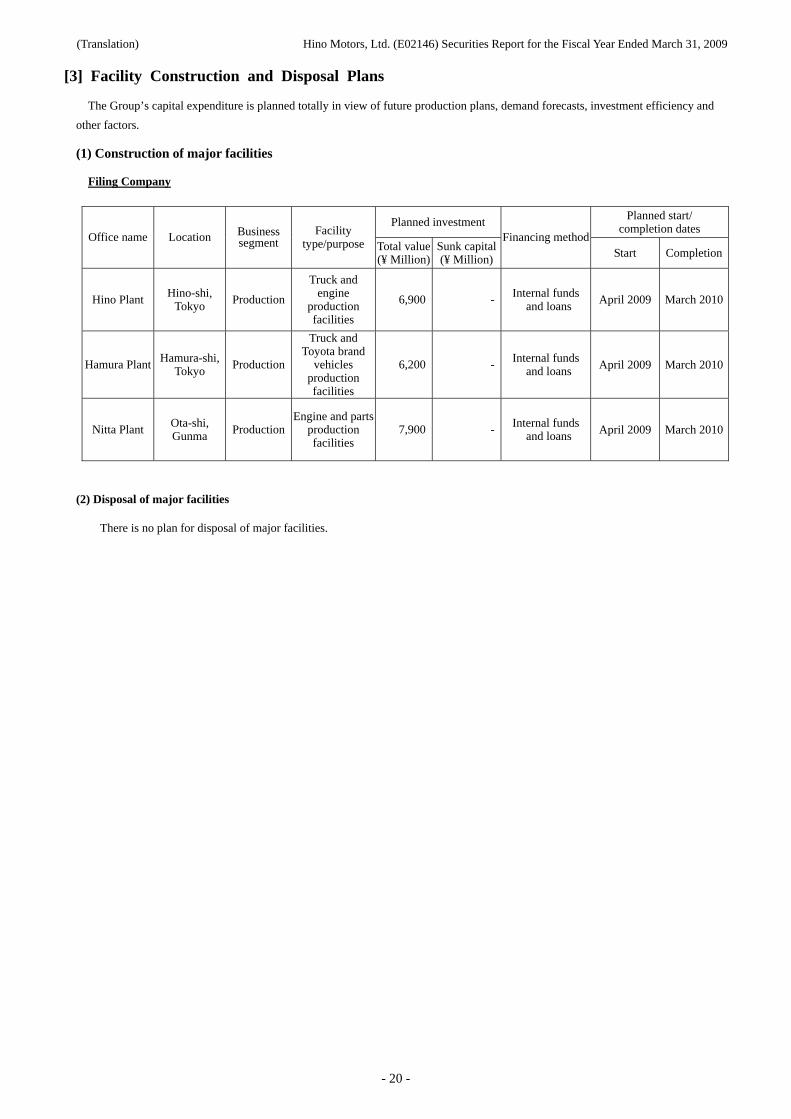
[3] Facility Construction and Disposal Plans
The Group’s capital expenditure is planned totally in view of future production plans, demand forecasts, investment efficiency and
other factors.
(1) Construction of major facilities
Filing Company
Planned investment Planned start/ completion dates
Office name Location Business segment
Facility type/purpose Total value
(¥ Million)Sunk capital (¥ Million)
Financing method Start Completion
Hino Plant Hino-shi, Tokyo
Production
Truck and engine
production facilities
6,900 - Internal funds and loans
April 2009 March 2010
Hamura Plant Hamura-shi, Tokyo
Production
Truck and Toyota brand
vehicles production facilities
6,200 - Internal funds and loans April 2009 March 2010
Nitta Plant Ota-shi, Gunma Production
Engine and partsproduction facilities
7,900 - Internal funds and loans April 2009 March 2010
(2) Disposal of major facilities
There is no plan for disposal of major facilities.
(Translation) Hino Motors, Ltd. (E02146) Securities Report for the Fiscal Year Ended March 31, 2009
- 21 -
Section 4. Information on the Filing Company
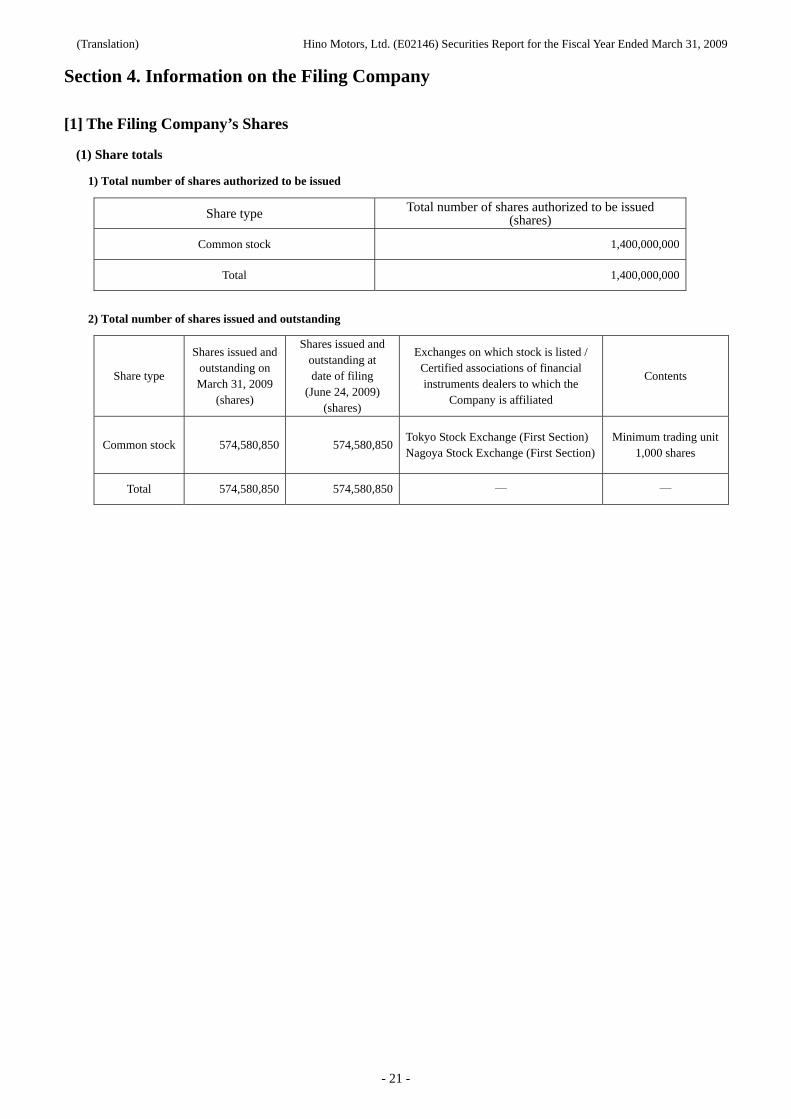
[1] The Filing Company’s Shares
(1) Share totals
1) Total number of shares authorized to be issued
Share type Total number of shares authorized to be issued (shares)
Common stock 1,400,000,000
Total 1,400,000,000
2) Total number of shares issued and outstanding
Share type
Shares issued and outstanding on March 31, 2009
(shares)
Shares issued and outstanding at date of filing
(June 24, 2009) (shares)
Exchanges on which stock is listed / Certified associations of financial instruments dealers to which the
Company is affiliated
Contents
Common stock 574,580,850 574,580,850Tokyo Stock Exchange (First Section) Nagoya Stock Exchange (First Section)
Minimum trading unit1,000 shares
Total 574,580,850 574,580,850 ― ―
(Translation) Hino Motors, Ltd. (E02146) Securities Report for the Fiscal Year Ended March 31, 2009
- 22 -
(2) Stock acquisition rights
The Company has granted the stock acquisition rights detailed below in line with the Companies Act.
Resolution at the ordinary general shareholders’ meeting on July 25, 2008
The year ended March 31, 2009
As of March 31, 2009
Stock acquisition rights outstanding at the last month-end prior to filing this
report (May 31, 2009) Number of stock acquisition rights to be granted
1,242 Same as on the left
Of the above, number of acquisition rights on treasury stock
– –
Class of stock acquisition rights to be issued or acquired upon exercise
Common stock of the Company Same as on the left
Number of the Company’s shares to be issued or acquired upon exercise of the stock acquisition rights
1,242,000 shares Same as on the left
Amount to be paid upon exercise of the stock acquisition rights
¥571 Same as on the left
Exercise period August 1, 2010 – July 31, 2016 Same as on the left
Issue price: ¥571
Issue price and amount to be increased in common stock on which the Company’s shares are issued for exercise of the stock acquisition rights
In accordance with Article 40 Paragraph 1 of the Corporation Accounting Regulation, stock acquisition rights shall be half of the maximum amount of paid-in capital increase and others, and fraction less than one (1) yen arising therefrom shall be rounded up to the nearest one (1) yen.
Same as on the left
Conditions for exercising the stock acquisition rights
1. Each stock acquisition right may not be partially
exercised. 2. Stock acquisition rights holders are required to be
in positions as directors, executive officers, employees or the like of the Company until the end of the ordinary general shareholders’ meeting for the previous fiscal year within two years after the ordinary general shareholders’ meeting held on June 25, 2008.
3. Stock acquisition rights holders may exercise their stock acquisition rights only for two years after they lose their positions as directors, executive officers, employees or the like of the Company, provided, however, that stock acquisition rights holders shall immediately forfeit their stock acquisition rights when they lose their positions due to voluntary retirement or dismissal.
4. No stock acquisition rights may be inherited. 5. Other conditions for the exercise of the stock
acquisition rights shall be subject to the agreement between stock acquisition rights holders and the Company pursuant to the resolutions at the ordinary general shareholders’ meeting and the board of directors meeting held on June 25, 2008.
Same as on the left
Matters relating to transfer of stock acquisition rights
Transfer of stock acquisition rights shall be subject to approval of the board of directors.
Same as on the left
Matters relating to payment by property other than money
– –
Matters relating to delivery of stock acquisition rights in case of corporate restructuring
– –
Note: No issuance of new shares is planned as the board of directors of the Company resolved at its meeting held on October 29, 2008 to repurchase
1,300,000 shares of the Company as substitute treasury shares to be used for stock options. As of the filing date (June 24, 2009), the repurchase
pursuant to the said resolution is completed.
(Translation) Hino Motors, Ltd. (E02146) Securities Report for the Fiscal Year Ended March 31, 2009
- 23 -
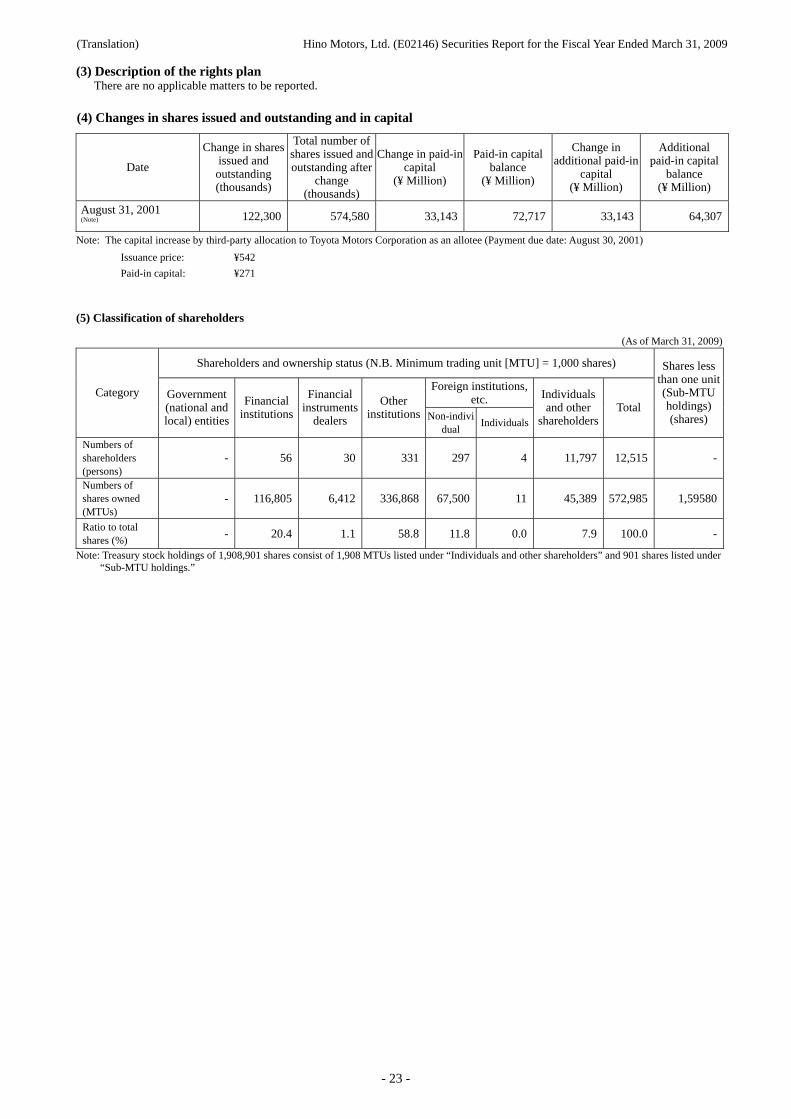
(3) Description of the rights plan There are no applicable matters to be reported.
(4) Changes in shares issued and outstanding and in capital
Date
Change in shares issued and outstanding (thousands)
Total number of shares issued and outstanding after
change (thousands)
Change in paid-in capital
(¥ Million)
Paid-in capital balance
(¥ Million)
Change in additional paid-in
capital (¥ Million)
Additional paid-in capital
balance (¥ Million)
August 31, 2001 (Note) 122,300 574,580 33,143 72,717 33,143 64,307
Note: The capital increase by third-party allocation to Toyota Motors Corporation as an allotee (Payment due date: August 30, 2001)
Issuance price: ¥542
Paid-in capital: ¥271
(5) Classification of shareholders
(As of March 31, 2009)
Shareholders and ownership status (N.B. Minimum trading unit [MTU] = 1,000 shares)
Foreign institutions, etc.
Category Government (national and local) entities
Financial institutions
Financial instruments
dealers
Other institutions Non-indivi
dual Individuals
Individuals and other
shareholders Total
Shares less than one unit (Sub-MTU holdings) (shares)
Numbers of shareholders (persons)
- 56 30 331 297 4 11,797 12,515 -
Numbers of shares owned (MTUs)
- 116,805 6,412 336,868 67,500 11 45,389 572,985 1,59580
Ratio to total shares (%)
- 20.4 1.1 58.8 11.8 0.0 7.9 100.0 -
Note: Treasury stock holdings of 1,908,901 shares consist of 1,908 MTUs listed under “Individuals and other shareholders” and 901 shares listed under “Sub-MTU holdings.”
(Translation) Hino Motors, Ltd. (E02146) Securities Report for the Fiscal Year Ended March 31, 2009
- 24 -
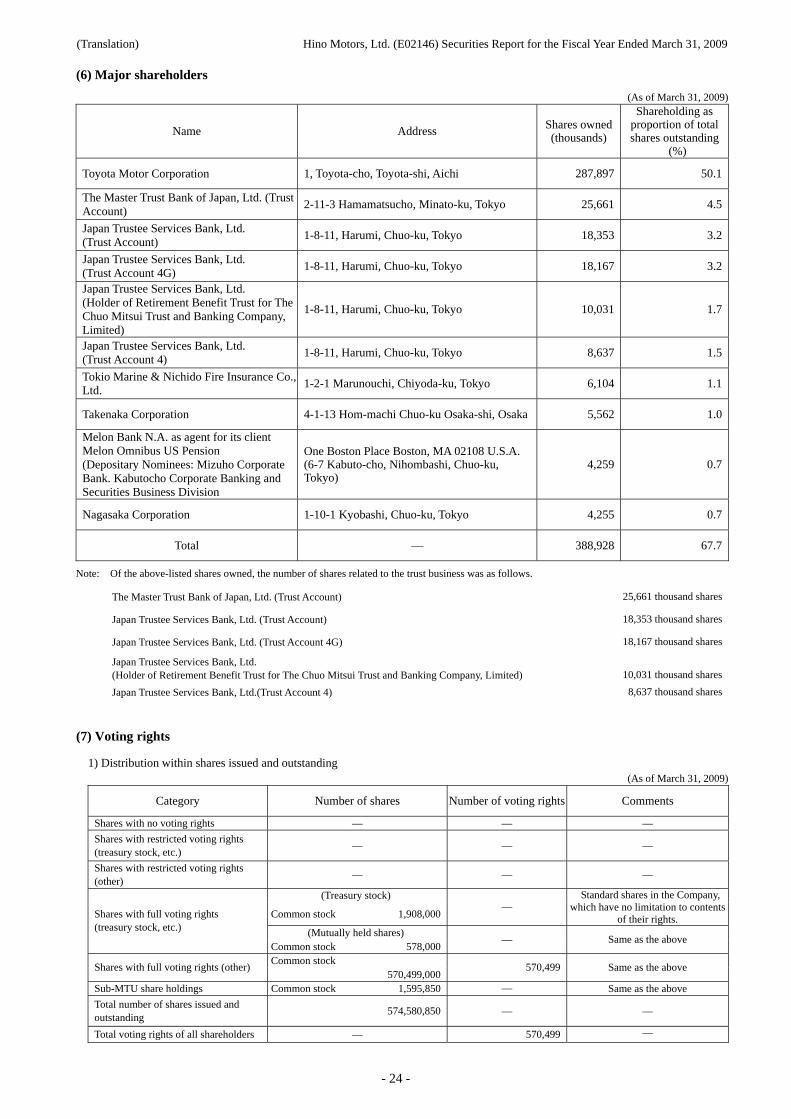
(6) Major shareholders
(As of March 31, 2009)
Name Address Shares owned (thousands)
Shareholding as proportion of total shares outstanding
(%)
Toyota Motor Corporation 1, Toyota-cho, Toyota-shi, Aichi 287,897 50.1
The Master Trust Bank of Japan, Ltd. (Trust Account)
2-11-3 Hamamatsucho, Minato-ku, Tokyo 25,661 4.5
Japan Trustee Services Bank, Ltd. (Trust Account)
1-8-11, Harumi, Chuo-ku, Tokyo 18,353 3.2
Japan Trustee Services Bank, Ltd. (Trust Account 4G)
1-8-11, Harumi, Chuo-ku, Tokyo 18,167 3.2
Japan Trustee Services Bank, Ltd. (Holder of Retirement Benefit Trust for The Chuo Mitsui Trust and Banking Company, Limited)
1-8-11, Harumi, Chuo-ku, Tokyo 10,031 1.7
Japan Trustee Services Bank, Ltd. (Trust Account 4)
1-8-11, Harumi, Chuo-ku, Tokyo 8,637 1.5
Tokio Marine & Nichido Fire Insurance Co., Ltd.
1-2-1 Marunouchi, Chiyoda-ku, Tokyo 6,104 1.1
Takenaka Corporation 4-1-13 Hom-machi Chuo-ku Osaka-shi, Osaka 5,562 1.0
Melon Bank N.A. as agent for its client Melon Omnibus US Pension (Depositary Nominees: Mizuho Corporate Bank. Kabutocho Corporate Banking and Securities Business Division
One Boston Place Boston, MA 02108 U.S.A. (6-7 Kabuto-cho, Nihombashi, Chuo-ku, Tokyo)
4,259 0.7
Nagasaka Corporation 1-10-1 Kyobashi, Chuo-ku, Tokyo 4,255 0.7
Total — 388,928 67.7
Note: Of the above-listed shares owned, the number of shares related to the trust business was as follows.
The Master Trust Bank of Japan, Ltd. (Trust Account) 25,661 thousand shares
Japan Trustee Services Bank, Ltd. (Trust Account) 18,353 thousand shares
Japan Trustee Services Bank, Ltd. (Trust Account 4G) 18,167 thousand shares
Japan Trustee Services Bank, Ltd. (Holder of Retirement Benefit Trust for The Chuo Mitsui Trust and Banking Company, Limited) 10,031 thousand shares
Japan Trustee Services Bank, Ltd.(Trust Account 4) 8,637 thousand shares
(7) Voting rights
1) Distribution within shares issued and outstanding (As of March 31, 2009)
Category Number of shares Number of voting rights Comments
Shares with no voting rights — — —
Shares with restricted voting rights (treasury stock, etc.)
— — —
Shares with restricted voting rights (other)
— — —
(Treasury stock)
Common stock 1,908,000—
Standard shares in the Company, which have no limitation to contents
of their rights. (Mutually held shares)
Shares with full voting rights (treasury stock, etc.)
Common stock 578,000— Same as the above
Common stock Shares with full voting rights (other)
570,499,000570,499 Same as the above
Sub-MTU share holdings Common stock 1,595,850 — Same as the above
Total number of shares issued and outstanding
574,580,850 — —
Total voting rights of all shareholders — 570,499 —
(Translation) Hino Motors, Ltd. (E02146) Securities Report for the Fiscal Year Ended March 31, 2009
- 25 -
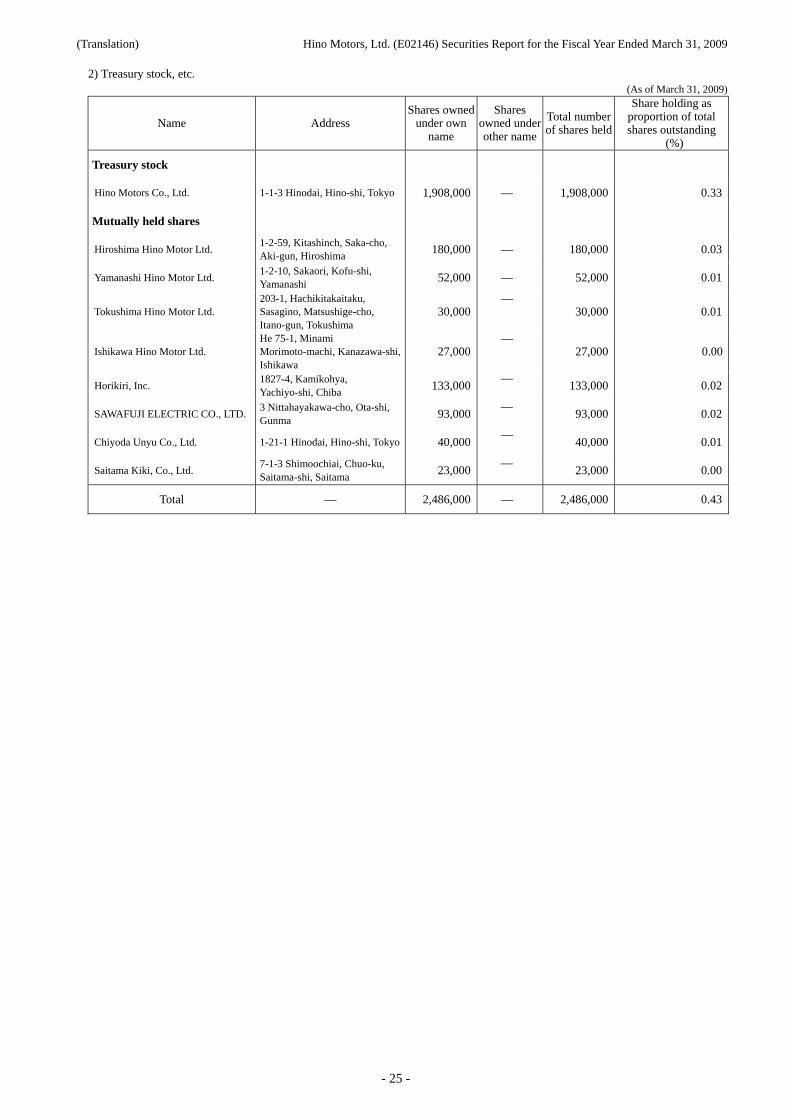
2) Treasury stock, etc. (As of March 31, 2009)
Name Address Shares owned
under own name
Shares owned under other name
Total number of shares held
Share holding as proportion of total shares outstanding
(%)
Treasury stock
Hino Motors Co., Ltd. 1-1-3 Hinodai, Hino-shi, Tokyo 1,908,000 — 1,908,000 0.33
Mutually held shares
Hiroshima Hino Motor Ltd. 1-2-59, Kitashinch, Saka-cho, Aki-gun, Hiroshima
180,000 — 180,000 0.03
Yamanashi Hino Motor Ltd. 1-2-10, Sakaori, Kofu-shi, Yamanashi
52,000 — 52,000 0.01
Tokushima Hino Motor Ltd. 203-1, Hachikitakaitaku, Sasagino, Matsushige-cho, Itano-gun, Tokushima
30,000—
30,000 0.01
Ishikawa Hino Motor Ltd. He 75-1, Minami Morimoto-machi, Kanazawa-shi, Ishikawa
27,000—
27,000 0.00
Horikiri, Inc. 1827-4, Kamikohya, Yachiyo-shi, Chiba
133,000—
133,000 0.02
SAWAFUJI ELECTRIC CO., LTD. 3 Nittahayakawa-cho, Ota-shi, Gunma
93,000—
93,000 0.02
Chiyoda Unyu Co., Ltd. 1-21-1 Hinodai, Hino-shi, Tokyo 40,000—
40,000 0.01
Saitama Kiki, Co., Ltd. 7-1-3 Shimoochiai, Chuo-ku, Saitama-shi, Saitama
23,000—
23,000 0.00
Total — 2,486,000 — 2,486,000 0.43
(Translation) Hino Motors, Ltd. (E02146) Securities Report for the Fiscal Year Ended March 31, 2009
- 26 -
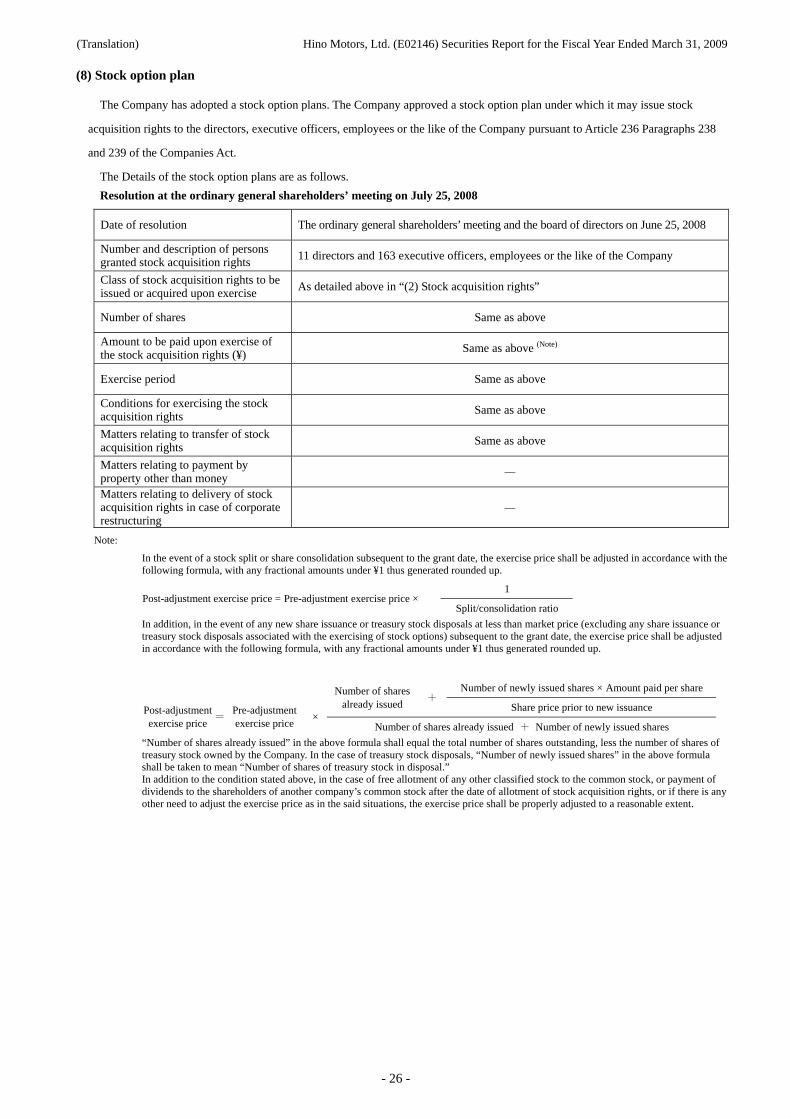
(8) Stock option plan
The Company has adopted a stock option plans. The Company approved a stock option plan under which it may issue stock
acquisition rights to the directors, executive officers, employees or the like of the Company pursuant to Article 236 Paragraphs 238
and 239 of the Companies Act.
The Details of the stock option plans are as follows.
Resolution at the ordinary general shareholders’ meeting on July 25, 2008
Date of resolution The ordinary general shareholders’ meeting and the board of directors on June 25, 2008
Number and description of persons granted stock acquisition rights
11 directors and 163 executive officers, employees or the like of the Company
Class of stock acquisition rights to be issued or acquired upon exercise
As detailed above in “(2) Stock acquisition rights”
Number of shares Same as above
Amount to be paid upon exercise of the stock acquisition rights (¥)
Same as above (Note)
Exercise period Same as above
Conditions for exercising the stock acquisition rights Same as above
Matters relating to transfer of stock acquisition rights
Same as above
Matters relating to payment by property other than money
—
Matters relating to delivery of stock acquisition rights in case of corporate restructuring
—
Note:
In the event of a stock split or share consolidation subsequent to the grant date, the exercise price shall be adjusted in accordance with the following formula, with any fractional amounts under ¥1 thus generated rounded up.
1 Post-adjustment exercise price = Pre-adjustment exercise price ×
Split/consolidation ratio
In addition, in the event of any new share issuance or treasury stock disposals at less than market price (excluding any share issuance or treasury stock disposals associated with the exercising of stock options) subsequent to the grant date, the exercise price shall be adjusted in accordance with the following formula, with any fractional amounts under ¥1 thus generated rounded up.
Number of newly issued shares × Amount paid per share Number of shares already issued
+Share price prior to new issuance Post-adjustment
exercise price =
Pre-adjustment exercise price
× Number of shares already issued + Number of newly issued shares
“Number of shares already issued” in the above formula shall equal the total number of shares outstanding, less the number of shares of treasury stock owned by the Company. In the case of treasury stock disposals, “Number of newly issued shares” in the above formula shall be taken to mean “Number of shares of treasury stock in disposal.” In addition to the condition stated above, in the case of free allotment of any other classified stock to the common stock, or payment of dividends to the shareholders of another company’s common stock after the date of allotment of stock acquisition rights, or if there is any other need to adjust the exercise price as in the said situations, the exercise price shall be properly adjusted to a reasonable extent.
(Translation) Hino Motors, Ltd. (E02146) Securities Report for the Fiscal Year Ended March 31, 2009
- 27 -
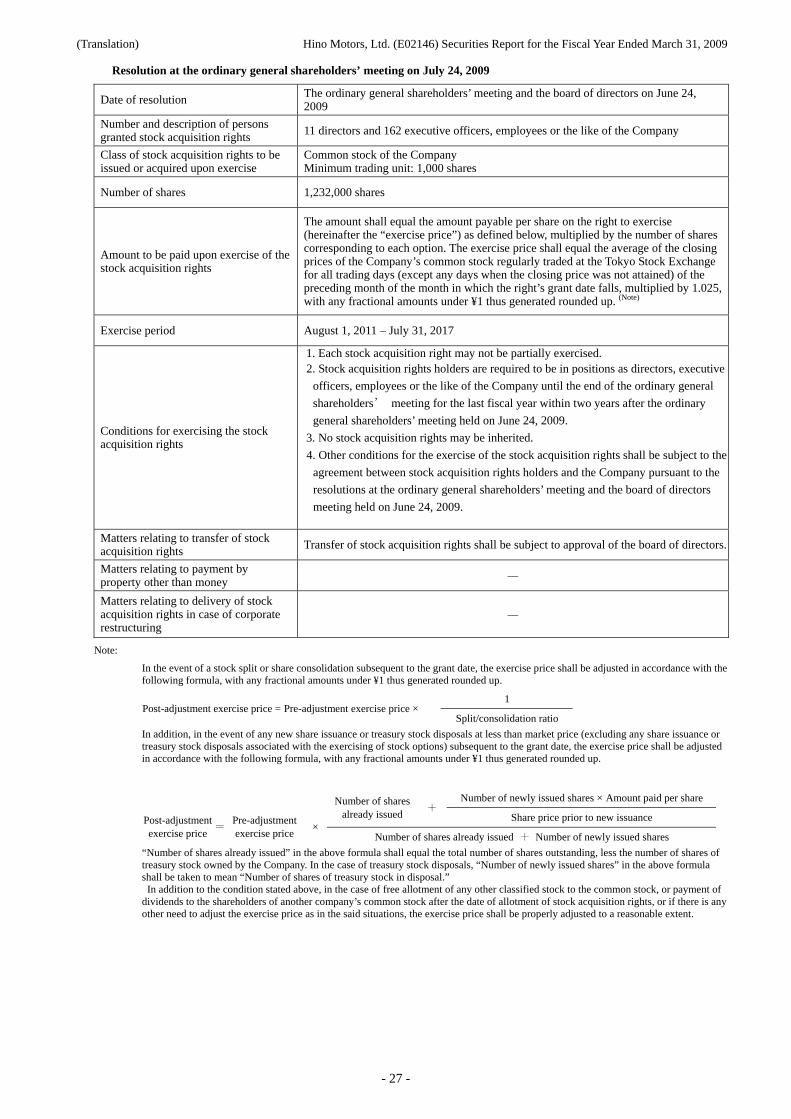
Resolution at the ordinary general shareholders’ meeting on July 24, 2009
Date of resolution The ordinary general shareholders’ meeting and the board of directors on June 24, 2009
Number and description of persons granted stock acquisition rights 11 directors and 162 executive officers, employees or the like of the Company
Class of stock acquisition rights to be issued or acquired upon exercise
Common stock of the Company Minimum trading unit: 1,000 shares
Number of shares 1,232,000 shares
Amount to be paid upon exercise of the stock acquisition rights
The amount shall equal the amount payable per share on the right to exercise (hereinafter the “exercise price”) as defined below, multiplied by the number of shares corresponding to each option. The exercise price shall equal the average of the closing prices of the Company’s common stock regularly traded at the Tokyo Stock Exchange for all trading days (except any days when the closing price was not attained) of the preceding month of the month in which the right’s grant date falls, multiplied by 1.025, with any fractional amounts under ¥1 thus generated rounded up. (Note)
Exercise period August 1, 2011 – July 31, 2017
Conditions for exercising the stock acquisition rights
1. Each stock acquisition right may not be partially exercised. 2. Stock acquisition rights holders are required to be in positions as directors, executive
officers, employees or the like of the Company until the end of the ordinary general
shareholders’ meeting for the last fiscal year within two years after the ordinary
general shareholders’ meeting held on June 24, 2009.
3. No stock acquisition rights may be inherited.
4. Other conditions for the exercise of the stock acquisition rights shall be subject to the
agreement between stock acquisition rights holders and the Company pursuant to the
resolutions at the ordinary general shareholders’ meeting and the board of directors
meeting held on June 24, 2009.
Matters relating to transfer of stock acquisition rights Transfer of stock acquisition rights shall be subject to approval of the board of directors.
Matters relating to payment by property other than money
—
Matters relating to delivery of stock acquisition rights in case of corporate restructuring
—
Note:
In the event of a stock split or share consolidation subsequent to the grant date, the exercise price shall be adjusted in accordance with the following formula, with any fractional amounts under ¥1 thus generated rounded up.
1 Post-adjustment exercise price = Pre-adjustment exercise price ×
Split/consolidation ratio
In addition, in the event of any new share issuance or treasury stock disposals at less than market price (excluding any share issuance or treasury stock disposals associated with the exercising of stock options) subsequent to the grant date, the exercise price shall be adjusted in accordance with the following formula, with any fractional amounts under ¥1 thus generated rounded up.
Number of newly issued shares × Amount paid per share Number of shares already issued
+Share price prior to new issuance Post-adjustment
exercise price =
Pre-adjustment exercise price
× Number of shares already issued + Number of newly issued shares
“Number of shares already issued” in the above formula shall equal the total number of shares outstanding, less the number of shares of treasury stock owned by the Company. In the case of treasury stock disposals, “Number of newly issued shares” in the above formula shall be taken to mean “Number of shares of treasury stock in disposal.” In addition to the condition stated above, in the case of free allotment of any other classified stock to the common stock, or payment of dividends to the shareholders of another company’s common stock after the date of allotment of stock acquisition rights, or if there is any other need to adjust the exercise price as in the said situations, the exercise price shall be properly adjusted to a reasonable extent.
(Translation) Hino Motors, Ltd. (E02146) Securities Report for the Fiscal Year Ended March 31, 2009
- 28 -
[2] Acquisitions of Treasury Stock [Class of shares, etc.] Acquisitions of common stock according to Article 155 Paragraphs 3 and 7 of the Companies Act
(1) Stock acquisitions by resolution of the ordinary general shareholders’ meeting
Item Number of shares Total value (¥)
Content of the resolution at the ordinary general shareholders’ meeting on June 25, 2008 (Acquisition period: June 26, 2008 to June 25, 2009)
1,300,000 1,200,000,000
Treasury stock acquired prior to the year ended March 2009 — —
Treasury stock acquired in the year ended March 2009 1,300,000 323,568,000
Shares for which the resolved acquisition has not been exercised — 876,432,000
Rate of the shares for which the resolved acquisition has not been exercised at the end of the year ended March 2009 (%)
— 73.0
Treasury stock acquired during the acquisition period — —
Rate of the shares for which the resolved acquisition has not been exercised as of the date of filing of the original Japanese version of this report (%)
— 73.0
(2) Stock acquisitions by resolution of the board of directors
There are no applicable matters to be reported.
(3) Stock acquisitions not based on resolutions of the ordinary general shareholders’ meeting or the board of
directors
Item Number of shares Total value (¥)
Treasury stock acquired in the year ended March 2009 49,830 22,930,689
Treasury stock acquired during the acquisition period 5,166 1,364,185
Note: The treasury stock acquired during the period does not include shares acquired by purchasing sub-MTU shares during the period from June 1, 2008, to the date of filing the original Japanese version of this report.
(4) Disposals or holdings of acquired treasury stock
The year ended March 2009 Current term Item
Number of shares
Total value of disposals (¥)
Number of shares
Total value of disposals (¥)
Shares of acquired treasury stock that went on offer — — — —
Treasury stock retired — — — —
Shares of acquired treasury stock involved in transfers accompanying merger, share exchange or company split
— — — —
Other (— )
— — — —
Shares of treasury stock held 1,908,901 — 1,914,067 —
Note: The number of shares of treasury stock held during the current term does not reflect increases or decreases as a result of the purchase of sub-MTU share holdings between June 1, 2009 and the filing of the original Japanese version of this report.
(Translation) Hino Motors, Ltd. (E02146) Securities Report for the Fiscal Year Ended March 31, 2009
- 29 -
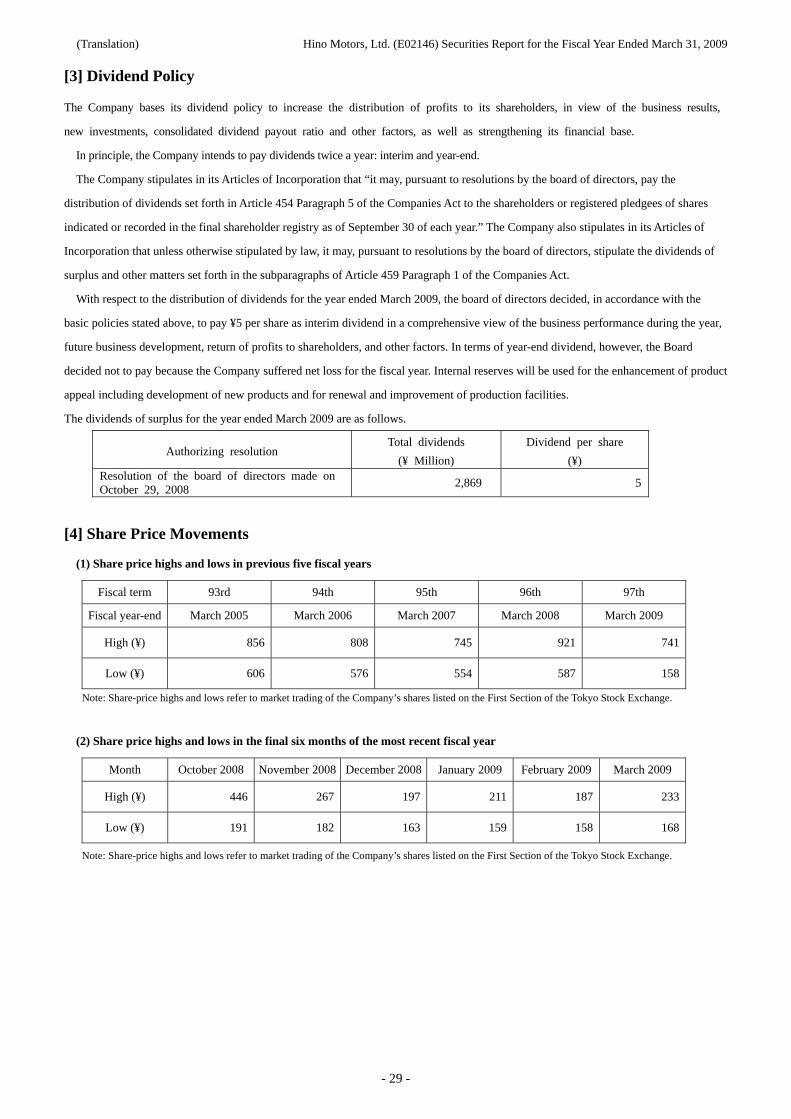
[3] Dividend Policy
The Company bases its dividend policy to increase the distribution of profits to its shareholders, in view of the business results,
new investments, consolidated dividend payout ratio and other factors, as well as strengthening its financial base.
In principle, the Company intends to pay dividends twice a year: interim and year-end.
The Company stipulates in its Articles of Incorporation that “it may, pursuant to resolutions by the board of directors, pay the
distribution of dividends set forth in Article 454 Paragraph 5 of the Companies Act to the shareholders or registered pledgees of shares
indicated or recorded in the final shareholder registry as of September 30 of each year.” The Company also stipulates in its Articles of
Incorporation that unless otherwise stipulated by law, it may, pursuant to resolutions by the board of directors, stipulate the dividends of
surplus and other matters set forth in the subparagraphs of Article 459 Paragraph 1 of the Companies Act.
With respect to the distribution of dividends for the year ended March 2009, the board of directors decided, in accordance with the
basic policies stated above, to pay ¥5 per share as interim dividend in a comprehensive view of the business performance during the year,
future business development, return of profits to shareholders, and other factors. In terms of year-end dividend, however, the Board
decided not to pay because the Company suffered net loss for the fiscal year. Internal reserves will be used for the enhancement of product
appeal including development of new products and for renewal and improvement of production facilities.
The dividends of surplus for the year ended March 2009 are as follows.
Authorizing resolution Total dividends
(¥ Million)
Dividend per share
(¥) Resolution of the board of directors made on October 29, 2008
2,869 5
[4] Share Price Movements
(1) Share price highs and lows in previous five fiscal years
Fiscal term 93rd 94th 95th 96th 97th
Fiscal year-end March 2005 March 2006 March 2007 March 2008 March 2009
High (¥) 856 808 745 921 741
Low (¥) 606 576 554 587 158
Note: Share-price highs and lows refer to market trading of the Company’s shares listed on the First Section of the Tokyo Stock Exchange.
(2) Share price highs and lows in the final six months of the most recent fiscal year
Month October 2008 November 2008 December 2008 January 2009 February 2009 March 2009
High (¥) 446 267 197 211 187 233
Low (¥) 191 182 163 159 158 168
Note: Share-price highs and lows refer to market trading of the Company’s shares listed on the First Section of the Tokyo Stock Exchange.
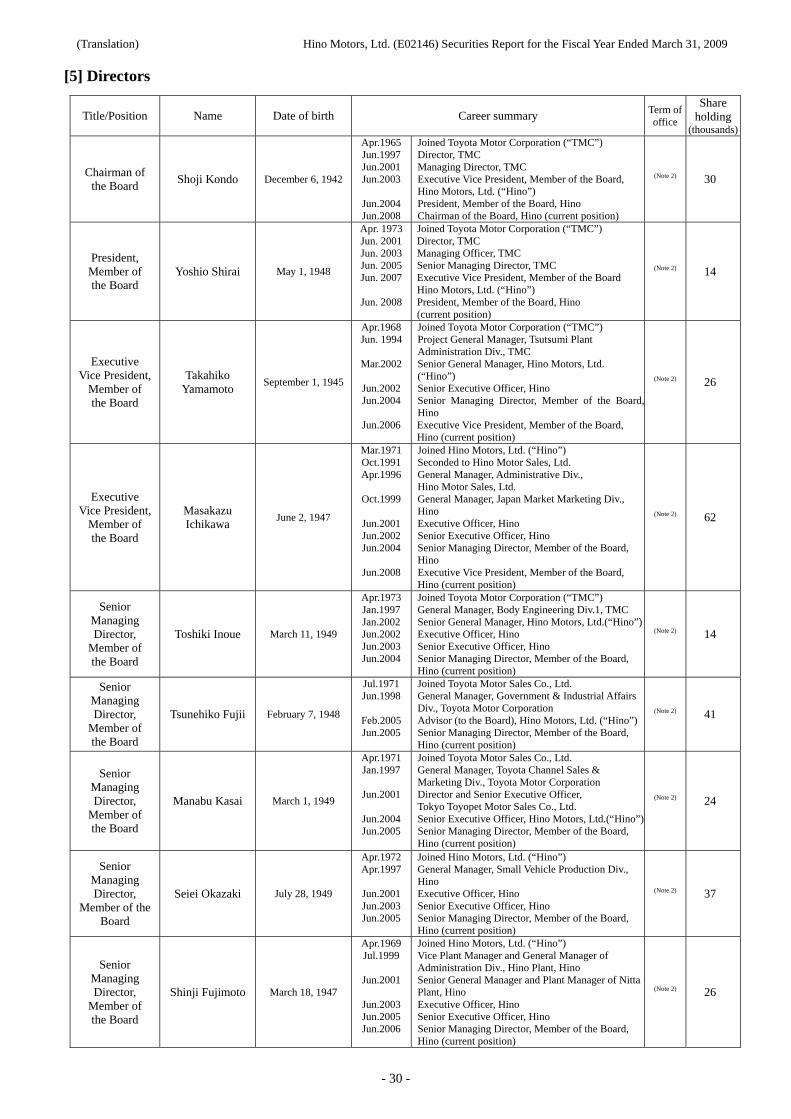
(Translation) Hino Motors, Ltd. (E02146) Securities Report for the Fiscal Year Ended March 31, 2009
- 30 -
[5] Directors
Title/Position Name Date of birth Career summary Term of office
Share holding
(thousands)
Chairman of the Board
Shoji Kondo December 6, 1942
Apr.1965Jun.1997Jun.2001Jun.2003
Jun.2004Jun.2008
Joined Toyota Motor Corporation (“TMC”) Director, TMC Managing Director, TMC Executive Vice President, Member of the Board, Hino Motors, Ltd. (“Hino”) President, Member of the Board, Hino Chairman of the Board, Hino (current position)
(Note 2) 30
President, Member of the Board
Yoshio Shirai May 1, 1948
Apr. 1973Jun. 2001Jun. 2003Jun. 2005Jun. 2007
Jun. 2008
Joined Toyota Motor Corporation (“TMC”) Director, TMC Managing Officer, TMC Senior Managing Director, TMC Executive Vice President, Member of the Board Hino Motors, Ltd. (“Hino”) President, Member of the Board, Hino (current position)
(Note 2) 14
Executive Vice President,
Member of the Board
Takahiko Yamamoto
September 1, 1945
Apr.1968Jun. 1994
Mar.2002
Jun.2002Jun.2004
Jun.2006
Joined Toyota Motor Corporation (“TMC”) Project General Manager, Tsutsumi Plant Administration Div., TMC Senior General Manager, Hino Motors, Ltd. (“Hino”) Senior Executive Officer, Hino Senior Managing Director, Member of the Board, Hino Executive Vice President, Member of the Board, Hino (current position)
(Note 2) 26
Executive Vice President,
Member of the Board
Masakazu Ichikawa
June 2, 1947
Mar.1971Oct.1991 Apr.1996
Oct.1999
Jun.2001Jun.2002Jun.2004
Jun.2008
Joined Hino Motors, Ltd. (“Hino”) Seconded to Hino Motor Sales, Ltd. General Manager, Administrative Div., Hino Motor Sales, Ltd. General Manager, Japan Market Marketing Div., Hino Executive Officer, Hino Senior Executive Officer, Hino Senior Managing Director, Member of the Board, Hino Executive Vice President, Member of the Board, Hino (current position)
(Note 2) 62
Senior Managing Director,
Member of the Board
Toshiki Inoue March 11, 1949
Apr.1973Jan.1997 Jan.2002 Jun.2002Jun.2003Jun.2004
Joined Toyota Motor Corporation (“TMC”) General Manager, Body Engineering Div.1, TMC Senior General Manager, Hino Motors, Ltd.(“Hino”) Executive Officer, Hino Senior Executive Officer, Hino Senior Managing Director, Member of the Board, Hino (current position)
(Note 2) 14
Senior Managing Director,
Member of the Board
Tsunehiko Fujii February 7, 1948
Jul.1971 Jun.1998
Feb.2005Jun.2005
Joined Toyota Motor Sales Co., Ltd. General Manager, Government & Industrial Affairs Div., Toyota Motor Corporation Advisor (to the Board), Hino Motors, Ltd. (“Hino”) Senior Managing Director, Member of the Board, Hino (current position)
(Note 2) 41
Senior Managing Director,
Member of the Board
Manabu Kasai March 1, 1949
Apr.1971Jan.1997
Jun.2001
Jun.2004Jun.2005
Joined Toyota Motor Sales Co., Ltd. General Manager, Toyota Channel Sales & Marketing Div., Toyota Motor Corporation Director and Senior Executive Officer, Tokyo Toyopet Motor Sales Co., Ltd. Senior Executive Officer, Hino Motors, Ltd.(“Hino”) Senior Managing Director, Member of the Board, Hino (current position)
(Note 2) 24
Senior Managing Director,
Member of the Board
Seiei Okazaki July 28, 1949
Apr.1972Apr.1997
Jun.2001Jun.2003Jun.2005
Joined Hino Motors, Ltd. (“Hino”) General Manager, Small Vehicle Production Div., Hino Executive Officer, Hino Senior Executive Officer, Hino Senior Managing Director, Member of the Board, Hino (current position)
(Note 2) 37
Senior Managing Director,
Member of the Board
Shinji Fujimoto March 18, 1947
Apr.1969Jul.1999
Jun.2001
Jun.2003Jun.2005Jun.2006
Joined Hino Motors, Ltd. (“Hino”) Vice Plant Manager and General Manager of Administration Div., Hino Plant, Hino Senior General Manager and Plant Manager of Nitta Plant, Hino Executive Officer, Hino Senior Executive Officer, Hino Senior Managing Director, Member of the Board, Hino (current position)
(Note 2) 26
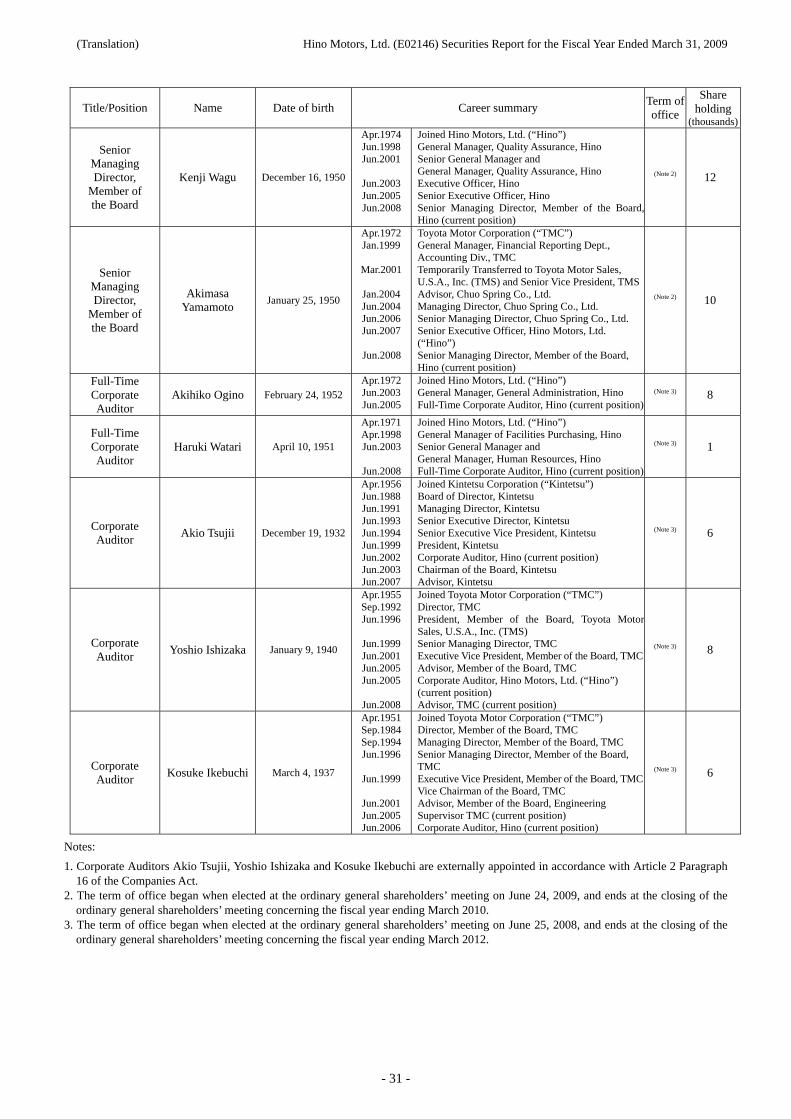
(Translation) Hino Motors, Ltd. (E02146) Securities Report for the Fiscal Year Ended March 31, 2009
- 31 -
Title/Position Name Date of birth Career summary Term of office
Share holding
(thousands)
Senior Managing Director,
Member of the Board
Kenji Wagu December 16, 1950
Apr.1974Jun.1998Jun.2001
Jun.2003Jun.2005Jun.2008
Joined Hino Motors, Ltd. (“Hino”) General Manager, Quality Assurance, Hino Senior General Manager and General Manager, Quality Assurance, Hino Executive Officer, Hino Senior Executive Officer, Hino Senior Managing Director, Member of the Board, Hino (current position)
(Note 2) 12
Senior Managing Director,
Member of the Board
Akimasa Yamamoto
January 25, 1950
Apr.1972Jan.1999
Mar.2001
Jan.2004 Jun.2004Jun.2006Jun.2007 Jun.2008
Toyota Motor Corporation (“TMC”) General Manager, Financial Reporting Dept., Accounting Div., TMC Temporarily Transferred to Toyota Motor Sales, U.S.A., Inc. (TMS) and Senior Vice President, TMS Advisor, Chuo Spring Co., Ltd. Managing Director, Chuo Spring Co., Ltd. Senior Managing Director, Chuo Spring Co., Ltd. Senior Executive Officer, Hino Motors, Ltd. (“Hino”) Senior Managing Director, Member of the Board, Hino (current position)
(Note 2) 10
Full-Time Corporate Auditor
Akihiko Ogino February 24, 1952Apr.1972Jun.2003Jun.2005
Joined Hino Motors, Ltd. (“Hino”) General Manager, General Administration, Hino Full-Time Corporate Auditor, Hino (current position)
(Note 3) 8
Full-Time Corporate Auditor
Haruki Watari April 10, 1951
Apr.1971Apr.1998Jun.2003 Jun.2008
Joined Hino Motors, Ltd. (“Hino”) General Manager of Facilities Purchasing, Hino Senior General Manager and General Manager, Human Resources, Hino Full-Time Corporate Auditor, Hino (current position)
(Note 3) 1
Corporate Auditor
Akio Tsujii December 19, 1932
Apr.1956Jun.1988Jun.1991Jun.1993Jun.1994Jun.1999Jun.2002Jun.2003Jun.2007
Joined Kintetsu Corporation (“Kintetsu”) Board of Director, Kintetsu Managing Director, Kintetsu Senior Executive Director, Kintetsu Senior Executive Vice President, Kintetsu President, Kintetsu Corporate Auditor, Hino (current position) Chairman of the Board, Kintetsu Advisor, Kintetsu
(Note 3) 6
Corporate Auditor
Yoshio Ishizaka January 9, 1940
Apr.1955Sep.1992Jun.1996
Jun.1999Jun.2001Jun.2005Jun.2005
Jun.2008
Joined Toyota Motor Corporation (“TMC”) Director, TMC President, Member of the Board, Toyota Motor Sales, U.S.A., Inc. (TMS) Senior Managing Director, TMC Executive Vice President, Member of the Board, TMC Advisor, Member of the Board, TMC Corporate Auditor, Hino Motors, Ltd. (“Hino”) (current position) Advisor, TMC (current position)
(Note 3) 8
Corporate Auditor
Kosuke Ikebuchi March 4, 1937
Apr.1951Sep.1984Sep.1994Jun.1996
Jun.1999
Jun.2001Jun.2005Jun.2006
Joined Toyota Motor Corporation (“TMC”) Director, Member of the Board, TMC Managing Director, Member of the Board, TMC Senior Managing Director, Member of the Board, TMC Executive Vice President, Member of the Board, TMC Vice Chairman of the Board, TMC Advisor, Member of the Board, Engineering Supervisor TMC (current position) Corporate Auditor, Hino (current position)
(Note 3) 6
Notes:
1. Corporate Auditors Akio Tsujii, Yoshio Ishizaka and Kosuke Ikebuchi are externally appointed in accordance with Article 2 Paragraph 16 of the Companies Act.
2. The term of office began when elected at the ordinary general shareholders’ meeting on June 24, 2009, and ends at the closing of the ordinary general shareholders’ meeting concerning the fiscal year ending March 2010.
3. The term of office began when elected at the ordinary general shareholders’ meeting on June 25, 2008, and ends at the closing of the ordinary general shareholders’ meeting concerning the fiscal year ending March 2012.
(Translation) Hino Motors, Ltd. (E02146) Securities Report for the Fiscal Year Ended March 31, 2009
- 32 -
[6] Corporate Governance
(1) Corporate Governance
The Company, as a corporation which manufactures and markets trucks and buses playing roles in logistics and transportation,
reconsidered its corporate principles in terms of CSR in 2007 and determined its mission, “To make the world a better place to live by
helping people and goods get where they need to go.” In order to accomplish this corporate mission, the Company is working toward
reinforcing the corporate governance to establish good relationships with its shareholders, customers, and stakeholders such as business
partners, global communities, local communities, and employees, and expand as a global corporation.
1) Organizational details
The Company employs an auditor system and sets up the board of directors, corporate auditors, board of corporate auditors, and an
accounting auditor.
The board of directors of the Company consists of 11 directors (the number of persons as of the filing date; the Articles of
Incorporation stipulates that the maximum number of directors should be 15). The board not only determines the conduct of
important affairs but also supervises the execution of the directors’ duties.
Also, the Company institutes the management committee to discuss the management policies of the Company and report
necessary information for management. Furthermore, the Company employs an executive officer system to streamline the board of
directors and facilitate the conduct of affairs.
The board of corporate auditors consists of 5 corporate auditors including 3 outside corporate auditors (the number of persons as
of the filing date).
The corporate auditors work toward communicating with the directors, internal audit department, and other employees, collecting
information, and establishing the audit environments in conformity with the corporate auditor’s audit criteria determined by the
board of corporate auditors, audit policies, and audit plans. In addition, the corporate auditors attend the board of directors’ meeting
and other important meetings, hear the duty execution status from the directors and employees, read important documents of decision,
investigate operation and property statuses through on-site audit to respective business offices and subsidiaries, and audit the duty
execution of the directors.
Furthermore, the corporate auditors inspect whether the accounting auditor maintains an independent stance and performs
adequate audits, receive a report on the duty execution status from the accounting auditor, exchange opinions, and examine business
reports, financial documents and the annexed specifications, and consolidated financial documents.
2) Internal control system and risk management system
In order to keep improving and enhancing corporate governance, the Company bases its internal control system on the concept
that decisions should be made after being thoroughly examined at the abovementioned management supervision of the board of
directors, the board of directors, Management Committee, and other cross-organizational meetings. At our board of directors meeting
in May 2006, the basic policy to ensure proper and appropriate corporate operations was adopted in accordance with the Companies
Act.
In order to create a sound corporate climate of the Company as well as subsidiaries, the Company established the “Hino Code of
Conduct” (the name as of the filing date) which clarifies the attitude and code of conduct for the management personnel and
employees.
Also, in order to establish the corporate ethics and assure thorough compliance, the Company sets up the “Compliance and Risk
Management Committee” (the name as of the filing date) consisting of all the directors and full-time corporate auditors. The
Committee makes discussions about important subjects related to the corporate ethics, compliance, and risk management, and the
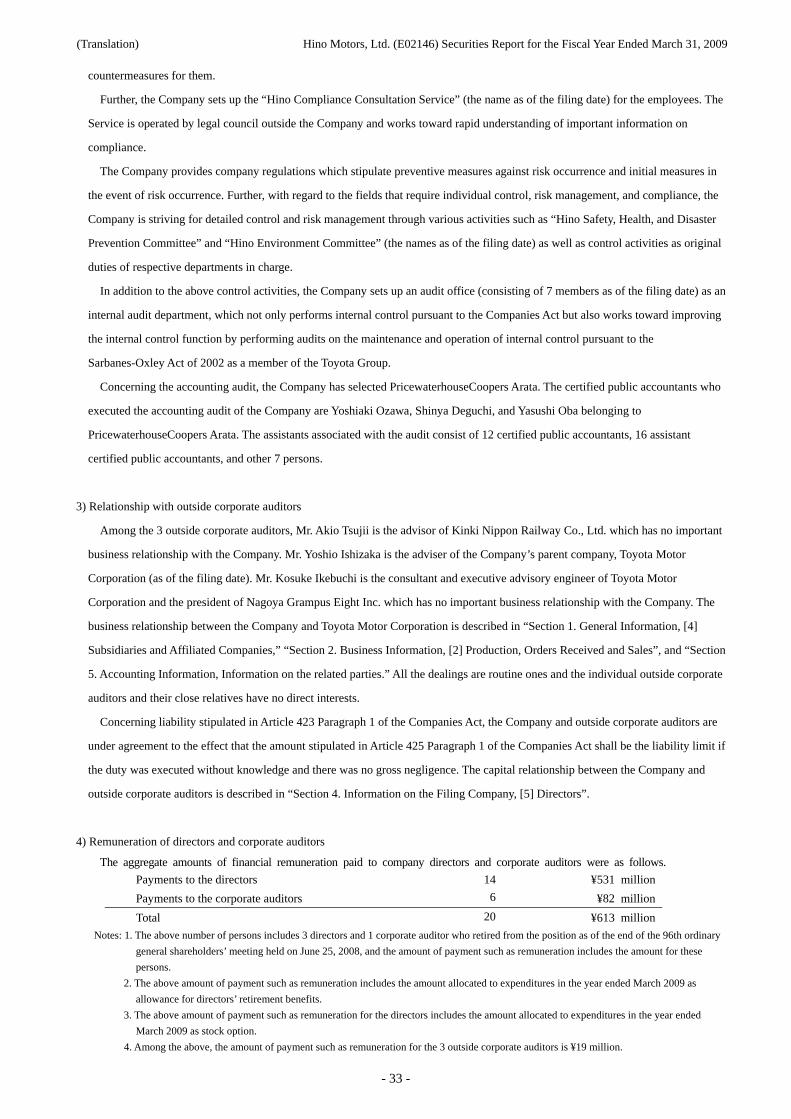
(Translation) Hino Motors, Ltd. (E02146) Securities Report for the Fiscal Year Ended March 31, 2009
- 33 -
countermeasures for them.
Further, the Company sets up the “Hino Compliance Consultation Service” (the name as of the filing date) for the employees. The
Service is operated by legal council outside the Company and works toward rapid understanding of important information on
compliance.
The Company provides company regulations which stipulate preventive measures against risk occurrence and initial measures in
the event of risk occurrence. Further, with regard to the fields that require individual control, risk management, and compliance, the
Company is striving for detailed control and risk management through various activities such as “Hino Safety, Health, and Disaster
Prevention Committee” and “Hino Environment Committee” (the names as of the filing date) as well as control activities as original
duties of respective departments in charge.
In addition to the above control activities, the Company sets up an audit office (consisting of 7 members as of the filing date) as an
internal audit department, which not only performs internal control pursuant to the Companies Act but also works toward improving
the internal control function by performing audits on the maintenance and operation of internal control pursuant to the
Sarbanes-Oxley Act of 2002 as a member of the Toyota Group.
Concerning the accounting audit, the Company has selected PricewaterhouseCoopers Arata. The certified public accountants who
executed the accounting audit of the Company are Yoshiaki Ozawa, Shinya Deguchi, and Yasushi Oba belonging to
PricewaterhouseCoopers Arata. The assistants associated with the audit consist of 12 certified public accountants, 16 assistant
certified public accountants, and other 7 persons.
3) Relationship with outside corporate auditors
Among the 3 outside corporate auditors, Mr. Akio Tsujii is the advisor of Kinki Nippon Railway Co., Ltd. which has no important
business relationship with the Company. Mr. Yoshio Ishizaka is the adviser of the Company’s parent company, Toyota Motor
Corporation (as of the filing date). Mr. Kosuke Ikebuchi is the consultant and executive advisory engineer of Toyota Motor
Corporation and the president of Nagoya Grampus Eight Inc. which has no important business relationship with the Company. The
business relationship between the Company and Toyota Motor Corporation is described in “Section 1. General Information, [4]
Subsidiaries and Affiliated Companies,” “Section 2. Business Information, [2] Production, Orders Received and Sales”, and “Section
5. Accounting Information, Information on the related parties.” All the dealings are routine ones and the individual outside corporate
auditors and their close relatives have no direct interests.
Concerning liability stipulated in Article 423 Paragraph 1 of the Companies Act, the Company and outside corporate auditors are
under agreement to the effect that the amount stipulated in Article 425 Paragraph 1 of the Companies Act shall be the liability limit if
the duty was executed without knowledge and there was no gross negligence. The capital relationship between the Company and
outside corporate auditors is described in “Section 4. Information on the Filing Company, [5] Directors”.
4) Remuneration of directors and corporate auditors
The aggregate amounts of financial remuneration paid to company directors and corporate auditors were as follows.
Payments to the directors 14 ¥531 million
Payments to the corporate auditors 6 ¥82 million
Total 20 ¥613 million
Notes: 1. The above number of persons includes 3 directors and 1 corporate auditor who retired from the position as of the end of the 96th ordinary
general shareholders’ meeting held on June 25, 2008, and the amount of payment such as remuneration includes the amount for these
persons.
2. The above amount of payment such as remuneration includes the amount allocated to expenditures in the year ended March 2009 as
allowance for directors’ retirement benefits.
3. The above amount of payment such as remuneration for the directors includes the amount allocated to expenditures in the year ended
March 2009 as stock option.
4. Among the above, the amount of payment such as remuneration for the 3 outside corporate auditors is ¥19 million.
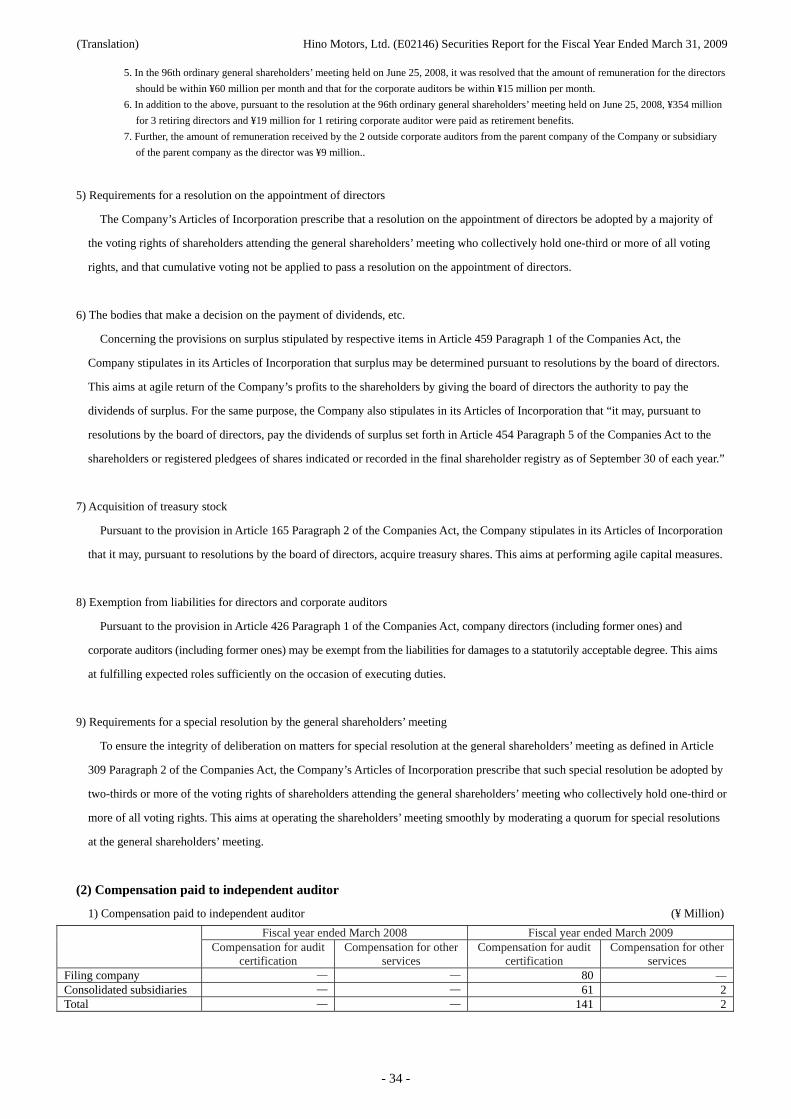
(Translation) Hino Motors, Ltd. (E02146) Securities Report for the Fiscal Year Ended March 31, 2009
- 34 -
5. In the 96th ordinary general shareholders’ meeting held on June 25, 2008, it was resolved that the amount of remuneration for the directors
should be within ¥60 million per month and that for the corporate auditors be within ¥15 million per month.
6. In addition to the above, pursuant to the resolution at the 96th ordinary general shareholders’ meeting held on June 25, 2008, ¥354 million
for 3 retiring directors and ¥19 million for 1 retiring corporate auditor were paid as retirement benefits.
7. Further, the amount of remuneration received by the 2 outside corporate auditors from the parent company of the Company or subsidiary
of the parent company as the director was ¥9 million..
5) Requirements for a resolution on the appointment of directors
The Company’s Articles of Incorporation prescribe that a resolution on the appointment of directors be adopted by a majority of
the voting rights of shareholders attending the general shareholders’ meeting who collectively hold one-third or more of all voting
rights, and that cumulative voting not be applied to pass a resolution on the appointment of directors.
6) The bodies that make a decision on the payment of dividends, etc.
Concerning the provisions on surplus stipulated by respective items in Article 459 Paragraph 1 of the Companies Act, the
Company stipulates in its Articles of Incorporation that surplus may be determined pursuant to resolutions by the board of directors.
This aims at agile return of the Company’s profits to the shareholders by giving the board of directors the authority to pay the
dividends of surplus. For the same purpose, the Company also stipulates in its Articles of Incorporation that “it may, pursuant to
resolutions by the board of directors, pay the dividends of surplus set forth in Article 454 Paragraph 5 of the Companies Act to the
shareholders or registered pledgees of shares indicated or recorded in the final shareholder registry as of September 30 of each year.”
7) Acquisition of treasury stock
Pursuant to the provision in Article 165 Paragraph 2 of the Companies Act, the Company stipulates in its Articles of Incorporation
that it may, pursuant to resolutions by the board of directors, acquire treasury shares. This aims at performing agile capital measures.
8) Exemption from liabilities for directors and corporate auditors
Pursuant to the provision in Article 426 Paragraph 1 of the Companies Act, company directors (including former ones) and
corporate auditors (including former ones) may be exempt from the liabilities for damages to a statutorily acceptable degree. This aims
at fulfilling expected roles sufficiently on the occasion of executing duties.
9) Requirements for a special resolution by the general shareholders’ meeting
To ensure the integrity of deliberation on matters for special resolution at the general shareholders’ meeting as defined in Article
309 Paragraph 2 of the Companies Act, the Company’s Articles of Incorporation prescribe that such special resolution be adopted by
two-thirds or more of the voting rights of shareholders attending the general shareholders’ meeting who collectively hold one-third or
more of all voting rights. This aims at operating the shareholders’ meeting smoothly by moderating a quorum for special resolutions
at the general shareholders’ meeting.
(2) Compensation paid to independent auditor
1) Compensation paid to independent auditor (¥ Million)
Fiscal year ended March 2008 Fiscal year ended March 2009 Compensation for audit
certification Compensation for other
services Compensation for audit
certification Compensation for other
services Filing company — — 80 —
Consolidated subsidiaries — — 61 2Total — — 141 2
(Translation) Hino Motors, Ltd. (E02146) Securities Report for the Fiscal Year Ended March 31, 2009
- 35 -
2) Other significant compensation details
The consolidated subsidiary of the Company, Hino Motors Manufacturing U.S.A. Inc. has paid ¥40 million as remuneration for
audit certification to PricewaterhouseCoopers LLP belonging to the same network as PricewaterhouseCoopers Arata, which is the
auditing certified public accountant of the Company.
Hino Motors Sales U.S.A. Inc., which is also the consolidated subsidiary of the Company, has paid ¥40 million as remuneration
for audit certification to PricewaterhouseCoopers LLP belonging to the same network as PricewaterhouseCoopers Arata, which is
the auditing certified public accountant of the Company.
3) Compensation paid to the accounting auditor for services other than audit work provided to the Company
There are no applicable matters to be reported.
4) Determination of compensation for audit services
There are no applicable matters to be reported.
(Translation) Hino Motors, Ltd. (E02146) Securities Report for the Fiscal Year Ended March 31, 2009
- 36 -
Section 5. Accounting Information [1] Preparation Method for Consolidated and Non-Consolidated Financial Statements
(1) The Company’s consolidated financial statements were prepared in accordance with the “Regulations concerning the terms, forms
and preparation methods for consolidated financial statements” (Ministerial Ordinance No. 28 of Ministry of Finance, enforced in
1976) (hereinafter referred to as the “consolidated accounting rules”).
For the previous fiscal year (from April 1, 2007 to March 31, 2008), the Company’s consolidated financial statements were
prepared in accordance with the pre-revised consolidated accounting rules. For the consolidated fiscal year ended March 31, 2009
(from April 1, 2008 to March 31, 2009), the Company’s consolidated financial statements were prepared in accordance with the
revised consolidated accounting rules.
(2) The Company’s non-consolidated financial statements were prepared in accordance with the “Regulations concerning the terms,
forms and preparation methods for non-consolidated financial statements” (Ministerial Ordinance No. 59 of Ministry of Finance,
enforced in 1963) (hereinafter referred to as the “non-consolidated accounting rules”).
For the previous fiscal year (from April 1, 2007 to March 31, 2008), the Company’s non-consolidated financial statements were
prepared in accordance with the pre-revised non-consolidated accounting rules. For the fiscal year ended March 31, 2009 (from April
1, 2008 to March 31, 2009), the Company’s non-consolidated financial statements in accordance with the revised non-consolidated
accounting rules.
[2] Report of Independent Auditors
Pursuant to Article 193-2 Paragraph 1 of the Financial Instruments and Exchange Act, the Company’s consolidated financial statements
and non-consolidated financial statements during the previous fiscal year (from April 1, 2007 to March 31, 2008) and the consolidated
fiscal year ended March 31, 2009 (from April 1, 2008 to March 31, 2009) have been audited by PricewaterhouseCoopers Arata.
Note: Only the Japanese original of this report has been audited.
(Translation) Hino Motors, Ltd. (E02146) Securities Report for the Fiscal Year Ended March 31, 2009
- 37 -
[1] Consolidated Financial Statements
(1) Consolidated financial statements
1) Consolidated balance sheets
(¥ Million)
FY2008
(As of March 31, 2008) FY2009
(As of March 31, 2009) Assets
Current assets Cash and deposits 29,108 29,725Notes and accounts receivable - trade *3 238,526 *3 149,453Inventories *3 102,565 -
Merchandise and finished goods - *3 61,554Work in progress - *3 22,649Raw materials and supplies - *3 16,634Deferred tax assets 16,716 4,612Others 16,928 21,880Allowance for doubtful accounts (3,729) (3,012)Total current assets 400,115 303,498
Fixed assets Tangible fixed assets
Buildings and structures (net) 106,523 97,139Machinery and transportation equipment (net) 108,866 93,494Tools, furniture and fixtures (net) 14,199 11,954Land 95,409 90,659Lease assets (net) 10,288 18,550Construction in progress 9,520 22,227Assets for rent (net) - 13,072Total tangible fixed assets *2,*3 344,807 *2,*3 347,097
Intangible fixed assets Software 25,217 26,008Lease assets - 64Others 498 625Total intangible fixed assets 25,716 26,698
Investments and other assets Investment securities *1 86,566 *1 61,874Long-term loans receivable 3,571 567Deferred tax assets 2,107 2,602Others *1 17,555 *1 18,380Allowance for doubtful accounts (6,070) (5,528)Total investments and other assets 103,730 77,896
Total fixed assets 474,254 451,693Total assets 874,369 755,192
(Translation) Hino Motors, Ltd. (E02146) Securities Report for the Fiscal Year Ended March 31, 2009
- 38 -
(¥ Million)
FY2008
(As of March 31, 2008) FY2009
(As of March 31, 2009) Liabilities
Current liabilities Notes and accounts payable - trade 195,741 110,272Short-term loans payable *3 114,623 *3 121,585Commercial papers 32,000 79,500Current portion of long-term loans payable *3 23,618 *3 20,762Lease liabilities - 1,746Accounts payable - trade 13,312 15,034Accrued income taxes 9,276 1,725Accrued bonuses 4,526 3,786Accrued directors’ bonuses 503 -
Warranty allowance 10,935 12,095Others 52,444 41,459Total current liabilities 456,983 407,969
Long-term liabilities Long-term loans payable *3 37,630 *3 49,822Lease liabilities - 21,878Deferred tax liabilities 4,761 8,234Deferred tax liabilities for land revaluation *4 3,732 *4 3,732Accrued employees’ retirement benefits 37,090 40,924Accrued directors’ retirement benefits 2,800 2,051Others 22,612 1,637Total long-term liabilities 108,627 128,280
Total liabilities 565,610 536,250Net assets
Shareholders’ equity Common stock 72,717 72,717Additional paid-in capital 64,327 64,327Retained earnings 136,393 69,022Treasury stock (379) (735)Total shareholders’ equity 273,058 205,332
Valuation and translation adjustments
Unrealized gain on available-for-sale securities 21,939 8,202Deferred gain or loss on hedges – (47)Net unrealized gain on land revaluation *4 1,617 *4 1,618Cumulative translation adjustment (5,315) (12,324)Total valuation and translation adjustments 18,241 (2,551)
Stock acquisition rights – 46Minority interests 17,458 16,115Total net assets 308,758 218,942
Total liabilities and net assets 874,369 755,192
(Translation) Hino Motors, Ltd. (E02146) Securities Report for the Fiscal Year Ended March 31, 2009
- 39 -
2) Consolidated statements of income
(¥ Million)
FY2008
(From April 1, 2007 to March 31, 2008)
FY2009 (From April 1, 2008 to March 31, 2009)
Net sales 1,368,633 1,069,488 Cost of sales 1,172,976 945,126 Gross profit on sales 195,656 124,361 Selling, general and administrative expenses
Sales charges 10,235 8,570 Freight charges and storage 12,158 9,609 Provision of warranty allowance 10,935 12,095 Advertisement expenses 3,879 3,188 Salary and benefits 39,365 37,477 Provision of accrued bonuses 2,998 2,591 Provision of accrued directors’ bonuses 503 – Provision of accrued retirement benefits 3,545 3,440 Provision of accrued directors’ retirement benefits 717 578 Rent expenses 6,312 5,436 Provision of allowance for doubtful accounts 788 827 Others 58,326 59,994 Total selling, general and administrative expenses 149,767 143,810
Operating income (loss) 45,889 (19,448)Non-operating income
Interest income 1,793 1,583 Dividends income 1,268 1,294 Rental income 367 365 Investment gain on equity method 871 – Miscellaneous income 1,446 1,743 Total non-operating income 5,747 4,987
Non-operating expenses Interest expenses 5,106 5,005 Loss on foreign exchange 2,972 6,432 Investment loss on equity method – 1,528 Miscellaneous expenses 2,523 3,019 Total non-operating expenses 10,602 15,985
Ordinary income (loss) 41,035 (30,446)Extraordinary income
Gain on sale of fixed assets *1 1,264 *1 55 Gain on sale of investment securities 35 2,688 Others 147 243 Total extraordinary income 1,447 2,988
Extraordinary loss Loss on sale or disposition of fixed assets *2 1,861 *2 1,504 Impairment loss – 940 Loss on valuation of investment securities – 1,038 Loss on revision of retirement benefit plan – 2,822 Provision for directors' retirement benefits for prior periods 2,494 – Others 1,241 1,272 Total extraordinary loss 5,596 7,579
Net income (loss) before income taxes and minority interests 36,885 (35,037)Income taxes 16,789 4,381 Income taxes–deferred (3,713) 21,736 Total income taxes 13,076 26,118 Minority interests income of consolidated subsidiaries 1,629 683 Net income (loss) 22,178 (61,839)
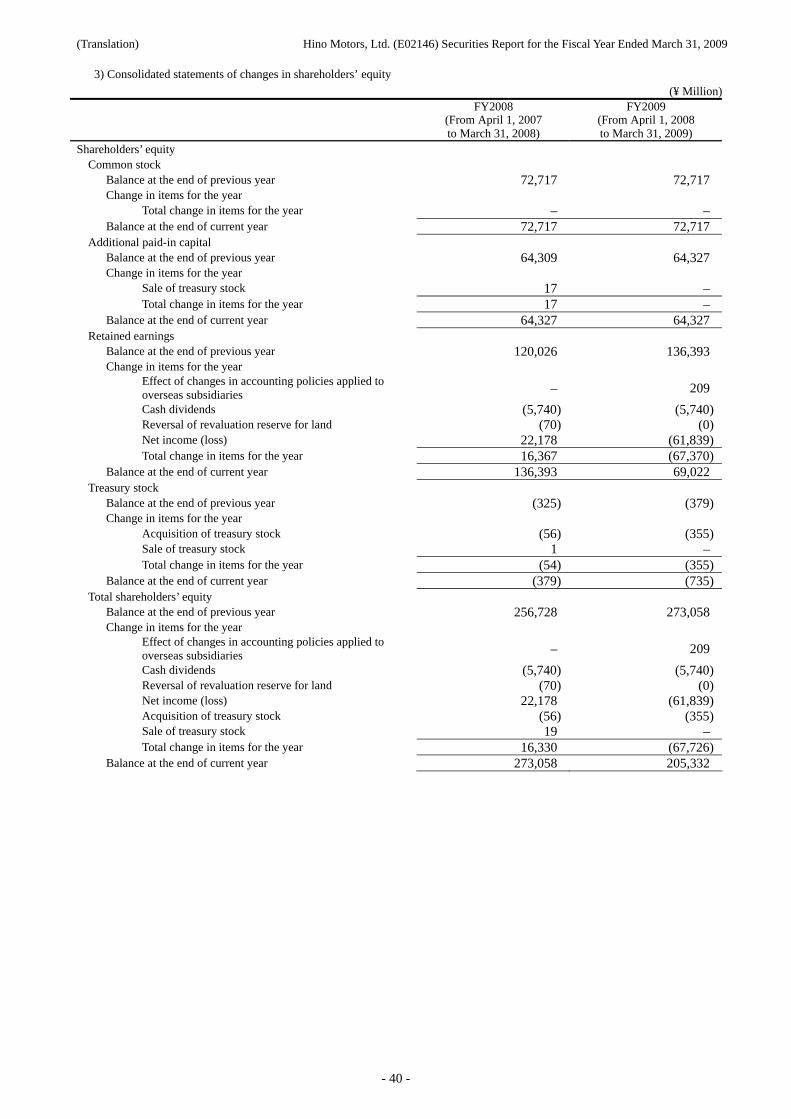
(Translation) Hino Motors, Ltd. (E02146) Securities Report for the Fiscal Year Ended March 31, 2009
- 40 -
3) Consolidated statements of changes in shareholders’ equity
(¥ Million)
FY2008
(From April 1, 2007 to March 31, 2008)
FY2009 (From April 1, 2008 to March 31, 2009)
Shareholders’ equity Common stock
Balance at the end of previous year 72,717 72,717 Change in items for the year
Total change in items for the year – – Balance at the end of current year 72,717 72,717
Additional paid-in capital Balance at the end of previous year 64,309 64,327 Change in items for the year
Sale of treasury stock 17 – Total change in items for the year 17 –
Balance at the end of current year 64,327 64,327 Retained earnings
Balance at the end of previous year 120,026 136,393 Change in items for the year
Effect of changes in accounting policies applied to overseas subsidiaries – 209
Cash dividends (5,740) (5,740)Reversal of revaluation reserve for land (70) (0)Net income (loss) 22,178 (61,839)Total change in items for the year 16,367 (67,370)
Balance at the end of current year 136,393 69,022 Treasury stock
Balance at the end of previous year (325) (379)Change in items for the year
Acquisition of treasury stock (56) (355)Sale of treasury stock 1 – Total change in items for the year (54) (355)
Balance at the end of current year (379) (735)Total shareholders’ equity
Balance at the end of previous year 256,728 273,058 Change in items for the year
Effect of changes in accounting policies applied to overseas subsidiaries – 209
Cash dividends (5,740) (5,740)Reversal of revaluation reserve for land (70) (0)Net income (loss) 22,178 (61,839)Acquisition of treasury stock (56) (355)Sale of treasury stock 19 – Total change in items for the year 16,330 (67,726)
Balance at the end of current year 273,058 205,332
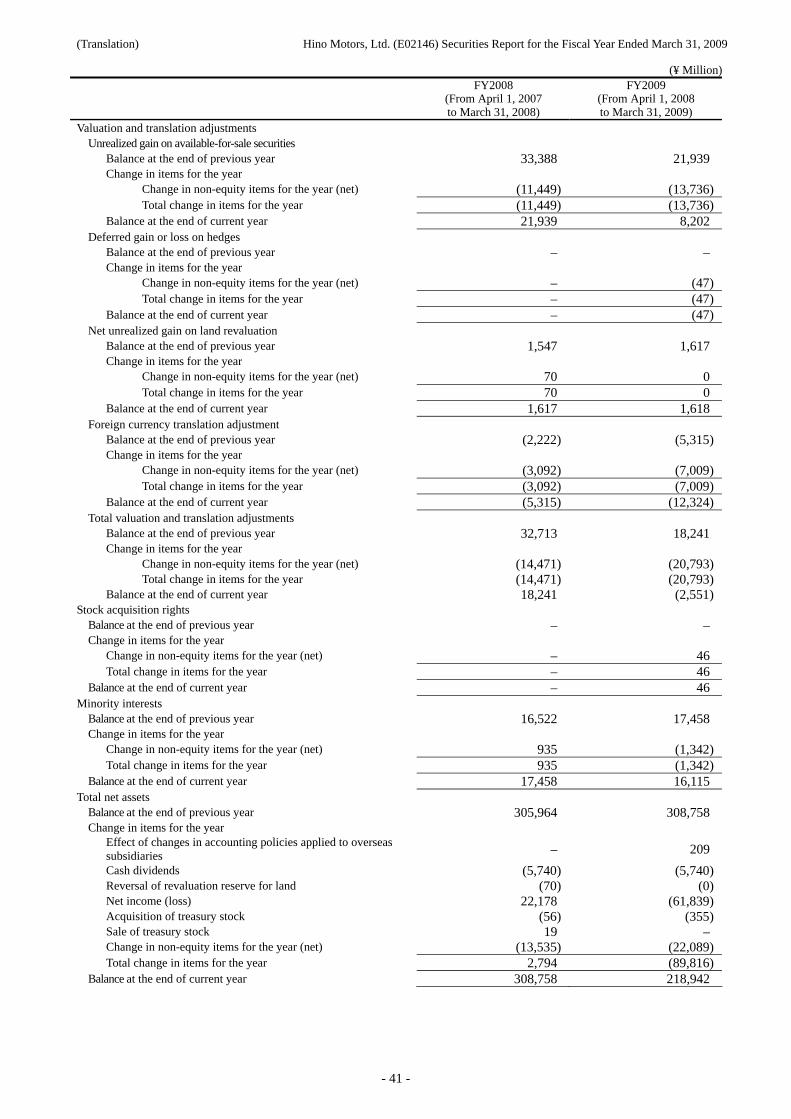
(Translation) Hino Motors, Ltd. (E02146) Securities Report for the Fiscal Year Ended March 31, 2009
- 41 -
(¥ Million)
FY2008
(From April 1, 2007 to March 31, 2008)
FY2009 (From April 1, 2008 to March 31, 2009)
Valuation and translation adjustments Unrealized gain on available-for-sale securities
Balance at the end of previous year 33,388 21,939 Change in items for the year
Change in non-equity items for the year (net) (11,449) (13,736)Total change in items for the year (11,449) (13,736)
Balance at the end of current year 21,939 8,202 Deferred gain or loss on hedges
Balance at the end of previous year – – Change in items for the year
Change in non-equity items for the year (net) – (47)Total change in items for the year – (47)
Balance at the end of current year – (47)Net unrealized gain on land revaluation
Balance at the end of previous year 1,547 1,617 Change in items for the year
Change in non-equity items for the year (net) 70 0 Total change in items for the year 70 0
Balance at the end of current year 1,617 1,618 Foreign currency translation adjustment
Balance at the end of previous year (2,222) (5,315)Change in items for the year
Change in non-equity items for the year (net) (3,092) (7,009)Total change in items for the year (3,092) (7,009)
Balance at the end of current year (5,315) (12,324)Total valuation and translation adjustments
Balance at the end of previous year 32,713 18,241 Change in items for the year
Change in non-equity items for the year (net) (14,471) (20,793)Total change in items for the year (14,471) (20,793)
Balance at the end of current year 18,241 (2,551)Stock acquisition rights
Balance at the end of previous year – – Change in items for the year
Change in non-equity items for the year (net) – 46 Total change in items for the year – 46
Balance at the end of current year – 46 Minority interests
Balance at the end of previous year 16,522 17,458 Change in items for the year
Change in non-equity items for the year (net) 935 (1,342)Total change in items for the year 935 (1,342)
Balance at the end of current year 17,458 16,115 Total net assets
Balance at the end of previous year 305,964 308,758 Change in items for the year
Effect of changes in accounting policies applied to overseas subsidiaries – 209
Cash dividends (5,740) (5,740)Reversal of revaluation reserve for land (70) (0)Net income (loss) 22,178 (61,839)Acquisition of treasury stock (56) (355)Sale of treasury stock 19 – Change in non-equity items for the year (net) (13,535) (22,089)Total change in items for the year 2,794 (89,816)
Balance at the end of current year 308,758 218,942
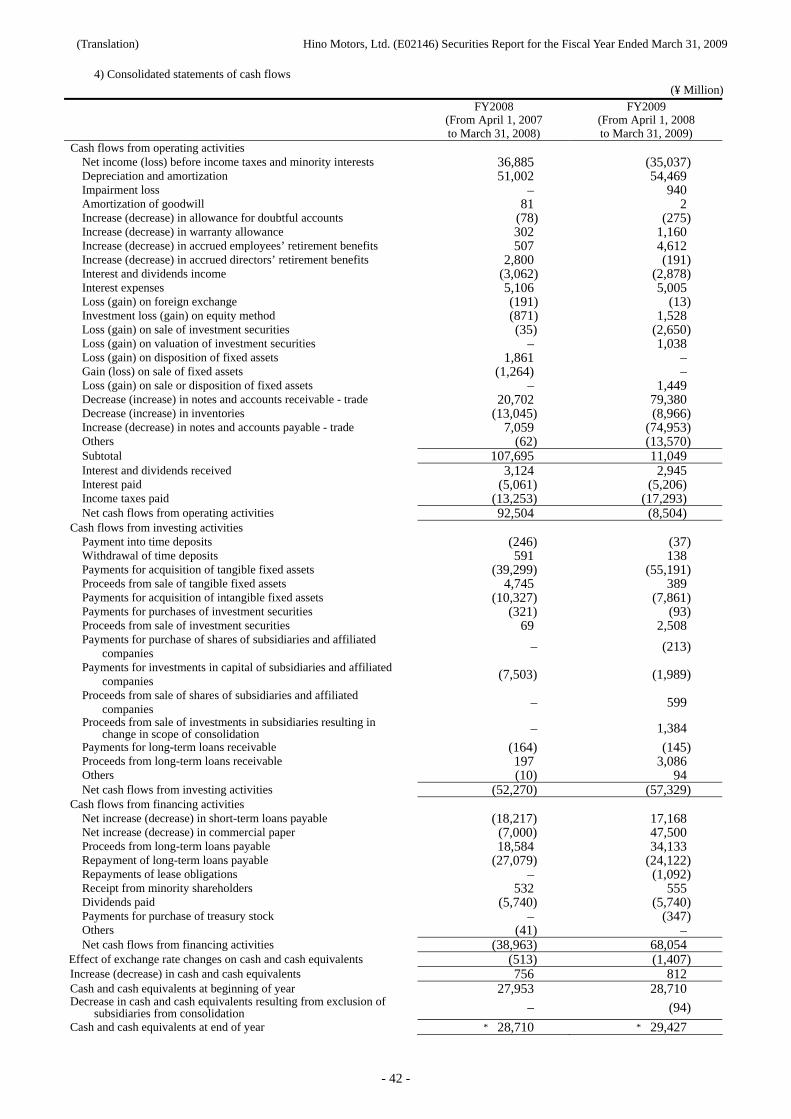
(Translation) Hino Motors, Ltd. (E02146) Securities Report for the Fiscal Year Ended March 31, 2009
- 42 -
4) Consolidated statements of cash flows (¥ Million)
FY2008
(From April 1, 2007 to March 31, 2008)
FY2009 (From April 1, 2008 to March 31, 2009)
Cash flows from operating activities Net income (loss) before income taxes and minority interests 36,885 (35,037) Depreciation and amortization 51,002 54,469 Impairment loss – 940 Amortization of goodwill 81 2 Increase (decrease) in allowance for doubtful accounts (78) (275) Increase (decrease) in warranty allowance 302 1,160 Increase (decrease) in accrued employees’ retirement benefits 507 4,612 Increase (decrease) in accrued directors’ retirement benefits 2,800 (191) Interest and dividends income (3,062) (2,878) Interest expenses 5,106 5,005 Loss (gain) on foreign exchange (191) (13) Investment loss (gain) on equity method (871) 1,528 Loss (gain) on sale of investment securities (35) (2,650) Loss (gain) on valuation of investment securities – 1,038 Loss (gain) on disposition of fixed assets 1,861 – Gain (loss) on sale of fixed assets (1,264) – Loss (gain) on sale or disposition of fixed assets – 1,449 Decrease (increase) in notes and accounts receivable - trade 20,702 79,380 Decrease (increase) in inventories (13,045) (8,966) Increase (decrease) in notes and accounts payable - trade 7,059 (74,953) Others (62) (13,570) Subtotal 107,695 11,049 Interest and dividends received 3,124 2,945 Interest paid (5,061) (5,206) Income taxes paid (13,253) (17,293) Net cash flows from operating activities 92,504 (8,504)
Cash flows from investing activities Payment into time deposits (246) (37) Withdrawal of time deposits 591 138 Payments for acquisition of tangible fixed assets (39,299) (55,191) Proceeds from sale of tangible fixed assets 4,745 389 Payments for acquisition of intangible fixed assets (10,327) (7,861) Payments for purchases of investment securities (321) (93) Proceeds from sale of investment securities 69 2,508 Payments for purchase of shares of subsidiaries and affiliated
companies – (213)
Payments for investments in capital of subsidiaries and affiliated companies (7,503) (1,989)
Proceeds from sale of shares of subsidiaries and affiliated companies – 599
Proceeds from sale of investments in subsidiaries resulting in change in scope of consolidation – 1,384
Payments for long-term loans receivable (164) (145) Proceeds from long-term loans receivable 197 3,086 Others (10) 94 Net cash flows from investing activities (52,270) (57,329)
Cash flows from financing activities Net increase (decrease) in short-term loans payable (18,217) 17,168 Net increase (decrease) in commercial paper (7,000) 47,500 Proceeds from long-term loans payable 18,584 34,133 Repayment of long-term loans payable (27,079) (24,122) Repayments of lease obligations – (1,092) Receipt from minority shareholders 532 555 Dividends paid (5,740) (5,740) Payments for purchase of treasury stock – (347) Others (41) – Net cash flows from financing activities (38,963) 68,054
Effect of exchange rate changes on cash and cash equivalents (513) (1,407) Increase (decrease) in cash and cash equivalents 756 812 Cash and cash equivalents at beginning of year 27,953 28,710 Decrease in cash and cash equivalents resulting from exclusion of
subsidiaries from consolidation – (94)
Cash and cash equivalents at end of year * 28,710 * 29,427
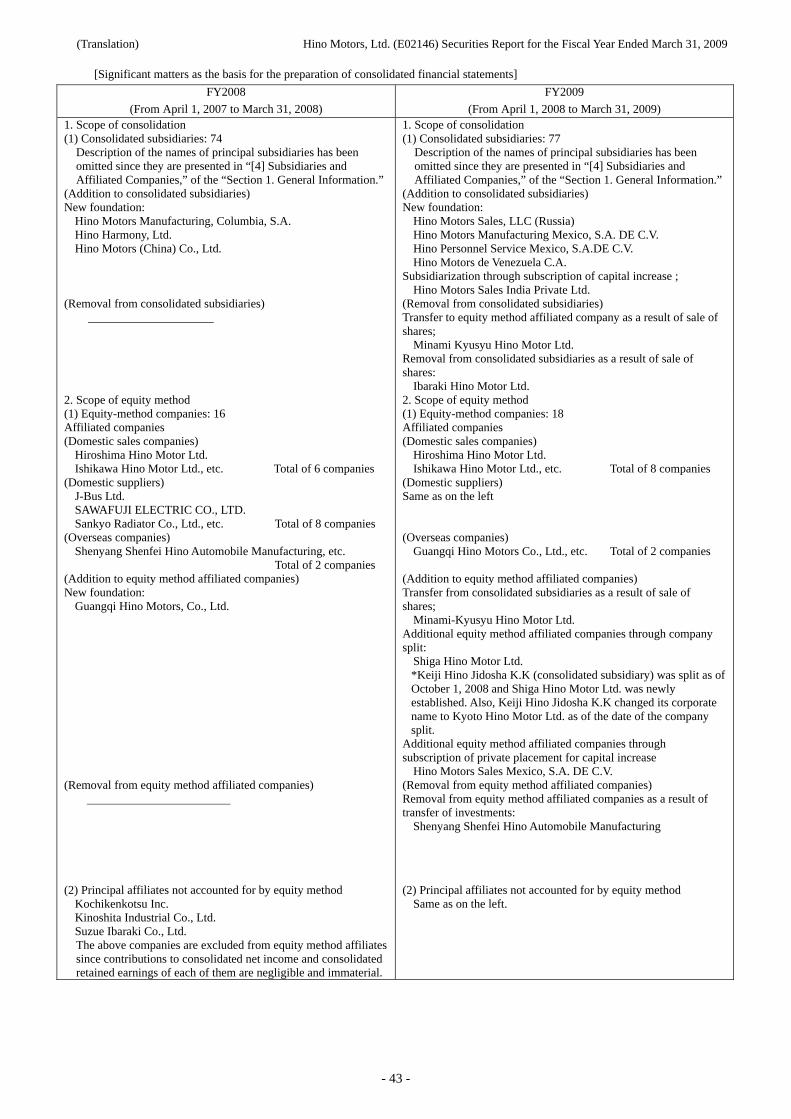
(Translation) Hino Motors, Ltd. (E02146) Securities Report for the Fiscal Year Ended March 31, 2009
- 43 -
[Significant matters as the basis for the preparation of consolidated financial statements]
FY2008
(From April 1, 2007 to March 31, 2008)
FY2009
(From April 1, 2008 to March 31, 2009) 1. Scope of consolidation (1) Consolidated subsidiaries: 74
Description of the names of principal subsidiaries has been omitted since they are presented in “[4] Subsidiaries and Affiliated Companies,” of the “Section 1. General Information.”
(Addition to consolidated subsidiaries) New foundation:
Hino Motors Manufacturing, Columbia, S.A. Hino Harmony, Ltd. Hino Motors (China) Co., Ltd.
(Removal from consolidated subsidiaries)
1. Scope of consolidation (1) Consolidated subsidiaries: 77
Description of the names of principal subsidiaries has been omitted since they are presented in “[4] Subsidiaries and Affiliated Companies,” of the “Section 1. General Information.”
(Addition to consolidated subsidiaries) New foundation:
Hino Motors Sales, LLC (Russia) Hino Motors Manufacturing Mexico, S.A. DE C.V. Hino Personnel Service Mexico, S.A.DE C.V. Hino Motors de Venezuela C.A.
Subsidiarization through subscription of capital increase ; Hino Motors Sales India Private Ltd.
(Removal from consolidated subsidiaries) Transfer to equity method affiliated company as a result of sale of shares;
Minami Kyusyu Hino Motor Ltd. Removal from consolidated subsidiaries as a result of sale of shares:
Ibaraki Hino Motor Ltd. 2. Scope of equity method (1) Equity-method companies: 16 Affiliated companies (Domestic sales companies)
Hiroshima Hino Motor Ltd. Ishikawa Hino Motor Ltd., etc. Total of 6 companies
(Domestic suppliers) J-Bus Ltd. SAWAFUJI ELECTRIC CO., LTD. Sankyo Radiator Co., Ltd., etc. Total of 8 companies
(Overseas companies) Shenyang Shenfei Hino Automobile Manufacturing, etc. Total of 2 companies
(Addition to equity method affiliated companies) New foundation:
Guangqi Hino Motors, Co., Ltd. (Removal from equity method affiliated companies)
2. Scope of equity method (1) Equity-method companies: 18 Affiliated companies (Domestic sales companies)
Hiroshima Hino Motor Ltd. Ishikawa Hino Motor Ltd., etc. Total of 8 companies
(Domestic suppliers) Same as on the left (Overseas companies)
Guangqi Hino Motors Co., Ltd., etc. Total of 2 companies (Addition to equity method affiliated companies) Transfer from consolidated subsidiaries as a result of sale of shares;
Minami-Kyusyu Hino Motor Ltd. Additional equity method affiliated companies through company split:
Shiga Hino Motor Ltd. *Keiji Hino Jidosha K.K (consolidated subsidiary) was split as of October 1, 2008 and Shiga Hino Motor Ltd. was newly established. Also, Keiji Hino Jidosha K.K changed its corporate name to Kyoto Hino Motor Ltd. as of the date of the company split.
Additional equity method affiliated companies through subscription of private placement for capital increase
Hino Motors Sales Mexico, S.A. DE C.V. (Removal from equity method affiliated companies) Removal from equity method affiliated companies as a result of transfer of investments:
Shenyang Shenfei Hino Automobile Manufacturing
(2) Principal affiliates not accounted for by equity method Kochikenkotsu Inc. Kinoshita Industrial Co., Ltd. Suzue Ibaraki Co., Ltd. The above companies are excluded from equity method affiliates since contributions to consolidated net income and consolidated retained earnings of each of them are negligible and immaterial.
(2) Principal affiliates not accounted for by equity method Same as on the left.
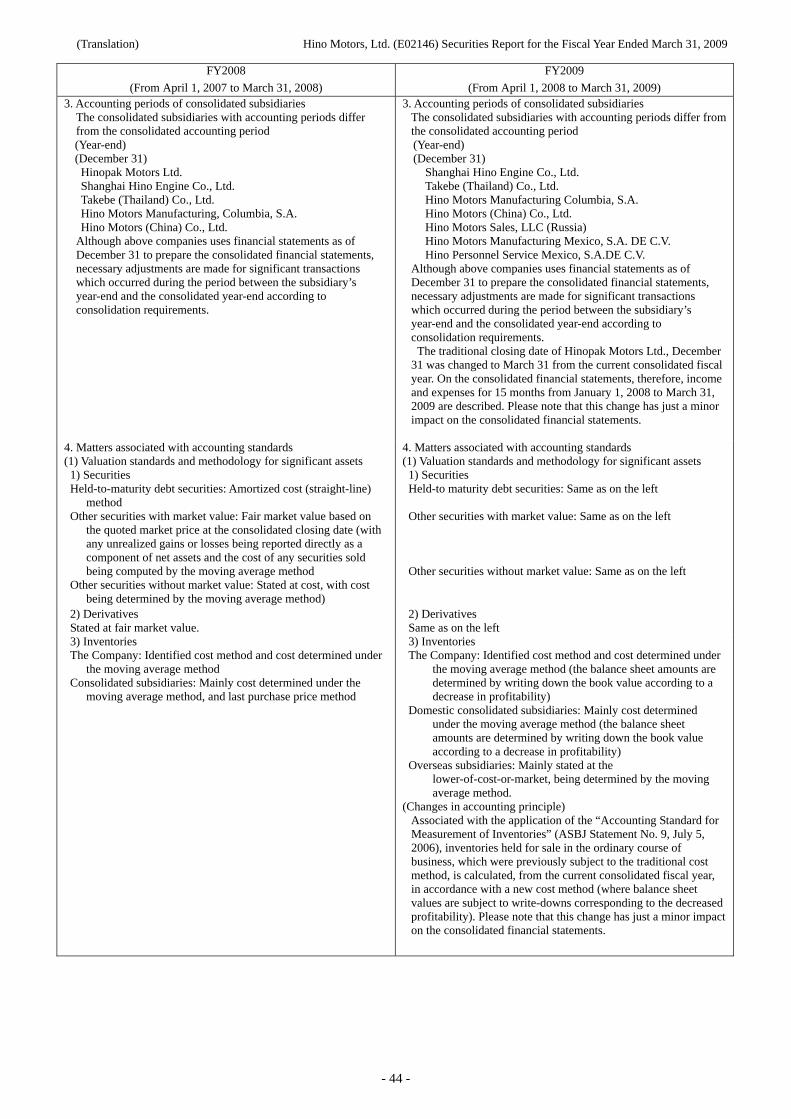
(Translation) Hino Motors, Ltd. (E02146) Securities Report for the Fiscal Year Ended March 31, 2009
- 44 -
FY2008
(From April 1, 2007 to March 31, 2008)
FY2009
(From April 1, 2008 to March 31, 2009) 3. Accounting periods of consolidated subsidiaries
The consolidated subsidiaries with accounting periods differ from the consolidated accounting period (Year-end) (December 31) Hinopak Motors Ltd. Shanghai Hino Engine Co., Ltd. Takebe (Thailand) Co., Ltd. Hino Motors Manufacturing, Columbia, S.A. Hino Motors (China) Co., Ltd.
Although above companies uses financial statements as of December 31 to prepare the consolidated financial statements, necessary adjustments are made for significant transactions which occurred during the period between the subsidiary’s year-end and the consolidated year-end according to consolidation requirements.
3. Accounting periods of consolidated subsidiaries The consolidated subsidiaries with accounting periods differ from the consolidated accounting period (Year-end) (December 31)
Shanghai Hino Engine Co., Ltd. Takebe (Thailand) Co., Ltd. Hino Motors Manufacturing Columbia, S.A. Hino Motors (China) Co., Ltd. Hino Motors Sales, LLC (Russia) Hino Motors Manufacturing Mexico, S.A. DE C.V. Hino Personnel Service Mexico, S.A.DE C.V.
Although above companies uses financial statements as of December 31 to prepare the consolidated financial statements, necessary adjustments are made for significant transactions which occurred during the period between the subsidiary’s year-end and the consolidated year-end according to consolidation requirements. The traditional closing date of Hinopak Motors Ltd., December
31 was changed to March 31 from the current consolidated fiscal year. On the consolidated financial statements, therefore, income and expenses for 15 months from January 1, 2008 to March 31, 2009 are described. Please note that this change has just a minor impact on the consolidated financial statements.
4. Matters associated with accounting standards (1) Valuation standards and methodology for significant assets 1) Securities Held-to-maturity debt securities: Amortized cost (straight-line)
method Other securities with market value: Fair market value based on
the quoted market price at the consolidated closing date (with any unrealized gains or losses being reported directly as a component of net assets and the cost of any securities sold being computed by the moving average method
Other securities without market value: Stated at cost, with cost being determined by the moving average method)
4. Matters associated with accounting standards (1) Valuation standards and methodology for significant assets 1) Securities Held-to maturity debt securities: Same as on the left Other securities with market value: Same as on the left Other securities without market value: Same as on the left
2) Derivatives Stated at fair market value.
2) Derivatives Same as on the left
3) Inventories The Company: Identified cost method and cost determined under
the moving average method Consolidated subsidiaries: Mainly cost determined under the
moving average method, and last purchase price method
3) Inventories The Company: Identified cost method and cost determined under
the moving average method (the balance sheet amounts are determined by writing down the book value according to a decrease in profitability)
Domestic consolidated subsidiaries: Mainly cost determined under the moving average method (the balance sheet amounts are determined by writing down the book value according to a decrease in profitability)
Overseas subsidiaries: Mainly stated at the lower-of-cost-or-market, being determined by the moving average method.
(Changes in accounting principle) Associated with the application of the “Accounting Standard for Measurement of Inventories” (ASBJ Statement No. 9, July 5, 2006), inventories held for sale in the ordinary course of business, which were previously subject to the traditional cost method, is calculated, from the current consolidated fiscal year, in accordance with a new cost method (where balance sheet values are subject to write-downs corresponding to the decreased profitability). Please note that this change has just a minor impact on the consolidated financial statements.
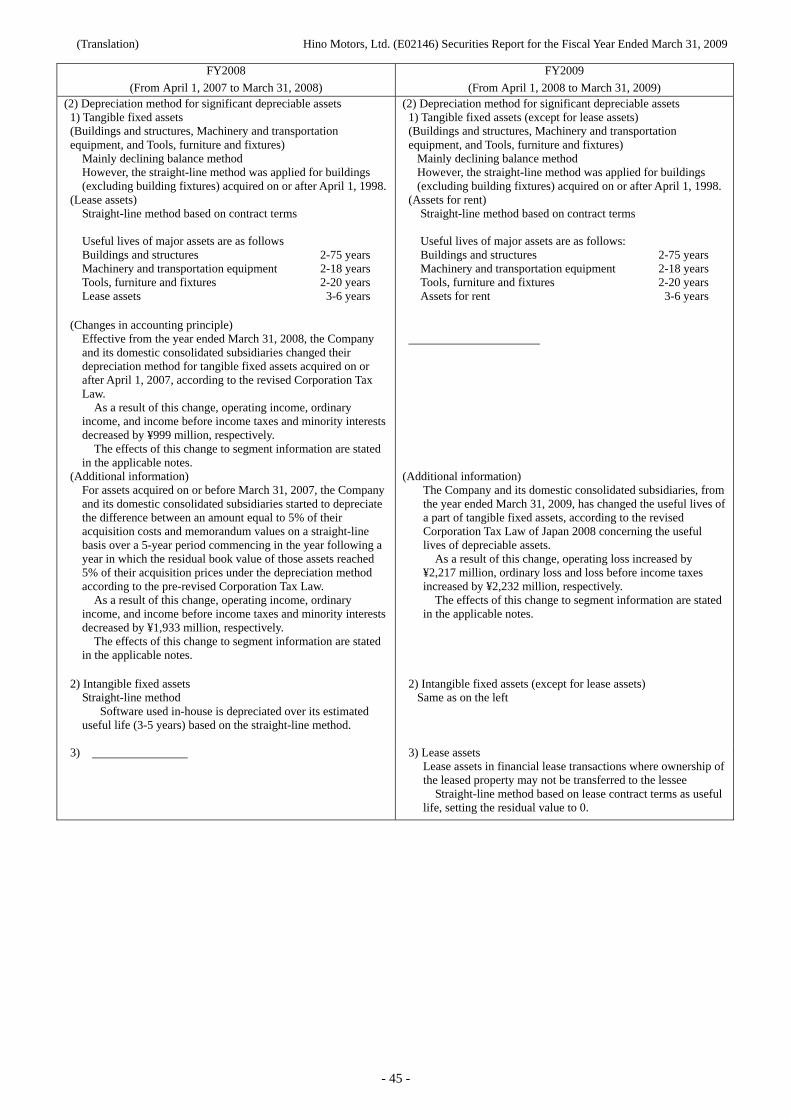
(Translation) Hino Motors, Ltd. (E02146) Securities Report for the Fiscal Year Ended March 31, 2009
- 45 -
FY2008
(From April 1, 2007 to March 31, 2008)
FY2009
(From April 1, 2008 to March 31, 2009) (2) Depreciation method for significant depreciable assets 1) Tangible fixed assets (Buildings and structures, Machinery and transportation equipment, and Tools, furniture and fixtures)
Mainly declining balance method However, the straight-line method was applied for buildings (excluding building fixtures) acquired on or after April 1, 1998.
(Lease assets) Straight-line method based on contract terms Useful lives of major assets are as follows Buildings and structures 2-75 years Machinery and transportation equipment 2-18 years Tools, furniture and fixtures 2-20 years Lease assets 3-6 years
(2) Depreciation method for significant depreciable assets 1) Tangible fixed assets (except for lease assets) (Buildings and structures, Machinery and transportation equipment, and Tools, furniture and fixtures)
Mainly declining balance method However, the straight-line method was applied for buildings (excluding building fixtures) acquired on or after April 1, 1998.
(Assets for rent) Straight-line method based on contract terms Useful lives of major assets are as follows: Buildings and structures 2-75 years Machinery and transportation equipment 2-18 years Tools, furniture and fixtures 2-20 years Assets for rent 3-6 years
(Changes in accounting principle)
Effective from the year ended March 31, 2008, the Company and its domestic consolidated subsidiaries changed their depreciation method for tangible fixed assets acquired on or after April 1, 2007, according to the revised Corporation Tax Law.
As a result of this change, operating income, ordinary income, and income before income taxes and minority interests decreased by ¥999 million, respectively.
The effects of this change to segment information are stated in the applicable notes.
(Additional information) For assets acquired on or before March 31, 2007, the Company and its domestic consolidated subsidiaries started to depreciate the difference between an amount equal to 5% of their acquisition costs and memorandum values on a straight-line basis over a 5-year period commencing in the year following a year in which the residual book value of those assets reached 5% of their acquisition prices under the depreciation method according to the pre-revised Corporation Tax Law.
As a result of this change, operating income, ordinary income, and income before income taxes and minority interests decreased by ¥1,933 million, respectively.
The effects of this change to segment information are stated in the applicable notes.
(Additional information) The Company and its domestic consolidated subsidiaries, from the year ended March 31, 2009, has changed the useful lives of a part of tangible fixed assets, according to the revised Corporation Tax Law of Japan 2008 concerning the useful lives of depreciable assets.
As a result of this change, operating loss increased by ¥2,217 million, ordinary loss and loss before income taxes increased by ¥2,232 million, respectively.
The effects of this change to segment information are stated in the applicable notes.
2) Intangible fixed assets Straight-line method
Software used in-house is depreciated over its estimated useful life (3-5 years) based on the straight-line method.
2) Intangible fixed assets (except for lease assets) Same as on the left
3)
3) Lease assets Lease assets in financial lease transactions where ownership of the leased property may not be transferred to the lessee
Straight-line method based on lease contract terms as useful life, setting the residual value to 0.
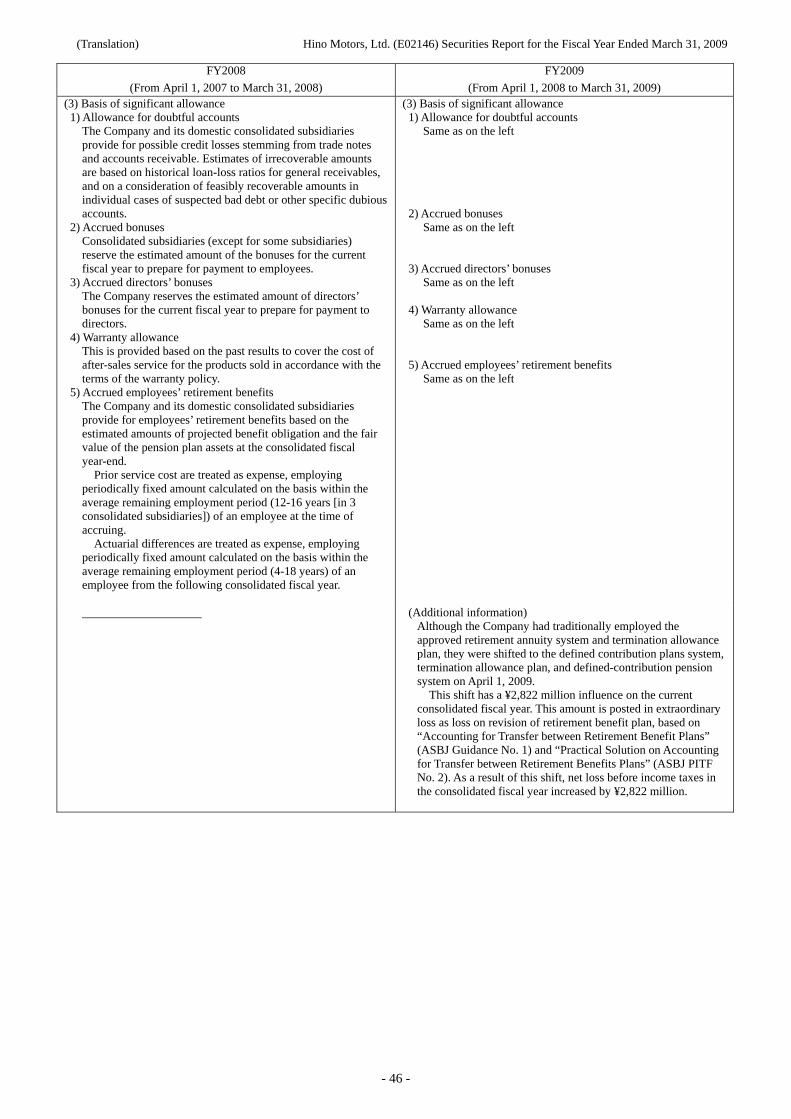
(Translation) Hino Motors, Ltd. (E02146) Securities Report for the Fiscal Year Ended March 31, 2009
- 46 -
FY2008
(From April 1, 2007 to March 31, 2008)
FY2009
(From April 1, 2008 to March 31, 2009) (3) Basis of significant allowance 1) Allowance for doubtful accounts
The Company and its domestic consolidated subsidiaries provide for possible credit losses stemming from trade notes and accounts receivable. Estimates of irrecoverable amounts are based on historical loan-loss ratios for general receivables, and on a consideration of feasibly recoverable amounts in individual cases of suspected bad debt or other specific dubious accounts.
2) Accrued bonuses Consolidated subsidiaries (except for some subsidiaries) reserve the estimated amount of the bonuses for the current fiscal year to prepare for payment to employees.
3) Accrued directors’ bonuses The Company reserves the estimated amount of directors’ bonuses for the current fiscal year to prepare for payment to directors.
4) Warranty allowance This is provided based on the past results to cover the cost of after-sales service for the products sold in accordance with the terms of the warranty policy.
5) Accrued employees’ retirement benefits The Company and its domestic consolidated subsidiaries provide for employees’ retirement benefits based on the estimated amounts of projected benefit obligation and the fair value of the pension plan assets at the consolidated fiscal year-end.
Prior service cost are treated as expense, employing periodically fixed amount calculated on the basis within the average remaining employment period (12-16 years [in 3 consolidated subsidiaries]) of an employee at the time of accruing.
Actuarial differences are treated as expense, employing periodically fixed amount calculated on the basis within the average remaining employment period (4-18 years) of an employee from the following consolidated fiscal year.
(3) Basis of significant allowance 1) Allowance for doubtful accounts
Same as on the left
2) Accrued bonuses Same as on the left
3) Accrued directors’ bonuses Same as on the left
4) Warranty allowance
Same as on the left
5) Accrued employees’ retirement benefits Same as on the left
(Additional information) Although the Company had traditionally employed the approved retirement annuity system and termination allowance plan, they were shifted to the defined contribution plans system, termination allowance plan, and defined-contribution pension system on April 1, 2009.
This shift has a ¥2,822 million influence on the current consolidated fiscal year. This amount is posted in extraordinary loss as loss on revision of retirement benefit plan, based on “Accounting for Transfer between Retirement Benefit Plans” (ASBJ Guidance No. 1) and “Practical Solution on Accounting for Transfer between Retirement Benefits Plans” (ASBJ PITF No. 2). As a result of this shift, net loss before income taxes in the consolidated fiscal year increased by ¥2,822 million.
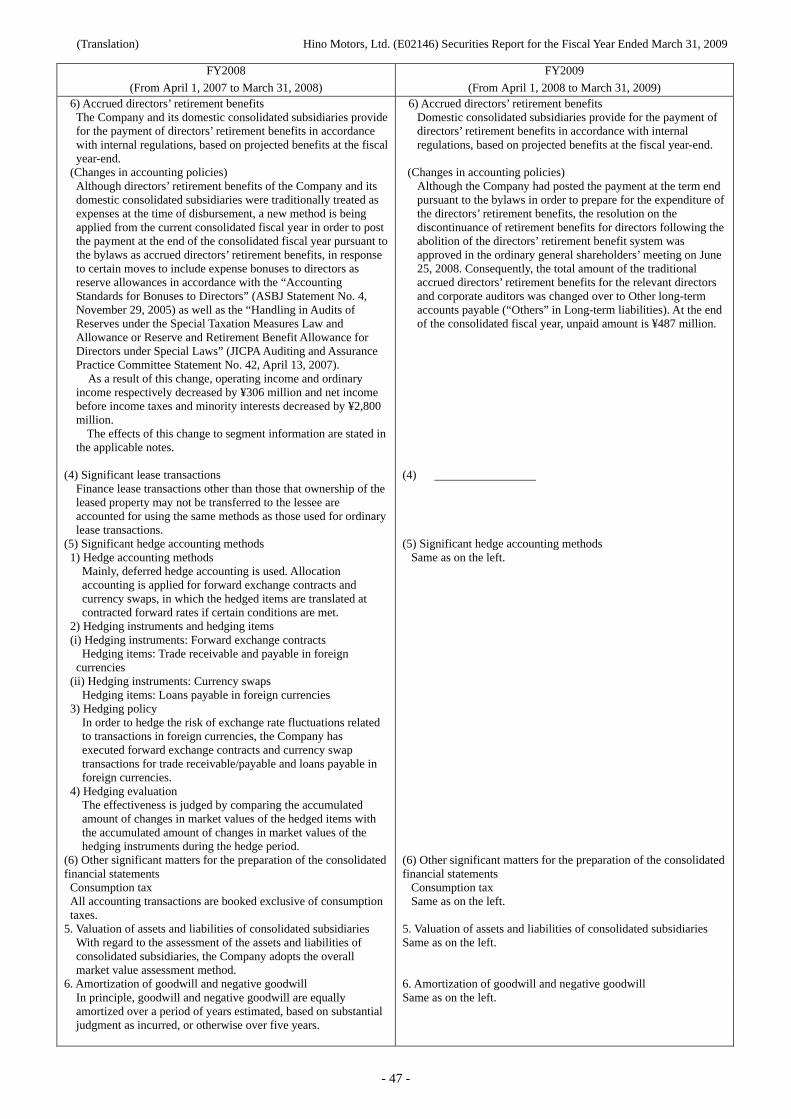
(Translation) Hino Motors, Ltd. (E02146) Securities Report for the Fiscal Year Ended March 31, 2009
- 47 -
FY2008
(From April 1, 2007 to March 31, 2008)
FY2009
(From April 1, 2008 to March 31, 2009) 6) Accrued directors’ retirement benefits The Company and its domestic consolidated subsidiaries provide for the payment of directors’ retirement benefits in accordance with internal regulations, based on projected benefits at the fiscal year-end.
(Changes in accounting policies) Although directors’ retirement benefits of the Company and its domestic consolidated subsidiaries were traditionally treated as expenses at the time of disbursement, a new method is being applied from the current consolidated fiscal year in order to post the payment at the end of the consolidated fiscal year pursuant to the bylaws as accrued directors’ retirement benefits, in response to certain moves to include expense bonuses to directors as reserve allowances in accordance with the “Accounting Standards for Bonuses to Directors” (ASBJ Statement No. 4, November 29, 2005) as well as the “Handling in Audits of Reserves under the Special Taxation Measures Law and Allowance or Reserve and Retirement Benefit Allowance for Directors under Special Laws” (JICPA Auditing and Assurance Practice Committee Statement No. 42, April 13, 2007).
As a result of this change, operating income and ordinary income respectively decreased by ¥306 million and net income before income taxes and minority interests decreased by ¥2,800 million.
The effects of this change to segment information are stated in the applicable notes.
6) Accrued directors’ retirement benefits Domestic consolidated subsidiaries provide for the payment of directors’ retirement benefits in accordance with internal regulations, based on projected benefits at the fiscal year-end.
(Changes in accounting policies)
Although the Company had posted the payment at the term end pursuant to the bylaws in order to prepare for the expenditure of the directors’ retirement benefits, the resolution on the discontinuance of retirement benefits for directors following the abolition of the directors’ retirement benefit system was approved in the ordinary general shareholders’ meeting on June 25, 2008. Consequently, the total amount of the traditional accrued directors’ retirement benefits for the relevant directors and corporate auditors was changed over to Other long-term accounts payable (“Others” in Long-term liabilities). At the end of the consolidated fiscal year, unpaid amount is ¥487 million.
(4) Significant lease transactions Finance lease transactions other than those that ownership of the leased property may not be transferred to the lessee are accounted for using the same methods as those used for ordinary lease transactions.
(5) Significant hedge accounting methods 1) Hedge accounting methods
Mainly, deferred hedge accounting is used. Allocation accounting is applied for forward exchange contracts and currency swaps, in which the hedged items are translated at contracted forward rates if certain conditions are met.
2) Hedging instruments and hedging items (i) Hedging instruments: Forward exchange contracts
Hedging items: Trade receivable and payable in foreign currencies
(ii) Hedging instruments: Currency swaps Hedging items: Loans payable in foreign currencies
3) Hedging policy In order to hedge the risk of exchange rate fluctuations related to transactions in foreign currencies, the Company has executed forward exchange contracts and currency swap transactions for trade receivable/payable and loans payable in foreign currencies.
4) Hedging evaluation The effectiveness is judged by comparing the accumulated amount of changes in market values of the hedged items with the accumulated amount of changes in market values of the hedging instruments during the hedge period.
(4) (5) Significant hedge accounting methods
Same as on the left.
(6) Other significant matters for the preparation of the consolidated financial statements Consumption tax All accounting transactions are booked exclusive of consumption taxes.
(6) Other significant matters for the preparation of the consolidated financial statements
Consumption tax Same as on the left.
5. Valuation of assets and liabilities of consolidated subsidiaries With regard to the assessment of the assets and liabilities of consolidated subsidiaries, the Company adopts the overall market value assessment method.
5. Valuation of assets and liabilities of consolidated subsidiaries Same as on the left.
6. Amortization of goodwill and negative goodwill In principle, goodwill and negative goodwill are equally amortized over a period of years estimated, based on substantial judgment as incurred, or otherwise over five years.
6. Amortization of goodwill and negative goodwill Same as on the left.
(Translation) Hino Motors, Ltd. (E02146) Securities Report for the Fiscal Year Ended March 31, 2009
- 48 -
FY2008
(From April 1, 2007 to March 31, 2008)
FY2009
(From April 1, 2008 to March 31, 2009) 7. Scope of cash in consolidated statements of cash flows
Cash (cash and cash equivalents) in consolidated statements of cash flows consist of cash on hand, deposit which is at any time available for withdrawal and short-term investments convertible easily into cash and repayable within 3 months after acquisition, with little risk for price fluctuation.
7. Scope of cash in consolidated statements of cash flows Same as on the left.
(Translation) Hino Motors, Ltd. (E02146) Securities Report for the Fiscal Year Ended March 31, 2009
- 49 -
[Changes in significant matters as the basis for the preparation of consolidated financial statements]
FY2008
(From April 1, 2007 to March 31, 2008)
FY2009
(From April 1, 2008 to March 31, 2009) (Accounting standards for lease transactions)
From the current consolidated fiscal year, the Company and its domestic consolidated subsidiaries have applied “Accounting Standards for Lease Transactions” (ASBJ Statement No. 13, June 17, 1993 (First Group of Financial Accounting Board), revised in March 30, 2007) and “Guidance on Accounting Standard for Lease Transactions” (ASBJ Guidance No. 16, January 18, 1994 (JICPA Accounting System Committee), revised on March 30, 2007).
In the consolidated balance sheets based on this, tangible fixed assets, intangible fixed assets, current liabilities, and long-term liabilities have increased by ¥2,776 million, ¥64 million, ¥814 million, and ¥2,089 million respectively. Please note that this change has just a minor impact on the consolidated statements of income. The effects of this change to segment information are stated in the applicable notes.
(Practical solution on unification of accounting policies applied to overseas subsidiaries for consolidated financial statements)
The “Practical Solution on Unification of Accounting Policies Applied to Foreign Subsidiaries for Consolidated Financial Statements” (ASBJ PITF No. 18, May 17, 2006) is applied from the current consolidated fiscal year to make modifications required for consolidated accounting. Please note that this application has just a minor impact on the consolidated financial statements.
[Changes in presentation]
FY2008
(From April 1, 2007 to March 31, 2008)
FY2009
(From April 1, 2008 to March 31, 2009) (On the consolidated balance sheets)
1. In the previous consolidated fiscal year, the lease assets and lease liabilities related to finance lease transactions of the overseas consolidated subsidiaries were included in “Buildings and structures” (¥5,372 million as of the previous fiscal year-end), “Machinery and transportation equipment” (¥12,263 million as of the previous fiscal year-end), “Tools, furniture and fixtures” (¥91 million as of the previous fiscal year-end), “Land” (¥882 million as of the previous fiscal year-end) in tangible fixed assets, “Others” (¥921 million as of the previous fiscal year-end) in current liabilities, and “Others” (¥20,619 million as of the previous fiscal year-end) in long-term liabilities. However, as the Company and its domestic consolidated subsidiaries applied to “Accounting Standards for Lease Transactions” (ASBJ Statement No. 13, June 17, 1993 (First Group of Financial Accounting Board), revised in March 30, 2007) and “Guidance on Accounting Standard for Lease Transactions” (ASBJ Guidance No. 16, January 18, 1994 (JICPA Accounting System Committee), revised on March 30, 2007) from the current consolidated fiscal year, they have been included in “Lease assets” in tangible fixed assets and “Lease liabilities” in current liabilities and long-term liabilities.
In the end of the consolidated fiscal year, “Lease assets” in tangible fixed assets, “Lease liabilities” in current liabilities, and “Lease liabilities” in long-term liabilities of the relevant consolidated subsidiaries are ¥15,773 million, ¥932 million, and ¥19,788 million, respectively.
In the previous consolidated fiscal year, rental assets (principally in-house products [vehicles]) were included in “Lease assets.” From the current fiscal year, however, they have been included in “Assets for rent.”
(Translation) Hino Motors, Ltd. (E02146) Securities Report for the Fiscal Year Ended March 31, 2009
- 50 -
FY2008
(From April 1, 2007 to March 31, 2008)
FY2009
(From April 1, 2008 to March 31, 2009) 2. Following the adoption of the “Cabinet Office Ordinance
Revising the Regulation for Terminology, Forms and Preparation of Financial Statements” (Cabinet Office Ordinance No. 50, August 7, 2008), items that had been listed as “Inventories” were broken down into “Merchandise and finished goods,” “Work in progress,” and “Raw materials and supplies” starting this fiscal year. “Merchandise and finished goods,” “Work in progress,” and “Raw materials and supplies” included under “Inventories” for the previous fiscal year were ¥62,351 million, ¥23,593 million, and ¥16,620 million, respectively.
3. “Accrued directors’ bonuses,” which was listed separately until the previous consolidated fiscal year, is included in “Others” under Current liabilities due to its decrease in materiality.
(On the consolidated statements of income)
1. “Provision for accrued directors’ bonuses,” which was listed separately until the previous consolidated fiscal year, is included in “Others” under selling, general and administrative expenses since its amount is due to its decrease in materiality.
2. “Impairment loss” (¥146 million in previous fiscal year) is listed
as a separate component for the current consolidated fiscal year, instead of being included within the “Others” in extraordinary loss as in the previous fiscal year, because it exceeded 10% of total extraordinary losses for the current fiscal year.
3. “Loss on valuation of investment securities” (¥44 million in
previous fiscal year) is listed as a separate component for the current consolidated fiscal year, instead of being included within the “Others” in extraordinary loss as in the previous fiscal year, because it exceeded 10% of total extraordinary losses for the current fiscal year.
(On the consolidated statements of cash flows) 1. “Impairment loss,” (¥146 million in previous fiscal year) which
was included in “Others” in cash flows from operating activities for the previous consolidated fiscal year, is listed as a separate component for the current fiscal year due to its increase in materiality.
2. “Loss (gain) on valuation of investment securities,” (¥44 million
in the previous consolidated fiscal year) which was included in “Others” in cash flows from operating activities for the previous fiscal year, is listed as a separate component for the current fiscal year due to its increase in materiality.
3. “Loss on sale or disposition of fixed assets” (¥1,504 million in
the current consolidated fiscal year) and “Gain on sale of fixed assets” (¥(55) million in the current fiscal year) categories under cash flows from operating activities were separately listed until the previous fiscal year. However, they are listed as “Loss (gain) on sale or disposition of fixed assets” as of the current fiscal year in order to improve the comparability of the consolidated financial statements as XBRL is introduced to EDINET.
4. “Purchase of treasury stock,” (¥(56) million in the previous
consolidated fiscal year) which was included in “Others” in cash flows from financing activities for the previous fiscal year, is listed as a separate component for the current fiscal year due to its increase in materiality.
(Translation) Hino Motors, Ltd. (E02146) Securities Report for the Fiscal Year Ended March 31, 2009
- 51 -
[Notes]
(On the consolidated balance sheets)
FY2008
(As of March 31, 2008)
FY2009
(As of March 31, 2009) Note 1. *1 Items accounted in affiliated companies are as follows Investment securities (stocks) ¥9,418 million Investments ¥7,514 million
*2. Cumulative depreciation of tangible fixed assets ¥554,806 million Note 2. Guarantee obligation Guarantee is made as to bank loans and others. Affiliated company
Kyushu Sun Body, Ltd. ¥144 million Auto loan ¥1,894 million Loan for the fund for employees’ housing ¥6,666 million Total ¥8,704 million Note 3. *3 Assets pledged as collateral
(i) Pledged as factory foundation mortgages Buildings ¥4,148 million Machinery and equipment ¥2,636 million Land ¥6,100 million Other tangible fixed assets ¥292 million Total ¥13,178 million
Assets stated above are pledged as collateral against followings: Short-term loans payable ¥5,594 million Long-term loans payable ¥3,901 million (including the current portion) Total ¥9,495 million
(ii) Pledged as non-factory foundation mortgages Notes receivable - trade ¥11,898 million Accounts receivable - trade ¥3,255 million Inventories ¥4,794 million Buildings ¥13,939 million Land ¥30,505 million Others ¥2,042 million Total ¥66,434 million
Assets stated above are pledged as collateral against followings: Short-term loans payable ¥39,203 million Long-term loans payable ¥739 million (including the current portion) Total ¥39,942 million
Note 1. *1 Items accounted in affiliated companies are as follows Investment securities (stocks) ¥7,987 million Investments ¥8,025 million
*2. Cumulative depreciation of tangible fixed assets ¥577,696 million Note 2. Guarantee obligation Guarantee is made as to bank loans and others. Affiliated company
Kyushu Sun Body, Ltd. ¥92 million Auto loan ¥1,208 million Loan for the fund for employees’ housing ¥5,917 million Total ¥7,218 million Note 3. *3 Assets pledged as collateral
(i) Pledged as factory foundation mortgages Buildings ¥4,475 million Machinery and equipment ¥2,343 million Land ¥6,100 million Other tangible fixed assets ¥282 million Total ¥13,201 million yen
Assets stated above are pledged as collateral against followings: Short-term loans payable ¥9,573 million Long-term loans payable ¥3,430 million (including the current portion) Total ¥13,003 million
(ii) Pledged as non-factory foundation mortgages Notes receivable - trade ¥8,163 million Accounts receivable - trade ¥2,458 million Inventories ¥3,015 million Buildings ¥11,444 million Land ¥23,867 million Others ¥1,280 million Total ¥50,229 million
Assets stated above are pledged as collateral against followings: Short-term loans payable ¥30,605 million Long-term loans payable ¥484 million (including the current portion) Total ¥31,090 million
(Translation) Hino Motors, Ltd. (E02146) Securities Report for the Fiscal Year Ended March 31, 2009
- 52 -
FY2008
(As of March 31, 2008)
FY2009
(As of March 31, 2009) Note 4. *4 Some domestic consolidated subsidiaries revaluated the
land for their business in accordance with the Act on Revaluation of Land (Act No. 34 promulgated on March 31, 1998) and the Act on Partial Revision to the Act on Revaluation of Land (Act No. 19 promulgated on March 31, 2001). With respect to the valuation difference, the amount equivalent to the deferred taxes related to the valuation difference is listed as “Deferred tax liabilities for land revaluation” under the liabilities section, while the amount where the said valuation difference is deducted is listed as “Net unrealized gain on land revaluation” under the net assets section. Revaluation method: Some companies calculated by making a
reasonable adjustment to the assessed value of fixed assets as set forth in Article 2 Paragraph 3 of the Order for Enforcement of the Act on Revaluation of Land (Order No. 119 promulgated on March 31, 1998) and based on appraisals by real-estate appraisers as set forth in Paragraph 5 of the said article.
Meanwhile, some companies calculated by making a reasonable adjustment, such as correction based on time adjustment, to the amount calculated by the method established and publicly announced by the Commissioner of the National Tax Agency to calculate the value of land as a basis of the calculation for the taxable amount of the land value tax stipulated in Article 16 of the Land-holding Tax Act as set forth in Article 2 Paragraph 4 of the Order for Enforcement of the Act on Revaluation of Land.
Date of revaluation: March 31, 2002 Difference between the ending market value of the revaluated land and the book value after the revaluation: ¥2,909 million
Note 4. *4 Some domestic consolidated subsidiaries revaluated the land for their business in accordance with the Act on Revaluation of Land (Act No. 34 promulgated on March 31, 1998) and the Act on Partial Revision to the Act on Revaluation of Land (Act No. 19 promulgated on March 31, 2001). With respect to the valuation difference, the amount equivalent to the deferred taxes related to the valuation difference is listed as “Deferred tax liabilities for land revaluation” under the liabilities section, while the amount where the said valuation difference is deducted is listed as “Net unrealized gain on land revaluation” under the net assets section. Revaluation method: Some companies calculated by making a
reasonable adjustment to the assessed value of fixed assets as set forth in Article 2 Paragraph 3 of the Order for Enforcement of the Act on Revaluation of Land (Order No. 119 promulgated on March 31, 1998) and based on appraisals by real-estate appraisers as set forth in Paragraph 5 of the said article.
Meanwhile, some companies calculated by making a reasonable adjustment, such as correction based on time adjustment, to the amount calculated by the method established and publicly announced by the Commissioner of the National Tax Agency to calculate the value of land as a basis of the calculation for the taxable amount of the land value tax stipulated in Article 16 of the Land-holding Tax Act as set forth in Article 2 Paragraph 4 of the Order for Enforcement of the Act on Revaluation of Land.
Date of revaluation: March 31, 2002 Difference between the ending market value of the revaluated
land and the book value after the revaluation: ¥2,207 million
(Translation) Hino Motors, Ltd. (E02146) Securities Report for the Fiscal Year Ended March 31, 2009
- 53 -
(On the consolidated statements of income)
FY2008
(From April 1, 2007 to March 31, 2008)
FY2009
(From April 1, 2008 to March 31, 2009) Note 1. *1 Major item accounted in gain on sale of fixed assets is
as follows: Land ¥1,178 million
*2 Major item accounted in loss on sale or disposition of
fixed assets is as follows: Machinery and transportation equipment
¥1,085 million Note 2. Research and development costs included in selling,
general and administrative expenses and manufacturing costs are as follows:
¥39,547 million
Note 1. *1 Major item accounted in gain on sale of fixed assets is as follows:
Machinery and transportation equipment ¥28 million
*2 Major item accounted in loss on sale or disposition of fixed assets is as follows:
Machinery and transportation equipment ¥1,118 million Note 2. Research and development costs included in selling,
general and administrative expenses and manufacturing costs are as follows:
¥40,927 million
(On the consolidated statements of changes in shareholders’ equity)
The year ended March 31, 2008, (From April 1, 2007 to March 31, 2008)
1. Type and number of issued shares of common stock and treasury stock
Number of shares at end of FY2007
(Thousands of shares)
Increase (Thousands of shares)
Decrease (Thousands of shares)
Number of shares at end of FY2008
(Thousands of shares) Shares issued
Common stock 574,580 – – 574,580Total 574,580 – – 574,580
Treasury stock Common stock Notes 1, 2 696 74 38 732
Total 696 74 38 732Notes: 1. The 74-thousand-share increase in treasury shares of common stock is comprised of the shares acquired by purchasing sub-MTU shares.
2. The 38-thousand-share decrease in treasury shares of common stock is comprised of the 10-thousand treasury shares (of the Company) owned by
the Company, which were sold by consolidated subsidiaries and the 27-thousand treasury shares (of the Company) owned by the Company, which
were sold by equity method affiliates.
2. Dividends
(1) Dividends paid
(Resolution) Class of shares Total amount of dividends paid
(¥ Million)
Dividends per share (¥)
Record date Effective date
Ordinary general shareholders’ meeting on
June 26, 2007 Common stock 2,870 5 March 31, 2007 June 27, 2007
Board of directors meeting on October 31, 2007
Common stock 2,870 5September 30, 2007
November 26, 2007
(2) Among the dividends of which record date belongs to the consolidated fiscal year ended March 2008, the dividends of which effective date comes during the following fiscal year.
(Resolution) Class of shares Total amount of dividends paid
(¥ Million)
Source of dividends
Dividends per share (¥)
Record date Effective date
Ordinary general shareholders’ meeting on
June 25, 2008
Common stock
2,870Retained earnings
5 March 31,
2008 June 26, 2008
(Translation) Hino Motors, Ltd. (E02146) Securities Report for the Fiscal Year Ended March 31, 2009
- 54 -
The year ended March 31, 2009 (From April 1, 2008 to March 31, 2009)
1. Type and number of issued shares of common stock and treasury stock
Number of shares at the end of FY2008
(Thousands of shares)
Increase (Thousands of shares)
Decrease (Thousands of shares)
Number of shares at the end of FY2009
(Thousands of shares) Shares issued
Common stock 574,580 – – 574,580Total 574,580 – – 574,580
Treasury stock Common stock Note 732 1,387 – 2,120
Total 732 1,387 – 2,120Note: The 1,387-thousand-share increase in treasury shares of common stock is comprised of the 1,300-thousand-share increase from acquisition of
treasury stocks through the ordinary general shareholders’ meeting’s resolution, the 38 thousand shares sold to equity-method affiliates, and the 49
thousand shares acquired by purchasing sub-MTU shares.
2. Stock acquisition rights and stock acquisition rights owned by the Company
Number of shares to be issued
Company Description Class of
shares to be issued
Number of shares at the end
of FY2008 Increase Decrease
Number of shares at the end
of FY2009
Balance at the end of FY2009
Hino Motors, Ltd.
Stock acquisition rights as stock options
– – – – – 46
Total – – – – – 46
3. Dividends
(1) Dividends paid
(Resolution) Class of shares Total amount of dividends paid
(¥ Million)
Dividends per share (¥)
Record date Effective date
ordinary general shareholders’ meeting on
June 25, 2008 Common stock 2,870 5 March 31, 2008 June 26, 2008
Board of directors meeting on October 29, 2008
Common stock 2,869 5September 30, 2008
November 26, 2008
(2) Among the dividends of which record date belongs to the current fiscal year, the dividends of which effective date comes during the consolidated fiscal year ending March 2010
There are no applicable matters to be reported.
(On the consolidated statements of cash flows)
FY2008
(From April 1, 2007 to March 31, 2008)
FY2009
(From April 1, 2008 to March 31, 2009) * Relation between cash and cash equivalents at the year-end and the amount of the item listed in consolidated balance sheets Accounts of cash and deposits ¥29,108 million Time deposit, deposit term
of which is over 3 months ¥(398) million Total cash and cash equivalents ¥28,710 million
* Relation between cash and cash equivalents at the year-end and the amount of the item listed in consolidated balance sheets Accounts of cash and deposits ¥29,725 million Time deposit, deposit term
of which is over 3 months ¥(297) million Total cash and cash equivalents ¥29,427 million
(Translation) Hino Motors, Ltd. (E02146) Securities Report for the Fiscal Year Ended March 31, 2009
- 55 -
(Lease transactions) <As a lessee>
FY2008
(From April 1, 2007 to March 31, 2008)
FY2009
(From April 1, 2008 to March 31, 2009) 1. Finance leases other than those that transfer ownership of the
leased assets to the lessee (1) Estimated acquisition cost, equivalent of accumulated
depreciation, and equivalent of year end balance for the leased assets are as follows:
(¥ Million) Estimated
acquisition cost
Equivalent of accumulated depreciation
Equivalent of year end balance
Machinery and transportation equipment
1,775 614 1,161
Tools, furniture and fixtures
3,719 1,745 1,973
Others 41 13 28Total 5,536 2,373 3,163
(2)Equivalent of outstanding obligations under finance leases at the
year-end are as follows: Due within one year ¥956 million Due after one year ¥2,293 million
Total ¥3,249 million
(3) Lease payments, and equivalents of depreciation expense and interest expense Lease payments ¥1,350 million Equivalent of depreciation expense ¥1,211 million Equivalent of interest expense ¥152 million
(4) Calculation method for equivalent of depreciation expense Straight-line method based on lease contract terms as useful life, setting the residual value to 0.
(5) Calculation method for interest equivalent The difference between the total lease fees and the acquisition cost equivalent of leased property is set as the interest equivalent. It is allocated to each fiscal year based on the interest method.
1. Finance lease transactions Finance lease transactions where ownership of the leased property may not be transferred to the lessee
(1) Details of the lease assets Tangible fixed assets
Mainly production facilities (Machinery and transportation equipment) and computer terminals (Tools, furniture and fixtures).
Intangible fixed assets Software
(2) Depreciation method for lease assets As described on “Significant matters as the basis for the preparation of consolidated financial statements” “4. Matters associated with accounting standards (2) Depreciation method for significant depreciable assets.”
2. Operating lease transactions Minimum lease commitments under operating leases
Due within one year ¥51 million Due after one year ¥110 million
Total ¥161 million
2. Operating lease transactions Minimum lease commitments under noncancellable operating leases Due within one year ¥44 million Due after one year ¥71 million
Total ¥116 million
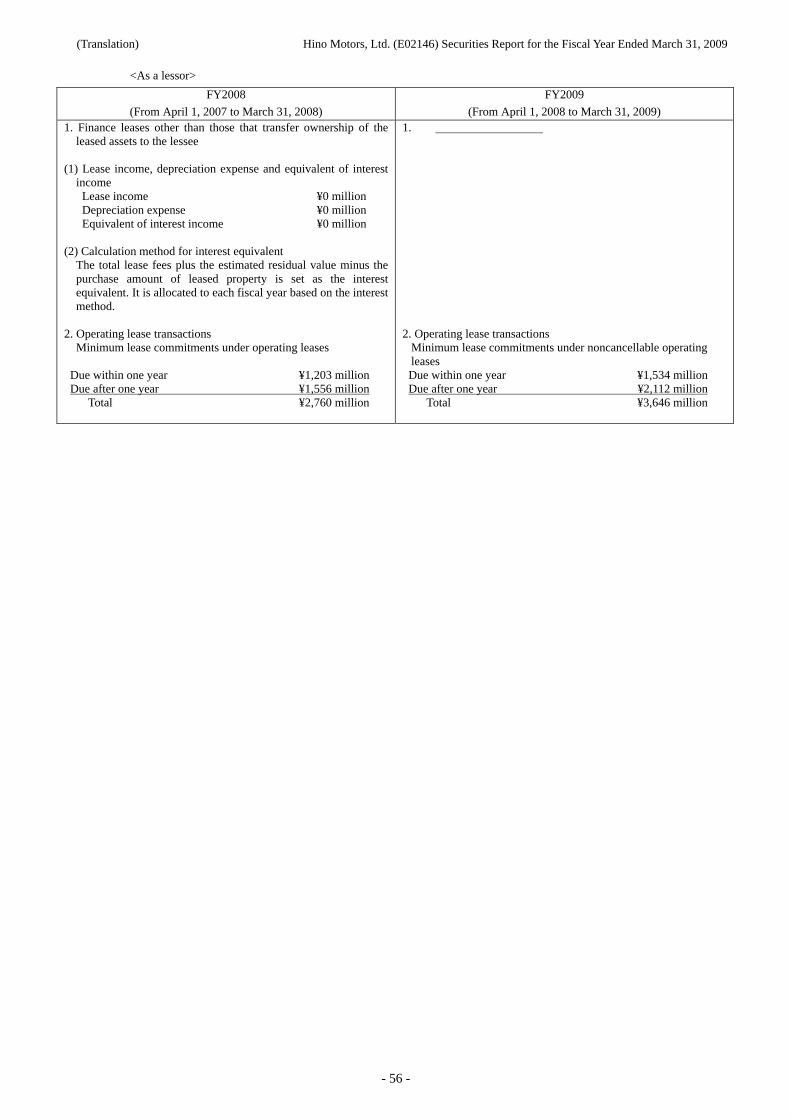
(Translation) Hino Motors, Ltd. (E02146) Securities Report for the Fiscal Year Ended March 31, 2009
- 56 -
<As a lessor>
FY2008
(From April 1, 2007 to March 31, 2008)
FY2009
(From April 1, 2008 to March 31, 2009) 1. Finance leases other than those that transfer ownership of the
leased assets to the lessee (1) Lease income, depreciation expense and equivalent of interest
income Lease income ¥0 million Depreciation expense ¥0 million Equivalent of interest income ¥0 million
(2) Calculation method for interest equivalent
The total lease fees plus the estimated residual value minus the purchase amount of leased property is set as the interest equivalent. It is allocated to each fiscal year based on the interest method.
2. Operating lease transactions
Minimum lease commitments under operating leases Due within one year ¥1,203 million Due after one year ¥1,556 million
Total ¥2,760 million
1. 2. Operating lease transactions
Minimum lease commitments under noncancellable operating leases Due within one year ¥1,534 million Due after one year ¥2,112 million
Total ¥3,646 million
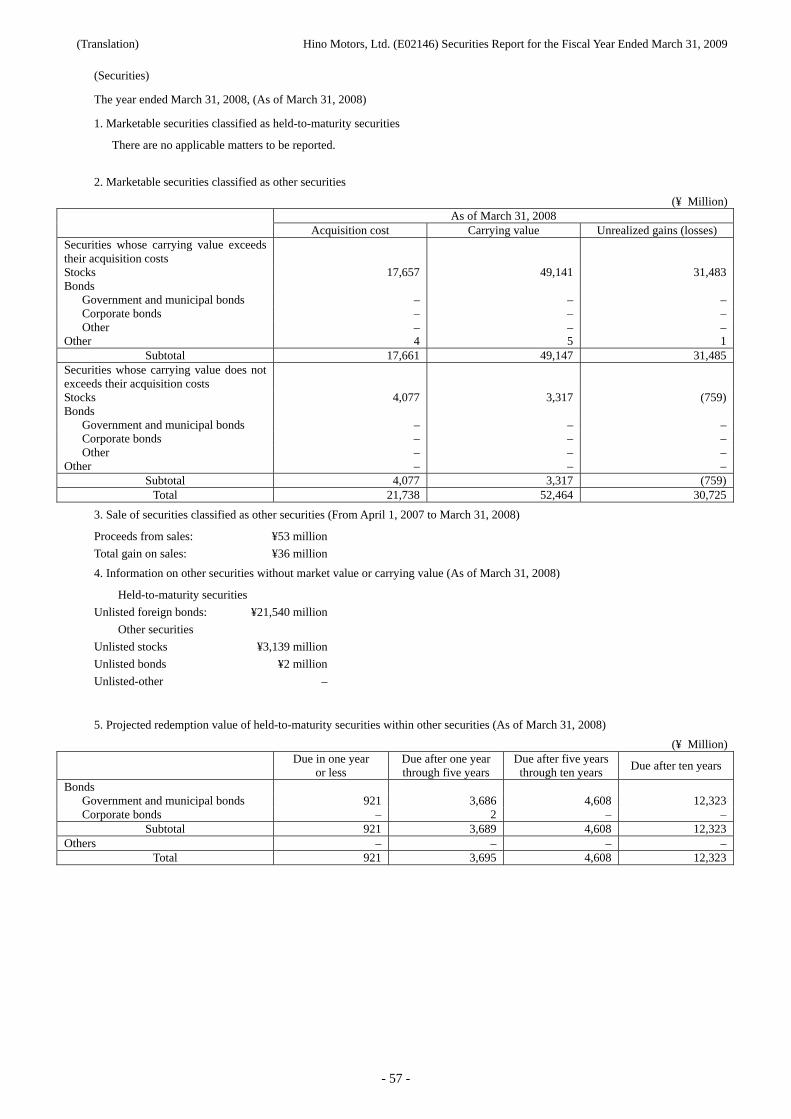
(Translation) Hino Motors, Ltd. (E02146) Securities Report for the Fiscal Year Ended March 31, 2009
- 57 -
(Securities)
The year ended March 31, 2008, (As of March 31, 2008)
1. Marketable securities classified as held-to-maturity securities
There are no applicable matters to be reported.
2. Marketable securities classified as other securities
(¥ Million) As of March 31, 2008
Acquisition cost Carrying value Unrealized gains (losses) Securities whose carrying value exceeds their acquisition costs
Stocks 17,657 49,141 31,483Bonds
Government and municipal bonds – – –Corporate bonds – – –Other – – –
Other 4 5 1Subtotal 17,661 49,147 31,485
Securities whose carrying value does not exceeds their acquisition costs
Stocks 4,077 3,317 (759)Bonds
Government and municipal bonds – – –Corporate bonds – – –Other – – –
Other – – –Subtotal 4,077 3,317 (759)
Total 21,738 52,464 30,725
3. Sale of securities classified as other securities (From April 1, 2007 to March 31, 2008)
Proceeds from sales: ¥53 million
Total gain on sales: ¥36 million
4. Information on other securities without market value or carrying value (As of March 31, 2008)
Held-to-maturity securities
Unlisted foreign bonds: ¥21,540 million
Other securities
Unlisted stocks ¥3,139 million
Unlisted bonds ¥2 million
Unlisted-other –
5. Projected redemption value of held-to-maturity securities within other securities (As of March 31, 2008)
(¥ Million)
Due in one year
or less Due after one year through five years
Due after five years through ten years
Due after ten years
Bonds Government and municipal bonds 921 3,686 4,608 12,323Corporate bonds – 2 – –
Subtotal 921 3,689 4,608 12,323Others – – – –
Total 921 3,695 4,608 12,323
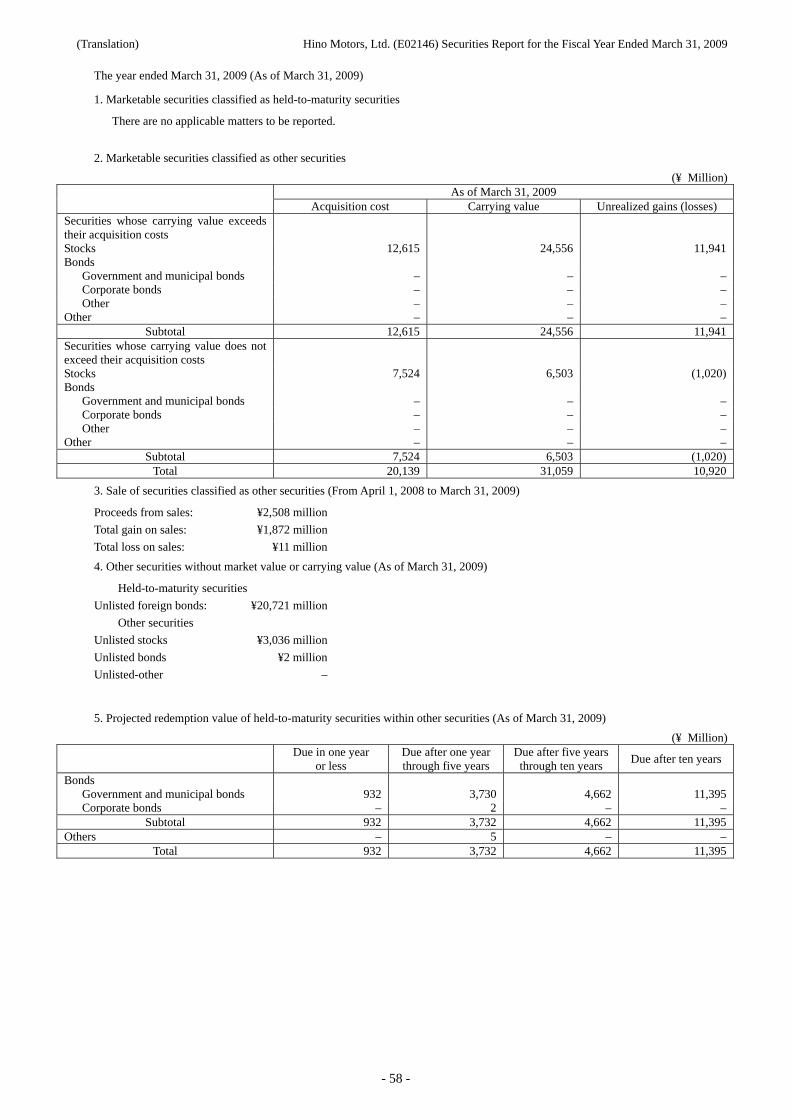
(Translation) Hino Motors, Ltd. (E02146) Securities Report for the Fiscal Year Ended March 31, 2009
- 58 -
The year ended March 31, 2009 (As of March 31, 2009)
1. Marketable securities classified as held-to-maturity securities
There are no applicable matters to be reported.
2. Marketable securities classified as other securities
(¥ Million) As of March 31, 2009
Acquisition cost Carrying value Unrealized gains (losses) Securities whose carrying value exceeds their acquisition costs
Stocks 12,615 24,556 11,941Bonds
Government and municipal bonds – – –Corporate bonds – – –Other – – –
Other – – –Subtotal 12,615 24,556 11,941
Securities whose carrying value does not exceed their acquisition costs
Stocks 7,524 6,503 (1,020)Bonds
Government and municipal bonds – – –Corporate bonds – – –Other – – –
Other – – –Subtotal 7,524 6,503 (1,020)
Total 20,139 31,059 10,920
3. Sale of securities classified as other securities (From April 1, 2008 to March 31, 2009)
Proceeds from sales: ¥2,508 million
Total gain on sales: ¥1,872 million
Total loss on sales: ¥11 million
4. Other securities without market value or carrying value (As of March 31, 2009)
Held-to-maturity securities
Unlisted foreign bonds: ¥20,721 million
Other securities
Unlisted stocks ¥3,036 million
Unlisted bonds ¥2 million
Unlisted-other –
5. Projected redemption value of held-to-maturity securities within other securities (As of March 31, 2009)
(¥ Million)
Due in one year
or less Due after one year through five years
Due after five years through ten years
Due after ten years
Bonds Government and municipal bonds 932 3,730 4,662 11,395Corporate bonds – 2 – –
Subtotal 932 3,732 4,662 11,395Others – 5 – –
Total 932 3,732 4,662 11,395
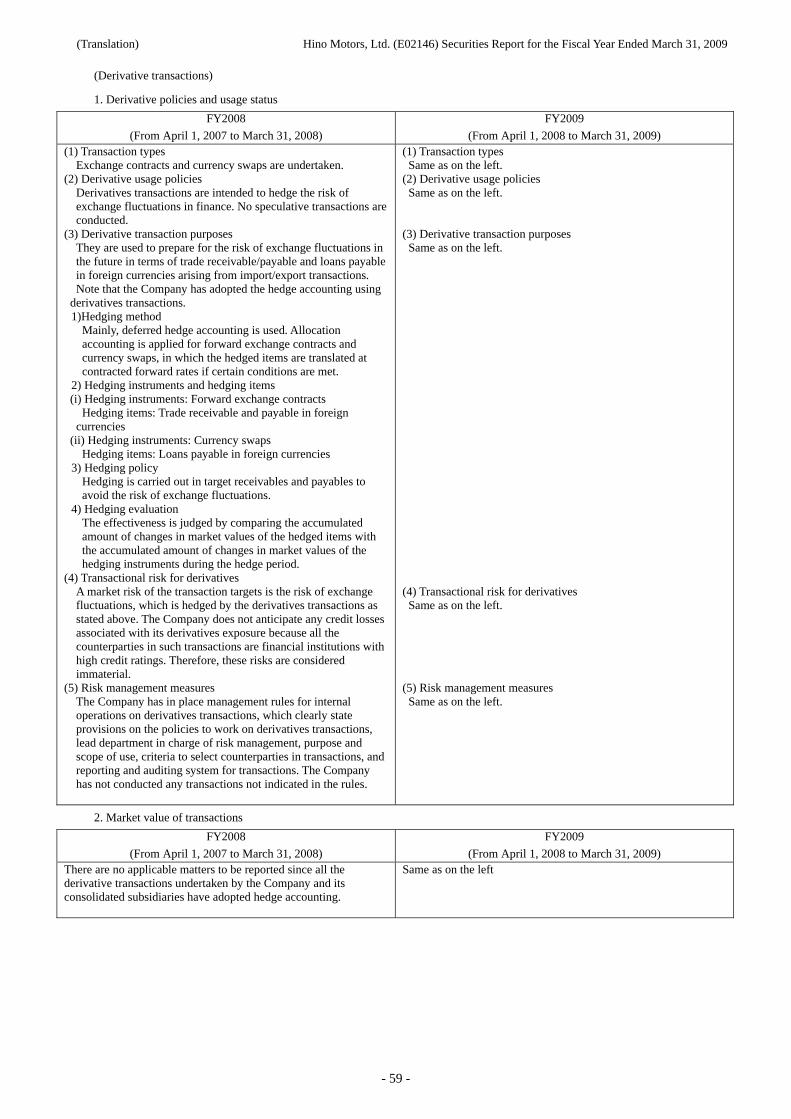
(Translation) Hino Motors, Ltd. (E02146) Securities Report for the Fiscal Year Ended March 31, 2009
- 59 -
(Derivative transactions)
1. Derivative policies and usage status
FY2008
(From April 1, 2007 to March 31, 2008)
FY2009
(From April 1, 2008 to March 31, 2009) (1) Transaction types
Exchange contracts and currency swaps are undertaken. (2) Derivative usage policies
Derivatives transactions are intended to hedge the risk of exchange fluctuations in finance. No speculative transactions are conducted.
(3) Derivative transaction purposes They are used to prepare for the risk of exchange fluctuations in the future in terms of trade receivable/payable and loans payable in foreign currencies arising from import/export transactions. Note that the Company has adopted the hedge accounting using
derivatives transactions. 1)Hedging method
Mainly, deferred hedge accounting is used. Allocation accounting is applied for forward exchange contracts and currency swaps, in which the hedged items are translated at contracted forward rates if certain conditions are met.
2) Hedging instruments and hedging items (i) Hedging instruments: Forward exchange contracts
Hedging items: Trade receivable and payable in foreign currencies
(ii) Hedging instruments: Currency swaps Hedging items: Loans payable in foreign currencies
3) Hedging policy Hedging is carried out in target receivables and payables to avoid the risk of exchange fluctuations.
4) Hedging evaluation The effectiveness is judged by comparing the accumulated amount of changes in market values of the hedged items with the accumulated amount of changes in market values of the hedging instruments during the hedge period.
(4) Transactional risk for derivatives A market risk of the transaction targets is the risk of exchange fluctuations, which is hedged by the derivatives transactions as stated above. The Company does not anticipate any credit losses associated with its derivatives exposure because all the counterparties in such transactions are financial institutions with high credit ratings. Therefore, these risks are considered immaterial.
(5) Risk management measures The Company has in place management rules for internal operations on derivatives transactions, which clearly state provisions on the policies to work on derivatives transactions, lead department in charge of risk management, purpose and scope of use, criteria to select counterparties in transactions, and reporting and auditing system for transactions. The Company has not conducted any transactions not indicated in the rules.
(1) Transaction types Same as on the left.
(2) Derivative usage policies Same as on the left.
(3) Derivative transaction purposes Same as on the left.
(4) Transactional risk for derivatives Same as on the left.
(5) Risk management measures Same as on the left.
2. Market value of transactions
FY2008
(From April 1, 2007 to March 31, 2008)
FY2009
(From April 1, 2008 to March 31, 2009) There are no applicable matters to be reported since all the derivative transactions undertaken by the Company and its consolidated subsidiaries have adopted hedge accounting.
Same as on the left
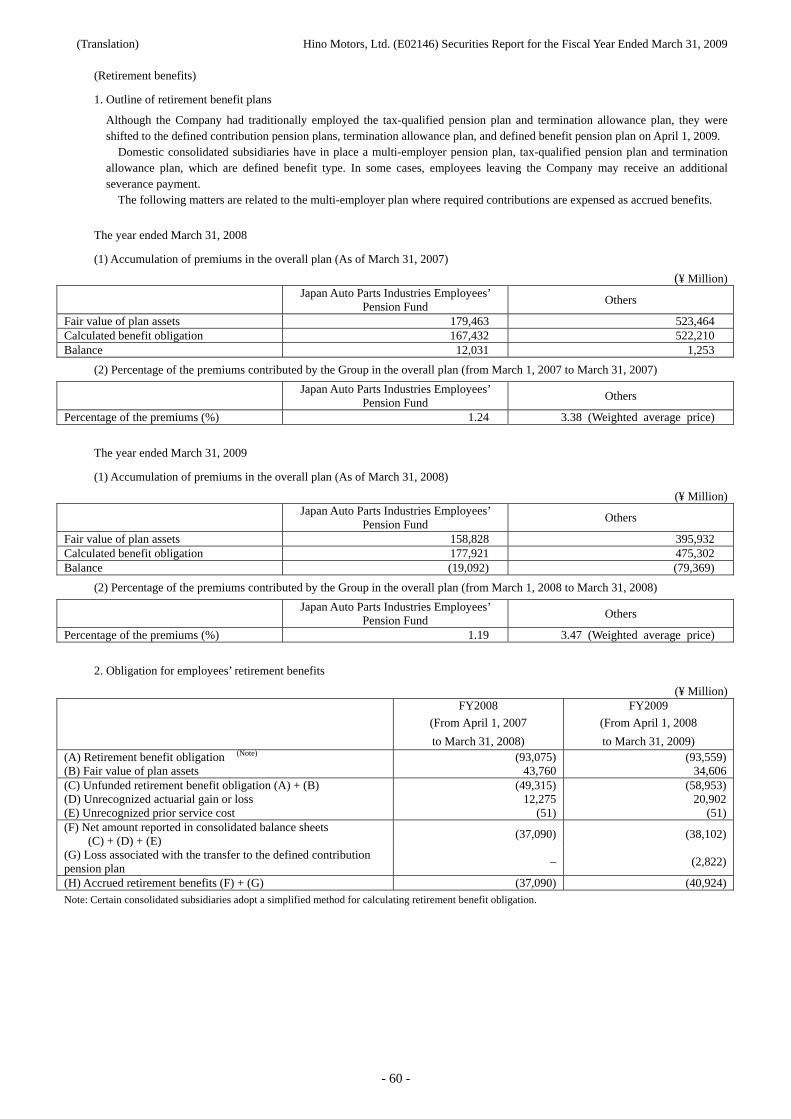
(Translation) Hino Motors, Ltd. (E02146) Securities Report for the Fiscal Year Ended March 31, 2009
- 60 -
(Retirement benefits)
1. Outline of retirement benefit plans
Although the Company had traditionally employed the tax-qualified pension plan and termination allowance plan, they were shifted to the defined contribution pension plans, termination allowance plan, and defined benefit pension plan on April 1, 2009.
Domestic consolidated subsidiaries have in place a multi-employer pension plan, tax-qualified pension plan and termination allowance plan, which are defined benefit type. In some cases, employees leaving the Company may receive an additional severance payment.
The following matters are related to the multi-employer plan where required contributions are expensed as accrued benefits.
The year ended March 31, 2008
(1) Accumulation of premiums in the overall plan (As of March 31, 2007)
(¥ Million)
Japan Auto Parts Industries Employees’
Pension Fund Others
Fair value of plan assets 179,463 523,464 Calculated benefit obligation 167,432 522,210 Balance 12,031 1,253
(2) Percentage of the premiums contributed by the Group in the overall plan (from March 1, 2007 to March 31, 2007)
Japan Auto Parts Industries Employees’ Pension Fund
Others
Percentage of the premiums (%) 1.24 3.38 (Weighted average price)
The year ended March 31, 2009
(1) Accumulation of premiums in the overall plan (As of March 31, 2008)
(¥ Million)
Japan Auto Parts Industries Employees’
Pension Fund Others
Fair value of plan assets 158,828 395,932 Calculated benefit obligation 177,921 475,302 Balance (19,092) (79,369)
(2) Percentage of the premiums contributed by the Group in the overall plan (from March 1, 2008 to March 31, 2008)
Japan Auto Parts Industries Employees’ Pension Fund
Others
Percentage of the premiums (%) 1.19 3.47 (Weighted average price)
2. Obligation for employees’ retirement benefits
(¥ Million) FY2008
(From April 1, 2007
to March 31, 2008)
FY2009
(From April 1, 2008
to March 31, 2009) (A) Retirement benefit obligation (Note) (93,075) (93,559)(B) Fair value of plan assets 43,760 34,606(C) Unfunded retirement benefit obligation (A) + (B) (49,315) (58,953)(D) Unrecognized actuarial gain or loss 12,275 20,902(E) Unrecognized prior service cost (51) (51)(F) Net amount reported in consolidated balance sheets (C) + (D) + (E)
(37,090) (38,102)
(G) Loss associated with the transfer to the defined contribution pension plan
– (2,822)
(H) Accrued retirement benefits (F) + (G) (37,090) (40,924)Note: Certain consolidated subsidiaries adopt a simplified method for calculating retirement benefit obligation.
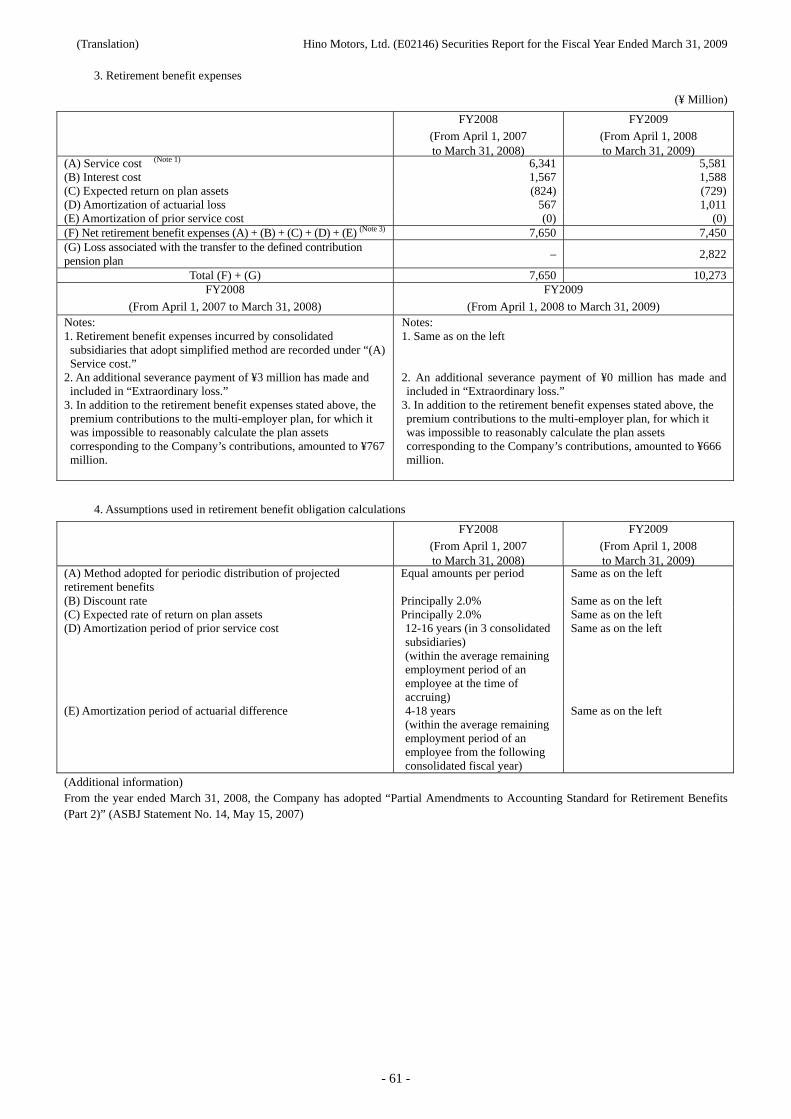
(Translation) Hino Motors, Ltd. (E02146) Securities Report for the Fiscal Year Ended March 31, 2009
- 61 -
3. Retirement benefit expenses
(¥ Million)
FY2008
(From April 1, 2007 to March 31, 2008)
FY2009
(From April 1, 2008 to March 31, 2009)
(A) Service cost (Note 1) 6,341 5,581(B) Interest cost 1,567 1,588(C) Expected return on plan assets (824) (729)(D) Amortization of actuarial loss 567 1,011(E) Amortization of prior service cost (0) (0)(F) Net retirement benefit expenses (A) + (B) + (C) + (D) + (E) (Note 3) 7,650 7,450(G) Loss associated with the transfer to the defined contribution pension plan
– 2,822
Total (F) + (G) 7,650 10,273FY2008
(From April 1, 2007 to March 31, 2008)
FY2009
(From April 1, 2008 to March 31, 2009) Notes: 1. Retirement benefit expenses incurred by consolidated subsidiaries that adopt simplified method are recorded under “(A) Service cost.”
2. An additional severance payment of ¥3 million has made and included in “Extraordinary loss.”
3. In addition to the retirement benefit expenses stated above, the premium contributions to the multi-employer plan, for which it was impossible to reasonably calculate the plan assets corresponding to the Company’s contributions, amounted to ¥767 million.
Notes: 1. Same as on the left 2. An additional severance payment of ¥0 million has made and included in “Extraordinary loss.”
3. In addition to the retirement benefit expenses stated above, the premium contributions to the multi-employer plan, for which it was impossible to reasonably calculate the plan assets corresponding to the Company’s contributions, amounted to ¥666 million.
4. Assumptions used in retirement benefit obligation calculations
FY2008
(From April 1, 2007 to March 31, 2008)
FY2009
(From April 1, 2008 to March 31, 2009)
(A) Method adopted for periodic distribution of projected retirement benefits
Equal amounts per period Same as on the left
(B) Discount rate Principally 2.0% Same as on the left (C) Expected rate of return on plan assets Principally 2.0% Same as on the left (D) Amortization period of prior service cost 12-16 years (in 3 consolidated
subsidiaries) (within the average remaining employment period of an employee at the time of accruing)
Same as on the left
(E) Amortization period of actuarial difference 4-18 years (within the average remaining employment period of an employee from the following consolidated fiscal year)
Same as on the left
(Additional information) From the year ended March 31, 2008, the Company has adopted “Partial Amendments to Accounting Standard for Retirement Benefits (Part 2)” (ASBJ Statement No. 14, May 15, 2007)
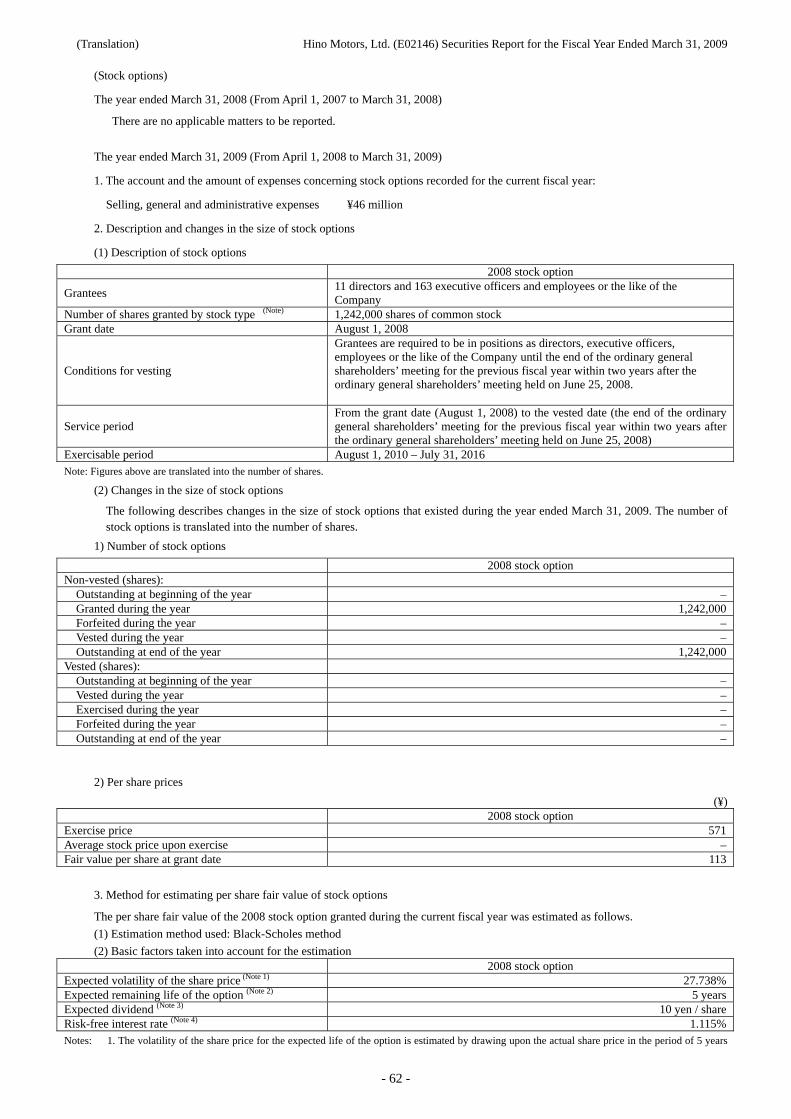
(Translation) Hino Motors, Ltd. (E02146) Securities Report for the Fiscal Year Ended March 31, 2009
- 62 -
(Stock options)
The year ended March 31, 2008 (From April 1, 2007 to March 31, 2008)
There are no applicable matters to be reported.
The year ended March 31, 2009 (From April 1, 2008 to March 31, 2009)
1. The account and the amount of expenses concerning stock options recorded for the current fiscal year:
Selling, general and administrative expenses ¥46 million
2. Description and changes in the size of stock options
(1) Description of stock options
2008 stock option
Grantees 11 directors and 163 executive officers and employees or the like of the Company
Number of shares granted by stock type (Note) 1,242,000 shares of common stock Grant date August 1, 2008
Conditions for vesting
Grantees are required to be in positions as directors, executive officers, employees or the like of the Company until the end of the ordinary general shareholders’ meeting for the previous fiscal year within two years after the ordinary general shareholders’ meeting held on June 25, 2008.
Service period From the grant date (August 1, 2008) to the vested date (the end of the ordinary general shareholders’ meeting for the previous fiscal year within two years after the ordinary general shareholders’ meeting held on June 25, 2008)
Exercisable period August 1, 2010 – July 31, 2016 Note: Figures above are translated into the number of shares.
(2) Changes in the size of stock options
The following describes changes in the size of stock options that existed during the year ended March 31, 2009. The number of stock options is translated into the number of shares.
1) Number of stock options
2008 stock option Non-vested (shares):
Outstanding at beginning of the year –Granted during the year 1,242,000Forfeited during the year –Vested during the year –Outstanding at end of the year 1,242,000
Vested (shares): Outstanding at beginning of the year –Vested during the year –Exercised during the year –Forfeited during the year –Outstanding at end of the year –
2) Per share prices
(¥) 2008 stock option Exercise price 571Average stock price upon exercise –Fair value per share at grant date 113
3. Method for estimating per share fair value of stock options
The per share fair value of the 2008 stock option granted during the current fiscal year was estimated as follows.
(1) Estimation method used: Black-Scholes method
(2) Basic factors taken into account for the estimation 2008 stock option Expected volatility of the share price (Note 1) 27.738%Expected remaining life of the option (Note 2) 5 yearsExpected dividend (Note 3) 10 yen / shareRisk-free interest rate (Note 4) 1.115%Notes: 1. The volatility of the share price for the expected life of the option is estimated by drawing upon the actual share price in the period of 5 years
(Translation) Hino Motors, Ltd. (E02146) Securities Report for the Fiscal Year Ended March 31, 2009
- 63 -
from the grant date.
2. Because it is difficult to make a reasonable estimation based on the past result of options exercised, the expected life of the options is
estimated based on the assumption that the options are exercised at the midway point of the exercise period.
3. Estimation of the expected dividend is based on the dividend payment for the year ended March 31, 2008.
4. Risk-free interest rate is the compound interest yield on long-term government bond to the expected remaining life of the options.
4. Method for estimating the number of stock options vested
The Company has adopted a method to reflect a reasonable estimate of the options which may lapse in the future.
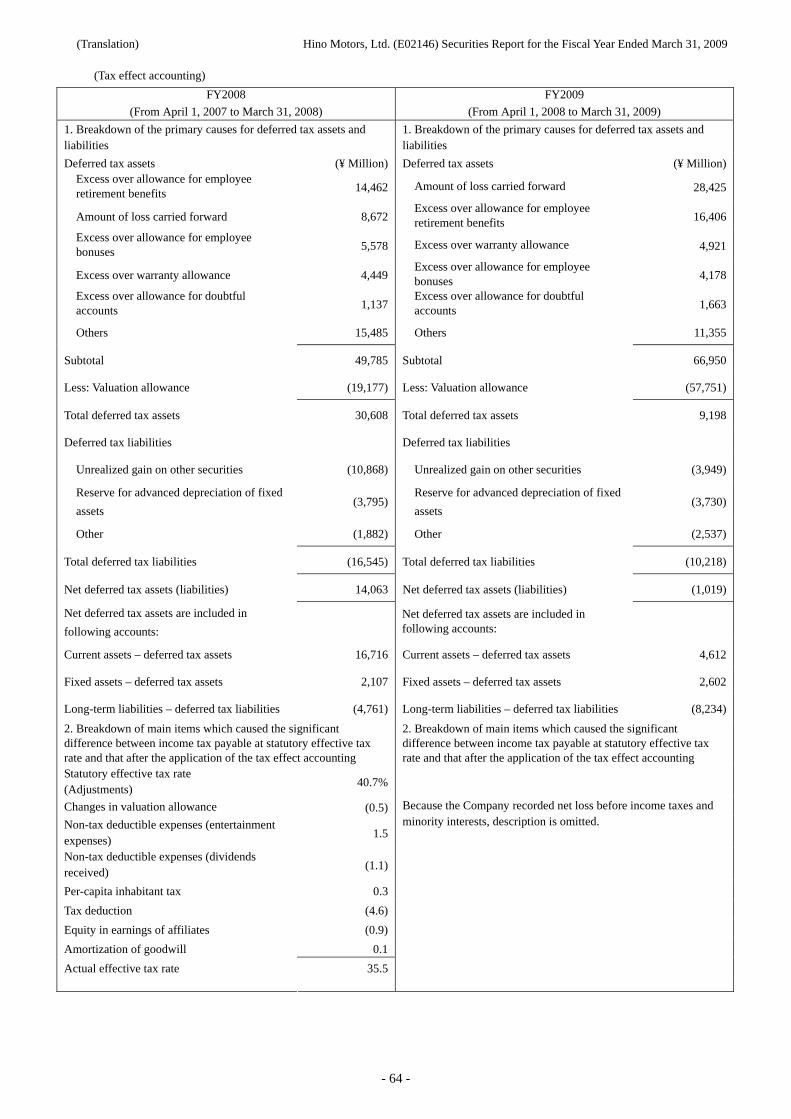
(Translation) Hino Motors, Ltd. (E02146) Securities Report for the Fiscal Year Ended March 31, 2009
- 64 -
(Tax effect accounting)
FY2008
(From April 1, 2007 to March 31, 2008)
FY2009
(From April 1, 2008 to March 31, 2009)
1. Breakdown of the primary causes for deferred tax assets and liabilities
1. Breakdown of the primary causes for deferred tax assets and liabilities
Deferred tax assets (¥ Million) Deferred tax assets (¥ Million)Excess over allowance for employee retirement benefits 14,462 Amount of loss carried forward 28,425
Amount of loss carried forward 8,672Excess over allowance for employee retirement benefits 16,406
Excess over allowance for employee bonuses 5,578 Excess over warranty allowance 4,921
Excess over warranty allowance 4,449Excess over allowance for employee bonuses 4,178
Excess over allowance for doubtful accounts 1,137
Excess over allowance for doubtful accounts 1,663
Others 15,485 Others 11,355
Subtotal 49,785 Subtotal 66,950
Less: Valuation allowance (19,177) Less: Valuation allowance (57,751)
Total deferred tax assets 30,608 Total deferred tax assets 9,198
Deferred tax liabilities Deferred tax liabilities
Unrealized gain on other securities (10,868) Unrealized gain on other securities (3,949)
Reserve for advanced depreciation of fixed
assets (3,795)
Reserve for advanced depreciation of fixed
assets (3,730)
Other (1,882) Other (2,537)
Total deferred tax liabilities (16,545) Total deferred tax liabilities (10,218)
Net deferred tax assets (liabilities) 14,063 Net deferred tax assets (liabilities) (1,019)
Net deferred tax assets are included in
following accounts:
Net deferred tax assets are included in following accounts:
Current assets – deferred tax assets 16,716 Current assets – deferred tax assets 4,612
Fixed assets – deferred tax assets 2,107 Fixed assets – deferred tax assets 2,602
Long-term liabilities – deferred tax liabilities (4,761) Long-term liabilities – deferred tax liabilities (8,234)
2. Breakdown of main items which caused the significant difference between income tax payable at statutory effective tax rate and that after the application of the tax effect accounting
2. Breakdown of main items which caused the significant difference between income tax payable at statutory effective tax rate and that after the application of the tax effect accounting
Statutory effective tax rate (Adjustments)
40.7%
Changes in valuation allowance (0.5)
Non-tax deductible expenses (entertainment expenses)
1.5
Because the Company recorded net loss before income taxes and minority interests, description is omitted.
Non-tax deductible expenses (dividends received)
(1.1)
Per-capita inhabitant tax 0.3
Tax deduction (4.6)
Equity in earnings of affiliates (0.9)
Amortization of goodwill 0.1
Actual effective tax rate 35.5
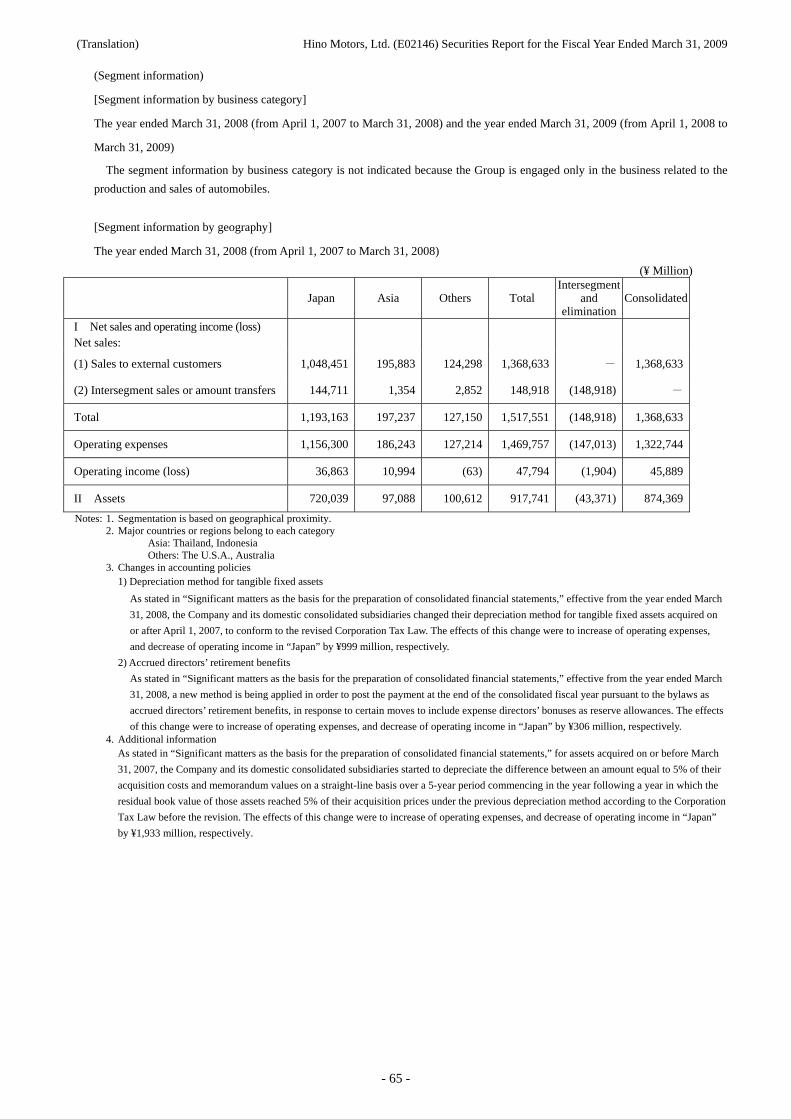
(Translation) Hino Motors, Ltd. (E02146) Securities Report for the Fiscal Year Ended March 31, 2009
- 65 -
(Segment information)
[Segment information by business category]
The year ended March 31, 2008 (from April 1, 2007 to March 31, 2008) and the year ended March 31, 2009 (from April 1, 2008 to
March 31, 2009)
The segment information by business category is not indicated because the Group is engaged only in the business related to the
production and sales of automobiles.
[Segment information by geography]
The year ended March 31, 2008 (from April 1, 2007 to March 31, 2008)
(¥ Million)
Japan Asia Others Total Intersegment
and elimination
Consolidated
I Net sales and operating income (loss) Net sales:
(1) Sales to external customers 1,048,451 195,883 124,298 1,368,633 - 1,368,633
(2) Intersegment sales or amount transfers 144,711 1,354 2,852 148,918 (148,918) -
Total 1,193,163 197,237 127,150 1,517,551 (148,918) 1,368,633
Operating expenses 1,156,300 186,243 127,214 1,469,757 (147,013) 1,322,744
Operating income (loss) 36,863 10,994 (63) 47,794 (1,904) 45,889
II Assets 720,039 97,088 100,612 917,741 (43,371) 874,369
Notes: 1. Segmentation is based on geographical proximity. 2. Major countries or regions belong to each category
Asia: Thailand, Indonesia Others: The U.S.A., Australia
3. Changes in accounting policies 1) Depreciation method for tangible fixed assets
As stated in “Significant matters as the basis for the preparation of consolidated financial statements,” effective from the year ended March
31, 2008, the Company and its domestic consolidated subsidiaries changed their depreciation method for tangible fixed assets acquired on
or after April 1, 2007, to conform to the revised Corporation Tax Law. The effects of this change were to increase of operating expenses,
and decrease of operating income in “Japan” by ¥999 million, respectively.
2) Accrued directors’ retirement benefits
As stated in “Significant matters as the basis for the preparation of consolidated financial statements,” effective from the year ended March
31, 2008, a new method is being applied in order to post the payment at the end of the consolidated fiscal year pursuant to the bylaws as
accrued directors’ retirement benefits, in response to certain moves to include expense directors’ bonuses as reserve allowances. The effects
of this change were to increase of operating expenses, and decrease of operating income in “Japan” by ¥306 million, respectively. 4. Additional information
As stated in “Significant matters as the basis for the preparation of consolidated financial statements,” for assets acquired on or before March
31, 2007, the Company and its domestic consolidated subsidiaries started to depreciate the difference between an amount equal to 5% of their
acquisition costs and memorandum values on a straight-line basis over a 5-year period commencing in the year following a year in which the
residual book value of those assets reached 5% of their acquisition prices under the previous depreciation method according to the Corporation
Tax Law before the revision. The effects of this change were to increase of operating expenses, and decrease of operating income in “Japan”
by ¥1,933 million, respectively.
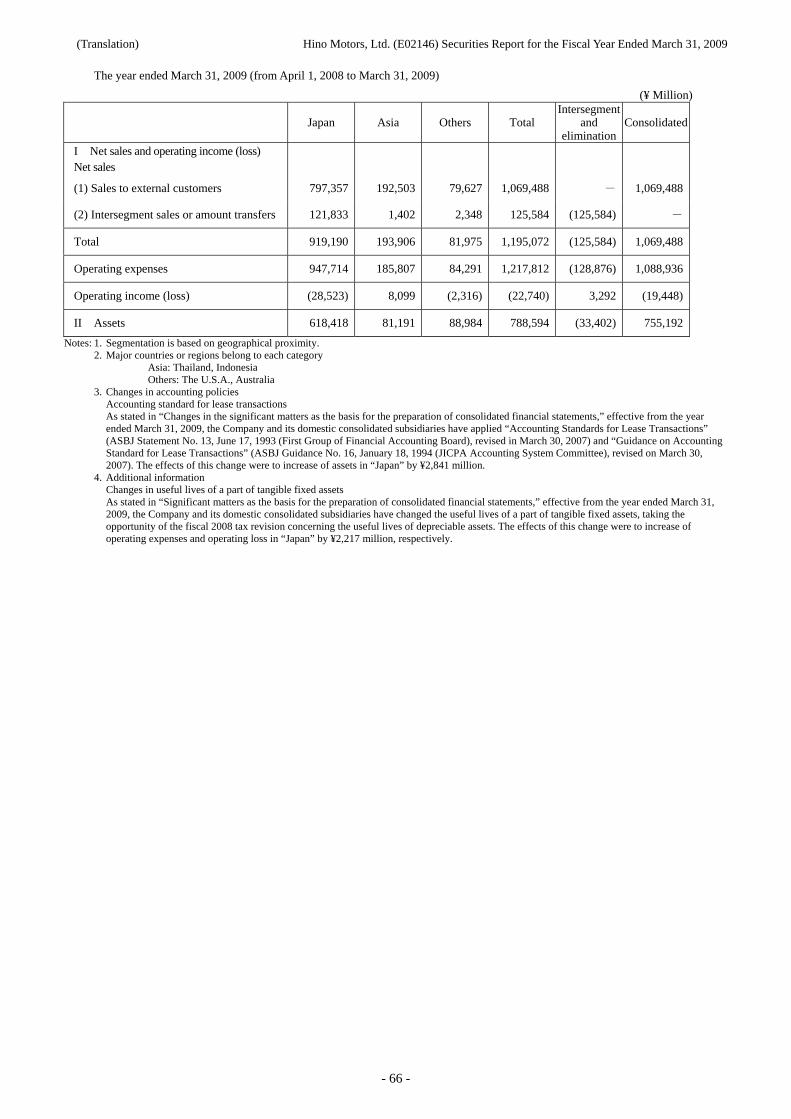
(Translation) Hino Motors, Ltd. (E02146) Securities Report for the Fiscal Year Ended March 31, 2009
- 66 -
The year ended March 31, 2009 (from April 1, 2008 to March 31, 2009)
(¥ Million)
Japan Asia Others Total Intersegment
and elimination
Consolidated
I Net sales and operating income (loss) Net sales
(1) Sales to external customers 797,357 192,503 79,627 1,069,488 - 1,069,488
(2) Intersegment sales or amount transfers 121,833 1,402 2,348 125,584 (125,584) -
Total 919,190 193,906 81,975 1,195,072 (125,584) 1,069,488
Operating expenses 947,714 185,807 84,291 1,217,812 (128,876) 1,088,936
Operating income (loss) (28,523) 8,099 (2,316) (22,740) 3,292 (19,448)
II Assets 618,418 81,191 88,984 788,594 (33,402) 755,192
Notes: 1. Segmentation is based on geographical proximity. 2. Major countries or regions belong to each category
Asia: Thailand, Indonesia Others: The U.S.A., Australia
3. Changes in accounting policies Accounting standard for lease transactions
As stated in “Changes in the significant matters as the basis for the preparation of consolidated financial statements,” effective from the year ended March 31, 2009, the Company and its domestic consolidated subsidiaries have applied “Accounting Standards for Lease Transactions” (ASBJ Statement No. 13, June 17, 1993 (First Group of Financial Accounting Board), revised in March 30, 2007) and “Guidance on Accounting Standard for Lease Transactions” (ASBJ Guidance No. 16, January 18, 1994 (JICPA Accounting System Committee), revised on March 30, 2007). The effects of this change were to increase of assets in “Japan” by ¥2,841 million.
4. Additional information Changes in useful lives of a part of tangible fixed assets As stated in “Significant matters as the basis for the preparation of consolidated financial statements,” effective from the year ended March 31, 2009, the Company and its domestic consolidated subsidiaries have changed the useful lives of a part of tangible fixed assets, taking the opportunity of the fiscal 2008 tax revision concerning the useful lives of depreciable assets. The effects of this change were to increase of operating expenses and operating loss in “Japan” by ¥2,217 million, respectively.
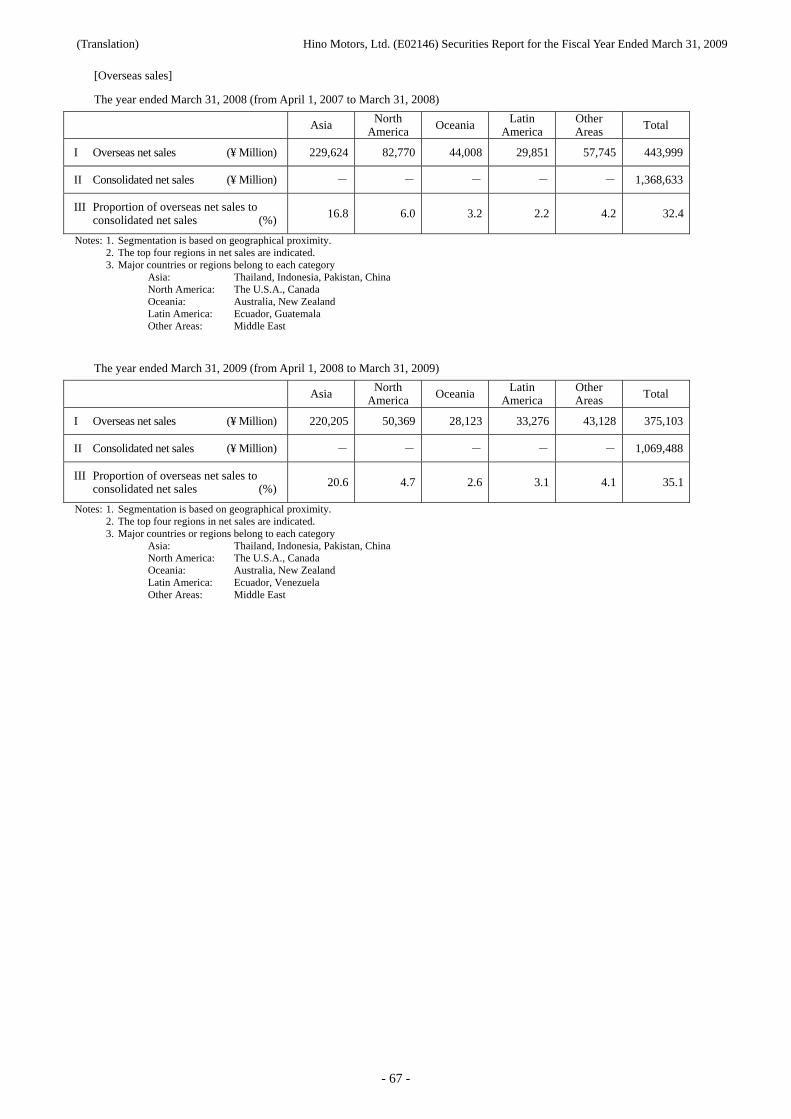
(Translation) Hino Motors, Ltd. (E02146) Securities Report for the Fiscal Year Ended March 31, 2009
- 67 -
[Overseas sales]
The year ended March 31, 2008 (from April 1, 2007 to March 31, 2008)
Asia North America
Oceania Latin America
Other Areas
Total
I Overseas net sales (¥ Million) 229,624 82,770 44,008 29,851 57,745 443,999
II Consolidated net sales (¥ Million) - - - - - 1,368,633
III Proportion of overseas net sales to consolidated net sales (%)
16.8 6.0 3.2 2.2 4.2 32.4
Notes: 1. Segmentation is based on geographical proximity. 2. The top four regions in net sales are indicated. 3. Major countries or regions belong to each category Asia: Thailand, Indonesia, Pakistan, China North America: The U.S.A., Canada Oceania: Australia, New Zealand Latin America: Ecuador, Guatemala Other Areas: Middle East
The year ended March 31, 2009 (from April 1, 2008 to March 31, 2009)
Asia North America Oceania Latin
America Other Areas Total
I Overseas net sales (¥ Million) 220,205 50,369 28,123 33,276 43,128 375,103
II Consolidated net sales (¥ Million) - - - - - 1,069,488
III Proportion of overseas net sales to consolidated net sales (%) 20.6 4.7 2.6 3.1 4.1 35.1
Notes: 1. Segmentation is based on geographical proximity. 2. The top four regions in net sales are indicated. 3. Major countries or regions belong to each category Asia: Thailand, Indonesia, Pakistan, China North America: The U.S.A., Canada Oceania: Australia, New Zealand Latin America: Ecuador, Venezuela Other Areas: Middle East
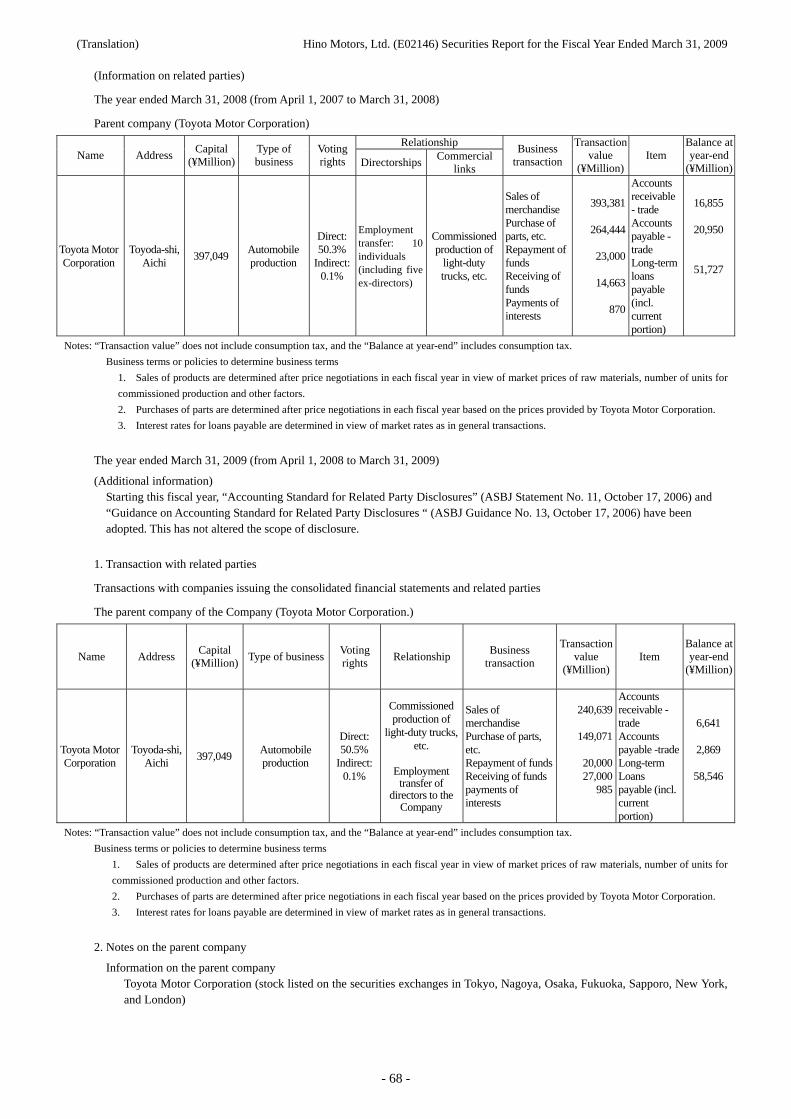
(Translation) Hino Motors, Ltd. (E02146) Securities Report for the Fiscal Year Ended March 31, 2009
- 68 -
(Information on related parties)
The year ended March 31, 2008 (from April 1, 2007 to March 31, 2008)
Parent company (Toyota Motor Corporation)
Relationship Name Address
Capital (¥Million)
Type of business
Voting rights Directorships
Commercial links
Business transaction
Transaction value
(¥Million) Item
Balance at year-end
(¥Million)
Toyota Motor Corporation
Toyoda-shi, Aichi
397,049 Automobile production
Direct: 50.3%
Indirect: 0.1%
Employment transfer: 10 individuals (including five ex-directors)
Commissioned production of
light-duty trucks, etc.
Sales of merchandise Purchase of parts, etc. Repayment of funds Receiving of funds Payments of interests
393,381
264,444
23,000
14,663
870
Accounts receivable - trade Accounts payable - trade Long-term loans payable (incl. current portion)
16,855
20,950
51,727
Notes: “Transaction value” does not include consumption tax, and the “Balance at year-end” includes consumption tax.
Business terms or policies to determine business terms
1. Sales of products are determined after price negotiations in each fiscal year in view of market prices of raw materials, number of units for
commissioned production and other factors.
2. Purchases of parts are determined after price negotiations in each fiscal year based on the prices provided by Toyota Motor Corporation.
3. Interest rates for loans payable are determined in view of market rates as in general transactions.
The year ended March 31, 2009 (from April 1, 2008 to March 31, 2009)
(Additional information) Starting this fiscal year, “Accounting Standard for Related Party Disclosures” (ASBJ Statement No. 11, October 17, 2006) and “Guidance on Accounting Standard for Related Party Disclosures “ (ASBJ Guidance No. 13, October 17, 2006) have been adopted. This has not altered the scope of disclosure.
1. Transaction with related parties
Transactions with companies issuing the consolidated financial statements and related parties
The parent company of the Company (Toyota Motor Corporation.)
Name Address Capital
(¥Million)Type of business
Voting rights
Relationship Business
transaction
Transaction value
(¥Million) Item
Balance at year-end
(¥Million)
Toyota Motor Corporation
Toyoda-shi, Aichi
397,049 Automobile production
Direct: 50.5%
Indirect: 0.1%
Commissioned production of
light-duty trucks, etc.
Employment
transfer of directors to the
Company
Sales of merchandise Purchase of parts, etc. Repayment of fundsReceiving of fundspayments of interests
240,639
149,071
20,000 27,000
985
Accounts receivable - trade Accounts payable -tradeLong-term Loans payable (incl. current portion)
6,641
2,869
58,546
Notes: “Transaction value” does not include consumption tax, and the “Balance at year-end” includes consumption tax.
Business terms or policies to determine business terms
1. Sales of products are determined after price negotiations in each fiscal year in view of market prices of raw materials, number of units for
commissioned production and other factors.
2. Purchases of parts are determined after price negotiations in each fiscal year based on the prices provided by Toyota Motor Corporation.
3. Interest rates for loans payable are determined in view of market rates as in general transactions.
2. Notes on the parent company
Information on the parent company Toyota Motor Corporation (stock listed on the securities exchanges in Tokyo, Nagoya, Osaka, Fukuoka, Sapporo, New York, and London)
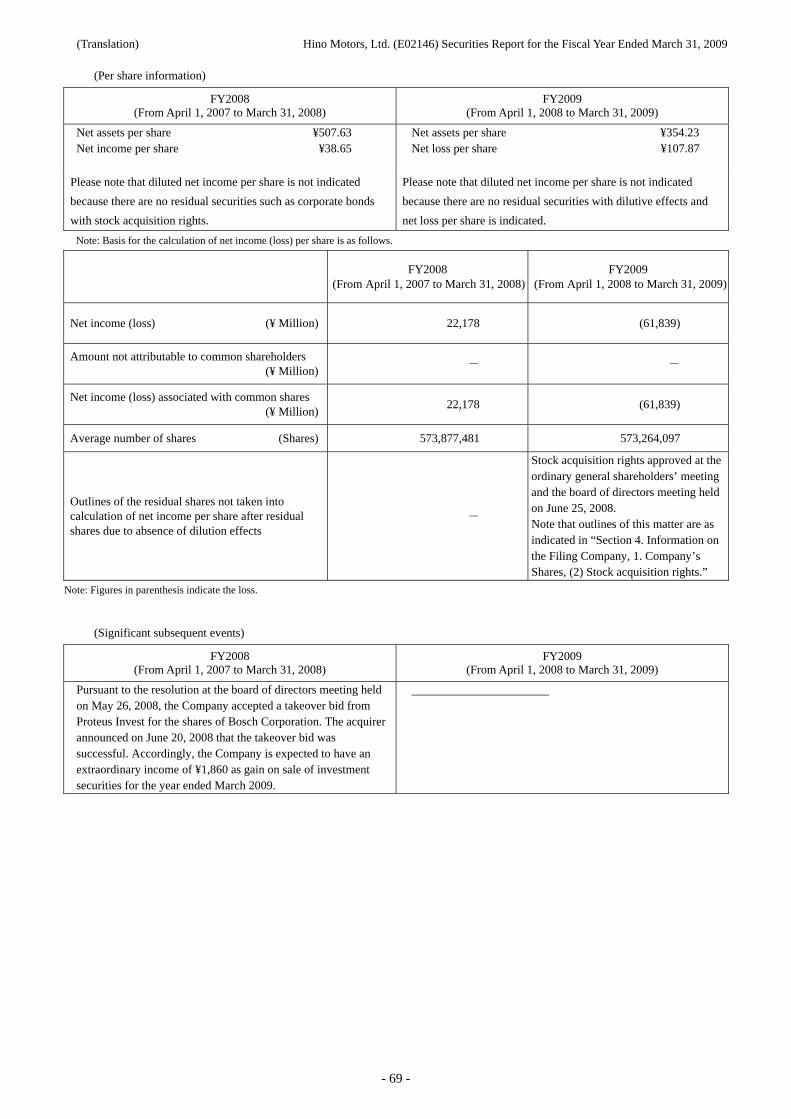
(Translation) Hino Motors, Ltd. (E02146) Securities Report for the Fiscal Year Ended March 31, 2009
- 69 -
(Per share information)
FY2008 (From April 1, 2007 to March 31, 2008)
FY2009 (From April 1, 2008 to March 31, 2009)
Net assets per share ¥507.63 Net income per share ¥38.65
Net assets per share ¥354.23 Net loss per share ¥107.87
Please note that diluted net income per share is not indicated
because there are no residual securities such as corporate bonds
with stock acquisition rights.
Please note that diluted net income per share is not indicated
because there are no residual securities with dilutive effects and
net loss per share is indicated.
Note: Basis for the calculation of net income (loss) per share is as follows.
FY2008
(From April 1, 2007 to March 31, 2008)FY2009
(From April 1, 2008 to March 31, 2009)
Net income (loss) (¥ Million) 22,178 (61,839)
Amount not attributable to common shareholders (¥ Million)
- -
Net income (loss) associated with common shares (¥ Million)
22,178 (61,839)
Average number of shares (Shares) 573,877,481 573,264,097
Outlines of the residual shares not taken into calculation of net income per share after residual shares due to absence of dilution effects
-
Stock acquisition rights approved at the ordinary general shareholders’ meeting and the board of directors meeting held on June 25, 2008. Note that outlines of this matter are as indicated in “Section 4. Information on the Filing Company, 1. Company’s Shares, (2) Stock acquisition rights.”
Note: Figures in parenthesis indicate the loss.
(Significant subsequent events)
FY2008 (From April 1, 2007 to March 31, 2008)
FY2009 (From April 1, 2008 to March 31, 2009)
Pursuant to the resolution at the board of directors meeting held on May 26, 2008, the Company accepted a takeover bid from Proteus Invest for the shares of Bosch Corporation. The acquirer announced on June 20, 2008 that the takeover bid was successful. Accordingly, the Company is expected to have an extraordinary income of ¥1,860 as gain on sale of investment securities for the year ended March 2009.
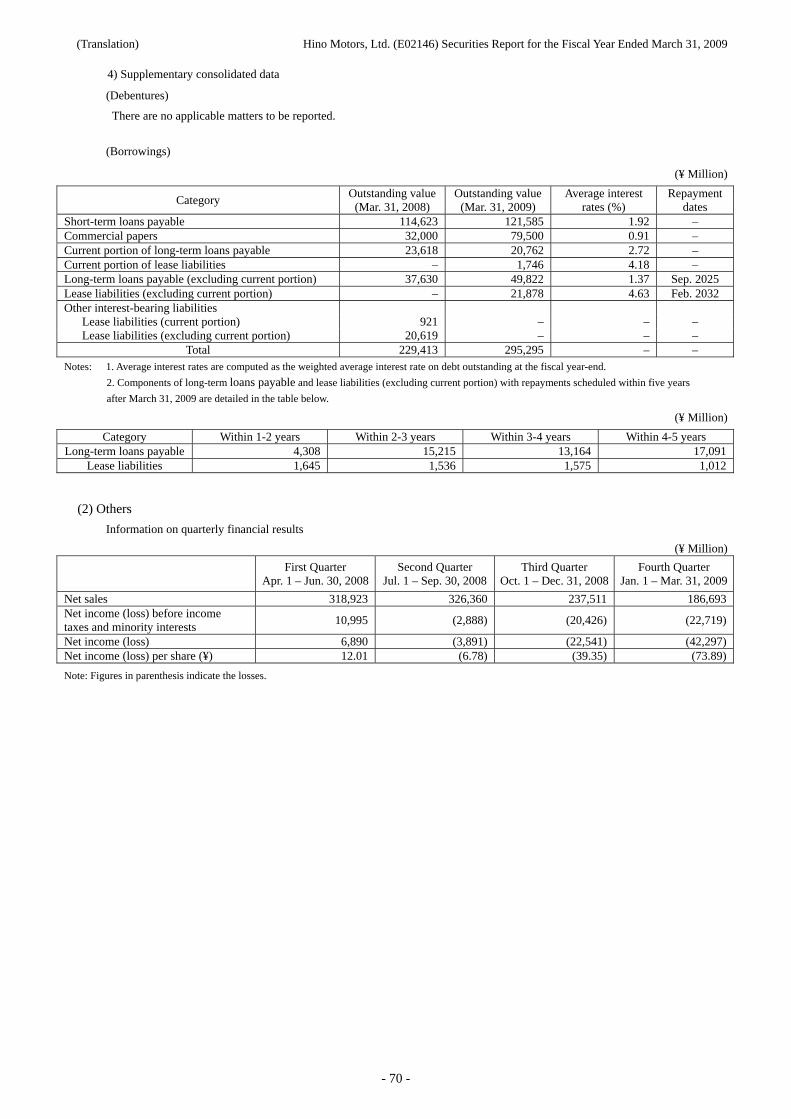
(Translation) Hino Motors, Ltd. (E02146) Securities Report for the Fiscal Year Ended March 31, 2009
- 70 -
4) Supplementary consolidated data
(Debentures)
There are no applicable matters to be reported.
(Borrowings)
(¥ Million)
Category Outstanding value
(Mar. 31, 2008) Outstanding value
(Mar. 31, 2009) Average interest
rates (%) Repayment
dates Short-term loans payable 114,623 121,585 1.92 – Commercial papers 32,000 79,500 0.91 – Current portion of long-term loans payable 23,618 20,762 2.72 – Current portion of lease liabilities – 1,746 4.18 – Long-term loans payable (excluding current portion) 37,630 49,822 1.37 Sep. 2025 Lease liabilities (excluding current portion) – 21,878 4.63 Feb. 2032 Other interest-bearing liabilities
Lease liabilities (current portion) 921 – – – Lease liabilities (excluding current portion) 20,619 – – –
Total 229,413 295,295 – – Notes: 1. Average interest rates are computed as the weighted average interest rate on debt outstanding at the fiscal year-end.
2. Components of long-term loans payable and lease liabilities (excluding current portion) with repayments scheduled within five years
after March 31, 2009 are detailed in the table below.
(¥ Million)
Category Within 1-2 years Within 2-3 years Within 3-4 years Within 4-5 years Long-term loans payable 4,308 15,215 13,164 17,091
Lease liabilities 1,645 1,536 1,575 1,012
(2) Others
Information on quarterly financial results
(¥ Million)
First Quarter
Apr. 1 – Jun. 30, 2008Second Quarter
Jul. 1 – Sep. 30, 2008Third Quarter
Oct. 1 – Dec. 31, 2008 Fourth Quarter
Jan. 1 – Mar. 31, 2009
Net sales 318,923 326,360 237,511 186,693Net income (loss) before income taxes and minority interests
10,995 (2,888) (20,426) (22,719)
Net income (loss) 6,890 (3,891) (22,541) (42,297)Net income (loss) per share (¥) 12.01 (6.78) (39.35) (73.89)
Note: Figures in parenthesis indicate the losses.
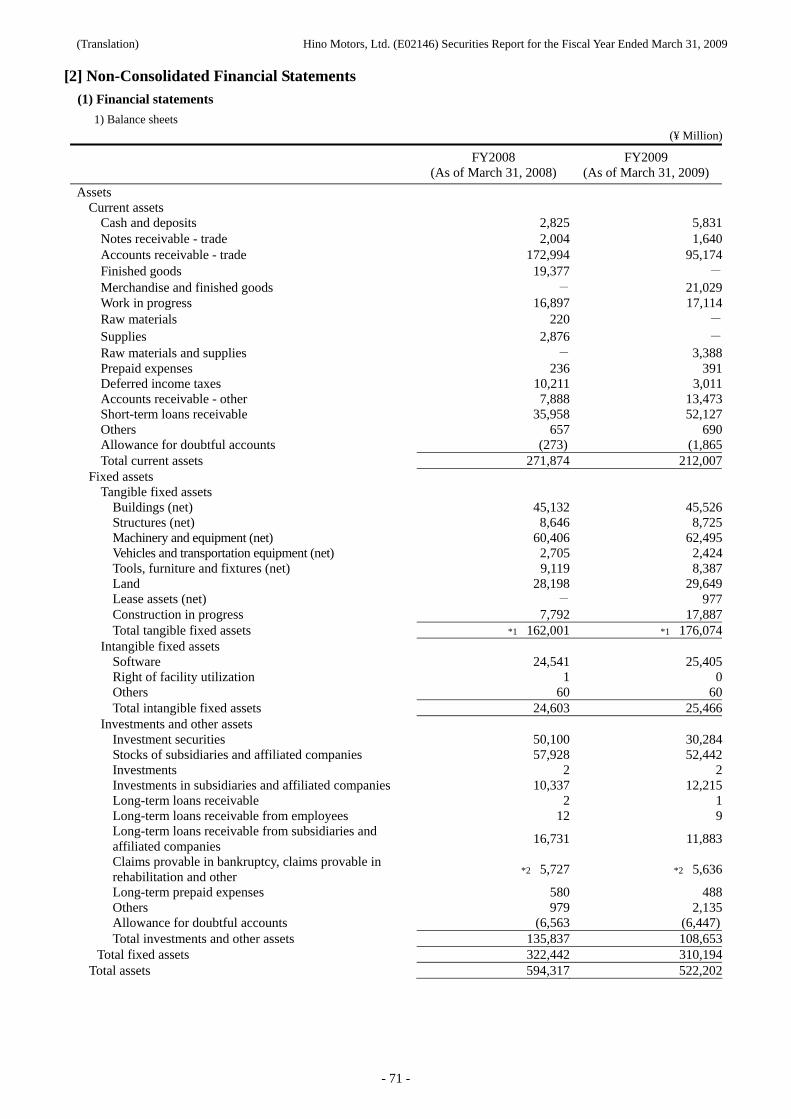
(Translation) Hino Motors, Ltd. (E02146) Securities Report for the Fiscal Year Ended March 31, 2009
- 71 -
[2] Non-Consolidated Financial Statements
(1) Financial statements
1) Balance sheets (¥ Million)
FY2008
(As of March 31, 2008) FY2009
(As of March 31, 2009)
Assets Current assets
Cash and deposits 2,825 5,831Notes receivable - trade 2,004 1,640Accounts receivable - trade 172,994 95,174Finished goods 19,377 -Merchandise and finished goods - 21,029Work in progress 16,897 17,114Raw materials 220 -
Supplies 2,876 -Raw materials and supplies - 3,388Prepaid expenses 236 391Deferred income taxes 10,211 3,011Accounts receivable - other 7,888 13,473Short-term loans receivable 35,958 52,127Others 657 690Allowance for doubtful accounts (273) (1,865Total current assets 271,874 212,007
Fixed assets Tangible fixed assets
Buildings (net) 45,132 45,526Structures (net) 8,646 8,725Machinery and equipment (net) 60,406 62,495Vehicles and transportation equipment (net) 2,705 2,424Tools, furniture and fixtures (net) 9,119 8,387Land 28,198 29,649Lease assets (net) - 977Construction in progress 7,792 17,887Total tangible fixed assets *1 162,001 *1 176,074
Intangible fixed assets Software 24,541 25,405Right of facility utilization 1 0Others 60 60Total intangible fixed assets 24,603 25,466
Investments and other assets Investment securities 50,100 30,284Stocks of subsidiaries and affiliated companies 57,928 52,442Investments 2 2Investments in subsidiaries and affiliated companies 10,337 12,215Long-term loans receivable 2 1Long-term loans receivable from employees 12 9Long-term loans receivable from subsidiaries and affiliated companies
16,731 11,883
Claims provable in bankruptcy, claims provable in rehabilitation and other
*2 5,727 *2 5,636
Long-term prepaid expenses 580 488Others 979 2,135Allowance for doubtful accounts (6,563 (6,447)Total investments and other assets 135,837 108,653
Total fixed assets 322,442 310,194Total assets 594,317 522,202
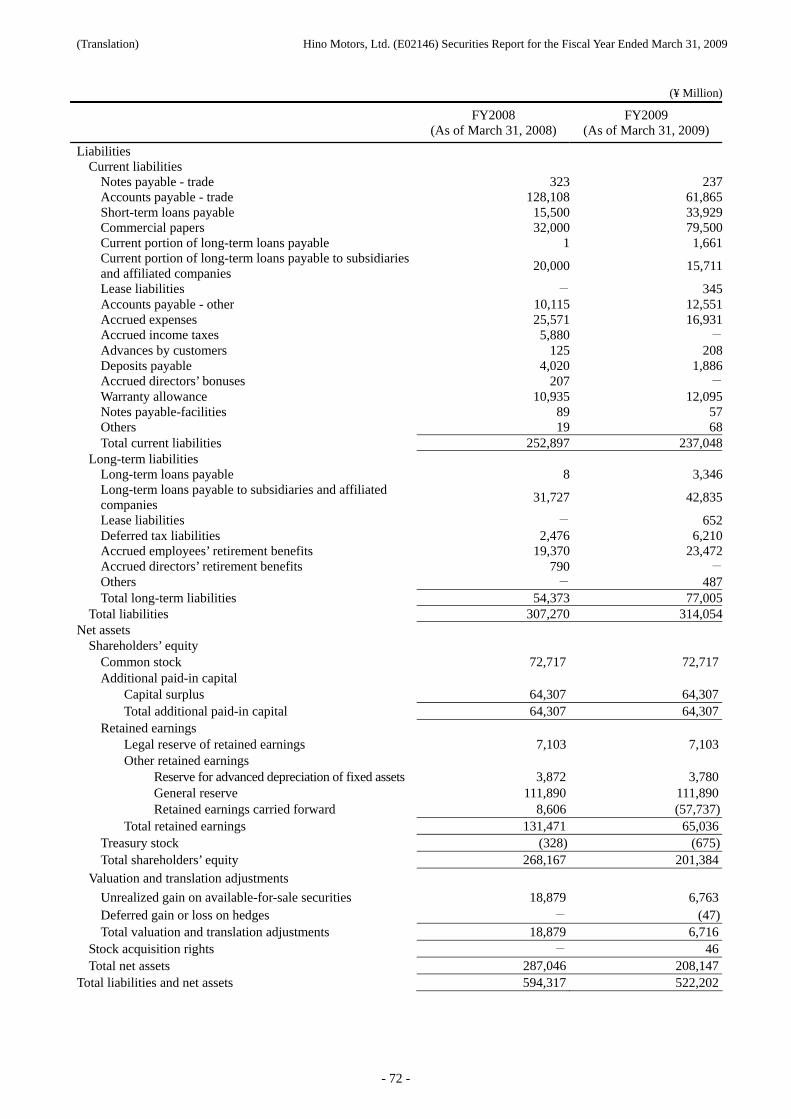
(Translation) Hino Motors, Ltd. (E02146) Securities Report for the Fiscal Year Ended March 31, 2009
- 72 -
(¥ Million)
FY2008
(As of March 31, 2008) FY2009
(As of March 31, 2009)
Liabilities Current liabilities
Notes payable - trade 323 237Accounts payable - trade 128,108 61,865Short-term loans payable 15,500 33,929Commercial papers 32,000 79,500Current portion of long-term loans payable 1 1,661Current portion of long-term loans payable to subsidiaries and affiliated companies
20,000 15,711
Lease liabilities - 345Accounts payable - other 10,115 12,551Accrued expenses 25,571 16,931Accrued income taxes 5,880 -
Advances by customers 125 208Deposits payable 4,020 1,886Accrued directors’ bonuses 207 -
Warranty allowance 10,935 12,095Notes payable-facilities 89 57Others 19 68Total current liabilities 252,897 237,048
Long-term liabilities Long-term loans payable 8 3,346Long-term loans payable to subsidiaries and affiliated companies
31,727 42,835
Lease liabilities - 652Deferred tax liabilities 2,476 6,210Accrued employees’ retirement benefits 19,370 23,472Accrued directors’ retirement benefits 790 -
Others - 487Total long-term liabilities 54,373 77,005
Total liabilities 307,270 314,054Net assets
Shareholders’ equity Common stock 72,717 72,717Additional paid-in capital
Capital surplus 64,307 64,307Total additional paid-in capital 64,307 64,307
Retained earnings Legal reserve of retained earnings 7,103 7,103Other retained earnings
Reserve for advanced depreciation of fixed assets 3,872 3,780General reserve 111,890 111,890Retained earnings carried forward 8,606 (57,737)
Total retained earnings 131,471 65,036Treasury stock (328) (675)Total shareholders’ equity 268,167 201,384
Valuation and translation adjustments
Unrealized gain on available-for-sale securities 18,879 6,763Deferred gain or loss on hedges - (47)Total valuation and translation adjustments 18,879 6,716
Stock acquisition rights - 46Total net assets 287,046 208,147
Total liabilities and net assets 594,317 522,202
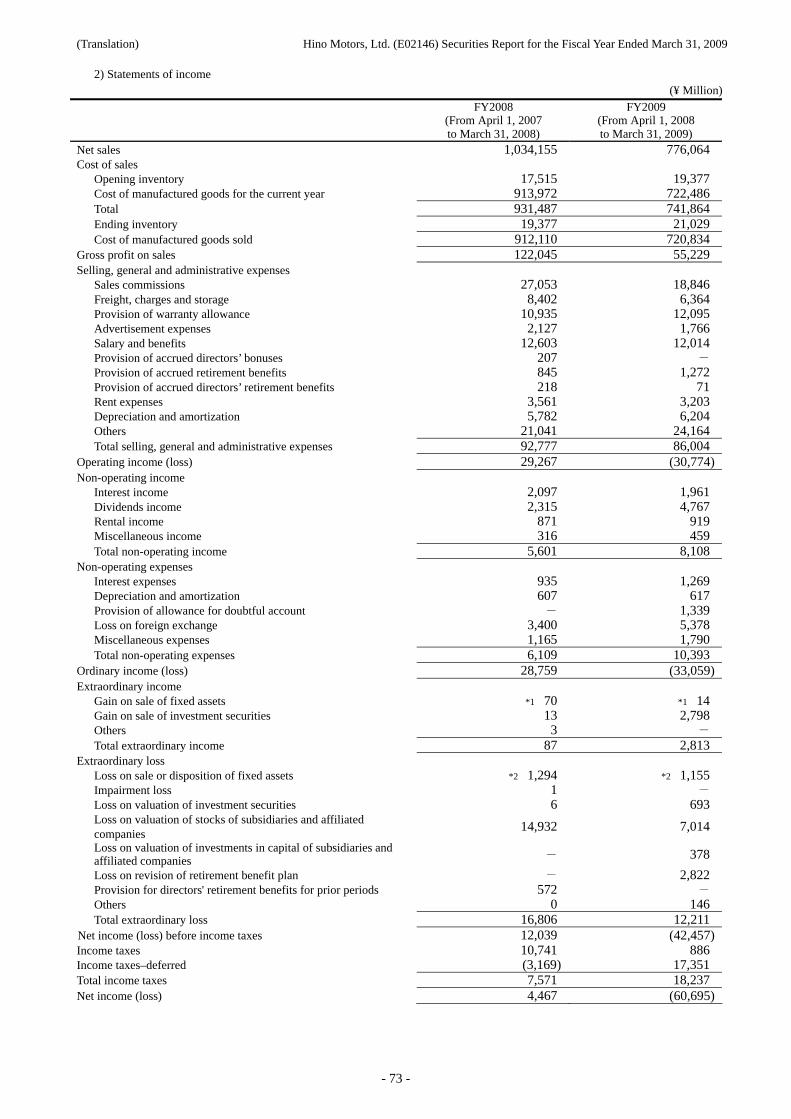
(Translation) Hino Motors, Ltd. (E02146) Securities Report for the Fiscal Year Ended March 31, 2009
- 73 -
2) Statements of income (¥ Million)
FY2008
(From April 1, 2007 to March 31, 2008)
FY2009 (From April 1, 2008 to March 31, 2009)
Net sales 1,034,155 776,064 Cost of sales
Opening inventory 17,515 19,377 Cost of manufactured goods for the current year 913,972 722,486 Total 931,487 741,864 Ending inventory 19,377 21,029 Cost of manufactured goods sold 912,110 720,834
Gross profit on sales 122,045 55,229 Selling, general and administrative expenses
Sales commissions 27,053 18,846 Freight, charges and storage 8,402 6,364 Provision of warranty allowance 10,935 12,095 Advertisement expenses 2,127 1,766 Salary and benefits 12,603 12,014 Provision of accrued directors’ bonuses 207 - Provision of accrued retirement benefits 845 1,272 Provision of accrued directors’ retirement benefits 218 71 Rent expenses 3,561 3,203 Depreciation and amortization 5,782 6,204 Others 21,041 24,164 Total selling, general and administrative expenses 92,777 86,004
Operating income (loss) 29,267 (30,774)Non-operating income
Interest income 2,097 1,961 Dividends income 2,315 4,767 Rental income 871 919 Miscellaneous income 316 459 Total non-operating income 5,601 8,108
Non-operating expenses Interest expenses 935 1,269 Depreciation and amortization 607 617 Provision of allowance for doubtful account - 1,339 Loss on foreign exchange 3,400 5,378 Miscellaneous expenses 1,165 1,790 Total non-operating expenses 6,109 10,393
Ordinary income (loss) 28,759 (33,059)Extraordinary income
Gain on sale of fixed assets *1 70 *1 14 Gain on sale of investment securities 13 2,798 Others 3 - Total extraordinary income 87 2,813
Extraordinary loss Loss on sale or disposition of fixed assets *2 1,294 *2 1,155 Impairment loss 1 - Loss on valuation of investment securities 6 693 Loss on valuation of stocks of subsidiaries and affiliated companies
14,932 7,014
Loss on valuation of investments in capital of subsidiaries and affiliated companies - 378
Loss on revision of retirement benefit plan - 2,822 Provision for directors' retirement benefits for prior periods 572 - Others 0 146 Total extraordinary loss 16,806 12,211
Net income (loss) before income taxes 12,039 (42,457)Income taxes 10,741 886 Income taxes–deferred (3,169) 17,351 Total income taxes 7,571 18,237 Net income (loss) 4,467 (60,695)
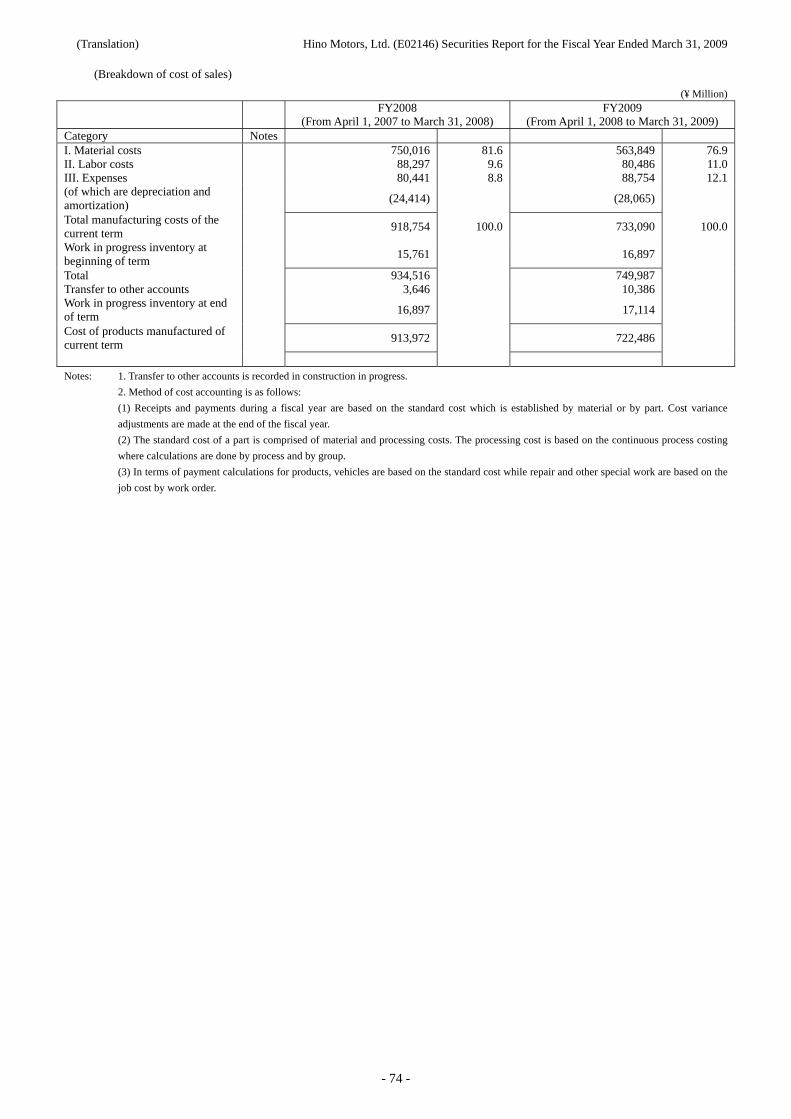
(Translation) Hino Motors, Ltd. (E02146) Securities Report for the Fiscal Year Ended March 31, 2009
- 74 -
(Breakdown of cost of sales)
(¥ Million)
FY2008
(From April 1, 2007 to March 31, 2008) FY2009
(From April 1, 2008 to March 31, 2009) Category Notes I. Material costs 750,016 81.6 563,849 76.9II. Labor costs 88,297 9.6 80,486 11.0III. Expenses 80,441 8.8 88,754 12.1(of which are depreciation and amortization)
(24,414) (28,065)
Total manufacturing costs of the current term
918,754 100.0 733,090 100.0
Work in progress inventory at beginning of term
15,761 16,897
Total 934,516 749,987Transfer to other accounts 3,646 10,386Work in progress inventory at end of term
16,897 17,114
Cost of products manufactured of current term
913,972 722,486
Notes: 1. Transfer to other accounts is recorded in construction in progress.
2. Method of cost accounting is as follows:
(1) Receipts and payments during a fiscal year are based on the standard cost which is established by material or by part. Cost variance
adjustments are made at the end of the fiscal year.
(2) The standard cost of a part is comprised of material and processing costs. The processing cost is based on the continuous process costing
where calculations are done by process and by group.
(3) In terms of payment calculations for products, vehicles are based on the standard cost while repair and other special work are based on the
job cost by work order.
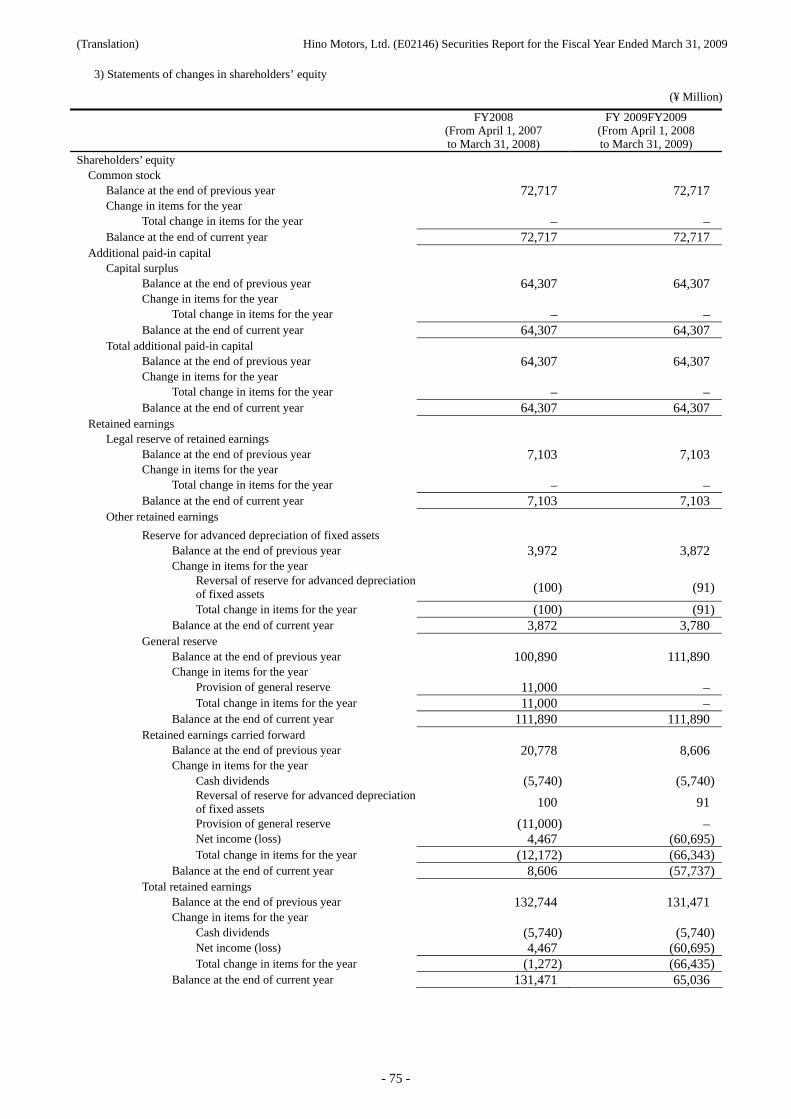
(Translation) Hino Motors, Ltd. (E02146) Securities Report for the Fiscal Year Ended March 31, 2009
- 75 -
3) Statements of changes in shareholders’ equity
(¥ Million)
FY2008
(From April 1, 2007 to March 31, 2008)
FY 2009FY2009 (From April 1, 2008 to March 31, 2009)
Shareholders’ equity Common stock
Balance at the end of previous year 72,717 72,717 Change in items for the year
Total change in items for the year – – Balance at the end of current year 72,717 72,717
Additional paid-in capital Capital surplus
Balance at the end of previous year 64,307 64,307 Change in items for the year
Total change in items for the year – – Balance at the end of current year 64,307 64,307
Total additional paid-in capital Balance at the end of previous year 64,307 64,307 Change in items for the year
Total change in items for the year – – Balance at the end of current year 64,307 64,307
Retained earnings Legal reserve of retained earnings
Balance at the end of previous year 7,103 7,103 Change in items for the year
Total change in items for the year – – Balance at the end of current year 7,103 7,103
Other retained earnings Reserve for advanced depreciation of fixed assets
Balance at the end of previous year 3,972 3,872 Change in items for the year
Reversal of reserve for advanced depreciation of fixed assets (100) (91)
Total change in items for the year (100) (91)Balance at the end of current year 3,872 3,780
General reserve Balance at the end of previous year 100,890 111,890 Change in items for the year
Provision of general reserve 11,000 – Total change in items for the year 11,000 –
Balance at the end of current year 111,890 111,890 Retained earnings carried forward
Balance at the end of previous year 20,778 8,606 Change in items for the year
Cash dividends (5,740) (5,740)Reversal of reserve for advanced depreciation of fixed assets 100 91
Provision of general reserve (11,000) – Net income (loss) 4,467 (60,695)Total change in items for the year (12,172) (66,343)
Balance at the end of current year 8,606 (57,737)Total retained earnings
Balance at the end of previous year 132,744 131,471 Change in items for the year
Cash dividends (5,740) (5,740)Net income (loss) 4,467 (60,695)Total change in items for the year (1,272) (66,435)
Balance at the end of current year 131,471 65,036
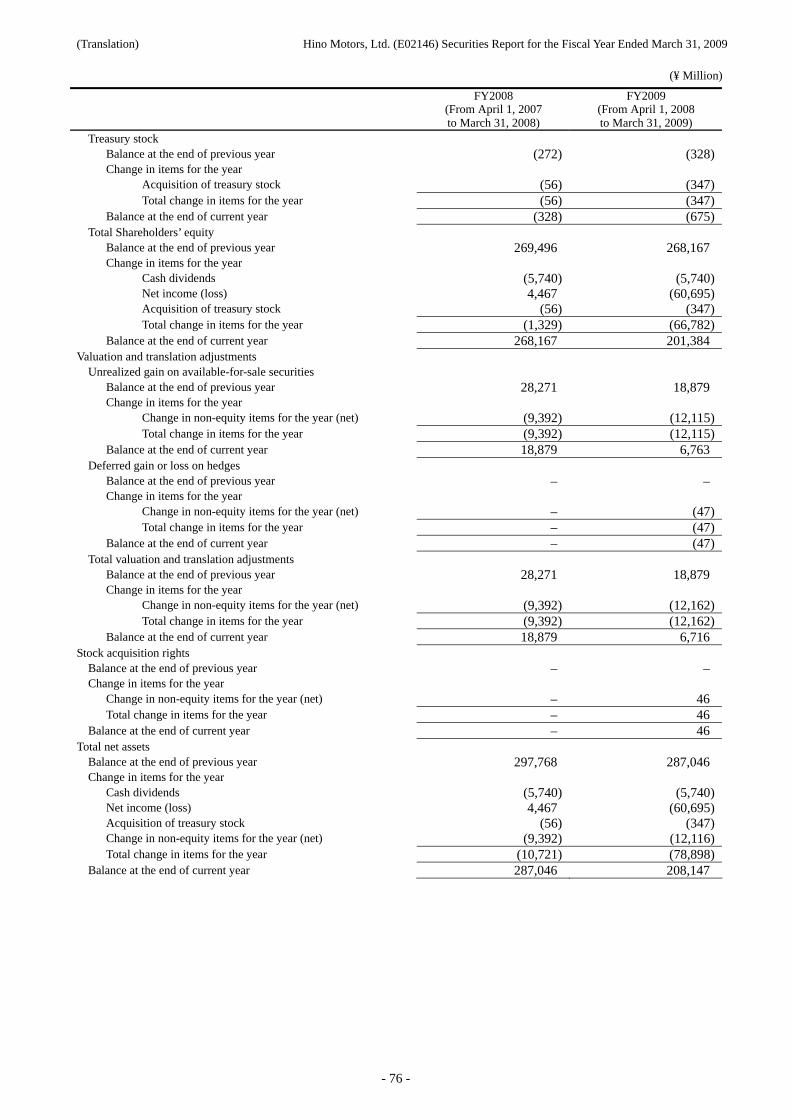
(Translation) Hino Motors, Ltd. (E02146) Securities Report for the Fiscal Year Ended March 31, 2009
- 76 -
(¥ Million)
FY2008
(From April 1, 2007 to March 31, 2008)
FY2009 (From April 1, 2008 to March 31, 2009)
Treasury stock Balance at the end of previous year (272) (328)Change in items for the year
Acquisition of treasury stock (56) (347)Total change in items for the year (56) (347)
Balance at the end of current year (328) (675)Total Shareholders’ equity
Balance at the end of previous year 269,496 268,167 Change in items for the year
Cash dividends (5,740) (5,740)Net income (loss) 4,467 (60,695)Acquisition of treasury stock (56) (347)Total change in items for the year (1,329) (66,782)
Balance at the end of current year 268,167 201,384 Valuation and translation adjustments
Unrealized gain on available-for-sale securities Balance at the end of previous year 28,271 18,879 Change in items for the year
Change in non-equity items for the year (net) (9,392) (12,115)Total change in items for the year (9,392) (12,115)
Balance at the end of current year 18,879 6,763 Deferred gain or loss on hedges
Balance at the end of previous year – – Change in items for the year
Change in non-equity items for the year (net) – (47)Total change in items for the year – (47)
Balance at the end of current year – (47)Total valuation and translation adjustments
Balance at the end of previous year 28,271 18,879 Change in items for the year
Change in non-equity items for the year (net) (9,392) (12,162)Total change in items for the year (9,392) (12,162)
Balance at the end of current year 18,879 6,716 Stock acquisition rights
Balance at the end of previous year – – Change in items for the year
Change in non-equity items for the year (net) – 46 Total change in items for the year – 46
Balance at the end of current year – 46 Total net assets
Balance at the end of previous year 297,768 287,046 Change in items for the year
Cash dividends (5,740) (5,740)Net income (loss) 4,467 (60,695)Acquisition of treasury stock (56) (347)Change in non-equity items for the year (net) (9,392) (12,116)Total change in items for the year (10,721) (78,898)
Balance at the end of current year 287,046 208,147
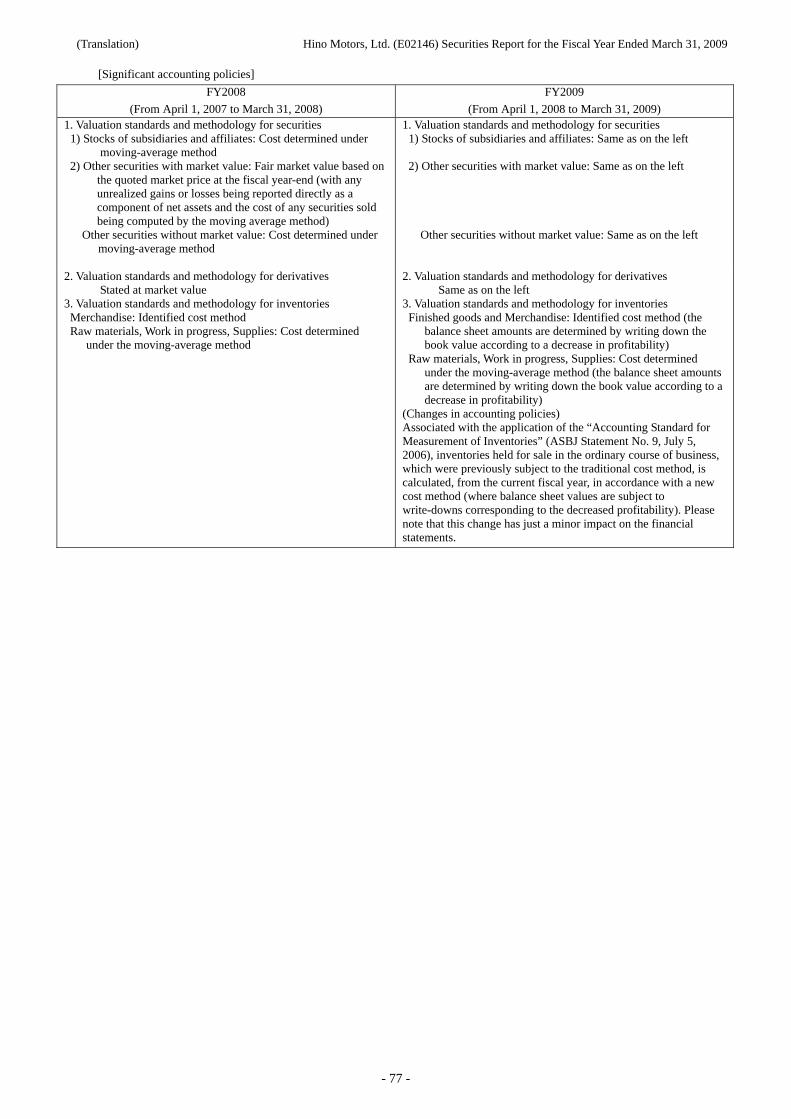
(Translation) Hino Motors, Ltd. (E02146) Securities Report for the Fiscal Year Ended March 31, 2009
- 77 -
[Significant accounting policies]
FY2008
(From April 1, 2007 to March 31, 2008)
FY2009
(From April 1, 2008 to March 31, 2009) 1. Valuation standards and methodology for securities
1) Stocks of subsidiaries and affiliates: Cost determined under moving-average method
2) Other securities with market value: Fair market value based on the quoted market price at the fiscal year-end (with any unrealized gains or losses being reported directly as a component of net assets and the cost of any securities sold being computed by the moving average method)
Other securities without market value: Cost determined under moving-average method
1. Valuation standards and methodology for securities 1) Stocks of subsidiaries and affiliates: Same as on the left 2) Other securities with market value: Same as on the left
Other securities without market value: Same as on the left
2. Valuation standards and methodology for derivatives Stated at market value
3. Valuation standards and methodology for inventories Merchandise: Identified cost method Raw materials, Work in progress, Supplies: Cost determined
under the moving-average method
2. Valuation standards and methodology for derivatives Same as on the left
3. Valuation standards and methodology for inventories Finished goods and Merchandise: Identified cost method (the
balance sheet amounts are determined by writing down the book value according to a decrease in profitability)
Raw materials, Work in progress, Supplies: Cost determined under the moving-average method (the balance sheet amounts are determined by writing down the book value according to a decrease in profitability)
(Changes in accounting policies) Associated with the application of the “Accounting Standard for Measurement of Inventories” (ASBJ Statement No. 9, July 5, 2006), inventories held for sale in the ordinary course of business, which were previously subject to the traditional cost method, is calculated, from the current fiscal year, in accordance with a new cost method (where balance sheet values are subject to write-downs corresponding to the decreased profitability). Please note that this change has just a minor impact on the financial statements.
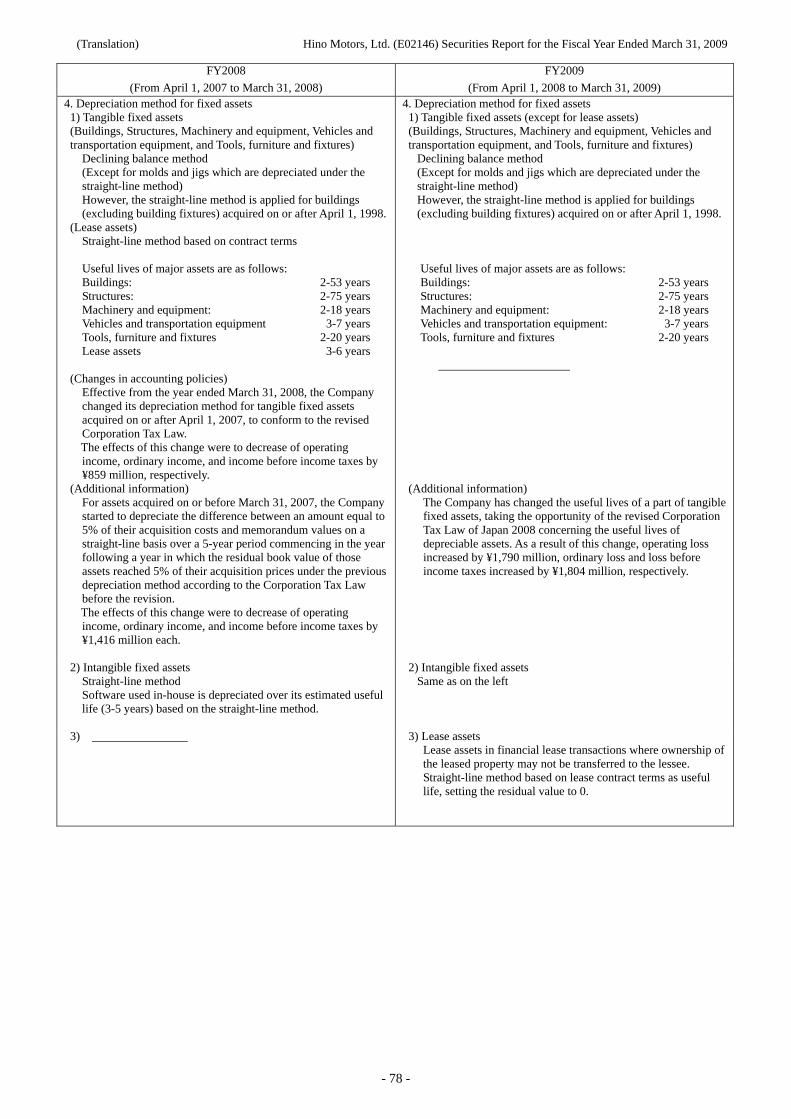
(Translation) Hino Motors, Ltd. (E02146) Securities Report for the Fiscal Year Ended March 31, 2009
- 78 -
FY2008
(From April 1, 2007 to March 31, 2008)
FY2009
(From April 1, 2008 to March 31, 2009) 4. Depreciation method for fixed assets 1) Tangible fixed assets (Buildings, Structures, Machinery and equipment, Vehicles and transportation equipment, and Tools, furniture and fixtures)
Declining balance method (Except for molds and jigs which are depreciated under the straight-line method) However, the straight-line method is applied for buildings (excluding building fixtures) acquired on or after April 1, 1998.
(Lease assets) Straight-line method based on contract terms Useful lives of major assets are as follows: Buildings: 2-53 years Structures: 2-75 years Machinery and equipment: 2-18 years Vehicles and transportation equipment 3-7 years Tools, furniture and fixtures 2-20 years Lease assets 3-6 years
(Changes in accounting policies) Effective from the year ended March 31, 2008, the Company changed its depreciation method for tangible fixed assets acquired on or after April 1, 2007, to conform to the revised Corporation Tax Law. The effects of this change were to decrease of operating income, ordinary income, and income before income taxes by ¥859 million, respectively.
(Additional information) For assets acquired on or before March 31, 2007, the Company started to depreciate the difference between an amount equal to 5% of their acquisition costs and memorandum values on a straight-line basis over a 5-year period commencing in the year following a year in which the residual book value of those assets reached 5% of their acquisition prices under the previous depreciation method according to the Corporation Tax Law before the revision. The effects of this change were to decrease of operating income, ordinary income, and income before income taxes by ¥1,416 million each.
4. Depreciation method for fixed assets 1) Tangible fixed assets (except for lease assets) (Buildings, Structures, Machinery and equipment, Vehicles and transportation equipment, and Tools, furniture and fixtures)
Declining balance method (Except for molds and jigs which are depreciated under the straight-line method) However, the straight-line method is applied for buildings (excluding building fixtures) acquired on or after April 1, 1998. Useful lives of major assets are as follows: Buildings: 2-53 years Structures: 2-75 years Machinery and equipment: 2-18 years Vehicles and transportation equipment: 3-7 years Tools, furniture and fixtures 2-20 years
(Additional information)
The Company has changed the useful lives of a part of tangible fixed assets, taking the opportunity of the revised Corporation Tax Law of Japan 2008 concerning the useful lives of depreciable assets. As a result of this change, operating loss increased by ¥1,790 million, ordinary loss and loss before income taxes increased by ¥1,804 million, respectively.
2) Intangible fixed assets Straight-line method Software used in-house is depreciated over its estimated useful life (3-5 years) based on the straight-line method.
2) Intangible fixed assets Same as on the left
3)
3) Lease assets Lease assets in financial lease transactions where ownership of the leased property may not be transferred to the lessee. Straight-line method based on lease contract terms as useful life, setting the residual value to 0.
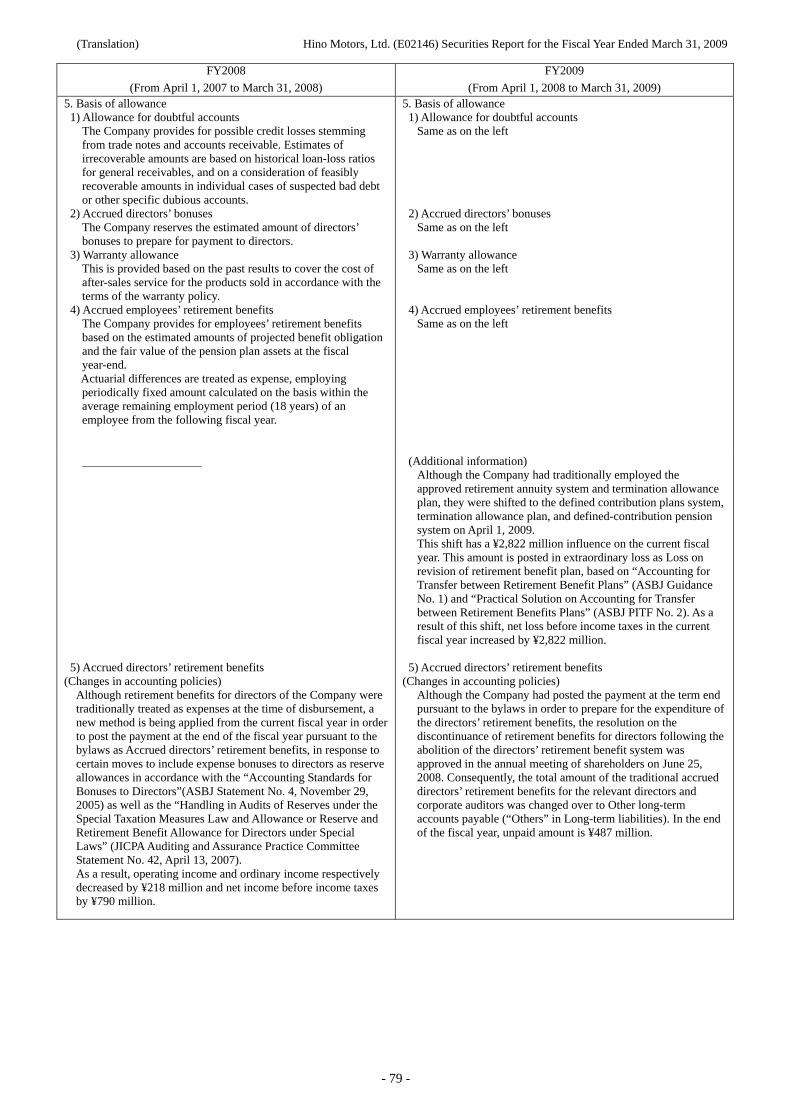
(Translation) Hino Motors, Ltd. (E02146) Securities Report for the Fiscal Year Ended March 31, 2009
- 79 -
FY2008
(From April 1, 2007 to March 31, 2008)
FY2009
(From April 1, 2008 to March 31, 2009) 5. Basis of allowance 1) Allowance for doubtful accounts
The Company provides for possible credit losses stemming from trade notes and accounts receivable. Estimates of irrecoverable amounts are based on historical loan-loss ratios for general receivables, and on a consideration of feasibly recoverable amounts in individual cases of suspected bad debt or other specific dubious accounts.
2) Accrued directors’ bonuses The Company reserves the estimated amount of directors’ bonuses to prepare for payment to directors.
3) Warranty allowance This is provided based on the past results to cover the cost of after-sales service for the products sold in accordance with the terms of the warranty policy.
4) Accrued employees’ retirement benefits The Company provides for employees’ retirement benefits based on the estimated amounts of projected benefit obligation and the fair value of the pension plan assets at the fiscal year-end. Actuarial differences are treated as expense, employing periodically fixed amount calculated on the basis within the average remaining employment period (18 years) of an employee from the following fiscal year.
5. Basis of allowance 1) Allowance for doubtful accounts
Same as on the left 2) Accrued directors’ bonuses
Same as on the left 3) Warranty allowance
Same as on the left 4) Accrued employees’ retirement benefits
Same as on the left
5) Accrued directors’ retirement benefits
(Changes in accounting policies) Although retirement benefits for directors of the Company were traditionally treated as expenses at the time of disbursement, a new method is being applied from the current fiscal year in order to post the payment at the end of the fiscal year pursuant to the bylaws as Accrued directors’ retirement benefits, in response to certain moves to include expense bonuses to directors as reserve allowances in accordance with the “Accounting Standards for Bonuses to Directors”(ASBJ Statement No. 4, November 29, 2005) as well as the “Handling in Audits of Reserves under the Special Taxation Measures Law and Allowance or Reserve and Retirement Benefit Allowance for Directors under Special Laws” (JICPA Auditing and Assurance Practice Committee Statement No. 42, April 13, 2007). As a result, operating income and ordinary income respectively decreased by ¥218 million and net income before income taxes by ¥790 million.
(Additional information) Although the Company had traditionally employed the approved retirement annuity system and termination allowance plan, they were shifted to the defined contribution plans system, termination allowance plan, and defined-contribution pension system on April 1, 2009. This shift has a ¥2,822 million influence on the current fiscal year. This amount is posted in extraordinary loss as Loss on revision of retirement benefit plan, based on “Accounting for Transfer between Retirement Benefit Plans” (ASBJ Guidance No. 1) and “Practical Solution on Accounting for Transfer between Retirement Benefits Plans” (ASBJ PITF No. 2). As a result of this shift, net loss before income taxes in the current fiscal year increased by ¥2,822 million.
5) Accrued directors’ retirement benefits
(Changes in accounting policies) Although the Company had posted the payment at the term end pursuant to the bylaws in order to prepare for the expenditure of the directors’ retirement benefits, the resolution on the discontinuance of retirement benefits for directors following the abolition of the directors’ retirement benefit system was approved in the annual meeting of shareholders on June 25, 2008. Consequently, the total amount of the traditional accrued directors’ retirement benefits for the relevant directors and corporate auditors was changed over to Other long-term accounts payable (“Others” in Long-term liabilities). In the end of the fiscal year, unpaid amount is ¥487 million.
(Translation) Hino Motors, Ltd. (E02146) Securities Report for the Fiscal Year Ended March 31, 2009
- 80 -
FY2008
(From April 1, 2007 to March 31, 2008)
FY2009
(From April 1, 2008 to March 31, 2009) 6. Lease transactions
Finance lease transactions other than those that ownership of the leased property may not be transferred to the lessee are accounted for using the same methods as those used for ordinary lease transactions.
7. Hedge accounting methods 1)Hedge accounting methods
Mainly, deferred hedge accounting is used. Allocation accounting is applied for forward exchange contracts and currency swaps, in which the hedged items are translated at contracted forward rates if certain conditions are met.
2) Hedging instruments and hedging targets Hedging instruments: Forward exchange contracts Hedging items: Trade receivable in foreign currencies
3) Hedging policy In order to hedge the risk of exchange rate fluctuations related to transactions in foreign currencies, the Company has executed forward exchange contracts for trade receivable in foreign currencies.
4) Hedging evaluation The effectiveness is judged by comparing the accumulated amount of changes in market values of the hedged items with the accumulated amount of changes in market values of the hedging instruments during the hedge period.
6. 7. Hedge accounting methods
Same as on the left.
8. Other significant matters for the preparation of the financial statements
Consumption tax All accounting transactions are booked exclusive of consumption taxes.
8. Other significant matters for the preparation of the financial statements
Consumption tax Same as on the left.
[Changes in the method of accounting]
FY2008
(From April 1, 2007 to March 31, 2008)
FY2009
(From April 1, 2008 to March 31, 2009) (Accounting standards for lease transactions)
From the current fiscal year, the Company and its domestic consolidated subsidiaries have applied “Accounting Standards for Lease Transactions” (ASBJ Statement No. 13, June 17, 1993 (First Group of Financial Accounting Board), revised in March 30, 2007) and “Guidance on Accounting Standard for Lease Transactions” (ASBJ Guidance No. 16, January 18, 1994 (JICPA Accounting System Committee), revised on March 30, 2007). In the balance sheets based on this, tangible fixed assets, current liabilities, and long-term liabilities have increased by ¥977 million, ¥345 million, and ¥652 million respectively. Please note that this change has just a minor impact on the statements of income.
[Changes in presentation]
FY2008
(From April 1, 2007 to March 31, 2008)
FY2009
(From April 1, 2008 to March 31, 2009) (On the balance sheet)
Following the adoption of the “Cabinet Office Ordinance Revising the Regulation for Terminology, Forms and Preparation of Financial Statements” (Cabinet Office Ordinance No. 50, August 7, 2008), items that had been listed as “Finished goods,” “Raw materials,” “Supplies,” were presented as “Merchandise and finished goods,” “Raw materials and supplies,” starting this fiscal year. “Raw materials” and “Supplies” included under “Raw materials and supplies” for the current fiscal year were ¥176 million, ¥3,211 million, respectively.
(Translation) Hino Motors, Ltd. (E02146) Securities Report for the Fiscal Year Ended March 31, 2009
- 81 -
[Notes]
(On the balance sheets)
FY2008
(As of March 31, 2008)
FY2009
(As of March 31, 2009) Note 1. *1 Amount of cumulative depreciation of tangible fixed
assets was ¥398,281 million. *2 This represents delayed payments including deferred receivables arising from export sales and receivables from companies under liquidation.
Note 2. Guarantee obligation Guarantee is made as to bank loans and others. Loan for the fund for employees’ housing
¥6,655 million Note 3. Notes on subsidiaries and affiliated companies
The following amounts related to subsidiaries and affiliated companies are included in the relevant accounts in addition to those separately indicated.
Accounts receivable - trade ¥117,367 million Short-term loans receivable ¥35,958 million Accounts payable - trade ¥41,748 million Accrued expenses ¥7,478 million
Note 1. *1 Amount of cumulative depreciation of tangible fixed assets was ¥413,867 million. *2 Same as on the left
Note 2. Guarantee obligation Guarantee is made as to bank loans and others. Loan for the fund for employees’ housing
¥5,905 million Note 3. Notes on subsidiaries and affiliated companies
The following amounts related to subsidiaries and affiliated companies are included in the relevant accounts in addition to those separately indicated.
Accounts receivable - trade ¥66,633 million Short-term loans receivable ¥52,127 million Accounts payable - trade ¥15,103 million
(On the statements of income)
FY2008
(As of March 31, 2008)
FY2009
(As of March 31, 2009) Note 1. Notes on the transactions with subsidiaries and affiliated companies
Amounts of transaction with subsidiaries and affiliated companies are as follows: Net sales ¥766,415 million Expenses for purchase of raw materials ¥434,994 million Interest income ¥1,678 million Dividend income ¥1,149 million Interest expenses ¥879 million
Note 2. *1 Major item accounted in Gain on sale of fixed assets is as follows:
Buildings ¥30 million *2 Major items accounted in Loss on sale or disposition of fixed assets are as follows:
Buildings ¥106 million Machinery and equipment ¥493 million Vehicles and transportation equipment ¥453 million Tools, furniture and fixtures ¥182 million Land ¥57 million
Note 3. Research and development costs included in selling, general and administrative expenses and manufacturing costs are as follows: ¥39,130 million
Note 1. Notes on the transactions with subsidiaries and affiliated companies
Amounts of transaction with subsidiaries and affiliated companies are as follows: Net sales ¥538,302 million Expenses for purchase of raw materials ¥302,428 million Interest income ¥1,446 million Dividend income ¥3,585 million
Note 2. *1 Major item accounted in Gain on sale of fixed assets is as follows:
Vehicles and transportation equipment ¥7 million *2 Major items accounted in Loss on sale or disposition of fixed assets are as follows:
Buildings ¥121 million Machinery and equipment ¥736 million Vehicles and transportation equipment ¥106 million Tools, furniture and fixtures ¥174 million
Note 3. Research and development costs included in selling,
general and administrative expenses and manufacturing costs are as follows:
¥40,482 million
(Translation) Hino Motors, Ltd. (E02146) Securities Report for the Fiscal Year Ended March 31, 2009
- 82 -
(On the statements of changes in shareholders’ equity)
The year ended March 31, 2008 (From April 1, 2007 to March 31, 2008)
1. Type and number of treasury stock
Number of shares at end of FY2007
(Thousands of shares)
Increase (Thousands of shares)
Decrease (Thousands of shares)
Number of shares at end of FY2008
(Thousands of shares) Common stock (Note) 484 74 – 559
Total 484 74 – 559Note: The increase in treasury shares of common stock is comprised of the shares acquired by purchasing sub-MTU shares.
The year ended March 31, 2009 (From April 1, 2008 to March 31, 2009)
1. Type and number of treasury stock
Number of shares at end of FY2008
(Thousands of shares)
Increase (Thousands of shares)
Decrease (Thousands of shares)
Number of shares at end of FY2009
(Thousands of shares) Common stock (Note) 559 1,349 – 1,908
Total 559 1,349 – 1,908Note: The 1,349-thousand-share increase in treasury shares of common stock is comprised of the 1,300-thousand treasury shares through the ordinary
general shareholders’ meeting’s resolved acquisition of treasury stocks and the 49 thousand shares acquired by purchasing sub-MTU shares.
(Lease transactions) <As a lessee>
FY2008
(From April 1, 2007 to March 31, 2008)
FY2009
(From April 1, 2008 to March 31, 2009) 1. Finance leases other than those that transfer ownership of the leased assets to the lessee (1) Estimated acquisition cost, equivalent of accumulated depreciation, and equivalent of year end balance for the leased assets are as follows:
(¥ Million) Estimated
acquisition cost
Equivalent of accumulated depreciation
Equivalent of year end balance
Tools, furniture and fixtures
2,742 1,242 1,500
Total 2,742 1,242 1,500 (2) Equivalent of outstanding obligations under finance leases at the year-end are as follows:
Due within one year ¥488 million Due after one year ¥1,037 million
Total ¥1,525 million
(3) Lease payments, and equivalents of depreciation expense and interest expense
Lease payments ¥716 million Equivalent of depreciation expense ¥665 million Equivalent of interest expense ¥50 million
(4) Calculation method for equivalent of depreciation expense
Straight-line method based on lease contract terms as useful life, setting the residual value to 0.
(5) Calculation method for interest equivalent
The difference between the total lease fees and the acquisition cost equivalent of leased property is set as the interest equivalent. It is allocated to each fiscal year based on the interest method.
1. Finance lease transactions Finance lease transactions where ownership of the leased property may not be transferred to the lessee
1) Details of the lease assets Tangible fixed assets
Mainly computer terminals (Tools, furniture and fixtures). 2) Depreciation method for lease assets
As described on Significant accounting policies, “4. Depreciation method for fixed assets.”
(Translation) Hino Motors, Ltd. (E02146) Securities Report for the Fiscal Year Ended March 31, 2009
- 83 -
<As a lessor>
FY2008
(From April 1, 2007 to March 31, 2008)
FY2009
(From April 1, 2008 to March 31, 2009) Finance leases other than those that transfer ownership of the leased assets to the lessee (1) Lease income, depreciation expenses and equivalent of interest income
Lease income ¥0 million Depreciation expense ¥0 million Equivalent of interest income ¥0 million
(2) Calculation method for interest equivalent
The total lease fees plus the estimated residual value minus the purchase amount of leased property is set as the interest equivalent. It is allocated to each fiscal year based on the interest method.
(Securities)
Information on securities classified as stocks of subsidiaries and affiliated companies
(¥ Million) As of March 31, 2008 As of March 31, 2009
Carrying value Market value
Unrealized gain (loss)
Carrying value Market value Unrealized gain (loss)
Stocks of subsidiaries 948 6,168 5,220 948 2,578 1,630Stocks of affiliated companies 731 1,744 1,013 731 1,012 281
Total 1,679 7,913 6,233 1,679 3,591 1,911
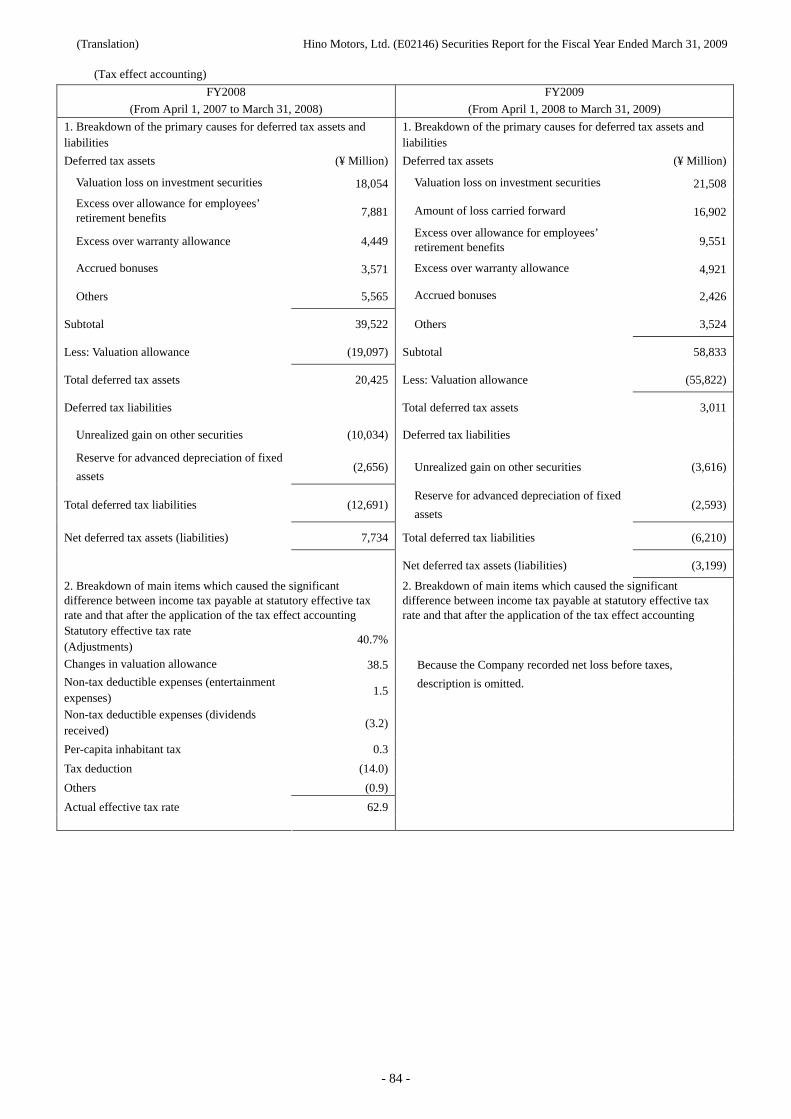
(Translation) Hino Motors, Ltd. (E02146) Securities Report for the Fiscal Year Ended March 31, 2009
- 84 -
(Tax effect accounting)
FY2008
(From April 1, 2007 to March 31, 2008)
FY2009
(From April 1, 2008 to March 31, 2009)
1. Breakdown of the primary causes for deferred tax assets and liabilities
1. Breakdown of the primary causes for deferred tax assets and liabilities
Deferred tax assets (¥ Million) Deferred tax assets (¥ Million)
Valuation loss on investment securities 18,054 Valuation loss on investment securities 21,508
Excess over allowance for employees’ retirement benefits 7,881 Amount of loss carried forward 16,902
Excess over warranty allowance 4,449Excess over allowance for employees’ retirement benefits 9,551
Accrued bonuses 3,571 Excess over warranty allowance 4,921
Others 5,565 Accrued bonuses 2,426
Subtotal 39,522 Others 3,524
Less: Valuation allowance (19,097) Subtotal 58,833
Total deferred tax assets 20,425 Less: Valuation allowance (55,822)
Deferred tax liabilities Total deferred tax assets 3,011
Unrealized gain on other securities (10,034) Deferred tax liabilities
Reserve for advanced depreciation of fixed
assets (2,656) Unrealized gain on other securities (3,616)
Total deferred tax liabilities (12,691)Reserve for advanced depreciation of fixed
assets (2,593)
Net deferred tax assets (liabilities) 7,734 Total deferred tax liabilities (6,210)
Net deferred tax assets (liabilities) (3,199)
2. Breakdown of main items which caused the significant difference between income tax payable at statutory effective tax rate and that after the application of the tax effect accounting
2. Breakdown of main items which caused the significant difference between income tax payable at statutory effective tax rate and that after the application of the tax effect accounting
Statutory effective tax rate (Adjustments)
40.7%
Changes in valuation allowance 38.5
Non-tax deductible expenses (entertainment expenses)
1.5
Non-tax deductible expenses (dividends received)
(3.2)
Per-capita inhabitant tax 0.3
Tax deduction (14.0)
Others (0.9)
Actual effective tax rate 62.9
Because the Company recorded net loss before taxes,
description is omitted.
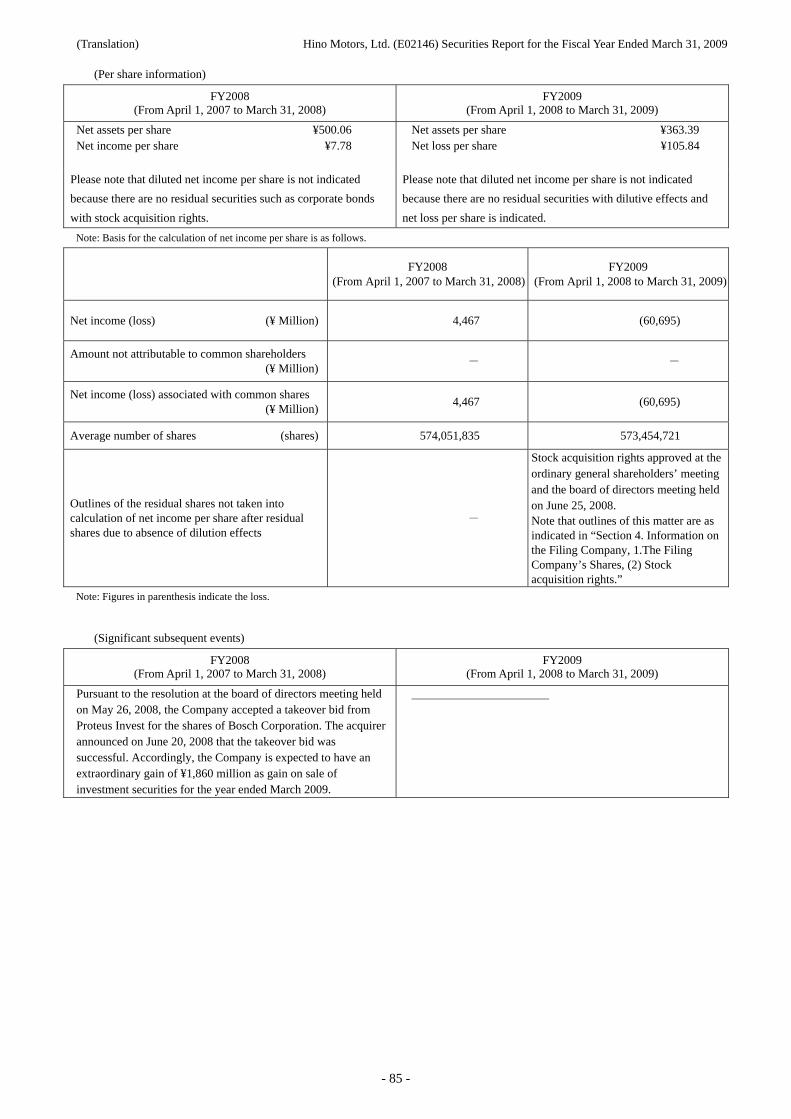
(Translation) Hino Motors, Ltd. (E02146) Securities Report for the Fiscal Year Ended March 31, 2009
- 85 -
(Per share information)
FY2008 (From April 1, 2007 to March 31, 2008)
FY2009 (From April 1, 2008 to March 31, 2009)
Net assets per share ¥500.06 Net income per share ¥7.78
Net assets per share ¥363.39 Net loss per share ¥105.84
Please note that diluted net income per share is not indicated
because there are no residual securities such as corporate bonds
with stock acquisition rights.
Please note that diluted net income per share is not indicated
because there are no residual securities with dilutive effects and
net loss per share is indicated.
Note: Basis for the calculation of net income per share is as follows.
FY2008
(From April 1, 2007 to March 31, 2008)FY2009
(From April 1, 2008 to March 31, 2009)
Net income (loss) (¥ Million) 4,467 (60,695)
Amount not attributable to common shareholders (¥ Million)
- -
Net income (loss) associated with common shares (¥ Million)
4,467 (60,695)
Average number of shares (shares) 574,051,835 573,454,721
Outlines of the residual shares not taken into calculation of net income per share after residual shares due to absence of dilution effects
-
Stock acquisition rights approved at the ordinary general shareholders’ meeting and the board of directors meeting held on June 25, 2008. Note that outlines of this matter are as indicated in “Section 4. Information on the Filing Company, 1.The Filing Company’s Shares, (2) Stock acquisition rights.”
Note: Figures in parenthesis indicate the loss.
(Significant subsequent events)
FY2008 (From April 1, 2007 to March 31, 2008)
FY2009 (From April 1, 2008 to March 31, 2009)
Pursuant to the resolution at the board of directors meeting held on May 26, 2008, the Company accepted a takeover bid from Proteus Invest for the shares of Bosch Corporation. The acquirer announced on June 20, 2008 that the takeover bid was successful. Accordingly, the Company is expected to have an extraordinary gain of ¥1,860 million as gain on sale of investment securities for the year ended March 2009.
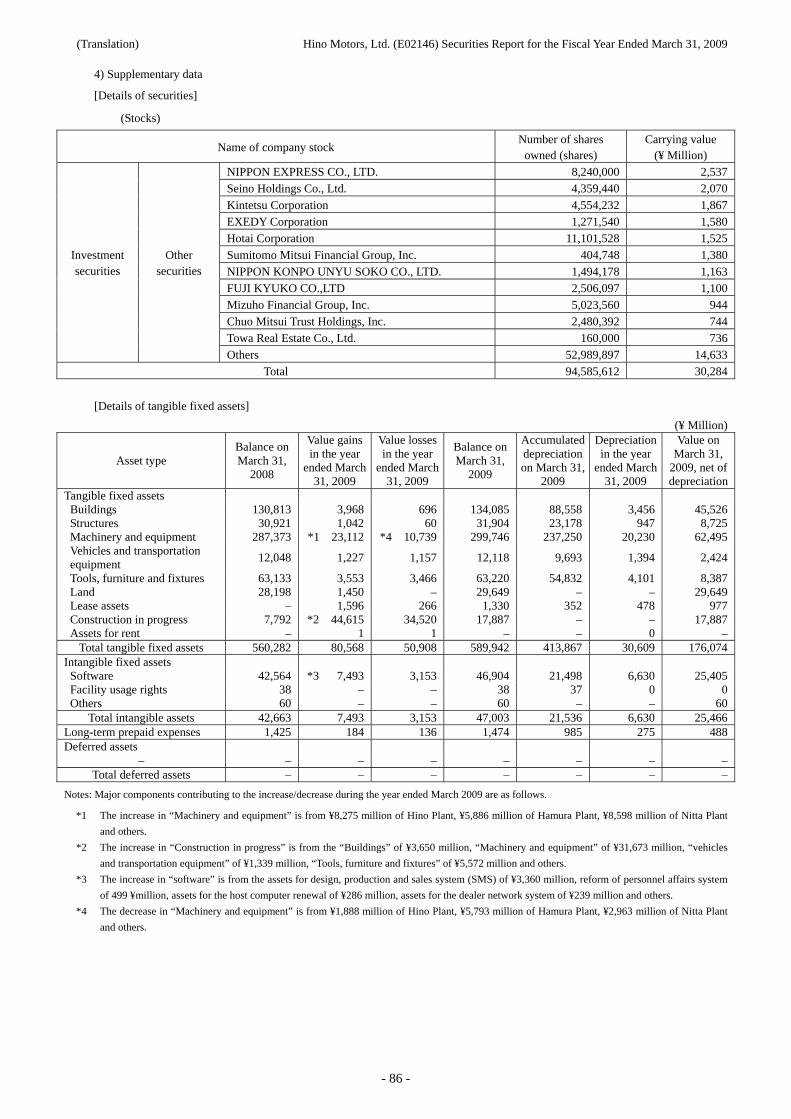
(Translation) Hino Motors, Ltd. (E02146) Securities Report for the Fiscal Year Ended March 31, 2009
- 86 -
4) Supplementary data
[Details of securities]
(Stocks)
Name of company stock Number of shares
owned (shares) Carrying value
(¥ Million)
NIPPON EXPRESS CO., LTD. 8,240,000 2,537
Seino Holdings Co., Ltd. 4,359,440 2,070
Kintetsu Corporation 4,554,232 1,867
EXEDY Corporation 1,271,540 1,580
Hotai Corporation 11,101,528 1,525
Sumitomo Mitsui Financial Group, Inc. 404,748 1,380
NIPPON KONPO UNYU SOKO CO., LTD. 1,494,178 1,163
FUJI KYUKO CO.,LTD 2,506,097 1,100
Mizuho Financial Group, Inc. 5,023,560 944
Chuo Mitsui Trust Holdings, Inc. 2,480,392 744
Towa Real Estate Co., Ltd. 160,000 736
Investment securities
Other securities
Others 52,989,897 14,633
Total 94,585,612 30,284
[Details of tangible fixed assets]
(¥ Million)
Asset type Balance on March 31,
2008
Value gains in the year
ended March 31, 2009
Value losses in the year
ended March 31, 2009
Balance on March 31,
2009
Accumulated depreciation on March 31,
2009
Depreciation in the year
ended March 31, 2009
Value on March 31,
2009, net of depreciation
Tangible fixed assets Buildings 130,813 3,968 696 134,085 88,558 3,456 45,526Structures 30,921 1,042 60 31,904 23,178 947 8,725Machinery and equipment 287,373 *1 23,112 *4 10,739 299,746 237,250 20,230 62,495Vehicles and transportation equipment
12,048 1,227 1,157 12,118 9,693 1,394 2,424
Tools, furniture and fixtures 63,133 3,553 3,466 63,220 54,832 4,101 8,387Land 28,198 1,450 – 29,649 – – 29,649Lease assets – 1,596 266 1,330 352 478 977Construction in progress 7,792 *2 44,615 34,520 17,887 – – 17,887Assets for rent – 1 1 – – 0 –
Total tangible fixed assets 560,282 80,568 50,908 589,942 413,867 30,609 176,074Intangible fixed assets Software 42,564 *3 7,493 3,153 46,904 21,498 6,630 25,405Facility usage rights 38 – – 38 37 0 0Others 60 – – 60 – – 60
Total intangible assets 42,663 7,493 3,153 47,003 21,536 6,630 25,466Long-term prepaid expenses 1,425 184 136 1,474 985 275 488Deferred assets
– – – – – – – –Total deferred assets – – – – – – –
Notes: Major components contributing to the increase/decrease during the year ended March 2009 are as follows.
*1 The increase in “Machinery and equipment” is from ¥8,275 million of Hino Plant, ¥5,886 million of Hamura Plant, ¥8,598 million of Nitta Plant
and others.
*2 The increase in “Construction in progress” is from the “Buildings” of ¥3,650 million, “Machinery and equipment” of ¥31,673 million, “vehicles
and transportation equipment” of ¥1,339 million, “Tools, furniture and fixtures” of ¥5,572 million and others.
*3 The increase in “software” is from the assets for design, production and sales system (SMS) of ¥3,360 million, reform of personnel affairs system
of 499 ¥million, assets for the host computer renewal of ¥286 million, assets for the dealer network system of ¥239 million and others.
*4 The decrease in “Machinery and equipment” is from ¥1,888 million of Hino Plant, ¥5,793 million of Hamura Plant, ¥2,963 million of Nitta Plant
and others.
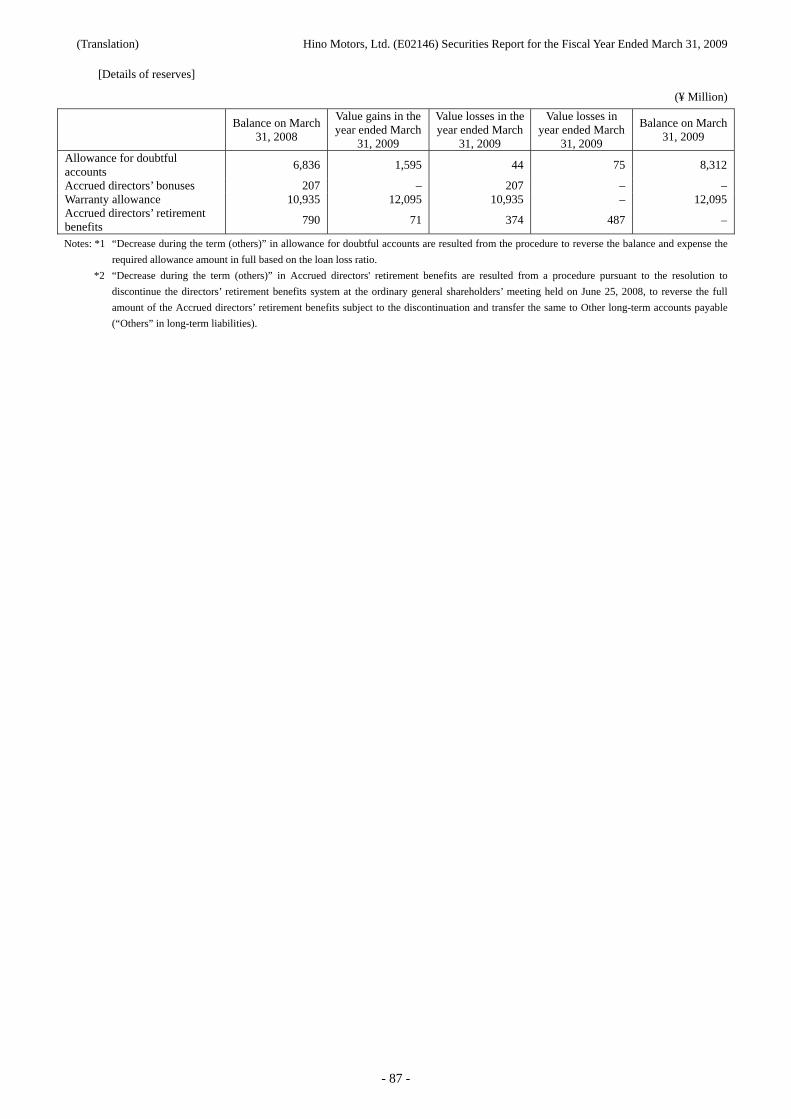
(Translation) Hino Motors, Ltd. (E02146) Securities Report for the Fiscal Year Ended March 31, 2009
- 87 -
[Details of reserves]
(¥ Million)
Balance on March
31, 2008
Value gains in the year ended March
31, 2009
Value losses in the year ended March
31, 2009
Value losses in year ended March
31, 2009
Balance on March 31, 2009
Allowance for doubtful accounts
6,836 1,595 44 75 8,312
Accrued directors’ bonuses 207 – 207 – –Warranty allowance 10,935 12,095 10,935 – 12,095Accrued directors’ retirement benefits
790 71 374 487 –
Notes: *1 “Decrease during the term (others)” in allowance for doubtful accounts are resulted from the procedure to reverse the balance and expense the
required allowance amount in full based on the loan loss ratio.
*2 “Decrease during the term (others)” in Accrued directors' retirement benefits are resulted from a procedure pursuant to the resolution to
discontinue the directors’ retirement benefits system at the ordinary general shareholders’ meeting held on June 25, 2008, to reverse the full
amount of the Accrued directors’ retirement benefits subject to the discontinuation and transfer the same to Other long-term accounts payable
(“Others” in long-term liabilities).
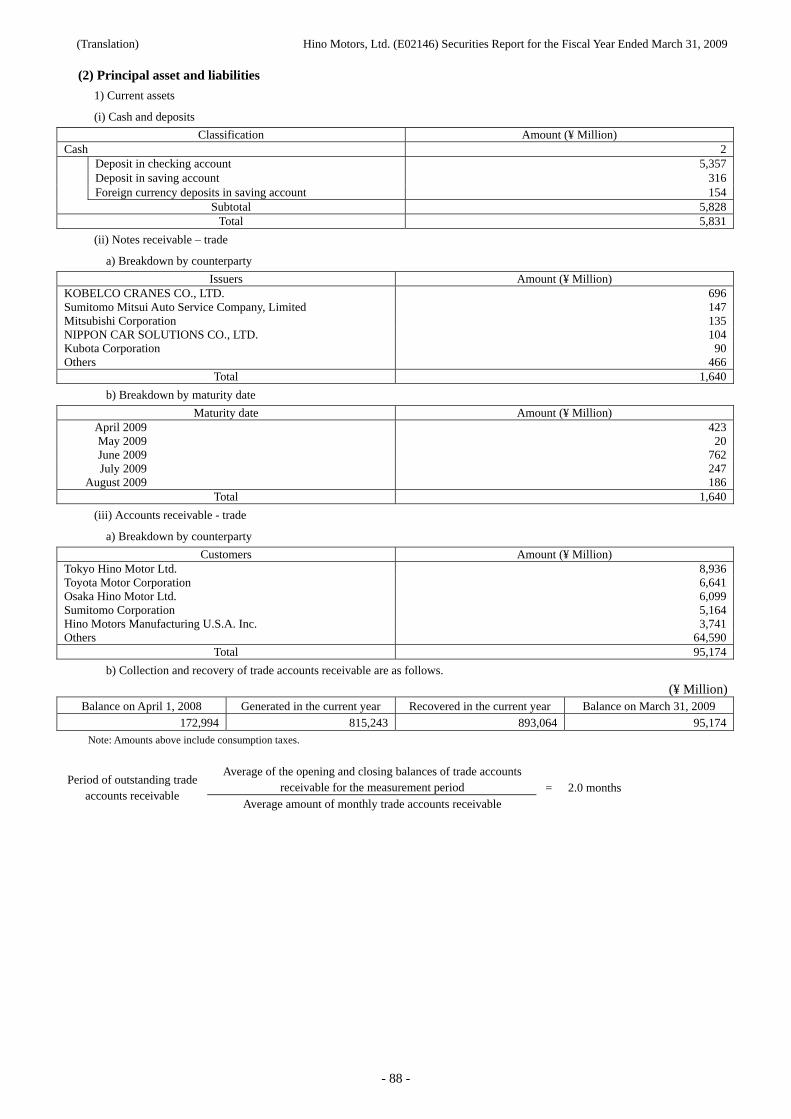
(Translation) Hino Motors, Ltd. (E02146) Securities Report for the Fiscal Year Ended March 31, 2009
- 88 -
(2) Principal asset and liabilities
1) Current assets
(i) Cash and deposits
Classification Amount (¥ Million) Cash 2
Deposit in checking account 5,357Deposit in saving account 316 Foreign currency deposits in saving account 154
Subtotal 5,828Total 5,831
(ii) Notes receivable – trade
a) Breakdown by counterparty
Issuers Amount (¥ Million) KOBELCO CRANES CO., LTD. 696Sumitomo Mitsui Auto Service Company, Limited 147Mitsubishi Corporation 135NIPPON CAR SOLUTIONS CO., LTD. 104Kubota Corporation 90Others 466
Total 1,640
b) Breakdown by maturity date
Maturity date Amount (¥ Million) April 2009 423May 2009 20June 2009 762July 2009 247
August 2009 186Total 1,640
(iii) Accounts receivable - trade
a) Breakdown by counterparty
Customers Amount (¥ Million) Tokyo Hino Motor Ltd. 8,936Toyota Motor Corporation 6,641Osaka Hino Motor Ltd. 6,099Sumitomo Corporation 5,164Hino Motors Manufacturing U.S.A. Inc. 3,741Others 64,590
Total 95,174
b) Collection and recovery of trade accounts receivable are as follows.
(¥ Million) Balance on April 1, 2008 Generated in the current year Recovered in the current year Balance on March 31, 2009
172,994 815,243 893,064 95,174
Note: Amounts above include consumption taxes.
Average of the opening and closing balances of trade accounts
receivable for the measurement period Period of outstanding trade
accounts receivable Average amount of monthly trade accounts receivable
= 2.0 months
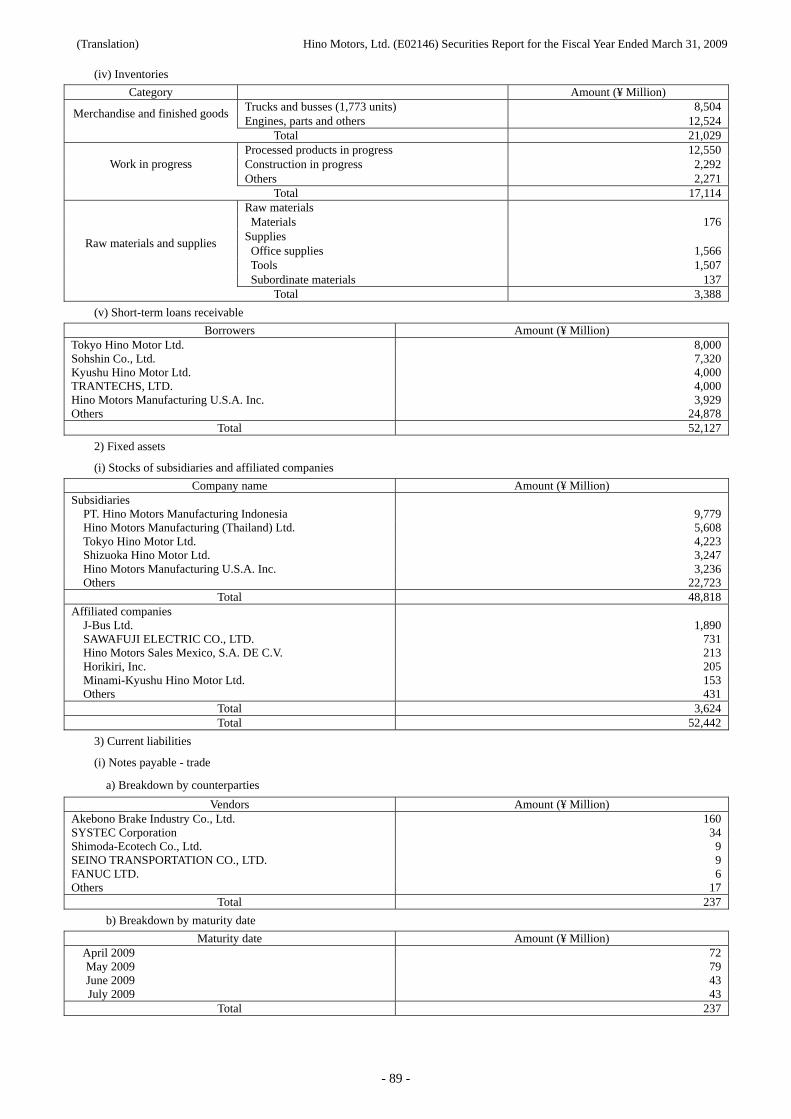
(Translation) Hino Motors, Ltd. (E02146) Securities Report for the Fiscal Year Ended March 31, 2009
- 89 -
(iv) Inventories
Category Amount (¥ Million) Trucks and busses (1,773 units) 8,504
Merchandise and finished goods Engines, parts and others 12,524
Total 21,029Processed products in progress 12,550Construction in progress 2,292Work in progress Others 2,271
Total 17,114Raw materials Materials 176
Supplies Office supplies 1,566Tools 1,507
Raw materials and supplies
Subordinate materials 137Total 3,388
(v) Short-term loans receivable
Borrowers Amount (¥ Million) Tokyo Hino Motor Ltd. 8,000Sohshin Co., Ltd. 7,320Kyushu Hino Motor Ltd. 4,000TRANTECHS, LTD. 4,000Hino Motors Manufacturing U.S.A. Inc. 3,929Others 24,878
Total 52,127
2) Fixed assets
(i) Stocks of subsidiaries and affiliated companies
Company name Amount (¥ Million) Subsidiaries
PT. Hino Motors Manufacturing Indonesia 9,779Hino Motors Manufacturing (Thailand) Ltd. 5,608Tokyo Hino Motor Ltd. 4,223Shizuoka Hino Motor Ltd. 3,247Hino Motors Manufacturing U.S.A. Inc. 3,236Others 22,723
Total 48,818Affiliated companies
J-Bus Ltd. 1,890SAWAFUJI ELECTRIC CO., LTD. 731Hino Motors Sales Mexico, S.A. DE C.V. 213Horikiri, Inc. 205Minami-Kyushu Hino Motor Ltd. 153Others 431
Total 3,624Total 52,442
3) Current liabilities
(i) Notes payable - trade
a) Breakdown by counterparties
Vendors Amount (¥ Million) Akebono Brake Industry Co., Ltd. 160SYSTEC Corporation 34Shimoda-Ecotech Co., Ltd. 9SEINO TRANSPORTATION CO., LTD. 9FANUC LTD. 6Others 17
Total 237
b) Breakdown by maturity date
Maturity date Amount (¥ Million) April 2009 72May 2009 79June 2009 43July 2009 43
Total 237
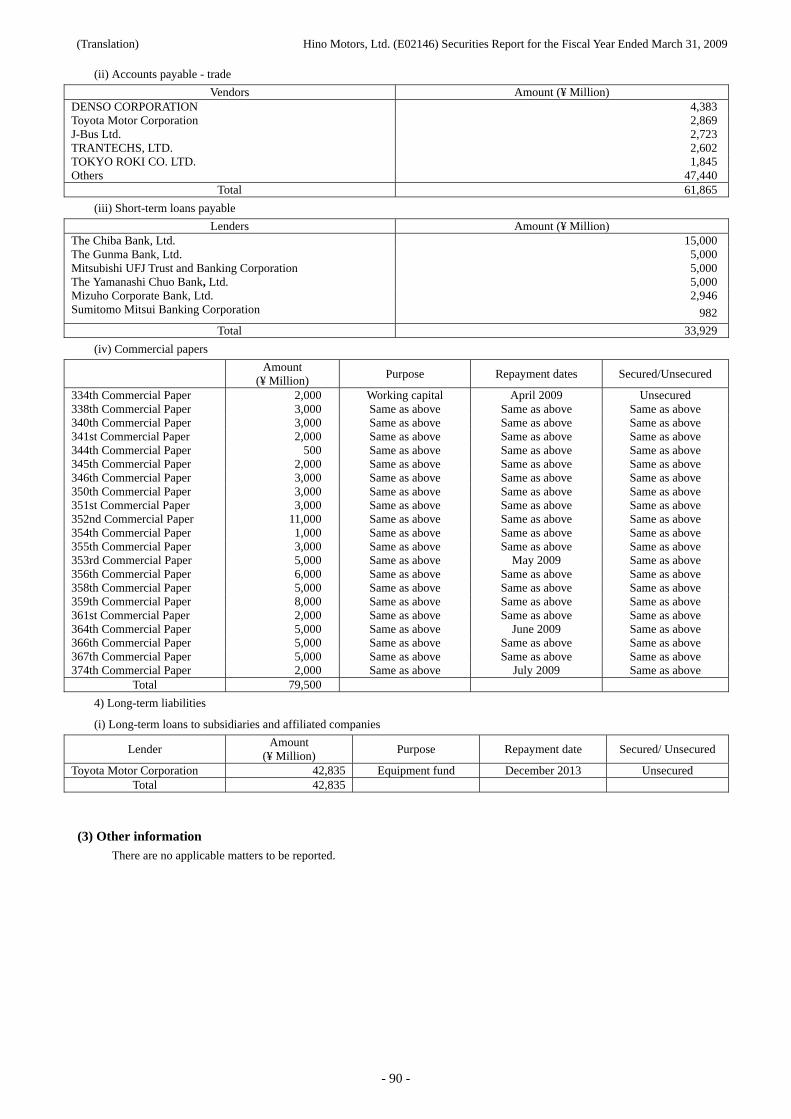
(Translation) Hino Motors, Ltd. (E02146) Securities Report for the Fiscal Year Ended March 31, 2009
- 90 -
(ii) Accounts payable - trade
Vendors Amount (¥ Million) DENSO CORPORATION 4,383Toyota Motor Corporation 2,869J-Bus Ltd. 2,723TRANTECHS, LTD. 2,602TOKYO ROKI CO. LTD. 1,845Others 47,440
Total 61,865
(iii) Short-term loans payable
Lenders Amount (¥ Million) The Chiba Bank, Ltd. 15,000The Gunma Bank, Ltd. 5,000Mitsubishi UFJ Trust and Banking Corporation 5,000The Yamanashi Chuo Bank, Ltd. 5,000Mizuho Corporate Bank, Ltd. 2,946Sumitomo Mitsui Banking Corporation 982
Total 33,929
(iv) Commercial papers
Amount
(¥ Million) Purpose Repayment dates Secured/Unsecured
334th Commercial Paper 2,000 Working capital April 2009 Unsecured 338th Commercial Paper 3,000 Same as above Same as above Same as above 340th Commercial Paper 3,000 Same as above Same as above Same as above 341st Commercial Paper 2,000 Same as above Same as above Same as above 344th Commercial Paper 500 Same as above Same as above Same as above 345th Commercial Paper 2,000 Same as above Same as above Same as above 346th Commercial Paper 3,000 Same as above Same as above Same as above 350th Commercial Paper 3,000 Same as above Same as above Same as above 351st Commercial Paper 3,000 Same as above Same as above Same as above 352nd Commercial Paper 11,000 Same as above Same as above Same as above 354th Commercial Paper 1,000 Same as above Same as above Same as above 355th Commercial Paper 3,000 Same as above Same as above Same as above 353rd Commercial Paper 5,000 Same as above May 2009 Same as above 356th Commercial Paper 6,000 Same as above Same as above Same as above 358th Commercial Paper 5,000 Same as above Same as above Same as above 359th Commercial Paper 8,000 Same as above Same as above Same as above 361st Commercial Paper 2,000 Same as above Same as above Same as above 364th Commercial Paper 5,000 Same as above June 2009 Same as above 366th Commercial Paper 5,000 Same as above Same as above Same as above 367th Commercial Paper 5,000 Same as above Same as above Same as above 374th Commercial Paper 2,000 Same as above July 2009 Same as above
Total 79,500
4) Long-term liabilities
(i) Long-term loans to subsidiaries and affiliated companies
Lender Amount
(¥ Million) Purpose Repayment date Secured/ Unsecured
Toyota Motor Corporation 42,835 Equipment fund December 2013 Unsecured Total 42,835
(3) Other information
There are no applicable matters to be reported.
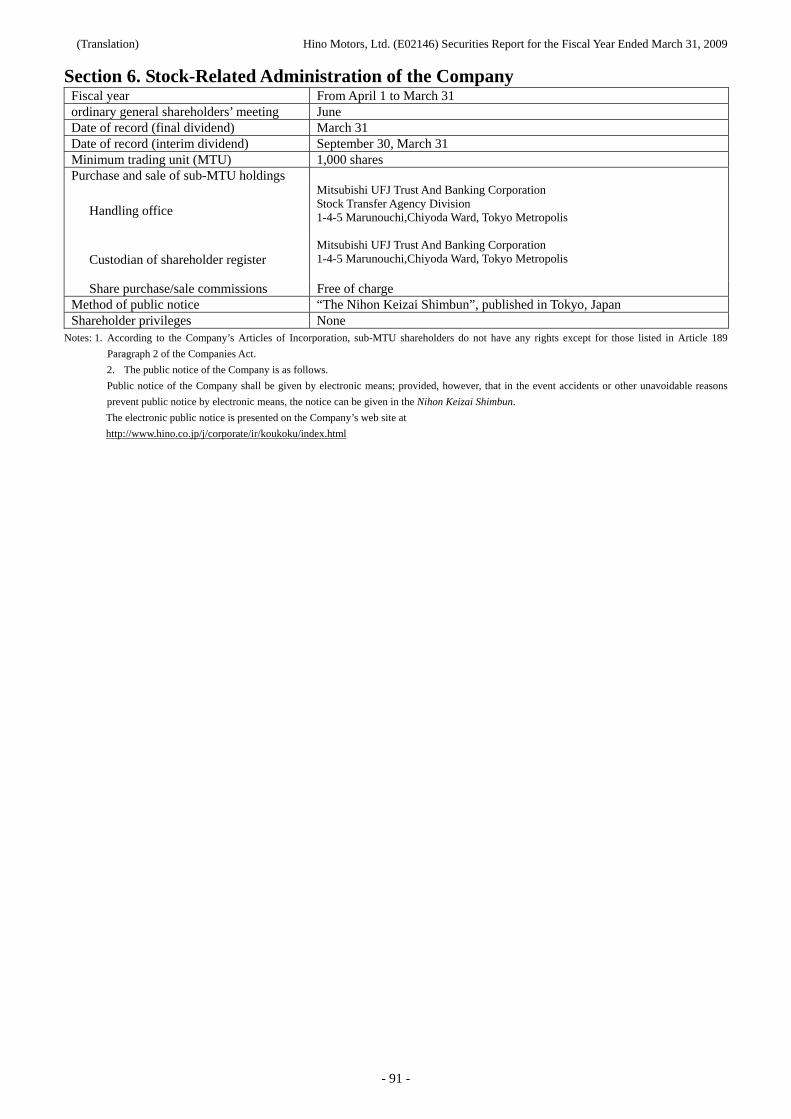
(Translation) Hino Motors, Ltd. (E02146) Securities Report for the Fiscal Year Ended March 31, 2009
- 91 -
Section 6. Stock-Related Administration of the Company Fiscal year From April 1 to March 31 ordinary general shareholders’ meeting June Date of record (final dividend) March 31 Date of record (interim dividend) September 30, March 31 Minimum trading unit (MTU) 1,000 shares Purchase and sale of sub-MTU holdings
Handling office
Mitsubishi UFJ Trust And Banking Corporation Stock Transfer Agency Division 1-4-5 Marunouchi,Chiyoda Ward, Tokyo Metropolis
Custodian of shareholder register Mitsubishi UFJ Trust And Banking Corporation 1-4-5 Marunouchi,Chiyoda Ward, Tokyo Metropolis
Share purchase/sale commissions Free of charge Method of public notice “The Nihon Keizai Shimbun”, published in Tokyo, Japan Shareholder privileges None
Notes: 1. According to the Company’s Articles of Incorporation, sub-MTU shareholders do not have any rights except for those listed in Article 189
Paragraph 2 of the Companies Act.
2. The public notice of the Company is as follows.
Public notice of the Company shall be given by electronic means; provided, however, that in the event accidents or other unavoidable reasons
prevent public notice by electronic means, the notice can be given in the Nihon Keizai Shimbun.
The electronic public notice is presented on the Company’s web site at
http://www.hino.co.jp/j/corporate/ir/koukoku/index.html
(Translation) Hino Motors, Ltd. (E02146) Securities Report for the Fiscal Year Ended March 31, 2009
- 92 -
Section 7. Reference Data on the Company [1] Information on Parent Company of Hino Motors, Ltd.
The Company has no parent company as stipulated in Article 24-1 Paragraph 7 of the Financial Instruments and Exchange Law.
[2] Other Reference Data The following publications were issued by the Company (in Japanese) between the start of the current fiscal year and the submittal of the Japanese version of this securities report.
(1) Securities report (including supplementary documentation) For the 96th fiscal term (from April 1, 2007 to March 31, 2008): Submitted to Director, Kanto Local Finance Bureau on June 25, 2008
(2) Quarterly reports and confirmation letters For the first quarter of the 97th fiscal term (from Apr. 1, 2008 to Jun. 30, 2008): Submitted to Director, Kanto Local Finance Bureau on August 8, 2008 For the second quarter of the 97th fiscal term (from Jul. 1, 2008 to Sep. 30, 2008): Submitted to Director, Kanto Local Finance Bureau on November 10, 2008 For the third quarter of the 97th fiscal term (from Oct. 1, 2008 to Dec. 31, 2008): Submitted to Director, Kanto Local Finance Bureau on February 9, 2009
(3) Amendment to interim report Submitted to Director, Kanto Local Finance Bureau on June 5, 2008
Amendment to the interim report of the 96th fiscal term (from Apr.1, 2007 to Sep. 30, 2008)
(4) Extraordinary report Submitted to Director, Kanto Local Finance Bureau on June 25, 2008
According to the provision of Article 24-4 Paragraph 5 of the Financial Instruments and Exchange Act, and Article 19 Paragraph 2-2-2 of the Cabinet Office Ordinance , regarding the disclosure of corporate information
Submitted to Director, Kanto Local Finance Bureau on April 21, 2009 According to the provision of Article 24-4 Paragraph 5 of the Financial Instruments and Exchange Act, and Article 19 Paragraph 2-2-12, 19 of the Cabinet Office Ordinance , regarding the disclosure of corporate information
Submitted to Director, Kanto Local Finance Bureau on June 24, 2009 According to the provision of Article 24 Paragraph 5-4 of the Financial Instruments and Exchange Act, and Article 19 Paragraph 2-2-2, of the Cabinet Office Ordinance, regarding the disclosure of corporate information
(5) Amendment to extraordinary report Submitted to Director, Kanto Local Finance Bureau on August 1, 2008
Amendment to the extraordinary report submitted on June 25, 2008
(6) Share buyback report Report term (from Jun. 25, 2008 to Jun. 30, 2008) Submitted to Director, Kanto Local Finance Bureau on July 11, 2008 Report term (from Jul. 1, 2008 to Jul. 31, 2008) Submitted to Director, Kanto Local Finance Bureau on August 6, 2008 Report term (from Aug. 1, 2008 to Aug. 31, 2008) Submitted to Director, Kanto Local Finance Bureau on September 9, 2008 Report term (from Sep. 1, 2008 to Sep. 30, 2008) Submitted to Director, Kanto Local Finance Bureau on October 7, 2008 Report term (from Oct. 1, 2008 to Oct. 31, 2008) Submitted to Director, Kanto Local Finance Bureau on November 11, 2008 Report term (from Nov. 1, 2008 to Nov. 30, 2008) Submitted to Director, Kanto Local Finance Bureau on December 8, 2008 Report term (from Dec. 1, 2008 to Dec. 31, 2008) Submitted to Director, Kanto Local Finance Bureau on January 9, 2009 Report term (from Jan. 1, 2009 to Jan. 31, 2009) Submitted to Director, Kanto Local Finance Bureau on February 9, 2009 Report term (from Feb. 1, 2009 to Feb. 28, 2009) Submitted to Director, Kanto Local Finance Bureau on March 9, 2009 Report term (from Mar. 1, 2009 to Mar. 31, 2009) Submitted to Director, Kanto Local Finance Bureau on April 7, 2009 Report term (from Apr. 1, 2009 to Apr. 30, 2009) Submitted to Director, Kanto Local Finance Bureau on May 12, 2009 Report term (from May 1, 2009 to May 31, 2009) Submitted to Director, Kanto Local Finance Bureau on June 8, 2009
(Translation) Hino Motors, Ltd. (E02146) Securities Report for the Fiscal Year Ended March 31, 2009
- 93 -
Part B: Information on Corporate Guarantor for the Company There are no applicable matters to be reported.
Copyright © 2022 FDOKUMEN