Annual Report and Financial Statements - Bamburi Cement
93
www.lafarge.co.ke ANNUAL REPORT AND FINANCIAL STATEMENTS 2020 Annual Report and Financial Statements BamburiCement BamburiCementLtd.LafargeHolcim BAMBURI CEMENT LIMITED Corporate Office, Kitui Road, Off Kampala Rd, Industrial Area, Nairobi. P.O Box 10921 - 00100, Nairobi. Tel: +254 (0) 20 2893000 / 6614358 / 722 202941 / 720 205471 Email: [email protected] Website: www.lafarge.co.ke Setting Industry Standards in Health & Safety
-
Upload
khangminh22 -
Category
Documents
-
view
3 -
download
0
Transcript of Annual Report and Financial Statements - Bamburi Cement

ww
w.la
farg
e.co
.ke
ANNU
AL R
EPOR
T AN
D FI
NANC
IAL
STAT
EMEN
TS 2
020
Annual Report and Financial Statements
BamburiCement BamburiCementLtd.LafargeHolcim
BAMBURI CEMENT LIMITEDCorporate Office,
Kitui Road, Off Kampala Rd, Industrial Area, Nairobi.P.O Box 10921 - 00100, Nairobi.
Tel: +254 (0) 20 2893000 / 6614358 / 722 202941 / 720 205471Email: [email protected]
Website: www.lafarge.co.ke
Setting Industry Standardsin Health & Safety

Who We Are 5About Bamburi Cement Group 7About LafargeHolcim 8Our Brands 10
2020 Overview 15Group - Key Financial Highlights 16Value Added Statement 17Chairman’s Statement 18Group Managing Director’s Statement 22Board of Directors 26Executive Committee Members 31
Business Overview 33Operational Review 34Marketing Highlights 42Health and Safety 46Our People, Culture and Systems 50Risk and Control 56
Sustainability Review 59Our Sustainability Framework 60Communities 63Climate 69Environment 70Circular Economy 72
Governance 75Corporate Governance Statement 76Governance Auditors Report 81Statement of the Directors on Governance 82Directors’ Remuneration Report 83Shareholder Profile 86
Financial Review 89Corporate Information 90Report of the Directors 91Statement of Directors’ Responsibilities 92Independent Auditors’ Report 93Consolidated Statement of Profit or Loss and Other Comprehensive Income 97Company Statement of Profit or Loss and Other Comprehensive Income 98Consolidated Statement of Financial Position 99Company Statement of Financial Position 100Consolidated Statement of Changes in Equity 101Company Statement of Changes in Equity 102Consolidated Statement of Cash Flows 103Company Statement of Cash Flows 104Notes to the Financial Statements 105
Contents
Over the years we have championed road safety by training long distance truck drivers and motorbike (boda
boda) riders as well as creating awareness countrywide
Integrated Reporting: This report applies the principles of Integrated Reporting to show how we manage the companysustainably, as well as the financial and non-financial value we created in 2020. BAMBURI CEMENT ANNUAL REPORT & FINANCIAL STATEMENTS 2020 3

Who We AreAs a leading cement and concrete producer in East Africa, Bamburi Cement Ltd is at the forefront of innovation in construction, driven through high performance, new technologies, and sustainable building and construction products and solutions. Our products and solutions support nation building. We are here to help the world build better.
Our VisionTo be the undisputed leader and the preferred partner by providing innovative solutions for nation building
Our Strategy:Building for Growth is based on 4 pillarsGrowthProfitable Growth ahead of market
PerformanceBe the best cash cost company in the country through innovation & operational excellence
PeopleBecome an agile, lean and performance focused organization by empowering our people
SustainabilityBe the most respected company by all stakeholders by creating shared value with them
Approved Personal Protective Equipment (PPE) must be worn at all our sites by staff and visitors alike.
BAMBURI CEMENT ANNUAL REPORT & FINANCIAL STATEMENTS 2020 5

BAMBURI CEMENT ANNUAL REPORT & FINANCIAL STATEMENTS 20206
Setting Industry Standards in Health & Safety
Hima Cement Ltd A subsidiary of Bamburi Cement Ltd with two plants in Kasese and Tororo.
About Bamburi Cement Group
UGANDA
KENYA
Bamburi Cement LtdA subsidiary of LafargeHolcim, the world’s global leader in building solutions, listed in the Nairobi Securities Exchange.
The company runs two cement plants, based in Mombasa and Athi River, from where it serves the market in Kenya, the region and export.
Bamburi Special Products Ltd A supplier of quality Ready Mix concrete and Precast concrete blocks with operations in Nairobi and Mombasa.
Lafarge Eco Systems LtdThe environmental arm of Bamburi Cement Ltd whose operations are in sustainable land use and quarry rehabilitation.
Binastore LtdA one-stop shop for a wide range of construction products, solutions and expertise to support customers in their construction needs.
Management conducts annual plant audits to review and update our Health and Safety systems.
BAMBURI CEMENT ANNUAL REPORT & FINANCIAL STATEMENTS 2020 BAMBURI CEMENT ANNUAL REPORT & FINANCIAL STATEMENTS 20206 7

About LafargeHolcim
Find out more: www.lafargeholcim.com/where-we-operate
Key Grinding plant
Cement plant
Our global presenceWe have the largest global footprint in our industry with a presence in around 70 countries across the world.
North America
5,749mNet sales (CHF)2019: 6,311m
Latin America
2,225mNet sales (CHF)2019: 2,620m
Our business segments
Middle East & Africa
2,349mNet sales (CHF)2019: 2,903m
Europe
7,061mNet sales (CHF)2019: 7,670m
Asia Pacific
5,243mNet sales (CHF)2019: 6,491m
Cement
190.4Sales (million tons)2019: 207.9
Aggregates
256.3Sales (million tons)2019: 269.9
Ready-Mix Concrete
42.3Sales (million m 3)2019: 47.7
Solutions & Products
1,893mSales (CHF million)2019: 2,248m
Setting Industry Standards in Health & Safety
BAMBURI CEMENT ANNUAL REPORT & FINANCIAL STATEMENTS 2020 BAMBURI CEMENT ANNUAL REPORT & FINANCIAL STATEMENTS 20208 9

Our BrandsSetting Industry Standards in Health & Safety
BAMBURI CEMENT ANNUAL REPORT & FINANCIAL STATEMENTS 2020 BAMBURI CEMENT ANNUAL REPORT & FINANCIAL STATEMENTS 202010 11
We offer the widest range of innovative application-based products and solutions specifically designed to meet different construction requirements, in response to our customer needs.

Haller Park
Forest Trails
Offers sustainable waste management solutions to industries and municipalities. Disposal through co-processing in cement kilns; a safe and more responsible solution to waste management.
Our Brands continued
A verdant cool forest with open grasslands and fitness trails transformed from a Bamburi quarried barren landscape. It’s cool, serene and fresh ambience, free from noise, makes it an ideal destination for outdoor activities, events and excursions. The fitness trails are used for leisure walking, jogging and cycling.
Setting Industry Standards in Health & Safety
BAMBURI CEMENT ANNUAL REPORT & FINANCIAL STATEMENT 2020 BAMBURI CEMENT ANNUAL REPORT & FINANCIAL STATEMENT 202012 13
A world famous ecological and ecotourism showcase which was once a Bamburi quarry wasteland and was rehabilitated into a rich diverse tropical ecosystem. Bamburi Haller Park is a recreational hot-spot ideal for experiential learning and serene outdoor experiences. It offers a variety of attractions to educate, raise awareness and entertain visitors; and is home to a diverse range of wild animals.
Bamburi Readymix Concrete
Pre-mixed concrete delivered to customer sites as ready to use construction product.
Bamburi Precast Mould
A variety of pre-cast mould concrete products for different applications ranging from block drainage, hollow blocks, road kerbs, edge restraints to fencing products among others.
BamburiBlox
High quality precast concrete paving blocks that offer quality paving solutions. We have a variety of designs and aesthetics to cater for different tastes.

2020 OverviewGroup - Key Financial Highlights 16Value Added Statement 17Chairman’s Statement 18Group Managing Director’s Statement 22Board of Directors 26Executive Committee Members 31
Defence against Covid-19:We ensured all staff had access to face masks and donated reusable masks to vulnerable communities.

BAMBURI CEMENT ANNUAL REPORT & FINANCIAL STATEMENTS 2020 BAMBURI CEMENT ANNUAL REPORT & FINANCIAL STATEMENTS 2020
2020 OVERVIEW FINANCIAL REVIEWBUSINESS OVERVIEW SUSTAINABILITY REVIEW GOVERNANCE
16 17
Setting Industry Standards in Health & Safety
Group - Key Financial Highlights
Revenues34,884M Kes
Customers are at the heart of our business. We understand our local markets and strive to exceed
our customers’ expectations. We are concerned with providing our customers with the highest quality products and respond
appropriately to their concerns.
Shareholders (Dividend)
-We provide shareholders with
open and transparent information and encourage two-way
communication while observing the highest standards of corporate governance and ethical business
practices.
Communities21M Kes
We seek to create social, environmental and economic
benefits for communities where we operate.
Banks 62M Kes
We create value for our financial services providers through the financial product and services we access from them enabling
us to finance our operations and investments.
Suppliers28,138M Kes
We work collaboratively with several strategic suppliers. We
cascade our high business conduct through these
relationships. We ensure that we treat our suppliers with the utmost respect and encourage
co-creation.
Net Capital Out Flows1,085M Kes
We are consistently improving our productive capacity through
investments in machinery, equipment, technology and other
assets so as to maintain our competitive advantage.
Payment to Governments3,368M Kes
By working closely with both National and County governments, we bring the
benefits of private sector operation; providing revenue for the exchequer through various taxes and payments
and influencing practices in the construction sector through policy
dialogue and sharing of our experience and expertise.
Our Employees2,979M Kes
Our employees drive our business. We strive to create a diverse
and inclusive workplace where all our colleagues can reach
their full potential while providing competitive remuneration and
benefits and prioritizing their health and safety
Retained forSustainable Growth
6,251M KesCash retained for sustainable operations in our business.
Value Added Statement
21,261 19,59423,048 22,218 20,670
16,773 16,380
14,214 14,578 14,214
38,034 35,974
37,262 36,796 34,884
2016 2017 2018 2019 2020
Group Turnover - Kes Million
Uganda Kenya Total Group
8,271
4,116
620 728
1,776
2016 2017 2018 2019 2020
Group Profit before tax - Kes Million
5,243
1,647
861 633 1,051
2016 2017 2018 2019 2020
Group Profit attributable to shareholders - Kes Million
2016 2017 2018 2019 2020
14.44
4.54
2.371.74
-
2.89
12.00
4.00 5.10
3.00
EPS (Kes per share) DPS (Kes per share)
Group Earnings and Dividend per Share
6,972
3,490
2,366
3,106
6,387
2016 2017 2018 2019 2020
Group Cash and cash equivalents- Kes Million
471 461 470403 374
331 347 352
326 346
802 808 822
729 720
2016 2017 2018 2019 2020
Employee Numbers
Uganda Kenya Total

BAMBURI CEMENT ANNUAL REPORT & FINANCIAL STATEMENTS 2020 BAMBURI CEMENT ANNUAL REPORT & FINANCIAL STATEMENTS 2020
2020 OVERVIEW FINANCIAL REVIEWBUSINESS OVERVIEW SUSTAINABILITY REVIEW GOVERNANCE
18 19
Setting Industry Standards in Health & Safety
The statement covers Bamburi Cement Limited (the ‘Company’) and its subsidiaries (together, the ‘Group’)
OverviewWith the announcement of the first confirmed case of Covid-19 infection in Kenya and Uganda in March of 2020, the year ahead promised to be an uncertain one. The impact of the pandemic was unprecedented, and was to be felt both from a public health perspective, as well as from a socio-economic level. Like every other community and business in the world, we had to brace ourselves for the worst, take our position to confront the situation head-on, while hoping for the best.
The Covid-19 crisis presented the biggest challenge our markets have had to deal with in recent times. Like everywhere else in the world, our people, our business and our communities have faced a difficult period.
In the year 2020, the Kenyan economy was impacted adversely, a little more than the Ugandan economy, given its significant exposure to Tourism, a sector which was a lot more impacted adversely.
As we navigated through the pandemic, our number one priority was to keep our people and communities safe. We took deliberate measures to preserve the health of our people as we worked to protect the business.
Chairman’s Statement
“Resilient business performance in a challenging environment of a global Covid-19 pandemic.”Dr. John SimbaChairman
Our Response to the Covid-19 Crisis: The HEALTH, COST & CASH InitiativeIn March 2020, the Group launched the “HEALTH, COST & CASH” (HCC) initiative whose objective was to safeguard the health and safety of our people, partners and communities, while mitigating the anticipated adverse financial impact of the pandemic on the business. The HCC initiative was executed flawlessly, with agility and precision.
HealthWorking quickly to respond to the evolving crisis, The Bamburi Group amplified its focus on health with the intention to preserve the health of our employees, our customers and of the communities in which we operate. The Group quickly put together a Covid-19 Business Resilience Team (BRT) made up of the executive committee and senior managers in the business. The BRT was tasked with the responsibility of closely monitoring the unfolding events, proactively formulating appropriate business response policies, and executing the same in a swift and timely manner. Through the BRT, a wide range of measures to protect our teams and contain the spread of Covid-19 within our community were executed. This included the creation of critical response documentation for specific operational focus points, reducing the number of people on our operating sites at any one point in time, introducing alternative work arrangements in compliance with mandated public health protocols, introduction and facilitation of remote working, screening of every individual on site, enforcing necessary hygiene and sanitisation measures on operating sites, and deploying emergency response measures in the face of infection threats.
We furnished our employees with appropriate Personal Protective Equipment (PPE) and consumables for use by themselves and their families. Care packs containing appropriate masks, gloves, sanitisers and thermometers were given out to our employees and the consumables in them replenished as and when the need arose. Similar care packs were extended to our customers including transporters, as well as to the communities that we work with.
As a responsible corporate citizen, the Group also supported various government sponsored Covid-19 containment initiatives through cash and PPE donations.
Cost Saving: Given the expected adverse impact on the cement market on account of the Covid-19 containment measures such as lockdowns, curfews and the need to limit personal contact with customers, the Group’s response was to mitigate the adverse impact of revenue shrinkage on the bottomline by saving on costs. The Group restricted or avoided altogether, non-critical spends, and focused only on those budget heads that were critical.
As a result of the cost saving measures, Year 2020 Group Profit before Tax closed at Kes 1,776m (Kes 728m in 2019), a 144% increase over 2019. This is a demonstration of great resilience of our business in the face of the Covid-19 pandemic.
Cash Preservation:To preserve cash, the Group amongst other initiatives, implemented the following:• Suspension or re-prioritisation of certain capital
projects• Optimisation of inventory levels• Minimisation of exposure to trade receivables by
reviewing of our credit policy and launching an aggressive collection drive.
As a consequence of the Cash Preservation measures, the Group generated a record cash flow from operations of Kes 6,860m (2019: Kes 3,659m), a 87% increase over the previous year.
Cement Market & CompetitionKenya and Uganda cement market recorded mixed performance over the period. In Kenya, the cement market size contracted in the first half borne by the slow down on construction activities due to the Covid-19 pandemic. However, the second half of the year recovered with volumes in 2020 outperforming prior year’s on a like for like basis.
In the first half of 2020, there was a gradual decline in activity in the building and construction sector driven by site closures especially in Nairobi, Mombasa and Kilifi in response to reduced hours of working and lockdowns. In addition, liquidity challenges alongside competitive pressure occasioned by over-capacity situation in the Kenyan cement market, continued to put pressure on cement selling prices.
However, in the second half of the year, the market recovered back to pre-Covid levels, driven by Individual Home Builders (IHB) segment and key infrastructure projects the Government had initiated.
The Uganda cement market saw almost the same pattern as in Kenya with a strong second half of the year. Despite the market growth, the cement demand and supply was still affected by the adverse effects of the Covid-19 containment measures which came into force from late March 2020.
With regards to export from Uganda to the adjacent regional markets, the volumes exported declined. The decline was attributable to plant supply constraints and logistics challenges caused by truck clearance delays at border points. Truck drivers were subjected to long queues and waiting times at the respective border points, the time during which they were subjected to Covid-19 testing and clearance protocols.

BAMBURI CEMENT ANNUAL REPORT & FINANCIAL STATEMENTS 2020 BAMBURI CEMENT ANNUAL REPORT & FINANCIAL STATEMENTS 2020
2020 OVERVIEW FINANCIAL REVIEWBUSINESS OVERVIEW SUSTAINABILITY REVIEW GOVERNANCE
20 21
Setting Industry Standards in Health & Safety
The strong financial performance delivered in the year 2020 is a foundation that we will build on to project forward into 2021.
AppreciationOn behalf of the Board of Directors, I would like to thank our customers, consumers, business partners as well as the governments of Kenya and Uganda where we operate, for their continued support. I also wish to thank our management and employees for their continued agility and resilience through the crisis. They have demonstrated deep commitment to this business, and I have no doubt that, with their continued efforts, we will emerge even stronger. I would also like to sincerely thank my fellow Bamburi Board members for their counsel, support and dedication throughout the year and for delivering a strong Corporate Governance environment. Together, we have made a strong positive mark on the business against the odds. We can do it again in the future.
DividendsIn consideration of the strong performance delivered in both bottom-line and Cash generation in the year 2020, and in recognition that the year 2020 was a difficult one financially for many, our esteemed shareholders included, the board of Bamburi Cement Limited, recommends the payment of a final dividend of Kes 3.00 per share. This is based on the Bamburi Cement Ltd parent company independent performance.
The dividend will be paid on or about 15th July 2021 to shareholders on the register at the close of business on 16th May 2021, subject to the approval of shareholders at the Annual General Meeting scheduled for 10th June 2021.
Dr. John Simba, EGH, MBS, OGW.Chairman
20 April 2021
The Rwanda-Uganda border closure continued to affect trade relations and cement export between the two countries. However, as we look forward to the border reopening, we have continued to maintain presence in the Rwanda market through supplies ex Bamburi Cement Limited in Kenya. Through our Ugandan subsidiary (Hima Cement Limited), we are driving increased dispatches to East DRC as well as plugging up market supply gaps occasioned by the Rwanda situation.
Performance OverviewDue to the impact of the Covid-19 pandemic in Kenya and Uganda, the Group Turnover at Kes 34,884m in 2020 (2019:Kes 36,796m) declined by 5%. The decline occurred in the first half of the year when impact of the Covid-19 containment measures on our volumes was most severe. In the first half of 2020 the Group registered a revenue decline of 13%, while the second half registered positive growth
Chairman’s Statement continued
over prior year. Lower than prior year selling prices have also been experienced partly due to change in product mix. In Kenya, in February 2020, we launched “Fundi”, a 22.5 masonry cement which specifically targets masonry, brick laying and plastering applications. The introduction of Fundi at a more affordable price into our range of product offerings has contributed to a lower than prior year average selling price. Competitive pressure has also contributed to pure price erosion.
Despite decline in revenue, the operating Profit in 2020 at Kes 1,983m (2019: Kes 1,117m) grew significantly by 77.5%. This is testimony that the swift implementation of the “HEALTH, COST & CASH” action plan adopted by the Group at the onset of the Covid-19 pandemic has helped mitigate the adverse impact of the crisis. The hard work the business has invested in transforming itself through cost base optimization and process efficiency; is making a big positive difference in the performance of the business.
Our ResilienceTotal comprehensive profit after tax for the year at Kes 1,919m (2019: Kes 350m), which is a growth of 448%, achieved against a 5% decline in turnover, is testimony that our HCC strategy delivered as intended in response to a ravaging pandemic.
The Group’s results for the year 2020, demonstrates the great resilience of our business. We are proud of our team’s agility to weather the storm, effectively driving cost savings ahead of revenue decline, improving net working capital and delivering a record high Cash Flow of Kes 4,857m (2019: Kes 359m).
2021 Outlook2021 has started with both the Kenya and Uganda governments gradually easing the Covid-19 containment measures. However, both countries have continued to register new infection rates, albeit at reduced levels. At the time of writing this report, Kenya is experiencing a third wave which is believed to be of a new strain that is presenting more aggressively than the previous, as is evidenced by the higher rates of infections and mortality. In response, the Kenya government has reintroduced selective containment measures.
In the wake of the third wave, not just in Kenya, but in many parts of the world, the adverse impact of the pandemic on the global and domestic supply chain is expected to persist through the remaining part of 2021. The strength of the economic recovery will depend in part on how Kenya and Uganda will be successful in accelerating vaccination, containing the new wave, flattening the curve, and subsequently easing off on the reintroduced containment measures.
Despite the uncertainty in this space, as a Group, we will remain steadfast in delivering on our strategy. This in a bid to grow shareholders’ value as we advance our purpose of transforming lives. Our key focus remains to protect our people and partners, without whom we will not be able to achieve our noble objectives.
We will redouble our efforts to grow the business across the region. We intend to achieve this through continued product innovation, re-engineering of our route to market, execution of cost containment initiatives in all functions, and digital transformation initiatives to improve business agility, flexibility and performance.
Despite the continuing uncertainty in relation to the Covid-19 pandemic, the Bamburi Group has confidence in the ability of the two governments of Kenya and Uganda to help contain the pandemic and promote a positive economic environment supportive of business growth. We will compliment government efforts with continuing to flawlessly execute our “Building for Growth” strategy, while espousing the spirit of resilience in the Health, Cost and Cash initiative as has been demonstrated by our management team.

BAMBURI CEMENT ANNUAL REPORT & FINANCIAL STATEMENTS 2020 BAMBURI CEMENT ANNUAL REPORT & FINANCIAL STATEMENTS 2020
2020 OVERVIEW FINANCIAL REVIEWBUSINESS OVERVIEW SUSTAINABILITY REVIEW GOVERNANCE
22 23
Setting Industry Standards in Health & Safety
At the same time, our non-industrial staff worked from home, with our customer facing employees connecting and engaging with our customers virtually during the restricted period. As a business, we also played our part by lending financial support to government sponsored containment initiatives, as well as making donations of Personal Protective Equipment (PPE) and consumables such as sanitisers, to the community and healthcare workers in order to help curb the spread of the pandemic.
Some of the policies we adopted as a Group in a bid to minimise the risk of spreading the virus, include; setting up of handwashing and sanitisation stations and temperature screening points at all access points into our sites, visualizing social distancing through markers within offices and work stations, implementing disinfection schedules for commonly touched surfaces and high traffic areas, and strictly enforcing the wearing of masks. We also safely accommodated over 120 workers onsite following the Presidential directives to industrial operators during the Covid-19 restriction period.
SafetyAlongside the focus on health, the Group continued to prioritise safety. Year 2020 was a good year for Kenya, which registered significant improvement over 2019. There was only one Lost Time Incident (LTI) compared to four LTI’s in 2019 in our Mombasa Plant, and one medical injury in 2020 compared to four in 2019. Unfortunately and regrettably, we recorded one road fatality in 2020, same as in 2019.
Our Mombasa plant was recognized in the whole of Middle East & Africa (MEA) region by the LafargeHolcim group for closing sustainably 100% of their audit findings from the Health and Safety audit performed in 2019. This was achieved despite the disruption caused by the pandemic. The closure of these actions was confirmed through a verification audit performed in November 2020 by the LafargeHolcim Group Health & Safety team.
Our Hima Cement Limited did even better in 2020. At Hima, we did not register any onsite fatality nor Lost Time Injury (LTI) as a result of our operations.
Operational ReviewAs a consequence of the pandemic, the Group revenue performance was adversely impacted in the first half of the year when the containment measures were most strict. The measures included restriction of movements and shorter working hours due to lockdowns and curfews. Many construction sites and aggregates quarries were shut down in response. Following the easing off of the measures towards the second half, we started witnessing some recovery. As a consequence of the difficult first half, our revenue declined by 13% in the period, while the second half of the year registered a growth of 3% compared to 2019. The Group performance in 2020 is very much a story of two halves. Overall, the full year registered a 5% decline in revenue.
At Lafargeholcim, health and safety is our overarching value. We prioritise the health and safety of our employees, partners and our communities because we believe this is the most sustainable way to doing business. 2020 is a year that would bring this value to the test more than ever before. A year of major business disruption on account of the Covid-19 global pandemic. With the announcement of the initial cases in Kenya and Uganda in the month of March 2020, the two governments immediately embarked on containment measures to curb the spread of the pandemic.
The Bamburi Group also responded swiftly by implementing the “HEALTH, COST & CASH” (HCC) action plan in order to protect the health of its stakeholders and that of the company. The objectives of the HCC initiative were threefold; ie
• To prioritise the protection of human health and by extension, human life,
• To preserve cash in the business, and• To optimize the Group’s cost base by deprioritizing
non-critical and non-essential spends.
HealthThe Covid-19 pandemic crisis, challenged us to innovate new and safe ways of doing business. For our employees, business Partners, stakeholders, and even the communities that we operate in, the priority was and remains, Health. Being an industrial outfit, we had to have a significant number of our employees operating on site. Consequently, we had to incorporate safety measures, including compliance with the mandated protocols by the Ministries of Health of the two countries. All our operations, from quarry to logistics had to comply with stipulated containment measures in order to protect all that were involved.
Despite the challenges experienced in 2020, we were still able to sustain the innovation momentum. Bamburi Cement Limited (BCL) launched ‘Fundi’ cement, a new MC 22.5, targeted at masonry and mortar works such as plastering, brick and block laying, screed and repair works. The new “Fundi” cement complements our wide range of existing product and building solution offerings targeting specific applications such as structural and waterproofing works. The launch of Fundi cement demonstrates BCL’s commitment to providing innovative solutions that meet more specific and unique construction and user needs.
In both Kenya and Uganda, in the midst of the crisis, we launched a commercial digital platform, namely “Lead Retail” application. The objective of the application is to connect with our customers so that they can order online, track their orders and deliveries and check their accounts.
In Uganda, this digital application was complemented by another one, known as “Jumia”.
The objective of going digital is to expand our customer reach and online footprint by connecting directly with individual home builders (IHBs). As result, a total of 40 new customers were recruited into this digital platform during the year. These initiatives are part of our Route-To-Market re-engineering and are expected to drive brand penetration at the retail level and provide more sales opportunities. We expect the digital solutions to help us connect better with our customers while also helping us offer a superior service to them. The timing of the digital solutions also served both our employees and customers well at a time when personal physical contact was to be minimized or eliminated altogether.
CostThe “Cost” Pillar of the HCC agenda that was launched in response to the pandemic, enabled us to drive a cost saving agenda to mitigate the impact of decline in revenue on the bottomline. By deprioritizing non-critical and non-essential costs, the impact of revenue decline on bottomline was fully mitigated. The successful implementation of the “cost” pillar, enabled us to mitigate the adverse impact not only of the revenue decline, but also of the significant devaluation of Kenya Shilling in 2020 (by over 8%) on our imported cost base, as well as the negative impact of the exceptional impairment of our Biofuels asset (by Kes 352m) in the year.
CashThe “Cash” pillar of the HCC initiative, which was about cash preservation to secure our liquidity; also served the Group well at a time of financial and cash distress for many businesses. To deliver on the Cash objective, the Group focused on inventory level optimization, and a tighter trade receivables governance which was supported by automation of the credit control process.
As a consequence, The Group was rewarded with a record cash flow in a long time.
Group Managing Director’s Statement
“Our priority during the Covid-19 pandemic remains to enhance business resilience and to protect the health and safety of our employees, their families and partners.”Seddiq HassaniGroup Managing Director

BAMBURI CEMENT ANNUAL REPORT & FINANCIAL STATEMENTS 2020 BAMBURI CEMENT ANNUAL REPORT & FINANCIAL STATEMENTS 2020
2020 OVERVIEW FINANCIAL REVIEWBUSINESS OVERVIEW SUSTAINABILITY REVIEW GOVERNANCE
24 25
Setting Industry Standards in Health & Safety
share in an increasingly competitive environment. The HCC agenda will help us optimise our cost base in order to deliver profitable growth.
In Kenya, we will continue to support the Government’s Big 4 Agenda, specifically the construction of affordable housing and key infrastructure projects such as dams, ports, the expressway, bypasses and road interchanges.
In Uganda we will also continue to focus on supplying key strategic projects in the domestic and export markets. The company will continue leveraging its brand equity for large projects, developing new products to penetrate new segments and gain market share in targeted markets through a more efficient commercial operation.
Overall, the Group is optimistic that as it maximizes revenue opportunities and continues to drive transformation initiatives to optimise cost base, we are in a good position to create more value for all our stakeholders and shareholders in the short, medium and long term. The Group’s priority continues to be the implementation of necessary measures to enhance business resilience and to protect the health and safety of our employees, their families and partners during the Covid-19 pandemic.
ConclusionI take this opportunity to thank all our loyal customers, suppliers, and hard-working staff including our community stakeholders for the support they have continue to accord to us. Without this valued support, we would not have achieved what we have delivered in 2020.
We continue to count on your support in our journey of Building for Growth, as we create greater value for all our stakeholders. Given the foundation of resilience that we have already laid, and plans we have in the pipeline, we believe we are well placed to face and navigate through the challenging and uncertain business environment that is ahead of us.
Seddiq HassaniGroup Managing Director
20 April 2020
ResilienceThanks to the flawless execution of the HCC initiative, the Group was able to demonstrate both operational and financial resilience at a very difficult time in recent history. We were able to navigate through the pandemic crisis while defending our market and cost leadership position.
Moving forward, the Group will continue with the drive to grow and sustain its market leadership position. We plan to achieve this through the leveraging of our wide range of innovative cement products, value added products in ready mix and precast, and cost leadership.
Financial PerformanceRevenue for the group at Kes 34,884m (2019: Kes 36,796m) was 5% down, indicating a resilient underlying performance on a like for like basis had there been no adverse impact from the Covid-19 in the first half of 2020.
In Kenya, cement sales volumes were flat against 2019 despite the Covid-19 pandemic impact on the economy. However, the turnover was lower than 2019 on account of lower average selling prices. The launch of “Fundi” cement in February 2020 at an affordable price also lowered the average selling price in comparison to 2019.
Group Managing Director’s Statement continued
COST & CASH” action plan by the Group at the onset of the Covid-19 Pandemic.
Profit before income tax at Kes 1,776m (2019: Kes 728m) was up by 144%. In additional to the impact of improved operating profit, the group was able to lower the net cost of finance by Kes 182m or 46.8% from Kes 389m in 2019 to Kes 207m in 2020.
Total Comprehensive income for the year grew 448% from Kes 350m in 2019 to Kes 1,919m in 2020 driven by a lower effective Tax Rate of 36.4% (2019: 50.6%) and a registered exchange gain in retranslation of Uganda shillings into Kenya Shillings at Kes 807m (2019: Kes 22m).
Cash flow The reduction in Finance costs came about from deliberate actions taken to by the Group as part of the “Cash” pillar of HCC. These actions included the release of cash tied in trade receivables and inventories by optimizing inventory levels across the group, as well as tightening credit control measures. During the year, inventories and trade receivables were reduced by Kes 1,554m (2019: Kes 1,041m) and Kes 885m (2019: 138m) respectively, releasing a total of Kes 2,439m (2019: 1,179m) of cash tied therein. Additionally with improved profitability, total cash generated from operations was Kes 6,860m (2019: Kes 3,659m), an exceptional growth of 87.5%.
Excluding the impact of dividends paid in 2019 of Kes 1,488m which did not apply to year 2020, net cashflow generated in 2020 at Kes 4,857m (2019: Kes 1,847m), registered a growth of Kes 3,010m or 163% in underlying terms.
The exceptional performance of the Group in 2020 both at profitability and cash flow level, despite a global pandemic is a testimony of our resilience in the face of adversity and makes us confident about the future.
2021 OutlookPost Covid-19 pandemic, the East African cement markets are projected to recover in 2021. The markets will remain highly competitive on account of the excess cement capacity invested in the region. To sustain our market leadership, the Group will continue to execute the “Building for Growth” strategy 2022. We will also continue implementing the Health, Cost and Cash action plan. Going forward, the group will focus on innovative solutions to support our revenue growth, cost optimization, people agenda, financial strength and sustainability.
Under “Building for Growth” we will continue to drive innovation in the building solutions space to ensure our users and clients are presented with the latest in the building technology to meet their diverse and ever changing needs. At the same time, the Group will continue revamping its Route-To-Market (RTM) strategy while expanding the Commercial digital space in which we operate. In executing both of these initiatives, we will be in a better position to maintain and defend our market
In Uganda, despite the pandemic, the domestic volume was higher than 2019 by 2%. However, Hima Cement’s 2020 export volumes declined by 17% on account of Covid-19 containment measures. The measures impacted plant output. In addition, transit times and associated costs increased for goods destined for exports markets due to truck clearance delays at the border crossing points necessitated by long queues and bureaucracies around truck drivers’ testing for Covid-19 and subsequent clearance. The situation of the Rwanda-Uganda border persisted in 2020.
Operating Profit for the group was impacted by an exceptional impairment on our Biofuels asset of Kes 352m (2019: Nil). Following the decline in global coal prices during the year, which led to the deprioritisation of capex spend to facilitate the consumption of our trees as alternative fuel to coal, we have had to impair the book valuation of the trees accordingly. Additionally, and on a positive note, the group was able to dispose of non-strategic assets during the year from which we realised a gain of Kes 260m (2019: Kes 196m). Despite the material impairment and the 5% decline in revenue, our operating profit grew by Kes 866m in 2020 representing a 77.5% growth from Kes 1,117m in 2019 to Kes 1,983 bn in 2020. The operating profit growth has been achieved thanks to the swift and efficient response to the pandemic via the implementation of the “HEALTH,

BAMBURI CEMENT ANNUAL REPORT & FINANCIAL STATEMENTS 2020 BAMBURI CEMENT ANNUAL REPORT & FINANCIAL STATEMENTS 2020
2020 OVERVIEW FINANCIAL REVIEWBUSINESS OVERVIEW SUSTAINABILITY REVIEW GOVERNANCE
26 27
Setting Industry Standards in Health & Safety
DR. JOHN SIMBA, 75
Independent Non-Executive Director
DR. JOHN SIMBALLB, LLD(hc) EGH, MBS, OGWJohn is an Advocate of the High Court of Kenya and Senior Partner at Simba & Simba, Advocates. He has previously worked with the Attorney General’s Chambers, Industrial & Commercial Development Corporation and National Bank of Kenya.Additionally, he has previously served as Chairman; Federation of Kenya Employers, Kenya Bankers’ Association, Retirement Benefits Authority and as President of the Rotary Club of Nairobi. Currently, he is Chairman of Sanlam Kenya Plc., Choice Tea Brokers Limited, Funguo Investments Limited. He also serves as a director in other companies including Hima Cement Ltd. in Uganda and Almasi Beverages Limited (a Coca-Cola Beverages Africa related company). John is a member of the Law Society of Kenya, East African Law Society, International Bar Association and the Institute of Directors, Kenya.John is the Chairman of the Board of Directors and Chairman of the Nomination, Remuneration & HR Committee (NR&HRC) and member. John was appointed to the Board on 29 November 2012,
RITA KAVASHEMBS, MBA, BEdRita is a captain of the automotive industry with over 20 years’ experience and the Managing Director of Isuzu East Africa Limited (formerly General Motors East Africa), the largest motor vehicle assembler in East Africa. She joined General Motors in 1995 as a Direct Sales Executive and held several key roles in Sales & Marketing, both in Kenya and South Africa before her appointment as Managing Director in 2011. She is the Chair of the Kenya Roads Board, Chair of the Board of British American Tobacco Kenya plc, Vice-Chair of the Kenya Private Sector Alliance and serves as a Member of the Kenya Vision 2030 Delivery Board. She holds a Bachelor’s degree in Education from Moi University - Kenya and a Master’s degree in Business Administration (MBA) from the University of Nairobi. She is also an executive coach certified by the Academy of Executive Coaches (AOEC) UK. In 2017, she was awarded the Moran of the Order of the Burning Spear (MBS) for exemplary service to the Country as a business leader. Rita serves on the Audit & Risk Committee.She was appointed to the Board on 9 March 2017.
MBUVI NGUNZEBComm, FCA (England and Wales)
Mbuvi started his career in Audit and Consultancy working for Price Waterhouse in the UK and Kenya (1990-98), and then for Lafarge in various positions (1998-2011). He was first Finance Director for Bamburi Cement in Kenya, Managing Director Hima Cement in Uganda, VP Group Internal Communications at the Lafarge HQ in Paris, and GM Mbeya Cement Tanzania, before joining Kenya Airways (2011-2017) as Chief Operating Officer, before his appointment as Group Managing Director and CEO.
He is currently a Senior Advisor- Strategy and Operations for Catalyst Principal Partners, an Eastern Africa focused PE fund, where he spends a significant amount of his time driving operational excellence and mentoring executives. He re-joined the Board of Bamburi Cement (LafargeHolcim) as a non-Executive Director, and is Chairman of both the Safarilink Aviation Limited and Mettle Solar Investments (a Pan African solar company) Boards. As part of his paying it forward, Mbuvi sits on the Board of Lewa Wildlife Conservancy, the foremost conservancy organisation in Kenya as Vice Chairman, and Chair of the Audit and Risk Committee. He is also Chair of the Board of St Andrews School Turi, serves on the Selection Committee for Rhodes Scholarships for Kenya, is Chair of the Kenya Association of Air Operators, and provides mentorship to scale up entrepreneurs with Endeavor Kenya.
He has previously served on the Boards of Bamburi Cement, Hima Cement, Mbeya Cement, (all Lafarge majority owned companies), and served as Secretary to the East African Cement Producers Association. He also served on the Boards of Kenya Airways plc, Precision Air Tanzania and Jambojet, Chaired the Executive Committee of African Airlines Association (AFRAA), and was a member of Board of Governors of IATA. He serves on the Audit & Risk and the Nomination, Remuneration & HR Committees. Mbuvi was appointed to the Board on 30 August 2018
DR HELEN GICHOHIOGW, MBS, PhD Zoology, MSc Bio of Conservation, BEd
Helen is currently the Conservation Ambassador for Africa for Fauna and Flora International. From December 2012 to January 2017 she served as Equity Group Foundation’s Managing Director. Prior to that, she led the African Wildlife Foundation (AWF) for 11 years having joined AWF as its first Director of the Heartlands Program in 2001 and rising to become the Vice President for Programs in 2002 and AWFs first President in 2007. Helen has worked at the Wildlife Conservation Society and African Conservation Centre, where she was the Managing Director. She is a recipient of several awards including the Charlotte Wyman Trust’s Women in Conservation Program and the Giai Environmental Award for 2012 at the WIFTs Foundation International Visionary Awards.She is a fellow of the Aspen Institute’s Energy and Environment Program and a McCluskey Fellow of the Yale School of Forestry and Environmental Studies.She previously served on the boards of Equity Bank Kenya Ltd and the Kenya Wildlife Service. Her current board positions include Equity Group Holdings Ltd, Ol Pejeta Conservancy and the African Wildlife Foundation. Helen also serves on the advisory board the African Leadership University’s School of Wildlife Conservation.Helen serves on the Nomination, Remuneration & HR Committee. She was appointed to the Board on 9 March 2017.
DR HELEN GICHOHI ,61
Independent Non-Executive Director
RITA KAVASHE, 56
Independent Non-Executive Director
MBUVI NGUNZE, 53
Independent Non-Executive Director
Board of Directors
SEDDIQ HASSANIMSc Eng. Mechanics, MSc Eng. Aeronautics, PhD MechanicsSeddiq worked as an auditor and Strategy consultant in Arthur Andersen Casablanca before joining Lafarge Morocco 2000. There he held several positions including Control Manager, CEO Lafarge Gypsum Morocco, Purchasing & Logistics Director and Marketing & Strategy Director until he was appointed the LafargeHolcim Head of Growth & Innovation for Middle East and Africa in 2015.He is a member of the Nomination, Remuneration & Human Resource Committee, a director of Hima Cement Limited and Chair of the Board of Bamburi Special Products Limited, Binastore Limited & Lafarge Eco Systems Limited.He was appointed to the Board and as Group Managing Director on 9 February 2018.SEDDIQ HASSANI, 51
Executive Director
PIERRE DELAPLANQUEMBA
Pierre joined Lafarge in 1992 as Treasurer/Controller, Kerneos, France. He continued to have an interesting and wide ranging career holding positions such as CFO - Venezuela, Post Integration Manager - UK, CFO - Phillipines, CEO - Ecuador and CEO - Greece. After the LafargeHolcim merger, Pierre was appointed as Area Manager, Emerging Europe, which position he held until being appointed Area Manager - East and South Africa & Indian Ocean in February 2018.He was appointed to the Board on 7 June 2018.
PIERRE DELEPLANQUE, 56
Non-Executive Director

BAMBURI CEMENT ANNUAL REPORT & FINANCIAL STATEMENTS 2020 BAMBURI CEMENT ANNUAL REPORT & FINANCIAL STATEMENTS 2020
2020 OVERVIEW FINANCIAL REVIEWBUSINESS OVERVIEW SUSTAINABILITY REVIEW GOVERNANCE
28 29
Setting Industry Standards in Health & Safety
AUSTIN A.O. OUKOJSM, LL.M, LL.BAustin A. O. Ouko is the Ag. General Manager (Corporate Affairs/Corporation Secretary) at the National Social Security Fund (NSSF) and has over 10 years’ experience in transactional, corporate and commercial law in both public and private companies. He was previously the Manager Legal at NSSF and before that, Senior Legal Officer with The Standard Group Limited.He holds a Master of the Science of Law (JSM) from Stanford University Law School, a Master of Laws (LL.M) in Public Finance & Financial Services and Bachelor of Laws (LL.B) degree, both from the University of Nairobi.He is an Advocate of the High Court of Kenya, a Fellow of the Chartered Institute of Arbitrators-UK, a Certified Public Secretary-Kenya, and an accredited Governance Auditor with the Institute of Certified Secretaries, Kenya.Austin was appointed to the Board on 28 August 2020.
AUSTIN A.O. OUKO, 39
Non-Executive Director
Board of Directors continued
GRACE A. OLUOCHBComm (Hons), CPA (K)Grace previously worked at Unilever Kenya Limited, which she joined in 1992 as Management Trainee in Finance. She went on to hold various positions including Finance Manager - Unilever Ghana Plc, Controlling Director - Unilever Africa Middle East & Turkey (AMET), Finance Director - Unilever Nigeria Plc, Finance Director - Unilever East & Southern Africa and Finance Transformation Director - Unilever Africa.She is a member of the Institute of Certified Public Accountants of Kenya (ICPAK).Grace was appointed Group Finance Director on 18 October 2018 and is a member of the Hima Cement Limited and Binastore Limited Board of Directors.Grace also sits on the Board of Trustees of Kilimanjaro Blind Trust Africa where she serves the Board as Treasurer.GRACE OLUOCH, 51
Executive Director
JEAN-MICHEL PONSMsc Engineering
Jean-Michel joined LafargeHolcim in 2011 as Country Business Development Director, Algeria & Serbia after which he was promoted to Innovation Director, Algeria then to Country Chief Executive Officer, Moldova. Before joining Lafarge, Jean-Michel had worked in Saint-Gobain, Russia for four years.He was appointed to the Board on 7 June 2019 and is the Managing Director Hima Cement Limited.
JEAN-MICHEL PONS, 43
Executive Director
VASILEIOS KARALISMsc International Banking & Finance, Bsc Mathematics
Vasileios worked in PricewaterhouseCoopers, Greece for four years before joining Lafarge Greece in 2007 as an analyst within the Finance Department. He was subsequently promoted to Assistant Controller - Industrial & Capex and Operations Controller.In 2013, he moved to Lafarge SA in France as Investment and M&A Projects Manager after which he was transferred to Lafarge Indonesia as Controlling VP. Following the merger, in 2016 Vasileios was appointed the Holcim Indonesia Head of Controlling. In 2018, he was appointed the Middle East & Africa Regional Controller, a position he held until beginning of 2019 when he was appointed Head of Finance, East & South Africa and Indian Ocean.He was appointed to the Board on 21 March 2019.
VASILEIOS KARALIS, 47
Non-Executive Director
ALICE OWUOROGW, MBA, BComm, FKIMAlice is a career tax administrator having served the Kenya Revenue Authority for 31 years in various critical areas of tax administration and diverse locations in Kenya since joining in 1984 as an assessor and retiring as Commissioner, Domestic Taxes in 2016. She was part of the KRA transformation team leading in the automation revolution and shift from manual back office processes through iTax implementation together with restructuring of the domestic taxes department to support devolution. Further to sitting in various committees in KRA, Alice has also been Audit Committee chair and Chair of the Kenya Institute of Management (KIM), Kenya liaison for Commonwealth Association of Tax Administration and founder/president of the Soroptimist International Club of Milimani. She is a Fellow of the KIM while also serving as a director of the Centre for Corporate Governance, Prudential Life Assurance Kenya and Moving The Goalposts.Alice is the Chair of the Audit & Risk Committee and a member of the Nomination, Remuneration & HR Committee. Alice was appointed to the Board on 9 March 2017.
ALICE OWUOR, 62
Independent Non-Executive Director
WAENI NGEALL.B, CPS(K) Waeni Ngea joined Bamburi Cement Limited in July 2020 as Head of Legal & Compliance and Company Secretary. She is a practicing advocate experienced in legal and corporate governance matters and an accredited governance auditor. Prior to joining the Company, she worked with British American Tobacco Kenya plc as Head of Legal & Company Secretary for East & Central Africa and before that with Unilever Kenya Limited as Legal Counsel, supporting the East Africa Area. She holds a Bachelor of Law Degree (LL.B) from the University of Nairobi and a Diploma in Law from Kenya School of Law. She is a member of the Law Society of Kenya, the Institute of Certificate Secretaries, Kenya and a Council Member of the Association of Retirement Benefit Schemes (ARBS).
WAENI NGEA, 40
Company Secretary

BAMBURI CEMENT ANNUAL REPORT & FINANCIAL STATEMENTS 2020 BAMBURI CEMENT ANNUAL REPORT & FINANCIAL STATEMENTS 2020
2020 OVERVIEW FINANCIAL REVIEWBUSINESS OVERVIEW SUSTAINABILITY REVIEW GOVERNANCE
30 31
Setting Industry Standards in Health & Safety
Our leadership team ensures that Bamburi’s resources are deployed effectively, with a focus on maximizing development impact and meeting the needs of our clients. Bamburi’s Management Team benefits from years of development experience, a diversity of knowledge, and distinct cultural perspectives. The team shapes our strategies and policies, positioning Bamburi to create opportunities where they are needed most.
Executive Committee Members
SEDDIQ HASSANIGroup Managing Director
GRACE OLUOCHGroup Finance Director
KANYI GITONGASales Director
MOSES WERESupply Chain Director
LAURENT NOËLGrowth Director (Exited October 2020)
Hyun Su AnPlant Manager - Mombasa
IRENE NAIBOHuman Resource & Organization Director
Board of Directors continued
Nguuni sanctuary

Business OverviewOperational Review 34Marketing Highlights 42Health and Safety 46Our People, Culture and Systems 50Risk and Control 56
Defence against Covid-19:We facilitated hand hygiene by placing automated sanitisers at all our sites.

2020 OVERVIEW FINANCIAL REVIEWBUSINESS OVERVIEW SUSTAINABILITY REVIEW GOVERNANCE
Setting Industry Standards in Health & Safety
BAMBURI CEMENT ANNUAL REPORT & FINANCIAL STATEMENTS 2020 BAMBURI CEMENT ANNUAL REPORT & FINANCIAL STATEMENTS 202034 35
Operational Review
GroupThe Financial Year 2020 was operationally an eventful year across the entire group. What started as a normal year was soon to become one of the most challenging in recent times. As a Group we started the year by progressing the execution of our “Building for Growth” Strategy which was launched in the year 2018. However, in March 2020, both Kenya and Uganda announced their first cases of Covid-19, following from which the two governments also announced a raft of containment measures to mitigate the spread of the virus amongst the communities.
Externally, the Covid-19 Pandemic impacted our two markets adversely. The demand for cement declined, especially following the shutting down of some key construction sites in compliance with containment measures announced by the two governments. In instances where construction sites continued to operate, the operations
HealthThe Health pillar was executed by the Business Resilience Teams (BRT). Two BRTs were formed, each to look after our Kenya and Uganda operations respectively. The two BRTs were constituted by the executive committees and senior management of the two operating entities. The mandate of the BRTs was:
• To anticipate the direct adverse impact of Covid-19 on the health of our stakeholders, as well as on the financial stability of our business; and formulate policies to mitigate the same in a safe and sustainable way.
• To execute the policies so formulated as well as ensure full compliance with those disseminated by the respective governments
• To manage the Covid-19 crisis in a coordinated and professional way.
• To escalate where need be so that appropriate higher level support can be accorded to the business.
• To prioritise and deploy resources towards combating and arresting the spread of the Covid-19 pandemic.
CostThe objective of the pillar was to drive the following:
• Reduction in fixed costs through temporary closure of sites in response to the short term changes in demand,
• Renegotiation of certain supply or service contracts with third parties, where the ability of either the Group or the third parties to perform was compromised on account of the Covid-19 containment measures, and;
• Avoidance of costs such as non-critical employee travel and accommodation
CashThe objective of the cash pillar was to preserve cash in the group through;
• Suspension or re-prioritisation of certain capital projects
• Optimisation of inventory levels
• Minimisation of exposure to trade receivables by reviewing of our credit policy and launching an aggressive collection drive
The Covid-19 pandemic, not only has impacted our operation but also impacted cement demand and prices. The cement prices has continued to come under pressure since the first case of the Covid-19 was reported in Kenya in the month of March 2020. The regional markets has remained competitive throughout the year fuelled by reduced consumer demand and the overcapacity. The competitive environment played a role in lowering cement prices across our markets hence adversely impacting our topline.
The more severe impact on the market was in the first half of the year when the containment measures were more stringent. As a result, the Group turnover declined by 13% during this period.
Thanks to our team’s for a flawless execution of both our “Building for Growth” strategy and the HCC agenda. The group has been able to ride through the Covid-19 storm in 2020 by effectively driving cost savings ahead of topline decline, improving net working capital and deliver a strong profit and record Cashflow.
were scaled down considerably. The reduced demand, in an overcapacity market situation further brought cement prices under pressure with regional markets remaining competitive throughout the year.
Internally, our operations were also disrupted. Our non-industrial employees had to work from home, while we had to depopulate industrial sites in order to comply with social distancing protocols. Restriction of movement stemming from lockdowns and curfews also impacted adversely the ability of our customer facing employees to connect with our customers. We also had to contend with Supply Chain disruptions, especially at border points, where truck drivers were subjected to long queues, delays and bureaucracies as they waited to be tested for Covid-19 before getting cleared to cross from one country to another.
In order to respond to and mitigate the impact of the pandemic, Bamburi Group adopted the three pillar “HEALTH, COST & CASH” (HCC) action plan.

2020 OVERVIEW FINANCIAL REVIEWBUSINESS OVERVIEW SUSTAINABILITY REVIEW GOVERNANCE
Setting Industry Standards in Health & Safety
BAMBURI CEMENT ANNUAL REPORT & FINANCIAL STATEMENTS 2020 BAMBURI CEMENT ANNUAL REPORT & FINANCIAL STATEMENTS 202036 37
Kenya
Bamburi Cement LimitedIn 2020, Kenya cement market is projected to have contracted by 2.3 % with the national cement consumption closing at 5.79MT (2019: 5.93MT). This was influenced by the slowdown in construction activities in the first half of the year due to Covid-19 crisis. Liquidity challenges and the over-capacity situation in the Kenyan cement market continued to drive competitive market dynamics and put pressure on cement selling prices. Most players reduced prices in the year to gain/ maintain market share.
Bamburi Cement Limited (BCL) registered a decline in top line performance with total turnover declining by 5% to Kes 20,131m (2019: Kes 21,211m). The domestic sales volumes declined by 1.9% during the year under review. But the decline was more than offset by the growth in exports, particularly to Rwanda. This performance is against a backdrop of a market contraction experienced in the construction segment in the advent of the Covid-19 pandemic. Average selling prices also declined thanks to the suppressed purchasing power by users and a slow private sector credit growth. Product mix also accounted for the lower average selling prices due to segment shutdown of big construction project sites which consume premium cement. The introduction of “Fundi” Cem 22.5 cement in 2020 also contributed to the lowering of the average selling price.
In 2020, our export volumes recovered considerably despite the logistics challenges posed by border crossing bureaucracies. The export volumes were driven by a demand surge in the Rwanda market. However, the EAC rules of origin continue to pose an obstacle to selling into the Tanzania market.
The launch of a new masonry cement (Fundi) in early 2020 is testimony of our ability to invest in innovative solutions to support our users in meeting their construction needs. The new masonry cement offers specialized construction solution best suited for mortar works such as plastering, block laying, screed and repair works.
To enhance our reach and provide superior service to our retail customers, the company also launched an easy to use Lead Retail application that offers customers the convenience of placing and tracking their orders on the palm of their hands. In addition, the direct sales channel is focused on tapping into the growing infrastructure segment with better value propositions, leveraging on fit for purpose products and efficient logistics as a compounded offering.
We will continue to play a key role in supplying construction solutions for key infrastructure projects in important sectors like rail, power, roads, ports and dams.
BCL profit before tax for the full year 2020 grew to Kes 1,672m from Kes 1,292m in prior year. This growth has been achieved despite the decline in the turnover. The improvement registered in Profit before Tax despite the highlighted downsides is testimony that the swift implementation of “HEALTH, COST & CASH” action plan adopted by the group at the onset of the Covid-19 Pandemic has helped mitigate the adverse impact of the crisis.
Nguuni Sanctuary

2020 OVERVIEW FINANCIAL REVIEWBUSINESS OVERVIEW SUSTAINABILITY REVIEW GOVERNANCE
Setting Industry Standards in Health & Safety
BAMBURI CEMENT ANNUAL REPORT & FINANCIAL STATEMENTS 2020 BAMBURI CEMENT ANNUAL REPORT & FINANCIAL STATEMENTS 202038 39
Bamburi Special ProductsBamburi Special Products (BSP) is a wholly owned subsidiary of the group and the preferred supplier of RMX and Precast Products and solutions in the local market. During the period under review, the business performance was affected significantly by the Covid-19 Crisis. The business operates in a very fragmented market environment with concomitant risks. In a bid to secure our cash flows, the management took a decision to stop credit sales and simultaneously launch an aggressive collection drive to minimize credit risk from the largely unsecured debt portfolio. In addition, we closed our Two Rivers RMX Plant in Nairobi in response to decline in demand for RMX.
As a result of implementing the stringent credit control measures, the sales for both RMX and Precast declined by over 47% compared to prior year. However, collections and consequently, cashflow, improved resulting in reduction in exposure to trade receivables by 60%. Under the “Cost” saving pillar, the business delivered a cost base improvement compared to prior year on a like for like basis.
Going forward, we are optimistic of a return to normalcy for our RMX and Precast Cement business in 2021. We expect to benefit from ongoing key infrastructure and building projects in order to drive volume uptake. We will also continuously work to innovate new product offerings in the RMX ultra series range of value added products in order to differentiate ourselves in the market place.
Lafarge Eco Systems LimitedLafarge Eco Systems Limited (LES) is a fully owned subsidiary of Bamburi Cement known for its professionalism in quarry rehabilitation, ecosystems management, conservation education and community sensitization on matters conservation and sustainability. Over the years, Lafarge Eco Systems has been rehabilitating quarried landscapes and transforming them into exceptional conservation sites for diverse flora and fauna. Bamburi Haller Park, and Bamburi Forest Trails are examples of rehabilitated quarries. The two are world renowned ecological showcases that demonstrate our commitment to environmental sustainability.
LES also manages reserve land, rehabilitated ecosystems, forest plantations and housing estates. It also supports communities and local agencies in wildlife rescue and care provision of rescued and orphaned animals.
The Company’s turnover stood at Kes 65m (2019: Kes 103m). As a unique tourist attraction in its own merit, a substantive part of LES revenues originates from Haller Park visit fees. During the year the company was adversely impacted by the Covid-19 pandemic. At the peak of the pandemic, Bamburi Haller Park had to close for 4 months, including the peak tourist month of April. The closure of learning institutions during the pandemic for the better part of 2020 also exacerbated the problem as organized education groups constitute the biggest proportion of local visiting clientele. International visitors also dropped significantly. Overall, LES registered a 72% drop in visitation in comparison to the prior year, hence the drop in turnover. The Park received a total of 45,553 visitors in the year (over 163,000 in 2019).
Kenya

2020 OVERVIEW FINANCIAL REVIEWBUSINESS OVERVIEW SUSTAINABILITY REVIEW GOVERNANCE
Setting Industry Standards in Health & Safety
BAMBURI CEMENT ANNUAL REPORT & FINANCIAL STATEMENTS 2020 BAMBURI CEMENT ANNUAL REPORT & FINANCIAL STATEMENTS 202040 41
Uganda
Operational Review continued
Hima Cement LtdUganda’s economy has experienced a slowdown in growth due to the severe impact of the Covid-19 pandemic crisis, a locust invasion and flooding caused by heavy rains. Inflows from exports, tourism, diaspora remittances, foreign direct investment and portfolio flows declined during the second half of 2020 due to international trade disruptions and restriction of movement of people.
The Uganda cement market closed at 3.9 Million tons in Dec 2020 implying a +15% growth compared to 2019 (3.4 Million Tons). Despite the market growth, cement demand and supply was disrupted by the Covid-19 containment measures instituted from late March 2020.
Our domestic volumes grew over the previous year by 2%. However, Hima Cement’s export volumes were down by 17% compared to prior year. The decline in exports was attributable to plant supply constraints and truck clearance delays at border points due to Covid-19 driver testing and clearance procedures. The Rwanda-Uganda political tensions that affected trade relations between the two countries in the previous year continued to persist in 2020. Overall, volumes were down on prior year.
Topline performance was therefore adversely impacted by the drop in volumes by 2%. In addition, there was deterioration in average selling prices. The combined impact on topline at Kes 14,214m (2019: Kes 14,974m) was a decline of 5%.
Thanks to the implementation of the “Health, Cost and Cash” initiative; our operating profit increased to Kes 630m (2019: Loss of Kes -331m) million on the backdrop of cost mitigation measures on operating costs. Mining concession costs, logistics costs, third party services costs; and personnel expenses all registered significant cost reductions. On the energy front, we are continuously working to improve the Thermal Substitution Rate (TSR) of coal with cleaner and more cost effective alternatives such as carbon black and pet coke.
Group Financial PerformanceBamburi Group is proud of the resilience of the business in the face of a ravaging pandemic.
Despite the adverse impact of the pandemic on topline which has resulted in a decline of 5% against prior year, our “Building for Growth” strategy, alongside the systems and policies that we have put in place, have transformed us into a resilient business.
Despite the Topline decline, The Group’s Operating Profit for the Financial Year 2020 increased by Kes 866m or 77.5% from Kes 1,117m in 2019 to Kes 1,983m. The increase at operating profit level is testimony that as a Group, we have a resilient business that has withstood the impact of a hostile business environment. As a consequent of improved Operating profit, the Group has also been rewarded with an increase in Profit after tax at Kes 1,129m (2019: Kes 359m) by Kes 770m or 214%.
In addition, the Group generated record cashflow at Kes 4,857m (2019: Kes 359m).
The Bamburi Group’s balance sheet remains solid with a good foundation for against which to leverage future growth.
At Kes 224m (2019: Kes 386m) our Finance costs also went down by 42%. This thanks to our focus on cash generation, and the substitution of more expensive bank overdraft facility with a more cost effective intra group short term loan from the Kenya parent company.
The company’s net cash position improved from a net overdraft of Kes 1,072m at the end of 2019 to Kes 1,565m at the end of 2020. The significant improvement in cash position is attributed to improved working capital management strategies implemented in-country in addition to traction of the various procurement and cost avoidance initiatives.
Moving forward, Hima cement profitability is expected to progressively grow due to the continued cost management initiatives around production, and logistics across all sites, negotiation of better procurement terms for key raw materials and the implementation of digital transformation initiatives at the front end of the business, in a bid to improve our reach while offering superior customer experience.

2020 OVERVIEW FINANCIAL REVIEWBUSINESS OVERVIEW SUSTAINABILITY REVIEW GOVERNANCE
Setting Industry Standards in Health & Safety
BAMBURI CEMENT ANNUAL REPORT & FINANCIAL STATEMENTS 2020 BAMBURI CEMENT ANNUAL REPORT & FINANCIAL STATEMENTS 202042 43
Marketing HighlightsKenya at a glance
‘FUNDI’ masonry cement launchedBamburi cemented its position as a leader of innovation in construction in Kenya with the launch of Fundi Cement on 14th February 2020 (Valentine ’s Day) a day that was especially suitable for the new ‘red brand’. With the launch Bamburi increased its portfolio of cement brands to eight, the highest in Kenya. The new 22.5 masonry cement, is specifically designed for application in plaster, brick, block laying, screed and repair works. The product is not targeted at structural applications, clearly differentiating it from the company’s 32.5 brands like NGUVU and TEMBO whose applications include concrete and structural works and other general purpose applications. Its specific application means the consumer gets value for money by purchasing FUNDI at a pocket friendly price. Awareness about the new brand was supported by a print campaign in the local dailies, TV and radio campaign, billboards and market activations. The launch of FUNDI cement demonstrates Bamburi’s commitment to provide innovative solutions to meet specific and unique construction and consumer needs.
Fundi and pack change launch to staff at Bamburi offices on Kitui Road Industrial area
On-ground customer and consumer engagements in Chuka town to create awareness on FUNDI application and benefits
Celebrating customer loyalty, ZAWADI-7 challengeThe Zawadi challenge is a program that rewards customer loyalty and volume sales with various rewards based on points accumulated, in 2020, the company celebrated the 7th Zawadi challenge in February 2020. Daima Stores (based in Chuka) was the luck winner of a brand new Isuzu FRR90 10-ton truck worth Ksh. 7 million. The truck was handed over to the delighted customer by Managing Directors of both Bamburi Cement and Isuzu East Africa in a colourful reward ceremony. Daima stores owner Robert Kinyua and his wife Elosy Kinyua receive a dummy key for their
Isuzu 10-ton truck from Bamburi Cement Group MD Seddiq Hassani & Sales Director KanyiGitonga (R) and Isuzu East Africa Managing Director Rita Kavashe & Mr. Wanjohi Kangangi - the Isuzu Sales & Marketing Director
Leveraging digital to serve customers Bamburi Cement launched a digital app's Lead Retail app (Navendor) in 2020. The digital app was very instrumental in serving our customers without any face to face interactions particularly with the onset of Covid-19 pandemic. The use of the app minimised exposure of both our customers and staff, with the strict social distance requirements in the prevention of the coronavirus spread.
Through the app customers are able to place and track their orders real time – from order placement, payment, up until their truck is loaded and is dispatched from our plant. Additionally, customer are able to redeem offers and discounts extended by the company, through their account.
Customers were also encouraged to call their Bamburi Sales Managers or the Customer Service team as other ways of being served, as the company encouraged its various stakeholders to take all the necessary precautions to effectively fight the pandemic.
Customer webinars - staying connected to customers
The Covid-19 pandemic did not stop customer engagements, rather the Company utilised online communication platforms to stay connect with its customers. Through Customer webinars discussion forums were created to support customers remain resilient during the pandemic.
The webinars kicked off in May and ran through to October. Customers were exposed to various topical issues such as business management and health. Experts were engaged to share insights on topics like: Living in the new norm of Covid-19; surviving the economic impact of the pandemic; securing the future of their businesses including financial planning, cost management and adapting their businesses and products; the 2020/21 government budget; silver lining opportunities available to entrepreneurs during and after the pandemic; pillars of business success among others. Additionally the contractor segment of our customers also benefited from our virtual seminar titled “Build for Tomorrow – Innovative Solutions for Concrete Durability” held with road infrastructure and concrete durability experts.

2020 OVERVIEW FINANCIAL REVIEWBUSINESS OVERVIEW SUSTAINABILITY REVIEW GOVERNANCE
Setting Industry Standards in Health & Safety
BAMBURI CEMENT ANNUAL REPORT & FINANCIAL STATEMENTS 2020 BAMBURI CEMENT ANNUAL REPORT & FINANCIAL STATEMENTS 202044 45
Marketing Highlights continued
B-Zawadi a digital consumer loyalty program launchedIn the last quarter of 2020, Bamburi Cement in it unending quest for innovation was the first to market in cement category with a digital consumer loyalty program dubbed B-Zawadi. The ‘Mafundi Jijenge Na B-Zawadi’ slogan was the communication campaign theme for the countrywide loyalty program targeted at the end-user such as masons, foremen and contractors. The loyalty program guarantees an immediate phone based reward in the form of airtime or cash for the purchase of either Nguvu or Fundi cement. The B-Zawadi aims to deepen brand connection and reward loyalty amongst end users.
Maskani quality construction offerMaskani is Bamburi’s construction solution targeted at the individual home builder, developer and contractor by providing step by step technical support throughout the building journey thereby minimising complexity.
In the last 5 years Maskani has provide personalised solutions to more than 1,500 customers and overseen the construction of more than 6,000 units countrywide.
In 2020 despite Covid-19, Maskani successfully supported its customers and their projects remotely. The key focus for the team was on quality and affordability and worked with customers to deliver efficiencies in their construction process through application of good technical advice from qualified professionals, which in turn reduced costs from their total spend, therefore affordability.
Over the years the program has served to uphold good construction practices by facilitating access to technical support to builders who did not have such information previously. First-time builders receive technical support and advice as well as links to good quality construction material suppliers with negotiated discounts; while seasoned builders get customised technical support and services as per their needs.
In the last few years we have expanded our footprint and now have capability to serve customers countrywide.
Uganda at a glance
‘FUNAMU NE HIMA’ loyalty campaignSchool fees and medical qualifiers handover: successfully handed over in February and November 2020. A total of 60 direct customers have so far benefited from this loyalty scheme.
In 2020 marketing focus was to defend, grow and recover lost market share. New initiatives were developed and launched, including targeted and aggressive trade marketing drives.
Hima and Jumia in a digital partnership In July 2020, Hima cement successfully launched a digital sales channel with an objective to grow customer base and online footprint. Reach the end users directly i.e. IHBs who are looking for convenience because they do not have the time to deal with complex deliveries or negotiate price. A total of 40 new customers have been recruited onto this digital platform.
Sports sponsorship to build Hima brand HIMA continued to leverage sponsorship of rugby and football sports to build brand awareness, create excitement and stay top of mind. In 2020, the company sponsored Hima Cement Heathens and football giants Vipers, both teams were announced and awarded League champions.
InnovationMining - MINECEM Ultra a customized low carbon cement specially designed for mine backfilling was recently launched into the market.
Roads - The Company opened up new opportunities in the roads sector through customized sales of chemical based roads stabilization.

2020 OVERVIEW FINANCIAL REVIEWBUSINESS OVERVIEW SUSTAINABILITY REVIEW GOVERNANCE
Setting Industry Standards in Health & Safety
BAMBURI CEMENT ANNUAL REPORT & FINANCIAL STATEMENTS 2020 BAMBURI CEMENT ANNUAL REPORT & FINANCIAL STATEMENTS 202046 47
Health and Safety
Kenya2020 was a good year for Kenya with great improvement compared to 2019. There was only one Lost Time Incident (LTI) in Mombasa Plant compared to four LTIs in 2019 still in Mombasa Plant, and one medical injury in 2020 against four in 2019. There was however one road fatality in 2020 against one in 2019.It was also a good year from perspective of leading indicators in Health & Safety (H&S) with 100% closure of our strategic H&S Improvement Plan. Process Management actions were closed at 100% as was Hazard Identification. There was improvement in quality of Visible Personal Commitments (VPCs) at a score 100% against 97% in 2019 and 66% in 2018, indicating H&S engagements in the field and follow up of actions generated. Despite the Covid-19 pandemic, the team performed very well against the set targets though the performance was below 2019 absolute numbers in Visible Personal Commitments (VPCs), Life Saving Audits (LSAs) and Safety Observations.
Mombasa Plant was recognized in the whole MEA region for closing sustainably 100% of their audit findings from the group audit performed in 2019. The closure of these actions was confirmed through a verification audit in November 2020 by Group H&S team.
Health and Safety Improvement PlanWe had five strategic objectives in 2020 which were being sponsored by Ex-Com members: the Sales Director sponsored Road Safety; Health was sponsored by the Finance Director; Leadership and Accountability by the CEO; Work at Height was sponsored by the Growth Director; and Competency sponsored by the HR&O Director.
i. Leadership and Accountability, 6 verification audits were conducted in Mombasa Plant, Nairobi Grinding Plant and Bamburi Special Products. The audits contributed highly to the great performance in Mombasa Plant in the verification by the Group H&S. The implementation of Reward and Sanction policy was also monitored under this pillar with many employees and contractors being rewarded across the sites as well as being sanctioned.
ii. Road Safety, we continued to implement the Reward and Sanction on the drivers and transporters based on the In-Vehicle Management System (IVMS) score card and positively influenced their driving behavior.
iii. In Health, engineering controls were implemented to address noise, dust and ergonomic risks in our operations. Some of the interventions included replacement of gantry cranes rails and seats to address ergonomic risks, maintenance of filters to reduce dust emissions and installation of silencers at the silo blowers to reduce noise.
iv. In Competency, many H&S trainings were delivered to employees especially through the e-learning program due to restrictions of Covid-19. Job descriptions were also revised to include H&S responsibilities.
v. Working at Height entailed the fatality elimination control actions, solutions were implemented following the Hierarchy of Controls with a lot of focus on engineering controls with an aim of reducing scaffolds in use across the sites. Some of the solutions implemented included installation of platforms with side protection and toe-boards.

2020 OVERVIEW FINANCIAL REVIEWBUSINESS OVERVIEW SUSTAINABILITY REVIEW GOVERNANCE
Setting Industry Standards in Health & Safety
BAMBURI CEMENT ANNUAL REPORT & FINANCIAL STATEMENTS 2020 BAMBURI CEMENT ANNUAL REPORT & FINANCIAL STATEMENTS 202048 49
On Process Safety Management, we focused on six areas in process management which were also sponsored by leaders across the business. These are:
i. Hot material managementii. Electrical safetyiii. Structural integrityiv. Traditional fuelsv. Quarry safetyvi. Acert (Alternative Fuels Safety)
In all these areas, we were also able to close the year at 100% closure rate on all actions that we had targeted to complete.
Covid-19 managementThe Covid-19 pandemic that hit the world in early 2020 was an unexpected pandemic but we were able to put the required measures in place to protect our employees, contractors and visitors. This was under the guidance of the Ministry of Health and LafargeHolcim global and local Business Resilience Teams (BRT).
Screening for temperature and other Covid-19 related symptoms at the entrances was implemented, handwashing and sanitization points provided, masks provided in most instances and social distance practiced at all times. These measures among many others such as awareness creation continue to be in place.
Self-assessments were also conducted to ensure continuous improvement.
Global health and safety daysIn 2020, there was great mobilization during the Health and Safety Days campaign held in October and November. The theme for the campaign was Ideas into Action, as we focused on replication with pride of great H&S ideas that have been implemented elsewhere. We had seven ideas implemented across the sites and winners recognized and rewarded.
Road safety In Road Safety, we continued to implement our reward and sanction policy on the drivers and transporters based on the In Vehicle Management System (IVMS) score card and positively influenced their driving behavior. The scorecard monitors performance on harsh braking, harsh acceleration, speeding, fatigued driving (exceeding driving hours), freewheeling and night driving. By proactively monitoring the above parameters and correcting the driving behavior, we are able to prevent accidents before they happen.
We held a transporters’ directors and owners meeting together with the Bamburi CEO and leadership team to review our road safety performance in 2019. The good performers were recognised and rewarded. The awards given were for sustained good road safety performance, highest performance in road safety that is 5-star rating, and highest improvement compared to same period the previous year. We also took the chance to agree on the focus areas in 2020 in our road safety roadmap.
Health and Safety continued
UgandaIn 2020, fortunately, Hima Cement did not register any onsite fatality or Lost Time Injury (LTI) as a result of our operations. The number of LTIs reduced from five in 2019 to zero in 2020.Hima Cement recorded a Lost Time Injury Frequency Rate (LTIFR) of 0.00 against a target of 1.33. This implies that for every one million hours worked, zero lost time injuries were recorded.
The company attained the target score of 95% for HSIP implementation, 95.8% for Critical Risk Elimination and 100% for LTIFR averaging to a Continuous Improvement Score (CIS) of 96.9% the second best in East and South Africa region of LafargeHolcim.
Road safetyIn sphere of road transport, the business registered two road fatalities compared to three in 2019 and nine in 2018. However, one out of the two road fatalities were recordable compared to two in 2019 and five in 2018.
The investigations revealed that the recordable road fatality in 2020 was attributed to the truck’s front tyre burst. As such, the business introduced ad-hoc tyre pressure checks and conducted training for all drivers on tyre inspections.
Following the installation and monitoring of the IVMS system in over 650 assets, Transport Analytics Center (TAC) was introduced by Group to support logistics benefits and maximize opportunity on the use of the system. In 2020, Uganda was the third country in LafargeHolcim Group to be certified with a fully compliant IVMS system.
Health & safety auditsA verification audit was conducted at our Kasese plant in December following an initial audit conducted in July 2017. The objective of the exercise was to verify completion of corrective actions arising from RCAs of Level 1 findings in the 2017 audit. 67% (10 out of 15) of L1 findings were closed. Action plans were developed and formed part of the 2021 site HSE-IP.
A Virtual H&S audit was conducted in Tororo Grinding Station in November with the objective of checking the implementation of HSMS standards. Initial report shared in December revealed 8 Level 1 findings. 70 % of the Level 1 findings have since been closed through a systematic corrective action program and the pending gaps shall be closed by end of Q1 2021.
Operating during Covid-19In early March 2020, we rapidly adapted our policies and procedures with the objective of minimizing the risk of spread of Covid-19 by setting up handwashing stations, temperature screening points in all access points, visualizing social distancing in offices and canteens, implementing disinfection schedules for commonly touched surfaces/ high traffic areas and enforcing mask wearing where social distancing cannot be maintained. We adequately encamped over 120 workers onsite following Presidential directives on operating during Covid-19 for industrial sites.
Between Q2 and Q4 2020, three pandemic exercises were conducted by the Business Resilience Team (BRT) during Trigger and Action Response Plan (TARP) Level 4, Stabilization and Adaptation, in order to improve the BRT’s response to Covid-19 incidents and learn key lessons from the existing plans. 100% of all actions under TARP Stabilization and Adaptation were completed.

2020 OVERVIEW FINANCIAL REVIEWBUSINESS OVERVIEW SUSTAINABILITY REVIEW GOVERNANCE
Setting Industry Standards in Health & Safety
BAMBURI CEMENT ANNUAL REPORT & FINANCIAL STATEMENTS 2020 BAMBURI CEMENT ANNUAL REPORT & FINANCIAL STATEMENTS 202050 51
Our People, Culture and Systems
KenyaLike most companies, in 2020 we took a conservative approach to recruitment, and had measures to ensure that we were able to retain our existing headcount in 2020, closing the year at 384 full time employees.
Head Office 112
Nairobi Grinding Plant (NAI Plant) 51
Mombasa Plant (MOM) 164
Bamburi Special Products (BSP) 34
Lafarge Eco Systems (LES) 19
Binastore 4
Total 384
GenderMale 308
Female 76
Headcount
Responding to Covid-19 pandemic Responding to the pandemic with agility and focus was key in 2020. Working quickly to respond to the evolving crisis, Bamburi adjusted its People strategy to focusing on Health - designing numerous wide-ranging interventions to ensure the continued health of our employees to enable the business and people to succeed.
Examples of the mitigations rolled out to protect the health and wellbeing of our employees and by extension their families and full time contractors during the onset of Covid-19 include:
Leadership monitoring On 30th January, 2020 the World Health Organization declared Covid-19 a Public Health Emergency of International Concern. Bamburi leadership team responded to this declaration by setting up and activating a Business Resilience Team (BRT), whose mandate was to ensure the business is prepared, develops a response plan, and to actively monitor the evolving situation.
Our staff clinics together with the County Public Health implemented infection, prevention and control (IPC) strategies required to prevent and limit transmission of Covid-19 in health facilities.
Covid - 19 strategy To keep the workplace safe we developed 9 workplace pillars:
1. Education and communication
2. Reducing the number of people in our operational sites introducing alternative work arrangements, remote and home working
3. Screening and testing
4. Sanitary cordon around our operations
5. Hygiene and cleaning measures
6. Respiratory protection
7. Safe monitoring and reporting
8. Contact tracing
9. Medi-Care: Tele-medicine, home care, and in addition Bamburi was among the first companies to purchase Covid-19 medical cover for staff.

2020 OVERVIEW FINANCIAL REVIEWBUSINESS OVERVIEW SUSTAINABILITY REVIEW GOVERNANCE
Setting Industry Standards in Health & Safety
BAMBURI CEMENT ANNUAL REPORT & FINANCIAL STATEMENTS 2020 BAMBURI CEMENT ANNUAL REPORT & FINANCIAL STATEMENTS 202052 53
Our People, Culture and Systems continued
Vibrant staff communication on prevention
One of the most important ways of keeping everyone safe from infection and controlling the spread of the Covid-19 virus has been informing everyone on prevention measures. Since the onset of the pandemic, the company kept a deliberate vibrant communication regime to constantly share relevant messages to support staff in knowing how to keep themselves and families safe. Our theme was ‘Fighting Covid-19 Together’ to say: We are in this together, everyone has a role to play, let’s stay united & the company cares.
Introducing a range of engagements we were able to ensure staff remained engaged and focused despite the challenges Covid-19 presented:
Health awareness webinars We held weekly and bi-weekly webinars with staff to discuss health topics around the pandemic, and later on added on beneficial topics like financial and wealth management, and personal development topics hosted by experts in medicine, nutrition, psychologists, personal financial and leadership to build skills, competencies and knowledge for employees, contractors and their families.
E-learning (Covid-19 Buster) campaign/program Engaging staff to learn new skills and build their competencies through e-learning. Our e-learning platform saw a marked increase in use and our learning hours grew by over 275% versus 2019.
Mental helplineMental health has been a big challenge during the pandemic, globally. We took a proactive approach to launch a mental helpline for staff and their families, in partnership with our medical providers.
‘Bamburi Cares’ staff video & donations campaignDuring the Christmas and end-of-year festivities, Bamburi staff took part in a company mobilized campaign to urge the general public to keep to the Covid-19 prevention guidelines during the festive season, as they shared warm holiday wishes. The videos popularly shared across social media were an uplifting gesture, after a difficult year and contributed to staff engagement as they came together in this noble cause.
In addition staff gave out part of their end of year staff budget to go towards donating foodstuff and other essential items to different children and charitable organizations in Nairobi and Mombasa.
Bamburi Covid-19 Heroes Staff recognition program where staff members nominated colleagues they felt were going over and above, in delivering the company’s Covid-19 action plan priorities - Health, Cash and Cost. Several heroes were awarded.
Talent programmesIn 2020, we continued our focus on talent development programs including competency assessments, talent and succession planning for our Industrial teams and critical roles within the business. Our efforts on ensuring we retain talent has been our key priority which makes us attractive in the market.
Bamburi homesWe launched Bamburi Homes, which will provide Bamburi employees an opportunity to own an affordable home. It is a partnership between Bamburi Cement and 14 Trees. Bamburi Homes places the company at the center of the 3D construction revolution. In plan are one, two and three bedroom single story houses located in Kilifi, Mombasa.
Building a diverse and inclusive culture UN Women WEP principlesOur CEO signed a statement of support for the Women’s Empowerment Principles (WEPs) to symbolize the company’s endorsement of the Principles. The Women’s Empowerment Principles charter is a joint initiative of UN Women and the UN Global Compact (UNGC), providing guidance for promoting gender equality in the workplace and the community through a set of seven Principles. This partnership reaffirms our continuous commitment to women career development and equality as a core value in the organization.

2020 OVERVIEW FINANCIAL REVIEWBUSINESS OVERVIEW SUSTAINABILITY REVIEW GOVERNANCE
Setting Industry Standards in Health & Safety
BAMBURI CEMENT ANNUAL REPORT & FINANCIAL STATEMENTS 2020 BAMBURI CEMENT ANNUAL REPORT & FINANCIAL STATEMENTS 202054 55
Our People, Culture and Systems continued
Early in the year we worked on implementing and reviewing our operations for efficiencies in our structure and this time we deliberately reduced our back office contractor numbers in some departments like Procurement, Finance and Industrial. This initiative was designed to foster our new operating model of increasing front office numbers to a rate of 40%: 60% respectively.
Following the decision to completely close the Rwanda Hima Offices, the remaining Rwanda staff were rendered redundant and were released by end of May 2020. Similarly following the business decision to close the Bonastore Franchise, all staff under the Franchise were released and all dues paid by June 2020.
Amidst the global pandemic, we experienced disruption within our business operations. We, however, continued to aggressively drive our desire as a business to establish and create a fit for purpose organizational structure and as a result we had to release 32 staff on redundancy across the organization in November 2020.
Despite all the disruption and interruption in 2020, we had the opportunity to introduce and launch Adrenaline – our new HRIMs. Adrenaline is a comprehensive HR Information System with a number of modules covering the complete life cycle of staff within the business.
Talent management Through the Talent Management strategy, we rely on a high performance, high engagement culture, underpinned by high caliber people who are enabled by efficient, integrated processes to achieve business results.
In 2020 we continued to drive our goal to prepare the business with 80% succession pipelines ready now for all our critical positions. Throughout the year we enrolled new talent into our people balance sheet to cover the moves that had been made in the previous year. We currently stand at 80% ready now talent pipelines for all critical roles in the organization.
Voluntary turnover is at 0.06% across our business operations as at 31st December 2020.
80% of vacancies in 2020 were filled internally through our strong succession pipelines.
CapabilityIn a bid to build a learning and self-refreshing organization, in the year 2020, we continued to focus on the optimization of Percepio, our e- learning platform, as part of our capability strategy following the lockdown due to the breakout of Covid-19 and we recorded over 200 hours of learning in 2020. We continue to deliver our capability strategy of 70:20:10 rule with 70% being on the job learning, 20% coaching and mentoring and 10% in classroom training.
Unlike the previous year 2019, in 2020 due to the pandemic we were not able to utilize our grant from the Private Sector Foundation of Uganda (PSFU) worth USH133, 000,000. The award was based on our deliberate efforts to upskill employees especially on the technical part of the organization. The grant required us to conduct face to face trainings which was and is still difficult to do given our current situation. We are optimistic that in 2021 we will utilize this opportunity in addition to our online training programs and draw up better plans for 2021 and 2022.
UgandaIn 2020 we continued to drive our desire as a business to establish and create a fit for purpose organizational structure that is simple, agile and efficient, effectively mirroring our business priorities.
As we continue to navigate our path to success, our desire is to drive and entrench the high performance culture of Excellent Execution, Every time, Everywhere until it becomes our way of life.
Furthermore we continued to optimize and create efficiencies through the Cement Industrial Framework (CIF) in addition to introduction of new health and safety ways of work cross our sites despite our current challenges. In the spirit of self-directed learning, staff were able to optimize their current processes and identify opportunities for improvement through coaching and mentoring for the different technical Industrial competences across the plants.
Through our process improvement initiatives, the different departments were able to set up virtual engagement monthly reviews in order to optimize and identify new opportunities within their operations. As a result we have realized improved business performance during this difficult pandemic year as well as increased competence development within the different teams.
CultureAs we stabilized working in the new normal in 2020, we continued to aspire in embedding an everyday winning culture to drive high performance – one where we all execute excellently every time, everywhere. We have positioned ourselves as catalysts for change, through quickly embracing and managing change systemically, focusing on people, processes and systems to create new routines and habits at scale across the organization.
We deliberately purposed to improve our communication across the organization and address key concerns real-time through our new tool ASK HR. We have been able to manage and address key concerns raised by staff across the organization as well as manage their anxiety. We also continue to celebrate our achievements and drum them out using the One Hima newsletter every month. Through our regular town halls employees have had an opportunity to engage the leadership team and now are more certain about our business’s overall objectives, performance and way forward during this difficult season. In the last quarter of the year we signed off People Policy Manual. In 2021 the ambition is to create awareness, rollout and implement all the new changes.
As we continue to navigate our path to success, our desire is to drive and entrench the high performance culture of Excellent Execution, Every time, Everywhere until it becomes our way of life. The focus will be on CRISP (Customers, Results, Integrity, Sustainability, and People).
ConclusionDespite the global challenges in the business world, in 2020, the Human Resources department continued to drive the People agenda through Organization Effectiveness – a fit for purpose organization, Talent Management – having the right people in the right roles, Capability interventions that fit the organization strategy and a culture that drives high performance. Digitization is at the top of our minds into 2021 in all areas of HR.

2020 OVERVIEW FINANCIAL REVIEWBUSINESS OVERVIEW SUSTAINABILITY REVIEW GOVERNANCE
Setting Industry Standards in Health & Safety
BAMBURI CEMENT ANNUAL REPORT & FINANCIAL STATEMENTS 2020 BAMBURI CEMENT ANNUAL REPORT & FINANCIAL STATEMENTS 202056 57
Risk and Control
Internal controlBusiness risk managementRisk is an inherent part of the business and management acknowledges that effective risk management is integral to the achievement of business objectives and strategy. We are therefore continuously developing and enhancing our risk and control procedures to improve the mechanisms for risk identification, evaluation, monitoring and control.
In 2020, the Group conducted a comprehensive risk assessment of our business risks and opportunities. The output was a risk and opportunities mapping with action plans to mitigate the risks and exploit the opportunities arising therefrom.
It is the Board’s opinion that the system of business risk management in place provides reasonable assurance that business risk management for the group is adequate and sound.
Internal control risk managementHaving an effective and efficient internal controls system is a key objective of the management team. Management is continuously reviewing the internal control framework to ensure that all risks are identified and mitigated.
The Board is dedicated to the identification of key internal control risks and providing assurance to the shareholders that the risks are fully understood and managed.
In 2020, the Board conducted a review of the internal policies and internal controls of the material systems in the business.
It is the opinion of the Board that the system of risk management and internal controls is in place and has been effective in 2020.
Internal controlsThe Group has in place sixty two (62) mandatory Minimum Control Standards (MCS’s). These encompass controls from Governance and Compliance, Accounting, Financial Reporting and Processes to Health and Safety, Security, Human Resources, Inventory, Expenditure, Fixed Assets and Information Technology. Each Executive Committee Member is responsible for a set of the minimum control standards for their area.
Adherence to these MCS’s is mandatory in all our operations across the Group and the MCS’s are continuously tested for compliance.
The Board through the Audit Committee has reviewed the implementation of MCS’s as well as the internal audit reports within the year and is satisfied that the control environment is robust enough to ensure efficient business operations.

Sustainability ReviewOur Sustainability Framework 60Communities 63Climate 69Environment 70Circular Economy 72
Defence against Covid-19: We controlled access to our plants through routine and random temperature checks alongside other precautions.

2020 OVERVIEW FINANCIAL REVIEWBUSINESS OVERVIEW SUSTAINABILITY REVIEW GOVERNANCE
Setting Industry Standards in Health & Safety
BAMBURI CEMENT ANNUAL REPORT & FINANCIAL STATEMENTS 2020 BAMBURI CEMENT ANNUAL REPORT & FINANCIAL STATEMENTS 202060 61
Our Sustainability Framework
As a future-oriented business with a purpose to deliver transformational construction solutions for sustained economic growth, Bamburi Cement Group believes that sustainable practices are critical business imperatives in creating value for our business, stakeholders and society.
Climate CircularEconomy
Water & Nature
People &Communities
Sustainable development presents many opportunities to our business, and we remain committed to ethical and responsible business practices. Since its inception in 1951, Bamburi Cement has led the industry in environmental conservation and protection through professional rehabilitation of its exhausted quarries, and investing in programs that create value for the communities in which we live and work. Our responsible business practices and partnerships with our stakeholders enhance shared value and growth.
Our passion for people, health, safety and environment remains at the heart of everything we do; we thereby conduct our operations professionally and responsibly to manage business risks to protect our employees, customers, stakeholders and the environment from which we draw natural resources. Our manufacturing process also puts us in a position to address society’s waste management problem and promote a circular economy; by using waste in our kilns for energy recovery is proven to be a sustainable waste management practice.
Our sustainability agenda is underpinned by LafargeHolcim’s overarching sustainability intention to “Build a world that works for people and the planet” as it reinvents how the world builds and become a net zero company. As the world’s global leader in innovative and sustainable building materials, LafargeHolcim is committed to shaping a greener, smarter and healthier world. LafargeHolcim’s 2030 plan sets clear commitments and targets that are supportive of the United Nations Sustainable Development Goals (SDGs) and encapsulated in four strategic pillars of sustainability namely:
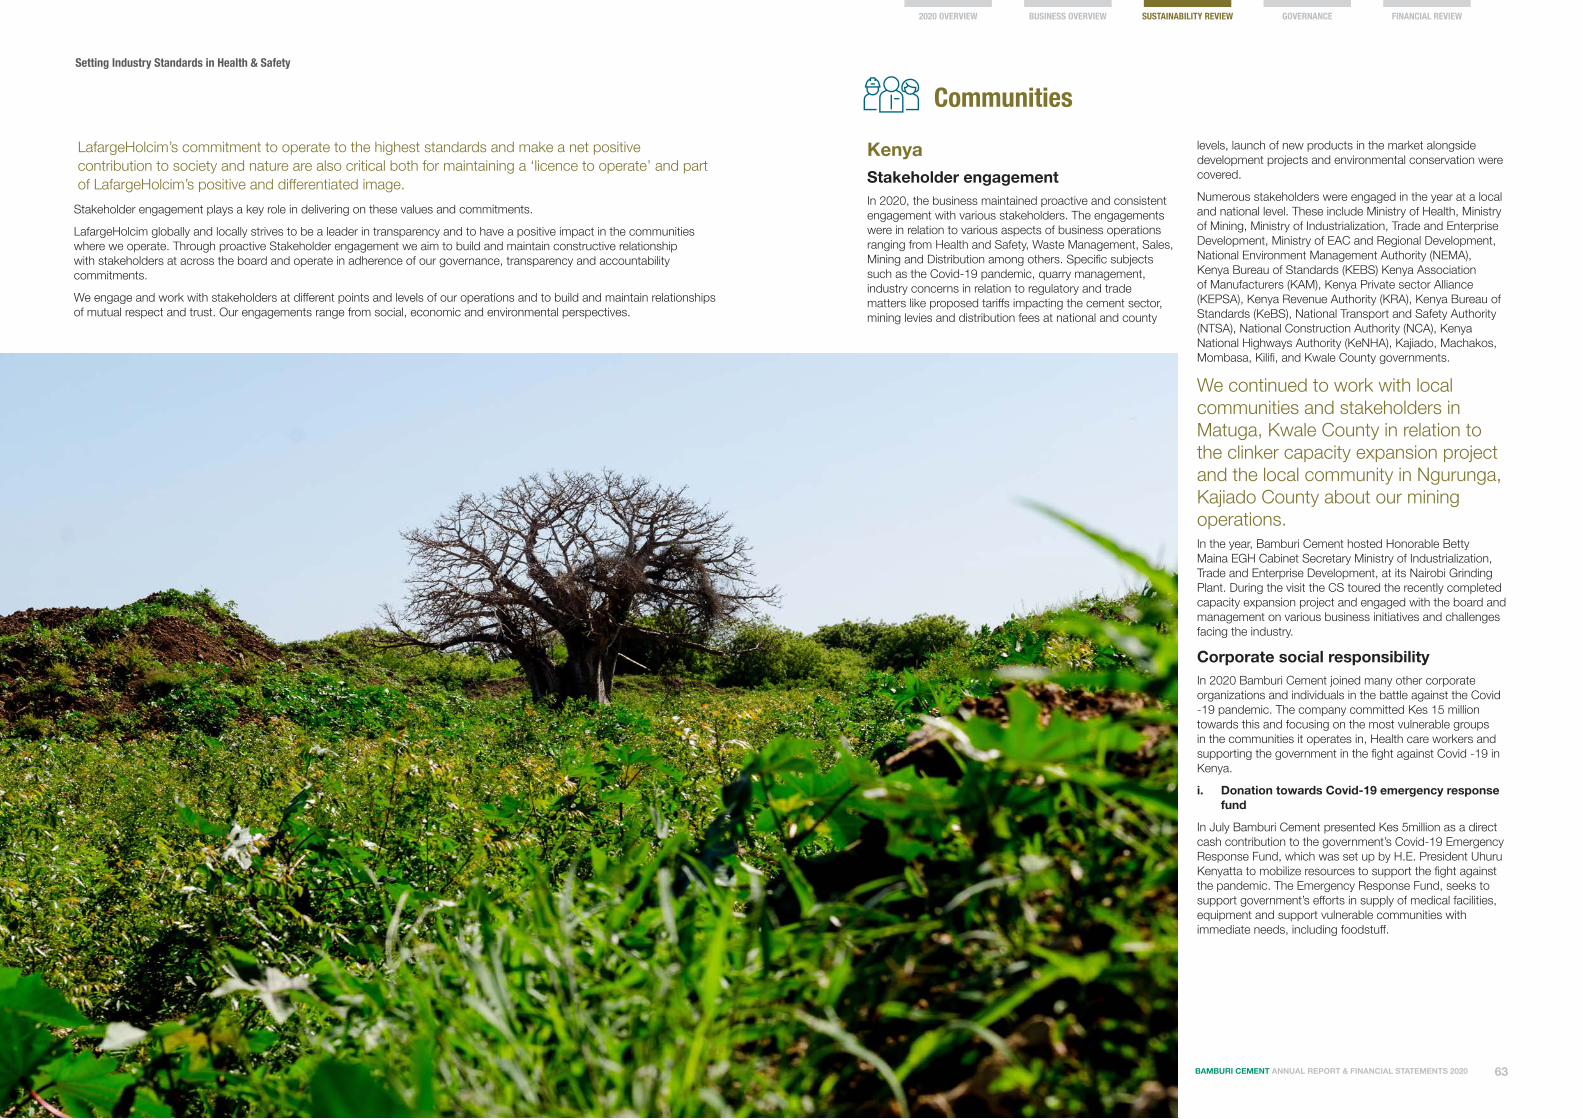
2020 OVERVIEW FINANCIAL REVIEWBUSINESS OVERVIEW SUSTAINABILITY REVIEW GOVERNANCE
Setting Industry Standards in Health & Safety
BAMBURI CEMENT ANNUAL REPORT & FINANCIAL STATEMENTS 2020 BAMBURI CEMENT ANNUAL REPORT & FINANCIAL STATEMENTS 202062 63
Communities
Stakeholder engagement plays a key role in delivering on these values and commitments.
LafargeHolcim globally and locally strives to be a leader in transparency and to have a positive impact in the communities where we operate. Through proactive Stakeholder engagement we aim to build and maintain constructive relationship with stakeholders at across the board and operate in adherence of our governance, transparency and accountability commitments.
We engage and work with stakeholders at different points and levels of our operations and to build and maintain relationships of mutual respect and trust. Our engagements range from social, economic and environmental perspectives.
LafargeHolcim’s commitment to operate to the highest standards and make a net positive contribution to society and nature are also critical both for maintaining a ‘licence to operate’ and part of LafargeHolcim’s positive and differentiated image.
Kenya Stakeholder engagementIn 2020, the business maintained proactive and consistent engagement with various stakeholders. The engagements were in relation to various aspects of business operations ranging from Health and Safety, Waste Management, Sales, Mining and Distribution among others. Specific subjects such as the Covid-19 pandemic, quarry management, industry concerns in relation to regulatory and trade matters like proposed tariffs impacting the cement sector, mining levies and distribution fees at national and county
levels, launch of new products in the market alongside development projects and environmental conservation were covered.
Numerous stakeholders were engaged in the year at a local and national level. These include Ministry of Health, Ministry of Mining, Ministry of Industrialization, Trade and Enterprise Development, Ministry of EAC and Regional Development, National Environment Management Authority (NEMA), Kenya Bureau of Standards (KEBS) Kenya Association of Manufacturers (KAM), Kenya Private sector Alliance (KEPSA), Kenya Revenue Authority (KRA), Kenya Bureau of Standards (KeBS), National Transport and Safety Authority (NTSA), National Construction Authority (NCA), Kenya National Highways Authority (KeNHA), Kajiado, Machakos, Mombasa, Kilifi, and Kwale County governments.
We continued to work with local communities and stakeholders in Matuga, Kwale County in relation to the clinker capacity expansion project and the local community in Ngurunga, Kajiado County about our mining operations. In the year, Bamburi Cement hosted Honorable Betty Maina EGH Cabinet Secretary Ministry of Industrialization, Trade and Enterprise Development, at its Nairobi Grinding Plant. During the visit the CS toured the recently completed capacity expansion project and engaged with the board and management on various business initiatives and challenges facing the industry.
Corporate social responsibilityIn 2020 Bamburi Cement joined many other corporate organizations and individuals in the battle against the Covid -19 pandemic. The company committed Kes 15 million towards this and focusing on the most vulnerable groups in the communities it operates in, Health care workers and supporting the government in the fight against Covid -19 in Kenya.
i. Donation towards Covid-19 emergency response fund
In July Bamburi Cement presented Kes 5million as a direct cash contribution to the government’s Covid-19 Emergency Response Fund, which was set up by H.E. President Uhuru Kenyatta to mobilize resources to support the fight against the pandemic. The Emergency Response Fund, seeks to support government’s efforts in supply of medical facilities, equipment and support vulnerable communities with immediate needs, including foodstuff.

2020 OVERVIEW FINANCIAL REVIEWBUSINESS OVERVIEW SUSTAINABILITY REVIEW GOVERNANCE
Setting Industry Standards in Health & Safety
BAMBURI CEMENT ANNUAL REPORT & FINANCIAL STATEMENTS 2020 BAMBURI CEMENT ANNUAL REPORT & FINANCIAL STATEMENTS 202064 65
ii. Donation of PPE to healthcare workers
The company also donated Kes 5.2 million worth of Personal Protective Equipment (PPE) and digital thermometers to a total of 11 health facilities and Rapid Response teams. The beneficiaries were spread out in the five counties where Bamburi operates - namely Kilifi, Kwale, Mombasa, Machakos and Kajiado. The PPE kits comprised N95 masks, surgical gloves, coveralls, googles, face shields and shoe covers (the most essential items required by healthcare workers treating Covid-19 patients).
Bamburi Cement board and management hosted the Chief Administration Secretary (CAS) for Health, Dr. Mercy Mwangangi who was the Chief Guest at a flag off ceremony for the distribution of the PPE Kit. The event was held at the Nairobi Grinding Plant and was witnessed by several Machakos and Kajiado counties representatives and staff. The PPE were received by the various healthcare facilities in December.
iii. Sanitization and face masks for communities and customers
iv. Donations towards children’s homes
The Covid-19 pandemic has had a socio-economic impact on many, and bearing the biggest brunt of it has been vulnerable groups. Over the Christmas holidays Bamburi staff gave up part of their end of year activities budget to go towards donating foodstuff and mattresses to Children-care institutions. The beneficiaries were six institutions including Kwale School for the Deaf, Henny’s Children Home in Kwale County, Good Life Orphanage Mtepeni Ward in Kilifi County, Mombasa Secondary for the Physically Handicap in Mombasa County, Hawa Children’s Home in Kajiado County, and Baby Blessing Children’s Home in Umoja, Nairobi County.
Mother and child health programThis program which runs from the Bamburi Cement Staff Clinic at our Mombasa Plant focuses mainly on pregnant mothers, infants and children below the age of 5 years. Bamburi Cement believes that maternal and child health is indeed an important public health issue and having this program is an opportunity to end preventable deaths among women, children and adolescents by greatly improving their health and well-being. The following services are provided in the Mother and Child Program:
i. Pregnant mothers
When a pregnant mother comes to the Clinic, she receives a wide range of services including health education about safe motherhood, nutritional counselling, key laboratory tests, correct staging of the pregnancy, unborn child monitoring, treatment to protect her and the un-born child from getting malaria, HIV counselling and testing, referral linkages for high risk pregnancies, information about birth spacing, teen mothers are counselled and connected to a support group and provision of family planning methods.
ii. Children under five
Children from the age 0 to 5 years receive the approved vaccinations, growth monitoring to ensure they are growing optimally, required vitamins such as vitamin A and Iron, deworming, treatment for conditions such as malaria, pneumonia and diarrhea that are fatal among this group.
During the year 2020, the staff clinic received 2,841 children, a drop from 3,555 children in 2019. 480 mothers visited the Antenatal and family planning services and a total of 436 visits for HIV services. During the visits, mothers were sensitized on Covid-19 symptoms and preventive measures.
Bamburi Cancer CenterOne of the major public health challenges facing Kenya today is cancer. According to the 2020 Globocan report, Kenya recorded 42,116 new cancer cases and 27, 092 deaths. Cancer is one of the major Non-Communicable Diseases (NCDs) and ranks third in Kenya as a leading cause of death. This is in addition to the already existing challenges with communicable diseases such as malaria resulting to a ‘double burden of disease’.
A key element to cancer management is supportive care, this is crucial as it ensures that the quality of life of patients is at an optimal level to improve outcomes. Thus, having a fully-fledged cancer unit is at the core of ensuring patients receive good care. Bamburi Cancer Center established an ultra-modern cancer center at the Coast General Hospital through a public-private partnership program (PPP) in 2017 that has been at the heart of Mombasa County’s healthcare system.
In 2020, the cancer center provided service to over 12,000 patients and serves as a centre of excellence for the wider Coastal region. In addition, Bamburi painted the facility and provided outdoor furniture for use in counselling services.
Communities continued
Proper sanitization, including handwashing and sanitization, as well as wearing of face masks have been identified as key prevention measures for Covid-19. At the onset of the pandemic earlier in the year the company supported local communities in Mombasa, Machakos. Kilifi, Kajiado and Kwale with water tanks, placed in common areas to support handwashing. Additionally the company donated face masks and sanitizers to members of these communities, customers and contracted employees across our operations.

2020 OVERVIEW FINANCIAL REVIEWBUSINESS OVERVIEW SUSTAINABILITY REVIEW GOVERNANCE
Setting Industry Standards in Health & Safety
BAMBURI CEMENT ANNUAL REPORT & FINANCIAL STATEMENTS 2020 BAMBURI CEMENT ANNUAL REPORT & FINANCIAL STATEMENTS 202066 67
Conservation Through collaboration with the Kenya Wildlife Service (KWS) we supported the equipping of Wildlife conservancies across the country with wildlife in an effort to increase conservation initiative in the region. In 2020, Bamburi Haller Park donated 14 animals to Vipingo Ridge and 9 animals to Marula farm in Naivasha under this collaboration. Equipping of wildlife conservancies across the country contributes to Kenya’s positive global image in wildlife conservation.
We also collaborated with KWS to conduct a feasibility study of Vipingo Ridge, and advised on the ecosystems suitability to host the animals. On request by KWS, we trained wildlife rangers for Vipingo Ridge on wildlife conservation and management skills, demonstrating Bamburi Cement and LafargeHolcim leadership and commitment to conservation.
In 2020, saw the launch of a partnership with Kenya Forest Research Institute (KEFRI) on research and development of Casuarina Equisetifolia seed material for enhancement and use in rehabilitation of quarries and restoration of ecosystems across the region for improved forest productivity. In December 2020, original Casuarina equisetifolia seed material from Bamburi Haller Park was collected by Lafarge Ecosystems and KEFRI joint team for research, development and enhancement for use.
Through our expertise in animal handling, we continue to respond to distress calls to capture snakes and other creatures within communities along the Kenya Coast. Our support to protecting and preventing human wildlife conflict is a source of pride to the company as well as greatly appreciated by the communities.
Baobab Trust In 2020, Bamburi continued to support the Baobab Trust: which focuses on environmental awareness, education and conservation; community education, health, and farmers training. Despite the Covid-19 pandemic, restrictions and protocols, the Trust was able to develop and enhance some of its projects.
i. Environmental awareness, education and conservation
Nguuni Nature Sanctuary in 2020 recorded 14,078 visitors comprising both residents and non-residents. Some 492 students visited in February and March before the pandemic hit. It became necessary to add more sheds and facilities and therefore the Mbuuni picnic site, Acacia Sundowner, campsite and refreshment area were set up. Repairs on the perimeter fencing and regular patrols have also ensured no animal strays outside the sanctuary and has also prevented tree logging trespassers.
During the year the sanctuary got additions (babies) to the eland, oryx and giraffe families and the wildlife stock stood at 20 giraffes, 15 eland, 7 oryx, 5 waterbucks, 2 ostrich and 7 guinea fowl. In addition a new boma houses 16 tortoises which has become added attraction to visitors especially children.
Renovations were also done at the Shale Quarry, which has ongoing biofuel and bio-forest trails; to prevent vandalism, trespassers and enhance the environment for the ecosystem. A stretch of 1,310m was cleared with an inspection track, nature walk trails, and sundowner and picnic sites created at selected sites. PVC-concrete filled posts were installed for an electric fence, gate installed between the sanctuary and biofuel for access among other renovations.
Communities continued
A new website for the Sanctuarywww.nguuninaturesanctuary.org was launched in July to showcase the various projects and activities; and the Sanctuary features at 8 out of 30 things to do in Mombasa on TripAdvisor with a 4.5 star rating, among other social media engagements.
Sea turtle conservation – a program in collaboration with Jumba Turtles Group continued to offer turtle conservation education. Some 7,127 hatchlings were recorded in the year.
Tree planting – On World Environment Day, 5th June, some 31 Muungano Kwa Mwalue community members came together for a tree planting activity, where over 200 trees were planted to bring shade, fruits, furniture timber and firewood to the Santuary.
ii. Community Education
The library recorded 1,528 readers in 2020, as it closed until August following government’s directive to close all learning institutions as a Covid-19 containment measure. During the short period children were encouraged to read, share a story, and write down their thoughts. Life-skills like knitting, writing and farming were also enhanced.
The Trust held its first Christmas event by engaging children for craft sessions using recycled materials to make decorations including cards and candle making; culminating in a day of Christmas carols, decorations and other Christmas presentations.
iii. Health
The clinic in Nguuni saw 2,959 patients and over 11,000 antenatal patients. The Ministry of Health continues to pay regular visits, providing the clinic with vaccines, family planning medicine and guidelines. Ongoing Family Planning sessions both in the clinic and communities continued to be received well, and the Family Planning room which was refurbished sees patients weekly.
In regards the Coronavirus pandemic, throughout the year the Trust continued to reach out to the communities to create awareness, distributing face masks and liquid hand soap. Over 150 community households were visited and issued with face masks and hand wash, as well as information material on prevention. Covid-19 sensitization talks were also done both during community outreach activities and at the clinic. Inside the Trust’s facilities, all project areas were set up with hand-washing stations and thermometer checks; and happily there are no reported cases within the organization.
iv. Farmer Training
Community training was done for 30 community farmers at the Mtopanga Training and Demo Farm, where they were taken through the various components of the farm, empowering them to set up and run vegetable plots and fish farming ponds at their homesteads. At the Medicinal Garden, beds with Artemisia, Turmeric, Hibiscus, Lemon Grass, Moringa and Aloe Vera were planted throughout the year.
The Youth Farming program for students continued for a short time due the pandemic as schools remained closed from March 2020. However, the plots have been maintained and await the students in 2021. The Tree Nursery has 40 trees species ranging from fruit trees, fuel wood, building furniture to ornamental plants. These are shared with the community during tree planting. During the year the training and demo fish pond was resized and re-lined.
Haller Farmers App – the new app was launched in June and is available on Google Play store, and provides great information on farming. During trainings at the Mtopanda Farm and in outreach activities farmers are encouraged to use it.

2020 OVERVIEW FINANCIAL REVIEWBUSINESS OVERVIEW SUSTAINABILITY REVIEW GOVERNANCE
Setting Industry Standards in Health & Safety
BAMBURI CEMENT ANNUAL REPORT & FINANCIAL STATEMENTS 2020 BAMBURI CEMENT ANNUAL REPORT & FINANCIAL STATEMENTS 202068 69
Climate
KenyaQuarry rehabilitation and ecosystems management Bamburi Cement recognizes that sustainable environmental restoration and conservation is a critical component in addressing livelihood concerns and an essential pillar for economic and social sustainability. It is also a major contributor in mitigation of climate change and contributes to Net Zero goals.
Through its subsidiary, Lafarge Eco Systems, Bamburi continued to rehabilitate, grow and manage forest plantations as well as conservation of biodiversity. Our long term goal in quarry rehabilitation is restoring coastal ecosystems, biodiversity conservation and sustainable utilization of the restored ecosystems. To date, we have rehabilitated over 356 hectares of limestone quarry in Kilifi and Mombasa Counties.
Ecotourism and conservation education In line with United Nations Sustainable Development Goals 4, we continued to provide inclusive, equitable and quality environmental education to promote lifelong learning opportunities. The education material leveraged experience and knowledge gained over the years from the two rehabilitated showcase parks Bamburi Haller Park and Bamburi Forest Trails.
Bamburi Haller Park is more than 49 years old and was opened to the public in 1984 while Bamburi Forest Trails a younger restored ecosystem located in North Quarry, rehabilitated from the early 1990’s. The showcase parks are the largest man-made ecosystems and recreational spaces in Mombasa providing a variety of outdoor activities in a scenic, natural environment for families, individuals, children and organizations. They represent rare facilities for outdoor functions, training opportunities, outdoor sports and educational activities.
Professional Educational Guides typically provide interactive tours, field studies, and ecology classes to over 181,000 visitors annually who visit Bamburi Haller Park and Bamburi Forest Trails. However, in light of the Covid-19 pandemic, we closed the parks and provided virtual conservation education lessons on the importance of conservation. We are committed to utilize both parks to provide education and eco-tourism and be a source of inspiration to environmental protection.
In 2020 we launched ‘Houses of Tomorrow’, an innovative and green construction project in Kenya, is part of our sustainable construction agenda through low-carbon based building solutions. The project involves careful selection, design and use of materials that leverage low carbon standards in the overall construction incorporating low carbon cement. Some of the Bamburi brands that will be used for the project include POWERMAX and NGUVU pozzolanic cements for concrete works, while FUNDI masonry cement, a low carbon cement will also be used for mortar and plaster works.
Green construction has long been a goal for the construction industry and the launch of ‘Houses of Tomorrow’ is another step in Bamburi’s journey towards even more sustainable building solutions and towards a more sustainable construction industry overall.
In our ambition of becoming a net zero company we are not only part of the solution, we are committed to supporting our customers in their CO2-reduction ambitions. We are therefore delighted to launch this project, further demonstrating our continuous innovative solutions aimed at reducing the carbon emissions across the entirety of our operations and supply chain. This project seeks to offer a more sustainable construction solution and we cannot wait for our customers to reap the benefits.
Our customers will not only benefit from the product’s sustainability credentials and great performance, but also exceptional service. Our technical team is well prepared to orient customers on this project, not only to help them understand the ‘green building’ concept but also to help them have a better understanding of low carbon footprint and why this solution matters, to enable them to make better and sustainable construction decisions.
UgandaLaunch of green cement The region’s mining market has very specialized needs and our innovations team was able to offer the new MINECEM Ultra, a green cement with only 95 Kg of CO2 per ton of cement. It is a cost effective solution for stope backfilling in underground mine operations. More importantly, it contributes to the LafargeHolcim’s Net Zero Pledge.
Project
UgandaOur operations by their very nature can have impact on neighboring communities. Developing strong and lasting relationships is therefore paramount to our existence. 2020 tested the bonds of these relationships because of the impacts of the Covid-19 pandemic. Our focus was on the health and safety of our employees and communities around us.
Covid-19In March 2020, the government of Uganda instituted country-wide lockdown measures in an effort to stop the spread of the Coronavirus. This involved stopping transportation of the general public with the exception of people on essential services. This meant that the already stretched local medical emergency services were worse off. In appreciation of this, Hima Kasese Plant donated the use of an ambulance to the Kasese District Covid-19 Task Force. This was instrumental in tracing of community cases and also in evacuating other medical emergencies in the greater Hima and Kasese area.
In Tororo, Hima donated 60 antibacterial mattresses required to set up the Covid-19 ward at Tororo Hospital. Additionally, the company donated 2000 liters of disinfectants and liquid soap, disposable gloves and masks to frontline workers in Tororo, Kasese and Kapchorwa District.
The team at the Namanve Blending Station in Kampala came up with a hand sanitizer formulation that was less than half the market value and with better ethanol concentration (80% concentration). This was donated to employees and their families, communities and some customers.
The Company also pledged to donate building materials worth Ushs 20 Million towards the construction of a drivers’ center at Mpondwe border post in Western Uganda by the government. Due to Covid-19 Government measures, the country was under lockdown for two months and this required our industrial teams to sleep close to or on site. As a result, we converted Hima Primary School, a community school near Hima Plant, into a residential space for the team, enabling our industrial operations to continue. Hima Primary School is our adopted school, which we have supported for 20 years. It was a demonstration of the numerous benefits of building good relationships with our host communities.
Community healthThe Hima HIV Clinic remained open to manage over 400 clients registered in the Antiretroviral Therapy Program. The clinic registered an increase in cases of opportunistic infections as clients took much longer to come in for drug refills and treatment due to the lockdown measures.
The mining community in Kichwamba Sub-county in Kabarole District where the company sources pozzolana for Hima Plant, faces a significant challenge with accessing clean water. Hima Cement completed construction of two boreholes in Magunga Village providing much needed water for sanitation and livelihoods to over 500 households.
Communities continuedEducationWe strive to create a better future beyond the bounds of our core business and that’s why we support education programs in our neighboring communities. We completed construction of a four classroom block at Mudodo Primary School in Tororo, after an investment of Ushs 133 Million. The school has a population of over 900 pupils and the additional space will go a long way in improving the learning environment.
We have supported our adopted school, Hima Primary School for over 20 years. The school has over 1,000 students and we offer support through facilitating the employment of more teachers, providing security, clean water and the volunteer services of our employees towards the schools’ literacy and environment conservation programs. We made several renovations at Hima Primary School including painting, fencing and upgrading of the kitchen with a concrete floor and cooking stoves.
The Hima Community Scholarship Program admitted an additional 26 students for secondary school in 2020 from five districts – Kasese, Kamwenge, Kabarole, Tororo and Kapchorwa. We currently have a total of 90 students benefitting from the program with approximately Ushs 100 Million spent every term.
We strive to employ local people and utilize local services, with a focus on engaging young people and women to offer third party services. For example, Mirembe Women’s Group which offers services including mending and cleaning of PPEs, landscaping services and other casual labour when required.

2020 OVERVIEW FINANCIAL REVIEWBUSINESS OVERVIEW SUSTAINABILITY REVIEW GOVERNANCE
Setting Industry Standards in Health & Safety
BAMBURI CEMENT ANNUAL REPORT & FINANCIAL STATEMENTS 2020 BAMBURI CEMENT ANNUAL REPORT & FINANCIAL STATEMENTS 202070 71
EnvironmentWildlife integration in restorationFrom the onset of Bamburi’s quarry rehabilitation efforts, we have integrated wildlife in the rehabilitation of quarries, leading to restoration of functional quarry ecosystems over the years. Introduction of large and small mammals, reptiles, insects, amphibians and arthropods to occupy specific niches in the ecosystem has led to a vibrant ecosystem and world renowned showcase of environmental conservation and sustainability.
Our conservation initiatives showcases the role of wildlife in restoration of tropical wasteland where different species of organisms have special roles to play. Several species of animals including monkeys, bush-babies and antelopes, act as seed dispersers, while butterflies and other insects, bats and others act as pollinators. Useful organisms such as insects, millipedes, other arthropods and fungi act as decomposers, turning the former quarry into a functional ecosystem.
Today, Bamburi Haller Park, is a reservoir of wildlife and is responsible for helping the Government of Kenya to equip Wildlife Conservancies, strengthening of genetic pool, and conservation of natural resources across the country. We are now shifting from populations to species diversity while addressing organism needs through habitat enrichment for ecosystems resilience and sustainability.
Biodiversity in quarry ecosystemsWe support the UN Sustainable Development Goal 4 by mainstreaming biodiversity conservation in the rehabilitated quarries, through protection, restoration and promotion of sustainable use of terrestrial ecosystems, sustainable management of forests, to combat desertification, and reverse degradation. We introduce indigenous trees, plants and organisms to recreate coastal ecosystems.
Kenya’s coastal ecosystems are critical to the country as they host a variety of biodiversity which deliver essential goods and services to local communities and support livelihoods. They are comprised of forests, wetlands and grasslands that are important for human survival but are under increasing threat due to population pressure leading to degradation.
The aim of our biodiversity conservation activities is to continue achieving a Net Positive Impact (NPI) by improving biodiversity and value of the rehabilitated quarry. Over 453 species of indigenous trees, shrubs and lianas have been introduced into the rehabilitated quarries between 1971 to date. Many of the indigenous species are now reproducing in the restored ecosystems, forming populations that contribute to ecosystems goods and services. By 2020, about 195 of these species were listed on the International Union for Conservation of Nature (IUCN) Red List, the world's most comprehensive inventory of the global conservation status of plant and animal species. Food plants as well as flowering plants have been introduced to attract and sustain rich biodiversity, including butterflies and birds.
More than 292 species of birds have been recorded in the rehabilitated areas and reserve lands, 11 of the bird species are listed as either Endangered, Vulnerable or Near Threatened. In addition, we have over 112 species of butterflies and 18 species of dragonflies.
Every year we participate in the International Waterfowl census (Bird Census) in the region and our restored ecosystems have been identified as hot spot for biodiversity on the world map, hosting important bird species including Madagascar Pond Heron (Ardeola idea) among others.

2020 OVERVIEW FINANCIAL REVIEWBUSINESS OVERVIEW SUSTAINABILITY REVIEW GOVERNANCE
Setting Industry Standards in Health & Safety
BAMBURI CEMENT ANNUAL REPORT & FINANCIAL STATEMENTS 2020 BAMBURI CEMENT ANNUAL REPORT & FINANCIAL STATEMENTS 202072 73
Circular EconomyWe continue to work with various stakeholders and partners including:
• The National Environmental Management Authority (NEMA) in supporting efforts to ensure a waste-free environment through policy development and implementation, and enforcing best practices in waste management.
• Kenya Revenue Authority (KRA) and Anti-Counterfeit Authority (ACA) – in the disposal of condemned goods that are designated for destruction.
• The Petroleum Institute of East Africa (PIEA)
• Transporters, fleet owners and tyre recyclers.
• Industries and manufacturers
In 2020 Bamburi Cement’s Mombasa Plant achieved a substitution rate of 7.6% while the Nairobi Grinding Plant achieved a substitution rate of 69%.
UgandaStrengthening our contribution to sustainability Geocycle Uganda operates at both Hima Plant Kasese and Hima Tororo grinding station providing waste management solutions for industrial and agricultural wastes for safe disposal by co-processing at both plants in Uganda.
In 2020, we achieved outstanding performance in terms of thermal substitution ratio (TSR) of 60% and a global gross added value (GAV) of Kes 942 million versus budget of 908 million. Alternative fuels cost was slightly above on account of low net calorific values due to the high biomass moisture.
The alternative fuels consumed in 2020 include coffee and rice husks, crushed palm kernels, groundnuts husks, sawdust, carbon black and distillation residues from tyre pyrolysis factories.
The cost of alternative fuels in 2020 was close to budget and better than 2019. This was mainly attributed to:
• Proactive team performance reviews and improvements actions.
• Use of carbon black with a low cost per GJ which improved the fuel cost
• Good fuel mix optimization in terms of availability and cost.
• However, seasonality of agricultural wastes necesitated sourcing coffee husks from Tanzania, in addition insecurity and logistical challenges from DRC negatively impacted cost.
• High moisture content biomass increased drying cost.
• Other challenges such as plant stoppages due to frequent power failures and unstable transport systems also impacted cost.
.
KenyaWe are committed to contributing to a sustainable environment and a circular economy by providing innovative waste management solutions to various industries.
Waste in Kenya is now getting more prominence with the government and private sector paying more attention to its safe disposal.
The year 2020 saw a few challenges in the way of Geocycle with the onset Covid -19 particularly in regard to sourcing and logistics. The extended lockdown on movement across the country to limit the spread of the coronavirus impacted sourcing by suppliers who are predominantly entrepreneurs.
Geocycle continued to engage with like-minded stakeholders and caucuses to encourage responsible collection and disposal of waste in order to protect our environment. We also used these forums to share best practices along with increasing awareness on the benefits of sustainable waste management through co-processing in cement kilns.
We continue to tap into the expertise and knowledge within the LafargeHolcim Group to provide economical and sustainable solutions to the waste management challenge within Kenya. Geocycle sources for various types of waste which Bamburi Cement disposes of through co-processing in cement kilns, leaving no-residues.
Co-processing in cement kilns achieves both energy and/or materials recovery. We have helped in disposal of several waste streams that would have otherwise caused damage to the environment, namely:
• Tyres• Coal• Waste from Pyrolysis• Condemned Cargo• Industrial Waste• Waste from the oil industry
Geocycle Uganda performance trend though strong in 2020 was negatively impacted by high biomass moisture and unstable plant performance for the kilns.

GovernanceCorporate Governance Statement 76Governance Auditor’s Report 81Statement of the Directors on Governance 82Directors’ Remuneration Report 83Shareholder Profile 86
Defence against Covid-19: We instituted Social distancing at all offices which included working from home and delivered results.

2020 OVERVIEW FINANCIAL REVIEWBUSINESS OVERVIEW SUSTAINABILITY REVIEW GOVERNANCE
Setting Industry Standards in Health & Safety
BAMBURI CEMENT ANNUAL REPORT & FINANCIAL STATEMENTS 2020 BAMBURI CEMENT ANNUAL REPORT & FINANCIAL STATEMENTS 202076 77
Corporate Governance Statement
Corporate governance refers to the systems, processes and principles used to direct and manage a company. The Board of Directors of Bamburi Cement Limited (the ‘Company’) is steadfast in its belief that good corporate governance is critical for the long term success of the Group and to ensure sustainable returns for investors and stakeholders.This corporate governance statement provides necessary information to enable investors evaluate how the Company has applied the principles of the Capital Markets Act Code of Corporate Governance for Issuers of Securities to the Public 2015 and should be read together with the wider corporate governance report on the Company’s website.
In line with the guidelines issued by the Capital Markets Authority, the Company has undertaken a governance audit for the year 2020. The Governance auditor’s opinion is included as part of this annual report on page 81. The Company has also put in place adequate systems and measures to ensure that high standards of corporate governance are maintained and the findings of past governance audits are implemented as deemed necessary.
The Board
Mandate
The Board’s main role is providing strategic leadership and stewardship for the Group. Its operations are governed by the Company’s Articles of Association, the Board Charter, the Board Annual Work Plan and statutory provisions under the laws of the Republic of Kenya.
To ensure that the obligations of the Board are clear to all, the Board has developed a Schedule of Matters Reserved for the Board, which are matters that only the Board itself or through its committees can handle. Any issues outside these, are delegated to Management through the Schedule of Matters Delegated by the Board.
The Board has set up three committees to perform its delegated functions i.e. the Audit & Risk Committee, the Nomination, Remuneration & HR Committee and the Executive Committee.
The Board Charter and terms of reference of each committee are reviewed regularly and updated to ensure that they remain dynamic and relevant.
Composition and size
The Board is composed of a total of eleven (11) directors with eight (8) being non-executive directors. The Board composition remained the same for the year ended 31st December 2020 with five (5) independent non-executive directors, three (3) non-independent non-executive directors and three (3) executive directors, representing four different nationalities and diverse professional backgrounds.
Since the last report, Joseph Kimote resigned as a non-executive director and was succeeded by Austin A.O. Ouko.
With over 70% comprising of non-executive directors, the Board is able to effectively provide independent oversight on strategy, give appropriate leadership and direction to management, leverage on their network of outside contacts for the Group’s benefit while ensuring proper risk management within the parameters deemed acceptable for the Group.
For the year under review, the Directors are satisfied with the effectiveness of the Board and its Committees and have put in place a plan to consistently close actions from past board evaluations.
Operations
With the support and assistance from the Group Managing Director and the Company Secretary, the Chairman is responsible for the operations of the Board including, without limitation, providing leadership and guidance, setting the agenda and presiding over meetings.
The Board’s operations are guided by the Annual Work Plan as well as any demands that may arise from time to time.
To adequately cover the Board’s annual work plan, meeting dates for the full calendar year are agreed in November of the preceding year. In 2020, the Board held eight meetings, three more than the usual number to enable it cover the planned activities for the year. Owing to the containment measures to prevent spread of Covid-19, meetings were held virtually.
Director Category Board Audit & Risk Committee NR&HR Committee AGM
Dr John Simba Non-executive 8/8 - 3/3 1/1Seddiq Hassani Executive 8/8 5/5 3/3 1/1Grace Oluoch Executive 7/8 5/5 - 1/1Alice Owuor Non-executive 8/8 5/5 2/3 1/1Dr Helen Gichohi Non-executive 8/8 - 3/3 1/1Jean-Michel Pons Executive 8/8 5/5 - 1/1Mbuvi Ngunze Non-executive 8/8 5/5 3/3 1/1Rita Kavashe Non-executive 7/8 5/5 - 1/1Vasileios Karalis None-executive 7/8 - - 1/1Pierre Deleplanque Non-executive 3/8 - 0/3 1/1Joseph Kimote Non-executive 5/8 4/5 - 1/1Austin A.O. Ouko Non-executive 1/1 - - -
The attendance report for the year under review is set out in the table below.
While the Group does not specify a time requirement that each director must dedicate for the business of the Group, Directors are expected to attend all meetings of the Board and the Committees on which they serve and to devote sufficient time to the Company to perform their duties. With Board papers and other documents circulated at least one week in advance, the Directors are expected to be sufficiently prepared for and fully participate in all meetings.
The Chairman and Group Managing Director meet at least once a month, where the Group Managing Director updates the Chairman on any matters that require the Chairman’s attention. Further, the Chairman and/or the Group Managing Director hold discussions with the Directors, individually or jointly, to keep Directors updated and provide opportunity for the Directors to raise any issues or concerns in between the meetings.
During the year, the independent non-executive Directors held discussions before/after Board and/or Committee meetings in the absence of Management and introduced a session with individual members of the Executive Committee.
Director compensation
Director compensation is reviewed annually by the Board and approved by the Shareholders. The details of the Director compensation are contained in the Directors’ Remuneration Report which is contained on page 83 - 85 of this Annual Report.
The executive Directors and the LafargeHolcim nominees do not receive any additional compensation for their service on the Board.
NOTE: The numbers show attendance/number of meetings a director is entitled to attend.
Separation of roles
In line with good governance, the roles of the Chair of the Board of Directors and that of the Group Managing Director are held by two different individuals with each having clear and distinct responsibilities.
The responsibilities of the Chair include providing leadership to the Board, management of Board affairs, corporate governance, Board performance evaluation, acting as the intermediary between the Board and Management as well as representing the Group in interactions with stakeholders.
The Managing Director is responsible for the day-to-day running of the operations, ensuring the strategy approved by the Board is implemented within the defined risk matrix and that the objectives set are met.
Training & evaluation
Induction and training
The Board has set the principles on induction, development and training for the Directors.
The Company Secretary is responsible for the induction of new Board members within these principles ensuring that each induction plan is tailor made to suit the individual’s skills set, existing/required knowledge and role. In 2020, one non-executive director was appointed to Board who is undergoing a phased induction plan.
Continuous development training requirements are determined by the Board, the changing business environment, business needs and/or regulatory changes. During the year, the Directors attended various corporate governance trainings, a feedback session with the CMA, a review into the management of matters arising from the Code of Business Conduct and received updates on new legislation.

2020 OVERVIEW FINANCIAL REVIEWBUSINESS OVERVIEW SUSTAINABILITY REVIEW GOVERNANCE
Setting Industry Standards in Health & Safety
BAMBURI CEMENT ANNUAL REPORT & FINANCIAL STATEMENTS 2020 BAMBURI CEMENT ANNUAL REPORT & FINANCIAL STATEMENTS 202078 79
Information
Together with their letters of appointment, incoming Directors are provided with an induction manual containing all information on corporate and legal obligations the Directors should be aware of. The manual includes documents such as the Board & Committee Charters and work plans, Company’s Articles of Association, Schedules of matters reserved for and those delegated by the Board, Board policies together with corporate governance regulations.
In line with prevailing statutory provisions and the Board Charter, the Directors received timely, accurate and complete information on all matters the Board is responsible for. Board and Committee packs are circulated electronically at least seven (7) days in advance to give Directors ample time to review the content and request clarification before any meeting. The documents are circulated via an electronic Board platform which allows real time access and updates as well as annotation of documents by the Directors. This has enriched discussions as the Directors can easily track their concerns when reviewing the documents.
Further, the Chairman, Managing Director and the Company Secretary are available to the Board members at all times. The Board can also seek independent professional advice at the expense of the Group and have access to any internal resources that may be required.
Performance evaluation
The Board regularly reviews its performance, that of the Chairman and the individual directors, which evaluation covers the board mandate, size, composition, meetings, stakeholder/shareholder relations, independence, induction & training, Management relations, legal & ethic duties etc. The Board also annually reviews the efficiency and composition of its Committees.
The evaluations are undertaken by each director, the Chairman, the Managing Director and the Company Secretary and include director self-assessments. On completion of the assessment the Chairman holds a feedback session with each individual director, each Committee Chair and with the full Board.
The Board is pleased to confirm that each board member continues to perform effectively and to demonstrate full commitment to their role on the Board. The Board annually assessed the independence of its non-executive directors and was satisfied that in 2020 all independent non-executive directors met the criteria for independence.
Board of Directors
Audit and Risk Committee
Nomination, Remuneration &
Human Resources Commitee
Executive Committee
Each Board Committee is governed by a charter approved by the Board. The Charters set out the parameters of responsibility as well as the operational elements of each Committee. In 2020, the Board reviewed the charter of the Audit & Risk Committee and the Nomination, Remuneration & HR Committee.
The reports of the Audit & Risk Committee and the Nomination, Remuneration & HR Committee are tabled before the Board for adoption while the Executive Committee reports are included in quarterly Management reports.
The Board and the Committees are satisfied that the Committees met their mandates in 2020 as provided for in the respective Charters.
Audit & Risk Committee
The Audit & Risk Committee comprises at least three (3) independent non-executive directors including a member with accounting qualification and in good standing with the respective professional association, in compliance with the CMA Code.
The current membership of the Committee was appointed by the shareholders at the 2020 annual general meeting.
The Committee invites the Group Managing Director, Managing Director – Hima Cement, Group Finance Director, Hima Finance Director and the Head of Internal Audit/Internal Controls Manager to attend all its meetings. Other members of the Board can also attend the meetings while members of Management are invited to present any reports required for the Committee to discharge its duties.
The Committee held five (5) meetings in 2020, to review the Group’s financial interim and annual reports, the Management Letter arising from the external audit, litigation and contingent liabilities, Kenya and Uganda Revenue Authority claims, internal audit work plan, special audit reports, the CMA corporate governance reporting tool feedback and the integrity line reports. The Committee also met with the auditors in the absence of Management.
For the year under review, no potential conflict of interest was brought before the Committee. However, the Committee reviewed several related party transactions.
The Committee also reviewed and was satisfied with the independence, expertise and effectiveness of the incoming auditors to carry out their audit mandate. The Committee is also satisfied that the Internal Audit Department is adequately sourced, has requisite support from Management and was effective during the year in review.
Nomination, Remuneration & Human Resources Committee (NR&HRC)
The NR&HRC is responsible for nomination of candidates for appointment to the Board and its Committees. The Committee is composed of six (6) members, four of whom are independent non-executive directors, thus complying with the requirements of the CMA Code to have a majority of independent members.
In 2020, the Committee managed the recruitment of one non-executive director to fill an arising vacancy following nomination of a new shareholder nominee. The Committee also reviewed staff remuneration including validation of the 2019 bonus objectives achievements and review/approval of the remuneration proposals for 2020 for both Kenya and Uganda.
The Committee also reviewed executive succession planning for members of the Executive Committee, assessed the independence of the non-executive directors and undertook a board skills review exercise. The outcome of the skills review provided insight into the Board’s skill strengths and will be used to support future board succession planning and training activities.
Executive committee
The day to day business and operations of the Group are delegated to the Executive Committee (ExCo) whose members are appointed by the Group Managing Director. The Committee consists of individuals responsible for the key business sections of Finance, Supply Chain, Procurement & Logistics, Plant Operations, Sales & Marketing and Human Resources.
The ExCo meets monthly or as frequently as necessary and the agenda focuses specifically on delivery of performance objectives approved by the Board. For the year under review, the ExCo was instrumental in driving delivery of agreed company and functional targets and implementing Board resolutions to yield the solid performance set out in the financial statements.
Company Secretary
The Company Secretary is appointed by the Board and acts as secretary to the Board as well as to all Board committees. In 2020, Betty Kanyagia resigned as company secretary effective 24 July 2020 and was succeeded by Waeni Ngea from 25 July 2020.
The Secretary is the custodian of the Board’s documents and is responsible for advising the Board on all governance matters, Board induction and training, timely and appropriate dissemination of information/board papers, together with compliance with statutory and regulatory requirements.
The Secretary is available to give detailed practical support and guidance to the Directors, individually and collectively.
Policies
Integrity line
The Group, through its Code of Business Conduct, emphasizes its commitment to ethics and compliance with laws, sets forth basic standards of behaviour for its employees, agents or directors when dealing with clients, suppliers, competitors and the general public, provides reporting mechanisms for known or suspected breaches while also ensuring prevention and detection of wrong doing.
During the year, the Group carried out training for all staff to reinforce the principles in Code of Business Conduct, promote declaration of potential conflicts of interest and familiarize all individuals with the available modes of reporting/whistleblowing on matters of concern. The reporting channels include a toll free telephone line, via email or through online reporting. Individuals making the reports have the option of remaining anonymous.
Further, review of the integrity line reports was included on the agenda of each Audit & Risk Committee meeting, which reports include details of each report, findings and remediation actions taken, if any. In this way, the Board ensures that risks arising from any ethical issues are identified and mitigated appropriately.
IT policy
The Board has adopted the LafargeHolcim Group IT policy.
The Policy aims to create value as innovative business enabler and an efficiency driver and includes three domains - IT Security, IT Service Management and other IT processes. The Policy sets out the areas of IT responsibility, its processes and a governance model. The IT framework is designed and maintained on a regular basis to keep the approach on an appropriate level of governance and to ensure efficient and secure processes.
Corporate Governance Statement continued

2020 OVERVIEW FINANCIAL REVIEWBUSINESS OVERVIEW SUSTAINABILITY REVIEW GOVERNANCE
Setting Industry Standards in Health & Safety
BAMBURI CEMENT ANNUAL REPORT & FINANCIAL STATEMENTS 2020 BAMBURI CEMENT ANNUAL REPORT & FINANCIAL STATEMENTS 202080 81
Corporate Governance Statement continued Governance Auditor’s Report
Procurement policy
The Group Procurement Policy, in place since 2018, aims at providing complete management from strategy definition to execution. It ensures that procurement creates value by leveraging size and volumes, efficient processes and systems together with combined global expertise with a consistent focus on the lowest total cost of ownership.
The Procurement Policy provides for supplier sustainability compliance, adherence to the Group’s Health & Safety Standards as well as applicable laws and regulations as integral parts of any sourcing decisions.
Related party transactions policy
The Policy applies to any transaction, arrangement or relationship (or any series of similar transactions, arrangements or relationships) between the Company and one or more of its Related Parties. It provides a framework for governance and reporting of Related Party Transactions.
In the year under review, the Board also reviewed the recommendations on each related party transaction to the Audit & Risk Committee. These related party transactions are declared in the audited financial statements as required.
Share trading
The Board applies the statutory provisions as well as the LafargeHolcim Trade Restriction Market Disclosure Directive in respect of share dealings.
Before the end of each year, the Company Secretary communicates the blackout periods during which the Directors and identified relevant employees are not authorized to trade in Company shares. To the best of the Company’s knowledge, there was no insider dealing in the 2020 financial year.
Legal & compliance audit
The CMA Code, requires the Board of a listed Company to subject the Company to a legal and compliance audit to establish the level of adherence to applicable laws, regulations and standards.
In compliance with this requirement, the Company has enlisted the services of Rachier & Amollo Advocates who are undertaking the legal and compliance audit for the year ended 31 December 2020. The auditor’s opinion will be disclosed at the 2021 annual general meeting and on the Company’s website and post audit remediation actions implemented to strengthen governance and controls. The Board is confident that the Company is generally in compliance with applicable laws and regulations.
Communication
The Board’s communication strategy aims to provide shareholders with the highest standards of disclosure and financial transparency. The Board announces its achievements and prospects to shareholders by way of interim and full year results. Significant matters are disseminated to the market through announcements to the regulators, publication in the newspapers and posting on the Group’s website.
The Group values the opinions of private investors and continued to engage them throughout the year. The Group Managing Director and Finance Director met with and received feedback from analysts and institutional shareholders.
During the year, Lafarge Eco Systems Limited’s sustainability and Group Covid community support efforts were also consistently featured in the local media.
The Group encourages individual shareholder with enquiries to forward them, which are then managed by the Chair, the Managing Director and/or the Company Secretary.
Annual general meeting
The Group held its Annual General Meeting (AGM) on 18 June 2020 virtually. Other than the Shareholders, the Directors were also present and used it to meet and interact online with the Shareholders present. The meeting was also attended by a representative from Deloitte, the external auditors.
Financial results
The Group announces its financial results every six (6) months. The half year and full year results are released through publication in two daily newspapers and the Group’s website. The Group also releases a Q&A paper with each set of financial results to enable a deeper understanding of the results while also anticipating and responding to any questions relating thereto.
The shareholders also get a copy of the annual report, which contains the full year results, other reports and information on the Group.
Following the coming into force of the Code of Corporate Governance for Issuers of Securities to the Public, 2015 (“the Code”), listed companies are specifically required to engage the services of an independent and accredited Governance Auditor to establish the extent to which the Board has applied Corporate Governance principles.
The annual Governance Audit should be conducted by a competent and recognized professional accredited for that purpose by ICS. Bamburi Cement Company Limited, in compliance with the Act and Code, retained Ms. Catherine Musakali of Dorion Associates (“the Auditor”) to conduct a Governance Audit of the governance structures, procedures and processes of the Company in order to assure the Board that its goals, structure and operations are consistent with the law, the Code, as well as the latest developments in Corporate Governance; and that the Company has adopted best practices in Corporate Governance as a means of ensuring sustainability. The Code further requires that after undergoing the Governance Audit, the Board should provide an explicit statement on the level of compliance.
The scope of the Audit is derived from the Code, the Companies Act, 2015 and the Governance Audit Tool developed by the ICS. More specifically, the Audit covers the following broad areas;
1. Leadership and strategic management;
2. Transparency and disclosure;
3. Compliance with laws and regulations;
4. Communication with stakeholders;
5. Board independence and governance;
6. Board systems and procedures;
7. Consistent shareholder and stakeholders’ value enhancement; and
8. Corporate social responsibility and investment.
Governance Auditor’s Responsibility
Our responsibility is to express an opinion on the existence and effectiveness of governance instruments, policies, structures, systems and practices in the organization in accordance with best governance practices as envisaged within the legal and regulatory framework. We conducted our audit in accordance with ICS Governance Audit Standards and Guidelines, which conform to global Standards. These standards require that we plan and perform the Governance Audit to obtain reasonable assurance on the adequacy and effectiveness of the organization’s policies, systems, practices and processes. The Audit involved obtaining audit evidence on a sample basis. We believe that the audit evidence we have obtained is sufficient and appropriate to provide a reasonable basis for our opinion.
Opinion
In our opinion, the Board has put in place a satisfactory governance framework, and in this regard, we issue an unqualified opinion.
FCS. Catherine Musakali, ICPSK GA. No 006For Dorion Associates For more information about this GAR, please contact:Catherine Musakali – [email protected]

2020 OVERVIEW FINANCIAL REVIEWBUSINESS OVERVIEW SUSTAINABILITY REVIEW GOVERNANCE
Setting Industry Standards in Health & Safety
BAMBURI CEMENT ANNUAL REPORT & FINANCIAL STATEMENTS 2020 BAMBURI CEMENT ANNUAL REPORT & FINANCIAL STATEMENTS 202082 83
The Kenya Companies Act, 2015 requires Directors to act in good faith, to promote the success of the Company for the benefit of its stakeholders and to avoid conflict between their personal interests and those of the Company, always acting in the best interest of the Company.
The Code of Corporate Governance for Issuers of Securities to the Public, 2015 (“the Code”) requires listed companies to engage the services of an independent and accredited Governance Auditor to establish the extent to which the Board has applied Corporate Governance principles. The Code further requires that after undergoing the Governance Audit, the Directors should provide an explicit statement on the level of compliance.
The Directors are responsible for putting in place governance structures and systems that support the practice of good governance in accordance with best practice, the requirements of the Kenya Companies Act, the Code and the Governance Audit Tool developed by the Institute of Certified Secretaries (“ICS”). The responsibility includes planning, designing and maintaining governance structures that ensure effective leadership and strategic management, transparency and disclosure, compliance with laws and regulations, communication with stakeholders, Board independence and governance, Board systems and procedures, consistent shareholder and stakeholders’ value enhancement and corporate social responsibility and investment.
The Directors also accept responsibility for putting in place an effective and efficient Management Team and effective internal control and risk governance systems that are designed to promote good governance practice.
The Directors accept that the independent Governance Audit does not relieve them of their responsibilities.
The Directors are not aware of any material governance issues that may adversely impact the operations of the Company.
As required by the Code therefore, the Directors commissioned a Governance Audit with the aim of ensuring that the Company has complied with the Act, the Code, and adopted best practices in Corporate Governance in order to deliver long term value to stakeholders.
The Directors have adopted this Governance Audit report for the year ended 31 December 2020, and which discloses the state of Governance within the Company.
Adoption of the Governance Audit Report
The Governance Audit Report was adopted by the Board of Directors of Bamburi Cement Company Limited on day 15 of April 2021.
……………………………. ………………………………
Dr. John Simba Seddiq Hassani Chairman Managing Director
Directors’ Remuneration Report
This Report is compiled in compliance with Division 9 of the Kenyan Companies Act, 2015 and in accordance with the Tenth Schedule of the Companies (General) Regulations 2015. Where required and as indicated, the Report has been audited by the Company’s external auditors – Deloitte Kenya.
The Board has developed a Remuneration Policy, which forms the basis of remuneration for members of the Board of Directors (both non-executive and executive) and the Bamburi Group as a whole.
The Nomination, Remuneration & Human Resources Committee is pleased to present its Remuneration Report for the year ended 31 December 2020.
Board Changes
On 27 August 2020, Joseph Kimote resigned as a non-executive Director and was replaced by Austin A.O. Ouko on 28 August 2020.
The remuneration contained in this report is pro-rated to reflect the time actual served.
Executive Directors and LafargeHolcim Representative Directors
It is a policy of the LafargeHolcim Group that executive directors and any non-executive directors appointed as representatives of the Group on the Board of Directors do not receive any payment by virtue of their membership on the Board.
As a result, for executive directors their remuneration is only that provided for under the Remuneration Policy covering remuneration for salaried/management employees.
Remuneration Outcomes 2019 - 2020: Executive Directors
Terms of Employment
The Executive Directors are employed under service contracts that are either fixed term or open ended. The dates of these contracts are:
Name Date of Contract Duration Notice PeriodSeddiq Hassani 9 February 2018 4 years 3 monthsGrace Oluoch 19 October 2018 Open ended 3 monthsJean-Michel Pons 7 June 2019 3 years 3 months
Some of the contracts have an indefinite term while others are for the indicated fixed term both of which may be terminated by either party by giving the indicated notice period. The contract for Seddiq Hassani was extended effective 8 February 2020 for a further year.
There were no significant changes to the remuneration in respect of pension or allowances during the year.
Bamburi Cement does not have any long term incentives or share option schemes.
Salary Review
The executive director salaries review was undertaken in line with the overall company salary review. The salary review reflected the potential impact of Covid-19 on company sustainability. Group CEO salary review was undertaken in line with his home country seniority increase.
The increases awarded compared to the salary increases average for salaried staff are as shown below:
Name 2020 2019Seddiq Hassani 1.3% 1.5%Grace Oluoch None NoneAverage staff salary increase Kenya None 4.5%Average staff salary increase Uganda None 10%
Performance Bonus 2020
All employees participate in the Group’s short term incentive program where the bonus paid is discretionary and based on Company and individual performance. For the Group Managing Director and Hima Cement CEO, the short term incentive program also includes LafargeHolcim Middle East Africa region objectives and as such bonus paid in 2020 was inclusive of regional performance. Overall company bonus performance for Kenya was 23%.
The performance bonuses were paid to the employees in March 2020 but excluded executive committee members in Kenya. The performance bonus for the year 2020 was paid in March 2021.
Statement of the Directors on Governance

2020 OVERVIEW FINANCIAL REVIEWBUSINESS OVERVIEW SUSTAINABILITY REVIEW GOVERNANCE
Setting Industry Standards in Health & Safety
BAMBURI CEMENT ANNUAL REPORT & FINANCIAL STATEMENTS 2020 BAMBURI CEMENT ANNUAL REPORT & FINANCIAL STATEMENTS 202084 85
Directors’ Remuneration Report continued
Name Salary Bonus Allowances Non-Cash Benefits1
Pension/Social Security
Total Total
2020 2019 2020 2019 2020 2019 2020 2019 2020 2019 2020 2019Kes‘000 Kes‘000 Kes‘000 Kes‘000 Kes‘000 Kes‘000 Kes‘000 Kes‘000 Kes‘000 Kes‘000 Kes‘000 Kes‘000
Seddiq Hassani 35,8372 36,390 556 3,514 7,959 7,941 8,084 6,652 7,790 8,567 60,227 63,064
Grace Oluoch 18,000 18,000 - 574 3,250 3,257 1,133 1,511 2,162 1,262 24,545 24,604
Jean-Michel Pons 40,688 7,186 2,346 - 7,055 1,797 6,039 6,285 2,552 1,437 58,6793 16,7054
TOTAL 94,525 61,576 2,902 4,088 18,264 12,995 15,256 14,449 12,504 11,266 143,451 104,3741 includes, where applicable, school fees, home travel, insurance covers, house, car, driver2 salary reduction is reflective of 2020 5% PAYE tax reduction and forex impact of home pay portion3 total reward covers the full year impact, family relocation and forex impact4 covers the period from 7 June 2019
Remuneration Outcomes 2019 - 2020: Non-Executive Directors
Terms of Employment
The non-executive Directors (including the Chairman) are appointed by letters of appointment, which do not contain fixed term period, which appointment is subject to performance review and re-election by the shareholders at annual general meetings.
The dates of the letters of appointment are set out below:
Name Date of ContractDr John Simba 29 November 2012Joseph Kimote 6 June 2016 – 27 August 2020Alice Owuor 10 March 2017Dr Helen Gichohi 10 March 2017Rita Kavashe 10 March 2017Pierre Deleplanque 7 June 2018Mbuvi Ngunze 30 August 2018Vasileios Karalis 21 March 2019Austin A.O. Ouko 28 August 2020
Apart from their service contracts, no director has had any material interest in any contract with the Group.
The Board proposed at the General Meeting and it was agreed to implement the increase over two (2) years, the first of which was approved by the Shareholders at the Annual General Meeting held on 18 June 2020 and implemented thereafter.
The Directors are paid an annual fee, paid bi-annually, and meeting attendance fees. The fees paid in 2020 were:
Non-Executive Director Remuneration
Name Annual Fees
Sitting Allowance1 Total 2020 Annual
FeesSitting
Allowance Total 2019
Dr John Simba 1,554,114 2,271,396 3,825,510 1,554,114 2,151,849 3,705,963
Joseph Kimote 454,460 1,315,017 1,769,477 691,080 1,912,752 2,603,832
Rita Kavashe 691,080 1,673,658 2,364,738 691,080 1,793,205 2,484,285
Alice Owuor 691,080 1,912,752 2,603,832 691,080 2,032,299 2,723,379
Dr Helen Gichohi 691,080 1,434,564 2,125,644 691,080 1,075,923 1,767,003
Mbuvi Ngunze 691,080 1,912,752 2,603,832 691,080 2,032,299 2,723,379
Austin A.O. Omondi 0 239,094 239,094 0 0 0
National Social Security Fund 236,620 0 236,620 0 0 0
Total Fees 5,009,514 10,759,233 15,768,747 5,009,514 10,998,327 16,007,8411 Must be read together with the attendance register for purposes of the sitting allowance
The Directors’ travel is fully facilitated by the Company and therefore no travel and related expenses are incurred by the individual directors. However, in the unlikely event that this happened, the Company reimbursed the cost.
There is no formal requirement that the Directors hold shares in the Company and there is no share option scheme that applies to the non-executive directors.
The non-executive directors are not members of the Group pension scheme by virtue of sitting on the Board.
Voting on the remuneration report at the 2019 Annual General Meeting and engagement with shareholders
During the 2019 AGM, held on 18 June 2020, 100.00% of the votes cast were in favour of the Directors’ remuneration policy and report while only 1 vote was against (0.00%), 0% abstained and 0.00% of the votes were rejected.
Directors' shareholding
As at 31 December 2020, the Directors of Bamburi Cement Limited held shares in the Company as follows:
Director 2020 2019Mbuvi Ngunze 1,000 1,000Alice Owuor 467 467
On behalf of the Board,
Dr J SimbaChairman, Nomination, Remuneration & HR Committee
15 April 2021

Setting Industry Standards in Health & Safety
BAMBURI CEMENT ANNUAL REPORT & FINANCIAL STATEMENTS 202086
Domicile No. of Shareholders No. of Shares % ShareholdingForeign Institutions 22 232,608,421 64.09%Foreign Individuals 65 308,888 0.09%Local Institutions 619 110,003,172 30.31%Local Individuals 3,189 20,038,794 5.52%Total 3,895 362,959,275 100.00%
Volume No. of Shareholders No. of Shares % Shareholding1 - 500 1,638 303,624 0.08%501 – 5,000 1,425 2,844,897 0.78%5,001 – 10,000 258 1,846,429 0.51%10,001 – 100,000 421 14,343,500 3.95%100,001 – 1,000,000 137 40,477,086 11.15%Above 1,000,000 16 303,143,739 83.52%Totals 3,895 362,959,275 100.00%
Director’s Name ShareholdingMbuvi Ngunze 1,000Alice Owuor 467
Top 10 Shareholders as at 31 December 2020
Share Analysis by Domicile as at 31 December 2020
Share Analysis by Volume as at 31 December 2020
Director Shareholding as at 31 December 2020
Rank Name of Shareholder Shares %1 Fincem Holding Limited 106,360,798 29.30%
2 Kencem Holding Limited 106,360,797 29.30%
3 Standard Chartered Nominees RESD A/C KE11396 56,906,640 15.68%
4 Standard Chartered Kenya Nominees Limited A/C KE004667 10,790,425 2.97%
5 Amarjeet Baloobhai Patel & Baloobhai Chhotabhai Patel 7,026,790 1.94%
6 Standard Chartered Nominees A/C KE 11993 2,607,700 0.72%
7 ICEA Lion Life Assurance Company Limited - Pooled 1,958,215 0.54%
8 Standard Chartered Nominees Nonresident A/C 9661 1,743,200 0.48%
9 Kestrel Capital Nominees Ltd A/C 006 1,500,000 0.41%
10 NIC Custodial Services A/C 230 1,311,800 0.36%
Shares selected 296,566,365 81.71%
Others (3,885 Shareholders) 66,392,910 18.29%
Total 362,959,275 100.00%
Shareholder Profile
Mombasa Plant

Financial ReviewCorporate Information 90Report of the Directors 91Statement of Directors’ Responsibilities 92Independent Auditors’ Report 93Consolidated Statement of Profit or Loss and Other Comprehensive Income 97Company Statement of Profit or Loss and Other Comprehensive Income 98Consolidated Statement of Financial Position 99Company Statement of Financial Position 100Consolidated Statement of Changes in Equity 101Company Statement of Changes in Equity 102Consolidated Statement of Cash Flows 103Company Statement of Cash Flows 104Notes to the Financial Statements 105
Defence against Covid-19: We donated PPE Kits to protect frontline health workers in Machakos, Kajiado, Kilifi, Kwale and Mombasa counties.

2020 OVERVIEW FINANCIAL REVIEWBUSINESS OVERVIEW SUSTAINABILITY REVIEW GOVERNANCE
Setting Industry Standards in Health & Safety
BAMBURI CEMENT ANNUAL REPORT & FINANCIAL STATEMENTS 2020 BAMBURI CEMENT ANNUAL REPORT & FINANCIAL STATEMENTS 202090 91
DIRECTORS ExecutiveSeddiq Hassani (Moroccan) Group Managing DirectorGrace Oluoch (Kenyan) Group Finance DirectorJean-Michel Pons (French)
Non-executiveDr. John Simba (Kenyan) Chairman Joseph Mune Kimote (Kenyan) Resigned 27 August 2020Alice Owuor (Kenyan)Dr. Hellen Gichohi (Kenyan)Rita Kavashe (Kenyan)Pierre Deleplanque (French)Mbuvi Ngunze (Kenyan)Vasileios Karalis (Hellenic)Austin Ouko (Kenyan) Appointed 28 August 2020
SECRETARY B Kanyagia Resigned 24 July 2020W Ngea Appointed 25 July 2020Certified Public Secretary (Kenya)LR No 209/6208, Kitui RoadP.O. Box 10921 - 00100 Nairobi, Kenya
REGISTERED OFFICE LR No 209/6208, Kitui Road,P.O. Box 10921 - 00100 Nairobi, Kenya
REGISTRARS Custody & Registrars Services LimitedIKM Place, 1st Floor, Tower BFifth Ngong AvenueP. O. Box 8484 - 00100 Nairobi, Kenya
AUDITORS Deloitte &ToucheDeloitte PlaceWaiyaki Way, MuthangariP. O. Box 40092 - 00100 Nairobi, Kenya
The directors have the pleasure of presenting their annual report together with the audited financial statements of Bamburi Cement Limited (the “Company) and its subsidiaries (together the “Group”) for the year ended 31 December 2020, in accordance with Section 653 (1) of the Kenyan Companies Act, 2015 which disclose the state of financial affairs.
1. PRINCIPAL ACTIVITIES
The Group is primarily engaged in the manufacture and sale of cement and cement related products. The Group also owns and maintains a world-class nature and environmental park created from rehabilitated quarries.
2. DIVIDENDS
During the year, the directors did not recommend payment of an interim dividend. The directors however recommend the approval of a final dividend of Kes 3.00 per ordinary share amounting to Kes 1,088,877,825 (2019: Kes nil) in respect of the year ended 31 December 2020.
3. DIRECTORS
The directors who served during the year and up to the date of approval of this report are disclosed on page 1.
The following change has taken place in the Board of Directors since the last Annual General Meeting:
• Joseph Kimote resigned as a director effective 27 August 2020
• Austin A.O. Ouko was appointed as a director effective 28 August 2020.
4. AUDITORS
Deloitte & Touche, having expressed their willingness, continue in office in accordance provisions of Section 719(2) of the Kenyan Companies Act, 2015 and being eligible, offer themselves for re-election in accordance with provisions of Section 721 of the same law. The directors monitor the effectiveness, objectivity and independence of the auditor. The directors also approve the annual audit engagement contract, which sets out the terms of the auditor’s appointment and the related fees.
5. DISCLOSURE OF INFORMATION TO AUDITORS
Each director at the date of approval of this report confirms that, so far as he/she is aware:
• there is no relevant audit information of which the Group’s and Company’s auditors are unaware and
• that each director has taken all the steps that he/she ought to have taken as a director to make himself/herself aware of any relevant audit information and to establish that the Group’s and Company’s auditors are aware of that information.
By Order of the Board
W NgeaCompany Secretary
20 April 2021
Corporate Information
PRINCIPAL BANKERS Citibank N A Citibank NA UgandaCitibank House, Upper Hill Centre Court NakaseroP. O. Box 30711 - 00100 P. O. Box 7505Nairobi, Kenya Kampala, Uganda
Standard Chartered Bank Kenya Limited Standard Chartered Bank Uganda LimitedChiromo Branch, 48 Westlands Road Speke Road Branch, 5 Speke RoadP. O. Box 30003 - 00100 P. O. Box 7111Nairobi, Kenya Kampala, Uganda
Equity Bank (Kenya) Limited Stanbic BankEquity Centre, Upper Hill 17 Hannington Road, Crested Towers BuildingP.O. Box 75104 - 00200 P. O. Box 7131Nairobi, Kenya Kampala, Uganda
Report of the Directorsfor the year ended 31 December 2020
2020 OVERVIEW FINANCIAL REVIEWBUSINESS OVERVIEW SUSTAINABILITY REVIEW GOVERNANCE
Setting Industry Standards in Health & Safety
BAMBURI CEMENT ANNUAL REPORT & FINANCIAL STATEMENTS 2020 BAMBURI CEMENT ANNUAL REPORT & FINANCIAL STATEMENTS 202092 93
The Kenyan Companies Act, 2015 requires the directors to prepare financial statements for each financial year that give a true and fair view of the financial position of the Group and the company as at the end of the financial year and of their profit or loss for that year. It also requires the directors to ensure that the company and its subsidiaries maintain proper accounting records that are sufficient to show and explain the transactions of the company and its subsidiaries and disclose, with reasonable accuracy, the financial position of the Group and the company. The directors are also responsible for safeguarding the assets of the Group, and for taking reasonable steps for the prevention and detection of fraud and error.
The directors accept responsibility for the preparation and presentation of these financial statements in accordance with the International Financial Reporting Standards and in the manner required by the Kenyan Companies Act, 2015. They also accept responsibility for:
(i) designing, implementing and maintaining such internal control as they determine necessary to enable the presentation of financial statements that are free from material misstatement, whether due to fraud or error;
(ii) selecting suitable accounting policies and applying them consistently; and
(iii) making accounting estimates and judgements that are reasonable in the circumstances.
Having made an assessment of the Group’s and company’s ability to continue as going concerns, the directors are not aware of any material uncertainties related to events or conditions that may cast doubt upon the Group’s and company’s ability to continue as going concerns.
The directors acknowledge that the independent audit of the financial statements does not relieve them of their responsibilities.
Approved by the board of directors on 20 April 2021 and signed on its behalf by:
______________________ ________________________
Director Director
Report on the audit of the consolidated and company financial statements
Our opinion
We have audited the accompanying financial statements of Bamburi Cement Limited (the “Company”) and its subsidiaries (together, the “Group”) set out on pages 97 to 185 comprising the consolidated and company statements of financial position at 31 December 2020 and consolidated and company statements of profit or loss and other comprehensive income, consolidated and company statements of changes in equity and consolidated and company statements of cash flows for the year then ended, and notes to the financial statements, including a summary of significant accounting policies.
In our opinion, the consolidated and company financial statements give a true and fair view of the financial position of the Group and of the Company at 31 December 2020 and of their financial performance and cash flows for the year then ended in accordance with International Financial Reporting Standards and the requirements of the Kenyan Companies Act, 2015.
Basis for Opinion
We conducted our audit in accordance with International Standards on Auditing (ISAs). Our responsibilities under those standards are further described in the Auditor’s responsibilities for the audit of the consolidated and company financial statements section of our report.
We are independent of the Group and the Company in accordance with the International Ethics Standards Board for Accountants’ Code of Ethics for Professional Accountants (IESBA Code) together with the ethical requirements that are relevant to our audit of the consolidated and company financial statements in Kenya, and we have fulfilled our ethical responsibilities in accordance with these requirements and the IESBA Code.
We believe that the audit evidence we have obtained is sufficient and appropriate to provide a basis for our opinion.
Key Audit Matters
Key audit matters are those matters that, in our professional judgement, were of most significance in our audit of the consolidated and company financial statements of the current period. These matters were addressed in the context of our audit of the consolidated and company financial statements as a whole, and in forming our opinion thereon, and we do not provide a separate opinion on these matters.
Statement of Directors’ Responsibilities Independent Auditors’ Reportto the Members of Bamburi Cement Limited

2020 OVERVIEW FINANCIAL REVIEWBUSINESS OVERVIEW SUSTAINABILITY REVIEW GOVERNANCE
Setting Industry Standards in Health & Safety
BAMBURI CEMENT ANNUAL REPORT & FINANCIAL STATEMENTS 2020 BAMBURI CEMENT ANNUAL REPORT & FINANCIAL STATEMENTS 202094 95
Report on the audit of the consolidated and company financial statements (Continued)
Key Audit Matters (Continued)
Key audit matter How our audit addressed the key audit matter Valuation of Trade Receivables
Due to the level of judgement and estimation relating to the impairment assessment of trade receivables by directors in accordance with the requirements of IFRS 9: Financial Instruments, the valuation of trade receivables is considered to be a key audit matter.As disclosed in note 22(a) of the consolidated and company financial statements, the Group’s and Company’s trade receivables amounted to Kes 1.6 billion and Kes 0.7 billion as at 31 December 2020 respectively.
Key judgements and estimation in respect of the timing and measurement of expected credit losses (ECL) include:
• Determining the appropriate customer groupings based on credit risk characteristics and historical credit loss experience;
• Determining the period over which the observed historical loss rates are appropriate; and
• Adjusting the historical loss rates with forward looking macro-economic factors.
Refer to note 2 of the consolidated and company financial statements for critical accounting judgements and key sources of estimation uncertainty. Also refer to note 38 (ii) for details on the estimated credit loss disclosure.
To respond to the key audit matter, we performed the following procedures:
• Tested the design, implementation and operating effectiveness of key controls across the processes relevant to the ECL governance, data accuracy and completeness and individual provisions and production of journal entries and disclosures.
• Assessed the appropriateness of customer groupings by verifying the historical data and assumptions adopted as a basis for the groupings
• Assessed whether forecasted macroeconomic variables were appropriate.
• Assessed whether the period over which the observed historical loss rates was appropriate in developing the expected loss rates.
• Tested the data used in the ECL calculation for accuracy and completeness.
• Validated the completeness and appropriateness of the related disclosures through assessing the disclosure of trade receivables and expected credit loss provision in notes 2, 22(a) and 38 (ii) of the consolidated and company financial statements.
Based on the evidence obtained, we are satisfied that trade receivables ECL provisions are reasonable and in accordance with the requirements of IFRS 9. In addition, the disclosures in the financial statements in respect of trade receivables ECL provisions were found to be appropriate.
Report on the audit of the consolidated and company financial statements (Continued)
Other Information
The Directors are responsible for the other information. The other information comprises the Report of the Directors and as required by the Kenyan Companies Act, 2015, the Chairman’s statement, the Group Managing director’s statement, Corporate governance statement and the Operational review report which were obtained prior to date of this report. The other information does not include the consolidated and company financial statements, the remuneration report and our auditors’ report thereon.
Our opinion on the consolidated and company financial statements does not cover the other information and we do not express any form of assurance conclusion thereon.
In connection with our audit of the consolidated and company financial statements, our responsibility is to read the other information identified above and, in doing so, consider whether the other information is materially inconsistent with the financial statements or our knowledge obtained in the audit, or otherwise appears to be materially misstated. If, based on the work we have performed on the other information, we conclude that there is a material misstatement of this other information, we are required to report that fact. We have nothing to report in this regard.
Responsibilities of the Directors for the consolidated and company financial statements
The Directors are responsible for the preparation and fair presentation of the consolidated and company financial statements that give a true and fair view in accordance with International Financial Reporting Standards and the requirements of the Kenyan Companies Act, 2015, and for such internal control as the Directors determine are necessary to enable the preparation of consolidated and company financial statements that are free from material misstatement, whether due to fraud or error.
In preparing the consolidated and company financial statements, the directors are responsible for assessing the Group’s and the Company’s ability to continue as a going concern, disclosing, as applicable, matters related to going concern and using the going concern basis of accounting unless the Directors either intend to liquidate the Company and/or its subsidiaries or to cease their operations, or have no realistic alternative but to do so. Auditors’ responsibilities for the audit of the consolidated and company financial statements
Our objectives are to obtain reasonable assurance about whether the consolidated and company financial statements as a whole are free from material misstatement, whether due to fraud or error, and to issue an auditors’ report that includes our opinion. Reasonable assurance is a high level of assurance, but is not a guarantee that an audit conducted in accordance with ISAs will always detect a material misstatement when it exists. Misstatements can arise from fraud or error and are considered material if, individually or in the aggregate, they could reasonably be expected to influence the economic decisions of users taken on the basis of these consolidated and company financial statements.
As part of an audit in accordance with ISAs, we exercise professional judgement and maintain professional scepticism throughout the audit. We also:• Identify and assess the risks of material misstatement of the consolidated and company financial statements, whether
due to fraud or error, design and perform audit procedures responsive to those risks, and obtain audit evidence that is sufficient and appropriate to provide a basis for our opinion. The risk of not detecting a material misstatement resulting from fraud is higher than for one resulting from error, as fraud may involve collusion, forgery, intentional omissions, misrepresentations, or the override of internal control.
• Obtain an understanding of internal control relevant to the audit in order to design audit procedures that are appropriate in the circumstances, but not for the purpose of expressing an opinion on the effectiveness of the Group’s and the Company’s internal control.
• Evaluate the appropriateness of accounting policies used and the reasonableness of accounting estimates and related disclosures made by the Directors.
Independent Auditors’ Reportto the Members of Bamburi Cement Limited (Continued)
Independent Auditors’ Reportto the Members of Bamburi Cement Limited (Continued)

2020 OVERVIEW FINANCIAL REVIEWBUSINESS OVERVIEW SUSTAINABILITY REVIEW GOVERNANCE
Setting Industry Standards in Health & Safety
BAMBURI CEMENT ANNUAL REPORT & FINANCIAL STATEMENTS 2020 BAMBURI CEMENT ANNUAL REPORT & FINANCIAL STATEMENTS 202096 97
Report on the audit of the consolidated and company financial statements (Continued)
Auditors’ responsibilities for the audit of the consolidated and company financial statements (Continued)
• Evaluate the appropriateness of accounting policies used and the reasonableness of accounting estimates and related disclosures made by the Directors.
• Conclude on the appropriateness of the Directors’ use of the going concern basis of accounting and, based on the audit evidence obtained, whether a material uncertainty exists related to events or conditions that may cast significant doubt on the Group’s and the Company’s ability to continue as going concerns. If we conclude that a material uncertainty exists, we are required to draw attention in our auditors’ report to the related disclosures in the financial statements or, if such disclosures are inadequate, to modify our opinion. Our conclusions are based on the audit evidence obtained up to the date of our auditors’ report. However, future events or conditions may cause the Group and the Company to cease to continue as going concerns.
• Evaluate the overall presentation, structure and content of the consolidated and company financial statements, including the disclosures, and whether the consolidated and company financial statements represent the underlying transactions and events in a manner that achieves fair presentation.
• Obtain sufficient appropriate audit evidence regarding the financial information of the entities or business activities within the Group to express an opinion on the consolidated financial statements. We are responsible for the direction, supervision and performance of the Group audit. We remain solely responsible for our audit opinion.
We communicate with the Board Audit and Risk Committee regarding, among other matters, the planned scope and timing of the audit and significant audit findings, including any significant deficiencies in internal control that we identify during our audit.
We also provide the Board Audit and Risk Committee with a statement that we have complied with relevant ethical requirements regarding independence, and to communicate with them all relationships and other matters that may reasonably be thought to bear on our independence, and where applicable, related safeguards. From the matters communicated with the Board Audit and Risk Committee, we determine those matters that were of most significance in the audit of the consolidated and company financial statements of the current period and are therefore key audit matters. We describe these matters in our auditor’s report unless law or regulation precludes public disclosure about the matter or when, in extremely rare circumstances, we determine that a matter should not be communicated in our report because the adverse consequences of doing so would reasonably be expected to outweigh the public interest benefits of such communication.
Report on other matters prescribed by the Kenyan Companies Act, 2015
Report of the Directors
In our opinion, the information given in the report of directors’ report on page 91 is consistent with the financial statements.
Directors’ remuneration report
In our opinion, the auditable part of the directors’ remuneration report on pages 83 to 85 has been properly prepared in accordance with the Kenyan Companies Act, 2015.
Certified Public Accountants (Kenya)
Nairobi, Kenya
CPA Fred Aloo, Practising certificate No. 1537.
Signing partner responsible for the independent audit
Notes2020
Kes’million2019
Kes’millionRevenue 4 34,884 36,796Cost of goods sold 5 (26,685) (27,737)Cost of transport service 5 (3,361) (3,755)Gross profit 4,838 5,304Marketing and sales expenses 9(i) (321) (862)Administration expenses 9(ii) (1,929) (2,085)Impairment losses on financial assets 22(b) (118) (132)Impairment of other assets 9(iii) - (75)Other income 7(i) 21 24Other gains 8 323 125Other operating expenses 10 (831) (1,182)Operating profit 1,983 1,117Finance income 7(ii) 62 60Finance costs 7(iii) (269) (449)Finance costs – net (207) (389)Profit before income tax 11(a) 1,776 728Tax charge 12(a) (647) (369)Profit for the year 1,129 359Other comprehensive income/(loss) not to be reclassified to profit or loss in subsequent periods:Actuarial gains/(losses) 28 31 (20)Income tax effect 12(a) (9) 6
22 (14)-
Fair value loss on investments in equity instruments designated as at FVTOCI 19(b) (39) (17)Income tax effect - -
(39) (17)
Net other comprehensive loss not to be reclassified to profit or loss in subsequent periods (17) (31)Other comprehensive income to be reclassified to profit or loss in subsequent periods:Exchange income on translation of foreign operations 807 22Net other comprehensive income to be reclassified to profit or loss in subsequent periods 807 22OTHER COMPREHENSIVE INCOME/(LOSS) INCOME FOR THE YEAR, NET OF TAX 790 (9)TOTAL COMPREHENSIVE INCOME FOR THE YEAR 1,919 350
Profit for the year attributed to:Owners of the parent Company 1,051 633Non-controlling interest 18(b) 78 (274)
1,129 359Total comprehensive income attributed to:Owners of the parent Company 1,599 615Non-controlling interest 18(b) 320 (265)
1,919 350Earnings per share – basic and diluted 13 2.89 1.74
Independent Auditors’ Reportto the Members of Bamburi Cement Limited (Continued)
Consolidated Statement of Profit or Loss and Other Comprehensive Incomefor Year ended 31 December 2020

2020 OVERVIEW FINANCIAL REVIEWBUSINESS OVERVIEW SUSTAINABILITY REVIEW GOVERNANCE
Setting Industry Standards in Health & Safety
BAMBURI CEMENT ANNUAL REPORT & FINANCIAL STATEMENTS 2020 BAMBURI CEMENT ANNUAL REPORT & FINANCIAL STATEMENTS 202098 99
Notes2020
Kes’million2019
Kes’millionRevenue 4 20,131 21,211Cost of goods sold 5 (15,334) (15,608)Cost of transport service 5 (1,706) (1,880)Gross profit 3,091 3,723Marketing and sales expenses 9(i) (200) (349)Administration expenses 9(ii) (1,129) (1,019)Impairment losses on financial assets 22(b) (33) (48)Impairment of other assets 9(iii) - (35)Other income 7(i) 21 24Other gains 8 304 14Other operating expenses 10 (407) (836)Impairment of investment in subsidiaries 18(a) - (191)Operating profit 1,647 1,283Finance income 7(ii) 68 59Finance costs 7(iii) (43) (50)Finance income - net 25 9Profit before tax 11(a) 1,672 1,292Tax charge 12(a) (544) (284)Profit for the year 1,128 1,008Other comprehensive loss not to be reclassified to profit or loss in subsequent periods:
Fair value loss on investments in equity instrumentsdesignated as at FVTOCI 19(b) (39) (17)Income tax effect 12(a) - -
(39) (17)Actuarial gains/(losses) 28 31 (31)Income tax effect 12(a) (9) 9
22 (22)Net other comprehensive loss not to be reclassified to profit or loss in subsequent periods (17) (39)OTHER COMPREHENSIVE LOSS FOR THE YEAR, NET OF TAX (17) (39)TOTAL COMPREHENSIVE INCOME FOR THE YEAR 1,111 969
Notes2020
Kes’million2019
Kes’millionASSETSNON-CURRENT ASSETSProperty, plant and equipment 15(a) 35,159 35,003Prepaid operating lease rentals 16(a) 116 -Right of use assets 16(b) 407 588Intangible assets 17 35 139Equity investments 19(a) 124 163Biological assets 34(a) 119 335Limestone reserves 17(b) 560 521Goodwill 20 217 217
36,737 36,966CURRENT ASSETSInventories 21 4,267 5,821Biological assets 34(b) - 136Trade and other receivables 22(a) 1,630 2,515Corporate tax recoverable 12(c) 425 514Cash and cash equivalents 23(a) 6,387 3,106
12,709 12,092Assets classified as held for sale 36 - 27TOTAL ASSETS 49,446 49,085EQUITY AND LIABILITIESEQUITY Share capital 24 1,815 1,815Asset revaluation reserve 25(a) 11,422 11,664Translation reserve 25(b) (1,462) (2,027)Retained earnings 18,527 17,251Equity attributable to owners of the Company 30,302 28,703Non-controlling interests 3,749 3,429Total equity 34,051 32,132NON-CURRENT LIABILITIESDeferred tax liability 26 4,935 4,915Provisions 27 448 285Employees’ defined benefit liabilities 28 383 468Long term borrowings 33(d) 2,191 2,056Lease liabilities 35 421 448
8,378 8,172CURRENT LIABILITIESUnclaimed dividends 14(a) - 1Bank overdrafts 23(c) 136 1,772Lease liability 35 29 47Provisions 27 94 89Employees’ defined benefit liabilities 28 54 47Trade and other payables 29 6,397 6,655Corporate tax payable 12(c) 307 170
7,017 8,781TOTAL EQUITY AND LIABILITIES 49,446 49,085
The financial statements on pages 97 to 185 were approved and authorised for issue by the Board of Directors on 20 April 2021 and were signed on its behalf by:
__________________________ ___________________
Dr John P.N Simba Seddiq HassaniChairman Group Managing Director
Company Statement of Profit or Loss and Other Comprehensive Incomefor the Year ended 31 December 2020
Consolidated Statement of Financial Positionas at 31 December 2020

2020 OVERVIEW FINANCIAL REVIEWBUSINESS OVERVIEW SUSTAINABILITY REVIEW GOVERNANCE
Setting Industry Standards in Health & Safety
BAMBURI CEMENT ANNUAL REPORT & FINANCIAL STATEMENTS 2020 BAMBURI CEMENT ANNUAL REPORT & FINANCIAL STATEMENTS 2020100 101
Notes2020
Kes’million2019
Kes’millionASSETSNON-CURRENT ASSETSProperty, plant and equipment 15(b) 19,034 19,469Intangible assets 17(a) 23 85Investments in subsidiaries 18(a) 1,809 1,809Equity investments 19(a) 124 163Biological assets 34(a) 119 335
_______ _______ 21,109 21,861
CURRENT ASSETSInventories 21 2,276 3,366Biological assets 34(b) - 136Loan to subsidiary 33(c) - 25Trade and other receivables 22(a) 2,151 1,640Corporate tax recoverable 12(c) 57 57Cash and cash equivalents 23 (a) 4,323 2,289
8,807 7,513
TOTAL ASSETS 29,916 29,374EQUITY AND LIABILITIESEQUITYShare capital 24 1,815 1,815Asset revaluation reserve 25(a) 10,200 10,431Retained earnings 11,117 9,775Total equity 23,132 22,021NON-CURRENT LIABILITIESDeferred tax liability 26 2,606 2,870Provisions 27 289 253Employees’ defined benefit liabilities 28 349 411
3,244 3,534CURRENT LIABILITIESUnclaimed dividends 14(a) - 1Provisions 27 61 57Employees’ defined benefit liabilities 28 49 45Trade and other payables 29 3,122 3,716Corporate tax payable 12(c) 308 -
3,540 3,819TOTAL EQUITY AND LIABILITIES 29,916 29,374
The financial statements on pages 97 to 185 were approved and authorised for issue by the Board of Directors on 20 April 2021 and were signed on its behalf by:
__________________________ ___________________Dr John P.N Simba Seddiq HassaniChairman Group Managing Director
Share capital
Assetrevaluation
reserveTranslation
reserveRetained earnings
Owners of the Company
Non-controlling
interestsTotal
equity
Kes’million Kes’million Kes’million Kes’million Kes’million Kes’million Kes’millionNote 24 Note 25(a) Note 25(c)
At 1 January 2020 1,815 11,664 (2,027) 17,251 28,703 3,429 32,132Profit for the year - - - 1,051 1,051 78 1,129Other comprehensive income / (loss) for the year - - 565 (17) 548 242 790Total comprehensive income for the year - - 565 1,034 1,599 320 1,919Transfer of excess depreciation (net of tax) - (242) - 242 - - -
At 31 December 2020 1,815 11,422 (1,462) 18,527 30,302 3,749 34,051
The reserve accounts included in the statement of changes in equity are explained below:
• The asset revaluation reserve represents the net cumulative surplus arising from revaluations of property, plant and equipment - Note 25(a).
• Retained earnings represent accumulated profits retained by the Group after payment of dividends to the shareholders.
• The translation reserve represents the cumulative position of translation gains and losses arising from conversion of net assets of the foreign subsidiary Company to the presentation currency - note 25(c).
Consolidated Statement of Changes in Equity for the Year ended 31 December 2019
Share capital
Asset revaluation
reserveTranslation
reserveRetained earnings
Owners of the Company
Non-controlling
interests
Total
equityKes’million Kes’million Kes’million Kes’million Kes’million Kes’million Kes’million
Note 24 Note 25(a) Note 25(c)
At 1 January 2019 1,815 11,906 (2,042) 17,897 29,576 3,694 33,270Profit/(loss) for the year - - - 633 633 (274) 359Other comprehensive income/ (loss) for the year - - 15 (33) (18) 9 (9)Total comprehensive income/ (loss) for the year - - 15 600 615 (265) 350Transfer of excess depreciation (net of tax) - (242) - 242 - - -Dividends: (note 14(b))- Final dividends for 2018 declared and approved - - - (1,488) (1,488) - (1,488)
At 31 December 2019 1,815 11,664 (2,027) 17,251 28,703 3,429 32,132The reserve accounts included in the statement of changes in equity are explained below:
• The asset revaluation reserve represents the net cumulative surplus arising from revaluations of property, plant and equipment - Note 25(a).
• Retained earnings represent accumulated profits retained by the Group after payment of dividends to the shareholders.
• The translation reserve represents the cumulative position of translation gains and losses arising from conversion of net assets of the foreign subsidiary Company to the presentation currency - note 25(c).
Company Statement of Financial Positionas at 31 December 2020
Consolidated Statement of Changes in Equity for the Year ended 31 December 2020

2020 OVERVIEW FINANCIAL REVIEWBUSINESS OVERVIEW SUSTAINABILITY REVIEW GOVERNANCE
Setting Industry Standards in Health & Safety
BAMBURI CEMENT ANNUAL REPORT & FINANCIAL STATEMENTS 2020 BAMBURI CEMENT ANNUAL REPORT & FINANCIAL STATEMENTS 2020102 103
ShareCapital
Kes’million
Asset revaluation
reserveKes’million
Retainedearnings
Kes’million
Totalequity
Kes’millionNote 24 Note 25(a)
At 1 January 2020 1,815 10,431 9,775 22,021Profit for the year - - 1,128 1,128Other comprehensive loss for the year - - (17) (17)Total comprehensive income for the year - - 1,111 1,111Transfer of excess depreciation (net of tax) _____- (231) 231 -
At 31 December 2020 1,815 10,200 11,117 23,132
The reserve accounts included in the statement of changes in equity are explained below:
• The asset revaluation reserve represents the net cumulative surplus arising from revaluations of property, plant and equipment - note 25(a).
• The retained earnings represent accumulated profit retained by the Company after payment of dividends to the shareholders.
Company Statement of Changes in Equity for the Year ended 31 December 2019
Sharecapital
Kes’million
Asset revaluation
reserveKes’million
Retainedearnings
Kes’million
Totalequity
Kes’millionAt 1 January 2019 1,815 10,662 10,063 22,540Profit for the year - - 1,008 1,008Other comprehensive loss for the year - - (39) (39)Total comprehensive income for the year - - 969 969Transfer of excess depreciation (net of tax) - (231) 231 -Dividends: (note 14(b))
- Final dividends for 2018 declared and approved - - (1,488) (1,488)
At 31 December 2019 1,815 10,431 9,775 22,021
The reserve accounts included in the statement of changes in equity are explained below:
• The asset revaluation reserve represents the net cumulative surplus arising from revaluations of property, plant and equipment - note 25(a).
• The retained earnings represent accumulated profit retained by the Company after payment of dividends to the shareholders.
Note2020
Kes’million2019
Kes’million
CASH FLOWS FROM OPERATING ACTIVITIES
Cash generated from operations 32 6,860 3,659
Interest received 7(ii) 62 60
Interest paid (145) (327)
Interest on lease liabilities 35 (73) -
Tax paid 12(c) (577) (273)
Net cash generated from operating activities 6,127 3,119
CASH FLOWS FROM INVESTING ACTIVITIES
Purchase of property, plant and equipment 15(a) (1,374) (1,327)
Purchase of intangible assets 17 - (13)
Proceeds from disposal of property, plant and equipment 268 321
Net cash used in investing activities (1,106) (1,019)
CASH FLOWS FROM FINANCING ACTIVITIES
Dividends paid to shareholders 14(b) (1) (1,488)
Principal repayment of lease liabilities 35 (164) (253)
Net cash generated used in financing activities (165) (1,741)
NET INCREASE IN CASH AND CASH EQUIVALENTS 4,856 359
MOVEMENT IN CASH AND CASH EQUIVALENTS
Cash and cash equivalents at the beginning of the year 1,334 963
Net increase in cash and cash equivalents during the year 4,856 359
Effects of exchange rate changes on cash held in foreign currencies 61 12
Cash and cash equivalents and at end of the year 23(b) 6,251 1,334
Consolidated Statement of Cash Flows for the Year ended 31 December 2020
Company Statement of Changes in Equity for the year ended 31December 2020 (Continued)

2020 OVERVIEW FINANCIAL REVIEWBUSINESS OVERVIEW SUSTAINABILITY REVIEW GOVERNANCE
Setting Industry Standards in Health & Safety
BAMBURI CEMENT ANNUAL REPORT & FINANCIAL STATEMENTS 2020 BAMBURI CEMENT ANNUAL REPORT & FINANCIAL STATEMENTS 2020104 105
Note2020
Kes’million2019
Kes’million
CASH FLOWS FROM OPERATING ACTIVITIES
Cash generated from operations 32 2,994 2,641
Interest received 7(ii) 68 59
Tax paid 12(c) (509) (138)
Net cash generated from operating activities 2,553 2,562
CASH FLOWS FROM INVESTING ACTIVITIES
Purchase of property, plant and equipment 15(b) (805) (962)
Purchase of intangible assets 17 - (13)
Loans advanced 33(c) (736) -
Loans repayments 33(c) 761 29
Proceeds from disposal of property, plant and equipment 262 -
Net cash used in investing activities (518) (946)
CASH FLOWS FROM FINANCING ACTIVITIES
Dividends paid to the shareholders 14(b) (1) (1,488)
Net cash used in financing activities (1) (1,488)
NET INCREASE IN CASH AND CASH EQUIVALENTS 2,034 128
MOVEMENT IN CASH AND CASH EQUIVALENTS
Cash and cash equivalents at the beginning of the year 2,289 2,161
Net increase in cash and cash equivalents during the year 2,034 128
Cash and cash equivalents at the end of the year 23(b) 4,323 2,289
1. SUMMARY OF SIGNIFICANT ACCOUNTING POLICIES
The accounting policies adopted in the preparation of these financial statements are set out below. These policies have been consistently applied to all years presented, unless otherwise stated.
a) Basis of preparation
The consolidated and the Company financial statements have been prepared on historical cost basis of accounting except for certain items of property, plant and equipment and available–for-sale financial assets that have been measured at fair value and except where otherwise stated in the accounting policies below.
The financial statements of the Group and the Company have been prepared in accordance with International Financial Reporting Standards (IFRSs) as issued by the International Accounting Standards Board (IASB), and in the manner required by the Kenyan Companies Act, 2015. The individual financial statements of each Group entity are presented in the currency of the primary economic environment in which the entity operates (its functional currency). For the purpose of the consolidated financial statements, the results and financial position of each entity are presented in millions of Kenya Shillings (Kes’ Million), which is the functional currency of the parent Company, and the presentation currency for the consolidated financial statements.
For the purpose of reporting under the Kenyan Companies Act, 2015, the balance sheet in these financial statements is represented by statement of financial position and the profit and loss account is represented by the statement of profit or loss and other comprehensive Income.
b) Application of new and revised International Financial Reporting Standards (IFRSs)
(i) Relevant new standards and amendments to published standards effective for the year ended 31 December 2020
Impact of the initial application of Interest Rate Benchmark Reform amendments to IFRS 9 and IFRS 7.
In September 2019, the IASB issued Interest Rate Benchmark Reform (Amendments to IFRS 9, IAS 39 and IFRS 7). These amendments modify specific hedge accounting requirements to allow hedge accounting to continue for affected hedges during the period of uncertainty before the hedged items or hedging instruments affected by the current interest rate benchmarks are amended as a result of the on-going interest rate benchmark reforms.
The amendments are irrelevant to the Group in the current financial (annual) period given that it did not hold benchmark interest rate exposures with respect to hedges. Although the Group is exposed to interest rate risk because entities in the Group borrow and place funds at both fixed and floating interest rates, the risk is not managed by use of hedging activities.
The amendments also introduce new disclosure requirements to IFRS 7 for hedging relationships that are subject to the exceptions introduced by the amendments to IFRS 9. The new disclosure requirements are not applicable to the Group for the financial year just ended.
Impact of the initial application of Covid-19-Related Rent Concessions Amendment to IFRS 16
In May 2020, the IASB issued Covid-19-Related Rent Concessions (Amendment to IFRS 16) that provides practical relief to lessees in accounting for rent concessions occurring as a direct consequence of Covid-19, by introducing a practical expedient to IFRS 16. The practical expedient permits a lessee to elect not to assess whether a Covid-19-related rent concession is a lease modification. A lessee that maKes this election shall account for any change in lease payments resulting from the Covid-19-related rent concession the same way it would account for the change applying IFRS 16 if the change were not a lease modification.
Notes to the Financial Statementsfor the year ended 31 December 2020
Company Statement of Cash Flowsfor the Year ended 31 December 2020

Notes to the Financial Statements (Continued)for the year ended 31 December 2020
FINANCIAL REVIEWBUSINESS OVERVIEW SUSTAINABILITY REVIEW GOVERNANCE2020 OVERVIEW
Setting Industry Standards in Health & Safety
Notes to the Financial Statements (Continued)for the year ended 31 December 2020
BAMBURI CEMENT ANNUAL REPORT & FINANCIAL STATEMENTS 2020 BAMBURI CEMENT ANNUAL REPORT & FINANCIAL STATEMENTS 2020106 107
1. SUMMARY OF SIGNIFICANT ACCOUNTING POLICIES (Continued)
b) Application of new and revised International Financial Reporting Standards (IFRSs) (Continued)
i) Relevant new standards and amendments to published standards effective for the year ended 31 December 2020 (Continued)
The practical expedient applies only to rent concessions occurring as a direct consequence of Covid-19 and only if all of the following conditions are met:
a) The change in lease payments results in revised consideration for the lease that is substantially the same as, or less than, the consideration for the lease immediately preceding the change;
b) Any reduction in lease payments affects only payments originally due on or before 30 June 2021 (a rent concession meets this condition if it results in reduced lease payments on or before 30 June 2021 and increased lease payments that extend beyond 30 June 2021); and
c) There is no substantive change to other terms and conditions of the lease.
In the current financial year, the Group has not applied the amendment to IFRS 16 (as issued by the IASB in May 2020) in advance of its effective date – 1 June 2020.
Impact on accounting for changes in lease payments applying the exemption
The Group has not applied the amendment to IFRS 16 (as issued by the IASB in May 2020) in advance of its effective date – 1 June 2020.
The Group has not benefited from any waiver of lease payments on any of its leased assets. The Group continued to recognize interest expense on all its lease liabilities.
Impact of the initial application of other new and amended IFRS Standards that are effective for the current year
In the current year, the Group has applied the below amendments to IFRS Standards and Interpretations issued by the Board that are effective for an annual period that begins on or after 1 January 2020. Their adoption has not had any material impact on the disclosures or on the amounts reported in these financial statements.
Amendments to References to the
Conceptual framework
The Group has adopted the amendments included in Amendments to References Conceptual Framework in IFRS to the Conceptual Framework in IFRS Standards for the first time in the current Standards year. The amendments include consequential amendments to affected Standards so that they refer to the new Framework. Not all amendments, however, update those pronouncements with regard to references to and quotes from the Framework so that they refer to the revised Conceptual Framework. Some pronouncements are only updated to indicate which version of the Framework they are referencing to (the IASC Framework adopted by the IASB in 2001, the IASB Framework of 2010, or the new revised Framework of 2018) or to indicate that definitions in the Standard have not been updated with the new definitions developed in the revised Conceptual Framework.
The Standards which are amended are IFRS 2, IFRS 3, IFRS 6, IFRS 14, IAS 1, IAS8, IAS 34, IAS 37, IAS 38, IFRIC 12, IFRIC 19, IFRIC 20, IFRIC 22, and SIC-32.
1. SUMMARY OF SIGNIFICANT ACCOUNTING POLICIES (Continued)
b) Application of new and revised International Financial Reporting Standards (IFRSs) (Continued)
i) Relevant new standards and amendments to published standards effective for the year ended
31 December 2020 (Continued)
Impact of the initial application of other new and amended IFRS Standards that are effective for the current year (Continued)
Amendments to IFRS 3 Definition of a business
The Group has adopted the amendments to IFRS 3 for the first time in the current year. The amendments clarify that while businesses usually have outputs, outputs are not required for an integrated set of activities and assets to qualify as a business. To be considered a business an acquired set of activities and assets must include, at a minimum, an input and a substantive process that together significantly contribute to the ability to create outputs.
The amendments remove the assessment of whether market participants are capable of replacing any missing inputs or processes and continuing to produce outputs. The amendments also introduce additional guidance that helps to determine whether a substantive process has been acquired.
The amendments introduce an optional concentration test that permits a simplified assessment of whether an acquired set of activities and assets is not a business. Under the optional concentration test, the acquired set of activities and assets is not a business if substantially all of the fair value of the gross assets acquired is concentrated in a single identifiable asset or group of similar assets. The amendments are applied prospectively to all business combinations and asset acquisitions for which the acquisition date is on or after 1 January 2020.
Amendments to IAS 1 and IAS 8 The Group has adopted the amendments to IAS 1 and IAS 8 for the first time Definition of material in the current year. The amendments make the definition of material in IAS 1 easier to understand and are not intended to alter the underlying concept of materiality in IFRS Standards. The concept of ‘obscuring’ material information with immaterial information has been included as part of the new definition.
The threshold for materiality influencing users has been changed from ‘could influence’ to ‘could reasonably be expected to influence’. The definition of material in IAS 8 has been replaced by a reference to the definition of material in IAS 1. In addition, the IASB amended other Standards and the Conceptual Framework that contain a definition of ‘material’ or refer to the term ‘material’ to ensure consistency.

Notes to the Financial Statements (Continued)for the year ended 31 December 2020
FINANCIAL REVIEWBUSINESS OVERVIEW SUSTAINABILITY REVIEW GOVERNANCE2020 OVERVIEW
Setting Industry Standards in Health & Safety
Notes to the Financial Statements (Continued)for the year ended 31 December 2020
BAMBURI CEMENT ANNUAL REPORT & FINANCIAL STATEMENTS 2020 BAMBURI CEMENT ANNUAL REPORT & FINANCIAL STATEMENTS 2020108 109
1. SUMMARY OF SIGNIFICANT ACCOUNTING POLICIES (Continued)
b) Application of new and revised International Financial Reporting Standards (IFRSs) (Continued)
ii) New and revised IFRS Standards in issue but not yet effective for the year ended 31 December 2020
At the date of authorisation of these financial statements, the Group has not applied the following new and revised IFRS Standards that have been issued but are not yet effective:
New and amendments to Standards Effective date on annual periods beginning on or after
IFRS 17: Insurance Contracts 1 January 2023
IFRS 10 and IAS 28 (amendments): Sale or Contribution of Assets between an Investor and its Associate or Joint Venture
1 January 2023, with early application permitted.
Amendments to IAS 1: Classification of Liabilities as Current or Non-current One year deferral to1 January 2023
Amendments to IFRS 3: Reference to the Conceptual Framework
1 January 2022, with early application permitted.
Amendments to IAS 16: Property, Plant and Equipment—Proceeds before Intended Use
1 January 2022, with early application permitted.
Amendments to IAS 37: Onerous Contracts – Cost of Fulfilling a Contract
1 January 2022, with early application permitted.
Annual Improvements to IFRS Standards 2018-2020 Cycle: Amendments to IFRS 1 First-time Adoption of International Financial Reporting Standards, IFRS 9 Financial Instruments, IFRS 16 Leases, and IAS 41 Agriculture
1 January 2022, with early application permitted.
The directors do not expect that the adoption of the Standards listed above will have a material impact on the financial statements of the Group in future periods, except as noted below:
IFRS 17 Insurance Contracts
IFRS 17 establishes the principles for the recognition, measurement, presentation and disclosure of insurance contracts and supersedes IFRS 4 Insurance Contracts.
IFRS 17 outlines a general model, which is modified for insurance contracts with direct participation features, described as the variable fee approach. The general model is simplified if certain criteria are met by measuring the liability for remaining coverage using the premium allocation approach.
The general model uses current assumptions to estimate the amount, timing and uncertainty of future cash flows and it explicitly measures the cost of that uncertainty. It takes into account market interest rates and the impact of policyholders’ options and guarantees.
In June 2020, the IASB issued Amendments to IFRS 17 to address concerns and implementation challenges that were identified after IFRS 17 was published. The amendments defer the date of initial application of IFRS 17 (incorporating the amendments) to annual reporting periods beginning on or after 1 January 2023.
1. SUMMARY OF SIGNIFICANT ACCOUNTING POLICIES (Continued)
b) Application of new and revised International Financial Reporting Standards (IFRSs) (Continued)
ii) New and revised IFRS Standards in issue but not yet effective for the year ended 31 December 2020 (Continued)
IFRS 17 Insurance Contracts (Continued)
IFRS 17 must be applied retrospectively unless impracticable, in which case the modified retrospective approach or the fair value approach is applied.
For the purpose of the transition requirements, the date of initial application is the start if the annual reporting period in which the entity first applies the Standard, and the transition date is the beginning of the period immediately preceding the date of initial application.
Amendments to IFRS 10 and IAS 28 – Sale or Contribution of Assets between an Investor and its Associate or Joint Venture
The amendments to IFRS 10 and IAS 28 deal with situations where there is a sale or contribution of assets between an investor and its associate or joint venture. Specifically, the amendments state that gains or losses resulting from the loss of control of a subsidiary that does not contain a business in a transaction with an associate or a joint venture that is accounted for using the equity method, are recognised in the parent’s profit or loss only to the extent of the unrelated investors’ interests in that associate or joint venture. Similarly, gains and losses resulting from the remeasurement of investments retained in any former subsidiary (that has become an associate or a joint venture that is accounted for using the equity method) to fair value are recognised in the former parent’s profit or loss only to the extent of the unrelated investors’ interests in the new associate or joint venture.
The effective date of the amendments has yet to be set by the Board; however, earlier application of the amendments is permitted. The directors of the Company anticipate that the application of these amendments may have an impact on the Group’s consolidated financial statements in future periods should such transactions arise.
Amendments to IAS 1 – Classification of Liabilities as Current or Non-current
The amendments to IAS 1 affect only the presentation of liabilities as current or non-current in the statement of financial position and not the amount or timing of recognition of any asset, liability, income or expenses, or the information disclosed about those items.
The amendments clarify that the classification of liabilities as current or non-current is based on rights that are in existence at the end of the reporting period, specify that classification is unaffected by expectations about whether an entity will exercise its right to defer settlement of a liability, explain that rights are in existence if covenants are complied with at the end of the reporting period, and introduce a definition of ‘settlement’ to make clear that settlement refers to the transfer to the counterparty of cash, equity instruments, other assets or services.
The amendments are applied retrospectively for annual periods beginning on or after 1 January 2023, with early application permitted.
The directors of the Company anticipate that the application of these amendments may have an impact on the Group’s consolidated financial statements in future periods

Notes to the Financial Statements (Continued)for the year ended 31 December 2020
FINANCIAL REVIEWBUSINESS OVERVIEW SUSTAINABILITY REVIEW GOVERNANCE2020 OVERVIEW
Setting Industry Standards in Health & Safety
Notes to the Financial Statements (Continued)for the year ended 31 December 2020
BAMBURI CEMENT ANNUAL REPORT & FINANCIAL STATEMENTS 2020 BAMBURI CEMENT ANNUAL REPORT & FINANCIAL STATEMENTS 2020110 111
1. SUMMARY OF SIGNIFICANT ACCOUNTING POLICIES (Continued)
b) Application of new and revised International Financial Reporting Standards (IFRSs) (Continued)
ii) New and revised IFRS Standards in issue but not yet effective for the year ended 31 December 2020 (Continued)
Amendments to IFRS 3 – Reference to the Conceptual Framework
The amendments update IFRS 3 so that it refers to the 2018 Conceptual Framework instead of the 1989 Framework. They also add to IFRS 3 a requirement that, for obligations within the scope of IAS 37, an acquirer applies IAS 37 to determine whether at the acquisition date a present obligation exists as a result of past events. For a levy that would be within the scope of IFRIC 21 Levies, the acquirer applies IFRIC 21 to determine whether the obligating event that gives rise to a liability to pay the levy has occurred by the acquisition date.
Finally, the amendments add an explicit statement that an acquirer does not recognise contingent assets acquired in a business combination.
The amendments are effective for business combinations for which the date of acquisition is on or after the beginning of the first annual period beginning on or after 1 January 2022. Early application is permitted if an entity also applies all other updated references (published together with the updated Conceptual Framework) at the same time or earlier.
The Directors of the Group are currently assessing the impact of these amendments and plan to adopt the amendments on the required effective date if necessary
Amendments to IAS 16 – Property, Plant and Equipment—Proceeds before Intended Use
The amendments prohibit deducting from the cost of an item of property, plant and equipment any proceeds from selling items produced before that asset is available for use, i.e. proceeds while bringing the asset to the location and condition necessary for it to be capable of operating in the manner intended by management. Consequently, an entity recognises such sales proceeds and related costs in profit or loss. The entity measures the cost of those items in accordance with IAS 2 Inventories.
The amendments also clarify the meaning of ‘testing whether an asset is functioning properly’. IAS 16 now specifies this as assessing whether the technical and physical performance of the asset is such that it is capable of being used in the production or supply of goods or services, for rental to others, or for administrative purposes.
If not presented separately in the statement of comprehensive income, the financial statements shall disclose the amounts of proceeds and cost included in profit or loss that relate to items produced that are not an output of the entity’s ordinary activities, and which line item(s) in the statement of comprehensive income include(s) such proceeds and cost.
The amendments are applied retrospectively, but only to items of property, plant and equipment that are brought to the location and condition necessary for them to be capable of operating in the manner intended by management on or after the beginning of the earliest period presented in the financial statements in which the entity first applies the amendments.
The entity shall recognise the cumulative effect of initially applying the amendments as an adjustment to the opening balance of retained earnings (or other component of equity, as appropriate) at the beginning of that earliest period presented.
1. SUMMARY OF SIGNIFICANT ACCOUNTING POLICIES (Continued)
b) Application of new and revised International Financial Reporting Standards (IFRSs) (Continued)
ii) New and revised IFRS Standards in issue but not yet effective for the year ended 31 December 2020 (Continued)
The amendments are effective for annual periods beginning on or after 1 January 2022, with early application permitted.
The Directors of the Group are currently assessing the impact of these amendments and plan to adopt the amendments on the required effective date if necessary
Amendments to IAS 37 – Onerous Contracts—Cost of Fulfilling a Contract
The amendments specify that the ‘cost of fulfilling’ a contract comprises the ‘costs that relate directly to the contract’. Costs that relate directly to a contract consist of both the incremental costs of fulfilling that contract (examples would be direct labour or materials) and an allocation of other costs that relate directly to fulfilling contracts (an example would be the allocation of the depreciation charge for an item of property, plant and equipment used in fulfilling the contract).
The amendments apply to contracts for which the entity has not yet fulfilled all its obligations at the beginning of the annual reporting period in which the entity first applies the amendments. Comparatives are not restated. Instead, the entity shall recognize the cumulative effect of initially applying the amendments as an adjustment to the opening balance of retained earnings or other component of equity, as appropriate, at the date of initial application.
The amendments are effective for annual periods beginning on or after 1 January 2022, with early application permitted.
The Directors of the Group are currently assessing the impact of these amendments and plan to adopt the amendments on the required effective date if necessary
Annual Improvements to IFRS Standards 2018–2020
The Annual Improvements include amendments to four Standards.
IFRS 1 First-time Adoption of International Financial Reporting Standards
The amendment provides additional relief to a subsidiary which becomes a first-time adopter later than its parent in respect of accounting for cumulative translation differences. As a result of the amendment, a subsidiary that uses the exemption in IFRS 1:D16 (a) can now also elect to measure cumulative translation differences for all foreign operations at the carrying amount that would be included in the parent’s consolidated financial statements, based on the parent’s date of transition to IFRS Standards, if no adjustments were made for consolidation procedures and for the effects of the business combination in which the parent acquired the subsidiary. A similar election is available to an associate or joint venture that uses the exemption in IFRS 1:D16 (a).
The amendment is effective for annual periods beginning on or after 1 January 2022, with early application permitted.

Notes to the Financial Statements (Continued)for the year ended 31 December 2020
FINANCIAL REVIEWBUSINESS OVERVIEW SUSTAINABILITY REVIEW GOVERNANCE2020 OVERVIEW
Setting Industry Standards in Health & Safety
Notes to the Financial Statements (Continued)for the year ended 31 December 2020
BAMBURI CEMENT ANNUAL REPORT & FINANCIAL STATEMENTS 2020 BAMBURI CEMENT ANNUAL REPORT & FINANCIAL STATEMENTS 2020112 113
1. SUMMARY OF SIGNIFICANT ACCOUNTING POLICIES (Continued)
b) Application of new and revised International Financial Reporting Standards (IFRSs) (Continued)
ii) New and revised IFRS Standards in issue but not yet effective for the year ended 31 December 2020 (Continued)
IFRS 9 Financial Instruments
The amendment clarifies that in applying the ‘10 per cent’ test to assess whether to derecognise a financial liability, an entity includes only fees paid or received between the entity (the borrower) and the lender, including fees paid or received by either the entity or the lender on the other’s behalf.
The amendment is applied prospectively to modifications and exchanges that occur on or after the date the entity first applies the amendment.
The amendment is effective for annual periods beginning on or after 1 January 2022, with early application permitted.
IFRS 16 Leases
The amendment removes the illustration of the reimbursement of leasehold improvements. As the amendment to IFRS 16 only regards an illustrative example, no effective date is stated.
IAS 41 Agriculture
The amendment removes the requirement in IAS 41 for entities to exclude cash flows for taxation when measuring fair value. This aligns the fair value measurement in IAS 41 with the requirements of IFRS 13 Fair Value Measurement to use internally consistent cash flows and discount rates and enables preparers to determine whether to use pre- tax or post-tax cash flows and discount rates for the most appropriate fair value measurement.
The amendment is applied prospectively, i.e. for fair value measurements on or after the date an entity initially applies the amendment.
The amendment is effective for annual periods beginning on or after 1 January 2022, with early application permitted.
The Directors of the Group are currently assessing the impact of these amendments and plan to adopt the amendments on the required effective date if necessary
At the date of authorisation of these financial statements, the Group has not applied the following new and revised IFRS Standards that have been issued but are not yet effective:
iii) Early adoption of standards
The Group did not early-adopt any new or amended standards in 2020.
c) Basis of Consolidation
The consolidated financial statements comprise the financial statements of the Company and entities controlled by the company as at 31 December 2020. Control is achieved when the Group is exposed, or has rights, to variable returns from its involvement with the investee and has the ability to affect those returns through its power over the investee.
A list of the subsidiaries in the Group is provided in Note 18(a).
1. SUMMARY OF SIGNIFICANT ACCOUNTING POLICIES (Continued)
c) Basis of Consolidation (Continued)
Specifically, the Group controls an investee if and only if the Group has:
• Power over the investee (i.e. existing rights that give it the current ability to direct the relevant activities of the investee);
• Exposure, or rights, to variable returns from its involvement with the investee; and• The ability to use its power over the investee to affect its returns.When the Group has less than a majority of the voting or similar rights of an investee, the Group considers all relevant facts and circumstances in assessing whether it has power over an investee, including:
• The contractual arrangement with the other vote holders of the investee;• Rights arising from other contractual arrangements; and/or• The Group’s voting rights and potential voting rights.The Group re-assesses whether or not it controls an investee if facts and circumstances indicate that there are changes to one or more of the three elements of control. Consolidation of a subsidiary begins when the Group obtains control over the subsidiary and ceases when the Group loses control of the subsidiary. Assets, liabilities, income and expenses of a subsidiary acquired or disposed of during the year are included in the consolidated financial statements from the date the Group gains control until the date the Group ceases to control the subsidiary.
Profit or loss and each component of other comprehensive income are attributed to the equity holders of the parent of the Group and to the non-controlling interests, even if this results in the non-controlling interests having a deficit balance. When necessary, adjustments are made to the financial statements of subsidiaries to bring their accounting policies into line with the Group’s accounting policies.
When the proportion of the equity held by non-controlling interests changes, the Group adjusts the carrying amounts of the controlling and non-controlling interests to reflect the changes in their relative interests in the Group. The Group recognises directly in equity any difference between the amount by which the non-controlling interests are adjusted and the fair value of the consideration paid or received, and attributable to the owners of the parent.
Disclosures of non-controlling interests are included in Notes 18(b).
All intra-group assets and liabilities, equity, income, expenses and cash flows relating to transactions between members of the Group are eliminated in full on consolidation.
A change in the ownership interest of a subsidiary, without a loss of control, is accounted for as an equity transaction. If the Group loses control over a subsidiary, it:
• Derecognises the assets (including goodwill) and liabilities of the subsidiary;• Derecognises the carrying amount of any non-controlling interests;• Derecognises the cumulative translation differences recorded in equity;• Recognises the fair value of the consideration received;• Recognises the fair value of any investment retained;• Recognises any surplus or deficit in profit or loss; and• Reclassifies the parent’s share of components previously recognised in OCI to profit or loss or retained
earnings, as appropriate, as would be required if the Group had directly disposed of the related assets or liabilities.

Notes to the Financial Statements (Continued)for the year ended 31 December 2020
FINANCIAL REVIEWBUSINESS OVERVIEW SUSTAINABILITY REVIEW GOVERNANCE2020 OVERVIEW
Setting Industry Standards in Health & Safety
Notes to the Financial Statements (Continued)for the year ended 31 December 2020
BAMBURI CEMENT ANNUAL REPORT & FINANCIAL STATEMENTS 2020 BAMBURI CEMENT ANNUAL REPORT & FINANCIAL STATEMENTS 2020114 115
1. SUMMARY OF SIGNIFICANT ACCOUNTING POLICIES (Continued)
d) Business combinations and goodwill
Business combinations are accounted for using the acquisition method. The cost of an acquisition is measured as the aggregate of the consideration transferred measured at acquisition date fair value and the amount of any non-controlling interest in the acquiree. For each business combination, the Group elects whether to measure the non-controlling interest in the acquiree at fair value or at the proportionate share of the acquiree’s identifiable net assets. Acquisition-related costs are expensed as incurred and included in administrative expenses.
When the Group acquires a business, it assesses the financial assets and liabilities assumed for appropriate classification and designation in accordance with the contractual terms, economic circumstances and pertinent conditions as at the acquisition date. This includes the separation of embedded derivatives in host contracts by the acquiree.
If the business combination is achieved in stages, the previously held equity interest is remeasured at its acquisition date fair value and any resulting gain or loss is recognised in profit or loss. It is then considered in the determination of goodwill.
Any contingent consideration to be transferred by the acquirer will be recognised at fair value at the acquisition date. Contingent consideration classified as an asset or liability that is a financial instrument and within the scope of IFRS 9 Financial Instruments: Recognition and Measurement, is measured at fair value with changes in fair value recognised in profit or loss in accordance with the IFRS. If the contingent consideration is not within the scope of IFRS 9, it is measured at each reporting date and changes in fair value recognised in profit or loss. Contingent consideration that is classified as equity is not re-measured and subsequent settlement is accounted for within equity.
Goodwill is initially measured at cost, being the excess of the aggregate of the consideration transferred and the amount recognised for non-controlling interest over the net identifiable assets acquired and liabilities assumed. If the fair value of the net assets acquired is in excess of the aggregate consideration transferred, the gain is recognised in profit or loss.
After initial recognition, goodwill is measured at cost less any accumulated impairment losses. For the purpose of impairment testing, goodwill is allocated to the cash generating units expected to benefit from the synergies of the business combination. Cash generating units to which goodwill has been allocated are tested for impairment annually. If the recoverable amount of the cash generating unit is less than the carrying amount of the unit, the impairment loss is allocated to reduce the carrying amount of the goodwill allocated to the unit. An impairment loss recognised for goodwill is not reversed in a subsequent period. Where goodwill has been allocated to a cash-generating unit and part of the operation within that unit is disposed of, the goodwill associated with the disposed operation is included in the carrying amount of the operation when determining the gain or loss on disposal.
Goodwill disposed in these circumstances is measured based on the relative values of the disposed operation and the portion of the cash-generating unit retained.
e) Translation of foreign currencies
i) Transactions and balances
Transactions in foreign currencies are initially recorded by the Group’s entities at their respective functional currency spot rates at the date the transaction first qualifies for recognition.
Monetary assets and liabilities denominated in foreign currencies are translated at the functional currency spot rates of exchange at the reporting date. Differences arising on settlement or translation of monetary items are recognised in profit or loss with the exception of monetary items that are designated as part of the hedge of the Group’s net investment of a foreign operation. These are recognised in other comprehensive income until the net investment is disposed of, at which time, the cumulative amount is reclassified to profit or loss. Tax charges and credits attributable to exchange differences on those monetary items are also recorded in other comprehensive income.
1. SUMMARY OF SIGNIFICANT ACCOUNTING POLICIES (Continued)
e) Translation of foreign currencies (Continued)
i) Transactions and balances (Continued)
Non-monetary items that are measured in terms of historical cost in a foreign currency are translated using the exchange rates at the dates of the initial transactions. Non-monetary items measured at fair value in a foreign currency are translated using the exchange rates at the date when the fair value is determined. The gain or loss arising on translation of non-monetary items measured at fair value is treated in line with the recognition of gain or loss on change in fair value of the item (i.e., translation differences on items whose fair value gain or loss is recognised in other comprehensive income or profit or loss are also recognised in other comprehensive income or profit or loss, respectively).
Any goodwill arising on the acquisition of a foreign operation and any fair value adjustments to the carrying amounts of assets and liabilities arising on the acquisition are treated as assets and liabilities of the foreign operation and translated at the spot rate of exchange at the reporting date.
ii) Translation of foreign operations
The results and financial position of all the Group entities (none of which has the currency of a hyperinflationary economy) that have a functional currency different from the presentation currency are translated into the presentation currency as follows:
• assets and liabilities for each statement of financial position presented are translated into Kenya Shillings using exchange rates prevailing at the end of the reporting period;
• income and expenses for each statement of profit or loss and other comprehensive income are translated at average exchange rates (unless this average is not a reasonable approximation of the cumulative effect of the rates prevailing on the transaction dates, in which case income and expenses are translated at the dates of the transactions); and
• all resulting exchange differences are recognised under other comprehensive income and accumulated in a separate heading, translation reserve, in the consolidated statement of changes in equity.When a foreign operation is sold, the cumulative amount of the exchange differences relating to that foreign entity, recognised in other comprehensive income and accumulated on the separate component of equity, is reclassified from equity to profit or loss when the gain or loss on disposal is recognised.
f) Revenue recognition
The Group recognises revenue from the following major sources:
• Sale of cement and cement products • From transport servicesTransport revenue is the surcharge to customer by the Group and Company for arranging delivery of cement and cement products to the customer.
Revenue is measured based on the consideration to which the Group expects to be entitled in a contract with a customer and excludes amounts collected on behalf of third parties. The Group recognises revenue when it transfers control of a product or service to a customer.
Sale of cement and cement products
The Group recognizes revenue when it satisfies a performance obligation by transferring promised goods to a customer (which is when the customer obtains control of the goods). The amount of revenue recognized is the amount allocated to the satisfied performance obligation. A performance obligation is satisfied at a point in time, for promises to transfer goods to a customer.

Notes to the Financial Statements (Continued)for the year ended 31 December 2020
FINANCIAL REVIEWBUSINESS OVERVIEW SUSTAINABILITY REVIEW GOVERNANCE2020 OVERVIEW
Setting Industry Standards in Health & Safety
Notes to the Financial Statements (Continued)for the year ended 31 December 2020
BAMBURI CEMENT ANNUAL REPORT & FINANCIAL STATEMENTS 2020 BAMBURI CEMENT ANNUAL REPORT & FINANCIAL STATEMENTS 2020116 117
1. SUMMARY OF SIGNIFICANT ACCOUNTING POLICIES (continued)
f) Revenue recognition (continued)
Transport services
The Group recognizes revenue when it satisfies a performance obligation by performing a service to a customer (which is when the customer obtains the benefits of that service). The amount of revenue recognized is the amount allocated to the satisfied performance obligation. A performance obligation is satisfied at a point in time, when the customer obtains control of the service.
Revenue is shown net of value added tax (VAT), returns, rebates and discounts and after eliminating sales within the Group.
Interest income
For all financial instruments measured at amortised cost and interest bearing financial assets classified as available-for-sale, interest income is recorded using the effective interest rate (EIR). EIR is the rate that exactly discounts the estimated future cash payments or receipts over the expected life of the financial instrument or a shorter period, where appropriate, to the net carrying amount of the financial asset or liability.
Dividends
Revenue is recognised when the Group’s right to receive the payment is established, which is generally when shareholders approve the dividend.
Rental income
Rental income is recognised when the Group’s right to receive the rent payment is established. The Group has residential buildings and sublets some of them to its employees.
Rendering of services
The Group through its subsidiary Lafarge Ecosystems Limited operates a private park and charges entry fees to tourists. Income from rendering of services is recognized when the Group transfers control of a service to a customer.
Rebates
Rebates are given to the customers who meet condition set by the Group and the Company policy. All rebates are paid inform of credit notes and the customer collects cement of equivalent value. Rebates are calculated based on tons or percentage volume depending on the signed agreement.
g) Borrowing costs
Borrowing costs consist of interest and other costs that an entity incurs in connection with the borrowing of funds. Borrowing costs that are directly attributable to the acquisition, construction or production of qualifying assets, which are assets that necessarily take a substantial period of time to get ready for their intended use or sale, are capitalised as part of the cost of those assets, until such a time as the assets are substantially ready for their intended use or sale. Investment income earned on the temporary investment of specific borrowings pending their expenditure on qualifying assets is deducted from the borrowing costs eligible for capitalisation.
All other borrowing costs are recognised in profit or loss in the period in which they are incurred.
1. SUMMARY SIGNIFICANT ACCOUNTING POLICIES (continued)
h) Leases
Group as a lessee
Since January 1, 2020, the Group assesses at inception of a contract whether it contains a lease under IFRS 16 and accordingly recognizes a right-of use asset and a lease liability if it meets the definition of a lease, with the exception of short-term leases and leases of low value assets.
The lease liability is measured at commencement date at the present value of the future lease payments, discounted with the interest rate implicit in the lease or, if not readily determinable, with the lessee’s respective incremental borrowing rate. Future lease payments include in-substance fixed payments, variable lease payments depending on an index or rate and payments under termination and extension options when these are reflected in the lease term. The lease term comprises the non-cancellable lease term together with the period covered by extension options, if assessed as reasonably certain to be exercised, and termination options, if assessed as reasonably certain not to be exercised. Non-lease components in contracts are separated from lease components and accordingly accounted for in operating profit on a cost incurred basis.
The right-of-use asset is recognized at the commencement date at cost, which includes the amount of the lease liability recognized, any lease payments made at or before the commencement date of the lease, initial direct costs incurred and an estimate of costs to be incurred in dismantling and removing the underlying asset or restoring the asset to the condition agreed with the lessor. Unless the Group is reasonably certain to exercise a purchase option, the right-of-use assets are depreciated on a straight-line basis over the shorter of its estimated useful life and lease term. Right-of- use assets are subject to the impairment requirements under IAS 36 Impairments of Assets.
In the event that the tax base of a right-of-use asset is not the same as its carrying amount for IFRS purposes on initial recognition of a lease contract, the Group recognizes the deferred tax impact arising on the temporary difference between the carrying amount of the right-of-use asset and its tax base. The same treatment as above also applies to the initial recognition of the lease liability.
Payments to acquire leasehold interests in land are treated as prepaid operating lease rentals and amortised over the period of the lease. The amortisation is recognised as an operating expense in profit or loss.
Group as a lessor
Leases in which the Group does not transfer substantially all the risks and benefits of ownership of an asset are classified as operating leases. Initial direct costs incurred in negotiating an operating lease are added to the carrying amount of the leased asset and recognised over the lease term on the same basis as rental income. Contingent rents are recognised as revenue in the period in which they are earned.
Currently, the Group has leased out residential houses and land to employees and third parties. See note 7 on rental income from residential property for more details.
i) Property, plant and equipment
All property, plant and equipment are initially recorded at cost. Freehold land and buildings are subsequently shown at their revalued amounts based on valuations by external independent valuers, less accumulated depreciation and any accumulated impairment losses. Plant and machinery is revalued internally on the basis of a valuation model prescribed by engineers and consultants at the technical centre of the ultimate shareholder. The valuations are carried out once every five years.
All other property and equipment are stated at historical cost less accumulated depreciation and accumulated impairment losses, if any.

Notes to the Financial Statements (Continued)for the year ended 31 December 2020
FINANCIAL REVIEWBUSINESS OVERVIEW SUSTAINABILITY REVIEW GOVERNANCE2020 OVERVIEW
Setting Industry Standards in Health & Safety
Notes to the Financial Statements (Continued)for the year ended 31 December 2020
BAMBURI CEMENT ANNUAL REPORT & FINANCIAL STATEMENTS 2020 BAMBURI CEMENT ANNUAL REPORT & FINANCIAL STATEMENTS 2020118 119
1. SUMMARY OF SIGNIFICANT ACCOUNTING POLICIES (continued)
i) Property, plant and equipment (Continued)
A revaluation surplus is recorded in other comprehensive income and credited to the asset revaluation reserve in equity. However, to the extent that it reverses a revaluation deficit of the same asset previously recognised in profit or loss, the increase is recognised in profit and loss. A revaluation deficit is recognised in profit or loss, except to the extent that it offsets an existing surplus on the same asset recognised in the asset revaluation.
Each year the difference between depreciation based on the revalued carrying amount of an asset (the depreciation charged to profit or loss) and depreciation based on the asset’s original cost is transferred from the asset revaluation reserve to retained earnings.
Depreciation is calculated on the straight line basis to write down the cost of each item of property plant and equipment, or the revalued amount, to its residual value over its expected useful life as follows:
Land and mineral reserves Not depreciatedBuildings and Installations 20-35 yearsHeavy machines and installations 20 - 30 yearsOther machines 10 - 20 yearsFurniture, vehicles and tools 3-10 years
Further details on useful lives and residual values of property, plant and equipment are given in Note 2, to the financial statements.
Freehold land is not depreciated as it is deemed to have an indefinite useful life and is tested for impairment on an annual basis.
Where the carrying amount of an asset is greater than its estimated recoverable amount, it is written down immediately to its recoverable amount. Additional disclosures on impairment are in Notes 1(p) and 2, to the financial statements.
An item of property, plant and equipment and any significant part initially recognised is derecognised upon disposal or when no future economic benefits are expected from its use or disposal. Any gain or loss arising on derecognition through disposal or retirement of the asset (calculated as the difference between the net disposal proceeds and the carrying amount of the asset) is included in profit or loss in the year in which the asset is derecognised.
The Limestone reserve is a finite resource hence amortisation is based on quantity of limestone mined. The amortisation is a rate and this is computed as a ratio of the number of limestone units mined to the total value of limestone units available during the year. The value of limestone units during the year is a product of the ratio of limestone units mined to the total number of units available at acquisition date multiplied by the total value of units available as at that date. The amortisation rate used during the year was Kes 19.5 per tonne mined.
The residual values, useful lives and methods of depreciation of property, plant and equipment are reviewed at each financial year end and adjusted prospectively, if appropriate.
j) Intangible assets
Computer software costs are stated at cost less accumulated amortisation and any accumulated impairment losses. The costs are amortised over the expected useful lives of the software on the straight line basis. Currently, the estimated useful life is five years.
Computer software is also assessed for impairment whenever there is an indication that the intangible asset may be impaired. Additional disclosures on impairment are included in Notes 1(p) and 2, to the financial statements.
The useful lives of computer software are reviewed at least at the end of each reporting period. Changes in the expected useful lives are considered to modify the amortisation period and are treated as changes in accounting estimates. The amortisation expense on computer software is recognised in profit or loss.
An intangible asset is derecognised when no future economic benefits are expected from its use. The Group’s intangible assets are mainly computer software which is not expected to generate any disposal proceeds on de-recognition. The de-recognition of intangible assets would therefore result in a loss which is recognised in profit or loss.
1. SUMMARY OF SIGNIFICANT ACCOUNTING POLICIES (continued)
k) Inventories
Inventories are valued at the lower of cost and net realisable value.
Inventories of consumables and spare parts are stated at the lower of cost and net realisable value. The cost of consumables and spare parts is the weighted average cost less provision for obsolete and slow moving items.
All other inventories are stated at the lower of cost and net realisable value. The cost includes direct cost and appropriate overheads and is determined on the first-in first-out method.
Net realisable value of inventories is the estimated selling price of the inventories in the ordinary course of the Group’s business less the estimated costs of completion and the estimated costs necessary to make the sale.
l) Tax
Current income tax
Current income tax assets and liabilities for the current period are measured at the amount expected to be recovered from or paid to the taxation authorities. Current income tax is provided on the basis of the results for the year, as shown in the financial statements, adjusted in accordance with tax legislation. The tax rates and tax laws used to compute the amount are those that are enacted or substantively enacted, at the reporting date in the countries where the Group operates and generates taxable income.
Current income tax relating to items recognised outside profit or loss is recognised directly in other comprehensive income or equity and not in profit or loss. Management periodically evaluates positions taken in the tax returns with respect to situations in which applicable tax regulations are subject to interpretation and establishes provisions where appropriate.
Deferred tax
Deferred tax is provided, using the liability method, for all temporary differences arising between the tax bases of assets and liabilities and their carrying amounts for financial reporting purposes at the reporting date.
Deferred tax liabilities are recognised for all taxable temporary differences, except:
• When the deferred tax liability arises from the initial recognition of goodwill or an asset or liability in a transaction that is not a business combination and, at the time of the transaction, affects neither the accounting profit nor taxable profit or loss.
• In respect of taxable temporary differences associated with investments in subsidiaries, associates and interests in joint ventures, when the timing of the reversal of the temporary differences can be controlled and it is probable that the temporary differences will not reverse in the foreseeable future.
Deferred tax assets are recognised for all deductible temporary differences, the carry forward of unused tax credits and any unused tax losses. Deferred tax assets are only recognised to the extent that it is probable that future taxable profits will be available against which the temporary differences, and the carry forward of unused tax credits and unused tax losses can be utilised except:
• When the deferred tax asset relating to the deductible temporary difference arises from the initial recognition of an asset or liability in a transaction that is not a business combination and, at the time of the transaction, affects neither the accounting profit nor taxable profit or loss.
• In respect of deductible temporary differences associated with investments in subsidiaries, associates and interests in joint ventures, deferred tax assets are recognised only to the extent that it is probable that the temporary differences will reverse in the foreseeable future and taxable profit will be available against which the temporary differences can be utilised.
The carrying amount of deferred tax assets is reviewed at each reporting date and reduced to the extent that it is no longer probable that sufficient taxable profit will be available to allow all or part of the deferred tax asset to be utilised. Unrecognised deferred tax assets are reassessed at each reporting date and are recognised to the extent that it has become probable that future taxable profits will allow the deferred tax asset to be recovered.
Deferred tax assets and liabilities are measured at the tax rates that are expected to apply in the year when the asset is realised or the liability is settled, based on tax rates (and tax laws) that have been enacted or substantively enacted at the reporting date.

Notes to the Financial Statements (Continued)for the year ended 31 December 2020
FINANCIAL REVIEWBUSINESS OVERVIEW SUSTAINABILITY REVIEW GOVERNANCE2020 OVERVIEW
Setting Industry Standards in Health & Safety
Notes to the Financial Statements (Continued)for the year ended 31 December 2020
BAMBURI CEMENT ANNUAL REPORT & FINANCIAL STATEMENTS 2020 BAMBURI CEMENT ANNUAL REPORT & FINANCIAL STATEMENTS 2020120 121
1. SUMMARY OF SIGNIFICANT ACCOUNTING POLICIES (continued)
l) Tax (continued)
Deferred tax (continued)
Deferred tax relating to items recognised outside profit or loss is recognised outside profit or loss. Deferred tax items are recognised in correlation to the underlying transaction either in other comprehensive income or directly in equity.
Deferred tax assets and deferred tax liabilities are offset only when there is a legally enforceable right to set off the current tax assets against current tax liabilities and when they relate to the same entity and the same taxation authority, and the Group intends to settle the tax assets and the tax liabilities on a net basis.
m) Dividends payable
Dividends payable on ordinary shares are charged to retained earnings in the period in which they are declared. Proposed dividends are not accrued for until ratified in an Annual General Meeting.
n) Financial instruments
Financial assets and financial liabilities are recognised in the Group’s statement of financial position when the Group becomes a party to the contractual provisions of the instrument.
Financial assets and financial liabilities are initially measured at fair value. Transaction costs that are directly attributable to the acquisition or issue of financial assets and financial liabilities (other than financial assets and financial liabilities at fair value through profit or loss) are added to or deducted from the fair value of the financial assets or financial liabilities, as appropriate, on initial recognition. Transaction costs directly attributable to the acquisition of financial assets or financial liabilities at fair value through profit or loss are recognised immediately in profit or loss.
Financial assets
All regular way purchases or sales of financial assets are recognised and derecognised on a trade date basis.
Regular way purchases or sales are purchases or sales of financial assets that require delivery of assets within the time frame established by regulation or convention in the marketplace.
All recognised financial assets are measured subsequently in their entirety at either amortised cost or fair value, depending on the classification of the financial assets.
Classification of financial assets
Debt instruments that meet the following conditions are measured subsequently at amortised cost:
• the financial asset is held within a business model whose objective is to hold financial assets in order to collect contractual cash flows; and
• the contractual terms of the financial asset give rise on specified dates to cash flows that are solely payments of principal and interest on the principal amount outstanding.
Debt instruments that meet the following conditions are measured subsequently at fair value through other comprehensive income (FVTOCI):
• the financial asset is held within a business model whose objective is achieved by both collecting contractual cash flows and selling the financial assets; and
• the contractual terms of the financial asset give rise on specified dates to cash flows that are solely payments of principal and interest on the principal amount outstanding.
By default, all other financial assets are measured subsequently at fair value through profit or loss (FVTPL).
Despite the foregoing, the Group may make the following irrevocable election/designation at initial recognition of a financial asset:
• the Group may irrevocably elect to present subsequent changes in fair value of an equity investment in other comprehensive income if certain criteria are met (see (iii) below); and
• The Group may irrevocably designate a debt investment that meets the amortised cost or FVTOCI criteria as measured at FVTPL if doing so eliminates or significantly reduces an accounting mismatch (see (iv) below).
1. SUMMARY OF SIGNIFICANT ACCOUNTING POLICIES (continued)
n) Financial instruments (continued)
(i) Amortised cost and effective interest methodThe effective interest method is a method of calculating the amortised cost of a debt instrument and of allocating interest income over the relevant period.For financial assets other than purchased or originated credit impaired financial assets (i.e. assets that are credit impaired on initial recognition), the effective interest rate is the rate that exactly discounts estimated future cash receipts (including all fees and points paid or received that form an integral part of the effective interest rate, transaction costs and other premiums or discounts) excluding expected credit losses, through the expected life of the debt instrument, or, where appropriate, a shorter period, to the gross carrying amount of the debt instrument on initial recognition. For purchased or originated credit impaired financial assets, a credit adjusted effective interest rate is calculated by discounting the estimated future cash flows, including expected credit losses, to the amortised cost of the debt instrument on initial recognition.
The amortised cost of a financial asset is the amount at which the financial asset is measured at initial recognition minus the principal repayments, plus the cumulative amortisation using the effective interest method of any difference between that initial amount and the maturity amount, adjusted for any loss allowance. The gross carrying amount of a financial asset is the amortised cost of a financial asset before adjusting for any loss allowance.Interest income is recognised using the effective interest method for debt instruments measured subsequently at amortised cost and at FVTOCI. For financial assets other than purchased or originated credit impaired financial assets, interest income is calculated by applying the effective interest rate to the gross carrying amount of a financial asset, except for financial assets that have subsequently become credit impaired (see below). For financial assets that have subsequently become credit impaired, interest income is recognised by applying the effective interest rate to the amortised cost of the financial asset. If, in subsequent reporting periods, the credit risk on the credit impaired financial instrument improves so that the financial asset is no longer credit impaired, interest income is recognised by applying the effective interest rate to the gross carrying amount of the financial asset.For purchased or originated credit impaired financial assets, the Group recognises interest income by applying the credit adjusted effective interest rate to the amortised cost of the financial asset from initial recognition.The calculation does not revert to the gross basis even if the credit risk of the financial asset subsequently improves so that the financial asset is no longer credit impaired.Interest income is recognised in profit or loss and is included in the “finance income – interest income” line item.
(ii) Equity instruments designated as at FVTOCIOn initial recognition, the Group may make an irrevocable election (on an instrument by instrument basis) to designate investments in equity instruments as at FVTOCI. Designation at FVTOCI is not permitted if the equity investment is held for trading or if it is contingent consideration recognised by an acquirer in a business combination.A financial asset is held for trading if:• it has been acquired principally for the purpose of selling it in the near term; or• on initial recognition it is part of a portfolio of identified financial instruments that the Group manages
together and has evidence of a recent actual pattern of short-term profit taking; or• it is a derivative (except for a derivative that is a financial guarantee contract or a designated and
effective hedging instrument).Investments in equity instruments at FVTOCI are initially measured at fair value plus transaction costs. Subsequently, they are measured at fair value with gains and losses arising from changes in fair value recognised in other comprehensive income and accumulated in the investments revaluation reserve. The cumulative gain or loss is not be reclassified to profit or loss on disposal of the equity investments, instead, it is transferred to retained earnings.Dividends on these investments in equity instruments are recognised in profit or loss in accordance with IFRS 9, unless the dividends clearly represent a recovery of part of the cost of the investment. Dividends are included in the ‘finance income’ line item in profit or loss.The Group has designated all investments in equity instruments that are not held for trading as at FVTOCI on initial application of IFRS 9.

Notes to the Financial Statements (Continued)for the year ended 31 December 2020
FINANCIAL REVIEWBUSINESS OVERVIEW SUSTAINABILITY REVIEW GOVERNANCE2020 OVERVIEW
Setting Industry Standards in Health & Safety
Notes to the Financial Statements (Continued)for the year ended 31 December 2020
BAMBURI CEMENT ANNUAL REPORT & FINANCIAL STATEMENTS 2020 BAMBURI CEMENT ANNUAL REPORT & FINANCIAL STATEMENTS 2020122 123
1. SUMMARY OF SIGNIFICANT ACCOUNTING POLICIES (continued)
n) Financial instruments (continued)
Foreign exchange gains and losses
The carrying amount of financial assets that are denominated in a foreign currency is determined in that foreign currency and translated at the spot rate at the end of each reporting period. Specifically;
• for financial assets measured at amortised cost that are not part of a designated hedging relationship, exchange differences are recognised in profit or loss in the ‘other gains and losses’ line item;
• for equity instruments measured at FVTOCI, exchange differences are recognised in other comprehensive income in the investments revaluation reserve.
Impairment of financial assets
The Group recognises a loss allowance for expected credit losses on investments in debt instruments that are measured at amortised cost or at FVTOCI, trade and other receivables. The amount of expected credit losses is updated at each reporting date to reflect changes in credit risk since initial recognition of the respective financial instrument.
The Group always recognises lifetime ECL for trade receivables and other receivables. The expected credit losses on these financial assets are estimated using a provision matrix based on the Group’s historical credit loss experience, adjusted for factors that are specific to the debtors, general economic conditions and an assessment of both the current as well as the forecast direction of conditions at the reporting date, including time value of money where appropriate.
For all other financial instruments, the Group recognises lifetime ECL when there has been a significant increase in credit risk since initial recognition.
Lifetime ECL represents the expected credit losses that will result from all possible default events over the expected life of a financial instrument.
(i) Significant increase in credit risk
In assessing whether the credit risk on a financial instrument has increased significantly since initial recognition, the Group compares the risk of a default occurring on the financial instrument at the reporting date with the risk of a default occurring on the financial instrument at the date of initial recognition. In making this assessment, the Group considers both quantitative and qualitative information that is reasonable and supportable, including historical experience and forward looking information that is available without undue cost or effort. Forward looking information considered includes the future prospects of the industries in which the Group’s debtors operate, obtained from economic expert reports, financial analysts, governmental bodies, relevant think tanks and other similar organisations, as well as consideration of various external sources of actual and forecast economic information that relate to the Group’s core operations.
In particular, the following information is taken into account when assessing whether credit risk has increased significantly since initial recognition:
• an actual or expected significant deterioration in the financial instrument’s external (if available) or internal credit rating;
• significant deterioration in external market indicators of credit risk for a particular financial instrument, e.g. a significant increase in the credit spread, the credit default swap prices for the debtor, or the length of time or the extent to which the fair value of a financial asset has been less than its amortised cost;
• existing or forecast adverse changes in business, financial or economic conditions that are expected to cause a significant decrease in the debtor’s ability to meet its debt obligations;
• an actual or expected significant deterioration in the operating results of the debtor;• significant increases in credit risk on other financial instruments of the same debtor;• an actual or expected significant adverse change in the regulatory, economic, or technological
environment of the debtor that results in a significant decrease in the debtor’s ability to meet its debt obligations.
Irrespective of the outcome of the above assessment, the Group presumes that the credit risk on a financial asset has increased significantly since initial recognition when contractual payments are more than 30 days past due, unless the Group has reasonable and supportable information that demonstrates otherwise.
1. SUMMARY OF SIGNIFICANT ACCOUNTING POLICIES (continued
n) Financial instruments (continued)
(i) Significant increase in credit risk (Continued)
Despite the foregoing, the Group assumes that the credit risk on a financial instrument has not increased significantly since initial recognition if the financial instrument is determined to have low credit risk at the reporting date. A financial instrument is determined to have low credit risk if:
1) The financial instrument has a low risk of default,2) The debtor has a strong capacity to meet its contractual cash flow obligations in the near term, and3) Adverse changes in economic and business conditions in the longer term may, but will not necessarily,
reduce the ability of the borrower to fulfil its contractual cash flow obligations.The Group considers a financial asset to have low credit risk when the asset has external credit rating of ‘investment grade’ in accordance with the globally understood definition or if an external rating is not available, the asset has an internal rating of ‘performing’. Performing means that the counterparty has a strong financial position and there is no past due amounts.
For financial guarantee contracts, the date that the Group becomes a party to the irrevocable commitment is considered to be the date of initial recognition for the purposes of assessing the financial instrument for impairment. In assessing whether there has been a significant increase in the credit risk since initial recognition of a financial guarantee contracts, the Group considers the changes in the risk that the specified debtor will default on the contract.
The Group regularly monitors the effectiveness of the criteria used to identify whether there has been a significant increase in credit risk and revises them as appropriate to ensure that the criteria are capable of identifying significant increase in credit risk before the amount becomes past due.
(ii) Definition of default
The Group considers the following as constituting an event of default for internal credit risk management purposes as historical experience indicates that financial assets that meet either of the following criteria are generally not recoverable:
• when there is a breach of financial covenants by the debtor; or• Information developed internally or obtained from external sources indicates that the debtor is unlikely
to pay its creditors, including the Group, in full (without taking into account any collateral held by the Group).
Irrespective of the above analysis, the Group considers that default has occurred when a financial asset is more than 90 days past due unless the Group has reasonable and supportable information to demonstrate that a more lagging default criterion is more appropriate.
(iii) Credit impaired financial assets
A financial asset is credit impaired when one or more events that have a detrimental impact on the estimated future cash flows of that financial asset have occurred. Evidence that a financial asset is credit-impaired includes observable data about the following events:
1. Significant financial difficulty of the issuer or the borrower;
2. A breach of contract, such as a default or past due event (see (ii) above);
3. the lender(s) of the borrower, for economic or contractual reasons relating to the borrower’s financial difficulty, having granted to the borrower a concession(s) that the lender(s) would not otherwise consider;
4. It is becoming probable that the borrower will enter bankruptcy or other financial reorganisation; or
5. The disappearance of an active market for that financial asset because of financial difficulties.
(iv) Write-off policy
The Group writes off a financial asset when there is information indicating that the debtor is in severe financial difficulty and there is no realistic prospect of recovery, e.g. when the debtor has been placed under liquidation or has entered into bankruptcy proceedings, or in the case of trade receivables, when the amounts are over two years past due, whichever occurs sooner. Financial assets written off may still be subject to enforcement activities under the Group’s recovery procedures, taking into account legal advice where appropriate. Any recoveries made are recognised in profit or loss.

Notes to the Financial Statements (Continued)for the year ended 31 December 2020
FINANCIAL REVIEWBUSINESS OVERVIEW SUSTAINABILITY REVIEW GOVERNANCE2020 OVERVIEW
Setting Industry Standards in Health & Safety
Notes to the Financial Statements (Continued)for the year ended 31 December 2020
BAMBURI CEMENT ANNUAL REPORT & FINANCIAL STATEMENTS 2020 BAMBURI CEMENT ANNUAL REPORT & FINANCIAL STATEMENTS 2020124 125
1. SUMMARY OF SIGNIFICANT ACCOUNTING POLICIES (continued)
n) Financial instruments (continued)
(v) Measurement and recognition of expected credit losses
The measurement of expected credit losses is a function of the probability of default, loss given default (i.e. the magnitude of the loss if there is a default) and the exposure at default. The assessment of the probability of default and loss given default is based on historical data adjusted by forward-looking information as described above.
As for the exposure at default, for financial assets, this is represented by the assets’ gross carrying amount at the reporting date; for financial guarantee contracts, the exposure includes the amount drawn down as at the reporting date, together with any additional amounts expected to be drawn down in the future by default date determined based on historical trend, the Group’s understanding of the specific future financing needs of the debtors, and other relevant forward looking information.
For financial assets, the expected credit loss is estimated as the difference between all contractual cash flows that are due to the Group in accordance with the contract and all the cash flows that the Group expects to receive, discounted at the original effective interest rate. For a lease receivable, the cash flows used for determining the expected credit losses is consistent with the cash flows used in measuring the lease receivable in accordance with IAS 17 Leases.
For a financial guarantee contract, as the Group is required to make payments only in the event of a default by the debtor in accordance with the terms of the instrument that is guaranteed, the expected loss allowance is the expected payments to reimburse the holder for a credit loss that it incurs less any amounts that the Group expects to receive from the holder, the debtor or any other party.
If the Group has measured the loss allowance for a financial instrument at an amount equal to lifetime ECL in the previous reporting period, but determines at the current reporting date that the conditions for lifetime ECL are no longer met, the Group measures the loss allowance at an amount equal to 12 month ECL at the current reporting date, except for assets for which simplified approach was used.
The Group recognises an impairment gain or loss in profit or loss for all financial instruments with a corresponding adjustment to their carrying amount through a loss allowance account, except for investments in debt instruments that are measured at FVTOCI, for which the loss allowance is recognised in other comprehensive income and accumulated in the investment revaluation reserve, and does not reduce the carrying amount of the financial asset in the statement of financial position.
Derecognition of financial assets
The Group derecognises a financial asset only when the contractual rights to the cash flows from the asset expire, or when it transfers the financial asset and substantially all the risks and rewards of ownership of the asset to another entity. If the Group neither transfers nor retains substantially all the risks and rewards of ownership and continues to control the transferred asset, the Group recognises its retained interest in the asset and an associated liability for amounts it may have to pay. If the Group retains substantially all the risks and rewards of ownership of a transferred financial asset, the Group continues to recognise the financial asset and also recognises a collateralised borrowing for the proceeds received.
On derecognition of a financial asset measured at amortised cost, the difference between the asset’s carrying amount and the sum of the consideration received and receivable is recognised in profit or loss. In addition, on derecognition of an investment in a debt instrument classified as at FVTOCI, the cumulative gain or loss previously accumulated in the investments revaluation reserve is reclassified to profit or loss. In contrast, on derecognition of an investment in equity instrument which the Group has elected on initial recognition to measure at FVTOCI, the cumulative gain or loss previously accumulated in the investments revaluation reserve is not reclassified to profit or loss, but is transferred to retained earnings.
1. SUMMARY OF SIGNIFICANT ACCOUNTING POLICIES (continued)
n) Financial instruments (continued)
Financial liabilities and equity
Classification as debt or equity
Debt and equity instruments are classified as either financial liabilities or as equity in accordance with the substance of the contractual arrangements and the definitions of a financial liability and an equity instrument.
Equity instruments
An equity instrument is any contract that evidences a residual interest in the assets of an entity after deducting all of its liabilities. Equity instruments issued by the Group are recognised at the proceeds received, net of direct issue costs.
Repurchase of the Company’s own equity instruments is recognised and deducted directly in equity. No gain or loss is recognised in profit or loss on the purchase, sale, issue or cancellation of the Company’s own equity instruments.
Financial liabilities
All financial liabilities are measured subsequently at amortised cost using the effective interest method.
Financial liabilities that arise when a transfer of a financial asset does not qualify for de recognition or when the continuing involvement approach applies, and financial guarantee contracts issued by the Group, are measured in accordance with the specific accounting policies set out below.
Financial liabilities measured subsequently at amortised cost
Financial liabilities that are not (i) contingent consideration of an acquirer in a business combination, (ii) held for trading, or (iii) designated as at FVTPL, are measured subsequently at amortised cost using the effective interest method.
The effective interest method is a method of calculating the amortised cost of a financial liability and of allocating interest expense over the relevant period. The effective interest rate is the rate that exactly discounts estimated future cash payments (including all fees and points paid or received that form an integral part of the effective interest rate, transaction costs and other premiums or discounts) through the expected life of the financial liability, or (where appropriate) a shorter period, to the amortised cost of a financial liability.
o) Impairment of non-financial assets
The Group assesses, at each reporting date, whether there is an indication that an asset may be impaired. If any indication exists, or when annual impairment testing for an asset is required, the Group estimates the asset’s recoverable amount. An asset’s recoverable amount is the higher of an asset’s or cash-generating unit’s (CGU) fair value less costs of disposal and its value in use. Recoverable amount is determined for an individual asset, unless the asset does not generate cash inflows that are largely independent of those from other assets or groups of assets. When the carrying amount of an asset or CGU exceeds its recoverable amount, the asset is considered impaired and is written down to its recoverable amount.
In assessing value in use, the estimated future cash flows are discounted to their present value using a pre-tax discount rate that reflects current market assessments of the time value of money and the risks specific to the asset. In determining fair value less costs of disposal, recent market transactions are taken into account. If no such transactions can be identified, an appropriate valuation model is used. These calculations are corroborated by valuation multiples, quoted share prices for publicly traded companies or other available fair value indicators.
The Group bases its impairment calculation on detailed budgets and forecast calculations, which are prepared separately for each of the Group’s CGUs to which the individual assets are allocated. These budgets and forecast calculations generally cover a period of five years. For longer periods, a long-term growth rate is calculated and applied to project future cash flows after the fifth year.
Impairment losses of continuing operations, including impairment on inventories, are recognised in the statement of profit or loss and other comprehensive income in expense categories consistent with the function of the impaired asset, except for properties previously revalued with the revaluation taken to other comprehensive income. For such properties, the impairment is recognised in other comprehensive income up to the amount of any previous revaluation.

Notes to the Financial Statements (Continued)for the year ended 31 December 2020
FINANCIAL REVIEWBUSINESS OVERVIEW SUSTAINABILITY REVIEW GOVERNANCE2020 OVERVIEW
Setting Industry Standards in Health & Safety
Notes to the Financial Statements (Continued)for the year ended 31 December 2020
BAMBURI CEMENT ANNUAL REPORT & FINANCIAL STATEMENTS 2020 BAMBURI CEMENT ANNUAL REPORT & FINANCIAL STATEMENTS 2020126 127
1. SUMMARY OF SIGNIFICANT ACCOUNTING POLICIES (continued)
o) Impairment of non-financial assets (continued)
For assets excluding goodwill, an assessment is made at each reporting date to determine whether there is an indication that previously recognised impairment losses no longer exist or have decreased. If such indication exists, the Group estimates the asset’s or CGU’s recoverable amount. A previously recognised impairment loss is reversed only if there has been a change in the assumptions used to determine the asset’s recoverable amount since the last impairment loss was recognised. The reversal is limited so that the carrying amount of the asset does not exceed its recoverable amount, or exceed the carrying amount that would have been determined, net of depreciation or amortisation, had no impairment loss been recognised for the asset in prior years.
Such reversal is recognised in profit or loss unless the asset is carried at a revalued amount, in which case, the reversal is treated as a revaluation increase.
p) Employee entitlements
Retirement benefits obligations - defined contribution plans
The Group operates a defined contribution pension scheme for eligible employees. The scheme is administered by an independent administration Company and is funded by contributions from the Group companies and employees. These are further discussed under Note 38.
The Group also makes contributions to the statutory defined contribution schemes in the two countries where operations are based.
The Group’s obligations to the staff retirement schemes are charged to profit or loss as they fall due.
Other entitlements
Employee entitlements to long service awards and service gratuity are recognised when they accrue to employees. A provision is made for the estimated liability for long-service awards as a result of services rendered by employees up to the reporting date. These are further discussed under Note 1 (r) – service gratuities, long service awards and leave pay.
Employee entitlements to annual leave are recognised when they expected to be paid to employees. A provision is made for the estimated liability for annual leave at the reporting date. These are further discussed under Note 1 (r) – service gratuities, long service awards and leave pay.
Bonus
An accrual is recognised for the amount expected to be paid under short-term cash bonus if the Group has a present legal or constructive obligation to pay this amount as a result of past service provided by the employee, the obligation can be estimated reliably and it is probable that an outflow of resources embodying economic benefits will be required to settle the obligation.
q) Provisions
Site restoration and other environmental provisions
The Group provides for the costs of restoring a site where a legal or constructive obligation exists. The estimated future costs for known restoration requirements are determined on a site-by-site basis and are calculated based on the present value of estimated future costs. The Group rehabilitates the quarried sites on an annual basis, as and when the quarried sites are disused. Hence no cost of raising a provision before exploitation of the raw materials has commenced is included in property, plant and equipment. The effect of any adjustments to the provision due to further environmental damage as a result of exploitation activities is recorded through operating costs over the life of the site, in order to reflect the best estimate of the expenditure required to settle the obligation at the end of the reporting period.
Other provisions
A provision is recognized when a legal or constructive obligation arising from past events exists, it is probable that an outflow of resources embodying economic benefits will be required to settle the obligation and a reliable estimate can be made of this amount.
Contingent liabilities. Contingent liabilities arise from past events whose existence will be confirmed only by the occurrence or non-occurrence of one or more uncertain future events not wholly within the control of the Group. They are accordingly disclosed in the notes to the financial statements.
1. SUMMARY OF SIGNIFICANT ACCOUNTING POLICIES (continued)
q) Provisions (continued)
Contingencies, guarantees, commitments and contingent assets
The Group is exposed to varying degrees of uncertainty related to tax matters and regulatory reviews and audits. The Group accounts for its income taxes on the basis of its own internal analyses, supported by external advice, if appropriate. The Group continually monitors its tax position, and whenever uncertainties arise, the Group assesses the potential consequences and either accrues the liability or discloses a contingent liability in its financial statements, depending on the strength of the Group’s position and the resulting risk of loss.
r) Service gratuities, long service award, leave pay and termination benefits
The Group provides service gratuity to unionisable staff that retire on attaining the age of 55 years or are declared redundant. These are provided to eligible employees based on each employee’s length of service with the Group, as provided for in the collective bargaining agreement. The Group also provides for long service award to staff based on the length of service.
The cost of providing service gratuity and long service awards which are considered as defined benefit plan is determined by a professional actuary using the projected unit credit method.
Re-measurements, comprising of actuarial gains and losses are recognised immediately in the statement of financial position with a corresponding debit or credit to retained earnings through other comprehensive income in the period in which they occur. Re-measurements are not reclassified to profit or loss in subsequent periods.
Net interest is calculated by applying the discount rate to the net defined benefit liability or asset.
The Group recognises the following changes in the net defined benefit in profit or loss as:
• Service costs comprising current service costs are recognised in profit or loss under cost of sales; and• Net interest expense or income is recognised in profit or loss under cost of sales.
Employee entitlements to annual leave are recognised when they expected to be paid to employees. A provision is made for the estimated liability for annual leave at the reporting date. Service gratuity, long service awards and leave pay provisions are disclosed in Note 27, to the financial statements.
The Group recognises a liability and expense for termination benefits at the earlier of the following dates:
(a) when the Group can no longer withdraw the offer of those benefits; and (b) when the Group recognises costs for a restructuring that is within the scope of IAS 37 and involves the
payment of termination benefits.
s) Cash and short-term deposits
Cash and short-term deposits in the statement of financial position comprise cash at banks and on hand and short-term deposits with a maturity of three months or less.
For the purpose of the statement of cash flows, cash and cash equivalents consist of cash and short-term deposits, as defined above.
t) Segment reporting.
Performance of business Segments is reported in line with Lafargeholcim management reporting guidelines and is reviewed by the Executive Committee. The executive Committee makes strategic decisions and is responsible for allocating resources and assessing performance of the operating segments (see note 3).

Notes to the Financial Statements (Continued)for the year ended 31 December 2020
FINANCIAL REVIEWBUSINESS OVERVIEW SUSTAINABILITY REVIEW GOVERNANCE2020 OVERVIEW
Setting Industry Standards in Health & Safety
Notes to the Financial Statements (Continued)for the year ended 31 December 2020
BAMBURI CEMENT ANNUAL REPORT & FINANCIAL STATEMENTS 2020 BAMBURI CEMENT ANNUAL REPORT & FINANCIAL STATEMENTS 2020128 129
1. SUMMARY OF SIGNIFICANT ACCOUNTING POLICIES (continued)
u) Fair value measurement
The Group measures financial instruments such as available-for-sale at fair value at each reporting date. The Group also measures certain items of property, plant and equipment at fair value. Also, fair values of financial instruments measured at amortised cost are disclosed in Note 37(b), to the financial statements.
Fair value is the price that would be received to sell an asset or paid to transfer a liability in an orderly transaction between market participants at the measurement date. The fair value measurement is based on the presumption that the transaction to sell the asset or transfer the liability takes place either:
• In the principal market for the asset or liability, or• In the absence of a principal market, in the most advantageous market for the asset or liability
The principal or the most advantageous market must be accessible to by the Group.
The fair value of an asset or a liability is measured using the assumptions that market participants would use when pricing the asset or liability, assuming that market participants act in their economic best interest.
A fair value measurement of a non-financial asset takes into account a market participant’s ability to generate economic benefits by using the asset in its highest and best use or by selling it to another market participant that would use the asset in its highest and best use.
The Group uses valuation techniques that are appropriate in the circumstances and for which sufficient data are available to measure fair value, maximising the use of relevant observable inputs and minimising the use of unobservable inputs.
All assets and liabilities for which fair value is measured or disclosed in the financial statements are categorised within the fair value hierarchy, described as follows, based on the lowest level input that is significant to the fair value measurement as a whole:
• Level 1 - Quoted (unadjusted) market prices in active markets for identical assets or liabilities• Level 2 - Valuation techniques for which the lowest level input that is significant to the fair value measurement
is directly or indirectly observable; and• Level 3 - Valuation techniques for which the lowest level input that is significant to the fair value measurement
is unobservable
For assets and liabilities that are recognised in the financial statements on a recurring basis, the Group determines whether transfers have occurred between Levels in the hierarchy by re-assessing categorisation (based on the lowest level input that is significant to the fair value measurement as a whole) at the end of each reporting period.
External valuers are involved for valuation of significant assets, such as freehold land and buildings. Involvement of external valuers is decided upon annually by the finance director after discussions with and approval by the Group’s audit committee. Selection criteria include market knowledge, reputation, independence and whether professional standards are maintained.
For the purpose of fair value disclosures, the Group has determined classes of assets and liabilities on the basis of the nature, characteristics and risks of the asset or liability and the level of the fair value hierarchy as explained above.
v) Biological assets
Biological assets comprise of eucalyptus, Casuarina, Cassi siamea and Neem plantations.
Eucalyptus Casuarina, Cassi siamea and Neem plantations are measured on initial recognition and at each reporting date at fair value less costs to sell. Any gains or losses arising on initial recognition of biological assets and from subsequent changes in fair value less costs to sell are recognised in the statement of comprehensive income in the year in which they arise. Additions and replanting of biological assets include cost of planting and upkeep until they mature. Subsequently all costs of upkeep and maintenance of mature biological assets are recognised in the income statement in the period in which they are incurred.
w) Comparatives
Where necessary comparatives have been adjusted to conform with changes in presentation in the current year.
1. SUMMARY OF SIGNIFICANT ACCOUNTING POLICIES (continued)
x) Non-current assets held for sale
Non-current assets (and disposal groups) classified as held for sale are measured at the lower of carrying amount and fair value less costs to sell.
Non-current assets and disposal groups are classified as held for sale if their carrying amount will be recovered through a sale transaction rather than through continuing use. This condition is regarded as met only when the sale is highly probable and the asset (or disposal group) is available for immediate sale in its present condition.
Management must be committed to the sale which should be expected to qualify for recognition as a completed sale within one year from the date of classification.
When the Group is committed to a sale plan involving loss of control of a subsidiary, all of the assets and liabilities of that subsidiary are classified as held for sale when the criteria described above are met, regardless of whether the Group will retain a non-controlling interest in its former subsidiary after the sale.
When the Group is committed to a sale plan involving disposal of an investment in an associate or, a portion of an investment in an associate, the investment, or the portion of the investment in the associate, that will be disposed of is classified as held for sale when the criteria described above are met.
The Group then ceases to apply the equity method in relation to the portion that is classified as held for sale. Any retained portion of an investment in an associate that has not been classified as held for sale continues to be accounted for using the equity method.
2. CRITICAL ACCOUNTING JUDGEMENTS AND KEY SOURCES OF ESTIMATION UNCERTAINTY
In applying the Group’s accounting policies, which are described in note 1(d), the directors are required to make judgements (other than those involving estimations) that have a significant impact on the amounts recognised and to make estimates and assumptions about the carrying amounts of assets and liabilities that are not readily apparent from other sources. The estimates and associated assumptions are based on historical experience and other factors that are considered to be relevant. Actual results may differ from these estimates.
The estimates and underlying assumptions are reviewed on an ongoing basis. Revisions to accounting estimates are recognised in the period in which the estimate is revised if the revision affects only that period, or in the period of the revision and future periods if the revision affects both current and future periods.
Critical judgements in applying the Group’s accounting policies
There are no critical judgements, apart from those involving estimations (which are presented separately below), that the directors have made in the process of applying the Group’s accounting policies and that have the most significant effect on the amounts recognised in financial statements
Key sources of estimation uncertainty
The key assumptions concerning the future, and other key sources of estimation uncertainty at the reporting period that may have a significant risk of causing a material adjustment to the carrying amounts of assets and liabilities within the next financial year, are discussed below.
Taxation provisions
Judgement is required in determining the provision for income taxes due to the complexity of legislation. There are many transactions and calculations for which ultimate tax determination is uncertain during the ordinary course of business. The Group recognises liabilities for anticipated tax audit issues based on estimates of whether additional taxes will be due. Where the final tax outcome of these matters is different from the amounts that were initially recorded, such differences will impact the income tax and deferred tax provisions in the period in which such determination is made.
The Group recognises the net future tax benefit that relates to deferred income tax assets to the extent that it is probable that the deductible temporary differences will reverse in the foreseeable future. Assessing the recoverability of deferred income tax assets requires the Group to make significant estimates related to expectations of future taxable income. Estimates of future taxable income are based on forecast cash flows from operations and the application of existing tax laws. To the extent that future cash flows and taxable income differ significantly from estimates, the ability of the Group to realise the net deferred tax assets recorded at the reporting date could be impacted.

Notes to the Financial Statements (Continued)for the year ended 31 December 2020
FINANCIAL REVIEWBUSINESS OVERVIEW SUSTAINABILITY REVIEW GOVERNANCE2020 OVERVIEW
Setting Industry Standards in Health & Safety
Notes to the Financial Statements (Continued)for the year ended 31 December 2020
BAMBURI CEMENT ANNUAL REPORT & FINANCIAL STATEMENTS 2020 BAMBURI CEMENT ANNUAL REPORT & FINANCIAL STATEMENTS 2020130 131
2. CRITICAL ACCOUNTING JUDGEMENTS AND KEY SOURCES OF ESTIMATION UNCERTAINTY (Continued)
Key sources of estimation uncertainty (continued)
Taxation provisions (continued)
Further details on income taxes are disclosed in Notes 12, 26 and 30 (d), to the financial statements.
Inventories provisioning and inventories count
Management makes provisions for spares that exceed the set maximum level based on the usage of the inventory by comparing items in stock with the recent past consumption. The maximum level is determined by taking into consideration the lead time, the specified order quantity, the source of the spares and the projected usage rate.
The inventories counts for raw materials – bulk materials including clinker, gypsum, bauxite, pozzolana and bulk cement, are carried out through a survey by an independent surveyor. This surveying process requires judgement and estimation.
Further details on inventories are given in Note 21, to the financial statements.
Revaluation of certain classes of property, plant and equipment
The Group carries certain classes of property, plant and equipment at fair value, with changes in fair value being recognised in other comprehensive income. The Group’s land, buildings, plant, and machinery were last revalued on 1 December 2018. Land and buildings were valued on the basis of open market value by independent valuers, Knight Frank Valuers Limited.
Plant and machinery were revalued on a depreciated replacement cost basis using a valuation model prescribed by engineers and consultants at the technical centre of the ultimate shareholder.
Further details on property, plant and equipment are given in Note 15, to the financial statements.
Fair value of financial instruments
When the fair value of financial assets and financial liabilities recorded in the statement of financial position cannot be derived from active markets, their fair value is determined using valuation techniques including the discounted cash flow model. The inputs to these models are taken from observable markets where possible, but where this is not feasible, a degree of judgement is required in establishing fair values. The judgements include considerations of inputs such as liquidity risk, credit risk and volatility. Changes in assumptions about these factors could affect the reported fair value of financial instruments. See Note 37, to the financial statements, for further discussion.
Site restoration
The Group makes full provision for the future cost of rehabilitating its quarry sites and related production facilities on a discounted basis at the time of developing the quarries and installing and using those facilities. On an annual basis, management, with the assistance of technical staff, makes estimations on the adequacy of the site restoration provisions. The provisions are made based on the additional open space, net of rehabilitated areas, arising from quarrying operations that took place in the year. The estimated cost per hectare is then applied to determine this adequacy. The cost per hectare is periodically assessed to factor in inflation.
Site restoration provisions are disclosed in Note 27, to the financial statements.
Post-employment benefits
The cost and the present value of the obligation of the service gratuity, long service awards and other post-employment benefits are determined using actuarial valuations by an independent actuarial valuer. An actuarial valuation involves making various assumptions that may differ from actual developments in the future. These include the determination of the discount rate, future salary increases, mortality rates and future pension increases. Due to the complexities involved in the valuation and its long-term nature, a defined benefit obligation is highly sensitive to changes in these assumptions. All assumptions are reviewed at each reporting date.
In determining the appropriate discount rate, the actuary considers the interest rates of the government bond market. The actuary also considers the mean terms of the yield of the bond and the liabilities. The mortality rate is based on publicly available mortality tables for the specific countries. Future salary increases and pension increases are based on expected future inflation rates for the respective countries.
Further details about service gratuity, long service awards and other post-employment benefits are given in Note 28, to the financial statements.
2. CRITICAL ACCOUNTING JUDGEMENTS AND KEY SOURCES OF ESTIMATION UNCERTAINTY (Continued)
Key sources of estimation uncertainty (continued)
Impairment losses for non-financial assets
At each reporting date, the Group reviews the carrying amounts of its tangible and intangible assets to determine whether there is any indication that those assets have suffered an impairment loss. If any such indication exists, the recoverable amount of the asset is estimated in order to determine the extent of the impairment loss. Impairment exists when the carrying amount of an asset or cash generating unit exceeds its recoverable amount, which is the higher of its fair value less costs of disposal and its value in use. The fair value less costs of disposal calculation is based on available data from binding sales transactions, conducted at arm’s length, for similar assets or observable market prices less incremental costs for disposing of the asset. The value in use calculation is based on a discounted cash flow model. The cash flows are derived from the budget for the next five years and do not include restructuring activities that the Group is not yet committed to or significant future investments that will enhance the asset’s performance of the CGU being tested. The recoverable amount is most sensitive to the discount rate used for the discounted cash flow model as well as the expected future cash-inflows and the growth rate used for extrapolation purposes. In assessing whether there is any indication that the tangible and intangible assets may be impaired, the Group considers the following indications:a) there are observable indications that the asset’s value has declined during the period significantly more than would
be expected as a result of the passage of time or normal use.b) significant changes with an adverse effect on the entity have taken place during the period, or will take place in
the near future, in the technological, market, economic or legal environment in which the entity operates or in the market to which an asset is dedicated.
c) market interest rates or other market rates of return on investments have increased during the period, and those increases are likely to affect the discount rate used in calculating an asset’s value in use and decrease the asset’s recoverable amount materially.
d) the carrying amount of the net assets of the entity is more than its market capitalisation.e) evidence is available of obsolescence or physical damage of an asset.f) significant changes with an adverse effect on the entity have taken place during the period, or are expected to take
place in the near future, in the extent to which, or manner in which, an asset is used or is expected to be used. These changes include the asset becoming idle, plans to discontinue or restructure the operation to which an asset belongs, plans to dispose of an asset before the previously expected date, and reassessing the useful life of an asset as finite rather than indefinite.
g) evidence is available from internal reporting that indicates that the economic performance of an asset is, or will be, worse than expected.
Further details on property, plant and equipment are given in Note 15, to the financial statements and intangible assets in Note 17, to the financial statements.
Determining whether goodwill is impaired requires an estimation of the value in use of the cash-generating units to which goodwill has been allocated. Dividends received are the cash flows from the CGU. The Company estimates the dividend expected yearly from each CGU and discounts these using estimated discount rates. In assessing whether there is any indication that the Goodwill is impaired, the Group considers that any observable indications that the CGU’s dividends have declined significantly during the period more than would be expected in normal operations of the CGU.For available-for-sale financial assets, the Group assess at each reporting date whether there is objective evidence that an investment or a group of investments is impaired. In the case of equity investments classified as available–for-sale financial assets, objective evidence would include a significant or prolonged decline in the fair value of the investment below its cost. The determination of what is ‘significant’ or ‘prolonged’ requires judgement. The Group treats ‘significant’ generally as 20% and ‘prolonged’ generally as greater than six months. In making this judgement, the Group evaluates, among other factors, the duration or extent to which the fair value of an investment is less than its cost. Further disclosures on this class of assets are done in Note 19, to the financial statements.Useful lives and residual values of property, plant and equipment
The Group reviews the estimated useful lives and residual values of property, plant and equipment at the end of each reporting period. In reviewing the useful lives of property, plant and equipment, the Group considers the remaining period over which an asset is expected to be available for use by the Group. Management also looks at the number of production or similar units expected to be obtained from the property, plant and equipment. Judgment and assumptions are required in estimating the remaining useful period and estimates of the number of production or similar units expected to be obtained from the property, plant and equipment.
During the financial year, no changes to the useful lives were identified by the Directors. Further details on property, plant and equipment are given in Note 15, to the financial statements.

Notes to the Financial Statements (Continued)for the year ended 31 December 2020
FINANCIAL REVIEWBUSINESS OVERVIEW SUSTAINABILITY REVIEW GOVERNANCE2020 OVERVIEW
Setting Industry Standards in Health & Safety
Notes to the Financial Statements (Continued)for the year ended 31 December 2020
BAMBURI CEMENT ANNUAL REPORT & FINANCIAL STATEMENTS 2020 BAMBURI CEMENT ANNUAL REPORT & FINANCIAL STATEMENTS 2020132 133
2. CRITICAL ACCOUNTING JUDGEMENTS AND KEY SOURCES OF ESTIMATION UNCERTAINTY (Continued)
Key sources of estimation uncertainty (Continued)
Contingent liabilities
As disclosed in Note 30 to the financial statements, the Group is exposed to various contingent liabilities in the normal course of business including a number of legal cases. The Directors evaluate the status of these exposures on a regular basis to assess the probability of the Group incurring related liabilities. However, provisions are only made in the financial statements where, based on the Directors’ evaluation, a present obligation has been established. Judgement and assumptions are required in:
• assessing the existence of a present obligation (legal or constructive) as a result of a past event;• assessing the probability that an outflow of resources embodying economic benefits will be required to settle the
obligation; and• Estimating the amount of the obligation to be paid out.
Impairment of financial assets
The Group recognises a loss allowance for expected credit losses on investments in debt instruments that are measured at amortised cost or at FVTOCI, lease receivables, trade receivables and contract assets, as well as on financial guarantee contracts. The amount of expected credit losses is updated at each reporting date to reflect changes in credit risk since initial recognition of the respective financial instrument.
The Group always recognises lifetime ECL for trade receivables, contract assets and lease receivables. The expected credit losses on these financial assets are estimated using a provision matrix based on the Group’s historical credit loss experience, adjusted for factors that are specific to the debtors, general economic conditions and an assessment of both the current as well as the forecast direction of conditions at the reporting date, including time value of money where appropriate.
For all other financial instruments, the Group recognises lifetime ECL when there has been a significant increase in credit risk since initial recognition. However, if the credit risk on the financial instrument has not increased significantly since initial recognition, the Group measures the loss allowance for that financial instrument at an amount equal to 12 month ECL.
Lifetime ECL represents the expected credit losses that will result from all possible default events over the expected life of a financial instrument. In contrast, 12 month ECL represents the portion of lifetime ECL that is expected to result from default events on a financial instrument that are possible within 12 months after the reporting date.
Lease liability
In order to make a judgement to determine the term of the lease and the corresponding lease liability, the directors consider any options regarding extension or termination of the lease contract which may be available and whether it is probable that such options will be exercised.
Unless there is an implicit interest rate contained in the lease contract, the discount rate used to calculate the net present value of the lease liability is the group’s incremental borrowing rate. This rate is estimated by the directors to be the rate which would be paid by the group to purchase a similar asset.
3. SEGMENT INFORMATION
In accordance with IFRS 8, Operating Segments, the information presented hereafter by operating segment is the same as that reported to the Chief Operating Decision Maker (the Group Managing Director) for the purposes of making decisions about allocating resources to the segment and assessing its performance.
The Group analyses its organisational structure and internal reporting system for the purpose of identifying suitable segment reporting format for the Group. The Group is organised on a regional basis into two main geographical segments: Kenya and Uganda.
Both geographical segments are mainly involved in the manufacture and sale of cement which comprises over 95% of the business activities of the Group. The remaining business activities, which include manufacture and sale of ready mix concrete, precast products and rehabilitation of quarries that are used as source of raw materials for cement production, are not deemed significant for separate segment reporting. There are no segments that are aggregated.
Revenue, assets and liabilities of the segment are measured in a manner consistent with that of the financial statements. The transactions are carried at arm’s length sales between the segments are made at prices that approximate market prices.
Group management internally evaluates its performance based upon:• Operating income before capital gains, impairment and restructuring; and• Capital employed (defined as the total of goodwill, intangible and tangible assets and working capital).
Year ended 31 December 2020 - All figures in millions of Kenya Shillings
Kenya UgandaAdjustments
and eliminations Consolidated
Revenue
External customers 20,670 14,214 - 34,884
Inter-segment (Geographical) 29 - (29) -
Total revenue 20,699 14,214 (29) 34,884
Cost of sales (17,728) (12,347) 29 (30,046)
Gross profit 2,971 1,867 - 4,838
Gross profit margin 14% 13% - 14%
Other income 21 - - 21
Finance income 67 13 (18) 62
Finance costs (61) (226) 18 (269)
Profit before tax 1,338 438 - 1,776
Income tax expense (470) (177) - (647)
Profit for the year 868 261 - 1,129
Segment assets 29,945 20,394 (893) 49,446
Segment liabilities 6,869 8,709 (197) 15,381
Depreciation and amortisation 1,362 1,258 - 2,620

Notes to the Financial Statements (Continued)for the year ended 31 December 2020
FINANCIAL REVIEWBUSINESS OVERVIEW SUSTAINABILITY REVIEW GOVERNANCE2020 OVERVIEW
Setting Industry Standards in Health & Safety
Notes to the Financial Statements (Continued)for the year ended 31 December 2020
BAMBURI CEMENT ANNUAL REPORT & FINANCIAL STATEMENTS 2020 BAMBURI CEMENT ANNUAL REPORT & FINANCIAL STATEMENTS 2020134 135
3. SEGMENT INFORMATION (continued)
Year ended 31 December 2019 - All figures in millions of Kenya Shillings
Kenya UgandaAdjustments
and eliminations Consolidated
Revenue
External customers 22,218 14,578 - 36,796
Inter-segment (Geographical) 72 - (72) -
Total revenue 22,290 14,578 (72) 36,796
Cost of sales (18,397) (13,167) 72 (31,492)
Gross profit 3,893 1,411 - 5,304
Gross profit margin 17% 10% - 14%
Other income 24 - - 24
Finance income 54 6 - 60
Finance costs 69 380 - 449
Profit/(loss) before tax 1,590 (862) - 728
Income tax expense (318) (51) - (369)
Profit/(loss) for the year 1,272 (913) - 359
Segment assets 29,874 20,096 (958) 49,012
Segment liabilities 7,646 9,279 (45) 16,880
Depreciation and amortisation 1,415 1,253 - 2,668
Impairment of Property, Plant and Equipment (including limestone reserves) 35 40 - 75
Total assets are shown by the geographical area in which the assets are located. Segment assets consist primarily of property, plant and equipment, intangible assets, inventories, receivables and operating cash and cash equivalents. Segment liabilities comprise trade and other payables, dividends payable and certain corporate borrowings. This figure excludes investment in subsidiaries.
The adjustments and eliminations relate to intercompany transactions and balances (Note 33). The adjustments and eliminations are effected while consolidating the financial information for the Group.
Information about major customers:
Included in the Group’s revenues of Kes 34,844 million (2019: Kes 36,756 million) are approximately Kes 29 million (2019: Kes 73 million) which arose from sales to the Group’s largest customer arising from the Kenyan segment.
4. REVENUE
Kenya Uganda Consolidated
GROUP2020
Kes’million2019
Kes’million2020
Kes’million2019
Kes’million2020
Kes’million2019
Kes’millionCement (Note 6) 19,076 19,529 14,012 14,139 33,088 33,668Precast products 356 648 - - 356 648Ready mix 419 903 - - 419 903Other* 61 93 - - 61 93Transport services 758 1,045 202 439 960 1,484Net sales 20,670 22,218 14,214 14,578 34,884 36,796
*The other revenue includes mainly service delivery income from tourism activities earned by Lafarge Eco Systems Limited, a subsidiary of Bamburi Cement Limited.
COMPANY2020
Kes’million2019
Kes’millionCement (Note 6) 19,414 20,253Transport services 717 958Net sales 20,131 21,211
5. COST OF SALESGROUP COMPANY
2020Kes’million
2019Kes’million
2020Kes’million
2019Kes’million
Distribution costsCost of transport services 3,361 3,755 1,706 1,880Packaging materials 1,270 1,463 660 683Diesel 110 106 1 2Depreciation of right-of-use assets 61 51 - -Other distribution expenses 881 875 642 658Total distribution cost 5,683 6,250 3,009 3,223Production cost of goods soldElimination of cost of sales-intra-group (416) (750) - -Cost of finished goods purchased 3,715 4,431 1,456 1,674Third party raw materials costs 5,145 5,998 2,116 2,459Production materials 629 787 345 306Energy 2,777 2,855 1,557 1,910Electricity 3,258 3,466 2,334 2,536Staff costs (Note 11(b)) 2,046 2,265 1,260 1,311Other production expenses 2,556 2,385 2,206 1,945Maintenance expenses 1,300 1,653 657 856Changes in inventory 1,024 (121) 879 182Depreciation 2,265 2,181 1,219 1,084Depreciation of right-of-use assets 53 80 - -Amortisation 11 12 2 2Total production cost of goods sold 24,363 25,242 14,031 14,265Cost of sales 30,046 31,492 17,040 17,488Cost of goods sold 26,685 27,737 15,334 15,608Transport service costs 3,361 3,755 1,706 1,880Cost of sales 30,046 31,492 17,040 17,488

Notes to the Financial Statements (Continued)for the year ended 31 December 2020
FINANCIAL REVIEWBUSINESS OVERVIEW SUSTAINABILITY REVIEW GOVERNANCE2020 OVERVIEW
Setting Industry Standards in Health & Safety
Notes to the Financial Statements (Continued)for the year ended 31 December 2020
BAMBURI CEMENT ANNUAL REPORT & FINANCIAL STATEMENTS 2020 BAMBURI CEMENT ANNUAL REPORT & FINANCIAL STATEMENTS 2020136 137
6. REBATES
The Group and the Company offer rebates to the customers who meet the terms and conditions based on the existing rebates policies. The cement revenues are presented net of rebates. During the year the rebates offered by the Group and the Company were as follows:
GROUP COMPANY
2020Kes’million
2019Kes’million
2020Kes’million
2019Kes’million
Rebates 1,163 1,218 550 630
7. OTHER INCOME AND FINANCE INCOME/COSTS
i) Other income
Rental income 21 24 21 24
Total other income 21 24 21 24
ii) Finance income
Interest income - cash deposits with local banks 60 60 47 55
Interest income - Related parties 2 - 21 4
Total finance income 62 60 68 59
iii) Finance costs
Interest payable on borrowings 145 327 - -
Interest on lease liabilities 73 63 - -
Interest cost on employee benefit liabilities 51 59 43 50
Total finance costs 269 449 43 50
8. OTHER GAINS AND LOSSES
Gain on disposal of assets 260 196 255 -
Foreign exchange losses (116) (649) (85) -
Foreign exchange gains 179 578 134 14
63 (71) 49 14___________ __________ _________ _________
Total other gains and losses 323 125 304 14
9 OPERATING EXPENSES
(i) Marketing and sales expensesMarketing and sales expenses comprise mainly third party services with respect to advertising; route to market expenses; builders academy training costs; promotional; and customers loyalty program expenses. The total amount incurred during the year for the Group was Kes 321 million (2019: Kes 862 million) and for the Company Kes 200 million (2019: Kes 349 million). Included in the marketing and sales expenses is Kes 39 million (2019:79 million) for depreciation of right-of-use assets for the Group.
(ii) Administration expensesGROUP COMPANY
2020Kes’million
2019Kes’million
2020Kes’million
2019Kes’million
Staff costs (note 11(b)) 933 965 589 549Third party services 474 322 307 188Other administration expenses 312 514 139 93Bank charges 19 19 13 10Depreciation 57 146 21 105Depreciation of right-of-use assets 29 11 - -Amortisation of intangible assets 105 108 60 74Total administration expenses 1,929 2,085 1,129 1,019
(iii) Impairment of other assets
Property, plant & equipment (note 15(a)) - 71 - 35Limestone reserves (Note 17(b)) - 4 - -
- 75 - 35
10 OTHER OPERATING EXPENSES
Technical fees (Note 33 (a)) 831 1,182 407 836
11. (a) PROFIT BEFORE TAX
Profit before tax is arrived at after charging
Staff costs (note 11(b)) 2,979 3,230 1,849 1,860
Depreciation on property, plant and equipment (note 11(c)) 2,322 2,327 1,240 1,189
Amortisation of intangible assets (note 17) 107 120 62 76
Amortisation of prepaid lease rentals (note 16(a)) 9 - - -
Depreciation on right-of use-of asset (note 16(b)) 182 221 - -
Directors’ fees (note 33) 16 16 16 16
Auditors’ remuneration 17 16 8 9
And after crediting:
Interest income (note 7) 62 60 68 59
Gain on disposal of plant and equipment (note 8) 260 196 255 -
Net foreign exchange gains/(losses) (note 8) 63 (71) 49 14

Notes to the Financial Statements (Continued)for the year ended 31 December 2020
FINANCIAL REVIEWBUSINESS OVERVIEW SUSTAINABILITY REVIEW GOVERNANCE2020 OVERVIEW
Setting Industry Standards in Health & Safety
Notes to the Financial Statements (Continued)for the year ended 31 December 2020
BAMBURI CEMENT ANNUAL REPORT & FINANCIAL STATEMENTS 2020 BAMBURI CEMENT ANNUAL REPORT & FINANCIAL STATEMENTS 2020138 139
11 (b) STAFF COSTS
GROUP COMPANY2020
Kes’million2019
Kes’million2020
Kes’million2019
Kes’million
Salaries and wages 1,531 1,728 967 1,022
Retirement benefits costs 249 266 129 134
Staff welfare costs 1,199 1,236 753 704
2,979 3,230 1,849 1,860
Presented as:
Cost of sales (note 5) 2,046 2,265 1,260 1,311
Administration expenses (note 9) 933 965 589 549
2,979 3,230 1,849 1,860
(c) DEPRECIATION AND AMORTIZATION
Depreciation on property, plant and equipment, amortisation of intangible assets and depreciation of right-of-use assets is presented as follows:
GROUP COMPANY2020
Kes’million2019
Kes’million2020
Kes’million2019
Kes’million
Depreciation
Cost of production (Note 5) 2,265 2,181 1,219 1,084
Administration expenses (Note 9(ii)) 57 146 21 105
2,322 2,327 1,240 1,189
Amortization
Cost of production (Note 5) 11 12 2 2
Administration expenses (Note 9(ii)) 105 108 60 74
116 120 62 76
Depreciation of right-of-use assets
Cost of production (Note 5) 114 131 - -
Marketing and sales expenses (Note 9(i)) 39 79 -
Administration expenses (Note 9(ii)) 29 11 - -
182 221 - -
12 TAX
GROUP COMPANY2020
Kes’million2019
Kes’million2020
Kes’million2019
Kes’million(a) Tax charge
Current tax based on the adjusted profit at 25% 810 125 804 25Income taxation - previous years 13 - 13 -
823 125 817 25Deferred tax (credit) / charge at 30% (Note 26):
-current year (181) 244 (289) 259-prior years 5 - 16 -
(176) 244 (273) 259Tax charge 647 369 544 284
Other comprehensive income charge / (credit)
Income tax effect of actuarial gains/losses (Note 28) 9 (6) 9 (9)
(b) Reconciliation of expected tax based on accounting profit to tax charge:Profit before tax 1,776 728 1,672 1,292Tax calculated at the domestic rates applicable* 466 218 418 388Tax effect of expenses not deductible for tax purposes 178 354 112 99Tax effect of reduction in tax rate * (15) - (15) -Power rebate - (203) - (203)Under provision of deferred tax in prior years 5 - 16 -Income tax prior years 13 - 13 -
_____ _____ ______ ______Tax charge 647 369 544 284
* The tax rate in Kenya for the year ended 31 December 2020 was 25% (2019: 30%). The tax rate in Uganda

Notes to the Financial Statements (Continued)for the year ended 31 December 2020
FINANCIAL REVIEWBUSINESS OVERVIEW SUSTAINABILITY REVIEW GOVERNANCE2020 OVERVIEW
Setting Industry Standards in Health & Safety
Notes to the Financial Statements (Continued)for the year ended 31 December 2020
BAMBURI CEMENT ANNUAL REPORT & FINANCIAL STATEMENTS 2020 BAMBURI CEMENT ANNUAL REPORT & FINANCIAL STATEMENTS 2020140 141
was 30% (2019: 30%).
12. TAX (Continued)
GROUP COMPANY2020
Kes’million2019
Kes’million2020
Kes’million2019
Kes’million
(c) Corporate tax (recoverable)/ payable
At the beginning of the year (344) (196) (57) 56
Tax charge -Current 810 125 804 25
-Prior years 13 - 13 -
Tax paid (567) (237) (500) (130)
Withholding tax paid (10) (36) (9) (8)
Translation gain (20) - - -
At end of the year (118) (344) 251 (57)
Comprising:*
Tax payable 307 170 308 -
Tax recoverable (425) (514) (57) (57)
* Prior year tax overpayment of Kes 57 million has not been utilised to offset against the tax liability for the year on the basis that the same is not reflected in ITax as an advance payment. KRA has indicated that taxpayers will need to apply for a tax refund for such tax overpayments. Management is in discussion with the Company’s Tax Consultants on the alternative that the Company may adopt to recover the tax overpayment.
13. EARNINGS PER SHARE
Basic and diluted earnings per share is calculated by dividing the net profit attributable to the ordinary equity holders by the weighted average number of ordinary shares in issue during the year, as shown below.
There were no potentially dilutive shares as at 31 December 2020 and as at 31 December 2019.
GROUP2020
Kes’million2019
Kes’million
Profit for the year attributable to owners of the parent Company (Kes million) 1,051 633
Weighted average number of ordinary shares (million) 363 363
Basic and diluted earnings per share (Kes) 2.89 1.74
14. DIVIDENDS
GROUP AND COMPANY2020
Kes’million2019
Kes’million
(a) Unclaimed dividends
At beginning of year 1 1
Declared and approved during the year - [Note 14 (b)] - 1,488
Dividends claimed/paid in the year (1) (1,488)
(b) Dividends declared/approved during the year 2020 and 2019:
Final dividends for previous year - 1,488
Interim dividends for current year - -
- 1,488
(c) Dividends declared/proposed in respect of the year
Interim dividend - paid in the year - -
Proposed for approval at the annual general meeting(not recognised as a liability as at 31 December) 1,089 -
1,089 -
Dividends per share (based on 363 million shares) 3 -
During the year, the Directors did not recommend payment of an interim dividend.
Withholding tax payment of dividends is subject to withholding tax at a rate of 10% for non-resident shareholders of the Company and 5% for resident shareholders. For resident owners of the Company, withholding tax is only deductible where the shareholding is below 12.5%.

Notes to the Financial Statements (Continued)for the year ended 31 December 2020
FINANCIAL REVIEWBUSINESS OVERVIEW SUSTAINABILITY REVIEW GOVERNANCE2020 OVERVIEW
Setting Industry Standards in Health & Safety
Notes to the Financial Statements (Continued)for the year ended 31 December 2020
BAMBURI CEMENT ANNUAL REPORT & FINANCIAL STATEMENTS 2020 BAMBURI CEMENT ANNUAL REPORT & FINANCIAL STATEMENTS 2020142 143
15. PROPERTY, PLANT AND EQUIPMENT
a) GROUPYear ended 31 December 2020
Freehold land and
residential Plant and Office
equipment Capital work-in-buildings machinery and tools progress * Total
Kes’million Kes’million Kes’million Kes’million Kes’millionCost or valuation
At 1 January 2020 13,517 47,806 2,223 1,748 65,294Transfers from capital work in progress* 149 1,132 46 (1,327) -Additions 60 279 26 1,009 1,374Assets previously classified as held for sale (Note 36) - 32 3 - 35Disposals (1) - (14) - (15)Translation difference** 248 1,383 31 58 1,720
At 31 December 2020 13,973 50,632 2,315 1,488 68,408
Depreciation
At 1 January 2020 2,263 26,220 1,808 - 30,291Charge for the year 301 1,934 87 - 2,322Assets previously classified as held for sale (Note 36) - 7 1 - 8Elimination of depreciation on disposal (1) - (14) - (15)Translation difference ** 98 526 19 - 643
At 31 December 2020 2,661 28,687 1,901 - 33,249
NET BOOK VALUE (see Fair Value level in Note 40) 11,312 21,945 414 1,488 35,159
* Capital work-in-progress represents costs incurred on ongoing work in respect of additions and replacements to various plants at year-end. Capital work-in-progress is not depreciated until the plants are completed and brought into use
** The foreign exchange adjustments arise from the translation of the carrying amounts of assets held by a subsidiary, Himcem Holdings Limited into the Group’s reporting currency.
15. PROPERTY, PLANT AND EQUIPMENT
a) GROUPYear ended 31 December 2019
Freehold land and
residential Plant and Office
equipment Capital work-in-buildings machinery and tools progress *** Total
Kes’million Kes’million Kes’million Kes’million Kes’millionCost or valuation
At 1 January 2019 13,036 47,490 2,123 1,665 64,314Transfers from capital work in progress 604 456 79 (1,140) (1)Additions 1 23 78 1,225 1,327Assets classified as held for sale (Note 36) - (32) (3) - (35)Disposals (125) - (45) - (170)Assets written off* - (140) (7) (3) (150)Translation difference** 1 9 (2) 1 9
At 31 December 2019 13,517 47,806 2,223 1,748 65,294
Depreciation
At 1 January 2019 1,951 24,372 1,736 - 28,059Charge for the year 310 1,926 91 - 2,327Assets classified as held for sale (Note 36) - (7) (1) - (8)Elimination of depreciation on disposal - - (15) - (15)Eliminated on write offs* - (77) (2) - (79)Translation difference ** 2 6 (1) - 7
At 31 December 2019 2,263 26,220 1,808 - 30,291
NET BOOK VALUE (see Fair Value level in Note 40) 11,254 21,586 415 1,748 35,003
* During the year, management carried out a review of the working condition of the Group’s plant and machinery, office equipment and tools. This review resulted in the write off of assets, whose cost was Kes 150 million and had a carrying value of Kes 71 million.
** The translation adjustments arise from the translation of the carrying amounts of assets held by a subsidiary, Himcem Holdings Limited.
*** Capital work-in-progress represents costs incurred on ongoing work in respect of additions and replacements to various plants at year-end. Capital work-in-progress is not depreciated until the plants are completed and brought into use.

Notes to the Financial Statements (Continued)for the year ended 31 December 2020
FINANCIAL REVIEWBUSINESS OVERVIEW SUSTAINABILITY REVIEW GOVERNANCE2020 OVERVIEW
Setting Industry Standards in Health & Safety
Notes to the Financial Statements (Continued)for the year ended 31 December 2020
BAMBURI CEMENT ANNUAL REPORT & FINANCIAL STATEMENTS 2020 BAMBURI CEMENT ANNUAL REPORT & FINANCIAL STATEMENTS 2020144 145
15. PROPERTY, PLANT AND EQUIPMENT (continued)
b) COMPANY
Year ended 31 December 2020
Freehold land and
residentialBuildings
Plant and
machinery
Officeequipment
and tools
Capital- work-in- progress Total
Kes’million Kes’million Kes’million Kes’million Kes’million
Cost or valuation
As at 1 January 2020 9,338 29,468 1,559 1,008 41,373
Disposal (1) - - - (1)
Transfers from capital WIP 95 874 19 (988) -
Additions 57 191 2 555 805
At 31 December 2020 9,489 30,533 1,580 575 42,177
Depreciation
As at 1 January 2020 1,031 19,516 1,357 - 21,904
Eliminated on disposal (1) - - - (1)
Charge for the year 76 1,123 41 - 1,240
At 31 December 2020 1,106 20,639 1,398 - 23,143
Net carrying amount (see Fair Value level in Note 40)
At 31 December 2020 8,383 9,894 182 575 19,034
Year ended 31 December 2019
Cost or valuation
As at 1 January 2019 9,018 29,187 1,510 733 40,448
Assets written off* - (30) (7) - (37)
Transfers from capital WIP 320 311 56 (687) -
Additions - - - 962 962
At 31 December 2019 9,338 29,468 1,559 1,008 41,373
Depreciation
As at 1 January 2019 964 18,440 1,313 - 20,717
Eliminated on write off* - - (2) - (2)
Charge for the year 67 1,076 46 - 1,189
At 31 December 2019 1,031 19,516 1,357 - 21,904
Net carrying amount (see Fair Value level in Note 40)
At 31 December 2019 8,307 9,952 202 1,008 19,469
* These assets (NBV Kes 35 million) were written off following a fixed assets verification exercise during the year.
15. PROPERTY, PLANT AND EQUIPMENT (continued)
c) OTHER DISCLOSURES
If the re-valued property, plant and equipment were stated on the historical cost basis, the amounts would be as follows:
GROUP COMPANY2020
Kes’million2019
Kes’million2020
Kes’million2019
Kes’millionCOSTLand 1,483 1,371 638 533Buildings and installations 6,184 6,085 2,307 2,502Machines 29,753 28,342 13,015 12,307Translation Gain 1,461 - - -TOTAL 38,881 35,798 15,960 15,342
ACCUMULATED DEPRECIATIONLand (1) (1) (1) (1)Buildings and installations (2,101) (1,802) (676) (704)Machines (14,315) (13,126) (7,731) (7,380)Translation loss (516) - - -
TOTAL (16,933) (14,929) (8,408) (8,085)
Net carrying amount 21,948 20,869 7,552 7,257
The Group’s and the Company’s land, buildings, plant, and machinery were last re-valued on 1 December 2018 (Hima Cement Limited on 1 December 2019). Land and residential buildings were valued on the basis of open market value by independent valuers, Knight Frank Valuers Limited.
Plant and machinery were re-valued on a depreciated replacement cost basis using a valuation model prescribed by engineers and consultants at the technical centre of the ultimate shareholder.
Freehold land and residential buildings at cost include land with a carrying amount of Kes 528 million (2019: Kes 528 million) located in Mombasa and Athi River.
d) IMPACT OF THE ENACTMENT OF THE LAND REGISTRATION ACT NO. 3 2012 ON THE COMPANY’S LAND HOLDING STATUS
The current Kenyan Constitution, enacted on 27 August 2010, introduced significant changes in the rules for landholding by non-citizens. The Constitution no longer allows foreigners and foreign bodies to own freehold land and leasehold land in excess of 99 years. Freehold land and leasehold land of more than 99 years tenure owned by foreigners and foreign bodies automatically becomes 99 year leases upon enactment of the required legislation under Articles 65(4) of the constitution. These changes in the landholding rules took effect on 2 May 2012 upon the enactment of the Land Registration Act No. 3 of 2012.
As per the definition of Articles 65(3) of the constitution, the Company is a non-citizen and hence the status of its freehold land changes to 99 years lease.
The Company is waiting for the National Land Commission to issue guidelines that will operationalise the provisions of the constitution and the revised land laws. The Company will continue to reassess the impact of the revised land laws to the financial statements as the guidelines are issued.

Notes to the Financial Statements (Continued)for the year ended 31 December 2020
FINANCIAL REVIEWBUSINESS OVERVIEW SUSTAINABILITY REVIEW GOVERNANCE2020 OVERVIEW
Setting Industry Standards in Health & Safety
Notes to the Financial Statements (Continued)for the year ended 31 December 2020
BAMBURI CEMENT ANNUAL REPORT & FINANCIAL STATEMENTS 2020 BAMBURI CEMENT ANNUAL REPORT & FINANCIAL STATEMENTS 2020146 147
16 (a) PREPAID OPERATING LEASE RENTALS
GROUP COMPANY2020
Kes’million2019
Kes’million2020
Kes’million2019
Kes’million
Cost
At 1 January - 194 - 3
Transfer from(to) Right-of-use Asset (Note 16(b)) 191 (194) - (3)
Foreign exchange adjustments* 15 - - -
At 31 December 206 - - -
Amortisation
At 1 January - 70 - 3
Transfer from(to) Right-of-use Asset (Note 16(b)) 75 (70) - (3)
Foreign exchange adjustments* 6 - - -
Charge for the year 9 - - -
At 31 December 90 - - -
Net carrying amount 116 - - -
The operating lease rentals relate to leasehold land, mainly raw materials quarries, located in Mombasa and Athi River in Kenya and Kasese in Uganda.
16. b) RIGHT OF USE ASSETS- GROUP
Land BuildingsMachinery &
equipmentFurniture & equipment
Motor vehicles Total
Kes’million Kes’million Kes’million Kes’million Kes’million Kes’millionYear ended 31 December 2020COSTAs at 1 January 2020 191 117 13 54 501 876Transfer to prepaid operating lease note 16(a)) (191) - - - - (191)Additions - 24 - 11 114 149Eliminations on disposal - (37) - - (55) (92)Translation differences - 8 1 1 39 49As 31 December 2020 - 112 14 66 599 791DEPRECIATIONAs at 1 January 2020 75 44 13 30 126 288Transfer to prepaid operating lease (note 16(a)) (75) - - - - (75)Charge for the year - 28 - 22 132 182Eliminations on disposal - (16) - - (13) (29)Translation differences - 4 1 - 13 18As 31 December 2020 - 60 14 52 258 384NET CARRYING VALUEAt 31 December 2020 - 52 - 14 341 407Year ended 31 December 2019COSTAt 1 January 2019 - - - - - -Adjustment on adoption of IFRS 16 - 117 13 54 501 685Transfer from prepaid operating lease (note 16(a)) 194 - - - - 194Foreign exchange adjustments (3) - - - - (3)As 31 December 2019 191 117 13 54 501 876DEPRECIATIONAt 1 January 2019 - - - - - -Transfer from prepaid operating lease (note 16(a)) 70 - - - - 70Foreign exchange adjustments (3) - - - - (3)Charge for the year 8 44 13 30 126 221As 31 December 2019 75 44 13 30 126 288NET CARRYING VALUEAt 31 December 2019 116 73 - 24 375 588
*The foreign exchange adjustments arise from the translation of the carrying amounts of assets held by a subsidiary, Himcem Holdings Limited into the reporting currency.

Notes to the Financial Statements (Continued)for the year ended 31 December 2020
FINANCIAL REVIEWBUSINESS OVERVIEW SUSTAINABILITY REVIEW GOVERNANCE2020 OVERVIEW
Setting Industry Standards in Health & Safety
Notes to the Financial Statements (Continued)for the year ended 31 December 2020
BAMBURI CEMENT ANNUAL REPORT & FINANCIAL STATEMENTS 2020 BAMBURI CEMENT ANNUAL REPORT & FINANCIAL STATEMENTS 2020148 149
17 (a) INTANGIBLE ASSETS – COMPUTER SOFTWARE
GROUP COMPANYCost 2020
Kes’million2019
Kes’million2020
Kes’million2019
Kes’millionAt 1 January 786 772 609 596Additions - 13 - 13Transfer from WIP - 1 - -Foreign exchange adjustments* 13 - - -
At 31 December 799 786 609 609
AmortisationAt 1 January 647 527 524 448Charge for the year 107 120 62 76Foreign exchange adjustments* 10 - - -
At 31 December 764 647 586 524
Net carrying amount 35 139 23 85
(b) LIMESTONE RESERVES
CostAt 1 January 670 673 - -Foreign exchange adjustments* 51 1 - -Impairment - (4) - -At 31 December 721 670 - -
Amortisation
At 1 January 149 148 - -Charge for the year 1 1 - -Foreign exchange adjustments* 11 - - -At 31 December 161 149 - -
Net carrying amount 560 521 - -*The foreign exchange adjustments arise from the translation of the carrying amounts of assets held by a subsidiary, Himcem Holdings Limited into the Group’s reporting currency.
18. INVESTMENTS IN SUBSIDIARIES
a) Information about subsidiaries
The consolidated financial statements of the Group include investment in subsidiaries as below.
These investments are unquoted and held at cost less accumulated impairment loss.
Principal place of business Holding 2020 2019
% Kes’million Kes’millionBamburi Special Products Limited Kenya 100 20 20Bamburi Cement Limited, Uganda* Uganda 100 - -Himcem Holdings Limited Channel Islands 100 911 911Lafarge Eco Systems Limited Kenya 100 130 130Less: Provision for impairment loss in value of investment in Lafarge Eco Systems Limited Kenya (91) (91)Diani Estate Limited Kenya 100 839 839Binastore Limited Kenya 100 100 100Less: Provision for impairment loss in value of investment in Binastore Limited Kenya (100) (100)Kenya Cement Marketing Limited* Kenya 50 - -Portland Mines Limited* Kenya 50 - -
1,809 1,809
Except where indicated above, the subsidiaries are incorporated in Kenya. Himcem Holdings Limited has a 70% holding in its subsidiary, Hima Cement Limited, a Company incorporated in Uganda.
* The amount of investments for Kenya Cement Marketing Limited, Bamburi Cement Limited - Uganda and Portland Mines Limited is below Kes 1,000,000.
Movement in the diminution of investments 2020 2019
Kes’million Kes’million
At beginning of year 1,809 2,000
Charge to profit or loss- Impairment - (191)
At end of year 1,809 1,809
In the year 2019, management reviewed the cost of investment versus the net assets of Lafarge Eco Systems Limited and Binastore Limited and this led to write down of the cost of investment to the subsidiary’s net asset value.
Both entities are not separate cash generating units from the parent company, Lafarge Eco Systems Limited was set up to undertake quarry rehabilitation on behalf of the parent while Binastore Limited’s principal activity is to promote the distribution of parent company’s products. The parent company finances the operations of the two entities.

Notes to the Financial Statements (Continued)for the year ended 31 December 2020
FINANCIAL REVIEWBUSINESS OVERVIEW SUSTAINABILITY REVIEW GOVERNANCE2020 OVERVIEW
Setting Industry Standards in Health & Safety
Notes to the Financial Statements (Continued)for the year ended 31 December 2020
BAMBURI CEMENT ANNUAL REPORT & FINANCIAL STATEMENTS 2020 BAMBURI CEMENT ANNUAL REPORT & FINANCIAL STATEMENTS 2020150 151
18. INVESTMENTS IN SUBSIDIARIES (continued)
b) Material partly-owned subsidiary
Financial information of subsidiary that has material non-controlling interests is provided below:
Proportion of equity interest held by non-controlling interests:
Name Country of incorporation and operation 2020 2019
Hima Cement Limited Uganda 30% 30%
2020Kes’million
2019Kes’million
Accumulated balances of material non-controlling interest 3,749 3,429
Profit/(loss) for the year allocated to material non-controlling interest 78 (274)
Other comprehensive income 242 9
Total comprehensive income/(loss) allocated to material non-controlling interest 320 (265)
The summarised financial information of the subsidiary is provided below. This information is based on amounts before inter-company eliminations.
Summarised statement of financial position as at 31 December 2020
Kes’million2019
Kes’million
Non-current assets 16,038 15,528
Property, plant and equipment and other non-current assets
Current assets 4,356 4,075
Inventories and cash and bank balances and other current assets
Current liabilities (3,471) (4,528)
Trade and other payables and other current liabilities
Non-current liabilities (5,238) (4,578)
Total equity and reserves 11,685 10,497
8,179 7,074
Equity holders of parent 3,506 3,423
Non-controlling interest
11,685 10,497
Summarised cash flow information for year ending 31 December
Operating cash inflows 3,243 477
Investing cash outflows (529) (261)
Financing cash outflows (136) (132)
Net increase in cash and cash equivalents 2,578 84
19. EQUITY INVESTMENTS – FVTOCI
These represent investments in Equity instruments designated as at FVTOCI which are carried at fair value.
a) Movement in the equity investments
GROUP AND COMPANY
The East African Portland Cement Plc2020
Kes’million2019
Kes’million
At 1 January 163 180
Fair value loss (Note 19(b)) (39) (17)
At 31 December 124 163
Total equity investment as at 31 December (Note 40) 124 163
b) Analysis of the equity investments
Number of shares Valuation
Quoted investments
At 1.1.2020units
Additions/(disposals)
units
At 31.12.2020
units
At 1.1.2020
Kes’ million
Additions/(disposals)
Kes’ Million
Increase/(decrease) in market
valueKes’ million
At 31.12.2020Kes’ million
The East African Portland Cement Plc 11,265,068 - 11,265,068 163 - (39) 124
Number of shares Valuation
Quoted investments
At 1.1.2019units
Additions/(disposals)
units
At 31.12.2019
units
At 1.1.2019
Kes’ million
Additions/(disposals)
Kes’ Million
Increase/(decrease) in market
valueKes’ million
At 31.12.2019Kes’ million
The East African Portland Cement Plc 11,265,068 - 11,265,068 180 - (17) 163Kenya Oil Company Limited 500 (500) - - - - -

Notes to the Financial Statements (Continued)for the year ended 31 December 2020
FINANCIAL REVIEWBUSINESS OVERVIEW SUSTAINABILITY REVIEW GOVERNANCE2020 OVERVIEW
Setting Industry Standards in Health & Safety
Notes to the Financial Statements (Continued)for the year ended 31 December 2020
BAMBURI CEMENT ANNUAL REPORT & FINANCIAL STATEMENTS 2020 BAMBURI CEMENT ANNUAL REPORT & FINANCIAL STATEMENTS 2020152 153
20. GOODWILL
GROUP2020
Kes’million2019
Kes’millionAt beginning and end of the year 217 217
The goodwill amounting to Kes 217 million arose from the acquisition of a subsidiary, Himcem Holdings Limited, in 1999. Himcem is the majority owner of the Group’s operating Company in Uganda, Hima Cement Limited. The whole amount has been allocated to the subsidiary, which the Group considers as a cash generating unit (CGU). Determination of goodwill impairment involves an estimation of the value in use of the cash-generating unit to which goodwill has been allocated.
The amount of the goodwill has been determined based on a value in use calculation using cash flow projections covering a period of 16 years from the year 2014. This is based on the expected life of the plant. The cash flows from the cash generating unit are based on expected return on capital invested of 8% and a stable market share. The expected cash flows are based on past experience on earnings generated from the CGU. The yearly earnings generated are expected to remain stable in the period stipulated. Management is of the opinion that any possible reasonable change in these assumptions would not cause the global carrying amount to exceed the recoverable amount.
During the current financial year, the directors assessed the recoverable amount of goodwill and determined that the goodwill is not impaired. The recoverable amount of the cash generating units was assessed by reference to value in use.
Sensitivity analysis
The Group has conducted an analysis of the sensitivity of the impairment test to changes in the key assumptions used to determine the recoverable amount of the CGU to which goodwill is allocated. The directors believe that any reasonably possible change in the key assumptions on which the recoverable amount is based would not cause the aggregate carrying amount to exceed the aggregate recoverable amount of the CGU.
At the beginning of the financial year and at the end of the year the recoverable amount was substantially in excess of its book value.
A 10% underperformance against budgeted earnings would reduce the headroom by 17% and would therefore not result in any impairment charge.
21. INVENTORIES
GROUP COMPANY2020
Kes’million2019
Kes’million2020
Kes’million2019
Kes’millionRaw materials 1,623 2,117 464 891
Semi-finished and finished products 561 1,136 444 862
Fuels 613 1,032 456 526
Parts and supplies 2,425 2,302 1,339 1,355
Provision for obsolete inventory (Parts and supplies) (955) (766) (427) (268)
Parts and supplies net of provision 1,470 1,536 912 1,087
4,267 5,821 2,276 3,366
During 2020, Kes 14,254 million (2019: Kes 14,769 million) and Kes 7,014 million (2019: Kes 7,216 million), for the Group and the Company, respectively, was recognised as an expense for inventories. This is recognised in the cost of sales.
22. TRADE AND OTHER RECEIVABLES
(a) Analysis of trade and other receivables:
GROUP COMPANY2020
Kes’million2019
Kes’million2020
Kes’million2019
Kes’millionTrade receivables 1,610 2,279 707 661
Other receivables* 235 262 185 212
Loss allowance (764) (633) (232) (199)
Net trade and other receivables 1,081 1,908 660 674
Prepayments 386 435 210 152
Receivables from related companies [Note 33 (b)] 163 172 1,281 814
1,630 2,515 2,151 1,640
*The other receivables include advances to staff, insurance recoverable and accrued interest.
(b) Movement in loss allowances
GROUP COMPANY2020
Kes’million2019
Kes’million2020
Kes’million2019
Kes’millionAt beginning of year 633 547 199 151
Foreign exchange adjustments 26 (1) - -
Bad debts written off (13) (45) - -
Increase in loss allowance charged to profit or loss 118 132 33 48
At end of year 764 633 232 199
The average credit period on sales of finished goods is 30 days. The bulk of the trade receivables are covered by bank guarantees in favour of the Group and the Company. Before accepting any new customer, the Group and the Company uses a credit scoring system to assess the potential customer’s credit quality and defines credit limits by customer. Limits and scoring attributed to customers are reviewed quarterly.
In determining the recoverability of a trade receivable, the Group and the Company considers any change in the credit quality of the trade receivable from the date credit was initially granted up to the reporting date.
Other receivables and receivables from related companies are all performing and no impairment losses have been recognised for them. Additional disclosures for credit risk management are in Note 38 (ii).
23. CASH AND CASH EQUIVALENTS
(a) Analysis of cash and cash equivalents:
GROUP COMPANY2020
Kes’million2019
Kes’million2020
Kes’million2019
Kes’millionCash at bank and on hand 4,327 3,106 2,263 2,289
Short term deposits (Note 23(d)) 2,060 - 2,060 -
6,387 3,106 4,323 2,289

Notes to the Financial Statements (Continued)for the year ended 31 December 2020
FINANCIAL REVIEWBUSINESS OVERVIEW SUSTAINABILITY REVIEW GOVERNANCE2020 OVERVIEW
Setting Industry Standards in Health & Safety
Notes to the Financial Statements (Continued)for the year ended 31 December 2020
BAMBURI CEMENT ANNUAL REPORT & FINANCIAL STATEMENTS 2020 BAMBURI CEMENT ANNUAL REPORT & FINANCIAL STATEMENTS 2020154 155
23. CASH AND CASH EQUIVALENTS (continued)
(b) Reconciliation to cash flow statement
For the purposes of the statement of cash flows, cash and cash equivalents comprise balances with less than three months’ maturity from the date of acquisition, including cash in hand and deposits held at call with banks and other short-term highly liquid investments with original maturities of three months or less. Analysis of cash and cash equivalents is as set out below:
GROUP COMPANY2020
Kes’million2019
Kes’million2020
Kes’million2019
Kes’millionBank and cash balances: - note 23(a) 6,387 3,106 4,323 2,289Bank overdrafts (note 23(c)) (136) (1,772) - -
Balances per statement of cash flows 6,251 1,334 4,323 2,289
(c) Analysis of bank overdrafts
Citibank NA 136 108 - -Standard Chartered Bank Uganda Limited - 203 - -Citibank Uganda Limited - 1,029 - -Stanbic Bank Uganda - 432 - -
136 1,772 - -
Bank overdrafts are unsecured and have been classified as current liabilities. The bank overdraft at Citibank NA was in denominated in Kenya Shillings (KES) and is held by Bamburi Special Products, a Kenya subsidiary of the Company. The bank overdraft is unsecured and denominated in KES with effective interest rate of 10.2 % p.a.
(d) Short term deposits
GROUP COMPANY2020
Kes’million2019
Kes’million2020
Kes’million2019
Kes’millionShort term financial deposit 2,060 - 2,060 -
The weighted average interest rates earned on the cash deposited with local banks during the year were as shown below:
GROUP COMPANY2020
Kes’million2019
Kes’million2020
Kes’million2019
Kes’millionForeign currencies 0.26% - 0.26% -
The USD denominated Short Term Deposit is held with LafargeHolcim International Finance Ltd, a related party by virtue of common shareholding and/or directorship. The deposit earned an interest equal to the 3-months USD LIBOR plus margin of 0.03% and was fixed quarterly in advance two business days before 26 September 2020 and 26 December 2020. The interest on the deposit is calculated with [actual/360] days and was paid semi-annually on 30 June 2020 and 31 December 2020, net of all applicable taxes and levies.
24. SHARE CAPITAL
GROUP AND COMPANY2020
Kes’million2019
Kes’million
Authorised
366,600,000 ordinary shares of Kes 5 each 1,833 1,833
100,000, 7% redeemable cumulative preference
shares of Kes 20 each 2 2
1,835 1,835
Issued and fully paid
362,959,275 ordinary shares of Kes 5 each 1,815 1,815
Fully paid ordinary shares, which have a par value of Kes 5 each, carry a right of one vote per share and have rights to dividends.
25. RESERVES
a) Asset revaluation reserve
The revaluation reserve is used to record increases in the fair value of property, plant and equipment and decreases to the extent that such decrease relates to an increase on the same asset previously recognised in equity. An annual transfer from the asset revaluation reserve to retained earnings is made for the difference between depreciation based on the revalued amount of the asset and depreciation based on the asset original cost. When revalued assets are sold, the portion of the revaluation reserve that relates to those assets is effectively realised and transferred directly to retained earnings. The revaluation reserve is not distributable.
b) Translation reserve
Exchange differences relating to the translation of the net assets of the Group’s foreign operations from their functional currency to the Group’s presentation currency (Kenya shillings) are recognised directly in other comprehensive income and accumulated in the foreign currency translation reserve. Exchange differences previously accumulated in the foreign currency translation reserve are reclassified to profit or loss on disposal or partial disposal of a foreign operation.

Notes to the Financial Statements (Continued)for the year ended 31 December 2020
FINANCIAL REVIEWBUSINESS OVERVIEW SUSTAINABILITY REVIEW GOVERNANCE2020 OVERVIEW
Setting Industry Standards in Health & Safety
Notes to the Financial Statements (Continued)for the year ended 31 December 2020
BAMBURI CEMENT ANNUAL REPORT & FINANCIAL STATEMENTS 2020 BAMBURI CEMENT ANNUAL REPORT & FINANCIAL STATEMENTS 2020156 157
26. DEFERRED TAX LIABILITY
Deferred taxes are calculated on all temporary differences under the liability method using a principal tax rate of 30% (2019: 30%). The make-up of the deferred tax liability at the year-end and the movement on the deferred tax account during the year are as presented below:
GROUP
At 1 January
2020
Profit or (loss) (note
12(a))
Other comprehensive
income (note 12(a))
Foreignexchange
adjustment/ other
At 31 December
2020Kes’million Kes’million Kes’million Kes’million Kes’million
Property, plant and equipment 5,963 (299) - 193 5,857Provision for site restoration and litigation costs (43) (47) - (2) (92)Bonus payable (63) (18) - (2) (83)Foreign exchange (losses) / gains (13) 26 - 13 26Provision for staff gratuity, long service awards and leave (179) 15 9 (2) (157)Provision for wage increment (1) 1 - - -Provision for obsolete inventories (171) (93) - (8) (272)Provision for slow moving stock (15) (6) - (1) (22)Other inventories provisions (52) 40 - (2) (14)Provision for site inventory (59) - - (4) (63)Provision for bad debts (190) (30) - (7) (227)Provision for customer rebates (39) (10) - (2) (51)Tax losses (797) 302 - (39) (534)Foreign currency translation (losses)/ gains on translations (9) - - 9 -Right of Use assets - IFRS 16 - (6) - - (6)Lease liabilities - IFRS 16 - 5 - - 5Revaluation surplus 673 - - 51 724Disallowed Interest (84) (56) - (9) (149)Other provisions (6) - - (1) (7)
4,915 (176) 9 187 4,935
26. DEFERRED TAX LIABILITY (continued)
GROUP
At 1 January
2019
Profit or (loss) (Note
12(a))
Other comprehensive
income (Note 12(a))
Foreignexchange
adjustment/ other
At 31 December
2019Kes’million Kes’million Kes’million Kes’million Kes’million
Property, plant and equipment 6,304 (341) - - 5,963Provision for site restoration and litigation costs (35) (8) - - (43)Bonus payable (61) (2) - - (63)Foreign exchange (losses) / gains (55) 42 - - (13)Provision for staff gratuity, long service awards and leave (210) 36 (6) - (180)Provision for obsolete inventories (218) (20) - - (238)Provision for site inventory (59) - - - (59)Provision for bad debts (176) (14) - - (190)Provision for customer rebates (18) (21) - - (39)Provision for restructuring (30) 30 - - -Tax losses (1,355) 558 - - (797)Foreign currency translation (losses)/ gains on translations (9) (2) - 2 (9)Provision for Petcoke and slag (10) 10 - - -Revaluation surplus 673 - - - 673Other provisions - (90) - - (90)Provision for non recoverable costs (66) 66 - - - 4,675 244 (6) 2 4,915
*The foreign nge adjustments arise from the translation of the carrying amounts of deferred tax held by a subsidiary, Himcem Holdings Limited.

Notes to the Financial Statements (Continued)for the year ended 31 December 2020
FINANCIAL REVIEWBUSINESS OVERVIEW SUSTAINABILITY REVIEW GOVERNANCE2020 OVERVIEW
Setting Industry Standards in Health & Safety
Notes to the Financial Statements (Continued)for the year ended 31 December 2020
BAMBURI CEMENT ANNUAL REPORT & FINANCIAL STATEMENTS 2020 BAMBURI CEMENT ANNUAL REPORT & FINANCIAL STATEMENTS 2020158 159
26. DEFERRED TAX LIABILITY (continued)
At1 January
2020 Profit or loss(note 12 (a))
Other comprehensive
income
At 31 December
2020
COMPANY Kes’million Kes’million Kes’million Kes’million
Property, plant and equipment 3,314 (244) - 3,070
Provision for site restoration and litigation costs (28) (11) - (39)
Bonus payable (28) (22) - (40)
Foreign exchange (losses) / gains 7 (3) - 4
Provision for staff gratuity, long service awards and leave (152) 10 9 (133)
Provision for obsolete inventories (81) (47) - (128)
Provision for bad debts (60) (11) - (71)
Provision for customer rebates (11) (13) - (24)
Provision for slow moving items - (23) - (23)
Tax losses (91) 91 - -
2,870 (273) 9 2,606
At1 January
2019 Profit or loss(note 12 (a))
Other comprehensive
income
At 31 December
2019
COMPANY Kes’million Kes’million Kes’million Kes’million
Property, plant and equipment 3,639 (325) - 3,314
Provision for site restoration and litigation costs (25) (3) - (28)
Bonus payable (32) 4 - (28)
Foreign exchange gains/ (losses) (2) 9 - 7
Provision for staff gratuity, long service awards and leave (181) 38 (9) (152)
Provision for obsolete inventories (68) (13) - (81)
Provision for bad debts (45) (15) - (60)
Provision for customer rebates (10) (1) - (11)
Provision for restructuring (28) 28 - -
Tax losses (628) 537 - (91)
2,620 259 (9) 2,870
27. PROVISIONS
Year ended 31 December 2020
GROUP
Site restoration and litigation
Kes’ millionLeave pay
Kes’ million
2020Total
Kes’ millionAt beginning of year 297 77 374Additional provisions 159 7 166Utilised during the year - (7) (7)Translation loss 7 2 9At end of year 463 79 542Categorised as:Current portion 15 79 94Non-current portion 448 - 448At end of year 463 79 542
COMPANYAt beginning of year 265 45 310Additional provisions 39 5 44Utilised during the year - (4) (4)At end of year 304 46 350Categorised as:Current portion 15 46 61Non-current portion 289 - 289At end of year 304 46 350
Year ended 31 December 2019
GROUP
Site restoration and litigation
Kes’ millionLeave pay
Kes’ million
2019Total
Kes’ millionAt beginning of year 289 69 358Additional provisions 12 22 34Utilised during the year (4) (14) (18)At end of year 297 77 374Categorised as:Current portion 12 77 89Non-current portion 285 - 285At end of year 297 77 374
COMPANYAt beginning of year 257 29 286Additional provisions 12 18 30Utilised during the year (4) (2) (6)At end of year 265 45 310Categorised as:Current portion 12 45 57Non-current portion 253 - 253
265 45 310
The provision for site restoration and litigation relates to future outflows that will be required to settle related liabilities.

Notes to the Financial Statements (Continued)for the year ended 31 December 2020
FINANCIAL REVIEWBUSINESS OVERVIEW SUSTAINABILITY REVIEW GOVERNANCE2020 OVERVIEW
Setting Industry Standards in Health & Safety
Notes to the Financial Statements (Continued)for the year ended 31 December 2020
BAMBURI CEMENT ANNUAL REPORT & FINANCIAL STATEMENTS 2020 BAMBURI CEMENT ANNUAL REPORT & FINANCIAL STATEMENTS 2020160 161
27. PROVISIONS (Continued)
The Group maKes full provision for the future cost of rehabilitating its quarry sites and related production facilities on a discounted basis at the time of developing the quarries and installing and using the facilities. The site restoration provision represents the present value of rehabilitation costs relating to quarry sites. These provisions have been created based on the Group’s internal estimates and assumptions based on the current economic environment, which management believes are a reasonable basis upon which to estimate the future liability. These estimates are reviewed regularly to take into account any material changes to the assumptions.
The actual restoration costs will depend upon future market prices for the necessary rehabilitation works required that will reflect market conditions at the relevant time. The timing of the rehabilitation is likely to depend on when the quarries cease to produce at economically viable rates. This, in turn, will depend upon future material prices, which are inherently uncertain.
The amount of litigation provisions made is based on the Group’s assessment of the basis for the claims and the level of risk on a case-by-case basis. The provision depends on the Group’s assessment of the stage of the proceedings and the arguments in its defence. The occurrence of events during proceedings may lead to a reappraisal of the risk at any time.
Leave pay relates to employee benefits in the form of annual leave entitlements provided for when they accrue to employees with reference to services rendered up to the reporting date. Employees are entitled to carry forward a maximum of 10 leave working days per annum which should be fully utilised by the end of the following year.
28. EMPLOYEE BENEFIT LIABILITIES
Service gratuity and long service
The provisions for service gratuity and long service awards represent entitlements that accrue as a result of services offered by employees. These are classified as defined benefit plans and are not funded. The cost and the present value of the obligation of the service gratuity and long service awards are determined using actuarial valuations by an independent actuarial valuer.
The following table summarises the components of net benefit expense recognised in the statement of profit or loss and other comprehensive income and the amounts recognised in the statement of financial position for the respective plans:
Year ended 31 December 2020
Group CompanyLong service
award Gratuity TotalLong service
award Gratuity TotalKes’million Kes’million Kes’million Kes’million Kes’million Kes’million
Opening employee benefit obligation 36 479 515 21 435 456Current service cost- charged to profit or loss cost of sales 4 20 24 2 18 20Benefits payments (7) (120) (127) (5) (85) (90)Interest cost - charged to profit or loss cost 5 46 51 3 40 43Actuarial gain - credited to other comprehensive income (4) (27) (31) (1) (30) (31)Exchange (gains)/loss 2 3 5 - - -Closing employee benefit obligation 36 401 437 20 378 398Categorised as:Current portion 4 50 54 3 46 49Non-current portion 32 351 383 17 332 349Total 36 401 437 20 377 398
28. EMPLOYEE BENEFIT LIABILITIES (Continued)
Year ended 31 December 2019
Group CompanyLong service
award Gratuity TotalLong service
award Gratuity TotalKes’million Kes’million Kes’million Kes’million Kes’million Kes’million
Opening employee benefit obligation 41 480 521 22 437 459Current service cost- charged to profit or loss cost of sales 4 21 25 2 18 20Benefits payments (6) (104) (110) (5) (99) (104)Interest cost - charged to profit or loss cost 6 53 59 3 47 50Net actuarial loss - charged to other comprehensive income (9) 29 20 (1) 32 31Closing employee benefit obligation 36 479 515 21 435 456
Categorised as:Current portion 8 39 47 6 39 45Non-current portion 28 440 468 15 396 411Total 36 479 515 21 435 456
The principal actuarial assumptions used in determining service gratuity and long service awards obligations for the Group’s plans are shown below:
2020 2019Kenya Uganda Kenya Uganda
% % % %
Interest rate 10.8% 15.26% 10.5% 15.9%Future salary increases 8.8% 13.5% 8.5% 13.9%Long service award escalation rate 5.8% 7.0% 5.5% 10.9%
Other disclosures
Mortality rate
The actuary uses actives’ mortality A49-52 ultimate and pensioners’ mortality A55 as the base tables of standard mortality rates. Statistical methods are used to adjust the rates reflected on the base table based on the Company’s experience of improvement or worsening of mortality.
Sensitivity of the Results
The results of the actuarial valuation will be more sensitive to changes in the financial assumption than changes in the demographic assumptions. In preparing the sensitivity analysis of the results to the discount rate used, the actuaries have relied on the calculations of the duration of the liability. Based on this methodology, the results of the sensitivity analysis are summarised in the table below:

Notes to the Financial Statements (Continued)for the year ended 31 December 2020
FINANCIAL REVIEWBUSINESS OVERVIEW SUSTAINABILITY REVIEW GOVERNANCE2020 OVERVIEW
Setting Industry Standards in Health & Safety
Notes to the Financial Statements (Continued)for the year ended 31 December 2020
BAMBURI CEMENT ANNUAL REPORT & FINANCIAL STATEMENTS 2020 BAMBURI CEMENT ANNUAL REPORT & FINANCIAL STATEMENTS 2020162 163
28. EMPLOYEE BENEFIT LIABILITIES (Continued)
Other disclosures (continued)
Sensitivity of the Results (continued)
A quantitative sensitivity analysis for significant assumption as at 31 December 2020 is as shown below:*
Interest rate Salary escalation rate Award escalation rate+1/2% -1/2% +1/2% -1/2% +1/2% -1/2%
COMPANY Kes’million Kes’million Kes’million Kes’million Kes’million Kes’millionGratuity 368 381 381 369 375 375Long service awards 20 21 20 20 21 20Total 388 402 401 389 396 395
Since the bulk of the benefits payable under the Scheme are salary related, the sensitivity of the liability to a change in the salary escalation assumption is not expected to be materially different. However, the impact of a change in salary escalation is expected to be less than the impact of a change in the discount rate as a portion of the liabilities (for example the liability in respect of pensions in payment and deferred pensioners) would not be affected by a change in the salary escalation rate.
Characteristics and Risks of the Scheme:
The Scheme is of a defined benefit nature (i.e. salary and service related). Therefore, one of the main risks relating to the benefits under the Scheme is the rate of salary growth. As the benefits are based on the final salary, any changes in salary that differ from the salary escalation rate assumed will have a direct bearing on the benefits paid and the present value of the benefit obligation under the scheme. The Company’s experience with respect to pre-retirement exit experience, actual ages of retirement and mortality will also impact the benefits payable under the Scheme, when compared with the assumption made. The Scheme is registered under irrevocable trust with the Retirement Benefits Authority.
Discount rate
IAS 19 requires the discount rate to be determined by reference to the market yields, on the reporting date, on high quality corporate bonds, or in the countries where there is no deep market in such bonds, the market yields on government bonds. The currency and term of the corporate or government bonds should be consistent with the currency and estimated term of the post- employment benefit obligation. In the absence of a deep and liquid market in such long dated securities in Kenya and Uganda, a discount rate as at 31 December 2020 of 12.3% (2019 12.3%) per annum and 14.9% (2019-14.9%) per annum has been used for Kenya and Uganda respectively. In this case, the government bond rates were used to determine the discount rates.
In Kenya, the bond selected to match the liabilities outstanding had a term of approximately 5 years and with a yield of 10.5% per annum. At this yield, the bond and the liabilities had discounted mean term of 3.69 years and the yield is thus considered appropriate discount rate. In Uganda, the longest bond had an outstanding term of approximately 15 years and with a yield of 15.9% per annum. It was considered appropriate to use the yield on the longest bond available as the valuation interest rate.
29. TRADE AND OTHER PAYABLES
GROUP COMPANY2020
Kes’million2019
Kes’million2020
Kes’million2019
Kes’millionTrade payables* 3,863 2,819 1,560 1,640Accrued expenses 1,367 1,667 719 521Other payables** 793 821 294 153Payable to related companies - Note 33 (b)* 374 1,348 549 1,402
6,397 6,655 3,122 3,716
Terms and conditions of the above financial liabilities:
* Trade payables and payables to related parties are non-interest bearing and are normally settled on a 30 – 60 day terms.
** Other payables are non-interest bearing and have an average term of less than one month. These mainly relate to amounts due to statutory bodies in respect to year-end staff deductions.
30. CONTINGENT LIABILITIES
a) Guarantees
GROUP COMPANY2020
Kes’million2019
Kes’million2020
Kes’million2019
Kes’millionGuarantees and bonds issued by the Group’s bankers in favour of Kenya Revenue Authority and Uganda National Roads Authority 101 101 101 101Guarantees and bonds issued by the Group’s bankers in favour of other parties 37 138 22 8At end of year 138 239 123 109
The guarantees and bonds are issued by the Group’s and the Company’s bankers in favour of third parties. The Group and the Company has entered into counterindemnities with the same banks. These guarantees and bonds are part of the borrowing facilities disclosed in Note 30 (d) and are issued in the normal course of business.
b) Legal matters
The Group and the Company are involved in a number of legal proceedings which are yet to be concluded upon. The Directors have evaluated the pending cases and determined that no material liabilities are likely to arise from these cases which arose in the normal course of business. The Group and the Company have an in-house legal department that assessed the court cases in arriving at the above conclusion. These include:
Court of Appeal Civil Appeal No. 155 of 2011 Uganda - Mining lease
This Appeal arises from Misc. Cause 88 of 2012 in the High Court. Hima Cement Limited (HCL) is challenging the findings of a judicial review in which East African Gold Sniffing Company Limited (the defendant) reclaimed their exploration licence “0932”in one of the limestone deposit sites in Kasese where HCL is operating. In the event of an adverse ruling, HCL stands to lose their mining lease over the said site, which would have a significant effect on the operations of the entity’s plant in Kasese. The legal costs in respect to this are estimated at UKes 295 million (USD 80,000). The company is still waiting for hearing date to be fixed.
According to the Board of Directors evaluation of the case and the legal advice received from the Company’s lawyers, the Directors opine that the appeal has a strong basis with a high likelihood of success. As such, the financial statements of Hima Cement Limited for the year ended 31 December 2020 have been prepared on a going concern basis.
c) Tax matters
The Group is regularly subjected to evaluations, by the taxation authorities, of its direct and indirect taxation affairs and in connection with such reviews, tax assessments can be issued by the taxation authorities in respect of the Group’s taxation affairs in relation to cases where a group entity is deemed to have failed to comply with tax laws.
In prior year the company reached an agreement with the Kenya Revenue Authority on a tax assessment relating to prior years which the company had disputed. A full settlement of the agreed principal tax amounting to Kes 161 million relating to corporate tax, Value Added Tax (VAT) and PAYE and Kes 171 million relating to management and technical fees was paid in 2019. Management has applied for a waiver of interest and penalties accrued amounting to Kes 288 million. The Directors are of the opinion that the waiver will be granted.
d) Borrowing facilities
At the end of the year, the Group had working capital facilities amounting to total of Kes 8.2 billion (2019 - Kes 5.6 billion), out of which the undrawn facilities amounted to Kes 7.8 billion (2019 – Kes 4.8 billion). The drawn amounts mainly relate to supplier trade finance, bonds and guarantees.
The working capital facilities are annual facilities that are subject to review at various dates during the year. They consist of letters of credit and guarantees, among others.

Notes to the Financial Statements (Continued)for the year ended 31 December 2020
FINANCIAL REVIEWBUSINESS OVERVIEW SUSTAINABILITY REVIEW GOVERNANCE2020 OVERVIEW
Setting Industry Standards in Health & Safety
Notes to the Financial Statements (Continued)for the year ended 31 December 2020
BAMBURI CEMENT ANNUAL REPORT & FINANCIAL STATEMENTS 2020 BAMBURI CEMENT ANNUAL REPORT & FINANCIAL STATEMENTS 2020164 165
31. CAPITAL COMMITMENTS
Authorised and contracted
Capital expenditure contracted for at the end of the reporting period but not recognised in the financial statements is as follows:
GROUP COMPANY2020
Kes’million2019
Kes’million2020
Kes’million2019
Kes’million
Commitments for the acquisition of property, plant and equipment 582 _1,023 432 221
Commitments during the year relate to capital purchases of PPE items yet to be delivered in both Kenya and Uganda.
Authorised but not contracted
Capital expenditure authorised but not contracted for at the reporting date:
GROUP COMPANY2020
Kes’million2019
Kes’million2020
Kes’million2019
Kes’million
Commitments for the acquisition of property, plant and equipment 120 234 120 234
32. NOTES TO THE STATEMENT OF CASH FLOWS
Reconciliation of profit before tax to cash generated from operations:
GROUP Notes2020
Kes’million2019
Kes’millionProfit before tax 1,776 728Adjustments for:Depreciation on property, plant and equipment 15(a) 2,322 2,327Amortisation of intangible assets 17 107 120Depreciation of right-of-use assets 16(b) 182 221Amortisation of prepaid lease rentals 16(a) 9 -Amortisation of limestone reserves 1 1Impairment of property, plant and equipment 15(a) - 71Impairment of biofuels 34 352 -Impairment of limestone reserves 17(b) - 4Interest income 7(ii) (62) (60)Interest on lease liability 35(c) 73 63Interest on borrowings 145 327Gain on disposal of property, plant and equipment 8 (260) (196)Interest on pension benefit obligations 51 -Net foreign exchange (gains) / losses (59) 44Actuarial gains on Employees defined Pension benefit Obligations - (20)Unrealized currency translation (gains)/losses (48) -Operating profit before working capital changes 4,589 3,630Changes in working capital balances:Decrease in inventories 1,554 1,041Decrease in employees’ benefit liabilities (78) (6)Decrease in trade and other receivables 885 138Increase in provisions 168 16Decrease in trade and other payables (258) (1,160)Cash generated from operations 6,860 3,659
32. NOTES TO THE STATEMENT OF CASH FLOWS (continued)
COMPANY Notes2020
Kes’million2019
Kes’millionProfit before tax 1,672 1,292Adjustments for:Depreciation on property, plant and equipment 5(b) 1,240 1,189Amortisation of intangible assets 17 62 76Impairment of biofuels 34 352 -Assets written off - 35Diminution of investments in subsidiaries - 191Interest income 7 (68) (59)Interest cost on pension benefit obligations 43 -Gain on disposal of property, plant and equipment 8 (255) -Actuarial gains on Employees defined benefit Pension Obligations - (31)Net foreign exchange losses/(gains) (19) -Operating profit before working capital changes 3,027 2,693Changes in working capital balances:Decrease in inventories 1,090 109Decrease in employees’ benefit liabilities (58) (3)(Increase)/decrease in trade and other receivables (511) 354Increase in provisions 40 24Decrease in trade and other payables (594) (536)Cash generated from operations 2,994 2,641
33. RELATED PARTY TRANSACTIONS
Note 18 provides the information about the Group’s structure including the details of the subsidiaries.
The ultimate parent of the Group is LafargeHolcim Ltd, incorporated in Switzerland. There are other companies which are related to Bamburi Cement Limited through common shareholdings and directorships.
(a) Related party transactions
The Company receives technical assistance from the majority shareholder, LafargeHolcim Ltd, which is paid for under a five-year agreement.
The following transactions were carried out with related parties during the year.
Sales of goods and services
Purchases of goods and
servicesInterest
receivedGROUP Kes’million Kes’million Kes’millionEntity with significant influence over the Group: Lafarge SA (technical services) 2020 - 831 -
2019 - 1,182 -Other related companiesLafarge-Holcim Trading 2020 - 1,813 -
2019 - 1,505 -Lafarge Energy Solutions 2020 - 936 -
2019 - 1,268 -LafargeHolcim International Finance 2020 - - 2
2019 - - -

Notes to the Financial Statements (Continued)for the year ended 31 December 2020
FINANCIAL REVIEWBUSINESS OVERVIEW SUSTAINABILITY REVIEW GOVERNANCE2020 OVERVIEW
Setting Industry Standards in Health & Safety
Notes to the Financial Statements (Continued)for the year ended 31 December 2020
BAMBURI CEMENT ANNUAL REPORT & FINANCIAL STATEMENTS 2020 BAMBURI CEMENT ANNUAL REPORT & FINANCIAL STATEMENTS 2020166 167
33. RELATED PARTY TRANSACTIONS (continued)
(a) Related party transactions (continued)
Sales of goods and services
Purchases of goods and
servicesInterest
receivedCOMPANY Kes’million Kes’million Kes’millionEntity with significant influence over the Company:Lafarge SA 2020 - 407 -
2019 - 836 - Subsidiaries:Hima Cement Limited 2020 29 - 18
2019 73 - -
Bamburi Special Products Limited 2020 347 8 12019 723 - 4
Other Related partiesLafarge-Holcim Trading 2020 - 788 -
2019 - 1,494 -
Lafarge Energy Solutions 2020 - 936 -2019 - 1,268 -
LafargeHolcim International Finance 2020 - - 2
2019 - - -
(b) Outstanding balances arising from sale and purchase of goods and services to/from related companies at the year-end.
GROUP COMPANY 2020
Kes’million2019
Kes’million2020
Kes’million2019
Kes’millionReceivables from related partiesLafarge France 10 10 10 10Lafarge South Africa 7 5 5 5Lafarge Technical Centre Europe 1 2 1 1Chilanga Cement Plc Zambia 7 6 6 6Malawi Portland Cement 30 10 14 8Lafarge Cairo 7 7 7 7Lafarge MEA IT services 30 31 26 26Other related parties 71 101 63 62
163 172 132 125
Receivables from subsidiariesHima Cement Limited - - 124 28Bamburi Special Products Limited - - 293 290Lafarge Eco Systems Limited - - 261 207Binastore Limited - - 201 147Diani Estate Limited - - 270 17
- - 1,149 689Total receivables (note 22(a)) 163 172 1,281 814
33. RELATED PARTY TRANSACTIONS (continued)
Payables to related parties
GROUP COMPANY 2020
Kes’million2019
Kes’million2020
Kes’million2019
Kes’million
Holcim Technology Limited 14 348 27 348
Lafarge France 64 270 81 164
Lafarge Eco Systems Limited - - 243 206
Other related parties 296 730 198 684
Total payables (note 29) 374 1,348 549 1,402
Terms and conditions of transactions and balances with related parties
The sales to and purchases from related parties are made on terms as specified in the transfer pricing arrangement between the Group companies. Outstanding balances at the year-end are unsecured and interest free. For the year ended 31 December 2020 the Group has not recorded any impairment of receivables relating to amounts owed by related parties (2019: Nil). This assessment is undertaken each financial year through examining the financial position of the related party and the market in which the related party operates. There have been no guarantees or commitments provided or received for any related party receivables or payables.
(c) Loan to a subsidiary
Within the year 2020, the subsidiary Bamburi Special Products Limited fully paid the outstanding loan balance due to the Company (2019 - Kes 25 million ). The loan was unsecured and the effective interest on the loan was 10% (2019 – 10%). The loan repayment period was 10 years from January 2011.
Company2020
Kes’million2019
Kes’millionCurrent portion - 25
The movement in loan to subsidiary is as shown below:
At 1 January 25 54
Paid during the year (25) (29)
At 31 December - 25
Interest charged on the above loan (Note 7(ii)) 1 4
In the year 2020, the Company advanced USD 7 million short term loan to its subsidiary Hima Cement Limited. The loan was unsecured and the effective interest on the loan was 6%. The loan was repaid in full within the year
The movement in loan to subsidiary is as shown below:
At 1 January - -
Loan advanced in the year 736 -
Paid during the year (736) -
At 31 December - -
Interest charged on the above loan (Note 7(ii)) 18 -

Notes to the Financial Statements (Continued)for the year ended 31 December 2020
FINANCIAL REVIEWBUSINESS OVERVIEW SUSTAINABILITY REVIEW GOVERNANCE2020 OVERVIEW
Setting Industry Standards in Health & Safety
Notes to the Financial Statements (Continued)for the year ended 31 December 2020
BAMBURI CEMENT ANNUAL REPORT & FINANCIAL STATEMENTS 2020 BAMBURI CEMENT ANNUAL REPORT & FINANCIAL STATEMENTS 2020168 169
33. RELATED PARTY TRANSACTIONS (continued)
(d) Loan due to a related company-Non-current liability.
As at the end of the year, the balance due to Cemasco B. V, a related company, from Hima Cement Limited, a subsidiary of Bamburi Cement Limited amounted Kes 2,191 million (2019 – Kes 2,056 million). The term of the loan is 5 years with a moratorium of 3 years. The loan is due for repayment in 2023. The loan is unsecured and attracts interest of 6 Month USD LIBOR + 3.5%.
Group2020
Kes’million2019
Kes’millionAt 1 January 2,056 2,010Foreign exchange (gain)/loss (21) 44Translation loss 156 2At 31 December 2,191 2,056
(e) Short term financial deposits
During the year the company invested a USD denominated Short Term Deposit (Kes 2 billion) with LafargeHolcim International Finance Ltd, a related party by virtue of common shareholding and/or directorship. The deposit attracts interest of 3-months USD LIBOR plus margin of 0.03%. Interest earned from the deposit in the year amounted to Kes 1.7 million.
(f) Key management personnel compensation
The remuneration of directors and members of key management during the year was as follows:
GROUP AND COMPANY2020
Kes’million2019
Kes’millionFees for services as a director Executive - -Non-executive 16 16Total directors’ fees 16 16Emoluments for Executive directorsSalaries and bonuses 97 79Short term employee benefits 34 39Post-employment pension-defined contribution 13 12Total emoluments for directors 144 130Guaranteed loans to executive directors - -
Emoluments for key management personnel (excluding the directors): Salaries and bonuses 91 119 Short term employee benefits 28 40 Post-employment pension-defined contribution 5 9Total emoluments for key management personal 124 168Total emoluments for directors and other key management personnel 284 314
Guaranteed long-term loans to key management staff - 31Guaranteed long-term loans to executive directors and key management personnel - 31
Terms and conditions of the guaranteed long-term loan
The long-term loans to executive directors and key management staff are issued as part of the employee benefit from the general loans for unsecured loans from Citibank. The Company acts as the guarantor for these loans. Any guaranteed loans that exceed Kes. 1.5 million require a security from all staff. The loans are at a company-negotiated rate.
34. BIOLOGICAL ASSETS (GROUP AND COMPANY)
Biological assets comprise eucalyptus, casuarina, cassi siamea and neem tree plantations. These are carried at fair value less costs to sell. The fair values of the tree plantations are determined by company’s internal valuation experts based on recent market transaction prices.
Cash conservation measures during the Covid-19 period necessitates the rationalisation of capital expenditure projects during the year. One of the projects indefinitely suspended was the modification the Mombasa Plant alternative fuel feeder equipment. The modification being a prerequisite for the usage of the biological assets meant that the Company has impaired the intrinsic value of the biological assets to their most recent market valuation.
(a) Non-current assets
Changes in carrying amounts of non-current biological assets comprise:
Group2020
Kes’million2019
Kes’millionAt start of year 335 399
Transfer to current assets (58) (64)
Impairment of realisable value (158) -
At end of year 119 335
(b) Current assets
Growing biological assets ready for use as at the reporting date
2020Kes’million
2019Kes’million
At start of year 136 72
Transfer from noncurrent assets 58 64
Impairment of realisable value (194) -
At end of year - 136
The following table presents the Company’s biological assets that are measured at fair value at 31 December 2020 (see Fair Value disclosures under Note 40):
Level 1 Level 2 Level 3Kes’million Kes’million Kes’million
Biological assets - treesYear ended 31 December 2020 - 119 -Year ended 31 December 2019 - 471 -
There were no transfers between any levels during the year.

Notes to the Financial Statements (Continued)for the year ended 31 December 2020
FINANCIAL REVIEWBUSINESS OVERVIEW SUSTAINABILITY REVIEW GOVERNANCE2020 OVERVIEW
Setting Industry Standards in Health & Safety
Notes to the Financial Statements (Continued)for the year ended 31 December 2020
BAMBURI CEMENT ANNUAL REPORT & FINANCIAL STATEMENTS 2020 BAMBURI CEMENT ANNUAL REPORT & FINANCIAL STATEMENTS 2020170 171
35. LEASE LIABILITIES - GROUP
2020Kes’million
2019Kes’million
Current 29 47Non-current 421 448
450 495The movement in the lease liabilities is as follows: At 1 January 495 685Additional lease liabilities 149 -Interest on lease liabilities 73 63Payment of interest and lease liabilities (237) (253)Ended contracts (62) -Translation differences 32 -As at 31 December 450 495
The group does not face a significant liquidity risk with regards to its lease liabilities. Lease liabilities are monitored within the group’s treasury function.
Maturity analysis of operating lease payments:
2020Kes’million
2019Kes’million
Year 1 29 47Year 2 29 43Year 3 132 48Year 4 241 143Year 5 19 214Year 6 onwards - -
450 495
36. ASSETS HELD FOR SALE
In the year 2019 the Directors had approved disposal of assets held by a subsidiary company whereby the subsidiary, Bamburi Special Products Limited, was to sell PPE to a third party. The sale fell through and the assets were reclassified back to PPE in the year.
Plant and Machinery Office equipment and Tools TotalAt 1 January 2020 25 2 27Transfer to Property, Plant and Equipment Note 15 (a) (25) (2) (27)At 31 December 2020 - - -
Covid-19 prevalent conditions led to the abandonment of the sale agreement by the third party.
37. RETIREMENT BENEFITS SCHEME
The Group operates a defined contribution retirement plan for the non-unionised employees. The assets of the plans are held separately from those of the Group in funds under the control of trustees. The scheme is administered by an independent administration Company and is funded by contributions from the Group companies and employees. The Group’s obligations to the staff retirement benefits plans are charged to profit or loss as they fall due and as they accrue to each employee.
The Group also maKes contributions to the statutory defined contribution schemes in the two countries where its operations are based. The only obligation of the Group with respect to the retirement benefit plan is to make the specified contributions.
The total expense recognised in profit or loss of Kes 249 million (2019: Kes 266 million) and Kes 129 million (2019: Kes 134 million) represents contributions payable to these plans by the Group and Company, respectively, at rates specified in the rules of the plans. The expense has been included within the retirement benefits costs under staff costs in Note 11(b).
38. FINANCIAL RISK MANAGEMENT
Introduction and overview
The Group’s principal financial liabilities are trade and other payables. The main purpose of these financial liabilities is to finance the Group’s operations and to provide guarantees to support its operations.
The Group’s principal financial assets include trade and other receivables, and cash and short-term deposits that derive directly from its operations. The Group also holds available for sale investments.
The Group is exposed to;
• market risk;• credit risk; and • liquidity risk. The Group’s overall risk management programme focuses on the unpredictability of changes in the business environment and seeks to minimise potential adverse effects of such risks on its financial performance within the options available in Kenya and Uganda by setting acceptable levels of risks.
Risk Management Framework
Financial risk management is carried out by Group’s Corporate Treasury Department under policies approved by the Board of Directors. The Group’s Corporate Treasury function identifies, evaluates and manages financial risks in close cooperation with operating units. The board provides written principles for overall risk management, as well as written policies covering specific areas such as credit risk, liquidity risk, foreign exchange risk, interest rate risk and price risk. The Group does not enter into or trade in financial instruments, including derivative financial instruments, for speculative purposes.
The Corporate Treasury function reports quarterly to the LafargeHolcim risk management committee, an independent body that monitors risks and policies implemented to mitigate risk exposures.
The Board of Directors reviews and agrees policies for managing each of these risks, which are summarised below:
(i) Market risk
Market risk is the risk arising from changes in market prices, such as interest rates, equity prices and foreign exchange rates which will affect the Group’s income or the value of its holding of financial instruments. The objective of market risk management is to manage and control market risk exposures within acceptable parameters, while optimising the return. Overall responsibility for managing market risk rests with the Group Finance Director. The Group’s Finance Department is responsible for the development of detailed risk management policies (subject to review and approval by Group Finance Director) and for the day to day implementation of those policies.
There has been no change to the Group’s exposure to market risks or the manner in which it measures and manages the risk.
a) Foreign currency risk management
The Group undertakes certain transactions denominated in foreign currencies. Therefore, exposures to exchange rate fluctuations arise. Foreign exchange risk arises from future commercial transactions, recognised assets and liabilities. The group manages foreign exchange risk by converting its foreign currency collections into local currency on an ongoing basis to cater for its operational requirements. The group raises some bills in foreign currency and receives the settlements in the same currency to avoid the effect of swinging currency exchange rates.
The carrying amounts of the Group’s foreign currency denominated monetary assets and liabilities at the end of the reporting period are as follows:

Notes to the Financial Statements (Continued)for the year ended 31 December 2020
FINANCIAL REVIEWBUSINESS OVERVIEW SUSTAINABILITY REVIEW GOVERNANCE2020 OVERVIEW
Setting Industry Standards in Health & Safety
Notes to the Financial Statements (Continued)for the year ended 31 December 2020
BAMBURI CEMENT ANNUAL REPORT & FINANCIAL STATEMENTS 2020 BAMBURI CEMENT ANNUAL REPORT & FINANCIAL STATEMENTS 2020172 173
38. FINANCIAL RISK MANAGEMENT (Continued)
Risk Management Framework (Continued)
(i) Market risk (Continued)
a) Foreign currency risk management (Continued)
Group foreign currency risk:
Denominated in EUR Denominated in USD TOTALKes’million Kes’million Kes’million
31 December 2020:
AssetsTrade and other receivables 143 277 520Bank balances 58 3,148 3,206Total assets 201 3,425 3,726
LiabilitiesTrade and other payables (1,648) (1,753) (3,401)
Bank Overdraft - - -
Net exposure position (1,447) 1,672 225
31 December 2019:
AssetsTrade and other receivables 50 347 397Bank balances 619 243 862
Total assets 669 590 1,259
LiabilitiesTrade and other payables (761) (981) (1,742)
Bank Overdraft (822) (210) (1,032)
Net exposure position (914) (601) (1,515)
38. FINANCIAL RISK MANAGEMENT (Continued)
Risk Management Framework (Continued)
(i) Market risk (Continued)
a) Foreign currency risk management (Continued)
Company foreign currency risk:
Denominated in EUR Denominated in USD TOTALKes’million Kes’million Kes’million
31 December 2020:
AssetsTrade and other receivables 124 109 233Bank balances 20 2,093 2,113
Total assets 144 2,202 2,346
LiabilitiesTrade and other payables (1,616) (1,007) (2,623)
Net exposure position (1,472) 1,195 (277)
31 December 2019:
AssetsTrade and other receivables 41 67 108Bank balances 619 53 672
Total assets 660 120 780
LiabilitiesTrade and other payables 543 710 1,253
Net exposure position 117 (590) (473)

Notes to the Financial Statements (Continued)for the year ended 31 December 2020
FINANCIAL REVIEWBUSINESS OVERVIEW SUSTAINABILITY REVIEW GOVERNANCE2020 OVERVIEW
Setting Industry Standards in Health & Safety
Notes to the Financial Statements (Continued)for the year ended 31 December 2020
BAMBURI CEMENT ANNUAL REPORT & FINANCIAL STATEMENTS 2020 BAMBURI CEMENT ANNUAL REPORT & FINANCIAL STATEMENTS 2020174 175
38. FINANCIAL RISK MANAGEMENT (Continued)
Risk Management Framework (Continued)
(i) Market risk (Continued)
a) Foreign currency risk management (Continued)
Foreign currency sensitivity analysis (Continued)
The following sensitivity analysis shows how profit and equity would change if the Kenya Shilling had depreciated against the other currencies by 5% (2019: 5%) on the reporting date with all other variables held constant. The reverse would also occur if the Kenya Shilling appreciated with all other variables held constant. This is mainly attributable to the change in value of foreign exchange receivables, payables and bank balances.
Effect on profit or loss before tax Effect on equity2020 2019 2020 2019
Kes’ million Kes’ million Kes’ million Kes’ millionGROUPEUR (72) (46) (50) (32)USD 84 (30) 59 (21)
12 (76) 9 (53)
COMPANYEUR (74) 6 (52) 4USD 60 (30) 42 (21)
(14) 24 (10) 17
b) Interest rate risk
The Group and the Company also holds cash deposits with financial institutions. The interest rates on the cash deposits are fixed and agreed upon in advance.
Management closely monitors the interest rate trends to minimise the potential adverse impacts of interest rate changes. Deposits are placed at fixed interest rates and management is therefore able to plan for the resulting income. For the facilities with variable rates, the Group and the Company is in regular contact with the lenders in a bid to obtain the best available rates.
During the year, a 5% (2019: 5%) increase/decrease of the annual interest rate would have resulted in an increase/decrease in pre-tax profit of Kes 3.1 million (2019: Kes 3.0 million) and an increase/decrease in equity of Kes 2.3 million (2019: Kes 2.3 million). The assumed movement in interest rate sensitivity analysis is based on the currently observable market environment. This is the amount by which interest rates generally fluctuate by.
c) Price risk
Quoted investments are valued at their market prices. These values are subject to frequent variations and adverse market movements. This risk is mitigated by the fact that equity investments are held for strategic rather than trading purposes. The Group and the Company do not actively trade in equity investments.
At 31 December 2020, if the prices at the Nairobi Securities Exchange had appreciated/depreciated by 5% with all other variables held constant, it would have resulted in an increase/decrease in the other comprehensive income and equity for the Group and Company of Kes 6 million (2019 - Kes 8 million) as a result of changes in fair value of available-for-sale shares.
38. FINANCIAL RISK MANAGEMENT (continued)
(ii) Credit risk
Credit risk refers to the risk that a counter party will default on its contractual obligations resulting in financial loss to the Group and the Company. The Group and the Company have adopted a policy of only dealing with creditworthy counterparties as a means of mitigating the risk of financial loss from defaults. The Group’s and the Company’s exposure and the credit rating of its counterparties are continuously monitored and the aggregate value of transactions concluded is spread amongst approved counterparties. Credit exposure is controlled by counterparty limits that are reviewed and approved by the management annually.
GROUP AND COMPANY
Trade Receivables
The average credit period on sales of goods is 30 days. No interest is charged on outstanding trade receivables.
The Group and Company always measures the loss allowance for trade receivables at an amount equal to lifetime ECL. The expected credit losses on trade receivables are estimated using a provision matrix by reference to past default experience of the debtor and an analysis of the debtor’s current financial position, adjusted for factors that are specific to the debtors, general economic conditions of the industry in which the debtors operate and an assessment of both the current as well as the forecast direction of conditions at the reporting date. The Group has recognized a loss allowance of 100% against all receivables over 365 days past due because historical experience has indicated that these receivables are generally not recoverable where they are not fully or partially secured by a bank guarantee.
There has been no change in the estimation techniques or significant assumptions made during the current reporting period.
The Group/Company’s write off a trade receivable when there is information indicating that the debtor is in severe financial difficulty and there is no realistic prospect of recovery, e.g. when the debtor has been placed under liquidation or has entered into bankruptcy proceedings, or when the trade receivables are over 365 days past due, whichever occurs earlier. The write off will be the excess of the amount owing over the security of the bank guarantee required of the credit customers. In case of unsecured debtors, who are predominantly in the contractors’ segment, the write off will be the entire amount owing to the Company.
The following tables detail the risk profile of trade receivables based on the Group/Company’s provision matrix. As the group and company’s historical credit loss experience shows significantly different loss patterns for different customer segments, the provision for loss allowance based on past due status is further distinguished between the Group’s different customer bases
The Group’s current credit risk grading framework comprises the following categories:
Contractors:
Category Description Basis for recognizing Expected credit loss (ECL)
Performing The counterparty has a low risk of default and does not have any past-due amounts
Lifetime ECL
Under watch Amount is >30 days past due or there has been a significant increase in credit risk since initial recognition
Lifetime ECL
Doubtful Amount is >90 days past due and there is evidence indicating the asset is credit-impaired
Lifetime ECL - credit-impaired
Write-off There is evidence indicating that the debtor is in severe financial difficulty and the Group/Company has no realistic prospect of recovery unless the Company is holding a bank guarantee covering the amount and or the amounts are subject to court proceeding and the adverse probable outcome is ranked high.
Amount is written off

Notes to the Financial Statements (Continued)for the year ended 31 December 2020
FINANCIAL REVIEWBUSINESS OVERVIEW SUSTAINABILITY REVIEW GOVERNANCE2020 OVERVIEW
Setting Industry Standards in Health & Safety
Notes to the Financial Statements (Continued)for the year ended 31 December 2020
BAMBURI CEMENT ANNUAL REPORT & FINANCIAL STATEMENTS 2020 BAMBURI CEMENT ANNUAL REPORT & FINANCIAL STATEMENTS 2020176 177
38. FINANCIAL RISK MANAGEMENT (continued)
(ii) Credit risk (continued)
Distributors:
Category Description Basis for recognizing Expected Credit Loss (ECL)
Performing The counterparty has a low risk of default and does not have any past-due amounts.
Lifetime ECL
Under watch Amount is >30 days past due or there has been a significant increase in credit risk since initial recognition.
Lifetime ECL
Doubtful Amount is >90 days past due and there is evidence indicating the asset is credit-impaired, and there no security held.
Lifetime ECL - credit-impaired
Write-off There is evidence indicating that the debtor is in severe financial difficulty and the Group has no realistic prospect of recovery of any amounts above the bank guarantee value and or the amounts are subject to court proceeding and the adverse probable outcome is ranked high..
Amount is written off
Cash customers, predominantly retail
Category Description Basis for recognizing Expected Credit Loss (ECL)
Doubtful There is evidence indicating that cash customers have stopped trading despite them having a debit balance in their account. An indicator of probable lapse on systems credit checks or overriding of controls.
Lifetime ECL - credit-impaired
Write-off There is evidence indicating that the debtor is in severe financial difficulty and the Group has no realistic prospect of recovery of any amounts above the bank guarantee value and or the amounts are subject to court proceeding and the adverse probable outcome is ranked high.
Amount is written off
38. FINANCIAL RISK MANAGEMENT (continued)
(ii) Credit risk (continued)
The tables below detail the credit quality of the Group’s financial assets and the Group’s maximum exposure to credit risk by credit risk rating grades:
Group
Financial asset
31 December 2020 Note
External rating
Internal rating
12-month lifetime ECL
Gross carrying amount
Kes’million
Loss allowance
Kes’million
Net carrying amount
Kes’million Classification
Equity investments 19
Marked to Market-NSE* N/A Performing 163 (39) 124 FVTOCI
Due from related a company 22 N/A Performing
Lifetime ECL not credit-impaired 163 - 163 Amortized cost
Trade receivables 22 N/A Doubtful
Lifetime ECL not credit-impaired
1,610
______
(764)
______
846
______ Amortized cost 1,936 (803) 1,133
Financial asset
31 December 2019 Note
External rating
Internal rating
12-month lifetime ECL
Gross carrying amount
Kes’million
Loss allowance
Kes’million
Net carrying amount
Kes’million Classification
Equity investments 19
Marked to Market-NSE* N/A Performing 180 (17) 163 FVTOCI
Due from related a company 22 N/A Performing
Lifetime ECL not credit-impaired 172 - 172 Amortized cost
Trade receivables 22 N/A Doubtful
Lifetime ECL not credit-impaired
2,279
______
(633)
______
1,646
______ Amortized cost 2,631 (650)) 1,981

Notes to the Financial Statements (Continued)for the year ended 31 December 2020
FINANCIAL REVIEWBUSINESS OVERVIEW SUSTAINABILITY REVIEW GOVERNANCE2020 OVERVIEW
Setting Industry Standards in Health & Safety
Notes to the Financial Statements (Continued)for the year ended 31 December 2020
BAMBURI CEMENT ANNUAL REPORT & FINANCIAL STATEMENTS 2020 BAMBURI CEMENT ANNUAL REPORT & FINANCIAL STATEMENTS 2020178 179
38. FINANCIAL RISK MANAGEMENT (continued)
(ii) Credit risk (continued)
The tables below detail the credit quality of the Company’s financial assets and the Company’s maximum exposure to credit risk by credit risk rating grades:
Company
Financial asset
31 December 2020 Note
External rating
Internal rating
12-month lifetime ECL
Gross carrying amount
Kes’million
Loss allowance
Kes’million
Net carrying amount
Kes’million Classification
Equity investments 19
Marked to Market-NSE* N/A Performing 163 (39) 124 FVTOCI
Due from related a company 22 N/A Performing
Lifetime ECL not credit-impaired 1,281 - 1,281 Amortized cost
Trade receivables 22 N/A Doubtful
Lifetime ECL not credit-impaired 707 (232) 475 Amortized cost
Loan due from a subsidiary 33(iii) N/A Performing
Lifetime ECL (simplified approach -SPPI)
-
______
-
______
-
______ Amortized cost 2,151 (271) 1,880
Financial asset
31 December 2019 Note
External rating
Internal rating
12-month lifetime ECL
Gross carrying amount
Kes’million
Loss allowance
Kes’million
Net carrying amount
Kes’million Classification
Equity investments 19
Marked to Market-NSE* N/A Performing 180 (17) 163 FVTOCI
Due from related a company 22 N/A Performing
Lifetime ECL not credit-impaired 814 - 814 Amortized cost
Trade receivables 22 N/A Doubtful
Lifetime ECL not credit-impaired 661 (199) 462 Amortized cost
Loan due from a subsidiary 33(iii) N/A Performing
Lifetime ECL (simplified approach -SPPI)
25
______
-
______
25
______ Amortized cost 1,680 (216) 1,464
* NSE: Nairobi Securities Exchange
38. FINANCIAL RISK MANAGEMENT (continued)
(ii) Credit risk (continued))
i) The loss allowance on quoted equities (available for sale assets) measured at FVTOCI is recognized through other Comprehensive Income. See note 19. FVTOCI has been irrevocably elected and applies because the shares are held neither for sale nor are they contingent for business combination
ii) Banks used by the Company are either determined or approved by the ultimate Parent’s Corporate Finance and Treasury (CFT) department in Zurich. The Banks are classified as either Relationship Banks or Niche Banks. Relationship banks are preferred to Niche Banks, any banks outside the Bank List require written approval from CFT in Zurich.
iii) The short term deposits held with LafargeHolcim International Finance, a related party, are carried at amortised cost. The carrying amount of the short term deposits at FVTPL as disclosed in note 23(d) best represents their maximum exposure to credit risk. The Group holds no collateral over any of these balances.
iv) For trade receivables, the Group/Company has applied the simplified approach in IFRS 9 to measure the loss allowance at lifetime ECL (which in the case of the Group/Company is the same as the 12-month ECL). The Group determines the expected credit losses on these items by using a provision matrix, estimate based on historical credit loss experience based on the past due status of the debtors, adjusted as appropriate to reflect current conditions and estimates of future economic conditions. Accordingly, the credit risk profile of these assets is presented based on their past due status in terms of the provision matrix. Notes 19, 22, 23 and 33 include further details on the loss allowance for these assets respectively.
v) For the loan to related parties, the gross carrying amount represents the maximum amount the Company expects to receive in principal payments from its subsidiary - Bamburi Special Products Limited, and the net carrying amount represents the amortized cost of the loan receivable without discounting given that the discounting yields an immaterial difference in the carrying amounts.
(iii) Liquidity risk
This is the risk that the Group will encounter difficulties in meeting its financial commitments from its financial liabilities that are settled by delivering cash or another financial asset. Prudent liquidity risk management includes maintaining sufficient cash to meet the group’s obligations.
Ultimate responsibility for liquidity risk management rests with the Board of Directors, which has developed and put in place an appropriate liquidity risk management framework for the management of the Group’s short, medium and long-term funding and liquidity management requirements. The Group manages liquidity risk by maintaining adequate reserves, banking facilities and reserve borrowing facilities, by continuously monitoring forecast and actual cash flows and matching the maturity profiles of financial assets and liabilities.
The following table analyses the Group’s remaining contractual maturity for its non-derivative financial liabilities with agreed repayment periods. The table has been drawn up based on the undiscounted cash flows of financial liabilities based on the earliest date on which the Group can be required to pay. The tables include both interest and principal cash flows and exclude the impact of netting agreements.
Balances due within 12 months equal their carrying balances, as the impact of discounting is not significant.

Notes to the Financial Statements (Continued)for the year ended 31 December 2020
FINANCIAL REVIEWBUSINESS OVERVIEW SUSTAINABILITY REVIEW GOVERNANCE2020 OVERVIEW
Setting Industry Standards in Health & Safety
Notes to the Financial Statements (Continued)for the year ended 31 December 2020
BAMBURI CEMENT ANNUAL REPORT & FINANCIAL STATEMENTS 2020 BAMBURI CEMENT ANNUAL REPORT & FINANCIAL STATEMENTS 2020180 181
38. FINANCIAL RISK MANAGEMENT (continued)
(iii) Liquidity risk (Continued)
GROUP – Financial liabilities:
Total amount
0-30
days
31-90
days
91-120
days120 days
and aboveKes’million Kes’million Kes’million Kes’million Kes’million
31 December 2020:
Trade payables 3,863 1,467 986 741 669Related party payables 374 132 84 72 86Borrowings 2,191 - - - 2,191Other payables 779 306 97 111 265Accrued expenses 1,367 798 200 91 278
-31 December 2019:
Trade payables 2,819 1,522 740 215 342
Related party payables 1,348 83 511 63 691Borrowings 2,056 - - - 2,056Other payables 821 410 118 123 170Accrued expenses 1,667 941 184 170 372
COMPANY – Financial liabilities:
31 December 2020:
Trade payables 1,560 984 127 239 210Related party payables 549 234 31 86 198Other payables 294 28 44 62 160Accrued expenses 706 142 26 118 466
31 December 2019:
Trade payables 1,640 1,040 123 173 304Related party payables 1,402 38 297 135 932Other payables 153 19 34 85 15Accrued expenses 521 201 98 65 157
39 CAPITAL RISK MANAGEMENT
The Group’s objectives when managing capital are:
• To ensure that entities in the Group will be able to continue as going concerns while maximising the return to stakeholders through the optimisation of the debt and equity balance.
• To maintain a strong capital base to support the current and future development needs of the business.The capital structure of the Group consists of debt, which includes borrowings, cash and cash equivalents and equity attributable to equity holders of the parent, comprising issued capital, reserves and retained earnings.
39 CAPITAL RISK MANAGEMENT (Continued)
The Board of Directors reviews the capital structure on a regular basis. As part of this review, the board considers the cost of capital and the risks associated with each class of capital. Based on the review, the Group analyses and assesses the gearing ratio to determine the level and its optimality.
The Group monitors capital using a gearing ratio, which is net debt divided by total capital plus net debt. Net debt is calculated as total borrowings less cash and cash equivalents. The Group’s policy is to keep the gearing ratio between 20% and 40%, where applicable.
There have been no material changes in the Group’s management of capital during the year.
The constitution of capital managed by the Group is as shown below:
GROUP COMPANY2020
Kes’million2019
Kes’million2020
Kes’million2019
Kes’millionEquity 34,064 32,132 23,145 22,021
DebtBorrowings 2,191 2,056 - -Lease liabilities 450 495 - -Bank overdrafts 136 1,772 - -Less: Cash and cash equivalents (6,387) (3,106) (4,323) (2,289)Net debt (3,610) 1,217 (4,323) (2,289)
Net debt to equity ratio N/A 4% N/A N/A
40. FAIR VALUE OF ASSETS AND LIABILITIES
a) Comparison by class of the carrying amount and fair values of the financial instruments
Fair value is the price that would be received to sell an asset or paid to transfer a liability in an orderly transaction between market participants at the measurement date. The fair value measurement is based on the presumption that the transaction to sell the asset or transfer the liability taKes place either:
• In the principal market for the asset or liability; or
• In the absence of a principal market, in the most advantageous market for the asset or liability
The principal or the most advantageous market must be accessible to by the Company.
The fair value of an asset or a liability is measured using the assumptions that market participants would use when pricing the asset or liability, assuming that market participants act in their economic best interest.
The table below sets out the Group’s classification of each class of financial assets and liabilities, and comparison of the carrying amount and their fair (excluding accrued interest):
GROUP Notes Carrying amount Fair Value
Financial assets2020
Kes’million2019
Kes’million2020
Kes’million2019
Kes’millionOther equity investments 19 124 163 124 163
COMPANYFinancial assetsOther equity investments 19 124 163 124 163

Notes to the Financial Statements (Continued)for the year ended 31 December 2020
FINANCIAL REVIEWBUSINESS OVERVIEW SUSTAINABILITY REVIEW GOVERNANCE2020 OVERVIEW
Setting Industry Standards in Health & Safety
Notes to the Financial Statements (Continued)for the year ended 31 December 2020
BAMBURI CEMENT ANNUAL REPORT & FINANCIAL STATEMENTS 2020 BAMBURI CEMENT ANNUAL REPORT & FINANCIAL STATEMENTS 2020182 183
40. FAIR VALUE OF ASSETS AND LIABILITIES (Continued)
a) Comparison by class of the carrying amount and fair values of the financial instruments (Continued)
Other equity investments are quoted shares at the Nairobi Securities Exchange. Fair value of the quoted shares is based on price quotations at the reporting date.
Management assessed that the fair value of trade receivables, receivables from related companies, cash and cash equivalents, trade payables and payables to related companies approximate their carrying amounts largely due to the short-term maturities of these instruments.
The carrying values of the Company’s loan to subsidiary is determined by using Discounting Cash Flows (DCF) method at discount rate that reflects the market interest rate as at the end of the reporting period.
b) Fair value hierarchy
The table below shows an analysis of all assets and liabilities measured at fair value in the financial statements or for which fair values are disclosed in the financial statements by level of the fair value hierarchy. These are grouped into levels 1 to 3 based on the degree to which the fair value is observable.
i. Level 1 fair value measurements are those derived from quoted prices (unadjusted) in active markets for identical assets or liabilities;
ii. Level 2 fair value measurements are those derived from inputs other than quoted prices included within level 1 that are observable for the asset or liability, either directly (i.e. as a price) or indirectly (i.e. derived from prices); and
iii. Level 3 fair value measurements are those derived from valuation techniques that include inputs for the asset or liability that are not based on observable market data (unobservable inputs)
Level 1 Level 2 Level 3Kes’million Kes’million Kes’million
GROUP31 December 2020AssetsProperty, plant and equipment (Note 15(a))-Freehold land and buildings - - 11,312-Plant and machinery - - 21,945Biological assets - 119 -Fair value designated at FVTOCI - equity securities 124 - -
31 December 2019AssetsProperty, plant and equipment (Note 15(a))-Freehold land and buildings - - 11,254-Plant and machinery - - 21,586Biological assets - 471 -Fair value designated at FVTOCI - equity securities 163 - -
40. FAIR VALUE OF ASSETS AND LIABILITIES (Continued)
b) Fair value hierarchy
Level 1 Level 2 Level 3Kes’million Kes’million Kes’million
COMPANY31 December 2020AssetsProperty, plant and equipment (Note 15(b))-Freehold land and buildings - - 8,383-Plant and machinery - - 9,894Biological assets - 119 --Other quoted investments 124 - -
31 December 2019AssetsProperty, plant and equipment (Note 15(b))-Freehold land and buildings - - 8,307-Plant and machinery - - 9,952Biological assets - 471 --Other quoted investments 163 - -
There were no transfers between levels 1, 2 and 3 in the year.
The Group’s freehold land, buildings, plant, and machinery were last revalued on 1 December 2018 for the parent company and December 2019 for Hima Cement Limited.
The valuations were based on market value as follows:
Comparable method for valuation of land and buildings
Fair value of the properties was determined by using market comparable method. This means that valuations performed by the valuer are based on active market prices, significantly adjusted for difference in the nature, location or condition of the specific property.
The properties’ fair values were based on valuations performed by Knight Frank Valuers Limited, an accredited independent valuer.

Notes to the Financial Statements (Continued)for the year ended 31 December 2020
FINANCIAL REVIEWBUSINESS OVERVIEW SUSTAINABILITY REVIEW GOVERNANCE2020 OVERVIEW
Setting Industry Standards in Health & Safety
Notes to the Financial Statements (Continued)for the year ended 31 December 2020
BAMBURI CEMENT ANNUAL REPORT & FINANCIAL STATEMENTS 2020 BAMBURI CEMENT ANNUAL REPORT & FINANCIAL STATEMENTS 2020184 185
40. FAIR VALUE OF ASSETS AND LIABILITIES (Continued)
b) Fair value hierarchy (continued)
Depreciated replacement cost for plant and machinery
Plant and machinery were revalued on a depreciated replacement cost basis using a valuation model prescribed by engineers and consultants at the technical centre of the ultimate shareholder.
In using the depreciated replacement cost basis the engineers and consultants at the technical centre of the ultimate shareholder ensures that this is consistent with methods of measuring fair value as per the requirements of IFRS 13.
The engineers and consultants ensure that:
1. The highest and best use of the property and machinery is its current use, and
2. The principal market or in its absence, the most advantageous market, exit market, for the property and machinery is the same as the market in which the property and machinery was or will be purchased, entry market.
In addition, the engineers and consultants ensure that the resulting depreciated replacement cost is assessed to ensure market participants are willing to transact for the property and machinery in its current condition and location at this price. The inputs used to determine replacement cost are consistent with what market participant buyers will pay to acquire or construct a substitute the property and machinery of comparable utility. The replacement cost has also been adjusted for obsolescence that market participant buyers will consider.
Description of valuation techniques used and key inputs to valuation of assets and liabilitiesValuation technique
Significant unobservable inputs
Range (weighted average)
Sensitivity of theinput to fair value
Land Market Comparable Approach
Price per acre Between Kes 1 million and Kes 30 million
0.5% (2019: 0.5%)increase (decrease)would result in anincrease/(decrease) infair value by Kes 56.23 million.
Buildings Market Comparable Approach
Estimated rental value per square meter per month.
Kes 30 per square meter
0.5% (2019: 0.5%)increase (decrease)would result in anincrease/(decrease) infair value by Kes 2.0 million.
Rent growth p.a. 5%Plant and machinery
Depreciated replacement cost for plant and machinery
Capital expenditure for a model plant at above capacity assuming supply from China.
Between Kes 1,358 million and Kes 2,729 million.
0.5% (2019: 0.5%)increase (decrease)would result in anincrease/(decrease) infair value by Kes 107.9 million.
Biological assets
Market Price Price for sawdust N/A N/A
40. FAIR VALUE OF ASSETS AND LIABILITIES (continued)
b) Fair value hierarchy (continued)
The significant unobservable inputs used in the fair value measurement of the Group and the Company’s property and equipment are price per acre, estimated rental value per square meter per month and capital expenditure for a model plant at above capacity assuming supply from China. Significant increases/(decreases) in any of those inputs in isolation would result in a significantly lower (higher) fair value measurement.
41. EVENTS AFTER THE REPORTING DATE
As at the date of approval of these financial statements for issue, there were no other material adjusting or non-adjusting events that would require disclosure.
42. COUNTRY OF INCORPORATION
The Company is incorporated and domiciled in Kenya under the Kenyan Companies Act, 2015. The ultimate parent of the Group is LafargeHolcim Ltd, incorporated in Switzerland.