2005-2006 Profile of Aberdeen School District 06-1 - South ...
Upload
khangminh22Category
view
0download
0
www.bang-olufsen.com
Annual Report 2005/06
CVR-No. 41257911
Annual Report 2005/06 Bang & Olufsen Group

Annual Report 2005/06 Bang & Olufsen Group
CVR-No. 41257911
If you wish to skip directly to a specific page, click on the pagenumber from CONTENTS on page 5. You will then go directly tothat page.
CONTENTS - click right HERE.

�
Jørgen WorningChairman
DEAR BANG & OlufSEN SHAREHOlDER,
About a year ago, we announced a change of direction in Bang & Olufsen’s development. After a three year focus on cost reductions and the transition from tube to flat-screen TVs, growth has been at the centre of the Group’s efforts this year. This was made clear in a statement setting out our ambition for a turnover of DKK 6 billion by 2010. Ambitions are something you strive for rather than a precise forecast or objective. Indeed, since no-one can predict how Bang & Olufsen will appear four or five years from now, specific forecasts are announced only on a year by year basis. We are delighted to state, however, that the expectations for the year, as announced in August 2005, have been met, and that our ambitions with regard to a DKK 6 billion turnover by 2010 remain unchanged. The Group’s many skilled employees and dealers have put in an excellent performance throughout the year, and have shown considerable flexibility in their commitment to achieve both turnover and profitability.
Alongside the financial targets, Bang & Olufsen’s ambitions also apply to the creation of unique products that surprise and please our customers. As well as some exciting products for the home, the year saw the launch of the first product for in-car sound, when the first Audi A8 with Bang & Olufsen Advanced Sound System rolled off the assembly line in December 2005. This event marked a milestone in the development of a new, important business area for Bang & Olufsen. As can be seen from the accounts, further resources were invested in the development of new products during the year under review. With these new products, and with the support of our efficient and motivated retail partners, we are succeeding in generating new orders for existing customers while, at the same time, welcoming new customers to the exciting universe of Bang & Olufsen. We hope you will find our Annual Report and Accounts a pleasant, even exciting, read.
Yours sincerely
Torben Ballegaard Sørensen President & CEO

�
Bang & Olufsen a/s, Peter Bangs Vej 15, 7600 Struer, DenmarkTel: +45 96 84 11 22, fax: +45 97 85 18 88, website: www.bang-olufsen.com
CVR-no. �1257911
Place of domicile: Struer
Financial year: 1 June – �1 May
Adoption of the annual report: The annual report is expected to be adopted at the Annual General Meeting, which is held on 28 September, 2006.
Annual General Meeting to be held on Thursday, 28 September, 2006, at 16.�0 at Struer Gymnasium.
Environmental reviews The product-related environmental review, ”To the last detail” - a story about environmental awareness told through the development, production, use and disposal of a specific product.
The reviews are available at www.bang-olufsen.com or from Bang & Olufsen’s Environment Department, tel: +�5 96 8� 10 18.
Financial calendar2006Monday, 21 August, Annual Report (2005/06)Thursday, 28 September, Annual General Meetingfriday, 6 October, Report for the first quarter (2006/07)
2007Wednesday, 10 January, half-year report (2006/07)Wednesday, 25 April, Report for the third quarter (2006/07)Monday, 1� August, Annual Report (2006/07)friday, 28 September, Annual General MeetingMonday, 8 October, Report for the first quarter (2007/08)
Group structure
Branded Non-branded
CORPORATE INfORMATION ETC.
Bang & Olufsen Operations a/s
Bang & Olufsen s.r.o.Koprivnice
Bang & Olufsen Telecom a/s
Bang & Olufsen ICEpower a/s
Bang & Olufsen Medicom a/s
19 national sales companiesSee note ��
Bang & Olufsen a/s
2 subsidiariesSee note ��

5
� Dear Bang & Olufsen shareholder
� Corporate information etc.
6 Bang & Olufsen - a brief history
1� five-year summary, main and key figures
1� Statement by the Management on the annual report
15 Auditors’ report
16 Structure, management and directorships
21 Directors’ report, Bang & Olufsen a/s Group
2� Branded business
27 Non-branded business
28 Expectations for the 2006/07 financial year
�0 Capital structure
�1 Ambitions for the next � years
�� Knowledge resources
�7 Environmental statement
�9 Corporate Governance
�1 Shareholder information
�� Announcements sent to the Copenhagen Stock Exchange
�5 Commercial risks
�9 financial report and notes
CONTENTS

6
BANG & OlufSEN - A BRIEf HISTORY
Although in global terms Bang & Olufsen’s size is modest, the company has achieved world renown for its spectacular, idea-based, quality products within the fields of audio/video products and telephony. Bang & Olufsen recently moved into the Carfi sector and, in a partnership with Audi, has developed a unique sound system for the top of the range, Audi A8. Moreover, several of the world’s leading hotels have installed Bang & Olufsen audio/video products. The company also develops a range of products for the medical technology industry. By an large, all development and product maturation is centred at the Group’s head office in Struer in Western Jutland.
At the end of the financial year, Bang & Olufsen employed 2,�00 people while the company’s products are currently sold in more than 70 countries across the world.
HistoryBang & Olufsen was founded in 1925 by two young Danish engineers, Peter Bang and Svend Olufsen. They met during their studies, and shared an enthusiasm for the new phenomenon of the age: The radio.
The company’s first two years were spent in the “incubator”, i.e. the main building of Svend’s parents’ estate, Quistrup, just outside the town of Struer. At the start, the estate’s young workers assisted the two engineers with their project, but the subsequent employment of 25 people meant that Quistrup started to burst at the seams. Occasionally, Svend’s mother, Anna Olufsen, supplemented the overstretched economy with money from her egg production for the weekly wages.
The first pioneering product, however, was not the mains radio, which the two engineers dreamed about, but the “Eliminator” – a mains receiver that disposed of the need for batteries. The timing was perfect – the Eliminator entered the market as electricity began to be the norm in Danish households. It, therefore, provided Bang & Olufsen with the needed start-up capital, which allowed the business to move into its own factory in the village of Gimsing, which, at the time, was outside Struer, but which today is part of the town.
In the final months of the Second World War, the factory was destroyed by Danish Nazi sympathisers as revenge for Bang & Olufsen’s refusal to work for the German occupying forces, and because many of its employees were involved in the Danish Resistance.
Back to CONTENTS
1
2
�

7
In subsequent years, Bang & Olufsen not only fought to survive in the marketplace, but also fought to rebuild the factory. During the 1950s and 60s, Bang & Olufsen successfully established a recognised name in the Danish market as “The Danish Quality Brand”.
When, at the end of the 1960s, competition from Asian manufacturers forced scores of Danish and European radio and TV factories to close, Bang & Olufsen allied itself with a group of architects and designers and set about focusing on the ideas and the design behind the products as well as on quality. Around the same time, Bang & Olufsen started the sales from abroad that today account for more than 80 % of its revenue.
In the late eighties and early nineties, dark clouds once again gathered over Bang & Olufsen. Earnings did not match the turnover, and the Group had insufficient funds to weather the storm. A largescale disposal of its non-core activities was executed, and a new distribution strategy launched: No longer should Bang & Olufsen’s products be sold through radio/TV stores, which sold a variety of brands, but through dedicated outlets which only dealt in Bang & Olufsen products.
Over the years, Bang & Olufsen shops (B1), have accounted for an increasing share of Bang & Olufsen’s total sales. Bang & Olufsen has also focused on developing a shop in shop concept, where individual dealers can sell Bang & Olufsen’s products if a separate section of the shop is designed according to Bang & Olufsen’s demands and specifications.
The focus on core skills and the distribution strategy has been – and remains – highly successful and has, since the late 90s, contributed to growth in both turnover and revenue on the strength of a healthy financial base.
Since the new millennium, the company has maintained its growth strategy and continues to establish shops worldwide, including shops in new growth regions such as India and China.
Back to CONTENTS
�
5
6
1. Svend Olufsen and Peter Bang, 19��2. The attic room at Quistrup�. Anna Olufsen by the source of the egg money, 1925�. The “Eliminator” 1926-�05. Architect Ib fabiansen’s sectional furniture, 19596. “The Danish Quality Brand”, extract from the maincatalogue, 1960

8
During this period, Bang & Olufsen launched a number of pioneering products, which fully meet the company’s high quality requirements and design, and which, at the same time, set new standards. This not only applies to the world of audio, where Beolab 5 was named one of the world’s finest loudspeakers, but also to the TV segment. In fact, in the spring of 2006, the lCD TV, BeoVision 7-�0, achieved the highest possible score in both sound and picture in the highly respected English trade magazine, “What Plasma & lCD TV”.
In several tests, Bang & Olufsen’s new mobile telephone, Serene, achieved the highest score for sound quality. Bang & Olufsen’s new sound system for Audi A8 has also got off to a good start, where the German motor magazine, “Auto, Motor & Sport”, conducted a comparative study of the high-end category within car stereo systems and reached the unequivocal conclusion: Advanced Sound System currently produces the best car stereo sound.
DistributionTight focus on core skills and the commitment to the dedicated Bang & Olufsen distribution continues to this day, where sales take place through two types of dedicated Bang & Olufsen shops:
- B1-shops, which only sell Bang & Olufsen products- Shop in shop outlets (SIS) where a substantial area of the shop is designed for, and exclusively allocated to, Bang & Olufsen’s products.
Irrespective of where customers purchase Bang & Olufsen products, they will encounter well-trained personnel as Bang & Olufsen uses comprehensive methods for the ongoing training of its shop staff.
Bang & Olufsen’s products are currently available from 725 B1-shops and 596 shop in shops. The B1-shops account for 7� % of the total turnover, while the shop in shop outlets account for 26 %. Bang & Olufsen will continue to focus on these two types of shops with the B1-shops as the most important, and the shop in shop outlets as an important distribution channel in areas, where the demographics do not justify a B1-shop.
Back to CONTENTS
2
�
�
1

9
MarketsBang & Olufsen’s products are today available around the world, and 82 % of the Group’s turnover derives from exports. In a number of markets, operations are handled by Bang & Olufsen’s own subsidiaries, cf. the review on note ��, while sales and distribution development in certain markets are organised by highly qualified business partners.
ProductionMost of Bang & Olufsen’s production is centred in Struer, where the factories are located alongside the Development Department, the Administration and the Group’s Head Office.
During the spring of 2006, Bang & Olufsen’s new factory in the Czech Republic was commissioned. By the end of the financial year, the 1�,000 sq.m. factory employed a workforce of 1�6 who are particularly involved in the production of audio products and assembly work.
The factory can accommodate up to 200 employees and the plan is to achieve this level during spring 2007. The quality requirements for the products manufactured in the Czech Republic are as high as in Struer and are maintained through comprehensive training of the Czech employees and thorough testing of all ready produced components - just as in Struer.
Many components and a few finished products are manufactured by suppliers across the world. A carefully considered in-and outsourcing process aims at optimising efficiency as well as quality.
Production of individual products only begins once the customer has placed his/her order. This negates the need of carrying large quantities of stock, and the risk of not being able to sell the produced products. In addition, the system offers greater flexibility and significantly increases opportunities for adapting the product to the individual customer’s requirements. Most of Bang & Olufsen’s products are manufactured in a very large number of varieties, depending on the customer’s specific wishes.
Back to CONTENTS
1. Beolab 5, August 200�2. BeoVision 7 and Beolab 5, 2005�. B1 shop front at Grand Hyatt, Singapore�. B1 shop layout at Grand Hyatt, Singapore5. Hanging of stand tubes for anodizing6. Dismantling of cold plates after anodizing7. Production of BeoCenter 2
5
6
7

10
Product development“Idealand” and “Idealab” are where the ideas for new concepts and new products are conceived. Just under the roof of the old, renovated factory 1, the concept developers work in close collaboration with external designers and with engineers and technicians in the Development Department to realise the ideas. “Synthesis” is the key word – as technology and design not only go hand in hand, but add a new dimension to each other. The objective is for Bang & Olufsen to launch between three and five new ground-breaking products each year. The factories in Struer continue to play a major role with regard to ensure quality in the assembly and finishing of the products, and they are an important element in the development of new products.
for the roughly 500 engineers and technicians involved in the development of Bang & Olufsen products, the opportunities for direct interaction with the production departments are of the utmost importance in order to ensure that the finished products contain the desired features and quality.
Branded businessfor decades, Bang & Olufsen has provided unique quality products for the home. The branded business has, however, recently expanded into new areas with, for instance, the development of its high-end sound system for Audi’s flagship, the A8. Supported by lens technology and digital ICEpower amplifier technology, the sound system delivers a tone quality, which is unprecedented in cars.
With the launch of the mobile telephone, Serene, Bang & Olufsen has delivered a unique mobile phone which, both in design and performance, stands out from all other equivalent products in the market. In addition, Bang & Olufsen has also put renewed focus on the sale of products to hotels. Consequently, the company is currently represented in more than 100 five star hotels across the world. Among them are the MGM in las Vegas, Hotel Arts in Barcelona, Widder Hotel in Zurich, Sheraton Park Tower in london and Grand Hyatt in Singapore.
Back to CONTENTS
2 �
1

11
Non-branded business Besides the branded business, Bang & Olufsen is engaged, within its non-branded business, in the development, production and sale of compact, digital amplifier units as well as the development and production of products for the medical technology industry.
The subsidiary, Bang & Olufsen ICEpower a/s, is responsible for development, production and sales of digital amplifier modules based on the Bang & Olufsen patented ICEpower technology – a technology that enables very small digital amplifiers to provide extremely high performance with particularly low heat output.
Bang & Olufsen Medicom a/s is the subsidiary responsible for development and production of products for the medical technology industry. These products require a superior degree of production precision - “intelligent products”. During the year under review, Bang & Olufsen Medicom won four awards for its products. “The Helping Hand” tablet dispenser, for example, won the internationally recognised If design award, while Medicom Stethoscope E�000 won The Danish Innovation and Design prize 2006.
Back to CONTENTS
�
1. lens loudspeaker in Audi A8, 20052. Serene, 2005�. Hotel Widder, Zürich�. ICEpower 250A5. Stethoscope E�0006. Tablet dispenser “The Helping Hand”
5
6

12
The key figures are defined as follows:
Profit ratio: Operating profit x 100Net turnover
Return on assets: Operating profit x 100 Average operational assets
Return on invested capital, excl. goodwill: Operating profit before depreciation and goodwill write offsAverage invested capital, excl. goodwill
Return on equity: Bang & Olufsen a/s’ share of result for the year x 100Average equity, excl. minority interests
Current ratio: Current assets Current liabilities
Equity ratio: Equity, end of year x 100 Total equity and liabilities, end of year
financial gearing: Interestbearing debt (net) end of yearEquity, end of year
Net turnover/invested capital, excl. goodwillNet turnover x 100 Average invested capital, excl. goodwill
Earnings per share (nominel DKK 10), DKK:Result after tax Average number of circulating shares
Equity value per share (nom. DKK 10), DKK:Equity, end of year Number of shares, end of year
Price/earnings: Quotation Result per share (nom. DKK 10)
Operating profit
Return on equity
Cash flow
Result before tax
DKK million
500
�00
�00
200
100
0
01/0
2
02/0
�
0�/0
�
0�/0
5
05/0
6
%
50
�0
�0
20
10
0
01/0
2
02/0
�
0�/0
�
0�/0
5
05/0
6
DKK million
600
�00
200
0
-200
-�00
01/0
2
02/0
�
0�/0
�
0�/0
5
05/0
6
DKK million
500
�00
�00
200
100
0
01/0
2
02/0
�
0�/0
�
0�/0
5
05/0
6
Back to CONTENTS

1�
Group (DKK million) 2005/06 200�/05 200�/0� 2002/0� 2001/02
Profit and loss account
Net turnover 4,225 �,7�2 �,61� �,97� �,212
Of which in foreign markets as a
percentage of above 82 82 8� 81 81
Operating profit 439 �72 ��� 296 260
Net financials (8) 8 7 (9) (�5)
Result before tax 431 �80 ��1 290 228
Result for the year 296 265 26� 190 1�9
Balance sheet
Total assets, end of year 2,915 2,78� 2,7�1 2,572 2,50�
Share capital 125 12� 12� 1�� 1��
Equity, end of year 1,744 1,715 1,652 1,551 1,�06
Investment in tangible non-current assets (185) (12�) (1�8) (1�2) (150)
Cash flow for the year (229) 259 28 296 18�
Of which cash flow from:
Operating activities 395 7�0 ��7 6�� ���
Investment activities (379) (2��) (195) (2�5) (22�)
- of which investment in tangible non-current assets (185) (12�) (1�8) (1�2) (150)
- of which investment in intangible non-current assets (171) (125) (1�7) (1�6) (85)
financing activities (246) (2�8) (22�) (102) (25)
Employment
Number of employees at year-end 2,422 2,��1 2,��9 2,6�6 2,871
Ratios
Profit ratio, % 10 10 9 7 6
Return on assets, % 20 18 15 1� 11
Return on invested capital, excl. goodwill, % 63 58 5� �7 �5
Return on equity, % 17 16 16 1� 10
Current ratio 2.3 2.5 2.6 2.6 2.1
Equity ratio, % 60 62 60 60 56
financial gearing 0.5 0.6 0.5 0.5 0.�
Net turnover/Invested capital, excl. goodwill 2.6 2.7 �.� �.5 �.7
Earnings per share (nom. DKK 10), DKK 25 22 22 15 11
Equity value per share (nom. DKK 10), DKK 140 1�1 1�� 115 112
Quotation as at �1 May 684 �89 �55 159 2�5
Price/earnings 27 18 16 10 21
Quotation/equity value 4.9 2.8 2.7 1.� 2.1
Dividend proposed/paid per share
(nom. DKK 10), DKK 16.00 12.00 7.00 7.00 �.50
Parentheses denote negative figures
Main and key figures have been prepared on the basis of IfRS and “Recommendations and key figures 2005” of The Danish
Society of Investment Proffesionals. Comparative figures have been prepared on the basis of “Recommendations and key
figures 1997” of The Danish Society of Investment Professionals
fIVE-YEAR SuMMARY, MAIN AND KEY fIGuRES
Back to CONTENTS

1�
STATEMENT BY THE MANAGEMENT ON THE ANNuAl REPORT
The Board of Directors and the Management have today considered and adopted the annual report for 2005/06 for Bang & Olufsen a/s. The report is prepared in accordance with International financial Reporting Standards as adopted by the European union and additional Danish disclosure requirements for annual reports of listed companies.
We consider the applied accounting policies to be appropriate so that the annual report provides a true and fair view of the Group’s and Parent Company’s assets, liabilities, financial position and result as well as the Group’s cash flow.
We recommend the annual report for adoption at the Annual general Meeting.
Struer, 21 August 2006
The Board of Management of Bang & Olufsen a/s
Torben Ballegaard Sørensen (president and CEO)
Peter Thostrup
The Board of Directors of Bang & Olufsen a/s
Jørgen Worning (chairman)
Torsten Erik Rasmussen (Deputy Chairman)
lars Brorsen
John Svejgaard Christoffersen
Thorleif Krarup
Preben Damgaard Nielsen
Knud Olesen
Ole Kristian Olesen
Peter Skak Olufsen
Back to CONTENTS

15
AuDITORS’ REPORT
Struer, 21 August 2006
DeloitteState Authorised Public Accounting Company
Erik Holst Jørgensen State Authorised Public Accountant
Henrik Z. HansenState Authorised Public Accountant
To the shareholders of Bang & Olufsen a/sWe have audited the annual report of Bang & Olufsen a/s for the financial year 1 June 2005 – �1 May 2006, prepared in accordance with International financial Reporting Standards as adopted by the Eu and additional Danish disclosure requirements for annual reports of listed companies.
The annual report is the responsibility of the Company’s Management. Our responsibility is to express an opinion on the annual report based on our audit.
Basis of opinionWe conducted our audit in accordance with Danish and International Standards on Auditing. Those Standards require that we plan and perform the audit to obtain reasonable assurance that the annual report is free of material misstatement. An audit includes examining, on a test basis, evidence sup-porting the amounts and disclosures in the annual report. An audit also includes assessing the ac-counting policies applied and significant estimates made by the Management, as well as an evaluation of the overall annual report presentation. We believe that our audit provides a reasonable basis for our opinion.
Our audit has not resulted in any qualification.
OpinionIn our opinion, the annual report gives a true and fair view of the Group’s and the Parent’s financial position at �1 May 2006 and of the results of their operations and cash flows for the financial year 1 June 2005 – �1 May 2006 in accordance with International financial Reporting Standards as adopted by the Eu and additional Danish disclosure requirements for annual reports of listed companies.
Back to CONTENTS
16
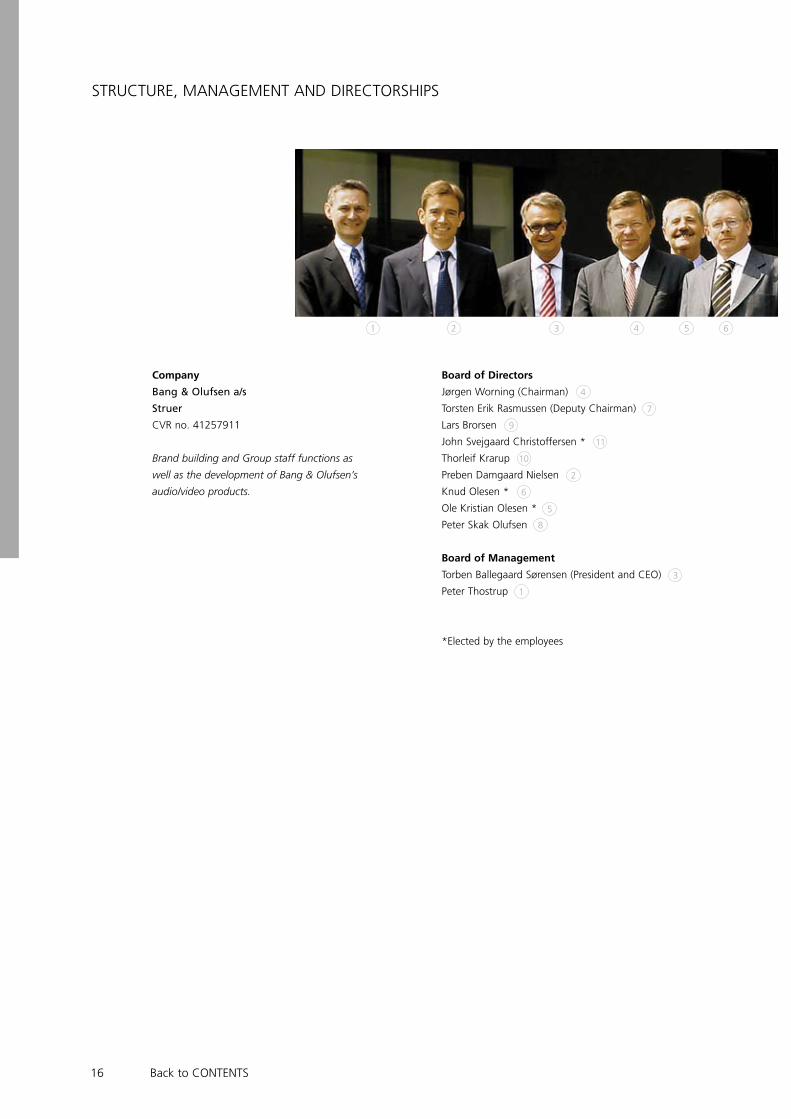
Company
Bang & Olufsen a/s
Struer
CVR no. �1257911
Brand building and Group staff functions as
well as the development of Bang & Olufsen’s
audio/video products.
Board of Directors
Jørgen Worning (Chairman)
Torsten Erik Rasmussen (Deputy Chairman)
lars Brorsen
John Svejgaard Christoffersen *
Thorleif Krarup
Preben Damgaard Nielsen
Knud Olesen *
Ole Kristian Olesen *
Peter Skak Olufsen
Board of Management
Torben Ballegaard Sørensen (President and CEO)
Peter Thostrup
*Elected by the employees
STRuCTuRE, MANAGEMENT AND DIRECTORSHIPS
�
10
2
8
�
1
7
6
9
11
5
1 2 � � 5 6
Back to CONTENTS

17
Directorships in other Danish and foreign companies
with the exception of 100 % owned subsidiaries
Jørgen Worning
flSmidth & CO A/S (CM)
AlK ABEllO A/S (CM)
Torsten Erik Rasmussen
Coloplast A/S
JAI A/S (DCM)
JAI Group Holding ApS
Vola Holding A/S + 1 S
Best Buy Group A/S (CM)
uni-chains A/S (CM)
uni-chains Holding A/S
Vestas Wind Systems A/S (DCM)
A/S Det Østasiatiske Kompagni (DCM)
TK Development A/S (DCM) + 1 S
Amadeus Invest A/S (CM)
ECCO SKO A/S
Schur International A/S
Acadia Pharmaceuticals Inc. + 1 S
NatImmune A/S
Outdoor Holding A/S + 1 S
Arvid Nilsson A/S
Lars Brorsen
Vorsitzender der Geschäftsführung von Jost-World GmbH
+ 1� S
Thorleif Krarup
Group� Securicor Plc.
H. lundbeck A/S (DCM)
Scion DTu A/S
lundbeckfonden
lfI A/S (DCM)
AlK ABEllO A/S (DCM)
Preben Damgaard Nielsen
ROCKWOOl International
IT university in Copenhagen
Giritech A/S
ERP International A/S
ED Equity Partner A/S
Damgaard Company 1 A/S
NOIR.IlluMINATI II Holding A/S
Proactive A/S (CM)
Gladsaxe Theater (CM)
DTu-Innovation
Heart Made (CM)
Excitor A/S
Peter Skak Olufsen
A/S fiil-Sø (CM) + 1 S
Hunsballe frø A/S (CM)
Hedeselskabet (CM)
Dalgas Group A/S (CM) + � S
Skov-Sam Holding ApS
JP/Politikens Hus A/S
EuroGrass BV
Torben Ballegaard Sørensen
SimCorp A/S
lEGO Holding A/S
Bang & Olufsen ICEpower a/s (CM) + 2 S
Peter Thostrup
Nordic Bioscience A/S (CM) + � S
CM = Chairman
DCM = Deputy Chairman
S = Subsidiaries
7 8 9 10 11
Back to CONTENTS

18
Company Board of Directors Board of Management
Bang & Olufsen Operations a/s Peter Thostrup (Chairman) John Christian Bennett-Therkildsen
Struer (100 % owned) Torben Ballegaard Sørensen (CEO)
CVR no. 260�5�06 John Christian Bennett-Therkildsen
Purchasing, production and logistics
for the Bang & Olufsen Group
as well as sale of Bang & Olufsen’s
audio/video products.
Bang & Olufsen s.r.o Michael langager Jensen (CEO)
Koprivnice (100 % owned)
Production of components
for the Group’s audio products.
Bang & Olufsen Medicom a/s Peter Thostrup (Chairman) Henrik Kagenow (CEO)
Struer (100 % owned) Henrik Kagenow
CVR-no. 2�05��15 Torben Ballegaard Sørensen
Exploits Bang & Olufsen’s competencies
within the medico area in cooperation
with current as well as new partners.
Bang & Olufsen Telecom a/s Torben Ballegaard Sørensen (Chairman) Peter Thostrup (CEO)
Struer (100 % owned) Peter Thostrup
CVR no. 2�062112 John Christian Bennett-Therkildsen
Develops and markets new telephony
concepts as a dynamic part of electronic
communication in the home.
STRuCTuRE, MANAGEMENT AND DIRECTORSHIPS (continued)
Back to CONTENTS

19
Company Board of Directors Board of Management
Bang & Olufsen Expansion a/s Peter Thostrup (Chairman) Jakob Odgaard (CEO)
Struer (100 % owned) Torben Ballegaard Sørensen
CVR no. 28698755 Kim Bo Hansen
Sales to new markets and
new business areas.
Bang & Olufsen Automotive G.m.b..H. Jens Peter Zinck (adm.)
Niederwinkling (100 % owned)
Sales.
Bang & Olufsen ICEpower a/s Torben Ballegaard Sørensen (Chairman) Peter Sommer (CEO)
Lyngby-Tårbæk (90 % owned) Henrik Mouritsen
CVR-no. 2505�591 Karsten Nielsen
Jens Peter Zinck
Develops, produces and markets
products based on highly effective
amplifier technologies.
Main banker for all companies
Danske Bank A/S
Auditors for all companies
Deloitte, State-Authorised Public Accounting Company
* Share, Bang & Olufsen ICEpower a/s
Back to CONTENTS

20 Back to CONTENTS

21
DIRECTORS’ REPORT, BANG & OlufSEN A/S GROuP
In the 2005/06 financial year, the Group recorded a turnover of DKK �,225 million against DKK �,7�2 million last year, equating to an increase of DKK �8� million or 1� per cent. The result before tax totalled DKK ��1 million against DKK �80 million last year, i.e. an increase of DKK 51 million or 1� per cent. The result is satisfactory and in line with the Group’s expectations for a result in the region of DKK �20-��0 million.
Operating profit for the 2005/06 financial year totalled DKK ��9 million against DKK �72 million last year. This corresponds to an advance of DKK 67 million or 18 per cent.
The TV portfolio alone produced a DKK 286 million increase in turnover in 2005/06. The positive development stems from the launch of a complete flat-screen TV portfolio which, with the exception of the uS, Japan and Korea, now ranges from a 22” lCD-TV to a 65” plasma TV. As the TV portfolio usually has a lower gross margin than the product portfolio in general, the Group’s gross margin for the year has, as expected, fallen from �6.� per cent to �6.0 per cent, or 0.� percentage points.
The Group has continued to expand its development activities and development costs incurred total DKK 512 million against DKK �15 million in 200�/05. As a result of capitalisations, DKK ��� million was expensed compared to DKK �9� million last year. The net capitalisation effect on profits for 2005/06 was positive by DKK 69 million against DKK 22 million the previous year.
Distribution and marketing costs increased by DKK 77 million from DKK 8�� million to DKK 911 million. The increase is primarily due to costs arising from the acquisition of the Australian distribution, which amounted to DKK �� million.
Administration costs for the year under review were DKK 150 million against DKK 1�7 million last year, an increase of DKK 1� million.
financial items were negative at DKK 7 million, compared to last year’s plus of DKK 7 million. The difference of DKK 1� million is due, inter alia, to exchange rate gains of DKK 1� million in 200�/05, whereas in 2005/06, there was an exchange rate loss of DKK 9 million.
The overall tax rate for the year was �1.� per cent, corresponding to a tax charge of DKK 1�5 million. for the 200�/05 financial year, the tax charge was 115 million equating to �0.� per cent. Thus, the year’s profit after tax was DKK 296 million against DKK 265 million last year. The Group did not capitalise the value of deferred tax relating to the uS.
Viewed separately, turnover for the fourth quarter was slightly better than expected, while the contribution margin was slightly below expectations.
Turnover for the quarter was DKK 1,108 million against DKK 972 million for the fourth quarter last year, equating to growth of DKK 1�6 million. Operating profit totalled DKK 72 million against DKK 102 million last year, while profits before tax for the fourth quarter totalled DKK 6� million against DKK 109 million last year, mainly due to a lower gross ratio during the quarter.
The fourth quarter gross margin was �1.7 per cent, which represents a decrease compared to the fourth quarter last year and also compared to the accumulated gross margin of �7.5 per cent at the end of third quarter. The lower gross margin in the fourth quarter is primarily owing to a shift in the quarter’s product mix following the launch of the new mobile phone, Serene, and the significant emphasis on the newly launched BeoVision 7-�0 TV.
Moreover, the running-in of certain new production processes, the implementation of the RoHS* directive and some instability concerning the supply of critical components have temporarily affected the production efficiency, supply stability and, consequently, the gross margin. The achieved gross margin in the first months of the 2006/07 financial year has reverted to the accumulated level for 2005/06. Distribution and marketing costs for the fourth quarter were DKK 2�2 million against DKK 207 million for the same quarter last year, i.e. an increase of DKK 25 million, of which DKK 1� million can be attributed to costs relating to the Australian distribution operations.
financial items during the fourth quarter were negative at DKK 8 million compared to the previous year’s gain of DKK 8 million. This development is due to negative exchange adjustments, which were positive last year.
Back to CONTENTS

22
The balance sheet increased by DKK 1�1 million from DKK 2,78� million to DKK 2,915 million during the financial year. The increase is primarily attributable to an increase in the funds tied up in inventories and trade receivables. The Group’s inventories increased by DKK 1�8 million during the financial year, while trade receivables were higher by DKK 106 million, not least as a result of a high fourth quarter turnover.
As at May �1, 2006, capitalised development projects totalled DKK �26 million against DKK 258 million as at May �1, 2005.
Investments (net) totalled DKK ��� million against DKK 22� million last year. Of this, investments in development projects account for DKK 165 million against DKK 111 million last year. Capital investments (net) totalled DKK 172 million against DKK 101 million in 200�/05.
The investment in the new factory in the Czech Republic amounted to DKK 7� million in the 2005/06 financial year.
In May 2006, the Group raised a loan of Euro 10 million in connection with the construction of the factory in the Czech Republic. Repayments on long-term loans totalled DKK �9 million against DKK 70 million last year. Dividend of DKK 1�9 million was paid during the year and repurchase of own shares accounted for DKK 1�9 million.
Cash flow for the year was negative at DKK 229 million against a positive cash flow of DKK 259 million for 200�/05.
The Board of Directors recommends that a dividend of DKK 16 per share be paid for 2005/06, i.e. approx. DKK 199 million, and that, over the quarters, a further approx. DKK �00 million be used for the purchase of own shares. As in previous years, the Board of Directors has decided to issue employee shares. Each employee will be allocated up to 12 shares corresponding to the issue of 18,��� employee shares.
Equity was DKK 1,7�2 million against DKK 1,715 million last year.
* During the financial year, the company implemented the new
RoHS directive. This is an Eu directive which, from July 1, 2006,
will restrict the use of hazardous materials in electronics,
and which has significantly impacted on the Group’s production
processes and purchase of raw materials.
Back to CONTENTS

2�
BRANDED BuSINESS
The Group’s branded business comprises the activities marketed under the Bang & Olufsen brand.
The turnover in the Group’s branded business for 2005/06 totalled DKK �,96� million against DKK �,5�7 million last financial year, equating to an increase of DKK �17 million or 12 per cent.
The result before tax for the Group’s branded business was DKK �88 million against DKK �56 million last year, i.e. an improvement of DKK �2 million or 9 per cent.
Development in the marketsPercentage changes are calculated in local currency.
UK and Benelux In the fourth quarter, the uK recorded an increase in turnover of 1� per cent on the same period last year. Although the first three quarters were characterised by a general recession, turnover for the uK for the financial year reached last year’s level, due to fourth quarter growth, and totalled DKK 5�8 million against DKK 5�6 million last year. This equates to an advance of DKK 2 million. The total number of B1-shops in the uK had a net addition of � and, at the end of the financial year, stood at 98.
Sales in the Benelux region were satisfactory. Two years ago, Bang & Olufsen took over the Dutch distribution after which it was decided to rationalise the sales and distribution activities in the Benelux region. This having been accomplished, the Benelux region recorded growth rates of 20 per cent in Holland and 19 per cent in Belgium in this financial year. Agreement still has to be reached with the previous Dutch distributor concerning goodwill payment. A settlement is expected to be reached by arbitration.
ScandinaviaIn Denmark, Bang & Olufsen, to a considerable extent, succeeded in capitalising on its product launches through its broad and effective distribution network while benefiting from strong Danish private consumption. Denmark is now the Group’s largest market. Turnover totalled DKK 558 million against DKK 511 million in 200�/05.
The number of shop in shop outlets fell by 12 to 1�0 during the financial year. As there was a net addition of 5 B1-shops, there are now �8 B1-shops in total.
In Sweden, the stagnating turnover in 200�/05 was turned into growth of 11 per cent in 2005/06. The improvement to the B1-distribution network contributed to Sweden’s good result.
Norway again failed to exploit market potential satisfactorily. As a result, Norway only recorded � per cent growth on the year.
Central EuropeCentral Europe continues the growth in turnover that has characterised these markets since the start of the financial year. The rise in turnover was most significant in Switzerland with 18 per cent, while Germany advanced by 1� per cent and Austria by 6 per cent compared to 200�/05.
The continuing positive development in Central Europe stems from three factors. Bang & Olufsen’s product portfolio in 2005/06, not least within TV, appealed to consumers. The ongoing rationalisation of the distribution and marketing also made a significant contribution. finally, the distribution continued to expand with the net addition of 10 B1-shops in the region. Moreover, the upgrading of 22 multi-brand shops to shop in shops was undertaken.
Southern EuropeThe Southern European markets, france, Spain, Portugal and Italy, continue their positive development achieving two digit growth rates. france increased turnover by 17 per cent on the year while Spain/Portugal advanced by 25 per cent. Italy also saw positive development with a growth of 11 per cent year on year.
The growth in the region is also due to the strong product portfolio and the ongoing efficiency and quality improvements to the distribution. Overall, the region saw a net addition of 10 new B1-shops.
Back to CONTENTS

2�
North AmericaIn the uS, the wholesale business showed a small advance in turnover on the year. Overall turnover in the uS, including sales in own retail shops, was DKK 25� million in 2005/06 against DKK 270 million for the same period last year. The lack of growth in 2005/06 in this market is partly owing to the ongoing reorganisation of the distribution, and partly to bottlenecks on the product side in the form of supply shortages or launch shifts concerning certain key products. In the new financial year an addition of 5-8 new B1-shops is expected and the product programme is expected to expand through i.e. a new large format TV and a uS version of the successful BeoVision 7-�0 TV with effect from the second half-year.
Asia and overseas marketsIn Asia, focus remains on expanding distribution. Working with partners with extensive brand experience, the strategy is to penetrate these markets with high profile-shops in the region’s metropolises. Bang & Olufsen’s two new markets, China and India, are developing positively. Consequently, during the financial year, 5 new shops were opened in China, where the number has now reached 10. One new B1-shop opened in India, which now has a total of � B1-shops.
Number of shops per segment Turnover share per segment
(active shops at the end of each year)
Definitions of shop segments
B1: Shops, which are dedicated retailers of Bang & Olufsen products
SIS: Shop in shop with a sales area dedicated for Bang & Olufsen products
�1/5 2005
�1/5 2006
Number
of shops
800
700
600
500
�00
�00
200
100
0
200�/05
2005/06
%
80
70
60
50
�0
�0
20
10
0
B1 SIS Other B1 SIS Other
Back to CONTENTS
25
In Japan, the Group recorded a decline, but a revitalised sales organisation and distribution is expected, together with the launch of the new BeoSystem � TV product, to provide a platform for renewed growth.
In Australia, in the second quarter, Bang & Olufsen took over the country’s 15 B1-shops. The transfer is now complete while efficiency measures and quality improvements in retailing and marketing in order to ensure stable growth and earnings continue.
The development in Russia and in the Middle East were satisfactory with two digit growth rates achieved for the year under review.
Other Asian and overseas markets experienced certain variations in turnover. The result was total sales of DKK �67 million compared to DKK �06 million last year.
Overall distribution developmentAt the end of the 2005/06 financial year, 1,�72 shops worldwide were selling Bang & Olufsen’s products. Of these, 725 were B1-shops and 596 shop in shops. 51 shops were operating in the “other” multi-brand shop category.
At the start of the financial year, the Group’s objective was to maintain focus on improving the quality of the distribution and open 50 new B1-shops (net) during the year based on the opening of 60-70 shops. While 8� B1-shops were opened or upgraded, �0 B1-shops were closed. Thus 5� B1-shops (net) were opened.
The turnover in B1-shops with a minimum of two years in operation rose by 9 per cent on the year.
New business development
Advanced sound systems for cars (CarFi)In December, Bang & Olufsen launched its first advanced sound system for cars in close collaboration with Audi. Audi A8 and S8 are the first cars to be equipped with the new system, which is built upon innovative Bang & Olufsen technologies, including the digital ICEpower amplifier technology and the acoustic lens that optimises sound performance of treble and mid-range in the cabin.
This advanced sound system sets new standards for high-end car stereo, with Bang & Olufsen Advanced Sound System winning several prizes and awards.
The system has been particularly well received in the market, with sales exceeding expectations.
Sales to the hotel industry During the financial year, the Group increased its global efforts with regard to sales of audio/video equipment to the hotel industry. At the close of the financial year, Bang & Olufsen’s products were presented in more than 100 five-star hotels across the world.
Turnover within the hotel area (Enterprise) totalled DKK 55 million against DKK �9 million the previous year, corresponding to an advance in turnover of DKK 16 million. Besides the continued co-operation with the Hyatt, Radisson Edwardian, Starwood and Rocco forte hotel chains, solutions have been supplied to more prestige hotels, and partnership agreements have been signed with the five-star hotel chains, four Seasons, Mandarin Oriental and Shangri-la. This offers Bang & Olufsen the opportunity to obtain orders for audio/video solutions for these hotels over the next few years.
Production and developmentThe establishment of the new 1�,000 square metre production facility in the Czech Republic has proceeded as planned. At the end of January, the workmen put the finishing touches to the new factory in Koprivnice, and a few days later, the first finished products were despatched from the new production facility in the Czech Republic. During the fourth quarter, the spare parts warehouse was also relocated from Struer to the new factory where, by the end of the financial year, 1�6 people were employed. It is expected that staffing will reach the planned level of 200 in the spring of 2007.
Work continues on the globalisation of the Group’s development activities and the network of development partners has been expanded to partners in Rumania, India and Taiwan. In addition, the Group has acquired the majority shareholding in the software company, liewenthal, in Estonia.
Back to CONTENTS
26
Product launches during the financial year
The Group’s massive effort with regard to product development resulted in a range of strong, new products during the financial year 2005/06.
In the second quarter, the Group introduced BeoVision 7-�0, a �0” lCD-TV with an integrated DVD player and unique picture quality. The TV is supported by two different sound concepts: Beolab 7-2 is a powerful stereo center loudspeaker, while Beolab 7-�, with its acoustic lens technology, has been specially developed for surround sound for home cinema. Both television and loudspeakers have won several renowned awards. In the second quarter, the Group also introduced Beolab �, a compact and highly flexible loudspeaker at an attractive price level. The loudspeaker can be combined with BeoSound � and other Bang & Olufsen music systems and is also highly suitable as a PC loudspeaker.
In the third quarter, the mobile phone, Serene, was successfully launched in Europe, ukraine and Russia. The telephone was designed by Bang & Olufsen and developed and produced in partnership with Samsung.
In the audio and acoustic area, the Group launched a range of new audio products in the fourth quarter, which are unique in concept, functionality and design. BeoSound � is a stationary music system with CD, fM and digital radio, while BeoSound � is a genuine portable solution with an integrated, rechargeable battery, soft-touch operation and clock-radio function. The two music systems, BeoSound � and BeoSound � both have digital SD-card functionality. BeoSound � makes it easy to copy CDs to the SD-card, which can be played back on BeoSound � or on MP�-players as Bang & Olufsen’s BeoSound 2.
During the financial year, the Group also launched BeoMedia, which integrates PC and internet access into Bang & Olufsen systems, and the first wireless solution for sound distribution in an uncompromising quality throughout the home, Beolink Wireless 1.
Back to CONTENTS
27
The Group’s non-branded business comprises the activities marketed independently of the Bang & Olufsen brand, i.e. Bang & Olufsen Medicom a/s and Bang & Olufsen ICEpower a/s.
Bang & Olufsen Medicom a/s develops and manufactures products for the medico-technical and pharmaceutical industries, while Bang & Olufsen ICEpower a/s develops and manufactures efficient, compact and intelligent amplifier modules that are sold to Bang & Olufsen itself and to external partners.
Bang & Olufsen Medicom a/s During the financial year, Medicom received new orders and increased sales to existing customers. Turnover for Bang & Olufsen Medicom totalled DKK 198 million for the financial year against DKK 18� million last year, equating to an advance of DKK 1� million or 8 per cent. The result before tax was a profit of DKK 1� million against DKK 22 million last year, i.e. a fall in result before tax of DKK 9 million.
The decline in profits is due to a lower gross margin compared to last year where in addition a project-based non-recurring income occurred. The company’s development costs during the financial year totalled DKK 1� million against DKK 8 million in 200�/05, and relate to the continued strengthening of the product portfolio within medico-technical products, i.e. within ”Patient Compliance Devices”, where Medicom has a strong position in the new and growing market for medical dosing systems.
Bang & Olufsen ICEpower a/sTurnover for Bang & Olufsen ICEpower doubled during the financial year from DKK 50 million to DKK 100 million. The turnover partly derives from royalties in connection with the sale of amplifier technology and acoustic solutions for major partners, including Samsung, and income realised in connection with sales of standard amplifier modules. More than 90 per cent of ICEpower’s turnover is externally based.
As ICEpower continues to invest in technology development, the drive to attract new customers remains a focus area. The result before tax was a profit of DKK �0 million against a profit of DKK 2 million last year, i.e. an improvement of DKK 28 million.
NON-BRANDED BuSINESS
Back to CONTENTS

28
ExPECTATIONS fOR THE 2006/07 fINANCIAl YEAR
Turnover in the branded businessThe aim is to generate growth in turnover through organic growth and the expansion of new business areas. The following factors are considered the most important in achieving the goal:
1. Product portfolioThe year will offer a broad portfolio of differentiated products in order to ensure the right balance in the product mix. Of the anticipated product launches in 2006/07, the following should be mentioned:
· BeoSystem � was launched in Japan and uSA in July and in Europe in August. BeoSystem � is a strong, global TV platform, which sets new standards for picture quality and sound performance. · In the first and second quarter, the Group expects to launch a new audio/video centre, BeoCenter 6-2� and BeoCenter 6-26. It comes with a 2�” and a 26” screen respectively and with integrated fM and digital radio. BeoCenter 6, in its expression, carries on the successful BeoVision 6 family.
· In the second quarter the launch of a bluetooth earset, Earset 2 is expected, which, with two microphones and a special microprocessor, can filter away any disturbing sound and ensure very high sound quality.
· In addition, during the second quarter, Bang & Olufsen will launch a quality loudspeaker, BeoVox 1, which can be built directly into the wall, a so-called ”in-wall speaker”, which, for instance, builds on the Carfi experience. This loudspeaker can be used everywhere in the home, including wet rooms, as well as an outdoor loudspeaker.
· In the second quarter and starting on the uS market, Bang & Olufsen will roll out a new global flagship within flat-screen TVs, which, together with the loudspeaker programme, will offer a special cinematic experience.
· In the third quarter, a new loudspeaker, Beolab 9, will also be launched. It will appear in a pioneering design and incorporate Bang & Olufsen’s advanced lens technology. Beolab 9 will be equipped with a particularly powerful amplifier to ensure highly authentic sound. In performance as well as price level, Beolab 9 will take over the position previously held by the large column-shaped loudspeaker, Beolab 1.
· In the second half-year the new TV concept, BeoVision 8 will be launched. This is targetted at customers who have so far purchased the classic Bang & Olufsen Mx-series, and will be available in two screen sizes, a 26” version and a �2” version. This TV, like the Mx series, has a ’casual’ design and is placed easily in the home
· In the fourth quarter, the successful BeoVision 7, �0”, will be launched in the uS, Japan and Korea.
· In the fourth quarter, the Group further expects to launch an integrated DVD-recorder/player.
2. Distribution developmentDuring the 2005/06 financial year, Bang & Olufsen had a net addition of 5� B1-shops. The Group expects to maintain this positive development through a net addition of approx. 50 new B1-shops in 2006/07.
3. MarketingIn its marketing, the Group will continue to focus on the brand’s substance and product-related qualities. The aim remains to improve and intensify efficient dialogue marketing, which will link the customer to the individual Bang & Olufsen shop and to the brand. Bang & Olufsen will maintain its general communication presence through for instance national and international advertising.
Back to CONTENTS

29
4. New business areas (CarFi)During the new financial year, Bang & Olufsen expects to announce further contracts for other Audi models. Moreover, selective sales and prototype work is in progress vis-a-vis other leading car makers, and the Group expects to announce new partnership agreements during 2006/07. In total, Automotive is expected to record a turnover of between DKK 50-70 million in 2006/07. In terms of profit contribution, however, this business area will continue to impact negatively on the Group’s EBIT, as new projects require both investment and costs in 1-2 years prior to the launch. Based on the successful launch of the sound system in A8/S8 as well as the forthcoming new products, it is expected that the Carfi area will account for substantial business within the next few years.
ProfitabilityOn the cost side, a high level of activity in the development area is expected to continue, while the level for development costs within the audio/visual area will be slightly lower than over the past two to three years. The net effect of capitalised development costs will, therefore, be lower than last year.
It is anticipated that the gross margin for the year will be on a par with the 2005/06 financial year.
Non-branded businessICEpower is expected to maintain its positive development, both through royalties and through the sale of standard amplifier modules. Bang & Olufsen Medicom’s turnover is expected to fall below last year’s level and profits to be around zero as a key production agreement has been terminated as was expected.
Expectations for the Group’s result for 2006/07The summer months have proceeded satisfactorily with turnover above last year. for the 2006/07 financial year, expectations are for turnover growth of 8-10 per cent and result before tax of DKK �60 – 500 million.
Back to CONTENTS

�0
Bang & Olufsen operates in a sector with very frequent and significant changes in technology. Distribution development largely takes place through retailer-owned shops, but in certain markets it might from time to time be necessary to acquire established retail networks. The draw on liquidity in individual financial years is characterised by considerable seasonal variations. The Group will occasionally be faced with small or medium-sized acquisition opportunities within new business areas and new fields of technology.
Based on this, Bang & Olufsen has a need for sufficient capital reserves and the Group will therefore, as a long-term average, aim at an equity ratio of �0-50 per cent and net interest-bearing debts in a range between 0.25 and 2.00 times earnings before interest, depreciation, amortisation and tax (EBIDAT).
Excess liquidity will be used either for dividend or for purchase of own shares. The Group’s dividend policy states that no less than one third of the company’s results after tax will be paid as dividend. Based on the above policy and due to the company’s strong financial position, the Board of Directors recommends that a dividend of DKK 16 per share be paid for 2005/06, i.e. approx. DKK 199 million, equating to two-thirds of the year’s result after tax, and that, over the quarters, a further approx. DKK �00 million be used for the purchase of own shares.
CAPITAl STRuCTuRE
Back to CONTENTS

�1
last year, Bang & Olufsen declared its ambition of achieving a level of turnover of around DKK 6 billion within five years. This to be achieved at the same time as profitability with an EBIT of at least 10 per cent is maintained. Based on the recently presented accounts the company believes that the ambition is both intact and realistic.
AMBITIONS fOR THE NExT fOuR YEARS
Back to CONTENTS

�2 Back to CONTENTS
1
2
�
�
9
7
10
5
6
8
1. The cube, used for acoustic measuring 2. listening panel �. Viewing panel �. Anodisation 5. Aluminium surface for BeoCenter 2 6. Assembling of sub-components 7. Medicom, Struer 8. ICEpower, lyngby 9. Workplace, Koprivnice 10. Production of BeoCom 1�01, Koprivnice

��
KNOWlEDGE RESOuRCES
Bang & Olufsen’s vision is to constantly question the ordinary in search of surprising, long-lasting experiences – a vision that demands a very high level of innovation in product development as well as in day-to-day operations, i.e. production, distribution, organisation and management. Bang & Olufsen, therefore, focuses strongly on maintaining and developing the skills that form the core of the company’s innovative abilities. In practice, this means that, within these areas, Bang & Olufsen constantly tests the limits of the possible.
Product development:for many years, Bang & Olufsen has placed considerable emphasis on innovation and on systematising innovation so that, today, an innovative spirit pervades the entire organisation. Taking its starting point in the company’s vision, innovation is embedded into Bang & Olufsen’s culture and values, such as excellence, originality, synthesis and passion. This is deeply rooted in the corporate culture, where employees have a natural passion for innovation, and where excellence and originality are strived for. Every difference or disagreement is used as a basis for finding better solutions – a synthesis.
As part of this culture and the innovative environment, Bang & Olufsen has divided its product development activities into separate stages.
Responsibility for the early stages, when the concept is born, lies with Idealand and Idealab which employ �0 highly qualified professionals from different backgrounds, who continually develop new concepts. Each individual maintains an ongoing dialogue with, and seeks inspiration from, external sources, including customers. The employees have, for example, access to Bang & Olufsen’s customer database where customer feedback is collated and analysed. Product development also takes place in close collaboration with external designers, employees from other parts of the organisation, in particular the Development Department, and with external partners, who provide valuable input for the process. When matured and approved, the concepts are transferred to the Development Department, which is responsible for the construction and realisation of unique concepts. There are, of course, close links between Idealand and the development process to ensure an efficient transition.
Bang & Olufsen’s core competencies are directed at enhancing the user’s experience, when using the products. This applies to the more technical competencies (as described in the following) as well as to the process competencies that drive the entire innovation process, i.e. concept development, technology, platform, quality and project management and ongoing process improvements.
Acoustic competencies:Sound is one of Bang and Olufsen’s core competencies and combines several knowledge areas, including basic acoustics, electro-acoustics, signal processing, highly effective amplifiers and psycho-acoustics. Bang & Olufsen’s Development Department in Struer employs around �0 acoustic specialists with a broad background – primarily, however, PhDs, Diploma and Civil Engineers. four are exclusively dedicated to acoustic research. The group has unique measuring facilities at its disposal, which includes a large measuring room for acoustic free field measurements, several sound studios, and special facilities for the development of sound in cars. A trained and competent listening panel critically assesses the sound quality of all Bang & Olufsen’s products. Over the years a platform of compact loudspeakers has been created with built-in amplifiers that offer extremely high acoustic performance. This platform now applies to the entire product portfolio.
The most recent major advance are the automatic adjustment of lower frequencies from the loudspeaker to the room and the acoustic lens created in partnership with Sausolito Audio Works. The Beolab 5 loudspeaker, offering these advanced systems, is much admired by audio enthusiasts around the world and several international magazines have named the Beolab 5 one of the world’s finest loudspeakers. The most recent spin off from Bang & Olufsen’s acoustic expertise is a unique in-car sound system, which has set new standards for sound in cars.
The continued development of Bang & Olufsen’s skills is ensured through partnerships with European and American universities. At Aalborg university in Denmark, Bang & Olufsen specialists have participated in the Sound Quality Research unit under the four-year centre contract. The work has resulted in a series of scientific articles and one patent.
Back to CONTENTS

��
Picture competency:Bang & Olufsen’s picture competency is founded upon a combination of basic knowledge about the way, in which we perceive picture quality, video signal processing, use of the TV screen and optimisation of the entire optical system from the screen to the eye. To exploit this knowledge, Bang & Olufsen has set up a number of special facilities, including a viewing room, where the viewing panel makes critical evaluations of Bang & Olufsen’s own and its competitors’ TVs. The aim is to optimise the picture quality in Bang & Olufsen TVs so that, irrespective of light conditions, they offer the best possible picture in the market.
Recent years have seen a radical transition from tube to flat lCD- and plasma screens, where the best displays ensure the ultimate picture quality. Only the most recent generation of high quality lCD- and plasma screens are built into Bang & Olufsen’s flat screen products. Moreover, the transition from analogue to digital picture processing continues to gather pace. Bang & Olufsen has been preparing for this for quite some time, building up the competencies now used in the products.
The picture experience is also affected by the glass plate in front of the lCD- and plasma screen. This, too, is an area where Bang & Olufsen has accumulated considerable competence. Consequently, all Bang & Olufsen TVs come with high tech front glass, which improves contrast and reduces screen reflections.
Bang & Olufsen’s long-standing development work within the field of picture quality is expressed in the Vision Clear platform, which enhances picture quality for all types of video products.
Operation competency:Operation competency combines behavioural psychology, tactability, mechanics, graphics and software, which are crucial for the development of user-friendly operations of the products. A special room has been designed for testing by psychologists who, together with users, test the operation. All details are recorded and subsequently analysed in order to enhance the operations. Around ten employees are continually employed in developing the products’ operation, including two who work exclusively on user-friendliness.
Since the mid-1980s, all controls have been integrated into one remote control, currently Beo �, a unique product which offers simple operations for the whole product portfolio. One press on the DVD button, for instance, switches on the TV, DVD and loudspeakers. With this one touch of the remote control, customers who have installed the Beoliving concept can regulate lighting, activate a projector, unroll the film screen and slide back the curtains. The same remote control and operating principles apply across all products.
Mechanical competency:The unique design of Bang & Olufsen’s products largely derives from the freedom given to its designers. This freedom is rooted in the very substantial mechanical construction skills available within the Development Department and the advanced material processes used in the production. The material quality, a strong Bang & Olufsen characteristic, is owing to the deliberate focus on, among other things, aluminium and plastic as well as close and enduring partnerships with key suppliers.
Bang & Olufsen has accumulated very substantial knowledge with regard to anodisation, treatment and surface treatment of aluminium. To take an example, the aluminium surface of a BeoCenter 2 is anodised so the aluminium contains a number of minute pores allowing signs and figures to be printed. As a result of the subsequent hardening process, the surface is extremely tough so that signs and figures are indelible. Bang & Olufsen’s high tech anodisation plant can colour aluminium surfaces in a variety of colours.
The production processes are ISO 9000 accredited and the Development Departments hold ISO 9001 certification.
The Development Department possesses special skills in terms of producing robust constructions of critical mechanical details and integrating high quality movements in the products.
Back to CONTENTS

�5
Global development:In the future a bigger part of the development and implementation work will be carried out outside Denmark. Bang & Olufsen has signed co-operation agreements with partners in, for instance, Estonia, Rumania and India where, in close collaboration with the specialists in Struer, software for new products is being developed. Moreover, the Group is in the process of establishing a small development centre in the Czech Republic with particular focus on mechanical competencies.
All idea and concept development activities will remain in Struer, the heart of the Group’s identity. As a result, the Group intends to invest substantially in its employees’ competencies, methods and tools – which, in turn, will strengthen Struer as the centre of product development.
Partnership with universities:Partnerships with knowledge centres, including universities, are a natural part of life at Bang & Olufsen and an important factor in the ongoing development of its core competencies. Bang & Olufsen has a long tradition for such partnerships and works with universities in Europe and North America. In this process, importance is attached to both research and its practical application. Bang & Olufsen’s development engineers also take part in professional networks and conferences.
The partnership is based on an updated research strategy, which is based on participation in research in all core competency areas. Each area has a “research gatekeeper”, who is responsible for the research undertaken by PhD students and financed by Bang & Olufsen.
Partnerships with suppliers:Bang & Olufsen enjoys close partnerships with some of the world’s foremost suppliers in areas where Bang & Olufsen does not itself possess the requisite knowledge and competencies. These partners do not only supply components for Bang & Olufsen’s production, but also knowledge and skills for the development of the products. This is, for instance, the case with regard to flat screens, loudspeakers, DVD, Digital Video Broadcasting (DVB) and software development.
Development centres:The development of audio/video, automotive and medico products is based at Bang & Olufsen’s central development department in Struer, while ICEpower is situated in lyngby, north of Copenhagen, close to Denmark’s Technical university. A development and innovation unit for software is sited at Alexandra Park in Århus, and works closely with Århus university. Over the next few years, a development group focusing on mechanics will be established at the new factory in the Czech Republic. In this case, too, the intention is to exploit the opportunities provided by the proximity to the university of Ostrava.
Production and development:In recent years, Bang & Olufsen has been continually and systematically involved with product and distribution development as well as implementing rationalisation on all areas, including the reduction of production and capacity costs. The guiding principles in this work have been innovation, simplification and focus. This targetted approach has also resulted in the establishment of the first production unit outside Denmark. In february 2006, Bang & Olufsen commissioned a 1�,000 sq. m. factory in the Czech town of Koprivnice which, at the close of the financial year, employed a workforce of 1�6. The new factory is an important component in Bang & Olufsen’s future, balanced production, in that a range of more labour-intensive tasks will be undertaken here. The factory has, for instance, taken over some pre-assembly work as well as the completion of a substantial part of Bang & Olufsen’s audio products. Struer, however, will continue to be the centre of the Group’s innovation with regard to product development. Moreover, production in Struer will place stronger emphasis on the introduction of new products, not least flat-screen TVs. Concurrent with these changes, new skills will be needed from employees in the Danish production and several hundreds have already taken part in a range of courses. The same is the case with the production employees in the Czech Republic, who have received intensive training to ensure that the extremely high quality level is identical in the Danish and Czech production processes.
Back to CONTENTS

�6
Organisation/Management:Several independent surveys have, in the past few years, revealed that Bang & Olufsen enjoys a strong image - both as a business and as a workplace. Most recently, the Reputation Institute in Copenhagen named Bang & Olufsen as the company with the best reputation in Denmark in 2006. Inside Bang & Olufsen, a great deal of work is concentrated on enhancing the working environment as well as providing opportunities for management and employees in terms of career development and the upgrading of skills. During the past financial year, approximately 1,000 employees participated in training programmes of a shorter or longer duration at a total cost of more than DKK 10 million. 250 production employees, for example, signed up for a two-year “Skills development in the production (KuP)” course. focusing on the ability and desire for professional development, the course has provided the participants with new insight into logistics, quality processes and finance. In addition, 1�0 managers have undergone a competence enhancement programme while 80 participated in different types of project management programmes. five managers have completed degrees such as MBAs or MMTs. Over the past few years, Bang & Olufsen has directed considerable focus on competence development for managers and employees and such efforts will continue. Consequently, the budget for the coming financial year allocates a similar amount as last year for skills enhancement programmes for employees and management.
.
Back to CONTENTS
�7
ENVIRONMENTAl STATEMENT
Environmental policyAll human activity impacts on the surrounding environment. This also applies to the production and use of Bang & Olufsen’s products.
Bang & Olufsen continually strives to minimise environmental impact and to establish a balance between such impact and our products’ qualities, economic viability, lifetime and aesthetics. Our wish is to be an industry leader in this respect. We communicate openly about environmental issues and publish an annual environmental statement.
Committed to contributing to globally sustainable development, we assess our activities from a life cycle perspective. We will of course comply with environmental legislation at all times.
Development: (concept, design and construction)In this creative process, the product’s environmental properties are determined. The aim is to reduce environmental impact during the subsequent life cycle phases.
Raw materials:Our choice of materials aims at avoiding components that can cause environmental issues.
Production:In our choice of production methods and production equipment, cleaner technologies have high priority.
We prioritise the near environment and the creation of a safe and healthy working environment for our employees. Our objective is to improve the physical as well as the psychological working environment.
When selecting suppliers we ensure that they accept responsibility for the environment. We wish to maintain a continuing dialogue with each individual supplier to create the right environmental conditions for the part of the product’s life cycle for which the supplier is responsible.
Transport:We make environmental demands on our transport operators in terms of a high degree of utilisation and optimum application of technology for the transport units.
Application:Our aim is for our products to be enjoyed without problems in the customer’s home environment, that the products have an extended life, and that they have a low energy consumption.
Disposal:Our aim is to provide product parts that are suitable for recycling, and that major parts can be identified when dismantled in order to ensure appropriate disposal and recycling.
Environmental issuesThe Bang & Olufsen logo is a guarantee of quality. We want our customers to buy Bang & Olufsen products in the knowledge that we have made intelligent decisions on their behalf – also in respect of environmental issues.
Based on life cycle analyses of our products, we know that the biggest environmental impact from Bang & Olufsen’s products is energy consumption while in use. Consequently, it has been natural for us to focus our environmental efforts on the product environment area on reducing the products’ energy consumption during stand-by. Between 2000 and the close of 2005, this resulted in a decrease in the products’ sales weighted stand-by consumption of 61 per cent for TV-sets and �0 per cent for audio-products.
During the past year, efforts have been directed at the two Eu directives, WEEE* and RoHS**. With effect from August 2005, WEEE introduced manufacturer responsibility for electrical and electronic waste within the Eu, i.e. manufacturers must ensure and finance the collection and reprocessing of their own products from the end user. We have met this responsibility by joining collective, national collection arragements.
RoHS prohibits the use of four heavy metals from July 2006, including lead in soldering as well as two brominated flame retardants. We have found alternatives to traditional lead soldering and have ensured that all our suppliers can supply components that comply with the RoHS requirements. The two brominated flame retardants were already phased out of our products at the beginning of the 90s.
Back to CONTENTS

�8
A further product-directed Eu directive, the EuP Directive***, has been adopted, which will impact on the products’ energy consumption while used by the end user. As mentioned above, Bang & Olufsen has focused on this area for some time, and we have already achieved substantial reductions. Consequently, we do not expect the directive to present significant challenges.
No external environmental issues have, or could have, a significant impact on Bang & Olufsen’s financial position. Bang & Olufsen’s Mechanics factory has been approved in accordance with the Danish Environmental Protection Act’s section 5. In connection with changes to processes or production layouts, the objective is to eliminate or limit pollution whenever possible. We maintain a regular dialogue with the authorities to find the best solutions and minimise pollution, e.g. by using cleaner technologies (BAT****).
Bang & Olufsen prepares an annual environmental statement, which details environmental aspects in relation to production at our factories, including consumption of raw materials, electricity, water and heat as well as waste volumes.
We also prepare a product-related environment review ”To the last detail, a story about environmental awareness told through the development, production, use and disposal of a specific product.” “To the last detail” has been produced for BeoCenter 1, BeoSound �200, Beolab 1 and BeoCenter 2. The most recent review concerns products in the Automotive business area.
”To the last detail” and the environmental review can be obtained by contacting the Environment Department on +�5 96 8� 10 18.
* WEE is an abbreviation of Waste Electrical and Electronic
Equipment 202/96EC, which determines manufacturer
responsibility for the collection and reprocessing of end of life
electronic products.
** RoHS is an abbreviation of Restriction of Hazardous
Substances 2002/95/EC. In the electronics industry, this
primarily relates to the switch to unleaded soldering.
*** EuP is an abbreviation of Energy using Products. 2005/�2/EC.
for the electronics industry, the directive primarily concerns
the reduction of the products’ energy consumption, while
used by the customer.
**** BAT is an environmental term ”Best Available Technology”
(easiest accessible or cleaner technology).
Back to CONTENTS

�9
CORPORATE GOVERNANCE
In March 2001, the Danish Ministry of Economic and Business Affairs established a committee to review the need for recommendations for good corporate governance in Denmark and present proposals for the formulation of such recommendations. To contribute to the continued development of Corporate Governance in Denmark the Copenhagen Stock Exchange subsequently established a committee for good corporate governance.
This work has resulted in reports on Corporate Governance in Denmark and a number of recommendations for good corporate governance.
On the basis of the Nørby Committee’s report, the Board of Directors of Bang & Olufsen a/s considered the general implementation level with regard to corporate governance in the Board’s work.
The general principles behind the report’s specific recommendations have, for several years, been applied by the Board.
In the reports it is recommended that the Board of Directors assesses the expediency of any articles of association concerning voting rights’ differentiation and, in its annual report, consider whether it is possible and desirable to eliminate this differentiation.
Bang & Olufsen a/s’ share capital is divided into A shares and B shares (multiple voting shares and ordinary shares respectively). The Board is of the opinion that the current division into two share classes is currently appropriate for securing the company’s continued and stable development. The Board will continually assess the expediency of the aforementioned division.
The reports recommend that information relating to individual directors’ and members of the Management Board’s share-based incentive schemes be published in the company’s annual report.
Members of Bang & Olufsen’s Board of Directors do not benefit from incentive schemes. Incentive-based remuneration of the Board of Management are published in accordance with the regulations pertaining at any given time.
With regard to other specific recommendations in the reports, the Board of Directors will continually assess these as part of its considerations on good corporate governance in order to safeguard the company’s and stakeholders’ interests in the best possible way.
Back to CONTENTS

�0
Development in quoted share price for
Bang & Olufsen’s ordinary shares compared
to the C20-index as at 31 May
Market value of shares compared to equity
as at 31 may
Bang & Olufsen share price
C-20-index
Market value of shares
Equity
Share price
700
600
500
�00
�00
200
100
0
01/0
2
02/0
�
0�/0
�
0�/0
5
05/0
6
DKK million
9,000
8,000
7,000
6,000
5,000
�,000
�,000
2,000
1,000
0
01/0
2
02/0
�
0�/0
�
0�/0
5
05/0
6
Ordinary shares (multiple voting shares) not listed on the
Copenhagen Stock Exchange are included at the same
price as the ordinary shares
Back to CONTENTS
�1
IR policyBang & Olufsen aims to provide:- The Copenhagen Stock Exchange- Current and potential investors- Share analysts and stockbrokerswith all relevant information about the Group rapidly and concisely.
The objective of the information is to:- Increase investor awareness of Bang & Olufsen in Denmark and abroad- Provide investors with structured, current and planned information, which will satisfy information requirements relating to investments in the Bang & Olufsen ordinary share.
The information, and the provision of such information, must always be in conformity with current regulations as issued by the Copenhagen Stock Exchange or other relevant bodies.
Internal rules regarding insider knowledge and trade in the company’s sharesIn conformity with the Danish Securities Trading Act, the company maintains an insider register of persons, who owing to their position, are deemed to have access to insider knowledge about the company. The company has set up internal rules for such individuals.
The individuals, which are included in the insider register and subject to the internal rules, are Board members and members of the Management Board of Bang & Olufsen a/s, other directors and senior managers who report directly to the Board of Directors or the Management Board of Bang & Olufsen a/s, elected auditors and other employees of Bang & Olufsen a/s who may have access to insider knowledge.
Also included are Board members and members of the Management Board, other directors and senior managers in Bang & Olufsen a/s’ subsidiaries, including the Group’s foreign companies if their positions are deemed to provide access to insider knowledge.
All Board members, members of the Management Board and other insider-registered employees in the Bang & Olufsen a/s group may only buy or sell shares in Bang & Olufsen a/s for a period of � weeks after publication of the company’s annual, half-year or quarterly reports or other publications of financial nature.
The Bang & Olufsen shareBang & Olufsen’s ordinary shares are listed on the Copenhagen Stock Exchange and were included in the C20-index as at 19 June, 2006. The company’s identification code is DK 0010218�2-9.
The quotation on Bang & Olufsen a/s´ ordinary shares has increased from �89 as at �1 May, 2005 to 68� as at �1 May, 2006, which equals 295 points or an increase of approx. 76 per cent.
Between 1 June, 2005 and �1 May, 2006, the Copenhagen Stock Exchange’s OMx C20-index increased by approx. �6 per cent.
During the same period, the market value of Bang & Olufsen a/s´ ordinary shares increased from DKK �,�9� million to DKK 7,750 million.
The share capital consists of: Ordinary shares (multiple voting shares)1,119,910 of DKK 10 DKK 11,199,100 Ordinary shares11,��1,015 of DKK 10 DKK 11�,�10,150 DKK 12�,509,250Circulating sharesIssued shares 12,�50,925 - Own shares (669,587) 11,781,��8
Average no. of circulating shares 11,872,�82
Own sharesAs at �1 May, 2006 Bang & Olufsen a/s’ holding of own shares was valued at DKK 6,695,870 equating to 5.�8 per cent of the share capital.
Shares held by members of the Management BoardAs at �1 May 2006, members of Bang & Olufsen a/s’ Management Board held nominally DKK 2,000 ordinary shares (multiple voting shares) and nominally DKK 5,860 ordinary shares.
Share option programmeBang & Olufsen’s established share option programme comprises a number of the Group’s directors. As at �1 May 2006, the total pool of options consisted of 17�.208, which can be exercised during the period 2006 -2010. for further information, please see note 5.
SHAREHOlDER INfORMATION
Back to CONTENTS

�2
List of shareholders in accordance with the Financial Statements Act, section 104(Individuals or corporations owning 5 per cent or more of the company’s nominal capital or the share capital’s voting rights).
As at �1 May 2006, Bang & Olufsen a/s had approx. 16,600 registered shareholders corresponding to an ownership interest of approx. 77 per cent of the share capital. As at �1 May 2006, the following shareholders were entered in the company’s register in accordance with the Danish limited Companies Act, section 28b:
Nominal amount Capital Votes t. DKK % %
lønmodtagernes Dyrtidsfond, Vendersgade 28, 1, 1�6� Copenhagen K 6,��0 5.16 1�.�7Nordea Companies Danmark A/S, Torvegade 2, 1786 Copenhagen V �,�67 2.78 9.5�ATP, Kongens Vænge 8, ��00 Hillerød 1�,�99 11.65 6.��fl Group, Sudurlandsbraut 12, 108 Reykjavik, Iceland * 12,5�� 10.10 5.56Kirsten og Peter Bang a/s, c/o Peter frithiof Bang, Ahlmannsallé 19, 2900 Hellerup 1,15� 0.9� 5.12Bang & Olufsen a/s, Peter Bangs Vej 15, 7600 Struer 6,696 5.�8 �.��
* As announced by fl Group to the Copenhagen Stock Exchange and Bang & Olufsen a/s on 6 March 2006.
Dividend policyThe Group’s dividend policy aims at paying at least one third of the result after tax as dividend. Due to the strong liquidity, the Board of Directors also this year propose to pay an extraordinarily large dividend of DKK 16 per nom. DKK 10 share, i.e. DKK 199 million. This will be proposed to the Annual General Meeting. Dividend paymentDividend is expected to be paid on Wednesday � October, 2006. The following share analysts covered Bang & Olufsen at the end of the financial yearABG Sundal Collier (Peter Kondrup)Alfred Berg ABN AMRO Alm. Brand Henton (Michael Kjær)Carnegie Bank A/S (lars Topholm)CaZenove (Kenneth leiling)Cheuvreux Intl ltd (Peter Knox)Danske Equities (fasial Kalim Ahmad)Enskilda Securities (Niels leth)GP Børsmæglerselskab (Dan Wejse)Gudme Raaschou Bank (Peter Molkte)Handelsbanken (Klaus Madsen)Jyske Bank (Rune Møller)Nordea (Torben Sommer)Oppenheim (Anne Gronski)
Back to CONTENTS

��
Stock Exchange announcements regarding Financial statements: 15 August, 2005 Annual Report for the financial year 200�/05 � October, 2005 Change to International financial Reporting Standards (IfRS) 7 October, 2005 Report for 1st quarter 2005/06 11 January, 2006 Half-year report 2005/06 19 April, 2006 Report for �rd quarter 2005/06
Other Stock Exchange announcements: � June, 2005 financial calender 8 September, 2005 Notice of Annual General Meeting 28 September, 2005 Resolutions taken at Annual General Meeting 7 October, 2005 Employee shares
Stock Exchange announcements regarding insider trading: 17 August, 2005 6 September, 2005 � October, 2005 1� January, 2006 17 January, 2006
Stock Exchange announcements regarding share buy-back: 2� August, 2005 2 September, 2005 1� September, 2005 18 October, 2005 27 October, 2005 7 November, 200520 January, 2006 2� January, 2006 �1 January, 2006 9 february, 2006
The announcements can be read in full at www.bang-olufsen.com under Corporate Info (investors).
ANNOuNCEMENTS SENT TO THE COPENHAGEN STOCK ExCHANGE BETWEEN JuNE 2005 – MAY 2006
Back to CONTENTS

��
The year’s net flow in key currencies
DKK million
1,200
1,100
1,000
900
800
700
600
500
�00
�00
200
100
0
-100
-200
EuR
GBP
CH
f
SEK
uSD
NO
K
JPY
Back to CONTENTS

�5
Markets and competitionAlthough the Group’s products are marketed globally, most of the turnover derives from Europe. The company is a niche player in an industry dominated by major international electronics businesses.
The company differentiates itself in terms of design, quality and innovation. Over a number of years, the company has established a selective distribution system with dedicated Bang & Olufsen dealers. The combination of innovative products and a dedicated distribution has positioned the company as a supplier of luxury goods rather than exclusively audio/video products.
The company can be affected by economic trends in the countries, where the Group’s products are sold, as well as by new technological initiatives by the industry’s main players.
Sales trends are seasonal with the main emphasis on the period from October to January. In order to comply with the commercial challenges, substantial investments are made in product development and flexible production.
SuppliersThe Group is dependent on a large number of suppliers, primarily from Europe and Asia, and strives to maintain long-term supplier relations with regard to the purchase of development services and production goods. Bang & Olufsen endeavours to ensure that supplies of critical raw materials are assured through contracts and agreements and, when possible, through co-operation with several suppliers.
EmployeesBang & Olufsen wishes to retain its position as an exciting and attractive workplace. Consequently, focus is on individual personal and career development by maintaining and creating interesting and challenging jobs throughout the Group. Each year, the Group, therefore, actively contributes to, and invests in, a range of training programmes for its employees.
InsuranceBang & Olufsen’s insurance policy stipulates that insurance policies must cover any damage arising to Bang & Olufsen’s assets and any claims that Bang & Olufsen may incur so that such damage or claims do not impact on the company’s capital and future operations to any significant extent. Consistent with this, the Group can be self-insured in respect of minor risks, while major risks are fully insured. When deemed financially beneficial, insurances contain an excess.
In respect of the above, a global insurance programme has been established to include all-risk, operational losses, business and product responsibility.
Bang & Olufsen has a written contingency plan and works continually with risk management in order to protect against damage to own and contractors’ facilities.
The Group’s management of financial risksAs a result of the Bang & Olufsen Group’s extensive international activities, the profit & loss account, balance sheet and equity are exposed to a number of financial risks at any given time.
These risks comprise:- foreign exchange risk- Interest rate risk- Credit risk- liquidity risk
Bang & Olufsen continually assesses these risks at Group level. It is the Group´s policy not to speculate in financial instruments. Therefore its financial management is solely directed towards the management of financial risks in relation to operations and financing.
Foreign exchange riskIn 2005/06, 82 % of the Group’s turnover are in foreign currency. Since the Group’s purchasing policy is to match purchasing and sales currencies to the greatest possible extent, the figure does not express the Group’s foreign exchange risk.
The Group has net inflows in EuR, GBP and CHf, while uSD accounts for the most significant exposure on the outflow side.
COMMERCIAl RISKS
Back to CONTENTS

�6
The Group’s foreign exchange risks are managed centrally by the parent company’s finance department based on a foreign exchange policy approved by the board of directors. forward contracts are used to continuously cover the financial year´s net positions. These forward contracts are classified as hedging and fulfil the accounting requirements for hedging future cash flow. forward contracts are used for commercial transactions only.
The Group’s net monetary items in foreign currencies appears from note �0.
fluctuations in foreign exchange rates of 5 % for GBP, 5 % for CHf and 10 % for uSD against DKK can be expected to impact on the Group’s result before tax by 5 %, � % and � % respectively. Historically, the GBP and uSD rates have often moved in the same direction. for the Group, this means that the impact from these two main currencies has had an opposite effect on the Group’s result, as the Group has net inflows in GBP and net outflows in uSD.
Besides the foreign exchange risk relating to current transactions, the Bang & Olufsen Group’s equity is affected by foreign exchange risks relating to the translation of the Group’s foreign subsidiaries from local currencies to DKK. The translation risk is of no significance to Bang & Olufsen’s annual report.
Interest rate riskThe Group’s interest rate risk relates to the interest-bearing debt and the interest-bearing assets.
The Group’s interest-bearing assets consist mainly of liquid funds, which at year end totalled DKK 50� million. liquid funds yield interest on the short-term money market. The interest rate risks are deemed to be insignificant in that a change in the interest rate level of 0.5 % for 2005/06 would have impacted on the Group’s result before tax by approx. DKK 2 million.
At year end, the Group’s interest-bearing debt totalled DKK 28� million corresponding to 9.7 % of the balance sheet total.
The interest-bearing debt is of a medium-term nature. for further information, please see note �2.
Due to the low debt level and the fact that borrowings are exclusively in fixed interest loans, the Group’s interest rate risks are insignificant and are not expected to impact significantly on the Group’s result.
Credit riskThe Group’s most important primary financial instruments comprise trade receivables and bank deposits. The amounts at which these balance sheet items are recognised correspond to the maximum credit risk.
At the end of the financial year, the Group was selling its products through 1,�72 dealers worldwide. In view of the large number of dealers and the wide geographical spread, and the fact that the Group has no substantial concentrations of credit risk, the Group regards the credit risk in relation to receivables as limited.
The individual dealers, including their geographical location, are subject to ongoing evaluation. When deemed necessary, the Group employs bank guarantees or debtor insurance against outstanding debts. losses relating to receivables have been at a minimal level over the past four years.
liquid funds are placed with financial institutions with high credit ratings. Derivatives, including foreign exchange forward contracts, are entered into with such institutions only.
It is deemed, therefore, that the credit risk relating to liquid funds is of no significance to Bang & Olufsen’s annual report.
Liquidity risk The financial reserve is continually assessed and managed by the parent company’s finance department. This ensures that, at any given time, there is sufficient, flexible and unused assurance credit available provided by major, reputable financial institutions. On the basis of its financial reserve arrangements, the Group believes that there is no reason for expecting liquidity issues.
The liquidity risk, therefore, is not significant in relation to Bang & Olufsen’s annual report.
Back to CONTENTS

�7Back to CONTENTS

�8 Back to CONTENTS

�9
Financial report 51 Profit and loss account 52 Balance Sheet 55 Cash flow statement 56 Statement of changes in equity
Notes 61 1 Accounting principles applied 81 2 Significant accounting estimates and judgements
Notes to the profit and loss account 82 � Segment - information 85 � Net turnover 86 5 Expenses, further information 9� 6 Dividend 9� 7 financial income 9� 8 financial costs 95 9 Tax on result for the year 95 10 Minority interests’ share of result for the year 95 11 Earnings per share Notes to the balance sheet 96 12 Intangible assets 98 1� Tangible assets 102 1� Investment property 10� 15 Impairment of assets 10� 16 Investments in subsidiaries 10� 17 Investments in associates 105 18 Deferred tax assets 106 19 Other financial receivables 106 20 Inventories 107 21 Trade receivables 107 22 Receivables from subsidiaries 107 2� Income tax receivable 108 2� Other receivables 108 25 Non-current assets classified as held for sale 108 26 Share capital 109 27 Retained earnings 109 28 Minority interests 110 29 Pensions 112 �0 Deferred tax 112 �1 Provisions 11� �2 financial liabilities 115 �� Income tax 116 �� Other payables
Notes to the cash flow statement 116 �5 Adjustments 116 �6 Change in working capital 116 �7 Acquisitions of activities 116 �8 Cash and cash equivalents
Notes - without cross reference 117 �9 fees to the auditors 117 �0 Contingent liabilities and other financial commitments 119 �1 financial instruments 120 �2 Related parties 122 �� Companies in Bang & Olufsen Group
fINANCIAl REPORT AND NOTES
Back to CONTENTS

50

51
PROfIT AND lOSS ACCOuNT
Notes ...
� ...
5 ...
5 ...
5 ...
5 ...
6 ...
7 ...
8 ...
9 ...
10 ...
11 ...
Bang & Olufsen a/s Group Parent company
(DKK million) 2005/06 200�/05 2005/06 200�/05
Net turnover 4,225.2 3,742.2 914.1 265.1
Production costs (2,282.7) (2,005.7) (�87.�) (252.7)
Gross profit 1,942.5 1,736.5 526.8 12.4
Development costs (��2.9) (�9�.�) (��9.�) -
Distribution and marketing costs (910.6) (8��.6) - -
Administration costs etc. (150.1) (1�7.�) (�1.2) (20.�)
Operating profit 438.9 372.2 56.2 (8.0)
Result from investments in associates after tax (1.0) 0.� - -
Impairment of investments in associates - - (17.0) -
Dividend - - 200.0 1�2.0
financial income 17.7 �0.7 1�.� 50.�
financial costs (2�.9) (2�.5) (19.9) (21.9)
Net financials (7.2) 7.2 (6.5) 28.5
Result before tax 430.7 379,8 232.7 152.5
Tax on result for the year (1��.7) (11�.9) (10.1) (6.5)
Result for the year 296.0 264.9 222.6 146.0
Attributable to:
Share holders of the parent company 29�.0 265.1
Minority interests 2.0 (0.2)
296.0 264.9
Earnings per share
Basic earnings per share, DKK 2�.8 21.9
Diluted earnings per share, DKK 2�.7 21.9
Basic earnings per share from continuing operations, DKK 2�.8 21.9
Diluted earnings per share from continuing operations, DKK 2�.7 21.9
Proposed profit distribution:
Retained earnings 2�.� (2.9)
Proposed dividend for the financial year 199.2 1�8.9
222.6 1�6.0
The proposed dividend corresponds to a dividend of DKK 16 per share (DKK 12 in 200�/05).
Parentheses denote negative figures or figures to be deducted
Notes: See pages 61 - 122
Back to fINANCIAl REPORT AND NOTES

52
BAlANCE SHEETASSETS
Bang & Olufsen a/s Group Parent company
(DKK million) �1/05 06 �1/05 05 �1/05 06 �1/05 05
Intangible assets
Goodwill 18.0 19.� �.2 �.2
Acquired rights 12.1 1�.� 8.� 10.�
Completed development projects 216.� 176.� 186.1 -
Development projects in progress 109.8 81.9 100.� -
Total intangible assets �56.2 291.8 298.0 1�.6
Tangible assets
land and buildings ��2.8 282.5 91.0 98.0
Plant and machinery 200.7 201.5 11.2 7.0
Other equipment 58.2 �9.7 �1.9 12.6
leasehold improvements 26.6 29.9 0.2 0.5
Tangible assets in progress and
prepayments for tangible assets �9.1 5�.� �.1 0.5
Total tangible assets 667.� 617.0 1�8.� 118.6
Investment property 0.7 0.8 87.� 9�.6
Financial assets
Investments in subsidiaries - - 728.2 862.7
Investments in associates 6.0 7.0 - 17.0
Deferred tax assets 28.8 ��.� - �.0
Other financial receivables �6.� 28.7 - -
Total financial receivables 71.2 80.1 728.2 88�.7
Total non-current assets 1,095.5 989.7 1,252.0 1,109.5
Inventories 567.� �29.7 0.2 0.2
Receivables
Trade receivables 655.1 5�8.8 - -
Receivables from subsidiaries - - 156.8 92.7
Income tax receivables 16.6 22.6 1�.8 -
Other receivables 51.� �5.9 12.6 2.8
Prepayments 25.5 15.2 �.0 �.�
Total receivables 7�8.6 6�2.5 188.2 98.8
Cash 502.5 7�1.9 �06.1 5�7.�
Non-current assets classified as held for sale 1.1 - - -
Total current assets 1,819.6 1,794.1 494.5 636.4
Total assets 2,915.1 2,783.8 1,746.5 1,745.9
Notes ...
12, 15 ...
1� ...
1� ...
16 ...
17 ...
18 ...
19 ...
20 ...
21 ...
22 ...
2� ...
2� ...
25 ...
Notes: See pages 61 - 122
Back to fINANCIAl REPORT AND NOTES

5�
BAlANCE SHEETEQuITY AND lIABIlITIES
Notes: See pages 61 - 122
Bang & Olufsen a/s Group Parent company
(DKK million) �1/05 06 �1/05 05 �1/05 06 �1/05 05
Equity
Share capital 12�.5 12�.1 12�.5 12�.1
Share premium account 1�.6 9.� 1�.6 9.�
Translation reserve (�.7) 1.1 - -
Retained earnings 1,60�.6 1,577.9 1,256.0 1,299.1
Equity attributable to shareholders of the parent company 1,7�8.0 1,712.5 1,�95.1 1,��2.6
Minority interests �.1 2.1 - -
Total equity 1,742.1 1,714.6 1,395.1 1,432.6
Non-current liabilities
Pensions 15.5 8.5 - -
Deferred tax 6�.7 65.5 62.7 -
Provisions 86.6 6�.6 �.6 1.�
Mortgage loans 107.2 120.7 66.9 79.�
loans from banks etc. 129.7 87.5 62.5 87.5
Total non-current liabilities �02.7 ��5.8 196.7 168.2
Current liabilities
Mortgage loans ��.9 �7.� �7.5 �7.�
loans from banks etc. 1.� 1.8 - -
Provisions �1.1 50.9 0.2 0.2
Trade payables 208.0 208.0 29.0 16.5
Income tax 78.� 72.0 - �0.7
Other payables �66.7 �11.8 88.0 60.2
Deferred income �9.9 �1.5 - 0.1
Total current liabilities 770.� 72�.� 15�.7 1�5.1
Total liabilities 1,173.0 1,069.2 351.4 313.3
Total equity and liabilities 2,915.1 2,783.8 1,746.5 1,745.9
Notes ...
26 ...
27 ...
28 ...
29 ...
�0 ...
�1 ...
�2 ...
�2 ...
�2 ...
�2 ...
�1 ...
�� ...
�� ...
Back to fINANCIAl REPORT AND NOTES

5�
Purchase of intangible assets and
amortisation
Purchase of tangible assets and
depreciation
Amortisation
Purchase of intangible assets
DKK million
200
150
100
50
0
01/0
2
02/0
�
0�/0
�
0�/0
5
05/0
6
Depreciation
Purchase of tangible assets
DKK million
200
150
100
50
0
01/0
2
02/0
�
0�/0
�
0�/0
5
05/0
6
Back to fINANCIAl REPORT AND NOTES

55
Bang & Olufsen a/s Group Parent company
(DKK million) 2005/06 200�/05 2005/06 200�/05
Result for the year 296.0 26�.9 222.6 1�6.0
Depreciations, amortisations and impairment losses 2�2.� 2��.5 1�8.5 �5.�
Adjustments 162.1 111.8 �0.1 (7.�)
Change in working capital (188.2) 69.8 (76.7) 157.1
Interest received etc. 17.7 �0.7 1�.� 50.�
Interest paid etc. (2�.9) (2�.5) (19.9) (21.9)
Income tax paid (100.�) �2.9 (��.6) 51.9
Cash flow from operating activities 394.6 740.1 264.4 411.4
Purchase of intangible non-current assets (171.�) (12�.7) (151.6) (8.9)
Purchase of tangible non-current assets (185.2) (122.9) (2�.5) (12.0)
Additions regarding investment property - - (2.�) -
Sale of intangible non-current assets - 2.1 - -
Sale of tangible non-current assets 1�.5 22.1 0.� �.1
Additions regarding investments in subsidiaries - - - (��.�)
Dividend received from associates - 2.0 - -
Acquisitions of activities (27.7) - - -
Change in financial receivables (7.7) (12.0) - -
Cash flow from investment activities (378.5) (233.4) (177.1) (61.2)
Proceeds from long-term loans 7�.6 - - -
Repayment of long-term loans (�8.8) (69.5) (�7.�) (�7.�)
Dividend paid (1�9.0) (86.7) (1�9.0) (86.7)
Dividend, own shares 5.7 �.2 5.7 �.2
Repurchase of own shares (1�8.9) (105.5) (1�8.9) (105.5)
Subscription of employee shares 5.6 �.0 5.6 �.0
Tax relating to share option programme - 0.2 - -
Sale of own shares 5.� 6.5 5.� 6.5
Cash flow from financing activities (245.5) (247.8) (318.6) (215.9)
Change in cash and cash equivalents
- cash flow for the year (229.4) 258.9 (231.3) 134.3
Cash and cash equivalents 1 June 7�1.9 �7�.0 5�7.� �0�.1
Cash and cash equivalents 31 May 502.5 731.9 306.1 537.4
CASH flOW STATEMENT
Notes ...
�5 ...
�6 ...
�7 ...
�8 ...
Parentheses denote capital expenditure
Notes: See pages 61 - 122
Back to fINANCIAl REPORT AND NOTES

56
Bang & Olufsen a/s, Group
Equity attributable to equity holders of the parent company Minority Total
(DKK million) interests
Share
premium Translation Retained Equity
Share capital account reserve earnings Group
Equity 1 June 2004 123.8 5.7 - 1,522.4 - 1,651.9
Accumulated effect at the beginning of the year
from changes to accounting principles applied - - - (�2.2) 2.� (�9.9)
Adjusted equity as at 1 June 200� 12�.8 5.7 - 1,�80.2 2.� 1,612.0
Equity and exchange rate adjustments in subsidiaries - - 1.1 �.� - 5.�
Change in fair value of financial instrument - - - 0.2 - 0.2
Subscription of employee shares - - - 7.5 - 7.5
Grant of share options - - - 2.9 - 2.9
Tax related to share options - - - 0.2 - 0.2
Net income recognised directly in equity - - 1.1 15.1 - 16.2
Retained earnings - - - 265.1 (0.2) 26�.9
Total recognised income and expense for the period - - 1.1 280.2 (0.2) 281.1
Subscription of employee shares 0.� �.7 - - - �.0
Purchase of own shares - - - (105.5) - (105.5)
Sale of own shares - - - 6.5 - 6.5
Dividend paid regarding 200�/0� - - - (86.7) - (86.7)
Dividend, own shares - - - �.2 - �.2
0.� �.7 - (182.5) - (178.5)
Equity 31 May 2005 124.1 9.4 1.1 1,577.9 2.1 1,714.6
STATEMENT Of CHANGES IN EQuITY
Parentheses denote negative figures or figures to be deducted
Back to fINANCIAl REPORT AND NOTES
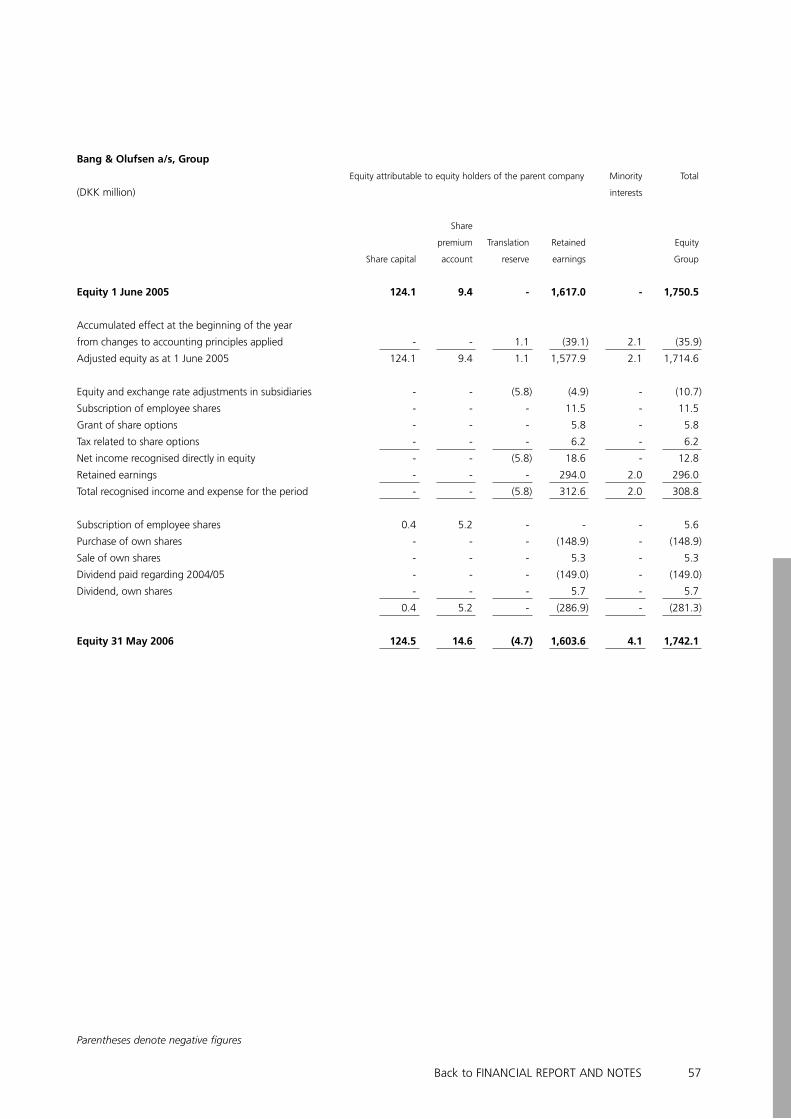
57
Parentheses denote negative figures
Bang & Olufsen a/s, Group
Equity attributable to equity holders of the parent company Minority Total
(DKK million) interests
Share
premium Translation Retained Equity
Share capital account reserve earnings Group
Equity 1 June 2005 124.1 9.4 - 1,617.0 - 1,750.5
Accumulated effect at the beginning of the year
from changes to accounting principles applied - - 1.1 (�9.1) 2.1 (�5.9)
Adjusted equity as at 1 June 2005 12�.1 9.� 1.1 1,577.9 2.1 1,71�.6
Equity and exchange rate adjustments in subsidiaries - - (5.8) (�.9) - (10.7)
Subscription of employee shares - - - 11.5 - 11.5
Grant of share options - - - 5.8 - 5.8
Tax related to share options - - - 6.2 - 6.2
Net income recognised directly in equity - - (5.8) 18.6 - 12.8
Retained earnings - - - 29�.0 2.0 296.0
Total recognised income and expense for the period - - (5.8) �12.6 2.0 �08.8
Subscription of employee shares 0.� 5.2 - - - 5.6
Purchase of own shares - - - (1�8.9) - (1�8.9)
Sale of own shares - - - 5.� - 5.�
Dividend paid regarding 200�/05 - - - (1�9.0) - (1�9.0)
Dividend, own shares - - - 5.7 - 5.7
0.� 5.2 - (286.9) - (281.�)
Equity 31 May 2006 124.5 14.6 (4.7) 1,603.6 4.1 1,742.1
Back to fINANCIAl REPORT AND NOTES

58
Bang & Olufsen a/s, parent company
(DKK million)
Reserve for net
revaluation
Share according to Equity
premium the equity Retained parent
Share capital account method earnings company
Equity 1 June 2004 123.8 5.7 208.6 1,313.8 1,651.9
Accumulated effect at the beginning of the year
from changes to accounting principles applied - - (208.6) 7.9 (200.7)
Adjusted equity as at 1 June 200� 12�.8 5.7 - 1,�21.7 1,�51.2
Change in fair value of financial instrument - - - 0.2 0.2
Subscription of employee shares - - - 7.6 7.6
Grant of share options - - - 2.5 2.5
Grant of share options, subsidiaries - - - 0.� 0.�
Tax regarding employee shares and share options - - - 2.2 2.2
Other corrections - - - 1.0 1.0
Net income recognised directly in equity - - - 1�.9 1�.9
Retained earnings - - - 1�6.0 1�6.0
Total recognised income and expense for the period - - - 159.9 159.9
Subscription of employee shares 0.� �.7 - - �.0
Purchase of own shares - - - (105.5) (105.5)
Sale of own shares - - - 6.5 6.5
Dividend paid regarding 200�/0� - - - (86.7) (86.7)
Dividend, own shares - - - �.2 �.2
0.� �.7 - (182.5) (178.5)
Equity 31 May 2005 124.1 9.4 - 1,299.1 1,432.6
STATEMENT Of CHANGES IN EQuITY
Parentheses denote negative figures or figures to be deducted
Back to fINANCIAl REPORT AND NOTES

59
Bang & Olufsen a/s, parent company
(DKK million)
Reserve for net
revaluation
Share according to Equity
premium the equity Retained parent
Share capital account method earnings company
Equity 1 June 2005 124.1 9.4 333.4 1,283.6 1,750.5
Accumulated effect at the beginning of the year
from changes to accounting principles applied - - (���.�) 15.5 (�17.9)
Adjusted equity as at 1 June 2005 12�.1 9.� - 1,299.1 1,��2.6
Subscription of employee shares - - - 11.5 11.5
Grant of share options - - - 5.8 5.8
Tax regarding share options - - - 6.2 6.2
Net income recognised directly in equity - - - 2�.5 2�.5
Retained earnings - - - 222.6 222.6
Total recognised income and expense for the period - - - 2�6.1 2�6.1
Business combination, inter-group - - - (2.�) (2.�)
Subscription of employee shares 0.� 5.2 - - 5.6
Purchase of own shares - - - (1�8.9) (1�8.9)
Sale of own shares - - - 5.� 5.�
Dividend paid regarding 200�/05 - - - (1�9.0) (1�9.0)
Dividend, own shares - - - 5.7 5.7
0.� 5.2 - (289.2) (28�.6)
Equity 31 May 2006 124.5 14.6 - 1,256.0 1,395.1
Specification of movements in share capital: 2005/06 2004/05 2003/04 2002/03 2001/02
Share capital at the beginning of the year 12�.1 12�.8 1��.� 1��.1 1��.9
Capital increase 0.� 0.� 0.� 0.2 0.2
Capital reduction - - (10.9) - -
Share capital at the end of the year 124.5 124.1 123.8 134.3 134.1
Parentheses denote negative figures or figures to be deducted
Back to fINANCIAl REPORT AND NOTES

60 Back to fINANCIAl REPORT AND NOTES
61
Accounting principles applied
Basic principles
The annual report for Bang & Olufsen a/s, which comprises the separate financial statements for the parent company
Bang & Olufsen a/s, and the consolidated financial statements for the Bang & Olufsen Group, has been prepared in accordance with the
International financial Reporting Standards (IfRS) and further Danish disclosure requirements for the presentation of financial statements
for listed companies. further Danish disclosure requirements for the presentation of financial statements are imposed in the Danish
Executive Order on Adoption of IfRSs issued in accordance with the Danish financial Statements Act and are imposed by the Copenhagen
Stock Exchange. IfRS is implemented so that the annual report also respects the regulations in financial reporting standards endorsed by
the European union.
The annual report is the first annual report that is presented in accordance with the International financial Reporting Standards. IfRS
1 “first-time Adoption of International financial Reporting Standards” has been applied for transition. The date of transition to IfRS
is 1 June 200�. In accordance with IfRS 1 all Standards and Interpretations that had entered into force at the reporting date, �1 May
2006, have been applied retrospectively during the preparation of this annual report with the exception of some situations where IfRS 1
exempts from retrospective application. The applied exemptions from IfRS 1 are the exemption not to recognise business combinations
retrospectively for the period before the date of transition, the exemption that share-based payment transactions do not need to be
recognised, if they were granted before 7 November 2002 or if they vested before 1 January 2005, and the exemption that the special
reserve under equity for accumulated exchange rate differences from translating the accounts of the foreign entities is reset to zero at the
date of transition. The comparative figures in the annual report have been adjusted to reflect the changed accounting principles applied.
The presentation currency in the financial statements is DKK, which is considered the functional currency for the Group.
International Financial Reporting Standards with an effective date after 31 May 2006
The following International financial Reporting Standards with an effective date after �1 May 2006 are applied in this annual report
Amendments to IAS 19, Actuarial Gains and losses, Group plans and Disclosures, amendments to IAS �9, Cash flow Hedge Accounting
of forecast Intragroup Transactions, with an effective date during the financial year 2006/07 and amendments to IfRS 7, financial
Instruments: Disclosures, with an effective date during the financial year 2007/2008. Applying these amendments did not have any
influence on the accounting principles applied in the Group
At the time of the announcement of this annual report, a number of new or amended Standards and Interpretations are still not effective.
The assessment of Management is that these Standards and Interpretations will not have significant influence on the annual report.
Notes ...
1 ...
Back to fINANCIAl REPORT AND NOTES

62
Changes to the accounting principles applied
The adoption of the International financial Reporting Standards has changed the accounting principles applied in the following areas:
1. Business combinations
Goodwill recognised in business combinations is not amortised as from 1 June 200� and onwards. Instead, an impairment test has to
be performed to ensure that the assets are written down if the carrying amount exceeds the recoverable amount. up to now, goodwill
acquired after 1 June 2002 was amortised in the profit and loss account over the estimated useful life, whereas goodwill acquired before
1 June 2002 was amortised directly over the equity. for business combinations before 1 June 200� the exemptions in IfRS 1 are applied.
This means that the carrying amount of goodwill calculated in accordance with the company’s former accounting principles applied is
used as new cost price for goodwill in the opening balance sheet on the date of transition. At the date of transition to the International
financial Reporting Standards at 1 June 200�, the recoverable amount of goodwill exceeds the carrying amount of goodwill, which
means that there is no need for recognising impairment losses.
2. Share-based payments
Equity-settled share-based payment transactions include granting of share options to a number of directors and employee shares.
Equity-settled share-based payment transactions, which are granted after 7 November 2002 with a vesting date after 1 January 2005,
are measured at fair value at grant date, and are recognised as an employee cost in the profit and loss account in the period from the
grant date to the vesting date. Previously share-based payments were not recognised in the annual report.
3. Minority interests
Minority interests’ pro rata share of the subsidiaries’ profit or loss and equity forms an integrated part of the profit or loss for the period
and the equity. until now the minority interests’ pro rata share of the profit or loss was deducted before the parent company’s share in
the profit or loss for the Group, while the minority interests’ pro rata share of the equity was presented as a separate item below equity.
4. Exchange rate differences from translating the accounts of foreign entities
As previously exchange rate differences from translating the profit and loss account and the balance sheet of foreign entities are
recognised directly in the equity. Previously these were recognised in retained earnings, as of 1 June 200� they are recognised in a special
reserve for exchange rate differences. As at 1 June 200� the Group has decided in accordance with IfRS 1 to reset the exchange rate
differences recognised before this date to zero, so that only exchange rate differences after 1 June 200� are separated on the special
reserve.
5. Investments in subsidiaries and associates in the balance sheet of the parent company
The parent company’s investments in subsidiaries and associates are measured at cost price. Previously the investments were measured
at equity value. In the balance sheets as at 1 June 200� and �1 May 2005 the adjustments from cost price to equity value including the
carrying amount of goodwill are reversed. In the profit and loss account for 200�/05 the pro rata share of the profit or loss after taxes and
amortisation of goodwill is reversed.
6. Dividend from subsidiaries and associates in the annual report of the parent company
As of the 200�/05 financial year dividend received from subsidiaries and associates is recognised in the parent company’s profit and loss
account in the financial year the dividend is declared. In situations where the dividend received exceeds the earnings after the acquisition
of the company, the dividend is recognised as a write-down of the cost price of the investment instead of in the profit and loss account.
7. Jubilee benefits
According to IAS 19 provisions for jubilee benefits are recognised. Previously the amounts were recognised in the profit and loss account
at the time of payment.
Back to fINANCIAl REPORT AND NOTES

6�
8. Provisions for fairness
It is the Group’s practice that defects are repaired for some time after the end of the warranty period, fairness. According to IAS �7
provisions for fairness are recognised. Previously the amounts were recognised in the profit and loss account at the time of the repair.
9. Pension obligations
Defined benefit obligations in foreign subsidiaries are recognised in accordance with IAS 19. Previously the obligations were recognised
according to calculations based on local principles.
10. Deferred tax
The effect on deferred tax of the changes in accounting principles applied is recognised.
11. Financial instruments
Regulations regarding the accounting treatment of financial instruments are applied as of 1 June 2005 in accordance with the transitional
provisions in IAS �2 and IAS �9. The comparative figures are prepared in accordance with the former accounting principles applied, which
do not differ materially from the accounting treatment in accordance with IAS �2 and IAS �9.
12. Reclassifications
Besides the changes in the accounting principles applied listed above the following reclassifications and changes in the presentation have
been made. The comparative figures for 200�/05 have been adjusted accordingly.
Investment property has been separated from other properties and is classified as investment property.
Deferred tax assets are classified as non-current assets. Previously the deferred tax assets were classified as current assets.
Income tax receivable is classified as a separate item in the balance sheet. Previously it was recognised as part of other
receivables.
Deferred tax, pensions and other provisions are no longer presented as a separate subtotal in the balance sheet
(Provisions). They are now recognised as part of long-term and short-term liabilities.
The reclassifications have been made in the balance sheet and do not affect the profit and loss account or the statement of changes in
equity.
13. Main and key figures
Main and key figures for the financial years 2001/02, 2002/0� and 200�/0� have not been adjusted to reflect the changed accounting
principles applied. Thus they equal the main and key figures in the annual report for 200�/05. The adjustments that would be necessary
to adjust the main and key figures for 2001/02, 2002/0� and 200�/0� to IfRS, equal the adjustments that have been made to the balance
sheet at the date of transition of 1 June 200�, see the description of the changes above.
Compared to the announcement to the Stock Exchange on � October 2005 regarding the adoption of the International financial
Reporting Standards (IfRS) minor changes relating to defined benefit plans for pensions, fairness and tax have been made.
Back to fINANCIAl REPORT AND NOTES

6�
The adoption of IfRS has the following effect on the Group’s main and key figures for 200�/05:
(DKK million) 200�/05
Previous Effect of
accounting adoption
principles of IfRS IfRS
Result
Net turnover �,7�2 - �,7�2
Of which in foreign markets, % 82 - 82
Gross margin, % �6.5 (0.1) �6.�
Operating profit �80 (8) �72
Net financials 7 - 7
Result before tax �87 (7) �80
Result for the year 269 (�) 265
Bang & Olufsen a/s’ share of the year’s result 269 (�) 265
Balance sheet
Total assets, end of year 2,762 22 2,78�
Share capital 12� - 12�
Total equity, end of year 1,751 (�6) 1,715
Minority interests 2 (2) -
Cash flow for the year 259 - 259
Cash flow from:
Operating activities 7�1 - 7�1
Investment activities (2��) - (2��)
- of which investments in tangible non-current assets (12�) - (12�)
- of which investments in intangible non-current assets (125) - (125)
financing activities (2�9) - (2�9)
Employment
Number of employees at the end of the year 2,��1 - 2,��1
Ratios
Profit ratio, % 10 - 10
Return on assets, % 18 - 18
Return on equity, % 16 - 16
Current ratio 2.7 (0.2) 2.5
Equity ratio, % 6� (1) 62
Earnings per share (nominal DKK 10), DKK 22 - 22
Equity value per share (nominal DKK 10), DKK 1�1 (�) 1�8
Quotation as at �1 May �89 - �89
Price/earnings 18 - 18
Quotations/equity value 2.8 - 2.8
Proposed/paid dividend per share (nominal DKK 10), DKK 12.00 - 12.00
Parentheses denote negative figures or figures to be deducted
Back to fINANCIAl REPORT AND NOTES

65
The adoption of IfRS has the following effect on the Group’s and the parent company’s profit and loss account:
Group Parent company
(DKK million) 200�/05 200�/05
Previous Effect of Previous Effect of
accounting adoption accounting adoption
principles of IfRS IfRS principles of IfRS IfRS
Net turnover 3,742.2 - 3,742.2 265.1 - 265.1
Production costs (2,002.�) (�.�) (2,005.7) (250.6) (2.1) (252.7)
Gross profit 1,739.8 (3.3) 1,736.5 14.5 (2.1) 12.4
Development costs (�90.�) (�.0) (�9�.�) - - -
Distribution and marketing costs (8�6.8) �.2 (8��.6) - - -
Administration costs, etc. (1��.2) (�.2) (1�7.�) (20.�) (0.1) (20.�)
Operating profit 379.5 (7.3) 372.2 (5.8) (2.2) (8.0)
Result from investments in
subsidiaries before tax - - - �6�.8 (�6�.8) -
Result from investments in
associates after tax 0.� - 0.� 0.� (0.�) -
Dividend - - - - 1�2.0 1�2.0
-
financial income �0.7 - �0.7 50.� - 50.�
financial costs (2�.5) - (2�.5) (21.9) - (21.9)
Net financials 7.2 - 7.2 28.5 - 28.5
Result before tax 387.1 (7.3) 379.8 386.9 (234.4) 152.5
Tax on result for the year (118.�) �.5 (11�.9) (118.0) 111.5 (6.5)
Minority interests’ share of result for the year 0.2 (0.2) - - - -
Result for the year 268.9 (4.0) 264.9 268.9 (122.9) 146.0
Parentheses denote negative figures or figures to be deducted
Back to fINANCIAl REPORT AND NOTES

66
The adoption of IfRS has the following effect on the Group’s balance sheet:
Group
(DKK million) 1/6 0� �1/5 05
Reclassi- Reclassi-
Previous fications and Previous fications and
accounting effect of adap- accounting effect of adap-
principles tion of IfRS IfRS principles tion of IfRS IfRS
Assets
Intangible assets
Goodwill 11.1 - 11.1 15.6 �.7 19.�
Acquired rights 22.2 - 22.2 1�.� - 1�.�
Completed development projects 15�.0 - 15�.0 176.� - 176.�
Development projects in progress 82.1 - 82.1 81.9 - 81.9
Total intangible assets 269.� - 269.� 288.1 �.7 291.8
Tangible assets
land and buildings 288.0 (0.9) 287.1 28�.� (0.8) 282.5
Plant and machinery 216.� - 216.� 201.5 - 201.5
Other equipment 52.7 - 52.7 �9.7 - �9.7
leasehold improvements �6.6 - �6.6 29.9 - 29.9
Tangible assets in progress and
prepayments for tangible assets 6�.6 - 6�.6 5�.� - 5�.�
Total tangible assets 658.2 (0.9) 657.� 617.8 (0.8) 617.0
Investment property - 0.9 0.9 - 0.8 0.8
Financial assets
Investments in associates 8.6 - 8.6 7.0 - 7.0
Deferred tax assets - �0.6 �0.6 - ��.� ��.�
Other financial receivables 16.7 - 16.7 28.7 - 28.7
Total financial assets 25.� �0.6 65.9 �5.7 ��.� 80.1
Total non-current assets 952.9 40.6 993.5 941.6 48.1 989.7
Inventories �90.� - �90.� �29.8 (0.1) �29.7
Receivables
Trade receivables 515.7 - 515.7 5�8.8 - 5�8.8
Income tax receivable - 121.2 121.2 - 22.6 22.6
Other receivables 2��.1 (121.2) 122.9 68.5 (22.6) �5.9
Deferred tax assets 2�.0 (2�.0) - 25.7 (25.7) -
Prepayments 22.� - 22.� 15.2 - 15.2
Total receivables 805.1 (2�.0) 782.1 658.2 (25.7) 6�2.5
Cash �7�.0 - �7�.0 7�1.9 - 7�1.9
Total current assets 1,768.5 (23.0) 1,745.5 1,819.9 (25.8) 1,794.1
Total assets 2,721.4 17.6 2,739.0 2,761.5 22.3 2,783.8
Back to fINANCIAl REPORT AND NOTES

67
Group
(DKK million) 1/6 0� �1/5 05
Reclassi- Reclassi-
Previous fications and Previous fications and
accounting effect of adap- accounting effect of adap-
principles tion of IfRS IfRS principles tion of IfRS IfRS
Equity and liabilities
Equity
Share capital 12�.8 - 12�.8 12�.1 - 12�.1
Share premium account 5.7 - 5.7 9.� - 9.�
Translation reserve - - - - 1.1 1.1
Retained earnings 1,��5.7 ��.5 1,�80.2 1,�68.1 109.8 1,577.9
Proposed dividend for the year 86.7 (86.7) - 1�8.9 (1�8.9) -
Equity attributable to shareholders
of the parent company 1,651.9 (�2.2) 1,609.7 1,750.5 (�8.0) 1,712.5
Minority interests - 2.� 2.� - 2.1 2.1
Total equity 1,651.9 (39.9) 1,612.0 1,750.5 (35.9) 1,714.6
Minority interests 2.3 (2.3) - 2.1 (2.1) -
Provisions
Pensions 1.2 (1.2) - 0.8 (0.8) -
Deferred tax 65.8 (65.8) - 6�.� (6�.�) -
Other provisions 67.5 (67.5) - 60.0 (60.0) -
Total provisions 134.5 (134.5) - 125.2 (125.2) -
Non-current liabilities
Pensions - 5.9 5.9 - 8.5 8.5
Deferred tax - 66.9 66.9 - 65.5 65.5
Provisions - 5�.9 5�.9 - 6�.6 6�.6
Mortgage loans 1��.9 - 1��.9 120.7 - 120.7
loans from banks etc. 1�9.1 - 1�9.1 87.5 - 87.5
Total non-current liabilities 27�.0 126.7 �00.7 208.2 1�7.6 ��5.8
Current liabilities
Repayments of loans in the coming year �2.9 �2.9 �9.2 - �9.2
Provisions - 67.6 67.6 - 50.9 50.9
Trade payables 18�.8 - 18�.8 208.0 - 208.0
Deferred income 19.� - 19.� �1.5 - �1.5
Income tax 9.6 - 9.6 72.0 - 72.0
Other payables �0�.0 - �0�.0 �1�.8 (�.0) �11.8
Total current liabilities 658.7 67.6 726.� 675.5 �7.9 72�.�
Total liabilities 932.7 194.3 1,127.0 883.7 185.5 1,069.2
Total equity and liabilities 2,721.4 17.6 2,739.0 2,761.5 22.3 2,783.8
Parentheses denote negative figures or figures to be deducted
Back to fINANCIAl REPORT AND NOTES

68
The adoption of IfRS has the following effect on the parent company’s balance sheet:
Parent company
(DKK million) 1/6 0� �1/5 05
Reclassi- Reclassi-
Previous fications and Previous fications and
accounting effect of adap- accounting effect of adap-
principles tion of IfRS IfRS principles tion of IfRS IfRS
Assets
Intangible assets
Goodwill - - - 1.6 1.6 �.2
Acquired rights 1�.7 - 1�.7 10.� - 10.�
Total intangible assets 1�.7 - 1�.7 12.0 1.6 1�.6
Tangible assets
land and buildings 197.0 (101.1) 95.9 191.6 (9�.6) 98.0
Plant and machinery 1.9 - 1.9 7.0 - 7.0
Other equipment 16.0 - 16.0 12.6 - 12.6
leasehold improvements 0.8 - 0.8 0.5 - 0.5
Tangible assets in progress and
prepayments for tangible assets 12.5 - 12.5 0.5 - 0.5
Total tangible assets 228.2 (101.1) 127.1 212.2 (9�.6) 118.6
Investment property - 101.1 101.1 - 9�.6 9�.6
Financial assets
Investments in subsidiaries 1,0�0.0 (208.6) 821.� 1,199.2 (��6.5) 862.7
Investments in associates 8.6 8.� 17.0 7.0 10.0 17.0
Deferred tax assets - 0.9 0.9 - �.0 �.0
Total financial assets 1,0�8.6 (199.�) 8�9.� 1,206.2 (�22.5) 88�.7
Total non-current assets 1,280.5 (199.3) 1,081.2 1,430.4 (320.9) 1,109.5
Inventories 0.� - 0.� 0.2 0.2
Receivables
Receivables from subsidiaries 199.6 - 199.6 85.9 6.8 92.7
Income tax receivables - 96.� 96.� - -
Other receivables 98.0 (95.8) 2.2 2.� 0.5 2.8
Deferred tax assets 0.5 (0.5) - 2.7 (2.7) -
Prepayments �.0 - �.0 �.� - �.�
Total receivables �02.1 - �02.1 9�.2 �.6 98.8
Cash �0�.1 - �0�.1 5�7.� - 5�7.�
Total current assets 705.6 - 705.6 631.8 4.6 636.4
Total assets 1,986.1 (199.3) 1,786.8 2,062.2 (316.3) 1,745.9
Parentheses denote negative figures or figures to be deducted
Back to fINANCIAl REPORT AND NOTES

69
Parent company
(DKK million) 1/6 0� �1/5 05
Reclassi- Reclassi-
Previous fications and Previous fications and
accounting effect of adap- accounting effect of adap-
principles tion of IfRS IfRS principles tion of IfRS IfRS
Equity and liabilities
Equity
Share capital 12�.8 - 12�.8 12�.1 - 12�.1
Share premium account 5.7 - 5.7 9.� - 9.�
Retained earnings 1,227.1 9�.6 1,�21.7 1,1��.7 16�.� 1,299.1
Reserve for net revaluation according
to the equity method 208.6 (208.6) - ���.� (���.�) -
Proposed dividend for the year 86.7 (86.7) - 1�8.9 (1�8.9) -
Total equity 1,651.9 (200.7) 1,451.2 1,750.5 (317.9) 1,432.6
Non-current liabilities
Provisions - 1.� 1.� - 1.� 1.�
Mortgage loans 91.7 - 91.7 79.� - 79.�
loans from banks etc. 112.5 - 112.5 87.5 - 87.5
Total non-current liabilities 20�.2 1.� 205.6 166.8 1.� 168.2
Current liabilities
Repayments of loans in the coming year �7.� - �7.� �7.� - �7.�
Provisions - - - - 0.2 0.2
Trade payables 12.5 - 12.5 16.5 - 16.5
Income tax - - - �0.7 - �0.7
Other payables 80.0 - 80.0 60.2 - 60.2
Deferred income 0.1 - 0.1 0.1 - 0.1
Total current liabilities 1�0.0 - 1�0.0 1��.9 0.2 1�5.1
Total liabilities 334.2 1.4 335.6 311.7 1.6 313.3
Total equity and liabilities 1,986.1 (199.3) 1,786.8 2,062.2 (316.3) 1,745.9
Parentheses denote negative figures or figures to be deducted
Back to fINANCIAl REPORT AND NOTES
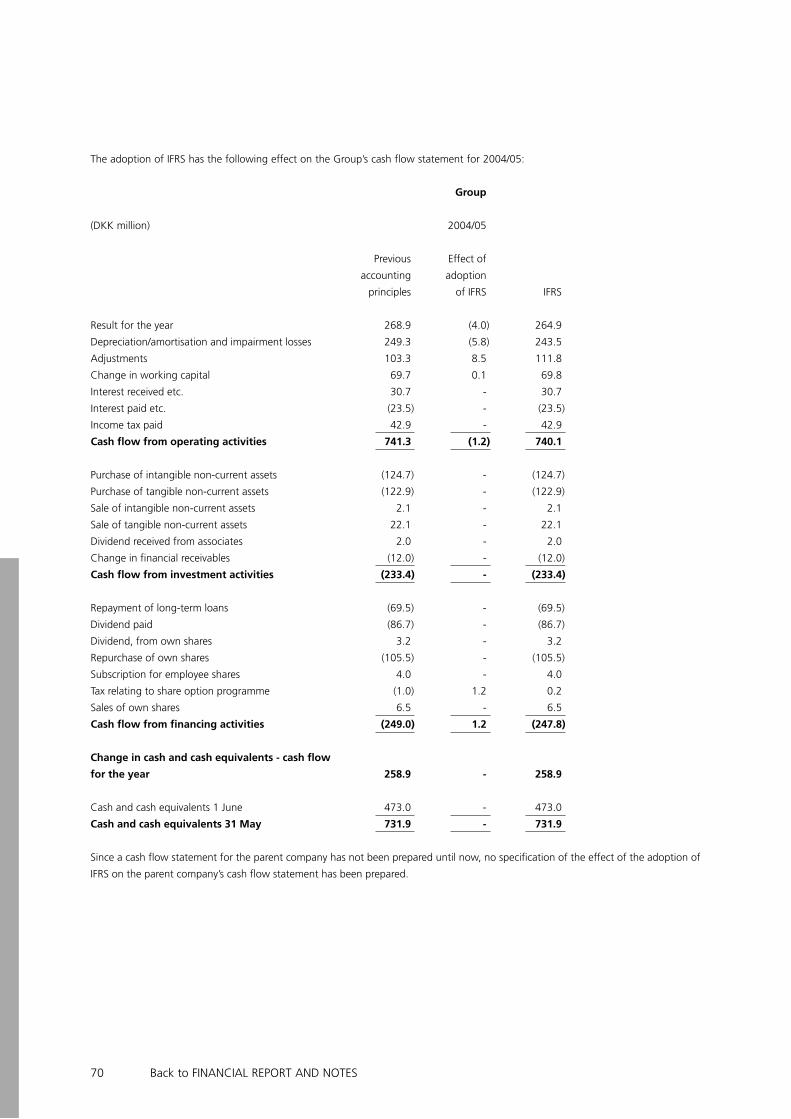
70
The adoption of IfRS has the following effect on the Group’s cash flow statement for 200�/05:
Group
(DKK million) 200�/05
Previous Effect of
accounting adoption
principles of IfRS IfRS
Result for the year 268.9 (�.0) 26�.9
Depreciation/amortisation and impairment losses 2�9.� (5.8) 2��.5
Adjustments 10�.� 8.5 111.8
Change in working capital 69.7 0.1 69.8
Interest received etc. �0.7 - �0.7
Interest paid etc. (2�.5) - (2�.5)
Income tax paid �2.9 - �2.9
Cash flow from operating activities 741.3 (1.2) 740.1
Purchase of intangible non-current assets (12�.7) - (12�.7)
Purchase of tangible non-current assets (122.9) - (122.9)
Sale of intangible non-current assets 2.1 - 2.1
Sale of tangible non-current assets 22.1 - 22.1
Dividend received from associates 2.0 - 2.0
Change in financial receivables (12.0) - (12.0)
Cash flow from investment activities (233.4) - (233.4)
Repayment of long-term loans (69.5) - (69.5)
Dividend paid (86.7) - (86.7)
Dividend, from own shares �.2 - �.2
Repurchase of own shares (105.5) - (105.5)
Subscription for employee shares �.0 - �.0
Tax relating to share option programme (1.0) 1.2 0.2
Sales of own shares 6.5 - 6.5
Cash flow from financing activities (249.0) 1.2 (247.8)
Change in cash and cash equivalents - cash flow
for the year 258.9 - 258.9
Cash and cash equivalents 1 June �7�.0 - �7�.0
Cash and cash equivalents 31 May 731.9 - 731.9
Since a cash flow statement for the parent company has not been prepared until now, no specification of the effect of the adoption of
IfRS on the parent company’s cash flow statement has been prepared.
Back to fINANCIAl REPORT AND NOTES
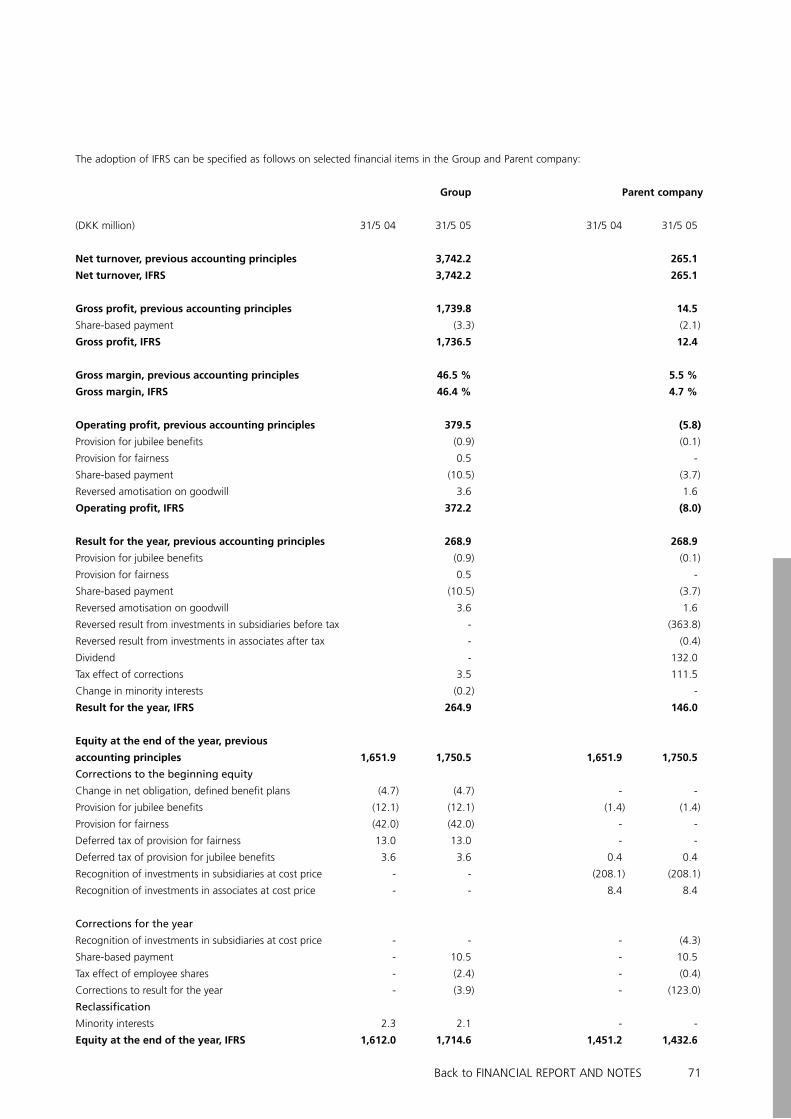
71
The adoption of IfRS can be specified as follows on selected financial items in the Group and Parent company:
Group Parent company
(DKK million) �1/5 0� �1/5 05 �1/5 0� �1/5 05
Net turnover, previous accounting principles 3,742.2 265.1
Net turnover, IFRS 3,742.2 265.1
Gross profit, previous accounting principles 1,739.8 14.5
Share-based payment (�.�) (2.1)
Gross profit, IFRS 1,736.5 12.4
Gross margin, previous accounting principles 46.5 % 5.5 %
Gross margin, IFRS 46.4 % 4.7 %
Operating profit, previous accounting principles 379.5 (5.8)
Provision for jubilee benefits (0.9) (0.1)
Provision for fairness 0.5 -
Share-based payment (10.5) (�.7)
Reversed amotisation on goodwill �.6 1.6
Operating profit, IFRS 372.2 (8.0)
Result for the year, previous accounting principles 268.9 268.9
Provision for jubilee benefits (0.9) (0.1)
Provision for fairness 0.5 -
Share-based payment (10.5) (�.7)
Reversed amotisation on goodwill �.6 1.6
Reversed result from investments in subsidiaries before tax - (�6�.8)
Reversed result from investments in associates after tax - (0.�)
Dividend - 1�2.0
Tax effect of corrections �.5 111.5
Change in minority interests (0.2) -
Result for the year, IFRS 264.9 146.0
Equity at the end of the year, previous
accounting principles 1,651.9 1,750.5 1,651.9 1,750.5
Corrections to the beginning equity
Change in net obligation, defined benefit plans (�.7) (�.7) - -
Provision for jubilee benefits (12.1) (12.1) (1.�) (1.�)
Provision for fairness (�2.0) (�2.0) - -
Deferred tax of provision for fairness 1�.0 1�.0 - -
Deferred tax of provision for jubilee benefits �.6 �.6 0.� 0.�
Recognition of investments in subsidiaries at cost price - - (208.1) (208.1)
Recognition of investments in associates at cost price - - 8.� 8.�
Corrections for the year
Recognition of investments in subsidiaries at cost price - - - (�.�)
Share-based payment - 10.5 - 10.5
Tax effect of employee shares - (2.�) - (0.�)
Corrections to result for the year - (�.9) - (12�.0)
Reclassification
Minority interests 2.� 2.1 - -
Equity at the end of the year, IFRS 1,612.0 1,714.6 1,451.2 1,432.6
Back to fINANCIAl REPORT AND NOTES

72
General information about recognition and measurement
Assets are recognised in the balance sheet, when it is probable that future economic benefits resulting from an event occurring before,
or on, the balance sheet date will flow to the Group, and the value of the asset can be measured reliably. Assets are derecognised in
the balance sheet, when it is no longer probable that future economic benefits will flow to the Group.
Purchases and sales of financial assets and liabilities are accounted for at trade date.
liabilities are recognised in the balance sheet, when it is probable that the Group will give up future economic benefits as a consequence
of a legal or constructive obligation resulting from an event occurring before, or on, the balance sheet date, and the value of the liability
can be measured reliably. liabilities are derecognised in the balance sheet, when it is no longer probable that the Group will give up
future economic benefits to meet the obligation.
On initial recognition, assets and liabilities are measured at cost price. Subsequently assets and liabilities are measured as described
below for each financial statement item. Certain financial assets and liabilities are measured at amortised cost price, by which a
constant effective rate of interest is recognised over the duration. Amortised cost price is calculated as initial cost price less instalments
and addition/deduction of the accumulated depreciation/amortisation of the difference between the cost price and nominal amount.
Consequently the difference between initial cost and the maturity amount is allocated over the duration of the asset/liability.
When recognising and measuring, due consideration is made for losses and risks that arise before the financial statements are finalised
and which confirm or invalidate conditions, which existed on the balance sheet date.
Income is recognised in the profit and loss account, when it is earned. furthermore all costs incurred to achieve the earnings of the year,
including depreciation and amortisation, impairment losses and provisions, are recognised in the profit and loss account as well as reversal
of amounts due to changes in accounting judgements and estimates, if the amounts have previously been recognised in the profit and
loss account.
Consolidation
for a list of subsidiaries, please refer to note ��.
Consolidation practice
The consolidated financial statement comprises the parent company, Bang & Olufsen a/s, and the subsidiaries in which the Group holds
more that 50 % of the voting rights or in other ways has a controlling influence on the subsidiary’s financial and operational policies.
Companies, which are not subsidiaries, but in which the Bang & Olufsen Group holds 20 % or more of the voting rights or in other ways
has a significant influence on the operational or financial management, are regarded as associates. Associates are consolidated in the item
“Result from investments in associates after tax”.
When judging whether or not Bang & Olufsen a/s has a controlling or significant influence, potential voting rights that are currently
exercisable or convertible are considered.
The consolidated financial statement has been prepared on the basis of the audited financial statements of the parent company and
its subsidiaries by integrating uniform items from the individual companies. In the process of consolidation, intra-group income and
expenses, shareholding, dividend, outstanding accounts and unrealised intra-group profits and losses have been eliminated.
Newly acquired subsidiaries are included in the consolidated financial statement as from the date of acquisition, and companies sold are
included until the date of sale. Comparative figures are not adjusted for newly acquired or sold companies.
The parent company’s shares in the consolidated subsidiaries, recognised at historical cost price, are netted against the parent company’s
share of the subsidiaries’ fair value of the identifiable net assets and contingent liabilities at the time of the acquisition.
Back to fINANCIAl REPORT AND NOTES

7�
Goodwill is calculated at the time of the acquisition as the difference between the cost price and the fair value of the assets, the liabilities
and the contingent liabilities acquired. for business combinations that took place at 1 June 200� or later, goodwill is recognised in the
balance sheet under intangible non-current assets. This goodwill is not amortised, instead quarterly impairment tests are performed. If the
cost of acquisition is less than the fair value of the net assets acquired, the difference is recognised directly in the profit and loss account
at the time of the business combination.
Goodwill acquired before 1 June 200� but after 1 June 2002 was recognised in the balance sheet under intangible non-current assets
and amortised on a straight-line basis over its estimated useful life, which was determined on the basis of Management’s experience of
the individual business areas, although a maximum of 20 years applied.
for acquisitions before 1 June 2002 goodwill was calculated at the time of the acquisition as the difference between the cost price and
the acquired company’s equity value calculated in accordance with the Group’s accounting principles applied. Goodwill was amortised
directly over the equity.
for business combinations before 1 June 200� the accounting classification and accounting treatment are maintained according to the
former accounting principles applied. Goodwill as from before 1 June 200� is recognised based on the cost price that was recognised
according to the former accounting principles applied with deduction of amortisation and impairment losses until �1 may 200�. Goodwill
is not amortised after 1 June 200� and, the goodwill, which is recognised in the opening balance sheet on the date of transition, is tested
for impairment quarterly as of 1 June 200�.
During the 2005/06 financial year the Group carried out an intra-group restructuring. As at 1 June 2005, a merger was carried through,
and the parent company received part of the activities which previously belonged to the dissolved subsidiary, Bang & Olufsen AudioVisual
a/s. In the parent company’s financial statements the additions from the merger were recognised at the carrying amounts previously
recognised in the subsidiary’s financial statements.
Minority interests
Minority interests include third party shareholders’ share of the equity value and the result for the year in subsidiaries, which are not
100 per cent owned.
The part of the subsidiaries’ result, which can be attributed to minority interests, forms an integrated part of the profit or loss for the
period. Minority interests’ share of the equity is stated as an integrated part of the equity.
When minority interests are obligated to cover a share of any losses, this is recognised as an asset. An individual assessment of the need
for provisions for losses is made.
Foreign exchange
The profit and loss account
Transactions in foreign currency are during the year translated at the exchange rate effective on the transaction date. Gains and losses
arising from the difference between the exchange rate on the transaction date and the exchange rate prevailing at the date of payment
are recognised in the profit and loss account as financial income or financial costs.
Receivables and payables
Receivables, payables and other monetary items in foreign currency, which exist at the balance sheet date, are translated at the exchange
rates prevailing at this date. Currency gains and losses arising from the differences between the exchange rate prevailing at the balance
sheet date and the exchange rate prevailing at the transaction date, are recognised in the profit and loss account as financial income or
financial costs.
Back to fINANCIAl REPORT AND NOTES

7�
Translation of foreign subsidiaries
When recognising foreign subsidiaries with a functional currency that differs from Bang & Olufsen a/s’ presentation currency in the
consolidated financial statements, profit and loss accounts are translated using average exchange rates, while balance sheet items are
translated using the exchange rates prevailing on the balance sheet date. Differences deriving from translation of the foreign subsidiaries’
opening equity to the exchange rates prevailing at the balance sheet date, and the differences owing to the translation of the profit and
loss accounts of the foreign subsidiaries from average exchange rates to balance sheet date exchange rates, are recognised in the equity.
Derivative financial instruments
Derivative financial instruments are initially recognised in the balance sheet at cost price and are subsequently measured at fair value.
Derivative financial instruments are recognised in other receivables and other debt.
Changes to the fair value of derivative financial instruments, which meets the conditions for hedging the fair value of a recognised asset
or a recognised liability, are recognised in the profit and loss account together with any changes in the fair value of the hedged asset or
the hedged liability.
Changes to the fair value of derivative financial instruments, which meets the conditions for hedging future cash flow, are recognised
in the equity. Income and expenses relating to these hedge transactions are transferred from the equity when the hedged position is
realised, and are included in the value of the hedged position.
for derivative financial instruments, which do not qualify as hedging instruments, changes to the fair value are recognised in the profit
and loss account as financial income or financial costs.
The profit and loss account
Net turnover
Revenue is recognised in the profit and loss account, when delivery and transfer of ownership to the customer have taken place, if the
revenue can be measured reliably, and payment is expected to be received. Revenue is recognised net of value added tax and rebates
related to the sale.
Sales of goods
Revenue regarding sales of goods is recognised in the profit and loss account, if the transfer of ownership has taken place before the
end of the financial year, and if payment is expected to be received, and if the revenue can be measured reliably.
Rendering of services
Revenue associated with the rendering of services, which among other things includes sales of hours in connection with development
projects, is recognised as the services are rendered.
Royalty
Royalty is recognised on a straight-line basis during the period covered by the royalty agreement.
Rentals
Rentals are recognised in the period, where the letting out of the property takes place.
Production costs
Production costs comprise wages, stock consumption and indirect costs, including salaries, depreciation/amortisation and impairment
losses, which are incurred with the purpose of achieving the net turnover for the year.
Development costs
Development costs, which do not meet the criteria for capitalisation, are recognised in the profit and loss account as development costs
along with amortisation and impairment losses on capitalised development projects.
Back to fINANCIAl REPORT AND NOTES

75
Distribution and marketing costs
Distribution and marketing costs comprise costs relating to sales and distribution of the Group’s products, including salaries for sales
personnel, advertising and exhibition costs, depreciation/amortisation and impairment losses. Costs in subsidiaries which are responsible
exclusively for the sales of the Group’s products, are allocated to distribution and marketing costs.
Administration costs etc.
Administration costs comprise costs for administrative personnel, management and office costs etc. including depreciation/amortisation
and impairment losses.
Lease/Rental
Payments for rent and leases are related to operating lease of plant and machinery, cars and other equipment. Payments for rent and
leases are recognised in the profit and loss account on a straight-line basis over the lease term, unless recognition on another systematic
basis better reflects the Group’s use of the leased asset. The lease commitments are disclosed in the notes
Result of investments in associates
In the Group’s profit and loss account the share of result after tax in associates after proportional elimination of intra-group profits and
losses is recognised as “Result from investments in associates after tax”.
Dividend
Dividend from subsidiaries and associates is recognised in the parent company’s profit and loss account in the financial year, where
the dividend is declared. In situations where the dividend received exceeds the earnings after the acquisition of the company, the dividend
is recognised as a write-down of the cost price of the investment instead of in the profit and loss account.
Financial income and costs
financial income and costs include interest, amortisation premium or allowance, fair value adjustments and realised and unrealised
foreign exchange gains and losses.
Tax
Tax for the year, which includes the anticipated tax liability on taxable earnings and changes in deferred tax for the year, is recognised in
the profit and loss account at the share that is attributable to the result for the year and directly on equity at the share, which can
be attributed to entries made directly on the equity.
The parent company has from 2005/06 financial year joined an obligatory Danish joint taxation scheme with all companies controlled by
the parent company. The calculated Danish tax of the jointly taxed income is distributed among the jointly taxed companies in proportion
to their taxable income (full distribution with reimbursement for tax deficits).
The Group pays tax according to the instalment principle. Any allowances, deductions or refunds related to the payments of tax are
included in financial income or costs.
The balance sheet
Intangible non-current assets
Development projects
Development projects, that are clearly defined and identifiable, and which are expected to be marketed as new products within future
potential markets, are recognised as intangible non-current assets.
Development projects are recognised at cost price and are amortised over the expected useful life when the criteria for capitalisation have
been met.
Development costs that do not meet the criteria for recognition in the balance sheet are recognised in the profit and loss account when
incurred.
Back to fINANCIAl REPORT AND NOTES

76
The cost price comprises salaries, wages, materials, services and depreciation of other equipment, plant and machinery that relate to
the Group’s development activities.
Subsidies concerning development projects are deducted in the incurred costs.
Interest expenses related to financing development projects are recognised in the profit and loss account.
Capitalised development projects are measured at the lower of cost price less accumulated amortisation and impairment losses and
recoverable amount.
After the completion of the development work, development projects are amortised on a straight-line basis over the estimated useful
life. The amortisation period is normally �-6 years.
Acquired rights
Acquired rights comprise software, key money and patents. These are measured at cost price less accumulated amortisation and
impairment losses.
Acquired rights are amortised on a straight-line basis over the shorter of estimated useful life and contractual duration.
Tangible non-current assets
Tangible non-current assets are measured at cost price with deduction of accumulated depreciation and impairment losses.
The cost price comprises the acquisition price and costs directly related to the acquisition until the time, when the asset is ready
for use. for non-current assets produced by the company, the cost price comprises direct costs for wage consumption, materials,
components and sub-contractors.
The cost price of a tangible non-current asset is divided into separate components, which are depreciated separately, if the expected
useful life differs for the separate components.
Subsidies concerning tangible non-current assets are deducted in the cost price.
Interest expenses related to financing the production of tangible non-current assets are recognised in the profit and loss account.
for tangible non-current assets held under finance leases, the cost price equals the lower of fair value of the leased assets and net
present value of future minimum lease payments. When calculating net present value, the interest rate implicit in the lease or the
incremental borrowing rate is used as discount rate.
Depreciation
Depreciation is carried out on a straight-line basis over the expected useful life of the assets considering the assets’ residual values.
The following depreciation periods are used:
land and buildings
land None
Buildings �0 years
Interior refurbishment/
special installations 10 years
Plant and machinery
Single purpose production tools � - 6 years
Other plant and machinery 8 - 10 years
Other equipment � - 10 years
leasehold improvements are depreciated on a straight-line basis over the term of the lease, though not exceeding 10 years.
Back to fINANCIAl REPORT AND NOTES

77
Investment property
Investment property is property held to earn rentals or for capital appreciation rather than for use in the production or supply of goods
or services or for administrative purposes in the company that owns the property.
Investment property is measured at cost price with deduction of accumulated depreciation and impairment losses. Investment property
is depreciated on a straight-line basis over �0 years.
Subsidies concerning investment property are deducted in the cost price.
Impairment losses on non-current assets
The carrying amount of both investment property and intangible and tangible non-current assets is reviewed each quarter to determine
if there are indications of decreases in value not reflected by ordinary depreciation/amortisation. If this is the case the recoverable amount
of the asset is determined and if the amount is lower than the carrying amount, an impairment loss is recognised, so that the carrying
amount is reduced to the asset’s recoverable amount. The recoverable amount for an asset is the higher of the net sales price and the
value in use. If it is not possible to set a recoverable amount for one asset, the asset is assessed within the smallest group of assets for
which a reliable recoverable amount can be set.
Goodwill and development projects in progress are tested for impairment each quarter irrespective of whether there is any indication
of impairment.
Financial non-current assets
Investments in subsidiaries and associates are measured at historical cost price in the balance sheet of the parent company. If the historical
cost price exceeds the recoverable amount, an impairment loss is recognised, so that the carrying amount is reduced to the investments’
recoverable amount.
In situations where the dividend distributed exceeds the earnings after the acquisition of the company, the dividend is recognised as
a write-down of the cost price of the investment.
Investments in associates are measured in the balance sheet of the Group at the equity value according to the Group’s accounting
principles applied, after proportional elimination of intra-group profits and losses.
Other financial receivables
Other financial receivables comprise primarily loans to external parties and are measured at amortised cost price corresponding to face
value less provisions for losses.
Provisions for losses are based on an individual assessment of each account outstanding.
Inventories
Inventories are measured at the lower of cost price using the fIfO-principle and net realisable value.
Cost price of raw materials, consumables and purchased goods comprises the invoice price with added delivery costs. The cost price
of finished goods and work in progress comprises the purchase price of materials and direct labour costs, plus indirect production costs.
Indirect production costs include indirect materials and wages, maintenance and depreciation on plant and machinery, factory buildings
and other equipment as well as costs for factory administration and management.
Costs of financing are not included in the cost price.
Receivables
Receivables are measured in the balance sheet at amortised cost price corresponding to face value less provisions for losses.
Provisions for losses are based on an individual assessment of each outstanding account.
Back to fINANCIAl REPORT AND NOTES

78
Equity
Dividend
Dividend is recognised as a liability at the time of approval by the Annual General Meeting.
Own shares
Acquisition fees, fees received in connection with the disposal of own shares and dividend received on own shares are recognised under
retained earnings in the equity.
Share premium account
The reserve consists of paid-in premium in connection with the subscription for shares.
The reserve is a distributable reserve and therefore it can be used for declaration of dividend or to cover deficits.
Translation reserve
The translation reserve for exchange rate differences in the consolidated financial statement consists of exchange rate differences that
occur when translating the foreign subsidiaries’ financial statements from their functional currency into Bang & Olufsen a/s’ presentation
currency
On disposal of the net investment the reserve for exchange rate differences on that foreign subsidiary is recognised in the profit and loss
account.
The reserve is an undistributable reserve and therefore it cannot be used for declaration of dividend or to cover deficits
The reserve for exchange rate differences is reset to zero as at 1 June 200� in accordance with IfRS 1.
Incentive programmes
The Group’s incentive programmes comprise a share option programme for a number of directors and employee shares.
Share option programme
The share option programme solely comprises equity-settled share options.
The value of the services received from the employees is measured by reference to the fair value of the equity instruments granted.
The fair value of the share options is measured on the grant date and is recognised as an expense in the profit and loss account during
the period from the grant date to the vesting date. The counter item to this is recognition directly in equity.
At initial recognition of the share options an estimate is made over the number of share options expected to vest. Subsequently, until
the vesting date, the estimation is adjusted if the number of equity instruments expected to vest differs from previous estimates. Thus
the number of share options actually recognised equals the number of equity instruments that ultimately vested.
The fair value of the share options is calculated on the basis of the Black-Scholes model for determining the value of options. When
calculating the fair value of the share options the terms and conditions that are linked to the share options are taken into consideration.
The consequence on the taxes of the share option programme is recognised.
Employee shares
The employee shares let the employees in the Danish companies of the Bang & Olufsen Group subscribe for shares in Bang & Olufsen a/s
at a quotation below the market quotation. The discount element of the employee shares is recognised at the grant date as an expense
in the profit and loss account. The counter item to this is recognition directly in equity. The consequence on the taxes of the employee
share arrangement is recognised. The discount element is calculated as the difference between the subscription price and the fair value
of the employee share calculated on the basis of the Black-Scholes model for determining the value of options.
Back to fINANCIAl REPORT AND NOTES

79
Liabilities
Pensions
The Bang & Olufsen Group operates pension plans for certain groups of employees in Denmark and abroad. In general, these plans
are defined contribution plans.
Costs regarding defined contribution plans are recognised continuously in the profit and loss account in the period, where the pension
is earned, and the contribution payable is recognised in the balance sheet as a liability. The premium payments (e.g. a fixed amount or
a fixed percentage of the salary) are made into independent insurance companies, which are responsible for the pension obligations.
Once the pension contributions for the defined contribution plans have been paid, the Bang & Olufsen Group has no further pension
obligations to current or past employees.
for defined benefit plans a yearly actuarial calculation is made of the present value of the defined benefit obligation. The present value
is calculated based on conditions about the future development in among other things salary levels, interest rates, inflation and mortality.
The actuarially calculated present value of the defined benefit obligation with deduction of the fair value of any plan assets is recognised
in the balance sheet.
If the net defined benefit liability is an asset it is only recognised if it corresponds to or is lower than any cumulative unrecognised net
actuarial losses and future refunds from the plan or it would result in reductions in future contributions to the plan.
Differences between the expected development in plan assets and in the defined benefit obligation and the actual values are actuarial
gains and losses. Actuarial gains and losses are recognised only if the accumulated values exceed the higher of 10% of the defined
benefit obligation or 10 % of the fair value of the plan assets as at the beginning of the financial year (“The Corridor Method”).
Amounts that fall outside the corridor are recognised over the remaining working years for the employees concerned.
Provisions
Provisions comprise provisions for warranty, provisions for fairness and other provisions. Provisions for warranty comprise obligations
to repair products within the warranty period. Provisions for fairness comprise obligations to repair products after the warranty period.
The provisions are recognised and measured on the basis of the company’s experience with warranty repairs and other obligations.
Deferred tax and income tax
Provision for deferred tax is calculated according to the liability method on the basis of all temporary differences between the tax-based
value and the carrying amount of assets and liabilities.
The tax-based value of assets is determined considering the planned use of the asset. In the calculation of deferred tax, the tax-based
value of any losses and provisions etc. is entered if it is likely that these can be offset against future taxable income. If the deferred tax
constitutes a positive amount, this is recognised in the balance sheet as a deferred tax asset.
Income tax is recognised as the tax expected to be liable on the year’s taxable income less prepaid tax.
Financial liabilities
fixed interest loans, such as mortgage loans or bank loans, are recognised at the date of the loan at the received proceeds less transaction
costs. In subsequent periods, the loans are measured at amortised cost price corresponding to the capitalised value using the effective
rate of interest, so that the difference between the proceeds and the nominal amount (debt discount) is recognised in the profit and loss
account over the term of the loan.
Other financial liabilities are measured at amortised cost price, which is practically the same as the nominal amount.
Prepayments and deferred income
Prepayments comprise incurred costs related to the following financial years.
Deferred income comprises received payments related to income in the following financial years.
Back to fINANCIAl REPORT AND NOTES
80
Cash flow statement
The presentation of the cash flow statement follows the indirect method, based on the result for the year.
The cash flow statement shows the cash flow for the year, the year’s change in cash and cash equivalents as well as cash and cash
equivalents at the beginning and end of the year.
Cash flow from operating activities
Cash flow from operating activities is stated as the result for the year adjusted for non-liquid profit and loss account items, received and
paid financial income and costs, paid income taxes and changes to the working capital. The working capital comprises current assets less
current liabilities, excluding items, which are recognised as cash and cash equivalents.
Cash flow from investment activities
Cash flow from investment activities comprises the acquisition and sale of investment property and intangible, tangible and financial non-
current assets.
Cash flow from financing activities
Cash flow from financing activities comprises borrowings and instalments on mortgage debt and other long-term debt, dividend paid and
proceeds from increases in the share capital as well as sales and repurchase of own shares.
Cash and cash equivalents
Cash and cash equivalents comprise cash less current bank debt, which forms part of the Group’s ongoing cash flow management. Cash
flow in foreign currency, including cash flow in foreign subsidiaries, is translated at average monthly exchange rates, which do not deviate
materially from the exchange rates prevailing on the date of payment.
Segment information
The Group’s main activities and primary segments are:
· Branded business
· Non-branded business – Medicom
· Non-branded business – The ICEpower Group
The Group’s geographical areas and secondary segments are:
· Scandinavia
· Central Europe
· Rest of Europe
· North America
· Asia
· Rest of the world
Scandinavia comprises Denmark, Sweden, Norway and finland.
Central Europe comprises Germany, Switzerland and Austria.
The secondary segments are broken down according to the location of customers and activities.
The division into segments is, in all material respects, in accordance with the Group’s management structure and the internal financial
management.
The segment figures have been prepared using the same accounting principles applied as for the consolidated financial statements.
Segment income and expenses and segment assets and liabilities comprise those items, which can be directly allocated to the segment.
Back to fINANCIAl REPORT AND NOTES

81
Intra-group trade takes place on market terms.
Non-current assets in the segment comprise those assets, which are used directly in the operations of the segment, including intangible
non-current assets and investments in subsidiaries. Current assets in the segment comprise those current assets, which are used directly in
the operations of the segment, including inventories, trade receivables, other receivables, prepayments and cash.
Segment liabilities comprise liabilities derived from the operations of the segment, including trade payables and other payables.
Significant accounting estimates and judgements
When preparing the annual report it is necessary that Management makes a number of accounting estimates and judgements, which
influence the carrying amount of certain assets and liabilities and the recognised revenue and costs for the financial years. Significant
judgements are among others made when assessing the depreciation/amortisation and the impairment losses, pension obligations and
similar obligations, provisions and contingent liabilities and contingent assets.
Management bases the judgements on historical experience and other assumptions that are believed to be reasonable under the given
circumstances. The result of the assumptions is used to evaluate the carrying amount of the assets and liabilities and the recognised
revenue and costs, which is not obvious from other material. The actual results can differ from the estimated results.
The following accounting estimates and judgements are believed to be material for the annual report:
Provisions for warranty and fairness
The Bang & Olufsen Group repairs or replaces products that do not function satisfactorily both within the warranty period and in certain
situations after the warranty period. Consequently provisions are made for future returns. The provisions are made based on historical
statistics of returns and based on Management’s judgements. The future returns can differ from the historical pattern, but it is the
assessment of Management that the estimate of the provisions is reasonable and appropriate.
Contingent liabilities
Contingent liabilities, including the outcome of ongoing lawsuits, are naturally uncertain. Management has assessed these based on
historical experience. It is the assessment of Management that the estimate of the contingent liabilities is reasonable.
Development projects
Development projects financed by the Group, which are clearly defined and identifiable, and which are expected to be marketed as new
products in future potential markets, are recognised as intangible non-current assets. In case of uncertainty at the time of decision in
regard to the Group’s future financial benefit from the asset, a conservative estimate of the potential intangible non-current asset is made,
based on historical experience and knowledge of interest from customers and actual orders. It is the assessment of Management that the
performed judgements of development projects are reasonable and appropriate.
Inventories
As a part of ordinary business, the Bang & Olufsen Group has the disposal of materials from sub-contractors for manufacturing in the
Group, in order to be able to comply with the expected demands of the customers. A perfect disposal of materials for future customer
needs is in many cases difficult, for which reason situations might arise where there are no longer any expected demands for materials
purchased or produced for inventory. Therefore provisions for obsolescence are made. The provisions regarding inventories are based on
historic scrapping caused by obsolescence and knowledge about and estimation of slow-moving materials.
The value of future scrapping as a consequence of obsolescence might differ from the provision, but it is the assessment of Management
that the performed judgements of obsolescence are reasonable and appropriate.
Jubilee benefits
In accordance with IAS 19, Employee Benefits, the Bang & Olufsen Group makes provisions for liabilities regarding jubilee benefits.
The liability is assessed based on projected data of expected jubilees and expected payments of jubilee benefits for present employees.
As a consequence of changes in number of employees and trend of wages and salaries, the actual jubilee benefits may differ from the
assessed liability. It is the assessment of Management that the performed judgements of jubilee benefits are reasonable and appropriate.
Notes ...
2 ...
Back to fINANCIAl REPORT AND NOTES

82
Branded Non-branded
business business
Bang & Olufsen Bang & Olufsen Medicom a/s
2005/06 200�/05 2005/06 200�/05
Primary segment - activities
Net turnover �,96�.9 �,5�7.� 198.� 18�.8
Internal turnover (26.0) (2�.�) (1.�) -
External turnover �,9�7.9 �,52�.0 197.0 18�.8
Gross profit 1,860.5 1,67�.� ��.2 �9.2
Depreciations and amortisations (211.6) (222.�) (8.�) (9.2)
Impairment losses recognised in the profit and loss account (10.0) (9.9) - -
Operating profit (EBIT) �97.8 ��5.2 1�.0 2�.7
Result from investments in associates (1.0) 0.� - -
Result before tax �96.8 ��5.6 1�.0 2�.7
Result for the year �96.8 ��5.6 1�.0 2�.7
Non-current assets 1,0�8.0 922.1 65.7 71.2
Current assets 1,7�9.5 1,7�2.� �5.0 7�.6
Total assets 2,797.5 2,66�.5 110.7 1��.8
Equity 1,818.6 1,750.0 ��.8 85.6
Non-current liabilities 297.9 2�8.1 �0.9 �2.1
Current liabilities 681.0 676.� 25.0 17.1
Total equity and liabilities 2,797.5 2,66�.5 110.7 1��.8
Capital additions �57.9 2�9.0 �.0 5.�
Investments in associates 6.0 7.0 - -
Average number of employees
in Denmark 1,702 1,688 1�7 127
abroad 616 �69 - -
2,�18 2,157 1�7 127
(DKK million)
Segment - information
Parentheses denote negative figures or figures to be deducted
Notes ...
� ...
Back to fINANCIAl REPORT AND NOTES

8�
Non-branded
business
Bang & Olufsen ICEpower a/s Bang & Olufsen a/s
Group unallocated items Other/ eliminations Group
2005/06 200�/05 2005/06 200�/05 2005/06 200�/05 2005/06 200�/05
100.� 50.2 - - (�7.5) (�9.1) �,225.2 �,7�2.2
(10.1) (1�.8) - - �7.5 �9.1 - -
90.� �5.� - - - - �,225.2 �,7�2.2
52.0 26.� - - (1�.�) (12.�) 1,9�2.5 1,7�6.5
(2.�) (2.0) - - - - (222.�) (2��.6)
- - - - - - (10.0) (9.9)
27.1 2.� - - - - ��8.9 �72.2
- - - - - - (1.0) 0.�
27.1 2.� �2.8 7.2 (50.0) - ��0.7 �79.8
27.1 2.� (91.9) (107.7) (50.0) - 296.0 26�.9
1�.2 12.2 28.8 ��.� (60.2) (60.2) 1,095.5 989.7
�0.1 20.� 16.6 22.6 (�1.6) (6�.9) 1,819.6 1,79�.1
5�.� �2.6 �5.� 67.0 (91.8) (125.1) 2,915.1 2,78�.8
�5.5 9.7 (96.6) (70.5) (60.2) (60.2) 1,7�2.1 1,71�.6
0.2 0.1 6�.7 65.5 - - �02.7 ��5.8
17.6 22.8 78.� 72.0 (�1.6) (6�.9) 770.� 72�.�
5�.� �2.6 �5.� 67.0 (91.8) (125.1) 2,915.1 2,78�.8
�.� �.2 - - - - �65.2 2�7.6
- - - - - - 6.0 7.0
29 27 - - - - 1,868 1,8�2
1 - - - - - 617 �69
�0 27 - - - - 2,�85 2,�11
Parentheses denote negative figures or figures to be deducted
Back to fINANCIAl REPORT AND NOTES

8�
(DKK million)
Segment - information (continued)
Notes ...
� ...
Secondary segment - geography
Total Total Total
assets capital additions External turnover
2005/06 200�/05 2005/06 200�/05 2005/06 200�/05
Scandinavia 2,20�.� 1,8�5.0 275.� 219.8 9�5.2 8�0.�
Central Europe 127.2 17�.1 0.8 0.� 85�.6 7��.8
Rest of Europe 5�9.1 611.8 79.2 25.7 1,65�.1 1,502.8
North America �0.8 92.2 2.� 0.� �0�.1 296.6
Asia 6.� �9.2 7.5 1.� ���.2 25�.5
Rest of the world �.1 22.5 - - 1��.0 115.1
Total 2,9�0.9 2,78�.8 �65.2 2�7.6 �,225.2 �,7�2.2
Export share 82 % 82 %
Reconciliation
Non-branded business
Bang & Olufsen Bang & Olufsen
Medicom a/s ICEpower a/s Group
2005/06 200�/05 2005/06 200�/05
Operating profit (EBIT) 1�.0 2�.7 27.1 2.�
Net financials (1.�) (2.6) 2.8 (0.6)
Result before tax 12.7 22.1 29.9 1.7
Tax on result for the year (�.�) (6.�) (9.6) (�.1)
Result for the year according to financial statements 9.� 15.7 20.� (2.�)
Back to fINANCIAl REPORT AND NOTES

85
Group Parent company
(DKK million) 2005/06 200�/05 2005/06 200�/05
Net turnover
Geografical analysis
Denmark 7�2.2 66�.5 906.6 265.1
Norway 65.2 60.0 - -
Sweden 11�.8 10�.8 - -
finland 1�.0 12.1 - -
Scandinavia 9�5.2 8�0.� 906.6 265.1
Germany 505.2 ��7.� 0.� -
Switzerland 276.9 2�7.5 - -
Austria 72.5 58.9 - -
Central Europe 85�.6 7��.8 0.� -
The uK 5�9.9 570.7 0.2 -
france 202.7 17�.0 - -
Spain/Portugal 251.6 198.6 0.5 -
Italy 217.0 192.� 0.1 -
Belgium 95.6 79.8 - -
Holland 291.� 2�9.� 0.� -
Rest of Europe �6.0 �9.0 - -
Rest of Europe 1,65�.1 1,502.8 1.1 -
uSA �0�.1 296.6 1.1 -
North America �0�.1 296.6 1.1 -
Japan 67.7 61.� 1.2 -
Singapore 5�.1 �1.8 - -
Rest of Asia 212.� 150.� �.7 -
Asia ���.2 25�.5 �.9 -
Middle East �9.6 26.5 - -
Rest of world 10�.� 88.6 - -
Rest of world 1��.0 115.1 - -
Total �,225.2 �,7�2.2 91�.1 265.1
Analysis of categories
Sales of goods �,17�.6 �,722.7 - -
Rendering of services 2�.8 16.2 15�.7 178.�
Royalty 26.8 �.� 681.8 -
Rentals from investment property - - 77.6 86.7
Total �,225.2 �,7�2.2 91�.1 265.1
Notes ...
� ...
Back to fINANCIAl REPORT AND NOTESBack to PROfIT AND lOSS ACCOuNT

86
Group Parent company
(DKK million) 2005/06 200�/05 2005/06 200�/05
Expenses, further information
The following amounts are included in production costs,
development costs, distribution and marketing costs and
administration costs. Information about the expenses
are provided below:
Development costs
Incurred development costs before capitalisation 512.1 �15.2 50�.2 -
Of which capitalised (165.1) (111.�) (1�7.5) -
Amortisations and impairment losses on development projects 95.9 89.5 8�.7 -
Development costs, recognised in the profit and loss account ��2.9 �9�.� ��9.� -
Classification based on the nature of expenses
Intangible non-current assets
Amortisations of intangible non-current assets are recognised
in the following items in the profit and loss account:
Production costs 0.8 1.2 5.5 10.5
Development costs 89.7 82.0 75.8 -
Distribution and marketing costs 1.� �.7 - -
Administration costs etc. �.8 7.8 0.� 0.9
96.7 9�.7 81.7 11.�
Impairment losses on intangible non-current assets are
recognised in the following item in the profit and loss account:
Development costs 10.0 9.9 10.0 -
No impairment losses on intangible non-current assets
have been reversed.
Tangible non-current assets
Depreciations of tangible non-current assets are recognised
in the following items in the profit and loss account:
Production costs 95.� 95.1 12.1 1�.1
Development costs 1�.5 2�.� 8.2 -
Distribution and marketing costs 1�.8 17.0 - -
Administration costs etc. 2.9 �.� 1.0 1.2
125.5 1�8.8 21.� 15.�
No impairment losses on tangible non-current assets
have been recognised.
No impairment losses on tangible non-current assets
have been reversed.
Notes ...
5...
Parentheses denote negative figures or figures to be deducted
Back to fINANCIAl REPORT AND NOTES Back to PROfIT AND lOSS ACCOuNT

87
Parentheses denote negative figures or figures to be deducted
Group Parent company
(DKK million) 2005/06 200�/05 2005/06 200�/05
Expences, further information (continued)
Investment property
Depreciations of investment property are recognised in the
following items in the profit and loss account:
Production costs 0.1 0.1 6.9 8.0
Development costs - - 1.0 -
Administration costs etc. - - 0.6 0.6
0.1 0.1 8.5 8.6
No impairment losses on investment property have
been recognised.
No impairment losses on investment property have
been reversed.
Employees
Remuneration to the Board of Directors of the parent company 2.8 2.� 2.8 2.�
Remuneration to the Board of Management of the parent
company 6.9 6.7 6.9 6.7
Share-based payment 22.1 10.5 9.6 5.5
Wages, salaries and fees 791.2 7��.� 256.9 8�.8
Pensions 50.5 ��.5 22.9 5.1
Other statutory contributions �2.� �6.8 �.8 1.�
915.8 8��.2 �0�.9 10�.7
Average number of full-time employees:
Denmark 1,868 1,8�2 671 258
Abroad 617 �69 - -
2,�85 2,�11 671 258
Employee benefits are recognised in the following items
in the profit and loss account:
Production costs 28�.1 267.� 89.2 90.9
Development costs 270.0 225.9 20�.5 -
Distribution and marketing costs 286.6 280.2 - -
Administration costs etc. 75.1 60.7 10.2 1�.8
915.8 8��.2 �0�.9 10�.7
Notes ...
5...
Back to fINANCIAl REPORT AND NOTESBack to PROfIT AND lOSS ACCOuNT

88
(DKK million)
Expenses, further information (continued)
Remuneration to the Board of Directors, the Board of Management and other key management personnel:
Group
2005/06 200�/05
Board of Board of Board of Board of
Directors of Management of Other key Directors of Management of Other key
the parent the parent management the parent the parent management
company company personnel company company personnel
Wages, salaries and fees 2.8 6.9 �.7 2.� 6.5 �.0
Bonus - - 0.9 - - 0.9
Pensions - - 0.� - - 0.�
Share-based payment - �.7 1.1 - 2.� 0.5
2.8 11.6 7.1 2.� 8.9 5.8
Parent company
2005/06 200�/05
Board of Board of Board of Board of
Directors of Management of Other key Directors of Management of Other key
the parent the parent management the parent the parent management
company company personnel company company personnel
Wages, salaries and fees 2.8 6.9 2.� 2.� 6.5 2.0
Bonus - - 0.� - - 0.5
Pensions - - 0.2 - - 0.2
Share-based payment - �.7 0.5 - 2.� 0.�
2.8 11.6 �.5 2.� 8.9 �.0
Share-based payment
Share option programme, Group
The Bang & Olufsen Group’s share option programme comprises a number of directors in the Group. As at �1 May, 2006, the pool of
unexercised options totals 17�,208 options, which can be exercised in the period 2006-2010. Exercise of the share options is dependent on
the owner of the option still being in employment at Bang & Olufsen at the time of the exercise. There are no further conditions for
the acquisition of the options.
The exercise prices, which are linked to earnings in the financial years 2001/02, 2002/0� og 200�/0�, are determined as the average price
for the 10 days subsequent to the publication of the annual accounts in August 1999, 2000 and 2001.
The exercise prices, which are linked to earnings in the financial years 200�/05 and 2005/06 are based on exercise prices of ��1 and 500,
which are adjusted with 5 % on the date of the company’s financial statement announcement to the Copenhagen Stock Exchange, first
time, at the announcement in August 2005 and August 2006 respectively. The annual addition no longer apply or is limited to the extent
that dividend is paid out on the latest Annual General Meeting before the announcement in question.
The share options can only be settled with shares. To cover the share option programme, Bang & Olufsen a/s has purchased own shares,
which cover the full commitment. The shares are recognised directly in the equity.
Notes ...
5...
Back to fINANCIAl REPORT AND NOTES Back to PROfIT AND lOSS ACCOuNT

89
(DKK million)
Expenses, further information (continued)
Share options, Board of Other Total number Exercise price
Bang & Olufsen Group Management directors of shares per option Exercise period
Outstanding 1 June, 200� 55,000 29,�11 8�,�11 2�0
Exercised 200�/05 (20,000) - (20,000) 201 August 2002 - August 2006
Exercised 200�/05 - (�,91�) (�,91�) 270 August 2002 - August 2006
Exercised 200�/05 - (�,505) (�,505) �05 August 200� - August 2007
Exercised 200�/05 (1�,000) (6,705) (19,705) 177 August 200� - August 2008
Allocated 200�/05 500 - 500 �05 August 200� - August 2007
Allocated 200�/05 500 - 500 177 August 200� - August 2008
Allocated 200�/05 70,000 15,500 85,500 *�51 August 2006 - August 2009
Outstanding �1 May 2005 9�,000 29,688 122,688 �2� August 2002 - August 2009
As at �1 May, 2005, the share options are divided as follows:
Qualification period:
financial year 2000/01 10,000 - 10,000 201 August 2002 - August 2006
financial year 2001/02 - 5,076 5,076 270 August 2002 - August 2006
financial year 2002/0� 1�,000 5,�9� 18,�9� �05 August 200� - August 2007
financial year 200�/0� - �,619 �,619 177 August 200� - August 2008
financial year 200�/05 70,000 15,500 85,500 *�51 August 2006 - August 2009
Outstanding �1. maj 2005 9�,000 29,688 122,688 �2� August 2002 - August 2009
Share options,
Bang & Olufsen Group
Outstanding 1 June 2005 9�,000 29,688 122,688 �2� August 2002 - August 2009
Exercised 2005/06 - (5,076) (5,076) 270 August 2002 - August 2006
Exercised 2005/06 (1�,750) (�,257) (18,007) �05 August 200� - August 2007
Exercised 2005/06 - (2,6�7) (2,6�7) 177 August 200� - August 2008
Exercised 2005/06 (10,000) - (10,000) 201 August 2002 - August 2006
Allocated 2005/06 750 - 750 �05 August 200� - August 2007
Allocated 2005/06 70,000 15,500 85,500 *51� August 2007 - August 2010
Outstanding �1 May 2006 1�0,000 ��,208 17�,208 ��0 August 200� - August 2010
As at �1 May, 2006, the share options are divided as follows:
Qualification period:
financial year 2002/0� - 1,2�6 1,2�6 �05 August 200� - August 2007
financial year 200�/0� - 972 972 177 August 200� - August 2008
financial year 200�/05 70,000 15,500 85,500 *�60 August 2006 - August 2009
financial year 2005/06 70,000 15,500 85,500 *51� August 2007 - August 2010
Outstanding �1. maj 2006 1�0,000 ��,208 17�,208 ��0 August 200� - August 2010
* The exercise price is adjusted cf. above.
At the dates of exercise of the share options the average share price was as follows:
Exercises in the period 15 August to 9 September, 2005 501
Notes ...
5 ...
Back to fINANCIAl REPORT AND NOTESBack to PROfIT AND lOSS ACCOuNT

90
Parentheses denote negative figures or figures to be deducted
(DKK million)
Expenses, further information (continued)
2005/06 200�/05
The following amounts regarding the share option programme have
been recognised as part of the employee costs in the Group 5.8 2.9
The recognition according to the Black-Scholes model for determining Options Options
the value of options is based on the following conditions: granted granted
2005/06 200�/05
Expected volatility 21.8 % �5.7 %
5th year risk-free interest rate 2.8 % �.6 %
In 2005/06 and 200�/05 an average addition for the Bang & Olufsen a/s share of 2.7� % and 2.78 %
respectively has been used in the calculation. The expected term is fixed for the end of the maturity period.
The volatility is based on the historical volatility.
Calculated on the basis of the closing rate of 68� as at �1 May, 2006 the equity value totals DKK ��.� million,
of which programmes for the years 200�/05 and 2005/06 account for DKK �2.� million. The closing rate as
at �1 May, 2005 was �89 corresponding to a calculated equity value of DKK 8.1 million, of which programmes
for the year 200�/05 account for DKK �.2 million.
Notes ...
5 ...
Back to fINANCIAl REPORT AND NOTES Back to PROfIT AND lOSS ACCOuNT

91
(DKK million)
Expenses, further information (continued)
Share option programme, parent company
A number of directors in Bang & Olufsen a/s are comprised by the Group’s share option programme.
As at �1 May, 2006, the pool of unexercised options totals 15�,972 options, which can be exercised in the period 2006-2010.
Share options, Board of Other Total number Exercise price
Bang & Olufsen a/s Management directors of shares per option Exercise period
Outstanding 1. juni 200� 55,000 16,9�� 71,9�� 226
Exercised 200�/05 (20,000) - (20,000) 201 August 2002 - August 2006
Exercised 200�/05 - (�,01�) (�,01�) 270 August 2002 - August 2006
Exercised 200�/05 - (�,251) (�,251) �05 August 200� - August 2007
Exercised 200�/05 (1�,000) (�,��2) (16,��2) 177 August 200� - August 2008
Allocated 200�/05 500 - 500 �05 August 200� - August 2007
Allocated 200�/05 500 - 500 177 August 200� - August 2008
Allocated 200�/05 70,000 7,000 77,000 *�60 August 2006 - August 2009
Outstanding �1 May 2005 9�,000 1�,�28 107,�28 ��1 August 2002 - August 2009
As at �1 May, 2005, the share options are divided as follows:
Qualification period:
financial year 2000/01 10,000 - 10,000 201 August 2002 - August 2006
financial year 2001/02 - 2,�29 2,�29 270 August 2002 - August 2006
financial year 2002/0� 1�,000 2,�60 15,�60 �05 August 200� - August 2007
financial year 200�/0� - 2,5�9 2,5�9 177 August 200� - August 2008
financial year 200�/05 70,000 7,000 77,000 *�60 August 2006 - August 2009
Outstanding �1 May 2005 9�,000 1�,�28 107,�28 ��1 August 2002 - August 2009
Share options, Bang & Olufsen a/s
Outstanding 1. juni 2005 9�,000 1�,�28 107,�28 ��1 August 2002 - August 2009
Exercised 2005/06 - (2,�29) (2,�29) 270 August 2002 - August 2006
Exercised 2005/06 (1�,750) (2,�60) (16,210) �05 August 200� - August 2007
Exercised 2005/06 - (1,567) (1,567) 177 August 200� - August 2008
Exercised 2005/06 (10,000) - (10,000) 201 August 2002 - August 2006
Allocated 2005/06 750 - 750 �05 August 200� - August 2007
Allocated 2005/06 70,000 7,000 77,000 *51� August 2007 - August 2010
Outstanding �1 May 2006 1�0,000 1�,972 15�,972 ��5 August 200� - August 2010
As at �1 May, 2006, the share options are divided as follows:
Qualification period:
financial year 200�/0� - 972 972 177 August 200� - August 2008
financial year 200�/05 70,000 7,000 77,000 *�60 August 2006 - August 2009
financial year 2005/06 70,000 7,000 77,000 *51� August 2007 - August 2010
Outstanding �1 May 2006 1�0,000 1�,972 15�,972 ��5 August 200� - August 2010
* The exercise price is adjusted cf. above.
At the dates of exercise of the share options the average share price was as follows:
Exercises in the period 15 August to 9 September, 2005 501
Notes ...
5 ...
Back to fINANCIAl REPORT AND NOTESBack to PROfIT AND lOSS ACCOuNT

92
(DKK million)
Expenses, further information (continued)
2005/06 200�/05
The following amounts regarding the share option programme have
been recognised as part of the employee costs in the parent company: 5.2 2.7
The recognition according to the Black-Scholes model for determining Options Options
the value of options is based on the following conditions: granted granted
2005/06 200�/05
Expected volatility 21.8 % �5.7 %
5th year risk-free interest rate 2.8 % �.6 %
In 2005/06 and 200�/05 an average addition for the Bang & Olufsen a/s share of 2.7� %
and 2.78 % respectively has been used for the calculation. The expected term is fixed for the
end of the maturity period. The volatility is based on the historical volatility.
Calculated on the basis of the closing rate of 68� as at �1 May, 2006 the equity value totals DKK �8.7 million,
of which programmes for the years 200�/05 and 2005/06 account for DKK �8.2 million.
The closing rate as at �1 May, 2005 was �89 corresponding to a calculated equity value of DKK 8.1 million,
of which programmes for the year 200�/05 account for DKK 2.9 million.
Employee shares, Group
In the fall of 2005 and the fall of 200� the employees in the Danish companies in the Bang & Olufsen Group
were offered the opportunity of subscribing employee shares in Bang & Olufsen a/s.
Each employee had the opportunity to subscribe a number of employee shares based on the length of service.
The subscription price for the employee shares was DKK 150 per share (DKK 120 in 200�). The employee
shares are according to Danish legislation placed in closed depots until the end of the fifth calender year
after the subscription. Thus, the employee shares can not be sold or in other ways be at the employees disposal
in the 5 years.
The employee shares were subscribed by capital increase.
The employees in the Group subscribed �6.685 employee shares (��.910 in 200�)
corresponding to 0.28 % of the share capital (0.27 % in 200�). The subscribed employee shares had a
weighted average fair value of DKK ��9 (DKK �18 in 200�). The weighted average fair value is calculated
based on the fair value of the employee shares at the time each employee accepted the Group’s offer.
Notes ...
5 ...
Back to fINANCIAl REPORT AND NOTES Back to PROfIT AND lOSS ACCOuNT

9�
(DKK million)
Expenses, further information (continued)
2005/06 200�/05
The discount element per employee share is DKK �15 (DKK 222 in 200�), which is recognised as part
of the employee costs.
The fair value has been calculated on the basis of the Black-Scholes model for determining the value of
options. The fact that the employee is entitled to receive dividend when the employee shares are in closed
depots has been taken into account when calculating the fair value.
The calculation of the fair value of the employee shares are based on the following conditions:
Expected volatility 21.8 % 28.2 %
Risk-free interest rate 2.9 % �.6 %
for 2005/06 and 200�/05 an average dividend for the Bang & Olufsen a/s share for the previous five
years has been used in the calculation. The expected term is fixed for the end of the maturity period.
The volatility is based on the historical volatility.
The following amount regarding the employee shares have
been recognised as part of the employee costs in the Group: 11.5 7.5
Employee shares, parent company
The employees in Bang & Olufsen a/s subscribed 1�,�76 employee shares (5,280 employee shares in 200�)
corresponding to 0.11 % of the share capital (0.0� % in 200�). The subscribed employee shares had a
weighted average fair value of DKK �50 (DKK �18 in 200�). The weighted average fair value is calculated
based on the fair value of the employee shares at the time each employee accepted the Group’s offer.
The discount element per employee share is DKK ��0 (DKK 222 in 200�), which is recognised as part of
employee costs.
The fair value has been calculated on the basis of the Black-Scholes model for determining the value of
options. The fact that the employee is entitled to receive dividend when the employee shares are in closed
depots has been taken into account when calculating the fair value.
The calculations of the fair value of the employee shares are based on the following conditions:
Expected volatility 21.8 % 28.2 %
Risk-free interest rate 2.9 % �.6 %
for 2005/06 and 200�/05 an average dividend for the Bang & Olufsen a/s share for the previous five years
has been used in the calculation. The expected term is fixed for the end of the maturity period.
The volatility is based on the historical volatility.
The following amount regarding the employee shares have been recognised as part of the employee costs
in the parent company: �.� 2.9
Notes ...
5 ...
Back to fINANCIAl REPORT AND NOTESBack to PROfIT AND lOSS ACCOuNT

9�
Parentheses denote negative figures or figures to be deducted
Group Parent company
(DKK million) 2005/06 200�/05 2005/06 200�/05
Dividend
Dividend received from subsidiaries 200.0 1�0.0
Dividend received from associates - 2.0
200.0 1�2.0
Financial income
Interest income from banks etc. 9.� 8.6 7.6 7.5
Interest income from subsidiaries - - 2.1 10.7
Exchange rate gains, net - 12.7 2.0 �0.�
Other financial income 8.� 9.� 1.7 1.8
financial income 17.7 �0.7 1�.� 50.�
Financial costs
Interest costs on bank loans etc. 6.0 10.� 5.8 9.�
Interest costs on mortgage loans 6.7 7.8 �.5 5.2
Interest costs to subsidiaries - - 7.7 5.6
Exchange rate losses, net 9.5 - - -
Other financial costs 2.7 5.� 1.9 1.8
financial costs 2�.9 2�.5 19.9 21.9
Tax on result for the year
Parent company:
Current tax (2.1) 8.5 (2.1) 8.5
Change in deferred tax 1�.8 (2.5) 1�.8 (2.5)
Change in deferred tax as a result of a change in the
rate of taxation - 0.1 - 0.1
Adjustment previous years, current tax (�.6) 0.9 (�.6) 0.9
Adjustment previous years, deferred tax 2.0 (0.5) 2.0 (0.5)
Total, parent company 10.1 6.5 10.1 6.5
Subsidiaries:
Current tax 117.9 109.�
Change in deferred tax 11.8 (�.7)
Change in deferred tax as a result of a change in the
rate of taxation - (1.9)
Adjustment previous years, current tax 9.� �.7
Adjustment previous years, deferred tax (1�.�) 0.9
Total, subsidiaries 12�.6 108.�
Tax on result for the year, total 1��.7 11�.9 10.1 6.5
Tax on result for the year is recognised as follows:
Tax recognised in the profit and loss account 1��.7 11�.9 10.1 6.5
Notes ...
6 ...
7 ...
8 ...
9 ...
Back to fINANCIAl REPORT AND NOTES Back to PROfIT AND lOSS ACCOuNT
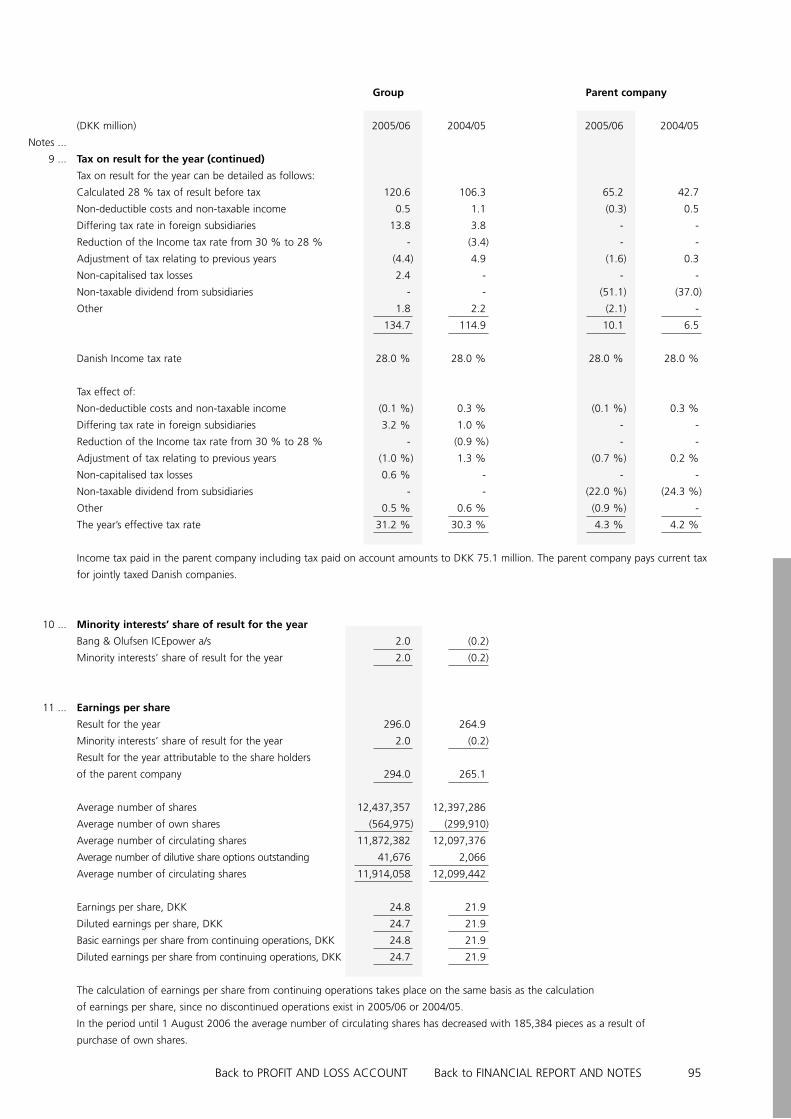
95
Notes ...
9 ...
10 ...
11 ...
Group Parent company
(DKK million) 2005/06 200�/05 2005/06 200�/05
Tax on result for the year (continued)
Tax on result for the year can be detailed as follows:
Calculated 28 % tax of result before tax 120.6 106.� 65.2 �2.7
Non-deductible costs and non-taxable income 0.5 1.1 (0.�) 0.5
Differing tax rate in foreign subsidiaries 1�.8 �.8 - -
Reduction of the Income tax rate from �0 % to 28 % - (�.�) - -
Adjustment of tax relating to previous years (�.�) �.9 (1.6) 0.�
Non-capitalised tax losses 2.� - - -
Non-taxable dividend from subsidiaries - - (51.1) (�7.0)
Other 1.8 2.2 (2.1) -
1��.7 11�.9 10.1 6.5
Danish Income tax rate 28.0 % 28.0 % 28.0 % 28.0 %
Tax effect of:
Non-deductible costs and non-taxable income (0.1 %) 0.� % (0.1 %) 0.� %
Differing tax rate in foreign subsidiaries �.2 % 1.0 % - -
Reduction of the Income tax rate from �0 % to 28 % - (0.9 %) - -
Adjustment of tax relating to previous years (1.0 %) 1.� % (0.7 %) 0.2 %
Non-capitalised tax losses 0.6 % - - -
Non-taxable dividend from subsidiaries - - (22.0 %) (2�.� %)
Other 0.5 % 0.6 % (0.9 %) -
The year’s effective tax rate �1.2 % �0.� % �.� % �.2 %
Income tax paid in the parent company including tax paid on account amounts to DKK 75.1 million. The parent company pays current tax
for jointly taxed Danish companies.
Minority interests’ share of result for the year
Bang & Olufsen ICEpower a/s 2.0 (0.2)
Minority interests’ share of result for the year 2.0 (0.2)
Earnings per share
Result for the year 296.0 26�.9
Minority interests’ share of result for the year 2.0 (0.2)
Result for the year attributable to the share holders
of the parent company 29�.0 265.1
Average number of shares 12,��7,�57 12,�97,286
Average number of own shares (56�,975) (299,910)
Average number of circulating shares 11,872,�82 12,097,�76
Average number of dilutive share options outstanding �1,676 2,066
Average number of circulating shares 11,91�,058 12,099,��2
Earnings per share, DKK 2�.8 21.9
Diluted earnings per share, DKK 2�.7 21.9
Basic earnings per share from continuing operations, DKK 2�.8 21.9
Diluted earnings per share from continuing operations, DKK 2�.7 21.9
The calculation of earnings per share from continuing operations takes place on the same basis as the calculation
of earnings per share, since no discontinued operations exist in 2005/06 or 200�/05.
In the period until 1 August 2006 the average number of circulating shares has decreased with 185,�8� pieces as a result of
purchase of own shares.
Back to fINANCIAl REPORT AND NOTESBack to PROfIT AND lOSS ACCOuNT

96
(DKK million)
Intangible assets
Completed Development
Acquired development projects in
Group Goodwill rights projects progress Total
Cost price 1 June, 200� 11.1 99.1 7�1.5 82.1 9��.8
Amortisations and impairment losses 1 June, 200� - (76.9) (587.5) - (66�.�)
Carrying amount 1 June, 200� 11.1 22.2 15�.0 82.1 269.�
Cost price 1 June, 200� 11.1 99.1 7�1.5 82.1 9��.8
Correction to opening balance �.� - - - �.�
Other additions during the year �.9 9.� �5.� 76.1 12�.7
Disposals during the year - (9.9) (89.2) - (99.1)
Completed development projects - - 76.� (76.�) -
Cost price �1 May, 2005 19.� 98.5 76�.0 81.9 96�.7
Amortisations and impairment losses 1 June, 200� - 76.9 587.5 - 66�.�
Amortisations during the year - 15.2 79.5 - 9�.7
Reversed amortisations on disposals during the year - (7.9) (89.2) - (97.1)
Impairment losses during the year - - 9.9 - 9.9
Amortisations and impairment losses �1 May, 2005 - 8�.2 587.7 - 671.9
Carrying amount �1 May, 2005 19.� 1�.� 176.� 81.9 291.8
Cost price �1 May, 2005 19.� 98.5 76�.0 81.9 96�.7
Amortisations and impairment losses �1 May, 2005 - (8�.2) (587.7) - (671.9)
Carrying amount �1 May, 2005 19.� 1�.� 176.� 81.9 291.8
Cost price 1 June, 2005 19.� 98.5 76�.0 81.9 96�.7
Exchange rate adjustment to year-end rate (0.�) (0.1) - - (0.�)
Reclassification (1.0) 1.0 - - -
Other aditions during the year - 6.� 68.2 96.9 171.�
Disposals during the year - (1.1) (�9.5) - (50.6)
Completed development projects - - 69.0 (69.0) -
Cost price �1 May, 2006 18.0 10�.6 851.7 109.8 1,08�.1
Amortisations and impairment losses 1 June, 2005 - 8�.2 587.7 - 671.9
Exchange rate adjustment to year-end rate - (0.1) - - (0.1)
Amortisations during the year - 9.5 87.2 - 96.7
Reversed amortisations on disposals during the year - (1.1) (�9.5) - (50.6)
Impairment losses during the year - - 10.0 - 10.0
Amortisations and impairment losses �1 May, 2006 - 92.5 6�5.� - 727.9
Carrying amount �1 May, 2006 18.0 12.1 216.� 109.8 �56.2
Cost price �1 May, 2006 18.0 10�.6 851.7 109.8 1,08�.1
Amortisations and impairment losses �1 May, 2006 - (92.5) (6�5.�) - (727.9)
Carrying amount �1 May, 2006 18.0 12.1 216.� 109.8 �56.2
No contractual obligations regarding purchase of intangible assets exist.
Notes ...
12 ...
Parentheses denote negative figures or figures to be deducted
Back to fINANCIAl REPORT AND NOTES Back to BAlANCE SHEET ASSETS

97
Parentheses denote negative figures or figures to be deducted
(DKK million)
Intangible assets (continued)
Completed Development
Acquired development projects in
Parent company Goodwill rights projects progress Total
Cost price 1 June, 200� - 67.� - - 67.�
Amortisations and impairment losses 1 June, 200� - (5�.7) - - (5�.7)
Carrying amount 1 June, 200� - 1�.7 - - 1�.7
Cost price 1 June, 200� - 67.� - - 67.�
Additions during the year, inter-group �.2 - - - �.2
Other additions during the year - 8.1 - - 8.1
Disposals during the year - (5.0) - - (5.0)
Cost price �1 May, 2005 �.2 70.5 - - 7�.7
Amortisations and impairment losses 1 June, 200� - 5�.7 - - 5�.7
Amortisations during the year - 11.� - - 11.�
Reversed amortisations on disposals during the year - (5.0) - - (5.0)
Amortisations and impairment losses �1 May, 2005 - 60.1 - - 60.1
Carrying amount �1 May, 2005 �.2 10.� - - 1�.6
Cost price �1 May, 2005 �.2 70.5 - - 7�.7
Amortisations and impairment losses �1 May, 2005 - (60.1) - - (60.1)
Carrying amount �1 May, 2005 �.2 10.� - - 1�.6
Cost price 1 June, 2005 �.2 70.5 - - 7�.7
Additions during the year, inter-group - 1�.7 657.6 71.8 7��.1
Other additions during the year - �.1 5�.1 9�.� 151.6
Disposals during the year - - (105.8) - (105.8)
Completed development projects - - 6�.8 (6�.8) -
Cost price �1 May, 2006 �.2 89.� 670.7 100.� 86�.6
Amortisations and impairment losses 1 June, 2005 - 60.1 - - 60.1
Additions during the year, inter-group - 12.9 506.7 - 519.6
Amortisations during the year - 8.0 7�.7 - 81.7
Reversed amortisations on disposals during the year - - (105.8) - (105.8)
Impairment losses during the year - - 10.0 - 10.0
Amortisations and impairment losses �1 May, 2006 - (81.0) (�8�.6) - (565.6)
Carrying amount �1 May, 2006 �.2 8.� 186.1 100.� 298.0
Cost price �1 May, 2006 �.2 89.� 670.7 100.� 86�.6
Amortisations and impairment losses �1 May, 2006 - (81.0) (�8�.6) - (565.6)
Carrying amount �1 May, 2006 �.2 8.� 186.1 100.� 298.0
No contractual obligations regarding purchase of intangible
assets exist.
Notes ...
12 ...
Back to fINANCIAl REPORT AND NOTESBack to BAlANCE SHEET ASSETS

98
Parentheses denote negative figures or figures to be deducted
(DKK million)
Tangible assets
Tangible
leasehold non-current
land and Plant and Other improve- assets in
Group buildings machinery equipment ment progress Total
Cost price 1 June, 200� �87.9 1,057.� 2�2.� 70.7 6�.6 1,922.8
Depreciations and impairment
losses 1 June, 200� (200.8) (8�1.0) (189.6) (��.1) - (1,265.5)
Carrying amount 1 June, 200� 287.1 216.� 52.7 �6.6 6�.6 657.�
Cost price 1 June, 200� �87.9 1,057.� 2�2.� 70.7 6�.6 1,922.8
Correction to opening balance - 2�.2 - - - 2�.2
Exchange rate adjustment to year-end rate (0.2) - (0.1) (0.2) - (0.5)
Additions during the year 11.� 26.8 17.8 8.8 58.2 122.9
Completed assets 5.6 5�.6 0.� - (60.6) -
Disposals during the year (8.�) (9�.9) (59.6) (18.7) (8.8) (189.�)
Cost price �1 May, 2005 �96.� 1,069.0 200.8 60.6 5�.� 1,880.1
Depreciations and impairment
losses 1 June, 200� 200.8 8�1.0 189.6 ��.1 - 1,265.5
Correction to opening balance - 2�.2 - - - 2�.2
Exchange rate adjustment to year-end rate (0.1) - (0.1) (0.1) - (0.�)
Depreciations during the year 20.8 9�.0 18.1 6.9 - 1�8.8
Reversed depreciations on disposals
during the year (7.7) (90.7) (56.5) (10.2) - (165.1)
Depreciations and impairment losses
�1 May, 2005 21�.8 867.5 151.1 �0.7 - 1,26�.1
Carrying amount �1 May, 2005 282.5 201.5 �9.7 29.9 5�.� 617.0
Cost price �1 May, 2005 �96.� 1,069.0 200.8 60.6 5�.� 1,880.1
Depreciations and impairment losses
�1 May, 2005 (21�.8) (867.5) (151.1) (�0.7) - (1,26�.1)
Carrying amount �1 May, 2005 282.5 201.5 �9.7 29.9 5�.� 617.0
Of which assets under finance leases - �.� - - - �.�
Notes ...
1� ...
Back to fINANCIAl REPORT AND NOTES Back to BAlANCE SHEET ASSETS

99
Parentheses denote negative figures or figures to be deducted
(DKK million)
Tangible assets (continued)
Tangible
leasehold non-current
land and Plant and Other improve- assets in
Group buildings machinery equipment ment progress Total
Cost price 1 June, 2005 �96.� 1,069.0 200.8 60.6 5�.� 1,880.1
Correction to opening balance - - - (0.�) - (0.�)
Exchange rate adjustment to year-end rate - - (0.1) (1.1) 0.� (0.9)
Transferred to non-current assets
classified as held for sale (1.1) - - - - (1.1)
Additions during the year 67.6 �0.1 28.� 6.9 50.8 19�.8
Completed assets 5.8 �9.5 0.9 - (�6.2) -
Disposals during the year - (99.7) (9.7) (5.5) (9.2) (12�.1)
Cost price �1 May, 2006 568.6 1,0�8.9 220.� 60.5 �9.1 1,9�7.�
Depreciations and impairment
losses 1 June, 2005 21�.8 867.5 151.1 �0.7 - 1,26�.1
Correction to opening balance - - - (0.�) - (0.�)
Exchange rate adjustment to year-end rate (0.1) - (0.�) (0.5) - (0.9)
Depreciations during the year 22.1 76.9 20.0 6.5 - 125.5
Reversed depreciations on disposals
during the year - (96.2) (8.7) (2.�) - (107.�)
Depreciations and impairment
losses �1 May, 2006 2�5.8 8�8.2 162.1 ��.9 - 1,280.0
Carrying amount �1 May, 2006 ��2.8 200.7 58.2 26.6 �9.1 667.�
Cost price �1 May, 2006 568.6 1,0�8.9 220.� 60.5 �9.1 1,9�7.�
Depreciations and impairment
losses �1 May, 2006 (2�5.8) (8�8.2) (162.1) (��.9) - (1,280.0)
Carrying amount �1 May, 2006 ��2.8 200.7 58.2 26.6 �9.1 667.�
Of which assets under finance leases - 2.0 - - - 2.0
Tangible assets in general
Neither in 2005/06 nor 200�/05 subsidies regarding acquisitions of tangible assets have been received, and there are no
unfulfilled conditions regarding subsidies that have been received in the past.
No contractual obligations regarding purchase of tangible assets exist.
Property
The cash value of property in Denmark according to the most recent valuation is DKK 2�1.7 million (DKK 2�1.7 million in
200�/05). The cash value of property contains both land and buildings and investment property.
Assets under finance leases
The assets under finance leases consist solely of trucks that can be purchased by the end of the lease term at favourable prices.
The lease arrangements do not impose any restrictions in the Group’s rights of disposal.
Notes ...
1� ...
Back to fINANCIAl REPORT AND NOTESBack to BAlANCE SHEET ASSETS

100
Parentheses denote negative figures or figures to be deducted
(DKK million)
Tangible assets (continued)
leasehold Tangible
land and Plant and Other improve- assets in
Parent company buildings machinery equipment ment progress Total
Cost price 1 June, 200� 175.9 5.6 87.0 1.� 12.5 282.�
Depreciations and impairment
losses 1 June, 200� (80.0) (�.7) (71.0) (0.6) - (155.�)
Carrying amount 1 June, 200� 95.9 1.9 16.0 0.8 12.5 127.1
Cost price 1 June, 200� 175.9 5.6 87.0 1.� 12.5 282.�
Additions during the year �.8 1.7 �.7 - 0.5 10.7
Completed assets 5.6 5.2 - - (10.8) -
Disposals during the year (1.2) (1.1) (19.8) - (1.7) (2�.8)
Cost price �1 May, 2005 185.1 11.� 70.9 1.� 0.5 269.�
Depreciations and impairment
losses 1 June, 200� 80.0 �.7 71.0 0.6 - 155.�
Depreciations during the year 7.9 0.8 6.� 0.� - 15.�
Reversed depreciations on disposals
during the year (0.8) (0.1) (19.0) - - (19.9)
Depreciations and impairment
losses �1 May, 2005 87.1 �.� 58.� 0.9 - 150.7
Carrying amount �1 May, 2005 98.0 7.0 12.6 0.5 0.5 118.6
Cost price �1 May, 2005 185.1 11.� 70.9 1.� 0.5 269.�
Depreciations and impairment
losses �1 May, 2005 (87.1) (�.�) (58.�) (0.9) - (150.7)
Carrying amount �1 May, 2005 98.0 7.0 12.6 0.5 0.5 118.6
Of which assets under finance leases - 0.1 - - - 0.1
Notes ...
1� ...
Back to fINANCIAl REPORT AND NOTES Back to BAlANCE SHEET ASSETS
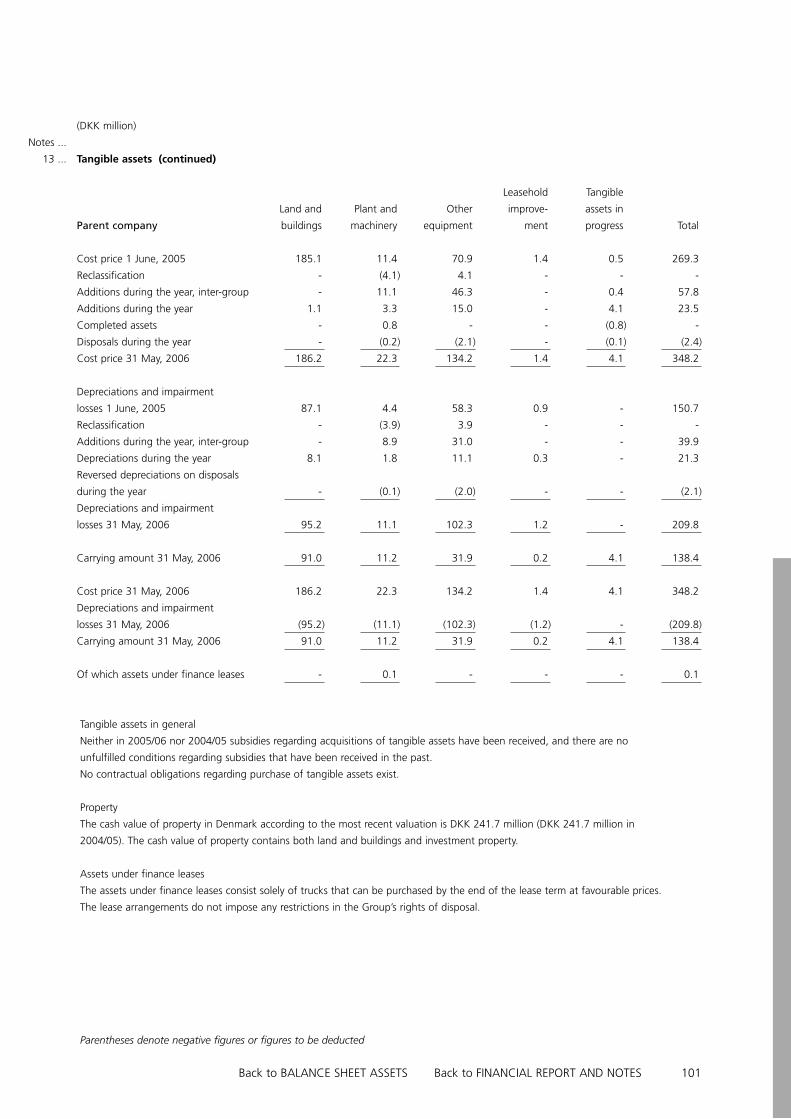
101
Parentheses denote negative figures or figures to be deducted
(DKK million)
Tangible assets (continued)
leasehold Tangible
land and Plant and Other improve- assets in
Parent company buildings machinery equipment ment progress Total
Cost price 1 June, 2005 185.1 11.� 70.9 1.� 0.5 269.�
Reclassification - (�.1) �.1 - - -
Additions during the year, inter-group - 11.1 �6.� - 0.� 57.8
Additions during the year 1.1 �.� 15.0 - �.1 2�.5
Completed assets - 0.8 - - (0.8) -
Disposals during the year - (0.2) (2.1) - (0.1) (2.�)
Cost price �1 May, 2006 186.2 22.� 1��.2 1.� �.1 ��8.2
Depreciations and impairment
losses 1 June, 2005 87.1 �.� 58.� 0.9 - 150.7
Reclassification - (�.9) �.9 - - -
Additions during the year, inter-group - 8.9 �1.0 - - �9.9
Depreciations during the year 8.1 1.8 11.1 0.� - 21.�
Reversed depreciations on disposals
during the year - (0.1) (2.0) - - (2.1)
Depreciations and impairment
losses �1 May, 2006 95.2 11.1 102.� 1.2 - 209.8
Carrying amount �1 May, 2006 91.0 11.2 �1.9 0.2 �.1 1�8.�
Cost price �1 May, 2006 186.2 22.� 1��.2 1.� �.1 ��8.2
Depreciations and impairment
losses �1 May, 2006 (95.2) (11.1) (102.�) (1.2) - (209.8)
Carrying amount �1 May, 2006 91.0 11.2 �1.9 0.2 �.1 1�8.�
Of which assets under finance leases - 0.1 - - - 0.1
Tangible assets in general
Neither in 2005/06 nor 200�/05 subsidies regarding acquisitions of tangible assets have been received, and there are no
unfulfilled conditions regarding subsidies that have been received in the past.
No contractual obligations regarding purchase of tangible assets exist.
Property
The cash value of property in Denmark according to the most recent valuation is DKK 2�1.7 million (DKK 2�1.7 million in
200�/05). The cash value of property contains both land and buildings and investment property.
Assets under finance leases
The assets under finance leases consist solely of trucks that can be purchased by the end of the lease term at favourable prices.
The lease arrangements do not impose any restrictions in the Group’s rights of disposal.
Notes ...
1� ...
Back to fINANCIAl REPORT AND NOTESBack to BAlANCE SHEET ASSETS

102
Group Parent company
(DKK million) 2005/06 200�/05 2005/06 200�/05
Investment property
Cost price 1 June 1.� 1.� 19�.9 19�.2
Depreciations and impairment losses 1 June (0.5) (0.�) (100.�) (9�.1)
Carrying amount 1 June 0.8 0.9 9�.6 101.1
Cost price 1 June 1.� 1.� 19�.9 19�.2
Additions during the year - - 2.� 1.�
Disposals during the year - - - (1.6)
Cost price �1 May 1.� 1.� 196.2 19�.9
Depreciations and impairment losses 1 June 0.5 0.� 100.� 9�.1
Depreciations during the year 0.1 0.1 8.5 8.6
Reversed depreciations on disposals during the year - - - (1.�)
Depreciations and impairment losses �1 May 0.6 0.5 108.8 100.�
Carrying amount �1 May 0.7 0.8 87.� 9�.6
Cost price �1 May 1.� 1.� 196.2 19�.9
Depreciations and impairment losses �1 May (0.6) (0.5) (108.8) (100.�)
Carrying amount �1 May 0.7 0.8 87.� 9�.6
The Group’s investment property is a house that is used only for rental.
Some of the parent company’s buildings are investment property, since these are owned solely for rental to the other companies
in the Group. All investment property is situated in Struer and is used for production, storage and offices.
Due to the location of the investment property it is not possible to estimate the fair value of the property, since the fair value is
completely dependent on the companies in the Group’s continued use of the property. furthermore it is not possible to establish
a range of estimates within which fair value of the investment property is most likely to lie. Independent valuers have not been
used.
Rental income from the investment property of DKK �7.1 million have been received in 2005/06 (DKK ��.8 million in 200�/05).
In the same period the direct operating expenses regarding the investment property that generated rental income were
DKK 2�.0 million (DKK 18.8 million in 200�/05).
No contractual obligations to purchase, construct or develop investment property exist. furthermore no contractual obligations
regarding repairs, maintenance or enhancements of the investment property exist.
The parent company’s investment property is rented to the subsidiaries on operating lease agreements with a lease term of �
months. According to the existing operating lease agreements the parent company will receive a rental income of
DKK 11.7 million in the � months that are included in the agreements’ lease term.
Notes ...
1� ...
Parentheses denote negative figures or figures to be deducted
Back to fINANCIAl REPORT AND NOTES Back to BAlANCE SHEET ASSETS

10�
(DKK million)
Impairment of assets
Intangible assets
Impairment losses during the year
Group
Due to the technological development, an impairment loss of DKK 10.0 million on completed development projects has been
recognised in 2005/06 (DKK 9.9 million in 200�/05).
The determination of the recoverable amount of the development project is based on the estimated value in use of the
project. The value in use is calculated based on all expected future cash flow from the project according to the budgets
approved by management, and a discount rate before tax of 10 %.
Parent company
Due to the technological development, an impairment loss of DKK 10.0 million on completed development projects has been
recognised in 2005/06 (DKK 0.0 million in 200�/05).
The determination of the recoverable amount of the development project is based on the estimated value in use of the
project. The value in use is calculated based on all expected future cash flow from the project according to the budgets
approved by management, and a discount rate before tax of 10 %.
Financial assets
Impairment losses during the year
Parent company
In 2005/06 an impairment loss of DKK 17.0 million on investments in associates has been recognised
(DKK 0.0 million in 200�/05).
The investment in associates that was impaired, was the investment in John Bjerrum Nielsen A/S. The total impairment
loss has been recognised as impairment of investments in associates. The investments in associates are
recognised as part of the Branded business segment.
The impairment loss was recognised due to the fact that the company has generated a loss in the last annual report
and uncertainty as to whether future positive cash flows will be generated from the investment.
The determination of the recoverable amount of the investment is based on the estimated value in use of the investment.
The value in use is calculated based on the expected future dividend payments from John Bjerrum Nielsen A/S, and a discount
rate before tax of 10 %.
Notes ...
15 ...
Back to fINANCIAl REPORT AND NOTESBack to BAlANCE SHEET ASSETS

10�
Parentheses denote negative figures or figures to be deducted
Group Parent company
(DKK million) 2005/06 200�/05 2005/06 200�/05
Investments in subsidiaries
Cost price 1 June 862.7 821.�
Additions during the year - 95.9
Disposals during the year (1��.5) (5�.6)
Cost price �1 May 728.2 862.7
for a list of subsidiaries please refer to note ��.
Investments in associates
Cost price 1 June 17.0 17.0 17.0 17.0
Impairment losses during the year - - (17.0) -
Cost price �1 May 17.0 17.0 - 17.0
Value adjustment 1 June (10.0) (8.�)
Net result for the year after tax (1.0) 0.�
Dividend paid - (2.0)
Value adjustment �1 May (11.0) (10.0)
Carrying amount �1 May 6.0 7.0
Bang & Olufsen’s share
Owners Total Total Share Result for Result for
Name and registered office Share assets liabilities capital Equity the year Equity the year
John Bjerrum Nielsen A/S
Bramming �� % �9.7 21.7 10.0 18.0 (2.9) 6.0 (1.0)
Notes ...
16 ...
17 ...
Back to fINANCIAl REPORT AND NOTES Back to BAlANCE SHEET ASSETS

105
Parentheses denote negative figures or figures to be deducted
(DKK million)
Deferred tax assets
Non- unused
current Inven- tax
Group assets tories Receivables Provisions losses Other Total
Deferred tax assets 1 June, 200� 6.� 0.7 �.� �.7 8.5 0.� 2�.0
Accumulated effect of changes to
accounting principles applied - - - 17.6 - - 17.6
Adjusted balance 1 June, 200� 6.� 0.7 �.� 21.� 8.5 0.� �0.6
Recognised in the profit and loss account 7.9 (�.�) 0.� 1.5 (2.�) (0.�) �.8
Deferred tax assets �1 May, 2005 1�.� (2.7) �.8 22.8 6.2 - ��.�
Recognised in the profit and loss account (7.1) �.0 0.2 (12.0) 0.� - (15.6)
Deferred tax assets �1 May, 2006 7.2 0.� �.0 10.8 6.5 - 28.8
Non-
current Inven-
Parent company assets tories Receivables Provisions Total
Deferred tax assets 1 June, 200� 1.1 (2.6) 2.0 - 0.5
Accumulated effect of changes
to accounting principles applied - - - 0.5 0.5
Adjusted balance 1 June, 200� 1.1 (2.6) 2.0 0.5 1.0
Recognised in the profit and loss account �.9 (0.7) (2.0) 1.8 �.0
Deferred tax assets �1 May, 2005 5.0 (�.�) - 2.� �.0
Transferred to deferred tax (5.0) �.� - (2.�) (�.0)
Deferred tax assets �1 May, 2006 - - - - -
Deferred tax assets relate to the subsidiaries in Denmark, Holland, Norway, Germany, Austria, the uK, france, Italy, Spain and Singapore.
Deferred tax assets have been calculated, based on local tax rates.
Deferred tax assets relating to the subsidiaries in the uS and Japan have not been recognised.
The unrecognised deferred tax assets amounts to DKK 88.7 million (DKK 90.0 million in 200�/05). The basis for the
unrecognised deferred tax assets is tax losses of DKK 22�.6 million (DKK 227.8 million in 200�/05).
Notes ...
18 ...
Back to fINANCIAl REPORT AND NOTESBack to BAlANCE SHEET ASSETS

106
Group Parent company
(DKK million) 2005/06 200�/05 2005/06 200�/05
Other financial receivables
Other financial receivables (gross) 1 June �7.1 2�.9
Exchange rate adjustment to year-end rate (0.�) (0.1)
Movements during the year �.9 2�.�
Other financial receivables (gross) �1 May 50.6 �7.1
Write-down for expected losses 1 June 18.� 7.2
Exchange rate adjustment to year-end rate (0.2) -
Change in write-down during the year (�.9) 11.�
Actual losses during the year (0.1) (0.1)
Write-down for expected losses �1 May 1�.2 18.�
Other financial receivables (net) �1 May �6.� 28.7
The write-down of other financial receivables is recognised in the profit and loss account as part of distribution and marketing costs.
The write-down is based on an individual assessment of the ability to pay of each individual debtor.
The fair value of other financial receivables in the Group amounts to DKK ��.9 million (DKK 25.8 million in 200�/05).
The fair value has been calculated based on the present value of the future expected cash flow from the receivables.
Inventories
Raw materials 161.1 1�2.� - -
Work in progress �8.� �2.0 - -
Spare parts 121.8 90.5 - -
finished goods 2�6.2 16�.8 0.2 0.2
Inventories �1 May 567.� �29.7 0.2 0.2
The following amounts of the carrying amount are expected
to be realised after more than 12 months:
Spare parts 5�.6 �0.6
Inventories �1 May 5�.6 �0.6
The reason, why a large part of the spare parts is expected to be realised after 12 months, is that it is the Group’s policy to be
able to make repairs to products for up to 12 years after, the products are sold.
Carrying amount of inventories carried at fair value
less costs to sell - -
Stock consumption recognised as part of production costs
during the year 1,925.2 1,6�9.�
Write-down of inventories recognised as
part of production costs during the year �5.8 1�.1
Reversal of write-down of inventories recognised
as part of the production costs during the year 1�.9 11.1
The reversal of write-down of inventories during the year has taken place due to sales of the inventories
which were written-down, exceeding the expected.
The reversal of write-down of inventories last year took place due to the same circumstances.
Notes ...
19 ...
20 ...
Back to fINANCIAl REPORT AND NOTES Back to BAlANCE SHEET ASSETS

107
Parentheses denote negative figures or figures to be deducted
Group Parent company
(DKK million) 2005/06 200�/05 2005/06 200�/05
Trade receivables
Trade receivables (gross) �1 May 711.5 602.�
Write-down for expected losses 1 June 5�.5 57.�
Change in write-down during the year 11.7 2�.�
Actual losses during the year (8.8) (28.2)
Write-down for expected losses �1 May 56.� 5�.5
Trade receivables (net) �1 May 655.1 5�8.8
All trade receivables fall due within 1 year.
The write-down of trade receivables is recognised in the profit and loss account as part of distribution and marketing costs.
The write-down is based on an individual assessment of the creditworthiness of each individual debtor.
The fair value of trade receivables in the Group amounts to DKK 655.1 million (DKK 5�8.8 million in 200�/05).
The carrying amount of receivables that fall due within one year is expected to be a reasonable approximation of the fair value.
Receivables from subsidiaries
Receivables from subsidiaries �1 May 156.8 92.7
All receivables from subsidiaries fall due within 1 year.
There has been no need for write-down of receivables from subsidiaries.
The fair value of receivables from subsidiaries amounts to DKK 156.8 million (DKK 92.7 million in 200�/05).
The carrying amount of receivables that fall due within one year is expected to be a reasonable approximation of the fair value.
Income tax receivable
Income tax receivable 1 June 22.6 121.2 - 96.�
Exchange rate adjustment to year-end rate (0.8) - - -
Adjustment previous years (7.9) - (0.2) -
The year’s current tax incl. jointly taxed subsidiaries 0.8 - 2.1 -
Corrections 0.6 - - -
Income tax paid during the year 1.� - 75.1 -
Income tax refunded during the year - (98.6) (�1.5) -
Transferred from Income tax - - (�0.7) -
Transferred to Income tax - - - (96.�)
Income tax receivable �1 May 16.6 22.6 1�.8 -
DKK 0 million of the Income tax receivable in the Group are expected to be received after 1 year (DKK 0 million in 200�/05).
DKK 0 million of the Income tax receivable in the parent company are expected to be received after 1 year (DKK 0 million in
200�/05).
Notes ...
21 ...
22 ...
2� ...
Back to fINANCIAl REPORT AND NOTESBack to BAlANCE SHEET ASSETS

108
Parentheses denote negative figures or figures to be deducted
Group Parent company
(DKK million) 2005/06 200�/05 2005/06 200�/05
Other receivables
Value added tax receivable 16.� 2�.6 10.0 -
Other receivables �5.0 21.� 2.6 2.8
Other receivables �1 May 51.� �5.9 12.5 2.8
All other receivables fall due within 1 year.
There has been no need for write-down of other receivables.
The fair value of other receivables in the Group amounts to DKK 51.� million (DKK �5.9 million in 200�/05), while the fair value
in the parent company amounts to DKK 12.6 million (DKK 2.8 million in 200�/05). The carrying amount of receivables that fall
due within one year is expected to be a reasonable approximation of the fair value.
Non-current assets classified as held for sale
Non-current assets classified as held for sale consist of the following assets:
Tangible assets 1.1 -
The tangible asset that is classified as held for sale is part of the existing land in Bang & Olufsen Medicom a/s. The asset is
classified as held for sale due to the management’s decision to sell the land to an interested buyer. The sale is expected to
take place in the fall of 2006.
The decision to sell the asset has not necessitated the recognition of impairment losses relating to the asset.
The tangible asset is recognised as part of the non-branded business segment.
Share capital
As at �1 May, 2006, the share capital comprises:
1,119,910 ordinary shares of DKK 10
(multiple voting shares) 11.2 11.2 11.2 11.2
11,��1,015 ordinary shares of DKK 10 11�.� 112.9 11�.� 112.9
12�.5 12�.1 12�.5 12�.1
Each ordinary share (multiple voting share) of DKK 10
gives 10 votes, while each ordinary share of DKK 10
gives 1 vote.
Number of ordinary shares (multiple voting shares) 1 June 1,119,910 1,119,910 1,119,910 1,119,910
Number of ordinary shares (multiple voting shares) �1 May 1,119,910 1,119,910 1,119,910 1,119,910
Number of ordinary shares 1 June 11,29�,��0 11,260,�20 11,29�,��0 11,260,�20
Subscription of employee shares �6,685 ��,910 �6,685 ��,910
Number of ordinary shares �1 May 11,��1,015 11,29�,��0 11,��1,015 11,29�,��0
Notes ...
2� ...
25...
26...
Back to fINANCIAl REPORT AND NOTES Back to BAlANCE SHEET ASSETSBack to BAlANCE SHEET EQuITY AND lIABIlITIES

109
Parentheses denote negative figures or figures to be deducted
Group Parent company
(DKK million) 2005/06 200�/05 2005/06 200�/05
Share capital (continued)
Number of own shares:
Ordinary shares (multiple voting shares) ��,�67 �0,�75 ��,�67 �0,�75
Ordinary shares 6�5,220 �05,00� 6�5,220 �05,00�
669,587 ��5,�79 669,587 ��5,�79
Nominal value in DKK million 6.7 �.� 6.7 �.�
% of share capital, year-end 5.� �.5 5.� �.5
17�,208 of the Group’s own shares (Ordinary shares)
are reserved for the coverage of the share option programme,
cf. note 5. There are no other reservations regarding the
Group’s own shares.
Acquisitions during the year:
Number of shares 255,58� �02,957 255,58� �02,957
Nominal value in DKK million 2.6 �.0 2.6 �.0
% of share capital, year-end 2.1 2.� 2.1 2.�
Total acquisition sum DKK million 1�8.9 105.5 1�8.9 105.5
The acquisitions were undertaken in accordance with the
authority from the Annual General Meeting to purchase own
shares with the purpose of subsequent capital reductions and
the coverage of the share option programme.
Sales during the year:
Number of shares 21,�75 �1,818 21,�75 �1,818
Nominal value in DKK million 0.2 0.2 0.2 0.2
% of share capital, year-end 0.2 0.2 0.2 0.2
Total acquisition sum DKK million 5.� 6.5 5.� 6.5
The sales were undertaken in connection with the exercise
of share options in the share option programme.
Retained earnings
In the 2005/06 financial year DKK 1�8.9 million have been paid as dividend corresponding to DKK 12 per share
(DKK 86.7 million corresponding to DKK 7 per share in 200�/05). On the Annual General Meeting 28 September 2006 a dividend
for the financial year 2005/06 of DKK 199.2 million corresponding to DKK 16 per share will be proposed. The proposed dividend
is not incorporated in the annual report.
Minority interests
Balance 1 June 2.1 2.�
Minority interests’ share of result for the year (1.7) (5.7)
Transferred to other receivables �.7 5.5
Balance �1 May �.1 2.1
Notes ...
26 ...
27...
28...
Back to fINANCIAl REPORT AND NOTESBack to BAlANCE SHEET EQuITY AND lIABIlITIES

110
(DKK million)
Pensions
Defined contribution plans:
In defined contribution plans Bang & Olufsen recognises the premium payments (e.g. a fixed amount or a fixed percentage of the salary)
for independent insurance companies, which are responsible for the pension obligations in the profit and loss account.
Once the pension contributions for defined contribution plans have been paid, Bang & Olufsen has no further pension
obligations to current or past employees. The pension plans in the Danish and some of the foreign companies are all
defined contribution plans
In the Group DKK �7.2 million (DKK �2.8 million in 200�/05) have been recognised in the profit and loss account as costs related
to defined contribution plans. In the parent company DKK 22.9 million (DKK 5.1 million in 200�/05) have been recognised as
costs related to defined contribution plans.
Defined benefit plans:
In defined benefit plans Bang & Olufsen is obliged to pay a certain benefit (e.g. retirement benefit as a fixed sum of the
final salary). In defined benefit plans Bang & Olufsen carries the risk, since changes to the calculation basis result in
changes in the actuarially calculated capital value.
The major defined benefit plans in the Group include employees in Germany and Holland.
In the Group a net obligation of DKK 1�.� million (DKK 7.� million in 200�/05) has been recognised relating to the Group’s
obligations to current or past employees concerning defined benefit plans.
The obligation is calculated after deduction of the plan assets. The parent company has no defined benefit plans.
In the Group DKK �.� million (DKK 0.7 million in 200�/05) have been recognised in the profit and loss account regarding defined
benefit plans.
Group
(DKK million) 2005/06 200�/05
Present value of defined benefit obligation 56.8 20.6
fair value of the plan assets (�9.7) (1�.6)
unrecognised actuarial gains and losses (2.8) 0.�
Defined benefit plans �1 May, net 1�.� 7.�
Of which included as part of the liabilities 15.5 8.5
Of which included as part of the assets (1.2) (1.1)
Development in the present value of the defined
benefit obligation:
Present value of the defined benefit obligation 1 June 20.6 20.0
Adjustment, beginning of the year due to business acquisition ��.0 -
Exchange rate adjustment to year-end rate 0.1 0.2
Contribution regarding the current year 2.� 0.6
Interest costs 2.� 0.8
Actuarial gains and losses (1.�) (0.�)
Benefits paid (0.2) (0.6)
Present value of the defined benefit obligation �1 May 56.8 20.6
Defined benefit obligation from plans that are wholly unfunded �.9 �.6
Defined benefit obligation from plans that are wholly or
partly funded 52.9 17.0
Notes ...
29 ...
Back to fINANCIAl REPORT AND NOTES Back to BAlANCE SHEET EQuITY AND lIABIlITIES

111
Group Parent company
(DKK million) 2005/06 200�/05 2005/06 200�/05
Pensions (continued)
Development in the fair value of the plan assets regarding
defined benefit plans:
fair value of the plan assets 1 June 1�.6 12.�
Adjustment, beginning of the year due to business acquisition 26.6 -
Exchange rate adjustment to year-end rate 0.1 0.2
Expected return on plan assets 1.9 0.7
Actuarial gains and losses (�.9) 0.1
Administration costs (0.�) -
Benefits paid (0.1) -
Contributions by the employer 2.9 0.�
Present value of the plan assets �1 May �9.7 1�.6
Amounts recognised in the profit and loss account:
Contribution regarding the current year 2.� 0.6
Interest costs on the obligation 2.� 0.8
Expected return on plan assets (1.9) (0.7)
Recognised actuarial gains and losses 0.2 -
Administration costs 0.� -
Total amount recognised for defined benefit plans �.� 0.7
Total amount recognised for defined contribution plans �7.2 �2.8 22.9 5.1
Total amounts recognised in
the profit and loss account, cf. note 5 50.5 ��.5 22.9 5.1
Actual return on plan assets regarding the
defined benefit plans (�.0) 0.8
The defined benefit plan in Germany is partly funded in an independent pension fund. As at �1 May, 2006, the actuarially
calculated net obligation is recognised in the Group’s balance sheet at DKK 5.� million (DKK �.6 million in 200�/05).
The net obligation is calculated as the present value of the future payments of DKK 12.1 million (DKK 11.� million in 200�/05)
less the fair value of the pension fund’s assets DKK 6.8 million (DKK 6.6 million in 200�/05). The actuarial calculation
is based on a calculation rate of �.25 % p.a., an expected rate of salary increase of 2 % p.a. and an expected rate of return on
plan assets of � % p.a. In the Group’s profit and loss account the defined benefit plan is recognised as an expense of
DKK 0.5 million (DKK 0.2 million in 200�/05).
The defined benefit plan in Holland is also partly funded in an independent pension fund. As at �1 May, 2006 the actuarially
calculated net obligation is recognised in the Group’s balance sheet at DKK 6.� million (DKK 0 million in 200�/05).
The net obligation is acquired in connection with the purchase of the Dutch distribution activity. The net obligation
is calculated as the present value of the future payments of DKK �2.2 million (DKK 0 million in 200�/05) less the fair value of
the fair value of the pension fund’s asset DKK 25.1 million (DKK 0 million in 200�/05). The actuarial calculation is based on
a calculation rate of � % p.a., an expected rate of salary increase of 2.5 % p.a. and an expected rate of return on plan assets
of �.2 % p.a. In the Group’s profit and loss account the defined benefit plan is recognised as an expense of DKK 2.2 million
(DKK 0 million in 200�/05).
Notes ...
29 ...
Back to fINANCIAl REPORT AND NOTESBack to BAlANCE SHEET EQuITY AND lIABIlITIES

112
(DKK million)
Deferred tax
Non- Share
current Inven- Receiv- based
Group assets tories ables Provisions payment Other Total
Deferred tax 1 June, 200� 58.1 19.9 (2.�) (9.8) - 1.0 66.9
Accumulated effect of changes
to accounting principles applied - - - - - - -
Adjusted balance 1 June, 200� 58.1 19.9 (2.�) (9.8) - 1.0 66.9
Recognised in the profit and loss account �.� (20.�) 2.2 12.0 - 0.� (1.�)
Deferred tax �1 May, 2005 62.5 (0.5) (0.1) 2.2 - 1.� 65.5
Recognised in the profit and loss account 15.� 2.5 (0.2) (8.7) (2.�) (2.1) �.�
Recognised in the equity - - - - (6.2) - (6.2)
Deferred tax �1 May, 2006 77.8 2.0 (0.�) (6.5) (8.6) (0.7) 6�.7
Parent company
Deferred tax �1 May, 2005 - - - - - - -
Transferred to deferred tax assets (5.0) �.� - (2.�) - - (�.0)
Addition due to business combination 61.6 - - (2.1) - - 59.5
Effect of changes to accounting principles applied - (2.5) - - - - (2.5)
Recognised in the profit and loss account 17.7 (0.7) - 2.9 (2.�) (1.6) 15.9
Recognised in the equity - - - - (6.2) - (6.2)
Deferred tax �1 May, 2006 7�.� 0.1 - (1.5) (8.6) (1.6) 62.7
Deferred tax has been calculated, using local tax rates.
Group
Provisions 2005/06 200�/05
Provisions for warranty 1 June 60.0 67.5
Exchange rate adjustment to year-end rate (0.�) (0.1)
Provisions during the year 50.5 �6.�
Provisions used during the year (�0.�) (�8.7)
Provisions reversed during the year (1.5) (5.0)
Provisions for warranty �1 May 68.� 60.0
Provisions for fairness 1 June �1.� �1.9
Exchange rate adjustment to year-end rate (0.2) (0.1)
Provisions during the year 11.8 1�.5
Provisions used during the year (9.6) (12.2)
Provisions reversed during the year (7.8) -
Change in the calculation of present value during the year (1.5) (1.7)
Provisions for fairness �1 May ��.1 �1.�
Notes ...
�0 ...
�1 ...
Parentheses denote negative figures or figures to be deducted
Back to fINANCIAl REPORT AND NOTES Back to BAlANCE SHEET EQuITY AND lIABIlITIES
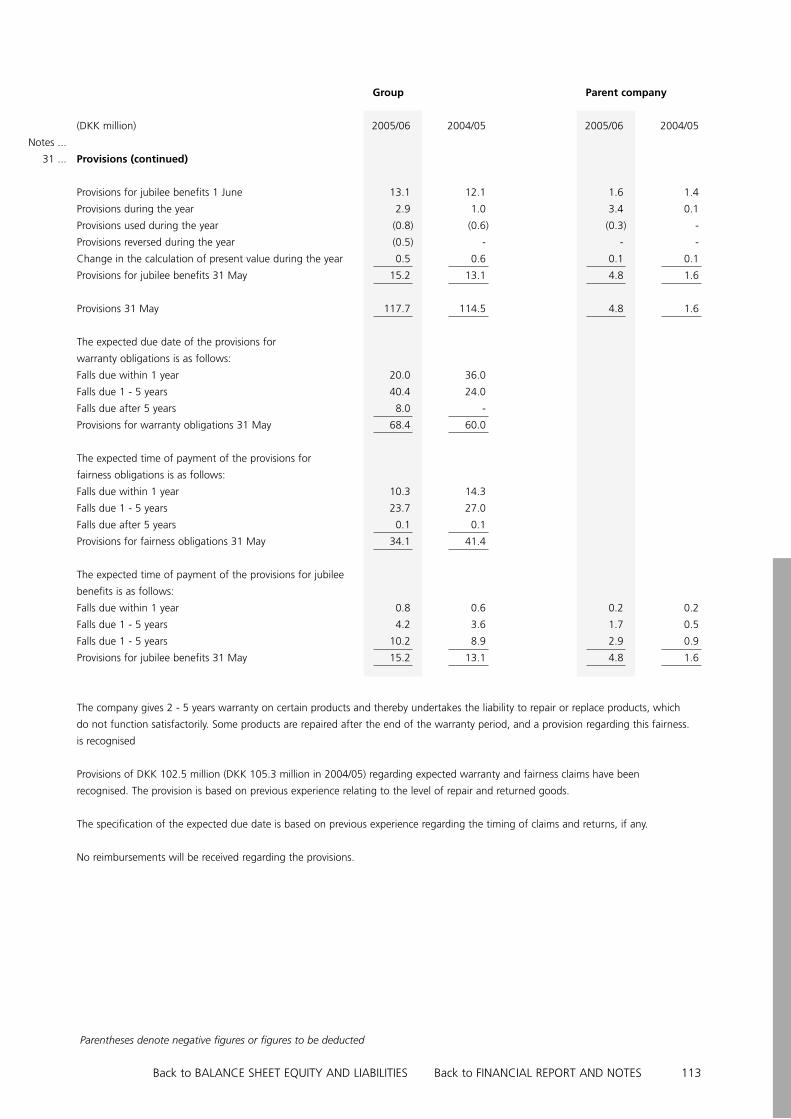
11�
Group Parent company
(DKK million) 2005/06 200�/05 2005/06 200�/05
Provisions (continued)
Provisions for jubilee benefits 1 June 1�.1 12.1 1.6 1.�
Provisions during the year 2.9 1.0 �.� 0.1
Provisions used during the year (0.8) (0.6) (0.�) -
Provisions reversed during the year (0.5) - - -
Change in the calculation of present value during the year 0.5 0.6 0.1 0.1
Provisions for jubilee benefits �1 May 15.2 1�.1 �.8 1.6
Provisions �1 May 117.7 11�.5 �.8 1.6
The expected due date of the provisions for
warranty obligations is as follows:
falls due within 1 year 20.0 �6.0
falls due 1 - 5 years �0.� 2�.0
falls due after 5 years 8.0 -
Provisions for warranty obligations �1 May 68.� 60.0
The expected time of payment of the provisions for
fairness obligations is as follows:
falls due within 1 year 10.� 1�.�
falls due 1 - 5 years 2�.7 27.0
falls due after 5 years 0.1 0.1
Provisions for fairness obligations �1 May ��.1 �1.�
The expected time of payment of the provisions for jubilee
benefits is as follows:
falls due within 1 year 0.8 0.6 0.2 0.2
falls due 1 - 5 years �.2 �.6 1.7 0.5
falls due 1 - 5 years 10.2 8.9 2.9 0.9
Provisions for jubilee benefits �1 May 15.2 1�.1 �.8 1.6
The company gives 2 - 5 years warranty on certain products and thereby undertakes the liability to repair or replace products, which
do not function satisfactorily. Some products are repaired after the end of the warranty period, and a provision regarding this fairness.
is recognised
Provisions of DKK 102.5 million (DKK 105.� million in 200�/05) regarding expected warranty and fairness claims have been
recognised. The provision is based on previous experience relating to the level of repair and returned goods.
The specification of the expected due date is based on previous experience regarding the timing of claims and returns, if any.
No reimbursements will be received regarding the provisions.
Notes ...
�1 ...
Parentheses denote negative figures or figures to be deducted
Back to fINANCIAl REPORT AND NOTESBack to BAlANCE SHEET EQuITY AND lIABIlITIES

11�
(DKK million)
Financial liabilities
falls due falls due falls due falls due after
Group within 1 year 1 - 5 years after 5 years 1 year, total
financial liabilities:
fixed rate loans, interest rate level 5.9 - 6.� % 29.� 7�.� - 7�.�
fixed rate loans, interest rate level �.0 - 5.0 % 16.9 68.0 95.5 16�.5
Carrying amount �1 May, 2006 �6.� 1�1.� 95.5 2�6.9
fixed rate loans, interest rate level 5.9 - 6.� % 29.� 102.8 - 102.8
fixed rate loans, interest rate level �.0 - 5.0 % 9.8 �0.2 65.2 105.�
Carrying amount �1 May, 2005 �9.2 1��.0 65.2 208.2
Parent company
financial liabilities:
fixed rate loans, interest rate level 5.9 - 6.� % 29.5 7�.� - 7�.�
fixed rate loans, interest rate level �.0 - 5.0 % 8.0 �2.0 2�.0 56.0
Carrying amount �1 May, 2006 �7.5 105.� 2�.0 129.�
fixed rate loans, interest rate level 5.9 - 6.� % 29.� 102.8 - 102.8
fixed rate loans, interest rate level �.0 - 5.0 % 8.0 �2.0 �2.0 6�.0
Carrying amount �1 May, 2005 �7.� 1��.8 �2.0 166.8
The fair value of the financial liabilities in the Group amounts to DKK 281.9 million (DKK 2�8.2 million in 200�/05),
while the fair value in the parent company amounts to DKK 166.9 million (DKK 20�.2 million in 200�/05).
The present value is calculated as the present vale of the expected future interest and capital repayments.
liabilities regarding finance leases are recognised in loans from banks etc. as follows:
Group
Instalment 1.� 0.7 - 2.1
Interest 0.1 0.1 - 0.2
Carrying amount �1 May, 2006 1.5 0.8 - 2.�
Group
Instalment 1.� 2.2 - �.6
Interest 0.1 0.1 - 0.2
Carrying amount �1 May, 2005 1.5 2.� - �.8
Notes ...
�2 ...
Parentheses denote negative figures or figures to be deducted
Back to fINANCIAl REPORT AND NOTES Back to BAlANCE SHEET EQuITY AND lIABIlITIES

115
(DKK million)
Financial liabilities (continued)
falls due falls due falls due falls due after
Parent company within 1 year 1 - 5 years after 5 years 1 year, total
Instalment 0.1 - - 0.1
Interest - - - -
Carrying amount �1 May, 2006 0.1 - - 0.1
Parent company
Instalment 0.1 - - 0.1
Interest - - - -
Carrying amount �1 May, 2005 0.1 - - 0.1
Neither in the Group nor in the parent company contingent leases have been recognised as an expense in 2005/06 or 200�/05.
None of the assets under finance leases have been subleased. Thus, at the balance sheet date, no non-cancellable subleases, from which
sublease payments are received, exist - neither in the Group nor in the Parent company.
The fair value of liabilities regarding assets under finance leases corresponds to the carrying amount. The fair value is estimated
to be the present value of the expected future cash flow at a market interest rate for similar leases.
Group Parent company
Income tax 2005/06 200�/05 2005/06 200�/05
Accrued Income tax 1 June 72.0 9.6 �0.7 -
Exchange rate adjustment to year-end rate (0.1) - - -
Tax deducted at source �.9 - - -
Adjustment previous years (11.�) �.6 - �.6
The year’s current tax incl. jointly taxed subsidiaries 112.9 111.0 - 71.6
Income tax paid during the year (1�0.7) (28.7) - (21.0)
Received Income tax receivable �1.6 72.8 - 72.8
Transferred to Income tax receivable - (96.�) (�0.7) (96.�)
Accrued Income tax �1 May 78.� 72.0 - �0.7
DKK 0 million of the accrued Income tax in the Group is expected to be paid after 1 year (DKK 0 million in 200�/05).
DKK 0 million of the accrued Income tax in the parent company is expected to be paid after 1 year (DKK 0 million in
200�/05).
Notes ...
�2 ...
�� ...
Parentheses denote negative figures or figures to be deducted
Back to fINANCIAl REPORT AND NOTESBack to BAlANCE SHEET EQuITY AND lIABIlITIES

116
Group Parent company
(DKK million) 2005/06 200�/05 2005/06 200�/05
Other payables
Payroll-related items 125.9 108.8 �8.6 12.5
Taxes and duties 72.1 67.0 - �1.6
Other payables 168.7 1�6.0 �9.� 16.1
Other payables �1 May �66.7 �11.8 88.0 60.2
All other payables fall due within one year.
The fair value of other payables in the Group amounts to DKK �66.7 million (DKK �11.8 million in 200�/05), while the fair
value in the parent company amounts to DKK 88.0 million (DKK 60.2 million in 200�/05).
The carrying amount of payables that fall due within one year is expected to be a reasonable approximation of the fair value.
Adjustments
Change in provisions 10.2 (7.�) (0.�) 0.2
financial income etc. (17.7) (�0.7) (1�.�) (50.�)
financial costs etc. 2�.9 2�.5 19.9 21.9
Share in associates’ result after tax 1.0 (0.�) - -
loss on sale of non-current assets �.� 1.6 - -
Tax on result for the year 1��.7 11�.9 10.1 6.5
Various adjustments 5.7 10.� 1�.8 1�.�
162.1 111.8 �0.1 (7.�)
Change in working capital
Change in receivables (122.0) 51.0 (62.6) 172.7
Change in inventories (112.8) 60.7 - 0.2
Change in accounts payables etc. �6.6 (�1.9) (1�.1) (15.8)
(188.2) 69.8 (76.7) 157.1
Acquisitions of activities
Inventories (2�.9)
Tangible non-current assets (8.6)
Deferred tax assets (0.8)
Prepayments (0.1)
Provisions 6.7
(27.7)
Cash and cash equivalents
Cash and cash equivalents consists of:
Cash and cash equivalents �1 May 502.5 7�1.9 �06.1 5�7.�
There are no restrictions in the Group’s or the parent company’s use of cash and cash equivalents.
Notes ...
�� ...
�5...
�6...
�7...
�8...
Parentheses denote negative figures or figures to be deducted
Back to fINANCIAl REPORT AND NOTES Back to BAlANCE SHEET EQuITY AND lIABIlITIESBack to CASH flOW STATEMENT
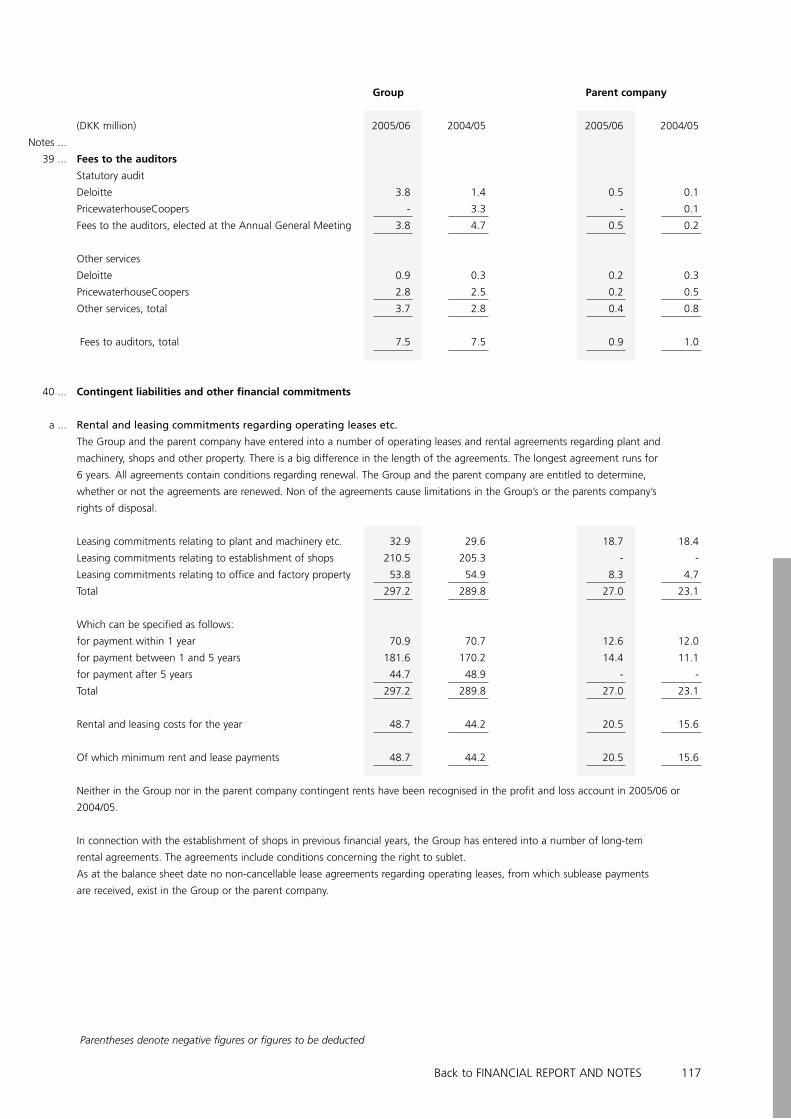
117
Group Parent company
(DKK million) 2005/06 200�/05 2005/06 200�/05
Fees to the auditors
Statutory audit
Deloitte �.8 1.� 0.5 0.1
PricewaterhouseCoopers - �.� - 0.1
fees to the auditors, elected at the Annual General Meeting �.8 �.7 0.5 0.2
Other services
Deloitte 0.9 0.� 0.2 0.�
PricewaterhouseCoopers 2.8 2.5 0.2 0.5
Other services, total �.7 2.8 0.� 0.8
fees to auditors, total 7.5 7.5 0.9 1.0
Contingent liabilities and other financial commitments
Rental and leasing commitments regarding operating leases etc.
The Group and the parent company have entered into a number of operating leases and rental agreements regarding plant and
machinery, shops and other property. There is a big difference in the length of the agreements. The longest agreement runs for
6 years. All agreements contain conditions regarding renewal. The Group and the parent company are entitled to determine,
whether or not the agreements are renewed. Non of the agreements cause limitations in the Group’s or the parents company’s
rights of disposal.
leasing commitments relating to plant and machinery etc. �2.9 29.6 18.7 18.�
leasing commitments relating to establishment of shops 210.5 205.� - -
leasing commitments relating to office and factory property 5�.8 5�.9 8.� �.7
Total 297.2 289.8 27.0 2�.1
Which can be specified as follows:
for payment within 1 year 70.9 70.7 12.6 12.0
for payment between 1 and 5 years 181.6 170.2 1�.� 11.1
for payment after 5 years ��.7 �8.9 - -
Total 297.2 289.8 27.0 2�.1
Rental and leasing costs for the year �8.7 ��.2 20.5 15.6
Of which minimum rent and lease payments �8.7 ��.2 20.5 15.6
Neither in the Group nor in the parent company contingent rents have been recognised in the profit and loss account in 2005/06 or
200�/05.
In connection with the establishment of shops in previous financial years, the Group has entered into a number of long-tem
rental agreements. The agreements include conditions concerning the right to sublet.
As at the balance sheet date no non-cancellable lease agreements regarding operating leases, from which sublease payments
are received, exist in the Group or the parent company.
Notes ...
�9 ...
�0 ...
a ...
Parentheses denote negative figures or figures to be deducted
Back to fINANCIAl REPORT AND NOTES

118
Group Parent company
(DKK million) 2005/06 200�/05 2005/06 200�/05
Contingent liabilities and other financial
commitments (continued)
Guarantees
Total guaranties as at �1 May 18.9 12.5 2.7 2.9
None of the guarantees are expected to result in any losses.
Letters of intent
Bang & Olufsen Operations a/s has issued letters of intent to
the foreign subsidiaries’ bank connections for: 1�.1 69.�
Bank debt as at �1 May 0.0 0.0
Joint taxation
The Danish companies in the Group are jointly taxed.
The companies are jointly and severally liable for the tax under the joint taxation until and including the 0�/05 financial year.
VAT and other taxes
The Danish companies in the Group share common registration and are jointly and severally liable for VAT and other taxes.
Security for mortgage debt
Security of DKK 272.� million (DKK 275.5 million as at �1 May, 2005) has been given in land and buildings for the Group’s
mortgage debt of DKK 28�.2 million (DKK 2�7.� million as at �1 May, 2005).
Security of DKK 228.6 million (DKK 228.6 million as at �1 May, 2005) has been given in land and buildings and investment
property for the parent company’s mortgage debt of DKK 166.9 million (DKK 20�.2 million as at �1 May, 2005).
Other tangible non-current assets related to the land and buildings and investment property are included in the security.
The carrying amount of the Group’s land and building is DKK 258.7 million (DKK 277.5 million as at �1 May, 2005), while
the carrying amount in the parent company is DKK 178.� million (DKK 191.6 million as at �1 May, 2005).
No intangible non-current assets are pledge as security for liabilities.
No financial assets are pledge as security for liabilities.
Lawsuits
The companies in the Group are parties to a few ongoing lawsuits. It is the assessment of Management, that the outcome
of the lawsuits will not influence the Group’s financial position. No further information is given regarding the lawsuits, as
further information might harm the Group.
Notes ...
�0 ...
b ...
c ...
d ...
e ...
f ...
g ...
Parentheses denote negative figures or figures to be deducted
Back to fINANCIAl REPORT AND NOTES

119
(DKK million)
Financial instruments
The extent and type of the Group’s and parent company’s financial instruments are given in the profit and loss account, balance
sheet and notes in accordance with the accounting principles applied. Information regarding conditions that can affect amount,
dates of payment or reliability of future payments, where such information is not directly evident from the consolidated or the
parent company’s accounts, or follows from common practice, is given below.
Monetary items* in the balance sheet of the Group as at 31 May translated to DKK:
2005/06 2004/05
Currency Payment/maturity Assets liabilities Net Assets liabilities Net
EuR 0-12 months 50�.7 11�.5 �91.2 �0�.2 105.7 297.5
> 12 months 2.8 0.� 2.5 �.0 1.5 1.5
GBP 0-12 months 171.� �0.� 1�1.0 1�9.6 �6.9 92.7
SEK 0-12 months 28.� �.7 2�.7 ��.7 9.� 2�.�
JPY 0-12 months 22.6 �.2 19.� 19.9 - 19.9
> 12 months 0.8 - 0.8 1.2 - 1.2
CHf 0-12 months �7.� 9.1 �8.� �0.2 15.8 2�.�
uSD 0-12 months 56.1 �8.� 7.7 57.8 16.9 �0.9
> 12 months 0.5 - 0.5 0.� - 0.�
CZK 0-12 months - 8.6 (8.6) 75.9 - 75.9
SGD 0-12 months 2�.0 5.5 18.5 - - -
> 12 months 1.� - 1.� - - -
AuD 0-12 months 1�.6 12.0 1.6 - - -
Other 0-12 months 20.1 5.� 1�.8 - 1�.� (1�.�)
> 12 months - - - 1.1 - 1.1
Monetary items* in the balance sheet of the parent company as at 31 May translated to DKK:
2005/06 200�/05
Currency Payment/maturity Assets liabilities Net Assets liabilities Net
EuR 0-12 months 8�.0 1.1 81.9 19.7 - 19.7
GBP 0-12 months 25.� - 25.� �.� - �.�
SEK 0-12 months 6.5 0.2 6.� - 0.2 (0.2)
JPY 0-12 months 5.� - 5.� 7.6 - 7.6
CHf 0-12 months 5.0 - 5.0 - 0.9 (0.9)
uSD 0-12 months 5.5 1.� �.2 17.1 - 17.1
CZK 0-12 months - - - 72.2 - 72.2
Other 0-12 months 6.8 - 6.8 - 0.5 (0.5)
* Monetary items are cash and cash equivalents etc., receivables and payables, which are settled in cash.
Hedging
There are no forward contracts in the Group and the parent company as at �1 May, 2006. Similarly there were no forward
contracts in the Group and the parent company as at �1 May, 2005.
Notes ...
�1 ...
Parentheses denote negative figures or figures to be deducted
Back to fINANCIAl REPORT AND NOTES

120
(DKK million)
Related parties
No related parties have controlling influence over the Bang & Olufsen Group or Bang & Olufsen a/s.
The related parties that have significant influence in Bang & Olufsen a/s, are the board of directors, the board of management
and certain other key management personnel and the close family members of these persons. Related parties also include
companies in which these persons have significant interests.
The related parties that have significant influence in the Bang & Olufsen Group, are the board of directors, the board of
management and certain other key management personnel in Bang & Olufsen a/s and certain members of the board of
management in other companies in the Group, and the close family members of these persons. Related parties also include
companies in which these persons have significant interests.
The related parties in Bang & Olufsen a/s also comprise the companies in which the company have a controlling interest,
cf. note ��.
The related parties in Bang & Olufsen a/s and the Bang & Olufsen Group also comprise the associate, John Bjerrum
Nielsen A/S, in which Bang & Olufsen have significant influence, cf. note 17.
Bang & Olufsen’s share in the subsidiaries and associates are shown in note ��.
Board of directors, board of management and other key management personnel
Except from what results from the employment, there have been no transactions with the board of directors, the board of
management and the other key management personnel. Remuneration and share option programmes are listed in note 5.
Subsidiaries and associates
The transactions with the subsidiaries and the associates have included the following:
Group Parent company
2005/06 200�/05 2005/06 200�/05
Purchase of raw materials from associates �1.8 5�.2 - -
Rendering of services from subsidiaries - - 69.5 -
Rendering of services to subsidiaries - - 2�7.� 178.�
Royalty income from subsidiaries - - 681.8 -
Rental income from subsidiaries - - 77.6 86.7
The transactions with the subsidiaries have been eliminated in the consolidated financial statements in accordance with the
accounting principles applied.
Notes ...
�2 ...
Parentheses denote negative figures or figures to be deducted
Back to fINANCIAl REPORT AND NOTES

121
(DKK million)
Related parties (continued)
Outstanding balances with subsidiaries and associates
Bang & Olufsen a/s’ and the Bang & Olufsen Group’s outstanding balances with the subsidiaries and the associates
appear from the balance sheet. The outstanding balances yield interest. The interest of the outstanding balances is shown in
notes 7 and 8. The terms of payment on the outstanding accounts regarding purchase of goods are end of month + �0 days.
There are no securities regarding the outstanding balances, and there have been no need for write-downs of the outstanding
balances. furthermore, there have been no actual losses regarding the outstanding balances in 2005/06 or 200�/05.
Other transactions
Bang & Olufsen a/s has received DKK 200.0 million as dividend from the subsidiaries (DKK 1�2.0 million in 200�/05).
No dividend has been received from the associates in 2005/06 (DKK 2.0 million in 200�/05).
Bang & Olufsen a/s has guaranteed for the related parties, cf. note �0 b. None of the guarantees are expected to result in any
losses.
Besides this, there have been no transactions with the related parties.
Notes ...
�2 ...
Back to fINANCIAl REPORT AND NOTES

122
(DKK million)
Companies in Bang & Olufsen Group
Number
Bang & Olufsen of not
Share capital Group’s disclosed
Company name Place of registration Currency local currency share subsidiaries
Branded business
Bang & Olufsen a/s Struer, DK DKK 12�,509,250 100 %
Bang & Olufsen Operations a/s Struer, DK DKK 155,000,000 100 %
Scandinavia
Bang & Olufsen Danmark a/s Copenhagen, DK DKK �,000,000 100 %
Bang & Olufsen AS Oslo, N NOK �,000,000 100 %
Bang & Olufsen Svenska AB Stockholm, S SEK �,150,000 100 %
Central Europe
Bang & Olufsen Deutschland G.m.b.H. Munich, D EuR 1,022,58� 100 % �
Bang & Olufsen AG Bassersdorf, CH CHf 200,000 100 %
Bang & Olufsen Ges. m.b.H Tulin, A EuR 1,7��,1�8 100 %
United Kingdom/Benelux
Bang & Olufsen united Kingdom ltd. Berkshire, GB GBP 2,600,000 100 % 2
S.A. Bang & Olufsen Belgium N.V. Wemmel, B EuR 9�2,000 100 %
Bang & Olufsen b.v. Hilversum, N EuR 18,000 100 %
Rest of Europe
Bang & Olufsen france S.A. levallois-Perret, f EuR �,585,000 100 % 1
Bang & Olufsen España S.A. Madrid, E EuR 1,80�,0�6 100 % �
Bang & Olufsen Italia S.p.A. Milan, I EuR 77�,000 100 %
North America
Bang & Olufsen America Inc. Arlington Heights, uSA uSD �9,050,000 100 % �
Asia
Bang & Olufsen Japan K. K. Tokyo, JP JPY 100,000,000 100 %
Bang & Olufsen Asia Pte ltd. Singapore, SG SGD 2 100 %
Bang & Olufsen Wholesale Pty ltd Hawthorn, Australia AuD 1,500,001 100 % �
Middle East
Bang & Olufsen Middle East fZ-llC Dubai, uAE EuR 11�,116 100 %
Other
Bang & Olufsen Expansion a/s Struer, DK DKK 7,000,000 100 %
Bang & Olufsen Automotive GmbH Niederwinkling, D EuR 25,000 100 %
Bang & Olufsen s.r.o Koprivnice, CZ CZK 187,800,000 100 %
Bang & Olufsen Telecom a/s Struer, DK DKK 2�,900,000 100 %
Non-branded business
Bang & Olufsen Medicom a/s Struer, DK DKK 8,000,000 100 %
Bang & Olufsen ICEpower a/s lyngby-Tårbæk, DK DKK 1,9�9,750 90 % 2
Associate
John Bjerrum Nielsen A/S Bramming, DK DKK 10,000,000 �� %
Dormant companies have not been included.
Notes ...
�� ...
Back to fINANCIAl REPORT AND NOTES

12�Printing: SaloGruppen a/s Index no.: �66666� Back to fINANCIAl REPORT AND NOTES

12�
Copyright © 2022 FDOKUMEN