
WPP Annual Report 2005 - AnnualReports.com
196
Annual Report & Accounts 2005
-
Upload
khangminh22 -
Category
Documents
-
view
1 -
download
0
Transcript of WPP Annual Report 2005 - AnnualReports.com

AdvertisingMedia investment management
Information, insight & consultancyPublic relations & public affairs
Branding & identityHealthcare communications
Direct, promotion & relationship marketingSpecialist communications
27 Farm StreetLondon W1J 5RJ
Telephone +44 (0)20 7408 2204Fax +44 (0)20 7493 6819
125 Park AvenueNew York NY 10017-5529
Telephone +1 (212) 632 2200Fax +1 (212) 632 2222
www.wpp.com
Annual Report &Accounts 2005
Annual R
eport&A
ccounts 2005

Contents
The fast readA six-minute read 2
Who we areAbout WPP 8Our companies and associates 10
Why we existWhy we exist 12Our mission 13
How we’re doingFinancial summary 15Letter to share owners 18Reports from our operating brands 26Ogilvy & Mather Worldwide 28JWT 33Young & Rubicam Brands 35Grey Global Group 41The Voluntarily United Group of Creative Agencies 43Bates Asia 44GroupM 45MediaCom 46Mediaedge:cia 48MindShare 49The Kantar Group 51Public relations & public affairs: overview 55Hill & Knowlton 56Ogilvy Public Relations Worldwide 58B to D Group: overview 60Enterprise IG 61Fitch 62CommonHealth 63Specialist communications 64
What we thinkThe Advertising & Marketing Services Industry:New markets and new technologies by Sir Martin Sorrell 70The Life & Works of Stephen Kingby Jeremy Bullmore and Judie Lannon 90
Who runs WPPBoard of Directors 94Senior officers and advisors to the Board 97
How we behaveDirectors’ reportReview of the Company’s governance
and the Nomination committee 100Review of the Audit committee 102Review of the Compensation committee 103The Board of Directors 105Committee meetings 106Share owner relations 106Internal control 106Adoption of IFRS 107Scheme of Arrangement 108Sarbanes-Oxley S404 108Going concern 108Responsibilities in respect of the preparation
of financial statements 108Substantial share ownership 108Election of directors 109Profits and dividends 109Parent company charitable donations 109Group activities 109Intangible assets 109Share capital 109Authority for purchase of own shares 109Supplier payment policy 109Auditors 109Corporate responsibilityBusiness impact 110How we manage corporate responsibility risk
and opportunity 110Corporate responsibility goals 111The impact of our work 111WPP as an employer 111Social investment 114Environment and supply chain 115
Annual Report 2005The Fast Read 1
How we’re rewardedCompensation committee report
on behalf of the BoardIntroduction 1162005 highlights 116Remit of the Compensation committee 116Composition of the Compensation committee 116Advisors to Compensation committee 118Principles of remuneration 118Review of compensation 119Impact of IFRS 120Policy on directors’ service contracts,
notice periods and termination payments 120Elements of remuneration 122Directors’ remuneration 125Directors’ interests 126US-style proxy disclosures 130
Operating & financial reviewCompetitive performance 133Geographic performance 134Sector performance 135Review of operations 137Adoption of IFRS 137Reconciliation to 2004 UK GAAP 137Group financial performance 138Operating margins 138Like-for-like performance 139Headcount 139Acquisitions and start-ups 139Parent company initiatives 139Treasury activities 139Cash flow and balance sheet 140New corporate structure 141Pensions funding 141Future prospects 141
Our 2005 financial statementsAccounting policies 145Consolidated income statement 150Consolidated cash flow statement 151Consolidated statement of recognised
income and expense 151Consolidated balance sheet 152Notes to the consolidated financial statements 153Company balance sheet 170Notes to the Company balance sheet 171Transition to IFRS 172Reconciliation to US Accounting Principles 177Notes to the Reconciliation to US Accounting
Principles 178Independent auditors’ report 181Five-year summary 183Financial glossary 184
About share ownershipInformation for share ownersShare owners’ register 187Analysis of shareholdings at 31 December 2005 187Dividends 187American Depositary Receipts (ADRs) 188Financial calendar 188Share price 188Access numbers/Ticker symbols 189Online information 189Registrar and transfer office 189American Depositary Receipts (ADRs) office 189WPP registered offices 189Tax information 189
Where to find usContact points 191
WPP offices 191Investor relations 191Media relations 191
Group information 191
Current and historical financial information, including trading statements, newsreleases and presentations are available online at www.wpp.com/investor
You can sign up to receive WPP news and announcements by e-mail atwww.wpp.com/emailservices

For a quick, pre-digested, highly-compressed version ofthis Annual Report: read the next six pages.The full story starts on page 8.Please read that, too.
The fast readWPP is one of the world’s largest communicationsservices groups, made up of leading companies in:
•Advertising
•Media investment management
• Information, insight & consultancy
•Public relations & public affairs
•Branding & identity
•Healthcare communications
•Direct, promotion & relationship marketing
•Specialist communications
WPP companies provide communications servicesto clients worldwide including more than 300 of theFortune Global 500; over one-half of the NASDAQ 100and over 30 of the Fortune e-50.
Our companies work with over 390 clients in threeor more disciplines. More than 270 clients are served infour disciplines; these clients account for around 60% ofGroup revenues. The Group also works with nearly 220clients in six or more countries.
Collectively, the Group has 92,000* people workingin over 2,000 offices in 106 countries.Our companies and their websites are listed on pages 10 and 11.
* Including associates.
Who we are
Annual Report 2005The Fast Read2

Within the WPP Group, our clients have access tocompanies with all the necessary marketing andcommunications skills; companies with strong anddistinctive cultures of their own; famous names, many of them.
WPP, the parent company, complements these companies in three distinct ways.
First, it relieves them of much administrative work.Financial matters (such as planning, budgeting,reporting, control, treasury, tax, mergers, acquisitions,
investor relations, legal affairs and internal audit) are co-ordinated centrally. For the operating companies, every administrative hour saved is an extra hour to bedevoted to the pursuit of professional excellence.
Secondly, the parent company encourages andenables operating companies of different disciplinesto work together for the benefit of clients. Such
collaborations have the additional benefit of enhancing thejob satisfaction of our people. The parent company alsoplays an across-the-Group role in the following functions:the management of talent, including recruitment andtraining; in property management; and in procurement,information technology and knowledge sharing.
And, finally, WPP itself can function as the 21stcentury equivalent of the full-service agency. Forsome clients, predominantly those with a vast
geographical spread and a need for marketing servicesranging from advertising through design and websiteconstruction to research and internal communications,WPP can act as a portal to provide a single point ofcontact and accountability.Read more about our role on page 12.
Why we exist What we think
Our mission
To develop and manage talent;to apply that talent,throughout the world,for the benefit of clients;to do so in partnership;to do so with profit.
The Advertising & Marketing Services Industry:New markets and new technologies
2005 was WPP’s best ever year by all metrics. 2006 has already shown more growth. It should – in theory – be better still.
It didn’t, however, look that way at the beginning of 2005. The calendar offered no big events to boostadvertising and marketing services spending, suggestingit would be the weakest of the four-year cycle to 2008.Moreover, 2004 was a hard act to follow. In that year, the world fully recovered from the internet bust of 2000,boosted in part by politics and sport. But, in the end, 2005confounded expectations – achieving for the first time 15%operating margins under ‘old’ 2004 UK GAAP measures.
2006 should benefit from a ‘mini-quadrennial’ –mid-term Congressional elections in the US, the TurinWinter Olympics and soccer’s World Cup in Germany.And 2007 will be the platform for 2008 – a ‘maxi-quadrennial’ dominated by the US presidential elections.The blockbuster Beijing Olympics and the EuropeanFootball Championships will also accelerate spending.
The short-term picture for the communicationsservices industry has improved. The immediate issues of government extravagance, consolidation amongclients, media owners, retail and agencies, increasingtrade and price promotion, fees, procurement andoutsourcing, media fragmentation and super-agencies are opportunities as much as threats.
In the long term, advertising and marketing servicesas a proportion of GNP will better the cyclical peakestablished in 2000. Globalisation and the growth of Asia Pacific, overcapacity and the shortage of humancapital, the web, the demand for internal communicationsand retail concentration should continue to assure ourindustry’s importance.Sir Martin Sorrell’s article begins on page 70.
The Life & Works of Stephen King
Jeremy Bullmore and Judie Lannon pay tribute to one ofthe founding fathers of modern advertising practice with a brief biography, an analysis of Stephen’s publishedwritings and edited highlights from them.The tribute appears on pages 90 to 93.
A collection of Jeremy Bullmore’s acclaimed Annual Report essays is nowavailable in book form. Please see page 90.
Annual Report 2005The Fast Read 3

How we’re doing
Financial summary*
2005 2004 Change %
Turnover (billings) £26,674m £19,598m +36.1
Revenue £5,374m £4,300m +25.0
Headline EBITDA1 £877m £664m +32.1
Headline operating profit1 £721m £531m +35.8
Reported operating profit £653m £476m +37.2
Headline PBIT1 £755m £560m +34.8
Headline PBIT margin 14.0% 13.0% +1.0
Headline PBT1 £669m £490m +36.5
Reported PBT £592m £434m +36.4
Headline diluted earnings per share1,3 36.0p 27.9p +29.0
Headline diluted earnings per ADR1,2,3 $3.27 $2.56 +27.7
Ordinary dividend per share 9.34p 7.78p +20.1
Ordinary dividend per ADR2 85.0¢ 71.3¢ +19.2
Net debt at year-end £804m £555m +44.9
Average net debt4 £1,212m £1,083m +11.9
Ordinary share price at year-end 629.0p 573.0p +9.8
ADR price at year-end $54.00 $54.67 -1.2
Market capitalisation at year-end £7,881m £6,792m +16.0
At 10 May 2006
Ordinary share price 681.5p
ADR price $63.35
Market capitalisation £8,524m
Notes*These figures have been prepared under IFRS (International Financial Reporting Standards,incorporating International Accounting Standards).
1 The calculation of ‘headline’ measurements of performance (including Headline EBITDA, Headlineoperating profit, Headline PBIT, Headline PBT and Headline earnings) is shown in note 32 of thefinancial statements.
2 One American Depositary Receipt represents five ordinary shares. These figures have beentranslated for convenience purposes only using the income statement exchange rates shown onpage 150. This conversion should not be construed as a representation that the pound sterlingamounts actually represent, or could be converted into, US dollars at the rates indicated.
3 Earnings per share is calculated in note 10 of the financial statements.4 Average net debt is defined on page 184.
2005 results
Our twentieth year was a record one. Our results for2005 reflect the continued, steady strength of the worldeconomy positively impacting almost all disciplines andgeographies, and, in addition, include the results of Grey Global Group (‘Grey’) with effect from 7 March 2005,which has performed well and made a strong contributionto the Group’s results.
Revenues were up 25% to £5.4 billion. Operatingmargin was up 1.0 margin points to 14.0%, ahead of our objective of 13.7%. Headline PBIT – that is beforegoodwill impairment, amortisation of acquired intangibles,interest, tax and investment gains and write-downs – was up almost 35% to £755 million.
Headline profit before tax was up over 36% to£669 million. Reported profit before tax was up over 36%to £592 million. Headline diluted earnings per share wereup 29% to 36.0p and reported diluted earnings per shareup almost 27% to 29.7p.
Total share owner return improved, with your shareprice rising by almost 10% to 629.0p over the year anddividends rising 20% to 9.34p. The share price hasadvanced a further 8% to 681.5p at the time of writing.
Based on constant currency comparisons, on alike-for-like basis, revenues were up 5.5% for the year, up 6% in the first half and 5% in the second half. Thisappears to have been at or above the growth in theworldwide market, with the Group maintaining orincreasing market share.
Sector and geographic performance
By sector, Media investment management led the way,along with direct, internet and interactive-related activitiesand Healthcare communications. Advertising, Information,insight & consultancy, Branding & identity and Specialistcommunications, showed consistent growth. Publicrelations & public affairs also continued to show significantimprovement following a strong year in 2004.
Marketing services contributed 52% of ourrevenues in 2005.
By geography, Asia Pacific, Africa and the MiddleEast, Latin America and Central and Eastern Europe ledthe way. Western Continental Europe, although relativelymore difficult, improved slightly in the second half. Marketsoutside North America represented 61% of our revenues,a similar level to 2004, due to the impact of Grey.
Our long-term objectives are to increase thecombined geographic share of revenues of Asia Pacific,Latin America, Africa and the Middle East, and Centraland Eastern Europe, from around 20% to one-third. Wealso aim to increase the share of revenues of marketingservices from 52% to two-thirds; and to increase the shareof more measurable marketing services – such as Insight,information & consultancy, and direct, interactive andinternet – from around one-third of our revenues to 50%.
Annual Report 2005The Fast Read 4

Cash flow
The objective introduced in 2003 of covering outgoings by free cash flow was achieved, excluding the net cashelement of the acquisition of Grey. We now generate over $1 billion per annum of cash flow – available forenhancing share owner value through capital expenditure,acquisitions, dividends and share buybacks.
Future objectives
We will continue to focus on our key objectives – improvingoperating profits and margins, increasing cost flexibility,using free cash flow to enhance share owner value andimprove return on capital employed, continuing to developthe role of the parent company in adding value to ourclients and people, developing our portfolio in high-revenuegrowth areas, both geographically and functionally, andimproving our creative quality and capabilities.
Outlook
Worldwide economic conditions seem set to continue to show steady growth in 2006, although concernsremain over the Middle East, oil and commodity pricesand the twin deficits of the US economy.
Although growth in the world economy continues to be led by Asia Pacific, Latin America, Africa and theMiddle East, Russia and the CIS countries, even WesternContinental Europe may continue the improvement seenin the second half of 2005, although the UK looks soft.
2006 should benefit from the ‘mini-quadrennial’impact of the mid-term US Congressional elections, the FIFA World Cup and the Winter Olympics in Turin.
2007 should also benefit from the build-up to theUS Presidential elections and the Beijing Olympics in 2008,which, as a maxi-quadrennial year, should be a very strongone, buoyed by those events plus heavy US politicaladvertising and the European Football Championships.Our letter to share owners starts on page 18.
Our 2005 operating & financial review and financial statements arepresented in full on pages 132 to 185 and at www.wpp.com/investor
Notes1 Percentages are calculated on a constant currency basis. See definition on page 184.2 Headline PBIT: The calculation of Headline PBIT is set out in note 32 of the financial statements.
Advertising and Media investment management
53
Information, insight & consultancy 11
Branding & identity, Healthcare and Specialist communications
26 Public relations & public affairs 10
2005 Headline PBIT1, 2 by sector %
2005 revenue2 by sector %
Branding & identity, Healthcare and Specialist communications
Advertising and Media investment management
27 Public relations & public affairs 10
48
Information, insight & consultancy 15
2005 Headline PBIT1, 2 by geography %
Continental Europe 24
Asia Pacific, Latin America, Africa & Middle East
19
North America 46
UK 11
2005 revenue2 by geography %
Continental Europe 27
Asia Pacific, Latin America, Africa & Middle East
19
UK 15
North America 39
Annual Report 2005The Fast Read 5

Non-executive chairman
Philip LaderChairman of the Nomination committeeMember of the Compensation committee
Executive directors
Sir Martin SorrellChief executive
Paul RichardsonFinance director
Howard PasterDirector
Mark ReadStrategy director
Non-executive directors
Colin Day
Esther DysonMember of the Compensation committeeMember of the Audit committee
Orit Gadiesh
David KomanskyMember of the Nomination committee
Christopher MackenzieMember of the Compensation committeeMember of the Nomination committee
Stanley (Bud) MortenCurrent chairman of the Compensation committeeMember of the Audit committeeSenior independent director
Koichiro Naganuma
Lubna Olayan
John Quelch
Jeffrey Rosen Future chairman of the Compensation committeeMember of the Audit committee
Paul SpencerChairman of the Audit committee
Members of the Advisory BoardJeremy BullmoreJohn Jackson
Company SecretaryMarie CapesDirectors’ biographies appear on pages 94 to 96.
Who runs WPP How we behave
Corporate governance
The Board of Directors as a whole is collectivelyaccountable to the Company’s share owners for goodcorporate governance and is committed to achievingcompliance with the principles of corporate governanceset out in the Combined Code.
Our goal is to comply with relevant laws,regulations, and guidelines such as the Combined Code,the US Sarbanes-Oxley Act of 2002 the NASDAQ rules,and their related regulations and, as far as is practicable,policies such as the Hermes Principles and those issuedby the Association of British Insurers (ABI), the NationalAssociation of Pension Funds (NAPF), the PensionsInvestment Research Consultants (PIRC).
WPP operates a system of internal control, which ismaintained and reviewed in accordance with the CombinedCode and the guidance in the Turnbull Report as well as therelevant provisions of the Securities Exchange Act of 1934as they currently apply to the Company. In the opinion ofthe Board, the Company has complied throughout the yearwith the Turnbull Report and has also complied with therelevant provisions of the Securities Exchange Act of 1934.
Corporate responsibility
Paul Richardson is the Board director responsible forassessing corporate responsibility risks for 2006. He chairsWPP’s Corporate responsibility committee, established in2003, which advises on policy, monitors emerging issuesand co-ordinates communication among Group companies.The Committee is made up of senior representatives fromWPP’s major business categories. It identifies andassesses significant corporate responsibility risks andopportunities for the business.
WPP’s three most significant corporateresponsibility issues are:The impact of our work including marketing ethics,compliance with marketing standards, protection ofconsumer privacy, social and cause-related marketing.The work our operating companies produce is part of ourcorporate responsibility performance. They are expectedto comply with all laws, regulations and codes of marketingpractice as well as our own Code of Business Conduct.Employment including diversity and equal opportunities,business ethics, employee development, remuneration,communication and health and safety. Our goal is to havea talent base that reflects the communities in which weoperate. We believe diversity contributes to creativity, newideas and a richer workplace. In 2005, WPP invested£32.7 million in training and well-being across the Group. Social investment including pro bono work, donationsto charity and employee volunteering. In 2005, our totalsocial investment was worth £17.3 million, equivalent to0.32% of revenue (2.9% of reported pre tax profits). This includes £13.9 million in pro bono work (based onthe fees the benefiting organisations would have paid forour work) and £3.4 million in donations.Full details of our governance policies and practices, and our corporateresponsibility activities, can be found on pages 99 to 115.
Annual Report 2005The Fast Read6

Executive remuneration policy is set by WPP’sCompensation committee and is governed by threeguiding principles:
•Competitiveness
•Performance
•Alignment to share owner interests
During 2005, the Compensation committeeundertook a thorough review of the Group’s currentcompensation and incentive strategy.
The committee subsequently decided to make a number of significant changes to the way in whichcompensation is to be delivered whilst at the same timestaying true to the principles of compensation describedabove. In summary this entailed:
•Single-year performance awards, delivered as restrictedstock awards and vesting a further two years after the end of the one-year performance period, replaced awardspreviously made under the operating company Long TermIncentive Plans.
•Similarly at the parent company, the use of ExecutiveShares Awards replaced awards previously made underthe Performance Share Plan. Again, these awards will vesttwo years after the end of the one-year performance period.
•A significantly reduced use of stock options. Awards ofstock options have not been made to executive directorssince 1995. Below this level, options will now only be usedin special circumstances, such as a recruitment incentive.
•Future awards of stock made on an annual basis to theWPP Leaders, Partners and High Potential Groups will allbe in the form of restricted stock which vest three yearsafter grant.Our directors’ remuneration and interests are described on pages 122 to131. A full report from the Compensation committee starts on page 116.
How we’re rewarded About share ownership
WPP is quoted on the London Stock Exchange andNASDAQ in New York.
Analysis of shareholdings
Issued share capital as at 31 December 2005: 1,252,899,372ordinary shares, owned by 11,572 share owners.
Substantial share ownership
As at 4 May 2006, the Company is aware of the followinginterests of 3% or more in the issued ordinary sharecapital of the Company:
Legal & General 4.15%
WPP ESOPs 4.05%
Legg Mason 3.98%
Barclays 3.11%
AIM Management 3.05%
The disclosed interests of all of the above refer to therespective combined holdings of those entities and tointerests associated with them. The Company has not been notified of any other holdings of ordinary sharecapital of 3% or more.
Share owner relations
WPP has a well-developed continuous program to addressthe needs of share owners, investment institutions andanalysts, supplying a regular flow of information about thecompany, its strategy, performance and competitive position.
WPP’s website, www.wpp.com, provides currentand historical financial information including tradingstatements, news releases and presentations.More information relating to share ownership can be found on pages 186to 189.
Share owners by type • Institutional investors 95%
• Employees 4%
• Other individuals 1%
Share owners by geography • UK 41%
• US 43%
• Asia Pacific, Latin America, Africa & Middle East and Continental Europe 16%
Annual Report 2005The Fast Read 7

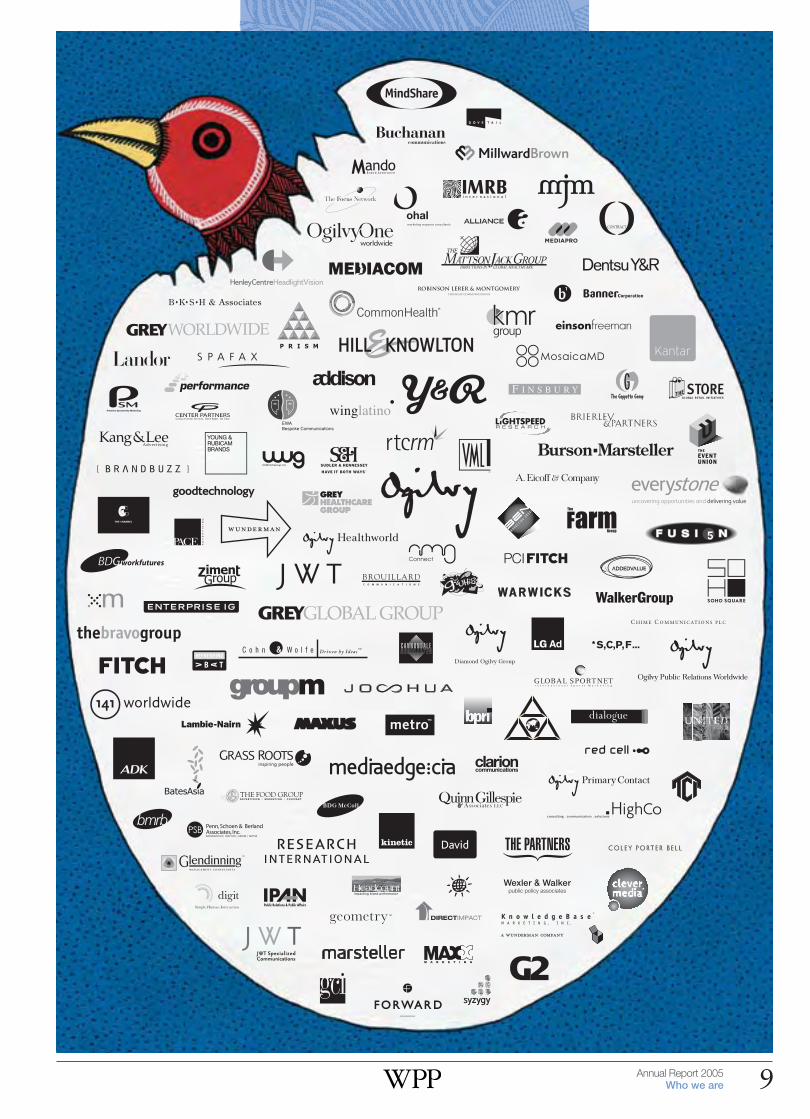
Who we are
WPP is one of the world’s largest communications services groups, made up of leading companies in:
AdvertisingMedia investment management
Information, insight & consultancyPublic relations & public affairs
Branding & identityHealthcare communications
Direct, promotion & relationship marketingSpecialist communications
Annual Report 2005Who we are8
Every WPP company is a distinctive brand in its own right; all withtheir own identities and own areas of expertise. That is their strength.What they have in common is in harnessing intelligence, talent andexperience to bring competitive advantage to their clients.
Through our companies and associates, WPP offers a comprehensiveand, when appropriate, integrated range of communications services tonational, multinational and global clients.
Our companies work with more than 300 of the Fortune Global500; over one-half of the NASDAQ 100 and over 30 of the Fortune e-50.Over 390 clients are served in three or more disciplines. More than 270clients are served in four disciplines; these clients account for around 60%of Group revenues. The Group also works with nearly 220 clients in six ormore countries.
Collectively, the Group has 92,000* people working in over 2,000offices in 106 countries.* Including associates.
Annual Report 2005Who we are 9
EWABespoke Communications

Who we are
Advertising
ADK 1
www.adk.jpBates Asiawww.batesasia.comBrandBuzz ■
www.brandbuzz.comDentsu Y&R 1, 2, ■
www.yandr.comDiamond Ogilvywww.diamond.co.krGrey Worldwide ◆
www.greyglobalgroup.comLG Ad 1
www.lgad.co.krJWTwww.jwt.comMarsteller Advertising ■
www.marsteller.comOgilvy & Mather Worldwidewww.ogilvy.comRed CellSoho Squarewww.sohosq.comThe Voluntarily United Group of CreativeAgencieswww.group-united.comY&R ■
www.yandr.com
Media investmentmanagement
GroupM:MAXUSwww.maxusglobal.comMediaComwww.mediacom.comMediaedge:ciawww.mecglobal.comMindSharewww.mindshareworld.comOutrider ▲
www.outrider.comOther media agenciesKinetic Worldwide 2
www.kineticww.comKR Media 3
Information, insight &consultancy
The Kantar Group:www.kantargroup.comAdded Valuewww.added-value.comBPRIwww.bprigroup.comCannondale Associateswww.cannondaleassoc.comCenter Partnerswww.centerpartners.comEverystonewww.everystonegroup.comFocalyst 2
www.focalyst.comFusion 5www.fusion5.comGlendinningwww.glendinning.comHenley Centre HeadlightVisionwww.hchlv.comIMRB Internationalwww.imrbint.comKMR Groupwww.kmr-group.com– AGBNielsen Media Research 2
www.agbgroup.com– BMRB International
www.bmrb.co.uk– IBOPE Media Information 1
www.ibope.com.br– Marktest 1
– Mediafaxwww.mediafax-pr.com
Lightspeed Researchwww.lightspeedresearch.comMVIwww.mventures.comMattson Jack Groupwww.mattsonjack.comMillward Brownwww.millwardbrown.comResearch Internationalwww.research-int.comRMS Instorewww.rms-uk.comZiment Groupwww.zimentgroup.comOther marketing consultanciesohalwww.ohal-group.com
Public relations & public affairs
BKSH ■
www.bksh.comBlanc & Otuswww.blancandotus.comBuchanan Communicationswww.buchanan.uk.comBurson-Marsteller ■
www.bm.comChime Communications PLC 1
www.chime.plc.ukClarion Communicationswww.clarioncomms.co.ukCohn & Wolfe ■
www.cohnwolfe.comFinsburywww.finsbury.comGCI Group ◆
www.gcigroup.comHill & Knowltonwww.hillandknowlton.comOgilvy Public Relations Worldwidewww.ogilvypr.comPenn, Schoen & Berland ■
www.psbsurveys.comQuinn Gillespiewww.quinngillespie.comRobinson Lerer & Montgomery ■
www.rlmnet.comTimmons and Companywww.timmonsandcompany.comWexler & Walker Public Policy Associateswww.wexlergroup.com
Branding & identity
Addison Corporate Marketing•www.addison.co.ukBDGMcCollwww.bdg-mccoll.comBDGworkfutureswww.bdgworkfutures.comColey Porter Bellwww.cpb.co.ukDovetailwww.dovetailfurniture.comEnterprise IG•www.enterpriseig.comFitchwww.fitchww.comLambie-Nairn•www.lambie-nairn.comLandor Associates ■•www.landor.comThe Partners ■•www.thepartners.co.ukVBAT•www.vbat.nlWalker Group •www.wgcni.comWarwickswww.warwicks-uk.com
Annual Report 2005Who we are10
Our companies & associates

Who we are
Healthcare communications
CommonHealthwww.commonhealth.comFeinstein Kean Healthcarewww.fkhealth.comGrey Healthcare Group ◆
www.ghgroup.comOgilvy Healthworldwww.ogilvyhealthworld.comSudler & Hennessey ■
www.sudler.com
Direct, digital, promotion & relationship marketing
A. Eicoff & Cowww.eicoff.comBridge Worldwidewww.bridgeworldwide.comBrierley & Partners 1
www.brierley.comDialogue Marketingwww.dialmkg.comDigitwww.digitlondon.comEinson Freemanwww.einsonfreeman.comEWAwww.ewa.ltd.ukFullSIX 3
www.fullsix.comGood Technology ▲ ■
www.goodtechnology.comGrass Roots 1
www.grg.comG2 ◆
www.g2.com– G2 Branding & Design– G2 Interactive– G2 Direct & Digital– G2 Promotional MarketingHeadcount Worldwide Field Marketingwww.headcount.co.ukHigh Co 1
www.highco.fr KnowledgeBase Marketing ■
www.knowledgebasemarketing.comMando Brand Assurancewww.mando.co.ukMaxx Marketingwww.maxx-marketing.comOgilvyOne Worldwidewww.ogilvy.comRMG Connectwww.rmgconnect.comRTC Relationship Marketing ■
www.rtcrm.comsyzygy 1
www.syzygy.netVML ■
www.vml.comWunderman ■
www.wunderman.com141 Worldwidewww.141worldwide.com
Specialist communications
Corporate/B2BBrouillardwww.brouillard.comOgilvy Primary Contactwww.primary.co.ukCustom mediaForwardwww.theforwardgroup.comSpafaxwww.spafax.comDemographic marketingThe Bravo Group ■
www.thebravogroupyr.comKang & Lee ■
www.kanglee.comMosaicaMDUniWorld 1
www.uniworldgroup.comWINGLATINO ◆
www.winglatino.comEmployer branding/recruitmentJWT Specialized Communicationswww.jwtworks.comEvent/face-to-face marketingMJMwww.mjmcreative.comPCI Fitchwww.fitch.comThe Event Union– MJM– Pro Deo
www.prodeo.com– facts + fiction
www.factsfiction.deFoodservice marketingThe Food Groupwww.thefoodgroup.comSports marketingGlobal Sportnetwww.globalsportnet.comPerformance SportEntwww.performance-worldwide.comPSMwww.premiere.co.uk PRISM Groupwww.prismteam.com
Entertainment marketingAlliance ◆
www.alliance-agency.comYouth marketingThe Geppetto Groupwww.geppettogroup.comG Whiz ◆
www.thinkgwhiz.comReal estate marketingPacewww.paceadv.comTechnology marketingBanner Corporation ■
www.b1.comMedia & production servicesClockwork Capital 1
www.clockworkcapital.comThe Farm Groupwww.farmpost.co.uk MEDIAPRO Group 1
www.mediapro.esMetro Groupwww.metrobroadcast.co.uk
WPP knowledge communities
The [email protected] [email protected]
Key1 Associate2 Joint venture3 Minority investment■ A Young & Rubicam Brands company▲ A Mediaedge:cia company• A member of B to D Group ◆ A Grey Global Group company
As at May 2006
Annual Report 2005Who we are 11

Annual Report 2005How we’re doing Contents12

WPP, the parent company, complements thesecompanies in three distinct ways.
First, it relieves them of much administrative work.Financial matters (such as planning, budgeting,reporting, control, treasury, tax, mergers, acquisitions,
investor relations, legal affairs and internal audit) are co-ordinated centrally. For the operating companies, every administrative hour saved is an extra hour to bedevoted to the pursuit of professional excellence.
Secondly, the parent company encourages and enablesoperating companies of different disciplines to worktogether for the benefit of clients. Such collaborations
have the additional benefit of enhancing the job satisfactionof our people. The parent company also plays an across-the-Group role in the following functions: the managementof talent, including recruitment and training; in propertymanagement; and in procurement, information technology and knowledge sharing.
And finally – a relatively recent development,this – WPP itself can function as the 21st centuryequivalent of the full-service agency. For some clients,
predominantly those with a vast geographical spread anda need for marketing services ranging from advertisingthrough design and website construction to research andinternal communications, WPP can act as a portal toprovide a single point of contact and accountability.
No two clients are structured in preciselythe same way. Within WPP’s operating companies, teams can be tailor-made to match any and all.
etween them, WPP companies have tens ofthousands of individual clients. They rangefrom Fortune 500 global giants through single-nation start-ups to the smallest of specialistcharities. Diverse as they are, they have onething in common: in pursuing their objectives,
they face formidable competition.Growing affluence in many parts of the world –
combined with over-capacity and over-supply in almostevery significant consumer market – have put more andmore power into the hands of consumers, accelerated by technology.
As always, if they are to succeed – or even to survivewith profit – every competitive company needs anintrinsically appealing product or service. But that, thoughit remains the most fundamental of requirements, is nolonger enough. Just as competitive costermongers arrangetheir apples in appealing displays, and polish them lovinglyto catch their customers’ eyes, so all companies need todisplay their wares compellingly.
They need access to high-quality information,strategic advice and specialist communications skills. And it’s in the nature of specialist and creative talent that it is unlikely to flourish within the confines of amanufacturing or service company. People with specialisttalents work best – and contribute more – when recruited,trained and inspired by specialist companies.
Within the WPP Group, our clients have access tocompanies of all the necessary marketing and communicationsskills; companies with strong and distinctive cultures of their own; famous names, many of them.
Why we exist
Our missionTo develop and manage talent;
to apply that talent, throughout the world,
for the benefit of clients;to do so in partnership;
to do so with profit.
Annual Report 2005Why we exist 13

Annual Report 2005How we’re doing14

2005 2004 Change %
Turnover (billings) £26,674m £19,598m +36.1Revenue £5,374m £4,300m +25.0Headline EBITDA1 £877m £664m +32.1Headline operating profit1 £721m £531m +35.8Reported operating profit £653m £476m +37.2Headline PBIT1 £755m £560m +34.8Headline PBIT margin 14.0% 13.0% +1.0Headline PBT1 £669m £490m +36.5Reported PBT £592m £434m +36.4Headline diluted earnings per share1,3 36.0p 27.9p +29.0Headline diluted earnings per ADR1,2,3 $3.27 $2.56 +27.7Ordinary dividend per share 9.34p 7.78p +20.1Ordinary dividend per ADR2 85.0¢ 71.3¢ +19.2Net debt at year-end £804m £555m +44.9Average net debt4 £1,212m £1,083m +11.9Ordinary share price at year-end 629.0p 573.0p +9.8ADR price at year-end $54.00 $54.67 -1.2Market capitalisation at year-end £7,881m £6,792m +16.0
At 10 May 2006
Ordinary share price 681.5pADR price $63.35Market capitalisation £8,524m
Notes*These figures have been prepared under IFRS (International Financial Reporting Standards, incorporating International Accounting Standards).1 The calculation of ‘headline’ measurements of performance (including Headline EBITDA, Headline operating profit, Headline PBIT, Headline PBT and Headline earnings) is shown in note 32 of the financial statements.2 One American Depositary Receipt represents five ordinary shares. These figures have been translated for convenience purposes only using the income statement exchange rates shown on page 150. This conversion should not be construed as a representation that the pound sterling amounts actually represent, or could be converted into, US dollars at the rates indicated.
3 Earnings per share is calculated in note 10 of the financial statements.4 Average net debt is defined on page 184.
How we’re doing*Financial summary*
Our twentieth year was a record one. All the key measures were better, reflecting growth
across almost all disciplines and geographies.
Annual Report 2005How we’re doing 15

How we’re doing
The Group has made the transition to IFRS and the figures for 2004 and 2005 are presented onthis basis. Information for 2003 and prior years is on a UK GAAP basis, as previously reported.1
Notes1 Figures for 2005 and 2004 have been prepared in accordance with IFRS (International FinancialReporting Standards, incorporating International Accounting Standards), which the Group adoptedin 2005. Figures for prior years have been prepared under UK GAAP, as previously disclosed in theGroup’s Annual Report and Accounts for those years.
2 The calculation of ‘headline’ measurements of performance (including Headline EBITDA, HeadlinePBIT and Headline earnings) is shown in note 32 of the financial statements.
3 Calculated gross of goodwill and using profit after taxation before goodwill impairment and othergoodwill write-downs, and gains/losses arising from the revaluation of financial instruments,amortisation of acquired intangible assets, and investment gains and write-downs.
Annual Report 2005How we’re doing16
Revenue1
£m05
04
03
02
01
5,374
4,300
4,106
3,908
4,022
Headline EBITDA1, 2
£m05
04
03
02
01
877
664
661
574
607
0504030201
Headline PBIT1, 2
£m
0
20
2468
1012141618
755560534468561
Headline PBIT2
margin
Headline diluted earnings per share1, 2
p
36
30
24
16
8
0
36.027.929.023.830.9
0504030201Dividends per share p
After tax return on average capital employed1, 3
%
0
10
123456789
9.18.57.56.89.4
0504030201
Weighted average cost of capital (WACC)
WPP total return to share owners relative to relevant comparators rebased to 31 December 2000
WPP
150
100
50
031 Dec 00 31 Dec 01 31 Dec 02 31 Dec 03 31 Dec 04
10 May0631 Dec 05
FTSE 100 Omnicom Interpublic
Financial summary

Annual Report 2005How we’re doing 17
How we’re doing
Notes1 Figures for 2005 and 2004 have been prepared in accordance with IFRS (International FinancialReporting Standards, incorporating International Accounting Standards), which the Group adoptedin 2005. Figures for prior years have been prepared under UK GAAP, as previously disclosed in theGroup’s Annual Report and Accounts for those years.
2 Percentages are calculated on a constant currency basis. See definition on page 184.3 The calculation of Headline PBIT is set out in note 32 of the financial statements.4 Interest in 2005 excludes finance costs arising from the revaluation of financial instruments.5 Average net debt includes amounts drawn down in each year on the Group’s working capital facility(the advance of cash financing against which certain trade debts have been assigned). This facilitywas repaid and cancelled on 31 August 2005.
6 Includes corporate bonds, convertible bonds and bank loans payable at par value, excluding anyredemption premium due.
Average net debt1, 5 £mand interest cover multiples
0
10
123456789
1,2121,0831,4801,5371,069
0504030201Net interest4 cover on Headline PBIT1,3
Debt maturity6
£m– 450
20072006
506
2008
–
2009
–
2010
–
2011
–
2012
–
2013
378
2014
87
2015+
2005 revenue2 by geography%North America 39
UK 15
Continental Europe 27
Asia Pacific, Latin America,Africa & Middle East
19
2005 Headline PBIT2, 3 by geography%North America 46
UK 11
Continental Europe 24
Asia Pacific, Latin America,Africa & Middle East
19
2005 revenue2 by sector%Advertising and Mediainvestment management
48
Information, insight & consultancy 15
Public relations & public affairs 10Branding & identity, Healthcareand Specialist communications
27
2005 Headline PBIT2, 3 by sector%Advertising and Mediainvestment management
53
Information, insight & consultancy 11
Public relations & public affairs 10Branding & identity, Healthcareand Specialist communications
26

How we’re doing
Annual Report 2005How we’re doing18
PP’s twentieth year was our best ever withkey measures exceeding the previous peakyears of 2001 and 2004.
Most importantly, total share ownerreturn improved, with your share pricerising by almost 10% to 629p over the
year and dividends rising 20% to 9.34p. Pleasingly, yourshare price has advanced a further 8% to 681.5p at thetime of writing.
Revenues were up 25% to £5.4 billion. Operatingmargin was up one margin point to 14% (15% under 2004 UK GAAP). Headline PBIT – that is before goodwillimpairment, amortisation of acquired intangibles, interest,tax and investment gains and write-downs (what a mouthful!)– was up almost 35% to £755 million. Headline profitbefore tax was up over 36% to £669 million.
Profit before tax was up over 36% to £592 million.Headline diluted earnings per share were up 29% to 36.0pand reported diluted earnings per share up almost 27% to 29.7p.
These results reflect faster growth in almost all regions– North America, Eastern Europe, Asia Pacific, LatinAmerica, Africa and the Middle East – the slower growtharea being Western Europe. Similarly, growth wasencouraging across all communications services sectors –Advertising, Media investment management, Information,insight & consultancy, Public relations & public affairs,Branding & identity, Healthcare and Specialistcommunications. As in 2004, we were firing on all cylinders.
These results also reflected continued improvementin productivity, with like-for-like revenues up 5.5% andaverage headcount on the same basis up 5.2%. Liquidityimproved with average net debt up only £132 million (at 2005 exchange rates) despite a net cash outflow of£195 million. Operating margins improved significantly,too – up one margin point after incentives and 0.9 marginpoints before incentives.
The rest of this letter to you is based on constantcurrency comparisons, which are more meaningful given
Dear share owner
Letter to share owners
currency movements. On a like-for-like basis revenues wereup 5.5% for the year, up 6% in the first half and 5% in thesecond half. This appears to have been above the growth inthe worldwide market, with the Group increasing marketshare.
Revenue growth was also consistently strong insuccessive quarters, on a like-for-like basis up 5.7%, 6.2%,4.8% and 5.2%. The momentum was maintained in thefirst quarter of 2006, with like-for-like revenues up almost5%. Our like-for-like revenue objective for 2006 remainsover 4%, well in line with or above forecasts for theadvertising and marketing services industry and worldwideGNP growth.
Media investment management continuesto lead growth
By sector, Media investment management led the way,together with Healthcare and Specialist communications,the latter particularly in direct, interactive and internet. But Advertising, Information, insight & consultancy, andBranding & identity also registered good performances.Public relations & public affairs registered its strongestyear since 2000. Marketing services fell to 52% of ourrevenues in 2005 from 54% in the previous year, due tostrong growth in Media investment management and theacquisition of Grey Global Group (‘Grey’), which wasmore concentrated in Advertising and Media investmentmanagement. We are still, however, more than just anadvertising company.
By geography, Asia Pacific, Africa and the MiddleEast, Latin America and Central and Eastern Europe ledthe way. The only laggard was Western Europe,particularly France, Germany and the UK, although therewas some improvement towards the end of the year andinto 2006. As a result, and because of the acquisition ofGrey, which was more concentrated in North America,markets outside North America remain at around 61% ofour revenues, as compared to 58% in 2003 and 56% in

How we’re doing
2002. The influence of the faster-growing markets outsideNorth America is increasing rapidly.
Profits up; liquidity improved
Headline PBIT margins rose to 14.0% from 13.0%, aheadof our original objective of 13.2%. This was particularlyencouraging as our income statement reflected our largest-ever incentive pools for record performance. Pre-incentiveheadline PBIT margins rose by 0.9 margin points to 18.3%from 17.4%. Incentive payments rose to £228 million, ormore than four margin points, from £190 million in 2004.Total incentive payments (including share-based payments)were more than 24% of operating profits before bonuses,taxes and income from associates. Our objective remainsto pay out approximately 20% at maximum and 15% attarget, excluding share option costs. Variable staff costs(freelance, consultants and incentive payments, includingshare option charges) now account for 7.6% of revenues,almost at last year’s peak of 7.8%. This provides a usefulshock absorber for operating margins, should revenuesagain come under pressure.
As a result of all this, headline PBIT rose to £755million, well over $1 billion for the second year in a row,up more than 31% in constant currencies. Although 2005was a strong year, some of our first-generation businessescontinued to suffer and a non-cash impairment chargereflecting accelerated amortisation of goodwill of £46million was taken, compared to £41 million in 2004. Pre-tax profits, therefore, rose by almost 32% to £592million, more than $1 billion for the first time, and dilutedheadline earnings per share by more than 25% to 36p.
Free cash flow was up strongly at £565 million,compared to £466 million in 2004. Excluding the cashpayment for Grey, for the third year in a row we morethan achieved our recently introduced cash flow objectiveof covering all acquisition payments and share re-purchases,and managed to cover dividend payments, too.
Liquidity improved as well, and even after the part-cash acquisition of Grey, your company remainscomfortably geared. Net debt averaged £1.212 billion –up £132 million (at 2005 exchange rates) – despite a grosscash payment of £376 million in respect of the acquisitionof Grey. In the first quarter of 2006, liquidity has continuedto strengthen, with average net debt only up £215 millionto £1.043 billion (at 2006 exchange rates) compared withthe same period in 2005, again despite the gross cashpayment for Grey. Headline interest cover in 2005 waswell over eight times. Analysts appear comfortable withaverage net debt levels of more than twice EBITDA, orover £2 billion, versus our current levels of approximately£1.2 billion.
Industry prospects
Theoretically, 2005 should have been the weakest year ofthe 2005-2008 quadrennial cycle, with no special events to stimulate growth. In fact, it was the contrary – perhapsreflecting a growing realisation among clients that the only way to succeed is by generating like-for-like revenuegrowth through innovation and branding. 2006 should,again in theory, be a stronger year, with the Turin WinterOlympics, the FIFA World Cup in Germany and the USCongressional elections stimulating growth. The industrywill probably grow at 4-5% in 2006, compared to 3-4% in 2005, with marketing services outpacing advertising,driven primarily by growth in direct, interactive andinternet marketing. 2007 should again be a good year,reflecting the build-up to the Beijing Olympics and the2008 US Presidential election, in which both parties areexpected to have well-financed, multi-candidate fields.2008 should be a blockbuster year not only because of the Summer Olympics and the US elections, but also withthe European Championship in Austria and Switzerland.Spending beyond one’s means may finally catch up withthe US economy in 2009 and result in a global slow-down.2007 should see growth similar to 2006’s or slightlystronger growth, with 2008 escalating to 5-6%.
2005 was an excellent year; 2006, we believe, willsee WPP strengthen more. The Company continues to bein its most robust position since 2000. Revenue growth,cost management, productivity, liquidity and balance sheetstrength all continued to improve over last year andcontinue to do so in 2006. Most importantly, our talentbase continues to strengthen, particularly as we invest inincreasing headcount in 2005 and in 2006.
As far as 2006 and beyond is concerned, there are two principal concerns: America’s twin deficits, andWestern Europe’s stagnation. How long growth cancontinue when the US government continues to run current account and fiscal deficits remains to be seen. The American consumer remains sluggish, and chairmenand CEOs do not seem willing as yet to raise corporatecapital spending consistently to bolster the economy, which – in our view – remains patchy. The 2000 recessionwas stimulated by a sharp decline in corporate capitalspending, which was then ameliorated by strongerconsumer spending. The reverse has not happened yet,notwithstanding the strength in corporate profitability,liquidity and margins. Profits as a proportion of GNP areat a 50-year high. At the same time inflation, stimulated by commodity price inflation, in oil and steel in particular,has increased, and the dollar has weakened. Perhaps this is an old-fashioned approach, but operating beyond your
Annual Report 2005How we’re doing 19

How we’re doing
means seems perilous to us. And a country’s currency, we think, comes close to representing its ‘stock price’.
Our second worry is that Western Europecontinues to stagnate, although there are signs of a slightimprovement. France, Germany, Italy and, to a lesserextent the UK, resemble a mature company in a matureindustry. There is little top-line growth. With healthcareand pension costs becoming an increasing burden, unlessrelative interest rates decline and growth is stimulated byfurther broadening of the European Union, for example by the early entry of Turkey or by more liberal corporateand social tax policies, Western Europe may be trapped in a sluggish, lack-of-growth scenario, falling furtherbehind the US and Asia Pacific. Social and structural costs are significant elements of this concern. The recentintroduction of transfer of undertakings legislation in theEU (‘TUPE’), for example, represents another burden tobear. In certain circumstances, it is possible that havingwon an account, the winning agency would have to takeon the losing team or pay severance.
Despite these issues, there is evidence – particularlyin 2004, 2005 and the early part of 2006 – of a growingfocus on top-line growth. Given a low-inflationaryenvironment, limited pricing power and more concentratedretail distribution, clients are increasingly coming to theview there is only one way to compete – throughinnovation and branding. Promote on price and you createcommodities. Innovate and differentiate, you create brandsand the right to demand a premium from the consumer.There is a growing realisation that cutting costs alone willnot deliver growth targets promised to Wall Street and theCity of London. There is a limit to cost reduction, but noceiling on top-line growth – at least until you reach 100%market share. Further reinforcing this trend, strategicadvisors, such as management consultants like McKinsey,counsel a switch in focus from costs to revenues.Corporate strategic plans are increasingly concentrating onmanaging for growth, instead of managing for value.
Finally, managements are just plain tired ofgrappling with debilitating cost-management programmes.For the past three or four years, there has been aninexorable focus on cost. It is much more fun to focus on growth – perhaps this partially explains the recent surgein merger and acquisition activity, too.
Annual Report 2005How we’re doing20
‘‘
‘‘
’’
’’Clients are increasinglycoming to the view there is only one way to compete – throughinnovation and branding.
For the past three or fouryears, there has been aninexorable focus on cost. It is much more fun to focuson growth – perhaps thispartially explains the recentsurge in merger andacquisition activity, too.

How we’re doing
Grey delivers benefits
Grey, which accounts for about 15% of the enlargedCompany, has now been fully integrated and has brought tothe Group important strategic assets and strong people. Ithas a powerful planning and account handling advertisingagency led by Jim Heekin, with relationships with majormultinational clients of WPP. And it is now raising its levelsof creativity. Its strong Media investment managementcapability, led by Alexander Schmidt-Vogel, is now fullyintegrated into GroupM, winning large accounts usingGroupM networks and planning and research tools. Its public relations capability, led by Jeff Hunt, is now co-ordinating and co-operating with Cohn & Wolfe, ably led by Donna Imperato. Its very strong healthcarecapability, probably our fastest growing, is run by Lynn O’Connor Vos. Its strong direct, sales promotion,interactive and internet capability, now uniformly brandedG2, is led by Joe Celia. Geographic strengths include theUS and Europe (including Eastern Europe) in particular,with interesting bases in Asia Pacific, Latin America, Africaand the Middle East, which are being built up further,organically and by acquisition. Grey also presents bigopportunities to build on existing common clientopportunities, and explore new relationships.
Our margins
Our 2006 budgets indicate organic growth of 4%, equallybalanced between first and second halves, and skewed togreater growth in marketing services. Operating marginsare projected to reach 14.5%. So far, we are ahead ofbudget. The margin objective for 2007 is 15.0% and in2008 we will aim even higher.
2006 should be a better year for the industry,stimulated by an additional 1% growth through the mini-quadrennial factors, such as the mid-term US Congressionalelections, the Turin Winter Olympics and the FIFA WorldCup in Germany. The following year should be its equal or even better, as we gear up for the maxi-quadrennial in2008. As previously noted, that year should be a blowout.In February, when we announced our results for 2005, we already had given guidance on life beyond 15%, andhow we might improve further our margin to 19% or 20%under 2004 UK GAAP. This is not so outrageous as somebelieve, given that our best performing companies in eachservices sector already perform at a combined Groupmargin of 17%.
Our top priorities
Our reason for being, the justification for WPP’s existence,continues to be to add value to our clients’ businesses andour people’s careers. Our goal remains to be the world’smost successful provider of communications services tomultinational and local companies.
To that end, we have three top strategic priorities.First, in the short term, having weathered the internetbust successfully, we need to build on the solid base wehave established. Our people are stronger: they are
better resourced, motivated and incentivised than when we exited the last recession in the early 1990s.
The Company is also more profitable, more liquid,less leveraged and better structured than then. In the mostrecent economic cycle, margins peaked at 14.5% andbottomed at 12.3%, as opposed to 10.5% and 5.6% theprevious time.
Second, in the medium term, to build upon thesuccessful base we have established with theacquisition of Young & Rubicam Brands and Grey.
At Grey,the new management structure is now in place andwhatever integration targeted, now completed. At Young& Rubicam Brands, our plans are also largely completed,the one remaining task being to complete the managementstructure at the Y&R advertising agency, where momentumhas picked up recently.
Our third priority, in the long term or over the next five to 10 years, is to increase the combinedgeographic share of revenues of Asia Pacific, Latin
America, Africa and the Middle East, and Central andEastern Europe, from around 20% to one-third. We shallalso aim to increase the share of revenues of marketingservices from around 52% to two-thirds; and to increasethe share of more measurable marketing services – suchas Information, insight & consultancy, and direct,interactive and internet – from around one-third of ourrevenues to 50%.
Our six objectives
Our six objectives remain as follows:First, to continue to raise operating margins to the levels of the best-performing competition. 15% (under 2004 UK GAAP) has finally been
achieved. 20%, or 19% under IFRS, is much tougher, but not out of the question. BBDO, Dentsu and McCannhave done so historically, although the pressure becametoo great in some instances.
Annual Report 2005How we’re doing 21

How we’re doing
Second, to continue to increase flexibility in the coststructure. Great strides were made in 2004 and 2005on this. Peak flexibility historically was in 2000,
at 6.6% of revenues in variable staff costs. Now at 7.6% in 2005, and 7.8% in 2004, we have seen new peaks; and once again we have a sufficient ‘shock absorber’ in our cost structure, if revenue growth weakens.
Third, to improve total share owner return bymaximising the return on investment on theCompany’s £600 million free cash flow. There
are broadly three alternative uses of funds:
•Capital expenditure, which usually approximates thedepreciation cost. Pressure here has eased as technologypricing has fallen, although we are investing more in realestate, particularly in the US, to secure greater efficiencies.
•Mergers and acquisitions, which have historically takenthe lion’s share of free cash flow. Here we have raised thehurdle rate on capital utilised so that our return on capitalemployed may be increased. Even so, there are stillinteresting opportunities, particularly outside the US,where pricing remains lower and where there is a closer fit with the Company’s strategic objectives. Privatetransactions remain more attractively priced at single-digitprice-earnings multiples. Happily, return on capital fromGrey exceeded our cost of capital in the first year, and thereturn from Young & Rubicam Brands, although stillbelow the cost of capital, is rising satisfactorily.
•Dividends or share buy-backs. We have been the onlyFTSE 100 company to increase its dividend by 20% perannum over the past 10 years. Given dividend cover ofmore than four times headline earnings and a dividendyield of just over 1%, we can continue to increase thedividend. However, a rolling share buy-back programmeappears to offer a more significant benefit to total shareowner returns, and we are looking at boosting the level of the share buy-back programme from 1.5-2% of theoutstanding share capital to over 2%. In the first quarter of 2006, we were buying back shares at an annualised rate of 2.5%.
Fourth, we will continue to enhance the contributionof the parent company. WPP is not just a holdingcompany focused on planning, budgeting, reporting
and financial issues, but a parent company that can addvalue to our clients and our people. We will continue to do this through a limited group of 250 or so people at thecentre in London, New York, Hong Kong and São Paulo.This does not mean that we seek to diminish the strengthof our operating brands. Our objective is to maximise theadded value for our clients with their businesses and ourpeople with their careers.
Annual Report 2005How we’re doing22
‘‘
‘‘’’
’’
It is a relatively recentdevelopment for certainmultinational marketingcompanies, when looking to satisfy their globalcommunications needs, tomake their initial approach notto operating companies butdirectly to parent companies.
All our clients, whether global,multinational or local, continueto focus on the quality of ourthinking, co-ordination ofcommunications, and price. In response, we focus on talent, structure and incentives.

How we’re doing
Many of our initiatives are possible because of thescale on which we now operate. In the optimum use ofproperty, in information technology and in procurementgenerally, we are able to achieve efficiencies that would be beyond the reach of any individual operating company.But it is also clear that there is an increasing requirementfor the centre to complement the operating companies inprofessional development and client co-ordination.
It is a relatively recent development for certainmultinational marketing companies, when looking tosatisfy their global communications needs, to make theirinitial approach not to operating companies but directly to parent companies. Such assignments present major, andincreasingly frequent, opportunities for the few groups of our size. It is absolutely essential that we have theprofessional resources and the practice developmentcapability to serve such clients comprehensively, activelyand creatively.
All our clients, whether global, multinational orlocal, continue to focus on the quality of our thinking, co-ordination of communications, and price. In response,we focus on talent, structure and incentives.
People, people, people
Talent and its management therefore remain the lynchpinof our reason for existence: that is what our clients pay usfor. Development of our people and the way we managethat talent is a critical driver of performance; and on that critical dimension, we continue to make significantprogress. In the creation of extremely attractive workingenvironments, with highly competitive incentives, weincreasingly differentiate ourselves from our competitorsand improve the attraction of WPP companies asdestinations for talent.
Our quarterly reviews with the operatingcompanies have been restructured, consequently, to give more time and attention to talent and to clients. Our recruiting efforts throughout 2005 were dedicated and especially fruitful as we successfully targeted andattracted top talent within and beyond our industry,often competing with investment banking, managementconsulting, and private equity offers. The war for talent is fierce, and there is more to be done.
The blueprint for our executive developmentcurriculum has been completed, and our new clientleadership training programme has been successfullyintroduced. Each of our operating companies installed its own approach to performance assessment andsuccession planning, aimed at developing the careers of their people, improving the quality of feedback,coaching and mentoring they receive and providing for
orderly succession. We continued to scrutinise and modifyour compensation practices: both to offer competitive andjustly based rewards to our existing people and to attractoutstanding talent from elsewhere. For the first time Grey was included in our performance and assessmentapproach in 2005. Our incentives assessment and rewardsmethodology have been enthusiastically received.
A communications services company must be amodel of excellent external and internal communications.To that end, we are broadening the understanding of the Group’s vast resources through a raft of regularcommunications: our regular FactFiles profiling Groupresources/companies/products; our monthly public onlinenews bulletin, e.wire; our quarterly global newspaper, TheWIRE; our annual Atticus Journal of original marketingthinking; and our annual Corporate Responsibility Report.Our online communications continue to be expanded witha comprehensive redevelopment of the WPP intranet andGroup website (www.wpp.com).
In property management, we continue to improvethe return on our investment in real estate through theWPP Space Program, with planned investment in propertydatabase and systems, innovative design and continuousreview of key locations. Surplus space, primarily inheritedthrough recent acquisitions, is steadily released from theportfolio, resulting in a reduction of 1,000,000 square feetduring the past two years; on our average cost per squarefoot equivalent to a saving of £24 million. Following thisreduction, at the end of 2005 our portfolio was 18.2million square feet and a further release of 300,000 squarefeet is expected during 2006.
In procurement, we have set ourselves the goal ofbecoming the undisputed leader of procurement practice in the global advertising and marketing services industry.With intensified internal training in this area, we havefocused on our major markets and categories morefavourable for global, regional or country contracts suchas IT, telecoms, facilities, travel, professional services and production. This program’s success has beendemonstrated by improvement of the non-staff costs to revenue ratio in recent years.
In information technology, we continue to integratecore infrastructure support across our offices. As withCordiant, Grey operations have been quickly integratedinto our IT platform, which has allowed the operatingcompanies to concentrate on client-related IT systemsdevelopment. Convergence of transmission of electronicdata, internet, wireless, IP and traditional voice telephonypresents us with a further opportunity to standardise ourapproach to technology at the regional if not global level,and to take advantage of current overcapacity in many ofthese sectors.
Annual Report 2005How we’re doing 23

How we’re doing
Finally, in practice development we continue todevelop horizontal initiatives in a focused set of high-potential areas across our vertical operating brands: inmedia investment management, healthcare, privatisation,new technologies, new faster-growing markets, internalcommunications, retail, entertainment and media, financialservices, and hi-tech and telecommunications. Specifically,we continue to invest in sharing insights and developinginitiatives through The Channel (in media and research)and The Store (in distribution and retail).
In key geographic markets we are increasingly co-ordinating our activities through WPP CountryManagers. Despite events at WPP Italy, we continue tobelieve that increasing co-ordination is required betweenour brands at the country and global levels, as thearguments for investment in regional management becomeweaker. However, the activities of Country Managers mustbe closely aligned and monitored. In addition, we areappointing a small number of WPP Global Client Leadersto co-ordinate our efforts on behalf of clients and to ensurethey get maximum benefit from their relationships withWPP operating brands.
Furthermore, we continue to encourage internalstrategic alliances and promote co-operation. Practicedevelopment initiatives have thereby been reinforced insuch areas as healthcare, internal communications, andmedia and entertainment. This has been especiallyimportant to manage our portfolio of direct investments in new media.
All these initiatives are designed to ensure that we, the parent company, really do (and are perceived to)inspire, motivate, coach, encourage, support andincentivise our operating companies to achieve theirstrategic and operational goals.
Fifth, as we move up the margin curve, we intend to place greater emphasis on revenue growth. Onelegitimate criticism of our performance against the
best-performing competition is our comparative level oforganic revenue growth. 2000 was a bumper year butunsustainable. In 2001, we disappointingly moved backinto the middle of the pack. But there was a significantrevival in 2002 and 2003, when we were one of only twoof the major companies that showed revenue growth. 2004 was punctuated with a number of high-profile wins,resulting in the second strongest organic growthperformance in the industry, and 2005 saw strong growthagain among the leaders in the industry.
Our practice development activities are also aimedat helping us position our portfolio in the faster-growingfunctional and geographic areas. So far in 2006, the Grouphas made acquisitions or increased equity interests inAdvertising and Media investment management in the US,
the UK, Germany, South Africa, Israel, China, Singaporeand Brazil; in Public relations & public affairs in India;and in Direct, internet & interactive in the US and China.
These acquisitions continue to move us forward to our aforementioned strategic priorities; expanding themarket shares of our businesses in Asia Pacific, LatinAmerica, Africa and the Middle East to one-third; inmarketing services to two-thirds; and in Information,insight & consultancy, direct and interactive, to one-half.
We will expand our strong networks – Ogilvy &Mather, JWT, Y&R, Grey, United, BatesAsia, MindShare,Mediaedge:cia, MediaCom, Research International,Millward Brown, KMR, Hill & Knowlton, Ogilvy Public Relations Worldwide, Burson-Marsteller, Cohn &Wolfe, GCI, OgilvyOne, Wunderman, 141 Worldwide, G2, CommonHealth, Sudler & Hennessey, OgilvyHealthworld, Grey Healthcare, Enterprise IG, Landor and Fitch – in high-growth markets or where their market share is insufficient.
In 2005, in addition to the completion of theacquisition of Grey, we strengthened our position inAdvertising and Media investment management in the US,the UK, Denmark, the Netherlands, Spain, Russia, Israel,Argentina, Hong Kong and Australia; in Information,insight & consultancy in the US, the UK, Poland, China,Hong Kong, Korea and New Zealand; in Public relations& public affairs in the US, Denmark, Bahrain, Argentina,India, China and Australia; in Healthcare communicationsin the US, the Netherlands and Switzerland; and in direct,internet and interactive in the US.
We will also enhance our leadership position in Information, insight & consultancy by furtherdevelopment of our key brands with particular emphasison North America, Asia Pacific and Latin America. We will accelerate our growth of panels and haveestablished a Kantar-wide operational capability.We will reinforce our growing position in media research through KMR, which includes our investments in television audience research through IBOPE,AGBNielsen Media Research and Marktest, which,combined, are the market leader outside North America. In addition, we will reinforce our worldwide strength indirect and interactive marketing and research through ourtraditional channels such as The Digital Edge, OgilvyOne,Wunderman, Blanc & Otus and Lightspeed. Although the early 2000-2001 compressions in financial valuationsinitially offered significant opportunities, we will now also invest directly in the new channels through start-ups,particularly as US valuations in search, for example, havebecome prohibitive. Lastly, we will continue to develop our specialist expertise in areas such as healthcare, retail and interactive and to identify new high-growth areas.
Annual Report 2005How we’re doing24

How we’re doing
Creativity remains paramount
Our sixth objective is to improve still further thequality of our creative output. Despite the growingimportance of co-ordinated communications and
price effectiveness, the quality of the work remains andwill remain paramount. If you drew a graph plottingcreative awards (as a proxy for creativity) against marginsfor any group of agencies, there would be a very strongcorrelation. The more awards, the stronger the margins.The client’s procurement department fades into thebackground when the work is strong. Of the three thingswe do – strategic thinking, creative execution and co-ordination – creative execution is undoubtedly the mostimportant, and that means creativity in its broadest sense.
Clients look for creative thinking and output notjust from advertising agencies, public relations and design companies, but also from our media investmentmanagement companies, MindShare, Mediaedge:cia,MAXUS and MediaCom, and our research companies.Millward Brown remains arguably one of our mostcreative brands. Witness its new global brands survey with the Financial Times.
We will achieve this objective by stepping up ourtraining and development programs; by recruiting thefinest external talent; by celebrating and rewardingoutstanding creative success tangibly and intangibly; byacquiring strong creative companies; and by encouraging,monitoring and promoting our companies’ achievements in winning creative awards. For additional leadership inthis regard, Robyn Putter, still worldwide creative directorat Ogilvy, has agreed to take on the additional role ofWPP’s worldwide creative head.
We are committed to achieving these objectives as a substantively responsible corporate citizen of theworld at large and the communities in which we operate.
Looking forward
A colossal amount remains to be done – challengingour clients, and therefore us. It seems certain that once theseobjectives are achieved, they will be replaced by new ones.
As companies grow in size, most chairmen andCEOs become concerned that their organisations maybecome flabby, slow to respond, bureaucratic and sclerotic.
Any sensible business leader aggressively resists thisphenomenon; we all seek the benefits of size and scalewithout sacrificing the suppleness and energy of a smallerfirm. And, for the first time, new technologies now makethis possible on a global platform.
WPP wants the scale and resources of the largestfirm together with the heart and mind of a small one.
As a parent company, we continue to developpractical principles and policies for our companies’charitable giving and services to the environment,education, the arts and healthcare based on best-practiceguidelines. We conservatively calculate that the WPPorganisation contributed an estimated £17.3 million worth of time, skills, materials and money to social andcommunity causes in 2005. A summary of the Group’sapproach to corporate responsibility can be found onpages 110 to 115.
And finally… a reminder
Those who own shares in WPP – and those who analyseand comment on its performance – quite rightly see it as a single entity; they rate it according to its overallachievements. And it’s those achievements that this Reportfeatures. It’s been a very good year.
But of course, what those aggregate numbers fail toreveal are the extraordinary number, range and diversity of quite separate achievements that go to make up thoseimpressive company totals.
By applying their brains and their talent and theirexperience to the service of their clients, every company in every discipline on every continent has contributed tothat parent company total. The contribution of some92,000 individual people, representing a vast variety ofskills, has gone to make up that parent company total.
And, as always, it is those individual skills that ourclients value, and pay for. Project by project, some tens ofthousands of them in all, as WPP companies helped maketheir clients more successful, so, project by project, theyadded inexorably to the final figures presented here.
So it is entirely right that we should end this letterby acknowledging the true source of our success – andoffering our wholehearted gratitude to all those manypeople who made it happen.
Philip LaderChairman
Sir Martin SorrellGroup chief executive
Annual Report 2005How we’re doing 25

How we’re doing
Annual Report 2005How we’re doing26

How we’re doing
Reports from our operating brands
Annual Report 2005How we’re doing 27

s the marketplace, the media, andconsumers’ expectations have evolved, wehave structured our offering to seize theinitiative. It could not be more clear whatclients want. They want great ideas thatcan move effortlessly through multiple
channels. They want thinking unfettered to specific media.They want diverse capabilities and they want experiencedpartners. They want leaders who can work together. We aredelivering. We have the partners in place who are working
How we’re doing
Agency networks
across regions and disciplines, creating new and compellingcommunication solutions. Yes, we are a long way from justthe “ad business.” And that is a good thing.
Last year we reaped the benefit of more than adozen years of honing 360 Degree Brand Stewardship®.This business platform enables us to integrate successfullyour growing range of disciplines which now include 141,Ogilvy’s brand activation company, Ogilvy PR and OgilvyHealthworld. We also have brought digital and directmedia back into our operations this year as Neo@Ogilvy.
We have made changes in leadership that haveallowed us to further our 360 agenda. In North America,where Ogilvy Advertising and OgilvyOne are alreadyclosely collaborating, the appointment of Carla Hendra andBill Gray as co-CEOs of North America promises morecohesion. (They succeed Tro Piliguian who is now WPP’schief operating officer.) Gary Leih, formerly at Ogilvy SouthAfrica, has dramatically reorganized Ogilvy in London;uniting our companies as the single largest marketingcommunications group in the UK.
While changes like these promise better 360execution, as practitioners we know that capability alone is not enough. If there is not a great idea at the heart of acampaign, it is a missed opportunity. Great ideas are whatclients come to us for. And we’ve had a number of those big ideas over this past year.
The Dove Campaign for Real Beauty has met with astounding success. It has been overwhelminglyembraced by consumers, including the 90 million who saw the first Dove TV spot to ever air on the Super Bowl.This 360 campaign, now in 30 countries, has generatedunprecedented PR, retail excitement, interactiveengagement and big sales jumps for Unilever. Dove’sdesignation as international advertiser of the year byCampaign magazine and its winning the Grand Prix award at the Euro Effies, demonstrate the admiration from the industry that this campaign has generated.
We continue to innovate on IBM, American Express,Kodak, DHL, Cisco, Kraft and BP among many otherclients. Our current clients get the lion’s share of our focus and talent because that is the implicit promise ofBrand Stewardship. Dove’s breakout campaign came after50 years on our roster, which demonstrates how potentdeep brand knowledge is in the creative process.
This year we also added a number of new globalclients like Lenovo, Morgan Stanley, AstraZeneca, Bristol-Myers Squibb and Novartis. We also gained newbusiness from existing clients such as Coca-Cola, Ford,Goodyear, GSK, Pfizer, Prudential, Unilever and Yahoo! –always a great measure of the value we bring. Importantly,the common denominator in winning all this new businesswas our 360 approach. It is the platform for growth.
Ogilvy & Mather Worldwide
Annual Report 2005How we’re doing28
Shelly LazarusChairman and chief executive officer
Ogilvy & Mather Worldwide

How we’re doing
Beyond the management changes in the UK andNorth America, there was significant planned successionelsewhere. Daniel Sicouri took over from Mike Walsh ashead of EAME; Guerino Delfino, head of OgilvyOne Italy,now runs all Ogilvy units in that country; Enric Pujadas was named to follow Rolando Sáinz de la Peña as head of Ogilvy in Spain. Christopher Graves now leads Ogilvy PR in Asia, and Martin Liptrot is heading Ogilvy PR inEAME. Departures opened the way for new WorldwideBoard members: Tim Isaac, Paul O’Donnell and Tham Khai Meng broadened our representation from Asia andfrom OgilvyOne, with Khai adding another significantcreative voice.
We continue to innovate and expand our Ogilvyoffering. This year, we launched David, a network of 10offices in Asia targeted at companies looking for quick-to-market brand solutions. We launched a consulting practicespecializing in the unique trading relationship betweenBrazil and China. We expanded in Russia and EasternEurope. We opened an OgilvyOne office in San Francisco to take on more digital assignments for Yahoo!. We openedthree new offices in Australia and China, and established an affiliate in Nepal – only the second international agencyin that market.
Our Ogilvy partners continue to provide thoughtleadership, with many becoming recognized experts on the key issues facing our industry. Several colleagues haverecently published books. In China, where we are theleading international agency, we established a think tank on branding with Tsinghua University. Verge, our hugelypopular digital communication summit launched in 2004,has been transformed into a global seminar series. To date we have held 15 Verge events in 13 countries. It’s been an enormous success in educating clients, bringingknowledge to the industry, and directly generating newbusiness. Our ability to lead in this area is essential asdigital and interactive grow ever more central in themarketing agenda.
We had an excellent year in terms of awards and recognition.
Ogilvy Latina’s largest offices – Argentina, Brazil,Chile and Mexico – all won multiple Agency of the Yearawards and numerous creative awards across disciplines,including Mexico’s first-ever Gold Lion at Cannes.
Ogilvy Asia continued its regional creativedominance as the hottest agency in Asia. We were alsonamed the No. 1 regional network in the region, and our creative director, Tham Khai Meng was named theleading creative person. Ogilvy India was named theCreative Agency of the Year for the eighth time in nineyears. It was also named No. 1 agency for the third time,with creative leader Piyush Pandey named industry leader.
Offices in other parts of the Ogilvy world alsoreceived recognition. Ogilvy South Africa was again namedbest large agency, with Cape Town named as the regionalAgency of the Year and its chief Gary Leih (now headingthe UK) the Agency Leader of the Year. Ogilvy Italy wascited as the agency with the best reputation. OgilvyOne was named top agency network for both direct and digitalmarketing by The Won Report. OgilvyInteractive wasAdweek’s North American interactive agency of the year,OgilvyOne North America was BtoB magazine’s directagency of the year, and Carla Hendra was namedAdvertising Woman of the Year by Advertising Women of New York.
Beyond Dove’s Euro Effie and Mexico’s Gold Lion,we did a brisk business at the award shows. At the NewYork Addy Awards we took home 12 gold and 13 silverawards for 12 different clients. Our long partnership withAmerican Express was honored with a special Grand Addy– only the second to have been awarded. As announced atthe ceremony, Ogilvy and American Express created“superior advertising done over the long haul, from Maldento Superman, they’ve all been great”.
At the One Show, Ogilvy took 13 Pencils includingfour gold and four silver. At Cannes, the total was 24Lions, including five gold, with Ogilvy Chile winning the prestigious Outdoor Grand Prix for work on Lego.
Once again, OgilvyOne dominated the DMA Echoawards, taking home 14 of 30 awards – more than anyother agency – for 10 different offices. A special Echo was given to OgilvyOne in New York and Chicago forcollaborative work on Allstate.
We swept the Asian Adfest with a record breaking43 awards, including seven golds and 12 silvers. At theFIAP awards in Latin America, Ogilvy won 17 medals. At the DM Asia awards Ogilvy swept with 34 awards,almost half of the total. And at the Asian PR Week awards, Ogilvy won 15 awards across categories.
That we have such a range of winners, across regionsand disciplines is testament to our clients. Make no mistake,it is committed client partnerships that make the differencein the quality of the work.
I cannot end a review of 2005 withoutacknowledging the passing of Jock Elliot, Ogilvy’s belovedsecond CEO. He was the consummate partner. It was hiswise leadership that guided the agency’s expansion in the1960s and 1970s while allowing David Ogilvy to focus onthe creative and cultural side of the business. They werecomplementary in skills, collaborative in nature, andcontributed all to the enterprise. Together they built thefoundation that sustains us today – a strong and vibrantnetwork, and a culture that values ideas and creativity in an environment of mutual support and partnership.
Annual Report 2005How we’re doing 29

How we’re doing
An era has passed and so has the baton to all the partnersat Ogilvy who look to the future armed with rich history,encouraged by strong results, and confident in each other’stalent and commitment. We are partners in progress.
Shelly Lazarus
OgilvyOne Worldwide
In 2005, OgilvyOne Worldwide established a new recordfor its financial performance, and set a strong pathway forfuture growth.
We entered the year with three strategic goals:to deepen our client service culture; strengthen talentretention efforts; and expand our leadership in digitalmarketing. The company made excellent progress on allthree fronts.
Our client satisfaction scores (which we measuresystematically each year) increased globally. We expandedour relationship with many key clients including Unilever,Nestlé, Hutch, Allstate, Starwood and Yahoo!. We alsowon significant new assignments across the entertainment,personal care, travel, beverage and consumer electronicscategories.
2005 will perhaps be remembered as the year that digital marketing went from niche to mainstream.Underlying the growth of digital marketing are the twomonster trends in the global communications business:1) consumers seizing control of their media andentertainment choices; and 2) marketers stepping up their pursuit of accountability and return on investment.
Digital marketing is no longer a technology story. It is a consumer adoption story. We see profound changesin how people ‘shop’ across so many brand categories andmarkets. Most significantly, we see digital marketingintersecting at the moments of truth as customers journeyfrom awareness to purchase.
OgilvyOne is deeply committed to helping ourclients navigate and win in the new digital marketinglandscape. To open everybody’s mind to what is possible,we launched Verge, a series of conferences where Ogilvyleaders, our clients and other industry experts gather todiscuss the realities and possibilities of digital marketing.First run in New York in 2004, Verge was expanded to 12markets through the end of 2005, including Japan, China,
Singapore, Australia, France, Germany, Mexico andCanada. In 2006, we will take Verge to new markets suchas Brazil, Spain and Korea. We have also just launched The OgilvyOne Report on digital trends, a global studyinto the “Net” generation, and a proprietary researchinitiative called Personal Circuits, which assesses howindividual consumers use digital media to shop and purchase.
We are very proud of our creative accomplishmentsin 2005 – the OgilvyOne Worldwide network won a record499 awards. We were named the top agency network forboth direct and digital marketing by The Won Report and The Cyber Won Report. And we dominated the 2005Direct Marketing Association Echo Awards for creativeexcellence and results, winning more than half of theawards. Significantly, over 50% of our total awards in 2005 were for digital marketing programs.
OgilvyOne enters 2006 with strong clientrelationships, outstanding talent and momentum in digital marketing. The most significant initiative of the new year is the launch of Neo@Ogilvy, our new digital,direct response and search marketing media division.Neo@Ogilvy places us squarely at the center of the fastest-growing parts of the total communications business.We can now offer clients a fully integrated digital marketingsolution – strategy + creative + media + metrics – and do itglobally. Neo@Ogilvy is off to a tremendous start. We havean outstanding portfolio of clients including IBM, Yahoo!,Cisco, American Express and SAP. Already, we have 200digital media and search marketing experts on boardaround the world.
OgilvyOne Worldwide’s goal is to lead in the growthsegment of marketing communications. 2005 was an excellentyear and 2006 looks equally promising.
Brian FetherstonhaughChairman and chief executive officer
OgilvyOne Worldwide
Ogilvy & Mather Worldwide
Annual Report 2005How we’re doing30

How we’re doing
Ogilvy Healthworld
2005 saw Ogilvy Healthworld’s For the Life of the Brand™business philosophy further realize its market ambition.Today, the organization offers a complete array ofhealthcare communication disciplines all focused on brand-building for our clients.
Our global network of 53 offices in 33 countriesbrings together solutions that link clinical trial recruitmentand medical education with PR, health professionaladvertising and consumer-directed communications.Together, these services work to build a stronger brand at each stage of the commercial lifecycle and across allgeography – a winning growth strategy with clients.
In 2005, we grew our medical education and PRbusiness with key clients Lilly and Roche, among others.We also enjoyed cross-market wins and referrals that grewour advertising business with important clients such asAstraZeneca, Novo Nordisk and Pfizer.
Our clinical trial recruitment business provided thenetwork with emerging new business opportunities as weassisted clients in the early stages of brand development andmarket preparation.
In addition, Ogilvy Healthworld also won portfolio-wide assignments in major markets, including CRM for theWyeth Women’s Health franchise in the US.
We won a broad array of industry awards acrossgeography and service sectors. Among them were our PR group’s win of the international SABRE award for“Redefining Hope and Beauty”, the breast cancerawareness campaign for AstraZeneca; recognition of ouroffice in Mexico as the most creative healthcare agency in the country from the Aspid Awards; and PMEA awardsuccess in the UK for direct-to-patient communication.
We believe a number of initiatives are driving our growth:
•First, knowledge transfer across the network has enabledus to move with greater speed and impact in meeting andexceeding clients’ needs and ambitions at both global andlocal levels.
•Second, by drawing on Ogilvy’s 360 Degree BrandStewardship® philosophy, we have improved the quality and consistency of our own creative work, which hasenabled us to compete for and win more global andregional assignments than ever before. Examples includethe international brand development for Roche’s Herceptin,the integrated European launch of Pfizer’s new smokingcessation brand, Champix, and the global advertisingcampaign for Altana’s leading Pantoprozole brand involving over 20 markets worldwide.
•The third dimension of Ogilvy Healthworld’s businesstransformation is our collaboration, on a true 360 Degreebasis, with the wider Ogilvy client network. This includesworking closely with Ogilvy’s Global Brand Community on accounts where aspects related to healthcare are vital to the success and growth of the client. Clients such asUnilever’s Dove and Slim.Fast and Nestlé’s Nutren fit well into this arena.
At every level, our client partnerships drive ourcontinued growth. They form the core of our strategicemphasis for 2006 – our unique ability to deliver big ideas in the expanding and increasingly diverse healthcare marketplace.
Steve GirgentiChief executive officer
Ogilvy Healthworld
141 Worldwide
2005 was a turning point year for 141. Yes, it was a year of significant business expansion and financial growth for the company. But what we are most proud of is thenetwork we’ve established to connect our global services,the engagements we’ve driven across Ogilvy businesses and, as always, the outstanding work we’ve done with ourclient partners.
The world is changing. Marketers are searching forways to navigate a constantly shifting landscape. Controland choice are increasingly in the hands of the consumerand the retailer. Return on investment remains as criticaland as elusive as ever. There is less time, more pressure andgreat demand for action.
This is where our clients leverage the work of 141.We create action through a platform we call BehaviorTransformation™. Everything we do is focused onchanging behavior where it can most immediately influence the purchase of a brand.
With all the change around us, building a strongbrand is still the pre-requisite to winning in market. Thosewho are going to market most successfully are realizing thatthe way to win is to build ownable brand experienceswhich move the consumer. We believe in improving bothbrand sales and brand equity at the same time.
At 141 we are doing this by creating media neutralprograms from the street up – by creating shopper andtrade marketing plans which reflect strategic insights intoboth the consumer and the trade customer. Our emphasis ison what we call the ‘last mile’. Our promise is measurableresults – a goal we all desire.
Annual Report 2005How we’re doing 31

How we’re doing
One of our key growth strategies has been to buildour business across the Ogilvy network and to offer clientsactivation programs which are tailored but can travelacross geographies and cultures. We have become a naturalfit within Ogilvy’s 360 Degree Brand Stewardship® offering.Whether we engage independently or in partnership withOgilvy, we are able to offer our clients channel-neutralsolutions tailored to specific needs.
Progress is good. Our business with global clientshas grown 20% over the past year. 80% of our top 10clients now have us working with them in two or moreregions around the world.
Across various units and around the world, we havebroadened our relationships with clients like AmericanExpress, BAT, BP, Coca-Cola, Ford, Gilette, GlaxoSmithKline,Kodak, Kraft, Michelin and Unilever.
Over the past year, we added three key services to our offering. The first was the acquisition of K&LMarketing, renamed 141 Boomerang. 141 Boomerang is amarketing company specializing in events, field marketingand face-to-face activation. Having this offering means wecan implement many of the programs we create withouthaving to outsource projects, providing a seamlessengagement for our clients. Within a year, this part of our business has more than doubled in size.
Second was the creation of 141 Première, our sportsand entertainment joint venture with Premiere SponsorshipMarketing (PSM), a unit of WPP. With years of experienceworking with the Olympics, professional sports leagues,franchises and athletes, as well as entertainment companies,studios and agents, this group offers our clients a realadvantage in the growing area of sponsorship marketing.
The third is the development of 141 Shopper, ourtrade marketing consultancy, committed to developingprograms targeted to retail entities. We believe that creating trade partnerships will be fundamental to amarketer’s success and clients are rewarding 141 for this consultative service.
Our work around the world speaks for itself, but we do value the recognition from others. Throughout the year, 141 was the recipient of awards in every region,across each of our disciplines. Perhaps most inspiring waswinning the 2005 WPP Worldwide Partnership Programaward for work done on behalf of Boeing. The award wascreated to encourage and recognize collaboration across
marketing disciplines which demonstrably enhance clientservice. As the lead agency for this program, it was a greatexample of how 141 is able to partner with WPP, Ogilvyand our clients. It is a testimony to the possibilities in our collaboration.
As we enter 2006, we feel momentum, opportunityand excitement. The marketplace is changing in ways which reward those who know how to influence behaviorand those who know how to get results through the line. We welcome those changes with open arms.
Rick RothChief executive officer
141 Worldwide
Ogilvy & Mather Worldwide
Annual Report 2005How we’re doing32

How we’re doing
s an agency with a rich heritage of firsts,JWT has invented and re-invented the waythe ad industry does business over its 142-year history. And we are determined totrail blaze again by leading the industryforward in today’s consumer-controlled,
attention-deficit world.That was the purpose of our re-launch on February
28, 2005, which went far beyond scrapping the J. WalterThompson signature script for the sleeker JWT logo.
At its core was our new point of view, which recognizes the imperative to create ideas that people want to spendmore time with.
Over the past year, we have worked unflaggingly to create a flatter, faster, and more fun environment. An environment that challenges the old ways of doingthings, encourages big multi-dimensional ideas, andembraces innovation.
To advance this type of thinking in our work, wepromoted Craig Davis to worldwide chief creative officer in January 2005. Under his creative leadership, weimplemented a set of 10 exacting standards – ranging from “world-beating” to “damaging” – that are meant to identify high-quality versus intolerable work andeverything in between. Our purpose was very clear – to create ideas that people want to spend time with. A point of view that feels even more relevant and morepowerful than it did a year ago.
Thanks to our adherence to this exacting system,we’re seeing some real signs of improvement. At last year’sCannes International Ad Festival, JWT took home 17 Lions– a vast improvement over 2004’s seven. Not only did wetake home 17 Lions, but 47 of our entries made it to theshortlist, nearly double the 25 that advanced last year.
What is impressive is that the work recognized forits creativity, originality, and inventiveness is for our majorclients, including Kimberly-Clark, Diageo, ReckittBenckiser, Ford, Kellogg’s and Pfizer.
In the UK, for instance, we earned recognition fortaking advantage of interactive TV for Diageo’s Smirnoff. If the viewers chose to interact with the ad, it deepenedtheir engagement with the creative idea and allowed themto spend more time with the brand.
For the Ford Fusion, we developed an emotionalconnection with young US buyers – raised in import-carhouseholds and highly skeptical of advertising messages –through smart product placement on such popular shows asAmerican Idol and Extreme Makeover: Home Edition. So,when Ford vehicles appear, they become an instantly integral,natural part of the program’s overall emotional content.
In Paris, we created a fictitious organization forWilkinson Sword to promote eccentric shaving in an attack against the image of the perfectly shaved man. The organization, called Wilkinson D.A.R.E., hosted a website containing viral spots of men converting toeccentric shaving, a fake history of eccentric shaving, an eccentric shaving simulator, and contests allowingpeople to send in photos of their own eccentric shaves. For Vodafone, we parodied the hippy-led movement of the ’60s and ’70s to increase SMS usage among universitystudents – they had free love, we had free SMS; they hadThe Joy of Sex, we had The Joy of Text.
Annual Report 2005How we’re doing 33
JWT
Bob JeffreyChief executive officer
JWT

As one of the largest and oldest agencies in theworld, we’ve stayed big for a very long time by staying onthe leading edge, bringing in new people with new skills,and being open to new ideas. This year, we are ascommitted as ever to the constant improvement of ourperformance, our growth, our consistency, and our qualityof relationships, quality of work, quality of resources, andquality of talent.
Bob Jeffrey
How we’re doing
Not only are these efforts innovative, but they arebased on world-class strategic thinking – what has alwaysbeen and will always be one of our points of differentiation.At JWT, we have always considered ourselvesanthropologists first, advertising people second. We believethat insights are the spark that ignites fresh thinking, thekey to opening up categories, and the fuel that drivesbusiness. Towards that end, we are dedicated to ensuring a regular supply of insights to energize business and drivenumbers across clients’ vital categories.
Unilever is a case in point. Last year, we commenceda qualitative study on 20-something singletons for Unilever’sSunsilk, which has taken us to every region of the world.The ongoing project, which is delving into an emergingpost-education, pre-marriage life stage of young women, ishelping to inform the client’s global strategy and business.
For Diamond Trading Company, we continued totap into such insights as women’s desire for reaffirmation oflove. So, last Christmas, we used an interactive, integratedcampaign to pose the question “What would you do forlove?”; the effort followed a man’s planes, trains andautomobiles adventure, as he did everything in his power to get home to his wife.
By now, we all understand that we have to think of TV or print or outdoor as one of many vehicles. Weunderstand the importance of putting the web, mobilephones, and other new unique media platforms on equalfooting with traditional modes of communication. That iswhy our CRM network, RMG Connect, which helps usand our clients reach elusive consumers in new andinteresting ways, is so vital.
Our global work for HSBC, which launched lastfall, is a prime example of such thinking. Some 1,000people from 22 JWT offices around the world took part inthe multimedia effort, which highlighted that HSBC is abank that values people’s different points of view. RMGplayed a hugely significant role in the campaign, the offlinepart of which drove thousands upon thousands of people to the website, yourpointofview.com, to engage further with the brand. RMG was responsible for the interactivecomponent, which helped to move HSBC from aninterruptive environment to a more interactive one.
Here’s where one of JWT’s biggest strengths liewhen it comes to our multinational clients: the diversity ofour multi-layered, multicultural network. Having openedour first international office in London in 1899, we helpedpioneer the ad network. Today, we are redefining thenetwork for the 21st century, developing a model forintelligence, efficiency, and effectiveness that can delivermulti-disciplinary, multi-office, cross-borders attention,strategic insights and creativity 24/7, 365 days a year.
Annual Report 2005How we’re doing34

How we’re doing
Annual Report 2005How we’re doing 35
Ann FudgeChairman and chief executive officer
Young & Rubicam Brands
Young & Rubicam Brands
n 2005, Young & Rubicam Brands turned in a solidperformance that reflected the strength of ourcollaborative, multidisciplinary model. We are wellorganized to help our client partners reach consumersacross the spectrum of communications channels andwell positioned to capitalize on the shifting trends in
the marketplace.Our Global Client Partner (GCP) structure
continued to deliver the best global resources and talent,the most appropriate communications channels and
disciplines. As a network of companies that span all thecommunications disciplines, we balance the individualexpertise of each of our brands with our collective objectiveto deliver the most powerful ideas that will drive businessresults. We have the mission, the processes andcommitment to work seamlessly together on behalf of ourclient partners.
Not surprisingly, most of our Global Client Partnersuse both Y&R and Wunderman. All but one work withBurson-Marsteller, Cohn & Wolfe or RLM, and more than60% of our GCPs engage Landor for branding and identitywork. Sudler & Hennessey is often asked to lend itsexpertise on healthcare concerns for consumer brands.Bravo and Kang & Lee help many of our client partnersreach targeted consumer segments. We made a majorinvestment in VML, a top-ranked digital company, which is working closely with many of our client partners acrossYoung & Rubicam Brands. And we continued to offertargeted resources from smaller agencies like the BannerCorporation and SicolaMartin that are also part of ourglobal network.
In 2005 we advanced our knowledge throughcontinued investments in our proprietary global brandmanagement tool, BrandAsset® Valuator.
We continued to develop our people through cross-company training programs like Virtuoso, which is helpingto build the next generation of leaders at Young &Rubicam Brands. This intensive workshop, taught by the top leaders across all of our companies, helps itsparticipants sharpen their individual skills to lead teamsacross disciplines and develop strong relationships withtheir client partners.
We continued to improve our operations, throughinitiatives like Lean Six Sigma that are making us moreproductive and flexible. Ultimately, the simplification thatcomes from this effort gets us to the real work of creatingideas for our client partners’ brands much faster.
As media and technology continue to converge, aspower and influence continue to shift to the consumer, therehas never been a stronger need to create ideas that willpenetrate the clutter and deliver results in the short andlong term. Here is how Young & Rubicam Brandscompanies shaped their businesses to do so.
Y&R
In 2005, we strengthened our global leadership, added keycreative talent and recommitted ourselves to delivering thebest creative ideas and work to our roster of client partners.
The most critical appointments in the year were inNorth America and Europe. Gord McLean was named CEOof North America and Massimo Costa was named CEO of

EMEA. Along with Chris Jaques in Asia, Eddie Gonzalezin Latin America, Hamish McLennan in Australia/NewZealand and Arun Nanda in India, we now have a strongglobal leadership team.
We focused equally on building our creative talentand product. With Michael Patti as global creativedirector, we strengthened our commitment to creatingoutstanding work all around the world. North Americaand Europe added key talent. Gary Goldsmith, one ofNorth America’s top creative stars joined as chief creativeofficer of New York, with a brief to work on regional andglobal client business, as well. Adrian Holmes, one of themost respected creatives in Europe, joined as the region’sexecutive creative director, a new post there.
At the end of the year, the global win of Bacardiaffirmed to us that our changes had traction and that weare on the right road to recasting ourselves as a stronger,more vital global network. With One Y&R working as a borderless, boundary-less agency, we delivered the besttalent and resources to each client partner. As a result,exciting new campaigns were created for Accenture,Chevron, Hilton Hotels, Land Rover, Lincoln Mercury,Miller Brewing Company, Pepperidge Farms, 7Up, Searsand Weight Watchers. With renewed momentum, 2006promises to be an even stronger year for North America.
In North America, we made some keyappointments that began to reshape the network after atough 2004. In addition to bringing Gary Goldsmith onboard, we named new managing partners – Paul Venn andRick Eiserman (in early 2006) – for our Detroit and Irvineagencies. Critical growth came from existing clients,evidenced most publicly in the consolidation of the entireSears advertising account with Y&R. New client partnersincluded Hilton Hotels, AMD, Ontario Tourism andSunTrust.
At Kang & Lee, which is part of the NorthAmerica network, new business growth was robust withlarge new wins like Harrah’s Entertainment and theconsolidation of existing business with client partners likeWestern Union. Ad Age ranked the agency as the No.1Asian American multicultural agency.
In the EMEA region, Y&R crowned an energeticand highly successful 2005 with a raft of account gainsaround the end of the year – including Volvic and Hitachiat a regional level and a major contribution to the globalwin of Bacardi. Y&R agencies across EMEA reported
more than 100 new clients during the year, and they were as diverse as they were many.
Shlomi Avnon, a partner in one of Y&R’s mostsuccessful agencies, Shalmor Avnon Amichay/Y&R Israel,was named vice-chairman of the region, and new leaderswere appointed for Y&R France and Y&R Poland.
Y&R Latin America delivered one of its bestperformances in 2005, driven by key markets Brazil, Mexicoand Chile, while Argentina rallied around a revitalized localeconomy. During 2005, significant wins included Telecom inColombia, Pfizer and UOL in Brazil, Bacardi and Sanfordregional business. Our largest local client in Brazil, CasasBahia, also continued to invest heavily.
Y&R in Asia had its most successful new businessperformance for many years, winning major newmultinational and local assignments. These included the winof Singapore Tourism Board’s global account, Tiger Beer forEurope, OCBC Bank in Singapore and Malaysia andUniversal Studios in Japan. In addition, we strengthened ourpartnership with current clients like Philip Morris, Measat,Cerebos and Ovaltine.
Y&R Singapore was voted Singapore’s Agency of the Year for 2005 and Y&R China was the most creativelyawarded China agency in the world in 2005. A newmanagement team for our offices in Greater China wasappointed to improve Y&R’s competitiveness there.
In Australia/New Zealand, where Young & Rubicamhas led the Top 10 Business Performance League rankings for three years, 2005 was the year in which Y&R focused onnegotiating and consolidating the biggest advertising andmarketing communications acquisition in Australian history.The merger of The Communications Group (TCG), home toicon agency George Patterson, was concluded to create thecountry’s largest and most diverse marketing services group.
We also successfully merged The CampaignPalace/Red Cell, which set the stage for their stellarperformance, winning Hutchinson 3 and Origin Energy. OurNew Zealand office also dominated their market, picking upTelecom NZ, Bank of New Zealand and Tower Insurance.
Finally, our agencies in India continued theirtremendous growth, with business coming both fromregional client partners and global client partners like Xerox.The agency continued to be a beacon of creativity, winningnumerous awards, including agency of the year in Bangalore.
With the individual strength of our regions and thecollective strength of our global network, we are confidentthat we are positioned for greater growth in 2006.
Ann Fudge
How we’re doing
Annual Report 2005How we’re doing36
Young & Rubicam Brands

How we’re doing
Annual Report 2005How we’re doing 37
Wunderman
Explosive growth in mobile technologies, CRM relating toe-mail databases, interactive TV, podcasting, blogs, viralmarketing and gaming was the hallmark of 2005. Digitalwork now accounts for more than one-third of Wundermanbusiness worldwide. Large global clients openly embracedigital solutions because they understand future success liesin both current and uncharted digital territory.
The power of Wunderman’s global marketingservices network is evidenced by the continuing expansionof Microsoft, our largest digital client. Mid-year, the agency opened doors to the ‘global hub’ in Seattle. The hub guarantees high service standards and streamlinesknowledge sharing across borders and disciplines. As of this writing, Microsoft work spans 29 countries.
To broaden our digital offering, Wundermanworked closely with digital powerhouse VML. Wundermanalso recruited top digital talent, including renowned digitalcreative director Jon Williams in Europe, and onlinemarketing expert Tina Miletich in New York.
On the data front, KnowledgeBase Marketing,Wunderman’s data services arm, strengthened its ability togrow marketing services through analytics and reporting. It acquired Fortelligent, specialists in next-generationanalytical and modeling solutions. The acquisition andstrong delivery of traditional data services ledKnowledgeBase Marketing to its best performance sincejoining Wunderman in 2001. Mid-year, Wunderman hiredAndrew Rutberg as the agency’s first chief data officer,responsible for building a global data strategy that turnsdata into knowledge for our largest global clients, includingMicrosoft.
New creative talent in every region continued toinfuse our teams with fresh ideas. Wunderman was namedAgency of the Year in Spain and Mexico. Germany movedup 10 spots to No.4 in country-specific rankings.
Wunderman was recognized with more than 434awards and citations all over the world, including runner-up Agency of the Year at the International Cannes LionsAdvertising Festival.
Growth remains a priority. Wunderman captured382 additional assignments from existing and new clientsthat span the globe, including the Royal Canadian Mint’s2010 Olympic sponsorship and a pan-Latin AmericanAgency-of-Record win from Diageo. In healthcare, businessfrom Abbott, AstraZeneca, Berlex, Forrest, Glaxo SmithKlineBeecham and Pfizer grew substantially. In addition tosignificant Microsoft expansion in IT and electronics,Nokia in Latin America, Hewlett-Packard in New York and TESSCO in Washington, DC were added to the client roster.
Wunderman amassed strong credentials in traveland leisure. Deutsche Lufthansa AG and Turkish TourismBoard named Wunderman Global Agency of Record. Wins from Aeropublica, Callaway, Jet Airways, Hotels.comand Hilton Hotels, and new projects from Star Allianceround out this sector experience. The agency’s strong postalexperience led to new business from Deutsche Poste,Canada Poste, DHL Global Mail and Poste Italiane.
Daniel MorelChairman and chief executive officer
Wunderman
Burson-Marsteller
2005, my first year as worldwide chief executive officer, wasa year of transition for Burson-Marsteller, but it was also ayear of exciting new opportunities and accomplishments forthe firm, our client partners and employees.
Burson-Marsteller’s strengths remain firmly rootedin our client relationships, the quality of our employees andour commitment to thought leadership. Among the year’snew business wins were US Patent and Trademark Office,Ferrero, Merck, UICI, Symbian, Wrigley, Innovene, BacardiLimited, Sun-maid Growers, Novartis, Football Federationof Australia and Auto-Suisse.
Burson-Marsteller was as successful expanding ourlong-standing client relationships. Global, regional and localexpertise, coupled with an all-encompassing worldwidenetwork, fueled growth in relationships with key clientpartners in every corner of the world. These client partnersinclude The Coca-Cola Company, HP, Dow Chemical, Visa International, Transitions Optical, Merrill Lynch,QUALCOMM, Activision, McDonald’s, Barilla, Colgate,Hormel, LG Electronics, Celestial Seasonings, Pfizer, CDWCorporation, IKEA, Kimberly-Clark and Heinz.
Asia-Pacific, the firm’s fastest-growing region, andLatin America both saw impressive double-digit growth,with the China market growing by more than 40%.Marsteller, Burson-Marsteller’s advertising, design,interactive and production company, benefited from stronggrowth in its Interactive and Design Divisions. BKSH &Associates, Burson-Marsteller’s global government relationsfirm, saw burgeoning demand for its strategic governmentrelations and advocacy expertise.
2005 was also a year of continued partnership withYoung & Rubicam Brands and WPP colleagues. The U.S.Department of the Treasury’s Bureau of Engraving andPrinting, Lincoln Mercury, The City of Madrid, and theMexico Tourism Board were among the clients that benefitedfrom the expertise and creativity of integrated teamwork.

To further strengthen our capabilities in the Asia-Pacific region, Burson-Marsteller acquired Genesis, one of India’s most respected public relations companies. Theacquisition extended the firm’s representation across morethan 80 cities throughout India, a market that is globallysignificant and critical to clients.
Furthering our commitment to aligning clients’ ever-changing communications needs, we launched aGlobal Financial Communications Practice and ExecutivePositioning Specialty Group. We also entered into apartnership with Intelliseek, BzzAgents, Converseon andOddcast to form the User Generated Media Alliance. Wemaintained our strategic investment in thought leadershipand launched the fifth wave of our CEO and corporatereputation research.
Performance at industry award competitions ranksamong Burson-Marsteller’s finest accomplishments in 2005.More than 125 global, regional and local awards were wonaround the world. Among our proudest achievements wasthe No.1 ranking in client satisfaction in the US PRWeekAgency Excellence Survey.
Chief among Burson-Marsteller’s priorities in 2006are further integration with Young & Rubicam Brands andWPP companies, and expansion of the digital spectrum foremployees and clients.
Mark PennWorldwide chief executive officer
Burson-Marsteller
Landor Associates
2005 was a record-breaking year for Landor. Driven by our commitment to achieving brand-led businesstransformation for our clients, Landor set many newmilestones, producing our highest revenue and profits todate with strong performances across all regions.
A critical and consistent element of our success isour depth of talent at every level. In 2005, several seniorexecutives were promoted to fill key roles and drive manyof Landor’s expanded offerings. Craig Branigan and RobHorjus were promoted to chairman and CEO and CFO,respectively, of the newly formed WPP branding and designentity, B to D Group, a network that includes Landor.I was promoted to president of Landor, Worldwide; MarkKennedy was promoted to chief strategy officer; PeterKnapp was promoted to executive creative director, Europeand the Middle East; and Kenny Holmes was promoted toexecutive director, Brand Experience.
Additionally, with the aim of expanding Landor’sfootprint around the world, on-the-ground resources wereestablished in Richmond, Virginia and Kobe, Japan, whilethe win of high-profile assignments in Russia and Indiaincreased our visibility in those key markets.
Landor’s 2005 success was both a result of newclients won and the continued strength of our Key ClientRelationships (KCRs) around the world. Notable clientadditions include: Citigroup, Hitachi, Bristol-Myers Squibb,Sudatel, LG, FIFA, China Construction Bank, Ingersoll-Rand and Speedo. KCRs that turned in strongperformances in 2005 include P&G, PepsiCo, Diageo, BP, Numico and Telefonica.
An emphasis on enhancing client offerings alsopaved the way for the year of growth. Our worldwidedisciplines of Brand Engagement, Brand Experience,Innovation, Digital Branding, Naming and Airlines were allinvigorated in 2005. Strengthened operations led to a full-scale positioning and Brand Engagement program with theNational Football League, the creation of a total BrandExperience for the Burj Dubai in the United Arab Emirates,among others.
In recognition of the quality of work in 2005,Landor received several prestigious awards including:Agency of the Year from Marketing magazine, as well asPackaging Agency of the Year from the Grocery Advertisingand Marketing Industry Awards, and the A.G. LafleyDesign Award from the P&G Brand Building Awards forour work on the Febreze brand.
There were also notable first-time accomplishments.Our clients’ concerns for accountability and return oninvestment motivated us to conduct the first ever BreakawayBrands Study, which was published in Fortune magazine’s
How we’re doing
Annual Report 2005How we’re doing38
Young & Rubicam Brands
How we’re doing
Annual Report 2005How we’re doing 39
31 October 2005 issue. Working with BrandEconomics andusing Young & Rubicam Brands’ BrandAsset® Valuator todevelop the list of brands, the study is the first to explicitlylink brand health to shareholder wealth. The results of thisstudy exceeded expectation. The study was picked up inmarkets all over the world and garnered interest from manyprospective clients.
We are committed to continuing to grow and enhanceour company with an eye towards shattering our recordsagain next year.
Charlie WrenchPresident
Landor Associates
Sudler & Hennessey
Sudler & Hennessey had another great year in 2005,adding new clients in all major regions of the world andcontinuing its strong revenue and profit growth, especiallyin North America and the Asia-Pacific region. S&Hcontinues to be included in a significant number of agencyselection searches, which this past year resulted in businessfrom new clients such as Allergan, Monogram Biosciences,Ortho-McNeil and BMS.
Particularly rewarding is the growth that resultedfrom new assignments from some of our current clients,including new brands assigned to us by Schering AG/Berlex,Roche, Abbott, Pfizer, Amgen, Boehringer Ingelheim, andForest. Several of our new assignments were awarded to usbecause clients have recognized the strength of the S&Hglobal network. In fact, one of the biggest accomplishmentsfor Sudler & Hennessey in 2005 was the recognition by itspeer agencies with the Best Global Agency Network awardfrom Medical Advertising News.
In addition to the MANNY Award, the agency’smany offices around the world were also recognized fortheir creative excellence, with numerous awards from theRx Club, the Globals, the MM&M Awards, PMT Reader’sChoice Awards, National Pubblicio Awards, the ComprixAwards, the Targa d’Oro Awards, the Freccia d’OroAwards, and the HAAG Awards.
S&H’s New York office added the new position ofbrand catalyst to its talent pool – hiring 20-year veteranKathy Jenkins in this ground-breaking role to stimulatenew, better, and bigger ideas from across all disciplines. We also appointed Rob Rogers (currently president of our Asia-Pacific region) to serve in the new role of chiefcreative officer for the U.S. Rob will bring seasoned insights and, partnering with global creative director
Bruno Stucchi, ensure an ongoing global creative dialoguewithin the S&H network.
In 2005, we expanded operations in Europe, Africaand Asia. In Europe, after years of working with an alliancepartner in Spain, S&H established its own office in Barcelona.In Africa, S&H is opening up an operations unit inJohannesburg, South Africa. And in India, S&H expandedits reach both promotionally as well as digitally, with a newS&H office in Bangalore and a new Avenue-e office inMumbai, spearheaded by Anthony Manson, managingdirector of Avenue-e in New York.
Jed BeitlerChairman and chief executive officer
Sudler & Hennessey
The Bravo Group
In 2005 Bravo celebrated its twenty-fifth anniversary. Three touchstones in its DNA are the real reason forcelebration: reaching for a higher standard, thoughtleadership and continual evolution. Today The BravoGroup is refreshing its focus on these objectives in responseto the dynamic evolution in our marketplace. To addressthese market changes, we heightened our focus onplanning, with the addition of Graham Hall.
In 2005, Bravo elevated our experiential marketingdisciplines to business unit status. These include, BravoRPM, retail marketing and promotions and Bravo Uno-A-Uno, the agency’s one-to-one marketing practice coveringdirect marketing, CRM, digital/interactive and brandedentertainment.
Bravo’s new clients included Microsoft,AstraZeneca, Pfizer Consumer Healthcare, Liberty Mutualand Cingular, for whom notable creative work includedlaunching the world’s first iTunes cellphone in the Hispanicmarket.
The agency’s media group won best media planusing OOH for Banco Popular, an award issued by theAssociation of Hispanic Advertising Agencies(AHAA).
2005 saw the merger of Mendoza Dillon and Mosaicainto MosaicaMD, headquartered in New York and focusedon Hispanic and multicultural marketing. 2006 will continueto drive growth in the expanding Hispanic market.
Gary BassellChairman and chief executive officer
The Bravo Group

Cohn & Wolfe
Cohn & Wolfe outperformed the market again in 2005with our third year of significant growth on the top andbottom line and record-breaking financial results for thecompany. Cohn & Wolfe is known for its brand-buildingexpertise and works for some of the best known brands inthe world. In 2005, the company added significant clientsto its roster including Ford, Weight Watchers, Air NewZealand, Michelin, Panasonic, Deloitte Consulting andProcter & Gamble.
Known as a ‘big-tique’ that delivers powerful ideasand resources with speed and efficiency, Cohn & Wolfe is entering the Asian market in 2006 with its first office in Shanghai. Driven by global client demands for service in China, the move will be the agency’s first geographicalexpansion beyond Europe and North America.
The company has initiated a New Media Practice toensure we maintain our reputable creative edge and meetthe growing need for viral and guerilla marketing for clientbrands. This initiative complements the agency’s drive forinnovation through creative training, awards programs anda culture of entrepreneurialism.
The key to Cohn & Wolfe’s success is in its people,who believe in and protect the agency’s strong culture ofaccountability, excellence and fun. Cohn & Wolfe rankedNo.1 in employee morale in the 2005 Holmes ReportEmployee Satisfaction Survey.
Donna ImperatoPresident and chief executive officer
Cohn & Wolfe
How we’re doing
Annual Report 2005How we’re doing40
Young & Rubicam Brands
Robinson Lerer & Montgomery
Robinson Lerer & Montgomery, a New York-basedstrategic communications firm, turned in excellent financialresults. The firm provides senior management of US- andoverseas-based corporations with a broad range ofcommunications support for financial transactions, crisismanagement, regulatory and governance issues, publicpolicy campaigns and strategic marketing programs.
RLM’s work involves many of the most prominentassignments and issues in the corporate world. In 2005, the firm served a roster of continuing clients while alsoexpanding its base with a number of new clients.
Linda RobinsonChairman
Robinson Lerer & Montgomery
BrandBuzz
2005 saw a continuation of BrandBuzz’s significant expansionand success, as clients continued to respond to the agency’schannel-neutral, business objectives. An impressive newbusiness win streak saw BrandBuzz winning ‘six of six’with the consolidation of LG Electronics, Green MountainCoffee Roasters, Nets Basketball & Entertainment, Burt’sBees, Dymo Label Writers and Tamiflu. BrandBuzz is alsoplaying a key role on the Young & Rubicam Brands’Microsoft team, leading all viral efforts for MSN.
Long-term BrandBuzz clients saw a year of award-winning and effective work, with LG winning an EFFIE for mobile phones in the highly competitive consumerelectronics category.
At the start of 2006, I was appointed president andthe new leadership team of Christian Barnett, executivedirector of planning; Frank Cavazzini, CFO; Jen Kohl,COO; Kara O’Neill, general manager; and Graham Turner,executive creative director and I secured another newbusiness win with the consolidation of six Sanford brands,including Expo and Sharpie, under BrandBuzz.
Mike ReesePresident
BrandBuzz

How we’re doing
Annual Report 2005How we’re doing 41
e recently completed a major milestone in the evolution of Grey Global Group: our first year as an important and dynamicmember of WPP. 2005 was remarkable intwo ways. First, we remained steadfast in our commitment to our clients’ success, anethic deeply rooted in the culture of Grey, that
resulted in our company’s success. Second, we set out to shapeGrey’s future with bold initiatives designed to energize theleadership of our company, sharpen our competitive edge inintegrated communications and recommit ourselves tosuperlative creativity as our reason for being. No transition isseamless but our performance last year dramatically under-scored the promise and potential of the Grey merger with WPP.
Grey Worldwide
Grey Worldwide once again ranked among the top tier ofglobal advertising agencies in revenue thanks to the strengthand success of our network in 90 countries. Our blue-chipclient roster counts one-fifth of all Fortune 500 companies.
The bedrock of Grey is our enduring relationships withhigh value, high potential global clients. Last year, we grewthe number of clients we serve in multiple countries, multipledisciplines and the number of global brands we handle. The agency’s vitality was evident in the new assignments wereceived from Procter & Gamble, GlaxoSmithKline, BAT,Novartis, Diageo, Nokia and Volkswagen around the world.
New business is the lifeblood of a growth companyand Grey was proud to win such prestigious clients as LehmanBrothers, Manpower, Land’s End, Max Factor, Symantec,Major League Baseball, Citigroup’s Primerica and SouthernCompany in the US. Internationally, we won Deutsche Bankand Ikea in Europe; Pfizer and Rayovac in South America;and AXA, China Merchant’s Bank and the launch of the newPassat in Asia-Pacific. We are off to a good start in 2006with such wins as SanDisk, Darden Restaurants’ SmokeyBones Grill, Hasbro’s adult games, Diageo’s Tanqueray Tenin the US; Morgan Stanley in the UK; and China Mobile.
In September, my appointment was announced aschairman and CEO of Grey Worldwide.
Recently, we convened an extraordinary meeting ofGrey executives from 35 countries around the world tochart the future of our company. I laid out a clear blueprintfor the “new” Grey, an integrated global network with aunique positioning and creative point of view, designed toaccelerate our momentum by capitalizing on ourconsiderable strengths in every discipline and channel.
During the year, we sent a clear signal that Grey iscommitted to reclaiming our historic pre-eminence inthought leadership and delivering a best-in-class creativeproduct with the appointment of superb talent in everyregion. Nat Puccio and Suresh Nair, two of the industry’sfinest leaders in consumer insights, were appointed as globalco-directors of strategic planning.
They joined many outstanding creative leaders whohave been given new or expanded roles at Grey includingTim Mellors in North America, Dave Alberts in London,Frank Dopheide in Germany, Todd McCracken in Asia-Pacific, Miyagawa Kanji in Japan, Pablo Gil and SebastianGarin in Argentina and Silvio Matos in Brazil. In addition,we have made improvement in creative quality andrecognition a key benchmark for the achievement ofincentive compensation.
We have begun to see the positive impact of this newcreative leadership across the globe. The AOL/discusscampaign, promoting a provocative dialogue on the merits
Grey Global Group
Ed MeyerChairman and chief executive officer
Grey Global Group

How we’re doing
Annual Report 2005How we’re doing42
of the internet, has received press acclaim across the UKand generated sales success. Kmart’s fresh, funny televisionhas broken new ground in retail advertising in the US.Panasonic’s “Life is…” work, mini-cinematic masterpieces,has changed the look and feel of consumer electronicsmarketing, to name a few recent successes.
Perception often lags reality in the shaping of acreative reputation and so we have redoubled our efforts toimprove Grey’s showing in awards. Grey EMEA wasnamed Agency of the Year at the 2005 European Effies andGrey New York recently swept the Addys winning 22Golds, 11 Silvers and Best of Show for its quirky, humantake on cell phones in a campaign for Nokia.
Jim HeekinChairman and chief executive officer
Grey Worldwide
G2
Years ago, Fortune magazine called Grey a “superagency”for its ownership of premier resources, across the totalspectrum of marketing channels, available under one roof.While other agencies talked “holistic,” we walked the walkand built an array of strong, integrated marketing companieson the leading edge of their disciplines. We anticipated themarketing landscape then and, once again, we are positioningGrey for leadership in the new communications environmenttransforming our business.
Recently, we announced that all of the specializedmarketing communications services grouped under GreySynchronized Partners will be unified under a single globalbrand called G2. The companies within this global businessunit will be rebranded: G2 Branding & Design (formerlyG2); G2 Interactive (formerly Grey Interactive); G2 Direct& Digital (formerly Grey Direct) and G2 PromotionalMarketing (formerly J. Brown Agency) and comprise aglobal network across 42 countries.
We have designed the G2 brand to becomesynonymous with leadership thinking and creativity in theworld of marketing communications, the fastest growthsector in our industry, and one evolving at warp speed.
As the silos come down, G2’s mission is not merelyto deliver the first true total offer in its space; its mission is to deliver the first true total integrated offer, working inclose partnership with Grey Worldwide.
Together, G2 and Grey Worldwide will offer deepspecialist expertise and integrated brand communications.We will be more agile, more responsive, and better ableto optimize client brand communications in a relevant,targeted and measurable way. Most importantly, we will
provide the breakthrough creative ideas that resonateacross all marketing channels clients are demanding.
Joe CeliaChairman and chief executive officer
G2
Grey Healthcare Group
Grey Healthcare Group, one of the world’s top five healthcaremarketing agencies, remained one of our fastest-growingcompanies in 2005. The agency’s expanding client rosternow includes Allergan, AstraZeneca, Aventis, BoehringerIngelheim, Eli Lilly, GlaxoSmithKline, Johnson & Johnson,Merck, Novartis, Pfizer, Procter & Gamble and Wyeth.
Grey Healthcare Group was honored for creating the2005 Best Professional Advertisement and nominated as 2005Agency of the Year, Most Admired Agency and Best GlobalNetwork by Med Ad News, one of the industry’s top publications.In addition, I was honored to be named 2005 Woman of theYear by the Healthcare Businesswomen’s Association.
Lynn O’Connor VosChief executive officer
Grey Healthcare Group
GCI
GCI Group, our global public relations company, also postedstrong growth. The agency added such premier clients asGenentech, Cephalon, Listerine, Whole Foods, Sony PicturesHome Entertainment and Paramount. GCI continued toexpand its consumer and technology practices as well as itsglobal reach, consolidating its offer with Cohn & Wolfe.
Jeff HuntChief executive officer
GCI
In conclusion
There is a saying that “real change demands real change.” 2005was a year of significant change at Grey and yet we stayed trueto our heritage of growing leading brands for our clients andbuilding their bottom lines. This marks my fiftieth year at Greyand the imagination, passion and creativity of our peoplecontinue to inspire me. I truly believe Grey’s best days lie ahead.
Ed Meyer

How we’re doing
Annual Report 2005How we’re doing 43
Light review against Fallon and other first-rate creativecompetition.
In the fall, Red Cell Network split in two parts, withnine of the former Red Cell offices forming the VoluntarilyUnited Group of Creative Agencies.
The group now includes Senora Rushmore United,Madrid; Berlin Cameron United, New York; Cole & WeberUnited, Seattle; WM United, Buenos Aires; United London;1861 United, Milan; LDV United, Antwerp; BTS United,Oslo; and Les Ouvriers du Paradis United, Paris.
Late in the year, the United Group was hiredinternationally in a test program by Procter & Gamble’sGeneva-based Fragrances Division. The group was alsoassigned a series of designer brands from Escada and MontBlanc.
Señora Rushmore United was distinguished asSpain’s Agency of the Year for 2005 by Anuncios, theSpanish advertising journal. WM United, although in itsfirst start-up year, was a finalist for similar Agency of theYear distinction in Buenos Aires.
Important wins for 2005 include Heineken PremiumLight, The Wall Street Journal, Nestlé-Purina Busybone,Hearst’s Marie Claire (New York), Sprite, Aquarius,Nestea-Portugal, ING Direct and Mahou beer (Madrid),Sony (Antwerp and Milan), Microsoft (Seattle), Infonxx(Milan), Credit du Nord (Paris), Argentinian WineProducers, Coca-Cola Juices and a project on Coca-Colafor mothers (Buenos Aires), Brussels Airport (Antwerp),Hero (London), Fokus Bank (Oslo), and Dell (Seattle).
2005 was a year of reorganisation for the Batey/RedCell Group in Asia. Early in the year a decision was madeto focus on the Batey/Red Cell agencies in the key marketsof Singapore and Taiwan. At the same time, other networkagencies were restructured and many of them achievedcritical mass by being merged with other WPP companies inthe region. During the year, Batey/Red Cell strengthened itsglobal relationship with Singapore Airlines and producedaward-winning work for DaimlerChrysler Mercedes-Benz.The appointment of executive creative director PabloMonzon further underlined the agency’s commitment toproducing creative solutions ‘from Asia for the world’.
Andy Berlin
The Voluntarily United Groupof Creative Agencies
Andy BerlinChairman and chief executive officer
The Voluntarily United Group of Creative Agencies
005 was a year of massive changes for WPP’sRed Cell Network.
After enjoying sudden fame with thewin of Coca-Cola USA, Berlin Cameron RedCell experienced losses of Coke USA and,subsequently, the international creative
advertising assignment it shared with sister agency JWT forSamsung. The agency undertook deep cuts, restructuredmanagement, stabilized core businesses, remained profitableand by year’s end won a hotly-contested Heineken Premium

How we’re doing
Annual Report 2005How we’re doing44
he rapid economic change that is driving Asiamanifests itself in social, political and evencultural shifts. It dramatically affects howpeople view their roles, their relationships, theirfuture and their fears and even how they viewbrands. We call these shifts ChangePoints.
To identify these ChangePoints, we commissionedextensive consumer studies in China amongst the 30-year-old affluent class, delved into the changing role ofconvenience shopping in Japan and conducted high-levelchange forums in India. We deployed these ChangePointinsights in our new business pursuits, and as a result hadmajor wins including Remy Cointreau in China, Marico and Yamaha Motorcycles in India, Honda in Malaysia andVietnam. We captured the prestigious Malaysia F1 Grand
Prix and extended our Mobi-Phone relationship to coverboth Cambodia and Vietnam.
We took our ChangePoint thinking into a 141Worldwide regional activation pitch on Nokia SoccerSponsorship. The positive shift of confidence and prideamongst Asian youths led to development of the “DefendYour Turf” concept, where Asian youth teams arechallenged by Brazilian street soccer players. The campaignis running across Asian markets including Singapore,Malaysia, India and Australia.
But BatesAsia does not just preach change. We live change.
In 2005 we launched a network-wide initiative toimprove the creative product and to make the Bates brandfamous. Our “One” program involves each creative personin the region being challenged to deliver one great idea eachquarter, with a goal of at least one great campaign from all12 BatesAsia offices every year.
In just two quarters of focus, BatesAsia has won oneBest in Show at the Times Asia Pacific Award (for Levi’s)and three Golds at AdFest (for Nokia). BatesAsia is puttingcreativity back in the heart of the agency.
2005 was also a landmark year for the marketingservices divisions of the BatesAsia Group. 141 Worldwidereceived strong support from Ogilvy to redefine and re-launch a new focused positioning and consistent offeringacross Asia. The launch of 141 Worldwide in Jakarta, Delhiand Bombay, plus the inclusion of TeamMate in Taiwanadded to the network of over 500 staff in 12 countries. In the process, new relationships were developed with keyclients such as Unilever in Japan, Indonesia, Vietnam,Taiwan and China as well as with Nokia, Visa, Gillette,Diageo, Nestlé and Coca-Cola.
141 Worldwide also became the most awardednetwork in the Promotional Marketing Awards of Asia andhelped transform the image of activation in Asia. Thisculminated in 141 Worldwide winning first runner-up Oneto One Agency in the prestigious Media’s Asian Agency ofthe Year Award.
XM Asia, the group’s interactive agency, formed apartnership to become part of RMG Asia. This partnershipconnects XM with one of the world’s leading relationshipagency networks and at the same time completes RMG’sextensive network in Asia. A very strong move.
The changes that we implemented in 2005strengthened our combined offering for clients and positionsus perfectly for Asia: the fastest-changing region on the planet.
Jeffrey Yu
BatesAsia
Jeffrey YuPresidentBatesAsia
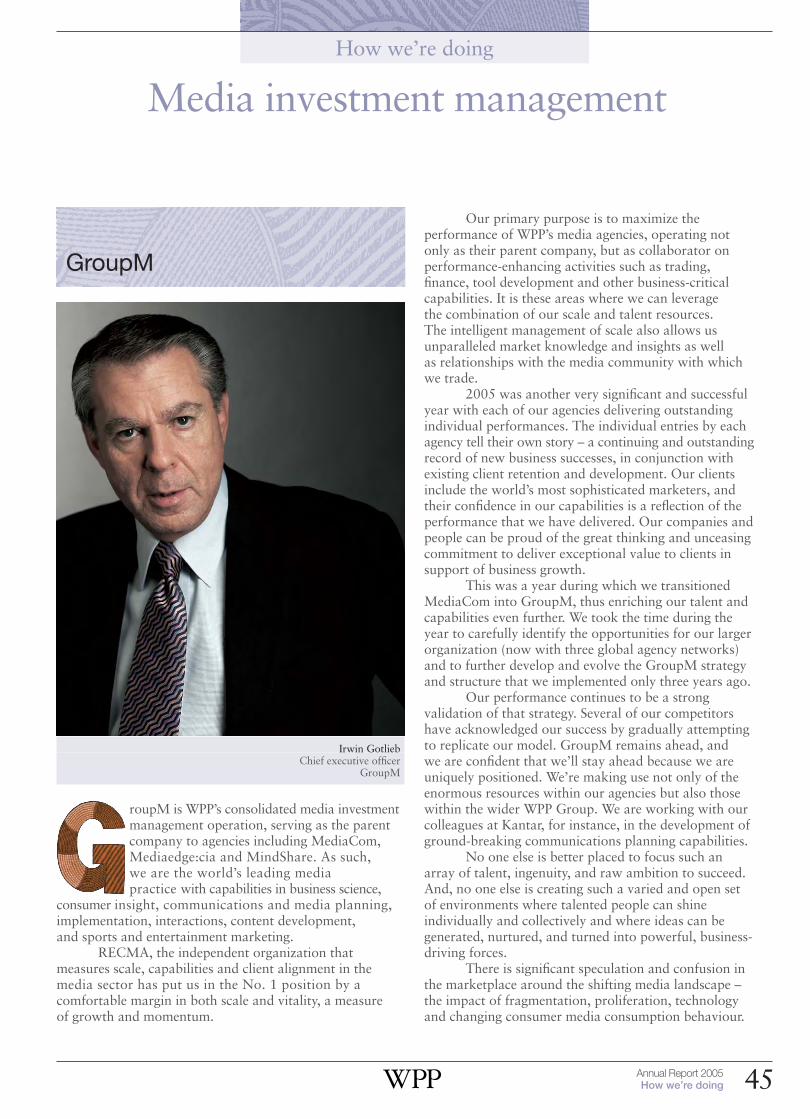
How we’re doing
Annual Report 2005How we’re doing 45
GroupM
Media investment management
roupM is WPP’s consolidated media investmentmanagement operation, serving as the parentcompany to agencies including MediaCom,Mediaedge:cia and MindShare. As such, we are the world’s leading media practice with capabilities in business science,
consumer insight, communications and media planning,implementation, interactions, content development, and sports and entertainment marketing.
RECMA, the independent organization thatmeasures scale, capabilities and client alignment in themedia sector has put us in the No. 1 position by acomfortable margin in both scale and vitality, a measure of growth and momentum.
Irwin GotliebChief executive officer
GroupM
Our primary purpose is to maximize theperformance of WPP’s media agencies, operating notonly as their parent company, but as collaborator onperformance-enhancing activities such as trading,finance, tool development and other business-criticalcapabilities. It is these areas where we can leverage the combination of our scale and talent resources. The intelligent management of scale also allows usunparalleled market knowledge and insights as well as relationships with the media community with whichwe trade.
2005 was another very significant and successfulyear with each of our agencies delivering outstandingindividual performances. The individual entries by eachagency tell their own story – a continuing and outstandingrecord of new business successes, in conjunction withexisting client retention and development. Our clientsinclude the world’s most sophisticated marketers, andtheir confidence in our capabilities is a reflection of theperformance that we have delivered. Our companies andpeople can be proud of the great thinking and unceasingcommitment to deliver exceptional value to clients insupport of business growth.
This was a year during which we transitionedMediaCom into GroupM, thus enriching our talent andcapabilities even further. We took the time during theyear to carefully identify the opportunities for our largerorganization (now with three global agency networks)and to further develop and evolve the GroupM strategyand structure that we implemented only three years ago.
Our performance continues to be a strongvalidation of that strategy. Several of our competitorshave acknowledged our success by gradually attemptingto replicate our model. GroupM remains ahead, and we are confident that we’ll stay ahead because we areuniquely positioned. We’re making use not only of theenormous resources within our agencies but also thosewithin the wider WPP Group. We are working with ourcolleagues at Kantar, for instance, in the development ofground-breaking communications planning capabilities.
No one else is better placed to focus such an array of talent, ingenuity, and raw ambition to succeed.And, no one else is creating such a varied and open set of environments where talented people can shineindividually and collectively and where ideas can begenerated, nurtured, and turned into powerful, business-driving forces.
There is significant speculation and confusion inthe marketplace around the shifting media landscape –the impact of fragmentation, proliferation, technologyand changing consumer media consumption behaviour.

How we’re doing
Annual Report 2005How we’re doing46 Annual Report 2005How we’re doing
MediaCom
Alexander Schmidt-VogelChairman and chief executive officer
MediaCom
005 was a watershed year for MediaCom. Not only was 2005 our best year ever for newbusiness wins and total billings, it was also the most important year yet for our futuredevelopment: 2005 marked MediaCom’s entryinto the WPP and GroupM families. Within the
context of our new family, significant steps and investmentswere made to propel us strongly into the future.
GroupM is fast emerging as an industry shaper, asan assertive influence on the future of how our clients,media, and consumers relate, interact, and evolve. Givenour strong position in the market, we cannot simply try topredict the future. Instead, we must be in a position toparticipate in shaping and influencing that future and hownew value gets created and growth stimulated for thebenefit of our clients as well as our agencies.
Irwin Gotlieb

How we’re doing
Annual Report 2005How we’re doing 47
MediaCom was very successful in substantiallygrowing and developing our core global client relationshipsover the past year. We continued to roll out coreinternational client accounts to key local markets, withclients such as VW/Audi choosing MediaCom in the USand Turkey; P&G and Gillette appointing us for newassignments in many markets throughout the world; TimeWarner tasking us with their AOR account in France. In addition, MediaCom was successful in obtaining globaland regional accounts from prestigious clients such asIKEA, Shell and Nikon.
But it wasn’t just new business wins that madeheadlines for MediaCom in 2005. MediaCom prides itselfon being a true business partner for our clients, and thecontinuing growth of MediaCom’s client billings attests tothis strong partnership. RECMA, the independent researchcompany which ranks and rates the media agencylandscape, noted MediaCom’s growth in 2005. RECMA’sBillings Report ranked MediaCom the second-fastestgrowing agency worldwide and fastest growing agency inthe US in 2005. In addition, according to RECMA’s 2005Vitality Report, MediaCom had the fastest-growing vitalityrating versus all other media agencies worldwide.
As a part of the WPP family, MediaCom in 2005was able – for the first time in our almost 20 year history –to work together with sister media agencies. As part ofGroupM, we began in 2005 to develop synergies in allrelevant professional areas. As GroupM continues toconsolidate and grow, we expect these synergies to grow as well, and become even more significant decision-makingfactors for our clients in the near future.
With the backing of WPP and GroupM, weintensified the completion of MediaCom as a truly globalnetwork. By establishing substantial MediaCom officesacross Asia Pacific during the last year, key countries suchas Australia and China were boosted up to strong positionsin their respective countries, and became real players in themedia market.
A crucial cornerstone for MediaCom’s future successwas laid in 2005, with the launch of MediaCom’s newArchitecture. The Architecture, comprised of seven stepswhich combine all of MediaCom’s professional areas intoone clearly defined process, takes MediaCom’s planningand implementation competency to new heights. Whereassome agencies are still focusing only on communicationplanning and implementation, MediaCom’s Architecturefocuses on both communication and business optimization.We place our clients’ core business issues – not media issues– at the fore of their planning, and go beyond “awarenessonly” planning solutions with the unique BrandBuilderAccess tool.
To support the Architecture, we made specialinvestments across all service areas throughout the entirenetwork. This included a significant build-up of global andregional key personnel, ground-breaking new researchcapacities, software development and global roll-out, andintense training for all levels of MediaCom people. Weinvested heavily in areas such as research, business scienceanalytics/optimization, and mobile marketing – areas whichwe believe are keystones to our future development.
MediaCom’s watershed year did not go unnoticedby the industry. In addition to the significant new businesswins and billings growth, MediaCom proved the quality ofits work in 2005 as well, in both quality and quantity ofindustry awards. In addition to winning the top prize in theindustry, the Cannes Media Lion Grand Prix, MediaCom wasthe fastest mover in the Gunn Report for Media, and toppedCream magazine’s Creativity Index throughout the year.
The first three months of 2006 demonstrate thatMediaCom’s extremely positive growth continues. The firststep to an even more successful 2006: winning the regionalNokia account in Asia Pacific. This was a strategicallycrucial win for MediaCom, and not only affirms ourcurrent strategy, but also gives us a clear perspective on ourfurther positive development. We’ll keep moving forward.
Alexander Schmidt-Vogel

How we’re doing
Mediaedge:cia
Annual Report 2005How we’re doing48
n 2004, we described our performance as ‘sheermomentum’. 2005 saw us build successfully on thatmomentum and Mediaedge:cia (MEC) grew again bothin absolute size as well as in the breadth and depth ofcapabilities. MEC is now four years old and we’veclearly ‘hit our stride’ with great confidence running
throughout the agency.This confidence stems from our ability to define the
changes taking place in our market, to adapt our businessaccordingly and so stay one step ahead of the competition.We believe that marketing is entering a major new stage.We call it Active Engagement. The empowered consumercontinues to re-define the media, entertainment and contentmarketplace and the consumer’s ability and appetite tocontrol this space continues to challenge. Interrupting andgrabbing the attention of consumers is increasingly difficultand clients now need to find ways to participate in media.
MEC’s role is to get consumers actively engagedwith our clients’ brands. That is the future of how we haveto deliver and that’s why the investment in the diversificationof our business continues and is increasingly where ourgrowth is coming from.
In addition to our media planning andimplementation capability, we’ve established and aregrowing our operations in interaction (digital, direct &search), entertainment marketing, sports, sponsorship and event marketing, cause-related marketing, contentdevelopment, ROI and consumer insights, and we are now developing a retail marketing practice.
We’ll continue to diversify and integrate thisexpertise and apply it to our clients’ business: engagingconsumers across an ever-increasing number ofcommunication channels.
With these new capabilities has come new talent andskills into the agency, and talent management – includingtraining and development – remains a key priority. The rangeof our business is now so wide that opportunities for peoplewith ideas and creativity are endless.
Charles CourtierExecutive chairman
Mediaedge:cia

How we’re doing
Annual Report 2005How we’re doing 49
We continue to run our MEC Navigator Academy, a major professional training program that ensures weintegrate and deliver the best of MEC to all our clients allaround the world.
The clearest sign of vitality is our ability to growwith our existing client base and to win new business. 2005 saw major regional and global wins from new clientssuch as IKEA, Paramount Pictures, Michelin, CingularWireless, Toys “R” Us and Monster.com. Perhaps mostsatisfying of all is that the majority of our growth comesfrom our long-standing client partners where we’remanaging an increasing share of their investment in media and communication services.
Additionally, we’ve seen certain MEC markets‘bloom’ where everything clicked and a staggering run ofsuccess all happened at once – China and Poland are twogreat examples of that for us. It’s our ability and depth atthe local market level, all around the world, that ultimatelydefines the core strength of MEC.
We continue to play our key role in GroupM, theworld’s leading media investment management group,leveraging the scale and intelligence of WPP’s mediacapabilities.
As we look ahead, it’s essential that we keep bothour clients and the consumer at the heart of everything wedo. In this context, our priorities must be to deliver growth– both for our clients and our own business – to continue todiversify our capabilities by either building or acquiring andto attract, retain and develop the best talent.
MEC had a great 2005. We’re proud of what weachieved. And as we look ahead to 2006, we do so withgreat confidence.
Charles Courtier
Dominic ProctorChief executive officer
MindShare
MindShare
005 was another wonderful year forMindShare’s people.
Our eighth year of existence saw oureighth consecutive year of serious double-digitgrowth as we developed new services and skillsto apply to our clients’ businesses. In turn our
clients rewarded us with many new responsibilities and newaccounts. It was another record-breaking year for MindShare.

How we’re doing
Annual Report 2005How we’re doing50
Our ambition moved from being leading marketingpartners for our clients to being their leading businesspartners. This change in emphasis has led to majorinvestments in developing strategic resources, especially inthe areas of communications planning, content, insights,digital and return on investment (ROI). Our clients havealways told us that they want us to be brilliant atimplementation and execution but now also increasingly to help them much more at a strategic level. For example,we have developed extremely sophisticated tools which help us answer a key question posed by all of our clients,“what is the most effective way to deploy my budget?”
In a communications landscape that offers suchincredible choice and complexity, clients have askedMindShare to be their partners in navigating these newchannels. And, in an increasingly accountable world, theywant our advice to be based on sound metrics and data aswell as intuition and creativity.
With the resources of WPP and GroupM, we arewell positioned to meet these challenges.
In 2005 we significantly enhanced our reputation forreally delivering on pitch promises. In a market which hasbecome highly measurable it is a key competitive advantagefor us to be known as the agency which over-delivers. Notonly does this add profit to our reputation but it also addsto our income as most of our contracts now have an elementof performance-related bonus.
Our partnerships with clients are enduring ratherthan project-based, so it is crucial that we can be trusted to deliver.
Many of these partnerships are global, or at leastinternational, and our global network remains our singlebiggest competitive advantage. This has been the case forfive years now. Actually, the network of 5,000 peoplecomprises several mini-networks which represent all aspectsof our business so, for example, there are networks ofmanagers, researchers, sponsorship experts, finance experts,traders, ROI specialists, knowledge managers, HRspecialists, content specialists, digital experts and (of course)networks of people dedicated to servicing each of ourclients. As our growth has been so rapid we were concernedthat such a strong network culture might dissolve, but infact it has strengthened. This remains a key managementpriority as we move towards our tenth year.
Media investment management is becoming a globaland consolidated business and this uniquely strong networkenables us to capitalize on that fact.
We seek regular feedback from our people and thevast majority are very happy and motivated to be part ofthe MindShare team. From this feedback we know that wehave plenty of things to improve (e.g. training, management
feedback, internal communications). Overall they greatlyvalue the collaborative attitude.
Similarly the feedback from clients is very positiveand client retention rates are very high.
They have told us they want us to be moreaccountable but also more creative. To increase our globalreach as well as our local expertise. To get the “old stuff”right while developing the “new stuff”. To be a hugeresource but delivered bespoke. We do not see these ascontradictory ambitions. Rather, as a service business, weneed to maintain high levels of flexibility as each of ourclients has different requirements and these individualrequirements themselves shift rapidly. The way we try toachieve this is by minimising the bureaucracy andmaximizing the common behaviour of collaboration,creativity, accountability, networking and fun. We don’twant each MindShare office to be the same but we do seegreat advantage in similar behaviour.
In last year’s report we commented on howwonderfully interesting the media sector has become. This is still the case. Technology and imagination still drivechange and opportunity for our people and our clientsglobally. We intend to stick with our simple strategy and we are confident that the people and clients who compriseMindShare will continue to enjoy it here.
Dominic Proctor

How we’re doing
Annual Report 2005How we’re doing 51
The Kantar Group
f this entry reads a bit like last year’s, it is nocoincidence. Our strategy has not changed. Our successdepends on how well we execute against it. From thatpoint of view our stakeholders – employees, clients,WPP and its share owners – had reasons to be satisfiedwith our progress in 2005. Our financial performance
was good, our clients experienced more innovation andconsistency in delivery than ever before, our peoplebenefited from greater investment in development, trainingand focus on their careers than ever before, we recruited
some fantastic people from diverse backgrounds and havean operational base which we can be proud of.
It is always nice to be publicly recognised in the waythat IMRB and BMRB were in being voted Agency of theYear in India and the UK respectively, but we must set ourown standards and work hard to ensure that we are theplace where motivated, passionate, talented people canthrive and where clients can find a proactive partner whodelivers great work consistently.
Our Kantar Gold Award winners in 2005 –Millward Brown US and Ziment – demonstrated thisclearly through the way in which they innovated, deepenedtheir relationships with clients and won new business,created an even better environment for their people and, in the process, grew revenues and profits substantially.
Our Kantar Performance Winners – Added ValueUK, BMRB, Lightspeed Research, MVI, ResearchInternational South Africa and Research International US –also developed extremely well.
Overview
inancially, we did well in 2005. Our revenueperformance was satisfactory in the light of theshift to internet-based research and the lowerprices which that involves. Given that as ameasure, revenue growth captures the extentto which our offer is suited to client needs,
the extent to which we are price-competitive, the extent towhich we deliver against our promises and the degree towhich we innovate with our clients we can be pleased withthe acceleration in our revenue growth over the past fewyears but we know that there is still more to do – ourrevenue growth was better than most of our competitorsbut not as strong as that of Ipsos or Synovate.
Our margin performance was very good in the lightof increased price competition and procurement initiativesfrom clients and the fact that our margins are at higherlevels than all of our major competitors in ad hoc research(TNS, Ipsos, Synovate, NOP) and increased by more in2005 than anyone else in the industry. However we knowthat there is still more that we can do and we know thatthere are still parts of our operation – by brand and bygeography – where we can improve.
Our businesses performed superbly in the US, Asiaand Latin America during the year but struggled in ContinentalEurope and performed poorly in the UK. The UK industrywent through a tough time in 2005 – revenue amongst the top 10 companies actually fell for the first time in over a decade but we contributed to our own problems. We know what we need to do in the UK – improve ourtalent pool, restore our thought leadership, become more
Information, insight & consultancy
Eric SalamaChairman and chief executive officer
The Kantar Group

How we’re doing
Annual Report 2005How we’re doing52
price-competitive, be more proactive with clients – and weare very focused on achieving this.
Role in community
Our financial success has gone hand in hand with playing a stronger role in the communities in which we live andwork. Public sector contracts continue to be a feature of ourwork. Research International carries out the Retail PriceIndex in the UK and is responsible for measuring servicedelivery for both the Royal Mail and OzPost; BMRBcarries out the British Crime Survey, the authoritativemeasure of crime in the UK; IMRB carries out a host ofwork for the Indian Government and for bodies such asUSAid and the Bill & Melinda Gates Foundation tounderstand attitudes towards AIDS, behaviour aroundimmunisation and the like.
And, as communities around the Pacific dealt withthe effects of the tsunami during 2005, Kantar and itspeople did more than simply raise $500,000 in contributionsto help – our people in IMRB took the lead on our behalfand used part of the money directly on the ground,supporting the rebuilding of six schools and a scienceresource centre in India and the support of a wide range ofpsychosocial facilities and activities in Sri Lanka includingpre-schools, camp care committee meetings, communitybuilding events and computer education classes.
Client needs and Kantar strategy
In the last two Annual Reports we wrote about clients whowant insights which are actionable, timely and value formoney, and of clients who complain of an industry that istoo focused on data, which doesn’t enable them to connectdeeply with their customers and which doesn’t make as biga contribution to their business as they need. If anything,client needs have become even more acute.
Consumer packaged-goods clients are finding it hardto push through price increases through European and USretailers unless they can offer new, genuinely innovativeproducts and more and more clients are focused onunderstanding how they should allocate their mediabudgets and their in-store budgets to best effect.
Against that backdrop we have concentrated ouroffer development in a number of areas:
We have more and better sources of syndicated data and insights
In an attempt to deliver better insights more cost effectivelyto our clients we have increased our focus on syndication.In the past year:
•We have established Focalyst, a joint venture with theAARP, to deliver syndicated research on the needs andattitudes of the over 50s.
•Ziment has launched iMAP Research with immediateclient demand in four therapeutic areas as a way ofdelivering attitudinal market tracking with physicians,patients and payors in the US and Europe and has rolledout the US National Health and Wellness Survey(www.nhwsurvey.com).
•Mattson Jack has integrated DaVinci and establisheditself as the leading authority in oncology.
• IMRB launched the Wallet Monitor which providesestimates of consumer spending and the IndividualPurchase Panel – iPulse.
•Center Partners pioneered the use of trained remoteagents in call centres.
•TGI is now available as the leading source of mediaconsumption data in over 50 markets.
•AGBNMR enhanced its TV ratings offer by measuringhomes with digital PVRs in UK for its client BARB, a world first.
•Cannondale’s Shopper Genetics (frequent shopper)databases have been used by clients in a wide range ofcategory management and channel-related work tounderstand individual consumers’ reaction to in-storemarketing while its RichMix product is now a leader inhelping clients decide on assortment strategies.
•MVI analysed and interpreted the strategies of leadingretailers in more markets than ever before and deliveredthose insights to clients through seminars, workshops andweb-based modules.
•Henley Centre’s merger with HeadlightVision hasenabled us to launch products such as Streetscape andHenley World around the world, providing usable trendsand insights into what is driving them.
We have developed a stronger offer inareas of critical importance to our clients
We have continued to improve our existing offers and havebrought more genuine innovation to the market than at anytime in our recent past. Particularly noteworthy has beenthe progress we have made in helping clients allocate theirbudgets effectively, in measuring the value of brands and inhelping clients innovate.
The Kantar Group

How we’re doing
Annual Report 2005How we’re doing 53
Millward Brown has introduced Demand AndActivation to its clients – a way of quantifying the impactwhich each media (paid-for such as internet advertising and not-paid-for such as word of mouth) has in drivingdemand, of quantifying the extent to which latent demandis translated into purchase in-store and of quantifying whatis driving a decision in-store.
Together with other Kantar businesses (notablyGlendinning, Cannondale, MVI and Research International),and companies such as G2, Millward Brown was alsoinstrumental in developing a Path To Purchase methodology,a way of measuring and understanding the way in whichconsumers progress from the first impulse to purchasethrough deciding on stores and brands throughconsumption of a particular brand and its effect onsubsequent purchases.
We have also made great progress in measuring theimpact of brands. Added Value has taken industry thinkinga step forward by focusing on the role of emotion in brandsand the way which a brand makes people feel as the bestguide to understanding behaviour. Millward Brown Optimorused its approach in valuing brands to team up with theFinancial Times in publishing a special supplement rankingthe world’s most valuable brands.
And Research International has packaged upexisting and new capabilities to offer a unique end-to-endinnovation offer, with everything from concept screeningand idea generation all the way through to forecasting salesof new products and services and measuring performancein-market.
We have helped clients make better useof their insights
It is not just through the generation of superb insights thatwe help our clients. Research International, Added Valueand Henley Centre HeadlightVision have made use ofinnovative presentation approaches including video and liveacting to make insights come alive in the minds and heartsof clients; we have carried out organisational developmentconsulting projects with clients to help them better connectthe generation of insights with decision makers; we havepioneered the use of creative briefs in research as a way ofkeeping ourselves and our clients focussed on what is reallyimportant in any given project.
We also have Kantar-wide account directors onsome of our key client located in our clients HQs, whosejob it is to anticipate client issues and ensure that the bestof Kantar is delivered to them at appropriate times.
Our talent pool is stronger
We tell our clients that their brands are built through thequality of the interactions which they have with theircustomers – and it is no different for us. We have thousandsof people and they each have hundreds, if not thousands, of interactions with our clients. Each one of those is anopportunity to understand the client better; to provoke,help, inspire.
Seen through that perspective, the emphasis we haveput in the past two years on training and development, onindividual career focus, on improving the quality of ourleadership capabilities, on bringing in people with talentsand capabilities we do not have enough of is nothing morethan a necessity.
We measure our progress through talent reviews,regular succession planning, “town hall” and informalmeetings and an annual Kantar-wide survey of allemployees – progress against which we include in all senior management’s bonus targets. Across the board weare doing OK, but still not good enough. There is now atalent mindset across the business; we have passionatepeople who love their work and who feel stretched andchallenged, but we are still not making as positive adifference to the experience of all of our people as I wouldlike us to be making.
Given that we want to be judged by what we do andthe impact we have and not just by what we say, we havemore work we need to do. Our aim is to do great work forclients. But we know that we will only do so consistently ifwe create and recreate an environment in which talented,passionate people thrive.
Our infrastructure is improving but we must pay moreattention to respondent issues
2005 saw the consolidation of our operational base in theUS under a single management team. Kantar Operations, as it is now called, manages fieldwork, data processing,scripting and all other operational capabilities for the wholeof Kantar in the US and the UK. We are now able better toalign capacity to needs, to manage transition to new formsof data collection such as the web and to do so cost-effectively and with the quality standards that we expect of ourselves. The focus this year will be on GlobalOperations, Locally Delivered – a way of being able todeliver on global projects through harmonized standardswhile taking into account local needs.
Lightspeed Research continues to be an industryleader in the provision of global online market researchwith panels that number over 17 million households across29 countries. Last year, we conducted 12 million online

How we’re doing
Annual Report 2005How we’re doing54
surveys for clients. To increase global reach and increaseability to conduct online market research in emerginginternet markets, Lightspeed Research has formalized twostrategic global panel partner agreements and developedonline specialty panels targeting the US Hispanic market, healthcare, financial services, automotive andtelecommunications. WebSurvey has increased its physicianpanel to over 100,000 strong across the US, UK, France,Germany, Spain and Italy with access in Japan as well. It still features the highest-known response rates for aphysician panel.
We believe that quality of fieldwork, privacy, ethicaluse of respondent data and other respondent issues willbecome increasingly important and that clients and theindustry will begin to refocus on these things in years tocome. We want to lead the industry in this area and willwork with any clients, competitors and third parties whoare committed to the same goals.
Adding to our existing capabilities
Our primary focus is always on our existing people and our existing businesses. But there will be occasions whenrecruiting externally or acquiring a business can enhanceour business in a way that we could not organically.
Mark Cranmer (who joined us as CEO of ResearchInternational having run Starcom across Europe), SoniaBueno (who joined us as Research International’s LatinAmerican CEO from LatamPanel), Angus Porter (whojoined us as CEO of Added Value having been on the board of Abbey National), Joanna Seddon (who joined usas CEO of Millward Brown Optimor from FutureBrand)are examples of numerous talented people from diversebackgrounds who are bringing us fresh perspectives andwho are positively challenging the way we do things.
Similarly, the acquisition of Pentor in Poland and RIChina for Research International, of MRI (in Korea) andDynamic Logic for Millward Brown, of RMS as the leaderin observing in-store behaviour, have helped us take ouroffers a step further.
Full circle back to clients
As I said last year, we do not often see our output displayedpublicly. But we know that 2005 was a good year in termsof the impact that our work has had on clients – in settingtheir strategic agendas, shaping their communication,developing new products and services, optimising theirtrade and media spend, helping them deliver higherproductivity from their employees, deepening the loyaltyand repurchase rates of their customers, setting prices fortheir products and services which have raised marginswithout losing customers and setting KPIs against whichthey are measured internally. Our largest clients have grownat twice the rate of all our clients – a reflection of the valuewe have added to them.
We know that our structure and approach candeliver to clients in ways which no other organisation can.Our aim continues to be to extend the range of occasionsand the consistency with which we can celebrate successtogether with our clients.
Eric Salama
The Kantar Group

How we’re doing
Annual Report 2005How we’re doing 55
Public relations & public affairs
including acquisitions. The revenue growth combined withdisciplined management enabled public relations & publicaffairs to increase its margin by a full point for the secondconsecutive year.
This improved financial performance was onlyachieved by making progress toward qualitative goals setout in last year’s Report. Specifically, we continue to dowell in the competition for the best professional talent inpublic relations & public affairs. This requires that wecompensate our people fairly. But winning the talent warrequires more than appropriate compensation, it alsorequires giving people a clear career path, investing intraining, supporting innovative thinking and providing apositive work environment. Our public relations & publicaffairs agencies understand this, and work at it all the time.
Another goal on which the agencies are focused isthe need to adapt their offerings to changing client needs,be it new services, new geographies, or new media. In adynamic economy, the proposition for clients must also be dynamic, reflecting marketplace demands.
One example of expanding the offer in 2005 wasBurson-Marsteller’s acquisition of Genesis, a leading publicrelations firm in India. Another example can be found inOgilvy Public Relations Worldwide’s (Ogilvy PR)acquisition of the Washington public affairs firm, theFederalist Group, even as Ogilvy PR strengthened its tieswith Ogilvy & Mather, furthering Ogilvy’s 360 Degreeproposition for clients.
Highlights of 2005 include a powerful newmarketing alliance forged by Cohn & Wolfe with Ford,WPP’s largest client. Cohn & Wolfe sustained its strongtop- and bottom-line growth for the third year in a row.Other top performers among full service agencies wereOgilvy PR and Hill & Knowlton, the latter sustaining thepositive momentum evident at the end of 2004. Burson-Marsteller managed well through a CEO transition, and by year-end Mark Penn, founding partner of WPP agencyPenn, Schoen & Berland (PSB), was named Burson’s newCEO. PSB, now a Burson agency, had an outstanding year.
The UK financial markets were busy in 2005, and a steady diet of IPOs and M&A activity enabled Buchananand Finsbury, respectively, to again deliver very goodresults. Also performing at a high level were the US single-office firms of Robinson Lerer & Montgomery, BKSH,Quinn Gillespie and Wexler & Walker.
Howard Paster
Public relations & public affairs
Howard PasterExecutive vice-president
WPP Public relations & public affairs
Overview
uilding on the momentum of a successful 2004,WPP’s public relations and public affairsagencies had an excellent year in 2005.Especially gratifying was the contribution to the improvement from almost every agency,regardless of size or offering.
Revenue was up on a like-for-like basis by well over7%, and up almost 19% on a constant currency basis

How we’re doing
Hill & Knowlton
Annual Report 2005How we’re doing56
005 at Hill & Knowlton saw a dramaticacceleration in clients requiring expandedcommunications services from the firm. All regions in the firm experienced revenuegrowth year-over-year with dramatic expansionin North Asia and, in particular, China where
half of that growth was driven by existing clients.H&K’s focus on client service continues to be measured
by the retention of its top 30 clients. HP, Motorola, Merck,SABIC, P&G, Microsoft and AstraZeneca remain atop a
list consistent each year. New to the H&K family of clientsinclude the Royal Canadian Mint, the government ofPakistan, the Commonwealth Bank of Australia, TomTom,HSBC, Hershey, VeriSign, Deloitte, Exelon and CRVD.
Companies turned to H&K for financialcommunications and M&A support in 2005. Canada led in transactions including CNPC International’s acquisitionof PetroKazakhstan; TUI AG’s acquisition of CP Ships; and Arcelor Steel in its acquisition of Dofasco. H&K’sHong Kong and New York teams assisted baidu.com, theGoogle of China, to become the biggest first-day gaineron the NASDAQ since 2000. Hong Kong also managedthe communications on the listing of China ConstructionBank, the largest IPO in the world in 2005.
Hiring senior trusted advisors remained a toppriority as Hill & Knowlton continued to deepen its talent.In healthcare, Paul Oestreicher joined as US director, Dr Martin Godfrey returned to London and Don Sanctoncame aboard as Canada’s national practice leader. JudiMackey was named US head of corporate communications,Mike Breslin signed on as Houston’s GM, and MichelleHutton was named head of Australia. In London, RichardMillar was promoted to head of consumer and marketing,and technology marketing specialist Paul Kok joined inAmsterdam. Julie Atherton came aboard as director ofinteractive in the US to help clients integrate their onlinecommunications to make marketing more immersive. Scott Kirkpatrick joined the firm to lead its US sportsmarketing practice.
H&K continued to invest in generating insights oncommunications. The annual survey, Tech Decision MakersStudy, provides insight into the decision-making process forB2B technology purchases, assessing the criteria and sourcesof influence on senior tech decision makers when makingtheir short list of vendors.
H&K also commissioned a Consumer Influences Studyto analyze the sources of influence on consumers as theypass through the purchasing life cycle in key B2C productand service categories. The study pinpoints the most influentialsources and identifies the experts for each category, enablinga targeted approach to spreading word-of-mouth.
Asia Pacific’s crisis and issues management andtraining practice launched Planning for Pandemics: A Step-by-Step Communications Approach for RespondingEffectively to the Risks of Outbreaks. This multi-facetedcommunications planning approach, extrapolated from the2003 SARS crisis in Asia, is a plan that helps companiesbetter understand how pandemics, such as avian flu, canthreaten their operations and reputations. The offeringhelps companies undertake risk assessment, plancommunications strategies to mitigate the threat and offerspost-pandemic recovery strategies.
Paul TaaffeChairman and chief executive officer
Hill & Knowlton

How we’re doing
Annual Report 2005How we’re doing 57
The year was one of transformation for Blanc &Otus, H&K’s stand-alone technology company. Celebratingits twentieth anniversary, B&O added 20 new clients andsix new staff members to its analyst relations joint venturewith H&K, which is led by former Gartner Group analystJosh Reynolds. Its consumer business grew to more than40% of revenue by year’s end.
B&O’s clients include Hitachi Data Systems,DreamWorks Animation, Panasonic, Universal Electronics,Disney’s Moviebeam venture, the Blu-ray Disc Association,Sony’s US PlayStation division, and start-ups, includingphotocasting pioneers FilmLoop, mobile phone GPSinnovator Destinator Technologies and VOIP telecomprovider My People. B&O added major new assignments in its burgeoning London office for LG and MCI to majorB2B work in the US for Computer Associates, Hyperion,Agile and Fujitsu Software.
Wexler & Walker Public Policy Associates had asuccessful 2005, with revenue increasing 12% over 2004.Helping to drive this growth were two significant hires outof the Bush Administration: John Duncan, who served asAssistant Secretary of the Treasury for Legislative Affairs; andTom Blank, who came from the Department of HomelandSecurity where he served as Deputy Administrator (Acting)of the Transportation Security Administration.
Among the firm’s client successes in 2005 werepassage of umbilical cord blood legislation for Cord BloodRegistries, Inc.; passage of legislation facilitating theexportation of pharmaceutical products overseas and jobcreation in the US for Cephalon, Inc.; passage of theCentral American Free Trade Agreement for ComprehensiveMarket Access Coalition; and passage of energy legislationfor the Alliance for Hydroelectric Licensing Reform.
Long a proponent of social responsibility for itsclients, Hill & Knowlton promotes that philosophy in-house. H&K, JWT Pakistan and local associate Asiatic PRprovided assistance to the government of Pakistan’s rescue,relief and reconstruction efforts following the devastatingOctober 8 earthquake. With on-site support in Pakistan,along with teams in Washington DC, London, Singaporeand Islamabad, the team helped government officialscoordinate aid from around the world and providedstrategic communications counsel and media engagement.In addition, Hill & Knowlton contributed to the AmericanRed Cross through its John Hill Foundation for the victimsof US hurricane Katrina, as well as matching employeecharitable donations.
Paul Taaffe

How we’re doing
Ogilvy Public RelationsWorldwide
Annual Report 2005How we’re doing58
ward-winning work, solid seniorleadership, new business wins, expandedglobal client relationships, 360 DegreeBrand Stewardship®, thought leadershipand growth – organic and throughacquisitions – best describe 2005 at Ogilvy
Public Relations Worldwide (Ogilvy PR).The Ogilvy PR network continued to experience
success worldwide throughout 2005 as we drove some ofthe year’s innovative, creative and award-winning global
communications initiatives. For example, in Asia weworked closely with the Coalition for a Healthy Indonesiaand Johns Hopkins University to reduce infant mortality.We helped FM Global, the world’s largest commercial and industrial property insurer, achieve a 20% increase in new business activity across Europe. In the US, we were recognized for our collaboration with the HudsonHighland Group, a leading executive search and staffingfirm, on the Hudson Employment IndexSM, now anationally-recognized monthly economic barometer. And, once again, we led the charge in educating womenabout heart disease with the Heart Truth campaign for the National Heart Lung Blood Institute.
Though these are just a few examples of the workwe did throughout 2005, they are a true testament to ourstable roster of senior leaders, which includes a mix of old and new blood, and our highly skilled account teams.One respondent to our 2005 client survey said, “You arethe best of the best. Keep up your hiring practices, becausethe talent you have employed in all areas is awesome.” To that end, we rounded out our senior leadership team byhiring Luca Penati, to head the global technology practiceand Orlando Camargo, as president of Japan.
As the account teams focused on delivering superiorclient service, our leadership set their sights on buildingbusiness. By leveraging our solid base of strong legacytalent with strategic new hires, we won an array of newbusiness opportunities around the world. Our global clientlist now includes Band-Aids®, Sam’s Club, QuintilesTransnational, Mercury Interactive, Nestlé, Sony BMG,Ford and Goodyear, to name a few.
In addition to significant new business wins, weexpanded our relationships with several global andmultinational clients. For example, in the global consumermarketing practice our relationship with Unilever grew. We now support seven of Unilever’s brands globally,including Slim.Fast, Lipton, Pond’s, Dove, Comfort,Promise and Hellmann’s. Corporate clients Invest in Franceand FM Global also tapped our worldwide network tomanage their global communications.
We continued to differentiate ourselves in themarketplace by partnering with sister agencies OgilvyAdvertising, OgilvyOne, and Ogilvy Interactive to bring360 Degree Brand Stewardship® to life for our clients.Through these strategic partnerships we developed anddelivered transformative communications programs toAmerican Chemistry Council, DuPont and Unilever, amongmany others.
In 2005, Ogilvy PR was active on the thoughtleadership front as clients and industry influencers lookedto our senior leaders for their expertise on some of theyear’s hottest topics. For instance, Christopher Graves,
Marcia SilvermanChief executive officer
Ogilvy Public Relations Worldwide

How we’re doing
Annual Report 2005How we’re doing 59
regional CEO of Asia Pacific, kicked off one of the earliestin-depth looks at corporate blogging and podcasting with a well-received global white paper. And, senior advisorJames McGregor examined China’s business landscape inhis bestselling book One Billion Customers; Lessons fromthe Front Lines of Doing Business in China.
The Ogilvy PR footprint was expanded in 2005 withthe acquisitions of iPR, the financial communications firmresponsible for 40% of the IPOs on the Hong Kong stockexchange last year alone, and The Federalist Group. TheFederalist Group is a premier Washington DC-based publicaffairs firm that specializes in government relations and hasearned an unsurpassed reputation for successful legislativeand regulatory advocacy.
Our global growth and client achievements in 2005are a direct result of the strength, hard work, dedicationand determination of our world-class global seniorleadership.
If the first few months of 2006 are any indication,collectively they will continue to push the agency forward.From the launch of our interactive offering, 360 DegreeDigital Influence, to our focus on providing enhancedfinancial communications programming to corporateclients, Ogilvy Public Relations Worldwide is wellpositioned for another solid and successful year.
Marcia Silverman

How we’re doing
Addison Corporate Marketing, Lambie-Nairn, The Partnersand Walker Group.
The mission of the B to D Group is to maximize andleverage the strengths of each individual company in orderto offer clients and prospects the most complete andcompelling branding and design solutions. As part of the group, the companies have access to new clients anduntapped markets, as well as resources such as advancedknowledge sharing systems and financial tools. Employeeexchange further enables the companies to share top-levelstrategic thinking, creativity and cultural knowledge.
Year one of B to D Group operations was primarilyspent building and refining the individual companies.Bringing energy and fresh perspectives, new companyleadership was established at Landor, Enterprise IG andAddison with the promotion of Charlie Wrench topresident, Simon Bolton to Worldwide CEO, and TomRobinson to CEO, respectively. New financial managementwas also put in place at Enterprise IG.
Landor and VBAT were top performers in thegroup, both contributing record revenues in 2005. Landorproduced record profits as well. Addison delivered anotable improvement over last year’s performance andLambie-Nairn presented solid numbers, surpassing 2005expectations.
Enterprise IG had a productive year overall, with the business responding to the leadership and streamliningactions taken. The Partners finished on a high note, despitea slow start to the year and Walker Group advances into2006 optimistic about refocusing the company on its moretraditional retail roots.
In the coming year, we plan to expand the B to DGroup’s reach both in terms of geography and capabilitiesto increasingly meet our clients’ growing demand for globalknowledge and innovative solutions, and continue toposition WPP’s branding and design practice as the majorforce in the market.
Craig Branigan
B to D Group
Annual Report 2005How we’re doing60
Branding & identity
Craig BraniganChairman and chief executive officer
B to D Group
Overview
determination to dominate the globalbranding and design market changed theshape of WPP’s brand consulting anddesign practice in 2005 with the formationof a new branding and design entity, the B to D Group.
Led by CFO Robert Horjus and myself, the groupconsists of Landor Associates, Enterprise IG, VBAT,

How we’re doing
005 was a year of consolidation for EnterpriseIG, cementing its position as a leading globalbrand agency. Strong office performances,deepening client relationships, key personnelappointments and continued investment innetwork infrastructure characterised the year.
Enterprise IG now has operations in 21 countriesaround the world. Most offer a portfolio of strategiccounsel, design implementation and brand engagement. In particular, our offices in Dubai, Dublin, London, Paris
and Tokyo all performed strongly. The highlights were inDubai and Shanghai, where the rapidly expanding marketfor branding and identity services allowed us to considerablystrengthen our presence and in London, where John Mathersguided the office to its strongest result since 2001. As we go to press, we are moving to strengthen our presence in Eastern Europe, India and Asia Pacific.
Enterprise IG’s stated ambition is to serve the needsof the world’s most demanding clients. The science of brandgrowth and engagement has never been more acute in clientorganisations. Thus Enterprise IG has stepped up to play a major partnership role with significant internationalclients such as American Express, Caterpillar, Electrolux,Masterfoods, SABMiller and Vodafone.
It was also gratifying to see the traction that EnterpriseIG has achieved in new business, winning significant newclients such as Airtel, Credit Suisse, Diageo, Motorola andUlster Bank, which also helped us grow our revenue over 2004.
In terms of people, we continued to enrich our talentpool office by office. At the CEO level, we appointed RitaRodriguez to run North America, Neil Hudspeth was recruitedto run Asia Pacific and Ulrika Dellby was recruited to runthe Nordic region from Stockholm. Tracey Wood wasappointed chief technology officer, directing all aspects oftechnology and knowledge sharing globally, and Alex Sparkwas appointed chief financial officer.
As part of our continued emphasis on peopledevelopment, our international talent transfer programmecontinued to strategically relocate our people, whilst ourcommitment to multi-office training programmes helpedreinforce our international culture.
At the beginning of 2006 I was appointed as theWorldwide CEO to lead Enterprise IG on this path oftransition and growth. The strategy is in place and thenetwork is delivering.
Simon Bolton
Annual Report 2005How we’re doing 61
Enterprise IG
Simon BoltonWorldwide chief executive officer
Enterprise IG

Fitch
How we’re doing
•The ongoing project of integrating our network into aGlobal Studio is a key task, one that has seen considerablesuccess this year, with more of our studios working together,sharing clients, data and staff. This is also the case withinthe WPP community, where, by collaborating with sisteragencies, we were able to win the annual WPP WorldwidePartnership Program award.
•Our global network was greatly enhanced in Asia whenwe acquired the successful Singapore brand communicationsagency Spring, whilst also absorbing most of the UnderlineFitch network. We now have four studios in the region and look forward with confidence to growing our presenceand portfolio, not least in India, where we have won ourfirst projects.
•We also continue to grow our international reach elsewherewith new projects in Russia, Thailand, the Middle East and Latin America and, to build on these opportunities, we have established a Fitch presence in Moscow and Dubai.
Our endeavours on the creative, client and integrationfronts have helped deliver better than expected financialresults for 2005. In 2006 we have ambitious plans, the yearhas started well and we remain confident and optimistic.
Rodney Fitch
itch’s second year as part of the WPPcommunity has lived up to the expectationsanticipated in my report last year. We haveenjoyed a very satisfactory year on all fronts:
• If industry recognition is a bellwether, thenthe quality of our work continues to improve.
Notable amongst the many awards our studios collectivelywon were an IDEA Gold for our Gerber Sippy cup in theUS and Store of the Year for Aquascutum.
•We have continued to serve longstanding clients such asMicrosoft, HSBC, Vodafone, BAT, GE and GM, whilst alsogrowing business with a host of new clients such as CentralMarkets in Bangkok, Nokia in Europe and Levi’s in the US.
Annual Report 2005How we’re doing62
Rodney FitchChairman
Fitch

How we’re doing
Annual Report 2005How we’re doing 63
Through our expanding range of services and thededicated focus and talent of our increasing employee base,in 2005 CommonHealth:
•Received significant new assignments from 23 clientcompanies including 3M, Abbott, AstraZeneca, Berlex,Bristol-Myers Squibb, Duramed, J&J, Merck, Nestlé, Novartis,Pfizer, Reckitt Benckiser, TAP and Wyeth.
•Expanded our client roster to include assignments witheach of the top 11 healthcare manufacturers.
• Integrated our services better than ever before, with morethan 80% of our top client brands now working with two or more CommonHealth companies.
•Successfully launched Altum, CommonHealth’s newestagency, focusing on high-science and specialty markets.
•Dramatically expanded the client roster and talent poolwithin CommonHealth’s second newest agency, Solara,focused on the distinct marketing needs of the managed care environment.
•Further extended our arsenal of proprietary insight andplanning tools – including Managing the DialogueTM,StoryTellerTM, PatientTalkTM and PeerSightTM, generating a unique ability to understand and impact the real, fluidworld of healthcare communications.
•Added an extraordinary level of new talent to theorganization, strengthening and deepening the offerings of each agency within our network. With 22 new hires at the SVP level and above, and 157 new people hired in 2005 overall, the ranks of creative marketing talent withinCommonHealth have never been so deep.
•Won 29 creative and/or industry awards.
•Gave back to the community through an ongoingcharitable contribution campaign, numerous pro bonoassignments and employer-match fundraisers benefiting both local and global causes.
Moving forward, we’ll continue to hone our plans for growth based on current dynamics in the healthcaremarketplace, including an accelerated focus on specialtycare/targeted therapies; the need for real-time, reality-based marketing tools and techniques; and the move towardinteractive, context-based messaging and permission-based media.
CommonHealth’s 35+ year history of innovation,creativity and growth in the healthcare communicationsarena continues to spur us on in our quest for more effectiveand more efficient ways to reach our clients’ customers. With an increasing sense of connectivity and productivitythroughout the organization, our interconnected businessmodel and culture has proven in recent years to be idealfor both our clients and our people, and it sets the stagefor a very promising 2006.
Matt Giegerich
CommonHealth
Healthcare communications
Matt GiegerichPresident and chief executive officer
CommonHealth
005 was another year of growth and expansionfor the CommonHealth network, with significantaccomplishments on every front. Among otherthings, our organization of 13 distinct operatingagencies – each organically grown to focus on a specific sector within the dynamic healthcare
communications arena – generated more new business than inany prior year, positively impacting every area of our business.
All CommonHealth agencies operate interdependently –sometimes separately and sometimes together – withindividual client/brand needs driving specific combinations of the total offering. The multitude of possibilities across thenetwork allows CommonHealth to be both large and small,taking advantage of scale and resources, yet maintainingentrepreneurial environments that keep clients’ interests atthe forefront.

How we’re doing
Overview
ur specialist communication businesses provideclients with unique marketing capabilities,specialized industry expertise, and deepknowledge of particular audience segments.In 2005, several new specialist resourceswere added, some existing units were
further developed, and others aligned structurally or collaboratively with our large group networks.
Direct, promotional and interactive marketing
Bridge Worldwide, a recent acquisition, brings to WPPnetworks world-class capabilities and dynamic growth in the interactive and relationship marketing space.
In 2005, Bridge was selected for Procter & Gamble’sbest-in-class interactive agency roster, solidifying alongstanding relationship which now extends across over adozen brands, including four of P&G’s billion dollar brands(Charmin, Pringles, Folgers and Bounty) as well as P&G’scorporate online initiatives (P&G’s Everyday Solutions).Also in fast-moving consumer goods, Bridge added notabledigital marketing relationships with McCormick &Company, the largest spice company in the world, andConAgra Foods, one of North America’s largest packagedfood companies.
Bridge Worldwide’s healthcare business alsoexperienced strong organic growth at Johnson & Johnson’sEthicon Endo-surgery and Abbott Labs’ Ross ProductsDivision. Tackling chronic disease states such as morbidobesity and diabetes, Bridge’s focus on healthcaredemonstrates the power of digital media to act as a hub in cementing relationships with professionals as well asconsumers in high-involvement categories. Bridge’s work on the professional launch for J&J’s BariatricEdge won aSilver at the RxClub Awards.
MJM benefited from a wide range of opportunitiesas face-to-face marketing truly came into its own in 2005.The result was a diverse portfolio of exciting workencompassing all the company’s varied offerings. Projectsranged from incorporating live performance into traditionalmuseum environments for the New York Historical Society,to staging a meeting in the desert around Dubai, openingnew HSBC branches across the UK, and providing webcastsupport for key internal communications at GlaxoSmithKline.Among the most dramatic projects was the design andcreation of Canon Expo 2005 in New York. Thisproprietary trade fair-like event attracted more than 10,000 invited guests and comprised 130,000 square feet of theaters, exhibits, product displays, and media and live presentations.
Specialist communications
Annual Report 2005How we’re doing64
Specialist communications

How we’re doing
EWA continued to develop its data and relationshipmanagement services and recorded another strongperformance in 2005. Growth was boosted by a newcontract with BAA Stansted and expansion of existingcontracts with the Department of Health and the Trainingand Development Agency for Schools.
Einson Freeman continued to make news in the world of brand promotion and integrated marketing. The agency enjoyed both new and expanded relationshipswith Dunkin’ Brands, HSBC, Pfizer, Bristol-Meyers Squibb,Simon Properties Group and more. Highlights included the branding and fully-integrated launch of Dunkin’ Donuts new flavored coffee line and a focus on employeeincentive programs for HSBC as part of the WPP multi-disciplinary team. In addition, the creation of a unique tie-in between Pfizer’s Purell brand and National
Geographic Kids won a distinguished Reggie Award from the Promotion Marketing Association.
Mando Brand Assurance strengthened itsrelationship with Unilever, via significant wins from PotNoodle and Dove. Other major campaigns includedWalkers/PepsiMax, The Guardian newspaper andCallaway. Mando continued to extend its coverage andknowledge of text and web sales promotion campaignsduring 2005.
Headcount Field Marketing broadened its client base, adding L’Oreal, Fexco and the EnvironmentAgency while growing existing relationships with clients such as Epson. The year ended with the win of a long-term contract from Warner, and the development of a Field Marketing European alliance across all major markets.
Warwicks’ focus on the automotive industry helpedearn an assignment with The Automotive Academy during2005. Early this year, work was awarded for Sytner BMWcar dealerships to handle local press advertising andcustomer-focused marketing.
Custom media
Forward continued to develop its UK business withcustomer direct work for Tesco, Barclays and Ford. Thebusiness also secured its first North American work forSears Holdings Corporation, based in Chicago, the start of a planned expansion for Forward.
Spafax had a strong year, winning new inflightentertainment contracts with Singapore Airlines andQuantas and renewing contracts with Malaysia Airlines,Cathay Pacific, British Airways and Delta. The acquisitionof DMX Inflight in early 2006 strengthens Spafax’sintegrated inflight entertainment offering and gives them a greater presence in the US market.
Demographic and sector marketing
Pace registered a very strong performance in 2005, winning national recognition once again for its prestigiousreal estate clients at the National Association ofHomebuilders annual convention. Substantial billinggrowth from existing clients, coupled with significant wins in new geographic markets, kept Pace ahead ofperformance expectations. Anticipating future needs of themarketplace, the firm has also launched new web site andvirtual tour initiatives.
Geppetto helped clients as varied as Pfizer, Samsung,Sanford, Kraft and Little Tikes tap into the power of theyouth market with work in the areas of productdevelopment, advertising, promotions and positioning.
Annual Report 2005How we’re doing 65
Mary Ellen HoweChief operating officer
Specialist communications, North America

How we’re doing
The Food Group enhanced its leadership position in food industries through the creation of a strategicconsultancy for corporate business and industry clients.Notable wins in 2005 included an engagement by Johnson& Johnson to launch a system-wide healthy eating initiative.Food Group retained agency of record assignments formany of the nation’s leading foodservice clients, such asTABASCO, Kraft, Florida Department of Citrus and newlyacquired Dannon.
BDG McColl, Edinburgh-based architects andinterior designers, showed continued international growthalongside appointments in the UK for BP’s new North SeaOperations Headquarters, and for the architectural andinterior design of the new Veterinary School for theUniversity of Edinburgh.
BDGworkfutures had a successful year withsignificant new wins, including Barclays, HoneywellControl Systems and Robson Rhodes. In addition tocorporate clients, BDGworkfutures also secured a numberof contracts to deliver workplace strategy and design withinthe Government sector, and this area is expected tocontinue to be strong in 2006.
Dovetail built on relationships with the architecturaland design community to develop new business opportunitiesthrough specifying furniture for major new projects. Theseincluded Discovery Channel’s new offices in Chiswick,Melli Bank’s new facility at London Wall, as well as TheNational Trust’s award-winning HQ scheme in Swindon.
Sports marketing
PRISM showed continued growth with the addition of anumber of new blue-chip clients providing sponsorshipassignments. Campaigns included Shell’s sponsorship ofFerrari and Ford’s DestinationFootball. PRISM continuedto use Brand Sponsorship Valuator 6.0 to help companiesclearly define the return on investment from sponsorshipinvestments and to create intelligent sponsorship activationprograms. Clients included Deutsche Bahn, Samsung,Telefonica, Visa and Xerox.
PSM opened affiliate operations with WPP sistercompanies Bates Pan Gulf in Dubai and Ogilvy RedCard in Singapore. New clients included Gillette, Nikon Europe,the European Space Agency and Chevrolet. The launch of Sportz III, the WPP sports equity tool in which PSMpartners with Hill & Knowlton, promises to be a major boost.
Specialist communications
Annual Report 2005How we’re doing66
Andrew ScottChief operating officer
International specialist communications

How we’re doing
Global Sportnet (GSN) continued the implementationof its strategy to move from being a specialized footballagency to a full service sports marketing agency marketingthe media (television, mobile, broadband) and sponsorshiprights of sports rights holders. In 2005 GSN brought inVELUX as the naming rights sponsor for Clipper Venture’s5 Oceans Race, the solo around-the-world yacht race.
Media and film production services
Metro showed successful growth with further in-roads into the High-Definition broadcast market and strongperformance in the events and staging business. Thebroadcast business shot and edited Totally Frank andprovided production facilities for various high-profileprograms for UK terrestrial television. The events andstaging business provided internal communication andexternal trade events for clients such as Accenture, BP,CSFB, Experian, Innovene, JP Morgan, Morgan Stanley,RBS and UBS.
The Farm Group, including Uncle, had anothersuccessful year despite difficult trading conditions, and was voted Best Post Production Company in the Broadcastmagazine awards (the fifth time in six years). Numeroushigh-profile film, TV and DVD projects were handled bythe Farm Group throughout the year including X Factor,Jonathan Ross, Hustle and Little Britain in the Londonfacility, and Space Cadets and Deal or No Deal in theBristol facility.
Mary Ellen Howe and Andrew Scott
Annual Report 2005How we’re doing 67

What we think
The Advertising & Marketing Services IndustryNew markets and new technologies
Sir Martin SorrellPage 70
The Life & Works of Stephen KingA tribute
Jeremy BullmoreJudie Lannon
Page 90
Annual Report 2005What we think68
“It’s unfair that one man should have so much wisdomand be able to express it so beautifully and entertainingly.” Campaign
Apples, Insightsand
Mad InventorsAn entertaining analysis of modern marketing
JEREMY BULLMOREForeword by SIR MARTIN SORRELL
by
It is our custom to invite marketing commentator and member of the WPP Advisory Board, Jeremy Bullmore, to contribute
an essay to our Annual Report each year.
In a change for this year only, we are devoting these pages to the work of Stephen King, one of the founding fathers of modern advertising practice
and a long-serving director of JWT, WPP and The Henley Centre.
Readers may be pleased to learn that a collection of Jeremy’s Annual Report essays, written over the past eight years, has just been published
in book form by Wiley. Apples, Insights and Mad Inventors: An entertaining analysis of modern marketing is available from Amazonand major booksellers, including Blackwell’s, Borders and Waterstone’s.

Annual Report 2005What we think 69

What we think
Annual Report 2005What we think70
The Advertising & Marketing Services Industry
New markets and new technologies
WPP CEO Sir Martin Sorrell reports

What we think
Annual Report 2005What we think 71
% by country• US 51.9%
• UK 7.5%
• France 3.2%
• Germany 4.9%
• Japan 7.5%
• Rest of the world 25.0%
Total 100.0%
Sources: Veronis Suhler Stevenson/ZenithOptimedia/ESOMAR/WPP estimates
Public Specialist Market relations & commun
Advertising research public affairs -ications Total
US 166.2 9.5 2.9 457.0 635.7UK 21.3 2.3 1.0 66.7 91.3France 12.6 1.7 0.1 24.8 39.2Germany 20.2 2.0 0.2 37.7 60.2Japan 40.9 1.6 0.1 48.8 91.4Rest of the world 145.1 5.9 0.1 155.5 306.6Total 406.3 23.0 4.5 790.6 1,224.4
005 was a surprisingly strong year, after 2004, which marked the fullrecovery from the internet bust of 2000. In theory, 2005 should havebeen the weakest of the four-year cycle to 2008, with no events toboost advertising and marketing services spending. It was, however,WPP’s best year ever – measured by all metrics. It achieved, for the
first time, 15% operating margins under ‘old’ 2004 UK GAAP measures. 2006 has already shown more improvement. It should, in theory, be even better – a ‘mini-quadrennial’ boosted by mid-term Congressional elections in the US, the Winter Olympics in Turin and soccer’s World Cup in Germany.
And 2007 will be the platform for 2008, a ‘maxi-quadrennial’ yeardominated by the US presidential elections (Hillary Clinton vs. John McCain?Tom Vilsack vs. Condoleezza Rice?), the blockbuster Beijing Olympics and theEuropean Football Championships in Austria and Switzerland.
In the longer term, true globalisation and the growth of Asia Pacific,overcapacity and the shortage of human capital, the web, the demand forinternal alignment and as a result internal communications, and retailconcentration should together underline and assure the importance of ourindustry and its constituent parts – advertising and marketing services.
Worldwide communications services expenditure 2005$bn

What we think
72 Annual Report 2005What we think
Source: Veronis Suhler Stevenson
Television Radio Newspapers Consumer Business- Consumer Yellow Outdoor Cinema Video magazines to-business internet pages games magazines
US advertising spending 1999-2009 $m
90,000
40,000
80,000
70,000
60,000
50,000
30,000
20,000
10,000
0 1999 2009200820072006200520042003200220012000
Growth continues
n 2005, spending on worldwide communicationsservices – or advertising and marketing services – grew by 3-4% to more than $1.2 trillion, putting WPP’smarket share, including Grey Global, at about 10%.This year the industry should grow at around 4%. As a proportion of worldwide GNP, it probably fell
during the recession of 2001-03, but stabilised in 2003,2004 and 2005. It will probably continue to grow again in 2006 and beyond – in 2007 and 2008.
Advertising and Media investment management –which concentrate on traditional media such as television,radio, newspapers, magazines, outdoor and cinema – have grown well historically and led the industry out of the recession. But its share has declined as supposedly lesssophisticated, less global and less developed marketingservices have gained share. These are the so-called below-
the-line areas, such as Information, insight & consultancy,Public relations & public affairs, Branding & identity,Healthcare and Specialist communications – particularlydirect, interactive and internet communications.
The march of marketing services
Marketing services have grown more quickly for tworeasons. First, network television pricing has risen fasterthan inflation, to the disquiet of big advertisers. Procter &Gamble, the world’s biggest advertiser (now even biggerwith Gillette), Unilever, Coca-Cola and American Expresshave registered voluble protests in recent times. They aresick and tired of paying more for less.
In 2003, in the upfront network buying season, cost per thousand rose by an estimated 15-22% against an expected 7-12% – this against general price inflation of 3%. In 2004, upfront pricing continued to outpace
US advertising spending 1999-2009$m
Business to
News- Consumer business Consumer Yellow Video Year Television Radio papers magazines magazines internet pages Outdoor Cinema games Total
1999 49,375 17,681 50,689 11,433 10,492 4,621 13,196 4,832 129 3 162,451
2000 56,208 19,848 53,371 12,370 11,659 8,087 14,267 5,235 194 9 181,248
2001 50,856 18,369 49,093 11,095 10,085 7,134 15,035 5,233 246 22 167,168
2002 54,729 19,411 49,079 10,995 9,028 6,010 15,231 5,232 301 44 170,060
2003 55,863 19,607 50,126 11,435 9,263 7,267 15,366 5,504 361 79 174,871
2004 62,101 20,022 52,152 12,121 9,845 9,626 15,928 5,834 438 120 188,187
2005 65,668 20,571 54,090 12,788 10,558 12,629 16,522 6,144 522 178 199,670
2006 71,499 21,258 56,262 13,555 11,330 16,052 17,274 6,481 608 267 214,586
2007 75,132 22,120 58,126 14,409 12,115 20,002 18,067 6,849 694 402 227,916
2008 81,931 23,419 60,204 15,346 12,962 24,062 18,975 7,234 782 594 245,509
2009 86,612 24,565 62,086 16,374 13,803 28,198 19,973 7,623 863 800 260,897

What we think
inflation, cost per thousand rising by 6-7%. 2005 sawmore softening, but prices still grew faster than inflation at around 4-5%. NBC was particularly hit hard –dropping $900 million in revenues, with pricing,programming and late bargaining issues combining tocause significant issues. 2006 will probably stabilisearound the general price inflation level of 3%.
The analogy is to imagine what would happen inthe car industry if the price of steel rose consistently by10% against general price inflation of 3%. Manufacturerswould use less steel or find a substitute. That is what ishappening in our industry, too. Marketing services andother traditional media such as radio, outdoor and cinemaadvertising are becoming more acceptable substitutes.
Network television will, however, remain animportant medium. It will not disappear. If we werestarting a multinational packaged goods company fromscratch, we would still use network television to reach
Annual Report 2005What we think 73
Source: Veronis Suhler Stevenson
Growth in US advertising spending 2000-2009Compound annual growth 1999-2004 vs 2005-2009
200
100
180160140120
806040200
-20 2000
Television Radio Newspapers Consumer Business- Consumer Yellow Outdoor Cinema Video magazines to-business internet pages games magazines
200920082007200620052004200320022001
Growth in US advertising spending 2000-2009 % growth
Source: Veronis Suhler Stevenson
Business to
News- Consumer business Consumer Yellow Video Year Television Radio papers magazines magazines internet pages Outdoor Cinema games Total
2000 13.8 12.3 5.3 8.2 11.1 75.0 8.1 8.3 50.4 200.0 11.6
2001 -9.5 -7.5 -8.0 -10.3 -13.5 -11.8 5.4 0.0 26.8 144.4 -7.8
2002 7.6 5.7 0.0 -0.9 -10.5 -15.8 1.3 0.0 22.4 100.0 1.7
2003 2.1 1.0 2.1 4.0 2.6 20.9 0.9 5.2 19.9 79.5 2.8
2004 11.2 2.1 4.0 6.0 6.3 32.5 3.7 6.0 21.3 51.9 7.6
2005 5.7 2.7 3.7 5.5 7.2 31.2 3.7 5.3 19.3 48.3 6.1
2006 8.9 3.3 4.0 6.0 7.3 27.1 4.6 5.5 16.4 50.0 7.5
2007 5.1 4.1 3.3 6.3 6.9 24.6 4.6 5.7 14.2 50.6 6.2
2008 9.0 5.9 3.6 6.5 7.0 20.3 5.0 5.6 12.6 47.8 7.7
2009 5.7 4.9 3.1 6.7 6.5 17.2 5.3 5.4 10.4 34.7 6.3
Compound annual growth
1999-2004 4.7 2.5 0.6 1.2 -1.3 15.8 3.8 3.8 27.7 109.1 3.0
2004-2009 6.9 4.2 3.5 6.2 7.0 24.0 4.6 5.5 14.5 46.1 6.8
Top 10 US advertising spenders by category $000
Jan 2004 – Jan 2005 – % Industry Dec 2004 Dec 2005 change
Automotive 20,479,778 19,808,258 -3
Retail 12,515,123 12,565,413 –
Media & advertising 8,663,052 9,393,459 8
Telecommunications 7,638,228 8,010,834 5
Financial 7,322,213 7,898,741 8
Medicines & proprietary remedies 6,916,048 6,869,126 -1
Local services & amusements 6,220,484 6,754,560 9
Insurance & real estate 4,356,074 5,317,937 22
Public transportation, hotels & resorts 4,985,368 5,085,637 2
Restaurants 4,413,707 4,680,193 6
Total 83,510,076 86,384,167 3
Source: TNS Media Intelligence

What we think
the largest number of people in the shortest time at thelowest cost.
Clients need reach. In the US, for example, primetimenetwork television used to reach 90% of households. A few years ago it was 50%; today it is perhaps only 33%.There are, of course, still programmes with significantlyincreased reach, like the Super Bowl or Academy Awardsor Olympic Games or World Cup. But they remain inrelatively fixed supply and their prices are bid up as a result.That is why a 30-second Super Bowl ad costs $2.5 millionand an Academy Awards slot $1.5 million.
This is not a situation that can last, particularlywhen significant segments of the population seem to gomissing. For instance, US audience ratings indicate thatyoung men have disappeared on Monday nights – perhapsgaming on the internet or watching out-of-home in bars –and housewives have defected from soap operas.
Moreover, media fragmentation has increasedsignificantly as the old media become more sophisticatedand the new media proliferate. Technology has improvedthe effectiveness and development of cable and satellitetelevision, newspapers and periodicals, radio and outdoor,while spawning new media in direct, interactive and theinternet. Many of these new media are more measurableand more targeted.
At the same time, media consumption habits arechanging with every generation. Just look at what a four-year-old can do with a computer in a few hours or whatbloggers and hackers do with different value systems.Decision-makers in media owners and agencies tend to be in their fifties and sixties; their sons and daughters and grandchildren are shifting in ever greater numbers tomulti-tasking on the web, personal video recorders (PVRs),video-on-demand, mobiles, podcasts and internet games.
Many leading executives are in denial. They believe– or hope – that such changes will not happen on theirwatch. Yet I know that my own consumption habits havealtered radically over the past few years – more dailynewspapers, fewer periodicals. More cable and satellitetelevision, less network. More web use for information and BlackBerry® e-mail. I am less willing to wait fordetailed analysis in weeklies or fortnightlies. I wantcommentary now. Why should I wait for 10 days or so for in-depth analysis of the Procter/Gillette mergerannounced on a Thursday night? Although, puzzlingly,The Economist still seems to strengthen and passedone million circulation and women seem to be increasingtheir magazine readership.
Similarly, the US has hitherto accounted for abouthalf of worldwide advertising and marketing servicesspending, with the most prominent non-US markets beingJapan, Germany, UK, France, Italy and Spain. That ischanging. Asia Pacific, Latin America, Africa, the MiddleEast, and Central and Eastern Europe are becoming moreand more significant, as multinational corporations buildtheir businesses where populations are growing.
Non-US markets will be increasingly important.Extrapolate WPP’s current revenues in the BRIC countries(Brazil, Russia, India and China) or BRICI (including 200million people plus Indonesia) at the rates of GNP growthpredicted in recently published Goldman Sachs researchdocuments and assume moderate rises in advertising toGNP ratios. The result is that Asia Pacific, Latin America,Africa, the Middle East, and Central and Eastern Europewill take a growing share of our business: possibly 38% by 2015, excluding acquisitions. Perhaps we should look at our activities on a network television and non-networktelevision basis, and a US and non-US basis.
Annual Report 2005What we think74
Hours per person per year using consumer media in US
1999 2000 2001 2002 2003 2004 2005 20061 20071 20081 20091
Total broadcast television 797 793 744 719 696 678 679 684 678 675 681
Total cable & satellite TV 630 674 744 800 847 868 869 871 877 891 881
Broadcast & satellite radio 939 942 952 991 1,003 986 978 975 974 984 984
Newspapers 205 201 197 194 192 188 183 179 175 170 165
Recorded music 281 258 229 200 184 185 179 175 175 169 165
Consumer internet 65 104 131 147 164 176 183 190 195 200 203
Consumer magazines 134 135 127 125 121 124 124 122 122 122 121
Consumer books 117 107 106 109 109 108 106 106 106 106 106
Video games 58 64 66 70 75 77 78 82 86 93 96
Home video 41 43 47 57 60 67 76 84 91 95 99
Box office 13 12 13 14 13 12 12 12 12 12 12
Interactive TV & wireless – – – 4 7 11 15 19 26 32 42
Total 3,280 3,333 3,356 3,430 3,471 3,480 3,482 3,499 3,517 3,549 3,555
Source: Veronis Suhler Stevenson1 Estimated.

What we think
Annual Report 2005What we think 75
Increasingly, the marketing world is becoming two-paced or even three-paced, geographically andfunctionally. Asia Pacific, Africa and the Middle East and Central and Eastern Europe are outpacing the US and the US outpacing Western Europe; the internet andother new technologies are outpacing network television,newspapers and periodicals.
WPP was founded some 20 years ago by two peoplein one room to try to capitalise on these two trends andprovide co-ordinated advertising and marketing servicesthroughout the world.
Events, dear boy
We were spoiled in the 1990s. All you had to do was comeinto the office. With a tightly controlled Rubin/GreenspanUS economy and Friedmanite economics driving the globaleconomy it was relatively easy – despite the world’s secondlargest economic engine, Japan, being out of order for 12 years or so. Strong growth, low inflation and high, butnot full levels of employment, drove a 10-year bull market,such as we have not seen since the 1920s.
The speculative blowout around the internet wasperhaps inevitable and, given its size, a lengthy correctionwas necessary. Overall, the past five years have been painful.After growing consistently through the 1990s, culminatingin organic growth of 15% in 2000 (20% using the yardstickof our competitors), WPP shrank or flattened, on a like-for-like basis, in 2001 and 2002. It resumed modestgrowth in 2003 and 2004 and stronger more broad-basedgrowth in 2005.
Ten fat years, three lean ones and a return to modestgrowth in a lower inflationary environment in the last two– mostly due to quadrennial events in the first of the past
2000 2005 2010 2015 2020 2025 2030 2035 2040 2045 2050
Brazil 762 468 668 962 1,333 1,695 2,189 2,871 3,740 4,794 6,074
China 1,078 1,724 2,998 4,754 7,070 10,213 14,312 19,605 26,438 34,799 44,453
India 469 604 929 1,411 2,104 3,174 4,935 7,854 12,367 18,847 27,803
Russia 391 534 847 1,232 1,741 2,264 2,980 3,734 4,467 5,156 5,870
France 1,311 1,489 1,622 1,767 1,930 2,096 2,257 2,445 2,668 2,898 3,148
Germany 1,875 2,011 2,212 2,386 2,524 2,604 2,687 2,903 3,147 3,381 3,603
Italy 1,078 1,236 1,337 1,447 1,553 1,625 1,671 1,708 1,788 1,912 2,061
Japan 4,176 4,427 4,601 4,858 5,221 5,567 5,810 5,882 6,039 6,297 6,673
UK 1,437 1,688 1,876 2,089 2,285 2,456 2,649 2,901 3,201 3,496 3,782
USA 9,825 11,697 13,271 14,786 16,415 18,340 20,833 23,828 27,229 30,956 35,165
BRIC 2,700 3,330 5,441 8,349 12,248 17,345 23,415 34,064 47,013 63,596 84,201
G6 19,702 22,548 24,919 27,332 29,928 32,687 35,906 39,668 44,072 48,940 54,333
Source: Goldman Sachs
Projected GDP, BRIC vs G6 $bn
Worldwide advertising expenditure US vs non-US
Major media* 2004 2005 2006 2007 2008
North America 168,250 173,271 182,209 189,878 197,369
Year-on-year growth % 6.1% 3.0% 5.2% 4.2% 3.9%
Europe 105,099 109,034 113,666 118,474 123,495
Year-on-year growth % 6.4% 3.7% 4.2% 4.2% 4.2%
Asia/Pacific 78,802 83,162 88,819 95,420 101,816
Year-on-year growth % 6.5% 5.5% 6.8% 7.4% 6.7%
Latin America 13,710 16,038 17,652 18,883 19,905
Year-on-year growth % 13.9% 17.0% 10.1% 7.0% 5.4%
Africa/Middle East/ROW 12,858 15,484 18,450 21,482 25,105
Year-on-year growth % 69.2% 17.0% 16.1% 14.1% 14.4%
World 378,719 396,989 420,796 444,137 467,690
Year-on-year growth % 7.2% 4.8% 6.0% 5.5% 5.3%
Source: ZenithOptimedia
*TV, Print, Radio, Cinema, Outdoor, Internet.
Consumer price inflation Year-on-year % change
01 v 00 02 v 01 03 v 02 04 v 03 05 v 04
France 1.7 1.8 2.1 2.2 1.9
Germany 2.0 1.4 1.1 1.6 2.0
Italy 2.8 2.4 2.6 2.3 2.2
Japan -0.7 -0.9 -0.3 0.0 -0.3
UK 1.8 1.6 2.9 3.0 2.2
USA 2.8 1.6 2.2 2.7 3.3
Brazil 6.8 8.5 14.7 6.6 5.0
Russia 21.5 15.7 13.7 10.9 12.1
India 3.7 4.4 3.9 3.8 4.3
China 0.5 -0.8 1.2 3.9 3.0
Source: ZenithOptimedia

What we think
two and perhaps a growing acknowledgement of theimportance of innovation and branding in the last one.
It seems our business is becoming increasinglyevent-driven, particularly by political events. PresidentBush wanted a strong economic background to his re-election and Prime Minister Blair wanted a similarbackground to his in 2004. President Bush will want thesame for his Republican nominee in 2008 and ChancellorBrown will want the same for his Prime Ministership inthree or four years time. His last budget was a model ofearly-term caution.
Fiscal over-stimulation remains a fear
The US economy was in a political cycle in 2004, as thegovernment used fiscal spending to stimulate the economy.Rates of growth in US government spending were back towhere they were 35 years ago at the height of the VietnamWar. In 2005, the tragedy of Katrina and the continuingdemands of the wars in Afghanistan and Iraq continued to fuel the government spending spree.
It is no accident that governments in many countriesare the largest advertising spenders: ministries use marketingspending to reinforce their policies and build electoralpopularity. The problem is that the US economy is almostentering another Reagan era with huge fiscal deficits, aweak dollar, trade imbalances and the threat of inflation.Isn’t the country’s currency really its stock price?
Source: Budget of the US Government1 Estimate.
President Bush may have to deal with the deficitand the weak dollar by raising interest rates and taxes –thus curbing growth. To date, the recession has hit thebusiness-to-business arena, leaving the consumer relativelyuntouched. Spending has been stimulated by negative realinterest rates and discounting. But there have been recentsigns of consumer weakness on both sides of the Atlantic.The issue remains whether increased corporate profitabilityand liquidity will stimulate a capital expenditure-ledincrease in activity, as the consumer is hit by monetarycorrection. 2005 and early 2006 has so far seen a relativelysoft landing, but corporate capital spending remains
GDP $bn Surplus/deficit (-) as a % of GDP
US government spending Since 1960
17,00015,00013,00011,0009,0007,0005,0003,0001,000
0
3210
-1-2-3-4-5-611109107105103019997959391898785838179777573716967656361
sluggish, not filling the void caused by more sensitive debt-ridden consumers and reduced consumer spending.
We are in a Sarbanes-Oxley, Eliot Spitzer-dominatedworld, where CEOs last on average less than four yearsand CMOs less than two years, and are constantlypressurised to return cash to share owners and hedge funds – themselves pre-occupied by short-termperformance targets. Perhaps that is not an environmentwhere anybody wants to take risks or focus on the long term. Why take chances and be fired? Continue to receive substantial compensation, until you retire inthree or four years.
Getting together
In parallel with this short-term weakness, other pressurespersist. Consolidation continues apace. Among clients,Procter takes Wella and Gillette, Interbrew takes AmBev,Telefonica takes Bell South’s Latin American interests,Cingular takes AT&T Wireless, MCI chooses Verizon,Pernod Ricard takes Allied Domecq, AT&T takes BellSouth. And this at a time when merger and acquisition(M&A) activity is meant to be at lower levels, althoughthere is a sharp acceleration now.
Consolidation among media owners also continuesunabated. NewsCorp takes DirecTV, Comcast tried to takeDisney, Carlton and Granada merge to monopolise ITV.Legislation favours more consolidation in the US and theUK. Even in Brazil, which has been fiercely protectionist,you could buy 30% of Globo or Editora Abril.
“The media owners are not onlyhaving to fend off disintermediationby new technologies, but thepricing pressure from significantconsolidation of media budgets.”
“The issue remains whetherincreased corporate profitability and liquidity will stimulate a capital expenditure-led increase in activity, as the consumer is hit by monetary correction.”
Annual Report 2005What we think76

What we think
Germany allows foreign ownership of TV channels. Italy concentrates further though the Gasparri Bill.
Clients and media owners are not alone. Retailconsolidates, too. Morrison takes Safeway. In LatinAmerica, Wal-Mart enters the North East of Brazil byacquiring part of Ahold’s interests, Lider consumesCarrefour, Jumbo buys Disco in Argentina, and rumourssurround Wal-Mart and Carrefour, and Home Depot and Kingfisher. In line with the laws of big numbers, thechallenge to Wal-Mart, Tesco and Home Depot will behow they can successfully manage expansion outside theirhome markets. Tesco already has half its square footageoutside the UK and has sent out its UK managing directorto the West Coast to manage its US expansion. It will notbe easy; the demands are different.
As a result, it is no surprise that agencies are alsoconsolidating. Certainly in the one area where there are big economies of scale – media buying – consolidation is significant. To negotiate with a Rupert Murdoch,Sumner Redstone, Mel Karmazin, Michael Eisner, Bob Iger or Bob Wright, larger scale is essential. Mediaplanning or buying, or what we call Media investmentmanagement, is one of WPP’s fastest-growing businesses,driven by clients looking for media buying efficiencies –rather than reductions in agency’s commissions. Oftensavings on gross media budgets of 5-10% are achievable.
Media savings are driving client centralisations andare a quick kill in showing efficiencies, as Nestlé andUnilever have shown. The media owners are not onlyhaving to fend off disintermediation by new technologies,but the pricing pressure from significant consolidation ofmedia budgets. But even on the creative side, voraciousprocurement departments and ill-judged price competitionby agencies themselves are driving consolidation (the$100 million pitch win headline in AdAge or Campaign is more satisfying than real revenue). No surprise, then,that Publicis dismantled D’Arcy, itself a consolidation of three agencies – D’Arcy, Masius Wynne-Williams andBenton & Bowles. We ourselves consolidated Cordiant, an amalgamation of Bates and Dorland, among others.
Price promotions: the road to hell
In a low-inflation, over-capacity market with little or nopricing power, many manufacturers have turned to pricepromotion and discounting. Probably the best example is the car and truck industry. General Motors still seems to believe it has a balance sheet advantage over itscompetitors, particularly in Detroit. Why else would itintroduce heavily price-based competition such as five-yearzero-coupon financing or discounts of $4,000 to $5,000 a unit. Probably, the most extreme case was Hyundai in
Korea offering negative interest rates on financing – a formof cash giveback. One dealer in America offered a buy-one,get-one-free deal on sports utility vehicles (SUVs). Luckilyit was a failure.
If you give cars away it is only to be expected thatconsumers buy them. No surprise, then, that the Americanauto market has remained at 16 or 17 million units in thisenvironment, or that housing markets and house pricesshow similar buoyancy, when fixed-term money is beinggiven away at such low interest rates.
The problem is that consumers become used to suchdiscounting and wait for new car or truck introductionsand the discounting that goes with them. The automanufacturers face profitless prosperity and break-eveneconomics at full capacity. Interestingly, the Japanese andKorean manufacturers, and some German ones too, havetended to resist the temptation of excessive discounting,offering lower levels of $1,000 or $2,000. Instead theyconcentrate on design, new products and branding to build a price premium. If you focus on price, you buildcommodities. If you focus on innovation and product and differentiation, you earn a price premium and build brands.
Conclusive evidence of the inadvisability of thisstrategy came when General Motors had to lower itsearnings forecast for 2005 by 80%. Recent comments andactions by General Motors do indicate a slight difference in approach and a shift to more focus on product. Further competition from the Chinese and Indians (Tata)will ram the point home more. The Geely Chinese four-door, five-seat car will be introduced into America in 2008, at under $10,000. Price promotion just does not work. The product is key.
A similarly unfortunate trend is occurring in thefood industry. Packaged goods companies continue to try to build share by discounting and price competition,particularly as distribution concentrates. They pay higher trade discounts and slotting allowances, and fund increased promotional activity. One packaged goodscompany spends about $2 billion on above-the-lineadvertising. Guess what its broadly defined tradepromotions budget is? Two years ago it was around
“If you focus on price, you buildcommodities. If you focus oninnovation and product anddifferentiation, you earn a pricepremium and build brands.”
Annual Report 2005What we think 77

What we think
Annual Report 2005What we think78
Source: Ad Age Global Marketing Report November 2005
Top global marketers spending by category% total 2004 • Automotive 24.2%
• Personal care 18.3%
• Entertainment & media 11.1%
• Pharmaceuticals 8.7%
• Food 8.5%
• Soft drinks 3.5%
• Electronics 3.4%
• Restaurants 3.4%
• Cleaners 3.2%
• Computers 3.2%
• Telecommunications 3.0%
• Retail 2.5%
• Beer, wine & liquor 2.3%
• Financial 2.2%
• Candy 1.1%
• Miscellaneous 1.4%
Recent accounting changes in the US have forcedcompanies to show gross and net sales, at least temporarily.As a result, more data is available on the balance betweenadvertising and promotional spending. Many CEOs know what they spend on advertising, but not on tradepromotion. Often the latter exceeds the former, even inheavy-spending above-the-line companies. It may well be that manufacturers will seek to cut trade spending andboost brand spending, particularly at a time when the tradeis consolidating at such a rapid rate. Bribing customers fordistribution is a recipe for ruin.
Fees, procurement and outsourcing bringopportunities as well as threats
The days of 15% gross commissions – 17.65% on cost –are long gone. Commission levels have receded to around12% gross for full service, including media planning andbuying. Production commissions have largely been reducedor eliminated, although there are interesting procurementopportunities for agencies themselves in television production,as we have seen in Australia.
While commissions persist, fees are becoming morepopular with clients, although that momentum seems tohave slowed recently. They now represent at least 75% ofour business. Usually time-based, with incentives, they areused almost exclusively in our marketing services business,which accounts for 52% of our revenues. In advertising,they account for over half of our business.
Fees have a number of advantages and on balancewe prefer them. They are not seasonal, in a business wherespending tends to be concentrated in the second and fourthquarters. January has become a profitable month. If clientscut or do not spend or continually re-brief us, we still getpaid. Finally, when fee-driven, we tend to plan our annualbusiness better.
Fees have also tended to dampen volatility in ouroperating margins. In the most recent cycle our marginspeaked at 14.5% and bottomed at 12.3%. In this cyclethey have already surpassed 15%. In the previous cycle
$10 billion, today around $12 billion, equivalent to morethan its operating profits and rising by $800 million a year.The CEO described it as the biggest crisis facing the company.Just like the media owners, the food manufacturers arebeing squeezed by a second factor – obesity. Diabetes is apandemic and diabesity becoming a huge area of publicconcern. Increasingly, commodity-like food companies arenot in a strong position.
Interestingly, there is not the same phenomenon in the health-based or well-being segments of the packagedgoods industry. Here, companies are more focused onproduct innovation, research and development or science,along with branding to build stronger market shares. As a result, brands and margins are more robust, andvolumes greater.
Measured advertisingexpenditures $m
AdvertiserCategory 2004 2003% change % total count
Automotive $22,693 $20,116 12.8 24.2 17
Personal care $17,163 $15,230 12.7 18.3 9
Entertainment & media $10,459 $9,709 7.7 11.1 10
Pharmaceuticals $8,197 $7,060 16.1 8.7 11
Food $8,015 $7,550 6.2 8.5 8
Soft drinks $3,331 $3,064 8.7 3.5 3
Electronics $3,186 $2,719 17.2 3.4 6
Restaurants $3,148 $2,898 8.6 3.4 4
Cleaners $2,982 $2,581 15.5 3.2 4
Computers $2,973 $2,857 33.2 2.9 4
Telecommunications $2,791 $2,095 19.8 2.4 3
Retail $2,344 $1,957 19.8 2.5 5
Beer, wine & liquor $2,197 $2,109 4.2 2.3 6
Financial $2,095 $1,683 24.4 2.2 4
Candy $1,067 $941 13.4 1.1 2
Miscellaneous $1,297 $1,196 8.5 1.4 4
Total worldwide $93,938 $83,764 12.1 100.0 100
Source: Ad Age Global Marketing Report November 2005
Top 100 global marketers spending by categoryby measured media bought in 2004 and 2003

What we think
in the early nineties, they peaked at 10.5% and bottomedat 5.6%.
I cannot remember a time, in the 25 or so years I have been in the industry, when clients have been sofocused on cost, although in 2004 and 2005 there weresigns of a growing focus on top-line growth, and innovationand branding – as opposed to costs. Given overcapacity,low inflation and lack of pricing power, and highmanagement turnover, that is perhaps understandable.
However, the question remains whether theprocurement process can successfully purchase creativeservices in the way door handles or widgets are bought.The emphasis on procurement seemed to start in thepharmaceutical industry and then moved elsewhere. It may work in media buying, where there are economiesof scale, but not necessarily in media planning or othercreative areas.
It is true we must improve our processes andeliminate waste, but can you buy ideas or our people’screativity in such a mechanical way? Increasingly, pressureon price will drive our best creative resources to thoseclients and categories where they feel their services areappreciated and rewarded appropriately. Many marketingclients still appreciate great advertising ideas and copydeliver outstanding results. Reducing marketing costsindiscriminately, particularly in industries with heavy fixedproduction costs, will only result in having to spread thosecosts over fewer unit sales.
The procurement process seems to be based on theidea that what we provide is low value-added, and thatbecause we are dependent on significant revenues fromlarge clients, we can be squeezed. This thinking may wellbe flawed. First, what we do is critical. There is a limit tohow far costs can be reduced; but there is almost no limit(apart from 100% market share) to how far you can growrevenues. Second, in an increasingly undifferentiated world,what we do – differentiate products and services, tangiblyand intangibly – is becoming more and more important.Particularly, in the slower-growth markets of the US andWestern Europe, where overcapacity, commoditisationand retail concentration are more pressing issues.
Finally, growing consolidation in our industry is reducing the available resources for clients. It is evermore difficult to find co-ordinated resources that candeliver what they require, particularly if the client is aninternational, multinational or global company. Smaller,country or city-based operations cannot offer the depth of coverage.
One interesting recent development is the growinginterest in outsourcing parts or all of the marketingfunction. Clearly this is an opportunity for us and is being driven by CEOs’ focus on costs and their analysis
of their investment in marketing services. Instead ofconcentrating solely on amounts spent outside theorganisation, closer examination is being made of amountsspent inside the company. WPP has become involvedrecently in outsourcing projects in the car and internetservices industries.
In a number of other areas, including advertising,direct marketing and research, there is interest in what can be done in outsourcing costs. Clearly this tends tomake internal marketing departments more defensiveabout their functions.
Media changes, but creativity is still key
Another significant short-term pressure is mediafragmentation. This has been driven by television priceinflation and falling audiences, as media consumptionhabits change. Developing technologies have given birth to new media such as personal computers, the internet and interactivity. They have also altered the economics of traditional media such as newspapers and magazines,while minority media such as radio, outdoor and cinemahave improved their offerings through better marketingand research.
Few traditional media owners have managed to deal with the disintermediation by new technologies.
Annual Report 2005What we think 79
Top global marketers spending by region% total by measured media bought in 2004 • Africa 0.5%
• Asia 14.0%
• Europe 32.6%
• Latin America 1.9%
• Middle East 0.3%
• Canada 1.8%
• US 48.7%Source: Ad Age Global Marketing Report November 2005
Top 100 global marketers spending by region by measured media bought in 2004 and 2003
Measured advertisingexpenditures $m
% % Country Region 2004 2003 change total count
Africa 457 320 42.8 0.5 3
Asia 13,168 11,449 15.0 14.0 15
Europe 30,655 26,303 16.5 32.6 33
Latin America 1,798 1,964 -8.4 1.9 12
Middle East 255 175 45.3 0.3 11
Canada 1,733 1,456 19.0 1.8 1
US 45,871 42,096 9.0 48.8 1
Total worldwide 93,937 83,765 12.1 100.0 76

What we think
Take Craigslist, for example. Established in 1995 by CraigNewmark, the site provides largely free classified advertisingto millions of users across the globe. The result – a massivereduction in classified advertising revenues for the traditionalplayers (it is estimated that Craigslist costs San FranciscoBay area newspapers up to $65 million per year inemployment advertising alone).
The response from traditional classified advertisers –to produce their own free classified sites. The effect – a permanent reduction in classified advertising revenues, as established classified media owners justify their activities on the basis of cannibalisation. If they don’t eat their own children, someone else will. After all, theinternet is probably the most socialistic or communisticphenomenon we have seen: free information or nearly free information breaking the tyranny or monopolyof distance.
Few newspaper or periodical publishers havemastered the connection with the new internet platforms.Hence Rupert Murdoch’s recent conference speeches with his editors, as well as his decision to re-examineNewsCorp’s new media approach, with McKinsey engagedto look at it, and his rapid purchases of internet assets suchas MySpace. Similar initiatives from network televisionnetwork, NBC owned by GE with i-village and ITV in theUK with Friends Reunited. Others such as the New YorkTimes have made similar moves, but none seem to havebeen able to replace the lost revenues by new ones.
Perhaps the mistake was not to charge for contenton the web in the first place. It is easier to take theconsumer down in price, rather than up. If you do notcharge for content as strong as Condé Nast’s, for example,when can you? Maybe the internet has resulted in apermanent reduction in the revenues and profitability of traditional media owners?
“Clients are re-examining theabsolute levels of their advertisingand marketing services investment.Does it make sense to shift theirportfolio of media investment awayfrom network television to cable,satellite, radio, outdoor, cinema,direct, public relations, interactive,internet or whatever?”
As a result, clients are re-examining the relativelevels of their advertising and marketing services investment.Does it make sense to shift their portfolio of mediainvestment away from network television to cable, satellite,radio, outdoor, cinema, direct, public relations, interactive,internet or whatever? The econometric analysis of mediainvestment is becoming increasingly important. How muchshould we spend and through which media, have becomethe critical questions – the Holy Grail of advertising. The answer to which half of advertising is wasted.
Among the latest media innovations are PVRs,which enable viewers to download television programmeson to a hard disk. The PVR enables you to build your owntelevision channel, recording programmes for screeningwhen you want to see them, and to build a library, as anApple iPod does with music. A PVR also allows you totime-shift programmes as you watch, stopping for breakswhenever you wish. Forrester Research predicts that 50%of US households will have PVRs or video on demand by2007. Others are less bullish, but even the least enthusiasticforecast 12% penetration by then. It cannot be long beforethey are standard equipment in television sets.
Sources: JP Morgan/Enders Analysis/Nielsen
What has made observers particularly excited aboutthe PVR is its ability to fast-forward or skip commercialsaltogether. Market research in the US indicates that consumerslike to fast-forward advertisements – though they stop at beercommercials for fun and car commercials for information.We could do most of this previously with television videorecorders, of course, and the key question remains the amountof time viewers will continue to devote to television viewing.In some PVRs, the skip button has been omitted and fast-forward speeds are limited. In others, little boxes on the PVRscreen will contain details of the ads being fast-forwarded.
Whatever the outcome, such devices will exert more pressure on network television and on agenciesto develop stronger programming and sponsorshipopportunities, along with even more creative advertisingideas. The same will be true of video-on-demand, anothernew and fast-developing technology. The premium oncreativity will grow.
US UK
Forecast of PVR penetration US and UK households %
30
20
25
15
10
0
5
2004 2005 2006 2007 2008 2009 2010
Annual Report 2005What we think80

What we think
The super-agency question
Formed initially in response to the pressures ofconsolidation and to house conflicting accounts, the super-agencies – or what we at WPP prefer to call theparent companies – really represent the full-serviceagencies of the 21st century.
In the 1960s if you visited, for example, JWT inBerkeley Square, London you would find a creativedepartment, a marketing department, an account handlingdepartment, a media department, a public relationsdepartment. There would be a merchandising department,a direct mail department, a packaging department, aproduction department, an experimental film department,a market research department, and a conference department.Even a home economics department with two fully equippedkitchens – plus an operations research department designinga factory for Mr Kipling’s cakes. Long before the phrase‘integrated communications’ came into common use,integrated communications were exactly what such full-service agencies provided.
Over time – and as a result of two pressures – thesedepartments became unbundled. Clients sought to reducecosts – and the media and craft specialists within agencies,feeling under-recognised as members of a mother agency’sdepartment, looked for greater recognition and reward infree-standing, specialist companies of their own.
Importantly, this involved a split between the creativeagency and the media agency, reducing costs fromapproximately 15% of gross media costs to about 12%.Good media people left and started independents such as Carat, Media Planning Group, CIA and WesternInternational, which grew organically and by acquisition.
The same pattern was seen among packaging,merchandising, PR and other specialist skills. Many suchcompanies have now been reabsorbed into the super-agencies, but in an inter-dependent or autonomous form.Strong media or marketing services functional specialistsdo not like, understandably, to be subsumed underadvertising professionals.
As the new specialist media investment managementagencies have grown in power, new media technologieshave developed and the media agencies have developedstrong client relationships, the creative agencies have becomeincreasingly discomforted and called for re-integration.This is not possible, in our view. The toothpaste is out ofthe tube.
Media agencies have declared UDI and gained theirindependence. They will not report again to creativemanagement. If clients want better co-ordination betweencreative and media agency, which in some cases needs to beimproved, the best way to do it is by housing the media
planners in the creative agency, but with them remainingemployed by the media agency. The creative agencies havepaid a heavy price for ignoring the importance of media.
Today, the new super-agencies have a big opportunity.Clients still require, first and foremost, creativity and greatcreative ideas. Secondly, but increasingly, they want betterco-ordination (although it is no good co-ordinating a lousyidea). Finally, they want it at the lowest possible price.
The challenge is therefore to provide the best ideasin the best co-ordinated or integrated way at the lowestprice. To respond to this, the super-agencies will in turnneed to focus on attracting, retaining and developing thebest talent, structuring their organisations in the mosteffective way and incentivising their people successfully –qualitatively and quantitatively.
Until quite recently, this might have been seen as a fad, the concept may now be taking root. Four majormultinational clients – three of them coincidentally,perhaps, with their origins or significant parts of theirbusiness in Asia – invited the four or five largest holding orparent companies to present for their global advertising andmarketing services business. In all cases the presentationsincluded advertising and media investment management,and direct – and in one case research. All these clients werelooking for an integrated global solution to their needs andfor groups that can offer alternative solutions – potentiallya weakness of the single network.
In all four pitches, a group or parent companysolution was selected. WPP tribes were successful in two ofthem. In the third, we were unable to field our strongestline-up because of conflict issues in one of the tribes and in the fourth conflict was probably a significant issue.
The CEO of one eliminated parent company in the first round of the first pitch declared that this was not a trend. Now that at least four pitches have takenplace, he has changed his mind and is pursuing a holdingcompany approach. In addition, many other group pitcheshave taken place – particularly in pharmaceuticals – thathave been under the trade papers’ radar. The only issuepreventing this from being a trend is whether clients can be convinced of the benefits.
The middle of the road is becoming an increasinglydifficult place to be, with traffic coming from both directions.Those agencies excluded from the super-agency pitchesbecause they lack the scale and resources must be feelinguncomfortable. Our business is increasingly polarisingbetween the very big at one end and the small at the other.
Annual Report 2005What we think 81

What we think
Annual Report 2005What we think82
Further down the line – a much brighter picture
Source: Millward Brown Optimor
Top 100 brands by location 2005%• USA 53%
• France 9%
• Japan 9%
• Germany 8%
• UK 6%
• Spain 3%
• Switzerland 3%
• China 2%
• Italy 2%
• Sweden 2%
• Finland 1%
• Korea 1%
• Netherlands 1%
Five key factors underpinning longer-term growth
Strategically, a better future
While the internet bust of 2000 temporarily clouded theshort-term outlook, 2004 and 2005 highlighted that thelong-term future for advertising and marketing services, for innovation and branding, remains very rosy. There arefive key reasons why the services we provide will becomeincreasingly relevant.
Globalisation or Americanisation
Commercial life has not worked out as ProfessorTheodore Levitt predicted it might some 21 years agoin the Harvard Business Review. The world has not
been globalised to the extent he predicted, whereconsumers around the world consumed similar products,marketed in the same way everywhere. Indeed, Levittadmitted as much in an interview to celebrate the 20thanniversary of his article. He was exaggerating to make a point.
Truly global products only account for around 10-15% of our worldwide revenues. Consumers areprobably more interesting for their differences than theirsimilarities. Recent political developments support this –the collapse of the Soviet Union, Yugoslavia, devolution in Scotland and Wales, Basque nationalism and Iraqifactionalism. Indeed, the European Union is really asupply-side led phenomenon, harmonising production and distribution, rather than demand. On January 1, 1993, a Euro consumer was not born.
What has been going on may well not be theglobalisation of world markets, but their Americanisation.Not in the sense that upsets the French or the Germans andresults in the banning of Americanisms from Frenchcommercial language, an objection to the culturalimperialism of Coke, the Golden Arches or Mickey Mouse.More in the sense of the power and leadership of the US.In most industries, including our own, the US accounts foralmost half of the world market. And given the prominence
of US-based multinationals, you could argue that almosttwo-thirds of the advertising and marketing services marketis controlled or influenced from there. If you want to builda worldwide brand you have to establish a big presence inthe world’s largest market – the US.
At WPP, 22 of our top 40 clients are headquarteredin the US, 17 in Europe and one in Asia Pacific. Moreover,they are almost all located in the north-east corridorcreated by Chicago, Detroit, New York and Washington.Failure to understand the importance of North Americacan be life threatening. Take the case of the investmentbanking industry. Fifteen to 20 years ago, strong brands inEurope included SG Warburg, Morgan Grenfell, Schrodersand Flemings. Today they have virtually disappeared.Large American banks like Goldman Sachs, MorganStanley, Merrill Lynch, Citigroup and Lehmans dominate
Top 20 global brands 2005
Rank Brand Parent Value ($m)
1 Microsoft Microsoft Corporation 62,039
2 GE (General Electric) General Electric Company 55,834
3 Coca-Cola The Coca-Cola Company 41,406
4 China Mobile China Mobile (HK) Limited 39,168
5 Marlboro Altria Group, Inc. 38,510
6 Wal-Mart Wal-Mart 37,567
7 Google Google Inc 37,445
8 IBM IBM Corporation 36,084
9 Citi Citigroup Inc 31,028
10 Toyota Toyota Motor Corp 30,201
11 McDonald’s McDonald’s Corporation 28,985
12 Bank of America Bank of America Corporation 28,155
13 Home Depot The Home Depot, Inc. 27,312
14 Nokia Nokia Corporation 26,538
15 Intel Intel Corporation 25,156
16 Vodafone Vodafone Group Plc 24,072
17 BMW BMW AG 23,820
18 Disney The Walt Disney Company 22,232
19 UPS United Parcel Service, Inc. 21,830
20 Cisco Cisco Systems, Inc. 20,922
Source: Millward Brown Optimor

What we think
the industry. While strong European talent might have hadmisgivings about working in American multinationals afew years ago, today these businesses are more sensitivelyrun and offer interesting, intellectually stimulating globalopportunities and challenges. The European-basedbusinesses that remain, such as Deutsche Bank, UBS andCredit Suisse, still face the challenge of establishing a goodmarket position in the US.
Neither is it easy to find European-based globalcompanies. BP and Shell certainly get it, as do Unilever and Nestlé. So does DaimlerChrysler, although JurgenSchrempp’s strategy is being dismantled. Vodafone,GlaxoSmithKline, AstraZeneca, L’Oreal and Sanofi areother good examples, although doubts in some casesremain. There are not many more.
American strength is based on three factors. First,the size and power of the American market; 295 millionpeople in a relatively homogeneous market. Despite the
“While strong European talent might have had misgivings about working in Americanmultinationals a few years ago,today these businesses are moresensitively run and offer interesting,intellectually stimulating globalopportunities and challenges.”
European Union being almost twice the size, it is muchmore heterogeneous. Second, the power and size ofAmerican capital markets. If you want to raise debt orequity capital, it still is the cheapest place to go. Finally,because of their strength in technology. It is hard to thinkof many areas where they do not lead. Third-generationmobile phone technology is one, but given the prices thatEuropean companies paid for the privilege, the distinctionis a dubious one.
At various times in history, when a country orempire seemed to have total political, social or economichegemony, the situation changed and the vacuum was filled
Annual Report 2005What we think 83
Source: Dealogic
*Q1 deal value comparative numbers
US deal flow02
03
04
05
06
0 500 1,000 1,500 2,000 2,500 3,000Volume Value $bn
Merger and acquisition activityEuropean deal flow
02
03
04
05
06
0 500 1,000 1,500 2,000 2,500 3,000Volume Value $bn
Top 10 global advertisers 2004
Worldwide US measured Spend Rank advertising spend $m media spending $m by region 2004 $m
% % Latin 2004 2003 Advertiser Headquarters 2004 2003 change 2004 2003 change Asia Europe America
1 1 Procter & Gamble Cincinnati 7,922 6,734 17.6 3,572 3,165 12.9 1,351 2,547 214
2 3 General Motors Corp. Detroit 3,918 3,293 19.0 2,798 2,371 18.0 137 779 83
3 2 Unilever London 3,462 3,395 2.0 603 621 -2.9 855 1,719 190
4 5 Ford Motor Co. Dearborn, US 2,798 2,434 15.0 1,643 1,449 13.4 98 919 51
5 7 L'Oreal Paris 2,646 2,284 15.8 768 677 13.5 144 1,613 49
6 4 Toyota Toyota City, Japan 2,608 2,475 5.4 1,098 1,016 8.0 901 499 20
7 6 Time Warner New York 2,495 2,301 8.4 1,938 1,833 5.8 129 387 9
8 8 DaimlerChrysler Auburn Hills Mich/Stuttgart Germany 2,371 2,081 14.0 1,811 1,607 12.7 38 439 30
9 11 Johnson & Johnson New Brunswick, US 1,922 1,700 13.0 1,393 1,276 9.2 105 355 17
10 9 Nestlé Vevey, Switzerland 1,899 1,848 2.8 498 523 -4.7 270 1,003 87
32,041 28,545 12.2 16,122 14,538 10.9 4,028 10,260 750
Source: Ad Age Global Marketing Report November 2005

What we think
by another power. At this point in time, it may well beChina that takes this role, in the context of the growth ofAsia Pacific. Although this development was delayed by the tragic events of 9/11, as the US and China grappledwith trying to understand actions in the Muslim world,this trend is now in full swing.
In fact, we may now be witnessing a change fromAmericanisation to globalisation. In Davos this year, theChinese and Indians exhibited a larger degree of self-reliance and independence. Both seem to be no longerrelying on handouts or support. Both economies havereached or are reaching a size and rate of growth that maybe self-sustaining and certainly more independent of a USbase and influence. But we will probably still rely on thestrength of the US and if the US sneezes, we all catch cold.
However, increasingly we will see the growth ofAsian-based multinationals. Not only the Japanese-basedmultinationals like Sony or Mitsubishi, or the SouthKorean-based chaebols such as Samsung, LG or Hyundai(the Samsung of the automobile industry). But the Chinesemultinationals such as Lenovo, Haier, Konka, Bird, Bright Dairy, China Mobile, Unicom and CNOC (they will come again). And the Indian multinationals such asthe two Reliances, Tata, Wipro and Infosys. The latter’sheadcount is up from 15,000 to 60,000 in the past fouryears. It plans to increase by a further 10,000 in the nexttwo years. China will increasingly become a service-basedeconomy. The mayor of Shanghai last year called for the55 CEOs on his International Business Leaders Advisory
“In Davos this year, the Chinese andIndians exhibited a larger degree ofself-reliance and independence.”
Council to advise on how to build Shanghai into the world’sleading services centre. Similarly, India will seek to be amanufacturing centre for the world and not just focused on services.
Asia Pacific: a giant opportunity unfolds
It is difficult for those of us in the West to comprehend thescale of Asia Pacific’s potential development. China is notjust one country; it consists of more than 30 provinces, withso many languages and dialects that Mao Tse Tung neededan interpreter. But it is equivalent to four or five Americas.It is true also that currently only 150-200 million Chinesecan afford the goods and services we are trying to marketto them. However, this is already equivalent to over half an America and this is a dynamic situation, one that willchange rapidly in the coming years. Furthermore, India –itself equivalent to three to four Americas – seems to havebeen stimulated into more rapid growth, driven perhaps by neighbourhood envy and the Chinese model of statedirected capitalism – although they bill themselves as theworld’s fastest-growing democracy. Do not underestimatethe potential of the region as rapprochement spreads evento cricket, with the Indian-Pakistani test and one-day seriesrepresenting as important a political, economic and socialsignal as the Beijing Olympics.
I am always amused by Sir John Bond’s example of Sock City at Datang. It can produce nine billion pairs of socks a year, one and a half pairs for everyone on theplanet; 100,000 sock buyers visit Sock City each year forits trade fair.
Asia Pacific will dominate again. This really is back to the future. In 1820, China and India generatedaround 49% of worldwide GDP. In the early 19th century,Meissen and Wedgwood were dismantling the high-quality,high-price Chinese porcelain industry, with similar quality
Annual Report 2005What we think84
Advertising expenditure As a % of GDP
2000 2001 2002 2003 2004 2005 2006 2007 2008
France 0.72 0.66 0.62 0.61 0.62 0.61 0.61 0.61 0.61
Germany 0.98 0.89 0.80 0.75 0.75 0.73 0.72 0.72 0.71
Italy 0.69 0.64 0.60 0.60 0.62 0.63 0.62 0.62 0.62
Japan 0.90 0.89 0.84 0.84 0.86 0.86 0.87 0.90 0.89
UK 1.11 1.02 0.97 0.95 0.97 0.96 0.97 0.97 0.97
USA 1.60 1.45 1.43 1.39 1.38 1.33 1.32 1.33 1.32
Brazil 0.89 0.78 0.72 0.73 0.77 0.83 0.91 0.93 0.95
Russia 0.32 0.44 0.64 0.67 0.67 0.81 1.00 1.25 1.55
India 0.34 0.36 0.36 0.40 0.44 0.48 0.47 0.46 0.45
China 0.44 0.43 0.47 0.52 0.51 0.52 0.55 0.59 0.66
Source: ZenithOptimedia

What we think
but low-priced porcelain. It is the exact reverse today. In 2025, these two countries are forecast to be headed forthe same level of world GDP, having bottomed out at 8%in 1973. Currently, China and India represent over one-third of the world’s population. Asia Pacific represents one-half. By 2014, Asia Pacific will represent over two-thirds.Greater China is already WPP’s fifth largest market inwhich we have a strong 15% share. In India, our marketshare is almost 50%, with a 25% share in South Korea. In Japan, it is almost 10%, behind the dominating Dentsuand HDY, but the largest gaijin firm. In Indonesia we areranked number one, with the lion’s share of the market.
China’s development has been rapid and willcontinue. The Chinese government is conscious ofpotential overheating and an imbalance in regional rates of development between the coastal regions and thehinterland. There has already been a very soft-landingslowdown in growth, which presents more opportunity for investment. 2008 represents a huge opportunity. Noself-respecting multinational company bent on expanding
into China or national company seeking to grow inside oroutside China will miss out on the branding opportunitypresented by the Olympics in Beijing. The Chinesegovernment is already committed to $45 billion ofinvestment around the Games (the UK government willprobably invest $10 billion), in a year that will also bestimulated by the US Presidential election. 2008 should be a whopper. And it will not end there. The Municipality of Shanghai will be investing $3 billion in Expo 2010.
Watch out for growing Chinese military influence.Recent economic contact with Fidel Castro in Cubacounterbalances Taiwanese tensions. Chinese investment in Galileo’s GPS systems drew a coruscating response from the Pentagon. Beijing will not be prepared to rely on America to defend its vital and growing energy supplyinterests in the Middle East and Russia and is busilybuilding trade bridges throughout the oil and energyproducing areas of the world.
The other challenge to American dominance maywell come from the Muslim world. Already, Muslimsnumber 1.5 billion people or a quarter of the world’spopulation. By 2014, Muslims will number 2.1 billion or 30% of the projected world’s population. The recentstruggles in Afghanistan and Iraq, and possible actionagainst Iran, really only continue the conflicts of the 1950s in Suez, the oil price increases of the 1970s and the invasion of Kuwait in the 1990s. Westerners have made little attempt to understand the Muslim mind andassume they have the same value systems and beliefs. They are different and it will be increasingly necessary to make a serious and sincere attempt to understand them.
These events may demand new thinking from the world’s multinational companies. As US-centriccompanies, for example, seek to develop their businessesand extend their reach into more heterogeneous markets, it may well be that the balance of organisations will shift.There will continue to be a focus on global, max or corebrands, with sales of more than $1 billion, particularly to counterbalance the power of global retailers and ascompanies become less dependent on the US markets.Coca-Cola’s geographic coverage of a third in NorthAmerica, a third in Europe and a third in Asia Pacificand Latin America will become more the norm, rather thanPepsi-Cola’s 63% in the US.
A local approach to more heterogeneous markets
However, given this geographic expansion, there will alsobe a need to develop more sensitive, local organisationsthat respond to national opportunities and challenges more readily. The past 10 to 15 years have seen, quiterightly, a diminution of power of country managers,
Annual Report 2005What we think 85
2002 2003 2004 2005 20061 20071
World 3.1 4.1 5.3 4.8 4.9 4.7
Advanced economies 1.6 2.0 3.3 2.7 3.0 2.8
USA 1.6 2.7 4.2 3.5 3.4 3.3
Euro area 0.9 0.7 2.1 1.3 2.0 1.9
Germany 0.1 -0.2 1.6 0.9 1.3 1.0
France 1.3 0.9 2.1 1.4 2.0 2.1
Italy 0.3 0.1 0.9 0.1 1.2 1.4
Japan 0.1 1.8 2.3 2.7 2.8 2.1
UK 2.0 2.5 3.1 1.8 2.5 2.7
Canada 3.1 2.0 2.9 2.9 3.1 3.0
Other emerging markets and developing countries 5.1 6.7 7.6 7.2 6.9 6.6
Africa 3.6 4.6 5.5 5.2 5.7 5.5
Developing Asia 7.0 8.4 8.8 8.6 8.2 8.0
China 9.1 10.0 10.1 9.9 9.5 9.0
India 4.2 7.2 8.1 8.3 7.3 7.0
Middle East 4.3 6.6 5.4 5.9 5.7 5.4
Brazil 1.9 0.5 4.9 2.3 3.5 3.5
Central & Eastern Europe 4.4 4.7 6.5 5.3 5.2 4.8
Commonwealth of Independent States 5.3 7.9 8.4 6.5 6.0 6.1
Russia 4.7 7.3 7.2 6.4 6.0 5.8
Source: IMF September 20051 Estimated.
Overview of world economic outlook projections GDP growth %
What we think
as companies sought to reduce needless duplication and stimulate the sharing of knowledge. Eradicatinggeographic silos and fiefdoms made sense. However, ascountry-based organisations have become more complexand sizeable, there may be a need to develop more focus at a country level. Several clients have started to re-buildcountry organisations and re-appoint country managers or ambassadors, particularly as their organisations becomemore complex at a country level and they need to buildgovernmental or academic influence at a country level.
As a result, regional management has beenscrutinised. With the development of technology andcommunications, organisational span-breakers may not be so necessary. In addition, given the complexity ofregional tasks, regional managers really become glorifiedfinancial directors. The average agency regional director in Europe, for example, may have to cover 100 offices in a 250-day working year. It is difficult to add significant valuespending an average of one to two days in each office a year,even if he or she travelled all year.
At WPP, we are experimenting with two neworganisational responses. First, Global Client Leaders to manage big clients across WPP on a worldwide basis.Second, WPP Country Managers focusing on three keyissues – people, local clients and acquisitions. Both responsescause angst to our operating company or tribal leaderswho continue to have primary organisational control. Both cut across the traditional organisational structures.Both demand new ways of working together, denying turf, territory and ego. Both raise questions about motives and methods and values. But, both are necessary, responding to client needs and developments.Organisations are becoming more and more networked and less and less pyramidic. Perhaps the 21st century is not for tidy minds.
Overcapacity and the shortage of human capital
The single biggest long-term issue facing our clientsin most industries is overcapacity. In fact, it isdifficult to find many cases where the opposite is
true; tequila, perhaps, where it takes seven years to growthe herb, or watches or high fashion companies like Rolexor Hermes where supply is limited. It is also true thatcommodity-based industries, like oil and steel, no longerface overcapacity issues, being overwhelmed by Indian andChinese demand. But most industries face situationssimilar to the car and truck industry, where companies canmake 80 million units and consumers consume 60 million.
Overcapacity issues are particularly difficult to dealwith in politically sensitive industries like automobiles.Governments are not enthusiastic about shutting down
capacity and increasing unemployment. They also like toincrease capacity by offering inducements to locate newproduction facilities in development regions. Thus the best thing for the European car industry would probablyhave been for GM to absorb Fiat’s production capability.But ex-Italian Prime Minister Silvio Berlusconi could notcountenance more unemployment in the Mezzogiorno. The same issue faced the British government with Roverparticularly during an election, resulting in subsidisingworkers to stay in work during the campaign period.
The critical issue in the 19th and 20th centuries was how to produce goods and services, and to make sure they reached the consumer. In the 21st century, it is convincing the consumer to purchase your product,service or brand in the first place.
In such circumstances differentiation becomescritically important, and differentiation is what ourbusiness is about. Historically, maintaining technical or product differences was easier. Today keeping atechnological lead is difficult. Product life cycles are being shortened and brand cycles lengthened. Again, an example from the car industry; less than a decade ago it took five years to design, produce and market a car.Today, it can be done in 18 months. Led by the aggressiveJapanese, South Korean and German manufacturers, theAmericans have followed.
Intangible differentiation is, then, becoming moreimportant. Psychological, life-style and emotionaldifferences are significant. The suit or dress you wear, the car you drive, the holidays you take, how you spendyour leisure time – all say a lot about your personality and preferences. Some find such intangible appeal immoralor at least unsavoury. Preying on people’s vulnerabilities, it is said, is unethical. However, we believe that fulfillingpeople’s desires or dreams is almost always justifiable andsatisfying for the consumer – and it is a key role for theadvertising and marketing services industry.
While there is certainly too much production andcapacity in general, what specific resource in the 21st centuryis in ever shorter supply? The answer is human capital.Every demographic statistic points to a reduction. Theslowing birth rate, declining marriage rates, higher divorce
“In a less differentiated world, it willbecome more and more importantfor companies to stand out throughthe quality and responsiveness oftheir people.”
Annual Report 2005What we think86

What we think
rates, more single parent families, smaller families, ageingpopulations – all these factors are reducing the supply oftalent. Even countries with strong, younger demographics,such as Mexico, will face similar situations by 2020. Thereare examples of government campaigns trying to stimulatethe birth rate. Western Europe and Japan face significanteconomic growth issues as a result of the decliningproportion of young people and an overall populationdecline. That is one of the reasons why the rapid inclusionof Turkey into the EU is so important: another source ofpopulation growth, as well as immigrants to stimulateeconomic growth and access to the Muslim world.
All this points to the growing importance of attracting,recruiting, developing, training, motivating, incentivisingand retaining human capital. In a less differentiated world,it will become more and more important for companies to stand out through the quality and responsiveness oftheir people. Making sure that your people buy into yourstrategy and structure will be increasingly important.Living the brand – operationally – will be critical.
The web comes back from the dead, stronger than ever
Since the dotcom implosion of 2000 it had becomefashionable to dismiss the web. However, WPP’ssmarter clients and those who missed out on
opportunities in the 1990s have taken advantage ofdepressed values and a contrarian position. Web activity,broadly defined, currently accounts for more than $1.5 billion of WPP Group revenues, or more than 15%. It is growing rapidly.
Source: IAB
*Q1 1999 – Q2 2005
UK online revenue £m400
300350
250200
150100500 99 Q2 Q3 Q4 00 Q2 Q3 Q4 01 Q2 Q3 Q4 02 Q2 Q3 Q4 03 Q2 Q3 Q4 04 Q2 Q2 Q3 05 Q2
Online media revenues 1999-2005* US online revenue $m
3,000
2,000
2,500
1,500
1,000
500
0 99 Q2 Q3 Q4 00 Q2 Q3 Q4 01 Q2 Q3 Q4 02 Q2 Q3 Q4 03 Q2 Q3 Q4 04 Q2 Q2 Q3 05 Q2
There seem to be three reasons why. First, there is still the threat of disintermediation. A horrible word;perhaps some explanation is needed. Let’s take an examplefrom our own business. More than $1 billion of WPP’srevenues come from market research. Traditionally,research has been done on the phone and through the post.The process is long and cumbersome. A questionnaire hasto be designed, distributed and filled in by consumers orinterviewers. Then data is collected, analysed andconclusions developed. It can all take three to six months.Many CEOs despair that by the time the solution has beenidentified, the problem has changed. Using the internet,however, the research process can be transformed andresponses obtained almost instantly. WPP’s Lightspeedpanel interrogates more than 17 million consumers globallyand can deliver answers inside 24 hours.
Second, you continue to be disintermediated bylower-cost business models that are evaluated by investinginstitutions in new and different ways. Despite the recentvicious compression in valuations and consequent losses,the financiers of new media and technology companies still focus on sales, sales growth and market share, ratherthan on operating profits, margins, earnings per share andreturn on capital employed.
Finally, the internet and new media companies stillsteal your people. After the bankruptcies and failures, manyyoung people returned to the more traditional businessesthey had left. WPP lost a number of such bright talents andlater welcomed some back to the fold. I conducted a numberof so-called re-entry interviews, and hoped to see and hearthat the returnees were relieved to have their jobs back. Far from it: few grovelled. Instead they admitted that,given the opportunity again, they would take it or seize asimilar one. And recently, in the last year or two, withthe emergence of the second internet boom, so called ‘Web2.0’, it is clear there is another wave of interest amongbright, young people over new technologies and attractiveopportunities at new technology companies.
Clearly, the age of apprenticeship inside largecorporations is finished. It was weakened by the corporatedownsizing of the 1980s and 1990s, and the final nail in the coffin was the internet boom of the late 1990s.Young, bright talent will always seek out new, flexible, un-bureaucratic, responsive companies. Staying with one company for 40 years or so – as my father and motherdid and advised me to do – no longer seems the best careerchoice. However, some recent polling and attitudinalanalysis in the UK shows younger people want a betterwork-life balance. Hedge funds, for instance, are moreattractive than investment banks, offering fixed work timesand not demanding all-night toil.
Annual Report 2005What we think 87

What we think
Google: friend or foe?
After Microsoft, who becomes the Dark Star? To some, Google fits the bill. It has a marketcapitalisation, despite recent volatility, of
approximately $135 billion, revenues of $6 billion, 5,680people in 50 offices. The stock markets are saying somethingabout valuation in relation to our own $15 billion valuation,$10 billion of revenues, 72,000 people (excluding associates)in 2,000 offices. To the CFO of Google, the laws of largenumbers may start to operate at $5 billion dollars ofrevenues, but Google’s success is clear and its economicpower is very substantial.
So is Google friend or foe? On the amicable side,we, for example, are its third largest customer and it isoffering incentive programs for us to buy more. We havealso run seminars for some of our largest and mostimportant clients to try to build mutual relationships.
On the less friendly side, at Davos this year, CEOEric Schmidt said it was targeting the advertising sector, a $700 billion industry. When reminded it was probably a trillion dollar industry, he said great, as that would be a 50% bigger opportunity!
Google has already taken several initiatives. It has runan experiment: wholesale purchasing print media and retailingthe space in smaller amounts to clients. Not successfulinitially, according to Business Week, but it can try again.It has hired creative people to write ads. It has approachedUS clients directly to see if it can set up a direct, electronicmedia buying exchange. It is looking at mechanical mediaplanning and buying models, which can be accessed throughthe web. It purchased dMarc, a radio internet-based companyfor $100 million down and a three-year earn-out possiblyworth $1.1 billion! Google has also concluded its billion-dollar deal with AOL, and Time-Warner has indicated ininternal memos that they plan to co-operate with Google intelevision, print and other media. The opportunity exists,although it is doubtful if the traditional Time-Warner operatingcompany verticals will be easily persuaded to give up ondigital expansion and opportunities to meet their budgetsand targets. It has also started to offer a free analytic service.
All in all, Google is opening up the attack on manyfronts. Perhaps too many, particularly when you considerthe other fronts they are fighting on, such as book publishing.One gets the impression they are throwing a lot of mudagainst the wall to see if any sticks. Yahoo has a differentapproach, working through its agency partners andbelieving in the power of people, rather than Google’sgreater focus and belief in technology.
With investment, we can reproduce any of the mediaplanning and buying technology developed and have alreadyaccessed search revenues effectively. Unlike the media owners,
we are not investing in a single technology or makingtechnological bets. We are purveyors of media investmentalternatives and as long as we are not excluded from anysingle, powerful technology and have the talent to analysethe media alternatives, we will remain relevant and valuableto our clients. Unlike media owners, who unless they cover the media waterfront, are exposed to one technologyor another.
Warren Buffet used to say in the 1970s, when he invested directly in IPG and Ogilvy, that agenciesrepresented a royalty on the international growth of US-based multinationals. Perhaps today, parent companyinvestment represents a royalty on the growth of newmedia technologies.
Let’s talk
Given the scale of strategic and structural changegoing on inside most companies, one of the mostimportant challenges facing CEOs is to communicate
that change internally. Internal communication to secureinternal alignment is, perhaps, a polite way of putting it.Probably the biggest block to progress for our clients –and perhaps ourselves – is internal politics. Turf, territoryand ego prevent productive change. If the chairmen orCEOs of our clients saw what we saw, they would behorrified. If they and we devoted 50% of the time thatthey or we spent on internal politics on the consumer, client or competition, they and we would be considerablymore successful.
You could argue that most of the communicationwe co-ordinate is aimed at internal audiences rather thanexternal ones. As some people, such as Allan Leightonwhen he was at Asda, have maintained that making sureyour internal constituencies are on side is often moreimportant than external ones. Only when internalcommunications are working can your company talkpositively to customers, suppliers, potential customers,potential employees, journalists, analysts, investors,government and NGOs.
“As long as we are not excludedfrom any single, powerfultechnology and have the talent to analyse the media alternatives,we will remain relevant andvaluable to our clients.”
Annual Report 2005What we think88

What we think
Building such virtuous circles in a uni-brandedcompany is one thing. Inside a multi-branded companysuch as WPP, which has grown by acquisition, our tribesoperate independently to deal with dis-economies of scaleand client conflict. It is far more complicated. Trying toensure 92,000 people face in the same direction at thesame time is not easy. On the other hand, once achieved,internal unison and common focus make up a very, verypowerful army.
It may not be fashionable to talk about charismaticor strong CEO leadership; the focus is more on the CEO as coach, mentor or team leader. But our experience is thatthe most successful companies with which we work arewhere the CEO understands the importance of the brand,has a strong vision and implements through a strong CMO.After all, at long last, it is understood that all business strategyis really marketing strategy, starting with the consumer andworking backwards from there.
Most of our companies develop internalcommunications through Advertising, Media investmentmanagement, Information, insight & consultancy, Publicrelations & public affairs, Branding & identity, andHealthcare and Specialist communications. However, no single operating entity exists within WPP to executeinternal communications on a worldwide basis. Still anopportunity for the future.
Distribution: the CEO’s nightmare
Whenever we ask CEOs what keeps them awake atnight or worries them when they get up in themorning, they almost always give the same answer:
distribution. Some 18% of Procter & Gamble’s worldwidesales (pre-Gillette) go through Wal-Mart. The figure isprobably 25-30% in US sales. Henkel recently bought DialCorp, 30% of whose sales go through Wal-Mart. Clorox,another Henkel-connected company, sells 30% of its USproducts through Wal-Mart. One of WPP’s media partnerssells 10% of its cover sales through Wal-Mart. To the mediaowner, this is life or death. To Wal-Mart it is a rounding errorand the province of the third or fourth level of procurement,making the publisher’s life a misery. More people visit Wal-Mart in the US in one week, than go to church on a Sunday. Indeed, some say Wal-Mart is the new religion.Wal-Mart, with $312 billion of sales, is the seventh largest“country” by retail sales, not far behind China. Wal-Martaccounts for 8% of US retail sales, Tesco for 12% of UKretail sales and 31% of the UK grocery market.
Influence over and control of distribution is not a newissue. In a sense, it is back to the future. After all, advertisingwas developed in the 19th century by manufacturers toappeal over the heads of wholesalers or retailers direct to
consumers. Increasing retail concentration – not only in theUS but also in Europe and Latin America – will onlyemphasise the importance of focusing on productinnovation and branding, along with better understandingof point-of-purchase consumer behaviour and emphasis on packaging, display and retail design. After all, as onesenior Asia Pacific Procter & Gamble executive saidrecently, depending on which P&G brand you are talkingabout, something between 30% and 80% of purchasingdecisions are made at the point of sale. Procter terms it“the first moment of truth”.
WPP believes an understanding of distribution and retail is essential and it is one of our core practicedevelopment areas. The Store, our virtual retail agency,links more than 900 retail professionals around the world,updating them on the latest developments and trends –subject to client confidentiality. MVI in Boston – with more than 50 global retail analysts – along with Cannondaleand Glendinning Associates, both experts in channelmanagement, supplement and consolidate our knowledge of global retailing.
In addition, 141 Worldwide gives the Group aneven broader distribution offer with its focus on productcategories that have been denied access to traditional media.
Conclusion
With recessionary forces abating in 2003 and quadrennialforces driving the industry to new highs in 2004 and 2005,the short-term picture for the communications servicesindustry has improved. The next quadrennial cycle of2005-2008 looks stronger.
The immediate issues of government overspending,consolidation among clients, media owners, retail andagencies, increasing trade and price promotion, fees,procurement and outsourcing, media fragmentation andsuper-agencies all bring opportunities as well as threats.2006 should show more improvement.
In the longer term, advancing Americanisation orthe new true globalisation and the growth of Asia Pacific,overcapacity and the shortage of human capital, the web,the demand for internal communications and retailconcentration should together underline and assure theimportance of our industry and its constituent parts,advertising and marketing services. The latter as aproportion of GNP will burst through the cyclical highestablished at the peak of the internet boom in 2000.
Annual Report 2005What we think 89

What we think
The Life (in brief) by Jeremy Bullmore
hese four pages are devoted to a brief biography of Stephen Kingfollowed by an analysis of his published writings and edited highlightsfrom them.
For many readers of this Report, Stephen’s will be an unknownname, but he earns his place here for many reasons. He spent 31 years
with J. Walter Thompson; four years as a non-executive director of WPP; and seven years as a director of The Henley Centre. He was also Visiting Professor of Marketing at the Cranfield School of Management.
In the course of this long career, he subjected the business of advertising –and indeed, of all marketing communications – to an intellectually rigorousinterrogation that to this day has never been equalled. By exposing cant andsloppy thinking, always deftly, he illuminated advertising’s real value. His healthyscepticism and lethal demolition of pseudo-science were never allowed to remaindestructive; he turned them, always, into positive insights and guidelines of greatclarity and practical application.
Today, account planning is an accepted agency discipline around the world;and it was Stephen – concurrently and almost coincidentally with Stanley Pollittof BMP – who re-thought the planning process from the bottom up and formeda new department to practise it. The first Account Planning Department, withStephen in charge, opened for business in JWT London in 1968. The worldwideagency had long enjoyed the reputation, first earned in America in the 1930s, of being ‘the university of advertising’. Account planning, and the disciplines itpreached, built on this reputation and were in time adopted by the entire company.
But neither Stephen not his beliefs were remotely ‘academic’ in thedismissive sense of that word. Typically, he called his planners’ guide-books,Toolkits: if a greater understanding of theory didn’t lead to more efficientcommunication, then he had no time for it. For him, function was everything.
Perhaps his greatest talent lay in developing theories and practices thatoutlawed imprecision when setting strategy while liberating the imaginationwhen turning that strategy into creative execution. He was, himself, bothnumerate and literate – and knew instinctively when it was time for rationalityto give way to unfettered speculation.
Much of his writing, including prize-winning papers, is as perceptive andtelling today as when it was written. With the enthusiastic support of his wifeSally, work is already in hand to re-publish much of it, with up-to-date comment.Meanwhile, Judie Lannon (who like me had the great good fortune to workwith Stephen over many years) here reminds us of some of the many highlights.
Annual Report 2005What we think90
The Life & Works of Stephen King1931-2006

What we think
Annual Report 2005What we think 91
The proper approach is a cycle of analysis, theory,experiment feedback, new theory, and so on. Proof with allits implication of final solutions, doesn’t really belong here.
Even if we could, we don’t simply want to provewhether we were right or wrong in the past, but to learnhow to do better in the conditions of the future. We needto understand in order to make better judgments. We needto know not just whether advertising worked but how and why. We should judge research by whether it helps this whole process, whether it improves our decisions.
From: Improving Advertising DecisionsImproving Advertising Decisions, ADMAP
Vol 13, Number 4. 1997
The starting point for Stephen’s intellectual journey was thefundamental question: how does advertising work? Andhere, after studying the writings and theories of academics,of advertising practitioners and of researchers in the field,he concluded that they had all got it completely wrong.
In his evaluation of the shortcomings of existingtheories and practices, he wrote:
Perhaps the most overt attempt to apply research directly todecision making has been in off-the-peg advertising research.Advertising research is unusual in that the research methodis chosen first and the problem to be solved only sorted outafterward, if indeed at all. This happens because it’s terriblyhard to know how advertising works.
So people say, “At least let’s pick a measure that we know how to use.” It’s as if an art critic said“I don’t know how to measure artistic merit, but I dounderstand how a tape measure works so I’ll use that.”
The trouble is that any measure implies some modelof how advertising works; there is no way of evading theproblem. Lurking behind most of the off-the-pegadvertising research systems are some questionable ideas.For instance, that the mind is some sort of inert andpassive receptacle for messages, an intellectual sponge,
To me the best describer of the New Science was KarlPopper. He seemed to turn the whole Baconian process of deduction from observed facts upside down. He thoughtof Science as a spiritual adventure, describing the mainneeds in Science and in Scientists as vision and creativity.
He pointed out that Archimedes, Copernicus,Galileo and Einstein had all been visionaries, all had beencreative artists. They worked by challenging acceptedideas and this was very similar to the great painters.The Impressionists, the Cubists, Picasso, Matisse allchallenged the accepted ideas of the time.
One of the most critical things Popper said was that you don’t start with observations. You start with what you call a trial solution, what we might call an idea.He wrote, in fact: ‘Observations are always interpretationsof the facts observed. They are interpretations in the lightof theories’ In other words you can’t make any sense offacts until you’ve had an idea, or as Einstein put it, ‘Theorycannot be fabricated out of the results of observation – itcan only be invented.’
From: Art and Science Asian Advertising Congress, New Delhi 1982
Stephen profoundly resisted what he thought of as ‘bogusscientism’ – the assumption of scientific certainty impliedin the language of many writers about advertising. He foundit pretentious and dangerously misleading. The followingsuccinctly sums up his beliefs about research:
‘The proof of advertising value’. The very use of words likeproof or test, and analogies from Euclidian mathematics orengineering can mislead us about the nature of marketingand advertising. (We should get our analogies from historyor the social sciences.) The planning and execution ofmarketing and advertising is surely a process of continuouslearning and adaptation in a competitive environmentwhere the norm is uncertainty and change.
The Works (in brief) by Judie Lannon
nlike many thinkers and writers in the field of communications whosereputation rests on one, (usually didactic) idea, Stephen’s work flowedfrom a restless curiosity that continually asked questions. Answers thenled to further questions with knowledge and understanding accumulatedalong the way. And it was because his mind worked in this extremely
creative but disciplined way that he found the philosopher Karl Popper so exciting.

What we think
Annual Report 2005What we think92
“The value of a good advertisingidea linked inexorably to a brand is enormous. It is clear that the ideawould be even more valuable to a company brand, because itsproducts/services are likely tobe even less distinguishable fromthe competitors and because itscontacts with consumers are likely to be even more diverse.”
“If advertising works mainly by givingadded values to a brand in the long run, what can we learn from a single exposure advertisementtest whose results are based on short-term brand switching?”
“We will never be able to useresearch to the full unless westarted from a carefully worked out theory of what the brand is, why it is successful or not, andwhat advertising can contribute.”
or that all advertising works by converting people in totofrom brand A to brand B. Or that it always works byrational persuasion.
What nearly all the off-the-peg systems have incommon is that their underlying models are opposed tomore or less every other theory of how the mind works or how markets behave. They’re based on our trying tomeasure what ads do to people rather than starting at theother end and asking what people do with ads, how theyuse them and how they respond to them.
From: Applying research to decision making Marketing Intelligence & Planning
Vol 1, Number 3. 1983
So how should you research advertising if the existingpractice is not only wrong but likely to be dangerous and, as the following extract from his seminal article,‘What is a Brand’ illustrates, woefully incomplete?
We will never be able to use research to the full unless we started from a carefully worked out theory of what the brand is, why it is successful or not, and whatadvertising can contribute.
If a brand is a complex blend of elements, with therelationship between them as important as the elementsthemselves, can it really make sense to test the elements in isolation? Can a name test in isolation mean anything?Or a pack test in isolation?
If advertising works mainly by giving added valuesto a brand in the long run, what can we learn from a singleexposure advertisement test whose results are based onshort-term brand switching?
If brands seem to consumers almost living thingswith personalities, are we learning anything by gettingpeople to choose between phrases printed on a bit of card?
Again, if brands have personalities with all thesubtleties of people are we using the right balance ofqualitative and quantitative research? Once you have heardpeople describing [cleaning products] Lifebuoy as ratherabrupt; Tide as gruff and ex-army; Camay as a bit catty,will you be content to rely solely on the sort of researchthat gets people to put crosses on a seven-point scalerunning from ‘kind to the hands’ to ‘not so kind to the hands’?
And so on. Once the theory is there the questionsabout our current use for research come pretty easily.
From: What is a Brand? JWT 1971
What we think
Annual Report 2005What we think 93
Stephen wasn’t the first to write about brands and branding.But he was unquestionably the first to codify what all themarketing and communication activities involved inbuilding brands were.
He knew that organisational structure andorganisation culture were at least as important as individualtalent in creating good work – hence the invention ofAccount Planning as a discipline. So his ultimate aim wasto provide a framework for thinking that best served theneeds of the people making the advertisements.
His last article anticipated the growing importanceof both the corporate brand and the service brand. But, asthe following extract – on the importance of a brand idea –illustrates, the same principles that guide simple packagedgoods brands are still relevant.
Many of the best of the classic brands are famous at least partly because they have had a vivid and enduringadvertising idea. By contrast, research has shown thatpeople are scornful of the more hackneyed themes andcampaign types, especially on television – the musicalwallpaper, the side-by-side comparison, the talking heads,the computer graphics, the miracle-everything-slashed-unique-opportunity sales. They are equally aware of somevery entertaining advertising for some brand whose namehas temporarily slipped their mind.
The value of a good advertising idea linked inexorablyto a brand is enormous. It is clear that the idea would be even more valuable to a company brand, because itsproducts/services are likely to be even less distinguishablefrom the competitors and because its contacts withconsumers are likely to be even more diverse. It wouldhave to have something broader than an advertising idea,simply because of the wider range of communicationvehicles used.
It’s easier to recognize a good idea years later than to see it at the time or to describe it. But generally a good communication idea for a company brand would be an original metaphor for the brand’s personality. Thebrand would be borrowing from the outside; somethingwith the same personality characteristics which could beuniquely associated with it; that could be reasonably long-lasting; and that in some way illuminated and enhancedthe brand itself.
There are many examples from the advertising of theclassic brands:
•Marlboro: the cowboy. The individual facing the elements.
•Esso: the tiger. Graceful, powerful, aggressive.
•Andrex: the puppy. Soft, durable, wholesome.
•Persil: mother love. Metaphor for taking care of clothes.
•Mr Kipling: the voice. Tone of voice as metaphor fortraditional craftsmanship.
Of course, it is a very great deal harder to find anadequate metaphor for the personality of a whole service-based company, usable in a much wider range of mediathan advertising. It’s not easy to think of many examples –there’s Lloyds Bank’s black horse, Legal & General’s brolly, the Prudential’s Rock of Gibraltar, Merrill Lynch’sthundering herd.
Some companies have used the personality of thefounder for the brand idea (Habitat, Laker, The Body Shop,Next) but of course that can mean a rather dangerousimpermanence. There are some good ‘brand gestures’ (somepublic policy designed to symbolize a company personality)such as Marks & Spencer’s no-quibble exchange of goodsor John Lewis’s no-quibble return of cash if shown to beundersold.) But on the whole there seem to be a lot ofmissed opportunities for company brand ideas.
From: Brand Building in the 1990sJournal of Marketing Management
Vol 7, Number 1. 1991
Stephen did more than any thinker on the subject tobuild a practical framework for creating effective brandcommunication. Although advertising was the originalinspiration and context, the framework and the questions itdemands answers to is timeless. And even more necessaryin today’s complex and fragmented media environment.

Members of the Board of Directors
Philip LaderNon-executive chairmanSir Martin SorrellChief executivePaul RichardsonFinance directorHoward PasterDirectorMark ReadStrategy directorColin DayNon-executiveEsther DysonNon-executiveOrit GadieshNon-executiveDavid KomanskyNon-executiveChristopher MackenzieNon-executiveStanley (Bud) MortenNon-executiveKoichiro NaganumaNon-executiveLubna OlayanNon-executiveJohn QuelchNon-executiveJeffrey RosenNon-executivePaul SpencerNon-executive
Members of the Advisory Board
Jeremy BullmoreJohn Jackson
Company Secretary
Marie Capes
Board of Directors
Philip Lader Age 60 Non-executive chairmanPhilip Lader was appointed chairman in 2001. The USAmbassador to the Court of St James’s from 1997 to 2001,he previously served in several senior executive roles in theUS Government, including as a Member of the President’sCabinet and as White House Deputy Chief of Staff. Before entering government service, he was executive vicepresident of the company managing the late Sir JamesGoldsmith’s US holdings and president of both a prominentAmerican real estate company and universities in the USand Australia. A lawyer, he is also a Senior Advisor toMorgan Stanley, a director of RAND, Marathon Oil andAES Corporations, a member of the Council of Lloyd’s(Insurance Market), a trustee of the British Museum and a member of the Council on Foreign Relations.
Sir Martin Sorrell Age 61 Chief executiveSir Martin Sorrell joined WPP in 1986 as a director,becoming Group chief executive in the same [email protected]
Paul Richardson Age 48 Finance directorPaul Richardson became Group finance director of WPP in 1996 after four years with the Company as director of treasury. He is responsible for the Group’s worldwidefunctions in finance, information technology, procurementand property. He is also the country manager for Italy.Previously he spent six years with the central financialteam of Hanson PLC. He is a chartered accountant andmember of the Association of Corporate Treasurers. He is a non-executive director of Chime Communications PLCand STW Communications Group Limited in Australia,both of which are companies associated with the [email protected]
Howard Paster Age 61 DirectorHoward Paster was appointed a director in January 2003.He was previously chairman and chief executive officer of Hill & Knowlton, Inc. He joined the WPP parent companyin August 2002, overseeing WPP’s portfolio of publicrelations and public affairs businesses. Prior to joining Hill & Knowlton Inc., he served as assistant to PresidentClinton and director of the White House Office of LegislativeAffairs. He is a member of the board of trustees of TuskegeeUniversity, president of the Little League Foundation and a member of the Council on Foreign [email protected]
Annual Report 2005Who runs WPP94
Who runs WPP

Who runs WPP
Mark Read Age 39 Strategy directorMark Read was appointed a director in March 2005. He hasbeen WPP’s director of strategy since 2002. He worked atWPP between 1989 and 1995 in both parent company andoperating company roles. Prior to rejoining WPP in 2002,he was a principal at the consultancy firm of Booz-Allen &Hamilton and founded and developed the companyWebRewards in the [email protected]
Colin Day Age 50 Non-executive directorColin Day was appointed a non-executive director in July2005. He is group finance director of Reckitt Benckiser plc,having been appointed to its board in September 2000.Prior to joining Reckitt Benckiser he was group ffinancedirector of Aegis Group plc and previously held a numberof senior finance positions with ABB Group plc and De LaRue Group plc. He is a non-executive director of ImperialTobacco plc and, until 30 September 2005, of easyJet plc.
Esther Dyson Age 54 Non-executive directorEsther Dyson was appointed a director in 1999. In 2004she sold her 21-year-old company, EDventure Holdings, toCNET Networks, the US-based interactive media company.She remains editor of her newsletter, Release 1.0, andcontinues to host the annual PC Forum conference underCNET’s ownership. She is an acknowledged luminary in the information technology industry, and has been highlyinfluential for the past 20 years on the basis of her insightinto the evolving online/information technology marketworldwide, including the emerging IT markets of Centraland Eastern Europe and Asia. An angel investor as well asan analyst/observer, she recently participated in the sale ofFlickr to Yahoo!. She sits on the boards of other IT start-ups including EVDB, Meetup.com, NewspaperDirect(Canada), CV-Online (Hungary) and Yandex (Russia). She sat on the consumer advisory board of Orbitz until its sale to Cendant. She is also active in public affairs andwas founding chairman of ICANN, the domain namepolicy agency, from 1998 to 2000.
Orit Gadiesh Age 55 Non-executive directorOrit Gadiesh was appointed a director in April 2004. She ischairman of Bain & Company, Inc. and a world-renownedexpert on management and corporate strategy. She holds anMBA from Harvard Business School and was a Baker Scholar.She is a board member of the Harvard Business SchoolVisiting Committee, the Dean’s Advisory Board at KelloggSchool in the US and the Haute Ecole Commerciale in France.She is a member of the Foundation Board for the WorldEconomic Forum, and on the Board of Directors of ThePeres Institute for Peace. She is a member of the Council on Foreign Relations, a trustee for Eisenhower Fellowships,a committee member of the Metropolitan Museum of Art,New York, and a vice chairman for The Kennedy Center.
David H Komansky Age 67 Non-executive directorDavid Komansky was appointed a director in January 2003.He was chairman of the Board of Merrill Lynch & Co, Inc,serving until his retirement on 28 April 2003. He served aschief executive officer from 1996 to 2002, having begun hiscareer at Merrill Lynch in 1968. Among many professionalaffiliations, he serves as a director of Black Rock, Inc. andas a member of the International Advisory Board of theBritish American Business Council. Active in many civicand charitable organisations, he serves on the Board of theNew York Presbyterian Hospital.
Christopher Mackenzie Age 51 Non-executive directorChristopher Mackenzie was appointed a director in 2000.He is chief executive of Equilibrium, a London-basedinvestor group. He is also a board member of the AbdulLatif Jameel Group, the Borets Group, Minerva plc andChampagne Jacquesson et Fils S.A. He served as the chiefexecutive of financial service groups including BrunswickCapital in Russia, Trizec Properties in the US and GECapital Europe.
Annual Report 2005Who runs WPP 95

Who runs WPP
Stanley (Bud) Morten Age 62 Non-executive directorBud Morten was appointed a director in 1991. He is aconsultant and private investor. He is currently theIndependent Consultant to Citigroup/Smith Barney withresponsibility for its independent research requirements.Previously he was the chief operating officer of Punk, Ziegel& Co, a New York investment banking firm with a focuson the healthcare and technology industries. Before that hewas the managing director of the equity division of WertheimSchroder & Co, Inc. in New York. He is a former non-executive director of Register.com, which was sold to a privateequity firm in November 2005 and is no longer a publiccompany. He is also a non-executive director of The MotleyFool, Inc., which is a private company.
Koichiro Naganuma Age 61 Non-executive directorKoichiro Naganuma was appointed a director in February2004. He is president and group chief operating officerof Asatsu-DK, also known as ADK. Joining the agency in1981, he began his career with the account service of globalclients in the agency. His mandate thereafter expanded to the total operation of the group. He replaced ADKChairman Masao Inagaki on the Board who retired uponthe appointment of Mr Naganuma. ADK is Japan’s thirdlargest advertising and communications company, and ninthlargest in the world. WPP took a 20% interest in ADK in 1998.
Lubna Olayan Age 50 Non-executive directorLubna Olayan was appointed a director in March 2005.Lubna Olayan has been the deputy chairman and chiefexecutive officer of the Olayan Financing Company (OFC),a subsidiary of The Olayan Group, and the holding entityfor the Olayan Group’s operations in the Kingdom of Saudi Arabia and the Middle East, since October 1986.OFC operates or actively participates in more than 40companies, often in partnership with leading multinationals.OFC is also one of the largest investors in the Saudi andregional stock markets. In December 2004, she was electedto the Board of Saudi Hollandi Bank, a publicly listedcompany in Saudi Arabia. She also served on the Board ofChelsfield Plc., the UK property developer, from 1996 to2004. Ms Olayan is a member of the International BusinessCouncil of the World Economic Forum and the InternationalAdvisory Board of the Council on Foreign Relations, whichshe joined in November and December of 2005 respectively.Ms Olayan joined the Board of Directors of INSEAD inJanuary of 2006, and has been a member of the InternationalCouncil of INSEAD since March 1997.
John Quelch Age 54 Non-executive directorJohn Quelch was appointed a director in 1988. He is SeniorAssociate Dean and Lincoln Filene Professor of BusinessAdministration at Harvard Business School. Between 1998and 2001 he was Dean of the London Business School. Healso serves as chairman of the Massachusetts Port Authority.Professor Quelch’s writings focus on global business practice inemerging as well as developed markets, international marketingand the role of the multinational corporation and the nationstate. He is a non-executive director of Inverness MedicalInnovations, Inc. and Pepsi Bottling Group Inc. He servedpreviously on the boards of Blue Circle Industries plc, easyJetplc, Pentland Group plc and Reebok International Limited.
Jeffrey A. Rosen Age 58 Non-executive directorJeffrey Rosen was appointed a director in December 2004.He is a deputy chairman and managing director of Lazard.Previously, he was a managing director of WassersteinPerella & Co., Inc. since its inception in 1988, and chairmanof Wasserstein Perella International. He has over 30 years’experience in international investment banking and corporatefinance. He is a member of the Council on Foreign Relationsand is President of the Board of Trustees of the InternationalCenter of Photography in New York.
Paul Spencer Age 56 Non-executive directorPaul Spencer was appointed a director in April 2004. He is a financier with 20 years’ experience in the financialmanagement of a number of blue chip companies, includingBritish Leyland PLC, Rolls-Royce PLC, Hanson PLC andRoyal & Sun Alliance PLC. He served as UK chief executiveof Royal & Sun Alliance PLC between 1999 and 2002. He is the chairman of State Street Managed Pension Funds Ltd.He is also chairman of the Association of CorporateTreasurers’ Advisory Board, NS&I (National Savings), theUK government-owned retail savings institution, and SovereignReversions Group plc. He is also a non-executive director ofCMC Group plc, Resolution Life Group plc and NipponkoaInsurance (Europe) Ltd. Paul is a governor of Motability, a UK charity for the disabled.
Beth Axelrod served as a director during the year, resigningon 24 March 2005.
Annual Report 2005Who runs WPP96

Who runs WPP
Senior officers & advisors to the Board
Strategic thinking, creativity, client co-ordination, and operationsP DartT PiliguianR PutterJ Steel
Corporate and geographical developmentA G B ScottA NewmanR SmitsC Black
Branding & identity, Healthcare andSpecialist communications servicesJ F ZweigM E Howe
Human resourcesM LinaughA Jackson
PropertyE BauchnerJ Murphy
ProcurementT KinnairdV ChimientiM VargasK LiewP Permanne
Information technologyD A S NicollS BlackburnA GarlickJ HollanderS O’Byrne
Knowledge CommunitiesM JohnsonD Muir
Financial control and management reportingD BarkerC SweetlandN DouglasS WintersK Gill
TreasuryP DelaneyT LobeneJ DurcanJ Yuen
Internal auditP StanleyS WhitworthB GrosvenorP JohnstonE Medlar
TaxR AzoulayT O NeumanK FarewellS Woodhouse
Investor relationsC SweetlandF Butera
Corporate communicationsF McEwanV EdwardsK McCormack
Company secretarial and legalM CapesA J HarrisM PoveyF BahrampourJ D Calow
Investment bankersGoldman Sachs International LtdPeterborough Court133 Fleet Street LondonEC4A 2BB
HSBC8 Canada SquareLondonE14 5HQ
Merrill Lynch International2 King Edward StreetLondonEC1A 1HQ
Morgan Stanley & Co Limited25 Cabot SquareCanary WharfLondon E14 4QA
CitigroupCitigroup Centre33 Canada SquareCanary WharfLondonE14 5LB
Legal advisorsAllen & Overy LLPOne New ChangeLondonEC4M 9QQ
Davis & Gilbert LLP1740 BroadwayNew YorkNY 10019
Freshfields Bruckhaus Deringer65 Fleet StreetLondonEC4Y 1HS
Fried Frank1 New York PlazaNew YorkNY 10004
Hammonds7 Devonshire SquareCutlers GardensLondonEC2M 4YH
StockbrokersMerrill Lynch International CorporateBroking2 King Edward StreetLondonEC1A 1HQ
Panmure Gordon & Co. plc155 MoorgateLondonEC2M 6XB
Auditors and accountancy advisorsDeloitte & Touche LLPHill House1 Little New StreetLondonEC4A 3TR
Ernst & Young LLP1 More London PlaceLondon SE1 2AF
KPMG LLP1 Puddle DockLondonEC4V 3DS
PricewaterhouseCoopers LLPSouthwark Towers32 London Bridge StreetLondonSE1 9SY
Remuneration consultantsTowers Perrin71 High HolbornLondonWC1V 6TP
Property advisorsFulcrum Corporate The Pumphouse13-16 Jacob’s Well MewsLondonW1U 3DY
James Andrew International72/75 Marylebone High StreetLondonW1M 3AR
Jones Lang LaSalle22 Hanover SquareLondonW1A 2BN
Cushman & Wakefield Inc51 West 52nd StreetNew YorkNY 10019-6178
Annual Report 2005Who runs WPP 97

Annual Report 2005How we behave98

How we behave
Annual Report 2005How we behave 99
How we behave

How we behave
Review of the Company’s governance and theNomination committee
Dear share ownerContinuing to emphasise excellence in corporategovernance while sustaining the entrepreneurshipcharacteristic of this Company is fundamental to itsperformance: that has been foremost among your Board of Directors’ objectives this past year. The latter isevidenced throughout this Report by your Company’sfinancial performance, growth, and innovation. Let mehere focus, therefore, on the former.
Significant changes in your Board’s compositionhave added new perspectives, further vitality, valuableexpertise and greater regulatory independence. Colin Day,Reckitt Benckiser’s highly respected ffinance director, withprior experience in the media-buying industry, is nowamong those who joined earlier in 2005 – Lubna Olayan,chief executive of the Saudi Arabian-based Olayan Group,Jeffrey Rosen, deputy chairman of the global investmentbank, Lazard, and Mark Read, WPP’s director of strategy.
Additions in 2004 included Orit Gadiesh, chair of the international strategic consulting firm Bain &Company, and Paul Spencer, who was also formerly aFTSE 100 finance director. We were pleased to note thatboth Lubna and Orit, together with Shelly Lazarus,Ogilvy’s chairman and CEO, were named in Forbes 2005list of The 100 Most Powerful Women in Business.Sir Martin Sorrell and Lubna Olayan were also named in the Time 100.
The composition of Board committees has been, or in the case of the chairmanship of the Compensationcommittee, will be realigned following the forthcomingAnnual General Meeting. The Compensation committeewill be chaired by Jeffrey Rosen, and Esther Dyson, theinternet authority, entrepreneur and investor, has alreadyjoined this committee. We cannot adequately thank BudMorten, after 12 years of service on this committee, all butone of them as its chairman, who has stepped down from
this and the Nomination committee. His comprehensiveknowledge of your Company’s businesses and people, aswell as his responsiveness to institutional share owners andyour representative organisations, have been an immensehelp to the Board and our executives over these many years.
David Komansky, former chairman and chiefexecutive of Merrill Lynch, has joined the Nominationcommittee, and – to comply with best practices, particularlyin the US – Martin Sorrell has stepped down from thiscommittee so that it is now comprised entirely of non-executive directors. The Nomination committee met onceformally in 2005, but held periodic informal sessions. Its meetings were also attended, in whole or in part, by the Group’s Company Secretary, chief talent officer, andchief legal advisor.
The addition of Esther Dyson to the Audit committeewill bring further expertise to the examination of itscomplex issues.
During 2005, the Board – and I, as chairman –engaged once again in a thorough assessment process,including detailed one-on-one discussions with eachdirector, followed by a full review by the Board as a whole. However well informed and engaged we might be, individually and collectively, we always seek to learn and benefit from the best governance practices of other public companies and continually strive toimprove our own performance.
Additionally, I want share owners to be aware ofyour Board’s rigorous talent management and succession-planning process. Annually, and for the last three years,more than 100 senior managers and ‘rising stars’ of theparent and operating companies, including the Group chiefexecutive, are reviewed by the non-executive directors. In this process individual strengths and developmentalneeds are considered in depth, and potential successors for senior positions are identified. We believe that the bestinterests of the Group require that these deliberations andour conclusions be kept strictly confidential.
Annual Report 2005How we behave100
Directors’ report
Once again, this year the Directors’ report includesreviews from the chairmen of three Board committees;
Philip Lader as chairman of the Company and itsNomination committee; Paul Spencer, as chairman of
the Audit committee, and Bud Morten, chairman of theCompensation committee during 2005. It also containsan analysis of the Company’s compliance with statutory
and regulatory requirements.

How we behave
It has always been your Company’s policy to complyfully with all relevant laws and regulations, including theCombined Code, the US Sarbanes-Oxley requirements, theNASDAQ rules and, where possible and practicable, withguidelines issued by institutional investors and theirrepresentative bodies.
To this end, WPP executives and advisors devotedsubstantial time and resource throughout 2005. In the yearended 31 December 2005, in the opinion of the Board,WPP has again been in compliance with provisions of theCombined Code on Corporate Governance, among otherrelevant benchmarks, and continues to be so.
The Board’s views on ‘independence’ of non-executive directors were explained in detail in last year’sReport and Accounts. Let me reiterate, nonetheless, thatindependence, in our opinion, should be determined on acase-by-case basis, with full disclosure to share owners of anyappearance of conflict with published guidelines. The Boardcontinues to disagree with guidelines that directors whohave served for more than nine years should, for this reasonalone, no longer be considered as independent.
Accordingly, notwithstanding Bud Morten’s 14 years of service on the Board and his advisory affiliation withCitigroup, he will continue, following the forthcomingAnnual General Meeting, as senior independent directorand as a member of the Audit committee. Similarly,although I am chairman of the Company and a senioradvisor to Morgan Stanley, I intend to continue aschairman of the Nomination committee and as a memberof the Compensation committee to ensure continuity in the work of those committees.
Your Board is composed of energetic, tough-minded,commercial professionals with wide experience andenviable records of achievement in their respective fields.They have worked hard in 2005, and have sought toachieve the proper balance between rendering appropriatecorporate governance oversight and championing theentrepreneurial spirit that has built WPP into the leadingglobal enterprise that it is. I thank them for their dedicationand all their considerable efforts.
Meanwhile, this past year the Group’s executiveshave also dealt – in addition to the central client andcompetitive challenges of their businesses – withunprecedented legislative and regulatory requirements.Their performance in both regards warrants both ouradmiration and our appreciation.
No expression of appreciation could be completewithout reference to another group. Clients – old and new,large and small, all necessarily demanding – make thisbusiness possible.
And to the people of WPP who deserve credit forthe remarkable story behind this year’s Report to you.
Philip Lader11 May 2006
Annual Report 2005How we behave 101
Philip LaderChairman of the Company and
chairman of the Nomination committee

How we behave
Review of the Audit committee
Dear share ownerMy colleagues on the committee during 2005 were BudMorten and Jeffrey Rosen who joined the committee on29 April 2005. I also welcome Esther Dyson to thecommittee, who was appointed in May 2006 and withwhom we look forward to working.
Meetings of the committee, of which there wereeight during 2005, were also attended, in whole or in part,by the auditors, the chairman of the Company, the Groupfinance director, the director of internal audit, theCompany Secretary and a representative of the legaldepartment. Furthermore, the committee receivedpresentations from several parent company departmentheads, such as taxation and treasury.
2005 has been another important year, especiallygiven WPP’s obligation to report at the end of 2006 on thecompliance of its internal controls with the requirementsestablished by the SEC pursuant to section 404 of theSarbanes-Oxley Act.
This year the work of the committee included:
•monitoring the integrity of the Company’s financialstatements and reviewing significant financial reportingjudgements;
•reviewing and reporting on the key elements of riskmanagement as they affect the Group’s global operations;
•reviewing internal financial control and internal audit activities;
• the review and appointment of the external auditors andapproval of their remuneration and terms of engagement;
•monitoring the external auditors’ independence,objectivity and effectiveness, taking into account relevantglobal professional and regulatory requirements;
• the approval and monitoring of the policy for theengagement of the external auditors in relation to the supplyof permissible non-audit services (including taxation), takinginto account relevant ethical and regulatory requirements.WPP’s policy regarding non-audit services that may be
provided by the Group’s auditors, Deloitte, prohibitscertain categories of work in line with relevant guidance on independence, such as the Sarbanes-Oxley Act. Other categories of work may be provided by the auditors if it is appropriate for them to do so. The provision of such services and associated fees are pre-approved by theAudit committee, although some specified categories ofwork may be delegated to the director of internal audit for pre-approval. All fees are summarised periodically for the committee in order to assess the aggregate value of non-audit fees against audit fees. The value of fees for2005 is shown in note 3 on page 154;
•monitoring accounting and legal reporting requirements,including all relevant regulations of the UK Listing Authority,the Securities Exchange Commission, and NASDAQ withwhich the Company must comply;
• in conjunction with Howard Paster, the director responsiblefor corporate responsibility (CR) in 2005, ensuring systemsare in place to monitor social, environmental and ethicalissues which may affect the Group (other than issues whichfall within the remit of the Compensation committee); and
•maintaining established procedures for the receipt andtreatment of concerns regarding accounting, audit andinternal audit matters, including confidential and anonymoussubmissions by employees of concerns relating to those issues.
During the year, particular attention has been givento the impact of new accounting standards, ensuringcompliance with the Combined Code, monitoring progresstowards full compliance with the Sarbanes-Oxley Act(particularly section 404 of that Act) and ensuring that theCompany complies with the NASDAQ rules to the extentthat they apply to the Company.
I am indebted to Bud Morten, Jeffrey Rosen,Philip Lader, Paul Richardson and a number of parentcompany executives for their continued assistancethroughout the year.
Paul Spencer11 May 2006
Annual Report 2005How we behave102
Paul SpencerChairman of the Audit committee

How we behave
Review of the Compensation committee
Dear share ownerThis will be my last report to you as chairman of theCompensation committee. Jeffrey Rosen will take over aschairman following the Annual General Meeting convenedfor 27 June 2006. Jeffrey brings to that role a wealth ofacumen and experience.
Let me also welcome as a new committee member,Esther Dyson, who has served as a non-executive directorof WPP for six years and, like Jeffrey, brings to thecommittee keen judgement and insight.
After 12 years as a member of the committee,11 of them as its chairman, I would also like to take thisopportunity to thank everyone for their help during mytenure, including Board colleagues who have served with me; executives in the parent company, particularlyAdrian Jackson, the Group’s director of compensation and benefits; advisors in the compensation and benefitsarea, particularly Carol Arrowsmith and her colleagues at Deloitte; and finally those in WPP’s legal and auditfunctions, particularly David Calow, the Group’s formerchief legal advisor. All have contributed enormously tofulfilling the committee’s increasingly complex and oftenpressing responsibilities.
I would also like to express my appreciation for theopen and stimulating dialogue I have enjoyed over the yearswith share owners and their advocates on both sides of theAtlantic. We have not all agreed on all of the issues all ofthe time, but I believe that is as it should be, and I hope thatwe at least share unanimous pride in the professionalismthat has always characterised our deliberations.
The year under review has been a busy one for thecommittee. Much effort was invested in a comprehensivereview of the Group’s compensation strategy and of evolvingbest practice. As a result, a new Restricted Stock Plan wasintroduced, and the first such awards were made in 2005.This plan essentially replaces grants under the Operating
Company Long Term Incentive Plans, the PerformanceShare Plan, and the Executive Stock Option Plan.
Because the previous Executive Stock Option Planand the Worldwide Ownership Plan were set to expire inMarch 2006, we renewed both of them, with share ownerapproval, in 2005. The Worldwide Ownership Plan willcontinue to be used, as it has in the past, to encourage ashare-ownership culture at all levels throughout the Group.The Executive Plan, having been largely supplanted by the new Restricted Stock Plan, will only be used in specialcircumstances, such as senior hirings.
The committee was also closely involved in ensuringthat all of the Group’s compensation plans were correctlytransferred to, and adopted by, the new parent holdingcompany after the re-organisation, which was put intoeffect with share owner approval in the autumn of 2005.
During 2005, Sir Martin Sorrell’s arrangementswere rationalised and simplified. Awards under theNotional Share Award Plan, the Capital Investment Plan(CIP) and Original LEAP all vested in September 2004,having been deferred over a number of years since theiroriginal vesting dates, although Sir Martin has furtherdeferred 2,649,208 shares under the CIP until late 2008.Also, in March 2005, JMS Financial Services Limited(JMS) exercised all of its remaining Additional Fee Rights(phantom options) and all rights then exercisable by SirMartin/JMS under the Performance Share Plan were alsoexercised. With effect from 1 April 2005, Sir Martinbecame a direct employee of the Company in respect of all of the services that he provides to the Group outside the US. He therefore no longer provides his services throughJMS. As of 1 September 2005, Sir Martin’s contractualarrangements both within and outside the US are on an‘at will’ basis.
During 2005, the committee held nine formalmeetings and also had many informal discussions.Committee meetings are frequently attended, in whole or in part, by the Group chief executive, the chief talent
Annual Report 2005How we behave 103
Bud MortenChairman of the Compensation committee during 2005

How we behave
officer, the director of compensation and benefits, theCompany Secretary and the Group general counsel.
My able colleagues on the committee during 2005were Philip Lader and Christopher Mackenzie. As notedabove, Jeffrey Rosen has subsequently joined the committee(and will take over as chairman following the AnnualGeneral Meeting) along with Esther Dyson. All the pastand present members of the committee are considered bythe Board for this purpose to be independent.
During the year, the committee received advice fromsenior executives and also from those external advisorsreferred to in the Report of the Compensation committeeon page 116.
I would like to close with a few general observationson the subject of corporate governance. WPP has alwayswelcomed and supported growing share owner activismand involvement because thoughtful dialogue on importantgovernance and policy issues is constructive for all concerned.As growth in the number of rules and standards continuesto outpace our ability to assess fully their impact – includingtheir inevitable unintended consequences – we must all bemindful that it is simply not possible to ‘legislate’ success at creating wealth for share owners by demanding rigidcompliance with ‘one size fits all’ regulations.
All the experts (Higgs, RREV, ABI, Hermes, etc.) agree with this, and they all stress the need for flexibility in the application of governance codes. However, it isquestionable whether in practice adequate manpower andother resources are being committed to make the thoughtfuland intelligent distinctions, based on performance andspecial circumstances, that such flexibility requires. Goodjudgement, transparency and accountability are importanton both sides of the dialogue, and in today’s intenselycompetitive global markets, there is little consolation forthe share owners of a defeated company in rememberingthat it was once admired for being rigidly compliant withall the governance codes and will be missed by admiring‘box tickers’.
Bud Morten11 May 2006
Annual Report 2005How we behave104

How we behave
Annual Report 2005How we behave 105
The Board is collectively responsible for promoting thesuccess of the Company by directing and supervising theCompany’s policy and strategy and is responsible to share owners for the Group’s financial and operationalperformance. Responsibility for the development andimplementation of Group policy and strategy and for day-to-day management issues is delegated by the Board to the Group chief executive and other executive directors.
For the year under review, Philip Lader continued as chairman of the Board, responsible for the leadership ofthe Board. Sir Martin Sorrell, as the Group chief executive,continued to be responsible for the development andimplementation of policy and strategy and for the day-to-day operations of the Group. The biographies of the currentBoard members appear on pages 94 to 96.
All directors are fully briefed on importantdevelopments in the various business activities which theGroup carries out worldwide and regularly receiveextensive information concerning the Group’s operations,finances, risk factors and its people, enabling them to fulfiltheir duties and obligations as directors. The directors arealso frequently advised on regulatory and best practicerequirements which affect the Group’s businesses on a globalbasis, but particularly in the US and the UK.
During 2005, the Board met six times formally andheld a number of ad hoc meetings throughout the year. With the exception of John Quelch, Lubna Olayan andColin Day (each absent for one meeting) and David Komansky(absent for two meetings), there was full attendance at allformal meetings of the Board during 2005.
The Board consists of 16 directors of whom four areexecutive and 11 plus the chairman who are non-executive.The Board considers that nine of the 11 non-executivedirectors, in addition to the chairman, are independent,with John Quelch and Korchiro Naganuma being the only non-executive directors considered by the Board to be not independent.
The shareholdings of non-executive directors are setout on page 126. Non-executive directors do not participatein the Company’s pension plans, share option or otherincentive plans, but may receive a part of their fees inordinary shares of the Company.
The Board considers that the non-executive directors’remuneration conforms with the requirements of theCombined Code.
The fees payable to non-executive directors representcompensation in connection with Board and Boardcommittee meetings, and where appropriate for devotingadditional time and expertise for the benefit of the Group in a wider capacity.
Details of directors’ remuneration and servicecontracts form part of the report of the Compensationcommittee which commences on page 116.
Details of the Scheme of Arrangement under s425 of the Companies Act 1985 are described on page 108. As a result of the Scheme of Arrangement all of the directorsof the Company who were not appointed as directors on theincorporation of the new parent company which is now calledWPP Group plc are required to submit themselves for electionat the Annual General Meeting. Only Sir Martin Sorrell, Paul Richardson and Mark Read were appointed at theincorporation of the Company as a consequence of which allthe remaining directors (other than Howard Paster who is notseeking election) need to be considered for election at theAnnual General Meeting.
As a matter of policy the Company requires all directorsto submit themselves for re-election by share owners at leastevery three years or every year in the case of those directorswho held office for more than nine years or who are 70 years of age or over.
The Board recommends that share owners vote infavour of the Resolutions to elect the relevant directors and set out their reasons for this recommendation in theAppendix to the Notice of the Annual General Meeting.
The Board of Directors

How we behave
Annual Report 2005How we behave106
Committee meetings
The attendance of non-executive directors at meetings ofthe committees of the Board during 2005 was as follows:
Notes1 Appointed to the Audit committee 29 April 2005 but attended meetings prior to his appointment.
During 2005, the Corporate responsibility committee,which in 2005 was chaired by Howard Paster and alsocomprises executives of the parent company met once on aformal basis. Their report for 2005 commences on page 110.
The Disclosure committee is comprised of seniorexecutives in the parent company, namely Group financialreporting, internal audit, legal, tax, human resource and investor relations departments. The purpose of theDisclosure committee is to add further assurance to thecontent of all public statements (including the AnnualReport and Accounts) and, during 2005, it met four times.
Share owner relations
Relations with share owners, potential share owners andinvestment analysts are given the highest priority by the Company.
The Company has a well-developed continuousprogram to address the needs of share owners, investmentinstitutions and analysts for a regular flow of informationabout the Company, its strategy, performance andcompetitive position. Given the wide geographicdistribution of the Company’s current and potential shareowners, this program includes regular visits to investors,particularly by the Group chief executive and the Groupfinance director, in the UK, Continental Europe and themajor financial centres in North America together withmore limited programs in Asia Pacific and Latin America.The Company also provides a quarterly trading update atthe end of the first and third quarters and at the AnnualGeneral Meeting (AGM) currently held in June each year in addition to semi-annual reporting required in the UK.
The Company ensures that it has a proper dialoguewith share owners and their representative bodies inrelation to remuneration matters as and when appropriate.
WPP’s website, www.wpp.com, provides current and historical financial information, including tradingstatements, news releases and presentations.
Nomination Audit Compensationcommittee committee committee
Philip Lader 1 n/a 9
Bud Morten 1 8 9
Christopher Mackenzie 1 n/a 9
Jeffrey Rosen1 n/a 8 n/a
Paul Spencer n/a 8 n/a
Internal control
WPP operates a system of internal control, which ismaintained and reviewed in accordance with the CombinedCode and the guidance in the Turnbull Report as well asRules 13a-14 and 15 of the Securities Exchange Act 1934as they currently apply to the Company. In the opinion ofthe Board, the Company has complied throughout the yearwith the Turnbull Report and has also complied with therelevant provisions of the Securities Exchange Act 1934.
The Board (which receives advice from the Auditcommittee) has overall responsibility for the system of internalcontrol and risk management in the Group and has reviewedthe effectiveness of the system during the year. In the contextof the scope and complexity of this system, the Board canonly give reasonable, but not absolute, assurance againstmaterial misstatement or loss.
The principal elements of internal control aredescribed below.
Control environmentThe quality and competence of our people, their integrity,ethics and behaviour are all vital to the maintenance of theGroup’s system of internal control.
The Code of Business Conduct (which is regularlyreviewed by the Audit committee and the Board) sets outthe principal obligations of all employees. Directors andsenior executives throughout the Group are required eachyear to certify their compliance with this Code. The WPPPolicy Book (which also is regularly updated) includes theCode of Business Conduct and human resource practices as well as guidance on practices in many operational areas.Breaches or alleged breaches of this Code of Conduct areinvestigated by the director of internal audit and the Groupgeneral counsel.
Furthermore, the Group has an independentlyoperated helpline, Right to Speak, for the reporting ofissues that employees feel unable to raise locally. A numberof issues have been raised during 2005 through thishelpline, all of which have been investigated.

How we behave
Annual Report 2005How we behave 107
Risk assessmentRisk monitoring of all of the Group’s operations throughoutthe world is given the highest priority by the Group chiefexecutive, the Group finance director, the chairman of the Audit committee and the Board, as it is essential to the creation and protection of share owner value and thedevelopment of the careers of our people. The Board realisesthat WPP is a service company and its ongoing prosperitydepends on being able to continue to provide a qualityservice to its existing and potential clients in a creative,efficient and economic way.
At each Board meeting, the Group chief executivepresents a Brand Check review of each of the business’operations, incorporating a risk monitor, providingfeedback on the business risks and details of any change in the risk profile since the last Board meeting.
The Brand Check covers such issues as:
•changes in political security;
• the possibility of the loss of major business (eg as a resultof a change of senior management at a major client);
• loss of a key executive of the Group;
• introduction of new legislation in an important market;
•change in accounting or corporate governance practice.Each operating group undertakes monthly and
quarterly procedures and day-to-day management activitiesto review their operations and business risks. These areformally communicated to the Group chief executive andother executive directors and senior executives in quarterlyreview meetings and, in turn, to the Board.
The Board is firmly of the opinion that themonitoring of risk has always been and continues to bestrongly embedded in the culture of the Company and ofthe operating companies, in a manner which the Boardconsiders goes beyond the Turnbull recommendations andthe requirements of Rules 13a-14 and 15 of the SecuritiesExchange Act 1934.
Control activities and monitoringPolicies and procedures for all operating companies are setout and communicated in the WPP Policy Book, internalcontrol bulletins and accounting guidelines. The applicationof these policies and procedures is monitored within theindividual businesses and by the Company’s director ofinternal audit and the Group general counsel.
Operating companies are required to maintain andupdate documentation of their internal controls and processes.This documentation incorporates an analysis of businessrisks (a summary of which was considered by the Auditcommittee), detailed control activities and monitoring,together with controls over security of data and the provisionof timely and reliable information to management. IT andfinancial controls are also included.
The internal audit department carried outreviews and testing of the documentation and therelevant controls for a majority of the Group during 2005,the results of which were reported to the Audit committee.
Financial reportingEach operating company annually updates a three-yearstrategic plan which incorporates financial objectives. These are reviewed by the parent company’s managementand are agreed with the chief executive of the relevantoperating company.
The Group operates a rigorous procedure for thedevelopment of operating company budgets which build up the Group’s budget. During the final quarter of eachfinancial year, operating companies prepare detailedbudgets for the following year for review by the parentcompany. The Group’s budget is reviewed by the Boardbefore being adopted formally. Operating company resultsare reported monthly and are reviewed locally, regionallyand globally by the business groups and by Groupmanagement on a consolidated basis and ultimately by the Board. The results are compared to budget and theprevious year, with full-year forecasts prepared and updatedquarterly throughout the year. The Company reports toshare owners four times a year.
At each year-end, all operating companies supplytheir full-year financial results with such additionalinformation as is appropriate. This information isconsolidated to allow the Group to present the necessary disclosures for UK and US GAAP reporting and International Financial Reporting Standards (IFRS)including International Accounting Standards (IAS).
The Disclosure committee gives further assurancethat publicly-released information, including this AnnualReport, is free from material omission or misstatement.
Adoption of IFRS
As required by European law, the Group has prepared its consolidated financial statements for the year ended31 December 2005 in accordance with InternationalFinancial Reporting Standards (IFRS) including IAS.Comparative figures for the year ended 31 December 2004have also been presented on this basis. More detailedinformation on the Group’s transition from UK GAAPto IFRS/IAS is shown on pages 172 to 176.

How we behave
Annual Report 2005How we behave108
Scheme of arrangement
In October 2005, pursuant to a Scheme of Arrangementunder s425 of the Companies Act 1985, a new parentcompany was introduced which is now called WPP Groupplc (‘Newco’). The previous parent company has beenrenamed and re-registered as WPP 2005 Limited (‘Oldco’).
The introduction of Newco constituted a groupreconstruction and has been accounted for using mergeraccounting principles. Therefore, although the reconstructiondid not become effective until October 2005, the financialstatements of WPP Group plc are presented as if Newcoand Oldco had always been part of the same group.Accordingly, the results of the Group for the entire yearended 31 December 2005 are shown in the consolidatedincome statement and the comparative figures for the yearended 31 December 2004 are also prepared on this basis.
Sarbanes-Oxley S404
Effective for the 2006 year-end, the Group and its auditorswill be required to report separately to the share owners on the design and effectiveness of internal controls overfinancial reporting, in accordance with section 404 of theSarbanes-Oxley Act.
The Group has planned its response to the necessarytesting procedures and is committed to achieving compliancegiven the rigour of the controls, processes and documentationdescribed above.
Going concern
UK company law requires the directors to consider whetherit is appropriate to adopt the financial statements on thebasis that the Company and the Group are going concerns.As part of its normal business practice, the Group preparesannual and longer-term plans and in reviewing thisinformation and in particular the 2006 three-year plan and budget the directors believe that the Company and the Group have adequate resources for the foreseeablefuture. Therefore the Company and the Group continue to adopt the going concern basis in preparing the financial statements.
Responsibilities in respect of the preparation offinancial statements
UK company law also requires the directors to preparefinancial statements for each financial year which give atrue and fair view of the state of affairs of the Companyand the Group as at the end of the financial year and of the profit or loss of the Group for that year. In preparingthose financial statements, the directors are required to:
•select suitable accounting policies and then apply them consistently;
•make judgements and estimates that are reasonable andprudent; and
•state whether applicable accounting standards have beenfollowed, subject to any material departures disclosed andexplained in the financial statements.
The directors are responsible for keeping properaccounting records which disclose with reasonable accuracyat all times the financial position of the Company andenable them to ensure that the financial statements complywith the Companies Act 1985. They are also responsiblefor safeguarding the assets of the Company and consequentlyfor taking all possible steps for the prevention and detectionof fraud and other irregularities.
The following information, together with thestatements regarding directors’ responsibilities andstatement of going concern set out above and the directors’remuneration and interests in the share capital of theCompany set out on pages 125 and 126, constitute theDirectors’ report.
Substantial share ownership
As at 4 May 2006, the Company is aware of the followinginterests of 3% or more in the issued ordinary share capitalof the Company:
The disclosed interests of all of the above refer to therespective combined holdings of those entities and to interestsassociated with them.
The Company has not been notified of any otherholdings of ordinary share capital of 3% or more.
Legal & General 4.15%
WPP ESOPs* 4.05%
Legg Mason 3.98%
Barclays 3.11%
AIM Management 3.05%
*The trustees of the ESOPs are entirely independent. It is the Company’s intention that the totalnumber of shares held in the ESOPs at any one time is such as may be required to satisfyoutstanding incentive plan share awards (but allowing for a contingency element, e.g. to deal withhirings in the course of a year). The number of shares held in the ESOPs as at 31 December 2005was 53,297,356. The ordinary shares and ADRs held in the ESOPs did not receive the interimdividend paid on 14 November 2005 as they waived their respective rights.

How we behave
Annual Report 2005How we behave 109
Authority for purchase of own shares
At the Annual General Meeting in 2005 share owners passeda special resolution authorising Oldco, in accordance withits Articles of Association, to purchase up to 126,473,866(adopted at an Extraordinary General Meeting of theCompany on 26 August 2005) of its own shares in themarket. In the year under review, 25.4 million shares (of which 21.3 million were cancelled) were purchased at an average price of £5.99 per share.
Supplier payment policy
The Company has no trade creditors because it is a parentcompany and, accordingly, no disclosure can be made ofthe year-end creditor days. However, the Group’s policy isto settle the terms of payment with suppliers when agreeingthe terms of each transaction, and to ensure that suppliersare made aware of the terms of payment and to abide by the terms of payment. The average trade creditors for theGroup, expressed as a number of days, were 49 (2004: 53).
Auditors
The directors will propose a resolution at the AGM to re-appoint Deloitte & Touche LLP as auditors.
By Order of the Board
M W CapesCompany Secretary
11 May 2006
Election of directors
Details of the directors who submit themselves for electionto the Board are referred to on page 105 and also in theNotice of Annual General Meeting.
Profits and dividends
The profit before tax for the year was £592.0 million(2004: £434.4 million). The directors recommend a finalordinary dividend of 6.34p (2004: 5.28p) per share to be paid on 3 July 2006 to share owners on the register at 2 June 2006 which, together with the interim ordinary dividend of 3.0p (2004: 2.5p) per share paid on14 November 2005, makes a total of 9.34p for the year(2004: 7.78p).
Parent company charitable donations
The Company made charitable donations of £379,000(2004: £202,000). In total WPP companies together withthe parent company contributed an estimated £3.4 millionworth of time, skills, materials and money to social andcommunity causes in 2005. More detailed informationregarding the Group’s support of charities is set out in the section dealing with corporate responsibility on pages 110 to 115.
It is the Company’s policy not to make payments forpolitical purposes.
Group activities
The principal activity of the Group continues to be theprovision of communications services worldwide. TheCompany acts only as a parent company and does not trade.
Intangible assets
Intangible assets in the consolidated balance sheet includecertain corporate brand names with indefinite useful lives.These assets are carried at historical cost. When comparedwith current valuation estimates, the directors consider the carrying value to be conservative. Further details of intangible assets are set out in note 14 on pages 157 and 158.
Share capital
Details of share capital movements are given in note 28on pages 164 to 166.

Annual Report 2005How we behave110
Business impact
Corporate responsibility continues to be important toWPP’s business outlook and future success. Consumers areincreasingly aware of environmental and social issues, andthis is of significance to our multinational and leadingnational clients.
As ethically-conscious consumers increasingly seekbrands that match their personal values, WPP businessesare supporting their clients in developing and promotingproducts to meet changing consumer preferences. The impact is variable regionally and between markets,but signs of concern are often evident. Interest in ethicalproducts such as organic produce, healthy foods, fair-traded coffee and cocoa, sweat-shop free apparel andclimate-friendly cars has never been higher.
WPP’s Corporate Responsibility Policy and ourCorporate Responsibility Report are increasingly relevantwhen competing for new business and have proved to bean attribute. We believe that WPP is well placed to respondto opportunities created by the corporate response toglobal environmental and social challenges.
WPP share owners continue to show interest inour corporate responsibility practices and we aim torespond constructively to their requests for corporateresponsibility information.
WPP is included in the Dow Jones SustainabilityIndex and the FTSE4Good Index.
Developments during 2005
In 2005, we published our third Corporate ResponsibilityReport which documents our approach, performance andgoals. The Report provides a detailed and objectiveaccount of how we are implementing WPP’s CorporateResponsibility Policy across our businesses.
Our reporting focuses on WPP’s three mostsignificant corporate responsibility issues:
•The impact of our work including marketing ethics,compliance with marketing standards, protection of consumerprivacy, together with social and cause-related marketing.
•Employment including diversity and equalopportunities, business ethics, employee development,remuneration, communication, and health and safety.
•Social investment including pro bono work, donationsto charity and employee volunteering.
Also part of our corporate responsibilityprogramme is our environmental impact, as well asour suppliers’ corporate responsibility performance.
How we manage corporate responsibility risk and opportunity
Paul Richardson is the Board director responsible forassessing corporate responsibility risks for 2006, havingtaken over from Howard Paster. He chairs WPP’sCorporate responsibility committee, established in 2003,which advises on policy, monitors emerging issues and co-ordinates communication among Group companies.
The committee is made up of senior representativesfrom WPP’s major business categories. It identifies andassesses significant corporate responsibility risks andopportunities for the business. In support of WPP’scorporate responsibility activities, the Group’s operatingcompanies have each nominated a corporate responsibilityrepresentative responsible for compiling and reporting datato the parent company and co-ordinating activity withinthe operating companies.
Paul Richardson provides an annual assessment of corporate responsibility risks and performance to theAudit committee. The Company’s internal audit functionalso includes corporate responsibility risks in its reviews of Group companies. This is in addition to the businessand financial reporting risks process described on pages106 and 107.
Corporate responsibility

How we behave
Annual Report 2005How we behave 111
WPP’s Corporate Responsibility Policy and ourCode of Business Conduct provide guidance for our peopleon a wide range of ethical, social and environmentalsubjects. Both documents are publicly available on ourwebsite www.wpp.com.
We have established an initial set of key performanceindicators (KPIs) in our Corporate Responsibility Reports.
Corporate responsibility goals
In 2005, we set ourselves three ongoing corporateresponsibility goals. These were:
•Contribution to society – Undertake pro bono work andmake donations to charity to a value of 0.4% of revenue.
•Marketing ethics – Comply with all laws and industrycodes governing marketing material (and to track ourperformance globally to establish how we are doing).
•Environment – Calculate climate impact, purchaserecycled paper and install recycling facilities in 10 of ourlargest offices.
Each of our goals requires co-ordinated effortacross five continents. This is made more complicated by WPP’s management structure that devolves a great deal of management responsibility and discretion to ouroperating companies.
In 2005 we made progress towards all three of thesegoals. The details are reported below.
The impact of our work
The work our operating companies produce is a significantpart of our corporate responsibility performance. Supportingclients by marketing products that offer environmental andsocial benefits is also key. In addition, WPP businesseswork for governments producing campaigns to raise publicawareness of issues such as climate change, the importanceof health and well-being and the dangers associated with drugs.
Marketing ethics
As a minimum our businesses are expected to comply with all laws, regulations and codes of marketing practice.Our Code of Business Conduct states that we will notknowingly create work which contains statements,suggestions or images offensive to general public decencyand will give appropriate consideration to the impact ofour work on minority segments of the population, whetherthat minority be by race, religion, national origin, colour,gender, sexual orientation, age or disability.
Many professionals from within WPP companiesplay an important part in developing and revising industrycodes in sensitive areas such as advertising to children and the marketing of food and pharmaceutical products.For example, Denise Maguire, managing director of Hill &Knowlton Hong Kong, is chair of the Ethics Committee for the Council of PR Firms; Gary Laben, CEO ofKnowledgeBase Marketing, is a member of the EthicsAdvisory Committee of the US Direct MarketingAssociation; and Sue Brooker, a director of MillwardBrown, is a member of the Professional StandardsCommittee for the UK Market Research Society.
Most of the campaigns we produce for clients donot cause complaint, but occasionally complaints do occurrelating to matters of taste or fact. In most countries theseare arbitrated by government or industry organisations.Our 2005 Corporate Responsibility Report will containstatistics on the number of cases upheld against campaignsby WPP companies.
Privacy
Privacy is an important issue for our market research anddirect marketing companies as they hold and use consumerdata. Our operating companies strive to comply withnational data protection laws and marketing codes ofpractice such as the UK Data Protection Act and the EUData Protection Directive.
Cause-related marketing
Cause-related marketing links brands to charities, usuallythrough a donation for every product purchased. Executedsensitively, these campaigns benefit both brand and charity.Many WPP companies work on cause-related marketing.
WPP as an employer
Diversity
Our goal is to have a talent base that reflects thecommunities in which we operate. We believe diversitycontributes to our business creativity and enhances ourunderstanding of multicultural markets. Our non-discrimination policy, introduced in 1992, commits us to select, develop and promote the best people withoutregard to factors such as race, religion, national origin,colour, gender, sexual orientation, age or disability.

How we behave
Annual Report 2005How we behave112
The Group’s Code of Business Conduct containspolicies on human resource issues, such as harassment and discrimination. Our people can report any concerns or suspected cases of discrimination or misconductconfidentially (and anonymously if desired) through ourRight to Speak helpline.
In 2005, women accounted for 33% of executivedirectors of operating companies, 52% of account directorsand 54% of total employees. There are three women onWPP’s Board.
All of our major agencies in the US have internalprograms to increase the diversity of their workforce. WPP also participates in a number of initiatives toencourage diversity in the advertising industry. These are a few examples from 2005:
•Partnerships: WPP’s US-based advertising agencies arepart of Operation Success, an initiative launched by theAmerican Association of Advertising Agencies (AAAA) to increase diversity in the US advertising industry. Ouragencies support the work of many diversity organisations.These include the Business Advisory Committee (whichhelps disabled people to find jobs); Advertising Women of New York TORCH (Together Our Resources Can Help),a program for under-served New York public high schoolstudents; the National Black Public Relations Society(NBPRS); the Hispanic PR Association; and LaGrantFoundation, a non-profit organisation providing careerdevelopment support to students from ethnic minorities.
• Internships: Several WPP companies, including TheBravo Group, Grey Worldwide, JWT, Mediaedge:cia,MindShare, Ogilvy & Mather and Y&R participate in the AAAA’s Multicultural Advertising Internship Program(MAIP). This enables students from a range of ethnic
05Employees
Account directors
Senior executives
04
05
04
05
04
46%
45%
48%
49%
67%
68%
03
03
03
44%
46%
64%
54%
55%
52%
51%
33%
32%
56%
54%
36%Female Male
Gender diversity 2003-2005%
backgrounds to gain work experience in the advertisingindustry. JWT and Hill & Knowlton also participate inINROADS, an internship programme for minority youth.In addition, Grey holds an annual disability mentor day for 10 disabled students to experience work in an advertising agency.
•Targeted recruitment activities: WPP sponsors events,such as the Harvard Business School African-AmericanAlumni Association conference, that help inform minorityprofessionals about new career opportunities, and positionWPP as a preferred employer.
Our agencies participate in recruitment fairs andevents at many minority colleges and universities. Theseinclude NYU’s Diversity Careers Fair; the Diversity &Leadership Group at Duke University; Howard University;the International Radio and Television Society’s MinorityCareer workshop; AAF’s Mosaic Career Fair; theAdvertising Women of New York Conference; the AsianAmerican Diversity Career Expo; and the US Departmentof Labor’s Job Fair for Hispanics.
Group companies also use specialised recruitmentagencies and publications. For example, JWT New York is using Community Connect’s recruitment service. Greyadvertises vacancies in diversity publications and websitessuch as IMDiversity, the Ad Age Annual Diversity Issueand HBCUCareerCenter.com.
•Raising employee awareness: JWT launched a newdiversity and harassment training program for employeesin its North American offices. Ogilvy conducted diversityawareness training sessions for employees in 2005, andY&R has appointed a chief diversity officer and helddiversity leadership training for managers.
In the UK, WPP began working with RareRecruitment, a UK graduate recruitment agency, to finddiverse candidates for the WPP Marketing FellowshipProgram. Rare places the most able students from minority backgrounds with companies that have strongdiversity policies.
The South African Government’s Black EconomicEmpowerment policy requires companies to ensure theblack population is adequately represented in theirworkforce and to establish a level of black ownership.WPP companies operating in South Africa are on track to achieve the 30% level of black ownership required foradvertising and communications companies. Diversityinitiatives at our South African agencies include the GreyAction Program, which provides internships for 10 youngblack graduates each year.

How we behave
Annual Report 2005How we behave 113
•Regular communication on Group initiatives such as the Worldwide Partnership Program, BRANDZ, theAtticus Awards, the WPP Marketing Fellowship Programand professional development workshops.
•Periodic reports from Sir Martin Sorrell to participantsin LEAP, and to the Leaders, Partners and High Potentialgroups.
•WPP’s website, Group intranet site and professionalKnowledge Communities.
•Formal and informal meetings at operating company level.
•Our annual Corporate Responsibility Report is widelydistributed across WPP and is available on our intranet and website.
Health and well-being
We aim to identify and reduce health risks and provide a safe workplace. By focusing on issues relevant to ouroffice environments, such as stress management and goodpractice in workstation design and use, we aim to maximisethe health and well-being of our people. In turn, thisenables us to minimise absence from work and improveproductivity and employee retention. Our agencies seek to create an environment where people feel able to discussany issues, including stress, with their manager or humanresources department. Our companies also assess the riskof work-related stress through regular staff surveys and bymonitoring issues raised via our Right to Speak helplines,Employee Assistance Programs and during exit interviews.
Initiatives to combat workplace stress vary bycompany but include:
•Employee Assistance Programs – a source of confidentialadvice, support and counselling.
•Flexible benefit programs, including subsidised childcare.
•Flexible work arrangements enabling people to workpart-time or from home.
•Medical checks and health screening.
•Training on stress and time management.
Employee external appointments
The Company recognises that its directors and seniorexecutives may be invited to become non-executivedirectors of other companies and that such exposure maybe beneficial to the Group. Consequently, executives areallowed to accept non-executive appointments with non-competing companies subject to obtaining the approval ofthe Group chief executive in the case of senior executivesand the approval of the Nomination committee in the caseof executive directors. Any fees receivable out of suchappointments are retained by the individuals concerned.
Development and training
WPP is a people business and we aspire to high standardsof employment progression and investment in thedevelopment of our teams. Our approach includesperformance assessment, succession planning and training.Our goal is for our people at all levels in our businesses toreceive regular performance appraisals.
In 2005, WPP invested £32.7 million in training andwell-being across the Group. We have introduced coursesaimed at developing creative leadership, client leadershipand personal leadership. The parent company runs theSparkLab program of innovative behavioural workshopsand master classes. Devised by WPP for our own people,SparkLabs aim to improve everyday communication andpresentation skills. The SparkLab workshops are led byprofessionals from the performing arts.
Our operating companies also run a range oftraining courses covering all aspects of agency business and creative skills.
Employee share ownership
Share ownership gives our people a financial stake in theCompany and a share in its success. WPP’s WorldwideOwnership Plan, introduced in 1997, has granted shareoptions to over 53,000 of our people. Details of this planand other executive stock options can be found on page 122.
Communication
We keep our people informed and up to date with what is happening across the Group. With 92,000 people in 106 countries this can be a challenge, so we place greatemphasis on good internal communications. Someexamples are:
•Distribution of the Annual Report and Accounts, the Navigator company handbook, the Atticus Journal,The WIRE (WPP’s global newspaper), and regular FactFilesto all companies worldwide.
•A monthly online news bulletin – e.wire.
Staff training and welfare 2001-2005£000
05
04
03
02
01
32,700
25,145
21,793
20,921
23,419

How we behave
Annual Report 2005How we behave114
Social investment
WPP companies have a history of supporting charities on a pro-bono basis. The donation of our time and skills at no cost or minimal cost is worth much more than anequivalent cash donation. This is because the work weundertake for charities helps them recruit members, raisefunds and advance causes. The net benefit to the charity is usually many times the value of our input.
In 2005, our total social investment was worth£17.3 million, equivalent to 0.32% of revenue (2.9% ofreported pre tax profits). This includes £13.9 million in pro bono work (based on the fees the benefitingorganisations would have paid for our work) and £3.4 million in donations. WPP came fourth in the UKGuardian newspaper’s Giving List 2005 (based on 2004data) that ranks FTSE 100 companies by the value of theirsocial investment.
WPP the parent company
The Company focuses its support on education and the arts. In the UK we supported a range of organisations
including: the Charles Edward Brooke Girls’ School inLondon, which specialises in media arts; the Royal Collegeof Art annual illustration competition and support ofHardship Fund; two bursary awards for D&AD, theprofessional association for design and advertising; and the National Portrait Gallery and Natural HistoryMuseum in London.
Donations by category 2005%• Health 26%
• Other 26%
• Education 18%
• Local community 18%
• Arts 8%
• Environment 4%
Pro bono work by category 2005%• Health 23%
• Local community 21%
• Other 17%
• Education 14%
• Environment 13%
• Arts 7%
• Illegal drugs 5%
WPP is also working with the World EconomicForum on an initiative to change perceptions of Africaamongst business leaders.
Many senior WPP executives also give pro bonoadvice and support.
Sir Martin Sorrell is an active participant in programsat the following international business schools: LondonBusiness School; IESE, Spain; Indian Business School;Harvard Business School and Boston University; andWhistling Woods International Institute for film, televisionand media arts, Mumbai, India.
A donation from WPP has paid for a library to bebuilt at the Lower Basic School in Sanyang village, Gambia.This has been stocked by books donated from across WPPcompanies. WPP is also providing funds to help the villagebuild a healthcare clinic.
Employee volunteering
Many of our people give their time and expertise asvolunteers to support good causes in their localcommunities. We encourage this because it benefits thecharity and our people. For example:
•Good Deeds is the volunteering programme for Y&Rand Mediaedge:cia employees in Detroit. Employees canspend two work days each year giving back to thecommunity through individual or agency-wide volunteeringactivities. For each employee that participates, the agenciesdonate $100 to the community organisation supported.
•MJM recognise the importance of communityparticipation. Employees can take up to two days of paid company time, every six months, for communityservice activities.
•VML’s community service programme gives employeestwo workdays a year to volunteer in the community. VML employees work with five Kansas City organisationsthat need volunteers.
•Burson-Marsteller China launched a volunteeringprogramme in 2005, giving employees two work daysa year to support community activities.

How we behave
Environment and supply chain
We have prioritised three environmental issues – energyconsumption, paper use and recycling – and are workingon these with 10 of our biggest offices.
We recognise the potential impact of our purchasingdecisions on the environment and also the need to considerthe labour standards associated with manufacturing incertain product sectors. We have introduced ethical andenvironmental criteria to WPP’s Procurement Policy and initiated a corporate responsibility questionnairethrough our UK procurement team. Following theresponses of UK suppliers, we have invited a small number to a workshop at which we will pilot the nextstage of our engagement process.
Our strategy is to focus on companies where we believe our intervention will have the most impact. We anticipate that usually this will be by engaging withsmall- and medium-sized supplier companies that mayhave had less exposure to corporate responsibility thanmultinationals and major national companies.
Annual Report 2005How we behave 115

Introduction
This report is made by the Board, prepared on its behalfand for its approval by the Compensation committee. This will be my last report as chairman of the committeeand I am pleased that Jeffrey Rosen will take over as chairmanfollowing the forthcoming Annual General Meeting.
The report provides the Company’s statement ofhow it has applied the principles of good governance set out in the Combined Code and Schedule 7A to theCompanies Act in respect of compensation matters. As in previous years, additional information on executiveremuneration, based on a US-proxy style disclosure hasbeen added at the end of this report.
The report of the auditors on the financialstatements set out on pages 181 and 182 confirms that thescope of their report covers, where required, the disclosurescontained in or referred to in this report that are specifiedfor their audit by the UK Listing Authority and under theCompanies Act.
Details of each individual director’s remunerationand of their beneficial holdings of the Company’s sharesand share awards are set out on pages 125 and 126.
The Company is required to submit theCompensation committee report for share owner approvalat the Annual General Meeting (AGM) convened for27 June 2006 and the appropriate resolution is set out asresolution 19 in the Notice of Annual General Meetingaccompanying the Annual Report and Accounts.
2005 highlights
During the year the most significant issues addressed by the committee were:
•A thorough review of all executive compensation plans, their effectiveness and relevance to the Group’sbusiness needs.
•Changes to the incentive packages for the chief financialofficer and the director of strategy.
•A review of the contractual arrangements for the Groupchief executive and monitoring the vesting of awards undera number of his incentive plans.
•Effecting the transfer of existing incentive arrangementsto the new parent holding company following the Group’sreorganisation.
•Renewing the WPP Executive Stock Option Plan and theWPP Worldwide Ownership Plan.
Remit of the Compensation committee
Under its terms of reference the committee is responsible for:
•Reviewing and approving the remuneration and terms of employment (including any termination arrangements) of executive directors and senior executives of theCompany and of directors and senior executives of theoperating companies.
•Reviewing the incentive policy and compensation plans.
•Monitoring the vesting of awards under all incentiveplans including the Renewed Leadership Equity AcquisitionPlan (Renewed LEAP).
•Reviewing systems implemented throughout the Groupto deal with matters such as employee harassment anddiscrimination.
•Appointing and reviewing the performance of externaladvisors to the committee and to the Company in relationto executive remuneration and human resource activities.
Composition of the Compensation committee
During 2005, the Compensation committee comprised thefollowing who took decisions in respect of the year:
•S W Morten (chairman of the committee);
•P Lader;
•C Mackenzie.Esther Dyson was appointed a member of the
committee on 4 May 2006 and Jeffrey Rosen will replaceBud Morten as chairman of the committee following theAnnual General Meeting.
Annual Report 2005How we’re rewarded116
How we’re rewardedCompensation committee report
on behalf of the Board

How we’re rewarded
Annual Report 2005How we’re rewarded 117

How we’re rewarded
No current member of the committee has anypersonal financial interest (other than as a share owner asdisclosed on page 126) in the matters to be decided by thecommittee, potential conflicts of interest arising from cross-directorships or day-to-day involvement in running theGroup’s businesses.
The terms of reference for the Compensationcommittee are available on the Company’s website and willbe on display as set out in the Notice of Annual GeneralMeeting. These terms of reference are regularly reviewed.
Advisors to the Compensation committee
The Compensation committee regularly consults withGroup executives, particularly the Group chief executive(who was not present at any meeting when matters relatingto his own compensation or contracts were decided), the chief talent officer, the Director of compensation andbenefits and the Group general counsel. During the year, thecommittee received material assistance from Towers Perrin.Significant advice was also received from Hammondssolicitors on a number of legal and governance issuessurrounding compensation and benefits which arose duringthe course of the year. Hammonds provide legal advice on a range of matters to the Group.
During 2005, no advice was required in relation tothe remuneration of the chairman of the Company and the non-executive directors. Had it been required it wouldhave been provided by Towers Perrin to the Board and notto the committee.
Advice is received by the committee on issuesincluding the following:
•analysis of competitive compensation practices anddetermination of competitive positioning;
•base salary levels;
•annual and long-term incentive plans and awards;
•policy relating to WPP share ownership;
•pensions and executive benefits;
•service contract terms for executives;
•changes in accounting, taxation, legal and regulatorypractices;
•governance issues relating to compensation and the roleof the committee; and
•policies for preventing employee harassment anddiscrimination.
Principles of remuneration
At its heart all executive compensation at WPP is governedby three guiding principles:
•competitiveness;
•performance; and
•alignment to share owner interests.
Competitiveness
Compensation packages for Group executives are reviewed on a regular basis (on average every 24 months). Whenreviewing an executive’s package the committee usuallyconsults with the Group chief executive, the Group chieftalent officer and the chief executive officer of theappropriate operating company.
In making its assessments, the committee considersindividual and business unit performance, level ofexperience and scope of responsibility. It also takes intoaccount the overall value of the package, including bothfixed and variable elements, and focuses on the ‘on-target’level of remuneration. The competitiveness of this totalpackage is then reviewed in relation to the mostappropriate benchmarks.
For example, for the Group chief executive threeseparate benchmarks for remuneration opportunities are used:
• the most senior executive position in the Company’s twoclosest comparators, Omnicom and Interpublic Group;
• the CEO position in companies of comparable size andcomplexity in the UK; and
• the CEO position in public companies of comparable sizeand complexity in the US.
The same approach is taken for the other seniorexecutives, including executive directors. The Compensationcommittee considers data from the latest industry surveyscovering the senior positions in WPP’s operating companies.WPP participates in the leading global surveys of executiveremuneration in the advertising, market research, healthcare,public relations and public affairs sectors. In addition, forheads of operating companies the committee considerspublic disclosures for similar positions in listed companiesof comparable size and complexity in the relevant sector.
Annual Report 2005How we’re rewarded118

How we’re rewarded
Performance
All remuneration packages for senior executives, includingexecutive directors, have a significant element which isvariable and dependent on performance as can be seen fromthe chart below.
i) Fixed compensation comprises salary, pension contributions and other benefits as disclosed in thetable on page 125.
ii) Variable compensation comprises short-term incentive plans and the value of Executive ShareAwards are also disclosed in the table on page 125 along with the expected value of the RenewedLEAP award granted in 2005 referred to in the table on page 129.
The performance targets set in respect of variablecompensation are both specific and challenging as isapparent in the fact that little or no short-term bonus was paid in 2001 and 2002 and both the 2002-2004 andthe 2003-2005 Performance Share Plan awards failed topay out.
Alignment to share owner interests
WPP is committed to aligning executive performance andreward with share owner interests. This is achieved byproviding significant opportunities for executives to acquireWPP stock, by using performance measures that are linkedto the creation of share owner value and by operating shareownership goals for the most senior executives.
Many of our incentive plans pay out wholly orpartially in WPP stock. As can be seen below, approximatelyhalf of the compensation package of the executive directorswas delivered in shares last year.
i) Cash compensation comprises salary, pension contributions, short-term incentive plans and otherbenefits as disclosed in the table on page 125.
ii) Share-based compensation comprises the value of Executive Share Awards are also disclosed in thetable on page 125 along with the expected value of the Renewed LEAP award granted in 2005referred to in the table on page 129.
Sir Martin Sorrell
Paul Richardson
Howard Paster
Mark Read
0 20 40 60 80 100%Cash Shares
Sir Martin Sorrell
Paul Richardson
Howard Paster
Mark Read
0 20 40 60 80 100%Fixed Variable
The Compensation committee believes that Total ShareholderReturn (TSR) relative to a group of key comparatorscontinues to be the most appropriate measure fordetermining long-term performance-based rewards forGroup executive directors, as it most closely aligns rewardwith the delivery of share owner value. For this reason TSRis the sole measure of performance used for Renewed LEAP.
WPP has encouraged share ownership for its mostsenior executives, including executive directors, for manyyears. For executive directors this is achieved throughparticipation in Renewed LEAP. Other WPP Leaders(approximately 200 people) are expected to own at least40,000 WPP ordinary shares.
Clearly there is also a need to ensure that shareowner value is not diminished through the issue of newshares to satisfy incentive awards. The dilution, as at 4 May 2006, was well below the 10% level recommendedby the ABI. It is intended that Renewed LEAP awards, thePerformance Share Awards, the Executive Share Awardsand Restricted Stock Plan awards will all be satisfied withpurchased shares held in the employee share ownershipplans (ESOPs).
Review of compensation
During 2005, the committee undertook a thorough reviewof the Group’s current compensation and incentive strategy.The review included extensive internal consultation, anexamination of our competitors’ current practices andconsideration of financial, tax, accounting and legal issuesand current best practice guidelines.
From this review it was apparent that:
•The ongoing use of stock options had become a majorsource of executive dissatisfaction, was not cost-effective(i.e. the cost to WPP of providing options far outweighedthe perceived value delivered to the participant) andfurthermore the use of options was becoming less commonin the industry.
WPP Share Incentive Scheme dilutionfor 2001 to 2005
14
2
4
6
8
10
12
0 0504030201WPPABI Limit
Dilution levels %
Annual Report 2005How we’re rewarded 119

How we’re rewarded
•The dynamic nature of our businesses meant that thethree-year performance measures used in our operatingcompany LTIP plans were both volatile and complex. This in turn resulted in the plans not being fully understoodand providing little motivational or retentive effect.
• In the limited cases they were being used, restricted stockawards were much better understood and provided a goodretention mechanism.
•The ‘poaching’ of our people by competitors wasbecoming an area of considerable concern across most ofour businesses and this was often accompanied by seniorexecutive frustration with the lack of appropriate means of compensation to retain our best people.
•Renewed LEAP continues to be an effective plan forcertain senior executives.
The committee therefore decided to make a numberof significant changes to the way in which compensation isto be delivered while at the same time staying true to theprinciples of compensation described above. In summarythis entailed:
•Single-year performance awards (Performance ShareAwards/PSAs), delivered as restricted stock awards andvesting a further two years after the end of the one-yearperformance period, replaced awards previously madeunder the operating company LTIPs.
•Similarly at the parent company, the use of ExecutiveShare Awards (ESAs) replaced awards previously madeunder the Performance Share Plan. Again, these awards will vest two years after the end of the one-yearperformance period.
•A significantly reduced use of stock options from theWPP Executive Stock Option Plan. Awards of stock optionsunder this plan have not been made to executive directorssince 1995. Below this level, options will now only be usedunder this plan (as opposed to the WWOP referred to in the table on page 122) in special circumstances, for exampleas a recruitment incentive.
•Future awards of stock made on an annual basis to theWPP Leaders, Partners and High Potential Groups will allbe in the form of restricted stock which vest three yearsafter grant.
Annual Report 2005How we’re rewarded120
Impact of IFRS
From 1 January 2005 the Company has been required toaccount under IFRS. It is commonly acknowledged that thismay lead to greater volatility in earnings. The committee is aware that these changes may affect the evaluation ofperformance under those WPP long-term plans which useearnings-based performance measures. The committee, inconsultation with the Audit committee, has resolved to takethese matters into account when evaluating performanceunder the relevant long-term incentive plans.
Details of the expensing of share-based incentivesunder IFRS 2 are given in note 25 on page 160.
Policy on directors’ service contracts, notice periodsand termination payments
The Compensation committee regularly considers theCompany’s policy on the duration of directors’ servicecontracts, the length of notice periods in executivedirectors’ service contracts and provisions for payment(if any) on termination of such contracts.
None of the contracts of parent company executivedirectors contain liquidated damages provisions. There wereno payments in 2005 in respect of termination of employmentof any executive director. The notice periods for directorsare as follows:
Executive director Contract/effective date Notice period
Sir Martin Sorrell 1 April 2005 “At will”
Howard Paster 1 January 2002 6 months
Paul Richardson 1 January 2005 12 months
Mark Read 9 September 2002 6 months
Non-executive director* Contract date
Philip Lader 26 February 2001
Colin Day 25 July 2005
Esther Dyson 29 June 1999
Orit Gadiesh 28 April 2004
David Komansky 28 January 2003
Bud Morten 2 December 1991
Lubna Olayan 18 March 2005
John Quelch 10 July 1991
Koichiro Naganuma 23 January 2004
Christopher Mackenzie 14 March 2000
Jeffrey Rosen 20 December 2004
Paul Spencer 28 April 2004
*The notice period applicable to all non-executive directors is two months.

How we’re rewarded
Group chief executive – Sir Martin Sorrell
Sir Martin Sorrell’s services to the Group outside the UShave previously been provided under an agreement withJMS Financial Services Limited (JMS). With effect from1 April 2005 this was replaced by an executive servicecontract entered into directly between Sir Martin and theCompany. He is also directly employed by WPP GroupUSA, Inc. for his activities in the US. Taken together, thecurrent agreement in relation to his services to the Groupoutside the US (‘the UK Agreement’) and to his services tothe Group in the US (‘the US Agreement’) provide for thefollowing remuneration, including incentive awards, all ofwhich is disclosed on pages 125 to 129:
•annual salary of £859,000*;
•annual pension contributions of £343,000;
•short-term incentive (annual bonus) of 100% of annualsalary at target and up to 200% at maximum;
• the Executive Stock Award; and
• the Leadership Equity Acquisition Plan as renewed.*Year-on-year may fluctuate due to exchange rate variances.
Annual Report 2005How we’re rewarded 121
Performance graphWPP total return to share owners relative to relevant comparators rebased to 31 December 2000
150
100
50
0
31 Dec 00 31 Dec 01 31 Dec 02 31 Dec 03 31 Dec 04 10 May 0631 Dec 05
WPP FTSE 100 Omnicom Interpublic
Source: Datastream
For share owners’ information, the Company’s TSR for the period from 31 December 2000 to 10 May 2006 is shown on this graph. The FTSE 100 is the Index the Board considers most relevant for the purpose of comparison andInterpublic and Omnicom are shown as these are the companies with whose performance that of the Company is mostcommonly compared.
Earned awards exercised by Sir Martin Sorrell in 2004and 2005
The table set out below was included in last year’s report of the committee and proved helpful for share owners inunderstanding the vesting/exercise of various incentiveplans awarded to Sir Martin Sorrell since 1993 and whichhave been deferred over a number of years.
The table has therefore been included again this year:
Notes1 In addition, 987,742 shares vested but have not yet been exercised and a further 2,649,208 shares weredeferred until 1 October 2008.
2 The number of shares under Original LEAP includes those attributable to JMS.3 JMS exercised the Phantom Options on 23 March 2005 and used the proceeds to subscribe for1,907,468 shares.
4 At 31 December 2005, Sir Martin Sorrell remained interested in the right to 11,077 shares under thePerformance Share Plan award made on 28 February 2001.
Date of No. of shares/ Year(s) of vesting/ phantom
Plan grant exercise shares
Capital Investment Plan1 1994 01.09.04 1,054,442
Notional Share Award Plan 1994 01.09.04 1,754,520
Original LEAP2 1999 22.09.04 3,221,442
Phantom Options3 1993, 1994 23.03.05 2,148,581
Performance Share Plan4 1999, 2000, 2001 16.03.05 313,976

How we’re rewarded
Annual Report 2005How we’re rewarded122
Key elements of short - and long-term remunerationObjective Participation Performance
periodConditions
Elements of remuneration
The principal elements of WPP executive remuneration were fully reviewed in 2005 and currently comprise the following:
•Base salaries (fixed);
•Annual incentives (variable); and
•Long-term incentives (variable).Pension contributions, life assurance, health and disability, and other benefits are also provided.
AnnualBase salary1 To maintain package competitiveness
at all levels within the Group.All employees. N/A Not applicable. But salary levels
are determined taking a number of relevant factors into account, including individual and business unit performance, level of experience,scope of responsibility and thecompetitiveness of total remuneration.
Cash bonus To incentivise delivery of value at alllevels within the Group.
Approximately 10% of employees are eligible to receive a performance bonus.
1 year Achievement of challengingperformance goals (financial and non-financial) at the individual and business unit level.
Performance share awards2
To incentivise delivery of value and toalign with interests of share owners.
Key operating company executives. 1 year Achievement of challengingperformance goals (financial and non-financial) at operating company level.Further two-year retention period.
Executive share awards2
To incentivise delivery of value and toalign with interests of share owners.
Parent company executives and executive directors.
1 year Achievement of individual annual bonus objectives. Further two-year retention period.
Long-TermWWOP3 To develop a stronger ownership
culture.Employees with two years’employment. Not offered to thoseparticipating in other share programsor to executive directors.
3 years None.
Renewed LEAP To incentivise long-term performanceof the most senior executives againstthe TSR of key comparators andmaximise alignment with share ownerinterests through a high level ofpersonal financial commitment.
Participation offered only to those keyexecutives (currently less than 20people) whose contributionstranscend their day-to-day role,including executive directors.
5 years Relative TSR performance against a group of key communicationservices comparator companies,subject to a fairness review by the Compensation committee.
Restricted Stock Plan
To encourage a share ownershipculture and long-term retention as well as supporting recruitment.
Directors and senior executives of the operating companies and seniorexecutives of the parent company.
Typically 3 yearretention period.
None.
Executive Stock Option Plan
To provide a tool to promote retentionand recruitment.
Occasional use only to deal withspecial situations.
3 years Conditions are determined at the time of grant of the award.
This table does not include details of previous plans, such as operating company LTIPS and PSP which are no longer used for regular grants of new awards.1 Base salary is the only pensionable element of remuneration.2 Awards are granted under the Restricted Stock Plan.3 Since its first adoption in 1997, grants have been made annually under this plan and as at 4 May 2006 options under this plan had been granted to over 53,000 employees for approximately 26.6 millionordinary shares of the Company.

How we’re rewarded
Base salary
The Compensation committee believes that base salary isonly one element of compensation and therefore shouldonly be reviewed in the context of the total compensationbeing provided to an executive.
During 2005 the base salary of Mark Read wasincreased to £225,000 as part of the overall review of hiscompensation arrangements when he was appointed to the Board. No other change was made to the base salary of any other executive directors.
Annual cash bonus
The annual cash bonus is paid under plans established foreach operating company and for executives, includingexecutive directors, of the parent company. Challengingperformance goals are established and these must be achievedbefore any bonus becomes payable.
Each executive’s annual incentive opportunity isdefined at a ‘target’ level for the full achievement ofobjectives. Higher awards may be paid for outstandingperformance in excess of target.
The target level for Group executive directors (otherthan the Group chief executive and Group finance director)is currently no more than 50% of base salary and themaximum is currently 75%. In the case of the Groupfinance director, the target level is 80% of base salary and120% at maximum. The target level for the Group chiefexecutive is 100% of base salary and the maximum is 200%.
In the case of the Group chief executive and otherparent company directors, the annual cash bonus is basedon Group and individual performance:
•one-third is based on Group financial results. This goal is common for all executive directors including the Groupchief executive (For 2005 the Group’s financial results werevery strong, with Headline PBIT increasing by almost 35%to £755 million, Headline PBIT margin increasing from13.0% to 14.0% and Headline diluted earnings per shareup 29% to 36.0 pence per share. Both profit and cash flowwere above budget.);
•one-third is based on individual strategic objectivesdetermined prospectively by the committee at thecommencement of each year. In the case of the Group chiefexecutive this related to the relative financial performanceof WPP against its peer group. (For 2005 WPP ranked firstin the peer group for operating profit growth, EPS growthand margin improvement.); and
•one-third is based on the achievement by the individualdirector of critical business objectives assessed by thecommittee at the end of each year. For 2005 in the case ofthe Group chief executive these included (amongst others)strengthening the geographic position of Group companiesin both developed and fast-growing markets, ensuringorderly and effective succession of leadership for a numberof specific key operating company and parent companyroles, developing collaboration amongst the businessleaders and encouraging cross-selling between Groupcompanies, including client co-ordination initiatives.
In assessing the individual performance of eachexecutive director in 2005, taking into account theperformance referred to above, the committee determinedthat the appropriate bonus for each was as follows:
Share awards
Following the policy review undertaken in 2005, theoperating company LTIPs were replaced by PSAs. This hasconsiderably simplified the measurement of performancewhile at the same time increasing retention by ensuring agreater percentage of the bonus pool is paid in shares.
At the parent company the comparable changemeant that no further awards were granted under the PSPand instead ESAs are used to reward executive directors forperformance over a single year. Performance under theseawards is against the same measures currently used todetermine the annual bonus payment, but in this casedelivered entirely in the form of shares with a further two-year retention period.
These awards are not pensionable and will be satisfiedout of one of the Company’s ESOPs and not out of a newissue of WPP or treasury shares.
Sir Martin Sorrell 190% of salary
Paul Richardson 108% of salary
Howard Paster 68% of salary
Mark Read 73% of salary
Annual Report 2005How we’re rewarded 123

How we’re rewarded
Annual Report 2005How we’re rewarded124
Renewed Leadership Equity Acquisition Plan(‘Renewed LEAP’)
Renewed LEAP was approved by share owners in April2004. As with Original LEAP the purposes of RenewedLEAP are to:
•reward superior performance relative to WPP’s peercompanies;
•align the interests of executive directors and other keyexecutives with those of share owners through significantpersonal investment and ownership of stock; and
•ensure competitive total rewards.Under Renewed LEAP, participants have to commit
WPP shares (‘investment shares’) in order to have theopportunity to earn additional WPP shares (‘matchingshares’). For each participant’s first LEAP award, at leastone-third of these investment shares have to be purchasedin the market. The number of matching shares which aparticipant can receive at the end of the investment andperformance period depends on the performance (based on TSR) of the Company measured over five financial years (four years in the case of awards made in 2004).
It is expected that all matching shares to whichparticipants may become entitled will be provided from one of the Company’s ESOPs.
The Compensation committee believes that TSRrelative to a group of key comparator companies is themost appropriate measure for determining performance-based rewards for Group executive directors, as it mostclosely aligns reward with the delivery of share owner value.However, the Compensation committee also acknowledgesthat TSR may not always reflect the true performance ofthe Company and in exceptional circumstances it thereforemay need to perform a ‘fairness review’ to vary the numberof matching shares that will vest if it determines that,during a performance period, there have been exceptionalcircumstances. Factors that the Committee will consider in its fairness review of any awards will include variousmeasures of the Group’s financial performance, such asgrowth in revenues and in earnings per share.
For the 2005 awards the vesting schedule is as follows;
As at the year end WPP’s TSR growth was belowmedian for both the 2004 and 2005 performance periods.The comparator companies for the awards made in 2005were:
On a change of control, matching shares underRenewed LEAP can be received based on the Company’sperformance to that date.
Awards are made on an annual basis, taking intoaccount prevailing market and competitive conditions.Under Renewed LEAP, Sir Martin Sorrell committedinvestment shares having a value of $10 million, namely1,032,416 shares, for the award made for 2004. In 2005 Sir Martin committed investment shares having a value of $2 million, namely 203,394 shares.
Retirement benefits
All pension coverage for the Company’s executive directorsis currently on a defined contribution basis and only basesalary is pensionable under any Company retirement plan.Details of pension contributions for the period under reviewin respect of executive directors are set out on page 125.
The form and level of Company sponsoredretirement programs varies depending on historicalpractices and local market considerations. The level ofretirement benefits is regularly considered when reviewingtotal executive remuneration levels.
Omnicom Aegis
Interpublic Taylor Nelson Sofres
Publicis Dentsu
Havas Arbitron
Ipsos VNU
Gfk
Rank compared to peer group* Number of matching shares
1 5
2 5
3 4.5
4 3.5
5 2.5
6 1.5
Below median 0**
* For actual performance between these positions the match is calculated on a pro rata basis.
**For participants for whom 2005 is the first year in LEAP, performance below median results in a halfshare match.

How we’re rewarded
The compensation of all executive directors is determined by the Compensation committee which is comprised wholly of non-executive directors whom the Company considers to be independent. The Compensation committee is advised byindependent remuneration consultants as well as by Group executives as referred to in the Report of the Compensationcommittee on page 118. The information in this section (pages 125 to 129) forms the part of the Report of theCompensation committee that is subject to audit.
The compensation of the chairman and non-executive directors is determined by the Board, which when necessaryis similarly advised.
The components of executive directors’ remuneration and the principles on which these are established are describedin the Report of the Compensation committee which commences on page 116.
Remuneration of the directors who were directors during the year ended 31 December 2005 is set out in the table below.All amounts shown constitute the total amounts which the respective director received during 2005 and for the annualbonus in respect of 2005 but received in 2006. No compensation payments for loss of office have been made during 2005to any individuals who have been directors of the Company.
Short-termincentive Total annual Pension
plans remuneration contributions
Salary Other (annual Value 2005 2004 2005 2004and fees benefits1 bonus)2 of ESA8 Total Total Total Total
Chairman Location £000 £000 £000 £000 £000 £000 £000 £000
P Lader3 USA 216 – – 216 213 – –
Executive directors
Sir Martin Sorrell1, 3, 4 UK 859 25 1,596 798 3,27810 2,419 343 321
E L Axelrod3, 6 USA 115 9 – – 124 615 145 22
H Paster3 USA 385 35 261 354 1,03510 584 19 8
M Read6 UK 169 1 163 218 551 – 17 –
P W G Richardson1, 3, 5 USA 463 91 486 450 1,49010 814 90 90
Non-executive directors
C Day6 UK 22 – – 22 – – –
E Dyson3 USA 51 – – 51 50 – –
O Gadiesh3 USA 51 – – 51 33 – –
D Komansky3 USA 51 – – 51 50 – –
C Mackenzie UK 54 – – 54 56 – –
S W Morten3 USA 65 – – 65 66 – –
K Naganuma9 Japan – – – – – – –
L Olayan6 KSA 40 – – 40 – – –
J A Quelch3, 7 USA 93 46 – 139 114 – –
J Rosen3, 6 USA 54 – – 54 – – –
P Spencer UK 60 – – 60 37 – –
Total remuneration 2,748 207 2,506 1,820 7,281 5,051 614 441
Notes1 Other benefits comprise healthcare, life assurance and allowances for cars, housing and club memberships.2 Amounts paid in 2006 in respect of bonus entitlements for 2005.3 All amounts payable in US dollars have been converted into pounds sterling at $1.8189 to £1. The amounts paid to Sir Martin Sorrell and Paul Richardson were paid part in US dollars and part in poundssterling. This can give rise to small fluctuations year on year.
4 The amount of salary and fees comprise the aggregate of salary/fees paid under the UK Agreement and the salary paid under the US Agreement.5 Neither Paul Richardson nor the Company received any payment from Chime Communications PLC or STW Communications Group Limited in respect of his non-executive directorships in those companies.6 Jeffrey Rosen was appointed to the Board in January 2005, Lubna Olayan was appointed to the Board in March 2005, Mark Read was appointed to the Board in April 2005, and Colin Day was appointed tothe Board in July 2005. Beth Axelrod retired from the Board in March 2005.
7 In addition to fees paid to John Quelch in 2005 as a non-executive director of the Company additional fees were received by him of £46,000.8 Shares vesting under these awards are deferred for two years.9 Mr Naganuma received no remuneration from the Company given his executive position with Asatsu DK.
10 The total for 2005 includes the value of the ESA. There was no comparable award in 2004 because historically awards have been made under the Performance Share Plan which is not a short-term incentive plan.
Directors’ remuneration – information subject to audit
Annual Report 2005How we’re rewarded 125

How we’re rewarded
Annual Report 2005How we’re rewarded126
Ordinary shares
Directors’ interests in the Company’s share capital, all of which were beneficial, were as follows1:
MovementShares acquired during At 31 Dec Shares acquired At 4 May
At 1 Jan through long-term 2005 2005 through long-term Other 20062005 or incentive plan inc. shares or earlier incentive plan movements or earlier
appointment awards in 20052
purchased retirement or awards in 20062
since retirement ordate Vested (sold) in 20053 resignation Vested (sold) 31 Dec 2005 resignation
E L Axelrod3, 4 75,720 4,859 (4,859) – 75,720 – – – 75,720
C Day4 3,240 – – 2,000 5,240 – – – 5,240
E Dyson 35,000 – – – 35,000 – – – 35,000
O Gadiesh – – – – – – – – –
D Komansky 10,000 – – – 10,000 – – – 10,000
P Lader 11,950 – – – 11,950 – – – 11,950
C Mackenzie 10,000 – – 20,000 30,000 – – – 30,000
S W Morten 20,000 – – – 20.000 – – – 20,000
K Naganuma6 – – – – – – – – –
L Olayan4 – – – – – – – – –
H Paster3, 5, 7, 8 502,736 – – (84,732) 418,004 – – (171,367) 246,367
J A Quelch 12,000 – – – 12,000 – – – 12,000
M Read3, 4, 5 3,000 – – – 3,000 – – – 3,000
P W G Richardson3, 5, 7, 8 455,000 10,816 (4,816) (234,824) 226,176 4,402 (4,402) (38,000) 188,176
J Rosen4 – – – – – – – – –
P Spencer – – – 10,000 10,000 – – – 10,000
Sir Martin Sorrell3, 5, 7, 9 17,265,707 34,701 (34,701) (3,632,679)13,633,028 11,373 – – 13,644,401
Notes1 Save as disclosed above and in the Report of the Compensation committee, no director had any interest in any contract of significance with the Group during the year.2 Further details of long-term incentive plans are given in the notes on pages 127 to 129.3 Each executive director has a technical interest as an employee and potential beneficiary in shares in the Company held under the ESOPs. At 31 December 2005, the Company’s ESOPs held in total53,297,356 shares in the Company (2004: 51,657,256 shares). On 24 March 2005, JMS sold 4,115,961 shares to the WPP Group plc UK ESOP (UKESOP) at a price of 617.5p per share and on the sameday Sir Martin Sorrell acquired from the UKESOP 2,999,003 shares also at the price of 617.5p per share.
4 Jeffrey Rosen was appointed to the Board in January 2005, Lubna Olayan was appointed to the Board in March 2005, Mark Read was appointed to the Board in April 2005 and Colin Day was appointed tothe Board in July 2005. Beth Axelrod retired from the Board in March 2005.
5 The above interests do not include the unvested interests of the executive directors in the Performance Share Plan or Restricted Stock Plan.6 K Naganuma is a director of Asatsu-DK, which at 4 May 2006 was interested in 31,295,646 shares representing 2.5% of the issued share capital of the Company.7 In respect of Sir Martin Sorrell, Howard Paster, Paul Richardson and Mark Read the above interests include investment shares committed to the 2004 and 2005 awards under Renewed LEAP, but do notinclude matching shares.
8 Paul Richardson sold 234,824 shares at a price of 614p per share on 23 March 2005. Howard Paster sold 78,032 shares at a price of 623p per share on 8 March 2005 and further gifted 6,700 shares to twoUS based charities on 6 September 2005.
9 In the case of Sir Martin Sorrell (through JMS) interests included 1,571,190 and 577,391 phantom options granted in 1993 and 1994 respectively, which were exercised on 23 March 2005, details of which areset out in the table on page 121 and also on page 127. Also included for Sir Martin Sorrell are 4,691,392 shares in respect of the Capital Investment Plan part of which vested in September 2004 and inrespect of which 987,742 shares are vested but have not yet been exercised and Sir Martin Sorrell deferred a further 2,649,208 shares until 1 October 2008. Sir Martin Sorrell also exercised rights over313,976 shares under the Performance Share Plan in March 2005 and sold 1,920,000 on 19 December 2005 at a price of 627.5p per share. In addition, the restricted period on the 178,036 shares whichrepresented Sir Martin’s bonus for 2002, and which he received in the form of restricted stock, ended on 27 May 2005.
Directors’ interests

How we’re rewarded
Annual Report 2005How we’re rewarded 127
Option and Phantom Option Awards held by executive directors in the year ended 31 December 2005
Granted Percent-At 1 Jan (lapsed) Exercised At 30 Dec Share/ADR age of Exercised
Grant/ 2005 2005 2005 Value on 2005 price maximum 2006 Share Vaue onAward Exercise (no. of (no. of (no. of Share price exercise (no. of 30 Dec vesting (no. of price on exercise
Date price shares) shares) shares) on exercise (£) shares) 20051 potential shares) exercise (£)
Sir Martin Sorrell2 Apr 1993 52.50p 1,571,190 – 1,571,190 617.50p 8,877,224 – 629p 100% – –
Apr 1994 115.00p 577,391 – 577,391 617.50p 2,901,390 – 629p 100% – –
H Paster3 Sep 1995 154.00p 78,032 – 78,032 623.00p 365,970 – 629p 100% – –
Jun 1996 214.00p 10,688 – – 10,688 629p 100% 10,688 671p 48,844
Sep 1997 283.50p 83,499 – – 83,499 629p 100% 83,499 671p 323,559
Sep 1998 293.00p 77,180 – – 77,180 629p 100% 77,180 677p 296,372
Sep 1999 $46.47501 11,834 – – 11,834 $54 100% – –
Sep 2000 $63.26251 8,694 – – 8,694 $54 100% – –
Sep 2001 $35.38001 16,959 – – 16,959 $54 100% – –
Sep 2002 $33.20001 18,072 – – 18,072 $54 100% – –
M Read3 Nov 2003 559.50p 10,615 – – 10,615 629p 100% – –
Oct 2004 553.50p 9,879 – – 9,879 629p 100% –
Notes1 Share price 12 month high/low: 630.5p/534.5p; $60.05/$47.34. Where $ is used in the above table, the awards to the relevant director are in respect of American Depositary Receipts (ADRs).2 The two awards shown in respect of Sir Martin Sorrell, relate to phantom option awards made to JMS in 1993 and 1994. The award made in 1993 was in respect of 2,196,190 phantom options. JMSexercised 625,000 of the 1993 phantom options in 1997, leaving 1,571,190 unexercised. The phantom option awards have vested in full. The exercise of the phantom option awards took place on 23 March2005; under an agreement dated 14 May 2001, the sum received was used by JMS to subscribe for 1,907,468 shares in aggregate.
3 All option awards were granted prior to becoming an Executive Director.
Restricted Stock Awards
During 2005 Mark Read held the following Restricted Stock awards, all of which were granted prior to his appointment asan executive director:
Grant date No. of shares awarded Vesting date
1 Jun 2004 5,515 1 Jun 2006
6 Mar 2005 19,262 6 Mar 2008
10 Mar 2005 4,816 10 Mar 2007

How we’re rewarded
Annual Report 2005How we’re rewarded128
Other Long-Term Incentive Plan awards
Performance Share Plan awards to directors up to and including 31 December 20051
Share ValueShare Granted price on received Percentage
price on At (lapsed) Vested vesting/ At from vested of maximumGrant grant date 01.01.05 2005 Performance 06.03.05 deferral date 31.12.05 awards vestingdate (p) (no. of shares) (no. of shares) period ends (no. of shares) (p) (no. of shares) (£) potential (%)
E L Axelrod2 02.09.02 473.0 9,601 (4,742) 31.12.03 4,859 623 – 30,272 50
18.09.02 421.0 52,645 (52,645) 31.12.04 – – Nil
30.04.043, 4 556.0 62,190 (62,190) 31.12.05 – – –
30.04.04 556.0 67,535 (67,535) 31.12.06 – – –
H Paster 30.04.043, 4 556.0 79,150 – 31.12.05 – 79,150 –
30.04.04 556.0 85,955 – 31.12.06 – 85,955 –
M Read 18.09.02 421.0 4,462 (4,462) 31.12.04 – – Nil
30.04.04 556.0 6,646 – 31.12.06 – 6,646 –
P W G Richardson 29.02.00 1,221.5 6,328 1495 31.12.02 6,477 623 – 40,352 69
28.02.01 812.0 8,571 545 31.12.03 4,339 623 4,286 27,032 50
18.09.02 421.0 44,617 (44,617) 31.12.04 – – Nil
30.04.043, 4 556.0 67,912 – 31.12.05 – 67,912 –
30.04.04 556.0 92,025 – 31.12.06 – 92,025 –
Sir Martin Sorrell5 22.09.99 568.5 186,247 – 31.12.01 186,247 7607 – 1,415,4778 85
29.02.00 1,221.5 94,500 – 31.12.02 94,500 474.57 – 448,4038 69
28.02.01 812.0 44,306 – 31.12.03 33,229 548.57 11,077 182,2618 50
18.09.02 421.0 115,319 (115,319) 31.12.04 – – – Nil
30.04.043, 4 556.0 142,615 – 31.12.05 – – 142,615 –
30.04.04 556.0 171,779 – 31.12.06 – – 171,779 –
Notes1 Performance conditions: The performance condition relates WPP’s Total Shareholder Return (TSR) compared to the TSR results for a comparator group of communications services companies. No vestingtakes place if the WPP TSR is below the median TSR result for the comparator group and full vesting occurs if WPP TSR is at least equal to the second highest result within the comparator group. Betweenthese levels, awards vest on a sliding scale according to TSR performance.
No awards were made under the PSP in the year ended 31 December 2005. Details of the comparator groups which apply in respect of different awards are as follows (for companies which subsequentlydelisted, the date of delisting is shown in brackets). Details of the treatment of delisted companies for the purposes of TSR calculation are set out in note 1 to the table on Renewed LEAP below.
(i) For 2003 and 2004 awards: Aegis Communications Group, Arbitron, Dentsu, Digitas, Grey Global Group (delisted March 2005), Gfk, Havas Advertising, Ipsos, Omnicom, Publicis, Taylor Nelson Sofres, Interpublic and VNU.
(ii) For 2002 awards: Aegis Communications Group, Cordiant Communications (delisted July 2003), Grey Global Group (delisted March 2005), Havas Advertising, Omnicom, Publicis, Taylor Nelson Sofres andInterpublic.
(iii) For 2001 awards, in addition to those listed at (ii): True North Communications (delisted June 2002).
(iv) For 2000 awards, in addition to those listed at (ii) and (iii): AC Nielsen (delisted February 2001), Saatchi & Saatchi (delisted September 2000) and Young & Rubicam (delisted October 2000).2 Beth Axelrod, who resigned in March 2005, had vested rights under the Performance Share Plan, all of which lapsed upon her ceasing to be an employee of the Group except the 4,859 shares from the 2001-2003 PSP which had already vested and were sold.
3 Following the calculation of TSR for WPP and the comparator group, the awards with the performance period ending 31 December 2005 have since lapsed.4 On 30 April 2004, awards were made to Beth Axelrod, Howard Paster, Paul Richardson and Sir Martin Sorrell in respect of period 2003-2005.5 These shares represent dividends received in respect of restricted stock where the performance conditions have been satisfied, and the dividends have been reinvested in the acquisition of further ordinaryshares or ADRs.
6 Sir Martin Sorrell deferred the vesting of 93,123 shares due to vest in 2002, 93,812 shares due to vest in 2003 and 92,340 shares due to vest in 2004, which would otherwise have been due to him under PSP.These awards together with 34,701 shares which vested in March 2005 were exercised on 23 March 2005.
7 The rules required that the value of the award was determined by reference to the value on the deferral date.8 The value received from vested awards does not include amounts paid in respect of dividends accrued on awards that Sir Martin Sorrell deferred in 2002, 2003 and 2004.

How we’re rewarded
Annual Report 2005How we’re rewarded 129
Renewed Leadership Equity Acquisition Plan
At median level of performance At maximum level of performance
Share Number of Number of Number of Number ofGrant/ units matching Granted/ matching matching Granted/ matchingaward (ADRs/ units at (lapsed) units at units at (lapsed) units at
Name date Ords)1 01.01.052 units 31.12.05 01.01.052 units 31.12.05
E L Axelrod3 28.10.04 ADRs 7,423 (7,423) – 24,744 (24,744) –
H Paster 28.10.04 ADRs 7,423 7,423 24,744 24,74415.12.05 ADRs 9,141 9,141 30,470 30,470
M Read 15.12.05 Ords 15,255 15,255 50,850 50,850
P W G Richardson 28.10.04 Ords 37,168 37,168 123,892 123,89215.12.05 Ords 122,037 122,037 406,790 406,790
Sir Martin Sorrell 28.10.04 Ords 1,238,899 1,238,899 4,129,664 4,129,66415.12.05 Ords 305,091 305,091 1,016,970 1,016,970
Notes1 One ADR is the equivalent of five Ordinary Shares.2 All awards shown in the above table, are dependent on WPP’s TSR performance against a comparator group over the relevant performance period and maintenance of a participant’s holding of InvestmentShares and continued employment throughout the Investment Period. The comparator group for the award made in 2004 comprises of Aegis, Arbitron, Dentsu, Digitas, Gfk, Grey Advertising, Havas Advertising,Interpublic, Ipsos, Omnicom Group, Publicis, Taylor Nelson Sofres and VNU. The comparator group for the award made in 2005 remained the same with the exception of the removal of Digitas and GreyAdvertising. Where a company delists during the performance period, the committee deem this to be a disposal and the proceeds are treated as being reinvested in the stock of the remaining companies.¶
3 The award to Beth Axelrod lapsed on her resignation on 24 March 2005.

How we’re rewarded
Annual Report 2005How we’re rewarded130
Compensation of executive officers
The information contained in the following three tables setsout the compensation details for the Group chief executiveand each of the other four most highly compensatedexecutive officers in the Group as at 31 December 2005(the ‘executive officers’). The information is in addition tothe disclosure required under UK legislation and regulations.As used in this section, the ‘executive officers’ are deemedto include executive directors of the Company, or anexecutive who served as the chief executive officer of one of the Group’s major operating companies.
Summary compensation table1
Annual compensation Long-term compensation
Awards Payouts
Other annual Share All othercompen- option SARs LTIP compen-
Salary Bonus2 sation3 and phantom4 Payments5 sation6
Year $000 $000 $000 ADR no. $000 $000
Sir Martin Sorrell9 – Group chief executive 2005 1,562 2,827 45 – 5,69910 625
2004 1,539 2,309 46 – 30,640 603
2003 1,374 – 40 – – 1,733
S Lazarus – Chairman/Chief executive officer Ogilvy & Mather Worldwide 2005 850 9518 55 – 675 648
2004 850 7577 37 65,501 9,599 648
2003 850 9067 36 63,805 502 648
A Fudge – Chairman/Chief executive officer Young & Rubicam 2005 800 596 28 – – 9
2004 800 – 27 15,748 – 5
2003 800 – 25 16,874 – 3
P W G Richardson – Group finance director 2005 841 509 165 – 123 164
2004 800 454 177 – 2,952 165
2003 731 164 159 – 251 120
I Gotlieb – Chairman/Chief executive officer GroupM 2005 750 684 16 – 2,789 38
2004 750 613 16 14,763 971 38
2003 750 536 16 15,819 506 38
Notes1 Amounts paid in sterling have been converted into US dollars using the following annual average exchange rates; 2005: $1.8189/£; 2004: $1.8326/£; and 2003: $1.6356/£. This can give rise to smallfluctuations year on year.
2 Represents short-term incentive awards paid during calendar years 2005, 2004 and 2003 in respect of the prior year’s incentive plans.3 Includes the value of company cars, club memberships, executive health and other benefits, supplemental executive life insurance.4 As used in this report, the term ‘phantom ADRs/shares’ (as used in the UK) and the term ‘free-standing SARs’ (as used in the US) are interchangeable. 5 Includes value of payments made under the PSP and LTIP in stock and cash. For the year 2004, these figures also include the value of matching shares vesting under Original LEAP. In the case of Sir MartinSorrell $30,640k; Shelly Lazarus $9,026k; and Paul Richardson $2,730k.
6 Includes accruals during each calendar year under consideration, under defined contribution retirement and defined benefit retirement arrangements.7 Includes a guaranteed bonus of $150k.8 Includes a guaranteed bonus of $250k.9 This includes the value of 178,036 shares which represented Sir Martin Sorrell’s bonus for 2002 and which he received in the form of restricted stock, in respect of which the restricted period ended on 27 May 2005.
10 This includes the value received from revised awards paid in respect of dividends accrued on Sir Martin Sorrell’s PSP awards deferred in 2002, 2003 and 2004.
US-style proxy disclosures – information not subject to audit
This information covers compensation for servicesrendered in all capacities and paid in the financial yearended 31 December 2005 and in the previous two financialyears in a format similar to a US-style proxy. Incentivecompensation paid in 2006 for performance in 2005 andprevious years is not included in these tables. The bonuspayments referred to below are payments made in 2005,2004 and 2003 under the short-term incentive awards forperformance in 2004, 2003 and 2002 respectively.

How we’re rewarded
Annual Report 2005How we’re rewarded 131
Stock option, SAR and phantom stock exercises in last financial year and final year-end share option, SAR and phantom stock values
OrdinaryOrdinary Share Ordinary Share Value of Value of
Equivalents Market Share Equivalent Vested Unvestedacquired Value at Equivalent Unvested Shares Shares
upon exercise exercise dateVested Shares Shares 12/30/05 12/30/051
($) ($) ($)
Sir Martin Sorrell 2,148,581 22,073,123 987,7422 2,649,2083 8,640,948 23,175,756
S Lazarus – – 91,440 1,493,025 137,617 3,668,671
A Fudge – – 0 243,065 0 425,125
P W G Richardson – – – – – –
I Gotlieb – – 484,130 378,810 728,616 1,091,233
1 The value is calculated by subtracting the exercise price from the fair market value of the Company’s ordinary shares on 30 December 2005, namely 629p, or the value of WPP’s ADRs, namely $54, and usingan exchange rate of $1.7187/£1.
2 Comprising an option over 987,742 ordinary shares following partial deferral of the award under the Capital Investment Plan on 1 September 2004.3 Deferred stock arising out of the deferral of the award under the Capital Investment Plan on 1 September 2004.
Long-term incentive plan grants in relation to 2005
Estimated future payouts
Performance Threshold Target MaximumPlan period Units Units2 Units
Sir Martin Sorrell Renewed LEAP1 2005 – 2009 – 61,019 203,395
S Lazarus Renewed LEAP 2005 – 2009 – 24,375 81,250
A Fudge Renewed LEAP 2005 – 2009 – 18,281 60,935
P W G Richardson Renewed LEAP1 2005 – 2009 – 24,408 81,360
I Gotlieb Renewed LEAP 2005 – 2009 – 9,141 30,470
1 Actual awards were made over ordinary shares but are shown here as ADRs for ease of comparison.2 Target units calculated on the basis of 1.5 matching shares for each investment share committed to Renewed LEAP and maximum units of 5 matching shares for each investment share.
ADR/share price at year end and during the year
30 December 12 month 12 month2005* high low
ADR $54.000 $60.050 $47.340
Ordinary 629p 630.5p 534.5p
*December 31st was a Saturday.
Stanley (Bud) MortenChairman of the Compensation committee
on behalf of the Board of Directors of WPP Group plc11 May 2006

Operating & financial review
Annual Report 2005Operating and financial review132

ur Media investment management businessescontinue to show strong growth, along withdirect, internet and interactive and Healthcarecommunications. Direct, internet andinteractive-related activities now account forover 15% of the Group’s revenues, which
are running at the rate of over $10 billion per annum.Brand advertising, particularly in the new faster-growingmarkets, along with Information, insight & consultancyand Branding & identity, Healthcare and Specialistcommunications, show consistent growth. Public relations& public affairs also continues to show significantimprovement over last year, following a strong year in2004. Media investment management and Information,insight & consultancy combined, grew by almost 10% in the year.
The Group completed the acquisition of GreyGlobal Group, Inc (‘Grey’) on 7 March 2005. Grey hasbeen consolidated into the results of the Group from that date.
Estimated net new billings of £2.8 billion ($5.2billion) were won last year, reflecting in part strong mediainvestment management new business.
In these circumstances there is no reason to believethat the Group cannot achieve margin targets of 14.5% in 2006 and 15.0% in 2007. Budgets for 2006 include thisoperating margin target. Neither is there any reason whyoperating margins could not be improved beyond this level by continued focus on revenue growth and carefulhusbandry of costs. Our ultimate objective continues to be to achieve a 19% margin over a period of time and to improve the return on capital employed.
Notes1 The figures above for Omnicom and IPG (The Interpublic Group) have been derived from theirrespective 10-K filings with the SEC. As both these companies report under US GAAP, the abovefigures should be read as indicative of their financial performance as they are not directly comparablewith WPP’s IFRS reporting. Additionally, adjustments have been made to conform the reportedresults of these companies to a presentation that is comparable – as far as the information disclosedin the Company’s 10-K filings allows – to that of WPP.
2 Revenue per head has been calculated as reported revenue divided by the average number ofemployees in the relevant year. For Omnicom and IPG, who do not report average headcount in their10-K filings, it has been estimated as the average of opening and closing headcount for the year.Additionally, revenue for these US dollar-reporting companies has been converted into sterling usingthe average exchange rates shown on page150.
3 The calculation of Headline PBIT is set out in note 32 of the financial statements.
Headline PBIT3 margins%
05WPP04
14.013.0
05Advertising and Mediainvestment management 04
15.514.9
05Omnicom1
0413.312.9
05IPG1
040.23.6
Revenue per head2
£00005WPP04
75.874.4
05Advertising and Mediainvestment management 04
68.467.5
05Omnicom1
0493.789.0
05IPG1
0479.680.0
Competitive performance
Annual Report 2005Operating and financial review 133
Operating & financial review

Operating & financial review
On a constant currency basis, all regionsshowed double-digit revenue growth, with theGroup at almost 23%. Like-for-like growthwas 5.5%.
The US continues to grow, with like-for-like growth of almost 6%, up slightly on
the first half. Latin America remains the fastest-growingregion, as it was in 2004.
Asia Pacific remains strong across the region, withChina and India leading the way, with like-for-like growthrates of 23% and almost 15% respectively, an accelerationof the growth seen in the first half.
Western Continental Europe, although relativelymore difficult, improved slightly in the second half. The UKwas softer in the latter part of the year, reflecting weaknessin the economy. As seen in the first half, rates of growth in Europe continue to be two-paced, with WesternContinental Europe remaining softer and Central andEastern Europe, Russia and the CIS countries, in particular,more buoyant.
Geographic performance
† See definition on page 184.
Notes1 The calculation of Headline PBIT is set out in note 32 of the financial statements.
Revenue by geography£m
6,000
5,000
4,000
3,000
2,000
1,000
0
UK
North America
Continental Europe
Asia Pacific, Latin America,Africa & Middle East
0504030201
Headline PBIT1 margins by geography%
05North America04
16.615.2
05UK04
10.510.4
05Continental Europe04
12.511.3
05Asia Pacific, Latin America,Africa & Middle East 04
13.713.4
Constant currency† revenue growth%
05North America04
25.99.7
05UK04
10.99.6
05Continental Europe04
23.07.6
05Asia Pacific, Latin America,Africa & Middle East 04
27.423.7
Annual Report 2005Operating and financial review134

Operating & financial review
Advertising and Media investment management
In constant currencies, Advertising and Media investmentmanagement revenue grew by almost 29%. Like-for-likerevenue growth was well over 4%. The combined operatingmargin of this sector was over 15%.
In 2005, Ogilvy & Mather Worldwide generatedestimated net new billings of £87 million ($161 million),JWT £117 million ($216 million), Y&R Advertising £152million ($280 million) and Grey Worldwide £398 million($735 million).
Also in 2005, MindShare, Mediaedge:cia andMediaCom generated estimated net new billings of £1.6billion ($2.9 billion).
Information, insight & consultancy
On a constant currency basis, Information, insight andconsultancy revenues grew over 7%, with like-for-likerevenues up over 6%. Overall margins improved by 1.1margin points to over 10%.
Strong performances were recorded by MillwardBrown (Greenfield Consulting Group, MaPs and DynamicLogic in the US, France, Germany, Spain, Poland, Centrumin the Netherlands, Hong Kong, Taiwan, Singapore, Fireflyin Thailand, the Philippines, Mexico, Brazil and Colombia);BMRB International in the UK, KMR Group, ResearchInternational (in the US, France, the Netherlands, Spain,SIFO in Sweden and Norway, South Africa, Brazil, HongKong, Indonesia and Australia); Center Partners andZiment in the US, IMRB in India, Lightspeed Research in the US and Asia, Da Vinci in the US, Added Value/icon in the UK, Italy, Spain, Japan and India.
Public relations & public affairs
Public relations and public affairs continued its recoverywith constant currency growth of almost 19% and like-for-like growth of well over 7%. Particularly strong wereCohn & Wolfe, Ogilvy Public Relations Worldwide,Hill & Knowlton, Penn, Schoen & Berland in the US andBuchanan Communications in the UK.
Operating margins continued to improve and arenow at 14%, an improvement of over 0.8 margin pointson a constant currency basis.
† See definition on page 184.
Notes1 The calculation of Headline PBIT is set out in note 32 of the financial statements.
05 04 03 02 01
Revenue by sector £m
Information, insight & consultancy
Advertising and Media investment management
Public relations & public affairs
Branding & identity, Healthcare and Specialist communications
6,000
5,000
4,000
3,000
2,000
1,000
0
Headline PBIT1 margins by sector%
05Advertising and Mediainvestment management 04
15.514.9
05Information, insight& consultancy 04
10.38.9
05Public relations &public affairs 04
14.113.1
05Branding & identity, Healthcareand Specialist communications 04
13.612.5
Constant currency† revenue growth%
05Advertising and Mediainvestment management 04
28.610.8
05Information, insight& consultancy 04
7.311.5
05Public relations &public affairs 04
18.76.5
05Branding & identity, Healthcareand Specialist communications 04
24.714.6
Sector performance
Annual Report 2005Operating and financial review 135

Operating & financial review
Branding & identity, Healthcare and Specialist communications
The Group’s Branding & identity, Healthcare and Specialistcommunications revenues rose by almost 25%. Like-for-like revenues rose by over 6%. Operating margins were up 1.2 margin points. The Group’s healthcare and direct,internet and interactive businesses showed particularlystrong revenue growth.
Several companies performed particularly well:
• In Branding & identity – Landor Associates in Cincinnatiin the US, the UK, Germany, Dubai, Mexico, Japan, HongKong and Australia; Enterprise IG in the UK, Germany,France and Dubai; Fitch in Phoenix and Seattle in the US,the UK, Peclers in France and Qatar.
• In Healthcare communications – Sudler & Hennessey inthe US including HealthAnswers Education, Market ForceCommunications and Toronto in Canada, the UK,Germany and Australia; in Grey Healthcare Group in theUS, the UK, France and Germany; in Ogilvy Healthworldin Medical Education in the US and Germany.
• In promotion and direct marketing – OgilvyOne (in NewYork, Minneapolis, San Francisco and Eicoff in the US, andalso in Canada, the UK, Italy and Brazil); 141 Worldwide(in Chicago and Boomerang in the US, the UK, Brazil,Mexico, China and Korea); Wunderman (in RTC, Chicagoand San Francisco in the US, the UK, the AutomotiveGroup in the UK, France, Germany, Italy, Greece,Argentina, Mexico, China, Thailand, Singapore andAustralia).
• In specialist marketing resources – VML and Pace in theUS and EWA, Metro, BDGworkfutures and PSM in the UK.
Manufacturing
Revenues and profits at the Group’s manufacturing divisionwere down in 2005.
Annual Report 2005Operating and financial review136

Operating & financial review
he Group’s financial performance in the yearmore than mirrored the continuing steadystrength in economic conditions across the globe, with even the weakest region,Western Continental Europe, picking up in the second half.
2005, the softest year of the quadrennial 2005-2008 cycle, was surprisingly strong. With no specialpolitical or sporting events to speak of, 2005 reflected the steady growth seen throughout the world, with threegeographical speeds – fastest in Asia Pacific, Latin America,Africa, the Middle East and Eastern Europe; a steadyspeed in the US; and slower speed in Western Europe.
2005 also marked continued client focus on top-line growth, as corporate profitability, margins andliquidity continued to improve significantly. Corporateprofitability remains at historically high levels on bothsides of the Atlantic. This resulted in unprecedented levelsof new business activity, which have continued into 2006.
Network television price inflation and decliningaudiences, fragmentation of traditional media and rapiddevelopment of new technologies continued to driveexperimentation by our clients in new media and non-traditional alternatives. 1998 was really the first yearwhen WPP’s marketing services activities represented over 50% of Group revenue. In 2004 these activitiesrepresented almost 54% of Group revenue. In 2005 theyrepresented 52%, as media investment management wasagain the fastest-growing part of our business, followingmajor success in winning media planning and buyingconsolidations, and the first-time inclusion of GreyWorldwide and MediaCom. In addition, in 2005, ournarrowly defined internet-related revenue was almost$500 million or over 5% of our worldwide reportedrevenue. This is in line with 4-5% for online media’s shareof total advertising spend in the US and approximately4% share worldwide. The new media continue to buildtheir share of client spending.
Review of operations
Adoption of IFRS
The Group’s 2005 consolidated financial statements havebeen prepared under IFRS (International FinancialReporting Standards, incorporating InternationalAccounting Standards), which were adopted with effectfrom 1 January 2004, with the exception of IAS 39‘Financial Instruments: Recognition and Measurement’ andIAS 32 ‘Financial Instruments: Disclosure and Presentation’.As a result of continued amendments to IAS 39 the Groupdecided not to implement this standard for statutoryreporting from 1 January 2004. As a result the Group hastaken advantage of the option in IFRS 1 ‘First-timeadoption of International Financial Reporting Standards’ to implement IAS 39, together with IAS 32, from 1 January2005 without restating its 2004 income statement andbalance sheet.
Reconciliation to 2004 UK GAAP
Note 32 of the financial statements reconciles IFRS to 2004UK GAAP in respect of the results for 2005. 2004 UKGAAP means UK Generally Accepted Accounting Principlesextant in respect of 2004 – the basis of preparation of theGroup’s consolidated financial statements for the yearended 31 December 2004, as previously reported, prior to the implementation of IFRS.
The principal reasons for the differences in headlinePBIT and operating margin are twofold. First, additionalcharges for share-based payments, of £32.4 million, largelyreflecting the cost of options on a fully-retrospective basis,with an impact on operating margins of 0.6 margin points.Secondly, accounting for associates, which reflects thededuction of tax from income from associates, previouslyincluded in taxation, amounting to £20.1 million andimpacting operating margins by 0.4 margin points.
Annual Report 2005Operating and financial review 137

Operating & financial review
Group financial performance
Turnover (billings) was up over 36% at £26.674 billion.Reportable revenue was up 25% to £5.374 billion.Revenue including associates (on a 100% basis) isestimated to total over £6.5 billion.
Headline PBIT or profit pre-goodwill impairment,amortisation of acquired intangibles, interest, tax andinvestment gains and write-downs was up almost 35% to£754.8 million from £560.2 million and up over 31% inconstant currencies. Reported profit before interest and taxwas up 36% to £686.7 million from £505.0 million and upover 32% in constant currencies. Headline profit before taxor profit pre-goodwill impairment, amortisation of acquiredintangibles, investment gains and write-downs, revaluationof financial instruments and tax was up over 36% to£669.0 million from £489.6 million and up over 32% inconstant currencies.
Net interest payable and similar charges was £94.7million up from £70.6 million last year, an increase of£24.1 million, largely reflecting additional charges underIFRS of £22.7m, relating to the treatment of convertiblebonds and revaluation of financial instruments (2004-nil).The remaining increase of £1.4 million reflects higherinterest rates, offset by the impact of improved liquidity as a result of a reduction in working capital.
Reported profit before tax rose by 36.3% to £592.0million, well over $1 billion, for the first time and upalmost 32% in constant currencies. Diluted earnings pershare rose by almost 27% to 29.7p and up over 22% inconstant currencies.
The Group’s tax rate on headline profits was 29%,an increase of 1.4 percentage points over 2004, reflectingthe continuing positive impact of the Group’s tax planninginitiatives, more than offset by the impact of Grey, whichhad a tax rate on acquisition in excess of 45%.
Diluted headline earnings per share were up 29% at 36.0p. In constant currency, earnings per share on thesame basis were up over 25%.
The Board recommends an increase of 20% in thefinal dividend to 6.34p per share, making a total of 9.34pper share for 2005, a 20% increase over 2004. The recorddate for this dividend is 2 June 2006, payable on 3 July2006. The dividend for 2005 is over four times covered byheadline earnings.
Operating margins
Headline operating margin (including income fromassociates) increased a full margin point to a record 14.0%from 13.0%, ahead of the revised target set in August 2005of 13.7%. Our target at the beginning of 2005 was 13.2%.The margin achieved in 2005 is equivalent to an operatingmargin of 15.0% under 2004 UK GAAP, which surpassesthe previous record operating margin of 14.5% in 2000.
Reported operating costs including direct costs (butexcluding goodwill impairment, amortisation of acquiredintangibles and investment gains and write-downs), rose byover 23% and by over 21% in constant currency. Like-for-like total operating and direct costs rose over 4%. Reportedstaff costs, excluding incentives (which includes the cost ofshare-based compensation), were up over 26%. Incentivepayments (including the cost of share-based compensation)totalled £227.6 million (£189.5 million in 2004), anincrease of over 20%, which represents 24.0% (26.3% in2004) of operating profit before bonuses, taxes and incomefrom associates. Before these incentive payments, operatingmargins increased by 0.9 margin points to 18.3% from17.4%. On a reported basis, the Group’s staff cost to grossmargin ratio was flat with last year at 62.1%.
Part of the Group’s strategy is to continue toincrease variable staff costs as a proportion of total staffcosts and revenue, as this provides flexibility to deal withvolatility in revenues. In the 1990s, variable staff costs as a proportion of total staff costs increased, reaching a peakof 12.1% in 2000. The impact of the recession in 2001 and2002 was to reduce this ratio to 9.2% and variable staffcosts as a proportion of revenue to 5.3% (calculated under2004 UK GAAP). In 2004, following the significantimprovement in pre-bonus operating profit and incentives,variable staff costs as a proportion of staff costs increasedfurther. There was a slight deterioration in 2005, with theratio declining by 0.4 percentage points, to 12.8% (underIFRS – which includes 1.0 percentage points attributable to share-based compensation).
The task of improving property utilisation continuesto be a priority with a portfolio of approximately 18 millionsquare feet worldwide. In December 2002, establishmentcost as a percentage of revenue was 8.4%, with a goal ofreducing this ratio to 7.0% in the medium term. At the endof 2004 the establishment cost to revenue ratio reduced to7.6% and by December 2005 this ratio improved further to 7.2%, driven by better utilisation and higher revenues.There should be further opportunities to improve utilisationin the future, as the 3.2 million square feet of property withinGrey is integrated into the portfolio.
Annual Report 2005Operating and financial review138

Operating & financial review
Like-for-like performance
On a constant currency basis, revenue was up almost 23%and gross profit up almost 24%. Like-for-like revenues,excluding the impact of acquisitions and on a constantcurrency basis, were up 5.5%. Like-for-like revenues wereup 6% in the first half of 2005 and up 5% in the secondhalf, continuing the strong organic growth of almost 6% in the second half of 2004.
Headcount
The number of people in the Group averaged 70,936against 57,788 in 2004, an increase of 22.8%. On a like-for-like basis, average headcount was up to 70,936 from67,439, an increase of 5.2%. At the end of 2005, staffnumbers were 74,631 compared with 71,624 at the end of 2004 on a like-for-like basis, an increase of 4.2%.Including all employees of associated undertakings, staffnumbers were approximately 92,000 at 31 December 2005.
Acquisitions and start-ups
In 2005, in addition to the completion of the acquisition ofGrey, the Group continued to make small to medium-sizedacquisitions or investments in high-growth geographical orfunctional areas. The net initial cost of all acquisitions was£378 million in cash, in Advertising and Media investmentmanagement in the US, the UK, Denmark, the Netherlands,Spain, Russia, Israel, Argentina, Hong Kong and Australia;in Information, insight & consultancy in the US, the UK,Poland, China, Hong Kong, Korea and New Zealand; in Public relations & public affairs in the US, Denmark,Bahrain, Argentina, China and Australia; in Healthcarecommunications in the US, the Netherlands andSwitzerland and in direct, internet & interactive in the US.
Parent company initiatives
Increasingly, WPP is concentrating on its mission of the“management of the imagination”, and ensuring it is a bigcompany with the heart and mind of a small one. To aid the achievement of this objective and to develop the benefitsof membership in the Group for both clients and our people,the parent company continues to develop its activities in theareas of human resources, property, procurement, informationtechnology and practice development. Ten practice areaswhich span all our brands have been developed initially inmedia investment management, healthcare, privatisation,new technologies, new faster-growing markets, internalcommunications, retail, entertainment and media, financialservices and hi-tech and telecommunications.
Treasury activities
Treasury activity is managed centrally, from the parentcompany’s London, New York and Hong Kong offices, and is principally concerned with the monitoring ofworking capital, managing external and internal fundingrequirements and the monitoring and management offinancial market risks, in particular interest rate and foreignexchange exposures.
The treasury operation is not a profit centre and its activities are carried out in accordance with policiesapproved by the Board of directors and subject to regularreview and audit.
The Group’s interest rate management policyrecognises that fixing rates on all its debt eliminates thepossibility of benefiting from rate reductions and similarly,having all its debt at floating rates unduly exposes theGroup to increases in rates.
Its principal borrowing currencies are US dollars,pounds sterling and euros. Borrowings in these currenciesrepresented 76% of the Group’s gross indebtedness at31 December 2005 (at $1,089 million, £168 million andN948 million) and 80% of the Group’s average gross debtduring the course of 2005 (at $1,759 million, £190 millionand N966 million). Including the effect of interest rate andcross currency swaps, 93% of the year-end US dollar netdebt is at fixed rates averaging 5.08% for an average periodof 97 months; 62% of the GBP net debt is at a fixed rate of-2.23% (including the effect of the redemption premium onthe £450 million 2% convertible bonds) for an averageperiod of 16 months; and 16% of the euro net debt is at fixedrates averaging 8.27% for an average period of 32 months.
Other than fixed rate debt, the Group’s other fixedrates are achieved principally through interest rate swapswith the Group’s bankers. The Group also uses forwardrate agreements and interest rate caps to manage exposureto interest rate changes. At 31 December 2005, no forwardrate agreements or interest rate caps were outstanding.
These interest rate derivatives are used only to hedgeexposures to interest rate movements arising from theGroup’s borrowing and surplus cash balances arising fromits commercial activities and are not traded independently.Payments made under these instruments are accounted foron an accruals basis.
An analysis of the debt and fixed rate maturities isshown in note 11 of the financial statements on pages 156and 157.
The Group manages liquidity risk by ensuringcontinuity and flexibility of funding even in difficult marketconditions. Undrawn committed borrowing facilities aremaintained in excess of peak net borrowing levels and debtmaturities are closely monitored.
Annual Report 2005Operating and financial review 139

Operating & financial review
Targets for average net debt are set on an annualbasis and, to assist in meeting this, working capital targetsare set for all the Group’s major operations.
The Group’s significant international operations giverise to an exposure to changes in foreign exchange rates.The Group seeks to mitigate the effect of these structuralcurrency exposures by borrowing in the same currencies asthe operating (or ‘functional’) currencies of its main operatingunits. The majority of the Group’s debt is thereforedenominated in US dollars and euros, as these are thepredominant currencies of revenues.
The Group’s operations conduct the majority of theiractivities in their own local currency and consequently theGroup has no significant transactional foreign exchangeexposures. Any significant cross-border trading exposuresare hedged by the use of forward foreign exchange contracts.There were no such material contracts in place at31 December 2005. No speculative foreign exchange tradingis undertaken.
Cash flow and balance sheet
Net debt averaged £1,212 million in 2005, up £129 millionagainst £1,083 million in 2004 (up £132 million at 2005exchange rates). With an equity market capitalisation at31 March 2006 of approximately £8.7 billion, and averagenet debt in the first quarter of 2006 of £1.0 billion, this wouldgive a total enterprise value of approximately £9.7 billion.
Cash flow strengthened as a result of improvedworking capital management and cash flow from operations.In 2005, operating profit before goodwill impairment,amortisation of acquired intangible assets and charges fornon-cash-based incentive plans was £794 million, capitalexpenditure £171 million, depreciation £122 million, taxpaid £136 million, interest and similar charges paid £60million and other net cash inflows of £16 million. Free cashflow available for debt repayment, acquisitions, sharebuybacks and dividends was therefore £565 million. This freecash flow was partially absorbed by £508 million in netacquisition payments and investments, share repurchases andcancellations of £152 million and dividends of £100 million.This resulted in a net outflow of £195 million. The objectiveintroduced in 2003 of covering outgoings by free cash flow was achieved, excluding the net cash element of theacquisition of Grey.
Your Board continues to examine ways of deployingits substantial cash flow of almost £600 million or over$1 billion per annum to enhance share owner value. As necessary capital expenditure is expected to remainequal to or less than the depreciation charge in the longterm, the Company has concentrated on examining
potential acquisitions and on returning excess capital toshare owners in the form of dividends or share buybacks.
Last year, 25.4 million ordinary shares (of which21.3 million were cancelled) or 2% of the share capitalwere repurchased at a total cost of £152 million and averageprice of £5.99 per share.
As noted above, your Board has decided to increasethe final dividend by 20% to 6.34p per share, taking the fullyear dividend to 9.34p per share which is over four timescovered, at the headline earnings level. In addition, as thereturn on capital criteria for investing in cash acquisitionshave been raised, particularly in the US, the Company will continue to commit to repurchasing up to 2% of itsshare base in the open market at an approximate cost of£150 million, when market conditions are appropriate.Such annual rolling share repurchases are believed to have a more significant impact in improving share owner valuethan sporadic buy-backs.
At 31 December 2005, net assets of £3,986 millioncompared with £3,066 million in 2004.
Note1 The calculation of free cash flow is set out in note 32 of the financial statements.
2004 cash flow£m
103 Depreciation
476 Operating profit
51 Net interest96 Capital expenditure
101 Tax
23 Other
53 Goodwill/acquired intangibles impairment and amortisation59 Charges for non-cash share based incentive plans
Free cash flow1 £466m
Cash outCash in
2005 cash flow£m
122 Depreciation
653 Operating profit
60 Net interest171 Capital expenditure
136 Tax
16 Other
72 Goodwill/acquired intangibles impairment and amortisation69 Charges for non-cash share-based incentive plans
Free cash flow1 £565m
Cash outCash in
Annual Report 2005Operating and financial review140

Operating & financial review
New corporate structure
Following approval by share owners at an ExtraordinaryGeneral Meeting on 26 September 2005, and after obtainingCourt approval, the Group’s corporate structure was changedin October 2005. This primarily involved the introductionof a new parent undertaking in the UK. This reorganisationresulted in the creation of more than £5 billion of additionaldistributable reserves, which the Board considers necessaryto cater for likely requirements for dividends and sharerepurchases in the medium to long term.
Pensions funding
The Group’s pension deficit was £231.4 million as at31 December 2005, compared to £202.3 million as at31 December 2004. The pension deficit increase is due to increases in North America and Continental Europe.These increases are principally due to newly acquiredunfunded plans (through the acquisition of Grey) and thereclassification of various existing unfunded arrangementsfrom defined contribution to defined benefit provisionfollowing a reassessment of the terms of these arrangementsin 2005. Also, in the UK, the discount rate decreased from5.3% to 4.7% due to the lower yields available on high-quality UK corporate debt.
Most of the Group’s pension scheme assets are held by its schemes in the UK and North America. In theUK, the forecasted weighted average return on assetsdecreased from 5.7% as at 31 December 2004 to 5.2% as at 31 December 2005, and in North America, theforecasted weighted average return decreased from 6.9% to 6.7%, principally due to decreases in expected rates of return on corporate bonds.
Contributions to funded schemes are determined in line with local conditions and practices. Certaincontributions in respect of unfunded schemes are paid asthey fall due. Our advisors indicate that further averagecash contributions of approximately £11-12 million perannum would be necessary to fully fund all funded pensionschemes over the remaining expected funding period.
Future prospects
Including associates, the Group had over 92,000 full-timepeople in over 2,000 offices in 106 countries at the year end.It services over 300 of the Fortune Global 500 companies,over one-half of NASDAQ 100, over 30 of the Fortunee-50, and over 390 national or multinational clients in threeor more disciplines. More than 270 clients are served infour disciplines and these clients account for around 60%of Group revenues. The Group also works with nearly220 clients in six or more countries.
These statistics reflect the increasing opportunitiesfor developing client relationships between activitiesnationally, internationally and by function. The Groupestimates that well over 35% of new assignments in theyear were generated through the joint development ofopportunities by two or more Group companies. Newintegration mechanisms, sensitive to global and localopportunities, including WPP Global Client Leaders andCountry Managers, continue to be developed. There is anincreasing number of major client creative and integrationopportunities at a Group level.
The world economy continued to grow in 2005,after the recovery in 2003 and 2004, driven by the US, Asia Pacific, Latin America, the Middle East, Russia and the CIS countries. As a result, your Company hasperformed at record levels. While like-for-like revenueshave grown beyond market expectations, like-for-likeaverage headcount has grown less.
Following this productivity improvement, theGroup’s margins at both the pre- and post-incentive levelshave improved significantly. In addition, given improvedlevels of operating profit and margin, incentive pools andvariable staff costs are now at record levels. This will improveoperational gearing and flexibility in 2006 and beyond.
As usual, the budgets for 2006 have been preparedon a prudent basis, largely excluding new business,particularly in advertising and media investmentmanagement. They predict improvements in like-for-likerevenues in the range of 4%, with balanced growth in the first and second half of the year. They also indicatemarketing services revenues growing faster than advertisingand media investment management.
In the first quarter of 2006 reported revenues roseby over 23%. Constant currency revenues were up 18%.Currency fluctuations accounted for just over 5% of theGroup’s revenue growth in the first quarter, principally due to the strength of the US dollar against sterling. On a like-for-like basis, excluding acquisitions and currencyfluctuations, revenues were up almost 5%.
Annual Report 2005Operating and financial review 141

Operating & financial review
Net new business billings of £1.3 billion ($2.3 billion)were won during the first quarter of 2006. This marks thehighest net new business won by the Group for a first quarter.
Net debt at 31 March 2006 was £1,216 million,compared with £1,261 million at 31 March 2005 (at constantexchange rates). Average net debt in the first quarter of 2006was £1,043 million compared to £828 million in 2005, at2006 exchange rates. In the 12 months to 31 March 2006,the Group’s free cash flow was £745 million. Over the sameperiod, the Group’s capital expenditure, acquisitions, sharerepurchases and dividends were £783 million.
Worldwide economic conditions seem set to continueto show steady growth in 2006, although concerns remainover the Middle East, oil and commodity prices and the twindeficits of the US economy. This year’s prospects, therefore,look okay, with worldwide advertising and marketing servicesspending set to rise by at least 4% with your companyexpected to grow 4-5% and therefore increasing share.Although growth in the world economy continues to be ledby Asia Pacific, Latin America, Africa and the Middle East,Russia and the CIS countries, even Western ContinentalEurope may continue the improvement seen in the secondhalf of 2005, although the UK looks soft.
2006 should benefit from the mini-quadrennial impactof the mid-term US Congressional elections, the FIFA WorldCup and the Turin Winter Olympics.
2007 should also benefit from the build-up to the US Presidential Elections and the Beijing Olympics in 2008,which, as a maxi-quadrennial year, should be a very strongone, buoyed by those events plus heavy US politicaladvertising and the European Football Championships.
In the short term, growth in advertising and marketingservices expenditure may remain low to medium single-digitterritory, given the low inflationary environment,concentrating distribution and consequent lack of pricingpower. In this climate, procurement pressure continues (but not in new media) and the significant proportion of feeremuneration dampens revenue growth on cyclical upturns(and moderates on downturns). However, there continueto be significant opportunities in the area of outsourcingclients’ marketing activities, consolidating client budgetsand capitalising on competitive weaknesses. In addition,spending amongst the packaged goods, pharmaceutical, oil and energy, government (the government continues to be one of the largest advertisers in the UK market) andprice-value retail sectors, which remained relatively resilientin the recession of 2001 and 2002, have been buttressed by increased activity in previously recession-affected sectorslike technology, financial services, media and entertainmentand telecommunications.
In the long term, the outlook appears very favourable.Overcapacity of production in most sectors and the shortageof human capital, the developments in new technologies andmedia, the growth in importance of internal communications,the continued strength of the US economy and the need toinfluence distribution, underpin the need for our clients tocontinue to differentiate their products and services bothtangibly and intangibly. Moreover, the growth of the BRICs(Brazil, Russia, India and China) economies, will addsignificant opportunities in Asia Pacific, Latin America,Africa and the Middle East and Central and Eastern Europe.Advertising and marketing services expenditure as aproportion of gross national products should resume itsgrowth and bust through the cyclical high established in 2000.
Given these short-term and long-term trends, yourCompany has three strategic priorities. In the short term,having weathered the recession, to capitalise on the 2004and 2005 up-turn; in the medium term, to continue tosuccessfully integrate acquired companies; and finally, inthe long term, to continue to develop its businesses in the faster-growing geographical areas of Asia Pacific, Latin America, Africa and the Middle East, and Centraland Eastern Europe, and in the faster-growing functionalareas of marketing services, particularly direct, internet,interactive and market research.
Incentive plans for 2006 will again focus more onoperating profit growth than historically, in order to stimulatetop-line growth, although objectives will continue to includeoperating margin improvement, improvement in staff coststo revenue ratios and qualitative Group objectives, includingco-ordination, talent management and succession planning.
Paul RichardsonGroup finance director
Annual Report 2005Operating and financial review142

Operating & financial review
In connection with the provisions of the Private Securities Litigation ReformAct of 1995 (the ‘Reform Act’), the Company may include forward-lookingstatements (as defined in the Reform Act) in oral or written public statementsissued by or on behalf of the Company. These forward-looking statementsmay include, among other things, plans, objectives, projections andanticipated future economic performance based on assumptions and the like that are subject to risks and uncertainties. As such, actual results oroutcomes may differ materially from those discussed in the forward-lookingstatements. Important factors which may cause actual results to differ includebut are not limited to: the unanticipated loss of a material client or keypersonnel, delays or reductions in client advertising budgets, shifts in industryrates of compensation, government compliance costs or litigation, naturaldisasters or acts of terrorism, the Company’s exposure to changes in thevalues of other major currencies (because a substantial portion of itsrevenues are derived and costs incurred outside of the UK) and the overalllevel of economic activity in the Company’s major markets (which variesdepending on, among other things, regional, national and internationalpolitical and economic conditions and government regulations in the world’sadvertising markets). In light of these and other uncertainties, the forward-looking statements included in this document should not be regarded as a representation by the Company that the Company’s plans and objectiveswill be achieved.
Annual Report 2005Operating and financial review 143

Our 2005 financial statements
Our 2005 financial statements
Annual Report 2005Our 2005 financial statements144

Accounting policies
he consolidated financial statements of WPPGroup plc (the Group) for the year ended 31 December 2005 have been prepared inaccordance with International FinancialReporting Standards, incorporating InternationalAccounting Standards (IFRS) as issued by the
International Accounting Standards Board. The consolidatedfinancial statements have also been prepared in accordancewith IFRSs adopted for use in the European Union (EU) andtherefore comply with Article 4 of the EU IAS Regulation.
The disclosures required by IFRS 1 (First-timeAdoption of International Financial Reporting) concerningthe transition from applicable accounting standards in theUnited Kingdom (UK GAAP) to IFRS are shown on pages172 to 176.
A summary of the Group’s principal accountingpolicies, which have been applied consistently throughoutthe year is set out below.
IFRS 1 exemptions
IFRS 1 allows a number of exemptions from the fullrequirements of IFRS for those companies adopting IFRSfor the first time. The Group has taken advantage of certainof these exemptions as follows:
Financial instruments
The Group has taken advantage of the exemption availableunder IFRS 1 not to apply IAS 39 (Financial Instruments:Recognition and Measurement) and IAS 32 (FinancialInstruments: Disclosure and Presentation) in respect of theyear ended 31 December 2004. UK GAAP has continued to be applied in accounting for financial instruments in this period. The Group has adopted IAS 39 and IAS 32with effect from 1 January 2005 and consequently restatedthe balance sheet at that date in accordance with therequirements of these standards, which generally means a recognition of financial instruments at fair value.
Business combinations
The Group has elected not to apply IFRS 3 (Businesscombinations) retrospectively to business combinationsthat completed prior to 1 January 2004. However, theGroup took the option to apply IAS 21 (the effects ofchanges in foreign exchange rates) retrospectively to fairvalue adjustments and goodwill arising in all businesscombinations that occurred before the date of transitionto IFRS.
Share-based payments
IFRS 2 (Share-based payments) applies to all share-basedpayments granted since 7 November 2002, but the Grouphas elected for full retrospective restatement as this betterrepresents the ongoing charge to the income statement.
Basis of accounting and presentation of financial statements
The financial statements are prepared under the historicalcost convention, except for the revaluation of certainfinancial instruments.
Basis of consolidation
In October 2005, pursuant to a Scheme of Arrangementunder s425 of the Companies Act 1985, a new parentcompany was introduced which is now called WPP Groupplc (Newco). The previous parent company has beenrenamed and re-registered as WPP 2005 Limited (Oldco).
The introduction of a new holding companyconstitutes a Group reconstruction and has been accountedfor using merger accounting principles. Therefore, althoughthe Group reconstruction did not become effective untilOctober 2005, the consolidated financial statements ofWPP Group plc are presented as if Newco and Oldco hadalways been part of the same Group. Accordingly, theresults of the Group for the entire year ended 31 December2005 are shown in the consolidated income statement andthe comparative figures for the year ended 31 December2004 are also prepared on this basis. Earnings per share are unaffected by the reorganisation.
The consolidated financial statements include theresults of Newco and all its subsidiary undertakings madeup to the same accounting date. The results of subsidiaryundertakings acquired or disposed of during the period areincluded or excluded from the income statement from theeffective date of acquisition or disposal.
Goodwill and other intangible assets
Intangible assets comprise goodwill, certain acquired separablecorporate brand names, customer relationships and capitalisedcomputer software not integral to a related item of hardware.
Goodwill represents the excess of fair valueattributed to investments in businesses or subsidiaryundertakings over the fair value of the underlying netassets at the date of their acquisition. Goodwill arising on acquisitions before the date of transition to IFRS hasbeen retained at the previous UK GAAP amounts subject to being tested for impairment at that date. Goodwill
Our 2005 financial statements
Annual Report 2005Our 2005 financial statements 145

Property, plant and equipment
Property, plant and equipment are shown at cost lessaccumulated depreciation and any provision forimpairment with the exception of freehold land which is notdepreciated. The Group assesses the carrying value of itsproperty, plant and equipment to determine if any impairmenthas occurred. Where this indicates that an asset may beimpaired, the Group applies the requirements of IAS 36 inassessing the carrying amount of the assets. This processincludes comparing its recoverable amount with its carryingvalue. Depreciation is provided at rates calculated to writeoff the cost less estimated residual value of each asset on astraight-line basis over its estimated useful life, as follows:
•Freehold buildings – 50 years
•Leasehold land and buildings – over the term of the leaseor life of the asset, if shorter
•Fixtures, fittings and equipment – 3-10 years
•Computer equipment – 3 years
Interests in associates
The Group’s share of the profits less losses of associateundertakings net of tax, interest and minority interest isincluded in the consolidated income statement and theGroup’s share of net assets is shown within interests inassociates in the consolidated balance sheet. The Group’sshare of the profits less losses and net assets is based oncurrent information produced by the undertakings, adjustedto conform with the accounting policies of the Group.
The Group assesses the carrying value of itsassociate undertakings to determine if any impairment has occurred. Where this indicates that an investment maybe impaired, the Group applies the requirements of IAS 36 in assessing the carrying amount of the investment. This process includes comparing its recoverable amountwith its carrying value.
The Group accounts for joint venture investmentsunder the equity method which is consistent with theGroup’s treatment of associates.
Other investments
Other investments are designated as ‘available for sale’ andare shown at fair value with any movements in fair valuetaken to equity.
Inventories
Work in progress is valued at cost or on a percentage ofcompletion basis where appropriate. Cost includes outlaysincurred on behalf of clients and an appropriate proportionof directly attributable costs and overheads on incompleteassignments. Provision is made for irrecoverable costswhere appropriate. Inventories are stated at the lower ofcost and net realisable value.
written off to reserves under UK GAAP prior to 1998 hasnot been reinstated and is not included in determining anysubsequent profit or loss on disposal.
Goodwill impairment reviews are undertaken bycomparing the carrying value of goodwill to the net presentvalue of future cashflows derived from the underlying assets using a projection period of up to five years for each cash-generating unit. After the projection period asteady or declining growth rate representing an appropriatelong-term growth rate for the industry is applied. Anyimpairment is recognised immediately as an expense and is not subsequently reversed.
Corporate brand names acquired as part ofacquisitions of business are capitalised separately fromgoodwill as intangible assets if their value can be measuredreliably on initial recognition and it is probable that theexpected future economic benefits that are attributable tothe asset will flow to the Group.
Certain corporate brands of the Group areconsidered to have an indefinite economic life becauseof the institutional nature of the corporate brand names,their proven ability to maintain market leadership andprofitable operations over long periods of time and theGroup’s commitment to develop and enhance their value.The carrying value of these intangible assets will continue tobe reviewed at least annually for impairment and adjustedto the recoverable amount if required.
Amortisation is provided at rates calculated to writeoff the cost less estimated residual value of each asset on astraight-line basis over its estimated useful life as follows:Acquired intangibles
•Brand names – 10-20 years
•Customer related intangibles – 3-10 years
•Other proprietary tools – 3-10 yearsOther
•Other (including capitalised computer software) – 3-5 years
Contingent consideration
Future anticipated payments to vendors in respect ofearnouts are based on the directors’ best estimates of futureobligations, which are dependent on the future performanceof the interests acquired and assume the operatingcompanies improve profits in line with directors’ estimates.When earnouts are to be settled by cash consideration, thefair value of the consideration is obtained by discounting to present value the amounts expected to be payable in thefuture. The resulting interest charge is included withininterest payable and similar charges.
Our 2005 financial statements
Annual Report 2005Our 2005 financial statements146

Trade receivables
Trade receivables are stated net of provisions for bad anddoubtful debts.
Financial instruments
The Group has taken advantage of the exemption availableunder IFRS 1 not to apply IAS 32 and IAS 39 in respect ofthe year ended 31 December 2004. UK GAAP has continuedto be applied to financial instruments in this period.
The accounting policy under UK GAAP for the yearended 31 December 2004 is disclosed in note 27.
The accounting policy under IFRS for the periodcommencing 1 January 2005 is as follows:
Foreign currency and interest rate hedging
The Group’s policy on Interest Rate and Foreign ExchangeRate Management sets out the instruments and methodsavailable to hedge interest and currency risk exposures andthe control procedures in place to ensure effectiveness.
The Group uses derivative financial instruments toreduce exposure to foreign exchange risk and interest ratemovements. The Group does not hold or issue derivativefinancial instruments for speculative purposes.
Changes in the value of derivative financialinstruments that are designated and effective as hedges offuture cash flows are recognised directly in equity and theineffective portion is recognised immediately in the incomestatement. If the cash flow hedge of a firm commitment orforecasted transaction results in the recognition of an assetor a liability, then, at the time the asset or liability isrecognised, the associated gains or losses on the derivativethat had previously been recognised in equity are includedin the initial measurement of the asset or liability. For hedgesthat do not result in the recognition of an asset or a liability,amounts deferred in equity are recognised in the incomestatement in the same period in which the hedged itemaffects net profit or loss.
For an effective hedge of an exposure to changes in the fair value, the hedged item is adjusted for changes in fair value attributable to the risk being hedged with thecorresponding entry in profit or loss. Gains or losses fromre-measuring the derivative, or for non-derivatives theforeign currency component of its carrying amount, arerecognised in profit or loss.
Changes in the fair value of derivative financialinstruments that do not qualify for hedge accounting arerecognised in the income statement as they arise.
Hedge accounting is discontinued when the hedginginstrument expires or is sold, terminated, or exercised, orno longer qualifies for hedge accounting. At that time, anycumulative gain or loss on the hedging instrument recognisedin equity is retained in equity until the forecasted transactionoccurs. If a hedged transaction is no longer expected tooccur, the net cumulative gain or loss recognised in equity is transferred to net profit or loss for the period.
Derivatives embedded in other financial instrumentsor other host contracts are treated as separate derivativeswhen their risks and characteristics are not closely relatedto those of host contracts and the host contracts are notcarried at fair value with unrealised gains or losses reportedin the income statement.
Liabilities in respect of option agreements
Option agreements that allow the Group’s equity partnersto require the Group to purchase the minority interest aretreated as derivatives over equity instruments and arerecorded in the balance sheet at fair value and the valuationis remeasured at each period end. Fair value is based on thepresent value of expected cash outflows and the movementin the fair value is recognised as income or expense withinfinance costs in the income statement.
Derecognition of financial liabilities
In accordance with IAS 39, a financial liability of the Groupis only released to the income statement when the underlyinglegal obligation is extinguished.
Convertible debt
Convertible debt is assessed according to the substance ofthe contractual arrangements and is classified into liabilityand equity elements on the basis of the initial fair value ofthe liability element. The difference between this figure andthe cash received is classified as equity.
The income statement charge for the finance costwill be spread evenly over the term of the bonds so that atredemption the liability equals the redemption value.
Bank borrowings
Other interest-bearing bank loans and overdrafts arerecorded at the proceeds received, net of direct issue costs.
Borrowing costs
Finance costs of borrowing are recognised in the incomestatement over the term of those borrowings.
Turnover and revenue recognition
Turnover (billings) comprises the gross amounts billed toclients in respect of commission-based income together with the total of other fees earned. Revenue comprisescommission and fees earned in respect of turnover. Directcosts include fees paid to external suppliers where they areretained to perform part or all of a specific project for aclient and the resulting expenditure is directly attributableto the revenue earned. Turnover and revenue are statedexclusive of VAT, sales taxes and trade discounts.
Our 2005 financial statements
Annual Report 2005Our 2005 financial statements 147

actual threshold is reached provided that collectibility is reasonably assured.
Public relations & public affairs and Branding & identity, Healthcare and Specialist communications
Revenue is typically derived from retainer fees and servicesto be performed subject to specific agreement. Revenue isrecognised when the service is performed, in accordancewith the terms of the contractual arrangement. Revenue isrecognised on long-term contracts, if the final outcome canbe assessed with reasonable certainty, by including in theincome statement revenue and related costs as contractactivity progresses.
Taxation
Corporate taxes are payable on taxable profits at current rates.The tax expense represents the sum of the tax
currently payable and deferred tax.The tax currently payable is based on taxable profit
for the year. Taxable profit differs from net profit asreported in the income statement because it excludes itemsof income or expense that are taxable or deductible in otheryears and it further excludes items that are never taxable ordeductible. The Group’s liability for current tax is calculatedusing tax rates that have been enacted or substantivelyenacted by the balance sheet date.
Deferred tax is the tax expected to be payable orrecoverable on differences between the carrying amounts of assets and liabilities in the financial statements and thecorresponding tax bases used in the computation of taxableprofit, and is accounted for using the balance sheet liabilitymethod. Deferred tax liabilities are recognised for alltaxable temporary differences unless specifically exceptedby IAS 12. Deferred tax assets are recognised to the extentthat it is probable that taxable profits will be availableagainst which deductible temporary differences can beutilised. Such assets and liabilities are not recognised if thetemporary difference arises from goodwill or from theinitial recognition (other than in a business combination) of other assets and liabilities in a transaction that affectsneither the tax profit nor the accounting profit.
Deferred tax liabilities are recognised for taxabletemporary differences arising on investments in subsidiariesand associates, and interests in joint ventures, except wherethe Group is able to control the reversal of the temporarydifference and it is probable that the temporary differencewill not reverse in the foreseeable future.
The carrying amount of deferred tax assets is reviewedat each balance sheet date and reduced to the extent that itis no longer probable that sufficient taxable profits will beavailable to allow all or part of the asset to be recovered.
Deferred tax is calculated at the tax rates that areexpected to apply in the period when the liability is settledor the asset is realised. Deferred tax is charged or creditedin the income statement, except when it relates to itemscharged or credited directly to equity, in which case thedeferred tax is also dealt with in equity.
Advertising and Media investment management
Revenue is typically derived from commissions on mediaplacements and fees for advertising services. Traditionally,the Group’s advertising clients were charged a standardcommission on their total media and productionexpenditure. In recent years, however, this has tended tobecome a matter of individual negotiation. Revenue maytherefore consist of various arrangements involvingcommissions, fees, incentive-based revenue or acombination of the three, as agreed upon with each client.
Revenue is recognised when the service isperformed, in accordance with the terms of the contractualarrangement. Incentive-based revenue typically comprisesboth quantitative and qualitative elements; on the elementrelated to quantitative targets, revenue is recognised whenthe quantitative targets have been achieved; on the elementrelated to qualitative targets, revenue is recognised whenthe incentive is received/receivable.
Information, insight & consultancy
Revenue recognised in proportion to the level of serviceperformed for market research contracts is based onproportional performance. In assessing contractperformance, both input and output criteria are reviewed.Costs incurred are used as an objective input measure ofperformance. The primary input of all work performedunder these arrangements is labour. As a result of therelationship between labour and cost, there is normallya direct relationship between costs incurred and theproportion of the contract performed to date. Costs incurredas a proportion of expected total costs is used as an initialproportional performance measure. This indicativeproportional performance measure is always subsequentlyvalidated against other more subjective criteria (i.e. relevantoutput measures) such as the percentage of interviewscompleted, percentage of reports delivered to a client andthe achievement of any project milestones stipulated in thecontract. In the event of divergence between the objectiveand more subjective measures, the more subjective measurestake precedence since these are output measures.
While most of the studies provided in connectionwith the Group’s market research contracts are undertakenin response to an individual client’s or group of clients’specifications, in certain instances a study may be developedas an off-the-shelf product offering sold to a broad clientbase. For these transactions, revenue is recognised when the product is delivered. Where the terms of transactionprovide for licensing the product on a subscription basis,revenue is recognised over the subscription period on astraight-line basis or, if applicable, based on usage.
Substantially all services are provided on a fixedprice basis. Pricing may also include a provision for asurcharge where the actual labour hours incurred in completinga project are significantly above the labour hours quoted in the project proposal. In instances where this occurs, the surcharge will be included in the total revenue base on which to measure proportional performance when the
Our 2005 financial statements
Annual Report 2005Our 2005 financial statements148

Retirement benefit costs
For defined contribution schemes, contributions are chargedto the income statement as payable in respect of theaccounting period.
For defined benefit schemes the amounts charged tooperating profit are the current service costs and gains andlosses on settlements and curtailments. They are included as part of staff costs. Past service costs are recognisedimmediately in the income statement if the benefits havevested. If the benefits have not vested, the costs arerecognised over the period until vesting occurs. The interestcost and the expected return on assets are shown withinfinance costs and finance income respectively. Actuarial gainsand losses are recognised immediately in the Statement ofRecognised Income and Expense.
Where defined benefit schemes are funded, the assetsof the scheme are held separately from those of the Group,in separate trustee-administered funds. Pension schemeassets are measured at fair value and liabilities are measuredon an actuarial basis using the projected unit method anddiscounted at a rate equivalent to the current rate of returnon a high-quality corporate bond of equivalent currencyand term to the scheme liabilities. The actuarial valuationsare obtained at least triennially and are updated at eachbalance sheet date.
Finance leases
Assets held under finance leases are recognised as assets of the Group at the inception of the lease at the lower of theirfair value and the present value of the minimum leasepayments. Depreciation on leased assets is charged to theincome statement on the same basis as owned assets. Leasingpayments are treated as consisting of capital and interestelements and the interest is charged to the income statementas it is incurred.
Operating leases
Operating lease rentals are charged to the income statementon a systematic basis. Any premium or discount on theacquisition of a lease is spread over the life of the lease oruntil the date of the first rent review.
Translation of foreign currencies
Foreign currency transactions arising from normal tradingactivities are recorded at the rates in effect at the date of thetransaction. Monetary assets and liabilities denominated inforeign currencies at the year end are translated at the year-end exchange rate. Foreign currency gains and losses arecredited or charged to the income statement as they arise.The income statements of overseas subsidiary undertakingsare translated into pounds sterling at average exchangerates and the year-end net assets of these companies aretranslated at year-end exchange rates. Exchange differencesarising from retranslation of the opening net assets and onforeign currency borrowings (to the extent that they hedge
the Group’s investment in such operations) are reported inthe Statement of Recognised Income and Expense.
Goodwill and fair value adjustments arising onthe acquisition of a foreign entity are treated as assetsand liabilities of the foreign entity and translated at theclosing rate.
Share-based payments
The Group issues equity-settled share-based payments(including share options) to certain employees and accountsfor these awards in accordance with IFRS 2 (Share-basedpayments). Equity-settled share-based payments aremeasured at fair value (excluding the effect of non market-based vesting conditions) at the date of grant. The Grouphas used a Black-Scholes valuation model for this purpose.
The fair value determined at the grant date isrecognised in the income statement as an expense on astraight-line basis over the relevant vesting period, based on the Group’s estimate of the number of shares that willultimately vest and adjusted for the effect of non market-based vesting conditions.
IFRS 2 permits prospective adoption for grantsmade after November 2002, but the Group has chosen toadopt IFRS 2 on a full retrospective basis for all option andshare award grants as the resulting charge better reflects theongoing impact on the Group.
New IFRS accounting pronouncements
At the date of authorisation of these financial statements,the following Standards and Interpretations which have notbeen applied in these financial statements were in issue butnot yet effective:IAS 21 Amendment – Net investment in a Foreign OperationIAS 39 Amendment – Cash flow hedges of ForecastIntragroup TransactionsIAS 39 Amendment – Fair value optionIAS 39 and IFRS 4 Amendment – Financial GuaranteeContractsIFRS 6 Exploration for and Evaluation of Mineral ResourcesIFRS 7 Financial instruments: DisclosuresIFRIC 4 Determining whether an Arrangement contains a LeaseIFRIC 5 Rights to Interests arising from Decommissioning,Restoration and Environmental Rehabilitation FundsIFRIC 6 Liabilities arising from Participating in a SpecificMarket – Waste Electrical and Electronic EquipmentIFRIC 7 Applying the Restatement Approach under IAS 29Financial Reporting in Hyperinflationary EconomiesIFRIC 8 Scope of IFRS 2IFRIC 9 Reassessment of Embedded Derivatives.
The Group does not consider that these Standardsand Interpretations will have a significant impact on thefinancial statements of the Group except for additionaldisclosures on capital and financial instruments when therelevant standards come into effect for periods commencingon or after 1 January 2007.
Our 2005 financial statements
Annual Report 2005Our 2005 financial statements 149

Consolidated income statementFor the year ended 31 December 2005
2005 2004 2005 2004Notes £m £m $m2 $m2
Turnover (billings) 2 26,673.7 19,598.0 48,516.8 35,915.3
Revenue 2 5,373.7 4,299.5 9,774.2 7,879.3
Direct costs (241.0) (225.1) (438.4) (412.6)
Gross profit 5,132.7 4,074.4 9,335.8 7,466.7
Operating costs 3 (4,479.9) (3,598.9) (8,148.5) (6,595.3)
Operating profit 2 652.8 475.5 1,187.3 871.4
Share of results of associates 4 33.9 29.5 61.7 54.1
Profit before interest and taxation 686.7 505.0 1,249.0 925.5
Finance income 7 87.6 77.7 159.3 142.4
Finance costs 7 (182.3) (148.3) (331.6) (271.8)
Profit before taxation 592.0 434.4 1,076.7 796.1
Taxation 8 (194.0) (135.0) (352.8) (247.4)
Profit for the year 398.0 299.4 723.9 548.7
Attributable to:
Equity holders of the parent 363.9 273.0 661.9 500.3
Minority interests 34.1 26.4 62.0 48.4
398.0 299.4 723.9 548.7
Headline PBIT 32 754.8 560.2 1,372.9 1,026.6
Headline PBIT margin 32 14.0% 13.0% 14.0% 13.0%
Headline PBT 32 669.0 489.6 1,216.8 897.2
Earnings per share1 10
Basic earnings per ordinary share 30.3p 24.0p 55.1¢ 44.0¢
Diluted earnings per ordinary share 29.7p 23.4p 54.0¢ 42.9¢
The accompanying notes form an integral part of this income statement.1 The calculations of the Group’s earnings per share and Headline earnings per share is set out in note 10.2 The main reporting currency of the Group is the pound sterling and the financial statements have been prepared on this basis. For illustrative purposes only, the income statement set out on this page is
also expressed in US dollars using the approximate average rate for the year (2005: $1.8189 = £1, 2004: $1.8326 = £1). This translation is unaudited and should not be construed as a representation thatthe pound sterling amounts actually represent, or could be converted into, US dollars at the rates indicated.
Our 2005 financial statements
Annual Report 2005Our 2005 financial statements150

Consolidated cash flow statementFor the year ended 31 December 2005
2005 2004Notes £m £m
Net cash inflow from operating activities 12 837.5 556.4
Investing activities
Acquisitions and disposals 12 (507.7) (208.9)
Purchases of property, plant and equipment (160.5) (89.7)
Purchases of other intangible assets (including capitalised computer software) (10.8) (5.9)
Proceeds on disposal of property, plant and equipment 6.7 9.3
Net cash outflow from investing activities (672.3) (295.2)
Financing activities
Issue of shares 20.3 17.9
Share repurchases and buybacks 12 (152.3) (88.7)
Net (decrease)/increase in borrowings 12 (595.2) 128.6
Financing and share issue costs (2.2) (5.0)
Equity dividends paid (100.2) (81.7)
Dividends paid to minority shareholders in subsidiary undertakings (24.0) (22.5)
Net cash outflow from financing activities (853.6) (51.4)
Net (decrease)/increase in cash and cash equivalents (688.4) 209.8
Translation differences 85.0 (44.6)
Cash and cash equivalents at beginning of year 1,283.0 1,117.8
Cash and cash equivalents at end of year 12 679.6 1,283.0
Reconciliation of net cash flow to movement in net debt:
Net (decrease)/increase in cash and cash equivalents (688.4) 209.8
Cash (outflow)/inflow from decrease/(increase) in debt financing 596.9 (124.2)
Net debt acquired (140.8) (9.6)
Other movements (25.9) (8.2)
Translation difference 8.9 (6.7)
Movement of net debt in the year (249.3) 61.1
Net debt at beginning of year (300.4) (361.5)
IAS 32 and IAS 39 adjustment at 1 January 2005 13 (254.3) –
Net debt at end of year 11 (804.0) (300.4)
The accompanying notes form an integral part of this cash flow statement.
Consolidated statement of recognised income and expense
For the year ended 31 December 2005
2005 2004£m £m
Profit for the year 398.0 299.4
Exchange adjustments on foreign currency net investments 266.1 (102.7)
Revaluation of other investments 21.0 –
Actuarial loss on defined benefit pension schemes (16.5) (18.2)
Deferred tax on defined benefit pension schemes 3.6 3.3
Total recognised income and expense relating to the year 672.2 181.8
Attributable to:
Equity holders of the parent 638.1 155.4
Minority interests 34.1 26.4
672.2 181.8
The accompanying notes form an integral part of this statement of recognised income and expense.
Our 2005 financial statements
Annual Report 2005Our 2005 financial statements 151

Consolidated balance sheetAt 31 December 2005
2005 2004 2005 2004Notes £m £m $m1 $m1
Non-current assets
Intangible assets:
Goodwill 14 5,675.2 4,389.7 9,754.0 8,409.8
Other 14 1,260.6 773.6 2,166.6 1,482.1
Property, plant and equipment 15 423.5 309.8 727.9 593.5
Interests in associates 16 509.9 385.5 876.4 738.5
Other investments 16 55.3 8.1 95.0 15.5
Deferred tax assets 17 130.3 100.2 223.9 192.0
Trade and other receivables 19 142.1 59.5 244.2 114.0
8,196.9 6,026.4 14,088.0 11,545.4
Current assets
Inventories 18 281.5 220.6 483.8 422.6
Trade and other receivables 19 4,795.5 2,541.5 8,242.0 4,869.0
Trade receivables within working capital facility:
Gross receivables 20 – 545.7 – 1,045.5
Non-returnable proceeds 20 – (261.0) – (500.0)
– 284.7 – 545.5
Cash and short-term deposits 1,115.2 1,616.0 1,916.7 3,095.9
6,192.2 4,662.8 10,642.5 8,933.0
Current liabilities
Trade and other payables 21 (6,828.4) (4,515.9) (11,736.0) (8,651.6)
Corporate income tax payable (56.5) (53.1) (97.1) (101.7)
Bank overdrafts and loans 23 (457.8) (597.8) (786.8) (1,145.3)
(7,342.7) (5,166.8) (12,619.9) (9,898.6)
Net current liabilities (1,150.5) (504.0) (1,977.4) (965.6)
Total assets less current liabilities 7,046.4 5,522.4 12,110.6 10,579.8
Non-current liabilities
Bonds and bank loans 23 (1,461.4) (1,318.6) (2,511.7) (2,526.1)
Trade and other payables 22 (703.0) (536.6) (1,208.2) (1,028.0)
Deferred tax liabilities 17 (533.1) (312.3) (916.2) (598.3)
Provision for post-employment benefits 26 (231.4) (202.3) (397.7) (387.6)
Provisions for liabilities and charges 24 (131.7) (86.9) (226.4) (166.5)
(3,060.6) (2,456.7) (5,260.2) (4,706.5)
Net assets 3,985.8 3,065.7 6,850.4 5,873.3
Equity
Called-up share capital 28, 29 125.3 118.5 215.4 227.0
Share premium account 29 2.1 1,002.2 3.6 1,920.0
Shares to be issued 29 37.2 49.9 63.9 95.6
Merger reserve 29 (1,388.1) 2,920.6 (2,385.7) 5,595.4
Other reserves 29 167.3 (90.6) 287.5 (173.6)
Own shares 29 (292.9) (277.7) (503.4) (532.0)
Retained earnings 29 5,253.6 (711.8) 9,029.4 (1,363.7)
Equity share owners’ funds 3,904.5 3,011.1 6,710.7 5,768.7
Minority interests 81.3 54.6 139.7 104.6
Total equity 3,985.8 3,065.7 6,850.4 5,873.3
The accompanying notes form an integral part of this balance sheet.1 The main reporting currency of the Group is the pound sterling and the financial statements have been prepared on this basis. For illustrative purposes only, the balance sheet set out on this page is also
expressed in US dollars using the rate in effect on 31 December (2005: $1.7187 = £1, 2004: $1.9158 = £1). This translation is unaudited and should not be construed as a representation that the poundsterling amounts actually represent, or could be converted into, US dollars at the rates indicated.
Signed on behalf of the Board on 11 May 2006:
Sir Martin Sorrell P W G RichardsonGroup chief executive Group finance director
Our 2005 financial statements
Annual Report 2005Our 2005 financial statements152

Notes to the consolidated financial statementsFor the year ended 31 December 2005
1. General informationWPP Group plc is a company incorporated in the UK under the Companies Act 1985. The address of the registered office is Pennypot Industrial Estate, Hythe, Kent, CT21 6PE.The nature of the Group’s operations and its principle activities are set out in note 2.
These financial statements are presented in pounds sterling because that is the currency of the primary economic environment in which the Group operates. Foreign operations areincluded in accordance with the policies set out on pages 145 to 149.
2. Segment informationThe Group is a leading worldwide communications services organisation offering national and multinational clients a comprehensive range of communications services.
For management purposes, the Group is currently organised into four operating segments – Advertising and Media investment management; Information, insight & consultancy;Public relations & public affairs; and Branding & identity, Healthcare and Specialist communications. These disciplines are the basis on which the Group reports its primaryinformation. The Group’s operations are located in North America; the UK; Continental Europe; and Asia Pacific, Latin America, Africa & Middle East and the Group’s performancehas historically been linked with the economic performance of these regions. These divisions are the basis on which the Group reports its secondary information.
Operating sectorsSegment information about these businesses is presented below:
Advertising and Branding & identity,Media investment Information, insight Public relations Healthcare and
management & consultancy & public affairs Specialist communications Consolidated2005 2004 2005 2004 2005 2004 2005 2004 2005 2004
£m £m £m £m £m £m £m £m £m £mTurnover (billings) 22,378.8 16,115.6 857.7 794.8 719.2 591.9 2,718.0 2,095.7 26,673.7 19,598.0
Revenue1 2,606.4 1,985.3 810.4 744.8 534.4 445.2 1,422.5 1,124.2 5,373.7 4,299.5
Operating profit 334.0 264.4 69.4 63.8 72.1 39.4 177.3 107.9 652.8 475.5Share of results of associates 16.1 18.2 6.9 5.0 2.1 1.3 8.8 5.0 33.9 29.5Profit before interest and taxation 350.1 282.6 76.3 68.8 74.2 40.7 186.1 112.9 686.7 505.0Finance income 87.6 77.7Finance costs (182.3) (148.3)Profit before taxation 592.0 434.4Taxation (194.0) (135.0)Profit for the year 398.0 299.4Notes
1 Intersegment sales have not been separately disclosed as they are not material.
Advertising and Branding & identity,Media investment Information, insight Public relations Healthcare and
management & consultancy & public affairs Specialist communications Consolidated2005 2004 2005 2004 2005 2004 2005 2004 2005 2004
£m £m £m £m £m £m £m £m £m £mHeadline PBIT1 402.7 295.0 83.4 66.1 75.3 58.4 193.4 140.7 754.8 560.2Headline PBIT margin % 15.5 14.9 10.3 8.9 14.1 13.1 13.6 12.5 14.0 13.0Notes
1 Headline PBIT is defined in note 32.
Advertising and Branding & identity,Media investment Information, insight Public relations Healthcare and
management & consultancy & public affairs Specialist communications Consolidated2005 2004 2005 2004 2005 2004 2005 2004 2005 2004
£m £m £m £m £m £m £m £m £m £mOther informationGoodwill and acquired intangibles additions 1,107.0 8.0 23.1 162.8 61.1 34.7 291.4 4.9 1,482.6 210.4Capital additions1 96.8 48.5 17.6 18.2 20.1 11.9 36.8 23.4 171.3 102.0Depreciation and amortisation 85.5 49.3 17.8 18.6 12.1 10.3 32.0 25.2 147.4 103.4Goodwill impairment and write-downs 35.6 20.7 7.1 3.8 0.4 17.8 4.0 10.9 47.1 53.2Interests in associates 294.0 260.5 96.8 17.2 18.2 14.3 100.9 93.5 509.9 385.5
Balance sheetAssetsSegment assets 9,842.9 6,746.3 949.4 708.2 625.5 435.4 1,725.8 1,083.1 13,143.6 8,973.0Unallocated corporate assets 2 1,245.5 1,716.2Consolidated total assets 14,389.1 10,689.2LiabilitiesSegment liabilities (5,949.9) (3,864.4) (401.1) (363.8) (249.5) (179.6) (921.2) (643.3) (7,521.7) (5,051.1)Unallocated corporate liabilities 2 (2,881.6) (2,572.4)Consolidated total liabilities (10,403.3) (7,623.5)Notes
1 Capital additions include purchases of property, plant and equipment and other intangible assets (including capitalised computer software).2 Included in unallocated corporate assets and liabilities are corporate income tax, deferred tax and net interest-bearing debt. The debt has not been allocated as it is held centrally and specifically allocating it to
individual segments is not considered to be a fair representation of the net assets of those segments.
Our 2005 financial statements
Annual Report 2005Our 2005 financial statements 153

Auditors’ remuneration:2005 2004
£m £mServices as auditors 13.1 8.4Further assurance services1, 2 2.2 3.7Preliminary Sarbanes-Oxley-related services 2.6 3.8
17.9 15.9Non-audit services2:Tax advisory 3.6 3.4Consulting – 0.6
21.5 19.9Notes
1 Further assurance services comprise due diligence and transaction support services.2 Further assurance and non-audit services require pre-approval by the Audit committee.
Auditors remuneration in respect of services as auditors has increased in the yearprimarily due to costs incurred in the audit of Grey and in the transition to IFRS.
Audit fees paid to Deloitte & Touche LLP include £0.5 million (2004: £0.5 million) inrespect of the parent company. Auditors other than Deloitte & Touche LLP were paid£0.7 million (2004: £0.5 million). In 2005 fees paid to auditors in respect of due diligenceand transaction services, included in further assurance services above, of £0.3 million(2004: £0.9 million) were capitalised.
Minimum committed annual rentalsAmounts payable in 2006 under the foregoing leases will be as follows:
Plant and Land andmachinery buildings
2006 2005 2006 2005£m £m £m £m
In respect of operating leases which expire:– within one year 7.0 6.9 20.6 24.0– within two to five years 17.9 19.3 94.5 74.0– after five years 1.8 1.5 90.0 75.9
26.7 27.7 205.1 173.9
Future minimum annual amounts payable under all lease commitments in existence at31 December 2005 are as follows:
Minimum Lessrental sub-let Net
payments rentals payment£m £m £m
Year ending 31 December2006 231.8 (18.2) 213.62007 202.2 (17.7) 184.52008 176.4 (17.0) 159.42009 156.5 (15.3) 141.22010 112.9 (13.9) 99.0Later years 360.0 (39.2) 320.8
1,239.8 (121.3) 1,118.5
4. Share of results of associatesShare of results of associates include:
2005 2004£m £m
Share of profit before interest and taxation 54.0 48.1Share of interest and minority interest (0.9) (0.7)Share of taxation (19.2) (17.9)
33.9 29.5
5. Our peopleOur staff numbers averaged 70,936 against 57,788 in 2004, including acquisitions.Their geographical distribution was as follows:
2005 2004North America 21,261 17,271UK 8,007 7,069Continental Europe 18,644 14,793Asia Pacific, Latin America, Africa & Middle East 23,024 18,655
70,936 57,788
Their operating sector distribution was as follows:2005 2004
Advertising and Media investment management 38,084 29,419Information, insight & consultancy 10,089 9,482Public relations & public affairs 5,901 5,136Branding & identity, Healthcare and Specialist communications 16,862 13,751
70,936 57,788
At the end of 2005 staff numbers were 74,631 (2004: 59,932). Including all employeesof associated undertakings, this figure is approximately 92,000 (2004: 84,000).
Contributions by geographical area were as follows:2005 2004
£m £mTurnover (billings)North America 10,040.5 7,576.3UK 2,964.1 1,973.1Continental Europe 8,730.4 6,312.4Asia Pacific, Latin America, Africa & Middle East 4,938.7 3,736.2
26,673.7 19,598.0
Revenue2
North America 2,106.9 1,651.9UK 808.1 728.5Continental Europe 1,410.3 1,134.8Asia Pacific, Latin America, Africa & Middle East 1,048.4 784.3
5,373.7 4,299.5
Headline PBIT1 Margin MarginNorth America 16.6% 350.1 15.2% 251.2UK 10.5% 84.6 10.4% 75.7Continental Europe 12.5% 176.1 11.3% 128.1Asia Pacific, Latin America, Africa & Middle East 13.7% 144.0 13.4% 105.2
14.0% 754.8 13.0% 560.2
Segment AssetsNorth America 5,119.7 4,002.8UK 1,359.9 1,423.6Continental Europe 4,100.3 1,990.7Asia Pacific, Latin America, Africa & Middle East 2,563.7 1,555.9
13,143.6 8,973.0
Capital additions3
North America 80.5 34.4UK 28.7 24.3Continental Europe 31.1 21.3Asia Pacific, Latin America, Africa & Middle East 31.0 22.0
171.3 102.0Notes
1 Headline PBIT is defined in note 32.2 Intersegment sales have not been separately disclosed as they are not material.3 Capital additions include purchases of property, plant and equipment and other intangible assets
(including capitalised computer software).
3. Operating costs2005 2004
£m £mTotal staff costs (note 5) 3,186.3 2,531.3Establishment costs 387.6 327.6Other operating costs (net) 906.0 740.0Total operating costs 4,479.9 3,598.9Operating costs include:Goodwill impairment 46.0 40.6Goodwill write-down relating to utilisation of pre-acquisition tax losses (note 14)1 1.1 12.6Amortisation of acquired intangible assets (note 14) 25.3 –Amortisation of other intangible assets (note 14) 10.7 6.7Depreciation of property, plant and equipment (note 15) 111.4 96.7Loss on sale of property, plant and equipment 1.1 1.9Gains on disposal of investments (note 6) (4.3) (3.0)Investment write-downs (note 6) – 5.0Net foreign exchange losses 0.8 1.8Operating lease rentals:Land and buildings 237.8 205.1Plant and machinery 34.8 37.5
272.6 242.6
All of the operating costs of the Group are related to administrative expenses.
Notes1 The goodwill write-down in relation to the utilisation of pre-acquisition tax losses is due to the better
than expected performance of certain acquisitions in the year. This enabled the utilisation of pre-acquisition tax attributes that previously could not be recognised at the time of acquisition due toinsufficient evidence that they were recoverable.
Our 2005 financial statements
Annual Report 2005Our 2005 financial statements154

Total staff costs were made up as follows:2005 2004
£m £mWages and salaries 2,182.1 1,718.4Cash-based incentive plans 159.0 130.7Share-based incentive plans (note 25) 68.6 58.8Social security costs 267.3 210.0Other pension costs (note 26) 75.6 64.4Other staff costs 433.7 349.0
3,186.3 2,531.3Staff cost to revenue ratio 59.3% 58.9%
Compensation for key management personnel is disclosed on page 125 to 129.
6. Investment gains and write-downs
Investment gainsIn 2005, profits of £4.3 million (2004: £3.0 million) were realised on the disposalof a number of equity interests held by the Group in North America and Europe.
Investment write-downsIn 2004, investment write-downs of £5.0 million comprised write-downs on certain non-core minority investments in new media companies and other technology ventures.
These transactions did not have a material effect on the Group’s tax charge or minority interest.
Other itemsThe Group has released £10.1 million (2004: £14.0 million) to operating profit relating to excess provisions established in respect of acquisitions completed prior to 2004. At the same time, the Group includes within operating costs charges for one-off costs,severance and restructuring charges, including those resulting from integratingacquisitions. For this reason, the Group considers that the combination of the abovereleases and charges, when taken together, does not materially impact the Group’squality of earnings.
7. Finance income and finance costsFinance income includes:
2005 2004£m £m
Expected return on pension scheme assets 24.2 21.3Investment income 5.6 –Interest income 57.8 56.4
87.6 77.7
Finance costs include:2005 2004
£m £mInterest on pension scheme liabilities 32.0 30.8Interest payable and similar charges1 141.4 117.5Finance charges (excluding revaluation of financial instruments) 173.4 148.3Revaluation of financial instruments 8.9 –
182.3 148.3Notes
1 The charge of £141.4 million for the year ended 31 December 2005 includes an expense of £13.8million arising from the change in accounting for the Group’s convertible bonds following the adoption of IAS 32 ‘Financial Instruments: Disclosure and Presentation’ and IAS 39 ‘Financial Instruments:Recognition and Measurement’ on 1 January 2005. Prior-year comparatives have not been restated as permitted by IFRS 1. This approach also applies to the initial recognition and subsequent re-measurement of the fair value of other financial instruments shown below. UK GAAP has continued to be applied in accounting for financial instruments in previous years.
The following are included in the revaluation of financial instruments shown above:2005 2004
£m £mMovements in fair value of treasury instruments 3.0 –Revaluation of put options over minority interests (note 21) 5.8 –Other 0.1 –
8.9 –
Interest payable on the Group’s borrowings, other than the bonds, is payable at a margin of between 0.125% and 0.275% over relevant LIBOR.
The majority of the Group’s long-term debt is represented by $750 million of US dollarbonds at a weighted average interest rate of 6.01% (prior to any interest rate swaps or cross-currency swaps), 1650 million of Eurobonds at 6% (prior to any interest rate or currency swaps), £450 million of convertible bonds at 3.00% (including redemptionpremium accrual and prior to any interest rate or currency swaps) and $150 million ofconvertible bonds at a rate of 5%.
Average borrowings under the Revolving Credit Facilities (note 11) amounted to$405.3 million at an average interest rate of 4.11% inclusive of margin.
8. TaxationThe tax charge is based on the profit for the year and comprises:
2005 2004£m £m
Current taxUK corporation tax at 30%:Current year 32.9 22.5Prior years (24.4) –
8.5 22.5Foreign tax:Current year 177.3 108.6Prior years 9.9 9.6
187.2 118.2Total current tax 195.7 140.7Deferred taxCurrent year (1.7) (5.7)Tax expense 194.0 135.0
The tax charge for the year can be reconciled to profit before taxation in the incomestatement as follows:
2005 2004£m £m
Profit before taxation 592.0 434.4Tax at the UK corporation tax rate of 30% 177.6 130.3Tax effect of share of results of associates (10.2) (8.9)Tax effect of expenses that are not deductible in determining taxable profit 12.4 1.3Tax effect of utilisation or recognition of tax losses not previously recognised (16.8) (18.3)Effect of different tax rates of subsidiaries operating in other jurisdictions 18.5 20.0Unused tax losses carried forward 12.5 10.6Tax expense 194.0 135.0Effective tax rate on profit before taxation 32.8% 31.1%Effective tax rate on Headline profit before taxation (note 32) 29.0% 27.6%
9. Ordinary dividendsAmounts recognised as distributions to equity holders in the year:
2005 2004Pence per Pence per 2005 2004
Per share share share £m £m2004 Final dividend paid 5.28p 4.40p 64.1 52.22005 Interim dividend paid 3.00p 2.50p 36.2 29.4
8.28p 6.90p 100.3 81.6
Cents per Cents per Per ADR1 ADR ADR $m $m2004 Final dividend paid 48.4¢ 36.0¢ 117.5 85.42005 Interim dividend paid 27.3¢ 22.9¢ 65.8 53.9
75.7¢ 58.9¢ 183.3 139.3
Proposed final dividend for the year ended 31 December 2005:2005 2004
Pence per Pence perPer share share share2005 Final dividend proposed2 6.34p 5.28p
Cents per Cents per Per ADR1 ADR ADR2005 Final dividend proposed2 57.7¢ 48.4¢Notes
1 These figures have been translated for convenience purposes only, using the approximate average ratefor the year shown on page 150. This conversion should not be construed as a representation that thepound sterling amounts actually represent, or could be converted into, US dollars at the rates indicated.
2 The Annual General Meeting to approve the final dividend will be on 27 June 2006 and therefore thefinal dividend has not been included as a liability in these financial statements.
Our 2005 financial statements
Annual Report 2005Our 2005 financial statements 155

DebtUSA bond During 2005, the Group repaid $200 million of 6.625% bonds due 2005.The Group has in issue $100 million of 6.875% bonds due 2008 and $650 million of5.875% bonds due 2014.
Grey debt In March 2005, subsequent to its acquisition by the Group, Grey GlobalGroup Inc repaid $75 million of 7.41% Senior Notes due 2009 and $50 million of8.17% Senior Notes due 2007 together with accrued interest of $4 million and make-whole payments of $10.85 million.
Eurobond The Group has in issue 1650 million of 6.0% bonds due 2008 and during2004, repaid 1350 million of 5.125% bonds.
Revolving Credit Facilities During 2005, the Group replaced its existing $750 millionRevolving Credit Facility with a new $1.6 billion seven-year Revolving Credit Facilitydue August 2012. The Group’s syndicated borrowings drawn down, in US dollarsand pounds sterling, averaged $405.3 million. The Group had available undrawncommitted facilities of £931 million at 31 December 2005 (2004: £391 million).
Borrowings under the Revolving Credit Facility and certain other debt instruments aregoverned by certain financial covenants based on the results and financial position ofthe Group, including requirements that (i) the interest coverage ratio for each financialperiod equal or exceed 5.0 to 1 and (ii) the ratio of borrowed funds to earnings beforeinterest, taxes, depreciation and amortisation at 30 June and 31 December in eachyear shall not exceed 3.5 to 1, both covenants as defined in the relevant agreements.The Group is currently in compliance with both covenants.
Convertible bondsIn October 2000, with the purchase of Young & Rubicam Inc, the Group acquired$287.5 million of 3% convertible bonds which were redeemed on their due date,15 January 2005.
In April 2002, the Group issued £450 million of 2% convertible bonds due April 2007.At the option of the holder, the bonds are convertible at any time into 41,860,465 WPPordinary shares at an initial price of £10.75. As the bonds are redeemable at a premiumof 5.35% over par, the conversion price increases during the life of the bonds to £11.33per share into the same number of shares as above. The effective interest rate on theliability component is 7.2%.
In March 2005, with the purchase of Grey Global Group Inc, the Group acquired$150 million of 5% convertible debentures due 2033. Each debenture holder has the right to require Grey and WPP (as co-obligor) to repurchase as of each of28 October 2008, 2010 and 2013 all or a portion of the holder’s then outstandingdebentures at par ($1,000 per debenture) plus the amount of accrued and unpaidinterest. WPP has the unrestricted right to call the bond at par from 2013. Each $1,000 of principal amount is initially convertible into 11.820362 WPP ADSs and$499.31 of cash and is convertible at the option of the holder at any time. The effectiveinterest rate on the liability component is 4.5%.
The convertible bonds have a nominal value of £537.3 million at 31 December 2005(2004: £600.1 million). In accordance with IAS 32 and IAS 39, these bonds have beensplit between a liability component and an equity component by initially valuing theliability component at fair value based on the present value of future cash flows and thenholding it at amortised cost. The equity component represents the fair value, on initialrecognition, of the embedded option to convert the liability into equity of the Group.
The liability element is £525.5 million and the equity component is £68.7 million as at31 December 2005. Prior year comparatives have not been restated as permitted byIFRS 1 and UK GAAP has continued to be applied in accounting for financialinstruments in previous years.
The Group estimates that the fair value of the liability component of the convertiblebonds at 31 December 2005 to be approximately £537 million. This fair value has been calculated by discounting the future cash flows at the market rate.
The following table is an analysis of net debt with debt analysed by year of repayment:2005 2004
£m £mDebtWithin one year (22.2) (264.8)Between one and two years (446.2) (2.5)Between two and three years (463.6) (453.3)Between three and four years (58.2) (510.9)Between four and five years – –Over five years (493.4) (351.9)Debt financing under the Revolving Credit Facility and in relation to unsecured loan notes (1,483.6) (1,583.4)Short-term overdrafts – within one year (435.6) (333.0)Debt financing (1,919.2) (1,916.4)Cash and short-term deposits 1,115.2 1,616.0Net debt (804.0) (300.4)
Elsewhere in this Annual Report net debt at 31 December 2004 is shown as £554.7million to provide a comparable basis with net debt at 31 December 2005. Thisincludes the entire IAS 32 and IAS 39 adjustment of £254.3 million at 1 January 2005described in note 13.
10. Earnings per share
Basic EPSThe reconciliation between Reported and Headline EPS, and between earnings figuresused in calculating them, is as follows:
2005 2004Reported earnings1 (£m) 363.9 273.0Headline earnings (£m) (note 32) 440.9 328.2Average shares used in Basic EPS calculation (m) 1,200.1 1,136.1Reported EPS 30.3p 24.0pHeadline EPS 36.7p 28.9pNotes
1 Reported earnings is equivalent to profit for the year attributable to equity holders of the parent.
Diluted EPSThe diluted Reported and Headline EPS are set out below:
2005 2004Diluted Reported Earnings (£m) 363.9 285.2Diluted Headline Earnings (£m) 440.9 340.4Average shares used in Diluted EPS calculation (m) 1,224.8 1,219.6Diluted Reported EPS 29.7p 23.4pDiluted Headline EPS 36.0p 27.9p
Diluted EPS has been calculated based on the Reported and Headline Earningsamounts above. In 2005, the Group’s convertible bonds were antidilutive to earningsper share and therefore excluded from the calculation. Had the convertible bondsbeen dilutive to earnings per share, incremental shares attributable to the assumedconversion of the bonds would have increased diluted shares outstanding by49.8 million. In addition, options to purchase 12.0 million and 18.4 million ordinaryshares were outstanding at 31 December 2005 and 2004, respectively, but werenot included in the computation of diluted earnings per share because the options’exercise prices were greater than the average market price of the shares and,therefore, the effect would be antidilutive. For the year ended 31 December 2004, both the $287.5 million convertible bonds and the £450 million convertible bonds weredilutive and earnings were consequently increased by £12.2 million.
A reconciliation between the shares used in calculating Basic and Diluted EPS isas follows:
2005 2004m m
Average shares used in Basic EPS calculation 1,200.1 1,136.1Dilutive share options outstanding 18.6 20.6Other potentially issuable shares 6.1 4.6$287.5 million convertible bonds – 16.4£450 million convertible bonds – 41.9Shares used in Diluted EPS calculation 1,224.8 1,219.6
At 31 December 2005 there were 1,252,899,372 ordinary shares in issue.
11. Sources of financeThe following table summarises the equity and debt financing of the Group, andchanges during the year:
2005 2004 2005 2004Shares Shares Debt Debt
£m £m £m £mAnalysis of changes in financingBeginning of year 1,120.7 1,074.0 1,583.4 1,479.3Reclassification due to Group reconstruction (1,037.9) – – –Shares issued in respect of acquisitions 8.5 – – –Other issues of share capital 38.5 48.0 – –Share cancellations (2.1) (1.3) – –Share issue costs paid (0.2) – – –Transfer to goodwill (0.1) – – –IAS 32 and IAS 39 adjustment at
1 January 2005 (note 13) – – 254.3 –Net (decrease)/increase in drawings on
bank loans, corporate bondsand convertible bonds – – (595.1) 128.6
Debt acquired (net) – – 140.8 9.6Net amortisation of financing costs
included in net debt – – 7.9 3.8Other movements – – 16.2 –Exchange adjustments – – 76.1 (37.9)End of year 127.4 1,120.7 1,483.6 1,583.4
The above table excludes bank overdrafts which fall within cash and cash equivalentsfor the purposes of the consolidated cash flow statement.
SharesAt 31 December 2005, the Company’s share base was entirely composed of ordinaryequity share capital and share premium of £127.4 million (2004: £1,120.7 million),further details of which are disclosed in notes 28 and 29.
Our 2005 financial statements
Annual Report 2005Our 2005 financial statements156

Analysis of fixed and floating rate debt by currency including the effect of interest rateand cross-currency swaps:2005 Fixed Floating PeriodCurrency £m rate1 basis (months)1
$ – fixed 551.5 5.08% n/a 62– floating 43.6 n/a LIBOR n/a
£ – fixed 104.1 (2.23%) n/a 16– floating 64.0 n/a market n/a
1 – fixed 137.7 8.27% n/a 32– floating 511.5 n/a LIBOR n/a
¥ – fixed 44.4 (1.29%) n/a 16Other 26.8 n/a various n/a
1,483.6
2004 Fixed Floating PeriodCurrency £m rate1 basis (months)1
$ – fixed 437.2 5.19% n/a 41– floating 363.72 n/a LIBOR n/a
£ – fixed 239.1 1.94% n/a 281 – fixed 176.9 6.00% n/a 42
– floating 564.6 n/a EURIBOR n/a¥ – fixed 45.8 (1.29%) n/a 28Other 17.1 n/a Various n/a
1,844.4Notes
1 Weighted average.2 Including drawings on working capital facility as described in note 20.
12. Analysis of cash flowsThe following tables analyse the items included within the main cash flow headings onpage 151.
Net cash from operating activities:2005 2004
£m £mOperating profit 652.8 475.5Adjustments for:Non-cash share-based incentive plans (including share options) 68.6 58.8Depreciation of property, plant and equipment 111.4 96.7Impairment of goodwill 46.0 40.6Goodwill write-down relating to utilisation of pre-acquisition tax losses 1.1 12.6Amortisation of acquired intangible assets 25.3 –Amortisation of other intangible assets 10.7 6.7Profits on disposal of equity interests (4.3) (3.0)Loss on sale of property, plant and equipment 1.1 1.9Amounts written off investments – 5.0Operating cash flow before movements in working capital and provisions 912.7 694.8Decrease in inventories and work in progress 39.5 40.1Increase in receivables (618.5) (414.6)Increase/(decrease) in payables – short term 710.4 339.0Increase/(decrease) in payables – long term (33.8) 29.9Increase in provisions 10.0 0.8Cash generated by operations 1,020.3 690.0Corporation and overseas tax paid (136.0) (101.3)Interest and similar charges paid (128.2) (99.7)Interest received 62.4 48.9Investment income 5.6 –Dividends from associates 13.4 18.5Net cash inflow from operating activities 837.5 556.4
Acquisitions and disposals:2005 2004
£m £mInitial cash consideration (561.2) (97.3)Cash and cash equivalents acquired (net) 173.9 6.3Earnout payments (96.7) (78.6)Loan note redemptions (33.0) (26.6)Purchase of other investments (including associates) (29.0) (22.0)Proceeds on disposal of investments 38.3 9.3Net cash outflow (507.7) (208.9)
Share repurchases and buybacks:2005 2004
£m £mShare cancellations (including brokerage fees) (123.3) (73.7)Purchase of own shares by ESOP trust (29.0) (15.0)Net cash outflow (152.3) (88.7)
Net (decrease)/increase in borrowings:2005 2004
£m £mIncrease in drawings on bank loans 17.1 0.9Repayment of $287.5 million convertible bonds (154.5) –Repayment of $125 million Grey debt (65.3) –Repayment of working capital facility (277.2) –Repayment of $200 million bonds (115.3) –Proceeds from issue of $650 million 10 year bonds – 358.2Repayment of 1350 million bonds – (230.5)Net cash (outflow)/inflow (595.2) 128.6
Cash and cash equivalents:2005 2004
£m £mCash at bank and in hand 1,029.0 1,372.0Short-term bank deposits 86.2 244.0Overdrafts1 (435.6) (333.0)Cash and cash equivalents at end of year 679.6 1,283.0Notes
1 Bank overdrafts are included in cash and cash equivalents because they form an integral part of theGroup’s cash management.
The Group considers that the carrying amount of cash and cash equivalentsapproximates their fair value.
13. IAS 32 and IAS 39 adjustment at 1 January 2005The IAS 32 and IAS 39 adjustments to net debt at 1 January 2005 are made up ofthe following:
£mReclassification of components of convertible debt 32.4Reclassification of deferred gain arising on termination of swaps (18.6)Recognition of financial instruments at fair value (7.1)Reclassification of the working capital facility1 (261.0)
(254.3)1 The Group had a working capital facility (the advance of cash financing against which certain trade
debts have been assigned) that IAS 32 and IAS 39 require to be presented as a bank borrowing. As the Group has elected to apply IAS 32 and IAS 39 from 1 January 2005, net debt at 31 December2004 has been presented to comply with 2004 UK GAAP as a deduction from debtors, inaccordance with the ‘linked presentation’ required by FRS 5 (Reporting the substance oftransactions). The drawdown on the facility was transferred to debt at 1 January 2005. The facilitywas repaid and cancelled on 31 August 2005.
14. Intangible assets
GoodwillThe movements in 2005 and 2004 were as follows:
£mCost:1 January 2004 4,630.4Additions1 203.4Exchange differences (105.3)31 December 2004 4,728.5Additions1 1,128.1Reclassifications to interests in associates (37.1)Disposals (47.1)Exchange differences 277.131 December 2005 6,049.5
Accumulated impairment losses and write-downs:1 January 2004 285.6Goodwill write-down relating to utilisation of pre-acquisition tax losses 12.6Impairment losses for the year 40.631 December 2004 338.8Goodwill write-down relating to utilisation of pre-acquisition tax losses 1.1Impairment losses for the year 34.431 December 2005 374.3
Net book value:31 December 2005 5,675.231 December 2004 4,389.71 January 2004 4,344.8Notes
1 Additions represent goodwill arising on the acquisition of subsidiary undertakings. Goodwill arising onthe acquisition of associate undertakings is shown within interests in associates in note 16.
Our 2005 financial statements
Annual Report 2005Our 2005 financial statements 157

15. Property, plant and equipmentThe movements in 2005 and 2004 were as follows:
Land and buildingsShort Fixtures,
Freehold leasehold fittings and ComputerLand buildings buildings equipment equipment Total
£m £m £m £m £m £mCost:1 January 2004 15.1 38.4 273.2 251.1 352.3 930.1Additions – 0.7 27.3 19.4 48.7 96.1New acquisitions – 2.5 3.3 12.3 27.8 45.9Disposals – (1.6) (14.2) (28.7) (44.0) (88.5)Exchange adjustments (1.0) (1.3) (7.9) (13.2) (7.6) (31.0)31 December 2004 14.1 38.7 281.7 240.9 377.2 952.6Additions – 0.7 59.8 36.5 63.5 160.5New acquisitions 9.1 0.8 78.4 69.4 33.5 191.2Disposals (3.0) (0.1) (35.1) (46.7) (104.2) (189.1)Exchange adjustments (5.1) 11.2 25.9 16.1 16.0 64.131 December 2005 15.1 51.3 410.7 316.2 386.0 1,179.3
Depreciation:1 January 2004 – 16.4 129.7 173.3 291.4 610.8New acquisitions – 0.4 1.7 9.6 17.7 29.4Charge for the year – 2.4 25.8 23.0 45.5 96.7Disposals – (0.3) (11.3) (24.0) (42.3) (77.9)Exchange adjustments – (0.4) (6.9) (7.0) (1.9) (16.2)31 December 2004 – 18.5 139.0 174.9 310.4 642.8New acquisitions 0.5 0.4 47.2 53.5 19.2 120.8Charge for the year 0.4 1.5 34.1 27.6 47.8 111.4Disposals (0.9) – (31.6) (43.0) (90.0) (165.5)Exchange adjustments (0.8) 3.1 15.9 12.8 15.3 46.331 December 2005 (0.8) 23.5 204.6 225.8 302.7 755.8
Net book value:31 December 2005 15.9 27.8 206.1 90.4 83.3 423.531 December 2004 14.1 20.2 142.7 66.0 66.8 309.81 January 2004 15.1 22.0 143.5 77.8 60.9 319.3
Leased assets (other than leasehold buildings) included above have a net book value of £8.3 million (2004: £8.5 million). Future obligations in respect of these leased assetsare £9.0 million (2004: £8.6 million) and are included in other creditors.
At the end of the year, capital commitments contracted, but not provided for in respectof property, plant and equipment were £36.9 million (2004: £30.9 million).
16. Interests in associates and other investmentsThe movements in 2005 and 2004 were as follows:
Goodwilland other
Net assets intangiblesof of
associate associate Otherunder- under- Total invest-takings takings associates ments
£m £m £m £m1 January 2004 156.9 187.5 344.4 22.0Additions (0.5) – (0.5) 0.8Goodwill arising on acquisition of new associates – 36.0 36.0 –Share of results of associate undertakings 29.5 – 29.5 –Dividends and other movements (21.2) – (21.2) (4.9)Exchange adjustments 1.1 15.9 17.0 –Disposals (0.1) (2.5) (2.6) (0.6)Reclassification to subsidiaries (2.8) (14.3) (17.1) (4.2)Write-downs – – – (5.0)31 December 2004 162.9 222.6 385.5 8.1Additions 21.0 – 21.0 23.2Goodwill arising on acquisition of new associates – 42.4 42.4 –Share of results of associate undertakings 33.9 – 33.9 –Dividends and other movements (12.3) – (12.3) –Exchange adjustments 2.2 16.3 18.5 –Disposals (0.5) – (0.5) –Reclassification from subsidiaries 1.0 33.1 34.1 3.0Revaluation of other investments – – – 21.0Goodwill impairment – (11.6) (11.6) –Amortisation of other intangible assets – (1.1) (1.1) –31 December 2005 208.2 301.7 509.9 55.3
Significant components of goodwill as at 31 December 2005 and 2004 are:2005 2004
£m £mYoung & Rubicam 2,369.9 2,087.7Grey 992.0 –Mediaedge:cia 921.3 902.7Other 1,392.0 1,399.3Total goodwill 5,675.2 4,389.7
Other intangible assets:The movements in 2005 and 2004 were as follows:
Brands with an
indefinite Acquired useful life intangibles Other Total
£m £m £m £mCost:1 January 2004 797.9 – 50.9 848.8Additions – – 5.9 5.9Disposals – – (0.5) (0.5)Acquired on acquisition of a subsidiary – 7.0 – 7.0Exchange differences (55.3) – – (55.3)31 December 2004 742.6 7.0 56.3 805.9Additions – – 10.8 10.8Disposals – – (5.1) (5.1)Acquired on acquisition of a subsidiary – 354.5 8.7 363.2Other movements – – 7.3 7.3Exchange differences 154.4 (4.9) 2.8 152.331 December 2005 897.0 356.6 80.8 1,334.4
Amortisation:1 January 2004 – – 25.6 25.6Charge for the year – – 6.7 6.731 December 2004 – – 32.3 32.3Charge for the year – 25.3 10.7 36.0Disposals – – (4.9) (4.9)Acquired on acquisition of a subsidiary – – 3.4 3.4Other movements – – 4.2 4.2Exchange differences – 1.0 1.8 2.831 December 2005 – 26.3 47.5 73.8
Net book value:31 December 2005 897.0 330.3 33.3 1,260.631 December 2004 742.6 7.0 24.0 773.61 January 2004 797.9 – 25.3 823.2
Brands with an indefinite life represent JWT, Hill & Knowlton, Ogilvy & Mather Worldwideand the Young & Rubicam Group. These assets are carried at historical cost in accordancewith the Group’s accounting policy for intangible assets. The most significant of these isthe Young & Rubicam Group with a carrying value of £539.4 million at 31 December 2005(2004: £453.4 million).
The estimated aggregate amortisation expense in respect of other intangible assets(including acquired intangibles) for each of the next five years is as follows: £52.6million in 2006, £42.2 million in 2007, £38.4 million in 2008, £32.8 million in 2009 and £31.4 million in 2010.
In accordance with the Group’s accounting policy, the carrying values of goodwill and other intangible assets are reviewed for impairment annually or more frequently if events or changes in circumstances indicate that the asset might be impaired.
The 2005 impairment review was initially undertaken as at 30 June 2005 and thenupdated as at 31 December 2005. The review assessed whether the carrying value of goodwill was supported by the net present value of future cashflows derived fromassets using a projection period of up to five years for each cash-generating unit. After the projection period, steady or declining growth has been assumed at rates notexceeding long-term average growth rates for the industry for each cash-generatingunit. Except as noted below, an annual growth rate of 3.0% and a pre-tax discount rate of 11.9% have been assumed. Projections for Young & Rubicam assume anannual growth rate of 4.4%. The projections also include assumptions about paymentsfor cash taxes and cash flows have therefore been discounted using the Group’sweighted average cost of capital of 7.8%. An impairment charge is required for bothgoodwill and other indefinite lived intangible assets when the carrying amount exceedsthe recoverable amount. Impairment charges of £46.0 million and £40.6 million wererecorded in the years ended 31 December 2005 and 2004, respectively. Theimpairment charges relate to certain under-performing businesses in the Group. In certain markets, the impact of current local economic conditions and tradingcircumstances on these businesses was sufficiently severe to indicate impairment to the carrying value of goodwill.
The estimates and assumptions made in connection with impairment testing could differfrom future actual results of operations and cash flows. Further, future events could causethe Group to conclude that impairment indicators exist and that the asset values associatedwith a given operation have become impaired. Any resulting impairment loss could have amaterial impact on the Group’s financial condition and results of operations. The carryingvalue of goodwill and other intangible assets will continue to be reviewed at least annually forimpairment and adjusted to the recoverable amount if required.
Our 2005 financial statements
Annual Report 2005Our 2005 financial statements158

Deferred tax liabilities of £15.0 million (2004: £5.8 million) have been set against thedeferred tax assets recognised above as they relate to the same tax group.
In addition the Group has recognised the following deferred tax liabilities andmovements thereon in 2005 and 2004:
Othershort-term
Associate temporaryBrands earnings differences Total
£m £m £m £mAt 1 January 2004 319.2 7.6 1.2 328.0Charge to income – 2.2 1.4 3.6Exchange differences (19.3) 0.6 (0.6) (19.3)At 31 December 2004 299.9 10.4 2.0 312.3Impact of adoption of IAS 32 and IAS 39 on 1 January 2005 – – 9.6 9.6Acquisition of subsidiaries 143.6 – 13.8 157.4(Credit)/charge to income (11.5) 1.6 (4.2) (14.1)Exchange differences 72.3 0.4 (4.8) 67.9At 31 December 2005 504.3 12.4 16.4 533.1
At the balance sheet date, the Group has unused gross tax losses and other temporarydifferences of £2,734.2 million available for offset against future profits. A deferred taxasset has been recognised in respect of the tax benefit of £429.9 million of such losses.No deferred tax asset has been recognised in respect of the remaining £2,304.3 millionas the Group considers that there will not be enough taxable profits in the entitiesconcerned such that any additional asset could be considered recoverable. Included in unrecognised temporary differences are losses of £362.7 million that will expire by2020 (a further £160.1 million will expire after this date). £1,686.4 million of losses maybe carried forward indefinitely.
At the balance sheet date, the aggregate amount of the temporary differences inrelation to the investment in subsidiaries for which deferred tax liabilities have not been recognised was £5,087.1 million (2004: £3,766.5 million). No liability has beenrecognised in respect of these differences because the Group is in a position to controlthe timing of the reversal of the temporary differences and the Group considers that it isprobable that such differences will not reverse in the foreseeable future.
18. InventoriesThe following are included in the net book value of inventories:
2005 2004£m £m
Work in progress 279.8 216.5Inventories 1.7 4.1
281.5 220.6
19. Trade and other receivablesThe following are included in trade and other receivables:
Amounts falling due within one year:2005 2004
£m £mTrade receivables 3,999.3 2,058.5VAT and sales taxes recoverable 43.0 29.1Corporate income taxes recoverable 21.0 24.2Other debtors 350.8 238.1Prepayments and accrued income 381.4 191.6
4,795.5 2,541.5
Amounts falling due after more than one year:2005 2004
£m £mOther debtors 115.8 54.2Prepayments and accrued income 26.3 5.3
142.1 59.5
Movements on bad debt provisions were as follows:2005 2004
£m £mBalance at beginning of year 63.1 66.6New acquisitions 12.8 1.5Charged to operating costs 11.1 13.5Exchange adjustments 3.6 (0.7)Utilisations and other movements (10.5) (17.8)Balance at end of year 80.1 63.1
The allowance for bad and doubtful debts is equivalent to 2.0% of gross tradeaccounts receivable.
The Group considers that the carrying amount of trade and other receivablesapproximates their fair value.
Our 2005 financial statements
Annual Report 2005Our 2005 financial statements 159
The investments included above as ‘other investments’ represent investments in equitysecurities that present the Group with opportunity for return through dividend incomeand trading gains. They have no fixed maturity or coupon rate. The fair values of thelisted securities are based on quoted market prices. For unlisted securities, wheremarket value is not available, the Group has estimated relevant fair values on the basisof publicly available information from outside sources or on the basis of discountedcash flow models where appropriate.
The Group’s principal associate undertakings at 31 December 2005 included:% Country of
owned incorporationAGB Nielsen Media Research BV 50.0 NetherlandsAsatsu-DK 20.9 JapanChime Communications PLC 21.8 UKDYR Tokyo Agency 49.0 JapanHigh Co S.A. 34.1 FranceIBOPE Group 31.2 BrazilKinetic Worldwide Limited 50.0 UKGIIR, Inc 28.2 KoreaMedia Production Properties BV 30.0 NetherlandsSingleton, Ogilvy & Mather (Holdings) Pty Limited 33.3 Australia
The market value of the Group’s shares in its principal listed associate undertakings at31 December 2005 was as follows: Asatsu-DK: £191.1 million, Chime CommunicationsPLC: £15.5 million, High Co S.A.: £27.3 million and GIIR, Inc £34.2 million. The carryingvalue (including goodwill) of these equity interests in the Group’s balance sheet at 31 December 2005 was as follows: Asatsu-DK: £148.7 million, Chime CommunicationsPLC: £14.2 million, High Co S.A.: £18.1 million and GIIR, Inc: £36.0 million. The Group’sinvestments in its principal associate undertakings are represented by ordinary shares.
Summarised financial informationThe following tables present a summary of the aggregate financial performance and netasset position of the Group’s associate undertakings. These have been estimated andconverted, where appropriate, to an IFRS presentation based on information providedby the relevant companies at 31 December 2005.
2005 2004£m £m
Income statementRevenue 1,167.0 1,022.4Operating profit 168.8 157.0Profit before taxation 182.8 162.6Profit for the year 113.8 117.4
2005 2004£m £m
Balance sheetAssets 2,873.1 2,246.4Liabilities (1,476.6) (1,277.7)Net assets 1,396.5 968.7
The application of equity accounting is ordinarily discontinued when the investment isreduced to zero and additional losses are not provided for unless the investor hasguaranteed obligations of the investee or is otherwise committed to provide furtherfinancial support for the investee. In 2005, £nil (prior years £1.1 million) of associatelosses were reversed.
At the end of the year, capital commitments contracted, but not provided for in respectof interests in associates and other investments were £7.5 million (2004: £6.3 million).
17. Deferred taxThe following are the major deferred tax assets recognised by the Group andmovements thereon in 2005 and 2004:
OtherRetirement short-term
Tax benefit temporarylosses obligations Goodwill differences Total
£m £m £m £m £mAt 1 January 2004 45.2 10.0 5.2 28.6 89.0(Charge)/credit to income – (0.9) 10.3 9.4Credit to equity – 4.4 – – 4.4Exchange differences (3.1) – 0.5 – (2.6)At 31 December 2004 42.1 14.4 4.8 38.9 100.2Acquisition of subsidiaries 6.0 – – 24.6 30.6Charge to income – – (2.5) (9.9) (12.4)Credit to equity – 3.6 – 4.1 7.7Exchange differences 4.8 – (0.8) 2.1 6.1Other – (1.1) – (0.8) (1.9)At 31 December 2005 52.9 16.9 1.5 59.0 130.3

Amounts falling due after more than 1 year:2005 2004
£m £mConvertible bonds 534.9 446.2Corporate bonds and bank loans 926.5 872.4
1,461.4 1,318.6
The Group estimates that the fair value of corporate bonds is £1,474 million at31 December 2005. The Group consider that the carrying amount of bank loansapproximates their fair value.
The corporate bonds, convertible bonds, bank loans and overdrafts included withincreditors fall due for repayment as follows:
2005 2004£m £m
Within one year 457.8 597.8Between one and two years 446.2 2.5Between two and three years 463.6 453.3Between three and four years 58.2 510.9Between four and five years – –Over five years 493.4 351.9
1,919.2 1,916.4
24. Provisions for liabilities and chargesThe movements in 2005 and 2004 were as follows:
Property Other Total£m £m £m
1 January 2004 60.1 39.6 99.7Charged to the income statement 0.6 2.7 3.3New acquisitions 12.5 1.8 14.3Utilised (5.2) (9.8) (15.0)Transfers (0.6) (7.8) (8.4)Exchange adjustments (4.7) (2.3) (7.0)31 December 2004 62.7 24.2 86.9Charged to the income statement 3.9 14.3 18.2New acquisitions 16.5 22.3 38.8Utilised (16.3) (13.6) (29.9)Transfers – 9.4 9.4Exchange adjustments 0.9 7.4 8.331 December 2005 67.7 64.0 131.7
Other provisions comprise other liabilities where there is uncertainty about the timing of settlement, but where a reliable estimate can be made of the amount. These includecertain long-term employee benefits and contingent liabilities where the likelihood ofsettlement is considered probable.
The Company and various of its subsidiaries are, from time to time, parties to legalproceedings and claims which arise in the ordinary course of business. The directorsdo not anticipate that the outcome of these proceedings and claims will have a materialadverse effect on the Group’s financial position or on the results of its operations.
25. Share-based paymentsThe Group charged the following amounts to the income statement in 2005 and 2004in relation to share-based incentive plans:
2005 2004£m £m
Stock options 25.9 29.4Other share-based payments 42.7 29.4
68.6 58.8
Further information on stock options is provided in note 28.
Other share-based paymentsThe Group operates a number of equity-settled share incentive schemes, in most casessatisfied by the delivery of stock from one of the Group’s ESOP Trusts. The mostsignificant schemes are as follows:
Renewed Leadership Equity Acquisition Plan (Renewed LEAP)Under Renewed LEAP, the most senior executives of the Group, including certainexecutive directors, commit WPP shares (‘investment shares’) in order to have theopportunity to earn additional WPP shares (‘matching shares’). The number ofmatching shares which a participant can receive at the end of the fixed performanceperiod (five years in the case of the 2005 grant and four years for the 2004 grant) isdependent on the performance (based on the Total Share Owner Return (TSR)) of theCompany over that period against a comparator group of other listed communicationsservices companies. The maximum possible number of matching shares for the 2005award is five shares (2004: four shares) for each investment share.
Long-Term Incentive Plans (LTIP)For 2004 and prior years, senior executives of most Group operating companiesparticipated in their respective company’s long-term incentive plans, based on theachievement of three-year financial performance targets. These plans operated on a rolling three-year basis. The value of payments earned by executives over eachperformance period was typically based on the achievement of targeted improvementsin the following performance measures over the relevant three-year period:(i) average operating profit or profit before taxation;(ii) average operating margin.No grant was made for LTIP schemes in 2005 as a new incentive plan, the PSA, was introduced.
20. Trade receivables within working capital facilityThe following are included in trade receivables within the Group’s working capital facilities:
2005 2004£m £m
Gross trade receivables – 545.7Non-returnable proceeds – (261.0)
– 284.7
The Group had a working capital facility in which certain trade receivables wereassigned as security against the advance of cash. This security was represented by the assignment of a pool of trade receivables to a bankruptcy-remote subsidiary of the Group, with further assignment to the providers of this working capital facility.The financing provided against this pool took into account, inter alia, the risks that mayhave been attached to the individual receivables and the expected collection period.
The working capital facility is required to be presented as a bank borrowing underIAS 32 and IAS 39. As the Group has elected to apply IAS 32 and IAS 39 from1 January 2005 the drawdown on the facility was transferred to debt on this date and the prior period has not been restated. The facility was repaid and cancelled on 31 August 2005.
On termination of the working capital facilities, the Group was not obliged to supportany credit-related losses arising from the assigned receivables against which cash hadbeen advanced. The transaction documents stipulate that, in the event of default inpayment by a debtor, the providers of the facility may only seek repayment of cashadvanced from the remainder of the pool of debts in which they hold an interest and that recourse against the Group is not available.
21. Trade and other payables: amounts falling due within one yearThe following are included in trade and other payables falling due within one year:
2005 2004£m £m
Trade payables 4,659.3 2,885.3Other taxation and social security 161.4 151.4Payments due to vendors (earnout agreements) 81.3 146.6Loan notes due to vendors 13.6 7.2Liabilities in respect of put option agreements with vendors1 50.4 –Other creditors and accruals 1,258.2 919.6Deferred income 604.2 405.8
6,828.4 4,515.9Notes
1 The recognition of liabilities in respect of put options arises from the adoption of IAS 32 and IAS 39. Prioryears have not been restated as permitted by IFRS 1.
The Group considers that the carrying amount of trade and other payablesapproximates their fair value.
22. Trade and other payables: amounts falling due after more than one yearThe following are included in trade and other payables falling due after more than one year:
2005 2004£m £m
Corporate income and other taxes payable 372.8 290.6Payments due to vendors (earnout agreements) 138.7 152.0Liabilities in respect of put option agreements with vendors1 39.6 –Other creditors and accruals 151.9 94.0
703.0 536.6Notes
1 The recognition of liabilities in respect of put options arises from the adoption of IAS 32 and IAS 39. Prioryears have not been restated as permitted by IFRS 1.
The Group considers that the carrying amount of trade and other payablesapproximates their fair value.
The following table sets out payments due to vendors, comprising deferredconsideration and the directors’ best estimates of future earnout related obligations:
2005 2004£m £m
Within one year 81.3 146.6Between one and two years 71.9 65.0Between two and three years 14.7 61.0Between three and four years 20.3 3.4Between four and five years 31.8 21.4Over five years – 1.2
220.0 298.6
23. Bank overdrafts, bonds and bank loansAmounts falling due within one year:
2005 2004£m £m
Bank overdrafts 435.6 333.0Convertible bonds – 150.1Corporate bonds and bank loans 22.2 114.7
457.8 597.8
The Group considers that the carrying amount of overdrafts and short-term borrowingsapproximates their fair value.
Our 2005 financial statements
Annual Report 2005Our 2005 financial statements160

Performance Share Awards (PSA)Grants of stock under PSA are dependent upon annual performance targets, typicallyone or more of: operating profit, profit before taxation and operating margin. Grants aremade in the year following the year of performance measurement, and will vest twoyears after grant provided the individual concerned is continually employed by theGroup throughout this time.
Leaders, Partners and High Potential GroupStock option grants under the executive stock option plan were not significant in 2005 asthe Group made grants of restricted stock (to be satisfied by stock from one of the Group’sESOP trusts) to participants instead. Performance conditions include continuedemployment over the three-year vesting period.
Valuation methodologyFor all of these schemes, the valuation methodology is based upon fair value on grantdate, which is determined by the market price on that date or the application of aBlack-Scholes model, depending upon the characteristics of the scheme concerned.The assumptions underlying the Black-Scholes model are detailed in note 28, includingdetails of assumed dividend yields. Market price on any given day is obtained fromexternal, publicly available sources.
Market/Non-market conditionsMost share-based plans are subject to non-market performance conditions, such as margin or growth targets, as well as continued employment. The Renewed LEAP scheme is subject to a number of performance conditions, including TSR, a market-based condition.
For schemes without market-based performance conditions, the valuation methodologyabove is applied and, at each year end, the relevant accrual for each grant is revised, if appropriate, to take account of any changes in estimate of the likely number ofshares expected to vest.
For schemes with market-based performance conditions, the probability of satisfyingthese conditions is assessed at grant date through a statistical model (such as the‘Monte Carlo Model’) and applied to the fair value. This initial valuation remains fixed throughout the life of the relevant plan, irrespective of the actual outcome in terms of performance.
The following table sets out the number and weighted average fair value of grantsmade in respect of 2005 for each of the schemes described above:
Number of Fair value atshares granted grant date
m Pence per shareSchemeRenewed LEAP1 0.7 574Long-Term Incentive Plan (LTIP)2 n/a n/aPerformance Share Award (PSA)2 4.6 640Leaders, Partners and High Potential Group 2.9 558Notes
1 The number of shares granted in respect of Renewed LEAP represents the ‘investment shares’committed by participants at grant date. The actual number of shares that will vest is dependent on the extent to which the relevant performance criteria are satisfied.
2 The PSA grant in respect of 2005 took place in February 2006.
26. Provision for post-employment benefitsCompanies within the Group operate a large number of pension schemes, the formsand benefits of which vary with conditions and practices in the countries concerned.The Group’s pension costs are analysed as follows:
2005 2004£m £m
Defined contribution schemes 59.3 52.4Defined benefit schemes charge to operating profit 16.3 12.0Pension costs (note 5) 75.6 64.4Expected return on pension scheme assets (note 7) (24.2) (21.3)Interest on pension scheme liabilities (note 7) 32.0 30.8
83.4 73.9
Defined benefit schemesThe pension costs are assessed in accordance with the advice of local independentqualified actuaries. The latest full actuarial valuations for the various schemes werecarried out as at various dates in the last three years. These valuations have beenupdated by the local independent qualified actuaries to 31 December 2005.
The Group has a policy of closing defined benefit schemes to new members which has been effected in respect of a significant number of the schemes. As a result, these schemes generally have an ageing membership population. In accordance with IAS 19, the actuarial calculations have been carried out using the Projected Unit Method. In these circumstances, use of this method implies that the contributionrate implicit in the current service cost will increase in future years.
Contributions to funded schemes are determined in line with local conditions and practices.Certain contributions in respect of unfunded schemes are paid as they fall due. The totalcontributions (for funded schemes) and benefit payments (for unfunded schemes) paid for 2005 amounted to £35.6 million (2004: £36.0 million).
(a) AssumptionsThe main weighted average assumptions used for the actuarial valuations at31 December are shown in the following table:
2005 2004 2003% pa % pa % pa
North AmericaDiscount rate 5.5 5.7 6.3Rate of increase in salaries 4.0 4.0 3.2Inflation 2.5 3.0 3.0Expected rate of return on equities 7.9 7.9 8.2Expected rate of return on bonds1 4.7 4.8 4.8Expected rate of return on cash 3.0 1.8 3.1Weighted average return on assets 6.7 6.9 7.0UKDiscount rate 4.7 5.3 5.5Rate of increase in salaries 4.3 4.3 3.6Rate of increase in pensions in payment 3.8 3.8 3.8Inflation 2.8 2.8 2.8Expected rate of return on equities 7.3 7.5 7.5Expected rate of return on bonds1 4.5 5.0 5.0Expected rate of return on insured annuities 4.7 5.3 5.5Expected rate of return on property 7.0 7.0 7.0Expected rate of return on cash 4.3 3.0 3.0Weighted average return on assets 5.2 5.7 5.8Continental EuropeDiscount rate 4.2 4.5 5.3Rate of increase in salaries 2.9 3.1 3.2Rate of increase in pensions in payment 1.6 1.7 1.7Inflation 2.0 2.0 2.0Expected rate of return on equities 6.7 7.0 7.5Expected rate of return on bonds1 4.3 4.5 5.0Expected rate of return on property 6.2 6.4 7.0Expected rate of return on cash 2.5 2.6 3.0Weighted average return on assets 5.4 5.5 5.9Asia Pacific, Latin America, Africa & Middle EastDiscount rate 3.5 3.1 2.8Rate of increase in salaries 3.6 3.1 2.7Inflation 2.0 1.5 1.6Expected rate of return on bonds1 3.2 3.1 2.6Expected rate of return on property 11.0 10.0 10.0Expected rate of return on cash 7.5 7.3 7.3Weighted average return on assets 3.3 3.1 2.7Notes
1 Expected rate of return on bonds assumptions reflect the yield expected on actual bonds held,whereas the discount rate assumptions are based on high-quality bond yields.
(b) Assets and liabilitiesAt 31 December, the fair value of the assets in the schemes, and the assessed presentvalue of the liabilities in the schemes are shown in the following table:
2005 2004£m % £m %
GroupEquities 164.2 36.2 148.8 37.9Bonds 191.1 42.2 157.7 40.1Insured annuities 73.2 16.1 66.8 17.0Property 17.5 3.9 14.8 3.8Cash 7.2 1.6 4.8 1.2Total fair value of assets 453.2 100.0 392.9 100.0Present value of scheme liabilities (684.6) (595.2)Deficit in the schemes (231.4) (202.3)
Deficit in schemes by regionNorth America (117.6) (102.9)UK (54.4) (54.6)Continental Europe (55.1) (41.3)Asia Pacific, Latin America, Africa & Middle East (4.3) (3.5)Deficit in the schemes (231.4) (202.3)
Some of the Group’s defined benefit schemes are unfunded (or largely unfunded) by common custom and practice in certain jurisdictions. In the case of these unfundedschemes, the benefit payments are made as and when they fall due. Pre-funding ofthese schemes would not be typical business practice.
Expected employer contributions and benefit payments in 2006 are £35.7 million and£31.5 million, respectively.
Our 2005 financial statements
Annual Report 2005Our 2005 financial statements 161

2005 2004£m £m
GroupCurrent service cost 17.9 11.8Past service (income)/cost (1.4) 0.1(Gain)/loss on settlements and curtailments (0.2) 0.1Charge to operating profit 16.3 12.0Expected return on pension scheme assets (24.2) (21.3)Interest on pension scheme liabilities 32.0 30.8Charge to profit before taxation for defined benefit schemes 24.1 21.5
Gain on pension scheme assets relative to expected return 22.4 13.5Experience gains arising on the scheme liabilities 3.6 1.2Changes in assumptions underlying the present value of the scheme liabilities (31.3) (40.3)Movement in exchange rates (10.9) 7.4Actuarial loss recognised in SORIE (16.2) (18.2)
As at 31 December 2005 the cumulative amount of actuarial losses recognised in equitysince 1 January 2001 was £116.5 million (31 December 2004: £100.0 million). Of thisamount, £34.7 million was recognised since the 1 January 2004 adoption of IAS 19.
In accordance with IAS 19 certain other long-term employee benefits should bemeasured in the same manner as a defined benefit plan. For the period ended 31 December 2005 the adjustment to the SORIE for such plans is £0.3 million.
(d) Movement in scheme obligationsThe following table shows an analysis of the movement in the scheme obligations foreach accounting period:
2005 2004£m £m
Change in benefit obligationBenefit obligation at beginning of year 595.2 547.0Service cost 17.9 11.8Interest cost 32.0 30.8Plan participants’ contributions 0.6 0.7Actuarial loss 27.7 39.1Benefits paid (38.4) (27.5)Loss/(gain) due to exchange rate movements 25.6 (15.7)Plan amendments (1.4) 0.1Acquisitions 14.2 11.1Reclassification 11.4 n/aSettlements (0.2) (2.2)Benefit obligation at end of year 684.6 595.2
The reclassifications represent certain of the Group’s benefit plans which are includedin this footnote for the first time in 2005.
(e) Movement in scheme assetsThe following table shows an analysis of the movement in the scheme assets for eachaccounting period:
2005 2004£m £m
Change in plan assetsFair value of plan assets at beginning of year 392.9 348.1Actual return on plan assets 46.6 34.8Employer contributions 35.6 36.0Plan participants’ contributions 0.6 0.7Benefits paid (38.4) (27.5)Gain/(loss) due to exchange rate movements 14.7 (8.4)Acquisitions 1.2 11.4Settlements – (2.2)Fair value of plan assets at end of year 453.2 392.9
(f) History of experience gains and losses2005 2004
£m £mGain on pension scheme assets relative to expected return:Amount 22.4 13.5Percentage of scheme assets 4.9% 3.4%Experience gains arising on the scheme liabilities:Amount 3.6 1.2Percentage of the present value of the scheme liabilities 0.5% 0.2%Total loss recognised in SORIE:Amount (16.2) (18.2)Percentage of the present value of the scheme liabilities (2.4%) (3.1%)
The following table shows the split of the deficit at 31 December 2005 and 2004between funded and unfunded schemes. The deficit in the unfunded schemes in 2005includes £13 million related to acquired plans. The average period over which theunderfunding would typically be payable (working lifetimes for schemes with activemembers or lifetimes for schemes with predominantly retired members) is also shownin the table.
2005 20042005 Funding 2004 Funding
Deficit period Deficit period£m years £m years
Funded schemes by regionNorth America 43.8 8.1 48.5 7.7UK 54.4 9.2 54.6 10.1Continental Europe 2.4 13.8 5.5 13.4Asia Pacific, Latin America, Africa & Middle East 2.4 13.6 2.6 13.1Deficit in the funded schemes 103.0 9.0 111.2 9.3
Unfunded schemes by regionNorth America 73.8 13.6 54.3 13.0UK – – – –Continental Europe 52.7 9.3 35.8 9.4Asia Pacific, Latin America, Africa & Middle East 1.9 17.2 1.0 17.4Deficit in the unfunded schemes 128.4 12.0 91.1 11.6
For the Group’s plans, the plans’ assets are invested with the objective of being able to meet current and future benefit payment needs, while controlling balance sheet volatility and future contributions. Plan assets are invested with a number ofinvestment managers, and assets are diversified among equities, bonds, insuredannuities, property and cash or other liquid investments. The primary use of bonds as an investment class is to match the anticipated cash flows from the plans to paypensions. Various insurance policies have also been bought historically to provide a more exact match for the cash flows, including a match for the actual mortality ofspecific plan members. These insurance policies effectively provide protection againstboth investment fluctuations and longevity risks. The strategic target allocation variesamong the individual schemes. The 2006 weighted-average target allocations areshown below:
2006 Weighted-AverageTarget Allocation
Equities 38.7%Bonds and insured annuities 55.0%Property/cash 6.3%
Establishing the expected long-term rates of investment return on pension assets is a judgemental matter. Management considers the types of investment classes inwhich our pension plan assets are invested and the expected compound return we can reasonably expect the portfolio to earn over time, which reflects forward-lookingeconomic assumptions.
Management reviews the expected long-term rates of return on an annual basis andrevises them as appropriate. Regarding mortality assumptions, in the UK, mortality ratesare calculated using the PA92 table, the main UK mortality table, projected to 2020 forcurrent active and deferred vested members, and to 2005 for current pensioners. Inthe US, mortality rates are principally calculated using the RP 2000 table, commonlyused in the US, projected for 10 years to build in an allowance for future improvementsin life expectancy. Also, we periodically commission detailed asset and liability studiesperformed by third-party professional investment advisors and actuaries, whichgenerate probability-adjusted expected future returns on those assets. These studiesalso project our estimated future pension payments and evaluate the efficiency of theallocation of our pension plan assets into various investment categories.
The studies performed at the time we set these assumptions supported thereasonableness of our return assumptions based on the target allocation of investmentclasses and the then current market conditions.
(c) Pension expenseThe following table shows the breakdown of the pension expense between amountscharged to operating profit, amounts charged to finance income and finance costs andamounts recognised in the statement of recognised income and expense (SORIE):
Our 2005 financial statements
Annual Report 2005Our 2005 financial statements162

27. Derivative financial instruments
Risk management policiesForeign currencyThe Group’s results in pounds sterling are subject to fluctuation as a result of exchangerate movements. The Group does not hedge this translation exposure to its earningsbut does hedge the currency element of its net assets using foreign currencyborrowings, cross-currency swaps and forward foreign exchange contracts.
Interest rate riskThe Group is exposed to interest rate risk on both interest bearing assets and interestbearing liabilities. The Group has a policy of actively managing its interest rate riskexposure while recognising that fixing rates on all its debt eliminates the possibility ofbenefiting from rate reductions and similarly, having all its debt at floating rates undulyexposes the Group to increases in rates.
Liquidity riskThe Group actively maintains a mixture of long-term and short-term committed facilitiesthat are designed to ensure the Group has sufficient available funds to meet currentand forecast financial requirements as cost effectively as possible. As at 31 December2005 the Group has a committed credit facility of £931 million which was undrawn.
Credit riskThe Group’s principal financial assets are bank balances and cash, trade and otherreceivables and investments, which represent the Group’s maximum exposure to creditrisk in relation to financial assets.
The Group’s credit risk is primarily attributable to its trade receivables. The amountspresented in the balance sheet are net of allowances for doubtful receivables,estimated by the Group’s management based on prior experience and theirassessment of the current economic environment.
The credit risk on liquid funds and derivative financial instruments is limited because the counterparties are banks with high credit-ratings assigned by international credit-rating agencies.
A relatively small number of clients contribute a significant percentage of the Group’sconsolidated revenues. The Group’s clients generally are able to reduce advertising and marketing spending or cancel projects at any time for any reason. There can be no assurance that any of the Group’s clients will continue to utilise the Group’s services tothe same extent, or at all, in the future. A significant reduction in advertising and marketingspending by, or the loss of one or more of, the Group’s largest clients, if not replaced bynew client accounts or an increase in business from existing clients, would adverselyaffect the Group’s prospects, business, financial condition and results of operations.
Currency derivativesThe Group utilises currency derivatives to hedge significant future transactions andcash flows. The Group is a party to a variety of foreign currency forward contracts in the management of its exchange rate exposures. The instruments purchased are primarily denominated in the currencies of the Group’s principal markets.
At the balance sheet date, the total notional amount of outstanding forward foreignexchange contracts designated under IAS 32 and IAS 39 are as below:
2005£m
Forward foreign currency contracts 188.2
These arrangements are designed to address significant exchange exposures for the first half of 2006, and are renewed on a revolving basis as required.
At 31 December 2005, the fair value of the Group’s currency derivatives is estimated to be a net liability of approximately £9.3 million. These amounts are based on marketvalues of equivalent instruments at the balance sheet date, comprising £5.7 millionassets included in trade and other receivables and £15.0 million liabilities included intrade and other payables. The fair value movement of currency derivatives during theyear that are designated and effective as net investment hedges amounts to £7.7 millionand has been charged to and deferred in equity.
Changes in the fair value relating to the ineffective portion of the currency derivativesamounted to £4.4 million and has been charged to expense for the year.
The Group currently designates its foreign currency denominated debt and crosscurrency swaps as hedging instruments against the currency risk associated with thetranslation of its foreign operations.
Interest rate swapsThe Group uses interest rate swaps as hedging instruments in fair value hedges tomanage its exposure to interest rate movements on its borrowings. Contracts withnominal values of 1400 million have fixed interest receipts at 6.00% up until June 2008and have floating interest payments averaging EURIBOR plus 2.185%.
The fair value of swaps entered into at 31 December 2005 is estimated to be a liability of£13.1 million. These amounts are based on market values of equivalent instruments atthe balance sheet date. All of these interest rate swaps are designated and effective asfair value hedges and the fair value movement thereon have been recognised in theincome statement.
In 2005 the Group terminated interest rate swaps for proceeds of £7.4 million.
2004 UK GAAP disclosuresThe accounting policy under UK GAAP for the year ended 31 December 2004 wasas follows:
For a forward foreign exchange contract to be treated as a hedge the instrument mustbe related to actual foreign currency assets or liabilities or to a probable commitment. It must involve the same currency or similar currencies as the hedged item and mustalso reduce the risk of foreign currency exchange movements on the Group’s operations.Gains and losses arising on these contracts are deferred and recognised in the profitand loss account or as adjustments to the carrying amount of fixed assets, only whenthe hedged transaction has itself been reflected in the Group’s financial statements.
For an interest rate swap to be treated as a hedge the instrument must be related toactual assets or liabilities or a probable commitment and must change the nature of the interest rate by converting a fixed rate to a variable rate or vice versa. Interestdifferentials under these swaps are recognised by adjusting net interest payable overthe periods of the contracts.
The following disclosures are in compliance with FRS 13 (Derivatives and other financialinstruments: disclosures) as applied by the Group under UK GAAP for 2004. Financialassets and financial liabilities are defined differently under IFRS and UK GAAP and assuch the amounts included in these captions below are not directly comparable tosimilar captions elsewhere in these accounts.
Derivative financial instrumentsThe fair value of derivatives, based on the amount that would be receivable or payable if the Group had sought to enter into such transactions, based on quoted marketprices where possible, was as follows:
31 Dec 2004Swaps
£mFair value 15.7Book value (2.0)
The book value above represents net accrued interest and the foreign translationdifference on the principal amounts.
The Group’s policy is to hedge the following exposures: interest rate risk – usinginterest rate swaps, caps and collars; currency swaps; and forward foreign currencycontracts; structural and transactional currency exposures, and currency exposures onfuture expected sales – using currency swaps and forward foreign currency contracts.
Gains and losses on instruments used for hedging are not recognised until theexposure that is being hedged is itself recognised. Unrecognised gains and losses oninstruments used for hedging, and the movements therein, are as follows:
Total Gains Losses net gains
£m £m £mUnrecognised gains and losses on hedges at 1 January 2004 34.4 (3.1) 31.3Gains and losses arising in previous years that were recognised in 2004 (3.4) – (3.4)Gains and losses arising in previous years that were not recognised in 2004 31.0 (3.1) 27.9Gains and losses arising in 2004 that were not recognised in 2004 2.0 – 2.0Unrecognised gains and losses on hedges at 31 December 2004 33.0 (3.1) 29.9Gains and losses expected to be recognised in 2005 5.0 – 5.0Gains and losses expected to be recognised in 2006 or later 28.0 (3.1) 24.9
The fair value of the above swaps has been obtained from a market data source.
Non-derivative financial instrumentsThe Group estimates that the aggregate fair value of non-derivative financialinstruments at 31 December 2004 does not differ materially from their aggregatecarrying values recorded in the consolidated balance sheet.
The Group has used the methods and assumptions detailed below to estimate the fairvalues of the Group’s financial instruments.
Cash, accounts receivable, accounts payable, overdrafts and short-term borrowings(including those drawn under the Revolving Credit Facilities) are considered toapproximate fair value because of the short maturity of such instruments.
The fair value of our $950 million bonds, 1650 million Eurobonds, $287.5 millionconvertible bonds and £450 million convertible bonds at 31 December 2004 was£1,616 million. This is calculated by reference to market prices at 31 December 2004.Considerable judgement is required in interpreting market data to develop theestimates of fair value, and, accordingly, the estimates are not necessarily indicative of the amounts that could be realised in a current market exchange.
Our 2005 financial statements
Annual Report 2005Our 2005 financial statements 163

Share optionsWPP Executive Share Option SchemeAs at 31 December 2005, unexercised options over ordinary shares of 21,584,961and unexercised options over ADRs of 8,155,501 have been granted under the WPP Executive Share Option Scheme as follows:
Number of ordinary Exercise price Exerciseshares under option per share (£) dates
176,990 1.269 2000-2006608,015 2.040 2000-2007347,299 2.140 1999-2006734,260 2.335 1999-2006
6,037 2.535 2000-20071,113,935 2.835 2000-20071,371,156 2.930 2001-2008
5,022 3.030 2001-200825,550 3.270 2001-200859,350 3.763 2006-201329,500 4.136 2000-200819,160 4.210 2005-2006
3,169,595 4.210 2005-201272,812 4.210 2005-201361,316 4.210 2006-2012
127,877 4.438 2005-201241,170 4.615 2006-201351,247 4.615 2007-2013
104,375 4.705 2000-20082,210,910 4.865 2004-2011
35,064 4.865 2005-201161,668 5.185 2002-2009
2,000,000 5.490 2007-201427,288 5.520 2008-201431,411 5.535 2007-2008
3,004,836 5.535 2007-20146,124 5.535 2007-2015
38,524 5.535 2008-20142,848,316 5.595 2006-2013
22,501 5.595 2006-201440,334 5.595 2007-201323,772 5.595 2006-2007
429,018 5.700 2002-200929,511 5.725 2007-201430,145 5.817 2008-201536,565 5.895 2008-20156,705 5.895 2009-2015
52,271 6.105 2008-2015590,764 6.163 2000-2009
7,005 6.280 2004-201141,750 6.328 2000-2009
417,228 7.052 2000-201064,165 7.180 2005-201241,291 7.550 2005-2006
572,936 7.550 2005-20124,302 7.550 2006-2012
10,437 7.569 2000-200973,250 8.110 2004-20112,985 8.110 2005-2011
45,634 8.193 2004-201116,700 8.769 2000-201010,438 8.996 2000-2010
580,528 9.010 2003-201011,575 9.010 2004-201034,344 10.770 2003-2010
28. Authorised and issued share capitalEquity Nominal Preference Nominal
ordinary value shares of valueshares £m £1 each £m
AuthorisedAt 1 January 2005 – WPP 2005 Limited (formerly WPP Group plc) 1,750,000,000 175.0 – –At 31 December 2005 – WPP Group plc (formerly WPP 2005 plc) 1,750,000,000 175.0 – –
Issued and fully paidAt 1 January 2005 1,185,338,038 118.5 – –Exercise of share options 8,664,925 0.9 – –Share cancellations (16,625,000) (1.6) – –Acquisitions 77,994,666 7.8 – –Other 1,277,411 0.1 – –At 24 October 2005 – shares in WPP 2005 Limited of 10p each 1,256,650,040 125.7 – –
On formation of WPP 2005 plc 2 – 50,000 –Group reconstruction – shares in WPP 2005 Limited exchanged for shares in WPP Group plcof 475p each 1,256,650,040 5,969.1 – –Capital reduction to 10p per ordinary share – (5,843.4) – –Redemption/cancellation of shares (2) – (50,000) –
1,256,650,040 125.7 – –Exercise of share options 949,332 0.1 – –Share cancellations (4,700,000) (0.5) – –At 31 December 2005 1,252,899,372 125.3 – –
On 25 October 2005 under a scheme of arrangement between WPP 2005 Limited(formerly WPP Group plc), the former holding company of the Group, and itsshareholders under Section 425 of the Companies Act 1985, and as sanctioned by the High Court, all the issued shares in that company were cancelled and the samenumber of new shares were issued to WPP Group plc in consideration for the allotmentto shareholders of one ordinary share in WPP Group plc for each ordinary share inWPP 2005 Limited held on the record date, 24 September 2005. In the above tablethe figures up to 24 October 2005 relate to shares in WPP 2005 Limited. Subsequentmovements relate to shares in WPP Group plc.
WPP Group plc was incorporated on 16 August 2005, under the name WPP 2005 plc,with an authorised share capital of £8,312,550,000 and issued shares as follows:– two ordinary shares of 475 pence; and– 50,000 redeemable preference shares of £1 were issued to WPP Group (Nominees)
Limited.
On 25 October 2005 as part of the scheme of arrangement noted above, a further1,256,650,040 ordinary shares of 475 pence were issued, whereby WPP Group plcwas interposed as the new holding company of the WPP Group. As required bySection 131 of the Companies Act 1985 (Merger Relief), no share premium wasrecognised. Subsequently, the entire issued redeemable preference share capital was redeemed at par, and the two ordinary shares cancelled.
On 27 October 2005 the share capital of WPP Group plc was reduced by reducing thenominal value of the ordinary shares from 475 pence to 10 pence as sanctioned by theHigh Court. As a result £5,843.4 million was added to retained earnings for both WPPGroup plc and the Group. For the Company this amount is distributable.
Our 2005 financial statements
Annual Report 2005Our 2005 financial statements164

Number of ADRs Exercise price Exerciseunder option per ADR ($) dates
90,768 9.186 2000-200620,514 9.186 2000-2007
575,976 14.767 2000-2007120,741 30.080 2006-201333,244 30.080 2007-2013
1,466,722 33.200 2005-201259,455 34.057 2000-20082,881 34.702 2005-20128,644 34.702 2007-2012
1,182,950 35.380 2004-201115,991 37.520 2006-2013
290,665 44.610 2000-2009324,478 46.475 2002-200948,698 46.556 2000-2009
1,245,783 47.410 2006-201311,481 48.204 2000-20101,548 48.450 2007-20144,175 50.299 2000-2010
26,038 50.670 2008-20151,232,433 50.800 2007-2014
383,574 51.048 2000-201042,221 51.220 2007-20146,524 52.400 2008-2015
37,370 53.030 2005-201225,050 53.443 2000-200986,005 54.042 2000-2009
292,652 54.050 2005-201218,439 54.230 2008-20155,039 54.570 2008-20158,350 55.314 2000-2009
16,600 55.740 2007-201433,400 56.287 2000-200940,783 57.020 2008-20156,976 57.338 2003-2010
30,070 58.238 2004-201117,040 58.886 2004-20113,007 59.656 2000-20106,263 60.479 2000-2010
60,899 62.110 2003-20102,415 62.110 2005-2010
244,105 63.263 2003-20102,923 63.773 2000-20101,670 71.781 2000-20101,587 72.605 2000-2010
16,849 84.485 2003-20102,505 84.731 2000-2010
WPP Worldwide Share Ownership ProgramAs at 31 December 2005, unexercised options over ordinary shares of 6,571,448 andunexercised options over ADRs of 873,035 have been granted under the WPPWorldwide Share Ownership Program as follows:
Number of ordinary Exercise price Exerciseshares under option per share (£) dates
53,550 2.695 2000-2007167,825 3.400 2001-200863,000 3.903 2006-2007
1,560,150 3.903 2006-201325,400 3.903 2007-201354,975 4.210 2005-201211,375 4.210 2005-20139,500 5.210 2004-2011
290,150 5.315 2002-20097,500 5.315 2003-2009
50,125 5.435 2007-20085,875 5.435 2007-2011
1,198,623 5.435 2007-201418,125 5.435 2008-201415,000 5.775 2008-201514,250 5.990 2004-20116,500 6.195 2008-2012
1,468,075 6.195 2008-201511,000 6.195 2009-201529,250 7.180 2005-2006
559,725 7.180 2005-201212,500 7.180 2006-2012
512,400 7.790 2003-20107,500 7.790 2004-2010
410,075 7.960 2004-20119,000 7.960 2005-2011
Number of ADRs Exercise price Exerciseunder option per ADR ($) dates
245,710 30.800 2006-2013198,120 49.880 2007-2014108,445 53.030 2005-201290,120 56.480 2004-2011
230,640 59.520 2008-2015
Tempus Group plc 1998 Long Term Incentive PlanAs at 31 December 2005, unexercised options over ordinary shares of 409,293 havebeen granted under the Tempus Group plc 1998 Long Term Incentive Plan as follows:
Number of ordinary Exercise price Exerciseshares under option per share (£) dates
243,063 2.260 2001-200856,713 4.920 2001-201112,147 4.930 2001-201140,505 4.970 2001-20092,023 4.980 2001-2009
20,254 5.580 2001-201134,588 6.000 2001-2010
The Grey Global Group, Inc. 1994 Stock Incentive PlanAs at 31 December 2005, unexercised options over ordinary shares of 288,136 andunexercised options over ADRs of 444,234 have been granted under the Grey GlobalGroup, Inc. 1994 Stock Incentive Plan as follows:
Number of ordinary Exercise price Exerciseshares under option per share (£) dates
21,746 1.128 2005-200654,365 1.499 2005-200932,619 1.598 2005-200816,311 2.042 2005-2010
108,730 3.139 2005-201154,365 3.499 2005-2014
Our 2005 financial statements
Annual Report 2005Our 2005 financial statements 165

Our 2005 financial statements
Annual Report 2005Our 2005 financial statements166
Number of ADRs Exercise price Exerciseunder option per ADR ($) dates
2,892 8.990 2005-200620,660 10.810 2005-200678,589 14.370 2005-200928,226 15.290 2005-20081,609 15.500 2005-20091,457 18.530 2005-2010
88,202 19.540 2005-20102,892 24.900 2005-20107,263 26.420 2005-20102,175 26.990 2005-20112,914 27.290 2005-20112,175 27.960 2005-20117,089 28.210 2005-20135,437 28.300 2005-20124,545 29.410 2005-2011
10,569 30.270 2005-201320,660 30.830 2005-201244,211 31.220 2005-20126,371 31.420 2005-2012
32,619 31.750 2005-20146,264 31.940 2005-20144,350 32.290 2005-2012
10,874 33.500 2005-201421,745 34.120 2005-20146,525 34.740 2005-2013
17,396 36.110 2005-20146,525 41.160 2005-2014
The aggregate status of the WPP Share Option Schemes during 2005 was as follows:
Movement on options granted (represented in ordinary shares)1 January 31 December
2005 Granted Exercised Lapsed 2005number number number number number
WPP 70,273,273 3,550,811 (3,299,169) (7,512,353) 63,012,562Y&R 14,333,866 – (3,298,020) (749,319) 10,286,527Tempus 417,394 – (8,101) – 409,293Grey – 5,869,8251 (3,183,071) (177,448) 2,509,306
85,024,533 9,420,636 (9,788,361) (8,439,120) 76,217,688Notes
1 Granted as consideration for the acquisition of Grey
Options outstanding over ordinary sharesRange of Weighted average Weighted average
exercise prices exercise price contractual life£ £ Months
1.128-10.770 5.008 84
Options outstanding over ADRsRange of Weighted average Weighted average
exercise prices exercise price contractual life$ $ Months
8.990-84.731 41.430 86
The weighted average fair value of options granted in the year calculated using theBlack-Scholes model, was as follows:
2005 2004Fair value of UK options (shares) 209.3p 205.5pFair value of US options (ADRs) $18.42 $18.38Weighted average assumptions:
UK Risk-free interest rate 4.77% 4.27%US Risk-free interest rate 4.06% 3.16%Expected life (months) 48 48Expected volatility 40% 45%Dividend yield 1.4% 1.0%
Options are issued at an exercise price equal to market value on the date of grant.
The weighted average share price of the Group for the year ended 31 December 2005was £5.88 (2004: £5.55) and the weighted average ADR price for the same period was$53.24 (2004: $50.93).
Expected volatility is sourced from external market data and represents the historicvolatility in the Group’s share price over a period equivalent to the expected option life.
Terms of share option plansThe Worldwide Share Ownership Program is open for participation to employees withat least two years’ employment in the Group. It is not available to those participating in other share-based incentive programs or to executive directors. The vesting periodfor each grant is three years and there are no performance conditions other thancontinued employment with the Group.
The Executive Stock Option Plan has historically been open for participation to WPPGroup Leaders, Partners and High Potential Group. It is not currently offered to parentcompany executive directors. The vesting period is three years and performanceconditions include achievement of various TSR (Total Share Owner Return) and EPS(Earnings per Share) objectives, as well as continued employment. In 2005, the Groupmoved away from the issuance of stock options for Leaders, Partners and HighPotential Group and instead largely made grants of restricted stock (note 25).
The Group grants stock options with a life of ten years, including the vesting period.The terms of stock options with performance conditions are such that if, after nineyears and eight months, the performance conditions have not been met, then thestock option will vest automatically.

Our 2005 financial statements
Annual Report 2005Our 2005 financial statements 167
29. Equity share owners’ fundsMovements during the year were as follows:
Ordinary Shareshare premium Shares to Merger Other Own1 Retained
capital account be issued reserve reserves Shares earnings Total£m £m £m £m £m £m £m £m
Balance at 1 January 2004 118.7 955.3 130.0 2,921.0 2.1 (307.8) (829.1) 2,990.2Ordinary shares issued 1.1 46.9 (23.1) 10.2 – – (2.3)2 32.8Share issue/cancellation costs – – – (0.3) – – (0.5) (0.8)Share cancellations (1.3) – – – 1.3 – (73.6) (73.6)Exchange adjustments on foreign currency net investments – – – – (102.7) – – (102.7)Net profit for the year – – – – – – 273.0 273.0Dividends paid – – – – – – (81.6) (81.6)Non-cash share-based incentive plans (including stock options) – – – – – – 58.8 58.8Tax benefit of share-based payments – – – – 8.7 – – 8.7Net disposal of own shares by ESOP Trusts – – – – – 30.1 (45.0) (14.9)Actuarial loss on defined benefit schemes – – – – – – (18.2) (18.2)Deferred tax on defined benefit pension schemes – – – – – – 3.3 3.3Transfer to goodwill – – (57.0) (10.3) – – – (67.3)Other movements – – – – – – 3.4 3.4Balance at 31 December 2004 118.5 1,002.2 49.9 2,920.6 (90.6) (277.7) (711.8) 3,011.1Impact of adoption of IAS 32 and IAS 39 on 1 January 20053 – – – – 30.8 – (92.9) (62.1)Reclassification due to Group reconstruction 5,843.4 (1,037.9) – (4,800.5) (5.0) – – –Capital reduction to 10p per ordinary share (5,843.4) – – – – – 5,843.4 –Ordinary shares issued in respect of acquisitions 7.8 0.7 19.7 478.2 – – – 506.4Other ordinary shares issued 1.2 37.3 (32.4) 21.8 – – (9.6)2 18.3Share issue/cancellation costs – (0.2) – (3.2) – – (0.2) (3.6)Share cancellations (2.1) – – – 2.1 – (123.3) (123.3)Exchange adjustments on foreign currency net investments – – – – 266.1 – – 266.1Net profit for the year – – – – – – 363.9 363.9Dividends paid – – – – – – (100.2) (100.2)Non-cash share-based incentive plans (including stock options) – – – – – – 68.6 68.6Tax benefit of share-based payments – – – – – – 12.9 12.9Net disposal of own shares by ESOP Trusts – – – – – (15.2) (13.8) (29.0)Actuarial loss on defined benefit schemes – – – – – – (16.5) (16.5)Deferred tax on defined benefit pension schemes – – – – – – 3.6 3.6Transfer to goodwill (0.1) – – (5.0) – – – (5.1)Revaluation of other investments – – – – 21.0 – – 21.0Recognition of financial instruments during the year – – – – (27.6) – – (27.6)Reclassification of equity component of convertible bond redeemed during the year – – – – (29.5) – 29.5 –Balance at 31 December 2005 125.3 2.1 37.2 (1,388.1) 167.3 (292.9) 5,253.6 3,904.5
Other reserves comprise the following:Capital Total
Equity Hedging Revaluation redemption Translation otherreserve reserve reserve reserve reserve reserves
£m £m £m £m £m £mBalance at 1 January 2004 – – – 2.1 – 2.1Share cancellations – – – 1.3 – 1.3Exchange adjustments on foreign currency net investments – – – – (102.7) (102.7)Tax benefit of share-based payments 8.7 – – – – 8.7Balance at 31 December 2004 8.7 – – 3.4 (102.7) (90.6)1 January 2005 IAS 32 and IAS 39 adjustments:
Recognition of equity component of convertible bonds 88.6 – – – – 88.6Recognition of additional financial liabilities required by IAS 39 (including put options) (56.6) (11.7) – – 10.5 (57.8)
Impact of adoption of IAS 32 and IAS 39 on 1 January 2005 32.0 (11.7) – – 10.5 30.8Reclassification due to Group reconstruction – – – (5.0) – (5.0)Share cancellations – – – 2.1 – 2.1Exchange adjustments on foreign currency net investments – – – – 266.1 266.1Revaluation of other investments – – 21.0 – – 21.0Recognition of financial instruments during the year (27.6) – – – – (27.6)Reclassification of equity component of convertible bond redeemed during the year (29.5) – – – – (29.5)Balance at 31 December 2005 (16.4) (11.7) 21.0 0.5 173.9 167.3Notes
1 The Company’s holdings of own shares are stated at cost and represent purchases by the Employee Share Ownership Plan (‘ESOP’) trusts of shares in WPP Group plc for the purpose of funding certain of the Group’s long-term incentive plan liabilities, details of which are disclosed in the Compensation committee report on pages 116 to 131.
The trustees of the ESOP purchase the Company’s ordinary shares in the open market using funds provided by the Company. The Company also has an obligation to make regular contributions to the ESOP to enable it to meet its administrative costs.
The number and market value of the ordinary shares of the Company held by the ESOP at 31 December 2005 was 53,297,356 (2004: 51,657,256) and £335.2 million (2004: £296.0 million) respectively.2 Represents the difference between the legal share capital and premium, recorded on the issue of new shares to satisfy option exercises, and the cash proceeds received on exercise.3 The impact of IAS 32 and IAS 39 on equity share owners’ funds at 1 January 2005 is analysed further on page 176.

Our 2005 financial statements
Annual Report 2005Our 2005 financial statements168
Reconciliation of movements in consolidated equity share owners’ funds for the yearended 31 December 2005:
2005 2004£m £m
Net profit for the year 363.9 273.0Dividends paid (100.2) (81.6)
263.7 191.4Non-cash share-based incentive plans (including stock options) 68.6 58.8Exchange adjustments on foreign currency net investments 266.1 (102.7)Ordinary shares issued in respect of acquisitions 506.4 –Share issue/cancellation costs (3.6) (0.8)Other ordinary shares issued 18.3 32.8Share cancellations (123.3) (73.6)Actuarial loss on defined benefit schemes (16.5) (18.2)Deferred tax on defined benefit pension schemes 3.6 3.3Net disposal of own shares by ESOP Trusts (29.0) (14.9)Transfer to goodwill (5.1) (67.3)Tax benefit of share-based payments 12.9 8.7Revaluation of other investments 21.0 –Recognition of financial instruments during the year (27.6) –Other movements – 3.4Net additions to equity share owners’ funds 955.5 20.9Opening equity share owners’ funds 3,011.1 2,990.2Impact of adoption of IAS 32 and IAS 39 on 1 January 2005 (62.1) –Closing equity share owners’ funds 3,904.5 3,011.1
30. AcquisitionsAcquisition of Grey Global Group, IncOn 7 March 2005 the Company finalised its acquisition of Grey Global Group, Inc(Grey). The following table sets out the book values of the identifiable assets andliabilities acquired and their fair value to the Group:
Book Account- Fair valuevalue at ing policy adjust- Fair value
acquisition alignments ments to Group£m £m £m £m
Intangible assets 0.3 (0.2) 319.2 319.3Property, plant and equipment 68.3 (5.8)(i) (0.7) 61.8Interests in associates and other investments 13.4 5.0(ii) 0.8 19.2Current assets 1,170.8 – (3.1) 1,167.7Total assets 1,252.8 (1.0) 316.2 1,568.0Current liabilities (1,067.7) (4.2) (65.2) (1,137.1)Bonds and bank loans (143.3) (6.8) – (150.1)Trade and other payables due after one year (52.3) (0.5) (34.4) (87.2)Deferred taxes (3.6) – (141.3) (144.9)Provisions (12.8) (3.4)(iii) (32.5)(iv) (48.7)Total liabilities (1,279.7) (14.9) (273.4) (1,568.0)Net (liabilities)/assets (26.9) (15.9) 42.8 –Minority interest (8.1)Goodwill 935.9Consideration 927.8Considered satisfied by:Cash 376.0Shares issued 486.0Shares to be issued 19.4Capitalised acquisition costs 46.4NotesAccounting policy alignmentsThese comprise adjustments to bring the assets and liabilities of Grey into compliance with WPPGroup plc’s accounting policies principally in relation to:
(i) Application of the Group’s depreciation policies to property, plant and equipment acquired;
(ii) Revaluation of unlisted investments to fair value; and
(iii) Adjustment for the application of IAS 19 for accounting for defined benefit schemes.
Fair value adjustmentsThese comprise adjustments to bring the book value of the assets and liabilities of Grey to fair value principally in relation to recognition of intangible assets and related taxes and:
(iv) Recognition of obligations under overseas property contracts and revaluation of other leasingarrangements to fair value, and provision for certain contingent liabilities where the likelihood of settlement is considered probable at the date of acquisition.
Net cash (outflows)/inflows in respect of Grey comprised:£m
Cash consideration (376.0)Cash at bank and in hand acquired 209.4Bank overdrafts acquired (31.2)Share issue and acquisition costs (49.6)
(247.4)
The post-acquisition contribution of Grey to the Group was £695.0 million to revenue,£68.6 million to operating profit and £93.3 million to Headline PBIT.
Other acquisitionsThe Group also acquired a number of other subsidiaries in the year. The following tablesets out the book values of the identifiable assets and liabilities acquired and their fairvalue to the Group. The fair value adjustments for certain acquisitions included in thetable below have been determined provisionally at the balance sheet date.
Fair value Book value adjust- Fair value
at acquisition ments to Group £m £m £m
Intangible assets 15.4 36.3 51.7Property, plant and equipment 8.6 – 8.6Interests in associates and other investments – 7.0 7.0Current assets 123.1 (0.2) 122.9Total assets 147.1 43.1 190.2Current liabilities (143.8) – (143.8)Trade and other payables due after one year (23.1) (1.1) (24.2)Deferred taxes (0.1) (12.4) (12.5)Provisions – (3.1) (3.1)Total liabilities (167.0) (16.6) (183.6)Net (liabilities)/assets (19.9) 26.5 6.6Minority interest (2.6)Goodwill 174.8Consideration 178.8Considered satisfied by:Cash 120.4Payments due to vendors 56.1Capitalised acquisition costs 2.3
The post-acquisition contribution of other acquisitions to the Group was £62.4 millionto revenue, £6.0 million to operating profit and £6.7 million to Headline PBIT.
If all acquisitions had been completed on the first day of the financial year, Grouprevenues for the period would have been £5,546.4 million, Group operating profitwould have been £657.8 million and Headline PBIT would have been £763.6 million.
31. Principal subsidiary undertakingsThe principal subsidiary undertakings of the Group are:
Country of IncorporationGrey Global Group, Inc USJ. Walter Thompson Company, Inc USGroupM Worldwide, Inc USThe Ogilvy Group, Inc USYoung & Rubicam, Inc US
All of these subsidiaries are operating companies and are 100% owned by the Group.
A more detailed listing of the operating subsidiary undertakings is given on pages 10and 11. The Company directly or indirectly holds controlling interests in the issued share capital of these undertakings with the exception of those specifically identified.
Advantage has been taken of Section 231(5) of the Companies Act 1985 to list onlythose undertakings required by that provision, as an exhaustive list would involve astatement of excessive length. A full listing of the Company’s subsidiary undertakings is included in the Company’s Annual Return.
32. Reconciliation to non-GAAP measures of performanceReconciliation of Headline PBIT and Headline PBT under IFRS to 2004 UK GAAP
Margin 2005 Margin 2004% £m % £m
Revenue 5,373.7 4,299.5Headline PBIT (IFRS) 14.0% 754.8 13.0% 560.2Share-based payments (IFRS 2) 0.6% 32.4 0.7% 28.9Accounting for associates (IAS 28) 0.4% 20.1 0.4% 18.6
52.5 47.5Headline PBIT (2004 UK GAAP) 15.0% 807.3 14.1% 607.7Headline PBT (IFRS) 669.0 489.6Adjustments to Headline PBIT (as above) 52.5 47.5Additional interest on convertible debt (IAS 32) 13.8 –Interest on associates (IAS 28) (0.1) (0.1)Headline PBT (2004 UK GAAP) 735.2 537.0

Our 2005 financial statements
Annual Report 2005Our 2005 financial statements 169
Reconciliation of free cash flow for the year ended 31 December 20052005 2004
£m £mCash generated by operations 1,020.3 690.0Plus:Interest received 62.4 48.9Investment income 5.6 –Dividends from associates 13.4 18.5Issue of shares 20.3 17.9Proceeds on disposal of property, plant and equipment 6.7 9.3Profits on disposal of equity interests 4.3 3.0Less:Movements in working capital and provisions (107.6) 4.8Loss on sale of property, plant and equipment (1.1) (1.9)Amounts written-off investments – (5.0)Interest and similar charges paid (128.2) (99.7)Purchases of property, plant and equipment (160.5) (89.7)Purchases of other intangible assets (including capitalised computer software) (10.8) (5.9)Corporation and overseas tax paid (136.0) (101.3)Dividends paid to minority shareholders in subsidiary undertakings (24.0) (22.5)Free cash flow 564.8 466.4
Reconciliation of profit before interest and taxation to Headline PBIT for theyear ended 31 December 2005:
2005 2004£m £m
Profit before interest and taxation 686.7 505.0Profits on disposal of equity investments (4.3) (3.0)Investment write-downs – 5.0Goodwill impairment 46.0 40.6Goodwill write-down relating to utilisation of pre-acquisition tax losses 1.1 12.6Amortisation of acquired intangible assets 25.3 –Headline PBIT 754.8 560.2Finance income 87.6 77.7FInance charges (excluding revaluation of financial instruments) (173.4) (148.3)
(85.8) (70.6)Interest cover on Headline PBIT1 8.8 times 7.9 times
1 The finance charges for the year ended 31 December 2005 of £173.4 million shown above include£13.8 million arising from the change in accounting for the Group’s convertible bonds under IFRS.Interest cover on a comparable basis with prior years would be 10.5 times.
Reconciliation of profit before taxation to Headline PBT and Headline earningsfor the year ended 31 December 2005:
2005 2004£m £m
Profit before taxation 592.0 434.4Profits on disposal of equity assets (4.3) (3.0)Investment write-downs – 5.0Goodwill impairment 46.0 40.6Goodwill write-down relating to utilisation of pre-acquisition tax losses 1.1 12.6Amortisation of acquired intangible assets 25.3 –Revaluation of financial instruments 8.9 –Headline PBT 669.0 489.6Taxation (194.0) (135.0)Minority interests (34.1) (26.4)Headline earnings 440.9 328.2Ordinary dividends 100.2 81.6Dividend cover on Headline earnings 4.4 times 4.0 times
Calculation of Headline EBITDA:2005 2004
£m £mHeadline PBIT (as above) 754.8 560.2Depreciation of property, plant and equipment 111.4 96.7Amortisation of other intangible assets 10.7 6.7Headline EBITDA 876.9 663.6
Headline PBIT margins before and after share of results of associates:Margin 2005 Margin 2004
% £m % £mRevenue 5,373.7 4,299.5Headline PBIT 14.0% 754.8 13.0% 560.2Share of results of associates 33.9 29.5Headline operating profit (Headline PBIT excluding share of results of associates) 13.4% 720.9 12.3% 530.7
Calculation of effective tax rate on Headline profit before tax:2005 2004
£m £mTaxation (194.0) (135.0)Headline PBT 669.0 489.6Effective tax rate on Headline profit before tax 29.0% 27.6%
Headline diluted earnings per ordinary share:2005 2004
£m £mHeadline earnings 440.9 328.2Earnings adjustment:
Dilutive effect of convertible bonds – 12.2Weighted average number of ordinary shares 1,224,804,570 1,219,588,084Headline diluted earnings per ordinary share 36.0p 27.9p

Our 2005 financial statements
Annual Report 2005Our 2005 financial statements170
Company balance sheetAs at 31 December 2005
2005Notes £m
Fixed assets
Investments 34 5,971.3
5,971.3
Current assets
Debtors 35 41.0
Creditors: amounts falling due within one year 36 (33.9)
Net current assets 7.1
Total assets less current assets 5,978.4
Net assets 5,978.4
Capital and reserves
Called-up share capital 37 125.3
Share premium account 37 2.1
Shares to be issued 37 37.2
Other reserves 37 0.5
Profit and loss account 37 5,813.3
Equity share owners’ funds 5,978.4
The accompanying notes form an integral part of this balance sheet.
Signed on behalf of the Board on 11 May 2006:
Sir Martin Sorrell P W G RichardsonGroup chief executive Group finance director
As provided by Section 230, Companies Act 1985, the profit and loss account for the Company has not been presented. Included within the consolidated income statement for the year ended 31 December 2005 is a loss of £3.4 million.

33 Accounting policiesThe principal accounting policies of WPP Group plc (the Company) are summarisedbelow. They have all been applied consistently throughout the period from 16 August2005, the date of incorporation, to 31 December 2005.
a) Basis of accountingThe financial statements are prepared under the historical cost convention and in accordance with applicable United Kingdom accounting standards and law.
b) Translation of foreign currencyForeign currency transactions arising from operating activities are translated from localcurrency into pounds sterling at the exchange rates prevailing at the date of thetransaction. Monetary assets and liabilities denominated in foreign currencies at theperiod end are translated at the period end exchange rate. Foreign currency gains orlosses are credited or charged to the profit and loss account as they arise.
c) InvestmentsFixed asset investments are stated at cost less provision for impairment.
d) TaxationCurrent tax is provided at amounts expected to be paid (or recovered) using the tax ratesand laws that have been enacted or substantially enacted by the balance sheet date.
Deferred taxation is provided in full on timing differences that result in an obligation at the balance sheet date to pay more tax, or a right to pay less tax, at a future date, at rates expected to apply when they crystallise based on current tax rates and law.Timing differences arise from the inclusion of items of income and expenditure intaxation computations in periods different from those in which they are included in financial statements. Deferred tax assets and liabilities are not discounted.
34 Fixed asset investmentsThe following are included in the net book value of fixed asset investments:
Subsidiaryundertakings
£mAdditions 5,971.331 December 2005 5,971.3
Fixed asset investments represent 100% of the issued share capital of WPP 2005Limited, a company incorporated in Great Britain. The fixed asset investment waspurchased in a share-for-share exchange.
35 DebtorsThe following are included in debtors:
2005£m
Amounts owed by subsidiary undertakings 41.0
Notes to the Company balance sheet
36 Creditors: amounts falling due within one yearThe following are included in creditors falling due within one year:
2005£m
Bank loans and overdrafts 33.9
37 Equity share owners’ fundsMovements during the period were as follows:
Ordinary Share Shares Profitshare premium to be Other and loss
capital account issued reserves account£m £m £m £m £m
Ordinary shares issued under the scheme of arrangement 5,969.1 – – – –Shares to be issued in respect of acquisitions – – 40.7 – –Capital reduction to 10p per ordinary share (5,843.4) – – – 5,843.4Other ordinary shares issued 0.1 2.1 (3.5) – –Share cancellations (0.5) – – 0.5 (26.7)Retained loss for the period – – – – (3.4)
125.3 2.1 37.2 0.5 5,813.3
Other reserves at 31 December 2005 comprise a capital redemption reserve of £0.5 million.
At 31 December 2005 the Company’s distributable reserves amounted to £5,813.3million. Further details of the Company’s movements in share capital and the schemeof arrangement are shown in notes 28 and 29.
Reconciliation of movements in equity share owners’ funds for the periodended 31 December 2005:
2005£m
Loss for the period (3.4)Ordinary shares issued under the scheme of arrangement 5,969.1Shares to be issued in respect of acquisitions 40.7Other ordinary shares issued (1.3)Share cancellations (26.7)Net additions to equity share owners’ funds 5,978.4Closing equity share owners’ funds 5,978.4
Our 2005 financial statements
Annual Report 2005Our 2005 financial statements 171

Our 2005 financial statements
Annual Report 2005Our 2005 financial statements172
Headline PBIT, Headline PBT and Headline earningsAs a result of the change in presentation in the income statement in respect of incomefrom associates, as well as other changes described below, the Group has redefinedcertain of its key performance metrics or ‘Headline’ profits and margins. An analysis of how the Group is calculating these under IFRS is presented in note 32 to thefinancial statements.
2004 2004UK GAAP IFRS
Revenue £4,300m £4,300mHeadline PBIT £608m £560mHeadline PBIT margin 14.1% 13.0%Headline PBT £537m1 £490mHeadline earnings £373m1 £328mHeadline diluted earnings per share 31.6p1 27.9pNotes
1 Restated to include interest on defined benefit pension schemes of £10m as a deduction fromHeadline profits.
Key impact analysisThe principal differences between UK GAAP and IFRS as they apply to WPP are setout below.
Changes in presentation of financial statementsThe financial statements in this section have been prepared substantially in accordancewith IAS 1 (Presentation of Financial Statements). The most significant presentationaldifferences arising from this change in format are as follows:
Income from associatesIn the current income statement format, in accordance with UK GAAP, the Groupseparately presents its share of operating profit, interest, minority interests and tax fromassociate undertakings. Under IAS 1, these results are aggregated into a single line inthe income statement. The effect is to reduce reported profit before interest and taxesby £19m in 2004, although there is no impact on earnings.
IFRS 2 Share-based paymentUnder UK GAAP, where the Group grants share options at a strike price equal to orgreater than the market price on the date of the grant, no compensation expense isrecognised. For share awards other than stock options, the charge to the Group’sincome statement is based on the intrinsic value (market value on grant date) of theaward, spread over the relevant performance period, in accordance with UITF 38(Accounting for ESOP trusts). IFRS 2 requires that share-based payments (includingshare options) are recognised in the income statement as an expense, spread over therelevant vesting period using a fair value model. The Group has used a Black-Scholesvaluation model for this purpose.
IFRS 2 permits prospective adoption for grants made after November 2002, but theGroup has chosen to adopt IFRS 2 on a full retrospective basis, for all option and shareaward grants as the resulting charge better reflects the ongoing impact on the Group.The impact on the income statement for the year ended 31 December 2004 is an after-tax charge of £27 million.
Deferred tax is provided based upon the expected future tax deductions relating toshare-based payment transactions, and is recognised over the vesting period of therelevant share award schemes. For the year ended 31 December 2004, this results in an additional deferred tax credit to the income statement of £2 million.
WPP Group plc (WPP) prepared its primary financial statements under UK GenerallyAccepted Accounting Practice (UK GAAP) for the years up to and including the yearended 31 December 2004. For periods beginning on or after 1 January 2005, all listed companies in the European Union, including WPP, are required to prepare theirconsolidated financial statements in accordance with International Financial ReportingStandards including International Accounting Standards (IFRS). WPP’s date oftransition to IFRS is 1 January 2004 (the transition date).
The effects of the transition from UK GAAP to IFRS on the Group’s reported financialposition and financial performance and cash flows for 2004 is explained in the followingschedules included in this section:• IFRS 1 exemptions• Key impact analysis• Reconciliations of:
– Income statement for the year ended 31 December 2004– Balance sheet as at 31 December 2004– Equity share owners’ funds as at 1 January 2004– Equity share owners’ funds as at 1 January 2005
IFRS 1 ExemptionsIFRS 1 (First-time adoption of International Financial Reporting Standards) allows a number of exemptions from the full requirements of IFRS for those companiesadopting IFRS for the first time. WPP has taken advantage of certain of theseexemptions as follows:
Financial instrumentsThe Group has taken advantage of the exemption available under IFRS 1 not to applyIAS 39 (Financial Instruments: Recognition and Measurement) and IAS 32 (FinancialInstruments: Disclosure and Presentation) in respect of the year ended 31 December2004. UK GAAP has continued to be applied in accounting for financial instruments inthis period. The Group has adopted IAS 39 and IAS 32 with effect from 1 January 2005and consequently restated the balance sheet at that date in accordance with therequirements of these standards, which generally means a recognition of financialinstruments at fair value.
Business combinationsThe Group has elected not to apply IFRS 3 (Business combinations) retrospectively to business combinations that completed prior to 1 January 2004.
Share-based paymentsIFRS 2 applies to all share-based payments granted since 7 November 2002, but the Group has elected for full retrospective restatement as this better represents theongoing charge to the income statement.
Presentation of financial informationThe primary financial statements contained in this section have been presentedsubstantially in accordance with the requirements of IAS 1 (Presentation of FinancialStatements). The presentation has been used in this section for a more clear illustration of comparisons between IFRS and UK GAAP.
Summary reported income statement:2004 2004
UK GAAP IFRSRevenue £4,300m £4,300mPBIT1 £529m £507mPBIT margin 12.3% 11.8%PBT £457m £434mEarnings £292m £273mDiluted earnings per share 25.0p 23.4pNotes
1 PBIT before amounts written off fixed asset investments.
Transition to IFRS
Our 2005 financial statements
Annual Report 2005Our 2005 financial statements 173
IFRS 3 Business combinationsThe Group has elected not to apply IFRS 3 retrospectively to business combinationscompleted prior to 1 January 2004, an exemption permitted by IFRS 1.
IFRS 3 prohibits amortisation of goodwill and instead requires impairment testing atleast annually. Under UK GAAP, WPP amortised a number of acquisitions where the lifeof the goodwill is determined to be finite. In the IFRS financial information presented,this amortisation has been reversed from the date of transition and the relevantgoodwill tested for impairment at 31 December 2004.
The Group has also conducted an impairment review of goodwill at 1 January 2004, in accordance with the requirements of IAS 36 (Impairment of Assets).
The impact on the income statement for the year ended 31 December 2004 is toeliminate goodwill amortisation of £42.5 million. No additional impairment of goodwillarose at 1 January 2004, however there was additional impairment of £5 million for the year ended 31 December 2004.
When the Group makes acquisitions, deferred tax assets are established in relation to tax losses and other tax attributes to the extent that it is probable that they will beutilised in the future. If the performance and profits of acquisitions are higher thanoriginally anticipated then the Group may recognise the additional tax benefit ofunbooked tax attributes in the IFRS income statement. IFRS 3 and IAS 12 (IncomeTaxes) require a write-down of goodwill equal to the tax benefit of any tax attributesthat are subsequently recognised if a deferred tax asset has not been established atthe time of acquisition. The write-down of goodwill adjusts goodwill in the balancesheet to the amount it would have been had a deferred tax asset been established on all of the tax attributes utilised. Due to the better than expected performance ofcertain acquisitions in the year ended 31 December 2004 there was an additionalgoodwill adjustment of £13 million charged to operating profit relating to the utilisation of pre-acquisition tax attributes that previously could not be recognised due toinsufficient evidence that they were recoverable. The Group expects the annualgoodwill adjustment to be lower in the future.
IAS 21 requires goodwill and fair value adjustments on acquisitions to be recorded in the functional currency of the acquiree rather than the functional currency of theacquirer. As permitted by IFRS 1 we are applying IAS 21 retrospectively to goodwill and fair value adjustments arising in business combinations that occurred before thedate of transition to IFRS. We have retranslated our goodwill and corporate brands on this basis which has resulted in a decrease in the carrying value of these assets at 31 December 2004 of £679 million, and an equivalent reduction in equity.
IFRS 1 has a further impact in that goodwill previously written off to reserves under UK GAAP is not recycled to the income statement in the event of the disposal of thebusiness concerned.
IAS 38 Intangible assetsThe Group has also applied IAS 38 to acquisitions completed since the initial adoption date which has resulted in the recognition of intangible assets of £7 millionat 31 December 2004 which would not qualify for recognition under UK GAAP. These largely comprise corporate brand names.
These intangibles are amortised over their useful economic lives, which vary dependingon the individual characteristics of the intangibles concerned, but are no more than 10years. The impact on the income statement for the year ended 31 December 2004 is not material.
Under UK GAAP, capitalised computer software is included within tangible fixed assetson the balance sheet. Under IFRS, only computer software that is integral to a relateditem of hardware should be included as property, plant and equipment. All othercapitalised computer software should be shown as an intangible asset.
Accordingly, a reclassification of £24 million has been made in the 31 December 2004balance sheet from property, plant and equipment to intangible assets.
IAS 28 Investments in associatesIFRS requires equity accounting for associates’ losses to cease at the point that thecarrying value of the net assets of the relevant associate are nil. Further losses are only accrued if the investor has a legal or constructive obligation for the losses.
The Group has therefore ceased to recognise equity losses where the net assets of theassociate concerned are nil or negative, where appropriate. This did not result in anyimpact on the 2004 income statement.
IAS 10 Events after the balance sheet dateIAS 10 does not permit dividends proposed after the balance sheet date to berecognised as a liability at that date because they do not represent a present obligationas defined by IAS 27 (Provisions, Contingent Liabilities and Contingent Assets).
The impact of this change is to exclude the final dividend of £62 million from the incomestatement for the year ended 31 December 2004, but include the prior year finaldividend of £52 million as an expense in 2004. This results in a net increase in retainedprofit of £10 million. The respective restated balance sheets at 31 December 2004 and1 January 2004 exclude these dividends.
IAS 19 Employee benefitsThe Group fully implemented the UK Accounting Standard FRS 17 (Retirement Benefits)in 2001. The treatment of pension benefits under FRS 17 is similar to IAS 19 and theAmendment to IAS 19 Employee Benefits: Actuarial Gains and Losses, Group Plansand Disclosures adopted by the IASB in December 2004, which encourages earlyadoption prior to its expected effective date of 1 January 2006.
IAS 32 and IAS 39 Financial instrumentsThe Group has taken advantage of the exemption available under IFRS 1 not to applyIAS 32 and IAS 39 in respect of the year ended 31 December 2004. UK GAAP hascontinued to be applied to financial instruments in this period.
The Group has therefore adopted IAS 32 and IAS 39 on 1 January 2005 andconsequently restated the opening balance sheet at that date to an IFRS basis in compliance with these standards.
The most significant impact on the income statement of adopting IAS 32 and IAS 39 at 1 January 2005 was as follows:
Convertible bondsUnder UK GAAP, convertible bonds are reported as a liability unless conversion actuallyoccurs, and no gain or loss is recognised on conversion. Under IAS 32, classification ofsuch compound instruments is undertaken based on the substance of the contractualarrangements and, consequently, the Group’s compound instruments will be split intoliability and equity elements, based on the fair value of the debt component at the dateof issue.
The income statement charge for the finance cost will continue to be spread evenlyover the term of the bonds so that at redemption the liability equals the redemptionvalue. However, under IFRS the initial recognition of the liability is for a lower amountthan under UK GAAP and consequently the finance cost over the period is higher.
At 1 January 2005, the Group had in issue two convertible bonds: £450 million bondmaturing in April 2007 and $287.5 million bond maturing in January 2005. The impact on the 1 January 2005 transition balance sheet from these bonds was:• £98 million reclassification from debt to equity to separately account for the equityelement of the convertible bonds (£69 million relating to the £450 million bond and £29 million relating to the $287.5 million bond).• £66 million adjustment to debt and retained earnings to reflect the cumulative extra amount of financing costs that would have been expensed through the incomestatement as at 31 December 2004 (£37 million relating to the £450 million bond and £29 million relating to the $287.5 million bond).• The impact on the income statement for the year ending 31 December 2005 is anincrease in interest payable and similar charges of £14 million, in relation to convertiblebonds in issue at 1 January 2005 (£13.7 million relating to the £450 million bond and£0.3 million relating to the $287.5 million bond).• The total interest charges for these bonds under IFRS for the year ending31 December 2005 was £30 million on the £450 million convertible and £0.5 millionon the $287.5 million convertible.
On 7 March 2005 WPP completed the acquisition of Grey Global Group Inc (Grey).Grey had in issue $150 million 5% Contingent Convertible Subordinated Debenturesdue in 2033. The principles described above also applied to this bond.
Hedging instrumentsThe Group has a number of hedging instruments which were accounted for as hedgesunder UK GAAP during 2004. On adoption of IAS 39, the Group has recognised thesehedging instruments at fair value in the balance sheet at 1 January 2005.
Subsequent movements in the fair value of these instruments did not have a significantimpact on the income statement for the year ending 31 December 2005 as they alsoqualify for hedge accounting under IAS 39.
From time to time, the Group uses certain short-term derivative financial instruments to mitigate interest rate and foreign exchange rate risks. These may not be held inqualifying hedge relationships and so movements in fair value of the relevant instrumentwill be taken to the income statement. However, owing to their short-term nature, theGroup does not expect this to have a significant impact on the income statement.
Other impactsIn addition to the above discussions, IAS 32 and IAS 39 led to an increase in financialliabilities on the balance sheet and the recognition of the fair value of puts over minoritystakes. The subsequent re-measurement also increases the volatility within the income statement.

Our 2005 financial statements
Annual Report 2005Our 2005 financial statements174
Earnings per shareEarnings per share have been calculated in accordance with IAS 33 (Earnings pershare). As noted above, in accordance with IFRS 2, the Group has charged the fairvalue of stock options to the income statement for 2004. IFRS 2 does not permit anyreduction in the number of shares used in the diluted earnings per share calculation in respect of the dilutive effect of stock options, in spite of the fact that a charge to the income statement has been made.
Reconciliation of profit on ordinary activities before interest, taxation, fixed asset gains and write-downs to Headline PBIT for the year ended31 December 2004:
UK GAAP IFRS£m £m
Profit on ordinary activities before interest, taxation, fixed asset gains and write-downs 529.2 507.0Goodwill amortisation 42.5 –Goodwill impairment 36.0 40.6Goodwill write-down relating to utilisation of pre-acquisition tax losses – 12.6Headline PBIT 607.7 560.2
Reported margins:UK GAAP IFRS
£m £mRevenue 4,299.5 4,299.5Headline PBIT 607.7 560.2Headline PBIT margin 14.1% 13.0%
Reconciliation of profit on ordinary activities before taxation to Headline PBTand Headline earnings for the year ended 31 December 2004:
UK GAAP IFRS£m £m
Profit on ordinary activities before taxation 456.5 434.4Goodwill amortisation 42.5 –Goodwill impairment 36.0 40.6Goodwill write-down relating to utilisation of pre-acquisition tax losses – 12.6Profits on disposal of fixed assets (3.0) (3.0)Amounts written off fixed asset investments 5.0 5.0Headline PBT 537.0 489.6Taxation on profit on ordinary activities (140.2) (135.0)Minority interests (24.0) (26.4)Headline earnings 372.8 328.2
Calculation of effective tax rate on Headline profit before tax:UK GAAP IFRS
£m £mTaxation on profit on ordinary activities (140.2) (135.0)Headline PBT 537.0 489.6Effective tax rate on Headline profit before tax 26.1% 27.6%
Earnings per ordinary share:UK GAAP IFRS
£m £mHeadline earnings 372.8 328.2Earnings adjustment:Dilutive effect of convertible bonds 12.2 12.2Weighted average number of ordinary shares 1,219,588,084 1,219,588,084Headline diluted earnings per ordinary share 31.6p 27.9p
IAS 12 Income taxesIAS 12 requires deferred tax to be provided on all taxable temporary differencesbetween the book value and the tax base of assets and liabilities of the Group ratherthan timing differences under UK GAAP. As a result, the Group’s IFRS balance sheet at31 December 2004 includes additional deferred tax assets of £11 million and deferredtax liabilities of £8 million in respect of the differences between the carrying value andtax written down value of goodwill in the Group’s balance sheet. In accordance withIAS 12, a liability of £6 million has been netted off against a deferred tax asset as bothitems relate to the same consolidated tax group. There was an additional charge to theIFRS income statement of £2 million in the year ended 31 December 2004 in relation to movements in these balances. IAS 1 requires deferred tax to be classified as a ‘non-current’ asset and accordingly £77 million of deferred tax assets reported under UK GAAP have been reclassified from ‘current assets’.
IAS 12 requires a deferred tax liability to be booked in respect of the tax cost ofremitting undistributed earnings of the Group’s associated undertakings and jointventures. At 1 January 2004 this deferred tax liability was £8 million. There was anadditional charge to the IFRS income statement of £2 million in the year ended31 December 2004 in relation to undistributed earnings arising in the year whilst foreign exchange movements led to an increase in the liability of £1 million. At 31 December 2004 the deferred tax liability was £10 million.
IAS 12 also requires deferred tax to be provided in respect of the Group’s futuredeductions in respect of share-based payments. At 1 January 2004 an asset of £3 million was recognised in respect of anticipated future tax deductions of share-based payments.
The 2004 IFRS income statement expense for stock options was £29 million. Deferred tax of only £2 million is credited to the IFRS income statement in 2004; the majority of the expense cannot be tax effected due to either the expense not being deductible for tax purposes or the recognition of the asset being restricted by existing tax losses. At 31 December 2004 a deferred tax asset of £3 million washeld in the balance sheet as although the asset was increased by £2 million relating to the 2004 charge there were other adjustments, primarily the exercise of options, that reduced the asset by £2 million.
In accordance with IAS 12, in the year ended 31 December 2004 an amount of£9 million which had previously been credited to tax expense in the UK GAAP profit and loss account was credited directly to equity as it related to the tax benefits ofshare-based payments that exceeded the cumulative income statement expense for those payments.
The total IFRS income statement tax charge for the year ended 31 December 2004 is £135 million. In accordance with IAS 28, income from associates and joint ventures is now shown net of tax. A reconciliation from the UK GAAP to the IFRS tax charge is shown below. Under IFRS there is a net reduction of £5 million in the tax charge forthe year ended 31 December 2004 which is comprised as follows:
£mUK GAAP Profit and loss account tax charge 140Reclass of tax charge relating to associates and joint ventures (18)Deferred tax charge on unremitted earnings of associates and joint ventures 2Deferred tax credit in relation to stock option expense (2)Tax charge in relation to the tax effect of share-based payments now credited to equity 9Deferred tax charge relating to goodwill 2Other changes 2IFRS Income statement tax charge 135
The effect of the adjustments required under IFRS is to increase the Group’s tax rate on Headline PBT for the year ended 31 December 2004 to 27.6% as compared with26.1% under UK GAAP. The primary reason for the increase in tax rate is the reductionin IFRS Headline PBT due to the additional income statement expense for stock optionsas the majority of this expense cannot be tax effected. The introduction of IFRS doesnot impact the amount of cash tax paid by the Group.
IAS 12 requires deferred tax liabilities of £300 million to be recognised at 31 December2004 in respect of intangible assets such as corporate brands which were recognised at the time of various acquisitions including Ogilvy & Mather, J. Walter Thompson, Hill & Knowlton and Young & Rubicam. As the Group acquired the shares in therespective holding companies there is no tax basis in the brands themselves andtherefore the resulting deferred tax liabilities are equal to the carrying value of thecorporate brands tax effected at the appropriate tax rate. The Group considers theappropriate tax rate to be the Group’s combined US federal and state tax rate.Normally recognition of these deferred tax liabilities would result in a correspondingincrease of goodwill in respect of these acquisitions, however under the exemptionsprovided by IFRS 1 relating to business combinations, the Group has not adjustedgoodwill in respect of acquisitions before 1 January 2004.
At 31 December 2004 the tax related adjustments under IFRS, excluding theadjustments for corporate brands, increase total assets by £3 million and total liabilitiesby £12 million. As a result, a net amount of £9 million was debited to IFRS Capital andReserves as at 31 December 2004 in relation to these adjustments. As detailed above,additional deferred tax liabilities of £300 million were recognised at 31 December 2004in relation to corporate brands; a corresponding amount was also debited to IFRSCapital and Reserves.

Our 2005 financial statements
Annual Report 2005Our 2005 financial statements 175
Reconciliations from UK GAAP to IFRSConsolidated income statement for the year ended 31 December 2004
31 Dec 2004 Reported IFRS 3 IFRS 2 IAS 12 31 Dec 2004 under UK Business Share IAS 28 IAS 10 Income Total IFRS Restated
GAAPCombinations Options Associates Dividends Taxes Other adjustments IFRS£m £m £m £m £m £m £m £m £m
Revenue 4,299.5 4,299.5Operating profit before goodwill amortisation 559.6 (28.9) (28.9) 530.7Goodwill amortisation and impairment – subsidiaries (75.0) 34.4 (12.6) 21.8 (53.2)Operating profit 484.6 34.4 (28.9) – – (12.6) – (7.1) 477.5Goodwill amortisation and impairment – associates (3.5) 3.5 3.5 –Income from associates and joint ventures 48.1 – 48.1Tax, interest and minority interest on associates – (18.6) (18.6) (18.6)Net income from associates and joint ventures 48.1 (18.6) (18.6) 29.5Profit on ordinary activities before interest, taxation and amounts written off fixed asset investments 529.2 37.9 (28.9) (18.6) – (12.6) – (22.2) 507.0Profits on disposal of fixed assets 3.0 – 3.0Amounts written off fixed asset investments (5.0) – (5.0)Investment income – 56.4 56.4 56.4Finance costs (shown net under UK GAAP) (70.7) 0.1 (56.4) (56.3) (127.0)Profit on ordinary activities before taxation 456.5 37.9 (28.9) (18.5) – (12.6) – (22.1) 434.4Taxation on profit on ordinary activities (140.2) 2.0 17.9 (14.7) 5.2 (135.0)Profit on ordinary activities after taxation 316.3 37.9 (26.9) (0.6) – (27.3) – (16.9) 299.4Minority interests (24.0) 0.6 (3.0) (2.4) (26.4)Profit attributable to ordinary share owners 292.3 37.9 (26.9) – – (27.3) (3.0) (19.3) 273.0Ordinary dividends (92.0) 10.4 10.4 (81.6)Retained profit for the year 200.3 37.9 (26.9) – 10.4 (27.3) (3.0) (8.9) 191.4
Headline PBIT 607.7 – (28.9) (18.6) – – – (47.5) 560.2Headline PBIT margin 14.1% 13.0%Headline PBT 537.0 – (28.9) (18.5) – – – (47.4) 489.6
Consolidated balance sheet as at 31 December 200431 Dec 2004 IAS 38
Reported IFRS 3 IAS 12 Intangibles 31 Dec 2004 under UK Business IAS 28 IAS 10 Income and software Total IFRS Restated
GAAP Combinations Associates Dividends Taxes reclass Other adjustments IFRS£m £m £m £m £m £m £m £m £m
Non-current assetsIntangible assets:
Corporate brands 950.0 (207.4) (207.4) 742.6Goodwill 4,845.7 (436.4) (12.6) (7.0) (456.0) 4,389.7Other – 31.0 31.0 31.0
Property plant and equipment 333.8 (24.0) (24.0) 309.8Deferred tax assets – 100.2 100.2 100.2Investments 389.3 3.2 1.1 4.3 393.6
6,518.8 (640.6) 1.1 – 87.6 – – (551.9) 5,966.9Current assetsInventories and work in progress 220.6 – 220.6Debtors 2,677.6 (76.6) (76.6) 2,601.0Trade debtors within working capital facility:
Gross debts 545.7 – 545.7Non-returnable proceeds (261.0) – (261.0)
284.7 – 284.7Current asset investments (short-term bank deposits) 244.0 (244.0) (244.0) –Cash and cash equivalents 1,372.0 244.0 244.0 1,616.0
4,798.9 – – – (76.6) – – (76.6) 4,722.3Current liabilitiesCreditors: amounts falling due within one year (including convertible bonds) (5,220.0) 62.6 (9.4) 53.2 (5,166.8)Net current liabilities (421.1) – – 62.6 (76.6) – (9.4) (23.4) (444.5)Total assets less current liabilities 6,097.7 (640.6) 1.1 62.6 11.0 – (9.4) (575.3) 5,522.4Non-current liabilitiesCreditors: amounts falling due after more than one year (including convertible bonds) (1,852.6) (2.6) (2.6) (1,855.2)Deferred tax liabilities – (312.3) (312.3) (312.3)Provisions for liabilities and charges (91.2) 4.3 4.3 (86.9)Post-employment benefits (187.8) (14.5) (14.5) (202.3)Net assets 3,966.1 (636.3) 1.1 62.6 (315.8) – (12.0) (900.4) 3,065.7
Capital and reservesCalled up share capital 118.5 – 118.5Share premium account 1,002.2 – 1,002.2Shares to be issued 49.9 – 49.9Merger reserve 2,920.6 – 2,920.6Other reserves (125.5) (174.7) 28.6 181.0 34.9 (90.6)Own shares (277.7) – (277.7)Retained earnings 226.5 (461.6) 1.1 62.6 (344.4) (196.0) (938.3) (711.8)Equity share owners’ funds 3,914.5 (636.3) 1.1 62.6 (315.8) – (15.0) (903.4) 3,011.1Minority interests 51.6 3.0 3.0 54.6Total capital employed 3,966.1 (636.3) 1.1 62.6 (315.8) – (12.0) (900.4) 3,065.7

Our 2005 financial statements
Annual Report 2005Our 2005 financial statements176
Reconciliations from UK GAAP to IFRSConsolidated equity share owners’ funds as at 1 January 2004
Ordinary Shareshare premium Shares Merger Other Own Retained
capital account to be issued reserve reserve Shares earnings Total£m £m £m £m £m £m £m £m
UK GAAP reported 1 January 2004 118.7 955.3 130.0 2,921.0 (178.9) (307.8) 129.4 3,767.7
IFRS 1 First time adoption of IFRS1 – – – – 181.0 – (181.0) –IFRS 3 Business Combinations2 – – – – – – (818.7) (818.7)IAS 10 Events after the balance sheet date – – – – – – 52.2 52.2Other – – – – – – (11.0) (11.0)
IFRS restated 1 January 2004 118.7 955.3 130.0 2,921.0 2.1 (307.8) (829.1) 2,990.2Notes
1 Election to deem the cumulative translation differences for all foreign operations to be zero at the date of transition to IFRS.2 Full retrospective restatement of goodwill and corporate brands in the functional currency of the acquiree.
Consolidated equity share owners’ funds as at 1 January 2005Ordinary Share
share premium Shares Merger Other Own Retainedcapital account to be issued reserve reserve Shares earnings Total
£m £m £m £m £m £m £m £mIFRS opening 1 January 2005 118.5 1,002.2 49.9 2,920.6 (90.6) (277.7) (711.8) 3,011.1
Impact of IAS 32 and IAS 39 adjustments:Reclassification of components of convertible debt – – – – 88.6 – (65.8) 22.8Recognition of additional financial liabilities (including put options) – – – – (57.8) – (27.1) (84.9)
IFRS 1 January 2005 restated for IAS 32 and IAS 39 118.5 1,002.2 49.9 2,920.6 (59.8) (277.7) (804.7) 2,949.0

Our 2005 financial statements
Annual Report 2005Our 2005 financial statements 177
The following is a summary of adjustments to net income and equity share owners’funds which would be required if US Generally Accepted Accounting Principles (US GAAP) had been applied. The reconciliation is presented for two years, aspermitted by the Securities and Exchange Commission as an accommodation forforeign private issuers in their first year of reporting under International FinancialReporting Standards, incorporating International Accounting Standards (IFRS).
IFRS 1 (First-Time Adoption of International Financial Reporting) allows a number ofexemptions from the full requirements of IFRS for those companies adopting IFRS forthe first time. WPP has taken advantage of certain of these exemptions, as explained in detail in the Group’s accounting policies.
For the year ended 31 December
2005 2004Notes £m £m
Net incomeProfit for the year 398.0 299.4Profit attributable to minority interests (34.1) (26.4)Profit attributable to equity holders of the parent under IFRS 363.9 273.0US GAAP adjustments:Amortisation of intangibles (a) (17.2) (28.5)Goodwill impairment (a) (22.7) (10.2)Contingent consideration (b) (73.9) (90.5)Accounting for derivatives (c) (1.3) (0.3)Recognition of liabilities (h) – (16.1)Pension accounting (d) (15.9) (9.5)Employer payroll taxes (e) 1.7 2.0Convertible debt (i) 12.7 –Tax items (f) 4.1 0.4Other – 6.1
(112.5) (146.6)Net income as adjusted for US GAAP 251.4 126.4
Earnings per shareBasic earnings per share as adjusted for US GAAP (p) 2 20.9 11.1Diluted earnings per share as adjusted for US GAAP (p) 2 20.5 10.9
As at 31 December2005 2004
Notes £m £mEquity share owners’ funds Total equity 3,985.8 3,065.7Minority interests (81.3) (54.6)Equity share owners’ funds under IFRS 3,904.5 3,011.1US GAAP adjustments:Capitalisation of goodwill arising on acquisition (net of accumulated amortisation and impairmentand amounts capitalised under IFRS) (a) 585.0 408.4Other investments (g) (1.4) 0.5Contingent consideration (b) (277.5) (215.8)Accounting for derivatives (c) 125.1 34.7Recognition of liabilities (h) – (16.1)Pension accounting (d) 13.4 0.9Convertible debt (i) (19.7) –Employer payroll taxes (e) 5.7 4.0Tax items (f) 361.9 267.9Other – 15.3
792.5 499.8Equity share owners’ funds as adjusted for US GAAP 4,697.0 3,510.9
Movement in equity share owners’ funds under US GAAP2005 2004
£m £mNet income for the year under US GAAP 251.4 126.4Ordinary dividends (100.2) (81.6)Retained earnings for the year 151.2 44.8Non-cash share-based incentive plans (including stock options) 68.6 58.8Exchange adjustments on foreign currency net investments 548.2 (172.8)Ordinary shares issued in respect of acquisitions 422.3 –Share issue/cancellation costs (3.6) (0.8)Other ordinary share issues 18.3 32.8Share cancellations (123.3) (73.6)Pension accounting 9.2 (11.6)Net additions of own shares by ESOP trusts (29.0) (14.9)Transfer to goodwill (5.1) (67.3)Revaluation of other investments 19.1 2.3Tax items 110.2 (2.0)Other items – 3.2Net additions/(reductions) to share owners’ funds 1,186.1 (201.1)Equity share owners’ funds at 1 January 3,510.9 3,712.0Equity share owners’ funds at 31 December 4,697.0 3,510.9
Reconciliation to US Accounting Principles
Our 2005 financial statements
Annual Report 2005Our 2005 financial statements178
Under US GAAP, SFAS 142 prescribes a two-step impairment test:
• The first step of the goodwill impairment test compares the fair value of a reportingunit with its carrying amount, including goodwill. The Group uses the discounted cash flow method in determining the fair value of each reporting unit and also givesconsideration to the overall market capitalisation of the Group. There are no differencesin the performance of this step between IFRS and US GAAP, other than the amountstested may differ due to GAAP differences affecting the carrying amounts of goodwill.
• If the carrying amount of a reporting unit exceeds its fair value, the second step of the goodwill impairment test, used to measure the amount of impairment loss,compares the implied fair value of reporting unit goodwill with the carrying amount of that goodwill.
The implied fair value of goodwill is determined in the same manner that the amount of goodwill recognised in a business combination is determined. That is, the Groupallocates the fair value of the reporting unit to all of the assets and liabilities of that unit(including any previously unrecognised intangible assets) as if the reporting unit hadbeen acquired in a business combination and the fair value of the reporting unit was theprice paid to acquire the reporting unit. The excess of the fair value of the reporting unitover the amounts assigned to its assets and liabilities is the implied fair value of goodwill.
The reporting units of the Group used in this assessment are its operating segments or one level below (i.e. individual offices). Where reporting units are represented byindividual offices, those reporting units are assessed for aggregation for purposes of testing for impairment of goodwill. Reporting units are aggregated if they supplysimilar services, provide these services in a similar manner, have like types and classes of customers and have similar economic characteristics. The reporting units under US GAAP are the same as the cash generating units under IFRS.
Under IFRS (IAS 36, Impairment of Assets), the impairment test is only a one-step test,as more fully described in the note on accounting policies in the financial statements.This could give rise to a GAAP difference related to the impairment of goodwill.At 31 December 2005 this difference was immaterial.
Other intangiblesUnder IFRS, the Group has applied IAS 38, Intangible Assets to acquisitions completedsince 1 January 2004, which has resulted in the recognition of acquired intangible assetswith a carrying value of £330.3 million and £7.0 million at 31 December 2005 and 2004,respectively. The Company generally assesses the fair value of identifiable intangibleassets based on the net present value of expected future cash flows to be derived.
Under US GAAP, in accordance with the provisions of SFAS 141, BusinessCombinations, effective for all business combinations initiated after 30 June 2001, the allocation of purchase consideration should include recognition of the fair value of identifiable intangible assets, as applicable, such as corporate brand names,customer relationships and proprietary tools. Intangible assets, net of amortisation,recognised under US GAAP with respect to business combinations completed prior to1 January 2004 resulted in a difference in carrying value of acquired intangible assets of £66.6 million at 31 December 2005. The additional amortisation charge in 2005relating to these intangibles was £17.2 million (2004: £28.5 million).
(b) Contingent considerationUnder IFRS, the Group provides for contingent consideration as a liability when it considers the likelihood of payment as probable. Under US GAAP, contingentconsideration is not recognised until the underlying contingency is resolved andconsideration is issued or becomes issuable. At 31 December 2005, the Group’sliabilities for vendor payments under IFRS totalled £220.0 million (2004: £298.6 million),of which £180.6 million (2004: £244.2 million) is dependent on the future performanceof the interests acquired. As these liabilities are represented by goodwill arising onacquisitions, there is no net effect on equity share owners’ funds. Under US GAAP,however, a balance sheet classification difference arises such that liabilities andgoodwill would each be reduced by the amount indicated as of each year end.This difference represents a continuing difference between IFRS and US GAAP.
In certain historical transactions the Group had considered that there was a commercialneed to tie in vendors to the businesses acquired; however the directors believe that, in substance, payments made under earnouts represent purchase consideration rather than compensation for services. Under US GAAP, payments made to vendorswhich are conditional upon them remaining in employment with the Company underearnout are required to be treated as compensation, except in rare instances, and the anticipated compensation expense is therefore accrued on a systematic basis over the earnout period. As allowed by IFRS 1, the Group has elected not to applyIFRS 3 retrospectively to business combinations completed prior to 1 January 2004.This is a transitional difference between IFRS and US GAAP that will continue to affectthe reconciiliation of net income until the earnout periods on pre-1 January 2004acquisitions expire.
(c) Accounting for derivative instruments and hedging activitiesThe Group has taken advantage of the exemption available under IFRS 1 not to applyIAS 32 and IAS 39 in respect of the year ended 31 December 2004. Therefore, asallowed by IFRS 1, in 2004, gains or losses on forward foreign exchange contractswere deferred and recognised in the profit and loss account or as adjustments to thecarrying amount of fixed assets. Interest differentials as a result of interest rate swaps
1 Significant differences between IFRS and USGenerally Accepted Accounting Principles
The Group’s financial statements are prepared in accordance with IFRS which differ incertain significant respects from US GAAP. These differences relate principally to thefollowing items:
(a) Goodwill and other intangiblesCapitalisation of goodwillUnder US GAAP (Statement of Financial Accounting Standards 141, BusinessCombinations, or SFAS 141) and IFRS (IFRS 3, Business Combinations), purchaseconsideration in respect of subsidiaries acquired is allocated on the basis of fair valuesto the various net assets, including intangible fixed assets, at the dates of acquisitionand any net balance is treated as goodwill. As allowed by IFRS 1, goodwill arising onacquisitions before 1 January 1998 was fully written off against equity share owners’funds, in accordance with the then preferred treatment under UK GAAP. In accordancewith Financial Reporting Standard No. 10 (FRS 10, Goodwill and Intangible Assets),goodwill arising on acquisitions on or after 1 January 1998 and before the adoption ofIFRS on 1 January 2004 has been capitalised as an intangible asset. This results in adifference in goodwill of £1,208.2 million at 31 December 2005. In addition, as allowedby IFRS 1, a revaluation associated with the acquisition of JWT was recorded in theyear following its acquisition and is not recognised under US GAAP. This resulted in adifference in carrying value of £175 million.
As allowed by IFRS 1, the Group has elected not to apply IFRS 3 retrospectively tobusiness combinations completed prior to 1 January 2004. Therefore WPP hashistorically amortised a number of acquisitions where the life to the goodwill wasdetermined to be finite. IFRS 3 prohibits amortisation of goodwill and instead requiresannual impairment testing. Under US GAAP (SFAS 142 Goodwill and Other IntangibleAssets) goodwill is not amortised for business combinations completed after 30 June2001; however, amortisation had been recorded under US GAAP historically onbusiness combinations completed through 30 June 2001. This resulted in a differencein cumulative amortisation of goodwill of £457.3 million at 31 December 2005.
Under IFRS, and for acquisitions completed prior to 1 January 2004, UK GAAP, shareconsideration for acquisitions is measured by reference to the share price on the datethe acquisition becomes effective, while under US GAAP the relevant measurement dateis the date of the announcement of the proposed acquisition and its recommendationto share owners by the respective Boards of directors. For the acquisition of Young &Rubicam Inc., the share consideration was measured under UK GAAP at the shareprice on 4 October 2000 of £7.99, while under US GAAP, the share consideration wasmeasured at £8.45, the share price on 12 May 2000. This resulted in a purchase pricewhich differed by £264.7 million and a corresponding difference in the gross carryingamount of goodwill. For the acquisition of Grey, the share consideration was measuredunder IFRS at the share price on 7 March 2005 of £6.22, while under US GAAP theshare consideration was measured at £5.14, the share price on 11 September 2004.This resulted in a purchase price difference of £84.1 million.
ImpairmentThe Group’s indefinite lived intangible assets consist of goodwill and corporate brand names. The carrying value of these assets is reviewed for impairment annually or more frequently if events or changes in circumstances indicate that the asset might be impaired.
Under IFRS, an impairment charge is required for both goodwill and other indefinite lived intangible assets when the carrying amount exceeds the ‘recoverable amount’. The term ‘recoverable amount’ as used in IFRS has the same meaning as ‘fair value’under US GAAP, with fair value usually determined as the present value of future cash flows. Impairment charges recorded under IFRS amounted to £46.0 million and £40.6 million respectively, in 2005 and 2004. The impairment charges relate to certain under-performing businesses during each respective period where the impact of the economic climate on these businesses during each respective period was sufficiently severe to indicate impairment to the carrying value of goodwill. For further details on the Company’s annual impairment review, see note 14 to the consolidated financial statements.
Additional impairment charges of £22.7 million (£10.3 million related to Branding & identity,Healthcare and Specialist communications, £12.2 million related to Information, insight& consultancy and £0.2 million related to Advertising and Media investmentmanagement) and a charge of £10.2 million (£7.0 million related to Branding & identity,Healthcare and Specialist communications, £3.1 million related to Advertising andMedia investment management and £0.3 million related to Public relations & publicaffairs offset by a reduction of £0.2 million related to Information, insight & consultancy)were recorded under US GAAP in 2005 and 2004, respectively. Under UK GAAP,substantially all such impaired goodwill had been amortised or included in the write-offagainst share owners’ funds as at 1 January 1998, as more fully described in theGroup’s accounting policies. The cumulative difference in goodwill resulting fromincremental US GAAP impairment charges since the implementation of SFAS 142amounts to £73.9 million as at 31 December 2005.
Notes to the Reconciliation to US Accounting Principles

Our 2005 financial statements
Annual Report 2005Our 2005 financial statements 179
were recognised by adjusting net interest payable over the periods of the contract.Under US GAAP, the Group accounts for derivative instruments under SFAS 133,Accounting for Derivative Instruments and Hedging Activities. The Statement requiresthat every derivative instrument (including certain derivative instruments embedded inother contracts) be recorded in the balance sheet as either an asset or liability measuredat its fair value. It also requires that changes in the derivative’s fair value be recognisedcurrently in earnings unless specific hedge accounting criteria are met. Specialaccounting for qualifying hedges allows a derivative’s gains and losses to offset relatedresults on the hedged item in the income statement, and requires that a company mustformally document, designate, and assess the effectiveness of transactions that receivehedge accounting.
Effective 1 January 2005, under IFRS derivatives are recognised in the balance sheet at fair value. However, GAAP differences remain with respect to certain derivativesterminated prior to 1 January 2005 and hedge relationships designated under IFRSwith effect from that date, as follows:
(i) under the transitional provisions of IFRS, the Group has deferred the gains on swapsterminated prior to 1 January 2005 and is amortising them over the remaining life of theunderlying bond. Under US GAAP the gains were recognised through income prior totermination of the swaps and now reside in retained earnings. This is a transitional GAAPdifference and will continue until the gains deferred under IFRS are fully amortised.
(ii) under IFRS the Group has, for the first time, designated certain of its derivatives ashedging instruments in fair value hedge relationships with effect from 1 January 2005.Under US GAAP these derivatives were not designated as hedges. Consequently allchanges in fair value of these derivatives are recognised in the income statement attheir fair value, representing a continuing difference between IFRS and US GAAP.
In addition, under IFRS, option agreements that allow the Group’s equity partners to require the Group to purchase the minority interest are treated as derivatives overequity instruments and are recorded in the balance sheet at present value of expectedcash outflows. Under US GAAP, these options are recorded at their fair value.
(d) Pension accountingUnder IFRS, pension costs are accounted for in accordance with IAS 19, EmployeeBenefits. Under US GAAP, pension costs are determined in accordance with therequirements of Statement of Financial Accounting Standards No 87, Employers’Accounting for Pensions (SFAS 87) and SFAS 88, Employers’ Accounting andSettlements and Curtailments of Defined Benefit Pension Plans and for Termination Benefits.
The differences in accounting policy are primarily due to differing treatment of actuarialgains and losses which arise over the accounting period (as a result of investmentreturns and demographic assumptions differing from those previously assumed, andalso the effect of changing actuarial assumptions). Under IAS 19, these actuarial gainsand losses are immediately recognised in the Statement of Recognised Income andExpense (‘SORIE’), whereas under SFAS 87 the actuarial gains and losses that at thebeginning of the year exceed 10% of the greater of the value of the assets and theprojected benefit obligation, are amortised over the future working lifetime of thescheme members.
IAS 19 also requires the cost of prior service costs to be expensed over the period inwhich the benefit vests, whereas SFAS 87 provides for these costs to be amortisedover the future service periods of those employees active at the date of the amendmentwho are expected to receive benefits under the plan.
Further, SFAS 87 requires the recognition of an additional liability to the extent that theliability in respect of any scheme does not cover the unfunded accumulated benefitobligation for that scheme.
The 2005 financial statements reflect a £15.9 million (2004: £9.5 million) difference inthe defined benefit pensions charge between IFRS and US GAAP. This is largely due tothe fact that the Group’s defined benefit schemes have experienced actuarial losses inrecent years, primarily due to poor investment returns. The US GAAP charges thereforeinclude an amortisation component in respect of these losses, which is not reflected inthe IFRS charge.
The differences between IAS 19 and SFAS 87 represent continuing GAAP differences.
(e) Employer payroll taxesUnder IFRS, provisions for National Insurance contributions are required to be measuredinitially at the date of grant of share options and recognised over the vesting period.Under US GAAP, National Insurance contributions with respect to share options are recognised on the date of the event triggering the measurement and payment of thecontribution, which is generally the exercise date. This represents a continuingdifference between IFRS and US GAAP.
(f) Tax itemsDeferred taxesUnder both IFRS and US GAAP deferred taxes are accounted for on all temporarydifferences unless specifically excepted by the standards. Deferred tax differencesprincipally arise as a result of additional temporary differences between the IFRS and USGAAP carrying values of assets and liabilities relative to their tax bases, as described indetail throughout these Notes to the Reconciliation to US Accounting Principles.
Treatment of pre-acquisition lossesUnder IFRS (IAS 12, Income Taxes), the tax effect of the recognition of the asset in respect of the utilisation of pre-acquisition losses may be taken to the incomestatement. Under US GAAP, the tax effect of the recognition of the asset in respect of the utilisation of pre-acquisition losses is recorded to goodwill directly and has noimpact on tax expense. In 2005, the adjustment for tax items includes £nil (2004:£6.5 million) of tax expense resulting from the utilisation of pre-acquisition losses and a £1.1 million reversal (2004: £12.6 million) of associated goodwill write-off recordedunder IAS 12.
Share-based paymentsUnder US GAAP, deferred tax assets for share awards are recorded based on therecorded compensation expense. Under IFRS, deferred tax assets are recognisedbased on the intrinsic gain at the year end. The amount recognised in the incomestatement is capped at the tax effected share award charge, with any excess beingrecognised directly in equity.
(g) Other investmentsUnder IFRS, other investments are classified as available-for-sale. They are recordedat fair value with changes in fair value being reported in equity. Under US GAAP, suchinvestments are also considered available for sale but are only reported at fair valuewhen they are listed. Unlisted investments are carried at cost less any provision forother than temporary impairment, representing a continuing difference between IFRSand US GAAP.
(h) Recognition of liabilitiesUnder US GAAP, in accordance with the provisions of SFAS 140, Accounting forTransfers and Servicing of Financial Assets and Extinguishments of Liabilities, liabilitiesare released when the underlying legal obligation becomes completely extinguished.Under IFRS, since the Group did not apply IAS 39 in respect of the year ended 31 December 2004, as permitted under IFRS 1, the requirement for liabilities to havebeen legally extinguished in order for derecognition to occur was not applied until 1 January 2005. This was a transitional difference between IFRS and US GAAP.
(i) Convertible debtUnder IFRS, convertible debt is classified into both liability and equity elements, as described in the note on accounting policies in the financial statements. Under US GAAP, APB 14, Accounting for Convertible Debt and Debt Issued with StockPurchase Warrants, requires the issuer of a conventional convertible debt instrumentissued without a substantial discount to account for the convertible debt entirely as a liability. In addition, consideration is also given to whether the conversion featureshould be separated pursuant to SFAS 133, Accounting for Derivative Instruments and Hedging Activities. The differences between IFRS and US GAAP will continue.
2 Earnings per share – reconciliation from IFRS toUS GAAP
Both basic and diluted earnings per share under US GAAP have been calculated bydividing the net income as adjusted for US GAAP differences by the weighted averagenumber of shares in issue during the year. Under IFRS, the Group’s convertible bondswere accretive in 2005 and therefore excluded from the calculation. Under US GAAP,the Group’s convertible bonds were accretive in both 2005 and 2004. Details on thesecurities are included in the note to the consolidated financial statements on earningsper share.
3 New US GAAP accounting pronouncements
The Group has considered the following recent US GAAP accounting pronouncementscovering topics that may be applicable to our operations for their potential impact onour results of operations and financial position:
(i) Adopted in the current year:
SFAS 123RIn December 2004, the Financial Accounting Standards Board (FASB) issued SFAS123 (revised 2004), Share-Based Payment (SFAS 123R). SFAS 123R replaces SFAS123 and supersedes APB 25. SFAS 123R requires that the cost resulting from allshare-based payment transactions be recognised in the financial statements at fairvalue. SFAS 123R is effective for the Group from 1 January 2006, but early adoption is encouraged. The Group has elected to adopt SFAS 123R effective 1 January 2004using the modified retrospective method.
Under the modified retrospective method, from the effective date, compensation costis recognised based on the requirements of SFAS 123R for all new share-basedawards and based on the requirements of SFAS 123 for all awards granted prior to theeffective date of SFAS 123R that remain unvested on the effective date. The impact onthe 2004 US GAAP financial statements was to reduce net income by £22.9 million.
The FASB issued several FASB Staff Positions (FSPs) during 2005 and 2006 coveringtopics relating to SFAS 123R. These topics include:
•the classification of freestanding instruments (FSP SFAS 123R-1);•the clarification of definition of grant date (FSP SFAS 123R-2);•the transition election related to the tax effects of share-based awards
(FSP SFAS 123R-3); and•the treatment of a cash settlement feature that can be exercised only upon
the occurrence of a contingent event that is outside the employee’s control (FSP SFAS 123R-4).
The application of these FSPs did not have a material impact on the Group’sconsolidated results of operations or financial position.
EITF 05-6In June 2005 the Emerging Issues Task Force (EITF) reached a consensus on Issue 05-6,Determining the Amortisation Period for Leasehold Improvements Purchased after LeaseInception or Acquired in a Business Combination (EITF 05-6). EITF 05-6 requiresleasehold improvements acquired in a business combination to be amortised over theshorter of the useful life of the assets or a term that includes required lease periods andrenewals deemed to be reasonably assured at the date of acquisition. Additionally, theIssue requires improvements placed in service significantly after and not contemplatedat or near the beginning of the lease term to be amortised over the shorter of the useful

Our 2005 financial statements
Annual Report 2005Our 2005 financial statements180
life of the assets or a term that includes required lease periods and renewals deemed to be reasonably assured at the date the leasehold improvements are purchased. The adoption of EITF 05-6 has not had a material impact on the consolidated resultsof operations or financial position.
(ii) To be adopted in future periods:
SFAS 153In December 2004, the FASB issued SFAS 153, Exchanges of Nonmonetary Assets.SFAS 153 amends APB Opinion 29 replacing the exception from having to apply thefair value accounting provisions of APB 29 for non-monetary exchanges of similarproductive assets with a general exception for exchanges of non-monetary assets that do not have commercial substance. SFAS 153 is effective for the first reportingperiod beginning after 15 June 2005. We do not believe that the adoption of SFAS 153 will have a material impact on the Group’s consolidated results of operations orfinancial position.
SFAS 154In May 2005, SFAS 154, Accounting Changes and Error Corrections – replacement of APB Opinion No. 20 and FASB Statement No. 3, was issued. SFAS 154 changesthe accounting for and reporting of a change in accounting principle by requiringretrospective application to prior periods’ financial statements of changes in accounting principle unless impracticable. SFAS 154 is effective for accountingchanges made in fiscal years beginning after 15 December 2005. We do not believethat the adoption of SFAS 154 will impact the Group’s historical consolidated results of operations or financial position; rather the impact depends upon future changes toaccounting principles.
EITF 04-5In June 2005, the EITF reached a consensus on Issue 04-5, Determining Whether aGeneral Partner, or the General Partners as a Group, Controls a Limited Partnership orSimilar Entity When the Limited Partners Have Certain Rights (EITF 04-5), regardinghow to evaluate whether a partnership should be consolidated by one of its partners.The scope of this Issue is limited to limited partnerships or similar entities (such aslimited liability companies that have governing provisions that are the functionalequivalent of a limited partnership) that are not variable interest entities under FASBInterpretation 46(R). The EITF concluded that a general partner or a group of generalpartners of a limited partnership is presumed to control the limited partnership, unlesseither the limited partners have the substantive ability to dissolve the limited partnership or otherwise remove the general partner without cause or the limited partners havesubstantive participating rights. The guidance in the Issue is effective after 29 June2005 for general partners of all new limited partnerships formed and for existing limitedpartnerships for which the partnership agreements are modified. For general partners in all other pre-existing limited partnerships, the guidance in this Issue is effective nolater than the beginning of the first reporting period in fiscal years beginning after15 December 2005. We do not believe that the adoption of EITF 04-5 will have amaterial impact on the Group’s financial statements.
FSP SFAS 115-1/124-1In November 2005, the FASB issued FSP SFAS 115-1/124-1, the Meaning of Other-Than-Temporary Impairment and Its Application to Certain Investments. The guidancein this FSP addresses the determination of when an investment is considered impaired,whether that impairment is other than temporary, and the measurement of animpairment loss. The FSP also includes accounting considerations subsequent to therecognition of an other-than-temporary impairment and requires certain disclosuresabout unrealised losses that have not been recognised as other-than-temporaryimpairments. The guidance in FSP SFAS 115-1/124-1 shall be applied to reportingperiods beginning after 15 December 2005. The Group does not expect the adoptionof FSP SFAS 115-1/124-1 to have a material impact on its consolidated results ofoperations or financial position.
4 Supplemental discussion of presentational differences
Income StatementPension accountingThe 2005 IFRS defined benefit pensions charge includes net finance costs of £7.8million (2004: £9.5 million) that would be recognised as an operating expense underUS GAAP.
Equity accountingUnder IFRS, the Group’s share of results of associates is presented above profit beforeinterest and taxation. Under US GAAP, equity income is presented between income taxexpense and income from continuing operations.
Balance SheetDebtUnder IFRS the Group initially states debt as the amount of the net proceeds afterdeduction of issue costs. US GAAP requires such costs to be recorded as a deferredcharge and not as a reduction in the carrying value of the debt. The amount of issue costs included in debt at 31 December was £9.1 million (2004: £10.7 million).
Deferred TaxesUnder IFRS, the Group must disclose the gross deferred tax assets and liabilities asnon-current. Under US GAAP, deferred tax assets and liabilities are classified betweencurrent and non-current, depending on the items to which they relate, disclosedseparately and presented on a net basis, by tax jurisdiction.

Our 2005 financial statements
Annual Report 2005Our 2005 financial statements 181
Independent Auditors’ report to the members of WPP Group plc
We have audited the Group and individual companyfinancial statements of WPP Group plc for the year ended31 December 2005 which comprise the consolidatedincome statement, the consolidated and individual companybalance sheets, the consolidated cash flow statement, theconsolidated statement of recognised income and expenses,the related notes 1 to 37, transition to IFRS on pages 172to 176 and reconciliation to US accounting principles onpages 177 to 180. These financial statements have beenprepared under the accounting policies set out therein. We have also audited the information in the directors’remuneration report that is described as having been audited.
This report is made solely to the Company’smembers, as a body, in accordance with section 235 of theCompanies Act 1985. Our audit work has been undertakenso that we might state to the Company’s members thosematters we are required to state to them in an auditors’report and for no other purpose. To the fullest extentpermitted by law, we do not accept or assume responsibilityto anyone other than the Company and the Company’smembers as a body, for our audit work, for this report, or for the opinions we have formed.
Respective responsibilities of directors and auditors
The directors’ responsibilities for preparing the annualreport and the group financial statements in accordancewith applicable law and International Financial ReportingStandards (IFRS) as adopted for use in the European Unionand for preparing the parent individual company financialstatements and the directors’ remuneration report inaccordance with applicable law and United KingdomAccounting Standards (United Kingdom GenerallyAccepted Accounting Practice) are set out in the statementof directors’ responsibilities.
Our responsibility is to audit the financial statementsand the part of the directors’ remuneration report describedas having been audited in accordance with relevant UnitedKingdom legal and regulatory requirements andInternational Standards on Auditing (UK and Ireland).
Independent auditors’ report
We report to you our opinion as to whether thefinancial statements give a true and fair view in accordancewith the relevant financial reporting framework, whetherthe financial statements and the part of the directors’remuneration report described as having been audited havebeen properly prepared in accordance with the CompaniesAct 1985 and whether, in addition, the Group financialstatements have been properly prepared in accordance with Article 4 of the IAS Regulation. We report to you if, in our opinion, the directors’ report is not consistent withthe financial statements. We also report to you if theCompany has not kept proper accounting records, if wehave not received all the information and explanations werequire for our audit, or if information specified by lawregarding directors’ remuneration and other transactions is not disclosed.
We also report to you if, in our opinion, theCompany has not complied with any of the four directors’remuneration disclosure requirements specified for ourreview by the Listing Rules of the Financial ServicesAuthority. These comprise the amount of each element in the remuneration package and information on shareoptions, details of long-term incentive schemes, and moneypurchase and defined benefit schemes. We give a statement,to the extent possible, of details of any non-compliance.
We review whether the corporate governancestatement reflects the Company’s compliance with the nineprovisions of the 2003 FRC Combined Code specified forour review by the Listing Rules of the Financial ServicesAuthority, and we report if it does not. We are not requiredto consider whether the Board’s statements on internalcontrol cover all risks and controls, or form an opinion on the effectiveness of the Group’s corporate governanceprocedures or its risk and control procedures.
We read the directors’ report and the otherinformation contained in the annual report for the aboveyear as described in the contents section including theunaudited part of the directors’ remuneration report andconsider the implications for our report if we become awareof any apparent misstatements or material inconsistencieswith the financial statements.

Our 2005 financial statements
Annual Report 2005Our 2005 financial statements182
Opinion
In our opinion:
• the Group financial statements give a true and fair view,in accordance with IFRSs as adopted for use in theEuropean Union, of the state of the Group’s affairs as at 31December 2005 and of its profit for the year then ended;
• the Group financial statements have been properlyprepared in accordance with the Companies Act 1985 andArticle 4 of the IAS Regulation;
• the individual company financial statements give a trueand fair view, in accordance with United KingdomGenerally Accepted Accounting Practice, of the state of theindividual company’s affairs as at 31 December 2005; and
• the individual company financial statements and the partof the directors’ remuneration report described as havingbeen audited have been properly prepared in accordancewith the Companies Act 1985.
Separate opinion in relation to IFRS
As explained in the accounting policies to the financialstatements, the Group, in addition to complying with itslegal obligation to comply with IFRS as adopted for use inthe European Union, has also complied with the IFRS asissued by the International Accounting Standards Board.Accordingly, in our opinion the financial statements give a true and fair view, in accordance with IFRS, of the state of the Group’s affairs as at 31 December 2005 and of itsprofit for the year then ended.
Deloitte & Touche LLPChartered Accountants and Registered Auditors
London11 May 2006
Basis of audit opinion
We conducted our audit in accordance with InternationalStandards on Auditing (UK and Ireland) issued by theAuditing Practices Board. An audit includes examination, on a test basis, of evidence relevant to the amounts anddisclosures in the financial statements and the part of thedirectors’ remuneration report described as having beenaudited. It also includes an assessment of the significantestimates and judgements made by the directors in thepreparation of the financial statements, and of whether theaccounting policies are appropriate to the Company’scircumstances, consistently applied and adequately disclosed.
We planned and performed our audit so as to obtainall the information and explanations which we considerednecessary in order to provide us with sufficient evidence to give reasonable assurance that the financial statementsand the part of the directors’ remuneration report to beaudited are free from material misstatement, whethercaused by fraud or other irregularity or error. In formingour opinion we also evaluated the overall adequacy of thepresentation of information in the financial statements andthe part of the directors’ remuneration report described ashaving been audited.

Our 2005 financial statements
Annual Report 2005Our 2005 financial statements 183
Five-year summary*
2005 2004 2003 2002 2001£m £m £m £m £m
Income statement
Turnover (billings) 26,673.7 19,598.0 18,621.3 18,028.7 20,886.9
Revenue 5,373.7 4,299.5 4,106.0 3,908.3 4,021.7
Operating profit 652.8 475.5 415.3 260.1 505.5
Headline PBIT1 754.8 560.2 533.5 467.8 561.1
Profit before taxation 592.0 434.4 349.9 193.0 411.0
Headline PBT2 669.0 489.6 473.4 388.2 493.6
Profit for the year 398.0 299.4 208.4 75.6 271.2
Balance sheet
Non-current assets 8,196.9 6,026.4 6,386.4 6,050.8 6,376.2
Net current liabilities (1,150.5) (504.0) (590.9) (524.3) (782.4)
Non-current trade and other payables (703.0) (536.6) (1,691.1) (1,837.5) (1,711.5)
Provisions for liabilities and charges (including provision for post-employment benefits) (363.1) (289.2) (288.6) (255.3) (241.4)
Net assets 3,985.8 3,065.7 3,815.8 3,433.7 3,640.9
Net debt (804.0) (300.4) (361.5) (722.7) (885.1)
Average net debt (1,212.0) (1,083.0) (1,222.0) (1,343.0) (834.0)
2005 2004 2003 2002 2001
Our people
Revenue per employee (£000) 75.8 74.4 79.6 77.5 79.7
Gross profit per employee (£000) 72.4 70.5 75.0 73.2 75.1
Average headcount 70,936 57,788 51,604 50,417 50,487
Share information
Headline3 – basic earnings per share 36.7p 28.9p 29.8p 24.4p 32.1p
– diluted earnings per share 36.0p 27.9p 29.0p 23.8p 30.9p
Reported – basic earnings per share 30.3p 24.0p 18.7p 6.8p 24.6p
– diluted earnings per share 29.7p 23.4p 18.2p 6.7p 23.7p
Dividends per share4 9.34p 7.78p 6.48p 5.40p 4.50p
Share price – high 630.5p 643p 596p 811p 889p
– low 534.5p 469.5p 320p 391p 460p
Market capitalisation at year-end (£m) 7,880.7 6,792.0 6,513.1 5,491.5 8,736.8
* Figures for 2005 and 2004 have been prepared in accordance with IFRS (International Financial Reporting Standards, incorporating International Accounting Standards), which the Group adopted in 2005.Figures for prior years have been prepared under UK GAAP, as previously disclosed in the Group’s Annual Report and Accounts for those years.
Notes1 The calculation of Headline PBIT for 2005 and 2004 is set out in note 32 of the financial statements. The calculation of Headline PBIT for prior years is set out in accordance with UK GAAP as previously
reported as follows: Profit before interest, taxation, goodwill amortisation and impairment and fixed asset gains and write-downs.2 The calculation of Headline PBT for 2005 and 2004 is set out in note 32 of the financial statements. The calculation of Headline PBT for prior years is set out in accordance with UK GAAP as previously
reported as follows: Profit before taxation, goodwill amortisation and impairment, fixed asset gains and write-downs and net interest charges on defined benefit pension schemes.3 Headline earnings per share for 2005 and 2004 is set out in note 32 of the financial statements. The calculation of Headline earnings per share for prior years is set out in accordance with UK GAAP as
previously reported and excludes goodwill amortisation and impairment, fixed asset gains and write-downs and net interest charges on defined benefit pension schemes.4 Dividends per share represents the dividends declared in respect of each year.
The information on this page is unaudited.

Our 2005 financial statements
Annual Report 2005Our 2005 financial statements184
Financial glossary
Term used in annual report US equivalent or brief description
Allotted Issued
ADRs/ADSs American Depositary Receipts/American Depositary Shares. The Groupuses the terms ADR and ADS interchangeably. One ADR/ADS representsfive ordinary shares
Average net debt Average net debt is calculated as the average daily net bank borrowings ofthe Group, derived from the Group’s automated banking system. Net debtat a period end is calculated as the sum of the net bank borrowings of theGroup, derived from the cash ledgers and accounts in the balance sheet
Called-up share capital Ordinary shares, issued and fully paid
Capital allowances Tax term equivalent to US tax depreciation allowances
Combined Code The ‘Principles of Good Governance’ and the provisions of the ‘Code ofBest Practice’ issued by the Hampel Committee on Corporate Governanceand the London Stock Exchange
Constant currency The Group uses US dollar-based, constant currency models to measureperformance. These are calculated by applying budgeted 2005 exchangerates to local currency reported results for the current and prior year. Thisgives a US dollar-denominated income statement and balance sheet whichexcludes any variances attributable to foreign exchange rate movements
ESOP Employee share ownership plan
Estimated net new billings Net new billings represent the estimated annualised impact on billings(turnover) of new business gained from both existing and new clients, net ofexisting client business lost. The estimated impact is based upon initialassessments of the clients’ media budgets, which may not necessarilyresult in actual billings of the same amount
EURIBOR The euro area inter-bank offered rate for euro deposits
Finance lease Capital lease
Free cash flow Free cash flow is calculated as headline operating profit before depreciationof property, plant and equipment and amortisation of other intangibleassets, including dividends received from associates, interest received,investment income received, proceeds from the issue of shares, andproceeds from the disposal of property, plant and equipment, lesscorporation and overseas tax paid, interest and similar charges paid,dividends paid to minority shareholders in subsidiary undertakings,purchases of property, plant and equipment and purchases of otherintangible assets
Freehold Ownership with absolute rights in perpetuity
Hampel Committee UK committee on corporate governance established in November 1995 to review the implementation of the findings of the Cadbury and Greenbury Committees
Headline earnings Headline PBT less taxation and minority interests
Headline EBITDA Profit before finance income/costs, taxation, investment gains and write-downs, goodwill impairment and other goodwill write-downs, amortisationof intangible assets and depreciation of property, plant and equipment

Our 2005 financial statements
Annual Report 2005Our 2005 financial statements 185
Term used in annual report US equivalent or brief description
Headline operating profit Operating profit before investment gains and write-downs, goodwillimpairment and other goodwill write-downs, and amortisation of acquiredintangible assets
Headline PBIT Profit before finance income/costs, taxation, investment gains and write-downs, goodwill impairment and other goodwill write-downs, and amortisation of acquired intangible assets
Headline PBT Profit before taxation, investment gains and write-downs, goodwillimpairment and other goodwill write-downs, amortisation of acquiredintangible assets and gains/losses arising from the revaluation of financial instruments
Higgs Report Report in the UK by Derek Higgs on the role and effectiveness of non-executive directors
IFRS/IAS International Financial Reporting Standard/International Accounting Standard
LIBOR The London inter-bank offered rate
Operating margin Headline PBIT as a percentage of revenue
Profit Income
Profit attributable to equity holders of the parent Net income
Pro forma (‘like-for-like’) Pro forma comparisons are calculated as follows: current year, constantcurrency actual results (which include acquisitions from the relevant date ofcompletion) are compared with prior year, constant currency actual results,adjusted to include the results of acquisitions for the commensurate periodin the prior year. The Group uses ‘pro forma’ and ‘like-for-like’interchangeably
Proposed dividend Dividend declared by directors but not yet approved by share owners
Provision against deferred tax assets Valuation allowance
Sarbanes-Oxley Act An Act passed in the US to protect investors by improving the accuracyand reliability of corporate disclosures made pursuant to the securitieslaws, and for other purposes
Share capital Ordinary shares, capital stock or common stock issued and fully paid
Share premium account Additional paid-in capital or paid-in surplus (not distributable)
Shares in issue Shares outstanding
Short leasehold A short lease is where the portion of the term remaining unexpired at theend of the financial year is less than 50 years
Smith Report Report in the UK by Sir Robert Smith on the role of audit committees
SORIE Consolidated statement of recognised income and expense
2004 UK GAAP UK Generally Accepted Accounting Principles (‘UK GAAP’) extant inrespect of 2004 – the basis of preparation of the Group’s consolidatedfinancial statements for the year ended 31 December 2004, as previouslyreported, prior to the implementation of International Financial ReportingStandards (‘IFRS’)
Turnbull Report Guidance issued by the Institute of Chartered Accountants in England &Wales on the implementation of the internal control requirements of theCombined Code on Corporate Governance at the request of the LondonStock Exchange

About share ownership
Annual Report 2005About share ownership186

About share ownership
Annual Report 2005About share ownership 187
Share owners’ register
A register of share owners’ interests is kept at the Company’s head office and is available for inspection on request. The register includes information on nominee accounts and their beneficial owners.
Analysis of shareholdings at 31 December 2005
Issued share capital as at 31 December 2005: 1,252,899,372 ordinary shares.
Dividends
Ordinary share owners have received the following dividends in respect of each financial year:
2005 2004 2003 2002 2001
Interim dividend per ordinary share 3.00p 2.50p 2.08p 1.73p 1.44p
Final (2005 proposed) dividend per ordinary share 6.34p 5.28p 4.40p 3.67p 3.06p
Total 9.34p 7.78p 6.48p 5.40p 4.50p
Share owners by type • Institutional investors 95%
• Employees 4%
• Other individuals 1%
Share owners by geography • UK 41%
• US 43%
• Asia Pacific, Latin America, Africa & Middle East and Continental Europe 16%
Share owners by geography % Share owners by type %
UK 41 Institutional investors 95
US 43 Employees 4
Asia Pacific, Latin America, Africa & Middle East and Continental Europe 16 Other individuals 1
Total 100 Total 100
Number of shares held Number of owners % Total of shares %
1 – 100 2,529 21.85 87,568 0.01
101 – 250 1,412 12.20 260,158 0.02
251 – 500 1,736 15.00 664,517 0.05
501 – 1,000 1,997 17.26 1,568,866 0.13
1,001 – 5,000 2,269 19.61 5,072,496 0.40
5,001 – 10,000 333 2.88 2,410,547 0.19
10,001 – 25,000 333 2.88 5,347,362 0.43
25,001 – 50,000 198 1.71 7,257,025 0.58
50,001 – 100,000 191 1.65 13,424,057 1.07
100,001 – 500,000 298 2.58 70,256,611 5.61
500,001 – 1,000,000 102 0.88 73,637,393 5.88
1,000,001 – 2,000,000 70 0.60 97,998,383 7.82
2,000,001 – 3,000,000 31 0.27 78,614,473 6.27
3,000,001 – 4,000,000 15 0.13 51,595,702 4.12
4,000,001 and above 58 0.50 844,704,214 67.42
Totals 11,572 100 1,252,899,372 100

About share ownership
Annual Report 2005About share ownership188
American Depositary Receipts (ADRs)
Each ADR represents five ordinary shares.ADR holders receive the annual and interim reports
issued by WPP Group plc.WPP Group plc is subject to the informational
requirements of the US securities laws applicable to foreigncompanies and files an annual report on Form 20-F andother information with the US Securities and ExchangeCommission. These documents are available at theCommission’s website, www.sec.gov. Our reports on Form 20-F are also available from our Investor Relationsdepartments in London or New York.
ADR dividends
ADR holders are eligible for all stock dividends or otherentitlements accruing on the underlying WPP Group plcshares and receive all cash dividends in US dollars. Theseare normally paid twice a year.
Dividend cheques are mailed directly to the ADRholder on the payment date if ADRs are registered withWPP’s US depositary. Dividends on ADRs that are registeredwith brokers are sent to the brokers, who forward them to ADR holders. WPP’s US depositary is Citibank N.A.(address on page 189).
Dividends per ADR in respect of each financial yearare set out below.
Notes1 These figures have been translated for convenience purposes only, using the approximate averagerate for the year shown on page 150. This conversion should not be construed as a representationthat the pound sterling amounts actually represent, or could be converted into, US dollars at therates indicated.
In US dollars1
Interim 27.28¢ 22.91¢ 17.01¢ 13.00¢ 10.40¢
Final (2005 proposed) 57.66¢ 48.38¢ 35.98¢ 27.60¢ 22.00¢
Total 84.94¢ 71.29¢ 52.99¢ 40.60¢ 32.40¢
2005 2004 2003 2002 2001
In £ sterling
Interim 15.00p 12.50p 10.40p 8.65p 7.20p
Final (2005 proposed) 31.70p 26.40p 22.00p 18.35p 15.30p
Total 46.70p 38.90p 32.40p 27.00p 22.50p
Dollar amounts paid to ADR holders depend onthe sterling/dollar exchange rate at the time of payment.
No withholding tax is imposed on dividends paid toADR holders and there will be no entitlement to offset anypart of the notional UK taxation credit against any UStaxation liability. The dividend received will be subject toUS taxation.
Following the Jobs and Growth Tax ReliefReconciliation Act of 2003, certain dividends subject to US taxation may be taxed at a reduced rate of 15% ifvarious conditions are met; share owners are advised to consult their professional advisors accordingly.
Financial calendar
•The 2005 final dividend will be paid on 3 July 2006to share owners on the register at 2 June 2006.
• Interim statements for the half-year ending 30 June areissued in August.
•Quarterly trading announcements are issued in April and October.
• Interim dividends are paid in November.
•Preliminary announcements of results for the financialyear ending 31 December are issued in February.
•Annual reports are posted to share owners in May/June.
•Annual General Meetings are held in London in June.
Share price
The mid-market price of the shares at 31 Decemberwas as follows:
Within the UK, the latest ordinary share price informationis available on Ceefax and Teletext and also the Citylineservice operated by the Financial Times (telephone 0906843 4544; calls charged at 60p per minute at all times).
Share price information is also available online atwww.wpp.com/investor.
2005 2004 2003 2002 2001
Ordinary 10p shares 629.0p 573.0p 548.5p 474.5p 760.0p

About share ownership
WPP registered office
Pennypot Industrial EstateHytheKent CT21 6PE
The Company’s registered number is 05537577.
Tax information
Reclaiming income tax on dividendsFor all dividends, the tax credit available to individual shareowners resident in the UK is one-ninth of the dividend; taxcredits are not repayable to UK holders with no tax liability.Individuals whose income is within the lower or basic taxrate bands are liable to tax at 10% on the dividend incomeand the tax credit will satisfy their income tax liability on UKdividends. The higher rate of tax on dividend income is 32.5%with relief available for the tax credit referred to above.
Capital gains taxThe market value of an ordinary share at 31 March 1982was 39p. Since that date rights issues have occurred inSeptember 1986, August 1987 and April 1993. For capitalgains tax purposes the acquisition cost of ordinary shares is adjusted to take account of such rights issues. Since anyadjustments will depend on individual circumstances, shareowners are advised to consult their professional advisors.
Access numbers/Ticker symbols
Online information
WPP’s public website, www.wpp.com, provides current andhistorical financial information, news releases, trading reportsand share price information. Go to www.wpp.com/investor
Registrar and transfer office
Computershare Investor Services PLCPO Box 82The PavilionsBridgwater RoadBristol BS99 7NH
General enquiry number: 0870 702 0000
American Depositary Receipts (ADRs) office
Citibank N.A.PO Box 43077ProvidenceRI 02940-3077
Telephone enquiries: within the US 1 877 248 4237Telephone enquiries: outside the US 1 781 575 4555E-mail enquiries: [email protected]
NASDAQ Reuters Bloomberg
Ordinary shares – WPP.L WPP LN
American Depositary Shares WPPGY WPPGY.O WPPGY US
Annual Report 2005About share ownership 189

Where to find us
Annual Report 2005Where to find us190

Annual Report 2005Where to find us 191
WPP London
27 Farm StreetLondon W1J 5RJTel +44 (0)20 7408 2204Fax +44 (0)20 7493 6819
WPP New York
125 Park AvenueNew York NY 10017-5529Tel +1 (212) 632 2200Fax +1 (212) 632 2222
WPP Asia Pacific
Stuart NeishTel +81 90 9688 1951Fax +852 2280 [email protected]
WPP Latin America
Ann NewmanTel +1 (212) 632 2275Fax +1 (212) 632 [email protected]
Contact points
Investor relations
Paul RichardsonGroup finance directorTel +1 (212) 632 2200Fax +1 (212) 632 [email protected]
Chris SweetlandDeputy Group finance directorTel +44 (0)20 7408 2204Fax +44 (0)20 7493 [email protected]
Fran ButeraInvestor relations directorTel +1 (212) 632 2235Fax +1 (212) 632 [email protected]
Investor information
Investor relations material and our financialstatements are available online atwww.wpp.com/investor
Media relations
Feona McEwanGroup communications directorTel +44 (0)20 7408 2204Fax +44 (0)20 7493 [email protected]
Kevin McCormackUS press officerTel +1 (212) 632 2239Fax +1 (212) 632 [email protected]
Group information
If you would like further general informationabout WPP, its companies or any of theprograms, publications or initiativesmentioned in this report, please visit ourwebsite: www.wpp.com or contact:
Feona McEwan or Scott Spiritat WPP in LondonTel +44 (0)20 7408 2204Fax +44 (0)20 7493 [email protected]@wpp.com
Kevin McCormackat WPP in New YorkTel +1 (212) 632 2200Fax +1 (212) 632 [email protected]
e.wire, our monthly online bulletin providinga round-up of news from around the WPP world, is automatically delivered tosubscribers’ e-mail addresses. Register toreceive e.wire at www.wpp.com
Recognition for WPPAnnual Reports
2006 Finalist in Design Week Awards 2005 Accountancy Age, Winner2005 Ranked No.5 in Global Top 200 in
Annual Report on Annual Reports(“A+ worldclass”)
2005 Ranked No.9 (out of 1,435worldwide entries) to feature in Top 100 Annual Reports of 2004,LACP Vision Awards
2005 Platinum Award for Best in Class,LACP Vision Awards
2005 Platinum Award for Most EngagingAnnual Report across all categoriesof companies, LACP Vision Awards
2005 Ranked No.3 in European Annual Report Top 60 by e.com and Real IR magazine
2004 Ranked No.13 in Global Top 200 inAnnual Report on Annual Reports(“A- superior report”)
2003 Platinum Award, LACP Vision Awards2003 Gold Award, Most Creative Annual
Report, LACP Vision Awards2003 Accountancy Age, Runner-up2002 Silver Award, LACP Vision Awards2001 Commendation, ProShare Awards2000 Commendation, ProShare Awards1999 ProShare Award Winner, Best Annual
Report for Private Investors in a FTSE 100 Company (for secondconsecutive year)
1999 Silver D&AD Award to WPP DirectorJeremy Bullmore, for his essayPolishing the Apples
Written and produced by WPPIllustrations by Bhajju ShyamPortraits by Christain Oth and Andy WilsonDesigned by Addison Corporate MarketingPrinted in the UK by St Ives Westerham Press Ltd©WPP 2006
Where to find us

hajju Shyam, who produced the extraordinary graphic forms in this report, had no ordinary entry into the art world. Not forhim the confines of art school. Instead, it was his mother whoset him on a creative path when he was a child growing up in the forests of central India. Bhajju says: “My mother paintedthe walls of our home – as is our tradition – and she would ask
me to help her paint the parts she couldn’t reach.”Bhajju Shyam was born in 1971 in Patangarh village in Madhya
Pradesh state. He belongs to the Gonds, a tribal community with a highlyvisual tradition. Their work is painted on the mud walls of their houses –telling stories of creation, animals, deities and village life. Gond peoplebelieve good luck comes to those who see a good image. This communityart is also a form of prayer, unconcerned with western realistic imperativesfor perspective and lighting. It is form, geometry, intricate pattern andiconography that drive their powerful creativity.
This is not to say that Gond art is locked in the past. A morecommercial form has evolved in the past decades as Gond artists havemigrated to Bhopal, capital of Madhya Pradesh. There they have createdworks on paper and canvas – using pens and acrylic colour, rather than the palette of four earth colours employed at home.
Bhajju followed this route, leaving his village at 16 to work as night-watchman in Bhopal – until his uncle, a celebrated Gond artist, took him on as an apprentice. Bhajju initially painted out his uncle’s work, but soonmade a name for himself, exhibiting in France, Britain and Russia.
Fifteen years after he left his village, he achieved a breakthrough in theWest with The London Jungle Book* (Tara Publishing). The title is a sly referenceto Kipling’s book, which mythologises the animals of the Indian forest.
It was through the book and a show at the Museum of Londonthat Bhajju came to the attention of WPP. At first it appeared that thecollaboration would never come together. Bhajju speaks no English and itwas only through an Ogilvy staff member in India that he was eventuallycontacted. It took two years to bring the project to fruition; Bhajju was busywith other work. But we didn’t give up. No other Indian artist we saw cameclose to Bhajju’s work.
WPP, as a global company, has always looked on India with admirationand respect. This creative partnership symbolises that relationship brilliantly.
About the illustrator
Annual Report 2005About the illustrations192 *Available from www.tarabooks.com


AdvertisingMedia investment management
Information, insight & consultancyPublic relations & public affairs
Branding & identityHealthcare communications
Direct, promotion & relationship marketingSpecialist communications
27 Farm StreetLondon W1J 5RJ
Telephone +44 (0)20 7408 2204Fax +44 (0)20 7493 6819
125 Park AvenueNew York NY 10017-5529
Telephone +1 (212) 632 2200Fax +1 (212) 632 2222
www.wpp.com
Annual Report &Accounts 2005
Annual R
eport&A
ccounts 2005