2005-2006 Profile of Aberdeen School District 06-1 - South ...
336
General $3,695,587 Capital Outlay $612,962 Pension $35,641 Special Education $852,589 Ending Fund Balance Bond Redemption $1,888,035 Capital Projects $1,515,414 Other Fund Data Agricultural $3.19 Non-Ag Z $4.19 Owner Occupied $5.13 Other Non-Ag/Utilities $11.00 Special Education $1.25 Bond Redemption $1.33 Pension Fund $0.30 Capital Outlay $2.50 2005 Payable 2006 Levy per Thousand $6,943,272 $1,986,854 $0 General Aid Special Education Extraordinary Cost Fund - SE $8,930,126 Total State Aid State Aid Special Education Federal Flowthrough $808,740 IDEA Part B Part B, Sec. 619, PK $39,651 $848,391 Total K-12 Instruction $10,787,945 PK Instruction $0 Adult Instruction $0 $2,549,329 $332,892 $0 General Special Education Expenditures Community Services $0 Non-Programmed $121,872 Debt Service $0 Co-Curricular $1,139,273 $0 $48,933 $0 $0 Total Expenditures $18,381,045 $4,594,263 2005 Payable 2006 Taxable Valuations Agricultural $157,640,826 Owner Occupied $678,540,332 Non-Ag Z $4,145,768 Other Non-Ag/Utilities $425,883,971 Total $1,266,210,897 $33,815 15.5 29.2% 232.0 $34,463 Average Teacher Salary Experience Adjusted Salary Avg Years of Experience % with Advanced Degrees Certified Instructional Staff Teaching Staff Data ADM of Tuitioned Out Paid 5.081 General State Aid Adj. ADM 3,671.538 Non-Public / Home Sch ADM 859.056 ADM Data Local $9,389,961 County $291,187 State $7,506,118 Federal $1,271,073 Total $18,458,339 $3,225,769 $36,508 $0 $0 $1,546,338 $54,762 $1,986,854 $994,078 General Capital Outlay Special Education Pension $3,262,277 $4,582,032 $368,749 Revenue Classroom Staff 1.0 ADM of Contracted Out Paid 0.000 Other Special Revenue $0 314 S Main St, Aberdeen, SD 57401 2005-2006 Profile of Aberdeen School District 06-1 Capital Outlay Pension Student/Staff Services Administration Services Transportation Services Other Support Services Enterprise Funds Cost per ADM General Fund Only Revenue Expenditures * Includes General, Special Education and Pension Funds Home County: Brown Area in Square Miles: 421 2005 K-12 Fall Enrollment: 3,690 $368,749 $0 $0 $0 $0 $0 $0 $0 $0 $1,502,650 $1,567,328 $137,956 $3,124,021 $769,054 $0 $96,682 $1,085,345 $0 $0 $1,426,140 $59,977 $1,279,255 $153,100 $230,755 $0 $0 $0 $0 $0 $0 $357,000 $0 $0 $4,917 Educational Funds* $6,088 $1,708,237 $100,603 $7,894 $1,454,758 $1,359,474 $3,679,909 $357,000 $242,711
-
Upload
khangminh22 -
Category
Documents
-
view
0 -
download
0
Transcript of 2005-2006 Profile of Aberdeen School District 06-1 - South ...

General $3,695,587Capital Outlay $612,962
Pension $35,641Special Education $852,589
Ending Fund Balance
Bond Redemption $1,888,035Capital Projects $1,515,414
Other Fund Data
Agricultural $3.19Non-Ag Z $4.19Owner Occupied $5.13Other Non-Ag/Utilities $11.00Special Education $1.25
Bond Redemption $1.33Pension Fund $0.30
Capital Outlay $2.50
2005 Payable 2006 Levy per Thousand
$6,943,272$1,986,854
$0
General AidSpecial EducationExtraordinary Cost Fund - SE
$8,930,126Total State Aid
State Aid
Special Education Federal Flowthrough
$808,740IDEA Part BPart B, Sec. 619, PK $39,651
$848,391Total
K-12 Instruction $10,787,945PK Instruction $0Adult Instruction $0
$2,549,329$332,892
$0
General Special Education
Expenditures
Community Services $0Non-Programmed $121,872Debt Service $0Co-Curricular $1,139,273
$0$48,933
$0$0
Total Expenditures $18,381,045 $4,594,263
2005 Payable 2006Taxable Valuations
Agricultural $157,640,826Owner Occupied $678,540,332Non-Ag Z $4,145,768Other Non-Ag/Utilities $425,883,971Total $1,266,210,897
$33,81515.5
29.2%232.0
$34,463Average Teacher SalaryExperience Adjusted SalaryAvg Years of Experience% with Advanced DegreesCertified Instructional Staff
Teaching Staff Data
ADM of Tuitioned Out Paid 5.081
General State Aid Adj. ADM 3,671.538Non-Public / Home Sch ADM 859.056
ADM Data
Local $9,389,961County $291,187State $7,506,118Federal $1,271,073Total $18,458,339
$3,225,769$36,508
$0$0
$1,546,338$54,762
$1,986,854$994,078
General Capital Outlay Special Education Pension
$3,262,277 $4,582,032 $368,749
Revenue
Classroom Staff 1.0
ADM of Contracted Out Paid 0.000
Other Special Revenue $0
314 S Main St, Aberdeen, SD 57401
2005-2006 Profile of Aberdeen School District 06-1
Capital Outlay Pension
Student/Staff ServicesAdministration ServicesTransportation ServicesOther Support Services
Enterprise Funds
Cost per ADM
General Fund Only
Revenue Expenditures
* Includes General, Special Education and Pension Funds
Home County: BrownArea in Square Miles: 421
2005 K-12 Fall Enrollment: 3,690
$368,749$0$0$0
$0$0
$0$0$0
$1,502,650$1,567,328
$137,956$3,124,021
$769,054$0
$96,682$1,085,345
$0$0
$1,426,140$59,977
$1,279,255$153,100$230,755
$0
$0$0$0$0$0
$357,000$0$0
$4,917Educational Funds* $6,088
$1,708,237$100,603
$7,894$1,454,758 $1,359,474
$3,679,909 $357,000
$242,711

December 2005 Federal Child Count
0Deaf-Blind
7166
29
DeafSpeech/Language
Autism
48Emotionally Disturbed72
1145
1041
Mental RetardationHearing ImpairedLearning DisabledMultiple DisabilitiesOrthopedic ImpairmentVisually Impaired
94
353
Other Health Impaired
Traumatic Brain InjuryDevelopmental Delay
633Total
1
0
095
00
251
202
71
7
6
0
Home
Early Childhood Setting
PT Early Child and SEEarly Childhood SE Setting
Separate SchoolResidential Facility
Regular Classroom
Resource Room
Self-Contained Classroom
Day Program
24 Hour Program
Home/Hospital Program
Special Education Placement Categories
Total 633
Student to Staff Ratio 15.8
K-8 2,398.7419-12 1,081.829
2,493.4241,174.908
ADA ADM
Total 3,480.570 3,668.332
Student Data
PK-12 Enrollment 3,690Open Enrolled Students Rec'd 65District Dropout Rate 2.4%
% Special Needs Students 17.2%% Eligible for Free/Red. Lunch 21.9%
Students Transported 331
District Attendance RateNumber of Graduates
94.9%243
Enrollment
Stanford Achievement Test Series, Tenth Edition (SAT10)
73
77
78
60
68
70
Math
Social Science
Language Arts
Reading
Complete Battery
Science
Stanford Writing Assessment Program, Third Edition
Grade 5
Grade 9
American College Test (ACT)
Grade 5Total
PRSpEd
PR
Number Tested
English
171
66%
52
71
68
38
52
55
Total PR
Sp Ed PR
71
72
66
66
70
68
32
39
34
25
32
33
77
73
67
59
80
71
22
29
31
16
25
25
63%
Grade 4 Grade 3Total
PRSp Ed
PR
Grade 6Total
PRSp Ed
PR
279 302 26043 27 17
Sp EdTotal
Number Tested
Grade 7Total
PRSp Ed
PR
Grade 8 Total
PRSp Ed
PR
Grade 11Total
PRSp Ed
PR
MathReadingScienceComposite Score
22.121.320.8
21.521.5
77 54
75 56
81 61
70 44
71 47
73 52
273 45
79 44
77 63
79 50
70 40
70 39
74 46
68 25
67 28
67 34
67 40
68 31
67 31
73 35
74 39
70 36
75 37
65 29
69 34
22242 30269 35271
Percent Proficient or Higher
No assessment data are reported when less than ten students were tested.
Ideas and Development
Sp EdTotal
Organization, Unity, and Coherence
Sp EdTotal
Word Choice
Sp EdTotal
Sentences and Paragraphs
Sp EdTotal
Grammer and Usage
Sp EdTotal
Writing Mechanics
Sp EdTotal
NumberTested
57% 60% 61%
64%
46%
60%
56%
70%
48%
71%
243
284

General $1,453,102Capital Outlay $527,015
Pension $50,702Special Education $269,877
Ending Fund Balance
Bond Redemption $0Capital Projects $0
Other Fund Data
Agricultural $3.19Non-Ag Z $4.19Owner Occupied $5.13Other Non-Ag/Utilities $11.00Special Education $0.60
Bond Redemption $0.00Pension Fund $0.00
Capital Outlay $0.85
2005 Payable 2006 Levy per Thousand
$503,643$0$0
General AidSpecial EducationExtraordinary Cost Fund - SE
$503,643Total State Aid
State Aid
Special Education Federal Flowthrough
$62,959IDEA Part BPart B, Sec. 619, PK $3,549
$66,508Total
K-12 Instruction $1,250,128PK Instruction $0Adult Instruction $0
$182,446$0$0
General Special Education
Expenditures
Community Services $0Non-Programmed $0Debt Service $0Co-Curricular $128,351
$0$0$0$0
Total Expenditures $3,059,493 $238,088
2005 Payable 2006Taxable Valuations
Agricultural $306,347,372Owner Occupied $27,238,863Non-Ag Z $2,980,284Other Non-Ag/Utilities $26,087,695Total $362,654,214
$31,39318.3
3.2%30.4
$32,256Average Teacher SalaryExperience Adjusted SalaryAvg Years of Experience% with Advanced DegreesCertified Instructional Staff
Teaching Staff Data
ADM of Tuitioned Out Paid 0.000
General State Aid Adj. ADM 332.976Non-Public / Home Sch ADM 13.000
ADM Data
Local $1,617,342County $70,169State $583,901Federal $105,521Total $2,376,934
$291,020$13
$0$0
$216,104$11
$0$67,576
General Capital Outlay Special Education Pension
$291,034 $283,690 $1,250
Revenue
Classroom Staff 0.0
ADM of Contracted Out Paid 0.000
Other Special Revenue $0
500 8th St, Onida, SD 57564-205
2005-2006 Profile of Agar-Blunt-Onida School District 58-3
Capital Outlay Pension
Student/Staff ServicesAdministration ServicesTransportation ServicesOther Support Services
Enterprise Funds
Cost per ADM
General Fund Only
Revenue Expenditures
* Includes General, Special Education and Pension Funds
Home County: SullyArea in Square Miles: 1,169
2005 K-12 Fall Enrollment: 296
$1,250$0$0$0
$0$0
$0$0$0
$157,830$364,375
$48,335$1,110,475
$9,172$0$0
$163,653$0$0$0
$10,016
$55,466$176
$0$0
$0$0$0$0$0$0$0$0
$10,365Educational Funds* $11,172
$0$0$0
$85,502 $94,136
$245,453 $0
$62,612

December 2005 Federal Child Count
0Deaf-Blind
012
0
DeafSpeech/Language
Autism
1Emotionally Disturbed10
19000
Mental RetardationHearing ImpairedLearning DisabledMultiple DisabilitiesOrthopedic ImpairmentVisually Impaired
6
03
Other Health Impaired
Traumatic Brain InjuryDevelopmental Delay
42Total
3
1
05
00
29
4
0
0
0
0
Home
Early Childhood Setting
PT Early Child and SEEarly Childhood SE Setting
Separate SchoolResidential Facility
Regular Classroom
Resource Room
Self-Contained Classroom
Day Program
24 Hour Program
Home/Hospital Program
Special Education Placement Categories
Total 42
Student to Staff Ratio 10.4
K-8 188.1829-12 95.615
194.773100.206
ADA ADM
Total 283.797 294.979
Student Data
PK-12 Enrollment 315Open Enrolled Students Rec'd 9District Dropout Rate 2.0%
% Special Needs Students 13.3%% Eligible for Free/Red. Lunch 20.8%
Students Transported 26
District Attendance RateNumber of Graduates
96.2%25
Enrollment
Stanford Achievement Test Series, Tenth Edition (SAT10)
83
80
73
58
76
74
Math
Social Science
Language Arts
Reading
Complete Battery
Science
Stanford Writing Assessment Program, Third Edition
Grade 5
Grade 9
American College Test (ACT)
Grade 5Total
PRSpEd
PR
Number Tested
English
16
93%
Total PR
Sp Ed PR
73
74
72
76
80
75
77
73
58
54
70
66
81%
Grade 4 Grade 3Total
PRSp Ed
PR
Grade 6Total
PRSp Ed
PR
26 20 283 5
Sp EdTotal
Number Tested
Grade 7Total
PRSp Ed
PR
Grade 8 Total
PRSp Ed
PR
Grade 11Total
PRSp Ed
PR
MathReadingScienceComposite Score
22.520.721.0
22.421.9
95
84
92
85
88
88
18
81
75
81
64
82
77
95
76
80
72
76
82
79
72
67
78
68
72
114 525 220
Percent Proficient or Higher
No assessment data are reported when less than ten students were tested.
Ideas and Development
Sp EdTotal
Organization, Unity, and Coherence
Sp EdTotal
Word Choice
Sp EdTotal
Sentences and Paragraphs
Sp EdTotal
Grammer and Usage
Sp EdTotal
Writing Mechanics
Sp EdTotal
NumberTested
86% 86% 79%
89%
50%
93%
64%
85%
57%
89%
14
27

General $963,165Capital Outlay $136,512
Pension $217,498Special Education $23,119
Ending Fund Balance
Bond Redemption $0Capital Projects $110,644
Other Fund Data
Agricultural $4.78Non-Ag Z $6.28Owner Occupied $7.69Other Non-Ag/Utilities $16.48Special Education $1.40
Bond Redemption $0.00Pension Fund $0.30
Capital Outlay $1.80
2005 Payable 2006 Levy per Thousand
$728,895$0$0
General AidSpecial EducationExtraordinary Cost Fund - SE
$728,895Total State Aid
State Aid
Special Education Federal Flowthrough
$94,726IDEA Part BPart B, Sec. 619, PK $10,378
$105,104Total
K-12 Instruction $1,222,835PK Instruction $0Adult Instruction $0
$212,162$33,009
$0
General Special Education
Expenditures
Community Services $0Non-Programmed $0Debt Service $0Co-Curricular $102,916
$0$0$0$0
Total Expenditures $2,127,952 $364,736
2005 Payable 2006Taxable Valuations
Agricultural $140,140,182Owner Occupied $33,534,328Non-Ag Z $1,285,233Other Non-Ag/Utilities $16,306,516Total $191,266,259
$31,64519.4
19.4%29.5
$33,397Average Teacher SalaryExperience Adjusted SalaryAvg Years of Experience% with Advanced DegreesCertified Instructional Staff
Teaching Staff Data
ADM of Tuitioned Out Paid 0.923
General State Aid Adj. ADM 364.616Non-Public / Home Sch ADM 19.928
ADM Data
Local $1,297,689County $90,326State $796,792Federal $110,979Total $2,295,786
$314,608$0$0$0
$261,849$0$0
$101,247
General Capital Outlay Special Education Pension
$314,608 $363,096 $64,054
Revenue
Classroom Staff 1.0
ADM of Contracted Out Paid 0.000
Other Special Revenue $0
102 E 5th, Alcester, SD 57001-0198
2005-2006 Profile of Alcester-Hudson School District 61-1
Capital Outlay Pension
Student/Staff ServicesAdministration ServicesTransportation ServicesOther Support Services
Enterprise Funds
Cost per ADM
General Fund Only
Revenue Expenditures
* Includes General, Special Education and Pension Funds
Home County: UnionArea in Square Miles: 174
2005 K-12 Fall Enrollment: 333
$64,054$0$0$0
$0$0
$52,042$0$0
$134,223$244,492$131,203$292,283
$11,051$0
$22,098$143,447
$0$0$0$0
$103,020$13,031
$0$3,513
$6,782$9,446
$0$7,360
$0$0$0
$3,238
$6,455Educational Funds* $7,686
$0$18,018
$0$114,584 $120,391
*District has opted out of General Fund levy
$251,887 $78,867
$75,291

December 2005 Federal Child Count
0Deaf-Blind
025
0
DeafSpeech/Language
Autism
0Emotionally Disturbed20
31300
Mental RetardationHearing ImpairedLearning DisabledMultiple DisabilitiesOrthopedic ImpairmentVisually Impaired
5
01
Other Health Impaired
Traumatic Brain InjuryDevelopmental Delay
67Total
0
3
06
00
50
8
0
0
0
0
Home
Early Childhood Setting
PT Early Child and SEEarly Childhood SE Setting
Separate SchoolResidential Facility
Regular Classroom
Resource Room
Self-Contained Classroom
Day Program
24 Hour Program
Home/Hospital Program
Special Education Placement Categories
Total 67
Student to Staff Ratio 11.4
K-8 191.2339-12 127.760
195.465132.712
ADA ADM
Total 318.993 328.177
Student Data
PK-12 Enrollment 349Open Enrolled Students Rec'd 4District Dropout Rate 2.1%
% Special Needs Students 19.2%% Eligible for Free/Red. Lunch 23.6%
Students Transported 177
District Attendance RateNumber of Graduates
97.2%39
Enrollment
Stanford Achievement Test Series, Tenth Edition (SAT10)
90
75
80
80
78
80
Math
Social Science
Language Arts
Reading
Complete Battery
Science
Stanford Writing Assessment Program, Third Edition
Grade 5
Grade 9
American College Test (ACT)
Grade 5Total
PRSpEd
PR
Number Tested
English
26
48%
Total PR
Sp Ed PR
78
68
67
66
64
68
74
83
69
62
83
75
62%
Grade 4 Grade 3Total
PRSp Ed
PR
Grade 6Total
PRSp Ed
PR
23 18 314 3
Sp EdTotal
Number Tested
Grade 7Total
PRSp Ed
PR
Grade 8 Total
PRSp Ed
PR
Grade 11Total
PRSp Ed
PR
MathReadingScienceComposite Score
22.620.021.0
21.821.5
79
72
69
83
81
77
20 7
94
87
77
73
80
84
87
72
70
68
73
75
88
78
73
69
73
76
215 128 226
Percent Proficient or Higher
No assessment data are reported when less than ten students were tested.
Ideas and Development
Sp EdTotal
Organization, Unity, and Coherence
Sp EdTotal
Word Choice
Sp EdTotal
Sentences and Paragraphs
Sp EdTotal
Grammer and Usage
Sp EdTotal
Writing Mechanics
Sp EdTotal
NumberTested
69% 62% 69%
66%
77%
59%
62%
66%
62%
62%
13
29
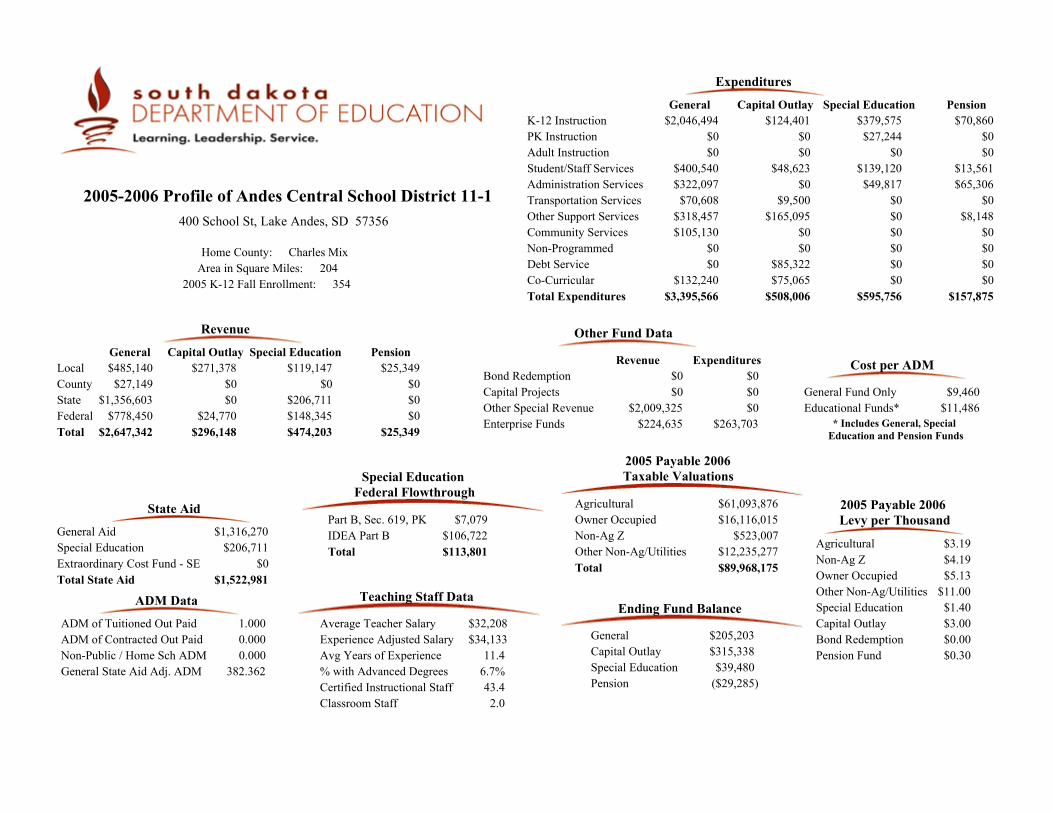
General $205,203Capital Outlay $315,338
Pension ($29,285)Special Education $39,480
Ending Fund Balance
Bond Redemption $0Capital Projects $0
Other Fund Data
Agricultural $3.19Non-Ag Z $4.19Owner Occupied $5.13Other Non-Ag/Utilities $11.00Special Education $1.40
Bond Redemption $0.00Pension Fund $0.30
Capital Outlay $3.00
2005 Payable 2006 Levy per Thousand
$1,316,270$206,711
$0
General AidSpecial EducationExtraordinary Cost Fund - SE
$1,522,981Total State Aid
State Aid
Special Education Federal Flowthrough
$106,722IDEA Part BPart B, Sec. 619, PK $7,079
$113,801Total
K-12 Instruction $2,046,494PK Instruction $0Adult Instruction $0
$379,575$27,244
$0
General Special Education
Expenditures
Community Services $105,130Non-Programmed $0Debt Service $0Co-Curricular $132,240
$0$0$0$0
Total Expenditures $3,395,566 $595,756
2005 Payable 2006Taxable Valuations
Agricultural $61,093,876Owner Occupied $16,116,015Non-Ag Z $523,007Other Non-Ag/Utilities $12,235,277Total $89,968,175
$34,13311.4
6.7%43.4
$32,208Average Teacher SalaryExperience Adjusted SalaryAvg Years of Experience% with Advanced DegreesCertified Instructional Staff
Teaching Staff Data
ADM of Tuitioned Out Paid 1.000
General State Aid Adj. ADM 382.362Non-Public / Home Sch ADM 0.000
ADM Data
Local $485,140County $27,149State $1,356,603Federal $778,450Total $2,647,342
$271,378$0$0
$24,770
$119,147$0
$206,711$148,345
General Capital Outlay Special Education Pension
$296,148 $474,203 $25,349
Revenue
Classroom Staff 2.0
ADM of Contracted Out Paid 0.000
Other Special Revenue $0
400 School St, Lake Andes, SD 57356
2005-2006 Profile of Andes Central School District 11-1
Capital Outlay Pension
Student/Staff ServicesAdministration ServicesTransportation ServicesOther Support Services
Enterprise Funds
Cost per ADM
General Fund Only
Revenue Expenditures
* Includes General, Special Education and Pension Funds
Home County: Charles MixArea in Square Miles: 204
2005 K-12 Fall Enrollment: 354
$25,349$0$0$0
$0$0
$70,860$0$0
$400,540$322,097
$70,608$318,457
$48,623$0
$9,500$165,095
$0$0
$85,322$75,065
$139,120$49,817
$0$0
$13,561$65,306
$0$8,148
$0$0$0$0
$9,460Educational Funds* $11,486
$0$0
$2,009,325$224,635 $263,703
$508,006 $157,875
$124,401

December 2005 Federal Child Count
0Deaf-Blind
017
1
DeafSpeech/Language
Autism
2Emotionally Disturbed50
34221
Mental RetardationHearing ImpairedLearning DisabledMultiple DisabilitiesOrthopedic ImpairmentVisually Impaired
1
025
Other Health Impaired
Traumatic Brain InjuryDevelopmental Delay
90Total
0
0
1910
00
45
14
1
0
1
0
Home
Early Childhood Setting
PT Early Child and SEEarly Childhood SE Setting
Separate SchoolResidential Facility
Regular Classroom
Resource Room
Self-Contained Classroom
Day Program
24 Hour Program
Home/Hospital Program
Special Education Placement Categories
Total 90
Student to Staff Ratio 8.3
K-8 271.0199-12 62.938
282.09265.177
ADA ADM
Total 333.957 347.269
Student Data
PK-12 Enrollment 375Open Enrolled Students Rec'd 0District Dropout Rate 3.0%
% Special Needs Students 24.0%% Eligible for Free/Red. Lunch 80.7%
Students Transported 178
District Attendance RateNumber of Graduates
96.2%12
Enrollment
Stanford Achievement Test Series, Tenth Edition (SAT10)
71
66
59
41
56
61
Math
Social Science
Language Arts
Reading
Complete Battery
Science
Stanford Writing Assessment Program, Third Edition
Grade 5
Grade 9
American College Test (ACT)
Grade 5Total
PRSpEd
PR
Number Tested
English
12
50%
Total PR
Sp Ed PR
52
62
66
47
52
54
43
58
49
44
52
49
50%
Grade 4 Grade 3Total
PRSp Ed
PR
Grade 6Total
PRSp Ed
PR
34 29 116 4 1
Sp EdTotal
Number Tested
Grade 7Total
PRSp Ed
PR
Grade 8 Total
PRSp Ed
PR
Grade 11Total
PRSp Ed
PR
MathReadingScienceComposite Score
19.220.519.6
20.620.0
64
44
59
43
44
51
29 6
46
47
47
39
37
43
58
47
44
56
45
50
44
54
45
48
35
43
233 327 533
Percent Proficient or Higher
No assessment data are reported when less than ten students were tested.
Ideas and Development
Sp EdTotal
Organization, Unity, and Coherence
Sp EdTotal
Word Choice
Sp EdTotal
Sentences and Paragraphs
Sp EdTotal
Grammer and Usage
Sp EdTotal
Writing Mechanics
Sp EdTotal
NumberTested
43% 29% 37%
40%
17%
40%
26%
35%
29%
60%
35
20

General $734,002Capital Outlay $606,530
Pension $141,652Special Education $52,837
Ending Fund Balance
Bond Redemption $300,290Capital Projects $51,867
Other Fund Data
Agricultural $3.99Non-Ag Z $5.24Owner Occupied $6.42Other Non-Ag/Utilities $13.76Special Education $1.40
Bond Redemption $2.36Pension Fund $0.30
Capital Outlay $3.00
2005 Payable 2006 Levy per Thousand
$938,727$95,967
$0
General AidSpecial EducationExtraordinary Cost Fund - SE
$1,034,694Total State Aid
State Aid
Special Education Federal Flowthrough
$56,141IDEA Part BPart B, Sec. 619, PK $2,112
$58,253Total
K-12 Instruction $920,454PK Instruction $25,997Adult Instruction $0
$179,471$12,266
$0
General Special Education
Expenditures
Community Services $0Non-Programmed $4,966Debt Service $0Co-Curricular $143,381
$0$0$0$0
Total Expenditures $1,909,744 $346,371
2005 Payable 2006Taxable Valuations
Agricultural $85,698,619Owner Occupied $26,345,076Non-Ag Z $1,410,618Other Non-Ag/Utilities $17,593,233Total $131,047,546
$31,7049.4
3.7%24.0
$28,916Average Teacher SalaryExperience Adjusted SalaryAvg Years of Experience% with Advanced DegreesCertified Instructional Staff
Teaching Staff Data
ADM of Tuitioned Out Paid 1.000
General State Aid Adj. ADM 364.818Non-Public / Home Sch ADM 10.860
ADM Data
Local $870,132County $22,165State $1,000,595Federal $95,588Total $1,988,480
$396,842$0$0$0
$179,533$0
$95,967$53,851
General Capital Outlay Special Education Pension
$396,842 $329,352 $39,040
Revenue
Classroom Staff 0.0
ADM of Contracted Out Paid 0.000
Other Special Revenue $0
306 S Main, Arlington, SD 57212
2005-2006 Profile of Arlington School District 38-1
Capital Outlay Pension
Student/Staff ServicesAdministration ServicesTransportation ServicesOther Support Services
Enterprise Funds
Cost per ADM
General Fund Only
Revenue Expenditures
* Includes General, Special Education and Pension Funds
Home County: KingsburyArea in Square Miles: 231
2005 K-12 Fall Enrollment: 315
$39,040$0$0$0
$0$0
$7,640$0$0
$123,049$239,088
$83,594$369,215
$0$0$0
$167,452$0$0
$91,228$0
$86,539$68,096
$0$0
$1,064$1,425
$85$1,966
$0$0$0
$705
$5,729Educational Funds* $6,726
$303,696$5,614
$0$137,508 $133,444
*District has opted out of General Fund levy
$258,680 $12,885
$0

December 2005 Federal Child Count
0Deaf-Blind
010
1
DeafSpeech/Language
Autism
1Emotionally Disturbed00
20800
Mental RetardationHearing ImpairedLearning DisabledMultiple DisabilitiesOrthopedic ImpairmentVisually Impaired
1
10
Other Health Impaired
Traumatic Brain InjuryDevelopmental Delay
42Total
0
2
00
00
36
2
1
0
1
0
Home
Early Childhood Setting
PT Early Child and SEEarly Childhood SE Setting
Separate SchoolResidential Facility
Regular Classroom
Resource Room
Self-Contained Classroom
Day Program
24 Hour Program
Home/Hospital Program
Special Education Placement Categories
Total 42
Student to Staff Ratio 13.7
K-8 200.6179-12 116.728
206.290121.157
ADA ADM
Total 317.345 327.447
Student Data
PK-12 Enrollment 329Open Enrolled Students Rec'd 20District Dropout Rate 0.0%
% Special Needs Students 12.8%% Eligible for Free/Red. Lunch 27.3%
Students Transported 133
District Attendance RateNumber of Graduates
96.9%33
Enrollment
Stanford Achievement Test Series, Tenth Edition (SAT10)
93
85
81
70
79
80
Math
Social Science
Language Arts
Reading
Complete Battery
Science
Stanford Writing Assessment Program, Third Edition
Grade 5
Grade 9
American College Test (ACT)
Grade 5Total
PRSpEd
PR
Number Tested
English
27
85%
Total PR
Sp Ed PR
78
85
71
62
60
71
79
67
56
53
68
64
76%
Grade 4 Grade 3Total
PRSp Ed
PR
Grade 6Total
PRSp Ed
PR
21 16 292 2 3
Sp EdTotal
Number Tested
Grade 7Total
PRSp Ed
PR
Grade 8 Total
PRSp Ed
PR
Grade 11Total
PRSp Ed
PR
MathReadingScienceComposite Score
22.222.120.2
21.621.6
88
76
77
73
82
80
24 5
82
69
82
64
74
75
79
71
73
63
71
71
84
72
58
59
59
67
123 127 528
Percent Proficient or Higher
No assessment data are reported when less than ten students were tested.
Ideas and Development
Sp EdTotal
Organization, Unity, and Coherence
Sp EdTotal
Word Choice
Sp EdTotal
Sentences and Paragraphs
Sp EdTotal
Grammer and Usage
Sp EdTotal
Writing Mechanics
Sp EdTotal
NumberTested
55% 59% 50%
76%
41%
73%
59%
82%
41%
91%
22
33

General $254,077Capital Outlay $506,120
Pension $2,043Special Education $79,814
Ending Fund Balance
Bond Redemption $0Capital Projects $0
Other Fund Data
Agricultural $3.19Non-Ag Z $4.19Owner Occupied $5.13Other Non-Ag/Utilities $11.00Special Education $1.40
Bond Redemption $0.00Pension Fund $0.30
Capital Outlay $3.00
2005 Payable 2006 Levy per Thousand
$680,629$18,513
$0
General AidSpecial EducationExtraordinary Cost Fund - SE
$699,142Total State Aid
State Aid
Special Education Federal Flowthrough
$34,685IDEA Part BPart B, Sec. 619, PK $587
$35,272Total
K-12 Instruction $727,498PK Instruction $7,247Adult Instruction $0
$84,643$2,362
$0
General Special Education
Expenditures
Community Services $28,368Non-Programmed $0Debt Service $0Co-Curricular $69,963
$0$0$0$0
Total Expenditures $1,315,839 $148,881
2005 Payable 2006Taxable Valuations
Agricultural $53,537,695Owner Occupied $13,926,808Non-Ag Z $301,512Other Non-Ag/Utilities $6,492,208Total $74,258,223
$27,95822.7
13.6%20.0
$30,227Average Teacher SalaryExperience Adjusted SalaryAvg Years of Experience% with Advanced DegreesCertified Instructional Staff
Teaching Staff Data
ADM of Tuitioned Out Paid 0.000
General State Aid Adj. ADM 215.417Non-Public / Home Sch ADM 1.000
ADM Data
Local $385,858County $11,415State $708,298Federal $107,752Total $1,213,323
$216,262$0$0$0
$94,492$0
$18,513$32,427
General Capital Outlay Special Education Pension
$216,262 $145,431 $21,129
Revenue
Classroom Staff 0.0
ADM of Contracted Out Paid 0.000
Other Special Revenue $0
604 3rd St, Armour, SD 57313
2005-2006 Profile of Armour School District 21-1
Capital Outlay Pension
Student/Staff ServicesAdministration ServicesTransportation ServicesOther Support Services
Enterprise Funds
Cost per ADM
General Fund Only
Revenue Expenditures
* Includes General, Special Education and Pension Funds
Home County: DouglasArea in Square Miles: 129
2005 K-12 Fall Enrollment: 182
$21,129$0$0$0
$0$0
$19,698$0$0
$70,510$158,012
$43,980$210,262
$3,442$0
$12,975$43,412
$0$0$0
$10,743
$61,875$0$0$0
$0$0$0$0$0$0$0$0
$7,081Educational Funds* $8,007
$0$0$0
$58,602 $58,507
$126,891 $19,698
$56,318

December 2005 Federal Child Count
0Deaf-Blind
01
0
DeafSpeech/Language
Autism
1Emotionally Disturbed306000
Mental RetardationHearing ImpairedLearning DisabledMultiple DisabilitiesOrthopedic ImpairmentVisually Impaired
9
00
Other Health Impaired
Traumatic Brain InjuryDevelopmental Delay
20Total
0
0
00
00
17
3
0
0
0
0
Home
Early Childhood Setting
PT Early Child and SEEarly Childhood SE Setting
Separate SchoolResidential Facility
Regular Classroom
Resource Room
Self-Contained Classroom
Day Program
24 Hour Program
Home/Hospital Program
Special Education Placement Categories
Total 20
Student to Staff Ratio 9.1
K-8 111.7989-12 62.410
114.13165.429
ADA ADM
Total 174.208 179.560
Student Data
PK-12 Enrollment 182Open Enrolled Students Rec'd 3District Dropout Rate 0.0%
% Special Needs Students 11.0%% Eligible for Free/Red. Lunch 30.0%
Students Transported 35
District Attendance RateNumber of Graduates
97.0%20
Enrollment
Stanford Achievement Test Series, Tenth Edition (SAT10)
93
80
85
64
84
83
Math
Social Science
Language Arts
Reading
Complete Battery
Science
Stanford Writing Assessment Program, Third Edition
Grade 5
Grade 9
American College Test (ACT)
Grade 5Total
PRSpEd
PR
Number Tested
English
12
82%
Total PR
Sp Ed PR
85
74
65
81
74
76
84
80
65
64
74
72
100%
Grade 4 Grade 3Total
PRSp Ed
PR
Grade 6Total
PRSp Ed
PR
9 15 181 2
Sp EdTotal
Number Tested
Grade 7Total
PRSp Ed
PR
Grade 8 Total
PRSp Ed
PR
Grade 11Total
PRSp Ed
PR
MathReadingScienceComposite Score
24.324.022.5
23.223.7
96
95
91
96
97
94
13
67
67
69
65
60
64
90
72
74
86
72
80
82
76
65
72
67
72
512 14 214
Percent Proficient or Higher
No assessment data are reported when less than ten students were tested.
Ideas and Development
Sp EdTotal
Organization, Unity, and Coherence
Sp EdTotal
Word Choice
Sp EdTotal
Sentences and Paragraphs
Sp EdTotal
Grammer and Usage
Sp EdTotal
Writing Mechanics
Sp EdTotal
NumberTested
50% 42% 50%
91%
50%
82%
50%
91%
42%
91%
12
11

General $793,426Capital Outlay $36,257
Pension ($11,602)Special Education $16,712
Ending Fund Balance
Bond Redemption $0Capital Projects $0
Other Fund Data
Agricultural $3.19Non-Ag Z $4.19Owner Occupied $5.13Other Non-Ag/Utilities $11.00Special Education $1.40
Bond Redemption $0.00Pension Fund $0.30
Capital Outlay $3.00
2005 Payable 2006 Levy per Thousand
$962,467$37,094
$0
General AidSpecial EducationExtraordinary Cost Fund - SE
$999,561Total State Aid
State Aid
Special Education Federal Flowthrough
$43,888IDEA Part BPart B, Sec. 619, PK $2,562
$46,450Total
K-12 Instruction $794,737PK Instruction $0Adult Instruction $0
$97,647$18,336
$0
General Special Education
Expenditures
Community Services $7,888Non-Programmed $0Debt Service $0Co-Curricular $133,911
$0$0$0$0
Total Expenditures $1,523,423 $183,302
2005 Payable 2006Taxable Valuations
Agricultural $63,412,959Owner Occupied $12,649,591Non-Ag Z $351,016Other Non-Ag/Utilities $4,859,060Total $81,272,626
$31,59013.9
20.0%18.4
$30,904Average Teacher SalaryExperience Adjusted SalaryAvg Years of Experience% with Advanced DegreesCertified Instructional Staff
Teaching Staff Data
ADM of Tuitioned Out Paid 1.749
General State Aid Adj. ADM 306.398Non-Public / Home Sch ADM 2.898
ADM Data
Local $417,227County $13,022State $994,728Federal $104,919Total $1,529,897
$241,641$0$0
$37,350
$108,811$0
$37,094$44,296
General Capital Outlay Special Education Pension
$278,991 $190,201 $23,264
Revenue
Classroom Staff 0.0
ADM of Contracted Out Paid 0.000
Other Special Revenue $0
210 Pine St, Avon, SD 57315
2005-2006 Profile of Avon School District 04-1
Capital Outlay Pension
Student/Staff ServicesAdministration ServicesTransportation ServicesOther Support Services
Enterprise Funds
Cost per ADM
General Fund Only
Revenue Expenditures
* Includes General, Special Education and Pension Funds
Home County: Bon HommeArea in Square Miles: 181
2005 K-12 Fall Enrollment: 263
$23,264$0$0$0
$0$0
$0$0$0
$67,856$189,688
$55,498$273,846
$0$4,256
$0$462,962
$0$0
$87,179$17,210
$67,319$0$0$0
$0$0$0$0$0
$34,530$0$0
$5,641Educational Funds* $6,394
$0$0$0
$91,861 $93,485
$621,214 $34,530
$49,607

December 2005 Federal Child Count
0Deaf-Blind
09
0
DeafSpeech/Language
Autism
1Emotionally Disturbed406100
Mental RetardationHearing ImpairedLearning DisabledMultiple DisabilitiesOrthopedic ImpairmentVisually Impaired
3
00
Other Health Impaired
Traumatic Brain InjuryDevelopmental Delay
24Total
0
0
12
00
19
2
0
0
0
0
Home
Early Childhood Setting
PT Early Child and SEEarly Childhood SE Setting
Separate SchoolResidential Facility
Regular Classroom
Resource Room
Self-Contained Classroom
Day Program
24 Hour Program
Home/Hospital Program
Special Education Placement Categories
Total 24
Student to Staff Ratio 14.4
K-8 166.3249-12 91.171
171.10093.976
ADA ADM
Total 257.495 265.076
Student Data
PK-12 Enrollment 265Open Enrolled Students Rec'd 56District Dropout Rate 0.0%
% Special Needs Students 9.1%% Eligible for Free/Red. Lunch 40.9%
Students Transported 0
District Attendance RateNumber of Graduates
97.1%19
Enrollment
Stanford Achievement Test Series, Tenth Edition (SAT10)
81
87
81
63
73
76
Math
Social Science
Language Arts
Reading
Complete Battery
Science
Stanford Writing Assessment Program, Third Edition
Grade 5
Grade 9
American College Test (ACT)
Grade 5Total
PRSpEd
PR
Number Tested
English
14
80%
Total PR
Sp Ed PR
77
73
65
68
67
70
85
74
69
71
79
75
76%
Grade 4 Grade 3Total
PRSp Ed
PR
Grade 6Total
PRSp Ed
PR
12 24 21 1
Sp EdTotal
Number Tested
Grade 7Total
PRSp Ed
PR
Grade 8 Total
PRSp Ed
PR
Grade 11Total
PRSp Ed
PR
MathReadingScienceComposite Score
21.821.621.3
22.321.8
72
65
71
59
63
66
20 2
87
84
87
70
67
80
91
73
78
77
63
77
82
78
76
74
63
74
316 126 17
Percent Proficient or Higher
No assessment data are reported when less than ten students were tested.
Ideas and Development
Sp EdTotal
Organization, Unity, and Coherence
Sp EdTotal
Word Choice
Sp EdTotal
Sentences and Paragraphs
Sp EdTotal
Grammer and Usage
Sp EdTotal
Writing Mechanics
Sp EdTotal
NumberTested
25% 25% 19%
76%
19%
84%
25%
76%
25%
80%
16
25

General $617,722Capital Outlay $259,412
PensionSpecial Education $52,415
Ending Fund Balance
Bond Redemption $270,986Capital Projects $5,071,449
Other Fund Data
Agricultural $3.19Non-Ag Z $4.19Owner Occupied $5.13Other Non-Ag/Utilities $11.00Special Education $1.40
Bond Redemption $3.37Pension Fund $0.30
Capital Outlay $2.00
2005 Payable 2006 Levy per Thousand
$1,138,982$109,505
$0
General AidSpecial EducationExtraordinary Cost Fund - SE
$1,248,487Total State Aid
State Aid
Special Education Federal Flowthrough
$59,082IDEA Part BPart B, Sec. 619, PK $1,137
$60,219Total
K-12 Instruction $1,058,289PK Instruction $485Adult Instruction $0
$189,606$17,542
$0
General Special Education
Expenditures
Community Services $0Non-Programmed $0Debt Service $0Co-Curricular $118,006
$0$0$0$0
Total Expenditures $1,999,675 $360,801
2005 Payable 2006Taxable Valuations
Agricultural $35,076,125Owner Occupied $59,218,624Non-Ag Z $1,318,536Other Non-Ag/Utilities $11,743,533Total $107,356,818
$32,70210.8
9.7%28.1
$29,854Average Teacher SalaryExperience Adjusted SalaryAvg Years of Experience% with Advanced DegreesCertified Instructional Staff
Teaching Staff Data
ADM of Tuitioned Out Paid 6.287
General State Aid Adj. ADM 399.622Non-Public / Home Sch ADM 7.039
ADM Data
Local $645,978County $18,774State $1,270,897Federal $58,618Total $1,994,267
$211,182$0$0$0
$139,336$0
$109,505$85,231
General Capital Outlay Special Education Pension
$211,182 $334,072 $31,177
Revenue
Classroom Staff 0.0
ADM of Contracted Out Paid 0.000
Other Special Revenue $0
One Bulldog Avenue, Baltic, SD 57003
2005-2006 Profile of Baltic School District 49-1
Capital Outlay Pension
Student/Staff ServicesAdministration ServicesTransportation ServicesOther Support Services
Enterprise Funds
Cost per ADM
General Fund Only
Revenue Expenditures
* Includes General, Special Education and Pension Funds
Home County: MinnehahaArea in Square Miles: 54
2005 K-12 Fall Enrollment: 359
$31,177$0$0$0
$0$0
$31,177$0$0
$206,056$246,852
$70,480$299,508
$4,846$0
$55,461$40,296
$0$0$0
$4,118
$89,766$9,196
$35,287$19,404
$0$0$0$0$0$0$0$0
$5,508Educational Funds* $6,270
$184,502$135,276
$0$139,480 $135,431
$144,966 $31,177
$40,245

December 2005 Federal Child Count
0Deaf-Blind
014
0
DeafSpeech/Language
Autism
3Emotionally Disturbed20
20100
Mental RetardationHearing ImpairedLearning DisabledMultiple DisabilitiesOrthopedic ImpairmentVisually Impaired
13
01
Other Health Impaired
Traumatic Brain InjuryDevelopmental Delay
54Total
0
4
01
00
39
8
0
1
1
0
Home
Early Childhood Setting
PT Early Child and SEEarly Childhood SE Setting
Separate SchoolResidential Facility
Regular Classroom
Resource Room
Self-Contained Classroom
Day Program
24 Hour Program
Home/Hospital Program
Special Education Placement Categories
Total 54
Student to Staff Ratio 12.8
K-8 251.7009-12 98.017
258.491102.789
ADA ADM
Total 349.717 361.280
Student Data
PK-12 Enrollment 359Open Enrolled Students Rec'd 40District Dropout Rate 0.6%
% Special Needs Students 15.0%% Eligible for Free/Red. Lunch 15.0%
Students Transported 98
District Attendance RateNumber of Graduates
96.8%20
Enrollment
Stanford Achievement Test Series, Tenth Edition (SAT10)
76
76
86
60
71
73
Math
Social Science
Language Arts
Reading
Complete Battery
Science
Stanford Writing Assessment Program, Third Edition
Grade 5
Grade 9
American College Test (ACT)
Grade 5Total
PRSpEd
PR
Number Tested
English
15
73%
Total PR
Sp Ed PR
80
74
67
69
70
72
70
73
62
59
72
67
77%
Grade 4 Grade 3Total
PRSp Ed
PR
Grade 6Total
PRSp Ed
PR
23 28 253 4 4
Sp EdTotal
Number Tested
Grade 7Total
PRSp Ed
PR
Grade 8 Total
PRSp Ed
PR
Grade 11Total
PRSp Ed
PR
MathReadingScienceComposite Score
22.522.523.0
23.823.0
66
54
57
64
51
58
23 6
87
76
90
75
69
79
69
58
59
54
50
58
82
74
69
77
69
74
121 633 423
Percent Proficient or Higher
No assessment data are reported when less than ten students were tested.
Ideas and Development
Sp EdTotal
Organization, Unity, and Coherence
Sp EdTotal
Word Choice
Sp EdTotal
Sentences and Paragraphs
Sp EdTotal
Grammer and Usage
Sp EdTotal
Writing Mechanics
Sp EdTotal
NumberTested
90% 86% 90%
69%
81%
73%
71%
62%
71%
73%
21
26

General $1,314,646Capital Outlay $464,912
Pension $150,243Special Education $316,904
Ending Fund Balance
Bond Redemption $198,698Capital Projects $0
Other Fund Data
Agricultural $3.19Non-Ag Z $4.19Owner Occupied $5.13Other Non-Ag/Utilities $11.00Special Education $1.40
Bond Redemption $0.81Pension Fund $0.30
Capital Outlay $3.00
2005 Payable 2006 Levy per Thousand
$3,892,259$675,921
$0
General AidSpecial EducationExtraordinary Cost Fund - SE
$4,568,180Total State Aid
State Aid
Special Education Federal Flowthrough
$242,039IDEA Part BPart B, Sec. 619, PK $6,018
$248,057Total
K-12 Instruction $3,987,756PK Instruction $0Adult Instruction $0
$843,723$79,508
$0
General Special Education
Expenditures
Community Services $0Non-Programmed $25,596Debt Service $0Co-Curricular $322,817
$0$0$0$0
Total Expenditures $6,777,127 $1,301,394
2005 Payable 2006Taxable Valuations
Agricultural $53,526,491Owner Occupied $133,989,555Non-Ag Z $2,409,530Other Non-Ag/Utilities $71,921,316Total $261,846,892
$31,63514.0
9.7%90.1
$32,157Average Teacher SalaryExperience Adjusted SalaryAvg Years of Experience% with Advanced DegreesCertified Instructional Staff
Teaching Staff Data
ADM of Tuitioned Out Paid 11.891
General State Aid Adj. ADM 1,283.337Non-Public / Home Sch ADM 66.925
ADM Data
Local $1,968,034County $58,195State $4,035,948Federal $814,256Total $6,876,432
$783,438$0$0$0
$371,171$0
$675,921$256,260
General Capital Outlay Special Education Pension
$783,438 $1,303,352 $78,989
Revenue
Classroom Staff 1.0
ADM of Contracted Out Paid 0.000
Other Special Revenue $0
2305 13th Avenue, Belle Fourche, SD 57717
2005-2006 Profile of Belle Fourche School District 09-1
Capital Outlay Pension
Student/Staff ServicesAdministration ServicesTransportation ServicesOther Support Services
Enterprise Funds
Cost per ADM
General Fund Only
Revenue Expenditures
* Includes General, Special Education and Pension Funds
Home County: ButteArea in Square Miles: 958
2005 K-12 Fall Enrollment: 1,285
$78,989$0$0$0
$0$0
$0$0$0
$489,988$667,008$163,203
$1,120,760
$0$0$0
$246,320$0$0
$424,993$8,619
$284,680$80,687$9,796$3,000
$0$0$0$0$0$0$0$0
$5,301Educational Funds* $6,100
$219,611$0$0
$495,120 $494,011
$762,167 $0
$82,236

December 2005 Federal Child Count
0Deaf-Blind
039
9
DeafSpeech/Language
Autism
8Emotionally Disturbed16
485
600
Mental RetardationHearing ImpairedLearning DisabledMultiple DisabilitiesOrthopedic ImpairmentVisually Impaired
25
114
Other Health Impaired
Traumatic Brain InjuryDevelopmental Delay
207Total
1
0
913
02
98
71
4
8
1
0
Home
Early Childhood Setting
PT Early Child and SEEarly Childhood SE Setting
Separate SchoolResidential Facility
Regular Classroom
Resource Room
Self-Contained Classroom
Day Program
24 Hour Program
Home/Hospital Program
Special Education Placement Categories
Total 207
Student to Staff Ratio 14.3
K-8 834.8799-12 379.806
878.535399.892
ADA ADM
Total 1,214.685 1,278.427
Student Data
PK-12 Enrollment 1,305Open Enrolled Students Rec'd 38District Dropout Rate 1.9%
% Special Needs Students 15.9%% Eligible for Free/Red. Lunch 41.3%
Students Transported 502
District Attendance RateNumber of Graduates
95.0%89
Enrollment
Stanford Achievement Test Series, Tenth Edition (SAT10)
68
61
61
51
59
59
Math
Social Science
Language Arts
Reading
Complete Battery
Science
Stanford Writing Assessment Program, Third Edition
Grade 5
Grade 9
American College Test (ACT)
Grade 5Total
PRSpEd
PR
Number Tested
English
54
59%
33
42
53
29
28
35
Total PR
Sp Ed PR
70
67
68
61
67
66
26
39
37
24
36
32
67
67
59
51
65
61
28
41
39
15
41
33
64%
Grade 4 Grade 3Total
PRSp Ed
PR
Grade 6Total
PRSp Ed
PR
99 128 9810 16 11
Sp EdTotal
Number Tested
Grade 7Total
PRSp Ed
PR
Grade 8 Total
PRSp Ed
PR
Grade 11Total
PRSp Ed
PR
MathReadingScienceComposite Score
22.421.620.2
21.421.5
55
65
61
50
60
57
87 7
54 14
64 37
69 23
55 24
54 15
57 20
58
65
58
60
56
59
62 28
64 42
67 55
66 42
59 30
62 36
1193 782 1291
Percent Proficient or Higher
No assessment data are reported when less than ten students were tested.
Ideas and Development
Sp EdTotal
Organization, Unity, and Coherence
Sp EdTotal
Word Choice
Sp EdTotal
Sentences and Paragraphs
Sp EdTotal
Grammer and Usage
Sp EdTotal
Writing Mechanics
Sp EdTotal
NumberTested
39% 35% 38%
53%
32%
51%
37%
65%
29%
64%
95
88

General $414,354Capital Outlay $193,784
Pension $1,540Special Education ($10,178)
Ending Fund Balance
Bond Redemption $0Capital Projects $57,789
Other Fund Data
Agricultural $3.19Non-Ag Z $4.19Owner Occupied $5.13Other Non-Ag/Utilities $11.00Special Education $1.40
Bond Redemption $0.00Pension Fund $0.30
Capital Outlay $3.00
2005 Payable 2006 Levy per Thousand
$1,767,357$192,282$100,016
General AidSpecial EducationExtraordinary Cost Fund - SE
$2,059,655Total State Aid
State Aid
Special Education Federal Flowthrough
$138,824IDEA Part BPart B, Sec. 619, PK $5,258
$144,082Total
K-12 Instruction $2,639,859PK Instruction $0Adult Instruction $0
$521,443$62,359
$0
General Special Education
Expenditures
Community Services $7,218Non-Programmed $0Debt Service $0Co-Curricular $111,118
$0$0$0$0
Total Expenditures $4,279,651 $640,453
2005 Payable 2006Taxable Valuations
Agricultural $100,669,685Owner Occupied $15,248,714Non-Ag Z $461,703Other Non-Ag/Utilities $7,152,080Total $123,532,182
$35,88815.1
15.7%50.1
$36,532Average Teacher SalaryExperience Adjusted SalaryAvg Years of Experience% with Advanced DegreesCertified Instructional Staff
Teaching Staff Data
ADM of Tuitioned Out Paid 0.882
General State Aid Adj. ADM 550.025Non-Public / Home Sch ADM 10.598
ADM Data
Local $693,313County $40,248State $1,854,870Federal $1,065,675Total $3,654,106
$352,748$0$0
$4,124
$164,612$0
$292,298$172,412
General Capital Outlay Special Education Pension
$356,872 $629,322 $35,214
Revenue
Classroom Staff 0.0
ADM of Contracted Out Paid 0.000
Other Special Revenue $0
402 2nd Ave, Martin, SD 57551
2005-2006 Profile of Bennett County School District 03-1
Capital Outlay Pension
Student/Staff ServicesAdministration ServicesTransportation ServicesOther Support Services
Enterprise Funds
Cost per ADM
General Fund Only
Revenue Expenditures
* Includes General, Special Education and Pension Funds
Home County: BennettArea in Square Miles: 1,191
2005 K-12 Fall Enrollment: 537
$35,214$0$0$0
$0$0
$84,611$0$0
$263,501$431,542$202,176$624,237
$0$0
$57,429$67,879
$0$0$0
$7,248
$56,651$0$0$0
$1,282$18,547
$0$0$0$0$0
$2,974
$7,906Educational Funds* $9,132
$0$0
$458,676$189,519 $195,975
$261,883 $107,413
$129,328

December 2005 Federal Child Count
0Deaf-Blind
024
0
DeafSpeech/Language
Autism
1Emotionally Disturbed81
39001
Mental RetardationHearing ImpairedLearning DisabledMultiple DisabilitiesOrthopedic ImpairmentVisually Impaired
8
17
Other Health Impaired
Traumatic Brain InjuryDevelopmental Delay
90Total
4
3
85
00
58
8
2
1
1
0
Home
Early Childhood Setting
PT Early Child and SEEarly Childhood SE Setting
Separate SchoolResidential Facility
Regular Classroom
Resource Room
Self-Contained Classroom
Day Program
24 Hour Program
Home/Hospital Program
Special Education Placement Categories
Total 90
Student to Staff Ratio 11.4
K-8 359.1079-12 143.169
382.388158.018
ADA ADM
Total 502.276 540.406
Student Data
PK-12 Enrollment 571Open Enrolled Students Rec'd 21District Dropout Rate 5.5%
% Special Needs Students 15.8%% Eligible for Free/Red. Lunch 34.1%
Students Transported 288
District Attendance RateNumber of Graduates
92.9%30
Enrollment
Stanford Achievement Test Series, Tenth Edition (SAT10)
54
57
54
42
50
50
Math
Social Science
Language Arts
Reading
Complete Battery
Science
Stanford Writing Assessment Program, Third Edition
Grade 5
Grade 9
American College Test (ACT)
Grade 5Total
PRSpEd
PR
Number Tested
English
28
54%
Total PR
Sp Ed PR
68
60
62
57
63
61
61
63
45
37
58
50
54%
Grade 4 Grade 3Total
PRSp Ed
PR
Grade 6Total
PRSp Ed
PR
50 49 286 2 7
Sp EdTotal
Number Tested
Grade 7Total
PRSp Ed
PR
Grade 8 Total
PRSp Ed
PR
Grade 11Total
PRSp Ed
PR
MathReadingScienceComposite Score
20.119.617.4
19.019.1
62
58
58
50
55
57
45 3
61
59
58
55
47
55
71
56
62
65
62
63
54
49
44
44
41
45
538 739 444
Percent Proficient or Higher
No assessment data are reported when less than ten students were tested.
Ideas and Development
Sp EdTotal
Organization, Unity, and Coherence
Sp EdTotal
Word Choice
Sp EdTotal
Sentences and Paragraphs
Sp EdTotal
Grammer and Usage
Sp EdTotal
Writing Mechanics
Sp EdTotal
NumberTested
46% 40% 46%
41%
37%
50%
34%
55%
31%
63%
35
56
1

General $825,636Capital Outlay $581,018
Pension $75,302Special Education $174,534
Ending Fund Balance
Bond Redemption $341,765Capital Projects $0
Other Fund Data
Agricultural $3.66Non-Ag Z $4.81Owner Occupied $5.89Other Non-Ag/Utilities $12.62Special Education $1.40
Bond Redemption $1.30Pension Fund $0.30
Capital Outlay $2.00
2005 Payable 2006 Levy per Thousand
$1,846,173$112,996
$0
General AidSpecial EducationExtraordinary Cost Fund - SE
$1,959,169Total State Aid
State Aid
Special Education Federal Flowthrough
$124,594IDEA Part BPart B, Sec. 619, PK $4,230
$128,824Total
K-12 Instruction $2,064,097PK Instruction $0Adult Instruction $0
$414,144$33,997
$0
General Special Education
Expenditures
Community Services $0Non-Programmed $0Debt Service $0Co-Curricular $130,627
$0$0$0$0
Total Expenditures $3,361,135 $636,637
2005 Payable 2006Taxable Valuations
Agricultural $162,027,090Owner Occupied $69,138,254Non-Ag Z $1,347,448Other Non-Ag/Utilities $30,971,087Total $263,483,879
$31,79017.1
36.2%43.6
$34,405Average Teacher SalaryExperience Adjusted SalaryAvg Years of Experience% with Advanced DegreesCertified Instructional Staff
Teaching Staff Data
ADM of Tuitioned Out Paid 2.443
General State Aid Adj. ADM 685.634Non-Public / Home Sch ADM 12.603
ADM Data
Local $1,400,679County $134,786State $2,063,223Federal $268,511Total $3,867,198
$503,972$0$0$0
$468,032$0
$112,996$121,491
General Capital Outlay Special Education Pension
$503,972 $702,518 $75,424
Revenue
Classroom Staff 0.0
ADM of Contracted Out Paid 0.000
Other Special Revenue $0
209 South Fourth St, Beresford, SD 57004-2107
2005-2006 Profile of Beresford School District 61-2
Capital Outlay Pension
Student/Staff ServicesAdministration ServicesTransportation ServicesOther Support Services
Enterprise Funds
Cost per ADM
General Fund Only
Revenue Expenditures
* Includes General, Special Education and Pension Funds
Home County: UnionArea in Square Miles: 204
2005 K-12 Fall Enrollment: 708
$75,424$0$0$0
$0$0
$0$0$0
$169,255$384,397$156,869$455,890
$5,482$1,399
$79,903$97,280
$0$0$0
$1,907
$135,918$45,756$6,822
$0
$0$0$0$0$0$0$0$0
$4,666Educational Funds* $5,345
$327,378$0$0
$263,920 $277,105
*District has opted out of General Fund levy
$317,000 $0
$131,027

December 2005 Federal Child Count
0Deaf-Blind
022
2
DeafSpeech/Language
Autism
7Emotionally Disturbed01
32600
Mental RetardationHearing ImpairedLearning DisabledMultiple DisabilitiesOrthopedic ImpairmentVisually Impaired
7
01
Other Health Impaired
Traumatic Brain InjuryDevelopmental Delay
78Total
0
0
54
00
47
8
2
1
11
0
Home
Early Childhood Setting
PT Early Child and SEEarly Childhood SE Setting
Separate SchoolResidential Facility
Regular Classroom
Resource Room
Self-Contained Classroom
Day Program
24 Hour Program
Home/Hospital Program
Special Education Placement Categories
Total 78
Student to Staff Ratio 16.4
K-8 450.4579-12 226.727
466.506236.823
ADA ADM
Total 677.184 703.329
Student Data
PK-12 Enrollment 714Open Enrolled Students Rec'd 69District Dropout Rate 0.5%
% Special Needs Students 10.9%% Eligible for Free/Red. Lunch 18.0%
Students Transported 313
District Attendance RateNumber of Graduates
96.3%56
Enrollment
Stanford Achievement Test Series, Tenth Edition (SAT10)
89
77
81
72
73
77
Math
Social Science
Language Arts
Reading
Complete Battery
Science
Stanford Writing Assessment Program, Third Edition
Grade 5
Grade 9
American College Test (ACT)
Grade 5Total
PRSpEd
PR
Number Tested
English
51
85%
Total PR
Sp Ed PR
74
65
62
48
57
61
75
69
59
43
70
63
77%
Grade 4 Grade 3Total
PRSp Ed
PR
Grade 6Total
PRSp Ed
PR
53 61 559 2 2
Sp EdTotal
Number Tested
Grade 7Total
PRSp Ed
PR
Grade 8 Total
PRSp Ed
PR
Grade 11Total
PRSp Ed
PR
MathReadingScienceComposite Score
21.621.921.5
21.621.8
87
75
78
79
76
77
47 7
90
79
89
71
67
80
79
70
84
64
54
70
74
58
67
60
60
64
347 751 158
Percent Proficient or Higher
No assessment data are reported when less than ten students were tested.
Ideas and Development
Sp EdTotal
Organization, Unity, and Coherence
Sp EdTotal
Word Choice
Sp EdTotal
Sentences and Paragraphs
Sp EdTotal
Grammer and Usage
Sp EdTotal
Writing Mechanics
Sp EdTotal
NumberTested
85% 89% 83%
72%
70%
68%
60%
74%
34%
68%
47
53

General $692,267Capital Outlay $44,142
Pension $14,146Special Education $88,421
Ending Fund Balance
Bond Redemption $0Capital Projects $0
Other Fund Data
Agricultural $5.25Non-Ag Z $6.90Owner Occupied $8.44Other Non-Ag/Utilities $18.10Special Education $1.35
Bond Redemption $0.00Pension Fund $0.30
Capital Outlay $1.26
2005 Payable 2006 Levy per Thousand
$318,192$29,345
$0
General AidSpecial EducationExtraordinary Cost Fund - SE
$347,537Total State Aid
State Aid
Special Education Federal Flowthrough
$22,109IDEA Part BPart B, Sec. 619, PK $541
$22,650Total
K-12 Instruction $646,790PK Instruction $0Adult Instruction $0
$92,281$0$0
General Special Education
Expenditures
Community Services $0Non-Programmed $0Debt Service $0Co-Curricular $14,423
$0$0$0$0
Total Expenditures $902,833 $93,897
2005 Payable 2006Taxable Valuations
Agricultural $3,726,299Owner Occupied $18,315,967Non-Ag Z $94,040Other Non-Ag/Utilities $25,913,284Total $48,049,590
$29,27318.3
0.0%10.8
$30,497Average Teacher SalaryExperience Adjusted SalaryAvg Years of Experience% with Advanced DegreesCertified Instructional Staff
Teaching Staff Data
ADM of Tuitioned Out Paid 5.116
General State Aid Adj. ADM 145.594Non-Public / Home Sch ADM 0.000
ADM Data
Local $804,481County $20,115State $330,880Federal $89,667Total $1,245,143
$61,190$0$0$0
$70,381$0
$29,345$20,202
General Capital Outlay Special Education Pension
$61,190 $119,928 $13,710
Revenue
Classroom Staff 0.0
ADM of Contracted Out Paid 36.831
Other Special Revenue $0
655 Walnut St, Big Stone City, SD 57216
2005-2006 Profile of Big Stone City School District 25-1
Capital Outlay Pension
Student/Staff ServicesAdministration ServicesTransportation ServicesOther Support Services
Enterprise Funds
Cost per ADM
General Fund Only
Revenue Expenditures
* Includes General, Special Education and Pension Funds
Home County: GrantArea in Square Miles: 21
2005 K-12 Fall Enrollment: 100
$13,710$0$0$0
$0$0
$14,000$0$0
$22,769$73,207$17,191
$128,452
$0$0$0
$49,320$0$0$0$0
$1,616$0$0$0
$0$0$0$0$0$0$0$0
$7,189Educational Funds* $8,180
$0$0$0
$44,243 $57,271
*District has opted out of General Fund levy
$49,320 $14,000
$0

December 2005 Federal Child Count
0Deaf-Blind
05
0
DeafSpeech/Language
Autism
1Emotionally Disturbed202000
Mental RetardationHearing ImpairedLearning DisabledMultiple DisabilitiesOrthopedic ImpairmentVisually Impaired
1
00
Other Health Impaired
Traumatic Brain InjuryDevelopmental Delay
11Total
0
0
00
00
10
1
0
0
0
0
Home
Early Childhood Setting
PT Early Child and SEEarly Childhood SE Setting
Separate SchoolResidential Facility
Regular Classroom
Resource Room
Self-Contained Classroom
Day Program
24 Hour Program
Home/Hospital Program
Special Education Placement Categories
Total 11
Student to Staff Ratio 9.3
K-8 96.0559-12 0.000
98.1720.000
ADA ADM
Total 96.055 98.172
Student Data
PK-12 Enrollment 100Open Enrolled Students Rec'd 4District Dropout Rate 0.0%
% Special Needs Students 7.9%% Eligible for Free/Red. Lunch 42.5%
Students Transported 66
District Attendance RateNumber of Graduates
97.8%0
Enrollment
Stanford Achievement Test Series, Tenth Edition (SAT10)
80
84
84
66
78
79
Math
Social Science
Language Arts
Reading
Complete Battery
Science
Stanford Writing Assessment Program, Third Edition
Grade 5
Grade 9
American College Test (ACT)
Grade 5Total
PRSpEd
PR
Number Tested
English
Total PR
Sp Ed PR
86
80
78
70
80
80
Grade 4 Grade 3Total
PRSp Ed
PR
Grade 6Total
PRSp Ed
PR
8 15 1
Sp EdTotal
Number Tested
Grade 7Total
PRSp Ed
PR
Grade 8 Total
PRSp Ed
PR
Grade 11Total
PRSp Ed
PR
MathReadingScienceComposite Score
75
84
76
84
76
76
8 1
92
74
78
63
74
79
66
68
71
60
61
64
79
77
76
75
70
74
111 9 11
Percent Proficient or Higher
No assessment data are reported when less than ten students were tested.
Ideas and Development
Sp EdTotal
Organization, Unity, and Coherence
Sp EdTotal
Word Choice
Sp EdTotal
Sentences and Paragraphs
Sp EdTotal
Grammer and Usage
Sp EdTotal
Writing Mechanics
Sp EdTotal
NumberTested
50% 29% 50% 43% 57% 43%14

General $555,049Capital Outlay $95,075
Pension $9,232Special Education $154,854
Ending Fund Balance
Bond Redemption $0Capital Projects $0
Other Fund Data
Agricultural $4.97Non-Ag Z $6.53Owner Occupied $7.99Other Non-Ag/Utilities $17.14Special Education $1.35
Bond Redemption $0.00Pension Fund $0.30
Capital Outlay $1.61
2005 Payable 2006 Levy per Thousand
$315,752$0$0
General AidSpecial EducationExtraordinary Cost Fund - SE
$315,752Total State Aid
State Aid
Special Education Federal Flowthrough
$30,604IDEA Part BPart B, Sec. 619, PK $2,023
$32,627Total
K-12 Instruction $549,262PK Instruction $0Adult Instruction $0
$122,257$5,602
$0
General Special Education
Expenditures
Community Services $0Non-Programmed $22,286Debt Service $0Co-Curricular $53,290
$0$0$0$0
Total Expenditures $1,077,995 $157,605
2005 Payable 2006Taxable Valuations
Agricultural $89,594,377Owner Occupied $7,050,991Non-Ag Z $202,938Other Non-Ag/Utilities $3,666,114Total $100,514,420
$28,28620.8
13.3%13.2
$29,640Average Teacher SalaryExperience Adjusted SalaryAvg Years of Experience% with Advanced DegreesCertified Instructional Staff
Teaching Staff Data
ADM of Tuitioned Out Paid 0.000
General State Aid Adj. ADM 152.432Non-Public / Home Sch ADM 20.000
ADM Data
Local $680,891County $19,150State $338,587Federal $135,213Total $1,173,842
$143,778$23
$0$16,208
$124,780$24
$0$33,088
General Capital Outlay Special Education Pension
$160,009 $157,891 $30,722
Revenue
Classroom Staff 0.0
ADM of Contracted Out Paid 0.000
Other Special Revenue $0
200 E Carr St, Bison, SD 57620-0009
2005-2006 Profile of Bison School District 52-1
Capital Outlay Pension
Student/Staff ServicesAdministration ServicesTransportation ServicesOther Support Services
Enterprise Funds
Cost per ADM
General Fund Only
Revenue Expenditures
* Includes General, Special Education and Pension Funds
Home County: PerkinsArea in Square Miles: 1,337
2005 K-12 Fall Enrollment: 127
$30,715$7$0$0
$0$0
$20,850$0$0
$67,174$147,737
$67,721$170,526
$9,191$5,900
$11,100$96,445
$0$0$0
$60,970
$29,746$0$0$0
$1,757$5,225
$0$1,110
$0$0$0$0
$8,420Educational Funds* $9,833
$0$0
$20,455$56,678 $60,167
*District has opted out of General Fund levy
$193,047 $28,942
$9,441

December 2005 Federal Child Count
0Deaf-Blind
08
1
DeafSpeech/Language
Autism
0Emotionally Disturbed109001
Mental RetardationHearing ImpairedLearning DisabledMultiple DisabilitiesOrthopedic ImpairmentVisually Impaired
0
02
Other Health Impaired
Traumatic Brain InjuryDevelopmental Delay
22Total
0
0
40
00
15
1
2
0
0
0
Home
Early Childhood Setting
PT Early Child and SEEarly Childhood SE Setting
Separate SchoolResidential Facility
Regular Classroom
Resource Room
Self-Contained Classroom
Day Program
24 Hour Program
Home/Hospital Program
Special Education Placement Categories
Total 22
Student to Staff Ratio 9.6
K-8 100.0699-12 23.492
103.57124.455
ADA ADM
Total 123.561 128.026
Student Data
PK-12 Enrollment 127Open Enrolled Students Rec'd 8District Dropout Rate 0.0%
% Special Needs Students 17.3%% Eligible for Free/Red. Lunch 47.6%
Students Transported 62
District Attendance RateNumber of Graduates
96.5%5
Enrollment
Stanford Achievement Test Series, Tenth Edition (SAT10)
81
81
82
67
79
78
Math
Social Science
Language Arts
Reading
Complete Battery
Science
Stanford Writing Assessment Program, Third Edition
Grade 5
Grade 9
American College Test (ACT)
Grade 5Total
PRSpEd
PR
Number Tested
English
5
83%
Total PR
Sp Ed PR
52
72
67
51
61
59
52
77
54
44
61
58
67%
Grade 4 Grade 3Total
PRSp Ed
PR
Grade 6Total
PRSp Ed
PR
18 9 52 2 2
Sp EdTotal
Number Tested
Grade 7Total
PRSp Ed
PR
Grade 8 Total
PRSp Ed
PR
Grade 11Total
PRSp Ed
PR
MathReadingScienceComposite Score
54
64
68
58
67
64
15 3
79
82
90
80
74
79
86
77
79
64
67
75
66
61
69
70
54
63
111 18 17
Percent Proficient or Higher
No assessment data are reported when less than ten students were tested.
Ideas and Development
Sp EdTotal
Organization, Unity, and Coherence
Sp EdTotal
Word Choice
Sp EdTotal
Sentences and Paragraphs
Sp EdTotal
Grammer and Usage
Sp EdTotal
Writing Mechanics
Sp EdTotal
NumberTested
27% 36% 27%
83%
45%
67%
36%
67%
36%
83%
11
6

General $437,805Capital Outlay $180,010
Pension $57,689Special Education ($12,077)
Ending Fund Balance
Bond Redemption $0Capital Projects $0
Other Fund Data
Agricultural $3.19Non-Ag Z $4.19Owner Occupied $5.13Other Non-Ag/Utilities $11.00Special Education $1.40
Bond Redemption $0.00Pension Fund $0.30
Capital Outlay $3.00
2005 Payable 2006 Levy per Thousand
$1,953,800$225,109
$59,090
General AidSpecial EducationExtraordinary Cost Fund - SE
$2,237,999Total State Aid
State Aid
Special Education Federal Flowthrough
$150,908IDEA Part BPart B, Sec. 619, PK $12,506
$163,414Total
K-12 Instruction $1,831,471PK Instruction $35,851Adult Instruction $0
$399,249$44,437
$0
General Special Education
Expenditures
Community Services $9,740Non-Programmed $0Debt Service $0Co-Curricular $178,777
$0$0$0$0
Total Expenditures $3,710,692 $684,018
2005 Payable 2006Taxable Valuations
Agricultural $108,874,800Owner Occupied $43,739,104Non-Ag Z $2,730,275Other Non-Ag/Utilities $18,577,905Total $173,922,084
$32,56613.3
30.0%48.0
$31,460Average Teacher SalaryExperience Adjusted SalaryAvg Years of Experience% with Advanced DegreesCertified Instructional Staff
Teaching Staff Data
ADM of Tuitioned Out Paid 0.702
General State Aid Adj. ADM 604.477Non-Public / Home Sch ADM 0.000
ADM Data
Local $1,014,441County $29,111State $2,025,632Federal $396,543Total $3,465,727
$508,887$0$0
$12,687
$237,238$0
$284,199$167,999
General Capital Outlay Special Education Pension
$521,574 $689,435 $51,627
Revenue
Classroom Staff 0.0
ADM of Contracted Out Paid 0.000
Other Special Revenue $2,500
1404 Fir Street, Tyndall, SD 57066-0028
2005-2006 Profile of Bon Homme School District 04-2
Capital Outlay Pension
Student/Staff ServicesAdministration ServicesTransportation ServicesOther Support Services
Enterprise Funds
Cost per ADM
General Fund Only
Revenue Expenditures
* Includes General, Special Education and Pension Funds
Home County: Bon HommeArea in Square Miles: 316
2005 K-12 Fall Enrollment: 602
$51,627$0$0$0
$0$0
$0$0$0
$313,590$487,015$168,205$686,044
$3,073$4,796
$29,683$100,124
$0$0
$278,275$31,282
$204,215$25,257
$203$10,658
$0$0$0$0$0
$32,760$0$0
$6,068Educational Funds* $7,163
$0$0
$123,782$352,404 $348,689
$540,432 $32,760
$93,199

December 2005 Federal Child Count
0Deaf-Blind
022
1
DeafSpeech/Language
Autism
1Emotionally Disturbed23
22504
Mental RetardationHearing ImpairedLearning DisabledMultiple DisabilitiesOrthopedic ImpairmentVisually Impaired
2
012
Other Health Impaired
Traumatic Brain InjuryDevelopmental Delay
74Total
0
1
210
00
35
25
1
0
0
0
Home
Early Childhood Setting
PT Early Child and SEEarly Childhood SE Setting
Separate SchoolResidential Facility
Regular Classroom
Resource Room
Self-Contained Classroom
Day Program
24 Hour Program
Home/Hospital Program
Special Education Placement Categories
Total 74
Student to Staff Ratio 12.8
K-8 410.8569-12 175.986
421.623182.152
ADA ADM
Total 586.842 603.775
Student Data
PK-12 Enrollment 614Open Enrolled Students Rec'd 24District Dropout Rate 0.3%
% Special Needs Students 12.1%% Eligible for Free/Red. Lunch 49.0%
Students Transported 199
District Attendance RateNumber of Graduates
97.2%47
Enrollment
Stanford Achievement Test Series, Tenth Edition (SAT10)
78
76
74
58
72
72
Math
Social Science
Language Arts
Reading
Complete Battery
Science
Stanford Writing Assessment Program, Third Edition
Grade 5
Grade 9
American College Test (ACT)
Grade 5Total
PRSpEd
PR
Number Tested
English
38
69%
Total PR
Sp Ed PR
78
74
65
65
60
68
79
76
56
60
71
68
73%
Grade 4 Grade 3Total
PRSp Ed
PR
Grade 6Total
PRSp Ed
PR
54 52 444 3 3
Sp EdTotal
Number Tested
Grade 7Total
PRSp Ed
PR
Grade 8 Total
PRSp Ed
PR
Grade 11Total
PRSp Ed
PR
MathReadingScienceComposite Score
22.321.821.2
22.122.0
79
74
77
64
66
71
47 5
78
79
82
62
64
73
67
58
65
65
56
61
66
65
63
58
56
60
351 449 549
Percent Proficient or Higher
No assessment data are reported when less than ten students were tested.
Ideas and Development
Sp EdTotal
Organization, Unity, and Coherence
Sp EdTotal
Word Choice
Sp EdTotal
Sentences and Paragraphs
Sp EdTotal
Grammer and Usage
Sp EdTotal
Writing Mechanics
Sp EdTotal
NumberTested
71% 71% 69%
69%
41%
62%
53%
69%
39%
84%
51
45
1

General $107,113Capital Outlay $104,480
Pension $13,764Special Education $5,383
Ending Fund Balance
Bond Redemption $0Capital Projects $0
Other Fund Data
Agricultural $3.19Non-Ag Z $4.19Owner Occupied $5.13Other Non-Ag/Utilities $11.00Special Education $1.40
Bond Redemption $0.00Pension Fund $0.30
Capital Outlay $1.47
2005 Payable 2006 Levy per Thousand
$474,196$48,111$64,063
General AidSpecial EducationExtraordinary Cost Fund - SE
$586,370Total State Aid
State Aid
Special Education Federal Flowthrough
$37,885IDEA Part BPart B, Sec. 619, PK $2,526
$40,411Total
K-12 Instruction $892,382PK Instruction $15,093Adult Instruction $881
$161,399$13,556
$0
General Special Education
Expenditures
Community Services $10,409Non-Programmed $0Debt Service $0Co-Curricular $65,355
$0$0$0$0
Total Expenditures $1,528,696 $267,060
2005 Payable 2006Taxable Valuations
Agricultural $71,388,480Owner Occupied $6,127,446Non-Ag Z $737,952Other Non-Ag/Utilities $2,898,132Total $81,152,010
$33,91114.7
10.0%19.0
$33,451Average Teacher SalaryExperience Adjusted SalaryAvg Years of Experience% with Advanced DegreesCertified Instructional Staff
Teaching Staff Data
ADM of Tuitioned Out Paid 1.000
General State Aid Adj. ADM 175.708Non-Public / Home Sch ADM 2.000
ADM Data
Local $328,718County $6,080State $503,189Federal $201,931Total $1,039,918
$115,890$0$0
$23,463
$102,943$0
$112,174$53,473
General Capital Outlay Special Education Pension
$139,353 $268,591 $13,764
Revenue
Classroom Staff 0.0
ADM of Contracted Out Paid 0.000
Other Special Revenue $0
410 Birdsell Street, Bonesteel, SD 57317-0410
2005-2006 Profile of Bonesteel-Fairfax School District 26-5
Capital Outlay Pension
Student/Staff ServicesAdministration ServicesTransportation ServicesOther Support Services
Enterprise Funds
Cost per ADM
General Fund Only
Revenue Expenditures
* Includes General, Special Education and Pension Funds
Home County: GregoryArea in Square Miles: 316
2005 K-12 Fall Enrollment: 134
$13,764$0$0$0
$0$0
$0$0$0
$55,773$181,204
$74,423$233,177
$1,375$0
$23,142$139,322
$0$0
$91,417$6,398
$85,660$0
$6,445$0
$0$0$0$0$0$0$0$0
$10,329Educational Funds* $11,462
$0$0
$927,420$74,838 $84,052
$270,061 $0
$8,406

December 2005 Federal Child Count
0Deaf-Blind
05
1
DeafSpeech/Language
Autism
0Emotionally Disturbed213200
Mental RetardationHearing ImpairedLearning DisabledMultiple DisabilitiesOrthopedic ImpairmentVisually Impaired
4
04
Other Health Impaired
Traumatic Brain InjuryDevelopmental Delay
22Total
0
2
22
00
5
10
0
0
1
0
Home
Early Childhood Setting
PT Early Child and SEEarly Childhood SE Setting
Separate SchoolResidential Facility
Regular Classroom
Resource Room
Self-Contained Classroom
Day Program
24 Hour Program
Home/Hospital Program
Special Education Placement Categories
Total 22
Student to Staff Ratio 7.7
K-8 82.4439-12 56.220
86.00659.417
ADA ADM
Total 138.663 145.423
Student Data
PK-12 Enrollment 147Open Enrolled Students Rec'd 2District Dropout Rate 0.0%
% Special Needs Students 15.0%% Eligible for Free/Red. Lunch 75.6%
Students Transported 80
District Attendance RateNumber of Graduates
95.4%19
Enrollment
Stanford Achievement Test Series, Tenth Edition (SAT10)
84
85
80
67
80
79
Math
Social Science
Language Arts
Reading
Complete Battery
Science
Stanford Writing Assessment Program, Third Edition
Grade 5
Grade 9
American College Test (ACT)
Grade 5Total
PRSpEd
PR
Number Tested
English
15
64%
Total PR
Sp Ed PR
69
52
64
64
59
61
71
77
52
57
71
65
55%
Grade 4 Grade 3Total
PRSp Ed
PR
Grade 6Total
PRSp Ed
PR
8 8 62 1
Sp EdTotal
Number Tested
Grade 7Total
PRSp Ed
PR
Grade 8 Total
PRSp Ed
PR
Grade 11Total
PRSp Ed
PR
MathReadingScienceComposite Score
19.921.820.7
22.121.3
87
79
85
74
77
80
15 2
88
85
76
76
80
81
76
59
47
53
41
56
92
79
84
80
71
81
112 28 12
Percent Proficient or Higher
No assessment data are reported when less than ten students were tested.
Ideas and Development
Sp EdTotal
Organization, Unity, and Coherence
Sp EdTotal
Word Choice
Sp EdTotal
Sentences and Paragraphs
Sp EdTotal
Grammer and Usage
Sp EdTotal
Writing Mechanics
Sp EdTotal
NumberTested
45% 73% 64%
45%
64%
36%
73%
64%
55%
64%
11
11

General $238,964Capital Outlay $135,413
PensionSpecial Education ($1,622)
Ending Fund Balance
Bond Redemption $0Capital Projects $0
Other Fund Data
Agricultural $6.02Non-Ag Z $7.91Owner Occupied $9.68Other Non-Ag/Utilities $20.76Special Education $1.06
Bond Redemption $0.00Pension Fund $0.30
Capital Outlay $0.55
2005 Payable 2006 Levy per Thousand
$426,375$8,539
$0
General AidSpecial EducationExtraordinary Cost Fund - SE
$434,914Total State Aid
State Aid
Special Education Federal Flowthrough
$24,385IDEA Part BPart B, Sec. 619, PK $1,528
$25,913Total
K-12 Instruction $567,314PK Instruction $0Adult Instruction $0
$59,594$13,300
$0
General Special Education
Expenditures
Community Services $0Non-Programmed $0Debt Service $0Co-Curricular $69,114
$0$0$0$0
Total Expenditures $971,939 $138,042
2005 Payable 2006Taxable Valuations
Agricultural $54,313,539Owner Occupied $6,926,012Non-Ag Z $262,583Other Non-Ag/Utilities $4,579,861Total $66,081,995
$27,48718.5
23.5%15.2
$29,481Average Teacher SalaryExperience Adjusted SalaryAvg Years of Experience% with Advanced DegreesCertified Instructional Staff
Teaching Staff Data
ADM of Tuitioned Out Paid 0.000
General State Aid Adj. ADM 151.924Non-Public / Home Sch ADM 0.182
ADM Data
Local $459,718County $8,961State $441,726Federal $49,456Total $959,860
$41,807$167
$0$15,153
$77,317$371
$8,539$28,186
General Capital Outlay Special Education Pension
$57,127 $114,413 $18,948
Revenue
Classroom Staff 0.0
ADM of Contracted Out Paid 0.000
Other Special Revenue $0
3083 2nd Ave, Bowdle, SD 57428-0563
2005-2006 Profile of Bowdle School District 22-1
Capital Outlay Pension
Student/Staff ServicesAdministration ServicesTransportation ServicesOther Support Services
Enterprise Funds
Cost per ADM
General Fund Only
Revenue Expenditures
* Includes General, Special Education and Pension Funds
Home County: EdmundsArea in Square Miles: 275
2005 K-12 Fall Enrollment: 126
$18,869$79$0$0
$0$0
$18,948$0$0
$16,887$88,448$61,939
$168,238
$12,348$0$0
$16,731$0$0$0$0
$41,085$20,076$3,987
$0
$0$0$0$0$0$0$0$0
$7,677Educational Funds* $8,773
$0$0$0
$51,350 $53,099
*District has opted out of General Fund levy
$60,000 $18,948
$30,921

December 2005 Federal Child Count
0Deaf-Blind
04
1
DeafSpeech/Language
Autism
0Emotionally Disturbed10
14000
Mental RetardationHearing ImpairedLearning DisabledMultiple DisabilitiesOrthopedic ImpairmentVisually Impaired
1
02
Other Health Impaired
Traumatic Brain InjuryDevelopmental Delay
23Total
0
1
12
00
15
4
0
0
0
0
Home
Early Childhood Setting
PT Early Child and SEEarly Childhood SE Setting
Separate SchoolResidential Facility
Regular Classroom
Resource Room
Self-Contained Classroom
Day Program
24 Hour Program
Home/Hospital Program
Special Education Placement Categories
Total 23
Student to Staff Ratio 8.4
K-8 89.4169-12 34.188
91.79934.805
ADA ADM
Total 123.604 126.604
Student Data
PK-12 Enrollment 128Open Enrolled Students Rec'd 2District Dropout Rate 0.0%
% Special Needs Students 18.0%% Eligible for Free/Red. Lunch 43.2%
Students Transported 45
District Attendance RateNumber of Graduates
97.6%6
Enrollment
Stanford Achievement Test Series, Tenth Edition (SAT10)
59
74
69
64
64
65
Math
Social Science
Language Arts
Reading
Complete Battery
Science
Stanford Writing Assessment Program, Third Edition
Grade 5
Grade 9
American College Test (ACT)
Grade 5Total
PRSpEd
PR
Number Tested
English
4
86%
Total PR
Sp Ed PR
71
62
68
62
67
66
81
75
72
67
69
72
86%
Grade 4 Grade 3Total
PRSp Ed
PR
Grade 6Total
PRSp Ed
PR
8 12 71 3 1
Sp EdTotal
Number Tested
Grade 7Total
PRSp Ed
PR
Grade 8 Total
PRSp Ed
PR
Grade 11Total
PRSp Ed
PR
MathReadingScienceComposite Score
63
68
65
75
50
62
7 1
76
73
89
73
70
75
70
70
57
60
58
63
62
77
50
81
63
65
10 10 7
Percent Proficient or Higher
No assessment data are reported when less than ten students were tested.
Ideas and Development
Sp EdTotal
Organization, Unity, and Coherence
Sp EdTotal
Word Choice
Sp EdTotal
Sentences and Paragraphs
Sp EdTotal
Grammer and Usage
Sp EdTotal
Writing Mechanics
Sp EdTotal
NumberTested
70% 70% 70%
100%
60%
71%
80%
71%
50%
86%
10
7

General $2,509,251Capital Outlay $40,319
Pension $260,665Special Education $620,940
Ending Fund Balance
Bond Redemption $619,351Capital Projects $0
Other Fund Data
Agricultural $3.19Non-Ag Z $4.19Owner Occupied $5.13Other Non-Ag/Utilities $11.00Special Education $1.20
Bond Redemption $0.80Pension Fund $0.30
Capital Outlay $3.00
2005 Payable 2006 Levy per Thousand
$6,162,231$554,708
$0
General AidSpecial EducationExtraordinary Cost Fund - SE
$6,716,939Total State Aid
State Aid
Special Education Federal Flowthrough
$427,688IDEA Part BPart B, Sec. 619, PK $15,863
$443,551Total
K-12 Instruction $7,583,590PK Instruction $0Adult Instruction $0
$1,071,504$162,747
$0
General Special Education
Expenditures
Community Services $58,504Non-Programmed $0Debt Service $0Co-Curricular $468,489
$0$0$0$0
Total Expenditures $13,339,689 $2,066,948
2005 Payable 2006Taxable Valuations
Agricultural $87,598,193Owner Occupied $578,803,758Non-Ag Z $5,721,572Other Non-Ag/Utilities $214,160,747Total $886,284,270
$35,28213.9
24.8%159.3
$35,503Average Teacher SalaryExperience Adjusted SalaryAvg Years of Experience% with Advanced DegreesCertified Instructional Staff
Teaching Staff Data
ADM of Tuitioned Out Paid 18.567
General State Aid Adj. ADM 2,794.963Non-Public / Home Sch ADM 66.438
ADM Data
Local $6,235,419County $148,751State $6,788,927Federal $348,017Total $13,521,114
$2,498,080$0$0
$19,295
$1,038,234$0
$554,708$474,864
General Capital Outlay Special Education Pension
$2,517,375 $2,067,806 $251,425
Revenue
Classroom Staff 0.0
ADM of Contracted Out Paid 0.000
Other Special Revenue $0
301 S Splitrock Blvd, Brandon, SD 57005-1651
2005-2006 Profile of Brandon Valley School District 49-2
Capital Outlay Pension
Student/Staff ServicesAdministration ServicesTransportation ServicesOther Support Services
Enterprise Funds
Cost per ADM
General Fund Only
Revenue Expenditures
* Includes General, Special Education and Pension Funds
Home County: MinnehahaArea in Square Miles: 128
2005 K-12 Fall Enrollment: 2,778
$251,425$0$0$0
$0$0
$54,423$0$0
$997,455$1,386,192
$636,993$2,208,467
$18,098$28,412
$181,073$1,786,945
$0$0
$642,171$62,745
$539,265$120,576$108,052
$64,802
$7,003$9,289$1,217$8,713
$407$72,652
$0$2,452
$4,747Educational Funds* $5,420
$708,533$0$0
$1,281,556 $1,264,989
$3,019,072 $156,156
$299,628

December 2005 Federal Child Count
0Deaf-Blind
482
6
DeafSpeech/Language
Autism
18Emotionally Disturbed25
49410
32
Mental RetardationHearing ImpairedLearning DisabledMultiple DisabilitiesOrthopedic ImpairmentVisually Impaired
29
036
Other Health Impaired
Traumatic Brain InjuryDevelopmental Delay
313Total
1
0
2228
10
160
85
2
13
1
0
Home
Early Childhood Setting
PT Early Child and SEEarly Childhood SE Setting
Separate SchoolResidential Facility
Regular Classroom
Resource Room
Self-Contained Classroom
Day Program
24 Hour Program
Home/Hospital Program
Special Education Placement Categories
Total 313
Student to Staff Ratio 17.4
K-8 1,945.1709-12 744.891
2,004.941777.230
ADA ADM
Total 2,690.061 2,782.171
Student Data
PK-12 Enrollment 2,778Open Enrolled Students Rec'd 56District Dropout Rate 0.2%
% Special Needs Students 11.3%% Eligible for Free/Red. Lunch 13.2%
Students Transported 1,655
District Attendance RateNumber of Graduates
96.7%176
Enrollment
Stanford Achievement Test Series, Tenth Edition (SAT10)
85
86
82
66
81
80
Math
Social Science
Language Arts
Reading
Complete Battery
Science
Stanford Writing Assessment Program, Third Edition
Grade 5
Grade 9
American College Test (ACT)
Grade 5Total
PRSpEd
PR
Number Tested
English
142
84%
57
71
67
38
43
53
Total PR
Sp Ed PR
78
78
71
73
72
74
35
42
40
31
35
37
82
81
75
64
84
77
76%
Grade 4 Grade 3Total
PRSp Ed
PR
Grade 6Total
PRSp Ed
PR
223 225 18518 20 5
Sp EdTotal
Number Tested
Grade 7Total
PRSp Ed
PR
Grade 8 Total
PRSp Ed
PR
Grade 11Total
PRSp Ed
PR
MathReadingScienceComposite Score
23.623.423.1
22.723.4
87 71
73 51
79 59
75 41
82 54
79 56
213 20
79 42
80 62
78 52
71 43
77 41
76 47
73 39
76 43
68 29
66 41
71 27
70 36
78
72
73
74
70
73
22248 15229 7186
Percent Proficient or Higher
No assessment data are reported when less than ten students were tested.
Ideas and Development
Sp EdTotal
Organization, Unity, and Coherence
Sp EdTotal
Word Choice
Sp EdTotal
Sentences and Paragraphs
Sp EdTotal
Grammer and Usage
Sp EdTotal
Writing Mechanics
Sp EdTotal
NumberTested
67% 60% 63%
73%
43%
72%
53%
73%
34%
79%
247
182 1

General $556,750Capital Outlay $412,794
Pension $36,832Special Education $103,096
Ending Fund Balance
Bond Redemption $95,578Capital Projects $0
Other Fund Data
Agricultural $3.19Non-Ag Z $4.19Owner Occupied $5.13Other Non-Ag/Utilities $11.00Special Education $1.40
Bond Redemption $1.11Pension Fund $0.30
Capital Outlay $2.40
2005 Payable 2006 Levy per Thousand
$583,945$0$0
General AidSpecial EducationExtraordinary Cost Fund - SE
$583,945Total State Aid
State Aid
Special Education Federal Flowthrough
$36,756IDEA Part BPart B, Sec. 619, PK $3,501
$40,257Total
K-12 Instruction $643,474PK Instruction $0Adult Instruction $0
$67,752$16,330
$0
General Special Education
Expenditures
Community Services $0Non-Programmed $0Debt Service $0Co-Curricular $62,643
$0$0$0$0
Total Expenditures $1,171,478 $140,049
2005 Payable 2006Taxable Valuations
Agricultural $69,468,605Owner Occupied $11,015,447Non-Ag Z $270,223Other Non-Ag/Utilities $5,428,317Total $86,182,592
$28,94919.1
10.5%16.6
$30,571Average Teacher SalaryExperience Adjusted SalaryAvg Years of Experience% with Advanced DegreesCertified Instructional Staff
Teaching Staff Data
ADM of Tuitioned Out Paid 0.000
General State Aid Adj. ADM 210.559Non-Public / Home Sch ADM 1.000
ADM Data
Local $485,781County $7,956State $602,961Federal $82,046Total $1,178,744
$205,787$0$0$0
$118,337$0$0
$42,917
General Capital Outlay Special Education Pension
$205,787 $161,253 $25,265
Revenue
Classroom Staff 1.7
ADM of Contracted Out Paid 0.000
Other Special Revenue $0
510 N Main, Bridgewater, SD 57319
2005-2006 Profile of Bridgewater School District 43-6
Capital Outlay Pension
Student/Staff ServicesAdministration ServicesTransportation ServicesOther Support Services
Enterprise Funds
Cost per ADM
General Fund Only
Revenue Expenditures
* Includes General, Special Education and Pension Funds
Home County: Mc CookArea in Square Miles: 130
2005 K-12 Fall Enrollment: 180
$25,265$0$0$0
$0$0
$0$0$0
$58,541$213,701
$28,893$164,226
$1,124$547
$31,640$24,480
$0$0$0
$20,153
$37,056$13,681
$620$4,610
$0$0$0$0$0$0$0$0
$6,212Educational Funds* $6,914
$96,082$0$0
$70,562 $75,993
$148,732 $0
$70,788

December 2005 Federal Child Count
0Deaf-Blind
07
0
DeafSpeech/Language
Autism
0Emotionally Disturbed206100
Mental RetardationHearing ImpairedLearning DisabledMultiple DisabilitiesOrthopedic ImpairmentVisually Impaired
3
00
Other Health Impaired
Traumatic Brain InjuryDevelopmental Delay
19Total
0
0
02
00
10
6
1
0
0
0
Home
Early Childhood Setting
PT Early Child and SEEarly Childhood SE Setting
Separate SchoolResidential Facility
Regular Classroom
Resource Room
Self-Contained Classroom
Day Program
24 Hour Program
Home/Hospital Program
Special Education Placement Categories
Total 19
Student to Staff Ratio 9.8
K-8 116.1489-12 51.979
120.91854.548
ADA ADM
Total 168.127 175.466
Student Data
PK-12 Enrollment 180Open Enrolled Students Rec'd 0District Dropout Rate 0.0%
% Special Needs Students 10.6%% Eligible for Free/Red. Lunch 34.1%
Students Transported 50
District Attendance RateNumber of Graduates
95.8%13
Enrollment
Stanford Achievement Test Series, Tenth Edition (SAT10)
74
79
71
56
68
69
Math
Social Science
Language Arts
Reading
Complete Battery
Science
Stanford Writing Assessment Program, Third Edition
Grade 5
Grade 9
American College Test (ACT)
Grade 5Total
PRSpEd
PR
Number Tested
English
10
83%
Total PR
Sp Ed PR
90
83
80
79
77
82
82
84
56
71
82
76
92%
Grade 4 Grade 3Total
PRSp Ed
PR
Grade 6Total
PRSp Ed
PR
17 13 81 1
Sp EdTotal
Number Tested
Grade 7Total
PRSp Ed
PR
Grade 8 Total
PRSp Ed
PR
Grade 11Total
PRSp Ed
PR
MathReadingScienceComposite Score
20.322.919.9
22.821.7
79
73
76
61
77
73
12 1
86
81
74
78
67
77
77
82
66
54
65
70
89
78
84
72
75
80
114 213 12
Percent Proficient or Higher
No assessment data are reported when less than ten students were tested.
Ideas and Development
Sp EdTotal
Organization, Unity, and Coherence
Sp EdTotal
Word Choice
Sp EdTotal
Sentences and Paragraphs
Sp EdTotal
Grammer and Usage
Sp EdTotal
Writing Mechanics
Sp EdTotal
NumberTested
57% 50% 57%
83%
43%
83%
43%
92%
21%
83%
14
12

General $1,529,440Capital Outlay $674,972
Pension $392,245Special Education $1,836
Ending Fund Balance
Bond Redemption $0Capital Projects $0
Other Fund Data
Agricultural $3.19Non-Ag Z $4.19Owner Occupied $5.13Other Non-Ag/Utilities $11.00Special Education $1.40
Bond Redemption $0.00Pension Fund $0.30
Capital Outlay $1.69
2005 Payable 2006 Levy per Thousand
$1,272,938$0$0
General AidSpecial EducationExtraordinary Cost Fund - SE
$1,272,938Total State Aid
State Aid
Special Education Federal Flowthrough
$99,312IDEA Part BPart B, Sec. 619, PK $4,639
$103,951Total
K-12 Instruction $1,781,476PK Instruction $0Adult Instruction $15,993
$322,555$19,397
$0
General Special Education
Expenditures
Community Services $11,418Non-Programmed $0Debt Service $0Co-Curricular $161,220
$0$0$0$0
Total Expenditures $3,079,195 $477,253
2005 Payable 2006Taxable Valuations
Agricultural $189,326,794Owner Occupied $47,047,203Non-Ag Z $380,556Other Non-Ag/Utilities $25,364,780Total $262,119,333
$35,59616.3
7.7%37.2
$36,395Average Teacher SalaryExperience Adjusted SalaryAvg Years of Experience% with Advanced DegreesCertified Instructional Staff
Teaching Staff Data
ADM of Tuitioned Out Paid 1.735
General State Aid Adj. ADM 560.879Non-Public / Home Sch ADM 5.000
ADM Data
Local $1,434,162County $57,281State $1,373,064Federal $186,097Total $3,050,604
$472,120$0$0$0
$352,334$0$0
$105,951
General Capital Outlay Special Education Pension
$472,120 $458,285 $49,365
Revenue
Classroom Staff 0.0
ADM of Contracted Out Paid 0.000
Other Special Revenue $0
759 5th St, Britton, SD 57430
2005-2006 Profile of Britton-Hecla School District 45-4
Capital Outlay Pension
Student/Staff ServicesAdministration ServicesTransportation ServicesOther Support Services
Enterprise Funds
Cost per ADM
General Fund Only
Revenue Expenditures
* Includes General, Special Education and Pension Funds
Home County: MarshallArea in Square Miles: 658
2005 K-12 Fall Enrollment: 534
$49,365$0$0$0
$0$0
$0$0$0
$151,059$315,611$215,473$426,943
$0$1,912
$54,829$47,423
$0$0
$240,565$33,751
$135,134$0
$166$0
$0$0$0$0$0
$22,329$0$0
$5,711Educational Funds* $6,402
$0$0$0
$234,469 $217,152
$438,526 $22,329
$60,046

December 2005 Federal Child Count
0Deaf-Blind
015
3
DeafSpeech/Language
Autism
0Emotionally Disturbed50
20300
Mental RetardationHearing ImpairedLearning DisabledMultiple DisabilitiesOrthopedic ImpairmentVisually Impaired
1
03
Other Health Impaired
Traumatic Brain InjuryDevelopmental Delay
50Total
0
0
05
00
29
14
0
0
2
0
Home
Early Childhood Setting
PT Early Child and SEEarly Childhood SE Setting
Separate SchoolResidential Facility
Regular Classroom
Resource Room
Self-Contained Classroom
Day Program
24 Hour Program
Home/Hospital Program
Special Education Placement Categories
Total 50
Student to Staff Ratio 14.5
K-8 355.7109-12 155.382
366.419166.988
ADA ADM
Total 511.092 533.407
Student Data
PK-12 Enrollment 539Open Enrolled Students Rec'd 33District Dropout Rate 1.8%
% Special Needs Students 9.3%% Eligible for Free/Red. Lunch 47.6%
Students Transported 138
District Attendance RateNumber of Graduates
95.8%39
Enrollment
Stanford Achievement Test Series, Tenth Edition (SAT10)
81
88
83
58
72
76
Math
Social Science
Language Arts
Reading
Complete Battery
Science
Stanford Writing Assessment Program, Third Edition
Grade 5
Grade 9
American College Test (ACT)
Grade 5Total
PRSpEd
PR
Number Tested
English
35
69%
Total PR
Sp Ed PR
74
70
61
65
64
67
84
77
68
63
77
73
66%
Grade 4 Grade 3Total
PRSp Ed
PR
Grade 6Total
PRSp Ed
PR
38 51 424 2 3
Sp EdTotal
Number Tested
Grade 7Total
PRSp Ed
PR
Grade 8 Total
PRSp Ed
PR
Grade 11Total
PRSp Ed
PR
MathReadingScienceComposite Score
21.719.919.9
20.920.8
81
81
76
69
72
74
36 3
79
72
71
60
58
68
86
71
71
76
66
74
74
64
56
62
61
63
250 443 148
Percent Proficient or Higher
No assessment data are reported when less than ten students were tested.
Ideas and Development
Sp EdTotal
Organization, Unity, and Coherence
Sp EdTotal
Word Choice
Sp EdTotal
Sentences and Paragraphs
Sp EdTotal
Grammer and Usage
Sp EdTotal
Writing Mechanics
Sp EdTotal
NumberTested
63% 55% 57%
57%
47%
60%
55%
66%
45%
71%
51
35

General $3,430,980Capital Outlay $2,107,156
Pension $219,767Special Education $87,456
Ending Fund Balance
Bond Redemption $845,990Capital Projects $703,814
Other Fund Data
Agricultural $3.62Non-Ag Z $4.75Owner Occupied $5.82Other Non-Ag/Utilities $12.48Special Education $1.40
Bond Redemption $1.05Pension Fund $0.30
Capital Outlay $3.00
2005 Payable 2006 Levy per Thousand
$5,635,738$853,283
$0
General AidSpecial EducationExtraordinary Cost Fund - SE
$6,489,021Total State Aid
State Aid
Special Education Federal Flowthrough
$474,196IDEA Part BPart B, Sec. 619, PK $20,263
$494,459Total
K-12 Instruction $8,637,200PK Instruction $0Adult Instruction $0
$1,660,970$152,824
$0
General Special Education
Expenditures
Community Services $23,535Non-Programmed $0Debt Service $0Co-Curricular $653,690
$0$0$0$0
Total Expenditures $14,271,790 $2,428,931
2005 Payable 2006Taxable Valuations
Agricultural $81,340,807Owner Occupied $438,774,067Non-Ag Z $1,855,487Other Non-Ag/Utilities $287,282,916Total $809,253,277
$34,93718.6
24.6%170.5
$37,022Average Teacher SalaryExperience Adjusted SalaryAvg Years of Experience% with Advanced DegreesCertified Instructional Staff
Teaching Staff Data
ADM of Tuitioned Out Paid 1.784
General State Aid Adj. ADM 2,686.120Non-Public / Home Sch ADM 53.371
ADM Data
Local $7,091,334County $301,212State $6,164,021Federal $660,497Total $14,217,064
$2,447,455$0$0
$4,715
$1,098,058$0
$853,283$515,468
General Capital Outlay Special Education Pension
$2,452,171 $2,466,809 $235,228
Revenue
Classroom Staff 1.9
ADM of Contracted Out Paid 0.000
Other Special Revenue $0
2130 8th St S, Brookings, SD 57006-3507
2005-2006 Profile of Brookings School District 05-1
Capital Outlay Pension
Student/Staff ServicesAdministration ServicesTransportation ServicesOther Support Services
Enterprise Funds
Cost per ADM
General Fund Only
Revenue Expenditures
* Includes General, Special Education and Pension Funds
Home County: BrookingsArea in Square Miles: 194
2005 K-12 Fall Enrollment: 2,702
$235,228$0$0$0
$0$0
$0$0$0
$1,343,555$1,083,258
$272,405$2,258,146
$349,956$0
$83,108$863,355
$0$0
$708,628$58,290
$413,954$112,585
$88,598$0
$0$0$0$0$0
$219,054$0$0
$5,282Educational Funds* $6,157
$863,402$11,885
$0$905,604 $909,446
*District has opted out of General Fund levy
$2,497,511 $219,054
$434,173

December 2005 Federal Child Count
0Deaf-Blind
054
14
DeafSpeech/Language
Autism
21Emotionally Disturbed29
1183
1925
Mental RetardationHearing ImpairedLearning DisabledMultiple DisabilitiesOrthopedic ImpairmentVisually Impaired
7
135
Other Health Impaired
Traumatic Brain InjuryDevelopmental Delay
371Total
0
0
1342
00
188
106
21
1
0
0
Home
Early Childhood Setting
PT Early Child and SEEarly Childhood SE Setting
Separate SchoolResidential Facility
Regular Classroom
Resource Room
Self-Contained Classroom
Day Program
24 Hour Program
Home/Hospital Program
Special Education Placement Categories
Total 371
Student to Staff Ratio 15.7
K-8 1,811.5879-12 761.085
1,878.092806.245
ADA ADM
Total 2,572.672 2,684.337
Student Data
PK-12 Enrollment 2,702Open Enrolled Students Rec'd 48District Dropout Rate 0.6%
% Special Needs Students 13.7%% Eligible for Free/Red. Lunch 21.8%
Students Transported 574
District Attendance RateNumber of Graduates
95.8%189
Enrollment
Stanford Achievement Test Series, Tenth Edition (SAT10)
78
79
79
65
72
73
Math
Social Science
Language Arts
Reading
Complete Battery
Science
Stanford Writing Assessment Program, Third Edition
Grade 5
Grade 9
American College Test (ACT)
Grade 5Total
PRSpEd
PR
Number Tested
English
162
71%
48
54
57
27
33
42
Total PR
Sp Ed PR
76
73
69
67
68
70
33
40
36
25
32
33
85
78
76
65
84
78
39
35
33
24
31
32
82%
Grade 4 Grade 3Total
PRSp Ed
PR
Grade 6Total
PRSp Ed
PR
195 210 21121 29 11
Sp EdTotal
Number Tested
Grade 7Total
PRSp Ed
PR
Grade 8 Total
PRSp Ed
PR
Grade 11Total
PRSp Ed
PR
MathReadingScienceComposite Score
23.823.923.0
23.323.6
75 44
76 50
79 60
67 41
66 36
70 41
208 25
76 37
78 50
80 50
71 34
69 35
73 40
78 34
74 41
76 41
72 43
71 25
74 35
86 34
77 27
72 23
80 27
71 23
76 28
21180 15184 18200
Percent Proficient or Higher
No assessment data are reported when less than ten students were tested.
Ideas and Development
Sp EdTotal
Organization, Unity, and Coherence
Sp EdTotal
Word Choice
Sp EdTotal
Sentences and Paragraphs
Sp EdTotal
Grammer and Usage
Sp EdTotal
Writing Mechanics
Sp EdTotal
NumberTested
53% 41% 47%
80%
36%
69%
45%
69%
30%
72%
184
194

General $276,098Capital Outlay $385,430
PensionSpecial Education $81,664
Ending Fund Balance
Bond Redemption $0Capital Projects $0
Other Fund Data
Agricultural $5.20Non-Ag Z $6.83Owner Occupied $8.36Other Non-Ag/Utilities $17.93Special Education $1.20
Bond Redemption $0.00Pension Fund $0.00
Capital Outlay $1.19
2005 Payable 2006 Levy per Thousand
$737,324$83,570
$0
General AidSpecial EducationExtraordinary Cost Fund - SE
$820,894Total State Aid
State Aid
Special Education Federal Flowthrough
$41,507IDEA Part BPart B, Sec. 619, PK $1,571
$43,078Total
K-12 Instruction $824,840PK Instruction $0Adult Instruction $0
$161,215$1,414
$0
General Special Education
Expenditures
Community Services $8,982Non-Programmed $0Debt Service $0Co-Curricular $77,432
$0$0$0$0
Total Expenditures $1,532,472 $252,103
2005 Payable 2006Taxable Valuations
Agricultural $90,675,587Owner Occupied $12,077,986Non-Ag Z $0Other Non-Ag/Utilities $4,576,946Total $107,330,519
$28,81618.2
20.0%22.0
$31,160Average Teacher SalaryExperience Adjusted SalaryAvg Years of Experience% with Advanced DegreesCertified Instructional Staff
Teaching Staff Data
ADM of Tuitioned Out Paid 0.000
General State Aid Adj. ADM 244.934Non-Public / Home Sch ADM 0.000
ADM Data
Local $645,304County $11,392State $772,154Federal $143,642Total $1,572,492
$128,792$0$0$0
$124,082$0
$83,570$49,473
General Capital Outlay Special Education Pension
$128,792 $257,125 $0
Revenue
Classroom Staff 0.0
ADM of Contracted Out Paid 0.000
Other Special Revenue $0
900 Washington St, Burke, SD 57523
2005-2006 Profile of Burke School District 26-2
Capital Outlay Pension
Student/Staff ServicesAdministration ServicesTransportation ServicesOther Support Services
Enterprise Funds
Cost per ADM
General Fund Only
Revenue Expenditures
* Includes General, Special Education and Pension Funds
Home County: GregoryArea in Square Miles: 360
2005 K-12 Fall Enrollment: 206
$0$0$0$0
$0$0
$0$0$0
$96,719$238,503
$75,967$210,028
$30,908$0
$11,000$11,051
$0$0
$96,509$7,746
$89,006$0
$468$0
$0$0$0$0$0$0$0$0
$7,479Educational Funds* $8,710
$0$0$0
$86,804 $90,902
*District has opted out of General Fund levy
$200,981 $0
$43,766

December 2005 Federal Child Count
0Deaf-Blind
05
2
DeafSpeech/Language
Autism
0Emotionally Disturbed20
12310
Mental RetardationHearing ImpairedLearning DisabledMultiple DisabilitiesOrthopedic ImpairmentVisually Impaired
8
02
Other Health Impaired
Traumatic Brain InjuryDevelopmental Delay
35Total
0
0
11
00
23
5
5
0
0
0
Home
Early Childhood Setting
PT Early Child and SEEarly Childhood SE Setting
Separate SchoolResidential Facility
Regular Classroom
Resource Room
Self-Contained Classroom
Day Program
24 Hour Program
Home/Hospital Program
Special Education Placement Categories
Total 35
Student to Staff Ratio 9.4
K-8 139.4829-12 57.020
145.07158.621
ADA ADM
Total 196.502 203.692
Student Data
PK-12 Enrollment 207Open Enrolled Students Rec'd 0District Dropout Rate 0.0%
% Special Needs Students 16.9%% Eligible for Free/Red. Lunch 53.2%
Students Transported 109
District Attendance RateNumber of Graduates
96.5%15
Enrollment
Stanford Achievement Test Series, Tenth Edition (SAT10)
91
88
84
64
80
82
Math
Social Science
Language Arts
Reading
Complete Battery
Science
Stanford Writing Assessment Program, Third Edition
Grade 5
Grade 9
American College Test (ACT)
Grade 5Total
PRSpEd
PR
Number Tested
English
7
86%
Total PR
Sp Ed PR
58
77
69
52
66
63
78
81
64
67
77
72
71%
Grade 4 Grade 3Total
PRSp Ed
PR
Grade 6Total
PRSp Ed
PR
16 22 185 3 2
Sp EdTotal
Number Tested
Grade 7Total
PRSp Ed
PR
Grade 8 Total
PRSp Ed
PR
Grade 11Total
PRSp Ed
PR
MathReadingScienceComposite Score
77
71
71
75
69
71
11
72
73
79
72
65
67
71
88
74
71
75
74
71
71
64
65
58
65
219 214 323
Percent Proficient or Higher
No assessment data are reported when less than ten students were tested.
Ideas and Development
Sp EdTotal
Organization, Unity, and Coherence
Sp EdTotal
Word Choice
Sp EdTotal
Sentences and Paragraphs
Sp EdTotal
Grammer and Usage
Sp EdTotal
Writing Mechanics
Sp EdTotal
NumberTested
37% 37% 53%
86%
53%
86%
53%
86%
42%
86%
19
14
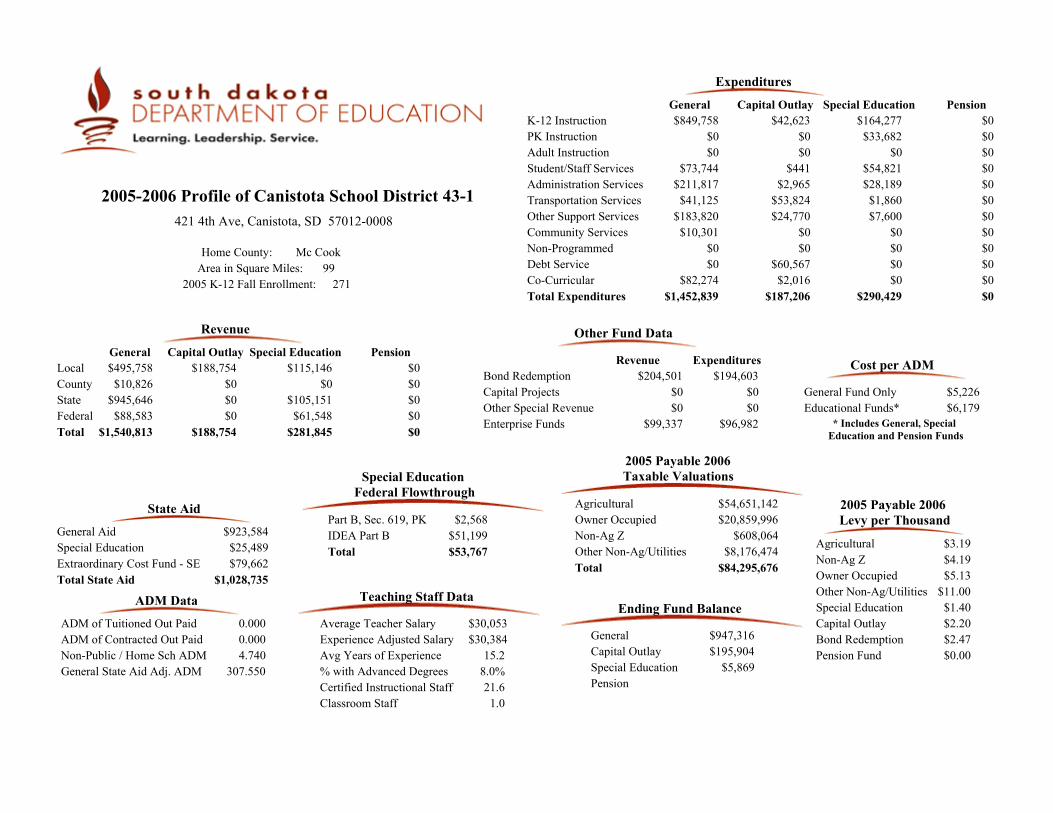
General $947,316Capital Outlay $195,904
PensionSpecial Education $5,869
Ending Fund Balance
Bond Redemption $194,603Capital Projects $0
Other Fund Data
Agricultural $3.19Non-Ag Z $4.19Owner Occupied $5.13Other Non-Ag/Utilities $11.00Special Education $1.40
Bond Redemption $2.47Pension Fund $0.00
Capital Outlay $2.20
2005 Payable 2006 Levy per Thousand
$923,584$25,489$79,662
General AidSpecial EducationExtraordinary Cost Fund - SE
$1,028,735Total State Aid
State Aid
Special Education Federal Flowthrough
$51,199IDEA Part BPart B, Sec. 619, PK $2,568
$53,767Total
K-12 Instruction $849,758PK Instruction $0Adult Instruction $0
$164,277$33,682
$0
General Special Education
Expenditures
Community Services $10,301Non-Programmed $0Debt Service $0Co-Curricular $82,274
$0$0$0$0
Total Expenditures $1,452,839 $290,429
2005 Payable 2006Taxable Valuations
Agricultural $54,651,142Owner Occupied $20,859,996Non-Ag Z $608,064Other Non-Ag/Utilities $8,176,474Total $84,295,676
$30,38415.2
8.0%21.6
$30,053Average Teacher SalaryExperience Adjusted SalaryAvg Years of Experience% with Advanced DegreesCertified Instructional Staff
Teaching Staff Data
ADM of Tuitioned Out Paid 0.000
General State Aid Adj. ADM 307.550Non-Public / Home Sch ADM 4.740
ADM Data
Local $495,758County $10,826State $945,646Federal $88,583Total $1,540,813
$188,754$0$0$0
$115,146$0
$105,151$61,548
General Capital Outlay Special Education Pension
$188,754 $281,845 $0
Revenue
Classroom Staff 1.0
ADM of Contracted Out Paid 0.000
Other Special Revenue $0
421 4th Ave, Canistota, SD 57012-0008
2005-2006 Profile of Canistota School District 43-1
Capital Outlay Pension
Student/Staff ServicesAdministration ServicesTransportation ServicesOther Support Services
Enterprise Funds
Cost per ADM
General Fund Only
Revenue Expenditures
* Includes General, Special Education and Pension Funds
Home County: Mc CookArea in Square Miles: 99
2005 K-12 Fall Enrollment: 271
$0$0$0$0
$0$0
$0$0$0
$73,744$211,817
$41,125$183,820
$441$2,965
$53,824$24,770
$0$0
$60,567$2,016
$54,821$28,189$1,860$7,600
$0$0$0$0$0$0$0$0
$5,226Educational Funds* $6,179
$204,501$0$0
$99,337 $96,982
$187,206 $0
$42,623

December 2005 Federal Child Count
0Deaf-Blind
015
1
DeafSpeech/Language
Autism
0Emotionally Disturbed01
30000
Mental RetardationHearing ImpairedLearning DisabledMultiple DisabilitiesOrthopedic ImpairmentVisually Impaired
5
10
Other Health Impaired
Traumatic Brain InjuryDevelopmental Delay
53Total
0
0
22
00
24
25
0
0
0
0
Home
Early Childhood Setting
PT Early Child and SEEarly Childhood SE Setting
Separate SchoolResidential Facility
Regular Classroom
Resource Room
Self-Contained Classroom
Day Program
24 Hour Program
Home/Hospital Program
Special Education Placement Categories
Total 53
Student to Staff Ratio 12.0
K-8 163.7139-12 94.017
169.05897.977
ADA ADM
Total 257.730 267.035
Student Data
PK-12 Enrollment 271Open Enrolled Students Rec'd 21District Dropout Rate 1.3%
% Special Needs Students 19.6%% Eligible for Free/Red. Lunch 30.9%
Students Transported 60
District Attendance RateNumber of Graduates
96.5%27
Enrollment
Stanford Achievement Test Series, Tenth Edition (SAT10)
81
81
79
75
85
80
Math
Social Science
Language Arts
Reading
Complete Battery
Science
Stanford Writing Assessment Program, Third Edition
Grade 5
Grade 9
American College Test (ACT)
Grade 5Total
PRSpEd
PR
Number Tested
English
19
50%
Total PR
Sp Ed PR
59
66
64
63
62
61
64
70
60
56
66
62
45%
Grade 4 Grade 3Total
PRSp Ed
PR
Grade 6Total
PRSp Ed
PR
18 23 225 4 3
Sp EdTotal
Number Tested
Grade 7Total
PRSp Ed
PR
Grade 8 Total
PRSp Ed
PR
Grade 11Total
PRSp Ed
PR
MathReadingScienceComposite Score
23.021.222.4
22.422.4
84
70
76
79
85
80
19 2
77
91
90
77
78
81
69
63
78
69
58
67
71
67
61
70
74
68
319 217 220
Percent Proficient or Higher
No assessment data are reported when less than ten students were tested.
Ideas and Development
Sp EdTotal
Organization, Unity, and Coherence
Sp EdTotal
Word Choice
Sp EdTotal
Sentences and Paragraphs
Sp EdTotal
Grammer and Usage
Sp EdTotal
Writing Mechanics
Sp EdTotal
NumberTested
58% 58% 58%
55%
63%
45%
63%
50%
53%
70%
19
20

General $760,394Capital Outlay $439,104
Pension $161,425Special Education $146,963
Ending Fund Balance
Bond Redemption $511,999Capital Projects $381,918
Other Fund Data
Agricultural $3.19Non-Ag Z $4.19Owner Occupied $5.13Other Non-Ag/Utilities $11.00Special Education $1.40
Bond Redemption $1.39Pension Fund $0.30
Capital Outlay $2.10
2005 Payable 2006 Levy per Thousand
$2,294,313$366,007
$0
General AidSpecial EducationExtraordinary Cost Fund - SE
$2,660,320Total State Aid
State Aid
Special Education Federal Flowthrough
$190,806IDEA Part BPart B, Sec. 619, PK $9,210
$200,016Total
K-12 Instruction $2,497,481PK Instruction $0Adult Instruction $0
$693,496$54,796
$0
General Special Education
Expenditures
Community Services $8,000Non-Programmed $0Debt Service $0Co-Curricular $206,710
$0$0$0$0
Total Expenditures $4,622,596 $1,046,926
2005 Payable 2006Taxable Valuations
Agricultural $151,606,792Owner Occupied $158,114,976Non-Ag Z $3,023,480Other Non-Ag/Utilities $46,353,164Total $359,098,412
$33,81112.7
13.6%58.1
$32,306Average Teacher SalaryExperience Adjusted SalaryAvg Years of Experience% with Advanced DegreesCertified Instructional Staff
Teaching Staff Data
ADM of Tuitioned Out Paid 14.082
General State Aid Adj. ADM 937.878Non-Public / Home Sch ADM 22.000
ADM Data
Local $1,959,258County $48,753State $2,409,818Federal $247,541Total $4,665,369
$725,335$0$0$0
$485,824$0
$366,007$213,351
General Capital Outlay Special Education Pension
$725,335 $1,065,182 $106,336
Revenue
Classroom Staff 1.6
ADM of Contracted Out Paid 0.000
Other Special Revenue $0
800 N Main, Canton, SD 57013
2005-2006 Profile of Canton School District 41-1
Capital Outlay Pension
Student/Staff ServicesAdministration ServicesTransportation ServicesOther Support Services
Enterprise Funds
Cost per ADM
General Fund Only
Revenue Expenditures
* Includes General, Special Education and Pension Funds
Home County: LincolnArea in Square Miles: 195
2005 K-12 Fall Enrollment: 918
$106,336$0$0$0
$0$0
$0$0$0
$425,703$522,337$212,874$749,492
$58,549$1,479
$38,350$184,843
$0$0
$130,188$24,957
$220,034$51,838$26,763
$0
$0$0$0$0$0
$30,236$0$0
$4,988Educational Funds* $5,861
$515,687$9,756
$0$317,395 $324,438
$576,421 $30,236
$138,056

December 2005 Federal Child Count
0Deaf-Blind
124
7
DeafSpeech/Language
Autism
6Emotionally Disturbed18
166
700
Mental RetardationHearing ImpairedLearning DisabledMultiple DisabilitiesOrthopedic ImpairmentVisually Impaired
9
02
Other Health Impaired
Traumatic Brain InjuryDevelopmental Delay
141Total
0
0
018
00
81
24
10
3
5
0
Home
Early Childhood Setting
PT Early Child and SEEarly Childhood SE Setting
Separate SchoolResidential Facility
Regular Classroom
Resource Room
Self-Contained Classroom
Day Program
24 Hour Program
Home/Hospital Program
Special Education Placement Categories
Total 141
Student to Staff Ratio 15.4
K-8 608.0539-12 292.222
625.525296.507
ADA ADM
Total 900.275 922.032
Student Data
PK-12 Enrollment 918Open Enrolled Students Rec'd 7District Dropout Rate 0.8%
% Special Needs Students 15.4%% Eligible for Free/Red. Lunch 23.6%
Students Transported 271
District Attendance RateNumber of Graduates
97.6%64
Enrollment
Stanford Achievement Test Series, Tenth Edition (SAT10)
87
77
83
57
73
76
Math
Social Science
Language Arts
Reading
Complete Battery
Science
Stanford Writing Assessment Program, Third Edition
Grade 5
Grade 9
American College Test (ACT)
Grade 5Total
PRSpEd
PR
Number Tested
English
46
74%
Total PR
Sp Ed PR
69
67
66
59
63
64
25
24
34
21
20
24
70
61
54
48
69
59
69%
Grade 4 Grade 3Total
PRSp Ed
PR
Grade 6Total
PRSp Ed
PR
58 68 815 11 8
Sp EdTotal
Number Tested
Grade 7Total
PRSp Ed
PR
Grade 8 Total
PRSp Ed
PR
Grade 11Total
PRSp Ed
PR
MathReadingScienceComposite Score
19.520.819.0
20.620.2
85
80
84
75
76
77
64 6
84
82
80
74
72
78
79
79
68
65
66
71
78 49
65 28
66 39
64 35
63 29
67 36
671 771 1182
Percent Proficient or Higher
No assessment data are reported when less than ten students were tested.
Ideas and Development
Sp EdTotal
Organization, Unity, and Coherence
Sp EdTotal
Word Choice
Sp EdTotal
Sentences and Paragraphs
Sp EdTotal
Grammer and Usage
Sp EdTotal
Writing Mechanics
Sp EdTotal
NumberTested
74% 63% 69%
61%
42%
59%
43%
59%
38%
60%
72
70

General $63,135Capital Outlay $47,763
PensionSpecial Education $124,213
Ending Fund Balance
Bond Redemption $0Capital Projects $0
Other Fund Data
Agricultural $3.19Non-Ag Z $4.19Owner Occupied $5.13Other Non-Ag/Utilities $11.00Special Education $1.01
Bond Redemption $0.00Pension Fund $0.00
Capital Outlay $0.00
2005 Payable 2006 Levy per Thousand
$0$0$0
General AidSpecial EducationExtraordinary Cost Fund - SE
$0Total State Aid
State Aid
Special Education Federal Flowthrough
$4,309IDEA Part BPart B, Sec. 619, PK $498
$4,807Total
K-12 Instruction $152,067PK Instruction $0Adult Instruction $0
$19,571$0$0
General Special Education
Expenditures
Community Services $0Non-Programmed $0Debt Service $0Co-Curricular $0
$0$0$0$0
Total Expenditures $217,062 $19,571
2005 Payable 2006Taxable Valuations
Agricultural $51,434,570Owner Occupied $1,332,520Non-Ag Z $573,400Other Non-Ag/Utilities $1,102,782Total $54,443,272
$27,25911.7
0.0%2.0
$27,164Average Teacher SalaryExperience Adjusted SalaryAvg Years of Experience% with Advanced DegreesCertified Instructional Staff
Teaching Staff Data
ADM of Tuitioned Out Paid 0.000
General State Aid Adj. ADM 19.778Non-Public / Home Sch ADM 0.000
ADM Data
Local $194,679County $705State $3,117Federal $0Total $198,502
$38$0$0$0
$41,875$0$0
$4,326
General Capital Outlay Special Education Pension
$38 $46,202 $0
Revenue
Classroom Staff 0.0
ADM of Contracted Out Paid 10.145
Other Special Revenue $0
141 Town Rd W, Carthage, SD 57323
2005-2006 Profile of Carthage School District 48-2
Capital Outlay Pension
Student/Staff ServicesAdministration ServicesTransportation ServicesOther Support Services
Enterprise Funds
Cost per ADM
General Fund Only
Revenue Expenditures
* Includes General, Special Education and Pension Funds
Home County: MinerArea in Square Miles: 146
2005 K-12 Fall Enrollment: 7
$0$0$0$0
$0$0
$0$0$0
$40$16,139
$3,668$45,148
$0$0$0
$931$0$0$0$0
$0$0$0$0
$0$0$0$0$0$0$0$0
$21,321Educational Funds* $21,648
$0$0$0$0 $0
$931 $0
$0

December 2005 Federal Child Count
0Deaf-Blind
00
0
DeafSpeech/Language
Autism
0Emotionally Disturbed101100
Mental RetardationHearing ImpairedLearning DisabledMultiple DisabilitiesOrthopedic ImpairmentVisually Impaired
0
00
Other Health Impaired
Traumatic Brain InjuryDevelopmental Delay
3Total
0
0
00
00
1
2
0
0
0
0
Home
Early Childhood Setting
PT Early Child and SEEarly Childhood SE Setting
Separate SchoolResidential Facility
Regular Classroom
Resource Room
Self-Contained Classroom
Day Program
24 Hour Program
Home/Hospital Program
Special Education Placement Categories
Total 3
Student to Staff Ratio 3.5
K-8 6.3149-12 0.000
6.3370.000
ADA ADM
Total 6.314 6.337
Student Data
PK-12 Enrollment 7Open Enrolled Students Rec'd 0District Dropout Rate 0.0%
% Special Needs Students 18.2%% Eligible for Free/Red. Lunch 28.6%
Students Transported 12
District Attendance RateNumber of Graduates
99.6%0
Enrollment
Stanford Achievement Test Series, Tenth Edition (SAT10)
Math
Social Science
Language Arts
Reading
Complete Battery
Science
Stanford Writing Assessment Program, Third Edition
Grade 5
Grade 9
American College Test (ACT)
Grade 5Total
PRSpEd
PR
Number Tested
English
Total PR
Sp Ed PR
Grade 4 Grade 3Total
PRSp Ed
PR
Grade 6Total
PRSp Ed
PR
Sp EdTotal
Number Tested
Grade 7Total
PRSp Ed
PR
Grade 8 Total
PRSp Ed
PR
Grade 11Total
PRSp Ed
PR
MathReadingScienceComposite Score
54
80
69
44
56
60
3
Percent Proficient or Higher
No assessment data are reported when less than ten students were tested.
Ideas and Development
Sp EdTotal
Organization, Unity, and Coherence
Sp EdTotal
Word Choice
Sp EdTotal
Sentences and Paragraphs
Sp EdTotal
Grammer and Usage
Sp EdTotal
Writing Mechanics
Sp EdTotal
NumberTested
25% 25% 25% 25% 0% 0%4

General $494,870Capital Outlay ($12,748)
Pension $149,967Special Education $35,804
Ending Fund Balance
Bond Redemption $150,998Capital Projects $0
Other Fund Data
Agricultural $3.19Non-Ag Z $4.19Owner Occupied $5.13Other Non-Ag/Utilities $11.00Special Education $1.40
Bond Redemption $1.88Pension Fund $0.30
Capital Outlay $2.00
2005 Payable 2006 Levy per Thousand
$876,406$132,373
$77,333
General AidSpecial EducationExtraordinary Cost Fund - SE
$1,086,112Total State Aid
State Aid
Special Education Federal Flowthrough
$57,228IDEA Part BPart B, Sec. 619, PK $2,578
$59,806Total
K-12 Instruction $879,823PK Instruction $27,673Adult Instruction $0
$259,065$11,751
$0
General Special Education
Expenditures
Community Services $0Non-Programmed $174Debt Service $0Co-Curricular $109,547
$0$0$0$0
Total Expenditures $1,658,008 $376,655
2005 Payable 2006Taxable Valuations
Agricultural $63,639,441Owner Occupied $18,576,552Non-Ag Z $1,022,528Other Non-Ag/Utilities $14,341,557Total $97,580,078
$34,35715.5
0.0%21.2
$30,591Average Teacher SalaryExperience Adjusted SalaryAvg Years of Experience% with Advanced DegreesCertified Instructional Staff
Teaching Staff Data
ADM of Tuitioned Out Paid 2.243
General State Aid Adj. ADM 310.857Non-Public / Home Sch ADM 1.846
ADM Data
Local $579,164County $12,146State $921,859Federal $107,961Total $1,621,130
$189,773$0$0$0
$132,229$0
$209,706$56,295
General Capital Outlay Special Education Pension
$189,773 $398,231 $31,653
Revenue
Classroom Staff 0.0
ADM of Contracted Out Paid 0.000
Other Special Revenue $0
310 E Harry St, Castlewood, SD 57223
2005-2006 Profile of Castlewood School District 28-1
Capital Outlay Pension
Student/Staff ServicesAdministration ServicesTransportation ServicesOther Support Services
Enterprise Funds
Cost per ADM
General Fund Only
Revenue Expenditures
* Includes General, Special Education and Pension Funds
Home County: HamlinArea in Square Miles: 130
2005 K-12 Fall Enrollment: 272
$31,653$0$0$0
$0$0
$0$0$0
$140,175$190,381
$72,038$238,198
$4,580$0
$64,343$62,764
$0$0
$78,130$1,658
$83,265$22,574
$0$0
$0$0$0$0$0
$24,866$0$0
$5,894Educational Funds* $6,823
$182,520$0$0
$127,212 $128,692
$268,328 $24,866
$56,853

December 2005 Federal Child Count
0Deaf-Blind
010
1
DeafSpeech/Language
Autism
3Emotionally Disturbed10
21800
Mental RetardationHearing ImpairedLearning DisabledMultiple DisabilitiesOrthopedic ImpairmentVisually Impaired
2
00
Other Health Impaired
Traumatic Brain InjuryDevelopmental Delay
46Total
0
1
40
00
24
9
7
0
1
0
Home
Early Childhood Setting
PT Early Child and SEEarly Childhood SE Setting
Separate SchoolResidential Facility
Regular Classroom
Resource Room
Self-Contained Classroom
Day Program
24 Hour Program
Home/Hospital Program
Special Education Placement Categories
Total 46
Student to Staff Ratio 14.1
K-8 178.1209-12 82.782
182.99486.276
ADA ADM
Total 260.902 269.270
Student Data
PK-12 Enrollment 299Open Enrolled Students Rec'd 20District Dropout Rate 0.0%
% Special Needs Students 15.4%% Eligible for Free/Red. Lunch 44.0%
Students Transported 94
District Attendance RateNumber of Graduates
96.9%19
Enrollment
Stanford Achievement Test Series, Tenth Edition (SAT10)
76
76
83
66
76
74
Math
Social Science
Language Arts
Reading
Complete Battery
Science
Stanford Writing Assessment Program, Third Edition
Grade 5
Grade 9
American College Test (ACT)
Grade 5Total
PRSpEd
PR
Number Tested
English
17
75%
Total PR
Sp Ed PR
89
79
86
78
82
82
82
66
67
63
81
72
65%
Grade 4 Grade 3Total
PRSp Ed
PR
Grade 6Total
PRSp Ed
PR
15 25 183 1 1
Sp EdTotal
Number Tested
Grade 7Total
PRSp Ed
PR
Grade 8 Total
PRSp Ed
PR
Grade 11Total
PRSp Ed
PR
MathReadingScienceComposite Score
20.220.619.0
20.120.1
82
81
85
83
80
81
17 3
77
78
85
74
68
75
79
70
77
70
70
73
78
61
65
71
69
69
425 122 422
Percent Proficient or Higher
No assessment data are reported when less than ten students were tested.
Ideas and Development
Sp EdTotal
Organization, Unity, and Coherence
Sp EdTotal
Word Choice
Sp EdTotal
Sentences and Paragraphs
Sp EdTotal
Grammer and Usage
Sp EdTotal
Writing Mechanics
Sp EdTotal
NumberTested
60% 56% 44%
70%
60%
60%
64%
65%
36%
75%
25
20

General $300,378Capital Outlay $92,217
PensionSpecial Education $14,436
Ending Fund Balance
Bond Redemption $170,320Capital Projects $0
Other Fund Data
Agricultural $3.87Non-Ag Z $5.08Owner Occupied $6.22Other Non-Ag/Utilities $13.34Special Education $1.40
Bond Redemption $1.52Pension Fund $0.30
Capital Outlay $1.25
2005 Payable 2006 Levy per Thousand
$828,158$3,855
$73,457
General AidSpecial EducationExtraordinary Cost Fund - SE
$905,470Total State Aid
State Aid
Special Education Federal Flowthrough
$53,732IDEA Part BPart B, Sec. 619, PK $2,555
$56,287Total
K-12 Instruction $829,826PK Instruction $0Adult Instruction $0
$189,928$15,392
$0
General Special Education
Expenditures
Community Services $0Non-Programmed $22,110Debt Service $0Co-Curricular $90,162
$0$0$0$0
Total Expenditures $1,506,851 $276,474
2005 Payable 2006Taxable Valuations
Agricultural $82,154,785Owner Occupied $22,554,499Non-Ag Z $5,591,430Other Non-Ag/Utilities $6,785,358Total $117,086,072
$29,93112.4
0.0%23.0
$28,667Average Teacher SalaryExperience Adjusted SalaryAvg Years of Experience% with Advanced DegreesCertified Instructional Staff
Teaching Staff Data
ADM of Tuitioned Out Paid 0.567
General State Aid Adj. ADM 298.015Non-Public / Home Sch ADM 0.000
ADM Data
Local $620,267County $19,625State $855,122Federal $54,525Total $1,549,540
$138,424$0$0$0
$155,037$0
$77,312$58,561
General Capital Outlay Special Education Pension
$138,424 $290,910 $33,222
Revenue
Classroom Staff 0.0
ADM of Contracted Out Paid 0.000
Other Special Revenue $0
610 Lincoln St, Centerville, SD 57014
2005-2006 Profile of Centerville School District 60-1
Capital Outlay Pension
Student/Staff ServicesAdministration ServicesTransportation ServicesOther Support Services
Enterprise Funds
Cost per ADM
General Fund Only
Revenue Expenditures
* Includes General, Special Education and Pension Funds
Home County: TurnerArea in Square Miles: 139
2005 K-12 Fall Enrollment: 263
$33,222$0$0$0
$0$0
$31,963$0$0
$50,551$156,938
$48,552$308,712
$0$0
$4,750$38,015
$0$0$0
$4,174
$47,033$16,087$6,140$1,894
$0$1,259
$0$0$0$0$0$0
$5,795Educational Funds* $6,860
$167,344$0$0
$83,733 $83,587
*District has opted out of General Fund levy
$110,264 $33,222
$63,325

December 2005 Federal Child Count
0Deaf-Blind
014
2
DeafSpeech/Language
Autism
1Emotionally Disturbed10
16100
Mental RetardationHearing ImpairedLearning DisabledMultiple DisabilitiesOrthopedic ImpairmentVisually Impaired
3
05
Other Health Impaired
Traumatic Brain InjuryDevelopmental Delay
43Total
0
0
07
00
27
6
2
0
1
0
Home
Early Childhood Setting
PT Early Child and SEEarly Childhood SE Setting
Separate SchoolResidential Facility
Regular Classroom
Resource Room
Self-Contained Classroom
Day Program
24 Hour Program
Home/Hospital Program
Special Education Placement Categories
Total 43
Student to Staff Ratio 11.7
K-8 157.3089-12 90.443
162.76694.714
ADA ADM
Total 247.751 257.480
Student Data
PK-12 Enrollment 270Open Enrolled Students Rec'd 21District Dropout Rate 1.9%
% Special Needs Students 15.9%% Eligible for Free/Red. Lunch 32.9%
Students Transported 91
District Attendance RateNumber of Graduates
96.2%24
Enrollment
Stanford Achievement Test Series, Tenth Edition (SAT10)
85
89
88
84
83
84
Math
Social Science
Language Arts
Reading
Complete Battery
Science
Stanford Writing Assessment Program, Third Edition
Grade 5
Grade 9
American College Test (ACT)
Grade 5Total
PRSpEd
PR
Number Tested
English
15
79%
Total PR
Sp Ed PR
76
69
72
62
70
69
84
67
52
53
75
67
74%
Grade 4 Grade 3Total
PRSp Ed
PR
Grade 6Total
PRSp Ed
PR
17 19 251 4 3
Sp EdTotal
Number Tested
Grade 7Total
PRSp Ed
PR
Grade 8 Total
PRSp Ed
PR
Grade 11Total
PRSp Ed
PR
MathReadingScienceComposite Score
24.024.922.0
22.523.5
87
79
86
71
77
80
16 3
78
72
87
78
63
76
76
84
87
74
73
77
75
70
66
74
69
70
315 19 428
Percent Proficient or Higher
No assessment data are reported when less than ten students were tested.
Ideas and Development
Sp EdTotal
Organization, Unity, and Coherence
Sp EdTotal
Word Choice
Sp EdTotal
Sentences and Paragraphs
Sp EdTotal
Grammer and Usage
Sp EdTotal
Writing Mechanics
Sp EdTotal
NumberTested
75% 56% 69%
68%
89%
58%
75%
58%
50%
74%
16
19

General $1,205,357Capital Outlay $2,871,934
Pension $66,074Special Education ($27,222)
Ending Fund Balance
Bond Redemption $171,250Capital Projects $51,848
Other Fund Data
Agricultural $3.19Non-Ag Z $4.19Owner Occupied $5.13Other Non-Ag/Utilities $11.00Special Education $1.40
Bond Redemption $1.11Pension Fund $0.30
Capital Outlay $3.00
2005 Payable 2006 Levy per Thousand
$2,360,452$548,826
$76,735
General AidSpecial EducationExtraordinary Cost Fund - SE
$2,986,013Total State Aid
State Aid
Special Education Federal Flowthrough
$198,565IDEA Part BPart B, Sec. 619, PK $5,473
$204,038Total
K-12 Instruction $3,513,352PK Instruction $0Adult Instruction $0
$1,013,292$82,819
$0
General Special Education
Expenditures
Community Services $34,976Non-Programmed $38,130Debt Service $0Co-Curricular $232,953
$0$0$0$0
Total Expenditures $5,811,380 $1,298,728
2005 Payable 2006Taxable Valuations
Agricultural $144,201,325Owner Occupied $66,265,726Non-Ag Z $1,887,042Other Non-Ag/Utilities $57,593,935Total $269,948,028
$31,66116.2
11.0%79.0
$31,865Average Teacher SalaryExperience Adjusted SalaryAvg Years of Experience% with Advanced DegreesCertified Instructional Staff
Teaching Staff Data
ADM of Tuitioned Out Paid 3.695
General State Aid Adj. ADM 850.714Non-Public / Home Sch ADM 165.175
ADM Data
Local $1,887,017County $82,255State $2,500,434Federal $1,204,373Total $5,674,079
$841,548$0$0$0
$368,257$0
$625,561$266,349
General Capital Outlay Special Education Pension
$841,548 $1,260,167 $78,490
Revenue
Classroom Staff 2.0
ADM of Contracted Out Paid 0.000
Other Special Revenue $0
301 E Kellam Ave, Chamberlain, SD 57325-0119
2005-2006 Profile of Chamberlain School District 07-1
Capital Outlay Pension
Student/Staff ServicesAdministration ServicesTransportation ServicesOther Support Services
Enterprise Funds
Cost per ADM
General Fund Only
Revenue Expenditures
* Includes General, Special Education and Pension Funds
Home County: BruleArea in Square Miles: 930
2005 K-12 Fall Enrollment: 858
$78,490$0$0$0
$0$0
$49,160$0$0
$691,098$381,995$228,517$690,359
$56,138$0
$48,444$146,766
$0$0
$321,665$7,731
$143,572$43,860$15,185
$0
$0$0$0$0$0$0$0$0
$6,820Educational Funds* $7,989
$306,443$0
$431,037$328,245 $324,112
$762,819 $49,160
$182,075

December 2005 Federal Child Count
0Deaf-Blind
235
2
DeafSpeech/Language
Autism
2Emotionally Disturbed10
04617
20
Mental RetardationHearing ImpairedLearning DisabledMultiple DisabilitiesOrthopedic ImpairmentVisually Impaired
5
032
Other Health Impaired
Traumatic Brain InjuryDevelopmental Delay
153Total
1
12
380
00
71
19
7
2
3
0
Home
Early Childhood Setting
PT Early Child and SEEarly Childhood SE Setting
Separate SchoolResidential Facility
Regular Classroom
Resource Room
Self-Contained Classroom
Day Program
24 Hour Program
Home/Hospital Program
Special Education Placement Categories
Total 153
Student to Staff Ratio 11.0
K-8 553.9739-12 255.321
576.791270.228
ADA ADM
Total 809.294 847.019
Student Data
PK-12 Enrollment 895Open Enrolled Students Rec'd 38District Dropout Rate 2.2%
% Special Needs Students 17.1%% Eligible for Free/Red. Lunch 36.2%
Students Transported 319
District Attendance RateNumber of Graduates
95.5%63
Enrollment
Stanford Achievement Test Series, Tenth Edition (SAT10)
81
80
77
57
73
74
Math
Social Science
Language Arts
Reading
Complete Battery
Science
Stanford Writing Assessment Program, Third Edition
Grade 5
Grade 9
American College Test (ACT)
Grade 5Total
PRSpEd
PR
Number Tested
English
64
34%
Total PR
Sp Ed PR
75
66
61
56
66
66
67
67
60
58
68
64
41%
Grade 4 Grade 3Total
PRSp Ed
PR
Grade 6Total
PRSp Ed
PR
52 58 433 3 2
Sp EdTotal
Number Tested
Grade 7Total
PRSp Ed
PR
Grade 8 Total
PRSp Ed
PR
Grade 11Total
PRSp Ed
PR
MathReadingScienceComposite Score
21.221.319.8
20.220.8
76
67
59
66
63
66
55 5
73 63
73 71
77 62
62 41
58 36
68 54
81
72
67
72
58
70
74
63
58
58
51
61
1078 467 966
Percent Proficient or Higher
No assessment data are reported when less than ten students were tested.
Ideas and Development
Sp EdTotal
Organization, Unity, and Coherence
Sp EdTotal
Word Choice
Sp EdTotal
Sentences and Paragraphs
Sp EdTotal
Grammer and Usage
Sp EdTotal
Writing Mechanics
Sp EdTotal
NumberTested
42% 40% 42%
38%
35%
36%
38%
40%
27%
52%
81
88

General $678,669Capital Outlay $855,565
Pension $16,727Special Education $22,305
Ending Fund Balance
Bond Redemption $74,113Capital Projects $0
Other Fund Data
Agricultural $3.19Non-Ag Z $4.19Owner Occupied $5.13Other Non-Ag/Utilities $11.00Special Education $1.40
Bond Redemption $0.57Pension Fund $0.30
Capital Outlay $3.00
2005 Payable 2006 Levy per Thousand
$924,796$88,823$31,700
General AidSpecial EducationExtraordinary Cost Fund - SE
$1,045,319Total State Aid
State Aid
Special Education Federal Flowthrough
$60,857IDEA Part BPart B, Sec. 619, PK $4,062
$64,919Total
K-12 Instruction $1,021,238PK Instruction $0Adult Instruction $0
$248,790$19,996
$0
General Special Education
Expenditures
Community Services $0Non-Programmed $0Debt Service $0Co-Curricular $104,738
$0$0$0$0
Total Expenditures $2,117,102 $377,093
2005 Payable 2006Taxable Valuations
Agricultural $77,010,126Owner Occupied $42,607,583Non-Ag Z $987,168Other Non-Ag/Utilities $25,275,138Total $145,880,015
$34,07212.6
0.0%26.4
$33,339Average Teacher SalaryExperience Adjusted SalaryAvg Years of Experience% with Advanced DegreesCertified Instructional Staff
Teaching Staff Data
ADM of Tuitioned Out Paid 0.963
General State Aid Adj. ADM 442.162Non-Public / Home Sch ADM 0.000
ADM Data
Local $937,096County $35,968State $968,142Federal $191,218Total $2,132,423
$429,613$0$0$0
$193,338$401
$120,523$80,276
General Capital Outlay Special Education Pension
$429,613 $394,538 $42,154
Revenue
Classroom Staff 0.0
ADM of Contracted Out Paid 0.000
Other Special Revenue $0
102 2nd Ave, Chester, SD 57016
2005-2006 Profile of Chester Area School District 39-1
Capital Outlay Pension
Student/Staff ServicesAdministration ServicesTransportation ServicesOther Support Services
Enterprise Funds
Cost per ADM
General Fund Only
Revenue Expenditures
* Includes General, Special Education and Pension Funds
Home County: LakeArea in Square Miles: 141
2005 K-12 Fall Enrollment: 355
$42,154$0$0$0
$0$0
$41,329$0$0
$295,774$276,641$109,470$309,240
$16,899$0$0
$107,086$0$0$0
$33,224
$85,608$8,774$1,190
$12,735
$0$0$0$0$0$0$0$0
$5,110Educational Funds* $6,051
$84,283$0$0
$143,405 $143,942
$350,030 $41,329
$192,821

December 2005 Federal Child Count
0Deaf-Blind
010
2
DeafSpeech/Language
Autism
2Emotionally Disturbed50
12100
Mental RetardationHearing ImpairedLearning DisabledMultiple DisabilitiesOrthopedic ImpairmentVisually Impaired
5
03
Other Health Impaired
Traumatic Brain InjuryDevelopmental Delay
40Total
0
0
30
00
33
4
0
0
0
0
Home
Early Childhood Setting
PT Early Child and SEEarly Childhood SE Setting
Separate SchoolResidential Facility
Regular Classroom
Resource Room
Self-Contained Classroom
Day Program
24 Hour Program
Home/Hospital Program
Special Education Placement Categories
Total 40
Student to Staff Ratio 13.7
K-8 226.8449-12 174.728
232.785180.503
ADA ADM
Total 401.572 413.288
Student Data
PK-12 Enrollment 362Open Enrolled Students Rec'd 65District Dropout Rate 0.0%
% Special Needs Students 11.0%% Eligible for Free/Red. Lunch 14.0%
Students Transported 210
District Attendance RateNumber of Graduates
97.2%38
Enrollment
Stanford Achievement Test Series, Tenth Edition (SAT10)
89
75
77
68
79
79
Math
Social Science
Language Arts
Reading
Complete Battery
Science
Stanford Writing Assessment Program, Third Edition
Grade 5
Grade 9
American College Test (ACT)
Grade 5Total
PRSpEd
PR
Number Tested
English
31
82%
Total PR
Sp Ed PR
82
63
66
65
67
70
66
65
55
41
68
61
68%
Grade 4 Grade 3Total
PRSp Ed
PR
Grade 6Total
PRSp Ed
PR
21 28 274 2
Sp EdTotal
Number Tested
Grade 7Total
PRSp Ed
PR
Grade 8 Total
PRSp Ed
PR
Grade 11Total
PRSp Ed
PR
MathReadingScienceComposite Score
21.020.921.9
21.721.5
85
79
80
68
73
77
23 4
84
74
85
72
72
77
71
63
73
62
62
66
71
59
57
67
59
60
221 329 539
Percent Proficient or Higher
No assessment data are reported when less than ten students were tested.
Ideas and Development
Sp EdTotal
Organization, Unity, and Coherence
Sp EdTotal
Word Choice
Sp EdTotal
Sentences and Paragraphs
Sp EdTotal
Grammer and Usage
Sp EdTotal
Writing Mechanics
Sp EdTotal
NumberTested
64% 64% 68%
71%
45%
71%
55%
61%
59%
75%
22
28

General $731,031Capital Outlay $203,543
Pension $289,494Special Education $148,468
Ending Fund Balance
Bond Redemption $301,839Capital Projects $0
Other Fund Data
Agricultural $3.19Non-Ag Z $4.19Owner Occupied $5.13Other Non-Ag/Utilities $11.00Special Education $1.00
Bond Redemption $1.43Pension Fund $0.30
Capital Outlay $1.00
2005 Payable 2006 Levy per Thousand
$853,113$0$0
General AidSpecial EducationExtraordinary Cost Fund - SE
$853,113Total State Aid
State Aid
Special Education Federal Flowthrough
$98,690IDEA Part BPart B, Sec. 619, PK $2,649
$101,339Total
K-12 Instruction $1,351,567PK Instruction $0Adult Instruction $0
$138,536$41,847
$0
General Special Education
Expenditures
Community Services $1,649Non-Programmed $0Debt Service $0Co-Curricular $128,223
$0$0$0$0
Total Expenditures $2,369,475 $319,492
2005 Payable 2006Taxable Valuations
Agricultural $152,772,422Owner Occupied $24,580,288Non-Ag Z $1,754,114Other Non-Ag/Utilities $37,199,761Total $216,306,585
$30,84317.1
15.2%31.1
$33,314Average Teacher SalaryExperience Adjusted SalaryAvg Years of Experience% with Advanced DegreesCertified Instructional Staff
Teaching Staff Data
ADM of Tuitioned Out Paid 0.000
General State Aid Adj. ADM 435.322Non-Public / Home Sch ADM 0.000
ADM Data
Local $1,239,483County $33,606State $916,334Federal $176,630Total $2,366,054
$214,262$0$0$0
$214,895$0$0
$97,045
General Capital Outlay Special Education Pension
$214,262 $311,940 $64,332
Revenue
Classroom Staff 0.5
ADM of Contracted Out Paid 0.000
Other Special Revenue $0
220 N Clinton, Clark, SD 57225
2005-2006 Profile of Clark School District 12-2
Capital Outlay Pension
Student/Staff ServicesAdministration ServicesTransportation ServicesOther Support Services
Enterprise Funds
Cost per ADM
General Fund Only
Revenue Expenditures
* Includes General, Special Education and Pension Funds
Home County: ClarkArea in Square Miles: 581
2005 K-12 Fall Enrollment: 408
$64,332$0$0$0
$0$0
$4,070$0$0
$85,941$245,259$207,242$349,593
$38,648$0
$36,045$33,616
$0$0
$8,400$14,064
$111,810$27,299
$0$0
$1,190$5,050
$0$6,156
$0$0$0
$2,963
$5,796Educational Funds* $6,524
$304,362$0$0
$211,903 $218,240
$177,825 $19,429
$47,051

December 2005 Federal Child Count
0Deaf-Blind
016
1
DeafSpeech/Language
Autism
2Emotionally Disturbed00
22200
Mental RetardationHearing ImpairedLearning DisabledMultiple DisabilitiesOrthopedic ImpairmentVisually Impaired
2
05
Other Health Impaired
Traumatic Brain InjuryDevelopmental Delay
50Total
0
5
01
00
33
10
0
0
0
1
Home
Early Childhood Setting
PT Early Child and SEEarly Childhood SE Setting
Separate SchoolResidential Facility
Regular Classroom
Resource Room
Self-Contained Classroom
Day Program
24 Hour Program
Home/Hospital Program
Special Education Placement Categories
Total 50
Student to Staff Ratio 13.6
K-8 273.0559-12 122.563
281.105126.413
ADA ADM
Total 395.618 407.518
Student Data
PK-12 Enrollment 429Open Enrolled Students Rec'd 2District Dropout Rate 0.5%
% Special Needs Students 11.7%% Eligible for Free/Red. Lunch 47.9%
Students Transported 210
District Attendance RateNumber of Graduates
97.1%36
Enrollment
Stanford Achievement Test Series, Tenth Edition (SAT10)
72
73
69
53
68
67
Math
Social Science
Language Arts
Reading
Complete Battery
Science
Stanford Writing Assessment Program, Third Edition
Grade 5
Grade 9
American College Test (ACT)
Grade 5Total
PRSpEd
PR
Number Tested
English
35
77%
Total PR
Sp Ed PR
73
71
59
67
69
68
67
65
55
62
71
64
73%
Grade 4 Grade 3Total
PRSp Ed
PR
Grade 6Total
PRSp Ed
PR
30 39 407 2 1
Sp EdTotal
Number Tested
Grade 7Total
PRSp Ed
PR
Grade 8 Total
PRSp Ed
PR
Grade 11Total
PRSp Ed
PR
MathReadingScienceComposite Score
22.121.721.1
22.421.9
62
56
61
71
59
61
31 6
73
68
72
70
67
70
80
67
66
67
54
67
63
56
49
56
52
55
227 432 331
Percent Proficient or Higher
No assessment data are reported when less than ten students were tested.
Ideas and Development
Sp EdTotal
Organization, Unity, and Coherence
Sp EdTotal
Word Choice
Sp EdTotal
Sentences and Paragraphs
Sp EdTotal
Grammer and Usage
Sp EdTotal
Writing Mechanics
Sp EdTotal
NumberTested
86% 79% 86%
91%
64%
86%
61%
86%
46%
100%
28
22

General $206,961Capital Outlay $449,859
Pension $26,703Special Education $79,849
Ending Fund Balance
Bond Redemption $228,000Capital Projects $0
Other Fund Data
Agricultural $3.19Non-Ag Z $4.19Owner Occupied $5.13Other Non-Ag/Utilities $11.00Special Education $1.00
Bond Redemption $2.00Pension Fund $0.30
Capital Outlay $2.06
2005 Payable 2006 Levy per Thousand
$899,064$29
$0
General AidSpecial EducationExtraordinary Cost Fund - SE
$899,093Total State Aid
State Aid
Special Education Federal Flowthrough
$51,593IDEA Part BPart B, Sec. 619, PK $621
$52,214Total
K-12 Instruction $821,885PK Instruction $0Adult Instruction $0
$103,625$0$0
General Special Education
Expenditures
Community Services $49,302Non-Programmed $0Debt Service $3,787Co-Curricular $79,854
$0$0$0$0
Total Expenditures $1,664,768 $173,497
2005 Payable 2006Taxable Valuations
Agricultural $74,871,078Owner Occupied $27,216,530Non-Ag Z $1,961,352Other Non-Ag/Utilities $10,509,571Total $114,558,531
$30,96813.3
8.3%22.1
$29,408Average Teacher SalaryExperience Adjusted SalaryAvg Years of Experience% with Advanced DegreesCertified Instructional Staff
Teaching Staff Data
ADM of Tuitioned Out Paid 0.000
General State Aid Adj. ADM 313.188Non-Public / Home Sch ADM 2.881
ADM Data
Local $610,233County $25,505State $931,409Federal $91,455Total $1,658,602
$245,146$0$0$0
$115,810$0
$29$48,239
General Capital Outlay Special Education Pension
$245,146 $164,077 $32,510
Revenue
Classroom Staff 0.0
ADM of Contracted Out Paid 0.000
Other Special Revenue $0
200 S Loban, Colman, SD 57017-0239
2005-2006 Profile of Colman-Egan School District 50-5
Capital Outlay Pension
Student/Staff ServicesAdministration ServicesTransportation ServicesOther Support Services
Enterprise Funds
Cost per ADM
General Fund Only
Revenue Expenditures
* Includes General, Special Education and Pension Funds
Home County: MoodyArea in Square Miles: 137
2005 K-12 Fall Enrollment: 273
$32,510$0$0$0
$0$0
$30,000$0$0
$113,888$255,366
$93,809$246,877
$0$1,635
$12,650$19,012
$0$0
$90,335$2,579
$51,647$8,079
$0$10,146
$0$0$0$0$0
$17,980$0$0
$5,840Educational Funds* $6,648
$240,250$0$0
$123,771 $118,981
$161,274 $47,980
$35,063

December 2005 Federal Child Count
0Deaf-Blind
011
0
DeafSpeech/Language
Autism
3Emotionally Disturbed10
12000
Mental RetardationHearing ImpairedLearning DisabledMultiple DisabilitiesOrthopedic ImpairmentVisually Impaired
5
00
Other Health Impaired
Traumatic Brain InjuryDevelopmental Delay
32Total
0
0
40
00
25
3
0
0
0
0
Home
Early Childhood Setting
PT Early Child and SEEarly Childhood SE Setting
Separate SchoolResidential Facility
Regular Classroom
Resource Room
Self-Contained Classroom
Day Program
24 Hour Program
Home/Hospital Program
Special Education Placement Categories
Total 32
Student to Staff Ratio 12.4
K-8 166.4139-12 95.381
171.831101.140
ADA ADM
Total 261.794 272.971
Student Data
PK-12 Enrollment 275Open Enrolled Students Rec'd 24District Dropout Rate 0.0%
% Special Needs Students 11.6%% Eligible for Free/Red. Lunch 14.4%
Students Transported 112
District Attendance RateNumber of Graduates
95.9%24
Enrollment
Stanford Achievement Test Series, Tenth Edition (SAT10)
85
71
79
62
75
75
Math
Social Science
Language Arts
Reading
Complete Battery
Science
Stanford Writing Assessment Program, Third Edition
Grade 5
Grade 9
American College Test (ACT)
Grade 5Total
PRSpEd
PR
Number Tested
English
13
61%
Total PR
Sp Ed PR
83
74
81
74
71
76
87
75
61
59
71
70
65%
Grade 4 Grade 3Total
PRSp Ed
PR
Grade 6Total
PRSp Ed
PR
12 22 291 4
Sp EdTotal
Number Tested
Grade 7Total
PRSp Ed
PR
Grade 8 Total
PRSp Ed
PR
Grade 11Total
PRSp Ed
PR
MathReadingScienceComposite Score
19.222.320.2
20.220.6
93
96
98
68
79
87
14 1
83
78
82
77
69
76
82
69
81
73
70
75
82
68
81
77
75
77
223 215 223
Percent Proficient or Higher
No assessment data are reported when less than ten students were tested.
Ideas and Development
Sp EdTotal
Organization, Unity, and Coherence
Sp EdTotal
Word Choice
Sp EdTotal
Sentences and Paragraphs
Sp EdTotal
Grammer and Usage
Sp EdTotal
Writing Mechanics
Sp EdTotal
NumberTested
76% 57% 81%
61%
43%
65%
52%
83%
38%
83%
21
23

General $519,751Capital Outlay $51,073
Pension $10,988Special Education $31,838
Ending Fund Balance
Bond Redemption $0Capital Projects $0
Other Fund Data
Agricultural $3.80Non-Ag Z $4.99Owner Occupied $6.11Other Non-Ag/Utilities $13.10Special Education $1.40
Bond Redemption $0.00Pension Fund $0.30
Capital Outlay $1.25
2005 Payable 2006 Levy per Thousand
$656,647$57,919
$0
General AidSpecial EducationExtraordinary Cost Fund - SE
$714,566Total State Aid
State Aid
Special Education Federal Flowthrough
$32,634IDEA Part BPart B, Sec. 619, PK $0
$32,634Total
K-12 Instruction $681,259PK Instruction $5,569Adult Instruction $0
$61,715$0$0
General Special Education
Expenditures
Community Services $33,437Non-Programmed $0Debt Service $0Co-Curricular $51,489
$0$0$0$0
Total Expenditures $1,209,492 $192,798
2005 Payable 2006Taxable Valuations
Agricultural $64,680,959Owner Occupied $6,932,911Non-Ag Z $1,112,127Other Non-Ag/Utilities $1,851,707Total $74,577,704
$28,18518.5
10.0%18.9
$29,006Average Teacher SalaryExperience Adjusted SalaryAvg Years of Experience% with Advanced DegreesCertified Instructional Staff
Teaching Staff Data
ADM of Tuitioned Out Paid 1.000
General State Aid Adj. ADM 222.445Non-Public / Home Sch ADM 0.000
ADM Data
Local $412,122County $9,535State $692,820Federal $129,324Total $1,243,801
$96,490$0$0
$4,500
$101,242$0
$57,919$30,896
General Capital Outlay Special Education Pension
$100,990 $190,057 $21,419
Revenue
Classroom Staff 0.0
ADM of Contracted Out Paid 0.000
Other Special Revenue $0
105 Carr Street, Colome, SD 57528
2005-2006 Profile of Colome School District 59-1
Capital Outlay Pension
Student/Staff ServicesAdministration ServicesTransportation ServicesOther Support Services
Enterprise Funds
Cost per ADM
General Fund Only
Revenue Expenditures
* Includes General, Special Education and Pension Funds
Home County: TrippArea in Square Miles: 326
2005 K-12 Fall Enrollment: 188
$21,419$0$0$0
$0$0
$10,431$0$0
$84,898$116,687
$61,433$174,720
$857$0
$57,135$12,494
$0$0
$46,825$0
$70,302$56
$2,062$58,663
$0$0$0$0$0$0$0$0
$6,315Educational Funds* $7,265
$0$0$0
$64,640 $67,005
*District has opted out of General Fund levy
$149,330 $10,431
$32,018

December 2005 Federal Child Count
0Deaf-Blind
06
0
DeafSpeech/Language
Autism
1Emotionally Disturbed105200
Mental RetardationHearing ImpairedLearning DisabledMultiple DisabilitiesOrthopedic ImpairmentVisually Impaired
4
02
Other Health Impaired
Traumatic Brain InjuryDevelopmental Delay
21Total
0
1
11
00
14
2
1
0
1
0
Home
Early Childhood Setting
PT Early Child and SEEarly Childhood SE Setting
Separate SchoolResidential Facility
Regular Classroom
Resource Room
Self-Contained Classroom
Day Program
24 Hour Program
Home/Hospital Program
Special Education Placement Categories
Total 21
Student to Staff Ratio 10.4
K-8 115.1689-12 63.005
118.16366.035
ADA ADM
Total 178.173 184.198
Student Data
PK-12 Enrollment 197Open Enrolled Students Rec'd 39District Dropout Rate 1.9%
% Special Needs Students 10.7%% Eligible for Free/Red. Lunch 48.3%
Students Transported 106
District Attendance RateNumber of Graduates
96.7%27
Enrollment
Stanford Achievement Test Series, Tenth Edition (SAT10)
83
85
87
70
81
81
Math
Social Science
Language Arts
Reading
Complete Battery
Science
Stanford Writing Assessment Program, Third Edition
Grade 5
Grade 9
American College Test (ACT)
Grade 5Total
PRSpEd
PR
Number Tested
English
6
50%
Total PR
Sp Ed PR
79
63
65
60
59
66
90
80
62
65
80
75
58%
Grade 4 Grade 3Total
PRSp Ed
PR
Grade 6Total
PRSp Ed
PR
7 17 161 3
Sp EdTotal
Number Tested
Grade 7Total
PRSp Ed
PR
Grade 8 Total
PRSp Ed
PR
Grade 11Total
PRSp Ed
PR
MathReadingScienceComposite Score
95
84
93
84
92
90
11
93
81
91
80
82
87
88
82
83
79
74
81
92
80
75
86
82
84
17 12 17
Percent Proficient or Higher
No assessment data are reported when less than ten students were tested.
Ideas and Development
Sp EdTotal
Organization, Unity, and Coherence
Sp EdTotal
Word Choice
Sp EdTotal
Sentences and Paragraphs
Sp EdTotal
Grammer and Usage
Sp EdTotal
Writing Mechanics
Sp EdTotal
NumberTested
82% 76% 71%
58%
73%
42%
65%
71%
65%
71%
17
24

General $680,928Capital Outlay $18,875
PensionSpecial Education $45,447
Ending Fund Balance
Bond Redemption $0Capital Projects $0
Other Fund Data
Agricultural $6.63Non-Ag Z $8.71Owner Occupied $10.66Other Non-Ag/Utilities $22.86Special Education $0.50
Bond Redemption $0.00Pension Fund $0.00
Capital Outlay $0.21
2005 Payable 2006 Levy per Thousand
$0$0$0
General AidSpecial EducationExtraordinary Cost Fund - SE
$0Total State Aid
State Aid
Special Education Federal Flowthrough
$21,313IDEA Part BPart B, Sec. 619, PK $551
$21,864Total
K-12 Instruction $540,977PK Instruction $0Adult Instruction $0
$17,986$4,899
$0
General Special Education
Expenditures
Community Services $0Non-Programmed $11,748Debt Service $0Co-Curricular $52,306
$0$0$0$0
Total Expenditures $939,052 $40,043
2005 Payable 2006Taxable Valuations
Agricultural $60,906,655Owner Occupied $3,910,578Non-Ag Z $507,304Other Non-Ag/Utilities $17,645,534Total $82,970,071
$30,62710.0
0.0%11.1
$30,904Average Teacher SalaryExperience Adjusted SalaryAvg Years of Experience% with Advanced DegreesCertified Instructional Staff
Teaching Staff Data
ADM of Tuitioned Out Paid 0.040
General State Aid Adj. ADM 91.032Non-Public / Home Sch ADM 0.000
ADM Data
Local $890,633County $5,458State $14,329Federal $65,394Total $975,813
$9,074$0$0$0
$38,934$0$0
$19,570
General Capital Outlay Special Education Pension
$9,074 $58,504 $0
Revenue
Classroom Staff 0.5
ADM of Contracted Out Paid 0.000
Other Special Revenue $0
130 3rd St SW, Conde, SD 57434
2005-2006 Profile of Conde School District 56-1
Capital Outlay Pension
Student/Staff ServicesAdministration ServicesTransportation ServicesOther Support Services
Enterprise Funds
Cost per ADM
General Fund Only
Revenue Expenditures
* Includes General, Special Education and Pension Funds
Home County: SpinkArea in Square Miles: 240
2005 K-12 Fall Enrollment: 76
$0$0$0$0
$0$0
$0$0$0
$42,630$106,813
$29,496$155,082
$0$0
$10,000$6,240
$0$0$0$0
$15,945$0
$1,213$0
$0$0$0$0$0$0$0$0
$12,385Educational Funds* $12,833
$0$0$0
$40,464 $43,717
*District has opted out of General Fund levy
$35,671 $0
$19,431

December 2005 Federal Child Count
0Deaf-Blind
05
0
DeafSpeech/Language
Autism
1Emotionally Disturbed003000
Mental RetardationHearing ImpairedLearning DisabledMultiple DisabilitiesOrthopedic ImpairmentVisually Impaired
0
00
Other Health Impaired
Traumatic Brain InjuryDevelopmental Delay
9Total
0
1
00
00
8
0
0
0
0
0
Home
Early Childhood Setting
PT Early Child and SEEarly Childhood SE Setting
Separate SchoolResidential Facility
Regular Classroom
Resource Room
Self-Contained Classroom
Day Program
24 Hour Program
Home/Hospital Program
Special Education Placement Categories
Total 9
Student to Staff Ratio 6.5
K-8 36.1749-12 35.762
37.15137.041
ADA ADM
Total 71.936 74.192
Student Data
PK-12 Enrollment 76Open Enrolled Students Rec'd 0District Dropout Rate 1.9%
% Special Needs Students 11.8%% Eligible for Free/Red. Lunch 30.7%
Students Transported 12
District Attendance RateNumber of Graduates
97.0%13
Enrollment
Stanford Achievement Test Series, Tenth Edition (SAT10)
90
88
80
50
81
81
Math
Social Science
Language Arts
Reading
Complete Battery
Science
Stanford Writing Assessment Program, Third Edition
Grade 5
Grade 9
American College Test (ACT)
Grade 5Total
PRSpEd
PR
Number Tested
English
9
60%
Total PR
Sp Ed PR
69
69
58
60
69
66
83
72
74
54
80
73
60%
Grade 4 Grade 3Total
PRSp Ed
PR
Grade 6Total
PRSp Ed
PR
4 6 71
Sp EdTotal
Number Tested
Grade 7Total
PRSp Ed
PR
Grade 8 Total
PRSp Ed
PR
Grade 11Total
PRSp Ed
PR
MathReadingScienceComposite Score
84
72
62
75
78
75
1
95
93
94
85
86
90
87
86
83
80
76
82
63
52
34
48
56
51
4 4 25
Percent Proficient or Higher
No assessment data are reported when less than ten students were tested.
Ideas and Development
Sp EdTotal
Organization, Unity, and Coherence
Sp EdTotal
Word Choice
Sp EdTotal
Sentences and Paragraphs
Sp EdTotal
Grammer and Usage
Sp EdTotal
Writing Mechanics
Sp EdTotal
NumberTested
100% 75% 100%
40%
60%
60%
75%
60%
50%
60%
4
5

General $395,138Capital Outlay $1,236,792
PensionSpecial Education $148,185
Ending Fund Balance
Bond Redemption $0Capital Projects $0
Other Fund Data
Agricultural $3.19Non-Ag Z $4.19Owner Occupied $5.13Other Non-Ag/Utilities $11.00Special Education $1.40
Bond Redemption $0.00Pension Fund $0.00
Capital Outlay $3.00
2005 Payable 2006 Levy per Thousand
$577,964$0$0
General AidSpecial EducationExtraordinary Cost Fund - SE
$577,964Total State Aid
State Aid
Special Education Federal Flowthrough
$36,196IDEA Part BPart B, Sec. 619, PK $589
$36,785Total
K-12 Instruction $607,671PK Instruction $6,027Adult Instruction $0
$69,979$530
$0
General Special Education
Expenditures
Community Services $13,494Non-Programmed $0Debt Service $0Co-Curricular $50,921
$0$0$0$0
Total Expenditures $1,162,115 $162,357
2005 Payable 2006Taxable Valuations
Agricultural $75,183,924Owner Occupied $15,323,766Non-Ag Z $135,850Other Non-Ag/Utilities $7,950,024Total $98,593,564
$29,10322.3
15.8%16.2
$31,419Average Teacher SalaryExperience Adjusted SalaryAvg Years of Experience% with Advanced DegreesCertified Instructional Staff
Teaching Staff Data
ADM of Tuitioned Out Paid 1.400
General State Aid Adj. ADM 215.375Non-Public / Home Sch ADM 87.329
ADM Data
Local $490,129County $13,627State $601,383Federal $123,416Total $1,228,555
$310,478$0$0
$2,039
$136,132$0$0
$34,386
General Capital Outlay Special Education Pension
$312,517 $170,518 $0
Revenue
Classroom Staff 0.0
ADM of Contracted Out Paid 0.000
Other Special Revenue $0
120 S. Napoleon Ave., Corsica, SD 57328
2005-2006 Profile of Corsica School District 21-2
Capital Outlay Pension
Student/Staff ServicesAdministration ServicesTransportation ServicesOther Support Services
Enterprise Funds
Cost per ADM
General Fund Only
Revenue Expenditures
* Includes General, Special Education and Pension Funds
Home County: DouglasArea in Square Miles: 193
2005 K-12 Fall Enrollment: 178
$0$0$0$0
$0$0
$0$0$0
$64,530$140,118
$45,203$234,151
$0$0
$14,550$13,014
$0$0
$105,304$0
$64,288$27,560
$0$0
$0$0$0$0$0$0$0$0
$6,398Educational Funds* $7,298
$0$0$0
$70,441 $75,260
$169,743 $0
$36,876

December 2005 Federal Child Count
0Deaf-Blind
05
0
DeafSpeech/Language
Autism
1Emotionally Disturbed20
10000
Mental RetardationHearing ImpairedLearning DisabledMultiple DisabilitiesOrthopedic ImpairmentVisually Impaired
1
10
Other Health Impaired
Traumatic Brain InjuryDevelopmental Delay
20Total
0
0
10
00
17
0
0
2
0
0
Home
Early Childhood Setting
PT Early Child and SEEarly Childhood SE Setting
Separate SchoolResidential Facility
Regular Classroom
Resource Room
Self-Contained Classroom
Day Program
24 Hour Program
Home/Hospital Program
Special Education Placement Categories
Total 20
Student to Staff Ratio 11.0
K-8 109.6129-12 63.853
112.22265.857
ADA ADM
Total 173.465 178.079
Student Data
PK-12 Enrollment 178Open Enrolled Students Rec'd 1District Dropout Rate 0.0%
% Special Needs Students 11.2%% Eligible for Free/Red. Lunch 33.5%
Students Transported 66
District Attendance RateNumber of Graduates
97.4%23
Enrollment
Stanford Achievement Test Series, Tenth Edition (SAT10)
90
87
85
71
87
85
Math
Social Science
Language Arts
Reading
Complete Battery
Science
Stanford Writing Assessment Program, Third Edition
Grade 5
Grade 9
American College Test (ACT)
Grade 5Total
PRSpEd
PR
Number Tested
English
19
45%
Total PR
Sp Ed PR
76
84
82
81
83
80
94
91
88
84
95
90
36%
Grade 4 Grade 3Total
PRSp Ed
PR
Grade 6Total
PRSp Ed
PR
19 16 124 1
Sp EdTotal
Number Tested
Grade 7Total
PRSp Ed
PR
Grade 8 Total
PRSp Ed
PR
Grade 11Total
PRSp Ed
PR
MathReadingScienceComposite Score
22.322.921.3
22.622.5
91
77
75
80
76
79
9
90
71
89
81
78
82
71
80
74
66
59
68
88
89
81
88
83
84
10 316 112
Percent Proficient or Higher
No assessment data are reported when less than ten students were tested.
Ideas and Development
Sp EdTotal
Organization, Unity, and Coherence
Sp EdTotal
Word Choice
Sp EdTotal
Sentences and Paragraphs
Sp EdTotal
Grammer and Usage
Sp EdTotal
Writing Mechanics
Sp EdTotal
NumberTested
89% 89% 89%
64%
67%
100%
78%
82%
78%
82%
9
11

General $705,393Capital Outlay ($37,163)
Pension $86,318Special Education $9,680
Ending Fund Balance
Bond Redemption $0Capital Projects $447,600
Other Fund Data
Agricultural $3.19Non-Ag Z $4.19Owner Occupied $5.13Other Non-Ag/Utilities $11.00Special Education $1.40
Bond Redemption $0.00Pension Fund $0.30
Capital Outlay $3.00
2005 Payable 2006 Levy per Thousand
$566,341$137,983$122,895
General AidSpecial EducationExtraordinary Cost Fund - SE
$827,219Total State Aid
State Aid
Special Education Federal Flowthrough
$202,435IDEA Part BPart B, Sec. 619, PK $6,834
$209,269Total
K-12 Instruction $4,136,542PK Instruction $0Adult Instruction $2,000
$777,622$31,030
$0
General Special Education
Expenditures
Community Services $0Non-Programmed $35,328Debt Service $0Co-Curricular $297,671
$0$0$0$0
Total Expenditures $6,953,064 $1,190,743
2005 Payable 2006Taxable Valuations
Agricultural $66,777,876Owner Occupied $247,246,257Non-Ag Z $6,379,405Other Non-Ag/Utilities $195,243,839Total $515,647,377
$34,51916.0
13.3%81.6
$35,623Average Teacher SalaryExperience Adjusted SalaryAvg Years of Experience% with Advanced DegreesCertified Instructional Staff
Teaching Staff Data
ADM of Tuitioned Out Paid 0.819
General State Aid Adj. ADM 960.797Non-Public / Home Sch ADM 43.702
ADM Data
Local $4,060,308County $97,792State $691,063Federal $1,402,809Total $6,251,972
$1,546,982$0$0$0
$699,939$0
$260,878$208,250
General Capital Outlay Special Education Pension
$1,546,982 $1,169,067 $152,031
Revenue
Classroom Staff 0.0
ADM of Contracted Out Paid 0.000
Other Special Revenue $0
147 N 5th St, Custer, SD 57730
2005-2006 Profile of Custer School District 16-1
Capital Outlay Pension
Student/Staff ServicesAdministration ServicesTransportation ServicesOther Support Services
Enterprise Funds
Cost per ADM
General Fund Only
Revenue Expenditures
* Includes General, Special Education and Pension Funds
Home County: CusterArea in Square Miles: 1,207
2005 K-12 Fall Enrollment: 974
$152,031$0$0$0
$0$0
$13,500$0$0
$647,722$713,955$160,346$959,500
$24,865$0
$22,489$713,803
$0$0
$533,809$36,476
$206,460$96,052$51,202$28,377
$0$0$0$0$0
$116,486$0$0
$7,196Educational Funds* $8,510
$0$41
$1,520,477$295,878 $310,489
$1,552,837 $129,986
$221,396

December 2005 Federal Child Count
0Deaf-Blind
055
0
DeafSpeech/Language
Autism
10Emotionally Disturbed13
159
203
Mental RetardationHearing ImpairedLearning DisabledMultiple DisabilitiesOrthopedic ImpairmentVisually Impaired
19
011
Other Health Impaired
Traumatic Brain InjuryDevelopmental Delay
173Total
0
2
818
00
105
29
7
0
4
0
Home
Early Childhood Setting
PT Early Child and SEEarly Childhood SE Setting
Separate SchoolResidential Facility
Regular Classroom
Resource Room
Self-Contained Classroom
Day Program
24 Hour Program
Home/Hospital Program
Special Education Placement Categories
Total 173
Student to Staff Ratio 12.1
K-8 620.9799-12 307.719
646.318318.666
ADA ADM
Total 928.698 964.984
Student Data
PK-12 Enrollment 991Open Enrolled Students Rec'd 13District Dropout Rate 0.8%
% Special Needs Students 17.5%% Eligible for Free/Red. Lunch 24.2%
Students Transported 244
District Attendance RateNumber of Graduates
96.2%84
Enrollment
Stanford Achievement Test Series, Tenth Edition (SAT10)
67
70
71
59
68
66
Math
Social Science
Language Arts
Reading
Complete Battery
Science
Stanford Writing Assessment Program, Third Edition
Grade 5
Grade 9
American College Test (ACT)
Grade 5Total
PRSpEd
PR
Number Tested
English
45
58%
58
67
69
58
61
61
Total PR
Sp Ed PR
69
68
64
66
64
66
45
59
51
41
40
46
73
75
70
49
72
67
54%
Grade 4 Grade 3Total
PRSp Ed
PR
Grade 6Total
PRSp Ed
PR
67 73 7912 10 7
Sp EdTotal
Number Tested
Grade 7Total
PRSp Ed
PR
Grade 8 Total
PRSp Ed
PR
Grade 11Total
PRSp Ed
PR
MathReadingScienceComposite Score
23.622.221.6
22.722.7
74 61
69 61
72 61
70 47
71 53
71 57
75 14
61
69
73
61
62
63
79
63
67
66
64
69
78
69
67
67
64
69
663 778 675
Percent Proficient or Higher
No assessment data are reported when less than ten students were tested.
Ideas and Development
Sp EdTotal
Organization, Unity, and Coherence
Sp EdTotal
Word Choice
Sp EdTotal
Sentences and Paragraphs
Sp EdTotal
Grammer and Usage
Sp EdTotal
Writing Mechanics
Sp EdTotal
NumberTested
64% 58% 58%
56%
41%
62%
48%
65%
29%
64%
69
81

General $1,467,576Capital Outlay $124,795
Pension $78,859Special Education $212,274
Ending Fund Balance
Bond Redemption $1,185,766Capital Projects $0
Other Fund Data
Agricultural $3.84Non-Ag Z $5.04Owner Occupied $6.18Other Non-Ag/Utilities $13.24Special Education $1.20
Bond Redemption $3.02Pension Fund $0.30
Capital Outlay $1.55
2005 Payable 2006 Levy per Thousand
$708,283$0$0
General AidSpecial EducationExtraordinary Cost Fund - SE
$708,283Total State Aid
State Aid
Special Education Federal Flowthrough
$154,673IDEA Part BPart B, Sec. 619, PK $6,253
$160,926Total
K-12 Instruction $2,603,804PK Instruction $0Adult Instruction $0
$577,555$58,140
$0
General Special Education
Expenditures
Community Services $0Non-Programmed $0Debt Service $0Co-Curricular $288,862
$0$0$0$0
Total Expenditures $4,965,889 $756,147
2005 Payable 2006Taxable Valuations
Agricultural $15,199,953Owner Occupied $233,238,551Non-Ag Z $162,074Other Non-Ag/Utilities $153,658,487Total $402,259,065
$35,27210.4
32.4%66.8
$32,732Average Teacher SalaryExperience Adjusted SalaryAvg Years of Experience% with Advanced DegreesCertified Instructional Staff
Teaching Staff Data
ADM of Tuitioned Out Paid 0.000
General State Aid Adj. ADM 924.402Non-Public / Home Sch ADM 0.000
ADM Data
Local $3,838,359County $239,624State $784,292Federal $181,014Total $5,043,288
$572,580$0$0$0
$486,256$0$0
$167,179
General Capital Outlay Special Education Pension
$572,580 $653,435 $117,758
Revenue
Classroom Staff 0.0
ADM of Contracted Out Paid 0.000
Other Special Revenue $0
1150 Northshore Drive, North Sioux City, SD 57049
2005-2006 Profile of Dakota Valley School District 61-8
Capital Outlay Pension
Student/Staff ServicesAdministration ServicesTransportation ServicesOther Support Services
Enterprise Funds
Cost per ADM
General Fund Only
Revenue Expenditures
* Includes General, Special Education and Pension Funds
Home County: UnionArea in Square Miles: 30
2005 K-12 Fall Enrollment: 925
$117,758$0$0$0
$0$0
$100,000$0$0
$491,073$552,737$254,341$775,071
$154,375$19,387
$3,131$167,841
$0$0$0
$21,841
$77,133$43,319
$0$0
$0$0$0$0$0$0$0$0
$5,372Educational Funds* $6,194
$1,206,192$0$0
$401,801 $414,734
*District has opted out of General Fund levy
$397,987 $100,000
$31,414
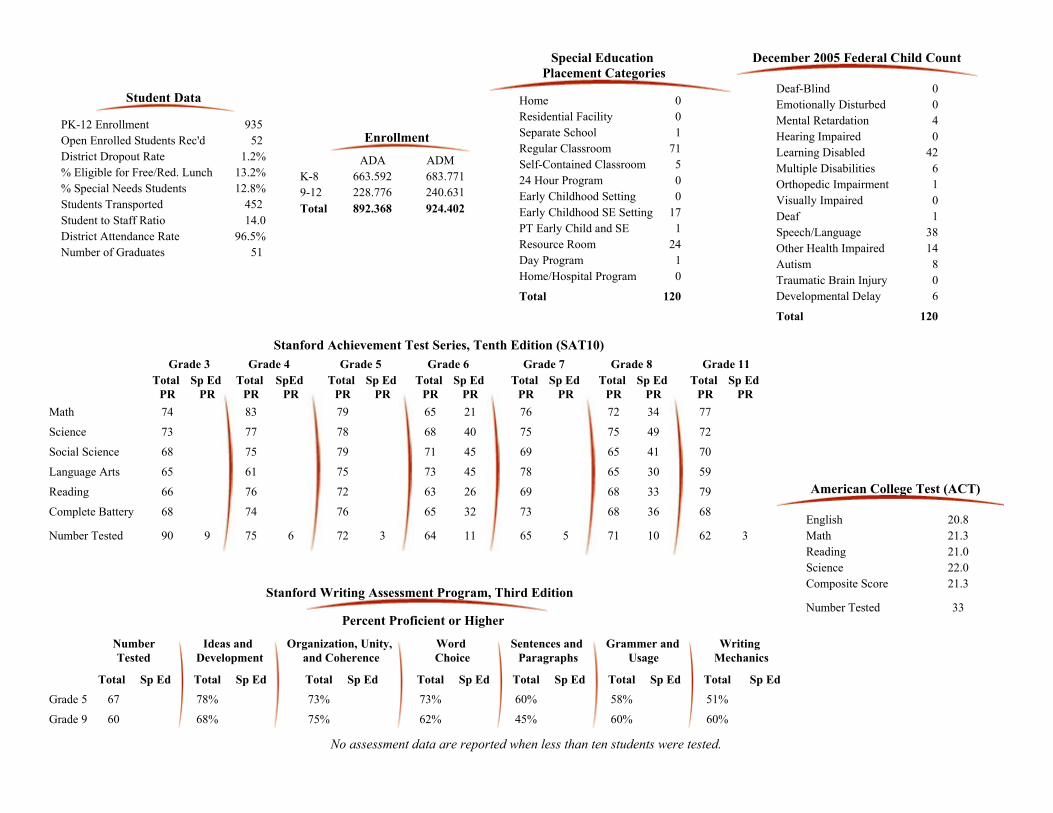
December 2005 Federal Child Count
0Deaf-Blind
138
8
DeafSpeech/Language
Autism
0Emotionally Disturbed40
42610
Mental RetardationHearing ImpairedLearning DisabledMultiple DisabilitiesOrthopedic ImpairmentVisually Impaired
14
06
Other Health Impaired
Traumatic Brain InjuryDevelopmental Delay
120Total
0
0
117
10
71
24
5
1
0
0
Home
Early Childhood Setting
PT Early Child and SEEarly Childhood SE Setting
Separate SchoolResidential Facility
Regular Classroom
Resource Room
Self-Contained Classroom
Day Program
24 Hour Program
Home/Hospital Program
Special Education Placement Categories
Total 120
Student to Staff Ratio 14.0
K-8 663.5929-12 228.776
683.771240.631
ADA ADM
Total 892.368 924.402
Student Data
PK-12 Enrollment 935Open Enrolled Students Rec'd 52District Dropout Rate 1.2%
% Special Needs Students 12.8%% Eligible for Free/Red. Lunch 13.2%
Students Transported 452
District Attendance RateNumber of Graduates
96.5%51
Enrollment
Stanford Achievement Test Series, Tenth Edition (SAT10)
83
77
75
61
76
74
Math
Social Science
Language Arts
Reading
Complete Battery
Science
Stanford Writing Assessment Program, Third Edition
Grade 5
Grade 9
American College Test (ACT)
Grade 5Total
PRSpEd
PR
Number Tested
English
33
75%
Total PR
Sp Ed PR
72
75
65
65
68
68
34
49
41
30
33
36
77
72
70
59
79
68
68%
Grade 4 Grade 3Total
PRSp Ed
PR
Grade 6Total
PRSp Ed
PR
75 71 626 10 3
Sp EdTotal
Number Tested
Grade 7Total
PRSp Ed
PR
Grade 8 Total
PRSp Ed
PR
Grade 11Total
PRSp Ed
PR
MathReadingScienceComposite Score
21.021.320.8
22.021.3
74
73
68
65
66
68
90 9
79
78
79
75
72
76
65 21
68 40
71 45
73 45
63 26
65 32
76
75
69
78
69
73
372 1164 565
Percent Proficient or Higher
No assessment data are reported when less than ten students were tested.
Ideas and Development
Sp EdTotal
Organization, Unity, and Coherence
Sp EdTotal
Word Choice
Sp EdTotal
Sentences and Paragraphs
Sp EdTotal
Grammer and Usage
Sp EdTotal
Writing Mechanics
Sp EdTotal
NumberTested
78% 73% 73%
62%
60%
45%
58%
60%
51%
60%
67
60

General $695,090Capital Outlay $103,668
Pension $14,294Special Education $11,605
Ending Fund Balance
Bond Redemption $203,349Capital Projects $0
Other Fund Data
Agricultural $4.30Non-Ag Z $5.65Owner Occupied $6.92Other Non-Ag/Utilities $14.83Special Education $1.40
Bond Redemption $1.60Pension Fund $0.30
Capital Outlay $0.75
2005 Payable 2006 Levy per Thousand
$780,286$6,815
$21,479
General AidSpecial EducationExtraordinary Cost Fund - SE
$808,580Total State Aid
State Aid
Special Education Federal Flowthrough
$53,305IDEA Part BPart B, Sec. 619, PK $630
$53,935Total
K-12 Instruction $903,640PK Instruction $0Adult Instruction $0
$127,896$11,758
$0
General Special Education
Expenditures
Community Services $646Non-Programmed $0Debt Service $0Co-Curricular $106,748
$0$0$0$0
Total Expenditures $1,738,318 $287,329
2005 Payable 2006Taxable Valuations
Agricultural $96,829,910Owner Occupied $24,714,458Non-Ag Z $428,833Other Non-Ag/Utilities $13,111,039Total $135,084,240
$28,62618.0
11.5%24.5
$29,282Average Teacher SalaryExperience Adjusted SalaryAvg Years of Experience% with Advanced DegreesCertified Instructional Staff
Teaching Staff Data
ADM of Tuitioned Out Paid 2.051
General State Aid Adj. ADM 313.429Non-Public / Home Sch ADM 0.000
ADM Data
Local $886,541County $19,783State $829,197Federal $97,007Total $1,832,528
$104,900$0$0
$3,894
$194,701$0
$28,294$56,609
General Capital Outlay Special Education Pension
$108,794 $279,604 $40,204
Revenue
Classroom Staff 0.0
ADM of Contracted Out Paid 0.000
Other Special Revenue $0
405 SW 3rd Ave, De Smet, SD 57231-0157
2005-2006 Profile of De Smet School District 38-2
Capital Outlay Pension
Student/Staff ServicesAdministration ServicesTransportation ServicesOther Support Services
Enterprise Funds
Cost per ADM
General Fund Only
Revenue Expenditures
* Includes General, Special Education and Pension Funds
Home County: KingsburyArea in Square Miles: 294
2005 K-12 Fall Enrollment: 282
$40,204$0$0$0
$0$0
$36,485$0$0
$139,729$214,712
$65,066$307,777
$7,861$2,344
$0$25,041
$0$0$0
$1,754
$77,623$11,850$25,077$33,125
$0$3,234
$0$0$0$0$0$0
$6,362Educational Funds* $7,471
$219,126$0$0
$106,456 $111,148
*District has opted out of General Fund levy
$76,755 $39,719
$39,756

December 2005 Federal Child Count
0Deaf-Blind
19
3
DeafSpeech/Language
Autism
2Emotionally Disturbed00
22020
Mental RetardationHearing ImpairedLearning DisabledMultiple DisabilitiesOrthopedic ImpairmentVisually Impaired
1
02
Other Health Impaired
Traumatic Brain InjuryDevelopmental Delay
42Total
0
0
20
00
22
15
0
1
2
0
Home
Early Childhood Setting
PT Early Child and SEEarly Childhood SE Setting
Separate SchoolResidential Facility
Regular Classroom
Resource Room
Self-Contained Classroom
Day Program
24 Hour Program
Home/Hospital Program
Special Education Placement Categories
Total 42
Student to Staff Ratio 11.5
K-8 181.6539-12 83.412
186.04087.111
ADA ADM
Total 265.065 273.151
Student Data
PK-12 Enrollment 282Open Enrolled Students Rec'd 13District Dropout Rate 0.8%
% Special Needs Students 14.9%% Eligible for Free/Red. Lunch 24.5%
Students Transported 111
District Attendance RateNumber of Graduates
97.0%26
Enrollment
Stanford Achievement Test Series, Tenth Edition (SAT10)
90
88
80
74
88
81
Math
Social Science
Language Arts
Reading
Complete Battery
Science
Stanford Writing Assessment Program, Third Edition
Grade 5
Grade 9
American College Test (ACT)
Grade 5Total
PRSpEd
PR
Number Tested
English
20
86%
Total PR
Sp Ed PR
82
79
66
63
72
73
86
83
66
78
89
81
95%
Grade 4 Grade 3Total
PRSp Ed
PR
Grade 6Total
PRSp Ed
PR
24 15 162 3
Sp EdTotal
Number Tested
Grade 7Total
PRSp Ed
PR
Grade 8 Total
PRSp Ed
PR
Grade 11Total
PRSp Ed
PR
MathReadingScienceComposite Score
21.321.919.7
20.921.2
74
79
82
71
75
75
27 9
74
77
89
72
70
75
78
71
73
69
72
72
82
73
63
69
61
70
621 520 220
Percent Proficient or Higher
No assessment data are reported when less than ten students were tested.
Ideas and Development
Sp EdTotal
Organization, Unity, and Coherence
Sp EdTotal
Word Choice
Sp EdTotal
Sentences and Paragraphs
Sp EdTotal
Grammer and Usage
Sp EdTotal
Writing Mechanics
Sp EdTotal
NumberTested
82% 68% 82%
90%
64%
90%
73%
81%
59%
86%
22
21

General $754,641Capital Outlay $562,942
Pension $78,894Special Education $292,346
Ending Fund Balance
Bond Redemption $137,200Capital Projects $0
Other Fund Data
Agricultural $3.19Non-Ag Z $4.19Owner Occupied $5.13Other Non-Ag/Utilities $11.00Special Education $1.40
Bond Redemption $0.55Pension Fund $0.30
Capital Outlay $3.00
2005 Payable 2006 Levy per Thousand
$2,331,945$324,079
$0
General AidSpecial EducationExtraordinary Cost Fund - SE
$2,656,024Total State Aid
State Aid
Special Education Federal Flowthrough
$181,434IDEA Part BPart B, Sec. 619, PK $11,727
$193,161Total
K-12 Instruction $2,678,893PK Instruction $0Adult Instruction $0
$554,907$53,503
$0
General Special Education
Expenditures
Community Services $108,597Non-Programmed $408Debt Service $17,139Co-Curricular $191,097
$0$0$0$0
Total Expenditures $4,724,217 $888,339
2005 Payable 2006Taxable Valuations
Agricultural $125,996,585Owner Occupied $158,014,469Non-Ag Z $1,084,931Other Non-Ag/Utilities $45,132,470Total $330,228,455
$32,99115.0
17.2%64.0
$32,575Average Teacher SalaryExperience Adjusted SalaryAvg Years of Experience% with Advanced DegreesCertified Instructional Staff
Teaching Staff Data
ADM of Tuitioned Out Paid 10.415
General State Aid Adj. ADM 960.036Non-Public / Home Sch ADM 214.527
ADM Data
Local $2,049,091County $58,244State $2,633,575Federal $122,675Total $4,863,586
$979,394$0$0
$4,889
$450,772$0
$324,079$217,744
General Capital Outlay Special Education Pension
$984,283 $992,596 $97,770
Revenue
Classroom Staff 0.0
ADM of Contracted Out Paid 0.000
Other Special Revenue $0
1216 N Garfield, Dell Rapids, SD 57022
2005-2006 Profile of Dell Rapids School District 49-3
Capital Outlay Pension
Student/Staff ServicesAdministration ServicesTransportation ServicesOther Support Services
Enterprise Funds
Cost per ADM
General Fund Only
Revenue Expenditures
* Includes General, Special Education and Pension Funds
Home County: MinnehahaArea in Square Miles: 168
2005 K-12 Fall Enrollment: 954
$97,770$0$0$0
$0$0
$63,000$0$0
$379,974$425,416$206,370$716,322
$90,287$3,556
$55,011$72,508
$0$0
$457,950$9,414
$220,699$11,463$47,766
$0
$0$0$0$0$0
$9,697$0$0
$4,815Educational Funds* $5,561
$176,256$0$0
$390,023 $394,415
$910,678 $72,697
$221,953

December 2005 Federal Child Count
0Deaf-Blind
037
5
DeafSpeech/Language
Autism
3Emotionally Disturbed15
138
210
Mental RetardationHearing ImpairedLearning DisabledMultiple DisabilitiesOrthopedic ImpairmentVisually Impaired
21
08
Other Health Impaired
Traumatic Brain InjuryDevelopmental Delay
131Total
0
0
120
00
81
25
1
3
0
0
Home
Early Childhood Setting
PT Early Child and SEEarly Childhood SE Setting
Separate SchoolResidential Facility
Regular Classroom
Resource Room
Self-Contained Classroom
Day Program
24 Hour Program
Home/Hospital Program
Special Education Placement Categories
Total 131
Student to Staff Ratio 14.9
K-8 615.6629-12 298.924
636.976313.300
ADA ADM
Total 914.586 950.276
Student Data
PK-12 Enrollment 954Open Enrolled Students Rec'd 54District Dropout Rate 0.8%
% Special Needs Students 13.7%% Eligible for Free/Red. Lunch 15.2%
Students Transported 412
District Attendance RateNumber of Graduates
96.2%73
Enrollment
Stanford Achievement Test Series, Tenth Edition (SAT10)
78
75
76
54
69
71
Math
Social Science
Language Arts
Reading
Complete Battery
Science
Stanford Writing Assessment Program, Third Edition
Grade 5
Grade 9
American College Test (ACT)
Grade 5Total
PRSpEd
PR
Number Tested
English
49
88%
52
64
64
31
43
50
Total PR
Sp Ed PR
81
67
69
71
64
71
69
73
58
51
71
64
79%
Grade 4 Grade 3Total
PRSp Ed
PR
Grade 6Total
PRSp Ed
PR
71 68 6510 7 3
Sp EdTotal
Number Tested
Grade 7Total
PRSp Ed
PR
Grade 8 Total
PRSp Ed
PR
Grade 11Total
PRSp Ed
PR
MathReadingScienceComposite Score
22.721.821.8
23.022.5
80 71
72 54
70 51
65 41
74 52
73 55
72 12
87
82
87
76
71
80
80
77
72
73
70
74
88
71
77
79
65
76
970 887 570
Percent Proficient or Higher
No assessment data are reported when less than ten students were tested.
Ideas and Development
Sp EdTotal
Organization, Unity, and Coherence
Sp EdTotal
Word Choice
Sp EdTotal
Sentences and Paragraphs
Sp EdTotal
Grammer and Usage
Sp EdTotal
Writing Mechanics
Sp EdTotal
NumberTested
79% 74% 83%
77%
60%
74%
67%
77%
54%
81%
70
96

General $611,656Capital Outlay $802,347
Pension $280,574Special Education $8,783
Ending Fund Balance
Bond Redemption $0Capital Projects $0
Other Fund Data
Agricultural $3.77Non-Ag Z $4.95Owner Occupied $6.06Other Non-Ag/Utilities $13.00Special Education $1.40
Bond Redemption $0.00Pension Fund $0.30
Capital Outlay $3.00
2005 Payable 2006 Levy per Thousand
$982,466$26,818$64,550
General AidSpecial EducationExtraordinary Cost Fund - SE
$1,073,834Total State Aid
State Aid
Special Education Federal Flowthrough
$75,730IDEA Part BPart B, Sec. 619, PK $2,131
$77,861Total
K-12 Instruction $1,346,147PK Instruction $15,762Adult Instruction $0
$279,904$17,723
$0
General Special Education
Expenditures
Community Services $9,500Non-Programmed $0Debt Service $0Co-Curricular $88,219
$0$0$0$0
Total Expenditures $2,353,100 $398,314
2005 Payable 2006Taxable Valuations
Agricultural $112,278,325Owner Occupied $33,048,370Non-Ag Z $5,344,773Other Non-Ag/Utilities $20,432,167Total $171,103,635
$31,15414.1
13.9%31.8
$30,491Average Teacher SalaryExperience Adjusted SalaryAvg Years of Experience% with Advanced DegreesCertified Instructional Staff
Teaching Staff Data
ADM of Tuitioned Out Paid 0.189
General State Aid Adj. ADM 420.666Non-Public / Home Sch ADM 0.000
ADM Data
Local $1,108,291County $37,673State $1,046,523Federal $139,209Total $2,331,695
$520,287$0$0$0
$234,605$0
$91,368$79,897
General Capital Outlay Special Education Pension
$520,287 $405,870 $57,508
Revenue
Classroom Staff 1.0
ADM of Contracted Out Paid 0.000
Other Special Revenue $0
100 School Ave, White, SD 57276
2005-2006 Profile of Deubrook Area School District 05-6
Capital Outlay Pension
Student/Staff ServicesAdministration ServicesTransportation ServicesOther Support Services
Enterprise Funds
Cost per ADM
General Fund Only
Revenue Expenditures
* Includes General, Special Education and Pension Funds
Home County: BrookingsArea in Square Miles: 250
2005 K-12 Fall Enrollment: 381
$57,508$0$0$0
$2,162$0
$30,000$0$0
$172,493$232,539$136,935$351,505
$21,538$2,243
$32,425$32,907
$0$0
$137,065$14,124
$100,687$0$0$0
$0$0$0
$3,000$0
$10,765$0$0
$5,814Educational Funds* $6,911
$0$0$0
$172,353 $181,991
*District has opted out of General Fund levy
$315,886 $43,765
$73,422

December 2005 Federal Child Count
0Deaf-Blind
02
1
DeafSpeech/Language
Autism
3Emotionally Disturbed00
28201
Mental RetardationHearing ImpairedLearning DisabledMultiple DisabilitiesOrthopedic ImpairmentVisually Impaired
4
02
Other Health Impaired
Traumatic Brain InjuryDevelopmental Delay
43Total
0
0
20
00
29
11
1
0
0
0
Home
Early Childhood Setting
PT Early Child and SEEarly Childhood SE Setting
Separate SchoolResidential Facility
Regular Classroom
Resource Room
Self-Contained Classroom
Day Program
24 Hour Program
Home/Hospital Program
Special Education Placement Categories
Total 43
Student to Staff Ratio 11.6
K-8 258.5039-12 117.809
264.675120.649
ADA ADM
Total 376.312 385.324
Student Data
PK-12 Enrollment 382Open Enrolled Students Rec'd 13District Dropout Rate 0.0%
% Special Needs Students 11.3%% Eligible for Free/Red. Lunch 42.7%
Students Transported 365
District Attendance RateNumber of Graduates
97.7%40
Enrollment
Stanford Achievement Test Series, Tenth Edition (SAT10)
78
77
81
69
79
77
Math
Social Science
Language Arts
Reading
Complete Battery
Science
Stanford Writing Assessment Program, Third Edition
Grade 5
Grade 9
American College Test (ACT)
Grade 5Total
PRSpEd
PR
Number Tested
English
35
63%
Total PR
Sp Ed PR
73
68
62
64
62
65
80
81
60
52
76
70
57%
Grade 4 Grade 3Total
PRSp Ed
PR
Grade 6Total
PRSp Ed
PR
31 34 237 7 5
Sp EdTotal
Number Tested
Grade 7Total
PRSp Ed
PR
Grade 8 Total
PRSp Ed
PR
Grade 11Total
PRSp Ed
PR
MathReadingScienceComposite Score
21.021.420.3
21.421.2
83
84
85
79
88
83
24
90
84
89
81
82
85
80
69
71
71
67
72
74
75
72
81
69
72
427 331 337
Percent Proficient or Higher
No assessment data are reported when less than ten students were tested.
Ideas and Development
Sp EdTotal
Organization, Unity, and Coherence
Sp EdTotal
Word Choice
Sp EdTotal
Sentences and Paragraphs
Sp EdTotal
Grammer and Usage
Sp EdTotal
Writing Mechanics
Sp EdTotal
NumberTested
59% 67% 63%
60%
48%
57%
63%
63%
41%
80%
27
30

General $997,651Capital Outlay $504,940
PensionSpecial Education $29,475
Ending Fund Balance
Bond Redemption $0Capital Projects $379,331
Other Fund Data
Agricultural $3.19Non-Ag Z $4.19Owner Occupied $5.13Other Non-Ag/Utilities $11.00Special Education $1.40
Bond Redemption $0.00Pension Fund $0.30
Capital Outlay $2.75
2005 Payable 2006 Levy per Thousand
$1,425,811$104,116
$0
General AidSpecial EducationExtraordinary Cost Fund - SE
$1,529,927Total State Aid
State Aid
Special Education Federal Flowthrough
$102,559IDEA Part BPart B, Sec. 619, PK $2,202
$104,761Total
K-12 Instruction $1,547,669PK Instruction $49,555Adult Instruction $0
$356,677$19,200
$0
General Special Education
Expenditures
Community Services $0Non-Programmed $0Debt Service $0Co-Curricular $178,974
$0$0$0$0
Total Expenditures $2,951,722 $526,894
2005 Payable 2006Taxable Valuations
Agricultural $144,822,281Owner Occupied $43,704,288Non-Ag Z $1,014,513Other Non-Ag/Utilities $23,144,909Total $212,685,991
$31,58915.7
12.8%36.5
$31,478Average Teacher SalaryExperience Adjusted SalaryAvg Years of Experience% with Advanced DegreesCertified Instructional Staff
Teaching Staff Data
ADM of Tuitioned Out Paid 1.000
General State Aid Adj. ADM 544.460Non-Public / Home Sch ADM 9.554
ADM Data
Local $1,288,097County $45,898State $1,476,534Federal $156,669Total $2,967,199
$612,831$0$0$0
$297,932$0
$104,116$101,105
General Capital Outlay Special Education Pension
$612,831 $503,154 $63,074
Revenue
Classroom Staff 0.0
ADM of Contracted Out Paid 0.000
Other Special Revenue $0
410 5th St W, Clear Lake, SD 57226-0770
2005-2006 Profile of Deuel School District 19-4
Capital Outlay Pension
Student/Staff ServicesAdministration ServicesTransportation ServicesOther Support Services
Enterprise Funds
Cost per ADM
General Fund Only
Revenue Expenditures
* Includes General, Special Education and Pension Funds
Home County: DeuelArea in Square Miles: 409
2005 K-12 Fall Enrollment: 517
$63,074$0$0$0
$0$0
$48,400$0$0
$211,587$312,505$168,108$483,323
$348,365$0
$4,500$206,058
$0$0
$311,076$8,030
$150,199$819
$0$0
$5,700$8,974
$0$0$0$0$0$0
$5,474Educational Funds* $6,598
$0$3,844
$0$211,563 $212,605
$941,252 $63,074
$63,222

December 2005 Federal Child Count
0Deaf-Blind
013
3
DeafSpeech/Language
Autism
6Emotionally Disturbed30
28400
Mental RetardationHearing ImpairedLearning DisabledMultiple DisabilitiesOrthopedic ImpairmentVisually Impaired
3
05
Other Health Impaired
Traumatic Brain InjuryDevelopmental Delay
65Total
1
1
80
00
26
19
9
0
1
0
Home
Early Childhood Setting
PT Early Child and SEEarly Childhood SE Setting
Separate SchoolResidential Facility
Regular Classroom
Resource Room
Self-Contained Classroom
Day Program
24 Hour Program
Home/Hospital Program
Special Education Placement Categories
Total 65
Student to Staff Ratio 14.4
K-8 322.5989-12 168.602
331.778175.771
ADA ADM
Total 491.200 507.549
Student Data
PK-12 Enrollment 524Open Enrolled Students Rec'd 14District Dropout Rate 1.0%
% Special Needs Students 12.4%% Eligible for Free/Red. Lunch 31.7%
Students Transported 372
District Attendance RateNumber of Graduates
96.8%43
Enrollment
Stanford Achievement Test Series, Tenth Edition (SAT10)
73
60
70
51
54
61
Math
Social Science
Language Arts
Reading
Complete Battery
Science
Stanford Writing Assessment Program, Third Edition
Grade 5
Grade 9
American College Test (ACT)
Grade 5Total
PRSpEd
PR
Number Tested
English
32
62%
Total PR
Sp Ed PR
83
74
76
66
66
73
84
73
65
54
75
70
62%
Grade 4 Grade 3Total
PRSp Ed
PR
Grade 6Total
PRSp Ed
PR
29 38 416 6 3
Sp EdTotal
Number Tested
Grade 7Total
PRSp Ed
PR
Grade 8 Total
PRSp Ed
PR
Grade 11Total
PRSp Ed
PR
MathReadingScienceComposite Score
22.322.320.1
22.321.9
85
76
88
74
76
79
31 4
85
73
79
69
71
76
84
68
76
64
58
70
84
69
71
68
58
70
142 134 646
Percent Proficient or Higher
No assessment data are reported when less than ten students were tested.
Ideas and Development
Sp EdTotal
Organization, Unity, and Coherence
Sp EdTotal
Word Choice
Sp EdTotal
Sentences and Paragraphs
Sp EdTotal
Grammer and Usage
Sp EdTotal
Writing Mechanics
Sp EdTotal
NumberTested
49% 40% 47%
69%
47%
69%
47%
67%
49%
81%
43
42

General $582,503Capital Outlay $160,503
Pension ($656)Special Education $147,329
Ending Fund Balance
Bond Redemption $0Capital Projects $0
Other Fund Data
Agricultural $4.85Non-Ag Z $6.37Owner Occupied $7.80Other Non-Ag/Utilities $17.72Special Education $1.40
Bond Redemption $0.00Pension Fund $0.30
Capital Outlay $0.50
2005 Payable 2006 Levy per Thousand
$400,353$9,793
$0
General AidSpecial EducationExtraordinary Cost Fund - SE
$410,146Total State Aid
State Aid
Special Education Federal Flowthrough
$40,690IDEA Part BPart B, Sec. 619, PK $2,050
$42,740Total
K-12 Instruction $758,924PK Instruction $0Adult Instruction $0
$52,250$10,351
$0
General Special Education
Expenditures
Community Services $0Non-Programmed $0Debt Service $0Co-Curricular $57,157
$0$0$0$0
Total Expenditures $1,286,514 $129,748
2005 Payable 2006Taxable Valuations
Agricultural $114,234,355Owner Occupied $5,279,697Non-Ag Z $2,248,621Other Non-Ag/Utilities $3,335,250Total $125,097,923
$33,00112.8
4.8%18.8
$31,712Average Teacher SalaryExperience Adjusted SalaryAvg Years of Experience% with Advanced DegreesCertified Instructional Staff
Teaching Staff Data
ADM of Tuitioned Out Paid 0.000
General State Aid Adj. ADM 191.099Non-Public / Home Sch ADM 0.000
ADM Data
Local $721,012County $6,442State $422,789Federal $162,419Total $1,312,663
$72,426$0$0$0
$167,221$0
$9,793$40,794
General Capital Outlay Special Education Pension
$72,426 $217,808 $35,245
Revenue
Classroom Staff 0.0
ADM of Contracted Out Paid 0.000
Other Special Revenue $0
405 N Humphrey Dr, Doland, SD 57436
2005-2006 Profile of Doland School District 56-2
Capital Outlay Pension
Student/Staff ServicesAdministration ServicesTransportation ServicesOther Support Services
Enterprise Funds
Cost per ADM
General Fund Only
Revenue Expenditures
* Includes General, Special Education and Pension Funds
Home County: SpinkArea in Square Miles: 393
2005 K-12 Fall Enrollment: 158
$35,245$0$0$0
$0$0
$28,224$0$0
$26,887$150,419
$85,652$207,476
$481$1,090
$0$9,030
$0$0$0
$2,024
$52,993$6,137$6,638$1,380
$881$5,706
$0$0$0$0$0$0
$8,079Educational Funds* $9,021
$0$0$0
$106,636 $96,663
*District has opted out of General Fund levy
$48,770 $34,811
$36,145

December 2005 Federal Child Count
0Deaf-Blind
07
0
DeafSpeech/Language
Autism
1Emotionally Disturbed00
11301
Mental RetardationHearing ImpairedLearning DisabledMultiple DisabilitiesOrthopedic ImpairmentVisually Impaired
0
03
Other Health Impaired
Traumatic Brain InjuryDevelopmental Delay
26Total
0
0
21
00
20
2
1
0
0
0
Home
Early Childhood Setting
PT Early Child and SEEarly Childhood SE Setting
Separate SchoolResidential Facility
Regular Classroom
Resource Room
Self-Contained Classroom
Day Program
24 Hour Program
Home/Hospital Program
Special Education Placement Categories
Total 26
Student to Staff Ratio 8.5
K-8 110.0779-12 46.230
112.05047.199
ADA ADM
Total 156.307 159.249
Student Data
PK-12 Enrollment 159Open Enrolled Students Rec'd 2District Dropout Rate 0.0%
% Special Needs Students 16.4%% Eligible for Free/Red. Lunch 71.4%
Students Transported 66
District Attendance RateNumber of Graduates
98.2%8
Enrollment
Stanford Achievement Test Series, Tenth Edition (SAT10)
55
62
52
42
55
54
Math
Social Science
Language Arts
Reading
Complete Battery
Science
Stanford Writing Assessment Program, Third Edition
Grade 5
Grade 9
American College Test (ACT)
Grade 5Total
PRSpEd
PR
Number Tested
English
8
67%
Total PR
Sp Ed PR
66
63
64
56
62
62
63
63
79
47
73
65
100%
Grade 4 Grade 3Total
PRSp Ed
PR
Grade 6Total
PRSp Ed
PR
13 12 114 1
Sp EdTotal
Number Tested
Grade 7Total
PRSp Ed
PR
Grade 8 Total
PRSp Ed
PR
Grade 11Total
PRSp Ed
PR
MathReadingScienceComposite Score
60
58
52
55
52
56
13 4
80
66
67
68
65
69
67
47
47
59
43
53
70
60
57
61
57
61
39 213 111
Percent Proficient or Higher
No assessment data are reported when less than ten students were tested.
Ideas and Development
Sp EdTotal
Organization, Unity, and Coherence
Sp EdTotal
Word Choice
Sp EdTotal
Sentences and Paragraphs
Sp EdTotal
Grammer and Usage
Sp EdTotal
Writing Mechanics
Sp EdTotal
NumberTested
56% 56% 67%
100%
32%
67%
33%
67%
33%
67%
9
6

General $797,017Capital Outlay $906,244
PensionSpecial Education $83,276
Ending Fund Balance
Bond Redemption $0Capital Projects $0
Other Fund Data
Agricultural $3.19Non-Ag Z $4.19Owner Occupied $5.13Other Non-Ag/Utilities $11.00Special Education $1.40
Bond Redemption $0.00Pension Fund $0.00
Capital Outlay $3.00
2005 Payable 2006 Levy per Thousand
$8,799,846$1,323,760
$0
General AidSpecial EducationExtraordinary Cost Fund - SE
$10,123,606Total State Aid
State Aid
Special Education Federal Flowthrough
$471,797IDEA Part BPart B, Sec. 619, PK $25,538
$497,335Total
K-12 Instruction $9,579,408PK Instruction $90,256Adult Instruction $0
$1,508,055$226,836
$0
General Special Education
Expenditures
Community Services $116,492Non-Programmed $297,809Debt Service $0Co-Curricular $445,647
$0$0$0$0
Total Expenditures $15,790,714 $2,842,946
2005 Payable 2006Taxable Valuations
Agricultural $14,523,861Owner Occupied $125,298,914Non-Ag Z $1,561,345Other Non-Ag/Utilities $89,934,311Total $231,318,431
$41,99514.8
51.6%186.0
$42,588Average Teacher SalaryExperience Adjusted SalaryAvg Years of Experience% with Advanced DegreesCertified Instructional Staff
Teaching Staff Data
ADM of Tuitioned Out Paid 2.000
General State Aid Adj. ADM 2,299.700Non-Public / Home Sch ADM 46.858
ADM Data
Local $1,944,857County $204,131State $9,000,699Federal $639,479Total $11,789,165
$636,651$0$0
$548,118
$312,423$0
$1,323,760$653,397
General Capital Outlay Special Education Pension
$1,184,769 $2,289,580 $0
Revenue
Classroom Staff 0.0
ADM of Contracted Out Paid 0.000
Other Special Revenue $0
400 Patriot Dr, Box Elder, SD 57719
2005-2006 Profile of Douglas School District 51-1
Capital Outlay Pension
Student/Staff ServicesAdministration ServicesTransportation ServicesOther Support Services
Enterprise Funds
Cost per ADM
General Fund Only
Revenue Expenditures
* Includes General, Special Education and Pension Funds
Home County: PenningtonArea in Square Miles: 151
2005 K-12 Fall Enrollment: 2,326
$0$0$0$0
$0$0
$0$0$0
$1,379,194$1,076,451
$467,348$2,338,108
$288,701($3,990)
$0$132,288
$795$0$0
$26,729
$653,177$221,011$144,922
$88,946
$0$0$0$0$0$0$0$0
$6,782Educational Funds* $7,881
$0$0
$7,259,664$783,013 $758,118
$801,708 $0
$357,184

December 2005 Federal Child Count
0Deaf-Blind
1128
8
DeafSpeech/Language
Autism
9Emotionally Disturbed13
1187
2310
Mental RetardationHearing ImpairedLearning DisabledMultiple DisabilitiesOrthopedic ImpairmentVisually Impaired
28
339
Other Health Impaired
Traumatic Brain InjuryDevelopmental Delay
441Total
2
1
3029
00
176
147
52
0
2
2
Home
Early Childhood Setting
PT Early Child and SEEarly Childhood SE Setting
Separate SchoolResidential Facility
Regular Classroom
Resource Room
Self-Contained Classroom
Day Program
24 Hour Program
Home/Hospital Program
Special Education Placement Categories
Total 441
Student to Staff Ratio 12.5
K-8 1,593.7449-12 583.475
1,673.371624.324
ADA ADM
Total 2,177.219 2,297.695
Student Data
PK-12 Enrollment 2,326Open Enrolled Students Rec'd 179District Dropout Rate 1.7%
% Special Needs Students 19.0%% Eligible for Free/Red. Lunch 31.0%
Students Transported 1,733
District Attendance RateNumber of Graduates
94.8%146
Enrollment
Stanford Achievement Test Series, Tenth Edition (SAT10)
74
75
71
52
69
67
Math
Social Science
Language Arts
Reading
Complete Battery
Science
Stanford Writing Assessment Program, Third Edition
Grade 5
Grade 9
American College Test (ACT)
Grade 5Total
PRSpEd
PR
Number Tested
English
98
59%
58
68
60
35
50
51
Total PR
Sp Ed PR
64
68
61
59
62
62
22
31
32
23
20
24
67
68
61
47
66
61
52%
Grade 4 Grade 3Total
PRSp Ed
PR
Grade 6Total
PRSp Ed
PR
166 180 14041 29 8
Sp EdTotal
Number Tested
Grade 7Total
PRSp Ed
PR
Grade 8 Total
PRSp Ed
PR
Grade 11Total
PRSp Ed
PR
MathReadingScienceComposite Score
23.121.720.6
21.221.8
76 58
70 54
70 59
66 47
69 52
69 54
193 44
67 46
71 57
71 53
58 44
61 38
65 46
57 29
70 32
67 37
65 41
57 22
61 30
63 30
61 38
65 38
64 38
57 23
57 32
26161 23211 25170
Percent Proficient or Higher
No assessment data are reported when less than ten students were tested.
Ideas and Development
Sp EdTotal
Organization, Unity, and Coherence
Sp EdTotal
Word Choice
Sp EdTotal
Sentences and Paragraphs
Sp EdTotal
Grammer and Usage
Sp EdTotal
Writing Mechanics
Sp EdTotal
NumberTested
58% 56% 60%
55%
36%
54%
48%
61%
35%
64%
153
177

General $359,458Capital Outlay $220,737
PensionSpecial Education $48,432
Ending Fund Balance
Bond Redemption $0Capital Projects $0
Other Fund Data
Agricultural $3.19Non-Ag Z $4.19Owner Occupied $5.13Other Non-Ag/Utilities $11.00Special Education $1.40
Bond Redemption $0.00Pension Fund $0.00
Capital Outlay $1.50
2005 Payable 2006 Levy per Thousand
$1,060,635$145,575
$0
General AidSpecial EducationExtraordinary Cost Fund - SE
$1,206,210Total State Aid
State Aid
Special Education Federal Flowthrough
$84,887IDEA Part BPart B, Sec. 619, PK $10,940
$95,827Total
K-12 Instruction $1,568,687PK Instruction $0Adult Instruction $0
$160,077$10,277
$0
General Special Education
Expenditures
Community Services $0Non-Programmed $0Debt Service $0Co-Curricular $73,464
$0$0$0$0
Total Expenditures $2,802,599 $335,806
2005 Payable 2006Taxable Valuations
Agricultural $42,763,595Owner Occupied $1,629,357Non-Ag Z $0Other Non-Ag/Utilities $1,083,405Total $45,476,357
$35,11612.1
6.1%31.4
$32,747Average Teacher SalaryExperience Adjusted SalaryAvg Years of Experience% with Advanced DegreesCertified Instructional Staff
Teaching Staff Data
ADM of Tuitioned Out Paid 1.018
General State Aid Adj. ADM 309.428Non-Public / Home Sch ADM 13.172
ADM Data
Local $220,970County $4,302State $1,113,113Federal $775,030Total $2,113,415
$30,021$0$0
$23,304
$62,540$0
$145,575$173,521
General Capital Outlay Special Education Pension
$53,325 $381,635 $0
Revenue
Classroom Staff 0.4
ADM of Contracted Out Paid 0.000
Other Special Revenue $0
B Street, Dupree, SD 57623
2005-2006 Profile of Dupree School District 64-2
Capital Outlay Pension
Student/Staff ServicesAdministration ServicesTransportation ServicesOther Support Services
Enterprise Funds
Cost per ADM
General Fund Only
Revenue Expenditures
* Includes General, Special Education and Pension Funds
Home County: ZiebachArea in Square Miles: 1,338
2005 K-12 Fall Enrollment: 270
$0$0$0$0
$0$0
$0$0$0
$356,875$295,495$145,245$362,833
$0$0
$64,365$76,450
$0$0$0
$2,591
$150,519$14,496
$437$0
$0$0$0$0$0$0$0$0
$10,330Educational Funds* $11,403
$0$0
$877,852$97,406 $172,792
$159,962 $0
$16,556

December 2005 Federal Child Count
0Deaf-Blind
012
0
DeafSpeech/Language
Autism
0Emotionally Disturbed01
19010
Mental RetardationHearing ImpairedLearning DisabledMultiple DisabilitiesOrthopedic ImpairmentVisually Impaired
2
09
Other Health Impaired
Traumatic Brain InjuryDevelopmental Delay
44Total
0
0
93
00
31
0
0
0
1
0
Home
Early Childhood Setting
PT Early Child and SEEarly Childhood SE Setting
Separate SchoolResidential Facility
Regular Classroom
Resource Room
Self-Contained Classroom
Day Program
24 Hour Program
Home/Hospital Program
Special Education Placement Categories
Total 44
Student to Staff Ratio 9.0
K-8 187.4049-12 63.794
199.43269.560
ADA ADM
Total 251.198 268.992
Student Data
PK-12 Enrollment 286Open Enrolled Students Rec'd 32District Dropout Rate 3.3%
% Special Needs Students 15.4%% Eligible for Free/Red. Lunch 62.0%
Students Transported 104
District Attendance RateNumber of Graduates
93.4%17
Enrollment
Stanford Achievement Test Series, Tenth Edition (SAT10)
66
78
72
44
53
61
Math
Social Science
Language Arts
Reading
Complete Battery
Science
Stanford Writing Assessment Program, Third Edition
Grade 5
Grade 9
American College Test (ACT)
Grade 5Total
PRSpEd
PR
Number Tested
English
11
30%
Total PR
Sp Ed PR
64
62
60
52
63
60
76
78
63
64
78
71
43%
Grade 4 Grade 3Total
PRSp Ed
PR
Grade 6Total
PRSp Ed
PR
19 23 173 2
Sp EdTotal
Number Tested
Grade 7Total
PRSp Ed
PR
Grade 8 Total
PRSp Ed
PR
Grade 11Total
PRSp Ed
PR
MathReadingScienceComposite Score
19.317.617.8
19.918.8
85
72
78
73
76
76
22 2
67
54
59
40
49
55
76
56
52
55
53
60
60
55
52
71
51
57
24 124 432
Percent Proficient or Higher
No assessment data are reported when less than ten students were tested.
Ideas and Development
Sp EdTotal
Organization, Unity, and Coherence
Sp EdTotal
Word Choice
Sp EdTotal
Sentences and Paragraphs
Sp EdTotal
Grammer and Usage
Sp EdTotal
Writing Mechanics
Sp EdTotal
NumberTested
17% 13% 21%
39%
20%
43%
29%
39%
33%
43%
24
23

General $127,291Capital Outlay $55,807
PensionSpecial Education $487,202
Ending Fund Balance
Bond Redemption $0Capital Projects $0
Other Fund Data
Agricultural $3.19Non-Ag Z $4.19Owner Occupied $5.13Other Non-Ag/Utilities $11.00Special Education $1.40
Bond Redemption $0.00Pension Fund $0.00
Capital Outlay $0.00
2005 Payable 2006 Levy per Thousand
$1,496,212$267,052
$0
General AidSpecial EducationExtraordinary Cost Fund - SE
$1,763,264Total State Aid
State Aid
Special Education Federal Flowthrough
$191,167IDEA Part BPart B, Sec. 619, PK $6,204
$197,371Total
K-12 Instruction $3,246,219PK Instruction $0Adult Instruction $0
$559,508$0$0
General Special Education
Expenditures
Community Services $0Non-Programmed $0Debt Service $0Co-Curricular $52,130
$0$0$0$0
Total Expenditures $4,696,521 $675,391
2005 Payable 2006Taxable Valuations
Agricultural $48,007,463Owner Occupied $3,370,460Non-Ag Z $76,507Other Non-Ag/Utilities $8,274,568Total $59,728,998
$36,62812.5
14.5%54.9
$35,058Average Teacher SalaryExperience Adjusted SalaryAvg Years of Experience% with Advanced DegreesCertified Instructional Staff
Teaching Staff Data
ADM of Tuitioned Out Paid 4.173
General State Aid Adj. ADM 351.460Non-Public / Home Sch ADM 3.417
ADM Data
Local $532,624County $9,854State $1,599,105Federal $1,427,603Total $3,569,187
$0$0$0
$39,438
$143,448$0
$267,052$262,713
General Capital Outlay Special Education Pension
$39,438 $673,213 $0
Revenue
Classroom Staff 1.0
ADM of Contracted Out Paid 0.000
Other Special Revenue $0
S Prairie Rd, Eagle Butte, SD 57625
2005-2006 Profile of Eagle Butte School District 20-1
Capital Outlay Pension
Student/Staff ServicesAdministration ServicesTransportation ServicesOther Support Services
Enterprise Funds
Cost per ADM
General Fund Only
Revenue Expenditures
* Includes General, Special Education and Pension Funds
Home County: DeweyArea in Square Miles: 1,646
2005 K-12 Fall Enrollment: 348
$0$0$0$0
$0$0
$0$0$0
$319,781$485,636
$41,293$551,462
$0$1,095
$0$168,988
$0$0$0$0
$112,365$1,392$1,853
$274
$0$0$0$0$0$0$0$0
$15,021Educational Funds* $16,613
$0$0
$1,340,631$0 $0
$182,520 $0
$12,436

December 2005 Federal Child Count
0Deaf-Blind
149
3
DeafSpeech/Language
Autism
13Emotionally Disturbed12
1118
200
Mental RetardationHearing ImpairedLearning DisabledMultiple DisabilitiesOrthopedic ImpairmentVisually Impaired
16
10
Other Health Impaired
Traumatic Brain InjuryDevelopmental Delay
216Total
0
2
111
00
156
41
1
0
3
1
Home
Early Childhood Setting
PT Early Child and SEEarly Childhood SE Setting
Separate SchoolResidential Facility
Regular Classroom
Resource Room
Self-Contained Classroom
Day Program
24 Hour Program
Home/Hospital Program
Special Education Placement Categories
Total 216
Student to Staff Ratio 6.2
K-8 226.0259-12 62.088
242.09768.564
ADA ADM
Total 288.113 310.661
Student Data
PK-12 Enrollment 348Open Enrolled Students Rec'd 0District Dropout Rate 6.4%
% Special Needs Students 62.1%% Eligible for Free/Red. Lunch 0.0%
Students Transported 160
District Attendance RateNumber of Graduates
92.7%24
Enrollment
Stanford Achievement Test Series, Tenth Edition (SAT10)
57
52
54
31
43
47
Math
Social Science
Language Arts
Reading
Complete Battery
Science
Stanford Writing Assessment Program, Third Edition
Grade 5
Grade 9
American College Test (ACT)
Grade 5Total
PRSpEd
PR
Number Tested
English
32
45%
34
33
42
20
16
24
Total PR
Sp Ed PR
41
35
35
32
35
36
33
41
30
20
35
31
33%
Grade 4 Grade 3Total
PRSp Ed
PR
Grade 6Total
PRSp Ed
PR
90 86 6815
Sp EdTotal
Number Tested
Grade 7Total
PRSp Ed
PR
Grade 8 Total
PRSp Ed
PR
Grade 11Total
PRSp Ed
PR
MathReadingScienceComposite Score
17.917.115.4
17.517.1
49
42
32
30
37
39
106 1
48 25
32 31
36 35
36 27
30 20
37 27
57 14
30 12
33 14
39 11
29 6
37 11
43
23
32
35
27
33
1075 1374 91
Percent Proficient or Higher
No assessment data are reported when less than ten students were tested.
Ideas and Development
Sp EdTotal
Organization, Unity, and Coherence
Sp EdTotal
Word Choice
Sp EdTotal
Sentences and Paragraphs
Sp EdTotal
Grammer and Usage
Sp EdTotal
Writing Mechanics
Sp EdTotal
NumberTested
34% 27% 27%
27%
12%
19%
16%
24%
11%
38%
83
78

General $538,794Capital Outlay $142,814
Pension $79,987Special Education $56,562
Ending Fund Balance
Bond Redemption $0Capital Projects $0
Other Fund Data
Agricultural $4.19Non-Ag Z $5.50Owner Occupied $6.74Other Non-Ag/Utilities $14.45Special Education $1.20
Bond Redemption $0.00Pension Fund $0.30
Capital Outlay $3.00
2005 Payable 2006 Levy per Thousand
$309,030$43,375
$0
General AidSpecial EducationExtraordinary Cost Fund - SE
$352,405Total State Aid
State Aid
Special Education Federal Flowthrough
$42,511IDEA Part BPart B, Sec. 619, PK $1,059
$43,570Total
K-12 Instruction $670,624PK Instruction $0Adult Instruction $0
$144,801$0$0
General Special Education
Expenditures
Community Services $0Non-Programmed $0Debt Service $0Co-Curricular $88,098
$0$0$0$0
Total Expenditures $1,309,206 $203,224
2005 Payable 2006Taxable Valuations
Agricultural $27,677,170Owner Occupied $11,050,943Non-Ag Z $0Other Non-Ag/Utilities $30,655,321Total $69,383,434
$32,06714.9
23.5%15.7
$32,249Average Teacher SalaryExperience Adjusted SalaryAvg Years of Experience% with Advanced DegreesCertified Instructional Staff
Teaching Staff Data
ADM of Tuitioned Out Paid 0.000
General State Aid Adj. ADM 165.941Non-Public / Home Sch ADM 3.400
ADM Data
Local $713,332County $17,741State $339,069Federal $244,834Total $1,314,976
$214,666$0$0$0
$94,767$0
$43,375$46,439
General Capital Outlay Special Education Pension
$214,666 $184,581 $24,737
Revenue
Classroom Staff 0.0
ADM of Contracted Out Paid 0.000
Other Special Revenue $0
715 D St, Edgemont, SD 57735
2005-2006 Profile of Edgemont School District 23-1
Capital Outlay Pension
Student/Staff ServicesAdministration ServicesTransportation ServicesOther Support Services
Enterprise Funds
Cost per ADM
General Fund Only
Revenue Expenditures
* Includes General, Special Education and Pension Funds
Home County: Fall RiverArea in Square Miles: 715
2005 K-12 Fall Enrollment: 139
$24,737$0$0$0
$0$0
$30,167$0$0
$84,262$134,393
$46,290$285,539
$10,831$1,800
$0$273,371
$0$0$0
$10,101
$40,189$13,677$1,054$3,503
$0$0$0$0$0$0$0
$8,864
$9,393Educational Funds* $11,142
$0$0$0
$55,043 $55,397
*District has opted out of General Fund levy
$384,629 $39,031
$88,528

December 2005 Federal Child Count
0Deaf-Blind
02
0
DeafSpeech/Language
Autism
2Emotionally Disturbed00
18410
Mental RetardationHearing ImpairedLearning DisabledMultiple DisabilitiesOrthopedic ImpairmentVisually Impaired
5
10
Other Health Impaired
Traumatic Brain InjuryDevelopmental Delay
33Total
0
0
00
00
20
13
0
0
0
0
Home
Early Childhood Setting
PT Early Child and SEEarly Childhood SE Setting
Separate SchoolResidential Facility
Regular Classroom
Resource Room
Self-Contained Classroom
Day Program
24 Hour Program
Home/Hospital Program
Special Education Placement Categories
Total 33
Student to Staff Ratio 8.9
K-8 85.8599-12 46.486
89.25048.034
ADA ADM
Total 132.345 137.284
Student Data
PK-12 Enrollment 139Open Enrolled Students Rec'd 9District Dropout Rate 1.2%
% Special Needs Students 23.7%% Eligible for Free/Red. Lunch 40.0%
Students Transported 42
District Attendance RateNumber of Graduates
96.4%8
Enrollment
Stanford Achievement Test Series, Tenth Edition (SAT10)
79
80
67
61
66
71
Math
Social Science
Language Arts
Reading
Complete Battery
Science
Stanford Writing Assessment Program, Third Edition
Grade 5
Grade 9
American College Test (ACT)
Grade 5Total
PRSpEd
PR
Number Tested
English
3
44%
Total PR
Sp Ed PR
77
75
65
67
60
68
68
73
70
50
58
62
38%
Grade 4 Grade 3Total
PRSp Ed
PR
Grade 6Total
PRSp Ed
PR
9 14 122 3 2
Sp EdTotal
Number Tested
Grade 7Total
PRSp Ed
PR
Grade 8 Total
PRSp Ed
PR
Grade 11Total
PRSp Ed
PR
MathReadingScienceComposite Score
87
85
91
54
73
78
5
69
66
60
59
58
62
48
73
57
55
51
55
71
70
68
73
52
64
212 213 38
Percent Proficient or Higher
No assessment data are reported when less than ten students were tested.
Ideas and Development
Sp EdTotal
Organization, Unity, and Coherence
Sp EdTotal
Word Choice
Sp EdTotal
Sentences and Paragraphs
Sp EdTotal
Grammer and Usage
Sp EdTotal
Writing Mechanics
Sp EdTotal
NumberTested
54% 38% 46%
38%
31%
38%
54%
38%
46%
50%
13
16

General $541,032Capital Outlay $221,158
PensionSpecial Education $128,727
Ending Fund Balance
Bond Redemption $0Capital Projects $0
Other Fund Data
Agricultural $4.26Non-Ag Z $5.60Owner Occupied $6.85Other Non-Ag/Utilities $14.69Special Education $0.89
Bond Redemption $0.00Pension Fund $0.30
Capital Outlay $0.40
2005 Payable 2006 Levy per Thousand
$351,959$0$0
General AidSpecial EducationExtraordinary Cost Fund - SE
$351,959Total State Aid
State Aid
Special Education Federal Flowthrough
$27,151IDEA Part BPart B, Sec. 619, PK $2,021
$29,172Total
K-12 Instruction $591,810PK Instruction $0Adult Instruction $0
$50,716$18,502
$0
General Special Education
Expenditures
Community Services $0Non-Programmed $0Debt Service $0Co-Curricular $48,353
$0$0$0$0
Total Expenditures $1,052,111 $118,636
2005 Payable 2006Taxable Valuations
Agricultural $112,117,424Owner Occupied $7,972,195Non-Ag Z $93,358Other Non-Ag/Utilities $4,604,778Total $124,787,755
$29,29920.7
6.7%13.9
$30,614Average Teacher SalaryExperience Adjusted SalaryAvg Years of Experience% with Advanced DegreesCertified Instructional Staff
Teaching Staff Data
ADM of Tuitioned Out Paid 0.000
General State Aid Adj. ADM 171.131Non-Public / Home Sch ADM 0.000
ADM Data
Local $696,437County $10,602State $374,554Federal $22,814Total $1,104,408
$61,925$209
$0$28,962
$101,967$362
$0$28,678
General Capital Outlay Special Education Pension
$91,095 $131,007 $35,112
Revenue
Classroom Staff 0.0
ADM of Contracted Out Paid 0.000
Other Special Revenue $0
105 1st Ave, Roscoe, SD 57471
2005-2006 Profile of Edmunds Central School District 22-5
Capital Outlay Pension
Student/Staff ServicesAdministration ServicesTransportation ServicesOther Support Services
Enterprise Funds
Cost per ADM
General Fund Only
Revenue Expenditures
* Includes General, Special Education and Pension Funds
Home County: EdmundsArea in Square Miles: 518
2005 K-12 Fall Enrollment: 144
$34,980$132
$0$0
$0$0
$30,131$0$0
$51,959$91,636$80,070
$188,283
$10$0$0
$78,041$0$0$0$0
$32,017$17,402
$0$0
$2,309$2,502
$0$0$0$0$0$0
$7,362Educational Funds* $8,282
$0$0$0
$57,462 $57,325
*District has opted out of General Fund levy
$103,789 $34,943
$25,738

December 2005 Federal Child Count
0Deaf-Blind
04
0
DeafSpeech/Language
Autism
0Emotionally Disturbed006100
Mental RetardationHearing ImpairedLearning DisabledMultiple DisabilitiesOrthopedic ImpairmentVisually Impaired
0
00
Other Health Impaired
Traumatic Brain InjuryDevelopmental Delay
11Total
0
0
01
00
7
3
0
0
0
0
Home
Early Childhood Setting
PT Early Child and SEEarly Childhood SE Setting
Separate SchoolResidential Facility
Regular Classroom
Resource Room
Self-Contained Classroom
Day Program
24 Hour Program
Home/Hospital Program
Special Education Placement Categories
Total 11
Student to Staff Ratio 10.4
K-8 92.4499-12 45.379
95.01147.598
ADA ADM
Total 137.828 142.609
Student Data
PK-12 Enrollment 144Open Enrolled Students Rec'd 0District Dropout Rate 0.0%
% Special Needs Students 7.6%% Eligible for Free/Red. Lunch 39.1%
Students Transported 89
District Attendance RateNumber of Graduates
96.6%14
Enrollment
Stanford Achievement Test Series, Tenth Edition (SAT10)
80
84
73
63
70
74
Math
Social Science
Language Arts
Reading
Complete Battery
Science
Stanford Writing Assessment Program, Third Edition
Grade 5
Grade 9
American College Test (ACT)
Grade 5Total
PRSpEd
PR
Number Tested
English
15
55%
Total PR
Sp Ed PR
87
73
70
76
74
76
76
67
57
61
73
67
45%
Grade 4 Grade 3Total
PRSp Ed
PR
Grade 6Total
PRSp Ed
PR
11 12 15
Sp EdTotal
Number Tested
Grade 7Total
PRSp Ed
PR
Grade 8 Total
PRSp Ed
PR
Grade 11Total
PRSp Ed
PR
MathReadingScienceComposite Score
20.321.021.1
21.821.3
91
78
89
73
91
86
6
78
79
86
68
67
74
86
78
74
71
69
76
74
67
69
71
66
68
216 116 111
Percent Proficient or Higher
No assessment data are reported when less than ten students were tested.
Ideas and Development
Sp EdTotal
Organization, Unity, and Coherence
Sp EdTotal
Word Choice
Sp EdTotal
Sentences and Paragraphs
Sp EdTotal
Grammer and Usage
Sp EdTotal
Writing Mechanics
Sp EdTotal
NumberTested
75% 56% 69%
55%
56%
73%
75%
73%
56%
73%
16
11

General $226,665Capital Outlay ($21)
PensionSpecial Education $42,712
Ending Fund Balance
Bond Redemption $0Capital Projects $0
Other Fund Data
Agricultural $2.93Non-Ag Z $3.85Owner Occupied $4.71Other Non-Ag/Utilities $10.10Special Education $0.49
Bond Redemption $0.00Pension Fund $0.00
Capital Outlay $0.49
2005 Payable 2006 Levy per Thousand
$0$0$0
General AidSpecial EducationExtraordinary Cost Fund - SE
$0Total State Aid
State Aid
Special Education Federal Flowthrough
$0IDEA Part BPart B, Sec. 619, PK $0
$0Total
K-12 Instruction $235,620PK Instruction $0Adult Instruction $0
$0$83
$0
General Special Education
Expenditures
Community Services $0Non-Programmed $0Debt Service $0Co-Curricular $0
$0$0$0$0
Total Expenditures $370,337 $9,799
2005 Payable 2006Taxable Valuations
Agricultural $7,103,473Owner Occupied $5,164,974Non-Ag Z $0Other Non-Ag/Utilities $8,820,289Total $21,088,736
$30,6667.5
0.0%2.0
$27,500Average Teacher SalaryExperience Adjusted SalaryAvg Years of Experience% with Advanced DegreesCertified Instructional Staff
Teaching Staff Data
ADM of Tuitioned Out Paid 2.079
General State Aid Adj. ADM 37.238Non-Public / Home Sch ADM 1.000
ADM Data
Local $159,510County $2,280State $1,159Federal $241,737Total $404,687
$16,056$0$0$0
$5,767$0$0$0
General Capital Outlay Special Education Pension
$16,056 $5,767 $0
Revenue
Classroom Staff 0.0
ADM of Contracted Out Paid 12.172
Other Special Revenue $0
10222 Valley Rd, Edgemont, SD 57735
2005-2006 Profile of Elk Mountain School District 16-2
Capital Outlay Pension
Student/Staff ServicesAdministration ServicesTransportation ServicesOther Support Services
Enterprise Funds
Cost per ADM
General Fund Only
Revenue Expenditures
* Includes General, Special Education and Pension Funds
Home County: CusterArea in Square Miles: 310
2005 K-12 Fall Enrollment: 20
$0$0$0$0
$0$0
$0$0$0
$11,312$43,425
$6,731$73,250
$0$0$0
$127,000$0$0$0$0
$9,446$270
$0$0
$0$0$0$0$0$0$0$0
$14,006Educational Funds* $14,585
$0$0$0
$866 $831
$127,000 $0
$0

December 2005 Federal Child Count
0Deaf-Blind
06
0
DeafSpeech/Language
Autism
0Emotionally Disturbed000000
Mental RetardationHearing ImpairedLearning DisabledMultiple DisabilitiesOrthopedic ImpairmentVisually Impaired
0
00
Other Health Impaired
Traumatic Brain InjuryDevelopmental Delay
6Total
0
3
01
00
2
0
0
0
0
0
Home
Early Childhood Setting
PT Early Child and SEEarly Childhood SE Setting
Separate SchoolResidential Facility
Regular Classroom
Resource Room
Self-Contained Classroom
Day Program
24 Hour Program
Home/Hospital Program
Special Education Placement Categories
Total 6
Student to Staff Ratio 10.0
K-8 16.2099-12 0.000
16.7810.000
ADA ADM
Total 16.209 16.781
Student Data
PK-12 Enrollment 20Open Enrolled Students Rec'd 0District Dropout Rate 0.0%
% Special Needs Students 19.3%% Eligible for Free/Red. Lunch 0.0%
Students Transported 0
District Attendance RateNumber of Graduates
96.6%0
Enrollment
Stanford Achievement Test Series, Tenth Edition (SAT10)
84
82
74
76
77
77
Math
Social Science
Language Arts
Reading
Complete Battery
Science
Stanford Writing Assessment Program, Third Edition
Grade 5
Grade 9
American College Test (ACT)
Grade 5Total
PRSpEd
PR
Number Tested
English
Total PR
Sp Ed PR
Grade 4 Grade 3Total
PRSp Ed
PR
Grade 6Total
PRSp Ed
PR
2
Sp EdTotal
Number Tested
Grade 7Total
PRSp Ed
PR
Grade 8 Total
PRSp Ed
PR
Grade 11Total
PRSp Ed
PR
MathReadingScienceComposite Score
94
88
89
70
79
84
3
20
78
45
22
51
40
20
23
43
22
29
26
2 0
Percent Proficient or Higher
No assessment data are reported when less than ten students were tested.
Ideas and Development
Sp EdTotal
Organization, Unity, and Coherence
Sp EdTotal
Word Choice
Sp EdTotal
Sentences and Paragraphs
Sp EdTotal
Grammer and Usage
Sp EdTotal
Writing Mechanics
Sp EdTotal
NumberTested
50% 50% 50% 0% 0% 0%2 1

General $1,075,380Capital Outlay $171,942
Pension $249,731Special Education $180,987
Ending Fund Balance
Bond Redemption $0Capital Projects $0
Other Fund Data
Agricultural $3.19Non-Ag Z $4.19Owner Occupied $5.13Other Non-Ag/Utilities $11.00Special Education $1.40
Bond Redemption $2.73Pension Fund $0.30
Capital Outlay $1.46
2005 Payable 2006 Levy per Thousand
$1,729,957$130,687
$0
General AidSpecial EducationExtraordinary Cost Fund - SE
$1,860,644Total State Aid
State Aid
Special Education Federal Flowthrough
$130,599IDEA Part BPart B, Sec. 619, PK $7,632
$138,231Total
K-12 Instruction $1,979,874PK Instruction $0Adult Instruction $0
$362,931$38,834
$0
General Special Education
Expenditures
Community Services $0Non-Programmed $0Debt Service $0Co-Curricular $237,895
$0$0$0$0
Total Expenditures $3,485,652 $570,187
2005 Payable 2006Taxable Valuations
Agricultural $141,617,695Owner Occupied $85,969,436Non-Ag Z $640,344Other Non-Ag/Utilities $31,462,761Total $259,690,236
$32,58315.3
18.2%43.6
$32,545Average Teacher SalaryExperience Adjusted SalaryAvg Years of Experience% with Advanced DegreesCertified Instructional Staff
Teaching Staff Data
ADM of Tuitioned Out Paid 1.000
General State Aid Adj. ADM 691.593Non-Public / Home Sch ADM 12.688
ADM Data
Local $1,420,522County $214,366State $1,792,157Federal $146,591Total $3,573,636
$389,302$0$0$0
$356,967$0
$130,687$141,649
General Capital Outlay Special Education Pension
$389,302 $629,303 $80,398
Revenue
Classroom Staff 0.0
ADM of Contracted Out Paid 0.000
Other Special Revenue $0
402 S Douglas St, Elk Point, SD 57025
2005-2006 Profile of Elk Point-Jefferson School District 61-7
Capital Outlay Pension
Student/Staff ServicesAdministration ServicesTransportation ServicesOther Support Services
Enterprise Funds
Cost per ADM
General Fund Only
Revenue Expenditures
* Includes General, Special Education and Pension Funds
Home County: UnionArea in Square Miles: 166
2005 K-12 Fall Enrollment: 686
$80,398$0$0$0
$0$0
$0$0$0
$221,604$398,623$139,653$508,004
$115,580$0
$26,690$114,195
$0$0$0
$18,689
$123,976$33,507$5,961$4,978
$0$0$0$0$0$0$0$0
$5,015Educational Funds* $5,759
$718,160$0$0
$283,305 $0
$342,459 $0
$67,306

December 2005 Federal Child Count
0Deaf-Blind
123
6
DeafSpeech/Language
Autism
0Emotionally Disturbed80
21200
Mental RetardationHearing ImpairedLearning DisabledMultiple DisabilitiesOrthopedic ImpairmentVisually Impaired
2
06
Other Health Impaired
Traumatic Brain InjuryDevelopmental Delay
69Total
0
1
65
00
29
22
5
1
0
0
Home
Early Childhood Setting
PT Early Child and SEEarly Childhood SE Setting
Separate SchoolResidential Facility
Regular Classroom
Resource Room
Self-Contained Classroom
Day Program
24 Hour Program
Home/Hospital Program
Special Education Placement Categories
Total 69
Student to Staff Ratio 16.0
K-8 454.2409-12 220.394
465.389226.960
ADA ADM
Total 674.634 692.349
Student Data
PK-12 Enrollment 699Open Enrolled Students Rec'd 13District Dropout Rate 0.3%
% Special Needs Students 9.9%% Eligible for Free/Red. Lunch 17.3%
Students Transported 344
District Attendance RateNumber of Graduates
97.4%44
Enrollment
Stanford Achievement Test Series, Tenth Edition (SAT10)
80
87
81
69
76
77
Math
Social Science
Language Arts
Reading
Complete Battery
Science
Stanford Writing Assessment Program, Third Edition
Grade 5
Grade 9
American College Test (ACT)
Grade 5Total
PRSpEd
PR
Number Tested
English
33
93%
Total PR
Sp Ed PR
78
78
75
74
68
73
83
77
78
65
77
75
93%
Grade 4 Grade 3Total
PRSp Ed
PR
Grade 6Total
PRSp Ed
PR
53 50 485 1 4
Sp EdTotal
Number Tested
Grade 7Total
PRSp Ed
PR
Grade 8 Total
PRSp Ed
PR
Grade 11Total
PRSp Ed
PR
MathReadingScienceComposite Score
22.223.521.6
22.922.7
75
72
81
62
68
71
55 3
61
74
78
67
73
69
78
69
69
64
65
69
82
81
80
85
79
80
363 360 252
Percent Proficient or Higher
No assessment data are reported when less than ten students were tested.
Ideas and Development
Sp EdTotal
Organization, Unity, and Coherence
Sp EdTotal
Word Choice
Sp EdTotal
Sentences and Paragraphs
Sp EdTotal
Grammer and Usage
Sp EdTotal
Writing Mechanics
Sp EdTotal
NumberTested
61% 57% 57%
90%
56%
75%
44%
79%
38%
79%
61
61

General $422,840Capital Outlay $461,024
Pension $179,443Special Education $10,224
Ending Fund Balance
Bond Redemption $142,251Capital Projects $0
Other Fund Data
Agricultural $3.19Non-Ag Z $4.19Owner Occupied $5.13Other Non-Ag/Utilities $11.00Special Education $1.40
Bond Redemption $1.32Pension Fund $0.30
Capital Outlay $3.00
2005 Payable 2006 Levy per Thousand
$845,828$17,983
$162,676
General AidSpecial EducationExtraordinary Cost Fund - SE
$1,026,487Total State Aid
State Aid
Special Education Federal Flowthrough
$61,227IDEA Part BPart B, Sec. 619, PK $1,622
$62,849Total
K-12 Instruction $1,187,399PK Instruction $0Adult Instruction $0
$248,409$34,783
$0
General Special Education
Expenditures
Community Services $0Non-Programmed $0Debt Service $0Co-Curricular $89,644
$0$0$0$0
Total Expenditures $2,091,712 $400,158
2005 Payable 2006Taxable Valuations
Agricultural $76,259,556Owner Occupied $23,171,127Non-Ag Z $2,537,135Other Non-Ag/Utilities $7,015,074Total $108,982,892
$30,92818.7
15.6%29.2
$31,789Average Teacher SalaryExperience Adjusted SalaryAvg Years of Experience% with Advanced DegreesCertified Instructional Staff
Teaching Staff Data
ADM of Tuitioned Out Paid 0.000
General State Aid Adj. ADM 312.550Non-Public / Home Sch ADM 0.000
ADM Data
Local $784,100County $31,588State $923,869Federal $111,826Total $1,851,383
$322,148$0$0$0
$156,048$0
$180,659$67,734
General Capital Outlay Special Education Pension
$322,148 $404,440 $33,126
Revenue
Classroom Staff 0.0
ADM of Contracted Out Paid 0.000
Other Special Revenue $27,492
508 Buffalo St, Elkton, SD 57026
2005-2006 Profile of Elkton School District 05-3
Capital Outlay Pension
Student/Staff ServicesAdministration ServicesTransportation ServicesOther Support Services
Enterprise Funds
Cost per ADM
General Fund Only
Revenue Expenditures
* Includes General, Special Education and Pension Funds
Home County: BrookingsArea in Square Miles: 151
2005 K-12 Fall Enrollment: 321
$33,126$0$0$0
$0$0
$50,099$0$0
$112,189$313,343$114,206$274,930
$16,142$3,071$8,901
$21,209$0$0
$137,210$3,150
$116,966$0$0$0
$0$0$0$0$0
$5,566$0$0
$6,680Educational Funds* $8,021
$149,545$0
$28,192$121,847 $132,885
$230,344 $55,665
$40,661

December 2005 Federal Child Count
0Deaf-Blind
03
1
DeafSpeech/Language
Autism
2Emotionally Disturbed20
19100
Mental RetardationHearing ImpairedLearning DisabledMultiple DisabilitiesOrthopedic ImpairmentVisually Impaired
1
10
Other Health Impaired
Traumatic Brain InjuryDevelopmental Delay
30Total
0
2
02
00
19
7
0
0
0
0
Home
Early Childhood Setting
PT Early Child and SEEarly Childhood SE Setting
Separate SchoolResidential Facility
Regular Classroom
Resource Room
Self-Contained Classroom
Day Program
24 Hour Program
Home/Hospital Program
Special Education Placement Categories
Total 30
Student to Staff Ratio 11.0
K-8 197.3139-12 103.290
203.050108.155
ADA ADM
Total 300.603 311.205
Student Data
PK-12 Enrollment 321Open Enrolled Students Rec'd 27District Dropout Rate 0.0%
% Special Needs Students 9.3%% Eligible for Free/Red. Lunch 58.1%
Students Transported 169
District Attendance RateNumber of Graduates
96.6%22
Enrollment
Stanford Achievement Test Series, Tenth Edition (SAT10)
87
85
82
77
78
80
Math
Social Science
Language Arts
Reading
Complete Battery
Science
Stanford Writing Assessment Program, Third Edition
Grade 5
Grade 9
American College Test (ACT)
Grade 5Total
PRSpEd
PR
Number Tested
English
12
63%
Total PR
Sp Ed PR
76
66
65
61
66
67
64
55
60
38
59
55
58%
Grade 4 Grade 3Total
PRSp Ed
PR
Grade 6Total
PRSp Ed
PR
25 30 353 1 6
Sp EdTotal
Number Tested
Grade 7Total
PRSp Ed
PR
Grade 8 Total
PRSp Ed
PR
Grade 11Total
PRSp Ed
PR
MathReadingScienceComposite Score
22.518.920.0
21.320.8
73
68
60
66
63
65
22 5
89
82
79
77
80
82
82
68
72
74
66
73
88
72
70
79
70
76
121 124 22
Percent Proficient or Higher
No assessment data are reported when less than ten students were tested.
Ideas and Development
Sp EdTotal
Organization, Unity, and Coherence
Sp EdTotal
Word Choice
Sp EdTotal
Sentences and Paragraphs
Sp EdTotal
Grammer and Usage
Sp EdTotal
Writing Mechanics
Sp EdTotal
NumberTested
57% 62% 71%
47%
57%
47%
57%
68%
52%
63%
21
19

General $409,269Capital Outlay $280,439
Pension $41,549Special Education $3,048
Ending Fund Balance
Bond Redemption $0Capital Projects $0
Other Fund Data
Agricultural $3.19Non-Ag Z $4.19Owner Occupied $5.13Other Non-Ag/Utilities $11.00Special Education $1.40
Bond Redemption $0.00Pension Fund $0.30
Capital Outlay $3.00
2005 Payable 2006 Levy per Thousand
$711,505$13,157$16,813
General AidSpecial EducationExtraordinary Cost Fund - SE
$741,475Total State Aid
State Aid
Special Education Federal Flowthrough
$33,308IDEA Part BPart B, Sec. 619, PK $3,982
$37,290Total
K-12 Instruction $664,707PK Instruction $0Adult Instruction $0
$74,904$15,864
$0
General Special Education
Expenditures
Community Services $10,476Non-Programmed $0Debt Service $0Co-Curricular $90,700
$0$0$0$0
Total Expenditures $1,382,781 $157,359
2005 Payable 2006Taxable Valuations
Agricultural $47,386,108Owner Occupied $10,629,865Non-Ag Z $319,699Other Non-Ag/Utilities $4,327,792Total $62,663,464
$29,16418.0
11.1%17.5
$29,782Average Teacher SalaryExperience Adjusted SalaryAvg Years of Experience% with Advanced DegreesCertified Instructional Staff
Teaching Staff Data
ADM of Tuitioned Out Paid 0.000
General State Aid Adj. ADM 213.942Non-Public / Home Sch ADM 0.000
ADM Data
Local $447,521County $9,007State $731,426Federal $176,103Total $1,364,057
$184,342$0$0
$1,722
$83,942$0
$29,970$39,085
General Capital Outlay Special Education Pension
$186,065 $152,997 $18,520
Revenue
Classroom Staff 0.0
ADM of Contracted Out Paid 0.000
Other Special Revenue $0
130 E 6th St, Emery, SD 57332
2005-2006 Profile of Emery School District 30-2
Capital Outlay Pension
Student/Staff ServicesAdministration ServicesTransportation ServicesOther Support Services
Enterprise Funds
Cost per ADM
General Fund Only
Revenue Expenditures
* Includes General, Special Education and Pension Funds
Home County: HansonArea in Square Miles: 100
2005 K-12 Fall Enrollment: 177
$18,520$0$0$0
$0$0
$0$0$0
$204,466$174,133
$52,628$185,672
$2,727$192
$8,600$27,498
$0$0
$45,600$16,157
$31,534$29,697
$0$5,360
$0$0$0$0$0$0$0$0
$6,958Educational Funds* $7,752
$0$0$0
$67,093 $73,539
$146,982 $0
$46,208

December 2005 Federal Child Count
0Deaf-Blind
02
0
DeafSpeech/Language
Autism
0Emotionally Disturbed20
11000
Mental RetardationHearing ImpairedLearning DisabledMultiple DisabilitiesOrthopedic ImpairmentVisually Impaired
3
00
Other Health Impaired
Traumatic Brain InjuryDevelopmental Delay
18Total
0
0
00
00
5
13
0
0
0
0
Home
Early Childhood Setting
PT Early Child and SEEarly Childhood SE Setting
Separate SchoolResidential Facility
Regular Classroom
Resource Room
Self-Contained Classroom
Day Program
24 Hour Program
Home/Hospital Program
Special Education Placement Categories
Total 18
Student to Staff Ratio 10.1
K-8 118.3379-12 56.286
120.28558.000
ADA ADM
Total 174.623 178.285
Student Data
PK-12 Enrollment 177Open Enrolled Students Rec'd 23District Dropout Rate 0.0%
% Special Needs Students 10.2%% Eligible for Free/Red. Lunch 34.0%
Students Transported 89
District Attendance RateNumber of Graduates
97.9%10
Enrollment
Stanford Achievement Test Series, Tenth Edition (SAT10)
94
95
94
80
88
90
Math
Social Science
Language Arts
Reading
Complete Battery
Science
Stanford Writing Assessment Program, Third Edition
Grade 5
Grade 9
American College Test (ACT)
Grade 5Total
PRSpEd
PR
Number Tested
English
9
92%
Total PR
Sp Ed PR
90
80
81
84
80
83
71
69
55
66
69
65
92%
Grade 4 Grade 3Total
PRSp Ed
PR
Grade 6Total
PRSp Ed
PR
8 15 163 2
Sp EdTotal
Number Tested
Grade 7Total
PRSp Ed
PR
Grade 8 Total
PRSp Ed
PR
Grade 11Total
PRSp Ed
PR
MathReadingScienceComposite Score
74
49
67
57
64
64
16
79
47
58
62
57
63
85
72
79
76
77
78
89
65
67
72
60
72
213 217 412
Percent Proficient or Higher
No assessment data are reported when less than ten students were tested.
Ideas and Development
Sp EdTotal
Organization, Unity, and Coherence
Sp EdTotal
Word Choice
Sp EdTotal
Sentences and Paragraphs
Sp EdTotal
Grammer and Usage
Sp EdTotal
Writing Mechanics
Sp EdTotal
NumberTested
54% 38% 77%
85%
38%
85%
46%
92%
46%
85%
13
13

General $561,383Capital Outlay $152,454
PensionSpecial Education $2,939
Ending Fund Balance
Bond Redemption $256,095Capital Projects $0
Other Fund Data
Agricultural $3.19Non-Ag Z $4.19Owner Occupied $5.13Other Non-Ag/Utilities $11.00Special Education $1.40
Bond Redemption $1.86Pension Fund $0.00
Capital Outlay $1.50
2005 Payable 2006 Levy per Thousand
$607,087$0
$18,753
General AidSpecial EducationExtraordinary Cost Fund - SE
$625,840Total State Aid
State Aid
Special Education Federal Flowthrough
$52,711IDEA Part BPart B, Sec. 619, PK $2,094
$54,805Total
K-12 Instruction $997,747PK Instruction $15,333Adult Instruction $0
$171,991$10,577
$0
General Special Education
Expenditures
Community Services $0Non-Programmed $0Debt Service $0Co-Curricular $89,828
$0$0$0$0
Total Expenditures $1,773,966 $280,599
2005 Payable 2006Taxable Valuations
Agricultural $75,724,080Owner Occupied $26,378,916Non-Ag Z $1,254,394Other Non-Ag/Utilities $34,179,892Total $137,537,282
$32,37514.7
17.4%21.2
$31,524Average Teacher SalaryExperience Adjusted SalaryAvg Years of Experience% with Advanced DegreesCertified Instructional Staff
Teaching Staff Data
ADM of Tuitioned Out Paid 0.000
General State Aid Adj. ADM 329.398Non-Public / Home Sch ADM 5.000
ADM Data
Local $898,812County $12,186State $652,239Federal $95,642Total $1,658,879
$203,496$0$0
$5,000
$200,100$0
$18,753$50,599
General Capital Outlay Special Education Pension
$208,496 $269,453 $0
Revenue
Classroom Staff 1.0
ADM of Contracted Out Paid 0.000
Other Special Revenue $0
708 Davis, Estelline, SD 57234-0306
2005-2006 Profile of Estelline School District 28-2
Capital Outlay Pension
Student/Staff ServicesAdministration ServicesTransportation ServicesOther Support Services
Enterprise Funds
Cost per ADM
General Fund Only
Revenue Expenditures
* Includes General, Special Education and Pension Funds
Home County: HamlinArea in Square Miles: 169
2005 K-12 Fall Enrollment: 296
$0$0$0$0
$0$0
$0$0$0
$106,330$172,757
$92,871$299,100
$5,845$0$0
$162,748$0$0
$41,499$228
$76,400$958
$20,673$0
$0$0$0$0$0$0$0$0
$5,995Educational Funds* $6,851
$266,843$0$0
$105,635 $106,724
$294,649 $0
$84,329

December 2005 Federal Child Count
0Deaf-Blind
18
0
DeafSpeech/Language
Autism
2Emotionally Disturbed00
16100
Mental RetardationHearing ImpairedLearning DisabledMultiple DisabilitiesOrthopedic ImpairmentVisually Impaired
2
00
Other Health Impaired
Traumatic Brain InjuryDevelopmental Delay
30Total
0
1
20
00
15
11
1
0
0
0
Home
Early Childhood Setting
PT Early Child and SEEarly Childhood SE Setting
Separate SchoolResidential Facility
Regular Classroom
Resource Room
Self-Contained Classroom
Day Program
24 Hour Program
Home/Hospital Program
Special Education Placement Categories
Total 30
Student to Staff Ratio 14.2
K-8 190.0499-12 92.489
194.69496.465
ADA ADM
Total 282.538 291.159
Student Data
PK-12 Enrollment 314Open Enrolled Students Rec'd 40District Dropout Rate 1.8%
% Special Needs Students 9.6%% Eligible for Free/Red. Lunch 30.7%
Students Transported 101
District Attendance RateNumber of Graduates
97.0%21
Enrollment
Stanford Achievement Test Series, Tenth Edition (SAT10)
78
60
68
52
62
65
Math
Social Science
Language Arts
Reading
Complete Battery
Science
Stanford Writing Assessment Program, Third Edition
Grade 5
Grade 9
American College Test (ACT)
Grade 5Total
PRSpEd
PR
Number Tested
English
14
79%
Total PR
Sp Ed PR
67
70
69
63
66
66
71
71
68
65
82
72
71%
Grade 4 Grade 3Total
PRSp Ed
PR
Grade 6Total
PRSp Ed
PR
21 36 251 1
Sp EdTotal
Number Tested
Grade 7Total
PRSp Ed
PR
Grade 8 Total
PRSp Ed
PR
Grade 11Total
PRSp Ed
PR
MathReadingScienceComposite Score
23.121.520.9
22.622.3
83
85
88
88
83
83
17 1
80
71
77
67
63
72
79
62
74
66
66
70
65
65
69
66
69
66
121 19 125
Percent Proficient or Higher
No assessment data are reported when less than ten students were tested.
Ideas and Development
Sp EdTotal
Organization, Unity, and Coherence
Sp EdTotal
Word Choice
Sp EdTotal
Sentences and Paragraphs
Sp EdTotal
Grammer and Usage
Sp EdTotal
Writing Mechanics
Sp EdTotal
NumberTested
59% 36% 59%
67%
50%
67%
55%
71%
55%
71%
22
24

General $609,379Capital Outlay $117,967
PensionSpecial Education $61,052
Ending Fund Balance
Bond Redemption $167,110Capital Projects $0
Other Fund Data
Agricultural $3.53Non-Ag Z $4.64Owner Occupied $5.68Other Non-Ag/Utilities $12.17Special Education $1.20
Bond Redemption $2.85Pension Fund $0.30
Capital Outlay $1.40
2005 Payable 2006 Levy per Thousand
$690,261$33,498
$0
General AidSpecial EducationExtraordinary Cost Fund - SE
$723,759Total State Aid
State Aid
Special Education Federal Flowthrough
$38,995IDEA Part BPart B, Sec. 619, PK $3,019
$42,014Total
K-12 Instruction $790,361PK Instruction $0Adult Instruction $0
$124,527$0$0
General Special Education
Expenditures
Community Services $0Non-Programmed $0Debt Service $0Co-Curricular $51,759
$0$0$0$0
Total Expenditures $1,274,157 $192,695
2005 Payable 2006Taxable Valuations
Agricultural $43,406,065Owner Occupied $10,364,569Non-Ag Z $918,468Other Non-Ag/Utilities $3,851,511Total $58,540,613
$29,88017.3
19.0%18.1
$30,156Average Teacher SalaryExperience Adjusted SalaryAvg Years of Experience% with Advanced DegreesCertified Instructional Staff
Teaching Staff Data
ADM of Tuitioned Out Paid 1.000
General State Aid Adj. ADM 247.236Non-Public / Home Sch ADM 2.942
ADM Data
Local $352,959County $18,217State $715,210Federal $87,265Total $1,173,650
$80,980$0$0
$22,050
$73,839$0
$33,498$42,014
General Capital Outlay Special Education Pension
$103,030 $149,351 $17,007
Revenue
Classroom Staff 1.0
ADM of Contracted Out Paid 0.000
Other Special Revenue $0
320 S 2nd St, Ethan, SD 57334
2005-2006 Profile of Ethan School District 17-1
Capital Outlay Pension
Student/Staff ServicesAdministration ServicesTransportation ServicesOther Support Services
Enterprise Funds
Cost per ADM
General Fund Only
Revenue Expenditures
* Includes General, Special Education and Pension Funds
Home County: DavisonArea in Square Miles: 105
2005 K-12 Fall Enrollment: 210
$17,007$0$0$0
$0$0
$17,007$0$0
$67,997$136,158
$46,517$181,365
$0$1,092$2,250
$46,463$0$0
$20,000$7,369
$68,168$0$0$0
$0$0$0$0$0$0$0$0
$5,912Educational Funds* $6,843
$167,806$0$0
$75,017 $75,780
*District has opted out of General Fund levy
$124,612 $17,007
$47,439

December 2005 Federal Child Count
0Deaf-Blind
03
0
DeafSpeech/Language
Autism
0Emotionally Disturbed409300
Mental RetardationHearing ImpairedLearning DisabledMultiple DisabilitiesOrthopedic ImpairmentVisually Impaired
3
09
Other Health Impaired
Traumatic Brain InjuryDevelopmental Delay
31Total
0
0
90
00
16
5
0
1
0
0
Home
Early Childhood Setting
PT Early Child and SEEarly Childhood SE Setting
Separate SchoolResidential Facility
Regular Classroom
Resource Room
Self-Contained Classroom
Day Program
24 Hour Program
Home/Hospital Program
Special Education Placement Categories
Total 31
Student to Staff Ratio 11.0
K-8 140.2059-12 58.562
144.29860.704
ADA ADM
Total 198.767 205.002
Student Data
PK-12 Enrollment 210Open Enrolled Students Rec'd 33District Dropout Rate 0.0%
% Special Needs Students 14.8%% Eligible for Free/Red. Lunch 25.4%
Students Transported 71
District Attendance RateNumber of Graduates
97.0%10
Enrollment
Stanford Achievement Test Series, Tenth Edition (SAT10)
93
81
76
67
89
85
Math
Social Science
Language Arts
Reading
Complete Battery
Science
Stanford Writing Assessment Program, Third Edition
Grade 5
Grade 9
American College Test (ACT)
Grade 5Total
PRSpEd
PR
Number Tested
English
6
90%
Total PR
Sp Ed PR
73
66
67
60
61
65
62
69
49
55
56
57
100%
Grade 4 Grade 3Total
PRSp Ed
PR
Grade 6Total
PRSp Ed
PR
17 19 161 3 1
Sp EdTotal
Number Tested
Grade 7Total
PRSp Ed
PR
Grade 8 Total
PRSp Ed
PR
Grade 11Total
PRSp Ed
PR
MathReadingScienceComposite Score
74
57
76
63
59
63
20 1
93
79
77
78
66
81
87
69
68
76
75
76
92
75
72
81
73
79
215 115 110
Percent Proficient or Higher
No assessment data are reported when less than ten students were tested.
Ideas and Development
Sp EdTotal
Organization, Unity, and Coherence
Sp EdTotal
Word Choice
Sp EdTotal
Sentences and Paragraphs
Sp EdTotal
Grammer and Usage
Sp EdTotal
Writing Mechanics
Sp EdTotal
NumberTested
40% 67% 33%
90%
53%
90%
67%
80%
53%
90%
15
10

General $608,363Capital Outlay $473,074
Pension $104,089Special Education $149,692
Ending Fund Balance
Bond Redemption $0Capital Projects $0
Other Fund Data
Agricultural $5.24Non-Ag Z $6.88Owner Occupied $8.43Other Non-Ag/Utilities $18.07Special Education $1.40
Bond Redemption $0.00Pension Fund $0.30
Capital Outlay $0.32
2005 Payable 2006 Levy per Thousand
$493,497$0$0
General AidSpecial EducationExtraordinary Cost Fund - SE
$493,497Total State Aid
State Aid
Special Education Federal Flowthrough
$40,781IDEA Part BPart B, Sec. 619, PK $3,028
$43,809Total
K-12 Instruction $768,711PK Instruction $0Adult Instruction $0
$110,822$22,942
$0
General Special Education
Expenditures
Community Services $0Non-Programmed $0Debt Service $0Co-Curricular $109,348
$0$0$0$0
Total Expenditures $1,467,659 $189,480
2005 Payable 2006Taxable Valuations
Agricultural $110,463,828Owner Occupied $16,635,866Non-Ag Z $549,585Other Non-Ag/Utilities $15,563,660Total $143,212,939
$31,31916.6
15.0%18.3
$31,892Average Teacher SalaryExperience Adjusted SalaryAvg Years of Experience% with Advanced DegreesCertified Instructional Staff
Teaching Staff Data
ADM of Tuitioned Out Paid 1.000
General State Aid Adj. ADM 232.261Non-Public / Home Sch ADM 0.000
ADM Data
Local $1,133,148County $4,727State $527,809Federal $75,526Total $1,741,210
$62,537$0$0
$2,860
$191,465$0$0
$42,336
General Capital Outlay Special Education Pension
$65,398 $233,801 $42,431
Revenue
Classroom Staff 1.0
ADM of Contracted Out Paid 0.000
Other Special Revenue $0
706 9th St, Eureka, SD 57437-0010
2005-2006 Profile of Eureka School District 44-1
Capital Outlay Pension
Student/Staff ServicesAdministration ServicesTransportation ServicesOther Support Services
Enterprise Funds
Cost per ADM
General Fund Only
Revenue Expenditures
* Includes General, Special Education and Pension Funds
Home County: Mc PhersonArea in Square Miles: 605
2005 K-12 Fall Enrollment: 198
$42,293$0$0
$138
$0$0
$5,450$0$0
$74,292$157,703$102,637$254,968
$1,118$0
$2,636$32,370
$0$0
$7,645$11,683
$35,786$14,387
$397$5,147
$237$2,014
$0$1,940
$0$0$0$0
$7,622Educational Funds* $8,483
$0$0$0
$86,666 $90,380
*District has opted out of General Fund levy
$90,777 $9,641
$35,324

December 2005 Federal Child Count
0Deaf-Blind
06
1
DeafSpeech/Language
Autism
0Emotionally Disturbed10
10100
Mental RetardationHearing ImpairedLearning DisabledMultiple DisabilitiesOrthopedic ImpairmentVisually Impaired
1
01
Other Health Impaired
Traumatic Brain InjuryDevelopmental Delay
21Total
0
0
21
00
17
0
1
0
0
0
Home
Early Childhood Setting
PT Early Child and SEEarly Childhood SE Setting
Separate SchoolResidential Facility
Regular Classroom
Resource Room
Self-Contained Classroom
Day Program
24 Hour Program
Home/Hospital Program
Special Education Placement Categories
Total 21
Student to Staff Ratio 10.4
K-8 117.7119-12 69.679
120.08772.464
ADA ADM
Total 187.390 192.551
Student Data
PK-12 Enrollment 200Open Enrolled Students Rec'd 14District Dropout Rate 0.0%
% Special Needs Students 10.5%% Eligible for Free/Red. Lunch 35.6%
Students Transported 91
District Attendance RateNumber of Graduates
97.3%22
Enrollment
Stanford Achievement Test Series, Tenth Edition (SAT10)
77
84
86
71
80
78
Math
Social Science
Language Arts
Reading
Complete Battery
Science
Stanford Writing Assessment Program, Third Edition
Grade 5
Grade 9
American College Test (ACT)
Grade 5Total
PRSpEd
PR
Number Tested
English
21
90%
Total PR
Sp Ed PR
69
81
80
76
76
74
73
79
65
57
81
72
81%
Grade 4 Grade 3Total
PRSp Ed
PR
Grade 6Total
PRSp Ed
PR
15 14 161 2
Sp EdTotal
Number Tested
Grade 7Total
PRSp Ed
PR
Grade 8 Total
PRSp Ed
PR
Grade 11Total
PRSp Ed
PR
MathReadingScienceComposite Score
22.221.122.1
20.521.7
80
63
81
78
74
75
7 1
81
78
88
80
73
80
78
84
76
76
68
75
77
77
86
85
78
79
215 112 22
Percent Proficient or Higher
No assessment data are reported when less than ten students were tested.
Ideas and Development
Sp EdTotal
Organization, Unity, and Coherence
Sp EdTotal
Word Choice
Sp EdTotal
Sentences and Paragraphs
Sp EdTotal
Grammer and Usage
Sp EdTotal
Writing Mechanics
Sp EdTotal
NumberTested
53% 73% 67%
86%
73%
90%
73%
90%
60%
86%
15
21

General $229,503Capital Outlay $459,690
Pension $1,586Special Education $137,861
Ending Fund Balance
Bond Redemption $0Capital Projects $0
Other Fund Data
Agricultural $6.00Non-Ag Z $7.88Owner Occupied $9.65Other Non-Ag/Utilities $20.69Special Education $1.20
Bond Redemption $0.00Pension Fund $0.30
Capital Outlay $3.00
2005 Payable 2006 Levy per Thousand
$851,575$100,060
$0
General AidSpecial EducationExtraordinary Cost Fund - SE
$951,635Total State Aid
State Aid
Special Education Federal Flowthrough
$38,064IDEA Part BPart B, Sec. 619, PK $1,085
$39,149Total
K-12 Instruction $821,005PK Instruction $0Adult Instruction $0
$122,708$0$0
General Special Education
Expenditures
Community Services $0Non-Programmed $0Debt Service $0Co-Curricular $66,372
$0$0$0$0
Total Expenditures $1,365,109 $131,749
2005 Payable 2006Taxable Valuations
Agricultural $38,711,689Owner Occupied $7,320,061Non-Ag Z $224,757Other Non-Ag/Utilities $4,152,102Total $50,408,609
$30,05216.1
10.5%17.7
$30,223Average Teacher SalaryExperience Adjusted SalaryAvg Years of Experience% with Advanced DegreesCertified Instructional Staff
Teaching Staff Data
ADM of Tuitioned Out Paid 0.000
General State Aid Adj. ADM 250.011Non-Public / Home Sch ADM 14.700
ADM Data
Local $436,838County $30,149State $898,008Federal $120,681Total $1,485,676
$160,675$0$0$0
$66,297$0
$100,060$38,306
General Capital Outlay Special Education Pension
$160,675 $204,663 $15,198
Revenue
Classroom Staff 0.0
ADM of Contracted Out Paid 0.000
Other Special Revenue $0
503 S 2nd Ave W, Faith, SD 57626
2005-2006 Profile of Faith School District 46-2
Capital Outlay Pension
Student/Staff ServicesAdministration ServicesTransportation ServicesOther Support Services
Enterprise Funds
Cost per ADM
General Fund Only
Revenue Expenditures
* Includes General, Special Education and Pension Funds
Home County: MeadeArea in Square Miles: 864
2005 K-12 Fall Enrollment: 206
$15,198$0$0$0
$0$0
$14,800$0$0
$86,124$175,086
$41,210$175,311
$0$0$0
$70,873$0$0
$51,726$0
$9,042$0$0$0
$0$0$0$0$0$0$0$0
$6,538Educational Funds* $7,240
$0$0$0
$86,934 $83,087
*District has opted out of General Fund levy
$122,599 $14,800
$0

December 2005 Federal Child Count
0Deaf-Blind
07
2
DeafSpeech/Language
Autism
1Emotionally Disturbed119100
Mental RetardationHearing ImpairedLearning DisabledMultiple DisabilitiesOrthopedic ImpairmentVisually Impaired
0
02
Other Health Impaired
Traumatic Brain InjuryDevelopmental Delay
24Total
0
0
05
00
18
1
0
0
0
0
Home
Early Childhood Setting
PT Early Child and SEEarly Childhood SE Setting
Separate SchoolResidential Facility
Regular Classroom
Resource Room
Self-Contained Classroom
Day Program
24 Hour Program
Home/Hospital Program
Special Education Placement Categories
Total 24
Student to Staff Ratio 11.8
K-8 126.7249-12 73.424
131.24576.549
ADA ADM
Total 200.148 207.794
Student Data
PK-12 Enrollment 208Open Enrolled Students Rec'd 45District Dropout Rate 0.0%
% Special Needs Students 11.5%% Eligible for Free/Red. Lunch 50.8%
Students Transported 0
District Attendance RateNumber of Graduates
96.3%18
Enrollment
Stanford Achievement Test Series, Tenth Edition (SAT10)
81
75
74
60
79
74
Math
Social Science
Language Arts
Reading
Complete Battery
Science
Stanford Writing Assessment Program, Third Edition
Grade 5
Grade 9
American College Test (ACT)
Grade 5Total
PRSpEd
PR
Number Tested
English
17
62%
Total PR
Sp Ed PR
85
79
81
65
67
76
87
88
69
67
85
80
76%
Grade 4 Grade 3Total
PRSp Ed
PR
Grade 6Total
PRSp Ed
PR
13 16 191 1
Sp EdTotal
Number Tested
Grade 7Total
PRSp Ed
PR
Grade 8 Total
PRSp Ed
PR
Grade 11Total
PRSp Ed
PR
MathReadingScienceComposite Score
21.021.319.6
22.221.2
72
61
74
57
61
64
18 2
72
66
74
54
47
62
85
63
75
72
71
75
84
59
63
69
54
67
418 16 215
Percent Proficient or Higher
No assessment data are reported when less than ten students were tested.
Ideas and Development
Sp EdTotal
Organization, Unity, and Coherence
Sp EdTotal
Word Choice
Sp EdTotal
Sentences and Paragraphs
Sp EdTotal
Grammer and Usage
Sp EdTotal
Writing Mechanics
Sp EdTotal
NumberTested
41% 47% 41%
71%
24%
67%
24%
76%
12%
71%
17
21

General $1,173,114Capital Outlay $273,756
Pension $7,932Special Education $316,217
Ending Fund Balance
Bond Redemption $0Capital Projects $0
Other Fund Data
Agricultural $3.19Non-Ag Z $4.19Owner Occupied $5.13Other Non-Ag/Utilities $11.00Special Education $0.93
Bond Redemption $0.00Pension Fund $0.21
Capital Outlay $1.92
2005 Payable 2006 Levy per Thousand
$1,050,049$0$0
General AidSpecial EducationExtraordinary Cost Fund - SE
$1,050,049Total State Aid
State Aid
Special Education Federal Flowthrough
$67,942IDEA Part BPart B, Sec. 619, PK $3,600
$71,542Total
K-12 Instruction $1,203,184PK Instruction $0Adult Instruction $0
$133,125$5,238
$0
General Special Education
Expenditures
Community Services $0Non-Programmed $41,173Debt Service $0Co-Curricular $93,738
$0$0$0$0
Total Expenditures $2,034,368 $214,777
2005 Payable 2006Taxable Valuations
Agricultural $169,829,943Owner Occupied $15,082,508Non-Ag Z $613,089Other Non-Ag/Utilities $6,664,515Total $192,190,055
$31,35914.7
12.5%29.3
$30,569Average Teacher SalaryExperience Adjusted SalaryAvg Years of Experience% with Advanced DegreesCertified Instructional Staff
Teaching Staff Data
ADM of Tuitioned Out Paid 0.000
General State Aid Adj. ADM 394.654Non-Public / Home Sch ADM 1.980
ADM Data
Local $801,511County $12,899State $1,188,747Federal $224,135Total $2,227,292
$338,533$0$0
$47,226
$182,507$0$0
$78,363
General Capital Outlay Special Education Pension
$385,759 $260,870 $42,182
Revenue
Classroom Staff 0.0
ADM of Contracted Out Paid 0.000
Other Special Revenue $0
1114 Court St, Faulkton, SD 57438
2005-2006 Profile of Faulkton Area School District 24-3
Capital Outlay Pension
Student/Staff ServicesAdministration ServicesTransportation ServicesOther Support Services
Enterprise Funds
Cost per ADM
General Fund Only
Revenue Expenditures
* Includes General, Special Education and Pension Funds
Home County: FaulkArea in Square Miles: 886
2005 K-12 Fall Enrollment: 349
$42,182$0$0$0
$0$0
$32,230$0$0
$111,544$216,875$109,421$258,433
$64,565$0
$47,164$234,773
$0$0$0
$5,221
$63,446$12,968
$0$0
$0$4,344
$0$2,016
$0$0$0$0
$5,791Educational Funds* $6,493
$0$0$0
$126,459 $137,376
$386,217 $38,589
$34,494

December 2005 Federal Child Count
0Deaf-Blind
011
0
DeafSpeech/Language
Autism
1Emotionally Disturbed30
16201
Mental RetardationHearing ImpairedLearning DisabledMultiple DisabilitiesOrthopedic ImpairmentVisually Impaired
3
03
Other Health Impaired
Traumatic Brain InjuryDevelopmental Delay
40Total
0
2
03
00
26
8
1
0
0
0
Home
Early Childhood Setting
PT Early Child and SEEarly Childhood SE Setting
Separate SchoolResidential Facility
Regular Classroom
Resource Room
Self-Contained Classroom
Day Program
24 Hour Program
Home/Hospital Program
Special Education Placement Categories
Total 40
Student to Staff Ratio 11.9
K-8 238.4049-12 100.110
245.200104.246
ADA ADM
Total 338.514 349.446
Student Data
PK-12 Enrollment 349Open Enrolled Students Rec'd 9District Dropout Rate 1.2%
% Special Needs Students 11.5%% Eligible for Free/Red. Lunch 42.9%
Students Transported 135
District Attendance RateNumber of Graduates
96.9%24
Enrollment
Stanford Achievement Test Series, Tenth Edition (SAT10)
76
78
75
72
76
74
Math
Social Science
Language Arts
Reading
Complete Battery
Science
Stanford Writing Assessment Program, Third Edition
Grade 5
Grade 9
American College Test (ACT)
Grade 5Total
PRSpEd
PR
Number Tested
English
65%
Total PR
Sp Ed PR
86
69
60
74
68
73
81
77
61
63
76
71
81%
Grade 4 Grade 3Total
PRSp Ed
PR
Grade 6Total
PRSp Ed
PR
17 28 251 4 1
Sp EdTotal
Number Tested
Grade 7Total
PRSp Ed
PR
Grade 8 Total
PRSp Ed
PR
Grade 11Total
PRSp Ed
PR
MathReadingScienceComposite Score
72
63
64
63
57
60
28 1
76
70
71
61
68
70
82
54
68
69
59
68
88
73
69
71
65
74
528 233 333
Percent Proficient or Higher
No assessment data are reported when less than ten students were tested.
Ideas and Development
Sp EdTotal
Organization, Unity, and Coherence
Sp EdTotal
Word Choice
Sp EdTotal
Sentences and Paragraphs
Sp EdTotal
Grammer and Usage
Sp EdTotal
Writing Mechanics
Sp EdTotal
NumberTested
50% 50% 50%
68%
39%
65%
43%
77%
43%
81%
28
31

General $1,157,813Capital Outlay $246,473
Pension $4,688Special Education $73,334
Ending Fund Balance
Bond Redemption $271,893Capital Projects $0
Other Fund Data
Agricultural $3.19Non-Ag Z $4.19Owner Occupied $5.13Other Non-Ag/Utilities $11.00Special Education $1.40
Bond Redemption $1.15Pension Fund $0.00
Capital Outlay $2.65
2005 Payable 2006 Levy per Thousand
$1,851,213$268,063
$0
General AidSpecial EducationExtraordinary Cost Fund - SE
$2,119,276Total State Aid
State Aid
Special Education Federal Flowthrough
$130,662IDEA Part BPart B, Sec. 619, PK $5,217
$135,879Total
K-12 Instruction $2,260,095PK Instruction $0Adult Instruction $0
$460,578$45,391
$0
General Special Education
Expenditures
Community Services $53,563Non-Programmed $0Debt Service $0Co-Curricular $195,463
$0$0$0$0
Total Expenditures $3,887,613 $809,647
2005 Payable 2006Taxable Valuations
Agricultural $165,170,305Owner Occupied $51,258,282Non-Ag Z $3,154,498Other Non-Ag/Utilities $18,650,579Total $238,233,664
$30,82314.4
14.8%56.6
$31,255Average Teacher SalaryExperience Adjusted SalaryAvg Years of Experience% with Advanced DegreesCertified Instructional Staff
Teaching Staff Data
ADM of Tuitioned Out Paid 6.618
General State Aid Adj. ADM 654.569Non-Public / Home Sch ADM 0.000
ADM Data
Local $1,194,849County $354,740State $1,941,630Federal $313,705Total $3,804,924
$617,877$0$0$0
$321,488$0
$268,063$176,102
General Capital Outlay Special Education Pension
$617,877 $765,654 $68,592
Revenue
Classroom Staff 0.0
ADM of Contracted Out Paid 0.000
Other Special Revenue $0
600 West Community Drive, Flandreau, SD 57028
2005-2006 Profile of Flandreau School District 50-3
Capital Outlay Pension
Student/Staff ServicesAdministration ServicesTransportation ServicesOther Support Services
Enterprise Funds
Cost per ADM
General Fund Only
Revenue Expenditures
* Includes General, Special Education and Pension Funds
Home County: MoodyArea in Square Miles: 249
2005 K-12 Fall Enrollment: 655
$68,592$0$0$0
$0$0
$68,400$0$0
$264,588$371,894$130,295$611,716
$15,174$840
$37,318$82,541
$0$0
$235,901$14,220
$179,803$42,264$76,405$5,206
$0$0$0$0$0$0$0$0
$5,900Educational Funds* $6,888
$273,434$0
$271,602$300,979 $292,705
$570,440 $68,400
$184,446

December 2005 Federal Child Count
0Deaf-Blind
410
3
DeafSpeech/Language
Autism
9Emotionally Disturbed51
29700
Mental RetardationHearing ImpairedLearning DisabledMultiple DisabilitiesOrthopedic ImpairmentVisually Impaired
10
06
Other Health Impaired
Traumatic Brain InjuryDevelopmental Delay
84Total
0
0
44
00
44
23
1
6
2
0
Home
Early Childhood Setting
PT Early Child and SEEarly Childhood SE Setting
Separate SchoolResidential Facility
Regular Classroom
Resource Room
Self-Contained Classroom
Day Program
24 Hour Program
Home/Hospital Program
Special Education Placement Categories
Total 84
Student to Staff Ratio 11.7
K-8 421.1609-12 193.055
440.849205.571
ADA ADM
Total 614.215 646.420
Student Data
PK-12 Enrollment 661Open Enrolled Students Rec'd 31District Dropout Rate 2.6%
% Special Needs Students 12.7%% Eligible for Free/Red. Lunch 26.9%
Students Transported 162
District Attendance RateNumber of Graduates
95.0%48
Enrollment
Stanford Achievement Test Series, Tenth Edition (SAT10)
68
58
62
45
61
59
Math
Social Science
Language Arts
Reading
Complete Battery
Science
Stanford Writing Assessment Program, Third Edition
Grade 5
Grade 9
American College Test (ACT)
Grade 5Total
PRSpEd
PR
Number Tested
English
34
77% 25%
Total PR
Sp Ed PR
81
82
67
66
73
74
80
78
74
63
80
75
86% 25%
Grade 4 Grade 3Total
PRSp Ed
PR
Grade 6Total
PRSp Ed
PR
52 43 511
Sp EdTotal
Number Tested
Grade 7Total
PRSp Ed
PR
Grade 8 Total
PRSp Ed
PR
Grade 11Total
PRSp Ed
PR
MathReadingScienceComposite Score
22.922.222.5
22.322.6
79
64
71
66
67
70
53 2
76
72
78
60
65
70
71
57
66
69
58
64
76
73
67
75
65
69
47 44 46
Percent Proficient or Higher
No assessment data are reported when less than ten students were tested.
Ideas and Development
Sp EdTotal
Organization, Unity, and Coherence
Sp EdTotal
Word Choice
Sp EdTotal
Sentences and Paragraphs
Sp EdTotal
Grammer and Usage
Sp EdTotal
Writing Mechanics
Sp EdTotal
NumberTested
67% 57% 71%
88% 25%
48%
84% 13%
48%
84% 13%
57%
84% 25%
42
43
3
8

General $201,612Capital Outlay $134,407
Pension $1,142Special Education $8,646
Ending Fund Balance
Bond Redemption $93,083Capital Projects $0
Other Fund Data
Agricultural $3.19Non-Ag Z $4.19Owner Occupied $5.13Other Non-Ag/Utilities $11.00Special Education $1.40
Bond Redemption $1.69Pension Fund $0.30
Capital Outlay $3.00
2005 Payable 2006 Levy per Thousand
$918,962$98,355
$147,347
General AidSpecial EducationExtraordinary Cost Fund - SE
$1,164,664Total State Aid
State Aid
Special Education Federal Flowthrough
$35,912IDEA Part BPart B, Sec. 619, PK $1,563
$37,475Total
K-12 Instruction $697,387PK Instruction $0Adult Instruction $0
$286,246$8,751
$0
General Special Education
Expenditures
Community Services $0Non-Programmed $0Debt Service $0Co-Curricular $69,010
$0$0$0$0
Total Expenditures $1,237,379 $376,102
2005 Payable 2006Taxable Valuations
Agricultural $41,408,522Owner Occupied $12,087,427Non-Ag Z $942,924Other Non-Ag/Utilities $2,468,877Total $56,907,750
$28,45010.9
10.5%18.4
$28,825Average Teacher SalaryExperience Adjusted SalaryAvg Years of Experience% with Advanced DegreesCertified Instructional Staff
Teaching Staff Data
ADM of Tuitioned Out Paid 0.398
General State Aid Adj. ADM 276.158Non-Public / Home Sch ADM 0.000
ADM Data
Local $272,383County $14,854State $944,641Federal $62,538Total $1,294,415
$188,025$0$0
$8,194
$79,382$0
$245,702$35,469
General Capital Outlay Special Education Pension
$196,219 $360,553 $16,698
Revenue
Classroom Staff 1.0
ADM of Contracted Out Paid 0.000
Other Special Revenue $0
515 Main Ave, Florence, SD 57235-0066
2005-2006 Profile of Florence School District 14-1
Capital Outlay Pension
Student/Staff ServicesAdministration ServicesTransportation ServicesOther Support Services
Enterprise Funds
Cost per ADM
General Fund Only
Revenue Expenditures
* Includes General, Special Education and Pension Funds
Home County: CodingtonArea in Square Miles: 140
2005 K-12 Fall Enrollment: 240
$16,698$0$0$0
$0$0
$15,800$0$0
$48,908$115,944
$85,933$220,195
$4,809$1,289
$0$28,566
$0$0$0
$7,209
$81,105$0$0$0
$0$0$0$0$0$0$0$0
$5,249Educational Funds* $6,521
$98,558$0$0
$77,995 $81,916
$175,061 $15,800
$133,187

December 2005 Federal Child Count
0Deaf-Blind
09
0
DeafSpeech/Language
Autism
6Emotionally Disturbed00
31500
Mental RetardationHearing ImpairedLearning DisabledMultiple DisabilitiesOrthopedic ImpairmentVisually Impaired
0
00
Other Health Impaired
Traumatic Brain InjuryDevelopmental Delay
51Total
0
0
00
00
21
27
3
0
0
0
Home
Early Childhood Setting
PT Early Child and SEEarly Childhood SE Setting
Separate SchoolResidential Facility
Regular Classroom
Resource Room
Self-Contained Classroom
Day Program
24 Hour Program
Home/Hospital Program
Special Education Placement Categories
Total 51
Student to Staff Ratio 12.4
K-8 147.8029-12 78.806
151.89382.942
ADA ADM
Total 226.608 234.835
Student Data
PK-12 Enrollment 241Open Enrolled Students Rec'd 67District Dropout Rate 3.6%
% Special Needs Students 21.2%% Eligible for Free/Red. Lunch 26.6%
Students Transported 137
District Attendance RateNumber of Graduates
96.5%23
Enrollment
Stanford Achievement Test Series, Tenth Edition (SAT10)
74
76
70
45
65
67
Math
Social Science
Language Arts
Reading
Complete Battery
Science
Stanford Writing Assessment Program, Third Edition
Grade 5
Grade 9
American College Test (ACT)
Grade 5Total
PRSpEd
PR
Number Tested
English
14
100%
Total PR
Sp Ed PR
73
66
54
59
62
63
73
58
54
52
66
61
82%
Grade 4 Grade 3Total
PRSp Ed
PR
Grade 6Total
PRSp Ed
PR
15 17 214 4 3
Sp EdTotal
Number Tested
Grade 7Total
PRSp Ed
PR
Grade 8 Total
PRSp Ed
PR
Grade 11Total
PRSp Ed
PR
MathReadingScienceComposite Score
20.422.621.4
20.821.4
85
73
84
59
70
71
14 6
71
44
69
54
56
60
73
70
58
59
52
62
61
40
47
44
49
49
216 311 523
Percent Proficient or Higher
No assessment data are reported when less than ten students were tested.
Ideas and Development
Sp EdTotal
Organization, Unity, and Coherence
Sp EdTotal
Word Choice
Sp EdTotal
Sentences and Paragraphs
Sp EdTotal
Grammer and Usage
Sp EdTotal
Writing Mechanics
Sp EdTotal
NumberTested
71% 41% 59%
82%
47%
55%
41%
64%
12%
82%
17
11 1

General $467,769Capital Outlay $148,211
Pension $98,773Special Education $255,854
Ending Fund Balance
Bond Redemption $0Capital Projects $0
Other Fund Data
Agricultural $4.44Non-Ag Z $5.83Owner Occupied $7.14Other Non-Ag/Utilities $15.31Special Education $1.25
Bond Redemption $0.00Pension Fund $0.30
Capital Outlay $2.50
2005 Payable 2006 Levy per Thousand
$689,503$0$0
General AidSpecial EducationExtraordinary Cost Fund - SE
$689,503Total State Aid
State Aid
Special Education Federal Flowthrough
$41,416IDEA Part BPart B, Sec. 619, PK $2,053
$43,469Total
K-12 Instruction $749,601PK Instruction $0Adult Instruction $0
$0$10,502
$0
General Special Education
Expenditures
Community Services $14,389Non-Programmed $0Debt Service $0Co-Curricular $54,820
$0$0$0$0
Total Expenditures $1,422,109 $133,461
2005 Payable 2006Taxable Valuations
Agricultural $87,041,096Owner Occupied $10,573,146Non-Ag Z $1,863,391Other Non-Ag/Utilities $4,402,462Total $103,880,095
$31,18412.7
11.1%16.5
$29,853Average Teacher SalaryExperience Adjusted SalaryAvg Years of Experience% with Advanced DegreesCertified Instructional Staff
Teaching Staff Data
ADM of Tuitioned Out Paid 0.006
General State Aid Adj. ADM 255.182Non-Public / Home Sch ADM 0.000
ADM Data
Local $598,458County $17,683State $713,668Federal $203,897Total $1,533,706
$312,820$0$0$0
$143,008$0$0
$46,085
General Capital Outlay Special Education Pension
$312,820 $189,092 $34,227
Revenue
Classroom Staff 1.0
ADM of Contracted Out Paid 0.000
Other Special Revenue $0
202 E Main St, Frederick, SD 57441
2005-2006 Profile of Frederick Area School District 06-2
Capital Outlay Pension
Student/Staff ServicesAdministration ServicesTransportation ServicesOther Support Services
Enterprise Funds
Cost per ADM
General Fund Only
Revenue Expenditures
* Includes General, Special Education and Pension Funds
Home County: BrownArea in Square Miles: 351
2005 K-12 Fall Enrollment: 215
$34,227$0$0$0
$0$0
$34,841$0$0
$127,932$152,915$142,933$179,520
$0$1,036
$25,219$246,491
$0$0
$89,563$0
$26,755$96,205
$0$0
$0$0$0$0$0
$26,848$0$0
$6,557Educational Funds* $7,375
$0$0$0
$78,793 $77,948
*District has opted out of General Fund levy
$408,624 $61,689
$46,315

December 2005 Federal Child Count
0Deaf-Blind
010
1
DeafSpeech/Language
Autism
0Emotionally Disturbed40
11100
Mental RetardationHearing ImpairedLearning DisabledMultiple DisabilitiesOrthopedic ImpairmentVisually Impaired
1
03
Other Health Impaired
Traumatic Brain InjuryDevelopmental Delay
31Total
2
0
30
00
23
3
0
0
0
0
Home
Early Childhood Setting
PT Early Child and SEEarly Childhood SE Setting
Separate SchoolResidential Facility
Regular Classroom
Resource Room
Self-Contained Classroom
Day Program
24 Hour Program
Home/Hospital Program
Special Education Placement Categories
Total 31
Student to Staff Ratio 12.5
K-8 142.0839-12 66.396
145.65768.351
ADA ADM
Total 208.479 214.008
Student Data
PK-12 Enrollment 219Open Enrolled Students Rec'd 18District Dropout Rate 0.0%
% Special Needs Students 14.2%% Eligible for Free/Red. Lunch 34.5%
Students Transported 165
District Attendance RateNumber of Graduates
97.4%15
Enrollment
Stanford Achievement Test Series, Tenth Edition (SAT10)
85
84
79
76
80
80
Math
Social Science
Language Arts
Reading
Complete Battery
Science
Stanford Writing Assessment Program, Third Edition
Grade 5
Grade 9
American College Test (ACT)
Grade 5Total
PRSpEd
PR
Number Tested
English
12
56%
Total PR
Sp Ed PR
65
63
59
39
45
54
65
69
56
48
61
59
50%
Grade 4 Grade 3Total
PRSp Ed
PR
Grade 6Total
PRSp Ed
PR
21 13 194 1 3
Sp EdTotal
Number Tested
Grade 7Total
PRSp Ed
PR
Grade 8 Total
PRSp Ed
PR
Grade 11Total
PRSp Ed
PR
MathReadingScienceComposite Score
22.722.523.0
22.923.0
92
85
89
85
83
85
10 2
97
89
93
85
84
90
78
71
70
69
58
69
85
76
61
78
67
74
212 220 121
Percent Proficient or Higher
No assessment data are reported when less than ten students were tested.
Ideas and Development
Sp EdTotal
Organization, Unity, and Coherence
Sp EdTotal
Word Choice
Sp EdTotal
Sentences and Paragraphs
Sp EdTotal
Grammer and Usage
Sp EdTotal
Writing Mechanics
Sp EdTotal
NumberTested
92% 67% 75%
50%
50%
63%
42%
75%
58%
81%
12
16

General $665,279Capital Outlay $300,254
Pension $105,268Special Education ($9,058)
Ending Fund Balance
Bond Redemption $0Capital Projects $0
Other Fund Data
Agricultural $4.20Non-Ag Z $5.52Owner Occupied $6.75Other Non-Ag/Utilities $14.48Special Education $1.40
Bond Redemption $0.00Pension Fund $0.30
Capital Outlay $2.70
2005 Payable 2006 Levy per Thousand
$1,050,137$95,729
$283,680
General AidSpecial EducationExtraordinary Cost Fund - SE
$1,429,546Total State Aid
State Aid
Special Education Federal Flowthrough
$102,959IDEA Part BPart B, Sec. 619, PK $8,042
$111,001Total
K-12 Instruction $1,424,764PK Instruction $0Adult Instruction $0
$436,836$43,454
$0
General Special Education
Expenditures
Community Services $0Non-Programmed $0Debt Service $0Co-Curricular $122,719
$0$0$0$0
Total Expenditures $2,525,836 $725,664
2005 Payable 2006Taxable Valuations
Agricultural $137,814,467Owner Occupied $35,195,030Non-Ag Z $305,530Other Non-Ag/Utilities $15,458,662Total $188,773,689
$30,57115.3
8.6%32.6
$29,971Average Teacher SalaryExperience Adjusted SalaryAvg Years of Experience% with Advanced DegreesCertified Instructional Staff
Teaching Staff Data
ADM of Tuitioned Out Paid 4.000
General State Aid Adj. ADM 411.419Non-Public / Home Sch ADM 87.449
ADM Data
Local $1,172,172County $12,488State $1,118,702Federal $217,761Total $2,521,124
$492,840$0$0$0
$256,591$0
$379,409$123,542
General Capital Outlay Special Education Pension
$492,840 $759,542 $56,482
Revenue
Classroom Staff 0.0
ADM of Contracted Out Paid 0.000
Other Special Revenue $0
1001 S Wipf St, Freeman, SD 57029-0220
2005-2006 Profile of Freeman School District 33-1
Capital Outlay Pension
Student/Staff ServicesAdministration ServicesTransportation ServicesOther Support Services
Enterprise Funds
Cost per ADM
General Fund Only
Revenue Expenditures
* Includes General, Special Education and Pension Funds
Home County: HutchinsonArea in Square Miles: 239
2005 K-12 Fall Enrollment: 378
$56,482$0$0$0
$0$0
$0$0$0
$105,061$303,281$102,227$467,784
($200)$0
$158,794$329,259
$0$0
$102,232$0
$220,984$10,109$7,125$7,156
$0$0$0$0$0
$8,465$0$0
$6,671Educational Funds* $8,015
$0$0$0
$150,669 $183,653
*District has opted out of General Fund levy
$718,405 $8,465
$128,319

December 2005 Federal Child Count
0Deaf-Blind
041
7
DeafSpeech/Language
Autism
1Emotionally Disturbed11
19300
Mental RetardationHearing ImpairedLearning DisabledMultiple DisabilitiesOrthopedic ImpairmentVisually Impaired
8
00
Other Health Impaired
Traumatic Brain InjuryDevelopmental Delay
81Total
0
3
016
00
43
14
1
2
2
0
Home
Early Childhood Setting
PT Early Child and SEEarly Childhood SE Setting
Separate SchoolResidential Facility
Regular Classroom
Resource Room
Self-Contained Classroom
Day Program
24 Hour Program
Home/Hospital Program
Special Education Placement Categories
Total 81
Student to Staff Ratio 11.6
K-8 264.9859-12 98.447
274.397102.287
ADA ADM
Total 363.432 376.684
Student Data
PK-12 Enrollment 378Open Enrolled Students Rec'd 5District Dropout Rate 0.0%
% Special Needs Students 21.4%% Eligible for Free/Red. Lunch 15.0%
Students Transported 221
District Attendance RateNumber of Graduates
96.5%27
Enrollment
Stanford Achievement Test Series, Tenth Edition (SAT10)
79
78
74
60
69
71
Math
Social Science
Language Arts
Reading
Complete Battery
Science
Stanford Writing Assessment Program, Third Edition
Grade 5
Grade 9
American College Test (ACT)
Grade 5Total
PRSpEd
PR
Number Tested
English
18
95%
Total PR
Sp Ed PR
72
72
67
70
66
69
77
71
61
53
66
65
84%
Grade 4 Grade 3Total
PRSp Ed
PR
Grade 6Total
PRSp Ed
PR
35 33 314 4 2
Sp EdTotal
Number Tested
Grade 7Total
PRSp Ed
PR
Grade 8 Total
PRSp Ed
PR
Grade 11Total
PRSp Ed
PR
MathReadingScienceComposite Score
23.721.321.9
22.822.6
74
69
75
71
76
72
36 9
76
80
85
71
73
76
59
66
68
74
69
66
76
76
73
78
76
74
134 321 726
Percent Proficient or Higher
No assessment data are reported when less than ten students were tested.
Ideas and Development
Sp EdTotal
Organization, Unity, and Coherence
Sp EdTotal
Word Choice
Sp EdTotal
Sentences and Paragraphs
Sp EdTotal
Grammer and Usage
Sp EdTotal
Writing Mechanics
Sp EdTotal
NumberTested
54% 49% 54%
79%
35%
79%
41%
74%
35%
95%
37
19

General $240,074Capital Outlay $398,240
Pension $124,527Special Education $97,855
Ending Fund Balance
Bond Redemption $191,601Capital Projects $0
Other Fund Data
Agricultural $3.19Non-Ag Z $4.19Owner Occupied $5.13Other Non-Ag/Utilities $11.00Special Education $1.40
Bond Redemption $1.35Pension Fund $0.30
Capital Outlay $3.00
2005 Payable 2006 Levy per Thousand
$1,390,438$94,452
$0
General AidSpecial EducationExtraordinary Cost Fund - SE
$1,484,890Total State Aid
State Aid
Special Education Federal Flowthrough
$75,678IDEA Part BPart B, Sec. 619, PK $3,163
$78,841Total
K-12 Instruction $1,464,117PK Instruction $0Adult Instruction $0
$149,743$55,195
$0
General Special Education
Expenditures
Community Services $0Non-Programmed $0Debt Service $0Co-Curricular $114,190
$0$0$0$0
Total Expenditures $2,725,455 $343,199
2005 Payable 2006Taxable Valuations
Agricultural $67,787,929Owner Occupied $64,399,728Non-Ag Z $491,647Other Non-Ag/Utilities $19,527,000Total $152,206,304
$32,18812.6
13.5%36.1
$30,744Average Teacher SalaryExperience Adjusted SalaryAvg Years of Experience% with Advanced DegreesCertified Instructional Staff
Teaching Staff Data
ADM of Tuitioned Out Paid 4.795
General State Aid Adj. ADM 510.080Non-Public / Home Sch ADM 0.862
ADM Data
Local $1,031,994County $24,136State $1,556,524Federal $59,568Total $2,672,222
$451,533$0$0$0
$220,263$0
$94,452$93,286
General Capital Outlay Special Education Pension
$451,533 $408,001 $45,785
Revenue
Classroom Staff 0.0
ADM of Contracted Out Paid 0.000
Other Special Revenue $0
505 2nd Street, Garretson, SD 57030
2005-2006 Profile of Garretson School District 49-4
Capital Outlay Pension
Student/Staff ServicesAdministration ServicesTransportation ServicesOther Support Services
Enterprise Funds
Cost per ADM
General Fund Only
Revenue Expenditures
* Includes General, Special Education and Pension Funds
Home County: MinnehahaArea in Square Miles: 88
2005 K-12 Fall Enrollment: 518
$45,785$0$0$0
$0$0
$20,000$0$0
$134,314$329,919$132,091$550,824
$0$0$0
$1,148,559$0$0
$293,762$10,252
$110,768$9,727$3,139
$14,627
$0$0$0$0$0$0$0$0
$5,176Educational Funds* $5,743
$208,575$0$0
$263,651 $250,872
$1,524,620 $20,000
$72,047

December 2005 Federal Child Count
0Deaf-Blind
022
4
DeafSpeech/Language
Autism
1Emotionally Disturbed40
18000
Mental RetardationHearing ImpairedLearning DisabledMultiple DisabilitiesOrthopedic ImpairmentVisually Impaired
10
07
Other Health Impaired
Traumatic Brain InjuryDevelopmental Delay
66Total
0
12
21
00
50
0
1
0
0
0
Home
Early Childhood Setting
PT Early Child and SEEarly Childhood SE Setting
Separate SchoolResidential Facility
Regular Classroom
Resource Room
Self-Contained Classroom
Day Program
24 Hour Program
Home/Hospital Program
Special Education Placement Categories
Total 66
Student to Staff Ratio 14.9
K-8 353.9129-12 150.942
364.938157.816
ADA ADM
Total 504.854 522.754
Student Data
PK-12 Enrollment 538Open Enrolled Students Rec'd 14District Dropout Rate 1.2%
% Special Needs Students 12.3%% Eligible for Free/Red. Lunch 12.8%
Students Transported 149
District Attendance RateNumber of Graduates
96.6%33
Enrollment
Stanford Achievement Test Series, Tenth Edition (SAT10)
82
79
77
54
64
70
Math
Social Science
Language Arts
Reading
Complete Battery
Science
Stanford Writing Assessment Program, Third Edition
Grade 5
Grade 9
American College Test (ACT)
Grade 5Total
PRSpEd
PR
Number Tested
English
25
62%
Total PR
Sp Ed PR
72
74
70
69
71
69
77
78
66
55
77
70
79%
Grade 4 Grade 3Total
PRSp Ed
PR
Grade 6Total
PRSp Ed
PR
39 45 464 3 1
Sp EdTotal
Number Tested
Grade 7Total
PRSp Ed
PR
Grade 8 Total
PRSp Ed
PR
Grade 11Total
PRSp Ed
PR
MathReadingScienceComposite Score
23.021.621.3
22.722.3
90
83
75
73
72
78
33 4
71
66
68
55
58
63
74
73
66
60
66
64
79
74
71
76
70
73
348 339 235
Percent Proficient or Higher
No assessment data are reported when less than ten students were tested.
Ideas and Development
Sp EdTotal
Organization, Unity, and Coherence
Sp EdTotal
Word Choice
Sp EdTotal
Sentences and Paragraphs
Sp EdTotal
Grammer and Usage
Sp EdTotal
Writing Mechanics
Sp EdTotal
NumberTested
54% 44% 52%
79%
38%
71%
52%
76%
42%
76%
48
34

General $588,785Capital Outlay $276,408
PensionSpecial Education $19,837
Ending Fund Balance
Bond Redemption $235,818Capital Projects $0
Other Fund Data
Agricultural $3.19Non-Ag Z $4.19Owner Occupied $5.13Other Non-Ag/Utilities $11.00Special Education $1.40
Bond Redemption $3.62Pension Fund $0.00
Capital Outlay $2.50
2005 Payable 2006 Levy per Thousand
$903,899$66,547$65,682
General AidSpecial EducationExtraordinary Cost Fund - SE
$1,036,128Total State Aid
State Aid
Special Education Federal Flowthrough
$53,848IDEA Part BPart B, Sec. 619, PK $5,967
$59,815Total
K-12 Instruction $964,913PK Instruction $0Adult Instruction $0
$201,487$22,250
$0
General Special Education
Expenditures
Community Services $0Non-Programmed $0Debt Service $0Co-Curricular $75,140
$0$0$0$0
Total Expenditures $1,516,091 $273,501
2005 Payable 2006Taxable Valuations
Agricultural $45,472,016Owner Occupied $16,007,750Non-Ag Z $568,543Other Non-Ag/Utilities $5,660,438Total $67,708,747
$30,6156.9
12.0%22.9
$26,307Average Teacher SalaryExperience Adjusted SalaryAvg Years of Experience% with Advanced DegreesCertified Instructional Staff
Teaching Staff Data
ADM of Tuitioned Out Paid 0.893
General State Aid Adj. ADM 291.087Non-Public / Home Sch ADM 1.930
ADM Data
Local $375,589County $23,395State $931,742Federal $224,518Total $1,555,244
$173,374$0$0$0
$95,781$0
$132,229$56,534
General Capital Outlay Special Education Pension
$173,374 $284,544 $0
Revenue
Classroom Staff 0.0
ADM of Contracted Out Paid 0.000
Other Special Revenue $0
100 Kingsbury, Gayville, SD 57031
2005-2006 Profile of Gayville-Volin School District 63-1
Capital Outlay Pension
Student/Staff ServicesAdministration ServicesTransportation ServicesOther Support Services
Enterprise Funds
Cost per ADM
General Fund Only
Revenue Expenditures
* Includes General, Special Education and Pension Funds
Home County: YanktonArea in Square Miles: 72
2005 K-12 Fall Enrollment: 270
$0$0$0$0
$0$0
$0$0$0
$55,860$158,984
$54,049$207,145
$0$0
$36,500$53,687
$0$0
$63,498$7,190
$47,351$0
$2,413$0
$0$0$0$0$0$0$0$0
$6,045Educational Funds* $6,714
$247,687$0$0
$93,095 $93,464
$213,501 $0
$52,627

December 2005 Federal Child Count
0Deaf-Blind
014
1
DeafSpeech/Language
Autism
4Emotionally Disturbed31
26000
Mental RetardationHearing ImpairedLearning DisabledMultiple DisabilitiesOrthopedic ImpairmentVisually Impaired
2
04
Other Health Impaired
Traumatic Brain InjuryDevelopmental Delay
55Total
0
0
010
00
42
2
0
0
1
0
Home
Early Childhood Setting
PT Early Child and SEEarly Childhood SE Setting
Separate SchoolResidential Facility
Regular Classroom
Resource Room
Self-Contained Classroom
Day Program
24 Hour Program
Home/Hospital Program
Special Education Placement Categories
Total 55
Student to Staff Ratio 11.9
K-8 167.3579-12 72.288
172.47877.461
ADA ADM
Total 239.645 249.939
Student Data
PK-12 Enrollment 273Open Enrolled Students Rec'd 44District Dropout Rate 2.3%
% Special Needs Students 20.1%% Eligible for Free/Red. Lunch 38.4%
Students Transported 171
District Attendance RateNumber of Graduates
95.9%21
Enrollment
Stanford Achievement Test Series, Tenth Edition (SAT10)
71
76
74
59
57
65
Math
Social Science
Language Arts
Reading
Complete Battery
Science
Stanford Writing Assessment Program, Third Edition
Grade 5
Grade 9
American College Test (ACT)
Grade 5Total
PRSpEd
PR
Number Tested
English
16
62%
Total PR
Sp Ed PR
80
81
72
67
65
73
69
68
66
51
66
64
62%
Grade 4 Grade 3Total
PRSp Ed
PR
Grade 6Total
PRSp Ed
PR
25 12 224 2 1
Sp EdTotal
Number Tested
Grade 7Total
PRSp Ed
PR
Grade 8 Total
PRSp Ed
PR
Grade 11Total
PRSp Ed
PR
MathReadingScienceComposite Score
18.918.918.0
20.019.1
60
72
72
50
56
60
18 5
46
56
55
46
43
48
85
77
82
70
73
78
57
61
50
48
45
51
514 319 825
Percent Proficient or Higher
No assessment data are reported when less than ten students were tested.
Ideas and Development
Sp EdTotal
Organization, Unity, and Coherence
Sp EdTotal
Word Choice
Sp EdTotal
Sentences and Paragraphs
Sp EdTotal
Grammer and Usage
Sp EdTotal
Writing Mechanics
Sp EdTotal
NumberTested
21% 36% 21%
57%
41%
43%
43%
48%
36%
57%
14
21

General $539,203Capital Outlay $490,408
Pension $37,485Special Education $156,841
Ending Fund Balance
Bond Redemption $0Capital Projects $0
Other Fund Data
Agricultural $5.04Non-Ag Z $6.62Owner Occupied $8.11Other Non-Ag/Utilities $17.38Special Education $1.40
Bond Redemption $0.00Pension Fund $0.30
Capital Outlay $2.75
2005 Payable 2006 Levy per Thousand
$175,436$0$0
General AidSpecial EducationExtraordinary Cost Fund - SE
$175,436Total State Aid
State Aid
Special Education Federal Flowthrough
$16,666IDEA Part BPart B, Sec. 619, PK $1,512
$18,178Total
K-12 Instruction $539,040PK Instruction $0Adult Instruction $0
$22,311$10,559
$0
General Special Education
Expenditures
Community Services $8,113Non-Programmed $0Debt Service $0Co-Curricular $36,351
$0$0$0$0
Total Expenditures $790,499 $63,258
2005 Payable 2006Taxable Valuations
Agricultural $63,298,395Owner Occupied $5,220,747Non-Ag Z $206,085Other Non-Ag/Utilities $2,780,989Total $71,506,216
$33,80410.4
7.1%11.8
$29,772Average Teacher SalaryExperience Adjusted SalaryAvg Years of Experience% with Advanced DegreesCertified Instructional Staff
Teaching Staff Data
ADM of Tuitioned Out Paid 0.000
General State Aid Adj. ADM 98.072Non-Public / Home Sch ADM 3.000
ADM Data
Local $475,511County $7,030State $194,907Federal $71,431Total $748,880
$184,819$0$0$0
$94,187$0$0
$16,654
General Capital Outlay Special Education Pension
$184,819 $110,841 $20,159
Revenue
Classroom Staff 0.0
ADM of Contracted Out Paid 0.000
Other Special Revenue $0
400 Fourth Street, Geddes, SD 57342
2005-2006 Profile of Geddes Community School District 11-2
Capital Outlay Pension
Student/Staff ServicesAdministration ServicesTransportation ServicesOther Support Services
Enterprise Funds
Cost per ADM
General Fund Only
Revenue Expenditures
* Includes General, Special Education and Pension Funds
Home County: Charles MixArea in Square Miles: 174
2005 K-12 Fall Enrollment: 85
$20,159$0$0$0
$0$0
$0$0$0
$18,454$53,168$17,961
$117,412
$0$0
$25,742$62,608
$0$0$0
$1,456
$30,388$0$0$0
$0$0$0$0$0$0$0$0
$9,573Educational Funds* $10,218
$0$0
$36,642$30,436 $45,227
*District has opted out of General Fund levy
$98,543 $0
$8,737

December 2005 Federal Child Count
0Deaf-Blind
01
0
DeafSpeech/Language
Autism
0Emotionally Disturbed000100
Mental RetardationHearing ImpairedLearning DisabledMultiple DisabilitiesOrthopedic ImpairmentVisually Impaired
0
02
Other Health Impaired
Traumatic Brain InjuryDevelopmental Delay
4Total
0
0
20
00
2
0
0
0
0
0
Home
Early Childhood Setting
PT Early Child and SEEarly Childhood SE Setting
Separate SchoolResidential Facility
Regular Classroom
Resource Room
Self-Contained Classroom
Day Program
24 Hour Program
Home/Hospital Program
Special Education Placement Categories
Total 4
Student to Staff Ratio 7.9
K-8 46.5559-12 32.979
47.47434.188
ADA ADM
Total 79.534 81.662
Student Data
PK-12 Enrollment 94Open Enrolled Students Rec'd 0District Dropout Rate 0.0%
% Special Needs Students 4.3%% Eligible for Free/Red. Lunch 45.1%
Students Transported 33
District Attendance RateNumber of Graduates
97.4%11
Enrollment
Stanford Achievement Test Series, Tenth Edition (SAT10)
85
80
59
34
83
75
Math
Social Science
Language Arts
Reading
Complete Battery
Science
Stanford Writing Assessment Program, Third Edition
Grade 5
Grade 9
American College Test (ACT)
Grade 5Total
PRSpEd
PR
Number Tested
English
9
63%
Total PR
Sp Ed PR
77
82
84
79
80
79
61
54
61
41
71
59
63%
Grade 4 Grade 3Total
PRSp Ed
PR
Grade 6Total
PRSp Ed
PR
7 5 10
Sp EdTotal
Number Tested
Grade 7Total
PRSp Ed
PR
Grade 8 Total
PRSp Ed
PR
Grade 11Total
PRSp Ed
PR
MathReadingScienceComposite Score
88
75
87
83
93
86
5 1
76
58
57
60
61
64
78
73
79
62
69
73
78
56
68
73
57
66
15 8 17
Percent Proficient or Higher
No assessment data are reported when less than ten students were tested.
Ideas and Development
Sp EdTotal
Organization, Unity, and Coherence
Sp EdTotal
Word Choice
Sp EdTotal
Sentences and Paragraphs
Sp EdTotal
Grammer and Usage
Sp EdTotal
Writing Mechanics
Sp EdTotal
NumberTested
60% 60% 60%
63%
40%
63%
60%
50%
60%
88%
5
8

General $646,861Capital Outlay $229,272
Pension $17,593Special Education $366,145
Ending Fund Balance
Bond Redemption $0Capital Projects $0
Other Fund Data
Agricultural $3.19Non-Ag Z $4.19Owner Occupied $5.13Other Non-Ag/Utilities $11.00Special Education $1.05
Bond Redemption $0.00Pension Fund $0.30
Capital Outlay $1.30
2005 Payable 2006 Levy per Thousand
$951,083$0$0
General AidSpecial EducationExtraordinary Cost Fund - SE
$951,083Total State Aid
State Aid
Special Education Federal Flowthrough
$45,486IDEA Part BPart B, Sec. 619, PK $3,065
$48,551Total
K-12 Instruction $922,004PK Instruction $0Adult Instruction $0
$86,126$7,912
$0
General Special Education
Expenditures
Community Services $0Non-Programmed $1,035Debt Service $0Co-Curricular $126,981
$0$0$0$0
Total Expenditures $1,773,316 $135,866
2005 Payable 2006Taxable Valuations
Agricultural $74,746,236Owner Occupied $18,866,203Non-Ag Z $3,427,118Other Non-Ag/Utilities $12,890,062Total $109,929,619
$27,88620.1
0.0%23.6
$29,257Average Teacher SalaryExperience Adjusted SalaryAvg Years of Experience% with Advanced DegreesCertified Instructional Staff
Teaching Staff Data
ADM of Tuitioned Out Paid 0.103
General State Aid Adj. ADM 332.201Non-Public / Home Sch ADM 8.000
ADM Data
Local $614,221County $33,861State $1,001,790Federal $113,893Total $1,763,764
$143,121$0$0$0
$136,398$0$0
$57,051
General Capital Outlay Special Education Pension
$143,121 $193,450 $17,593
Revenue
Classroom Staff 0.0
ADM of Contracted Out Paid 0.000
Other Special Revenue $0
100 E King Ave, Gettysburg, SD 57442
2005-2006 Profile of Gettysburg School District 53-1
Capital Outlay Pension
Student/Staff ServicesAdministration ServicesTransportation ServicesOther Support Services
Enterprise Funds
Cost per ADM
General Fund Only
Revenue Expenditures
* Includes General, Special Education and Pension Funds
Home County: PotterArea in Square Miles: 222
2005 K-12 Fall Enrollment: 296
$17,593$0$0$0
$0$0
$0$0$0
$156,179$223,068
$40,794$303,254
$7,921$3,431
$40,775$107,528
$0$0$0$0
$36,359$0
$1,554$3,915
$0$0$0$0$0$0$0$0
$6,012Educational Funds* $6,438
$0$0$0
$87,266 $91,686
$183,279 $0
$23,624

December 2005 Federal Child Count
0Deaf-Blind
07
0
DeafSpeech/Language
Autism
4Emotionally Disturbed00
10010
Mental RetardationHearing ImpairedLearning DisabledMultiple DisabilitiesOrthopedic ImpairmentVisually Impaired
7
00
Other Health Impaired
Traumatic Brain InjuryDevelopmental Delay
29Total
0
0
00
00
27
2
0
0
0
0
Home
Early Childhood Setting
PT Early Child and SEEarly Childhood SE Setting
Separate SchoolResidential Facility
Regular Classroom
Resource Room
Self-Contained Classroom
Day Program
24 Hour Program
Home/Hospital Program
Special Education Placement Categories
Total 29
Student to Staff Ratio 12.6
K-8 174.6029-12 108.439
180.345113.702
ADA ADM
Total 283.041 294.047
Student Data
PK-12 Enrollment 296Open Enrolled Students Rec'd 38District Dropout Rate 1.2%
% Special Needs Students 9.8%% Eligible for Free/Red. Lunch 17.2%
Students Transported 26
District Attendance RateNumber of Graduates
96.3%26
Enrollment
Stanford Achievement Test Series, Tenth Edition (SAT10)
85
82
84
63
81
80
Math
Social Science
Language Arts
Reading
Complete Battery
Science
Stanford Writing Assessment Program, Third Edition
Grade 5
Grade 9
American College Test (ACT)
Grade 5Total
PRSpEd
PR
Number Tested
English
22
86%
Total PR
Sp Ed PR
71
66
63
64
65
64
85
77
62
58
73
71
83%
Grade 4 Grade 3Total
PRSp Ed
PR
Grade 6Total
PRSp Ed
PR
18 22 261 4
Sp EdTotal
Number Tested
Grade 7Total
PRSp Ed
PR
Grade 8 Total
PRSp Ed
PR
Grade 11Total
PRSp Ed
PR
MathReadingScienceComposite Score
21.021.020.5
21.121.0
61
75
76
45
61
60
26 5
81
87
93
62
74
80
89
86
81
67
83
82
82
85
79
72
73
77
321 218 224
Percent Proficient or Higher
No assessment data are reported when less than ten students were tested.
Ideas and Development
Sp EdTotal
Organization, Unity, and Coherence
Sp EdTotal
Word Choice
Sp EdTotal
Sentences and Paragraphs
Sp EdTotal
Grammer and Usage
Sp EdTotal
Writing Mechanics
Sp EdTotal
NumberTested
52% 71% 67%
83%
73%
72%
71%
79%
52%
83%
21
29

General $194,768Capital Outlay ($57,471)
Pension ($352)Special Education $26,922
Ending Fund Balance
Bond Redemption $0Capital Projects $0
Other Fund Data
Agricultural $4.11Non-Ag Z $5.40Owner Occupied $6.61Other Non-Ag/Utilities $14.17Special Education $1.40
Bond Redemption $0.00Pension Fund $0.30
Capital Outlay $3.00
2005 Payable 2006 Levy per Thousand
$637,850$31,587
$0
General AidSpecial EducationExtraordinary Cost Fund - SE
$669,437Total State Aid
State Aid
Special Education Federal Flowthrough
$47,692IDEA Part BPart B, Sec. 619, PK $595
$48,287Total
K-12 Instruction $653,549PK Instruction $43,294Adult Instruction $0
$77,851$8,989
$0
General Special Education
Expenditures
Community Services $0Non-Programmed $0Debt Service $0Co-Curricular $72,270
$0$0$0$0
Total Expenditures $1,412,787 $263,875
2005 Payable 2006Taxable Valuations
Agricultural $83,633,373Owner Occupied $8,105,223Non-Ag Z $751,945Other Non-Ag/Utilities $3,409,928Total $95,900,469
$31,60615.4
11.1%15.7
$31,991Average Teacher SalaryExperience Adjusted SalaryAvg Years of Experience% with Advanced DegreesCertified Instructional Staff
Teaching Staff Data
ADM of Tuitioned Out Paid 0.000
General State Aid Adj. ADM 212.137Non-Public / Home Sch ADM 20.050
ADM Data
Local $628,633County $12,977State $665,562Federal $89,390Total $1,396,562
$292,674$0
$11,735$0
$169,894$0
$31,587$44,672
General Capital Outlay Special Education Pension
$304,409 $246,152 $29,744
Revenue
Classroom Staff 1.0
ADM of Contracted Out Paid 0.000
Other Special Revenue $0
16370 482nd Ave, Revillo, SD 57259
2005-2006 Profile of Grant-Deuel School District 25-3
Capital Outlay Pension
Student/Staff ServicesAdministration ServicesTransportation ServicesOther Support Services
Enterprise Funds
Cost per ADM
General Fund Only
Revenue Expenditures
* Includes General, Special Education and Pension Funds
Home County: GrantArea in Square Miles: 257
2005 K-12 Fall Enrollment: 203
$29,744$0$0$0
$0$0
$27,313$1,980
$0$74,489
$182,714$129,416$257,055
$5,200$0
$21,000$141,938
$0$0
$43,031$0
$63,494$0$0
$113,542
$451$0$0$0$0$0$0$0
$6,860Educational Funds* $8,278
$0$0$0
$128,432 $127,298
*District has opted out of General Fund levy
$256,432 $29,744
$45,263

December 2005 Federal Child Count
0Deaf-Blind
02
0
DeafSpeech/Language
Autism
1Emotionally Disturbed30
17110
Mental RetardationHearing ImpairedLearning DisabledMultiple DisabilitiesOrthopedic ImpairmentVisually Impaired
1
00
Other Health Impaired
Traumatic Brain InjuryDevelopmental Delay
26Total
0
0
01
00
19
4
2
0
0
0
Home
Early Childhood Setting
PT Early Child and SEEarly Childhood SE Setting
Separate SchoolResidential Facility
Regular Classroom
Resource Room
Self-Contained Classroom
Day Program
24 Hour Program
Home/Hospital Program
Special Education Placement Categories
Total 26
Student to Staff Ratio 12.7
K-8 128.3449-12 69.747
129.49569.781
ADA ADM
Total 198.091 199.276
Student Data
PK-12 Enrollment 213Open Enrolled Students Rec'd 8District Dropout Rate 0.0%
% Special Needs Students 12.2%% Eligible for Free/Red. Lunch 43.3%
Students Transported 202
District Attendance RateNumber of Graduates
99.4%17
Enrollment
Stanford Achievement Test Series, Tenth Edition (SAT10)
73
80
71
50
69
69
Math
Social Science
Language Arts
Reading
Complete Battery
Science
Stanford Writing Assessment Program, Third Edition
Grade 5
Grade 9
American College Test (ACT)
Grade 5Total
PRSpEd
PR
Number Tested
English
15
64%
Total PR
Sp Ed PR
63
60
66
59
56
60
74
77
77
69
79
75
43%
Grade 4 Grade 3Total
PRSp Ed
PR
Grade 6Total
PRSp Ed
PR
12 16 211 3 2
Sp EdTotal
Number Tested
Grade 7Total
PRSp Ed
PR
Grade 8 Total
PRSp Ed
PR
Grade 11Total
PRSp Ed
PR
MathReadingScienceComposite Score
20.420.120.1
20.520.4
74
69
64
69
64
68
13 4
82
74
76
68
66
72
66
62
58
62
62
64
45
58
54
47
53
45
215 520 519
Percent Proficient or Higher
No assessment data are reported when less than ten students were tested.
Ideas and Development
Sp EdTotal
Organization, Unity, and Coherence
Sp EdTotal
Word Choice
Sp EdTotal
Sentences and Paragraphs
Sp EdTotal
Grammer and Usage
Sp EdTotal
Writing Mechanics
Sp EdTotal
NumberTested
93% 86% 100%
43%
57%
71%
71%
64%
57%
79%
14
14

General $99,140Capital Outlay $52,706
PensionSpecial Education ($9)
Ending Fund Balance
Bond Redemption $0Capital Projects $0
Other Fund Data
Agricultural $3.19Non-Ag Z $4.19Owner Occupied $5.13Other Non-Ag/Utilities $11.00Special Education $0.01
Bond Redemption $0.00Pension Fund $0.00
Capital Outlay $0.22
2005 Payable 2006 Levy per Thousand
$137,093$6$0
General AidSpecial EducationExtraordinary Cost Fund - SE
$137,099Total State Aid
State Aid
Special Education Federal Flowthrough
$0IDEA Part BPart B, Sec. 619, PK $0
$0Total
K-12 Instruction $404,189PK Instruction $0Adult Instruction $0
$41,761$0$0
General Special Education
Expenditures
Community Services $0Non-Programmed $0Debt Service $0Co-Curricular $0
$0$0$0$0
Total Expenditures $409,590 $41,761
2005 Payable 2006Taxable Valuations
Agricultural $38,785,398Owner Occupied $5,965,779Non-Ag Z $87,045Other Non-Ag/Utilities $1,663,559Total $46,501,781
$00.0
0.0%0.0
$0Average Teacher SalaryExperience Adjusted SalaryAvg Years of Experience% with Advanced DegreesCertified Instructional Staff
Teaching Staff Data
ADM of Tuitioned Out Paid 0.000
General State Aid Adj. ADM 81.586Non-Public / Home Sch ADM 0.000
ADM Data
Local $193,665County $17,152State $143,685Federal $1,500Total $356,002
$12,964$0$0$0
$467$0$6$0
General Capital Outlay Special Education Pension
$12,964 $473 $0
Revenue
Classroom Staff 0.0
ADM of Contracted Out Paid 67.988
Other Special Revenue $0
850 Kerr Drive, Akron, IA 51001
2005-2006 Profile of Greater Hoyt School District 61-4
Capital Outlay Pension
Student/Staff ServicesAdministration ServicesTransportation ServicesOther Support Services
Enterprise Funds
Cost per ADM
General Fund Only
Revenue Expenditures
* Includes General, Special Education and Pension Funds
Home County: UnionArea in Square Miles: 49
2005 K-12 Fall Enrollment: 0
$0$0$0$0
$0$0
$0$0$0
$0$3,901
$0$1,500
$0$0$0$0$0$0$0$0
$0$0$0$0
$0$0$0$0$0$0$0$0
$0Educational Funds* $0
$0$0$0$0 $0
$7,727 $0
$7,727

December 2005 Federal Child Count
0Deaf-Blind
00
0
DeafSpeech/Language
Autism
0Emotionally Disturbed103100
Mental RetardationHearing ImpairedLearning DisabledMultiple DisabilitiesOrthopedic ImpairmentVisually Impaired
0
00
Other Health Impaired
Traumatic Brain InjuryDevelopmental Delay
5Total
0
0
00
00
2
2
1
0
0
0
Home
Early Childhood Setting
PT Early Child and SEEarly Childhood SE Setting
Separate SchoolResidential Facility
Regular Classroom
Resource Room
Self-Contained Classroom
Day Program
24 Hour Program
Home/Hospital Program
Special Education Placement Categories
Total 5
Student to Staff Ratio 0.0
K-8 0.9949-12 0.000
1.0000.000
ADA ADM
Total 0.994 1.000
Student Data
PK-12 Enrollment 0Open Enrolled Students Rec'd 0District Dropout Rate 0.0%
% Special Needs Students 7.2%% Eligible for Free/Red. Lunch 0.0%
Students Transported 0
District Attendance RateNumber of Graduates
0.0%0
Enrollment
Stanford Achievement Test Series, Tenth Edition (SAT10)
Math
Social Science
Language Arts
Reading
Complete Battery
Science
Stanford Writing Assessment Program, Third Edition
Grade 5
Grade 9
American College Test (ACT)
Grade 5Total
PRSpEd
PR
Number Tested
English
Total PR
Sp Ed PR
Grade 4 Grade 3Total
PRSp Ed
PR
Grade 6Total
PRSp Ed
PR
Sp EdTotal
Number Tested
Grade 7Total
PRSp Ed
PR
Grade 8 Total
PRSp Ed
PR
Grade 11Total
PRSp Ed
PR
MathReadingScienceComposite Score
Percent Proficient or Higher
No assessment data are reported for contracting districts.
Ideas and Development
Sp EdTotal
Organization, Unity, and Coherence
Sp EdTotal
Word Choice
Sp EdTotal
Sentences and Paragraphs
Sp EdTotal
Grammer and Usage
Sp EdTotal
Writing Mechanics
Sp EdTotal
NumberTested

General $226,915Capital Outlay $0
PensionSpecial Education $23,389
Ending Fund Balance
Bond Redemption $716,547Capital Projects $0
Other Fund Data
Agricultural $2.74Non-Ag Z $3.60Owner Occupied $4.41Other Non-Ag/Utilities $9.45Special Education $0.02
Bond Redemption $0.00Pension Fund $0.00
Capital Outlay $0.00
2005 Payable 2006 Levy per Thousand
$0$0$0
General AidSpecial EducationExtraordinary Cost Fund - SE
$0Total State Aid
State Aid
Special Education Federal Flowthrough
$0IDEA Part BPart B, Sec. 619, PK $0
$0Total
K-12 Instruction $116,978PK Instruction $0Adult Instruction $0
$8,035$0$0
General Special Education
Expenditures
Community Services $0Non-Programmed $0Debt Service $0Co-Curricular $0
$0$0$0$0
Total Expenditures $116,978 $8,035
2005 Payable 2006Taxable Valuations
Agricultural $17,289,267Owner Occupied $2,093,146Non-Ag Z $177,982Other Non-Ag/Utilities $881,688Total $20,442,083
$00.0
0.0%0.0
$0Average Teacher SalaryExperience Adjusted SalaryAvg Years of Experience% with Advanced DegreesCertified Instructional Staff
Teaching Staff Data
ADM of Tuitioned Out Paid 0.000
General State Aid Adj. ADM 26.400Non-Public / Home Sch ADM 0.000
ADM Data
Local $81,842County $0State $3,172Federal $0Total $85,014
$0$0$0$0
$490$0$0$0
General Capital Outlay Special Education Pension
$0 $490 $0
Revenue
Classroom Staff 0.0
ADM of Contracted Out Paid 22.000
Other Special Revenue $0
1300 Ave P, Hawarden, IA 51023
2005-2006 Profile of Greater Scott School District 61-5
Capital Outlay Pension
Student/Staff ServicesAdministration ServicesTransportation ServicesOther Support Services
Enterprise Funds
Cost per ADM
General Fund Only
Revenue Expenditures
* Includes General, Special Education and Pension Funds
Home County: UnionArea in Square Miles: 21
2005 K-12 Fall Enrollment: 0
$0$0$0$0
$0$0
$0$0$0
$0$0$0$0
$0$0$0$0$0$0$0$0
$0$0$0$0
$0$0$0$0$0$0$0$0
$0Educational Funds* $0
$0$0$0$0 $274,806
$0 $0
$0

December 2005 Federal Child Count
0Deaf-Blind
00
0
DeafSpeech/Language
Autism
0Emotionally Disturbed000000
Mental RetardationHearing ImpairedLearning DisabledMultiple DisabilitiesOrthopedic ImpairmentVisually Impaired
0
00
Other Health Impaired
Traumatic Brain InjuryDevelopmental Delay
0Total
0
0
00
00
0
0
0
0
0
0
Home
Early Childhood Setting
PT Early Child and SEEarly Childhood SE Setting
Separate SchoolResidential Facility
Regular Classroom
Resource Room
Self-Contained Classroom
Day Program
24 Hour Program
Home/Hospital Program
Special Education Placement Categories
Total 0
Student to Staff Ratio 0.0
K-8 12.8209-12 8.433
13.0009.000
ADA ADM
Total 21.253 22.000
Student Data
PK-12 Enrollment 0Open Enrolled Students Rec'd 0District Dropout Rate 0.0%
% Special Needs Students 0.0%% Eligible for Free/Red. Lunch 0.0%
Students Transported 0
District Attendance RateNumber of Graduates
0.0%4
Enrollment
Stanford Achievement Test Series, Tenth Edition (SAT10)
Math
Social Science
Language Arts
Reading
Complete Battery
Science
Stanford Writing Assessment Program, Third Edition
Grade 5
Grade 9
American College Test (ACT)
Grade 5Total
PRSpEd
PR
Number Tested
English
Total PR
Sp Ed PR
Grade 4 Grade 3Total
PRSp Ed
PR
Grade 6Total
PRSp Ed
PR
Sp EdTotal
Number Tested
Grade 7Total
PRSp Ed
PR
Grade 8 Total
PRSp Ed
PR
Grade 11Total
PRSp Ed
PR
MathReadingScienceComposite Score
Percent Proficient or Higher
No assessment data are reported for contracting districts.
Ideas and Development
Sp EdTotal
Organization, Unity, and Coherence
Sp EdTotal
Word Choice
Sp EdTotal
Sentences and Paragraphs
Sp EdTotal
Grammer and Usage
Sp EdTotal
Writing Mechanics
Sp EdTotal
NumberTested

General $1,285,568Capital Outlay $88,976
PensionSpecial Education $141,024
Ending Fund Balance
Bond Redemption $0Capital Projects $223,896
Other Fund Data
Agricultural $3.19Non-Ag Z $4.19Owner Occupied $5.13Other Non-Ag/Utilities $11.00Special Education $1.40
Bond Redemption $0.00Pension Fund $0.00
Capital Outlay $1.32
2005 Payable 2006 Levy per Thousand
$1,160,272$51,276
$0
General AidSpecial EducationExtraordinary Cost Fund - SE
$1,211,548Total State Aid
State Aid
Special Education Federal Flowthrough
$83,584IDEA Part BPart B, Sec. 619, PK $4,111
$87,695Total
K-12 Instruction $1,301,171PK Instruction $0Adult Instruction $3,271
$251,617$78,926
$0
General Special Education
Expenditures
Community Services $106,011Non-Programmed $0Debt Service $0Co-Curricular $138,567
$0$0$0$0
Total Expenditures $2,318,164 $386,388
2005 Payable 2006Taxable Valuations
Agricultural $131,080,904Owner Occupied $23,003,255Non-Ag Z $1,204,751Other Non-Ag/Utilities $10,899,717Total $166,188,627
$31,17113.2
6.1%31.5
$30,184Average Teacher SalaryExperience Adjusted SalaryAvg Years of Experience% with Advanced DegreesCertified Instructional Staff
Teaching Staff Data
ADM of Tuitioned Out Paid 0.000
General State Aid Adj. ADM 407.454Non-Public / Home Sch ADM 4.839
ADM Data
Local $795,390County $17,889State $1,228,924Federal $372,186Total $2,414,390
$219,269$0$0$0
$216,942$0
$51,276$91,161
General Capital Outlay Special Education Pension
$219,269 $359,379 $0
Revenue
Classroom Staff 0.0
ADM of Contracted Out Paid 0.000
Other Special Revenue $0
707 Rosebud, Gregory, SD 57533
2005-2006 Profile of Gregory School District 26-4
Capital Outlay Pension
Student/Staff ServicesAdministration ServicesTransportation ServicesOther Support Services
Enterprise Funds
Cost per ADM
General Fund Only
Revenue Expenditures
* Includes General, Special Education and Pension Funds
Home County: GregoryArea in Square Miles: 506
2005 K-12 Fall Enrollment: 378
$0$0$0$0
$0$0
$0$0$0
$107,667$214,481
$69,946$377,050
$0$0
$50,000$15,013
$0$0
$56,043$4,431
$55,845$0$0$0
$0$0$0$0$0$0$0$0
$5,854Educational Funds* $6,671
$0$57,428
$0$171,890 $181,848
$180,297 $0
$54,809

December 2005 Federal Child Count
0Deaf-Blind
010
2
DeafSpeech/Language
Autism
1Emotionally Disturbed90
15310
Mental RetardationHearing ImpairedLearning DisabledMultiple DisabilitiesOrthopedic ImpairmentVisually Impaired
9
03
Other Health Impaired
Traumatic Brain InjuryDevelopmental Delay
53Total
0
0
61
00
37
7
2
0
0
0
Home
Early Childhood Setting
PT Early Child and SEEarly Childhood SE Setting
Separate SchoolResidential Facility
Regular Classroom
Resource Room
Self-Contained Classroom
Day Program
24 Hour Program
Home/Hospital Program
Special Education Placement Categories
Total 53
Student to Staff Ratio 12.1
K-8 246.0409-12 119.597
255.105127.663
ADA ADM
Total 365.637 382.768
Student Data
PK-12 Enrollment 381Open Enrolled Students Rec'd 3District Dropout Rate 1.0%
% Special Needs Students 13.9%% Eligible for Free/Red. Lunch 43.4%
Students Transported 91
District Attendance RateNumber of Graduates
95.5%29
Enrollment
Stanford Achievement Test Series, Tenth Edition (SAT10)
86
87
85
70
81
82
Math
Social Science
Language Arts
Reading
Complete Battery
Science
Stanford Writing Assessment Program, Third Edition
Grade 5
Grade 9
American College Test (ACT)
Grade 5Total
PRSpEd
PR
Number Tested
English
22
70%
Total PR
Sp Ed PR
69
71
66
69
66
67
62
63
61
46
68
61
77%
Grade 4 Grade 3Total
PRSp Ed
PR
Grade 6Total
PRSp Ed
PR
22 30 342 3 1
Sp EdTotal
Number Tested
Grade 7Total
PRSp Ed
PR
Grade 8 Total
PRSp Ed
PR
Grade 11Total
PRSp Ed
PR
MathReadingScienceComposite Score
22.019.520.6
21.121.0
88
69
72
63
68
73
24 2
81
81
82
55
69
74
66
70
60
64
62
64
57
68
60
58
47
56
630 335 528
Percent Proficient or Higher
No assessment data are reported when less than ten students were tested.
Ideas and Development
Sp EdTotal
Organization, Unity, and Coherence
Sp EdTotal
Word Choice
Sp EdTotal
Sentences and Paragraphs
Sp EdTotal
Grammer and Usage
Sp EdTotal
Writing Mechanics
Sp EdTotal
NumberTested
43% 40% 57%
77%
50%
70%
50%
73%
53%
77%
30
30

General $1,073,495Capital Outlay $246,785
PensionSpecial Education $132,056
Ending Fund Balance
Bond Redemption $223,268Capital Projects $0
Other Fund Data
Agricultural $3.19Non-Ag Z $4.19Owner Occupied $5.13Other Non-Ag/Utilities $11.00Special Education $0.92
Bond Redemption $0.74Pension Fund $0.30
Capital Outlay $1.54
2005 Payable 2006 Levy per Thousand
$1,224,737$0$0
General AidSpecial EducationExtraordinary Cost Fund - SE
$1,224,737Total State Aid
State Aid
Special Education Federal Flowthrough
$130,097IDEA Part BPart B, Sec. 619, PK $7,611
$137,708Total
K-12 Instruction $1,746,488PK Instruction $7,478Adult Instruction $0
$290,397$42,765
$0
General Special Education
Expenditures
Community Services $25,842Non-Programmed $12,722Debt Service $0Co-Curricular $352,072
$0$0$0$0
Total Expenditures $3,578,966 $507,378
2005 Payable 2006Taxable Valuations
Agricultural $289,083,996Owner Occupied $50,862,182Non-Ag Z $2,546,131Other Non-Ag/Utilities $29,262,624Total $371,754,933
$31,33419.5
14.3%46.3
$33,247Average Teacher SalaryExperience Adjusted SalaryAvg Years of Experience% with Advanced DegreesCertified Instructional Staff
Teaching Staff Data
ADM of Tuitioned Out Paid 0.336
General State Aid Adj. ADM 635.992Non-Public / Home Sch ADM 0.946
ADM Data
Local $1,934,765County $52,817State $1,458,561Federal $186,821Total $3,632,964
$526,969$67
$0$2,288
$312,220$39
$0$125,155
General Capital Outlay Special Education Pension
$529,324 $437,414 $110,480
Revenue
Classroom Staff 0.0
ADM of Contracted Out Paid 0.000
Other Special Revenue $0
125 E 4th Ave, Groton, SD 57445-0410
2005-2006 Profile of Groton Area School District 06-6
Capital Outlay Pension
Student/Staff ServicesAdministration ServicesTransportation ServicesOther Support Services
Enterprise Funds
Cost per ADM
General Fund Only
Revenue Expenditures
* Includes General, Special Education and Pension Funds
Home County: BrownArea in Square Miles: 785
2005 K-12 Fall Enrollment: 599
$110,465$15$0$0
$0$0
$66,008$275
$0$173,316$369,705$243,458$647,887
$12,193$0
$56,378$270,717
$0$0
$91,129$29,288
$155,750$10,883$4,309$3,272
$6,018$11,427
$1,214$15,747
$0$0$0
$9,791
$5,773Educational Funds* $6,705
$229,809$0$0
$210,036 $208,049
$599,317 $110,480
$139,611

December 2005 Federal Child Count
0Deaf-Blind
024
3
DeafSpeech/Language
Autism
1Emotionally Disturbed50
35020
Mental RetardationHearing ImpairedLearning DisabledMultiple DisabilitiesOrthopedic ImpairmentVisually Impaired
7
010
Other Health Impaired
Traumatic Brain InjuryDevelopmental Delay
87Total
0
4
218
00
53
8
2
0
0
0
Home
Early Childhood Setting
PT Early Child and SEEarly Childhood SE Setting
Separate SchoolResidential Facility
Regular Classroom
Resource Room
Self-Contained Classroom
Day Program
24 Hour Program
Home/Hospital Program
Special Education Placement Categories
Total 87
Student to Staff Ratio 13.6
K-8 405.6519-12 182.641
419.130192.926
ADA ADM
Total 588.292 612.056
Student Data
PK-12 Enrollment 628Open Enrolled Students Rec'd 33District Dropout Rate 0.7%
% Special Needs Students 13.9%% Eligible for Free/Red. Lunch 16.0%
Students Transported 327
District Attendance RateNumber of Graduates
96.1%46
Enrollment
Stanford Achievement Test Series, Tenth Edition (SAT10)
85
86
79
60
72
76
Math
Social Science
Language Arts
Reading
Complete Battery
Science
Stanford Writing Assessment Program, Third Edition
Grade 5
Grade 9
American College Test (ACT)
Grade 5Total
PRSpEd
PR
Number Tested
English
78%
Total PR
Sp Ed PR
83
73
74
77
72
76
88
76
74
66
78
76
65%
Grade 4 Grade 3Total
PRSp Ed
PR
Grade 6Total
PRSp Ed
PR
44 42 353 4
Sp EdTotal
Number Tested
Grade 7Total
PRSp Ed
PR
Grade 8 Total
PRSp Ed
PR
Grade 11Total
PRSp Ed
PR
MathReadingScienceComposite Score
82
74
77
74
71
74
50 7
77
76
84
61
68
73
92
83
81
73
82
83
87
77
79
81
75
80
541 250 448
Percent Proficient or Higher
No assessment data are reported when less than ten students were tested.
Ideas and Development
Sp EdTotal
Organization, Unity, and Coherence
Sp EdTotal
Word Choice
Sp EdTotal
Sentences and Paragraphs
Sp EdTotal
Grammer and Usage
Sp EdTotal
Writing Mechanics
Sp EdTotal
NumberTested
83% 68% 78%
65%
39%
63%
49%
65%
41%
76%
41
49

General $964,420Capital Outlay $425,753
PensionSpecial Education $238,673
Ending Fund Balance
Bond Redemption $0Capital Projects $0
Other Fund Data
Agricultural $3.19Non-Ag Z $4.19Owner Occupied $5.13Other Non-Ag/Utilities $11.00Special Education $1.00
Bond Redemption $0.00Pension Fund $0.30
Capital Outlay $1.00
2005 Payable 2006 Levy per Thousand
$645,214$0$0
General AidSpecial EducationExtraordinary Cost Fund - SE
$645,214Total State Aid
State Aid
Special Education Federal Flowthrough
$56,677IDEA Part BPart B, Sec. 619, PK $5,021
$61,698Total
K-12 Instruction $1,129,885PK Instruction $0Adult Instruction $0
$148,256$255
$0
General Special Education
Expenditures
Community Services $0Non-Programmed $2,635Debt Service $0Co-Curricular $134,025
$0$0$0$0
Total Expenditures $1,878,689 $210,724
2005 Payable 2006Taxable Valuations
Agricultural $151,206,756Owner Occupied $15,986,369Non-Ag Z $2,928,324Other Non-Ag/Utilities $12,429,119Total $182,550,568
$31,65318.8
11.1%25.8
$33,381Average Teacher SalaryExperience Adjusted SalaryAvg Years of Experience% with Advanced DegreesCertified Instructional Staff
Teaching Staff Data
ADM of Tuitioned Out Paid 0.000
General State Aid Adj. ADM 316.064Non-Public / Home Sch ADM 5.950
ADM Data
Local $926,636County $10,563State $702,679Federal $189,989Total $1,829,867
$210,653$0$0
$18
$151,014$0$0
$62,332
General Capital Outlay Special Education Pension
$210,671 $213,346 $0
Revenue
Classroom Staff 0.0
ADM of Contracted Out Paid 0.000
Other Special Revenue $0
330 Scottie Ave, Philip, SD 57567-0730
2005-2006 Profile of Haakon School District 27-1
Capital Outlay Pension
Student/Staff ServicesAdministration ServicesTransportation ServicesOther Support Services
Enterprise Funds
Cost per ADM
General Fund Only
Revenue Expenditures
* Includes General, Special Education and Pension Funds
Home County: HaakonArea in Square Miles: 1,664
2005 K-12 Fall Enrollment: 282
$0$0$0$0
$0$0
$0$0$0
$91,735$212,901
$33,686$273,821
$1,672$1,145
$0$45,941
$0$0
$162,424$64,802
$47,461$12,169$2,582
$0
$0$0$0$0$0$0$0$0
$6,782Educational Funds* $7,542
$0$0$0
$68,528 $62,233
$341,758 $0
$65,774

December 2005 Federal Child Count
0Deaf-Blind
010
3
DeafSpeech/Language
Autism
0Emotionally Disturbed00
13000
Mental RetardationHearing ImpairedLearning DisabledMultiple DisabilitiesOrthopedic ImpairmentVisually Impaired
3
00
Other Health Impaired
Traumatic Brain InjuryDevelopmental Delay
29Total
0
0
16
00
17
5
0
0
0
0
Home
Early Childhood Setting
PT Early Child and SEEarly Childhood SE Setting
Separate SchoolResidential Facility
Regular Classroom
Resource Room
Self-Contained Classroom
Day Program
24 Hour Program
Home/Hospital Program
Special Education Placement Categories
Total 29
Student to Staff Ratio 11.1
K-8 169.7029-12 96.655
175.875101.133
ADA ADM
Total 266.357 277.008
Student Data
PK-12 Enrollment 287Open Enrolled Students Rec'd 31District Dropout Rate 2.5%
% Special Needs Students 10.1%% Eligible for Free/Red. Lunch 12.1%
Students Transported 0
District Attendance RateNumber of Graduates
96.2%22
Enrollment
Stanford Achievement Test Series, Tenth Edition (SAT10)
91
93
89
81
86
87
Math
Social Science
Language Arts
Reading
Complete Battery
Science
Stanford Writing Assessment Program, Third Edition
Grade 5
Grade 9
American College Test (ACT)
Grade 5Total
PRSpEd
PR
Number Tested
English
15
96%
Total PR
Sp Ed PR
74
69
68
76
77
72
85
80
70
57
81
75
92%
Grade 4 Grade 3Total
PRSp Ed
PR
Grade 6Total
PRSp Ed
PR
15 20 261 2
Sp EdTotal
Number Tested
Grade 7Total
PRSp Ed
PR
Grade 8 Total
PRSp Ed
PR
Grade 11Total
PRSp Ed
PR
MathReadingScienceComposite Score
21.923.320.1
22.922.2
89
90
90
78
79
83
20
77
84
85
77
68
77
81
88
81
77
76
79
80
67
68
74
70
72
318 222 129
Percent Proficient or Higher
No assessment data are reported when less than ten students were tested.
Ideas and Development
Sp EdTotal
Organization, Unity, and Coherence
Sp EdTotal
Word Choice
Sp EdTotal
Sentences and Paragraphs
Sp EdTotal
Grammer and Usage
Sp EdTotal
Writing Mechanics
Sp EdTotal
NumberTested
39% 39% 39%
88%
44%
79%
33%
71%
33%
75%
18
24

General $778,897Capital Outlay $84,321
PensionSpecial Education $1,501
Ending Fund Balance
Bond Redemption $408,150Capital Projects $0
Other Fund Data
Agricultural $3.19Non-Ag Z $4.19Owner Occupied $5.13Other Non-Ag/Utilities $11.00Special Education $1.40
Bond Redemption $1.85Pension Fund $0.30
Capital Outlay $3.00
2005 Payable 2006 Levy per Thousand
$1,640,591$86,148
$192,833
General AidSpecial EducationExtraordinary Cost Fund - SE
$1,919,572Total State Aid
State Aid
Special Education Federal Flowthrough
$108,527IDEA Part BPart B, Sec. 619, PK $3,730
$112,257Total
K-12 Instruction $1,734,723PK Instruction $0Adult Instruction $0
$510,481$22,074
$0
General Special Education
Expenditures
Community Services $0Non-Programmed $34,122Debt Service $0Co-Curricular $186,431
$0$0$0$0
Total Expenditures $3,211,618 $693,770
2005 Payable 2006Taxable Valuations
Agricultural $152,375,706Owner Occupied $40,240,642Non-Ag Z $980,040Other Non-Ag/Utilities $29,696,030Total $223,292,418
$32,79611.7
10.9%42.0
$30,866Average Teacher SalaryExperience Adjusted SalaryAvg Years of Experience% with Advanced DegreesCertified Instructional Staff
Teaching Staff Data
ADM of Tuitioned Out Paid 9.000
General State Aid Adj. ADM 643.895Non-Public / Home Sch ADM 18.530
ADM Data
Local $1,195,967County $29,246State $1,745,884Federal $246,126Total $3,217,223
$635,085$452
$0$0
$296,533$211
$278,981$108,450
General Capital Outlay Special Education Pension
$635,537 $684,175 $64,052
Revenue
Classroom Staff 0.0
ADM of Contracted Out Paid 0.000
Other Special Revenue $0
44577 188th St, Hayti, SD 57241
2005-2006 Profile of Hamlin School District 28-3
Capital Outlay Pension
Student/Staff ServicesAdministration ServicesTransportation ServicesOther Support Services
Enterprise Funds
Cost per ADM
General Fund Only
Revenue Expenditures
* Includes General, Special Education and Pension Funds
Home County: HamlinArea in Square Miles: 365
2005 K-12 Fall Enrollment: 645
$64,029$23$0$0
$0$0
$63,514$0$0
$132,438$313,539$297,060$513,305
$8,404$0
$9,950$108,849
$0$0
$286,761$29,216
$159,350$0
$1,864$0
$0$0$0$0$0$0$0$0
$4,942Educational Funds* $5,795
$418,524$0$0
$261,999 $300,694
$526,258 $63,514
$83,077

December 2005 Federal Child Count
0Deaf-Blind
014
1
DeafSpeech/Language
Autism
1Emotionally Disturbed31
42701
Mental RetardationHearing ImpairedLearning DisabledMultiple DisabilitiesOrthopedic ImpairmentVisually Impaired
1
02
Other Health Impaired
Traumatic Brain InjuryDevelopmental Delay
73Total
0
1
30
00
51
11
5
0
2
0
Home
Early Childhood Setting
PT Early Child and SEEarly Childhood SE Setting
Separate SchoolResidential Facility
Regular Classroom
Resource Room
Self-Contained Classroom
Day Program
24 Hour Program
Home/Hospital Program
Special Education Placement Categories
Total 73
Student to Staff Ratio 15.4
K-8 428.3549-12 186.086
441.676193.219
ADA ADM
Total 614.440 634.895
Student Data
PK-12 Enrollment 645Open Enrolled Students Rec'd 8District Dropout Rate 1.0%
% Special Needs Students 11.3%% Eligible for Free/Red. Lunch 45.4%
Students Transported 650
District Attendance RateNumber of Graduates
96.8%49
Enrollment
Stanford Achievement Test Series, Tenth Edition (SAT10)
71
76
84
57
70
69
Math
Social Science
Language Arts
Reading
Complete Battery
Science
Stanford Writing Assessment Program, Third Edition
Grade 5
Grade 9
American College Test (ACT)
Grade 5Total
PRSpEd
PR
Number Tested
English
31
51%
Total PR
Sp Ed PR
77
72
61
57
65
67
88
84
64
66
80
77
49%
Grade 4 Grade 3Total
PRSp Ed
PR
Grade 6Total
PRSp Ed
PR
49 44 455 3
Sp EdTotal
Number Tested
Grade 7Total
PRSp Ed
PR
Grade 8 Total
PRSp Ed
PR
Grade 11Total
PRSp Ed
PR
MathReadingScienceComposite Score
21.823.420.8
21.422.0
85 67
87 69
88 81
77 51
81 55
82 63
49 12
81
70
83
69
72
75
58
72
71
64
57
62
80
59
62
66
58
65
544 450 749
Percent Proficient or Higher
No assessment data are reported when less than ten students were tested.
Ideas and Development
Sp EdTotal
Organization, Unity, and Coherence
Sp EdTotal
Word Choice
Sp EdTotal
Sentences and Paragraphs
Sp EdTotal
Grammer and Usage
Sp EdTotal
Writing Mechanics
Sp EdTotal
NumberTested
43% 39% 50%
43%
45%
55%
41%
68%
32%
70%
44
47
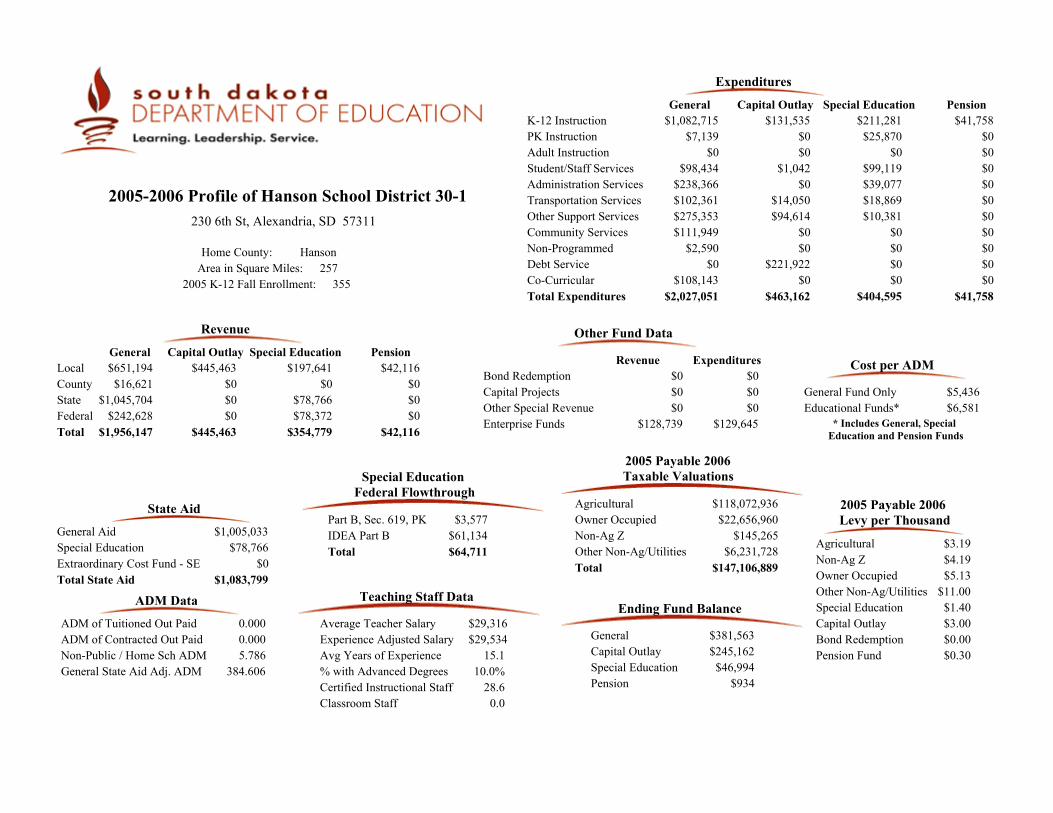
General $381,563Capital Outlay $245,162
Pension $934Special Education $46,994
Ending Fund Balance
Bond Redemption $0Capital Projects $0
Other Fund Data
Agricultural $3.19Non-Ag Z $4.19Owner Occupied $5.13Other Non-Ag/Utilities $11.00Special Education $1.40
Bond Redemption $0.00Pension Fund $0.30
Capital Outlay $3.00
2005 Payable 2006 Levy per Thousand
$1,005,033$78,766
$0
General AidSpecial EducationExtraordinary Cost Fund - SE
$1,083,799Total State Aid
State Aid
Special Education Federal Flowthrough
$61,134IDEA Part BPart B, Sec. 619, PK $3,577
$64,711Total
K-12 Instruction $1,082,715PK Instruction $7,139Adult Instruction $0
$211,281$25,870
$0
General Special Education
Expenditures
Community Services $111,949Non-Programmed $2,590Debt Service $0Co-Curricular $108,143
$0$0$0$0
Total Expenditures $2,027,051 $404,595
2005 Payable 2006Taxable Valuations
Agricultural $118,072,936Owner Occupied $22,656,960Non-Ag Z $145,265Other Non-Ag/Utilities $6,231,728Total $147,106,889
$29,53415.1
10.0%28.6
$29,316Average Teacher SalaryExperience Adjusted SalaryAvg Years of Experience% with Advanced DegreesCertified Instructional Staff
Teaching Staff Data
ADM of Tuitioned Out Paid 0.000
General State Aid Adj. ADM 384.606Non-Public / Home Sch ADM 5.786
ADM Data
Local $651,194County $16,621State $1,045,704Federal $242,628Total $1,956,147
$445,463$0$0$0
$197,641$0
$78,766$78,372
General Capital Outlay Special Education Pension
$445,463 $354,779 $42,116
Revenue
Classroom Staff 0.0
ADM of Contracted Out Paid 0.000
Other Special Revenue $0
230 6th St, Alexandria, SD 57311
2005-2006 Profile of Hanson School District 30-1
Capital Outlay Pension
Student/Staff ServicesAdministration ServicesTransportation ServicesOther Support Services
Enterprise Funds
Cost per ADM
General Fund Only
Revenue Expenditures
* Includes General, Special Education and Pension Funds
Home County: HansonArea in Square Miles: 257
2005 K-12 Fall Enrollment: 355
$42,116$0$0$0
$0$0
$41,758$0$0
$98,434$238,366$102,361$275,353
$1,042$0
$14,050$94,614
$0$0
$221,922$0
$99,119$39,077$18,869$10,381
$0$0$0$0$0$0$0$0
$5,436Educational Funds* $6,581
$0$0$0
$128,739 $129,645
$463,162 $41,758
$131,535

December 2005 Federal Child Count
0Deaf-Blind
116
2
DeafSpeech/Language
Autism
0Emotionally Disturbed309410
Mental RetardationHearing ImpairedLearning DisabledMultiple DisabilitiesOrthopedic ImpairmentVisually Impaired
0
10
Other Health Impaired
Traumatic Brain InjuryDevelopmental Delay
37Total
0
2
06
10
24
3
1
0
0
0
Home
Early Childhood Setting
PT Early Child and SEEarly Childhood SE Setting
Separate SchoolResidential Facility
Regular Classroom
Resource Room
Self-Contained Classroom
Day Program
24 Hour Program
Home/Hospital Program
Special Education Placement Categories
Total 37
Student to Staff Ratio 13.2
K-8 241.6729-12 103.037
246.579104.672
ADA ADM
Total 344.709 351.251
Student Data
PK-12 Enrollment 378Open Enrolled Students Rec'd 17District Dropout Rate 1.2%
% Special Needs Students 9.8%% Eligible for Free/Red. Lunch 35.5%
Students Transported 98
District Attendance RateNumber of Graduates
98.1%17
Enrollment
Stanford Achievement Test Series, Tenth Edition (SAT10)
79
74
75
61
65
70
Math
Social Science
Language Arts
Reading
Complete Battery
Science
Stanford Writing Assessment Program, Third Edition
Grade 5
Grade 9
American College Test (ACT)
Grade 5Total
PRSpEd
PR
Number Tested
English
11
80%
Total PR
Sp Ed PR
82
71
76
79
74
76
74
61
73
57
72
67
70%
Grade 4 Grade 3Total
PRSp Ed
PR
Grade 6Total
PRSp Ed
PR
29 29 241 1 1
Sp EdTotal
Number Tested
Grade 7Total
PRSp Ed
PR
Grade 8 Total
PRSp Ed
PR
Grade 11Total
PRSp Ed
PR
MathReadingScienceComposite Score
18.019.115.9
19.918.3
80
56
60
44
55
61
19 2
77
56
69
56
57
63
65
57
47
54
45
53
72
65
69
69
56
64
223 226 130
Percent Proficient or Higher
No assessment data are reported when less than ten students were tested.
Ideas and Development
Sp EdTotal
Organization, Unity, and Coherence
Sp EdTotal
Word Choice
Sp EdTotal
Sentences and Paragraphs
Sp EdTotal
Grammer and Usage
Sp EdTotal
Writing Mechanics
Sp EdTotal
NumberTested
59% 55% 55%
60%
50%
70%
45%
40%
45%
40%
22
20

General $1,275,984Capital Outlay $173,571
Pension $12,425Special Education $190,779
Ending Fund Balance
Bond Redemption $0Capital Projects $0
Other Fund Data
Agricultural $3.19Non-Ag Z $4.19Owner Occupied $5.13Other Non-Ag/Utilities $11.00Special Education $0.63
Bond Redemption $0.00Pension Fund $0.30
Capital Outlay $1.26
2005 Payable 2006 Levy per Thousand
$427,038$0$0
General AidSpecial EducationExtraordinary Cost Fund - SE
$427,038Total State Aid
State Aid
Special Education Federal Flowthrough
$44,334IDEA Part BPart B, Sec. 619, PK $2,073
$46,407Total
K-12 Instruction $1,106,768PK Instruction $0Adult Instruction $0
$63,632$0$0
General Special Education
Expenditures
Community Services $0Non-Programmed $2,459Debt Service $0Co-Curricular $118,114
$0$0$0$0
Total Expenditures $1,871,530 $134,437
2005 Payable 2006Taxable Valuations
Agricultural $146,621,280Owner Occupied $9,459,400Non-Ag Z $56,920Other Non-Ag/Utilities $25,376,843Total $181,514,443
$31,43713.0
3.7%24.3
$29,823Average Teacher SalaryExperience Adjusted SalaryAvg Years of Experience% with Advanced DegreesCertified Instructional Staff
Teaching Staff Data
ADM of Tuitioned Out Paid 0.000
General State Aid Adj. ADM 259.897Non-Public / Home Sch ADM 3.824
ADM Data
Local $1,049,453County $348,258State $471,501Federal $327,623Total $2,196,835
$211,330$8,516
$0$0
$124,776$4,411
$0$41,766
General Capital Outlay Special Education Pension
$219,846 $170,953 $58,397
Revenue
Classroom Staff 0.6
ADM of Contracted Out Paid 0.000
Other Special Revenue $0
102 West Allison St, Buffalo, SD 57720
2005-2006 Profile of Harding County School District 31-1
Capital Outlay Pension
Student/Staff ServicesAdministration ServicesTransportation ServicesOther Support Services
Enterprise Funds
Cost per ADM
General Fund Only
Revenue Expenditures
* Includes General, Special Education and Pension Funds
Home County: HardingArea in Square Miles: 2,684
2005 K-12 Fall Enrollment: 226
$56,313$2,084
$0$0
$0$0
$40,263$0$0
$96,449$168,165
$80,639$298,935
$1,344$1,007$7,000
$119,035$0$0$0
$3,783
$15,086$55,719
$0$0
$3,508$6,492
$0$4,817
$0$0$0$0
$7,219Educational Funds* $8,018
$0$0$0
$72,111 $66,623
$229,017 $55,080
$96,848

December 2005 Federal Child Count
0Deaf-Blind
08
0
DeafSpeech/Language
Autism
0Emotionally Disturbed306000
Mental RetardationHearing ImpairedLearning DisabledMultiple DisabilitiesOrthopedic ImpairmentVisually Impaired
1
00
Other Health Impaired
Traumatic Brain InjuryDevelopmental Delay
18Total
0
0
11
00
13
3
0
0
0
0
Home
Early Childhood Setting
PT Early Child and SEEarly Childhood SE Setting
Separate SchoolResidential Facility
Regular Classroom
Resource Room
Self-Contained Classroom
Day Program
24 Hour Program
Home/Hospital Program
Special Education Placement Categories
Total 18
Student to Staff Ratio 9.2
K-8 140.9959-12 68.839
146.69972.091
ADA ADM
Total 209.834 218.790
Student Data
PK-12 Enrollment 228Open Enrolled Students Rec'd 0District Dropout Rate 0.0%
% Special Needs Students 7.9%% Eligible for Free/Red. Lunch 20.1%
Students Transported 42
District Attendance RateNumber of Graduates
95.9%14
Enrollment
Stanford Achievement Test Series, Tenth Edition (SAT10)
82
80
73
57
76
75
Math
Social Science
Language Arts
Reading
Complete Battery
Science
Stanford Writing Assessment Program, Third Edition
Grade 5
Grade 9
American College Test (ACT)
Grade 5Total
PRSpEd
PR
Number Tested
English
14
88%
Total PR
Sp Ed PR
80
71
72
65
62
69
83
84
70
57
74
73
82%
Grade 4 Grade 3Total
PRSp Ed
PR
Grade 6Total
PRSp Ed
PR
17 23 201 2 1
Sp EdTotal
Number Tested
Grade 7Total
PRSp Ed
PR
Grade 8 Total
PRSp Ed
PR
Grade 11Total
PRSp Ed
PR
MathReadingScienceComposite Score
23.422.121.1
22.422.4
77
76
72
62
63
69
10 3
88
77
87
66
67
78
75
87
86
84
67
78
71
58
69
63
55
62
113 22 19
Percent Proficient or Higher
No assessment data are reported when less than ten students were tested.
Ideas and Development
Sp EdTotal
Organization, Unity, and Coherence
Sp EdTotal
Word Choice
Sp EdTotal
Sentences and Paragraphs
Sp EdTotal
Grammer and Usage
Sp EdTotal
Writing Mechanics
Sp EdTotal
NumberTested
38% 38% 31%
71%
38%
71%
46%
82%
38%
76%
13
17

General $384,380Capital Outlay $1,212,674
PensionSpecial Education ($13,005)
Ending Fund Balance
Bond Redemption $1,067,033Capital Projects $645,404
Other Fund Data
Agricultural $3.72Non-Ag Z $4.89Owner Occupied $5.98Other Non-Ag/Utilities $12.83Special Education $1.40
Bond Redemption $1.58Pension Fund $0.30
Capital Outlay $2.50
2005 Payable 2006 Levy per Thousand
$770,849$16,906
$112,124
General AidSpecial EducationExtraordinary Cost Fund - SE
$899,879Total State Aid
State Aid
Special Education Federal Flowthrough
$209,079IDEA Part BPart B, Sec. 619, PK $7,975
$217,054Total
K-12 Instruction $3,528,814PK Instruction $0Adult Instruction $0
$718,503$81,354
$0
General Special Education
Expenditures
Community Services $0Non-Programmed $5,863Debt Service $0Co-Curricular $209,080
$0$0$0$0
Total Expenditures $5,888,758 $1,245,281
2005 Payable 2006Taxable Valuations
Agricultural $55,959,570Owner Occupied $410,189,762Non-Ag Z $13,945,942Other Non-Ag/Utilities $171,983,000Total $652,078,274
$34,16110.3
14.0%83.7
$31,524Average Teacher SalaryExperience Adjusted SalaryAvg Years of Experience% with Advanced DegreesCertified Instructional Staff
Teaching Staff Data
ADM of Tuitioned Out Paid 8.478
General State Aid Adj. ADM 1,262.659Non-Public / Home Sch ADM 337.372
ADM Data
Local $4,699,799County $61,343State $935,206Federal $185,856Total $5,882,203
$1,470,010$0$0$0
$820,075$0
$129,030$234,847
General Capital Outlay Special Education Pension
$1,470,010 $1,183,952 $172,108
Revenue
Classroom Staff 0.0
ADM of Contracted Out Paid 0.000
Other Special Revenue $0
200 Willow St, Harrisburg, SD 57032-0187
2005-2006 Profile of Harrisburg School District 41-2
Capital Outlay Pension
Student/Staff ServicesAdministration ServicesTransportation ServicesOther Support Services
Enterprise Funds
Cost per ADM
General Fund Only
Revenue Expenditures
* Includes General, Special Education and Pension Funds
Home County: LincolnArea in Square Miles: 70
2005 K-12 Fall Enrollment: 1,225
$172,108$0$0$0
$0$0
$127,108$0$0
$314,134$442,247$254,954
$1,133,667
$382,842$0$0
$296,736$0$0
$259,555$12,849
$344,645$72,133$22,155$6,492
$0$9,000
$0$16,000
$0$20,000
$0$0
$4,693Educational Funds* $5,674
$1,061,438$375
$0$506,316 $500,207
*District has opted out of General Fund levy
$1,672,758 $172,108
$720,776

December 2005 Federal Child Count
0Deaf-Blind
057
5
DeafSpeech/Language
Autism
1Emotionally Disturbed41
79940
Mental RetardationHearing ImpairedLearning DisabledMultiple DisabilitiesOrthopedic ImpairmentVisually Impaired
11
014
Other Health Impaired
Traumatic Brain InjuryDevelopmental Delay
185Total
0
0
1332
10
95
33
3
8
0
0
Home
Early Childhood Setting
PT Early Child and SEEarly Childhood SE Setting
Separate SchoolResidential Facility
Regular Classroom
Resource Room
Self-Contained Classroom
Day Program
24 Hour Program
Home/Hospital Program
Special Education Placement Categories
Total 185
Student to Staff Ratio 15.1
K-8 930.8729-12 275.715
957.046293.416
ADA ADM
Total 1,206.587 1,250.462
Student Data
PK-12 Enrollment 1,259Open Enrolled Students Rec'd 39District Dropout Rate 0.4%
% Special Needs Students 14.7%% Eligible for Free/Red. Lunch 12.2%
Students Transported 615
District Attendance RateNumber of Graduates
96.5%59
Enrollment
Stanford Achievement Test Series, Tenth Edition (SAT10)
71
74
74
61
65
67
Math
Social Science
Language Arts
Reading
Complete Battery
Science
Stanford Writing Assessment Program, Third Edition
Grade 5
Grade 9
American College Test (ACT)
Grade 5Total
PRSpEd
PR
Number Tested
English
41
95%
Total PR
Sp Ed PR
76
75
74
70
71
72
38
51
43
23
38
38
78
81
75
54
74
72
88%
Grade 4 Grade 3Total
PRSp Ed
PR
Grade 6Total
PRSp Ed
PR
82 97 728 14 8
Sp EdTotal
Number Tested
Grade 7Total
PRSp Ed
PR
Grade 8 Total
PRSp Ed
PR
Grade 11Total
PRSp Ed
PR
MathReadingScienceComposite Score
22.821.222.2
22.022.1
77 69
78 78
77 74
68 62
67 54
71 65
112 12
80 55
81 79
85 69
70 53
67 42
76 57
81
85
83
71
71
77
75 27
67 35
67 29
63 26
64 28
67 29
1195 590 1391
Percent Proficient or Higher
No assessment data are reported when less than ten students were tested.
Ideas and Development
Sp EdTotal
Organization, Unity, and Coherence
Sp EdTotal
Word Choice
Sp EdTotal
Sentences and Paragraphs
Sp EdTotal
Grammer and Usage
Sp EdTotal
Writing Mechanics
Sp EdTotal
NumberTested
79% 65% 69%
78%
44%
78%
50%
81%
34%
85%
94
80
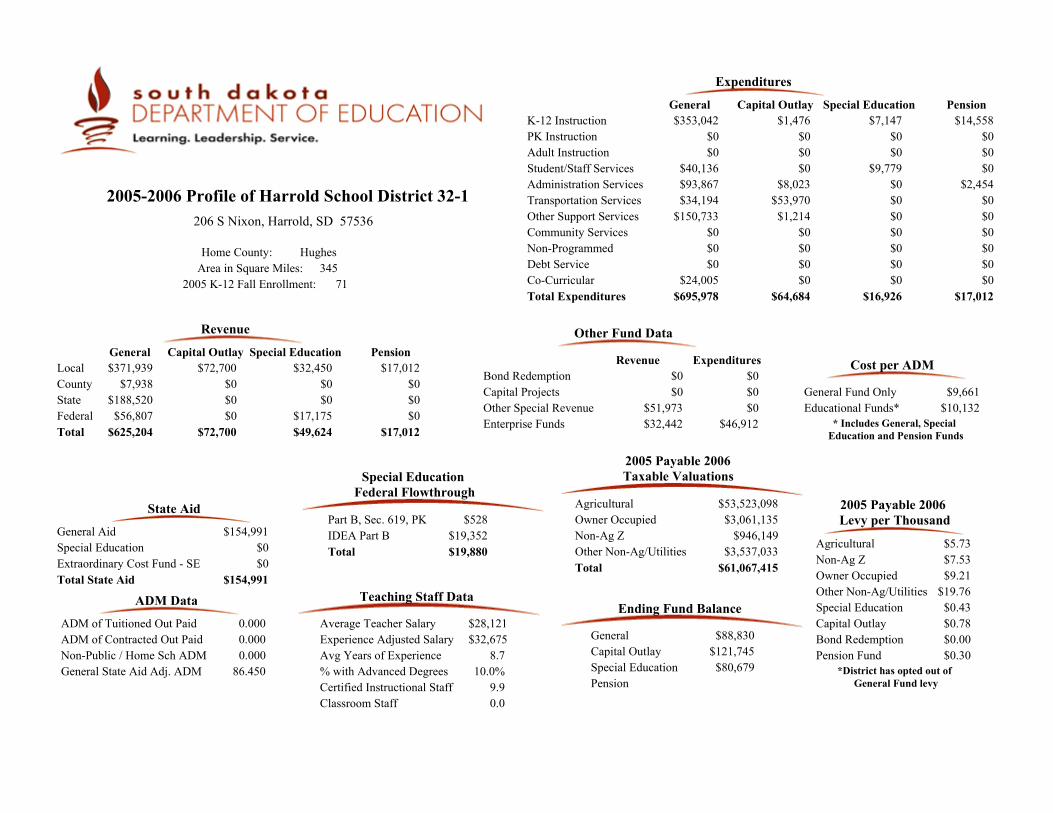
General $88,830Capital Outlay $121,745
PensionSpecial Education $80,679
Ending Fund Balance
Bond Redemption $0Capital Projects $0
Other Fund Data
Agricultural $5.73Non-Ag Z $7.53Owner Occupied $9.21Other Non-Ag/Utilities $19.76Special Education $0.43
Bond Redemption $0.00Pension Fund $0.30
Capital Outlay $0.78
2005 Payable 2006 Levy per Thousand
$154,991$0$0
General AidSpecial EducationExtraordinary Cost Fund - SE
$154,991Total State Aid
State Aid
Special Education Federal Flowthrough
$19,352IDEA Part BPart B, Sec. 619, PK $528
$19,880Total
K-12 Instruction $353,042PK Instruction $0Adult Instruction $0
$7,147$0$0
General Special Education
Expenditures
Community Services $0Non-Programmed $0Debt Service $0Co-Curricular $24,005
$0$0$0$0
Total Expenditures $695,978 $16,926
2005 Payable 2006Taxable Valuations
Agricultural $53,523,098Owner Occupied $3,061,135Non-Ag Z $946,149Other Non-Ag/Utilities $3,537,033Total $61,067,415
$32,6758.7
10.0%9.9
$28,121Average Teacher SalaryExperience Adjusted SalaryAvg Years of Experience% with Advanced DegreesCertified Instructional Staff
Teaching Staff Data
ADM of Tuitioned Out Paid 0.000
General State Aid Adj. ADM 86.450Non-Public / Home Sch ADM 0.000
ADM Data
Local $371,939County $7,938State $188,520Federal $56,807Total $625,204
$72,700$0$0$0
$32,450$0$0
$17,175
General Capital Outlay Special Education Pension
$72,700 $49,624 $17,012
Revenue
Classroom Staff 0.0
ADM of Contracted Out Paid 0.000
Other Special Revenue $0
206 S Nixon, Harrold, SD 57536
2005-2006 Profile of Harrold School District 32-1
Capital Outlay Pension
Student/Staff ServicesAdministration ServicesTransportation ServicesOther Support Services
Enterprise Funds
Cost per ADM
General Fund Only
Revenue Expenditures
* Includes General, Special Education and Pension Funds
Home County: HughesArea in Square Miles: 345
2005 K-12 Fall Enrollment: 71
$17,012$0$0$0
$0$0
$14,558$0$0
$40,136$93,867$34,194
$150,733
$0$8,023
$53,970$1,214
$0$0$0$0
$9,779$0$0$0
$0$2,454
$0$0$0$0$0$0
$9,661Educational Funds* $10,132
$0$0
$51,973$32,442 $46,912
*District has opted out of General Fund levy
$64,684 $17,012
$1,476

December 2005 Federal Child Count
0Deaf-Blind
01
0
DeafSpeech/Language
Autism
0Emotionally Disturbed002000
Mental RetardationHearing ImpairedLearning DisabledMultiple DisabilitiesOrthopedic ImpairmentVisually Impaired
0
01
Other Health Impaired
Traumatic Brain InjuryDevelopmental Delay
4Total
0
0
01
00
3
0
0
0
0
0
Home
Early Childhood Setting
PT Early Child and SEEarly Childhood SE Setting
Separate SchoolResidential Facility
Regular Classroom
Resource Room
Self-Contained Classroom
Day Program
24 Hour Program
Home/Hospital Program
Special Education Placement Categories
Total 4
Student to Staff Ratio 7.2
K-8 45.7319-12 24.841
47.12024.922
ADA ADM
Total 70.572 72.042
Student Data
PK-12 Enrollment 71Open Enrolled Students Rec'd 1District Dropout Rate 0.0%
% Special Needs Students 5.6%% Eligible for Free/Red. Lunch 53.2%
Students Transported 32
District Attendance RateNumber of Graduates
98.0%5
Enrollment
Stanford Achievement Test Series, Tenth Edition (SAT10)
85
96
82
81
91
87
Math
Social Science
Language Arts
Reading
Complete Battery
Science
Stanford Writing Assessment Program, Third Edition
Grade 5
Grade 9
American College Test (ACT)
Grade 5Total
PRSpEd
PR
Number Tested
English
3
100%
Total PR
Sp Ed PR
58
48
73
56
64
59
46
69
71
61
79
66
100%
Grade 4 Grade 3Total
PRSp Ed
PR
Grade 6Total
PRSp Ed
PR
6 7 7 1
Sp EdTotal
Number Tested
Grade 7Total
PRSp Ed
PR
Grade 8 Total
PRSp Ed
PR
Grade 11Total
PRSp Ed
PR
MathReadingScienceComposite Score
36
51
62
55
59
51
5
82
69
86
53
66
73
90
67
71
68
72
76
93
81
73
54
57
75
8 7 4
Percent Proficient or Higher
No assessment data are reported when less than ten students were tested.
Ideas and Development
Sp EdTotal
Organization, Unity, and Coherence
Sp EdTotal
Word Choice
Sp EdTotal
Sentences and Paragraphs
Sp EdTotal
Grammer and Usage
Sp EdTotal
Writing Mechanics
Sp EdTotal
NumberTested
100% 86% 57%
100%
43%
67%
57%
83%
43%
100%
7
6
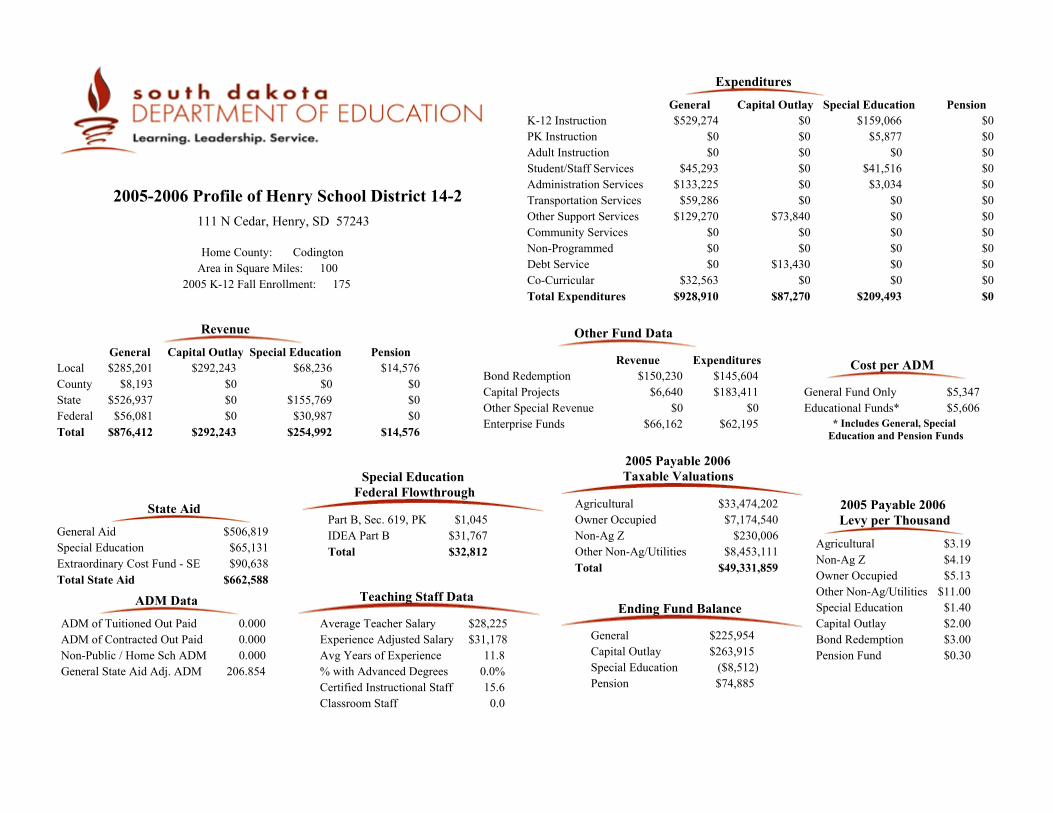
General $225,954Capital Outlay $263,915
Pension $74,885Special Education ($8,512)
Ending Fund Balance
Bond Redemption $145,604Capital Projects $183,411
Other Fund Data
Agricultural $3.19Non-Ag Z $4.19Owner Occupied $5.13Other Non-Ag/Utilities $11.00Special Education $1.40
Bond Redemption $3.00Pension Fund $0.30
Capital Outlay $2.00
2005 Payable 2006 Levy per Thousand
$506,819$65,131$90,638
General AidSpecial EducationExtraordinary Cost Fund - SE
$662,588Total State Aid
State Aid
Special Education Federal Flowthrough
$31,767IDEA Part BPart B, Sec. 619, PK $1,045
$32,812Total
K-12 Instruction $529,274PK Instruction $0Adult Instruction $0
$159,066$5,877
$0
General Special Education
Expenditures
Community Services $0Non-Programmed $0Debt Service $0Co-Curricular $32,563
$0$0$0$0
Total Expenditures $928,910 $209,493
2005 Payable 2006Taxable Valuations
Agricultural $33,474,202Owner Occupied $7,174,540Non-Ag Z $230,006Other Non-Ag/Utilities $8,453,111Total $49,331,859
$31,17811.8
0.0%15.6
$28,225Average Teacher SalaryExperience Adjusted SalaryAvg Years of Experience% with Advanced DegreesCertified Instructional Staff
Teaching Staff Data
ADM of Tuitioned Out Paid 0.000
General State Aid Adj. ADM 206.854Non-Public / Home Sch ADM 0.000
ADM Data
Local $285,201County $8,193State $526,937Federal $56,081Total $876,412
$292,243$0$0$0
$68,236$0
$155,769$30,987
General Capital Outlay Special Education Pension
$292,243 $254,992 $14,576
Revenue
Classroom Staff 0.0
ADM of Contracted Out Paid 0.000
Other Special Revenue $0
111 N Cedar, Henry, SD 57243
2005-2006 Profile of Henry School District 14-2
Capital Outlay Pension
Student/Staff ServicesAdministration ServicesTransportation ServicesOther Support Services
Enterprise Funds
Cost per ADM
General Fund Only
Revenue Expenditures
* Includes General, Special Education and Pension Funds
Home County: CodingtonArea in Square Miles: 100
2005 K-12 Fall Enrollment: 175
$14,576$0$0$0
$0$0
$0$0$0
$45,293$133,225
$59,286$129,270
$0$0$0
$73,840$0$0
$13,430$0
$41,516$3,034
$0$0
$0$0$0$0$0$0$0$0
$5,347Educational Funds* $5,606
$150,230$6,640
$0$66,162 $62,195
$87,270 $0
$0

December 2005 Federal Child Count
0Deaf-Blind
03
4
DeafSpeech/Language
Autism
0Emotionally Disturbed00
22100
Mental RetardationHearing ImpairedLearning DisabledMultiple DisabilitiesOrthopedic ImpairmentVisually Impaired
2
10
Other Health Impaired
Traumatic Brain InjuryDevelopmental Delay
33Total
0
0
01
00
24
5
3
0
0
0
Home
Early Childhood Setting
PT Early Child and SEEarly Childhood SE Setting
Separate SchoolResidential Facility
Regular Classroom
Resource Room
Self-Contained Classroom
Day Program
24 Hour Program
Home/Hospital Program
Special Education Placement Categories
Total 33
Student to Staff Ratio 11.8
K-8 98.8809-12 54.772
100.99457.467
ADA ADM
Total 153.652 158.461
Student Data
PK-12 Enrollment 184Open Enrolled Students Rec'd 70District Dropout Rate 0.0%
% Special Needs Students 17.9%% Eligible for Free/Red. Lunch 45.2%
Students Transported 86
District Attendance RateNumber of Graduates
97.0%10
Enrollment
Stanford Achievement Test Series, Tenth Edition (SAT10)
88
84
74
78
79
80
Math
Social Science
Language Arts
Reading
Complete Battery
Science
Stanford Writing Assessment Program, Third Edition
Grade 5
Grade 9
American College Test (ACT)
Grade 5Total
PRSpEd
PR
Number Tested
English
8
75%
Total PR
Sp Ed PR
79
78
78
63
77
76
68
67
51
59
78
66
67%
Grade 4 Grade 3Total
PRSp Ed
PR
Grade 6Total
PRSp Ed
PR
12 12 182 4 3
Sp EdTotal
Number Tested
Grade 7Total
PRSp Ed
PR
Grade 8 Total
PRSp Ed
PR
Grade 11Total
PRSp Ed
PR
MathReadingScienceComposite Score
76
70
66
53
48
61
13 6
78
61
73
49
65
67
72
75
71
64
69
69
91
75
67
75
64
75
314 212 110
Percent Proficient or Higher
No assessment data are reported when less than ten students were tested.
Ideas and Development
Sp EdTotal
Organization, Unity, and Coherence
Sp EdTotal
Word Choice
Sp EdTotal
Sentences and Paragraphs
Sp EdTotal
Grammer and Usage
Sp EdTotal
Writing Mechanics
Sp EdTotal
NumberTested
73% 73% 80%
58%
53%
75%
53%
67%
47%
83%
15
12

General $197,680Capital Outlay $272,035
PensionSpecial Education $7,065
Ending Fund Balance
Bond Redemption $0Capital Projects $0
Other Fund Data
Agricultural $3.19Non-Ag Z $4.19Owner Occupied $5.13Other Non-Ag/Utilities $11.00Special Education $1.40
Bond Redemption $0.00Pension Fund $0.00
Capital Outlay $3.00
2005 Payable 2006 Levy per Thousand
$467,736$14,953$99,691
General AidSpecial EducationExtraordinary Cost Fund - SE
$582,380Total State Aid
State Aid
Special Education Federal Flowthrough
$28,233IDEA Part BPart B, Sec. 619, PK $3,479
$31,712Total
K-12 Instruction $630,151PK Instruction $0Adult Instruction $0
$69,984$26,950
$0
General Special Education
Expenditures
Community Services $0Non-Programmed $0Debt Service $0Co-Curricular $54,147
$0$0$0$0
Total Expenditures $1,067,285 $222,101
2005 Payable 2006Taxable Valuations
Agricultural $47,318,891Owner Occupied $7,436,414Non-Ag Z $189,300Other Non-Ag/Utilities $2,763,262Total $57,707,867
$31,38717.2
7.1%13.2
$32,054Average Teacher SalaryExperience Adjusted SalaryAvg Years of Experience% with Advanced DegreesCertified Instructional Staff
Teaching Staff Data
ADM of Tuitioned Out Paid 0.000
General State Aid Adj. ADM 167.880Non-Public / Home Sch ADM 1.860
ADM Data
Local $297,844County $10,489State $499,198Federal $68,629Total $876,160
$180,502$0$0$0
$78,806$0
$114,644$36,577
General Capital Outlay Special Education Pension
$180,502 $230,027 $0
Revenue
Classroom Staff 0.0
ADM of Contracted Out Paid 0.000
Other Special Revenue $0
302 Main St, Herreid, SD 57632
2005-2006 Profile of Herreid School District 10-1
Capital Outlay Pension
Student/Staff ServicesAdministration ServicesTransportation ServicesOther Support Services
Enterprise Funds
Cost per ADM
General Fund Only
Revenue Expenditures
* Includes General, Special Education and Pension Funds
Home County: CampbellArea in Square Miles: 274
2005 K-12 Fall Enrollment: 140
$0$0$0$0
$0$0
$0$0$0
$54,024$76,309$75,735
$176,918
$0$0
$10,250$52,810
$0$0
$10,339$2,626
$103,468$21,700
$0$0
$0$0$0$0$0$0$0$0
$7,629Educational Funds* $8,985
$0$0$0
$50,764 $75,631
$127,727 $0
$51,702

December 2005 Federal Child Count
0Deaf-Blind
08
1
DeafSpeech/Language
Autism
0Emotionally Disturbed104000
Mental RetardationHearing ImpairedLearning DisabledMultiple DisabilitiesOrthopedic ImpairmentVisually Impaired
0
15
Other Health Impaired
Traumatic Brain InjuryDevelopmental Delay
20Total
0
0
33
00
11
2
1
0
0
0
Home
Early Childhood Setting
PT Early Child and SEEarly Childhood SE Setting
Separate SchoolResidential Facility
Regular Classroom
Resource Room
Self-Contained Classroom
Day Program
24 Hour Program
Home/Hospital Program
Special Education Placement Categories
Total 20
Student to Staff Ratio 10.6
K-8 89.9009-12 50.000
89.90050.000
ADA ADM
Total 139.900 139.900
Student Data
PK-12 Enrollment 140Open Enrolled Students Rec'd 9District Dropout Rate 0.0%
% Special Needs Students 14.3%% Eligible for Free/Red. Lunch 29.4%
Students Transported 58
District Attendance RateNumber of Graduates
100.0%15
Enrollment
Stanford Achievement Test Series, Tenth Edition (SAT10)
74
86
81
59
78
75
Math
Social Science
Language Arts
Reading
Complete Battery
Science
Stanford Writing Assessment Program, Third Edition
Grade 5
Grade 9
American College Test (ACT)
Grade 5Total
PRSpEd
PR
Number Tested
English
15
90%
Total PR
Sp Ed PR
78
76
74
75
67
72
69
72
54
58
83
69
100%
Grade 4 Grade 3Total
PRSp Ed
PR
Grade 6Total
PRSp Ed
PR
6 14 101 1
Sp EdTotal
Number Tested
Grade 7Total
PRSp Ed
PR
Grade 8 Total
PRSp Ed
PR
Grade 11Total
PRSp Ed
PR
MathReadingScienceComposite Score
17.118.719.7
18.518.7
93
95
92
93
92
92
15 2
49
62
82
65
70
64
63
61
56
72
50
60
71
52
69
70
67
65
13 5 111
Percent Proficient or Higher
No assessment data are reported when less than ten students were tested.
Ideas and Development
Sp EdTotal
Organization, Unity, and Coherence
Sp EdTotal
Word Choice
Sp EdTotal
Sentences and Paragraphs
Sp EdTotal
Grammer and Usage
Sp EdTotal
Writing Mechanics
Sp EdTotal
NumberTested
67% 58% 58%
100%
58%
90%
67%
90%
50%
80%
12
10

General $305,329Capital Outlay $795,212
Pension $19,145Special Education $132,770
Ending Fund Balance
Bond Redemption $0Capital Projects $0
Other Fund Data
Agricultural $2.80Non-Ag Z $3.68Owner Occupied $4.50Other Non-Ag/Utilities $9.66Special Education $1.40
Bond Redemption $0.00Pension Fund $0.30
Capital Outlay $2.38
2005 Payable 2006 Levy per Thousand
$0$0$0
General AidSpecial EducationExtraordinary Cost Fund - SE
$0Total State Aid
State Aid
Special Education Federal Flowthrough
$93,710IDEA Part BPart B, Sec. 619, PK $2,693
$96,403Total
K-12 Instruction $2,153,932PK Instruction $0Adult Instruction $0
$327,828$5,454
$0
General Special Education
Expenditures
Community Services $0Non-Programmed $4Debt Service $0Co-Curricular $203,130
$0$0$0$0
Total Expenditures $3,898,466 $444,397
2005 Payable 2006Taxable Valuations
Agricultural $3,324,923Owner Occupied $117,503,382Non-Ag Z $781,582Other Non-Ag/Utilities $200,481,880Total $322,091,767
$33,58214.0
9.3%42.7
$34,038Average Teacher SalaryExperience Adjusted SalaryAvg Years of Experience% with Advanced DegreesCertified Instructional Staff
Teaching Staff Data
ADM of Tuitioned Out Paid 0.000
General State Aid Adj. ADM 515.968Non-Public / Home Sch ADM 7.376
ADM Data
Local $2,666,221County $41,954State $65,256Federal $661,721Total $3,435,151
$812,031$362
$0$1,408
$422,253$192
$0$98,635
General Capital Outlay Special Education Pension
$813,802 $521,081 $91,156
Revenue
Classroom Staff 0.0
ADM of Contracted Out Paid 0.000
Other Special Revenue $0
421 Main St, Hill City, SD 57745
2005-2006 Profile of Hill City School District 51-2
Capital Outlay Pension
Student/Staff ServicesAdministration ServicesTransportation ServicesOther Support Services
Enterprise Funds
Cost per ADM
General Fund Only
Revenue Expenditures
* Includes General, Special Education and Pension Funds
Home County: PenningtonArea in Square Miles: 580
2005 K-12 Fall Enrollment: 511
$91,114$41$0$0
$0$0
$79,597$0$0
$252,585$476,086$151,776$660,953
$54,175$0$0
$245,599$0$0
$291,331$9,619
$110,624$0
$491$0
$3,730$0$0$0$0$0$0$0
$7,794Educational Funds* $8,838
$0$0
$811,035$199,931 $241,013
$675,145 $83,327
$74,422

December 2005 Federal Child Count
0Deaf-Blind
07
1
DeafSpeech/Language
Autism
0Emotionally Disturbed11
61110
Mental RetardationHearing ImpairedLearning DisabledMultiple DisabilitiesOrthopedic ImpairmentVisually Impaired
5
03
Other Health Impaired
Traumatic Brain InjuryDevelopmental Delay
81Total
0
0
70
00
28
45
1
0
0
0
Home
Early Childhood Setting
PT Early Child and SEEarly Childhood SE Setting
Separate SchoolResidential Facility
Regular Classroom
Resource Room
Self-Contained Classroom
Day Program
24 Hour Program
Home/Hospital Program
Special Education Placement Categories
Total 81
Student to Staff Ratio 12.0
K-8 296.1769-12 175.930
311.799187.411
ADA ADM
Total 472.106 499.210
Student Data
PK-12 Enrollment 514Open Enrolled Students Rec'd 41District Dropout Rate 0.7%
% Special Needs Students 15.8%% Eligible for Free/Red. Lunch 36.5%
Students Transported 156
District Attendance RateNumber of Graduates
94.6%56
Enrollment
Stanford Achievement Test Series, Tenth Edition (SAT10)
67
80
67
54
67
66
Math
Social Science
Language Arts
Reading
Complete Battery
Science
Stanford Writing Assessment Program, Third Edition
Grade 5
Grade 9
American College Test (ACT)
Grade 5Total
PRSpEd
PR
Number Tested
English
35
62%
Total PR
Sp Ed PR
69
76
75
65
74
69
60
66
63
48
72
62
57%
Grade 4 Grade 3Total
PRSp Ed
PR
Grade 6Total
PRSp Ed
PR
36 37 455 5 4
Sp EdTotal
Number Tested
Grade 7Total
PRSp Ed
PR
Grade 8 Total
PRSp Ed
PR
Grade 11Total
PRSp Ed
PR
MathReadingScienceComposite Score
22.119.721.2
21.921.3
53
64
56
46
53
51
40 4
47
74
71
66
55
58
59
71
68
70
63
64
54
63
69
63
65
61
933 740 838
Percent Proficient or Higher
No assessment data are reported when less than ten students were tested.
Ideas and Development
Sp EdTotal
Organization, Unity, and Coherence
Sp EdTotal
Word Choice
Sp EdTotal
Sentences and Paragraphs
Sp EdTotal
Grammer and Usage
Sp EdTotal
Writing Mechanics
Sp EdTotal
NumberTested
44% 34% 47%
62%
34%
65%
50%
68%
28%
65%
32
37

General $456,770Capital Outlay $436,263
Pension $107,297Special Education $248,059
Ending Fund Balance
Bond Redemption $0Capital Projects $0
Other Fund Data
Agricultural $3.19Non-Ag Z $4.19Owner Occupied $5.13Other Non-Ag/Utilities $11.00Special Education $0.97
Bond Redemption $0.00Pension Fund $0.30
Capital Outlay $0.73
2005 Payable 2006 Levy per Thousand
$747,305$0$0
General AidSpecial EducationExtraordinary Cost Fund - SE
$747,305Total State Aid
State Aid
Special Education Federal Flowthrough
$46,377IDEA Part BPart B, Sec. 619, PK $1,114
$47,491Total
K-12 Instruction $934,730PK Instruction $0Adult Instruction $0
$211,988$0$0
General Special Education
Expenditures
Community Services $0Non-Programmed $1,106Debt Service $0Co-Curricular $89,681
$0$0$0$0
Total Expenditures $1,605,321 $224,217
2005 Payable 2006Taxable Valuations
Agricultural $152,903,475Owner Occupied $10,050,216Non-Ag Z $1,686,805Other Non-Ag/Utilities $5,419,281Total $170,059,777
$28,19919.0
8.0%24.1
$29,339Average Teacher SalaryExperience Adjusted SalaryAvg Years of Experience% with Advanced DegreesCertified Instructional Staff
Teaching Staff Data
ADM of Tuitioned Out Paid 1.017
General State Aid Adj. ADM 315.148Non-Public / Home Sch ADM 2.000
ADM Data
Local $687,219County $15,057State $855,533Federal $130,873Total $1,688,682
$133,363$0$0
$36,527
$198,543$0$0
$42,742
General Capital Outlay Special Education Pension
$169,890 $241,285 $48,206
Revenue
Classroom Staff 0.0
ADM of Contracted Out Paid 0.000
Other Special Revenue $0
401 4th Ave., Tulare, SD 57476
2005-2006 Profile of Hitchcock Tulare School District 56-6
Capital Outlay Pension
Student/Staff ServicesAdministration ServicesTransportation ServicesOther Support Services
Enterprise Funds
Cost per ADM
General Fund Only
Revenue Expenditures
* Includes General, Special Education and Pension Funds
Home County: SpinkArea in Square Miles: 483
2005 K-12 Fall Enrollment: 261
$48,206$0$0$0
$0$0
$0$0$0
$48,225$148,731$114,496$268,352
$28,122$0$0
$98,082$0$0
$12,557$2,378
$12,229$0$0$0
$0$0$0$0$0
$9,938$0$0
$6,136Educational Funds* $6,805
$0$0$0
$80,201 $84,419
$177,391 $9,938
$36,252

December 2005 Federal Child Count
0Deaf-Blind
15
1
DeafSpeech/Language
Autism
1Emotionally Disturbed10
14201
Mental RetardationHearing ImpairedLearning DisabledMultiple DisabilitiesOrthopedic ImpairmentVisually Impaired
2
00
Other Health Impaired
Traumatic Brain InjuryDevelopmental Delay
28Total
0
0
00
00
21
4
2
0
1
0
Home
Early Childhood Setting
PT Early Child and SEEarly Childhood SE Setting
Separate SchoolResidential Facility
Regular Classroom
Resource Room
Self-Contained Classroom
Day Program
24 Hour Program
Home/Hospital Program
Special Education Placement Categories
Total 28
Student to Staff Ratio 10.8
K-8 182.7349-12 69.943
188.69772.879
ADA ADM
Total 252.677 261.576
Student Data
PK-12 Enrollment 261Open Enrolled Students Rec'd 2District Dropout Rate 0.0%
% Special Needs Students 10.7%% Eligible for Free/Red. Lunch 16.8%
Students Transported 110
District Attendance RateNumber of Graduates
96.6%22
Enrollment
Stanford Achievement Test Series, Tenth Edition (SAT10)
77
61
61
55
62
65
Math
Social Science
Language Arts
Reading
Complete Battery
Science
Stanford Writing Assessment Program, Third Edition
Grade 5
Grade 9
American College Test (ACT)
Grade 5Total
PRSpEd
PR
Number Tested
English
86%
Total PR
Sp Ed PR
81
58
62
64
63
67
73
74
80
60
82
74
86%
Grade 4 Grade 3Total
PRSp Ed
PR
Grade 6Total
PRSp Ed
PR
23 27 224 2 1
Sp EdTotal
Number Tested
Grade 7Total
PRSp Ed
PR
Grade 8 Total
PRSp Ed
PR
Grade 11Total
PRSp Ed
PR
MathReadingScienceComposite Score
65
55
52
41
52
54
19 4
80
69
74
60
61
69
85
63
80
69
62
72
83
53
62
74
57
67
323 120 219
Percent Proficient or Higher
No assessment data are reported when less than ten students were tested.
Ideas and Development
Sp EdTotal
Organization, Unity, and Coherence
Sp EdTotal
Word Choice
Sp EdTotal
Sentences and Paragraphs
Sp EdTotal
Grammer and Usage
Sp EdTotal
Writing Mechanics
Sp EdTotal
NumberTested
68% 59% 68%
86%
77%
79%
55%
86%
55%
86%
22
14
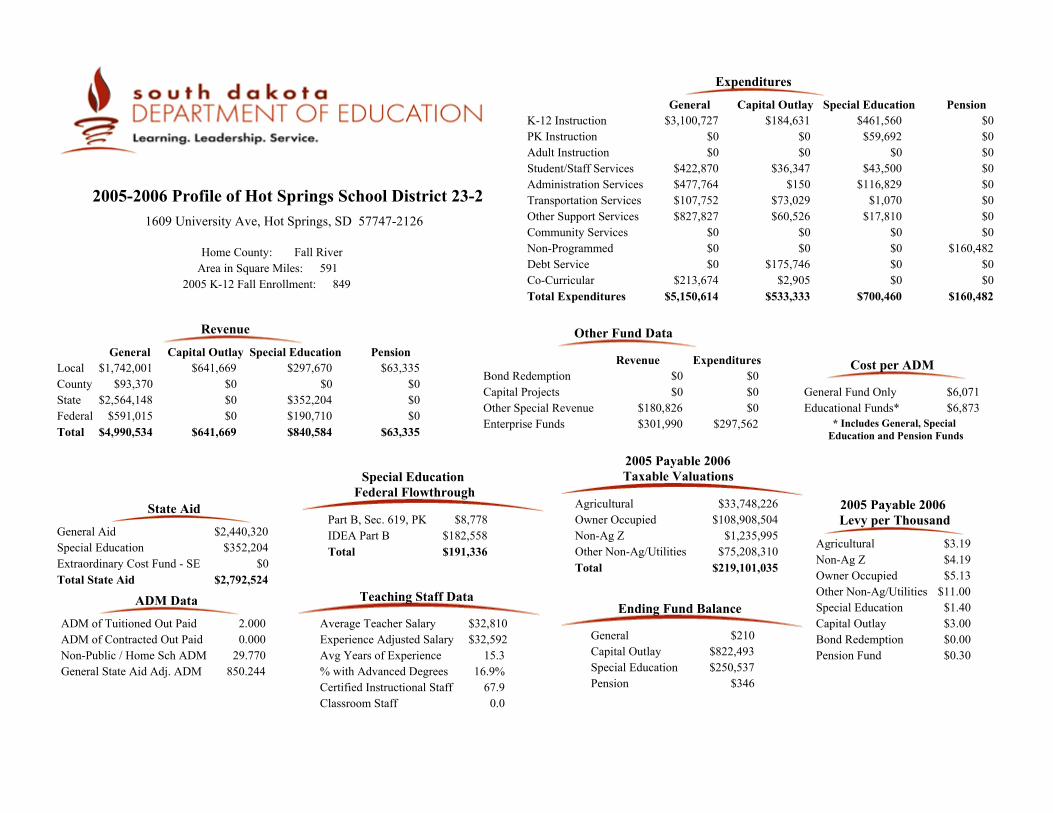
General $210Capital Outlay $822,493
Pension $346Special Education $250,537
Ending Fund Balance
Bond Redemption $0Capital Projects $0
Other Fund Data
Agricultural $3.19Non-Ag Z $4.19Owner Occupied $5.13Other Non-Ag/Utilities $11.00Special Education $1.40
Bond Redemption $0.00Pension Fund $0.30
Capital Outlay $3.00
2005 Payable 2006 Levy per Thousand
$2,440,320$352,204
$0
General AidSpecial EducationExtraordinary Cost Fund - SE
$2,792,524Total State Aid
State Aid
Special Education Federal Flowthrough
$182,558IDEA Part BPart B, Sec. 619, PK $8,778
$191,336Total
K-12 Instruction $3,100,727PK Instruction $0Adult Instruction $0
$461,560$59,692
$0
General Special Education
Expenditures
Community Services $0Non-Programmed $0Debt Service $0Co-Curricular $213,674
$0$0$0$0
Total Expenditures $5,150,614 $700,460
2005 Payable 2006Taxable Valuations
Agricultural $33,748,226Owner Occupied $108,908,504Non-Ag Z $1,235,995Other Non-Ag/Utilities $75,208,310Total $219,101,035
$32,59215.3
16.9%67.9
$32,810Average Teacher SalaryExperience Adjusted SalaryAvg Years of Experience% with Advanced DegreesCertified Instructional Staff
Teaching Staff Data
ADM of Tuitioned Out Paid 2.000
General State Aid Adj. ADM 850.244Non-Public / Home Sch ADM 29.770
ADM Data
Local $1,742,001County $93,370State $2,564,148Federal $591,015Total $4,990,534
$641,669$0$0$0
$297,670$0
$352,204$190,710
General Capital Outlay Special Education Pension
$641,669 $840,584 $63,335
Revenue
Classroom Staff 0.0
ADM of Contracted Out Paid 0.000
Other Special Revenue $0
1609 University Ave, Hot Springs, SD 57747-2126
2005-2006 Profile of Hot Springs School District 23-2
Capital Outlay Pension
Student/Staff ServicesAdministration ServicesTransportation ServicesOther Support Services
Enterprise Funds
Cost per ADM
General Fund Only
Revenue Expenditures
* Includes General, Special Education and Pension Funds
Home County: Fall RiverArea in Square Miles: 591
2005 K-12 Fall Enrollment: 849
$63,335$0$0$0
$0$0
$0$0$0
$422,870$477,764$107,752$827,827
$36,347$150
$73,029$60,526
$0$0
$175,746$2,905
$43,500$116,829
$1,070$17,810
$0$0$0$0$0
$160,482$0$0
$6,071Educational Funds* $6,873
$0$0
$180,826$301,990 $297,562
$533,333 $160,482
$184,631

December 2005 Federal Child Count
0Deaf-Blind
027
3
DeafSpeech/Language
Autism
4Emotionally Disturbed61
30501
Mental RetardationHearing ImpairedLearning DisabledMultiple DisabilitiesOrthopedic ImpairmentVisually Impaired
15
118
Other Health Impaired
Traumatic Brain InjuryDevelopmental Delay
111Total
0
4
121
00
66
14
1
0
3
1
Home
Early Childhood Setting
PT Early Child and SEEarly Childhood SE Setting
Separate SchoolResidential Facility
Regular Classroom
Resource Room
Self-Contained Classroom
Day Program
24 Hour Program
Home/Hospital Program
Special Education Placement Categories
Total 111
Student to Staff Ratio 13.0
K-8 530.0469-12 272.166
559.277287.967
ADA ADM
Total 802.212 847.244
Student Data
PK-12 Enrollment 880Open Enrolled Students Rec'd 48District Dropout Rate 2.4%
% Special Needs Students 12.6%% Eligible for Free/Red. Lunch 33.7%
Students Transported 165
District Attendance RateNumber of Graduates
94.7%55
Enrollment
Stanford Achievement Test Series, Tenth Edition (SAT10)
75
75
72
54
71
70
Math
Social Science
Language Arts
Reading
Complete Battery
Science
Stanford Writing Assessment Program, Third Edition
Grade 5
Grade 9
American College Test (ACT)
Grade 5Total
PRSpEd
PR
Number Tested
English
35
65%
Total PR
Sp Ed PR
68
65
69
58
62
64
69
77
66
44
68
65
65%
Grade 4 Grade 3Total
PRSp Ed
PR
Grade 6Total
PRSp Ed
PR
65 86 627 6 4
Sp EdTotal
Number Tested
Grade 7Total
PRSp Ed
PR
Grade 8 Total
PRSp Ed
PR
Grade 11Total
PRSp Ed
PR
MathReadingScienceComposite Score
22.521.920.6
22.321.9
75
62
67
56
63
63
50 2
76
66
73
61
66
69
46
59
50
44
45
48
56
60
57
60
61
58
442 772 676
Percent Proficient or Higher
No assessment data are reported when less than ten students were tested.
Ideas and Development
Sp EdTotal
Organization, Unity, and Coherence
Sp EdTotal
Word Choice
Sp EdTotal
Sentences and Paragraphs
Sp EdTotal
Grammer and Usage
Sp EdTotal
Writing Mechanics
Sp EdTotal
NumberTested
80% 73% 75%
62%
70%
59%
65%
68%
45%
67%
40
99
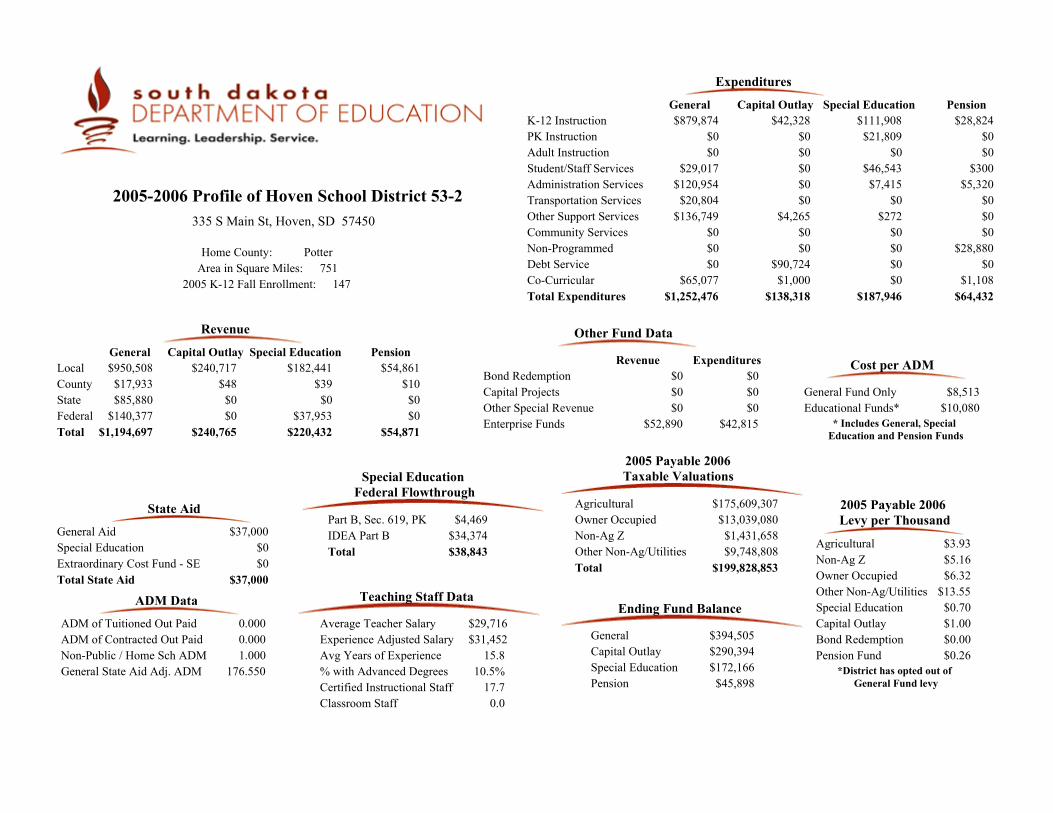
General $394,505Capital Outlay $290,394
Pension $45,898Special Education $172,166
Ending Fund Balance
Bond Redemption $0Capital Projects $0
Other Fund Data
Agricultural $3.93Non-Ag Z $5.16Owner Occupied $6.32Other Non-Ag/Utilities $13.55Special Education $0.70
Bond Redemption $0.00Pension Fund $0.26
Capital Outlay $1.00
2005 Payable 2006 Levy per Thousand
$37,000$0$0
General AidSpecial EducationExtraordinary Cost Fund - SE
$37,000Total State Aid
State Aid
Special Education Federal Flowthrough
$34,374IDEA Part BPart B, Sec. 619, PK $4,469
$38,843Total
K-12 Instruction $879,874PK Instruction $0Adult Instruction $0
$111,908$21,809
$0
General Special Education
Expenditures
Community Services $0Non-Programmed $0Debt Service $0Co-Curricular $65,077
$0$0$0$0
Total Expenditures $1,252,476 $187,946
2005 Payable 2006Taxable Valuations
Agricultural $175,609,307Owner Occupied $13,039,080Non-Ag Z $1,431,658Other Non-Ag/Utilities $9,748,808Total $199,828,853
$31,45215.8
10.5%17.7
$29,716Average Teacher SalaryExperience Adjusted SalaryAvg Years of Experience% with Advanced DegreesCertified Instructional Staff
Teaching Staff Data
ADM of Tuitioned Out Paid 0.000
General State Aid Adj. ADM 176.550Non-Public / Home Sch ADM 1.000
ADM Data
Local $950,508County $17,933State $85,880Federal $140,377Total $1,194,697
$240,717$48
$0$0
$182,441$39
$0$37,953
General Capital Outlay Special Education Pension
$240,765 $220,432 $54,871
Revenue
Classroom Staff 0.0
ADM of Contracted Out Paid 0.000
Other Special Revenue $0
335 S Main St, Hoven, SD 57450
2005-2006 Profile of Hoven School District 53-2
Capital Outlay Pension
Student/Staff ServicesAdministration ServicesTransportation ServicesOther Support Services
Enterprise Funds
Cost per ADM
General Fund Only
Revenue Expenditures
* Includes General, Special Education and Pension Funds
Home County: PotterArea in Square Miles: 751
2005 K-12 Fall Enrollment: 147
$54,861$10$0$0
$0$0
$28,824$0$0
$29,017$120,954
$20,804$136,749
$0$0$0
$4,265$0$0
$90,724$1,000
$46,543$7,415
$0$272
$300$5,320
$0$0$0
$28,880$0
$1,108
$8,513Educational Funds* $10,080
$0$0$0
$52,890 $42,815
*District has opted out of General Fund levy
$138,318 $64,432
$42,328

December 2005 Federal Child Count
0Deaf-Blind
09
0
DeafSpeech/Language
Autism
1Emotionally Disturbed10
12000
Mental RetardationHearing ImpairedLearning DisabledMultiple DisabilitiesOrthopedic ImpairmentVisually Impaired
0
00
Other Health Impaired
Traumatic Brain InjuryDevelopmental Delay
23Total
1
0
20
00
16
4
0
0
0
0
Home
Early Childhood Setting
PT Early Child and SEEarly Childhood SE Setting
Separate SchoolResidential Facility
Regular Classroom
Resource Room
Self-Contained Classroom
Day Program
24 Hour Program
Home/Hospital Program
Special Education Placement Categories
Total 23
Student to Staff Ratio 8.8
K-8 90.4249-12 51.790
92.94354.182
ADA ADM
Total 142.214 147.125
Student Data
PK-12 Enrollment 156Open Enrolled Students Rec'd 6District Dropout Rate 1.3%
% Special Needs Students 14.7%% Eligible for Free/Red. Lunch 55.6%
Students Transported 13
District Attendance RateNumber of Graduates
96.7%17
Enrollment
Stanford Achievement Test Series, Tenth Edition (SAT10)
79
75
76
57
63
69
Math
Social Science
Language Arts
Reading
Complete Battery
Science
Stanford Writing Assessment Program, Third Edition
Grade 5
Grade 9
American College Test (ACT)
Grade 5Total
PRSpEd
PR
Number Tested
English
14
79%
Total PR
Sp Ed PR
69
67
47
47
64
61
72
58
54
54
69
62
79%
Grade 4 Grade 3Total
PRSp Ed
PR
Grade 6Total
PRSp Ed
PR
11 10 133 2
Sp EdTotal
Number Tested
Grade 7Total
PRSp Ed
PR
Grade 8 Total
PRSp Ed
PR
Grade 11Total
PRSp Ed
PR
MathReadingScienceComposite Score
21.523.221.6
20.921.9
75
72
74
81
57
68
8 2
83
79
86
74
57
75
76
75
74
74
67
72
85
69
73
83
73
77
10 213 110
Percent Proficient or Higher
No assessment data are reported when less than ten students were tested.
Ideas and Development
Sp EdTotal
Organization, Unity, and Coherence
Sp EdTotal
Word Choice
Sp EdTotal
Sentences and Paragraphs
Sp EdTotal
Grammer and Usage
Sp EdTotal
Writing Mechanics
Sp EdTotal
NumberTested
40% 40% 40%
71%
62%
64%
40%
64%
40%
64%
10
14

General $693,459Capital Outlay $474,994
Pension $2,407Special Education $6,310
Ending Fund Balance
Bond Redemption $0Capital Projects $0
Other Fund Data
Agricultural $4.06Non-Ag Z $5.33Owner Occupied $6.53Other Non-Ag/Utilities $14.00Special Education $1.40
Bond Redemption $0.00Pension Fund $0.30
Capital Outlay $0.74
2005 Payable 2006 Levy per Thousand
$1,010,581$5,070
$42,858
General AidSpecial EducationExtraordinary Cost Fund - SE
$1,058,509Total State Aid
State Aid
Special Education Federal Flowthrough
$84,259IDEA Part BPart B, Sec. 619, PK $4,575
$88,834Total
K-12 Instruction $1,226,843PK Instruction $0Adult Instruction $0
$316,157$8,800
$0
General Special Education
Expenditures
Community Services $43,926Non-Programmed $3,135Debt Service $0Co-Curricular $121,639
$0$0$0$0
Total Expenditures $2,365,937 $430,968
2005 Payable 2006Taxable Valuations
Agricultural $179,802,356Owner Occupied $20,350,781Non-Ag Z $3,169,112Other Non-Ag/Utilities $12,169,811Total $215,492,060
$30,19317.9
11.8%32.3
$31,967Average Teacher SalaryExperience Adjusted SalaryAvg Years of Experience% with Advanced DegreesCertified Instructional Staff
Teaching Staff Data
ADM of Tuitioned Out Paid 1.919
General State Aid Adj. ADM 419.654Non-Public / Home Sch ADM 0.000
ADM Data
Local $1,257,701County $11,675State $1,060,410Federal $142,761Total $2,472,548
$197,660$0$0$0
$292,942$0
$47,928$97,434
General Capital Outlay Special Education Pension
$197,660 $438,304 $59,216
Revenue
Classroom Staff 0.0
ADM of Contracted Out Paid 0.000
Other Special Revenue $0
500 N Section Line, Howard, SD 57349-0069
2005-2006 Profile of Howard School District 48-3
Capital Outlay Pension
Student/Staff ServicesAdministration ServicesTransportation ServicesOther Support Services
Enterprise Funds
Cost per ADM
General Fund Only
Revenue Expenditures
* Includes General, Special Education and Pension Funds
Home County: MinerArea in Square Miles: 438
2005 K-12 Fall Enrollment: 399
$59,216$0$0$0
$0$0
$50,635$0$0
$176,882$274,632$168,603$350,278
$11,357$2,188
$70,568$132,143
$0$0
$77,245$5,417
$94,013$7,976$2,724$1,298
$4,415$3,575
$0$0$0$0$0$0
$5,839Educational Funds* $6,946
$0$0$0
$178,309 $180,125
*District has opted out of General Fund levy
$377,590 $58,625
$78,672

December 2005 Federal Child Count
0Deaf-Blind
019
0
DeafSpeech/Language
Autism
3Emotionally Disturbed50
28300
Mental RetardationHearing ImpairedLearning DisabledMultiple DisabilitiesOrthopedic ImpairmentVisually Impaired
11
06
Other Health Impaired
Traumatic Brain InjuryDevelopmental Delay
75Total
0
1
54
00
38
24
2
0
1
0
Home
Early Childhood Setting
PT Early Child and SEEarly Childhood SE Setting
Separate SchoolResidential Facility
Regular Classroom
Resource Room
Self-Contained Classroom
Day Program
24 Hour Program
Home/Hospital Program
Special Education Placement Categories
Total 75
Student to Staff Ratio 12.2
K-8 247.1839-12 135.301
255.102142.047
ADA ADM
Total 382.484 397.149
Student Data
PK-12 Enrollment 394Open Enrolled Students Rec'd 18District Dropout Rate 0.9%
% Special Needs Students 19.0%% Eligible for Free/Red. Lunch 22.7%
Students Transported 242
District Attendance RateNumber of Graduates
96.3%34
Enrollment
Stanford Achievement Test Series, Tenth Edition (SAT10)
78
74
84
62
73
73
Math
Social Science
Language Arts
Reading
Complete Battery
Science
Stanford Writing Assessment Program, Third Edition
Grade 5
Grade 9
American College Test (ACT)
Grade 5Total
PRSpEd
PR
Number Tested
English
31
50%
Total PR
Sp Ed PR
80
82
76
66
66
73
78
79
71
62
83
75
53%
Grade 4 Grade 3Total
PRSp Ed
PR
Grade 6Total
PRSp Ed
PR
24 33 381 4 5
Sp EdTotal
Number Tested
Grade 7Total
PRSp Ed
PR
Grade 8 Total
PRSp Ed
PR
Grade 11Total
PRSp Ed
PR
MathReadingScienceComposite Score
20.720.820.5
21.421.0
74
70
79
57
67
69
28 9
67
75
79
59
61
67
86
80
85
76
80
81
75
70
67
64
59
66
328 224 539
Percent Proficient or Higher
No assessment data are reported when less than ten students were tested.
Ideas and Development
Sp EdTotal
Organization, Unity, and Coherence
Sp EdTotal
Word Choice
Sp EdTotal
Sentences and Paragraphs
Sp EdTotal
Grammer and Usage
Sp EdTotal
Writing Mechanics
Sp EdTotal
NumberTested
38% 48% 34%
63%
28%
43%
41%
50%
34%
63%
29
30

General $408,977Capital Outlay $288,008
Pension $2,485Special Education $10,866
Ending Fund Balance
Bond Redemption $141,635Capital Projects $0
Other Fund Data
Agricultural $4.80Non-Ag Z $6.30Owner Occupied $7.72Other Non-Ag/Utilities $16.55Special Education $1.40
Bond Redemption $1.97Pension Fund $0.30
Capital Outlay $1.60
2005 Payable 2006 Levy per Thousand
$491,088$1,041
$0
General AidSpecial EducationExtraordinary Cost Fund - SE
$492,129Total State Aid
State Aid
Special Education Federal Flowthrough
$32,396IDEA Part BPart B, Sec. 619, PK $2,997
$35,393Total
K-12 Instruction $501,337PK Instruction $2,551Adult Instruction $0
$66,582$14,228
$0
General Special Education
Expenditures
Community Services $30,379Non-Programmed $0Debt Service $1,400Co-Curricular $65,527
$0$0$0$0
Total Expenditures $1,113,691 $137,124
2005 Payable 2006Taxable Valuations
Agricultural $53,577,445Owner Occupied $13,222,970Non-Ag Z $1,049,945Other Non-Ag/Utilities $5,271,885Total $73,122,245
$26,81115.2
27.8%15.1
$25,989Average Teacher SalaryExperience Adjusted SalaryAvg Years of Experience% with Advanced DegreesCertified Instructional Staff
Teaching Staff Data
ADM of Tuitioned Out Paid 0.000
General State Aid Adj. ADM 183.550Non-Public / Home Sch ADM 7.000
ADM Data
Local $578,750County $5,244State $513,373Federal $60,015Total $1,157,381
$127,097$0$0$0
$102,727$0
$1,041$40,516
General Capital Outlay Special Education Pension
$127,097 $144,283 $22,134
Revenue
Classroom Staff 0.0
ADM of Contracted Out Paid 0.000
Other Special Revenue $0
501 Adams St, Hurley, SD 57036-0278
2005-2006 Profile of Hurley School District 60-2
Capital Outlay Pension
Student/Staff ServicesAdministration ServicesTransportation ServicesOther Support Services
Enterprise Funds
Cost per ADM
General Fund Only
Revenue Expenditures
* Includes General, Special Education and Pension Funds
Home County: TurnerArea in Square Miles: 102
2005 K-12 Fall Enrollment: 155
$22,134$0$0$0
$0$0
$19,500$0$0
$57,866$143,822
$65,845$244,964
$2,544$0$0
$11,341$0$0
$49,594$6,313
$36,149$10,109$4,696$5,360
$0$0$0$0$0$0$0$0
$7,066Educational Funds* $7,978
$154,476$0$0
$69,326 $71,950
*District has opted out of General Fund levy
$94,809 $19,500
$25,017

December 2005 Federal Child Count
0Deaf-Blind
09
0
DeafSpeech/Language
Autism
0Emotionally Disturbed11
10100
Mental RetardationHearing ImpairedLearning DisabledMultiple DisabilitiesOrthopedic ImpairmentVisually Impaired
0
00
Other Health Impaired
Traumatic Brain InjuryDevelopmental Delay
22Total
0
1
05
00
14
2
0
0
0
0
Home
Early Childhood Setting
PT Early Child and SEEarly Childhood SE Setting
Separate SchoolResidential Facility
Regular Classroom
Resource Room
Self-Contained Classroom
Day Program
24 Hour Program
Home/Hospital Program
Special Education Placement Categories
Total 22
Student to Staff Ratio 10.6
K-8 101.8809-12 47.656
103.71149.247
ADA ADM
Total 149.536 152.958
Student Data
PK-12 Enrollment 160Open Enrolled Students Rec'd 17District Dropout Rate 0.0%
% Special Needs Students 13.8%% Eligible for Free/Red. Lunch 19.2%
Students Transported 56
District Attendance RateNumber of Graduates
97.8%9
Enrollment
Stanford Achievement Test Series, Tenth Edition (SAT10)
83
88
80
75
78
79
Math
Social Science
Language Arts
Reading
Complete Battery
Science
Stanford Writing Assessment Program, Third Edition
Grade 5
Grade 9
American College Test (ACT)
Grade 5Total
PRSpEd
PR
Number Tested
English
9
64%
Total PR
Sp Ed PR
76
76
62
56
56
65
81
81
57
60
78
72
71%
Grade 4 Grade 3Total
PRSp Ed
PR
Grade 6Total
PRSp Ed
PR
9 15 10
Sp EdTotal
Number Tested
Grade 7Total
PRSp Ed
PR
Grade 8 Total
PRSp Ed
PR
Grade 11Total
PRSp Ed
PR
MathReadingScienceComposite Score
82
76
83
35
47
56
15 3
88
77
88
71
70
79
90
72
76
80
75
80
77
75
76
72
57
69
213 110 9
Percent Proficient or Higher
No assessment data are reported when less than ten students were tested.
Ideas and Development
Sp EdTotal
Organization, Unity, and Coherence
Sp EdTotal
Word Choice
Sp EdTotal
Sentences and Paragraphs
Sp EdTotal
Grammer and Usage
Sp EdTotal
Writing Mechanics
Sp EdTotal
NumberTested
86% 86% 86%
71%
62%
71%
57%
79%
50%
79%
14
14

General $2,385,142Capital Outlay $2,358,543
Pension ($46,137)Special Education $508,821
Ending Fund Balance
Bond Redemption $897,895Capital Projects $0
Other Fund Data
Agricultural $3.19Non-Ag Z $4.19Owner Occupied $5.13Other Non-Ag/Utilities $11.00Special Education $1.30
Bond Redemption $1.68Pension Fund $0.30
Capital Outlay $2.95
2005 Payable 2006 Levy per Thousand
$5,251,642$982,035
$0
General AidSpecial EducationExtraordinary Cost Fund - SE
$6,233,677Total State Aid
State Aid
Special Education Federal Flowthrough
$466,376IDEA Part BPart B, Sec. 619, PK $10,424
$476,800Total
K-12 Instruction $6,102,170PK Instruction $0Adult Instruction $0
$1,445,811$62,155
$0
General Special Education
Expenditures
Community Services $19,790Non-Programmed $9,583Debt Service $0Co-Curricular $586,848
$0$0$0$0
Total Expenditures $11,130,822 $2,253,387
2005 Payable 2006Taxable Valuations
Agricultural $139,073,405Owner Occupied $210,848,588Non-Ag Z $2,048,241Other Non-Ag/Utilities $183,519,937Total $535,490,171
$33,81917.5
17.3%131.3
$36,598Average Teacher SalaryExperience Adjusted SalaryAvg Years of Experience% with Advanced DegreesCertified Instructional Staff
Teaching Staff Data
ADM of Tuitioned Out Paid 1.588
General State Aid Adj. ADM 1,988.781Non-Public / Home Sch ADM 262.801
ADM Data
Local $4,026,930County $181,744State $5,571,101Federal $1,239,565Total $11,019,340
$1,647,654$0$0$0
$776,955$0
$982,035$456,079
General Capital Outlay Special Education Pension
$1,647,654 $2,215,069 $158,377
Revenue
Classroom Staff 1.0
ADM of Contracted Out Paid 0.000
Other Special Revenue $4,000
88 3rd Street SE, Huron, SD 57350-0949
2005-2006 Profile of Huron School District 02-2
Capital Outlay Pension
Student/Staff ServicesAdministration ServicesTransportation ServicesOther Support Services
Enterprise Funds
Cost per ADM
General Fund Only
Revenue Expenditures
* Includes General, Special Education and Pension Funds
Home County: BeadleArea in Square Miles: 434
2005 K-12 Fall Enrollment: 1,977
$158,377$0$0$0
$0$0
$0$0$0
$1,155,887$861,896$359,092
$2,035,557
$125,912$9,000
$122,000$1,957,246
$0$0
$137,718$39,932
$596,309$129,110
$20,002$0
$0$0$0$0$0
$193,063$0$0
$5,593Educational Funds* $6,667
$916,438$0
$4,153$1,140,097 $1,129,156
$2,479,429 $193,063
$87,622

December 2005 Federal Child Count
0Deaf-Blind
084
10
DeafSpeech/Language
Autism
17Emotionally Disturbed36
386
801
Mental RetardationHearing ImpairedLearning DisabledMultiple DisabilitiesOrthopedic ImpairmentVisually Impaired
12
07
Other Health Impaired
Traumatic Brain InjuryDevelopmental Delay
264Total
0
1
292
00
136
39
52
0
5
0
Home
Early Childhood Setting
PT Early Child and SEEarly Childhood SE Setting
Separate SchoolResidential Facility
Regular Classroom
Resource Room
Self-Contained Classroom
Day Program
24 Hour Program
Home/Hospital Program
Special Education Placement Categories
Total 264
Student to Staff Ratio 15.1
K-8 1,220.6719-12 673.812
1,270.982716.498
ADA ADM
Total 1,894.483 1,987.480
Student Data
PK-12 Enrollment 1,991Open Enrolled Students Rec'd 58District Dropout Rate 4.1%
% Special Needs Students 13.3%% Eligible for Free/Red. Lunch 35.8%
Students Transported 630
District Attendance RateNumber of Graduates
95.3%153
Enrollment
Stanford Achievement Test Series, Tenth Edition (SAT10)
69
72
76
56
67
67
Math
Social Science
Language Arts
Reading
Complete Battery
Science
Stanford Writing Assessment Program, Third Edition
Grade 5
Grade 9
American College Test (ACT)
Grade 5Total
PRSpEd
PR
Number Tested
English
121
55%
57
69
72
52
54
58
Total PR
Sp Ed PR
71
72
67
61
71
68
44
34
36
32
39
39
76
79
70
61
77
72
63%
Grade 4 Grade 3Total
PRSp Ed
PR
Grade 6Total
PRSp Ed
PR
135 176 14822 19 3
Sp EdTotal
Number Tested
Grade 7Total
PRSp Ed
PR
Grade 8 Total
PRSp Ed
PR
Grade 11Total
PRSp Ed
PR
MathReadingScienceComposite Score
22.221.721.0
21.921.8
73 64
63 58
66 63
57 51
56 60
62 57
115 17
70 50
70 54
80 58
65 56
62 45
68 51
73 29
65 40
63 40
62 33
58 30
63 33
64 39
71 48
73 48
70 37
65 34
66 40
20143 15163 11166
Percent Proficient or Higher
No assessment data are reported when less than ten students were tested.
Ideas and Development
Sp EdTotal
Organization, Unity, and Coherence
Sp EdTotal
Word Choice
Sp EdTotal
Sentences and Paragraphs
Sp EdTotal
Grammer and Usage
Sp EdTotal
Writing Mechanics
Sp EdTotal
NumberTested
57% 47% 55%
59%
33%
55%
44%
65%
38%
72%
136
192

General $396,924Capital Outlay $353,094
PensionSpecial Education $371,282
Ending Fund Balance
Bond Redemption $0Capital Projects $0
Other Fund Data
Agricultural $3.76Non-Ag Z $4.94Owner Occupied $6.05Other Non-Ag/Utilities $12.97Special Education $1.40
Bond Redemption $0.00Pension Fund $0.00
Capital Outlay $2.20
2005 Payable 2006 Levy per Thousand
$442,341$0$0
General AidSpecial EducationExtraordinary Cost Fund - SE
$442,341Total State Aid
State Aid
Special Education Federal Flowthrough
$59,193IDEA Part BPart B, Sec. 619, PK $3,542
$62,735Total
K-12 Instruction $902,687PK Instruction $0Adult Instruction $0
$118,069$18,532
$0
General Special Education
Expenditures
Community Services $0Non-Programmed $3,230Debt Service $0Co-Curricular $99,511
$0$0$0$0
Total Expenditures $1,526,343 $214,941
2005 Payable 2006Taxable Valuations
Agricultural $174,418,051Owner Occupied $15,798,986Non-Ag Z $1,006,753Other Non-Ag/Utilities $19,102,858Total $210,326,648
$32,45114.5
8.0%22.5
$31,742Average Teacher SalaryExperience Adjusted SalaryAvg Years of Experience% with Advanced DegreesCertified Instructional Staff
Teaching Staff Data
ADM of Tuitioned Out Paid 0.000
General State Aid Adj. ADM 305.624Non-Public / Home Sch ADM 0.155
ADM Data
Local $1,094,039County $18,056State $469,712Federal $136,094Total $1,717,901
$438,991$0$0$0
$280,713$0$0
$63,218
General Capital Outlay Special Education Pension
$438,991 $343,931 $0
Revenue
Classroom Staff 0.0
ADM of Contracted Out Paid 0.000
Other Special Revenue $0
415 Iowa Ave S, Highmore, SD 57345
2005-2006 Profile of Hyde School District 34-1
Capital Outlay Pension
Student/Staff ServicesAdministration ServicesTransportation ServicesOther Support Services
Enterprise Funds
Cost per ADM
General Fund Only
Revenue Expenditures
* Includes General, Special Education and Pension Funds
Home County: HydeArea in Square Miles: 843
2005 K-12 Fall Enrollment: 261
$0$0$0$0
$0$0
$0$0$0
$102,337$180,646
$61,609$176,324
$0$0
$10,273$71,666
$0$0
$160,231$12,658
$43,529$33,249$1,562
$0
$0$0$0$0$0$0$0$0
$5,729Educational Funds* $6,467
$0$0$0
$108,518 $105,066
*District has opted out of General Fund levy
$371,372 $0
$116,545

December 2005 Federal Child Count
0Deaf-Blind
012
0
DeafSpeech/Language
Autism
0Emotionally Disturbed60
10200
Mental RetardationHearing ImpairedLearning DisabledMultiple DisabilitiesOrthopedic ImpairmentVisually Impaired
0
03
Other Health Impaired
Traumatic Brain InjuryDevelopmental Delay
33Total
1
2
33
00
15
9
0
0
0
0
Home
Early Childhood Setting
PT Early Child and SEEarly Childhood SE Setting
Separate SchoolResidential Facility
Regular Classroom
Resource Room
Self-Contained Classroom
Day Program
24 Hour Program
Home/Hospital Program
Special Education Placement Categories
Total 33
Student to Staff Ratio 11.6
K-8 172.3599-12 80.798
180.93585.076
ADA ADM
Total 253.157 266.011
Student Data
PK-12 Enrollment 261Open Enrolled Students Rec'd 24District Dropout Rate 1.4%
% Special Needs Students 12.6%% Eligible for Free/Red. Lunch 32.1%
Students Transported 81
District Attendance RateNumber of Graduates
95.2%16
Enrollment
Stanford Achievement Test Series, Tenth Edition (SAT10)
89
82
76
70
72
78
Math
Social Science
Language Arts
Reading
Complete Battery
Science
Stanford Writing Assessment Program, Third Edition
Grade 5
Grade 9
American College Test (ACT)
Grade 5Total
PRSpEd
PR
Number Tested
English
13
75%
Total PR
Sp Ed PR
72
65
62
66
61
65
80
74
60
57
81
71
85%
Grade 4 Grade 3Total
PRSp Ed
PR
Grade 6Total
PRSp Ed
PR
19 25 233 2
Sp EdTotal
Number Tested
Grade 7Total
PRSp Ed
PR
Grade 8 Total
PRSp Ed
PR
Grade 11Total
PRSp Ed
PR
MathReadingScienceComposite Score
23.622.221.1
22.722.6
69
75
71
56
67
67
24 3
79
85
88
70
75
78
82
66
75
78
69
74
88
76
73
81
71
77
213 117 23
Percent Proficient or Higher
No assessment data are reported when less than ten students were tested.
Ideas and Development
Sp EdTotal
Organization, Unity, and Coherence
Sp EdTotal
Word Choice
Sp EdTotal
Sentences and Paragraphs
Sp EdTotal
Grammer and Usage
Sp EdTotal
Writing Mechanics
Sp EdTotal
NumberTested
69% 62% 62%
80%
62%
75%
69%
85%
38%
85%
13
20

General $624,565Capital Outlay $83,141
Pension $2,167Special Education $266,844
Ending Fund Balance
Bond Redemption $0Capital Projects $0
Other Fund Data
Agricultural $3.19Non-Ag Z $4.19Owner Occupied $5.13Other Non-Ag/Utilities $11.00Special Education $0.53
Bond Redemption $0.00Pension Fund $0.30
Capital Outlay $2.20
2005 Payable 2006 Levy per Thousand
$786,216$0$0
General AidSpecial EducationExtraordinary Cost Fund - SE
$786,216Total State Aid
State Aid
Special Education Federal Flowthrough
$88,245IDEA Part BPart B, Sec. 619, PK $1,201
$89,446Total
K-12 Instruction $1,221,874PK Instruction $0Adult Instruction $0
$139,547$0$0
General Special Education
Expenditures
Community Services $0Non-Programmed $0Debt Service $0Co-Curricular $144,915
$0$0$0$0
Total Expenditures $2,221,082 $225,535
2005 Payable 2006Taxable Valuations
Agricultural $121,103,342Owner Occupied $47,108,220Non-Ag Z $1,289,517Other Non-Ag/Utilities $39,105,245Total $208,606,324
$27,28918.0
11.8%31.7
$30,767Average Teacher SalaryExperience Adjusted SalaryAvg Years of Experience% with Advanced DegreesCertified Instructional Staff
Teaching Staff Data
ADM of Tuitioned Out Paid 0.392
General State Aid Adj. ADM 417.260Non-Public / Home Sch ADM 35.013
ADM Data
Local $1,202,469County $21,731State $955,618Federal $191,195Total $2,371,014
$397,637$157
$0$0
$137,700$80
$0$91,461
General Capital Outlay Special Education Pension
$397,794 $229,240 $60,333
Revenue
Classroom Staff 1.0
ADM of Contracted Out Paid 0.000
Other Special Revenue $0
211 5th St, Ipswich, SD 57451-0306
2005-2006 Profile of Ipswich Public School District 22-6
Capital Outlay Pension
Student/Staff ServicesAdministration ServicesTransportation ServicesOther Support Services
Enterprise Funds
Cost per ADM
General Fund Only
Revenue Expenditures
* Includes General, Special Education and Pension Funds
Home County: EdmundsArea in Square Miles: 541
2005 K-12 Fall Enrollment: 388
$60,303$30$0$0
$0$0
$49,517$0$0
$93,314$241,996$179,962$339,020
$13,690$34,637$30,000
$298,905$0$0
$105,130$0
$64,431$21,557
$0$0
$1,493$9,045
$0$6,299
$0$10,361
$0$2,175
$5,749Educational Funds* $6,485
$0$0$0
$183,433 $182,224
$501,119 $78,890
$18,756

December 2005 Federal Child Count
0Deaf-Blind
017
0
DeafSpeech/Language
Autism
3Emotionally Disturbed60
15000
Mental RetardationHearing ImpairedLearning DisabledMultiple DisabilitiesOrthopedic ImpairmentVisually Impaired
1
00
Other Health Impaired
Traumatic Brain InjuryDevelopmental Delay
42Total
0
4
00
10
21
11
5
0
0
0
Home
Early Childhood Setting
PT Early Child and SEEarly Childhood SE Setting
Separate SchoolResidential Facility
Regular Classroom
Resource Room
Self-Contained Classroom
Day Program
24 Hour Program
Home/Hospital Program
Special Education Placement Categories
Total 42
Student to Staff Ratio 12.5
K-8 250.4259-12 118.230
260.357124.547
ADA ADM
Total 368.655 384.904
Student Data
PK-12 Enrollment 410Open Enrolled Students Rec'd 5District Dropout Rate 1.0%
% Special Needs Students 10.2%% Eligible for Free/Red. Lunch 62.9%
Students Transported 181
District Attendance RateNumber of Graduates
95.8%24
Enrollment
Stanford Achievement Test Series, Tenth Edition (SAT10)
83
81
82
66
77
78
Math
Social Science
Language Arts
Reading
Complete Battery
Science
Stanford Writing Assessment Program, Third Edition
Grade 5
Grade 9
American College Test (ACT)
Grade 5Total
PRSpEd
PR
Number Tested
English
84%
Total PR
Sp Ed PR
69
61
52
52
54
57
84
63
57
56
68
66
84%
Grade 4 Grade 3Total
PRSp Ed
PR
Grade 6Total
PRSp Ed
PR
24 45 273 4 1
Sp EdTotal
Number Tested
Grade 7Total
PRSp Ed
PR
Grade 8 Total
PRSp Ed
PR
Grade 11Total
PRSp Ed
PR
MathReadingScienceComposite Score
70
69
72
63
66
67
27 2
67
62
71
51
55
61
79
64
67
70
65
70
82
69
75
72
68
73
228 133 123
Percent Proficient or Higher
No assessment data are reported when less than ten students were tested.
Ideas and Development
Sp EdTotal
Organization, Unity, and Coherence
Sp EdTotal
Word Choice
Sp EdTotal
Sentences and Paragraphs
Sp EdTotal
Grammer and Usage
Sp EdTotal
Writing Mechanics
Sp EdTotal
NumberTested
56% 48% 56%
77%
48%
74%
59%
90%
56%
87%
27
31

General $93,356Capital Outlay $670,983
Pension $607Special Education $66,098
Ending Fund Balance
Bond Redemption $64,865Capital Projects $0
Other Fund Data
Agricultural $4.14Non-Ag Z $5.44Owner Occupied $6.66Other Non-Ag/Utilities $14.28Special Education $1.40
Bond Redemption $0.77Pension Fund $0.30
Capital Outlay $3.00
2005 Payable 2006 Levy per Thousand
$742,809$33,964
$0
General AidSpecial EducationExtraordinary Cost Fund - SE
$776,773Total State Aid
State Aid
Special Education Federal Flowthrough
$39,709IDEA Part BPart B, Sec. 619, PK $3,999
$43,708Total
K-12 Instruction $769,158PK Instruction $0Adult Instruction $0
$116,138$13,486
$0
General Special Education
Expenditures
Community Services $0Non-Programmed $0Debt Service $0Co-Curricular $64,097
$0$0$0$0
Total Expenditures $1,372,856 $186,006
2005 Payable 2006Taxable Valuations
Agricultural $66,664,623Owner Occupied $14,537,430Non-Ag Z $167,771Other Non-Ag/Utilities $4,400,534Total $85,770,358
$31,23312.0
12.5%20.9
$29,541Average Teacher SalaryExperience Adjusted SalaryAvg Years of Experience% with Advanced DegreesCertified Instructional Staff
Teaching Staff Data
ADM of Tuitioned Out Paid 0.744
General State Aid Adj. ADM 226.338Non-Public / Home Sch ADM 0.000
ADM Data
Local $536,096County $20,851State $779,923Federal $85,800Total $1,422,670
$257,086$0$0$0
$119,016$0
$33,964$42,001
General Capital Outlay Special Education Pension
$257,086 $194,981 $25,500
Revenue
Classroom Staff 0.0
ADM of Contracted Out Paid 0.000
Other Special Revenue $0
130 E State, Irene, SD 57037-0005
2005-2006 Profile of Irene School District 63-2
Capital Outlay Pension
Student/Staff ServicesAdministration ServicesTransportation ServicesOther Support Services
Enterprise Funds
Cost per ADM
General Fund Only
Revenue Expenditures
* Includes General, Special Education and Pension Funds
Home County: YanktonArea in Square Miles: 147
2005 K-12 Fall Enrollment: 187
$25,500$0$0$0
$0$0
$30,949$0$0
$82,189$162,663
$77,523$217,227
$0$5,000
$0$31,063
$0$0$0
$20,000
$40,628$13,744$2,010
$0
$0$0$0$0$0$0$0$0
$7,307Educational Funds* $8,250
$67,242$0$0
$96,656 $94,448
*District has opted out of General Fund levy
$139,905 $30,949
$83,842

December 2005 Federal Child Count
0Deaf-Blind
017
0
DeafSpeech/Language
Autism
0Emotionally Disturbed407000
Mental RetardationHearing ImpairedLearning DisabledMultiple DisabilitiesOrthopedic ImpairmentVisually Impaired
1
00
Other Health Impaired
Traumatic Brain InjuryDevelopmental Delay
29Total
0
5
05
00
15
3
0
0
1
0
Home
Early Childhood Setting
PT Early Child and SEEarly Childhood SE Setting
Separate SchoolResidential Facility
Regular Classroom
Resource Room
Self-Contained Classroom
Day Program
24 Hour Program
Home/Hospital Program
Special Education Placement Categories
Total 29
Student to Staff Ratio 8.9
K-8 119.7729-12 61.996
123.18264.688
ADA ADM
Total 181.768 187.870
Student Data
PK-12 Enrollment 187Open Enrolled Students Rec'd 0District Dropout Rate 1.0%
% Special Needs Students 15.5%% Eligible for Free/Red. Lunch 24.5%
Students Transported 71
District Attendance RateNumber of Graduates
96.8%20
Enrollment
Stanford Achievement Test Series, Tenth Edition (SAT10)
74
69
66
47
61
63
Math
Social Science
Language Arts
Reading
Complete Battery
Science
Stanford Writing Assessment Program, Third Edition
Grade 5
Grade 9
American College Test (ACT)
Grade 5Total
PRSpEd
PR
Number Tested
English
16
64%
Total PR
Sp Ed PR
71
69
60
47
47
59
89
80
62
69
89
77
73%
Grade 4 Grade 3Total
PRSp Ed
PR
Grade 6Total
PRSp Ed
PR
11 12 172 3
Sp EdTotal
Number Tested
Grade 7Total
PRSp Ed
PR
Grade 8 Total
PRSp Ed
PR
Grade 11Total
PRSp Ed
PR
MathReadingScienceComposite Score
18.419.919.8
19.319.5
80
80
74
64
69
73
13 3
91
86
82
66
68
80
84
70
67
69
59
71
59
55
59
53
59
57
115 14 15
Percent Proficient or Higher
No assessment data are reported when less than ten students were tested.
Ideas and Development
Sp EdTotal
Organization, Unity, and Coherence
Sp EdTotal
Word Choice
Sp EdTotal
Sentences and Paragraphs
Sp EdTotal
Grammer and Usage
Sp EdTotal
Writing Mechanics
Sp EdTotal
NumberTested
57% 79% 71%
91%
71%
82%
71%
64%
50%
82%
14
11

General $383,170Capital Outlay $373,882
Pension $82,206Special Education $74,652
Ending Fund Balance
Bond Redemption $133,100Capital Projects $0
Other Fund Data
Agricultural $3.81Non-Ag Z $5.00Owner Occupied $6.13Other Non-Ag/Utilities $13.14Special Education $1.14
Bond Redemption $1.00Pension Fund $0.15
Capital Outlay $1.24
2005 Payable 2006 Levy per Thousand
$515,812$0$0
General AidSpecial EducationExtraordinary Cost Fund - SE
$515,812Total State Aid
State Aid
Special Education Federal Flowthrough
$51,852IDEA Part BPart B, Sec. 619, PK $3,513
$55,365Total
K-12 Instruction $769,934PK Instruction $0Adult Instruction $0
$100,273$3,847
$0
General Special Education
Expenditures
Community Services $0Non-Programmed $0Debt Service $0Co-Curricular $69,344
$0$0$0$0
Total Expenditures $1,330,253 $155,518
2005 Payable 2006Taxable Valuations
Agricultural $117,433,805Owner Occupied $13,020,690Non-Ag Z $59,895Other Non-Ag/Utilities $6,864,845Total $137,379,235
$29,10511.8
9.5%20.0
$27,145Average Teacher SalaryExperience Adjusted SalaryAvg Years of Experience% with Advanced DegreesCertified Instructional Staff
Teaching Staff Data
ADM of Tuitioned Out Paid 0.218
General State Aid Adj. ADM 227.351Non-Public / Home Sch ADM 0.000
ADM Data
Local $651,791County $28,938State $547,828Federal $134,751Total $1,363,307
$156,176$0$0$0
$129,979$0$0
$55,594
General Capital Outlay Special Education Pension
$156,176 $185,573 $22,310
Revenue
Classroom Staff 1.0
ADM of Contracted Out Paid 0.000
Other Special Revenue $0
111 E Washita, Iroquois, SD 57353-0098
2005-2006 Profile of Iroquois School District 02-3
Capital Outlay Pension
Student/Staff ServicesAdministration ServicesTransportation ServicesOther Support Services
Enterprise Funds
Cost per ADM
General Fund Only
Revenue Expenditures
* Includes General, Special Education and Pension Funds
Home County: BeadleArea in Square Miles: 357
2005 K-12 Fall Enrollment: 190
$22,310$0$0$0
$0$0
$0$0$0
$66,449$100,975$128,268$195,284
$1,894$1,087
$22,635$44,839
$0$0
$11,996$2,091
$41,022$8,210$1,214
$952
$0$0$0
$14,271$0$0$0$0
$7,029Educational Funds* $7,874
$137,373$0$0
$57,294 $70,624
*District has opted out of General Fund levy
$117,260 $14,271
$32,717

December 2005 Federal Child Count
0Deaf-Blind
08
0
DeafSpeech/Language
Autism
2Emotionally Disturbed10
18000
Mental RetardationHearing ImpairedLearning DisabledMultiple DisabilitiesOrthopedic ImpairmentVisually Impaired
5
03
Other Health Impaired
Traumatic Brain InjuryDevelopmental Delay
37Total
0
0
02
00
31
4
0
0
0
0
Home
Early Childhood Setting
PT Early Child and SEEarly Childhood SE Setting
Separate SchoolResidential Facility
Regular Classroom
Resource Room
Self-Contained Classroom
Day Program
24 Hour Program
Home/Hospital Program
Special Education Placement Categories
Total 37
Student to Staff Ratio 9.3
K-8 115.5269-12 67.963
117.97071.271
ADA ADM
Total 183.489 189.241
Student Data
PK-12 Enrollment 196Open Enrolled Students Rec'd 30District Dropout Rate 0.9%
% Special Needs Students 18.9%% Eligible for Free/Red. Lunch 31.7%
Students Transported 139
District Attendance RateNumber of Graduates
97.0%17
Enrollment
Stanford Achievement Test Series, Tenth Edition (SAT10)
59
60
74
60
62
62
Math
Social Science
Language Arts
Reading
Complete Battery
Science
Stanford Writing Assessment Program, Third Edition
Grade 5
Grade 9
American College Test (ACT)
Grade 5Total
PRSpEd
PR
Number Tested
English
11
74%
Total PR
Sp Ed PR
51
76
67
66
63
62
58
57
57
54
71
60
74%
Grade 4 Grade 3Total
PRSp Ed
PR
Grade 6Total
PRSp Ed
PR
7 16 172 1
Sp EdTotal
Number Tested
Grade 7Total
PRSp Ed
PR
Grade 8 Total
PRSp Ed
PR
Grade 11Total
PRSp Ed
PR
MathReadingScienceComposite Score
21.919.021.3
20.320.7
59
41
48
40
39
46
13 6
61
74
77
57
61
64
70
64
64
62
60
63
59
59
48
71
58
58
9 313 412
Percent Proficient or Higher
No assessment data are reported when less than ten students were tested.
Ideas and Development
Sp EdTotal
Organization, Unity, and Coherence
Sp EdTotal
Word Choice
Sp EdTotal
Sentences and Paragraphs
Sp EdTotal
Grammer and Usage
Sp EdTotal
Writing Mechanics
Sp EdTotal
NumberTested
56% 56% 67%
79%
44%
58%
44%
68%
22%
79%
9
19

General $28,741Capital Outlay $21,019
PensionSpecial Education ($3,415)
Ending Fund Balance
Bond Redemption $0Capital Projects $0
Other Fund Data
Agricultural $4.55Non-Ag Z $5.98Owner Occupied $7.32Other Non-Ag/Utilities $15.69Special Education $1.40
Bond Redemption $0.00Pension Fund $0.30
Capital Outlay $1.90
2005 Payable 2006 Levy per Thousand
$309,686$22,337
$0
General AidSpecial EducationExtraordinary Cost Fund - SE
$332,023Total State Aid
State Aid
Special Education Federal Flowthrough
$26,473IDEA Part BPart B, Sec. 619, PK $1,020
$27,493Total
K-12 Instruction $553,541PK Instruction $0Adult Instruction $0
$83,953$0$0
General Special Education
Expenditures
Community Services $145Non-Programmed $0Debt Service $0Co-Curricular $33,973
$0$0$0$0
Total Expenditures $1,142,351 $126,592
2005 Payable 2006Taxable Valuations
Agricultural $23,566,683Owner Occupied $1,851,410Non-Ag Z $297,529Other Non-Ag/Utilities $1,112,341Total $26,827,963
$37,8898.9
7.7%11.1
$32,552Average Teacher SalaryExperience Adjusted SalaryAvg Years of Experience% with Advanced DegreesCertified Instructional Staff
Teaching Staff Data
ADM of Tuitioned Out Paid 0.000
General State Aid Adj. ADM 98.351Non-Public / Home Sch ADM 0.697
ADM Data
Local $175,766County $185State $330,443Federal $113,595Total $619,989
$39,959$0$0$0
$34,907$0
$22,337$21,994
General Capital Outlay Special Education Pension
$39,959 $79,239 $7,431
Revenue
Classroom Staff 0.5
ADM of Contracted Out Paid 0.000
Other Special Revenue $0
410 N Main, Isabel, SD 57633
2005-2006 Profile of Isabel School District 20-2
Capital Outlay Pension
Student/Staff ServicesAdministration ServicesTransportation ServicesOther Support Services
Enterprise Funds
Cost per ADM
General Fund Only
Revenue Expenditures
* Includes General, Special Education and Pension Funds
Home County: DeweyArea in Square Miles: 449
2005 K-12 Fall Enrollment: 85
$7,431$0$0$0
$0$0
$21,989$2,427
$0$93,777
$179,439$54,653
$226,824
$0$0$0
$135,223$0$0
$2,015$0
$3,550$0$0
$39,089
$3,224$6,101
$0$4,718
$0$0$0
$738
$13,887Educational Funds* $15,880
$0$0
$608,013$75,651 $149,795
*District has opted out of General Fund levy
$183,835 $39,197
$46,598

December 2005 Federal Child Count
0Deaf-Blind
01
1
DeafSpeech/Language
Autism
0Emotionally Disturbed00
13000
Mental RetardationHearing ImpairedLearning DisabledMultiple DisabilitiesOrthopedic ImpairmentVisually Impaired
0
00
Other Health Impaired
Traumatic Brain InjuryDevelopmental Delay
15Total
0
0
00
00
15
0
0
0
0
0
Home
Early Childhood Setting
PT Early Child and SEEarly Childhood SE Setting
Separate SchoolResidential Facility
Regular Classroom
Resource Room
Self-Contained Classroom
Day Program
24 Hour Program
Home/Hospital Program
Special Education Placement Categories
Total 15
Student to Staff Ratio 7.3
K-8 49.8459-12 27.395
52.83129.128
ADA ADM
Total 77.240 81.959
Student Data
PK-12 Enrollment 85Open Enrolled Students Rec'd 12District Dropout Rate 2.2%
% Special Needs Students 17.6%% Eligible for Free/Red. Lunch 56.1%
Students Transported 4
District Attendance RateNumber of Graduates
94.2%10
Enrollment
Stanford Achievement Test Series, Tenth Edition (SAT10)
76
92
78
61
77
77
Math
Social Science
Language Arts
Reading
Complete Battery
Science
Stanford Writing Assessment Program, Third Edition
Grade 5
Grade 9
American College Test (ACT)
Grade 5Total
PRSpEd
PR
Number Tested
English
10
57%
Total PR
Sp Ed PR
79
56
47
59
64
65
35
56
51
29
56
47
57%
Grade 4 Grade 3Total
PRSp Ed
PR
Grade 6Total
PRSp Ed
PR
5 8 51 3
Sp EdTotal
Number Tested
Grade 7Total
PRSp Ed
PR
Grade 8 Total
PRSp Ed
PR
Grade 11Total
PRSp Ed
PR
MathReadingScienceComposite Score
24.823.122.0
23.423.4
59
82
65
54
48
43
4
76
74
77
82
68
74
74
52
64
67
58
64
98
94
84
91
91
93
16 17 2
Percent Proficient or Higher
No assessment data are reported when less than ten students were tested.
Ideas and Development
Sp EdTotal
Organization, Unity, and Coherence
Sp EdTotal
Word Choice
Sp EdTotal
Sentences and Paragraphs
Sp EdTotal
Grammer and Usage
Sp EdTotal
Writing Mechanics
Sp EdTotal
NumberTested
67% 50% 67%
57%
50%
57%
50%
57%
50%
43%
6
7

General $777,801Capital Outlay $609,353
Pension $57,897Special Education $641,347
Ending Fund Balance
Bond Redemption $0Capital Projects $0
Other Fund Data
Agricultural $4.86Non-Ag Z $6.38Owner Occupied $7.82Other Non-Ag/Utilities $16.76Special Education $1.30
Bond Redemption $0.00Pension Fund $0.30
Capital Outlay $0.69
2005 Payable 2006 Levy per Thousand
$351,568$0$0
General AidSpecial EducationExtraordinary Cost Fund - SE
$351,568Total State Aid
State Aid
Special Education Federal Flowthrough
$40,330IDEA Part BPart B, Sec. 619, PK $2,527
$42,857Total
K-12 Instruction $672,132PK Instruction $4,961Adult Instruction $0
$104,133$34,072
$0
General Special Education
Expenditures
Community Services $25,911Non-Programmed $0Debt Service $0Co-Curricular $85,386
$0$0$0$0
Total Expenditures $1,264,590 $164,324
2005 Payable 2006Taxable Valuations
Agricultural $120,331,026Owner Occupied $10,273,490Non-Ag Z $21,865Other Non-Ag/Utilities $9,804,807Total $140,431,188
$27,41018.2
10.0%18.0
$28,582Average Teacher SalaryExperience Adjusted SalaryAvg Years of Experience% with Advanced DegreesCertified Instructional Staff
Teaching Staff Data
ADM of Tuitioned Out Paid 0.000
General State Aid Adj. ADM 205.106Non-Public / Home Sch ADM 3.380
ADM Data
Local $957,383County $31,639State $383,677Federal $132,467Total $1,505,166
$100,102$0$0$0
$185,261$0$0
$38,571
General Capital Outlay Special Education Pension
$100,102 $223,832 $40,970
Revenue
Classroom Staff 0.4
ADM of Contracted Out Paid 0.000
Other Special Revenue $0
404 Jackson Ave., Murdo, SD 57559
2005-2006 Profile of Jones County School District 37-3
Capital Outlay Pension
Student/Staff ServicesAdministration ServicesTransportation ServicesOther Support Services
Enterprise Funds
Cost per ADM
General Fund Only
Revenue Expenditures
* Includes General, Special Education and Pension Funds
Home County: JonesArea in Square Miles: 947
2005 K-12 Fall Enrollment: 167
$40,970$0$0$0
$0$0
$28,527$228
$0$57,739
$135,381$39,515
$243,565
$2,567$2,406
$0$58,634
$0$0$0
$25,700
$26,083$0
$35$0
$673$5,850
$0$5,144
$0$0$0
$1,067
$7,218Educational Funds* $8,102
$0$0$0$0 $0
*District has opted out of General Fund levy
$96,419 $41,488
$7,112

December 2005 Federal Child Count
0Deaf-Blind
15
0
DeafSpeech/Language
Autism
0Emotionally Disturbed107100
Mental RetardationHearing ImpairedLearning DisabledMultiple DisabilitiesOrthopedic ImpairmentVisually Impaired
1
02
Other Health Impaired
Traumatic Brain InjuryDevelopmental Delay
18Total
0
2
20
00
10
3
1
0
0
0
Home
Early Childhood Setting
PT Early Child and SEEarly Childhood SE Setting
Separate SchoolResidential Facility
Regular Classroom
Resource Room
Self-Contained Classroom
Day Program
24 Hour Program
Home/Hospital Program
Special Education Placement Categories
Total 18
Student to Staff Ratio 9.1
K-8 101.1239-12 64.058
104.68366.240
ADA ADM
Total 165.181 170.923
Student Data
PK-12 Enrollment 167Open Enrolled Students Rec'd 14District Dropout Rate 1.0%
% Special Needs Students 10.8%% Eligible for Free/Red. Lunch 0.0%
Students Transported 31
District Attendance RateNumber of Graduates
96.6%19
Enrollment
Stanford Achievement Test Series, Tenth Edition (SAT10)
80
86
82
54
80
77
Math
Social Science
Language Arts
Reading
Complete Battery
Science
Stanford Writing Assessment Program, Third Edition
Grade 5
Grade 9
American College Test (ACT)
Grade 5Total
PRSpEd
PR
Number Tested
English
12
87%
Total PR
Sp Ed PR
70
60
51
58
54
59
82
79
76
66
74
74
87%
Grade 4 Grade 3Total
PRSp Ed
PR
Grade 6Total
PRSp Ed
PR
14 15 142 2 1
Sp EdTotal
Number Tested
Grade 7Total
PRSp Ed
PR
Grade 8 Total
PRSp Ed
PR
Grade 11Total
PRSp Ed
PR
MathReadingScienceComposite Score
21.420.721.0
21.621.3
75
72
72
66
67
69
11
90
77
80
73
57
77
90
85
86
83
81
84
85
80
73
77
70
76
15 8 11
Percent Proficient or Higher
No assessment data are reported when less than ten students were tested.
Ideas and Development
Sp EdTotal
Organization, Unity, and Coherence
Sp EdTotal
Word Choice
Sp EdTotal
Sentences and Paragraphs
Sp EdTotal
Grammer and Usage
Sp EdTotal
Writing Mechanics
Sp EdTotal
NumberTested
87% 47% 80%
80%
60%
60%
67%
67%
60%
73%
15
15

General $245,685Capital Outlay $266,836
PensionSpecial Education $8,599
Ending Fund Balance
Bond Redemption $0Capital Projects $0
Other Fund Data
Agricultural $3.19Non-Ag Z $4.19Owner Occupied $5.13Other Non-Ag/Utilities $11.00Special Education $1.24
Bond Redemption $0.00Pension Fund $0.00
Capital Outlay $2.53
2005 Payable 2006 Levy per Thousand
$1,114,910$112,480
$0
General AidSpecial EducationExtraordinary Cost Fund - SE
$1,227,390Total State Aid
State Aid
Special Education Federal Flowthrough
$94,140IDEA Part BPart B, Sec. 619, PK $8,537
$102,677Total
K-12 Instruction $1,598,883PK Instruction $11,834Adult Instruction $0
$257,103$24,059
$0
General Special Education
Expenditures
Community Services $0Non-Programmed $7,751Debt Service $0Co-Curricular $103,269
$0$0$0$0
Total Expenditures $2,799,130 $417,181
2005 Payable 2006Taxable Valuations
Agricultural $86,397,973Owner Occupied $10,065,552Non-Ag Z $0Other Non-Ag/Utilities $9,886,367Total $106,349,892
$33,13515.4
11.1%34.7
$33,083Average Teacher SalaryExperience Adjusted SalaryAvg Years of Experience% with Advanced DegreesCertified Instructional Staff
Teaching Staff Data
ADM of Tuitioned Out Paid 1.000
General State Aid Adj. ADM 354.049Non-Public / Home Sch ADM 15.832
ADM Data
Local $605,842County $103,651State $1,168,509Federal $790,832Total $2,668,835
$268,923$0$0$0
$135,896$0
$112,480$129,690
General Capital Outlay Special Education Pension
$268,923 $378,066 $0
Revenue
Classroom Staff 0.0
ADM of Contracted Out Paid 0.000
Other Special Revenue $0
800 Bayberry St, Kadoka, SD 57543
2005-2006 Profile of Kadoka School District 35-1
Capital Outlay Pension
Student/Staff ServicesAdministration ServicesTransportation ServicesOther Support Services
Enterprise Funds
Cost per ADM
General Fund Only
Revenue Expenditures
* Includes General, Special Education and Pension Funds
Home County: JacksonArea in Square Miles: 1,670
2005 K-12 Fall Enrollment: 320
$0$0$0$0
$0$0
$0$0$0
$269,170$321,106$103,795$383,322
$27,515$0
$55,011$92,794
$0$0
$416,248$400
$106,729$27,672$1,618
$0
$0$0$0$0$0$0$0$0
$8,803Educational Funds* $9,933
$0$0
$258,742$127,056 $137,547
$602,174 $0
$10,205

December 2005 Federal Child Count
0Deaf-Blind
021
0
DeafSpeech/Language
Autism
1Emotionally Disturbed10
29400
Mental RetardationHearing ImpairedLearning DisabledMultiple DisabilitiesOrthopedic ImpairmentVisually Impaired
2
00
Other Health Impaired
Traumatic Brain InjuryDevelopmental Delay
58Total
2
4
40
00
29
17
1
0
1
0
Home
Early Childhood Setting
PT Early Child and SEEarly Childhood SE Setting
Separate SchoolResidential Facility
Regular Classroom
Resource Room
Self-Contained Classroom
Day Program
24 Hour Program
Home/Hospital Program
Special Education Placement Categories
Total 58
Student to Staff Ratio 9.2
K-8 217.1289-12 82.253
228.66188.919
ADA ADM
Total 299.381 317.580
Student Data
PK-12 Enrollment 320Open Enrolled Students Rec'd 0District Dropout Rate 0.7%
% Special Needs Students 18.1%% Eligible for Free/Red. Lunch 40.2%
Students Transported 81
District Attendance RateNumber of Graduates
94.3%25
Enrollment
Stanford Achievement Test Series, Tenth Edition (SAT10)
77
76
72
37
62
66
Math
Social Science
Language Arts
Reading
Complete Battery
Science
Stanford Writing Assessment Program, Third Edition
Grade 5
Grade 9
American College Test (ACT)
Grade 5Total
PRSpEd
PR
Number Tested
English
19
63%
Total PR
Sp Ed PR
53
53
55
52
54
51
56
73
63
56
76
66
74%
Grade 4 Grade 3Total
PRSp Ed
PR
Grade 6Total
PRSp Ed
PR
24 23 205 5 2
Sp EdTotal
Number Tested
Grade 7Total
PRSp Ed
PR
Grade 8 Total
PRSp Ed
PR
Grade 11Total
PRSp Ed
PR
MathReadingScienceComposite Score
21.421.319.8
20.720.9
63
50
58
44
51
54
25 3
59
56
58
44
52
54
67
48
54
55
52
56
56
42
50
45
48
47
623 329 419
Percent Proficient or Higher
No assessment data are reported when less than ten students were tested.
Ideas and Development
Sp EdTotal
Organization, Unity, and Coherence
Sp EdTotal
Word Choice
Sp EdTotal
Sentences and Paragraphs
Sp EdTotal
Grammer and Usage
Sp EdTotal
Writing Mechanics
Sp EdTotal
NumberTested
46% 29% 42%
68%
29%
53%
46%
58%
29%
68%
24
19

General $950,663Capital Outlay $797,017
PensionSpecial Education $132,886
Ending Fund Balance
Bond Redemption $0Capital Projects $0
Other Fund Data
Agricultural $3.19Non-Ag Z $4.19Owner Occupied $5.13Other Non-Ag/Utilities $11.00Special Education $0.46
Bond Redemption $0.00Pension Fund $0.00
Capital Outlay $2.55
2005 Payable 2006 Levy per Thousand
$809,585$0$0
General AidSpecial EducationExtraordinary Cost Fund - SE
$809,585Total State Aid
State Aid
Special Education Federal Flowthrough
$56,478IDEA Part BPart B, Sec. 619, PK $1,129
$57,607Total
K-12 Instruction $1,130,244PK Instruction $0Adult Instruction $0
$110,092$339
$0
General Special Education
Expenditures
Community Services $19,663Non-Programmed $0Debt Service $0Co-Curricular $121,948
$0$0$0$0
Total Expenditures $1,971,065 $185,264
2005 Payable 2006Taxable Valuations
Agricultural $117,038,762Owner Occupied $9,961,306Non-Ag Z $1,218,605Other Non-Ag/Utilities $6,816,313Total $135,034,986
$33,27315.6
3.8%24.8
$32,898Average Teacher SalaryExperience Adjusted SalaryAvg Years of Experience% with Advanced DegreesCertified Instructional Staff
Teaching Staff Data
ADM of Tuitioned Out Paid 0.000
General State Aid Adj. ADM 351.317Non-Public / Home Sch ADM 0.000
ADM Data
Local $784,531County $22,312State $874,216Federal $175,299Total $1,856,358
$455,383$160
$0$1,087
$62,468$37
$0$52,409
General Capital Outlay Special Education Pension
$456,630 $114,914 $0
Revenue
Classroom Staff 0.0
ADM of Contracted Out Paid 0.000
Other Special Revenue $0
300 S East St, Kimball, SD 57355
2005-2006 Profile of Kimball School District 07-2
Capital Outlay Pension
Student/Staff ServicesAdministration ServicesTransportation ServicesOther Support Services
Enterprise Funds
Cost per ADM
General Fund Only
Revenue Expenditures
* Includes General, Special Education and Pension Funds
Home County: BruleArea in Square Miles: 474
2005 K-12 Fall Enrollment: 272
$0$0$0$0
$0$0
$0$0$0
$120,852$224,330
$93,847$260,181
$29,241$0
$21,800$97,918
$0$0
$199,278$0
$74,383$0
$450$0
$0$0$0$0$0$0$0$0
$6,073Educational Funds* $6,660
$0$0$0
$172,968 $169,640
$354,828 $0
$6,591

December 2005 Federal Child Count
0Deaf-Blind
07
0
DeafSpeech/Language
Autism
2Emotionally Disturbed30
11000
Mental RetardationHearing ImpairedLearning DisabledMultiple DisabilitiesOrthopedic ImpairmentVisually Impaired
5
00
Other Health Impaired
Traumatic Brain InjuryDevelopmental Delay
28Total
0
0
20
00
23
3
0
0
0
0
Home
Early Childhood Setting
PT Early Child and SEEarly Childhood SE Setting
Separate SchoolResidential Facility
Regular Classroom
Resource Room
Self-Contained Classroom
Day Program
24 Hour Program
Home/Hospital Program
Special Education Placement Categories
Total 28
Student to Staff Ratio 11.0
K-8 171.0169-12 136.002
175.018139.662
ADA ADM
Total 307.018 314.680
Student Data
PK-12 Enrollment 272Open Enrolled Students Rec'd 9District Dropout Rate 0.7%
% Special Needs Students 10.3%% Eligible for Free/Red. Lunch 55.4%
Students Transported 105
District Attendance RateNumber of Graduates
97.6%21
Enrollment
Stanford Achievement Test Series, Tenth Edition (SAT10)
68
68
71
48
58
62
Math
Social Science
Language Arts
Reading
Complete Battery
Science
Stanford Writing Assessment Program, Third Edition
Grade 5
Grade 9
American College Test (ACT)
Grade 5Total
PRSpEd
PR
Number Tested
English
13
84%
Total PR
Sp Ed PR
81
74
72
67
70
72
82
80
65
58
78
73
76%
Grade 4 Grade 3Total
PRSp Ed
PR
Grade 6Total
PRSp Ed
PR
22 19 251 1 1
Sp EdTotal
Number Tested
Grade 7Total
PRSp Ed
PR
Grade 8 Total
PRSp Ed
PR
Grade 11Total
PRSp Ed
PR
MathReadingScienceComposite Score
20.519.919.8
20.020.2
74
63
77
59
67
67
22 2
86
74
88
71
76
79
90
74
80
73
74
79
78
66
64
72
56
67
119 320 322
Percent Proficient or Higher
No assessment data are reported when less than ten students were tested.
Ideas and Development
Sp EdTotal
Organization, Unity, and Coherence
Sp EdTotal
Word Choice
Sp EdTotal
Sentences and Paragraphs
Sp EdTotal
Grammer and Usage
Sp EdTotal
Writing Mechanics
Sp EdTotal
NumberTested
74% 68% 74%
72%
63%
68%
53%
76%
47%
80%
19
25

General $648,819Capital Outlay $308,328
Pension $895Special Education $65,354
Ending Fund Balance
Bond Redemption $0Capital Projects $0
Other Fund Data
Agricultural $4.85Non-Ag Z $6.37Owner Occupied $7.80Other Non-Ag/Utilities $16.72Special Education $1.40
Bond Redemption $0.00Pension Fund $0.30
Capital Outlay $3.00
2005 Payable 2006 Levy per Thousand
$691,963$92,152
$0
General AidSpecial EducationExtraordinary Cost Fund - SE
$784,115Total State Aid
State Aid
Special Education Federal Flowthrough
$39,766IDEA Part BPart B, Sec. 619, PK $1,079
$40,845Total
K-12 Instruction $875,403PK Instruction $0Adult Instruction $0
$108,688$8,732
$0
General Special Education
Expenditures
Community Services $0Non-Programmed $0Debt Service $0Co-Curricular $70,556
$0$0$0$0
Total Expenditures $1,520,454 $199,923
2005 Payable 2006Taxable Valuations
Agricultural $70,897,150Owner Occupied $11,358,016Non-Ag Z $104,103Other Non-Ag/Utilities $11,136,880Total $93,496,149
$29,31316.7
7.7%21.6
$30,111Average Teacher SalaryExperience Adjusted SalaryAvg Years of Experience% with Advanced DegreesCertified Instructional Staff
Teaching Staff Data
ADM of Tuitioned Out Paid 0.000
General State Aid Adj. ADM 246.315Non-Public / Home Sch ADM 2.928
ADM Data
Local $659,660County $10,925State $728,617Federal $182,277Total $1,581,479
$287,262$0
$7,700$0
$127,595$0
$92,152$42,438
General Capital Outlay Special Education Pension
$294,962 $262,185 $27,328
Revenue
Classroom Staff 0.0
ADM of Contracted Out Paid 0.000
Other Special Revenue $0
300 1st Street NE, Lake Preston, SD 57249
2005-2006 Profile of Lake Preston School District 38-3
Capital Outlay Pension
Student/Staff ServicesAdministration ServicesTransportation ServicesOther Support Services
Enterprise Funds
Cost per ADM
General Fund Only
Revenue Expenditures
* Includes General, Special Education and Pension Funds
Home County: KingsburyArea in Square Miles: 198
2005 K-12 Fall Enrollment: 208
$27,328$0$0$0
$0$0
$26,658$0$0
$118,676$189,102
$53,935$212,782
$0$3,444
$0$49,888
$0$0
$169,113$12,228
$61,649$15,024
$0$5,830
$0$0$0$0$0$0$0$0
$6,915Educational Funds* $7,862
$0$0$0
$90,760 $96,280
*District has opted out of General Fund levy
$297,409 $26,658
$62,736

December 2005 Federal Child Count
0Deaf-Blind
010
2
DeafSpeech/Language
Autism
0Emotionally Disturbed00
18300
Mental RetardationHearing ImpairedLearning DisabledMultiple DisabilitiesOrthopedic ImpairmentVisually Impaired
5
00
Other Health Impaired
Traumatic Brain InjuryDevelopmental Delay
38Total
0
0
00
00
28
8
0
2
0
0
Home
Early Childhood Setting
PT Early Child and SEEarly Childhood SE Setting
Separate SchoolResidential Facility
Regular Classroom
Resource Room
Self-Contained Classroom
Day Program
24 Hour Program
Home/Hospital Program
Special Education Placement Categories
Total 38
Student to Staff Ratio 9.7
K-8 132.0279-12 67.561
135.49869.580
ADA ADM
Total 199.588 205.078
Student Data
PK-12 Enrollment 208Open Enrolled Students Rec'd 23District Dropout Rate 0.0%
% Special Needs Students 18.3%% Eligible for Free/Red. Lunch 36.3%
Students Transported 95
District Attendance RateNumber of Graduates
97.3%21
Enrollment
Stanford Achievement Test Series, Tenth Edition (SAT10)
93
86
79
88
83
85
Math
Social Science
Language Arts
Reading
Complete Battery
Science
Stanford Writing Assessment Program, Third Edition
Grade 5
Grade 9
American College Test (ACT)
Grade 5Total
PRSpEd
PR
Number Tested
English
14
89%
Total PR
Sp Ed PR
81
79
78
67
69
74
82
73
69
69
77
69
74%
Grade 4 Grade 3Total
PRSp Ed
PR
Grade 6Total
PRSp Ed
PR
13 18 162 4 1
Sp EdTotal
Number Tested
Grade 7Total
PRSp Ed
PR
Grade 8 Total
PRSp Ed
PR
Grade 11Total
PRSp Ed
PR
MathReadingScienceComposite Score
20.321.819.6
21.620.9
86
84
82
75
80
81
13 5
85
80
79
69
67
76
72
72
72
74
66
70
80
71
78
67
62
71
415 524 417
Percent Proficient or Higher
No assessment data are reported when less than ten students were tested.
Ideas and Development
Sp EdTotal
Organization, Unity, and Coherence
Sp EdTotal
Word Choice
Sp EdTotal
Sentences and Paragraphs
Sp EdTotal
Grammer and Usage
Sp EdTotal
Writing Mechanics
Sp EdTotal
NumberTested
60% 73% 53%
74%
33%
68%
53%
74%
40%
74%
15
19

General $333,563Capital Outlay $279,774
Pension $103,603Special Education $112,042
Ending Fund Balance
Bond Redemption $104,185Capital Projects $0
Other Fund Data
Agricultural $3.19Non-Ag Z $4.19Owner Occupied $5.13Other Non-Ag/Utilities $11.00Special Education $0.44
Bond Redemption $0.87Pension Fund $0.30
Capital Outlay $1.07
2005 Payable 2006 Levy per Thousand
$726,331$0$0
General AidSpecial EducationExtraordinary Cost Fund - SE
$726,331Total State Aid
State Aid
Special Education Federal Flowthrough
$37,283IDEA Part BPart B, Sec. 619, PK $0
$37,283Total
K-12 Instruction $882,601PK Instruction $477Adult Instruction $0
$78,078$0$0
General Special Education
Expenditures
Community Services $0Non-Programmed $0Debt Service $0Co-Curricular $60,262
$0$0$0$0
Total Expenditures $1,437,032 $102,931
2005 Payable 2006Taxable Valuations
Agricultural $108,645,504Owner Occupied $12,902,783Non-Ag Z $1,568,764Other Non-Ag/Utilities $4,139,545Total $127,256,596
$33,05310.6
14.3%21.0
$30,675Average Teacher SalaryExperience Adjusted SalaryAvg Years of Experience% with Advanced DegreesCertified Instructional Staff
Teaching Staff Data
ADM of Tuitioned Out Paid 0.477
General State Aid Adj. ADM 259.050Non-Public / Home Sch ADM 1.800
ADM Data
Local $560,885County $24,183State $752,878Federal $74,487Total $1,412,433
$169,604$15
$500$11,669
$69,814$7$0
$36,512
General Capital Outlay Special Education Pension
$181,788 $106,333 $35,281
Revenue
Classroom Staff 0.0
ADM of Contracted Out Paid 0.000
Other Special Revenue $0
206 Chestnut St, Langford, SD 57454
2005-2006 Profile of Langford School District 45-2
Capital Outlay Pension
Student/Staff ServicesAdministration ServicesTransportation ServicesOther Support Services
Enterprise Funds
Cost per ADM
General Fund Only
Revenue Expenditures
* Includes General, Special Education and Pension Funds
Home County: MarshallArea in Square Miles: 322
2005 K-12 Fall Enrollment: 218
$35,278$3$0$0
$0$0
$0$0$0
$11,819$180,097
$93,222$208,553
$6,905$906
$0$247,122
$0$0$0
$17,405
$24,853$0$0$0
$0$0$0$0$0
$17,500$0$0
$6,606Educational Funds* $7,160
$113,026$0$0
$74,373 $78,887
$310,446 $17,500
$38,107

December 2005 Federal Child Count
0Deaf-Blind
014
0
DeafSpeech/Language
Autism
5Emotionally Disturbed018000
Mental RetardationHearing ImpairedLearning DisabledMultiple DisabilitiesOrthopedic ImpairmentVisually Impaired
4
00
Other Health Impaired
Traumatic Brain InjuryDevelopmental Delay
32Total
0
1
10
00
26
4
0
0
0
0
Home
Early Childhood Setting
PT Early Child and SEEarly Childhood SE Setting
Separate SchoolResidential Facility
Regular Classroom
Resource Room
Self-Contained Classroom
Day Program
24 Hour Program
Home/Hospital Program
Special Education Placement Categories
Total 32
Student to Staff Ratio 10.8
K-8 145.4889-12 71.543
145.73971.715
ADA ADM
Total 217.031 217.454
Student Data
PK-12 Enrollment 226Open Enrolled Students Rec'd 11District Dropout Rate 0.0%
% Special Needs Students 14.2%% Eligible for Free/Red. Lunch 32.3%
Students Transported 97
District Attendance RateNumber of Graduates
99.8%13
Enrollment
Stanford Achievement Test Series, Tenth Edition (SAT10)
80
73
75
47
64
68
Math
Social Science
Language Arts
Reading
Complete Battery
Science
Stanford Writing Assessment Program, Third Edition
Grade 5
Grade 9
American College Test (ACT)
Grade 5Total
PRSpEd
PR
Number Tested
English
8
84%
Total PR
Sp Ed PR
75
63
69
65
73
69
74
81
73
64
84
76
58%
Grade 4 Grade 3Total
PRSp Ed
PR
Grade 6Total
PRSp Ed
PR
18 19 157 2
Sp EdTotal
Number Tested
Grade 7Total
PRSp Ed
PR
Grade 8 Total
PRSp Ed
PR
Grade 11Total
PRSp Ed
PR
MathReadingScienceComposite Score
77
71
74
68
66
69
15 4
68
68
76
52
52
63
81
72
73
66
56
70
78
55
48
62
56
62
219 318 317
Percent Proficient or Higher
No assessment data are reported when less than ten students were tested.
Ideas and Development
Sp EdTotal
Organization, Unity, and Coherence
Sp EdTotal
Word Choice
Sp EdTotal
Sentences and Paragraphs
Sp EdTotal
Grammer and Usage
Sp EdTotal
Writing Mechanics
Sp EdTotal
NumberTested
53% 47% 47%
58%
37%
74%
42%
84%
37%
89%
19
19

General $4,156,750Capital Outlay $664,289
Pension $308,698Special Education $6,335
Ending Fund Balance
Bond Redemption $0Capital Projects $0
Other Fund Data
Agricultural $3.90Non-Ag Z $5.12Owner Occupied $6.27Other Non-Ag/Utilities $13.45Special Education $1.40
Bond Redemption $0.00Pension Fund $0.30
Capital Outlay $3.00
2005 Payable 2006 Levy per Thousand
$648,472$50,898
$285,974
General AidSpecial EducationExtraordinary Cost Fund - SE
$985,344Total State Aid
State Aid
Special Education Federal Flowthrough
$194,741IDEA Part BPart B, Sec. 619, PK $6,358
$201,099Total
K-12 Instruction $3,225,682PK Instruction $0Adult Instruction $0
$704,391$68,278
$0
General Special Education
Expenditures
Community Services $0Non-Programmed $3,141Debt Service $0Co-Curricular $317,029
$0$0$0$0
Total Expenditures $6,130,417 $1,151,056
2005 Payable 2006Taxable Valuations
Agricultural $2,768,652Owner Occupied $176,611,561Non-Ag Z $3,916,366Other Non-Ag/Utilities $253,719,828Total $437,016,407
$37,14114.4
20.2%87.0
$36,274Average Teacher SalaryExperience Adjusted SalaryAvg Years of Experience% with Advanced DegreesCertified Instructional Staff
Teaching Staff Data
ADM of Tuitioned Out Paid 5.155
General State Aid Adj. ADM 938.911Non-Public / Home Sch ADM 0.000
ADM Data
Local $4,849,558County $193,728State $844,574Federal $747,744Total $6,635,604
$1,275,271$0
$120,089$0
$597,554$0
$336,872$218,746
General Capital Outlay Special Education Pension
$1,395,360 $1,153,172 $139,406
Revenue
Classroom Staff 1.1
ADM of Contracted Out Paid 0.000
Other Special Revenue $0
320 S Main St, Lead, SD 57754-1548
2005-2006 Profile of Lead-Deadwood School District 40-1
Capital Outlay Pension
Student/Staff ServicesAdministration ServicesTransportation ServicesOther Support Services
Enterprise Funds
Cost per ADM
General Fund Only
Revenue Expenditures
* Includes General, Special Education and Pension Funds
Home County: LawrenceArea in Square Miles: 432
2005 K-12 Fall Enrollment: 940
$139,406$0$0$0
$0$0
$0$0$0
$509,849$591,132$179,284
$1,304,298
$154,792$913
$60,656$677,429
$0$0
$347,019$20,160
$197,894$17,093$22,325
$141,075
$0$0$0$0$0
$47,187$0$0
$6,476Educational Funds* $7,646
$0$0$0
$295,032 $281,927
*District has opted out of General Fund levy
$1,409,806 $47,187
$148,837

December 2005 Federal Child Count
0Deaf-Blind
010
5
DeafSpeech/Language
Autism
3Emotionally Disturbed60
81200
Mental RetardationHearing ImpairedLearning DisabledMultiple DisabilitiesOrthopedic ImpairmentVisually Impaired
1
07
Other Health Impaired
Traumatic Brain InjuryDevelopmental Delay
115Total
0
2
06
00
87
16
1
1
2
0
Home
Early Childhood Setting
PT Early Child and SEEarly Childhood SE Setting
Separate SchoolResidential Facility
Regular Classroom
Resource Room
Self-Contained Classroom
Day Program
24 Hour Program
Home/Hospital Program
Special Education Placement Categories
Total 115
Student to Staff Ratio 10.7
K-8 498.8399-12 383.171
524.084406.436
ADA ADM
Total 882.010 930.520
Student Data
PK-12 Enrollment 940Open Enrolled Students Rec'd 17District Dropout Rate 4.3%
% Special Needs Students 12.2%% Eligible for Free/Red. Lunch 26.1%
Students Transported 481
District Attendance RateNumber of Graduates
94.8%94
Enrollment
Stanford Achievement Test Series, Tenth Edition (SAT10)
65
74
69
48
59
61
Math
Social Science
Language Arts
Reading
Complete Battery
Science
Stanford Writing Assessment Program, Third Edition
Grade 5
Grade 9
American College Test (ACT)
Grade 5Total
PRSpEd
PR
Number Tested
English
42
55%
Total PR
Sp Ed PR
70
69
65
50
59
62
73
71
65
47
73
65
59%
Grade 4 Grade 3Total
PRSp Ed
PR
Grade 6Total
PRSp Ed
PR
52 66 859 3 2
Sp EdTotal
Number Tested
Grade 7Total
PRSp Ed
PR
Grade 8 Total
PRSp Ed
PR
Grade 11Total
PRSp Ed
PR
MathReadingScienceComposite Score
22.220.520.9
21.421.4
63 33
77 49
76 48
62 29
57 31
63 35
54 10
66
70
70
65
61
65
64 38
62 37
63 33
68 36
58 28
62 34
62 25
64 40
64 28
67 31
61 30
62 30
354 1063 1473
Percent Proficient or Higher
No assessment data are reported when less than ten students were tested.
Ideas and Development
Sp EdTotal
Organization, Unity, and Coherence
Sp EdTotal
Word Choice
Sp EdTotal
Sentences and Paragraphs
Sp EdTotal
Grammer and Usage
Sp EdTotal
Writing Mechanics
Sp EdTotal
NumberTested
62% 47% 60%
53%
23%
51%
34%
61%
19%
70%
53
83

General ($16,834)Capital Outlay $54,005
Pension $13,930Special Education ($6,109)
Ending Fund Balance
Bond Redemption $0Capital Projects $0
Other Fund Data
Agricultural $3.96Non-Ag Z $5.20Owner Occupied $6.37Other Non-Ag/Utilities $13.66Special Education $1.40
Bond Redemption $0.00Pension Fund $0.30
Capital Outlay $1.60
2005 Payable 2006 Levy per Thousand
$1,115,691$65,342$11,653
General AidSpecial EducationExtraordinary Cost Fund - SE
$1,192,686Total State Aid
State Aid
Special Education Federal Flowthrough
$72,411IDEA Part BPart B, Sec. 619, PK $8,929
$81,340Total
K-12 Instruction $1,129,117PK Instruction $0Adult Instruction $5,159
$199,688$30,454
$0
General Special Education
Expenditures
Community Services $0Non-Programmed $2,700Debt Service $0Co-Curricular $115,576
$0$0$0$0
Total Expenditures $2,104,980 $336,851
2005 Payable 2006Taxable Valuations
Agricultural $71,705,893Owner Occupied $15,802,962Non-Ag Z $46,547Other Non-Ag/Utilities $10,191,304Total $97,746,706
$35,07716.9
26.9%25.0
$35,487Average Teacher SalaryExperience Adjusted SalaryAvg Years of Experience% with Advanced DegreesCertified Instructional Staff
Teaching Staff Data
ADM of Tuitioned Out Paid 2.000
General State Aid Adj. ADM 364.495Non-Public / Home Sch ADM 14.564
ADM Data
Local $664,055County $45,476State $1,176,238Federal $244,244Total $2,130,014
$164,690$404
$0$14,800
$143,846$361
$76,995$83,084
General Capital Outlay Special Education Pension
$179,894 $304,286 $30,875
Revenue
Classroom Staff 1.0
ADM of Contracted Out Paid 0.000
Other Special Revenue $0
209 3rd St W, Lemmon, SD 57638-1137
2005-2006 Profile of Lemmon School District 52-2
Capital Outlay Pension
Student/Staff ServicesAdministration ServicesTransportation ServicesOther Support Services
Enterprise Funds
Cost per ADM
General Fund Only
Revenue Expenditures
* Includes General, Special Education and Pension Funds
Home County: PerkinsArea in Square Miles: 1,240
2005 K-12 Fall Enrollment: 336
$30,798$77$0$0
$1,000$0
$25,499$0$0
$89,256$230,298
$83,020$449,853
$0$0$0
$97,145$0$0$0$0
$67,285$38,924
$417$83
$0$0$0$0$0$0$0$0
$6,405Educational Funds* $7,215
$0$0
$86,259$100,821 $104,932
*District has opted out of General Fund levy
$154,119 $25,499
$55,974

December 2005 Federal Child Count
0Deaf-Blind
013
2
DeafSpeech/Language
Autism
0Emotionally Disturbed10
23100
Mental RetardationHearing ImpairedLearning DisabledMultiple DisabilitiesOrthopedic ImpairmentVisually Impaired
6
01
Other Health Impaired
Traumatic Brain InjuryDevelopmental Delay
47Total
0
0
20
00
34
8
1
0
2
0
Home
Early Childhood Setting
PT Early Child and SEEarly Childhood SE Setting
Separate SchoolResidential Facility
Regular Classroom
Resource Room
Self-Contained Classroom
Day Program
24 Hour Program
Home/Hospital Program
Special Education Placement Categories
Total 47
Student to Staff Ratio 13.0
K-8 219.0739-12 96.313
226.671100.234
ADA ADM
Total 315.386 326.905
Student Data
PK-12 Enrollment 337Open Enrolled Students Rec'd 5District Dropout Rate 2.9%
% Special Needs Students 13.9%% Eligible for Free/Red. Lunch 32.0%
Students Transported 84
District Attendance RateNumber of Graduates
96.5%27
Enrollment
Stanford Achievement Test Series, Tenth Edition (SAT10)
83
83
58
75
Math
Social Science
Language Arts
Reading
Complete Battery
Science
Stanford Writing Assessment Program, Third Edition
Grade 5
Grade 9
American College Test (ACT)
Grade 5Total
PRSpEd
PR
Number Tested
English
24
45%
Total PR
Sp Ed PR
80
82
78
75
78
78
81
71
62
56
81
71
50%
Grade 4 Grade 3Total
PRSp Ed
PR
Grade 6Total
PRSp Ed
PR
24 25 252 2 1
Sp EdTotal
Number Tested
Grade 7Total
PRSp Ed
PR
Grade 8 Total
PRSp Ed
PR
Grade 11Total
PRSp Ed
PR
MathReadingScienceComposite Score
20.920.920.3
20.220.8
79
80
79
75
79
77
23 3
83
77
85
64
66
75
86
74
80
78
71
77
86
82
71
83
77
79
527 28 433
Percent Proficient or Higher
No assessment data are reported when less than ten students were tested.
Ideas and Development
Sp EdTotal
Organization, Unity, and Coherence
Sp EdTotal
Word Choice
Sp EdTotal
Sentences and Paragraphs
Sp EdTotal
Grammer and Usage
Sp EdTotal
Writing Mechanics
Sp EdTotal
NumberTested
55% 48% 58%
36%
55%
45%
65%
50%
32%
55%
31
22

General $638,261Capital Outlay $432,347
Pension $29,177Special Education ($12,512)
Ending Fund Balance
Bond Redemption $894,203Capital Projects $3,313,482
Other Fund Data
Agricultural $3.19Non-Ag Z $4.19Owner Occupied $5.13Other Non-Ag/Utilities $11.00Special Education $1.40
Bond Redemption $2.74Pension Fund $0.30
Capital Outlay $2.06
2005 Payable 2006 Levy per Thousand
$2,712,331$227,764
$0
General AidSpecial EducationExtraordinary Cost Fund - SE
$2,940,095Total State Aid
State Aid
Special Education Federal Flowthrough
$168,489IDEA Part BPart B, Sec. 619, PK $6,293
$174,782Total
K-12 Instruction $2,406,946PK Instruction $0Adult Instruction $1,121
$477,210$75,526
$0
General Special Education
Expenditures
Community Services $0Non-Programmed $49,023Debt Service $0Co-Curricular $268,571
$0$0$0$0
Total Expenditures $4,643,024 $864,851
2005 Payable 2006Taxable Valuations
Agricultural $126,594,335Owner Occupied $145,154,508Non-Ag Z $4,032,477Other Non-Ag/Utilities $31,473,929Total $307,255,249
$31,81914.6
9.0%64.7
$32,901Average Teacher SalaryExperience Adjusted SalaryAvg Years of Experience% with Advanced DegreesCertified Instructional Staff
Teaching Staff Data
ADM of Tuitioned Out Paid 6.444
General State Aid Adj. ADM 949.832Non-Public / Home Sch ADM 0.000
ADM Data
Local $1,783,305County $47,703State $2,809,549Federal $141,373Total $4,781,931
$1,107,776$0$0
$54,078
$411,454$0
$227,764$202,265
General Capital Outlay Special Education Pension
$1,161,854 $841,483 $89,784
Revenue
Classroom Staff 1.0
ADM of Contracted Out Paid 0.000
Other Special Revenue $0
201 South Elm, Lennox, SD 57039
2005-2006 Profile of Lennox School District 41-4
Capital Outlay Pension
Student/Staff ServicesAdministration ServicesTransportation ServicesOther Support Services
Enterprise Funds
Cost per ADM
General Fund Only
Revenue Expenditures
* Includes General, Special Education and Pension Funds
Home County: LincolnArea in Square Miles: 193
2005 K-12 Fall Enrollment: 948
$89,784$0$0$0
$0$0
$85,000$0$0
$361,106$505,952$258,362$791,943
$105,807$99
$57,325$140,590
$0$0
$581,689$19,303
$194,668$85,374$32,072
$0
$0$0$0$0$0$0$0$0
$4,884Educational Funds* $5,684
$926,657$38,359
$0$575,704 $609,784
$1,048,191 $85,000
$143,379
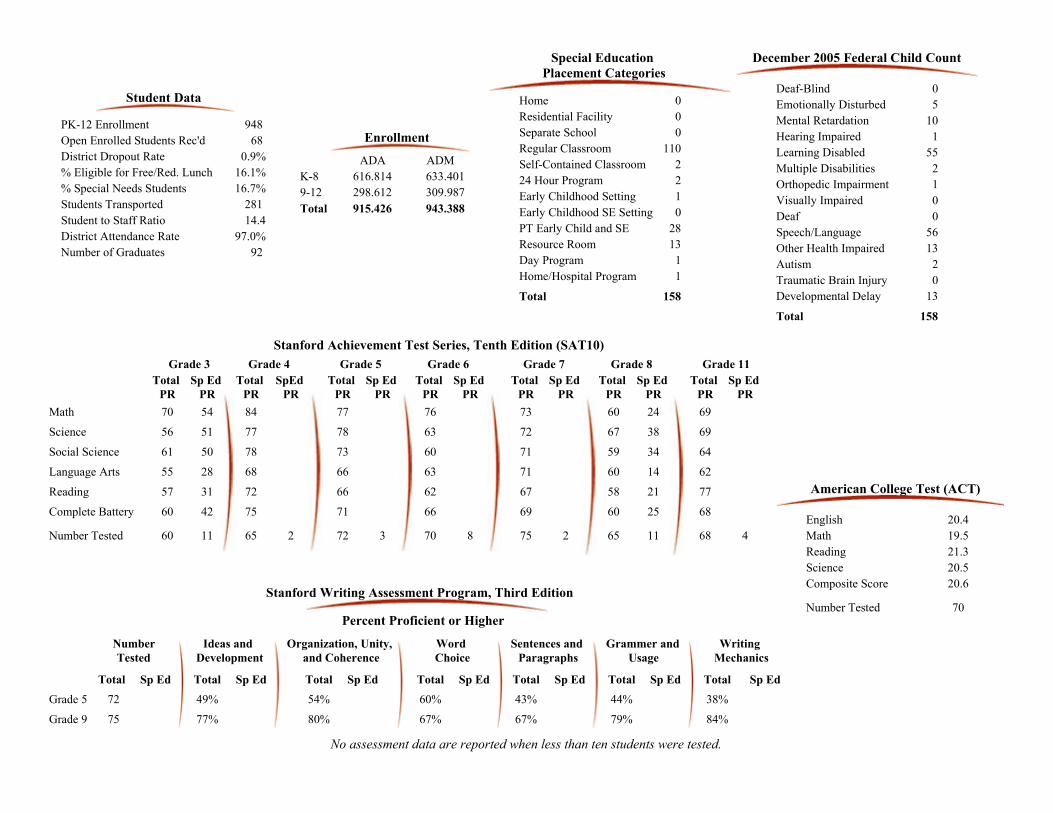
December 2005 Federal Child Count
0Deaf-Blind
056
2
DeafSpeech/Language
Autism
5Emotionally Disturbed10
155
210
Mental RetardationHearing ImpairedLearning DisabledMultiple DisabilitiesOrthopedic ImpairmentVisually Impaired
13
013
Other Health Impaired
Traumatic Brain InjuryDevelopmental Delay
158Total
0
1
280
00
110
13
2
1
2
1
Home
Early Childhood Setting
PT Early Child and SEEarly Childhood SE Setting
Separate SchoolResidential Facility
Regular Classroom
Resource Room
Self-Contained Classroom
Day Program
24 Hour Program
Home/Hospital Program
Special Education Placement Categories
Total 158
Student to Staff Ratio 14.4
K-8 616.8149-12 298.612
633.401309.987
ADA ADM
Total 915.426 943.388
Student Data
PK-12 Enrollment 948Open Enrolled Students Rec'd 68District Dropout Rate 0.9%
% Special Needs Students 16.7%% Eligible for Free/Red. Lunch 16.1%
Students Transported 281
District Attendance RateNumber of Graduates
97.0%92
Enrollment
Stanford Achievement Test Series, Tenth Edition (SAT10)
84
77
78
68
72
75
Math
Social Science
Language Arts
Reading
Complete Battery
Science
Stanford Writing Assessment Program, Third Edition
Grade 5
Grade 9
American College Test (ACT)
Grade 5Total
PRSpEd
PR
Number Tested
English
70
80%
Total PR
Sp Ed PR
60
67
59
60
58
60
24
38
34
14
21
25
69
69
64
62
77
68
77%
Grade 4 Grade 3Total
PRSp Ed
PR
Grade 6Total
PRSp Ed
PR
65 65 682 11 4
Sp EdTotal
Number Tested
Grade 7Total
PRSp Ed
PR
Grade 8 Total
PRSp Ed
PR
Grade 11Total
PRSp Ed
PR
MathReadingScienceComposite Score
21.319.520.4
20.520.6
70 54
56 51
61 50
55 28
57 31
60 42
60 11
77
78
73
66
66
71
76
63
60
63
62
66
73
72
71
71
67
69
372 870 275
Percent Proficient or Higher
No assessment data are reported when less than ten students were tested.
Ideas and Development
Sp EdTotal
Organization, Unity, and Coherence
Sp EdTotal
Word Choice
Sp EdTotal
Sentences and Paragraphs
Sp EdTotal
Grammer and Usage
Sp EdTotal
Writing Mechanics
Sp EdTotal
NumberTested
49% 54% 60%
67%
43%
67%
44%
79%
38%
84%
72
75

General $373,324Capital Outlay $176,877
Pension $11,680Special Education $141,558
Ending Fund Balance
Bond Redemption $0Capital Projects $0
Other Fund Data
Agricultural $3.74Non-Ag Z $4.91Owner Occupied $6.01Other Non-Ag/Utilities $12.90Special Education $0.66
Bond Redemption $0.00Pension Fund $0.30
Capital Outlay $1.13
2005 Payable 2006 Levy per Thousand
$568,862$0$0
General AidSpecial EducationExtraordinary Cost Fund - SE
$568,862Total State Aid
State Aid
Special Education Federal Flowthrough
$43,690IDEA Part BPart B, Sec. 619, PK $2,081
$45,771Total
K-12 Instruction $999,538PK Instruction $0Adult Instruction $0
$0$348
$0
General Special Education
Expenditures
Community Services $0Non-Programmed $0Debt Service $0Co-Curricular $64,527
$0$0$0$0
Total Expenditures $1,584,097 $185,014
2005 Payable 2006Taxable Valuations
Agricultural $116,140,578Owner Occupied $11,793,649Non-Ag Z $670,620Other Non-Ag/Utilities $20,397,181Total $149,002,028
$31,11711.9
15.4%24.3
$29,654Average Teacher SalaryExperience Adjusted SalaryAvg Years of Experience% with Advanced DegreesCertified Instructional Staff
Teaching Staff Data
ADM of Tuitioned Out Paid 0.782
General State Aid Adj. ADM 288.151Non-Public / Home Sch ADM 4.000
ADM Data
Local $865,931County $2,680State $605,665Federal $174,733Total $1,649,010
$168,137$0
$708$0
$78,440$0
$202$48,614
General Capital Outlay Special Education Pension
$168,845 $127,256 $42,087
Revenue
Classroom Staff 0.0
ADM of Contracted Out Paid 0.000
Other Special Revenue $0
820 Leola Ave, Leola, SD 57456
2005-2006 Profile of Leola School District 44-2
Capital Outlay Pension
Student/Staff ServicesAdministration ServicesTransportation ServicesOther Support Services
Enterprise Funds
Cost per ADM
General Fund Only
Revenue Expenditures
* Includes General, Special Education and Pension Funds
Home County: Mc PhersonArea in Square Miles: 597
2005 K-12 Fall Enrollment: 249
$42,087$0$0$0
$0$0
$35,682$0$0
$64,592$116,859
$90,831$247,751
$14,654$2,613
$0$160,917
$0$0$0
$1,506
$44,909$138,281
$1,477$0
$0$0$0$0$0$0$0$0
$6,413Educational Funds* $7,284
$0$0$0
$162,701 $187,463
*District has opted out of General Fund levy
$203,760 $35,682
$24,070

December 2005 Federal Child Count
0Deaf-Blind
06
3
DeafSpeech/Language
Autism
1Emotionally Disturbed406000
Mental RetardationHearing ImpairedLearning DisabledMultiple DisabilitiesOrthopedic ImpairmentVisually Impaired
1
01
Other Health Impaired
Traumatic Brain InjuryDevelopmental Delay
22Total
1
0
13
00
14
2
0
1
0
0
Home
Early Childhood Setting
PT Early Child and SEEarly Childhood SE Setting
Separate SchoolResidential Facility
Regular Classroom
Resource Room
Self-Contained Classroom
Day Program
24 Hour Program
Home/Hospital Program
Special Education Placement Categories
Total 22
Student to Staff Ratio 10.3
K-8 185.5049-12 54.043
190.46256.539
ADA ADM
Total 239.547 247.001
Student Data
PK-12 Enrollment 249Open Enrolled Students Rec'd 3District Dropout Rate 0.0%
% Special Needs Students 8.8%% Eligible for Free/Red. Lunch 66.8%
Students Transported 86
District Attendance RateNumber of Graduates
97.0%13
Enrollment
Stanford Achievement Test Series, Tenth Edition (SAT10)
83
71
71
66
76
74
Math
Social Science
Language Arts
Reading
Complete Battery
Science
Stanford Writing Assessment Program, Third Edition
Grade 5
Grade 9
American College Test (ACT)
Grade 5Total
PRSpEd
PR
Number Tested
English
11
85%
Total PR
Sp Ed PR
91
75
58
74
58
74
48
78
62
59
76
66
77%
Grade 4 Grade 3Total
PRSp Ed
PR
Grade 6Total
PRSp Ed
PR
24 18 181 1
Sp EdTotal
Number Tested
Grade 7Total
PRSp Ed
PR
Grade 8 Total
PRSp Ed
PR
Grade 11Total
PRSp Ed
PR
MathReadingScienceComposite Score
21.519.921.8
21.321.3
54
40
39
29
32
39
21 1
75
59
72
58
56
65
77
59
63
63
56
64
78
60
55
63
51
62
318 218 22
Percent Proficient or Higher
No assessment data are reported when less than ten students were tested.
Ideas and Development
Sp EdTotal
Organization, Unity, and Coherence
Sp EdTotal
Word Choice
Sp EdTotal
Sentences and Paragraphs
Sp EdTotal
Grammer and Usage
Sp EdTotal
Writing Mechanics
Sp EdTotal
NumberTested
28% 11% 28%
85%
28%
77%
33%
77%
28%
85%
18
13

General $1,226,627Capital Outlay $319,367
Pension $54,203Special Education $505,651
Ending Fund Balance
Bond Redemption $0Capital Projects $0
Other Fund Data
Agricultural $3.19Non-Ag Z $4.19Owner Occupied $5.13Other Non-Ag/Utilities $11.00Special Education $1.40
Bond Redemption $0.00Pension Fund $0.30
Capital Outlay $2.00
2005 Payable 2006 Levy per Thousand
$911,907$0$0
General AidSpecial EducationExtraordinary Cost Fund - SE
$911,907Total State Aid
State Aid
Special Education Federal Flowthrough
$96,524IDEA Part BPart B, Sec. 619, PK $5,151
$101,675Total
K-12 Instruction $1,516,195PK Instruction $0Adult Instruction $0
$261,133$9,133
$0
General Special Education
Expenditures
Community Services $0Non-Programmed $0Debt Service $0Co-Curricular $137,309
$0$0$0$0
Total Expenditures $2,825,013 $361,591
2005 Payable 2006Taxable Valuations
Agricultural $227,663,121Owner Occupied $18,677,644Non-Ag Z $2,136,091Other Non-Ag/Utilities $9,691,829Total $258,168,685
$31,34913.0
25.0%38.2
$32,762Average Teacher SalaryExperience Adjusted SalaryAvg Years of Experience% with Advanced DegreesCertified Instructional Staff
Teaching Staff Data
ADM of Tuitioned Out Paid 1.000
General State Aid Adj. ADM 429.525Non-Public / Home Sch ADM 3.342
ADM Data
Local $1,175,239County $82,308State $974,578Federal $506,202Total $2,738,327
$474,208$0$0$0
$338,474$0$0
$131,754
General Capital Outlay Special Education Pension
$474,208 $470,228 $72,813
Revenue
Classroom Staff 0.0
ADM of Contracted Out Paid 0.000
Other Special Revenue $0
201 South Birch Ave, Presho, SD 57568
2005-2006 Profile of Lyman School District 42-1
Capital Outlay Pension
Student/Staff ServicesAdministration ServicesTransportation ServicesOther Support Services
Enterprise Funds
Cost per ADM
General Fund Only
Revenue Expenditures
* Includes General, Special Education and Pension Funds
Home County: LymanArea in Square Miles: 1,216
2005 K-12 Fall Enrollment: 400
$72,813$0$0$0
$0$0
$65,969$0$0
$227,177$275,812$254,735$413,784
$0$0
$88,890$300,370
$0$0$0$0
$84,917$4,140$2,267
$0
$0$7,100
$0$460
$0$0$0$0
$7,063Educational Funds* $8,073
$0$0
$360,975$164,498 $168,533
$389,259 $73,529
$0

December 2005 Federal Child Count
0Deaf-Blind
027
1
DeafSpeech/Language
Autism
1Emotionally Disturbed10
16600
Mental RetardationHearing ImpairedLearning DisabledMultiple DisabilitiesOrthopedic ImpairmentVisually Impaired
5
08
Other Health Impaired
Traumatic Brain InjuryDevelopmental Delay
65Total
3
11
10
00
45
4
0
0
1
0
Home
Early Childhood Setting
PT Early Child and SEEarly Childhood SE Setting
Separate SchoolResidential Facility
Regular Classroom
Resource Room
Self-Contained Classroom
Day Program
24 Hour Program
Home/Hospital Program
Special Education Placement Categories
Total 65
Student to Staff Ratio 10.7
K-8 259.7299-12 121.161
272.578127.405
ADA ADM
Total 380.890 399.983
Student Data
PK-12 Enrollment 407Open Enrolled Students Rec'd 2District Dropout Rate 0.9%
% Special Needs Students 16.0%% Eligible for Free/Red. Lunch 52.3%
Students Transported 224
District Attendance RateNumber of Graduates
95.2%25
Enrollment
Stanford Achievement Test Series, Tenth Edition (SAT10)
85
79
74
72
76
78
Math
Social Science
Language Arts
Reading
Complete Battery
Science
Stanford Writing Assessment Program, Third Edition
Grade 5
Grade 9
American College Test (ACT)
Grade 5Total
PRSpEd
PR
Number Tested
English
20
91%
Total PR
Sp Ed PR
75
67
65
65
56
65
86
73
67
69
84
76
86%
Grade 4 Grade 3Total
PRSp Ed
PR
Grade 6Total
PRSp Ed
PR
34 42 333 1 1
Sp EdTotal
Number Tested
Grade 7Total
PRSp Ed
PR
Grade 8 Total
PRSp Ed
PR
Grade 11Total
PRSp Ed
PR
MathReadingScienceComposite Score
22.122.222.1
22.522.3
61
44
44
44
43
49
34 9
79
70
79
60
58
70
84
58
68
65
64
70
82
64
64
73
61
69
324 422 236
Percent Proficient or Higher
No assessment data are reported when less than ten students were tested.
Ideas and Development
Sp EdTotal
Organization, Unity, and Coherence
Sp EdTotal
Word Choice
Sp EdTotal
Sentences and Paragraphs
Sp EdTotal
Grammer and Usage
Sp EdTotal
Writing Mechanics
Sp EdTotal
NumberTested
87% 87% 87%
74%
43%
66%
65%
69%
48%
83%
23
35

General $1,573,726Capital Outlay $346,062
Pension $16,456Special Education $202,198
Ending Fund Balance
Bond Redemption $0Capital Projects $5,241,493
Other Fund Data
Agricultural $3.19Non-Ag Z $4.19Owner Occupied $5.13Other Non-Ag/Utilities $11.00Special Education $1.30
Bond Redemption $0.00Pension Fund $0.30
Capital Outlay $3.00
2005 Payable 2006 Levy per Thousand
$2,658,239$213,676
$0
General AidSpecial EducationExtraordinary Cost Fund - SE
$2,871,915Total State Aid
State Aid
Special Education Federal Flowthrough
$214,031IDEA Part BPart B, Sec. 619, PK $3,556
$217,587Total
K-12 Instruction $3,495,979PK Instruction $17,955Adult Instruction $0
$834,521$47,147
$0
General Special Education
Expenditures
Community Services $1,214Non-Programmed $67,678Debt Service $0Co-Curricular $255,093
$0$0$0$0
Total Expenditures $5,748,721 $1,113,449
2005 Payable 2006Taxable Valuations
Agricultural $127,660,155Owner Occupied $179,576,931Non-Ag Z $783,050Other Non-Ag/Utilities $107,188,817Total $415,208,953
$34,98617.0
24.4%80.2
$35,820Average Teacher SalaryExperience Adjusted SalaryAvg Years of Experience% with Advanced DegreesCertified Instructional Staff
Teaching Staff Data
ADM of Tuitioned Out Paid 19.781
General State Aid Adj. ADM 1,180.214Non-Public / Home Sch ADM 81.899
ADM Data
Local $2,718,660County $163,456State $2,802,378Federal $379,982Total $6,064,475
$1,222,946$3,142
$0$44,149
$527,560$1,363
$213,676$265,074
General Capital Outlay Special Education Pension
$1,270,237 $1,007,673 $121,496
Revenue
Classroom Staff 0.0
ADM of Contracted Out Paid 0.000
Other Special Revenue $0
800 NE 9th St, Madison, SD 57042-1149
2005-2006 Profile of Madison Central School District 39-2
Capital Outlay Pension
Student/Staff ServicesAdministration ServicesTransportation ServicesOther Support Services
Enterprise Funds
Cost per ADM
General Fund Only
Revenue Expenditures
* Includes General, Special Education and Pension Funds
Home County: LakeArea in Square Miles: 251
2005 K-12 Fall Enrollment: 1,161
$121,183$314
$0$0
$0$0
$0$0$0
$416,391$599,985$197,004$697,422
$13,878$0
$5,500$52,192
$2,295$0
$896,399$5,587
$177,284$12,716$41,780
$0
$0$0$0$0$0
$128,412$0$0
$4,920Educational Funds* $5,828
$0$100,634
$0$455,074 $453,439
$1,122,841 $128,412
$146,990

December 2005 Federal Child Count
0Deaf-Blind
034
2
DeafSpeech/Language
Autism
3Emotionally Disturbed90
47710
Mental RetardationHearing ImpairedLearning DisabledMultiple DisabilitiesOrthopedic ImpairmentVisually Impaired
16
03
Other Health Impaired
Traumatic Brain InjuryDevelopmental Delay
122Total
0
0
95
00
57
41
5
4
1
0
Home
Early Childhood Setting
PT Early Child and SEEarly Childhood SE Setting
Separate SchoolResidential Facility
Regular Classroom
Resource Room
Self-Contained Classroom
Day Program
24 Hour Program
Home/Hospital Program
Special Education Placement Categories
Total 122
Student to Staff Ratio 14.5
K-8 750.8749-12 368.955
773.510386.923
ADA ADM
Total 1,119.829 1,160.433
Student Data
PK-12 Enrollment 1,161Open Enrolled Students Rec'd 40District Dropout Rate 1.1%
% Special Needs Students 10.5%% Eligible for Free/Red. Lunch 17.6%
Students Transported 241
District Attendance RateNumber of Graduates
96.5%85
Enrollment
Stanford Achievement Test Series, Tenth Edition (SAT10)
86
84
83
76
84
82
Math
Social Science
Language Arts
Reading
Complete Battery
Science
Stanford Writing Assessment Program, Third Edition
Grade 5
Grade 9
American College Test (ACT)
Grade 5Total
PRSpEd
PR
Number Tested
English
68
72%
Total PR
Sp Ed PR
78
73
71
71
70
72
77
71
64
62
75
70
71%
Grade 4 Grade 3Total
PRSp Ed
PR
Grade 6Total
PRSp Ed
PR
70 106 953 7 6
Sp EdTotal
Number Tested
Grade 7Total
PRSp Ed
PR
Grade 8 Total
PRSp Ed
PR
Grade 11Total
PRSp Ed
PR
MathReadingScienceComposite Score
22.922.723.3
22.723.0
72 41
67 53
70 52
61 41
70 47
68 46
79 11
75 38
76 53
80 51
72 40
69 35
73 42
76
76
70
64
65
70
71
69
68
69
69
68
1076 584 191
Percent Proficient or Higher
No assessment data are reported when less than ten students were tested.
Ideas and Development
Sp EdTotal
Organization, Unity, and Coherence
Sp EdTotal
Word Choice
Sp EdTotal
Sentences and Paragraphs
Sp EdTotal
Grammer and Usage
Sp EdTotal
Writing Mechanics
Sp EdTotal
NumberTested
49% 52% 51%
64%
44%
57%
56%
74%
49%
68%
77
110

General $359,953Capital Outlay $326,106
Pension $20,864Special Education $25,680
Ending Fund Balance
Bond Redemption $0Capital Projects $0
Other Fund Data
Agricultural $4.36Non-Ag Z $5.73Owner Occupied $7.01Other Non-Ag/Utilities $15.03Special Education $1.40
Bond Redemption $0.00Pension Fund $0.11
Capital Outlay $2.70
2005 Payable 2006 Levy per Thousand
$812,067$54,351
$0
General AidSpecial EducationExtraordinary Cost Fund - SE
$866,418Total State Aid
State Aid
Special Education Federal Flowthrough
$50,736IDEA Part BPart B, Sec. 619, PK $5,963
$56,699Total
K-12 Instruction $709,136PK Instruction $0Adult Instruction $0
$158,129$23,518
$0
General Special Education
Expenditures
Community Services $855Non-Programmed $0Debt Service $0Co-Curricular $81,083
$0$0$0$0
Total Expenditures $1,409,727 $242,687
2005 Payable 2006Taxable Valuations
Agricultural $56,518,323Owner Occupied $21,264,353Non-Ag Z $630,847Other Non-Ag/Utilities $11,178,111Total $89,591,634
$27,98516.8
0.0%20.0
$28,165Average Teacher SalaryExperience Adjusted SalaryAvg Years of Experience% with Advanced DegreesCertified Instructional Staff
Teaching Staff Data
ADM of Tuitioned Out Paid 1.415
General State Aid Adj. ADM 269.286Non-Public / Home Sch ADM 10.246
ADM Data
Local $567,674County $8,649State $831,108Federal $81,252Total $1,488,683
$244,212$0$0$0
$120,227$0
$54,351$68,854
General Capital Outlay Special Education Pension
$244,212 $243,432 $9,889
Revenue
Classroom Staff 0.0
ADM of Contracted Out Paid 0.000
Other Special Revenue $0
100 S Cedar, Marion, SD 57043
2005-2006 Profile of Marion School District 60-3
Capital Outlay Pension
Student/Staff ServicesAdministration ServicesTransportation ServicesOther Support Services
Enterprise Funds
Cost per ADM
General Fund Only
Revenue Expenditures
* Includes General, Special Education and Pension Funds
Home County: TurnerArea in Square Miles: 110
2005 K-12 Fall Enrollment: 230
$9,889$0$0$0
$0$0
$6,170$0$0
$91,412$169,385
$67,550$290,307
$4,058$0
$14,995$53,467
$0$0
$66,905$11,119
$45,572$10,859
$0$4,610
$0$7,700
$0$0$0$0$0$0
$6,208Educational Funds* $6,956
$0$0$0
$84,133 $87,451
*District has opted out of General Fund levy
$175,302 $13,871
$24,757

December 2005 Federal Child Count
0Deaf-Blind
015
3
DeafSpeech/Language
Autism
0Emotionally Disturbed20
10100
Mental RetardationHearing ImpairedLearning DisabledMultiple DisabilitiesOrthopedic ImpairmentVisually Impaired
1
13
Other Health Impaired
Traumatic Brain InjuryDevelopmental Delay
36Total
0
0
011
00
12
10
2
1
0
0
Home
Early Childhood Setting
PT Early Child and SEEarly Childhood SE Setting
Separate SchoolResidential Facility
Regular Classroom
Resource Room
Self-Contained Classroom
Day Program
24 Hour Program
Home/Hospital Program
Special Education Placement Categories
Total 36
Student to Staff Ratio 12.1
K-8 138.8459-12 78.889
144.25782.684
ADA ADM
Total 217.734 226.941
Student Data
PK-12 Enrollment 241Open Enrolled Students Rec'd 14District Dropout Rate 0.0%
% Special Needs Students 14.9%% Eligible for Free/Red. Lunch 22.7%
Students Transported 125
District Attendance RateNumber of Graduates
95.9%20
Enrollment
Stanford Achievement Test Series, Tenth Edition (SAT10)
91
94
88
64
84
85
Math
Social Science
Language Arts
Reading
Complete Battery
Science
Stanford Writing Assessment Program, Third Edition
Grade 5
Grade 9
American College Test (ACT)
Grade 5Total
PRSpEd
PR
Number Tested
English
15
83%
Total PR
Sp Ed PR
78
73
66
53
59
67
69
73
65
56
75
67
74%
Grade 4 Grade 3Total
PRSp Ed
PR
Grade 6Total
PRSp Ed
PR
13 18 161 1
Sp EdTotal
Number Tested
Grade 7Total
PRSp Ed
PR
Grade 8 Total
PRSp Ed
PR
Grade 11Total
PRSp Ed
PR
MathReadingScienceComposite Score
23.220.121.1
21.321.5
81
79
83
73
76
77
20 4
91
73
79
69
70
79
96
87
80
76
83
87
72
66
67
69
62
66
119 116 121
Percent Proficient or Higher
No assessment data are reported when less than ten students were tested.
Ideas and Development
Sp EdTotal
Organization, Unity, and Coherence
Sp EdTotal
Word Choice
Sp EdTotal
Sentences and Paragraphs
Sp EdTotal
Grammer and Usage
Sp EdTotal
Writing Mechanics
Sp EdTotal
NumberTested
65% 76% 71%
78%
60%
78%
59%
70%
59%
91%
17
23
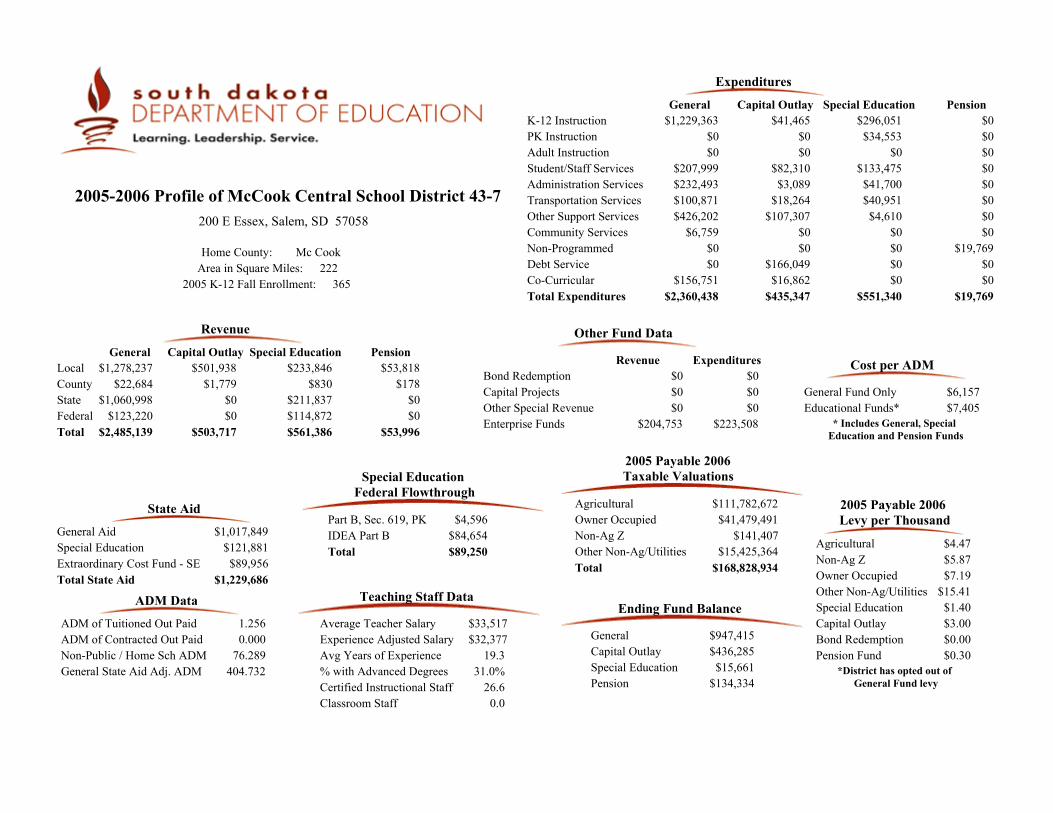
General $947,415Capital Outlay $436,285
Pension $134,334Special Education $15,661
Ending Fund Balance
Bond Redemption $0Capital Projects $0
Other Fund Data
Agricultural $4.47Non-Ag Z $5.87Owner Occupied $7.19Other Non-Ag/Utilities $15.41Special Education $1.40
Bond Redemption $0.00Pension Fund $0.30
Capital Outlay $3.00
2005 Payable 2006 Levy per Thousand
$1,017,849$121,881
$89,956
General AidSpecial EducationExtraordinary Cost Fund - SE
$1,229,686Total State Aid
State Aid
Special Education Federal Flowthrough
$84,654IDEA Part BPart B, Sec. 619, PK $4,596
$89,250Total
K-12 Instruction $1,229,363PK Instruction $0Adult Instruction $0
$296,051$34,553
$0
General Special Education
Expenditures
Community Services $6,759Non-Programmed $0Debt Service $0Co-Curricular $156,751
$0$0$0$0
Total Expenditures $2,360,438 $551,340
2005 Payable 2006Taxable Valuations
Agricultural $111,782,672Owner Occupied $41,479,491Non-Ag Z $141,407Other Non-Ag/Utilities $15,425,364Total $168,828,934
$32,37719.3
31.0%26.6
$33,517Average Teacher SalaryExperience Adjusted SalaryAvg Years of Experience% with Advanced DegreesCertified Instructional Staff
Teaching Staff Data
ADM of Tuitioned Out Paid 1.256
General State Aid Adj. ADM 404.732Non-Public / Home Sch ADM 76.289
ADM Data
Local $1,278,237County $22,684State $1,060,998Federal $123,220Total $2,485,139
$501,938$1,779
$0$0
$233,846$830
$211,837$114,872
General Capital Outlay Special Education Pension
$503,717 $561,386 $53,996
Revenue
Classroom Staff 0.0
ADM of Contracted Out Paid 0.000
Other Special Revenue $0
200 E Essex, Salem, SD 57058
2005-2006 Profile of McCook Central School District 43-7
Capital Outlay Pension
Student/Staff ServicesAdministration ServicesTransportation ServicesOther Support Services
Enterprise Funds
Cost per ADM
General Fund Only
Revenue Expenditures
* Includes General, Special Education and Pension Funds
Home County: Mc CookArea in Square Miles: 222
2005 K-12 Fall Enrollment: 365
$53,818$178
$0$0
$0$0
$0$0$0
$207,999$232,493$100,871$426,202
$82,310$3,089
$18,264$107,307
$0$0
$166,049$16,862
$133,475$41,700$40,951$4,610
$0$0$0$0$0
$19,769$0$0
$6,157Educational Funds* $7,405
$0$0$0
$204,753 $223,508
*District has opted out of General Fund levy
$435,347 $19,769
$41,465

December 2005 Federal Child Count
0Deaf-Blind
131
1
DeafSpeech/Language
Autism
1Emotionally Disturbed20
25510
Mental RetardationHearing ImpairedLearning DisabledMultiple DisabilitiesOrthopedic ImpairmentVisually Impaired
9
02
Other Health Impaired
Traumatic Brain InjuryDevelopmental Delay
78Total
0
0
69
00
60
2
0
0
1
0
Home
Early Childhood Setting
PT Early Child and SEEarly Childhood SE Setting
Separate SchoolResidential Facility
Regular Classroom
Resource Room
Self-Contained Classroom
Day Program
24 Hour Program
Home/Hospital Program
Special Education Placement Categories
Total 78
Student to Staff Ratio 13.7
K-8 222.2169-12 138.083
228.037143.948
ADA ADM
Total 360.299 371.985
Student Data
PK-12 Enrollment 365Open Enrolled Students Rec'd 17District Dropout Rate 0.4%
% Special Needs Students 21.4%% Eligible for Free/Red. Lunch 28.3%
Students Transported 113
District Attendance RateNumber of Graduates
96.9%30
Enrollment
Stanford Achievement Test Series, Tenth Edition (SAT10)
90
87
84
70
80
82
Math
Social Science
Language Arts
Reading
Complete Battery
Science
Stanford Writing Assessment Program, Third Edition
Grade 5
Grade 9
American College Test (ACT)
Grade 5Total
PRSpEd
PR
Number Tested
English
29
70%
Total PR
Sp Ed PR
70
69
65
62
63
65
70
65
51
49
69
61
70%
Grade 4 Grade 3Total
PRSp Ed
PR
Grade 6Total
PRSp Ed
PR
22 27 334 3 4
Sp EdTotal
Number Tested
Grade 7Total
PRSp Ed
PR
Grade 8 Total
PRSp Ed
PR
Grade 11Total
PRSp Ed
PR
MathReadingScienceComposite Score
22.122.221.3
21.822.0
76
62
59
74
67
65
19 3
94
76
87
74
73
83
81
72
78
67
67
70
78
82
69
69
62
70
326 424 328
Percent Proficient or Higher
No assessment data are reported when less than ten students were tested.
Ideas and Development
Sp EdTotal
Organization, Unity, and Coherence
Sp EdTotal
Word Choice
Sp EdTotal
Sentences and Paragraphs
Sp EdTotal
Grammer and Usage
Sp EdTotal
Writing Mechanics
Sp EdTotal
NumberTested
83% 79% 58%
65%
46%
59%
75%
65%
38%
68%
24
37

General $357,825Capital Outlay $379,121
Pension $74,794Special Education $69,054
Ending Fund Balance
Bond Redemption $0Capital Projects $0
Other Fund Data
Agricultural $5.33Non-Ag Z $7.00Owner Occupied $8.57Other Non-Ag/Utilities $18.38Special Education $1.40
Bond Redemption $0.00Pension Fund $0.00
Capital Outlay $3.00
2005 Payable 2006 Levy per Thousand
$513,449$73,542
$0
General AidSpecial EducationExtraordinary Cost Fund - SE
$586,991Total State Aid
State Aid
Special Education Federal Flowthrough
$43,600IDEA Part BPart B, Sec. 619, PK $3,020
$46,620Total
K-12 Instruction $962,734PK Instruction $0Adult Instruction $0
$123,669$0$0
General Special Education
Expenditures
Community Services $0Non-Programmed $1,378Debt Service $0Co-Curricular $83,512
$0$0$0$0
Total Expenditures $1,929,030 $226,323
2005 Payable 2006Taxable Valuations
Agricultural $34,313,561Owner Occupied $2,606,977Non-Ag Z $241,720Other Non-Ag/Utilities $2,421,691Total $39,583,949
$34,29216.6
0.0%16.6
$35,100Average Teacher SalaryExperience Adjusted SalaryAvg Years of Experience% with Advanced DegreesCertified Instructional Staff
Teaching Staff Data
ADM of Tuitioned Out Paid 0.000
General State Aid Adj. ADM 175.666Non-Public / Home Sch ADM 5.000
ADM Data
Local $348,308County $1,865State $540,634Federal $314,617Total $1,205,423
$70,338$0$0
$11,305
$60,657$0
$73,542$67,886
General Capital Outlay Special Education Pension
$81,643 $202,085 $16,497
Revenue
Classroom Staff 0.0
ADM of Contracted Out Paid 0.000
Other Special Revenue $0
135 Main St, McIntosh, SD 57641
2005-2006 Profile of McIntosh School District 15-1
Capital Outlay Pension
Student/Staff ServicesAdministration ServicesTransportation ServicesOther Support Services
Enterprise Funds
Cost per ADM
General Fund Only
Revenue Expenditures
* Includes General, Special Education and Pension Funds
Home County: CorsonArea in Square Miles: 900
2005 K-12 Fall Enrollment: 151
$16,497$0$0$0
$0$0
$0$0$0
$287,573$209,460$177,666$206,708
$13,518$1,590
$166,892$7,074
$0$0$0
$1,375
$91,908$6,589$4,157
$0
$0$0$0$0$0
$32,043$0$0
$12,079Educational Funds* $13,747
$0$0
$927,185$77,962 $114,944
*District has opted out of General Fund levy
$201,650 $32,043
$11,201

December 2005 Federal Child Count
0Deaf-Blind
07
3
DeafSpeech/Language
Autism
0Emotionally Disturbed20
18100
Mental RetardationHearing ImpairedLearning DisabledMultiple DisabilitiesOrthopedic ImpairmentVisually Impaired
1
03
Other Health Impaired
Traumatic Brain InjuryDevelopmental Delay
35Total
1
0
70
00
22
4
1
0
0
0
Home
Early Childhood Setting
PT Early Child and SEEarly Childhood SE Setting
Separate SchoolResidential Facility
Regular Classroom
Resource Room
Self-Contained Classroom
Day Program
24 Hour Program
Home/Hospital Program
Special Education Placement Categories
Total 35
Student to Staff Ratio 9.6
K-8 96.3619-12 54.717
98.67155.827
ADA ADM
Total 151.078 154.498
Student Data
PK-12 Enrollment 159Open Enrolled Students Rec'd 29District Dropout Rate 4.1%
% Special Needs Students 22.0%% Eligible for Free/Red. Lunch 71.0%
Students Transported 127
District Attendance RateNumber of Graduates
97.8%18
Enrollment
Stanford Achievement Test Series, Tenth Edition (SAT10)
82
82
86
72
76
79
Math
Social Science
Language Arts
Reading
Complete Battery
Science
Stanford Writing Assessment Program, Third Edition
Grade 5
Grade 9
American College Test (ACT)
Grade 5Total
PRSpEd
PR
Number Tested
English
18
94%
Total PR
Sp Ed PR
71
59
62
62
66
64
88
75
70
56
74
72
88%
Grade 4 Grade 3Total
PRSp Ed
PR
Grade 6Total
PRSp Ed
PR
11 16 92 3
Sp EdTotal
Number Tested
Grade 7Total
PRSp Ed
PR
Grade 8 Total
PRSp Ed
PR
Grade 11Total
PRSp Ed
PR
MathReadingScienceComposite Score
16.920.717.2
20.218.8
88
84
73
66
77
78
7
66
77
83
74
57
69
57
58
67
64
50
57
65
58
73
79
63
66
110 414 112
Percent Proficient or Higher
No assessment data are reported when less than ten students were tested.
Ideas and Development
Sp EdTotal
Organization, Unity, and Coherence
Sp EdTotal
Word Choice
Sp EdTotal
Sentences and Paragraphs
Sp EdTotal
Grammer and Usage
Sp EdTotal
Writing Mechanics
Sp EdTotal
NumberTested
73% 64% 73%
94%
64%
81%
55%
63%
73%
63%
11
16
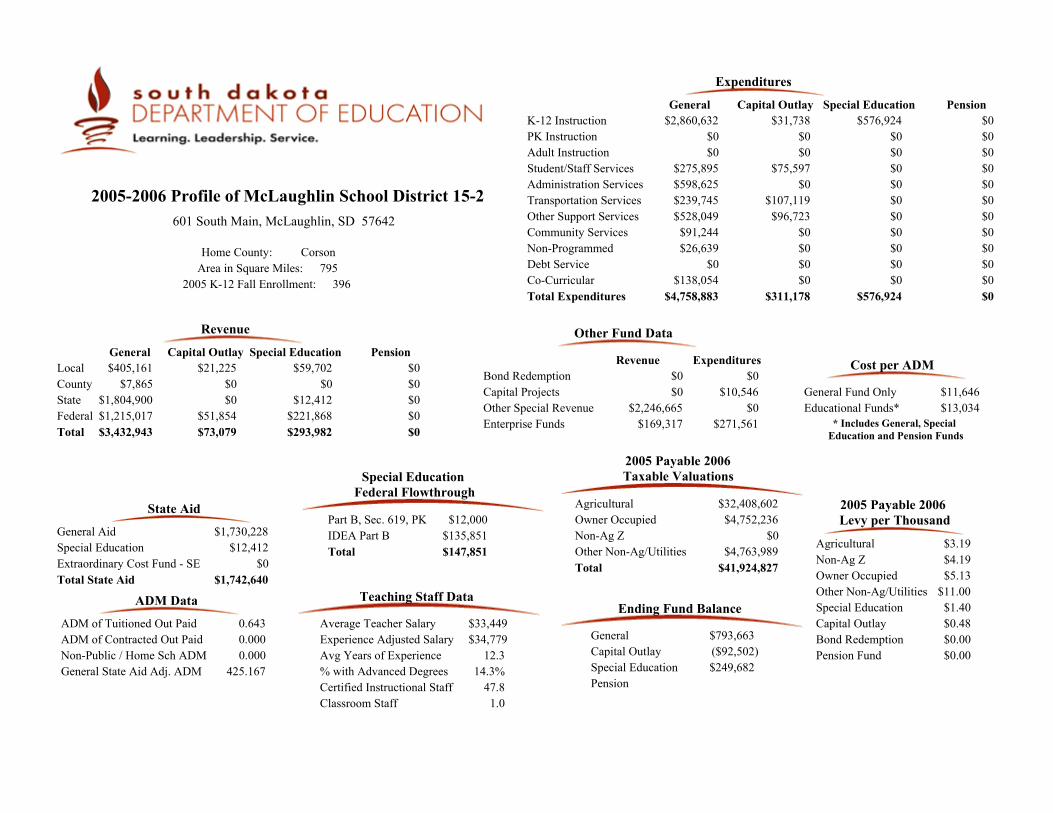
General $793,663Capital Outlay ($92,502)
PensionSpecial Education $249,682
Ending Fund Balance
Bond Redemption $0Capital Projects $10,546
Other Fund Data
Agricultural $3.19Non-Ag Z $4.19Owner Occupied $5.13Other Non-Ag/Utilities $11.00Special Education $1.40
Bond Redemption $0.00Pension Fund $0.00
Capital Outlay $0.48
2005 Payable 2006 Levy per Thousand
$1,730,228$12,412
$0
General AidSpecial EducationExtraordinary Cost Fund - SE
$1,742,640Total State Aid
State Aid
Special Education Federal Flowthrough
$135,851IDEA Part BPart B, Sec. 619, PK $12,000
$147,851Total
K-12 Instruction $2,860,632PK Instruction $0Adult Instruction $0
$576,924$0$0
General Special Education
Expenditures
Community Services $91,244Non-Programmed $26,639Debt Service $0Co-Curricular $138,054
$0$0$0$0
Total Expenditures $4,758,883 $576,924
2005 Payable 2006Taxable Valuations
Agricultural $32,408,602Owner Occupied $4,752,236Non-Ag Z $0Other Non-Ag/Utilities $4,763,989Total $41,924,827
$34,77912.3
14.3%47.8
$33,449Average Teacher SalaryExperience Adjusted SalaryAvg Years of Experience% with Advanced DegreesCertified Instructional Staff
Teaching Staff Data
ADM of Tuitioned Out Paid 0.643
General State Aid Adj. ADM 425.167Non-Public / Home Sch ADM 0.000
ADM Data
Local $405,161County $7,865State $1,804,900Federal $1,215,017Total $3,432,943
$21,225$0$0
$51,854
$59,702$0
$12,412$221,868
General Capital Outlay Special Education Pension
$73,079 $293,982 $0
Revenue
Classroom Staff 1.0
ADM of Contracted Out Paid 0.000
Other Special Revenue $0
601 South Main, McLaughlin, SD 57642
2005-2006 Profile of McLaughlin School District 15-2
Capital Outlay Pension
Student/Staff ServicesAdministration ServicesTransportation ServicesOther Support Services
Enterprise Funds
Cost per ADM
General Fund Only
Revenue Expenditures
* Includes General, Special Education and Pension Funds
Home County: CorsonArea in Square Miles: 795
2005 K-12 Fall Enrollment: 396
$0$0$0$0
$0$0
$0$0$0
$275,895$598,625$239,745$528,049
$75,597$0
$107,119$96,723
$0$0$0$0
$0$0$0$0
$0$0$0$0$0$0$0$0
$11,646Educational Funds* $13,034
$0$0
$2,246,665$169,317 $271,561
$311,178 $0
$31,738

December 2005 Federal Child Count
0Deaf-Blind
038
1
DeafSpeech/Language
Autism
1Emotionally Disturbed70
34000
Mental RetardationHearing ImpairedLearning DisabledMultiple DisabilitiesOrthopedic ImpairmentVisually Impaired
1
18
Other Health Impaired
Traumatic Brain InjuryDevelopmental Delay
91Total
0
0
292
00
42
17
0
0
1
0
Home
Early Childhood Setting
PT Early Child and SEEarly Childhood SE Setting
Separate SchoolResidential Facility
Regular Classroom
Resource Room
Self-Contained Classroom
Day Program
24 Hour Program
Home/Hospital Program
Special Education Placement Categories
Total 91
Student to Staff Ratio 8.8
K-8 265.6709-12 92.733
289.345105.095
ADA ADM
Total 358.403 394.440
Student Data
PK-12 Enrollment 429Open Enrolled Students Rec'd 1District Dropout Rate 9.5%
% Special Needs Students 21.2%% Eligible for Free/Red. Lunch 82.9%
Students Transported 205
District Attendance RateNumber of Graduates
90.9%17
Enrollment
Stanford Achievement Test Series, Tenth Edition (SAT10)
64
51
46
29
42
48
Math
Social Science
Language Arts
Reading
Complete Battery
Science
Stanford Writing Assessment Program, Third Edition
Grade 5
Grade 9
American College Test (ACT)
Grade 5Total
PRSpEd
PR
Number Tested
English
16
39%
Total PR
Sp Ed PR
59
42
37
28
41
41
73
69
57
38
63
59
26%
Grade 4 Grade 3Total
PRSp Ed
PR
Grade 6Total
PRSp Ed
PR
25 33 222 2
Sp EdTotal
Number Tested
Grade 7Total
PRSp Ed
PR
Grade 8 Total
PRSp Ed
PR
Grade 11Total
PRSp Ed
PR
MathReadingScienceComposite Score
19.318.116.8
19.318.4
51
38
37
27
49
44
33 7
44
44
53
35
37
42
45
36
41
46
34
40
48
34
37
35
27
35
429 332 338
Percent Proficient or Higher
No assessment data are reported when less than ten students were tested.
Ideas and Development
Sp EdTotal
Organization, Unity, and Coherence
Sp EdTotal
Word Choice
Sp EdTotal
Sentences and Paragraphs
Sp EdTotal
Grammer and Usage
Sp EdTotal
Writing Mechanics
Sp EdTotal
NumberTested
26% 15% 21%
32%
9%
29%
21%
42%
21%
35%
34
31

General $2,669,547Capital Outlay $3,327,768
Pension $487,233Special Education $616,873
Ending Fund Balance
Bond Redemption $0Capital Projects $0
Other Fund Data
Agricultural $3.19Non-Ag Z $4.19Owner Occupied $5.13Other Non-Ag/Utilities $11.00Special Education $1.25
Bond Redemption $0.00Pension Fund $0.30
Capital Outlay $3.00
2005 Payable 2006 Levy per Thousand
$5,931,132$734,495
$0
General AidSpecial EducationExtraordinary Cost Fund - SE
$6,665,627Total State Aid
State Aid
Special Education Federal Flowthrough
$491,555IDEA Part BPart B, Sec. 619, PK $16,953
$508,508Total
K-12 Instruction $8,848,945PK Instruction $0Adult Instruction $78,030
$1,860,391$0$0
General Special Education
Expenditures
Community Services $26,662Non-Programmed $5,683Debt Service $0Co-Curricular $474,679
$0$0$0$0
Total Expenditures $14,303,679 $2,393,512
2005 Payable 2006Taxable Valuations
Agricultural $202,417,886Owner Occupied $481,418,988Non-Ag Z $15,507,072Other Non-Ag/Utilities $227,569,938Total $926,913,884
$33,54515.1
16.6%193.7
$33,747Average Teacher SalaryExperience Adjusted SalaryAvg Years of Experience% with Advanced DegreesCertified Instructional Staff
Teaching Staff Data
ADM of Tuitioned Out Paid 15.139
General State Aid Adj. ADM 2,678.034Non-Public / Home Sch ADM 103.049
ADM Data
Local $5,981,417County $436,976State $6,243,881Federal $1,586,740Total $14,249,013
$2,721,360$0$0$0
$1,146,403$0
$734,495$568,654
General Capital Outlay Special Education Pension
$2,721,360 $2,449,552 $278,908
Revenue
Classroom Staff 1.0
ADM of Contracted Out Paid 0.000
Other Special Revenue $0
1230 Douglas St, Sturgis, SD 57785-1869
2005-2006 Profile of Meade School District 46-1
Capital Outlay Pension
Student/Staff ServicesAdministration ServicesTransportation ServicesOther Support Services
Enterprise Funds
Cost per ADM
General Fund Only
Revenue Expenditures
* Includes General, Special Education and Pension Funds
Home County: MeadeArea in Square Miles: 3,121
2005 K-12 Fall Enrollment: 2,688
$278,908$0$0$0
$0$0
$0$0$0
$1,018,911$891,581$506,865
$2,452,323
$25,000$0
$94,850$887,864
$0$0
$803,368$52,708
$433,751$75,292$24,078
$0
$0$0$0$0$0
$126,292$0$0
$5,332Educational Funds* $6,197
$0$0$0
$935,999 $903,566
$1,930,905 $126,292
$67,115

December 2005 Federal Child Count
0Deaf-Blind
093
8
DeafSpeech/Language
Autism
25Emotionally Disturbed22
2152
2120
Mental RetardationHearing ImpairedLearning DisabledMultiple DisabilitiesOrthopedic ImpairmentVisually Impaired
13
033
Other Health Impaired
Traumatic Brain InjuryDevelopmental Delay
371Total
0
0
050
01
175
90
45
8
2
0
Home
Early Childhood Setting
PT Early Child and SEEarly Childhood SE Setting
Separate SchoolResidential Facility
Regular Classroom
Resource Room
Self-Contained Classroom
Day Program
24 Hour Program
Home/Hospital Program
Special Education Placement Categories
Total 371
Student to Staff Ratio 13.8
K-8 1,748.1319-12 772.371
1,828.758833.633
ADA ADM
Total 2,520.502 2,662.391
Student Data
PK-12 Enrollment 2,688Open Enrolled Students Rec'd 196District Dropout Rate 2.4%
% Special Needs Students 13.8%% Eligible for Free/Red. Lunch 14.8%
Students Transported 365
District Attendance RateNumber of Graduates
94.7%182
Enrollment
Stanford Achievement Test Series, Tenth Edition (SAT10)
70
74
69
50
67
66
Math
Social Science
Language Arts
Reading
Complete Battery
Science
Stanford Writing Assessment Program, Third Edition
Grade 5
Grade 9
American College Test (ACT)
Grade 5Total
PRSpEd
PR
Number Tested
English
111
52%
48
53
47
23
37
41
Total PR
Sp Ed PR
69
68
63
61
68
66
27
41
35
27
30
31
75
71
64
51
70
66
28
27
33
20
26
27
55%
Grade 4 Grade 3Total
PRSp Ed
PR
Grade 6Total
PRSp Ed
PR
198 231 21219 14 15
Sp EdTotal
Number Tested
Grade 7Total
PRSp Ed
PR
Grade 8 Total
PRSp Ed
PR
Grade 11Total
PRSp Ed
PR
MathReadingScienceComposite Score
21.820.920.7
21.221.3
62 55
62 66
64 59
53 37
59 45
59 51
195 14
58 33
70 63
71 46
62 36
61 29
62 39
60 28
72 44
66 35
66 33
64 30
64 33
65 27
59 27
58 31
65 25
57 28
60 28
11193 15191 15210
Percent Proficient or Higher
No assessment data are reported when less than ten students were tested.
Ideas and Development
Sp EdTotal
Organization, Unity, and Coherence
Sp EdTotal
Word Choice
Sp EdTotal
Sentences and Paragraphs
Sp EdTotal
Grammer and Usage
Sp EdTotal
Writing Mechanics
Sp EdTotal
NumberTested
59% 58% 61%
56%
43%
53%
50%
55%
42%
61%
185
210
1

General $1,163,922Capital Outlay $549,164
Pension $183,867Special Education ($17,323)
Ending Fund Balance
Bond Redemption $205,420Capital Projects $0
Other Fund Data
Agricultural $4.44Non-Ag Z $5.83Owner Occupied $7.14Other Non-Ag/Utilities $15.31Special Education $1.40
Bond Redemption $1.74Pension Fund $0.30
Capital Outlay $1.69
2005 Payable 2006 Levy per Thousand
$1,053,015$24,588$23,870
General AidSpecial EducationExtraordinary Cost Fund - SE
$1,101,473Total State Aid
State Aid
Special Education Federal Flowthrough
$66,154IDEA Part BPart B, Sec. 619, PK $2,617
$68,771Total
K-12 Instruction $1,187,622PK Instruction $4,202Adult Instruction $0
$178,862$22,729
$0
General Special Education
Expenditures
Community Services $8,425Non-Programmed $0Debt Service $0Co-Curricular $97,367
$0$0$0$0
Total Expenditures $1,968,879 $297,774
2005 Payable 2006Taxable Valuations
Agricultural $96,508,444Owner Occupied $15,364,137Non-Ag Z $462,832Other Non-Ag/Utilities $6,541,373Total $118,876,786
$29,47016.6
10.0%28.3
$30,051Average Teacher SalaryExperience Adjusted SalaryAvg Years of Experience% with Advanced DegreesCertified Instructional Staff
Teaching Staff Data
ADM of Tuitioned Out Paid 0.000
General State Aid Adj. ADM 347.489Non-Public / Home Sch ADM 2.000
ADM Data
Local $778,226County $12,358State $1,097,827Federal $184,637Total $2,073,048
$214,062$0$0$0
$160,408$0
$48,458$63,187
General Capital Outlay Special Education Pension
$214,062 $272,052 $34,072
Revenue
Classroom Staff 0.0
ADM of Contracted Out Paid 0.000
Other Special Revenue $0
410 5th Street, Menno, SD 57045-0346
2005-2006 Profile of Menno School District 33-2
Capital Outlay Pension
Student/Staff ServicesAdministration ServicesTransportation ServicesOther Support Services
Enterprise Funds
Cost per ADM
General Fund Only
Revenue Expenditures
* Includes General, Special Education and Pension Funds
Home County: HutchinsonArea in Square Miles: 180
2005 K-12 Fall Enrollment: 319
$34,072$0$0$0
$0$0
$0$0$0
$128,719$205,831
$67,943$268,770
$2,391$1,149
$32,689$88,165
$0$0$0
$11,508
$96,184$0$0$0
$0$0$0$0$0
$29,532$0$0
$6,299Educational Funds* $7,280
$208,952$0$0
$193,416 $227,020
*District has opted out of General Fund levy
$164,467 $29,532
$28,564

December 2005 Federal Child Count
0Deaf-Blind
08
0
DeafSpeech/Language
Autism
0Emotionally Disturbed11
25200
Mental RetardationHearing ImpairedLearning DisabledMultiple DisabilitiesOrthopedic ImpairmentVisually Impaired
1
03
Other Health Impaired
Traumatic Brain InjuryDevelopmental Delay
41Total
0
0
34
00
19
14
1
0
0
0
Home
Early Childhood Setting
PT Early Child and SEEarly Childhood SE Setting
Separate SchoolResidential Facility
Regular Classroom
Resource Room
Self-Contained Classroom
Day Program
24 Hour Program
Home/Hospital Program
Special Education Placement Categories
Total 41
Student to Staff Ratio 11.5
K-8 231.3449-12 71.621
236.34974.201
ADA ADM
Total 302.965 310.550
Student Data
PK-12 Enrollment 324Open Enrolled Students Rec'd 40District Dropout Rate 0.8%
% Special Needs Students 12.7%% Eligible for Free/Red. Lunch 62.6%
Students Transported 135
District Attendance RateNumber of Graduates
97.6%12
Enrollment
Stanford Achievement Test Series, Tenth Edition (SAT10)
71
70
67
45
59
62
Math
Social Science
Language Arts
Reading
Complete Battery
Science
Stanford Writing Assessment Program, Third Edition
Grade 5
Grade 9
American College Test (ACT)
Grade 5Total
PRSpEd
PR
Number Tested
English
10
76%
Total PR
Sp Ed PR
85
67
71
72
75
75
77
75
59
65
69
67
79%
Grade 4 Grade 3Total
PRSp Ed
PR
Grade 6Total
PRSp Ed
PR
26 24 163 1 1
Sp EdTotal
Number Tested
Grade 7Total
PRSp Ed
PR
Grade 8 Total
PRSp Ed
PR
Grade 11Total
PRSp Ed
PR
MathReadingScienceComposite Score
21.120.317.8
21.220.2
64
55
62
61
56
59
29 7
83
73
78
73
72
76
75
77
70
68
65
70
82
66
61
71
60
69
626 421 325
Percent Proficient or Higher
No assessment data are reported when less than ten students were tested.
Ideas and Development
Sp EdTotal
Organization, Unity, and Coherence
Sp EdTotal
Word Choice
Sp EdTotal
Sentences and Paragraphs
Sp EdTotal
Grammer and Usage
Sp EdTotal
Writing Mechanics
Sp EdTotal
NumberTested
58% 46% 58%
59%
42%
59%
46%
62%
46%
55%
26
29

General $122,960Capital Outlay $153,727
PensionSpecial Education $44,872
Ending Fund Balance
Bond Redemption $0Capital Projects $0
Other Fund Data
Agricultural $6.81Non-Ag Z $8.94Owner Occupied $10.95Other Non-Ag/Utilities $23.48Special Education $0.00
Bond Redemption $0.00Pension Fund $0.00
Capital Outlay $0.00
2005 Payable 2006 Levy per Thousand
$152,561$0$0
General AidSpecial EducationExtraordinary Cost Fund - SE
$152,561Total State Aid
State Aid
Special Education Federal Flowthrough
$11,056IDEA Part BPart B, Sec. 619, PK $1,489
$12,545Total
K-12 Instruction $377,686PK Instruction $0Adult Instruction $0
$26,514$37,594
$0
General Special Education
Expenditures
Community Services $0Non-Programmed $1,469Debt Service $0Co-Curricular $30,065
$0$0$0$0
Total Expenditures $695,790 $98,147
2005 Payable 2006Taxable Valuations
Agricultural $39,255,665Owner Occupied $3,261,367Non-Ag Z $713,803Other Non-Ag/Utilities $2,199,040Total $45,429,875
$29,41810.3
0.0%8.3
$26,636Average Teacher SalaryExperience Adjusted SalaryAvg Years of Experience% with Advanced DegreesCertified Instructional Staff
Teaching Staff Data
ADM of Tuitioned Out Paid 0.000
General State Aid Adj. ADM 63.050Non-Public / Home Sch ADM 1.000
ADM Data
Local $394,996County $2,742State $167,367Federal $76,077Total $641,183
$10,238$0$0$0
$1,053$0$0
$13,356
General Capital Outlay Special Education Pension
$10,238 $14,409 $0
Revenue
Classroom Staff 2.5
ADM of Contracted Out Paid 0.000
Other Special Revenue $0
104 Main St, Midland, SD 57552-0226
2005-2006 Profile of Midland School District 27-2
Capital Outlay Pension
Student/Staff ServicesAdministration ServicesTransportation ServicesOther Support Services
Enterprise Funds
Cost per ADM
General Fund Only
Revenue Expenditures
* Includes General, Special Education and Pension Funds
Home County: HaakonArea in Square Miles: 400
2005 K-12 Fall Enrollment: 52
$0$0$0$0
$0$0
$0$0$0
$76,057$79,385
$5,551$125,577
$0$0$0
$15,553$0$0$0$0
$19,725$14,314
$0$0
$0$0$0$0$0$0$0$0
$13,243Educational Funds* $14,395
$0$0$0
$24,324 $38,613
*District has opted out of General Fund levy
$19,390 $0
$3,838

December 2005 Federal Child Count
0Deaf-Blind
00
1
DeafSpeech/Language
Autism
0Emotionally Disturbed103000
Mental RetardationHearing ImpairedLearning DisabledMultiple DisabilitiesOrthopedic ImpairmentVisually Impaired
1
00
Other Health Impaired
Traumatic Brain InjuryDevelopmental Delay
6Total
0
0
10
00
3
2
0
0
0
0
Home
Early Childhood Setting
PT Early Child and SEEarly Childhood SE Setting
Separate SchoolResidential Facility
Regular Classroom
Resource Room
Self-Contained Classroom
Day Program
24 Hour Program
Home/Hospital Program
Special Education Placement Categories
Total 6
Student to Staff Ratio 4.8
K-8 36.6559-12 14.202
37.54215.000
ADA ADM
Total 50.857 52.542
Student Data
PK-12 Enrollment 52Open Enrolled Students Rec'd 0District Dropout Rate 0.0%
% Special Needs Students 11.5%% Eligible for Free/Red. Lunch 52.8%
Students Transported 0
District Attendance RateNumber of Graduates
96.8%3
Enrollment
Stanford Achievement Test Series, Tenth Edition (SAT10)
47
70
69
50
62
59
Math
Social Science
Language Arts
Reading
Complete Battery
Science
Stanford Writing Assessment Program, Third Edition
Grade 5
Grade 9
American College Test (ACT)
Grade 5Total
PRSpEd
PR
Number Tested
English
3
67%
Total PR
Sp Ed PR
84
82
76
79
77
79
85
84
73
57
86
78
33%
Grade 4 Grade 3Total
PRSp Ed
PR
Grade 6Total
PRSp Ed
PR
4 7 5
Sp EdTotal
Number Tested
Grade 7Total
PRSp Ed
PR
Grade 8 Total
PRSp Ed
PR
Grade 11Total
PRSp Ed
PR
MathReadingScienceComposite Score
75
55
65
65
59
64
4
70
51
70
66
56
63
88
95
87
90
87
88
43
41
13
73
41
42
16 4 1
Percent Proficient or Higher
No assessment data are reported when less than ten students were tested.
Ideas and Development
Sp EdTotal
Organization, Unity, and Coherence
Sp EdTotal
Word Choice
Sp EdTotal
Sentences and Paragraphs
Sp EdTotal
Grammer and Usage
Sp EdTotal
Writing Mechanics
Sp EdTotal
NumberTested
100% 83% 67%
33%
33%
33%
50%
67%
17%
100%
6
3

General $767,668Capital Outlay $188,164
Pension $15,591Special Education $112,718
Ending Fund Balance
Bond Redemption $0Capital Projects $0
Other Fund Data
Agricultural $3.19Non-Ag Z $4.19Owner Occupied $5.13Other Non-Ag/Utilities $11.00Special Education $1.20
Bond Redemption $0.00Pension Fund $0.30
Capital Outlay $2.75
2005 Payable 2006 Levy per Thousand
$1,776,142$292,841
$0
General AidSpecial EducationExtraordinary Cost Fund - SE
$2,068,983Total State Aid
State Aid
Special Education Federal Flowthrough
$205,868IDEA Part BPart B, Sec. 619, PK $6,853
$212,721Total
K-12 Instruction $2,709,494PK Instruction $0Adult Instruction $0
$624,775$38,451
$0
General Special Education
Expenditures
Community Services $121,865Non-Programmed $0Debt Service $0Co-Curricular $318,018
$0$0$0$0
Total Expenditures $4,966,217 $972,336
2005 Payable 2006Taxable Valuations
Agricultural $101,048,200Owner Occupied $104,046,156Non-Ag Z $2,874,546Other Non-Ag/Utilities $129,224,933Total $337,193,835
$32,55321.7
13.4%65.6
$35,397Average Teacher SalaryExperience Adjusted SalaryAvg Years of Experience% with Advanced DegreesCertified Instructional Staff
Teaching Staff Data
ADM of Tuitioned Out Paid 1.000
General State Aid Adj. ADM 964.264Non-Public / Home Sch ADM 124.460
ADM Data
Local $2,781,970County $70,396State $1,912,617Federal $319,147Total $5,084,129
$973,682$0$0
$8,528
$430,279$0
$292,841$215,790
General Capital Outlay Special Education Pension
$982,210 $938,910 $103,263
Revenue
Classroom Staff 0.0
ADM of Contracted Out Paid 0.000
Other Special Revenue $0
1001 E Park Ave, Milbank, SD 57252-1190
2005-2006 Profile of Milbank School District 25-4
Capital Outlay Pension
Student/Staff ServicesAdministration ServicesTransportation ServicesOther Support Services
Enterprise Funds
Cost per ADM
General Fund Only
Revenue Expenditures
* Includes General, Special Education and Pension Funds
Home County: GrantArea in Square Miles: 299
2005 K-12 Fall Enrollment: 955
$103,263$0$0$0
$0$0
$45,200$0$0
$363,465$401,668$268,977$782,731
$10,547$2,500
$71,750$31,377
$0$0
$409,719$18,733
$216,951$87,784$4,375
$0
$0$3,955
$0$3,390
$0$43,693
$0$3,955
$4,980Educational Funds* $6,007
$0$0$0
$383,572 $403,565
$1,041,132 $100,193
$496,507

December 2005 Federal Child Count
0Deaf-Blind
023
2
DeafSpeech/Language
Autism
3Emotionally Disturbed61
6511
20
Mental RetardationHearing ImpairedLearning DisabledMultiple DisabilitiesOrthopedic ImpairmentVisually Impaired
0
116
Other Health Impaired
Traumatic Brain InjuryDevelopmental Delay
130Total
0
0
114
00
84
23
7
0
1
0
Home
Early Childhood Setting
PT Early Child and SEEarly Childhood SE Setting
Separate SchoolResidential Facility
Regular Classroom
Resource Room
Self-Contained Classroom
Day Program
24 Hour Program
Home/Hospital Program
Special Education Placement Categories
Total 130
Student to Staff Ratio 14.6
K-8 560.3619-12 367.247
578.814386.230
ADA ADM
Total 927.608 965.044
Student Data
PK-12 Enrollment 955Open Enrolled Students Rec'd 46District Dropout Rate 1.1%
% Special Needs Students 13.6%% Eligible for Free/Red. Lunch 21.4%
Students Transported 664
District Attendance RateNumber of Graduates
96.1%106
Enrollment
Stanford Achievement Test Series, Tenth Edition (SAT10)
78
72
69
57
67
68
Math
Social Science
Language Arts
Reading
Complete Battery
Science
Stanford Writing Assessment Program, Third Edition
Grade 5
Grade 9
American College Test (ACT)
Grade 5Total
PRSpEd
PR
Number Tested
English
76
68%
Total PR
Sp Ed PR
76
69
61
68
66
68
79
78
76
53
75
72
78%
Grade 4 Grade 3Total
PRSp Ed
PR
Grade 6Total
PRSp Ed
PR
68 70 716 5 4
Sp EdTotal
Number Tested
Grade 7Total
PRSp Ed
PR
Grade 8 Total
PRSp Ed
PR
Grade 11Total
PRSp Ed
PR
MathReadingScienceComposite Score
23.222.422.1
22.922.8
82 77
76 68
76 72
66 56
72 64
74 67
57 11
88
89
85
80
81
84
77
79
71
70
72
73
72
71
68
69
71
69
660 564 874
Percent Proficient or Higher
No assessment data are reported when less than ten students were tested.
Ideas and Development
Sp EdTotal
Organization, Unity, and Coherence
Sp EdTotal
Word Choice
Sp EdTotal
Sentences and Paragraphs
Sp EdTotal
Grammer and Usage
Sp EdTotal
Writing Mechanics
Sp EdTotal
NumberTested
83% 68% 80%
71%
59%
66%
68%
73%
64%
74%
59
111

General $1,301,917Capital Outlay $607,193
Pension $38,807Special Education $413,408
Ending Fund Balance
Bond Redemption $0Capital Projects $0
Other Fund Data
Agricultural $3.19Non-Ag Z $4.19Owner Occupied $5.13Other Non-Ag/Utilities $11.00Special Education $1.40
Bond Redemption $0.00Pension Fund $0.30
Capital Outlay $1.84
2005 Payable 2006 Levy per Thousand
$1,024,672$0$0
General AidSpecial EducationExtraordinary Cost Fund - SE
$1,024,672Total State Aid
State Aid
Special Education Federal Flowthrough
$105,725IDEA Part BPart B, Sec. 619, PK $4,195
$109,920Total
K-12 Instruction $1,580,028PK Instruction $0Adult Instruction $0
$366,452$24,477
$0
General Special Education
Expenditures
Community Services $0Non-Programmed $0Debt Service $0Co-Curricular $172,104
$0$0$0$0
Total Expenditures $2,763,983 $496,468
2005 Payable 2006Taxable Valuations
Agricultural $266,475,271Owner Occupied $36,346,958Non-Ag Z $1,735,443Other Non-Ag/Utilities $21,382,460Total $325,940,132
$28,94419.0
6.8%43.5
$30,369Average Teacher SalaryExperience Adjusted SalaryAvg Years of Experience% with Advanced DegreesCertified Instructional Staff
Teaching Staff Data
ADM of Tuitioned Out Paid 0.276
General State Aid Adj. ADM 527.870Non-Public / Home Sch ADM 29.000
ADM Data
Local $1,442,106County $38,720State $1,228,177Federal $197,995Total $2,906,999
$574,177$0$0$0
$462,611$0$0
$116,457
General Capital Outlay Special Education Pension
$574,177 $579,068 $93,932
Revenue
Classroom Staff 0.0
ADM of Contracted Out Paid 0.000
Other Special Revenue $0
623 E 4th St, Miller, SD 57362
2005-2006 Profile of Miller Area School District 29-3
Capital Outlay Pension
Student/Staff ServicesAdministration ServicesTransportation ServicesOther Support Services
Enterprise Funds
Cost per ADM
General Fund Only
Revenue Expenditures
* Includes General, Special Education and Pension Funds
Home County: HandArea in Square Miles: 1,118
2005 K-12 Fall Enrollment: 515
$93,932$0$0$0
$0$0
$38,320$0$0
$143,451$231,443$200,049$436,908
$0$0
$35,303$134,007
$0$0
$220,168$26,741
$70,576$33,963
$999$0
$0$0$0$0$0
$50,893$0$0
$5,324Educational Funds* $6,241
$0$0$0
$158,429 $162,807
$513,749 $89,213
$97,530

December 2005 Federal Child Count
0Deaf-Blind
020
2
DeafSpeech/Language
Autism
3Emotionally Disturbed10
122
310
Mental RetardationHearing ImpairedLearning DisabledMultiple DisabilitiesOrthopedic ImpairmentVisually Impaired
5
00
Other Health Impaired
Traumatic Brain InjuryDevelopmental Delay
67Total
0
0
70
00
38
13
9
0
0
0
Home
Early Childhood Setting
PT Early Child and SEEarly Childhood SE Setting
Separate SchoolResidential Facility
Regular Classroom
Resource Room
Self-Contained Classroom
Day Program
24 Hour Program
Home/Hospital Program
Special Education Placement Categories
Total 67
Student to Staff Ratio 11.9
K-8 341.5919-12 169.529
347.415170.238
ADA ADM
Total 511.120 517.653
Student Data
PK-12 Enrollment 518Open Enrolled Students Rec'd 48District Dropout Rate 1.1%
% Special Needs Students 12.9%% Eligible for Free/Red. Lunch 48.4%
Students Transported 154
District Attendance RateNumber of Graduates
98.7%37
Enrollment
Stanford Achievement Test Series, Tenth Edition (SAT10)
73
80
80
63
74
73
Math
Social Science
Language Arts
Reading
Complete Battery
Science
Stanford Writing Assessment Program, Third Edition
Grade 5
Grade 9
American College Test (ACT)
Grade 5Total
PRSpEd
PR
Number Tested
English
89%
Total PR
Sp Ed PR
80
72
76
81
74
76
81
78
62
58
68
69
91%
Grade 4 Grade 3Total
PRSp Ed
PR
Grade 6Total
PRSp Ed
PR
37 41 373 2
Sp EdTotal
Number Tested
Grade 7Total
PRSp Ed
PR
Grade 8 Total
PRSp Ed
PR
Grade 11Total
PRSp Ed
PR
MathReadingScienceComposite Score
68
69
70
47
59
62
43 3
74
75
81
70
63
71
86
72
82
79
77
79
72
79
70
76
66
70
436 434 550
Percent Proficient or Higher
No assessment data are reported when less than ten students were tested.
Ideas and Development
Sp EdTotal
Organization, Unity, and Coherence
Sp EdTotal
Word Choice
Sp EdTotal
Sentences and Paragraphs
Sp EdTotal
Grammer and Usage
Sp EdTotal
Writing Mechanics
Sp EdTotal
NumberTested
63% 54% 66%
91%
63%
89%
51%
93%
46%
89%
35
45

General $2,853,542Capital Outlay $712,923
Pension $384,334Special Education $596,340
Ending Fund Balance
Bond Redemption $0Capital Projects $0
Other Fund Data
Agricultural $3.35Non-Ag Z $4.40Owner Occupied $5.39Other Non-Ag/Utilities $11.55Special Education $1.40
Bond Redemption $0.00Pension Fund $0.30
Capital Outlay $3.00
2005 Payable 2006 Levy per Thousand
$5,581,903$940,462
$0
General AidSpecial EducationExtraordinary Cost Fund - SE
$6,522,365Total State Aid
State Aid
Special Education Federal Flowthrough
$556,521IDEA Part BPart B, Sec. 619, PK $18,964
$575,485Total
K-12 Instruction $8,274,586PK Instruction $0Adult Instruction $0
$1,623,987$161,423
$0
General Special Education
Expenditures
Community Services $11,123Non-Programmed $2,428Debt Service $0Co-Curricular $636,706
$0$0$0$0
Total Expenditures $13,284,192 $2,403,199
2005 Payable 2006Taxable Valuations
Agricultural $98,160,160Owner Occupied $371,651,489Non-Ag Z $1,981,527Other Non-Ag/Utilities $250,351,443Total $722,144,619
$35,22117.2
37.0%174.0
$37,020Average Teacher SalaryExperience Adjusted SalaryAvg Years of Experience% with Advanced DegreesCertified Instructional Staff
Teaching Staff Data
ADM of Tuitioned Out Paid 13.136
General State Aid Adj. ADM 2,516.502Non-Public / Home Sch ADM 399.656
ADM Data
Local $5,788,511County $327,708State $5,934,060Federal $1,344,086Total $13,394,365
$2,176,042$173,360
$0$166,250
$985,957$0
$940,462$612,029
General Capital Outlay Special Education Pension
$2,515,652 $2,538,448 $210,230
Revenue
Classroom Staff 1.0
ADM of Contracted Out Paid 0.000
Other Special Revenue $0
800 W 10th Avenue, Mitchell, SD 57301-7760
2005-2006 Profile of Mitchell School District 17-2
Capital Outlay Pension
Student/Staff ServicesAdministration ServicesTransportation ServicesOther Support Services
Enterprise Funds
Cost per ADM
General Fund Only
Revenue Expenditures
* Includes General, Special Education and Pension Funds
Home County: DavisonArea in Square Miles: 266
2005 K-12 Fall Enrollment: 2,516
$210,230$0$0$0
$0$0
$0$0$0
$1,089,778$1,048,360
$171,859$2,049,352
$77,440$427,528
$28,634$758,158
$0$0
$894,661$28,987
$510,727$72,392$34,670
$0
$0$0$0$0$0
$82,128$0$0
$5,267Educational Funds* $6,030
$0$0$0
$1,148,470 $1,100,233
*District has opted out of General Fund levy
$2,249,756 $82,128
$34,348

December 2005 Federal Child Count
0Deaf-Blind
1130
17
DeafSpeech/Language
Autism
10Emotionally Disturbed22
1120
1121
Mental RetardationHearing ImpairedLearning DisabledMultiple DisabilitiesOrthopedic ImpairmentVisually Impaired
29
725
Other Health Impaired
Traumatic Brain InjuryDevelopmental Delay
376Total
0
7
2336
00
171
114
8
10
7
0
Home
Early Childhood Setting
PT Early Child and SEEarly Childhood SE Setting
Separate SchoolResidential Facility
Regular Classroom
Resource Room
Self-Contained Classroom
Day Program
24 Hour Program
Home/Hospital Program
Special Education Placement Categories
Total 376
Student to Staff Ratio 14.4
K-8 1,624.1429-12 782.458
1,681.011822.434
ADA ADM
Total 2,406.600 2,503.445
Student Data
PK-12 Enrollment 2,516Open Enrolled Students Rec'd 57District Dropout Rate 1.1%
% Special Needs Students 14.9%% Eligible for Free/Red. Lunch 55.4%
Students Transported 500
District Attendance RateNumber of Graduates
96.1%198
Enrollment
Stanford Achievement Test Series, Tenth Edition (SAT10)
80
75
75
55
70
71
Math
Social Science
Language Arts
Reading
Complete Battery
Science
Stanford Writing Assessment Program, Third Edition
Grade 5
Grade 9
American College Test (ACT)
Grade 5Total
PRSpEd
PR
Number Tested
English
143
72%
38
35
36
20
30
32
Total PR
Sp Ed PR
80
66
68
64
66
69
42
39
41
36
33
38
79
80
82
63
80
76
30
44
47
24
37
36
77%
Grade 4 Grade 3Total
PRSp Ed
PR
Grade 6Total
PRSp Ed
PR
174 205 18917 24 12
Sp EdTotal
Number Tested
Grade 7Total
PRSp Ed
PR
Grade 8 Total
PRSp Ed
PR
Grade 11Total
PRSp Ed
PR
MathReadingScienceComposite Score
22.522.221.5
23.122.5
80 72
68 65
72 60
66 59
72 53
72 61
166 27
83 49
74 55
78 49
67 40
72 29
75 44
80 42
71 35
67 32
65 36
64 21
70 33
79 37
68 32
66 33
71 34
63 24
67 24
11174 22190 17193
Percent Proficient or Higher
No assessment data are reported when less than ten students were tested.
Ideas and Development
Sp EdTotal
Organization, Unity, and Coherence
Sp EdTotal
Word Choice
Sp EdTotal
Sentences and Paragraphs
Sp EdTotal
Grammer and Usage
Sp EdTotal
Writing Mechanics
Sp EdTotal
NumberTested
59% 49% 58%
73%
49%
66%
56%
69%
45%
74%
171
191
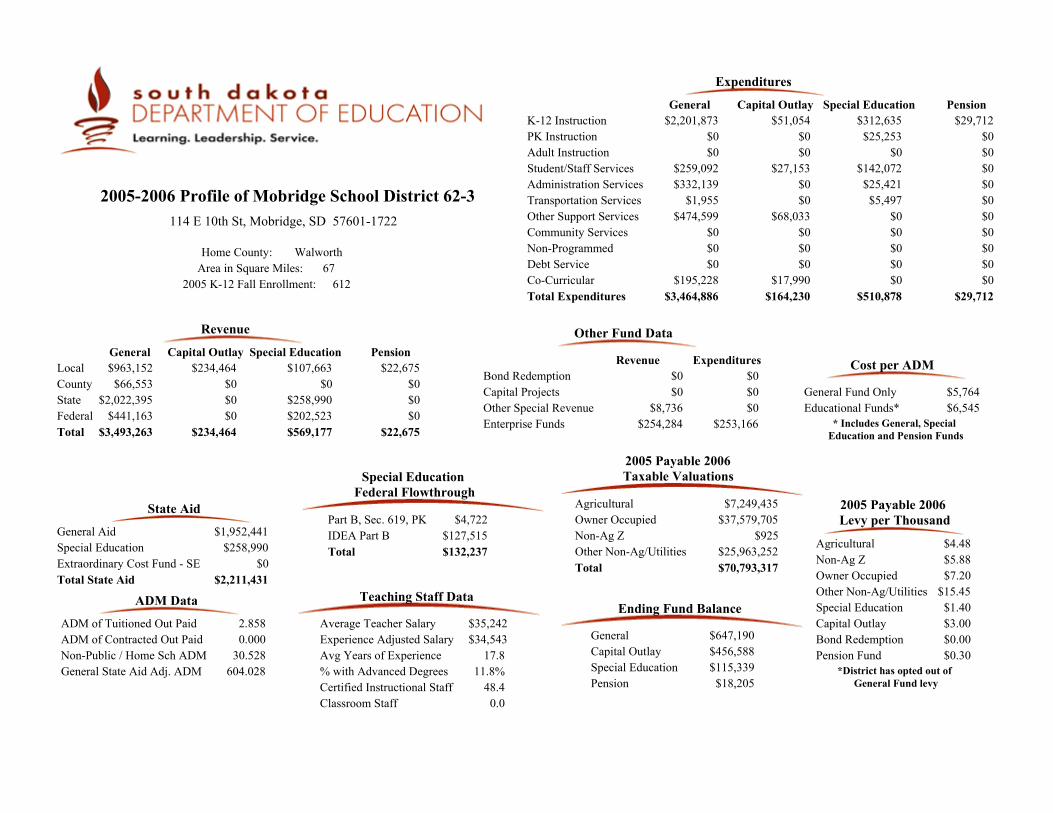
General $647,190Capital Outlay $456,588
Pension $18,205Special Education $115,339
Ending Fund Balance
Bond Redemption $0Capital Projects $0
Other Fund Data
Agricultural $4.48Non-Ag Z $5.88Owner Occupied $7.20Other Non-Ag/Utilities $15.45Special Education $1.40
Bond Redemption $0.00Pension Fund $0.30
Capital Outlay $3.00
2005 Payable 2006 Levy per Thousand
$1,952,441$258,990
$0
General AidSpecial EducationExtraordinary Cost Fund - SE
$2,211,431Total State Aid
State Aid
Special Education Federal Flowthrough
$127,515IDEA Part BPart B, Sec. 619, PK $4,722
$132,237Total
K-12 Instruction $2,201,873PK Instruction $0Adult Instruction $0
$312,635$25,253
$0
General Special Education
Expenditures
Community Services $0Non-Programmed $0Debt Service $0Co-Curricular $195,228
$0$0$0$0
Total Expenditures $3,464,886 $510,878
2005 Payable 2006Taxable Valuations
Agricultural $7,249,435Owner Occupied $37,579,705Non-Ag Z $925Other Non-Ag/Utilities $25,963,252Total $70,793,317
$34,54317.8
11.8%48.4
$35,242Average Teacher SalaryExperience Adjusted SalaryAvg Years of Experience% with Advanced DegreesCertified Instructional Staff
Teaching Staff Data
ADM of Tuitioned Out Paid 2.858
General State Aid Adj. ADM 604.028Non-Public / Home Sch ADM 30.528
ADM Data
Local $963,152County $66,553State $2,022,395Federal $441,163Total $3,493,263
$234,464$0$0$0
$107,663$0
$258,990$202,523
General Capital Outlay Special Education Pension
$234,464 $569,177 $22,675
Revenue
Classroom Staff 0.0
ADM of Contracted Out Paid 0.000
Other Special Revenue $0
114 E 10th St, Mobridge, SD 57601-1722
2005-2006 Profile of Mobridge School District 62-3
Capital Outlay Pension
Student/Staff ServicesAdministration ServicesTransportation ServicesOther Support Services
Enterprise Funds
Cost per ADM
General Fund Only
Revenue Expenditures
* Includes General, Special Education and Pension Funds
Home County: WalworthArea in Square Miles: 67
2005 K-12 Fall Enrollment: 612
$22,675$0$0$0
$0$0
$29,712$0$0
$259,092$332,139
$1,955$474,599
$27,153$0$0
$68,033$0$0$0
$17,990
$142,072$25,421$5,497
$0
$0$0$0$0$0$0$0$0
$5,764Educational Funds* $6,545
$0$0
$8,736$254,284 $253,166
*District has opted out of General Fund levy
$164,230 $29,712
$51,054

December 2005 Federal Child Count
0Deaf-Blind
037
1
DeafSpeech/Language
Autism
10Emotionally Disturbed60
38310
Mental RetardationHearing ImpairedLearning DisabledMultiple DisabilitiesOrthopedic ImpairmentVisually Impaired
10
010
Other Health Impaired
Traumatic Brain InjuryDevelopmental Delay
116Total
0
6
40
00
90
15
0
0
1
0
Home
Early Childhood Setting
PT Early Child and SEEarly Childhood SE Setting
Separate SchoolResidential Facility
Regular Classroom
Resource Room
Self-Contained Classroom
Day Program
24 Hour Program
Home/Hospital Program
Special Education Placement Categories
Total 116
Student to Staff Ratio 12.8
K-8 408.5859-12 161.004
427.640173.459
ADA ADM
Total 569.589 601.099
Student Data
PK-12 Enrollment 617Open Enrolled Students Rec'd 30District Dropout Rate 3.8%
% Special Needs Students 18.8%% Eligible for Free/Red. Lunch 38.5%
Students Transported 0
District Attendance RateNumber of Graduates
94.8%42
Enrollment
Stanford Achievement Test Series, Tenth Edition (SAT10)
61
63
59
47
55
57
Math
Social Science
Language Arts
Reading
Complete Battery
Science
Stanford Writing Assessment Program, Third Edition
Grade 5
Grade 9
American College Test (ACT)
Grade 5Total
PRSpEd
PR
Number Tested
English
29
79%
36
38
39
28
29
34
Total PR
Sp Ed PR
70
60
63
46
60
61
68
71
58
58
75
66
77%
Grade 4 Grade 3Total
PRSp Ed
PR
Grade 6Total
PRSp Ed
PR
44 49 3111
Sp EdTotal
Number Tested
Grade 7Total
PRSp Ed
PR
Grade 8 Total
PRSp Ed
PR
Grade 11Total
PRSp Ed
PR
MathReadingScienceComposite Score
21.221.620.7
22.321.7
73
62
69
61
67
67
48 6
63
60
72
55
59
62
62
58
63
56
57
58
80
62
58
64
61
66
538 54 43
Percent Proficient or Higher
No assessment data are reported when less than ten students were tested.
Ideas and Development
Sp EdTotal
Organization, Unity, and Coherence
Sp EdTotal
Word Choice
Sp EdTotal
Sentences and Paragraphs
Sp EdTotal
Grammer and Usage
Sp EdTotal
Writing Mechanics
Sp EdTotal
NumberTested
58% 37% 63%
62%
69%
44%
61%
59%
45%
67%
38
39

General $621,303Capital Outlay $333,309
Pension $13,064Special Education $8,080
Ending Fund Balance
Bond Redemption $204,010Capital Projects $0
Other Fund Data
Agricultural $3.19Non-Ag Z $4.19Owner Occupied $5.13Other Non-Ag/Utilities $11.00Special Education $1.40
Bond Redemption $2.37Pension Fund $0.30
Capital Outlay $2.70
2005 Payable 2006 Levy per Thousand
$806,911$71,640$24,799
General AidSpecial EducationExtraordinary Cost Fund - SE
$903,350Total State Aid
State Aid
Special Education Federal Flowthrough
$45,271IDEA Part BPart B, Sec. 619, PK $2,549
$47,820Total
K-12 Instruction $843,210PK Instruction $0Adult Instruction $0
$172,540$16,846
$0
General Special Education
Expenditures
Community Services $19,146Non-Programmed $0Debt Service $0Co-Curricular $72,320
$0$0$0$0
Total Expenditures $1,441,800 $271,325
2005 Payable 2006Taxable Valuations
Agricultural $61,682,910Owner Occupied $19,938,401Non-Ag Z $1,364,796Other Non-Ag/Utilities $4,235,223Total $87,221,330
$28,99615.0
4.5%21.0
$29,774Average Teacher SalaryExperience Adjusted SalaryAvg Years of Experience% with Advanced DegreesCertified Instructional Staff
Teaching Staff Data
ADM of Tuitioned Out Paid 0.000
General State Aid Adj. ADM 260.457Non-Public / Home Sch ADM 2.551
ADM Data
Local $453,006County $10,317State $837,438Federal $82,629Total $1,383,390
$247,830$643
$0$38
$119,419$300
$96,439$49,937
General Capital Outlay Special Education Pension
$248,511 $266,095 $13,064
Revenue
Classroom Staff 0.0
ADM of Contracted Out Paid 0.000
Other Special Revenue $23,372
309 S Church Avenue, Montrose, SD 57048-9528
2005-2006 Profile of Montrose School District 43-2
Capital Outlay Pension
Student/Staff ServicesAdministration ServicesTransportation ServicesOther Support Services
Enterprise Funds
Cost per ADM
General Fund Only
Revenue Expenditures
* Includes General, Special Education and Pension Funds
Home County: Mc CookArea in Square Miles: 124
2005 K-12 Fall Enrollment: 224
$13,064$0$0$0
$0$0
$0$0$0
$59,972$172,275
$65,787$209,090
$6,127$0
$11,573$56,056
$0$0
$95,040$3,610
$50,253$26,326
$0$5,360
$0$0$0$0$0$0$0$0
$6,515Educational Funds* $7,561
$209,484$0
$89,827$113,338 $109,612
$217,065 $0
$44,658

December 2005 Federal Child Count
0Deaf-Blind
13
0
DeafSpeech/Language
Autism
0Emotionally Disturbed32
10000
Mental RetardationHearing ImpairedLearning DisabledMultiple DisabilitiesOrthopedic ImpairmentVisually Impaired
6
02
Other Health Impaired
Traumatic Brain InjuryDevelopmental Delay
27Total
0
0
21
00
18
6
0
0
0
0
Home
Early Childhood Setting
PT Early Child and SEEarly Childhood SE Setting
Separate SchoolResidential Facility
Regular Classroom
Resource Room
Self-Contained Classroom
Day Program
24 Hour Program
Home/Hospital Program
Special Education Placement Categories
Total 27
Student to Staff Ratio 10.9
K-8 138.5859-12 72.154
142.52475.835
ADA ADM
Total 210.739 218.359
Student Data
PK-12 Enrollment 228Open Enrolled Students Rec'd 16District Dropout Rate 0.0%
% Special Needs Students 11.8%% Eligible for Free/Red. Lunch 45.1%
Students Transported 45
District Attendance RateNumber of Graduates
96.5%24
Enrollment
Stanford Achievement Test Series, Tenth Edition (SAT10)
85
81
81
81
77
80
Math
Social Science
Language Arts
Reading
Complete Battery
Science
Stanford Writing Assessment Program, Third Edition
Grade 5
Grade 9
American College Test (ACT)
Grade 5Total
PRSpEd
PR
Number Tested
English
21
86%
Total PR
Sp Ed PR
62
59
59
62
64
61
93
94
72
75
91
87
82%
Grade 4 Grade 3Total
PRSp Ed
PR
Grade 6Total
PRSp Ed
PR
12 16 141
Sp EdTotal
Number Tested
Grade 7Total
PRSp Ed
PR
Grade 8 Total
PRSp Ed
PR
Grade 11Total
PRSp Ed
PR
MathReadingScienceComposite Score
21.021.219.8
21.021.0
72
48
68
58
55
61
12
82
79
76
68
67
75
65
63
77
58
57
63
66
61
63
63
59
61
10 218 617
Percent Proficient or Higher
No assessment data are reported when less than ten students were tested.
Ideas and Development
Sp EdTotal
Organization, Unity, and Coherence
Sp EdTotal
Word Choice
Sp EdTotal
Sentences and Paragraphs
Sp EdTotal
Grammer and Usage
Sp EdTotal
Writing Mechanics
Sp EdTotal
NumberTested
90% 80% 80%
82%
60%
77%
60%
77%
80%
73%
10
22

General $671,102Capital Outlay $427,436
Pension $24,457Special Education $100,699
Ending Fund Balance
Bond Redemption $111,213Capital Projects $0
Other Fund Data
Agricultural $4.88Non-Ag Z $6.41Owner Occupied $7.85Other Non-Ag/Utilities $16.83Special Education $1.40
Bond Redemption $1.42Pension Fund $0.30
Capital Outlay $3.00
2005 Payable 2006 Levy per Thousand
$871,263$81,133
$0
General AidSpecial EducationExtraordinary Cost Fund - SE
$952,396Total State Aid
State Aid
Special Education Federal Flowthrough
$37,285IDEA Part BPart B, Sec. 619, PK $1,097
$38,382Total
K-12 Instruction $930,040PK Instruction $13,928Adult Instruction $0
$118,088$16,636
$0
General Special Education
Expenditures
Community Services $6,199Non-Programmed $0Debt Service $0Co-Curricular $63,063
$0$0$0$0
Total Expenditures $1,641,839 $213,838
2005 Payable 2006Taxable Valuations
Agricultural $64,937,667Owner Occupied $13,635,148Non-Ag Z $1,057,760Other Non-Ag/Utilities $4,965,352Total $84,595,927
$30,59217.0
17.9%23.9
$31,017Average Teacher SalaryExperience Adjusted SalaryAvg Years of Experience% with Advanced DegreesCertified Instructional Staff
Teaching Staff Data
ADM of Tuitioned Out Paid 0.000
General State Aid Adj. ADM 269.078Non-Public / Home Sch ADM 0.000
ADM Data
Local $667,770County $24,212State $896,160Federal $120,776Total $1,708,918
$239,366$0$0$0
$112,516$0
$81,133$36,133
General Capital Outlay Special Education Pension
$239,366 $229,781 $24,309
Revenue
Classroom Staff 0.0
ADM of Contracted Out Paid 0.000
Other Special Revenue $0
500 N Main, Mount Vernon, SD 57363
2005-2006 Profile of Mount Vernon School District 17-3
Capital Outlay Pension
Student/Staff ServicesAdministration ServicesTransportation ServicesOther Support Services
Enterprise Funds
Cost per ADM
General Fund Only
Revenue Expenditures
* Includes General, Special Education and Pension Funds
Home County: DavisonArea in Square Miles: 168
2005 K-12 Fall Enrollment: 226
$24,309$0$0$0
$0$0
$0$0$0
$129,451$206,574
$61,085$231,499
$0$0
$9,500$36,920
$0$0
$118,773$354
$78,116$0
$998$0
$0$0$0$0$0$0$0$0
$7,108Educational Funds* $7,972
$119,091$0$0
$84,693 $87,019
*District has opted out of General Fund levy
$185,529 $0
$19,982

December 2005 Federal Child Count
0Deaf-Blind
03
1
DeafSpeech/Language
Autism
2Emotionally Disturbed20
11100
Mental RetardationHearing ImpairedLearning DisabledMultiple DisabilitiesOrthopedic ImpairmentVisually Impaired
2
00
Other Health Impaired
Traumatic Brain InjuryDevelopmental Delay
22Total
0
0
00
00
17
4
1
0
0
0
Home
Early Childhood Setting
PT Early Child and SEEarly Childhood SE Setting
Separate SchoolResidential Facility
Regular Classroom
Resource Room
Self-Contained Classroom
Day Program
24 Hour Program
Home/Hospital Program
Special Education Placement Categories
Total 22
Student to Staff Ratio 9.5
K-8 138.8899-12 82.030
141.58986.554
ADA ADM
Total 220.919 228.143
Student Data
PK-12 Enrollment 226Open Enrolled Students Rec'd 42District Dropout Rate 0.7%
% Special Needs Students 9.7%% Eligible for Free/Red. Lunch 39.6%
Students Transported 70
District Attendance RateNumber of Graduates
96.8%24
Enrollment
Stanford Achievement Test Series, Tenth Edition (SAT10)
78
80
78
51
67
71
Math
Social Science
Language Arts
Reading
Complete Battery
Science
Stanford Writing Assessment Program, Third Edition
Grade 5
Grade 9
American College Test (ACT)
Grade 5Total
PRSpEd
PR
Number Tested
English
21
74%
Total PR
Sp Ed PR
77
72
67
67
65
69
68
77
72
54
76
70
43%
Grade 4 Grade 3Total
PRSp Ed
PR
Grade 6Total
PRSp Ed
PR
17 16 201
Sp EdTotal
Number Tested
Grade 7Total
PRSp Ed
PR
Grade 8 Total
PRSp Ed
PR
Grade 11Total
PRSp Ed
PR
MathReadingScienceComposite Score
20.121.020.1
21.920.9
54
56
69
56
61
59
18 4
72
71
77
65
54
66
71
72
74
74
47
65
87
77
70
77
67
75
214 215 219
Percent Proficient or Higher
No assessment data are reported when less than ten students were tested.
Ideas and Development
Sp EdTotal
Organization, Unity, and Coherence
Sp EdTotal
Word Choice
Sp EdTotal
Sentences and Paragraphs
Sp EdTotal
Grammer and Usage
Sp EdTotal
Writing Mechanics
Sp EdTotal
NumberTested
80% 67% 53%
52%
33%
52%
60%
61%
73%
61%
15
23
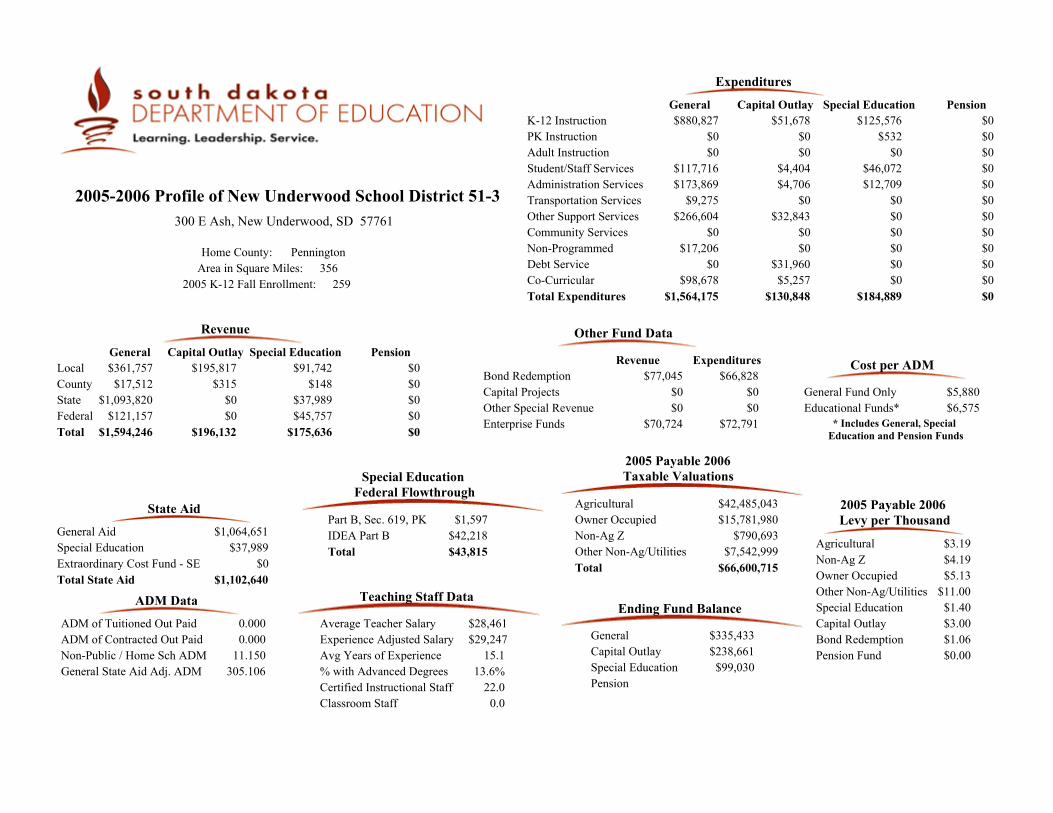
General $335,433Capital Outlay $238,661
PensionSpecial Education $99,030
Ending Fund Balance
Bond Redemption $66,828Capital Projects $0
Other Fund Data
Agricultural $3.19Non-Ag Z $4.19Owner Occupied $5.13Other Non-Ag/Utilities $11.00Special Education $1.40
Bond Redemption $1.06Pension Fund $0.00
Capital Outlay $3.00
2005 Payable 2006 Levy per Thousand
$1,064,651$37,989
$0
General AidSpecial EducationExtraordinary Cost Fund - SE
$1,102,640Total State Aid
State Aid
Special Education Federal Flowthrough
$42,218IDEA Part BPart B, Sec. 619, PK $1,597
$43,815Total
K-12 Instruction $880,827PK Instruction $0Adult Instruction $0
$125,576$532
$0
General Special Education
Expenditures
Community Services $0Non-Programmed $17,206Debt Service $0Co-Curricular $98,678
$0$0$0$0
Total Expenditures $1,564,175 $184,889
2005 Payable 2006Taxable Valuations
Agricultural $42,485,043Owner Occupied $15,781,980Non-Ag Z $790,693Other Non-Ag/Utilities $7,542,999Total $66,600,715
$29,24715.1
13.6%22.0
$28,461Average Teacher SalaryExperience Adjusted SalaryAvg Years of Experience% with Advanced DegreesCertified Instructional Staff
Teaching Staff Data
ADM of Tuitioned Out Paid 0.000
General State Aid Adj. ADM 305.106Non-Public / Home Sch ADM 11.150
ADM Data
Local $361,757County $17,512State $1,093,820Federal $121,157Total $1,594,246
$195,817$315
$0$0
$91,742$148
$37,989$45,757
General Capital Outlay Special Education Pension
$196,132 $175,636 $0
Revenue
Classroom Staff 0.0
ADM of Contracted Out Paid 0.000
Other Special Revenue $0
300 E Ash, New Underwood, SD 57761
2005-2006 Profile of New Underwood School District 51-3
Capital Outlay Pension
Student/Staff ServicesAdministration ServicesTransportation ServicesOther Support Services
Enterprise Funds
Cost per ADM
General Fund Only
Revenue Expenditures
* Includes General, Special Education and Pension Funds
Home County: PenningtonArea in Square Miles: 356
2005 K-12 Fall Enrollment: 259
$0$0$0$0
$0$0
$0$0$0
$117,716$173,869
$9,275$266,604
$4,404$4,706
$0$32,843
$0$0
$31,960$5,257
$46,072$12,709
$0$0
$0$0$0$0$0$0$0$0
$5,880Educational Funds* $6,575
$77,045$0$0
$70,724 $72,791
$130,848 $0
$51,678

December 2005 Federal Child Count
0Deaf-Blind
07
1
DeafSpeech/Language
Autism
1Emotionally Disturbed10
15101
Mental RetardationHearing ImpairedLearning DisabledMultiple DisabilitiesOrthopedic ImpairmentVisually Impaired
0
01
Other Health Impaired
Traumatic Brain InjuryDevelopmental Delay
28Total
0
2
11
00
23
1
0
0
0
0
Home
Early Childhood Setting
PT Early Child and SEEarly Childhood SE Setting
Separate SchoolResidential Facility
Regular Classroom
Resource Room
Self-Contained Classroom
Day Program
24 Hour Program
Home/Hospital Program
Special Education Placement Categories
Total 28
Student to Staff Ratio 11.8
K-8 161.7749-12 90.942
168.83796.633
ADA ADM
Total 252.716 265.470
Student Data
PK-12 Enrollment 259Open Enrolled Students Rec'd 71District Dropout Rate 0.7%
% Special Needs Students 10.8%% Eligible for Free/Red. Lunch 24.4%
Students Transported 0
District Attendance RateNumber of Graduates
95.2%22
Enrollment
Stanford Achievement Test Series, Tenth Edition (SAT10)
70
63
60
38
58
59
Math
Social Science
Language Arts
Reading
Complete Battery
Science
Stanford Writing Assessment Program, Third Edition
Grade 5
Grade 9
American College Test (ACT)
Grade 5Total
PRSpEd
PR
Number Tested
English
16
71%
Total PR
Sp Ed PR
62
51
63
49
55
51
57
63
52
51
72
60
64%
Grade 4 Grade 3Total
PRSp Ed
PR
Grade 6Total
PRSp Ed
PR
18 17 241 3 2
Sp EdTotal
Number Tested
Grade 7Total
PRSp Ed
PR
Grade 8 Total
PRSp Ed
PR
Grade 11Total
PRSp Ed
PR
MathReadingScienceComposite Score
20.419.219.0
19.819.6
68
65
57
51
54
58
26 2
85
67
77
76
63
74
67
57
66
47
56
59
68
49
59
50
53
56
120 13 423
Percent Proficient or Higher
No assessment data are reported when less than ten students were tested.
Ideas and Development
Sp EdTotal
Organization, Unity, and Coherence
Sp EdTotal
Word Choice
Sp EdTotal
Sentences and Paragraphs
Sp EdTotal
Grammer and Usage
Sp EdTotal
Writing Mechanics
Sp EdTotal
NumberTested
70% 55% 75%
50%
60%
54%
60%
75%
35%
75%
20
28

General $508,566Capital Outlay $107,397
Pension $105,654Special Education $65,562
Ending Fund Balance
Bond Redemption $0Capital Projects $0
Other Fund Data
Agricultural $3.19Non-Ag Z $4.19Owner Occupied $5.13Other Non-Ag/Utilities $11.00Special Education $1.40
Bond Redemption $0.00Pension Fund $0.30
Capital Outlay $3.00
2005 Payable 2006 Levy per Thousand
$1,154,367$121,580
$0
General AidSpecial EducationExtraordinary Cost Fund - SE
$1,275,947Total State Aid
State Aid
Special Education Federal Flowthrough
$95,953IDEA Part BPart B, Sec. 619, PK $1,213
$97,166Total
K-12 Instruction $1,374,755PK Instruction $0Adult Instruction $2,450
$322,839$0$0
General Special Education
Expenditures
Community Services $94,847Non-Programmed $0Debt Service $0Co-Curricular $138,975
$0$0$0$0
Total Expenditures $2,490,657 $385,123
2005 Payable 2006Taxable Valuations
Agricultural $107,633,778Owner Occupied $24,560,723Non-Ag Z $625,971Other Non-Ag/Utilities $12,390,662Total $145,211,134
$30,12911.3
3.0%32.0
$27,945Average Teacher SalaryExperience Adjusted SalaryAvg Years of Experience% with Advanced DegreesCertified Instructional Staff
Teaching Staff Data
ADM of Tuitioned Out Paid 2.000
General State Aid Adj. ADM 387.661Non-Public / Home Sch ADM 21.402
ADM Data
Local $734,330County $16,495State $1,218,603Federal $535,506Total $2,504,934
$422,329$0$0$0
$194,788$0
$121,580$96,649
General Capital Outlay Special Education Pension
$422,329 $413,017 $41,257
Revenue
Classroom Staff 2.0
ADM of Contracted Out Paid 0.000
Other Special Revenue $0
501 Dartmouth, Newell, SD 57760
2005-2006 Profile of Newell School District 09-2
Capital Outlay Pension
Student/Staff ServicesAdministration ServicesTransportation ServicesOther Support Services
Enterprise Funds
Cost per ADM
General Fund Only
Revenue Expenditures
* Includes General, Special Education and Pension Funds
Home County: ButteArea in Square Miles: 1,324
2005 K-12 Fall Enrollment: 355
$41,257$0$0$0
$0$0
$0$0$0
$190,924$260,494$128,937$299,275
$0$580
$16,077$142,887
$0$0
$255,712$3,902
$15,659$0
$2,398$44,227
$0$0$0$0$0
$27,568$0$0
$6,793Educational Funds* $7,838
$0$0$0
$130,684 $127,476
$438,204 $27,568
$19,047

December 2005 Federal Child Count
0Deaf-Blind
04
0
DeafSpeech/Language
Autism
3Emotionally Disturbed11
26230
Mental RetardationHearing ImpairedLearning DisabledMultiple DisabilitiesOrthopedic ImpairmentVisually Impaired
4
13
Other Health Impaired
Traumatic Brain InjuryDevelopmental Delay
48Total
0
0
32
01
28
12
1
0
1
0
Home
Early Childhood Setting
PT Early Child and SEEarly Childhood SE Setting
Separate SchoolResidential Facility
Regular Classroom
Resource Room
Self-Contained Classroom
Day Program
24 Hour Program
Home/Hospital Program
Special Education Placement Categories
Total 48
Student to Staff Ratio 10.9
K-8 217.6539-12 120.700
228.467127.876
ADA ADM
Total 338.353 356.343
Student Data
PK-12 Enrollment 371Open Enrolled Students Rec'd 9District Dropout Rate 1.0%
% Special Needs Students 12.9%% Eligible for Free/Red. Lunch 48.0%
Students Transported 184
District Attendance RateNumber of Graduates
95.0%32
Enrollment
Stanford Achievement Test Series, Tenth Edition (SAT10)
57
67
62
34
47
52
Math
Social Science
Language Arts
Reading
Complete Battery
Science
Stanford Writing Assessment Program, Third Edition
Grade 5
Grade 9
American College Test (ACT)
Grade 5Total
PRSpEd
PR
Number Tested
English
26
76%
Total PR
Sp Ed PR
81
66
53
54
65
66
74
78
62
54
76
69
72%
Grade 4 Grade 3Total
PRSp Ed
PR
Grade 6Total
PRSp Ed
PR
19 27 293 3 4
Sp EdTotal
Number Tested
Grade 7Total
PRSp Ed
PR
Grade 8 Total
PRSp Ed
PR
Grade 11Total
PRSp Ed
PR
MathReadingScienceComposite Score
22.622.321.1
22.822.4
71
49
54
42
50
49
21 6
69
72
67
60
68
67
78
68
57
59
48
62
71
64
52
61
50
59
326 133 529
Percent Proficient or Higher
No assessment data are reported when less than ten students were tested.
Ideas and Development
Sp EdTotal
Organization, Unity, and Coherence
Sp EdTotal
Word Choice
Sp EdTotal
Sentences and Paragraphs
Sp EdTotal
Grammer and Usage
Sp EdTotal
Writing Mechanics
Sp EdTotal
NumberTested
42% 42% 50%
79%
31%
72%
46%
72%
38%
76%
26
29

General $264,827Capital Outlay $10,336
PensionSpecial Education $29,758
Ending Fund Balance
Bond Redemption $0Capital Projects $0
Other Fund Data
Agricultural $3.19Non-Ag Z $4.19Owner Occupied $5.13Other Non-Ag/Utilities $11.00Special Education $0.20
Bond Redemption $0.00Pension Fund $0.00
Capital Outlay $0.00
2005 Payable 2006 Levy per Thousand
$26,525$0$0
General AidSpecial EducationExtraordinary Cost Fund - SE
$26,525Total State Aid
State Aid
Special Education Federal Flowthrough
$0IDEA Part BPart B, Sec. 619, PK $0
$0Total
K-12 Instruction $30,893PK Instruction $0Adult Instruction $0
$11,833$0$0
General Special Education
Expenditures
Community Services $0Non-Programmed $0Debt Service $0Co-Curricular $0
$0$0$0$0
Total Expenditures $49,433 $13,649
2005 Payable 2006Taxable Valuations
Agricultural $28,865,719Owner Occupied $1,337,906Non-Ag Z $0Other Non-Ag/Utilities $438,415Total $30,642,040
$00.0
0.0%0.0
$0Average Teacher SalaryExperience Adjusted SalaryAvg Years of Experience% with Advanced DegreesCertified Instructional Staff
Teaching Staff Data
ADM of Tuitioned Out Paid 0.000
General State Aid Adj. ADM 1.200Non-Public / Home Sch ADM 0.000
ADM Data
Local $113,004County $24,398State $30,758Federal $18,972Total $187,133
$0$0$0$0
$30,410$0$0$0
General Capital Outlay Special Education Pension
$0 $30,410 $0
Revenue
Classroom Staff 0.0
ADM of Contracted Out Paid 1.000
Other Special Revenue $0
Duck Creek Rd, Lodgepole, SD 57640
2005-2006 Profile of Northwest School District 52-3
Capital Outlay Pension
Student/Staff ServicesAdministration ServicesTransportation ServicesOther Support Services
Enterprise Funds
Cost per ADM
General Fund Only
Revenue Expenditures
* Includes General, Special Education and Pension Funds
Home County: PerkinsArea in Square Miles: 407
2005 K-12 Fall Enrollment: 0
$0$0$0$0
$0$0
$0$0$0
$0$5,263
$0$13,277
$0$0
$3,600$0$0$0$0$0
$0$0
$1,816$0
$0$0$0$0$0$0$0$0
$0Educational Funds* $0
$0$0$0$0 $0
$3,600 $0
$0

December 2005 Federal Child Count
0Deaf-Blind
00
0
DeafSpeech/Language
Autism
0Emotionally Disturbed000000
Mental RetardationHearing ImpairedLearning DisabledMultiple DisabilitiesOrthopedic ImpairmentVisually Impaired
0
00
Other Health Impaired
Traumatic Brain InjuryDevelopmental Delay
0Total
0
0
00
00
0
0
0
0
0
0
Home
Early Childhood Setting
PT Early Child and SEEarly Childhood SE Setting
Separate SchoolResidential Facility
Regular Classroom
Resource Room
Self-Contained Classroom
Day Program
24 Hour Program
Home/Hospital Program
Special Education Placement Categories
Total 0
Student to Staff Ratio 0.0
K-8 0.0009-12 0.000
0.0000.000
ADA ADM
Total 0.000 0.000
Student Data
PK-12 Enrollment 0Open Enrolled Students Rec'd 0District Dropout Rate 0.0%
% Special Needs Students 0.0%% Eligible for Free/Red. Lunch 0.0%
Students Transported 27
District Attendance RateNumber of Graduates
0.0%0
Enrollment
Stanford Achievement Test Series, Tenth Edition (SAT10)
Math
Social Science
Language Arts
Reading
Complete Battery
Science
Stanford Writing Assessment Program, Third Edition
Grade 5
Grade 9
American College Test (ACT)
Grade 5Total
PRSpEd
PR
Number Tested
English
Total PR
Sp Ed PR
Grade 4 Grade 3Total
PRSp Ed
PR
Grade 6Total
PRSp Ed
PR
Sp EdTotal
Number Tested
Grade 7Total
PRSp Ed
PR
Grade 8 Total
PRSp Ed
PR
Grade 11Total
PRSp Ed
PR
MathReadingScienceComposite Score
Percent Proficient or Higher
No assessment data are reported for contracting districts.
Ideas and Development
Sp EdTotal
Organization, Unity, and Coherence
Sp EdTotal
Word Choice
Sp EdTotal
Sentences and Paragraphs
Sp EdTotal
Grammer and Usage
Sp EdTotal
Writing Mechanics
Sp EdTotal
NumberTested

General $844,152Capital Outlay $39,188
PensionSpecial Education $71,397
Ending Fund Balance
Bond Redemption $0Capital Projects $0
Other Fund Data
Agricultural $3.19Non-Ag Z $4.19Owner Occupied $5.13Other Non-Ag/Utilities $11.00Special Education $1.13
Bond Redemption $0.89Pension Fund $0.30
Capital Outlay $1.38
2005 Payable 2006 Levy per Thousand
$787,704$0$0
General AidSpecial EducationExtraordinary Cost Fund - SE
$787,704Total State Aid
State Aid
Special Education Federal Flowthrough
$62,519IDEA Part BPart B, Sec. 619, PK $1,126
$63,645Total
K-12 Instruction $855,442PK Instruction $0Adult Instruction $0
$87,843$41,180
$0
General Special Education
Expenditures
Community Services $304Non-Programmed $949Debt Service $0Co-Curricular $73,219
$0$0$0$0
Total Expenditures $1,605,090 $190,977
2005 Payable 2006Taxable Valuations
Agricultural $160,416,367Owner Occupied $11,335,127Non-Ag Z $650,236Other Non-Ag/Utilities $9,230,978Total $181,632,708
$33,43712.6
4.2%20.4
$32,308Average Teacher SalaryExperience Adjusted SalaryAvg Years of Experience% with Advanced DegreesCertified Instructional Staff
Teaching Staff Data
ADM of Tuitioned Out Paid 0.000
General State Aid Adj. ADM 318.918Non-Public / Home Sch ADM 0.000
ADM Data
Local $781,949County $12,612State $933,096Federal $112,202Total $1,839,858
$342,921$9$0$0
$156,413$7$0
$68,126
General Capital Outlay Special Education Pension
$342,930 $224,546 $54,640
Revenue
Classroom Staff 0.0
ADM of Contracted Out Paid 0.000
Other Special Revenue $0
221 3rd St, Mellette, SD 57461
2005-2006 Profile of Northwestern Area School District 56-7
Capital Outlay Pension
Student/Staff ServicesAdministration ServicesTransportation ServicesOther Support Services
Enterprise Funds
Cost per ADM
General Fund Only
Revenue Expenditures
* Includes General, Special Education and Pension Funds
Home County: SpinkArea in Square Miles: 581
2005 K-12 Fall Enrollment: 279
$54,637$3$0$0
$0$0
$35,785$0$0
$95,516$184,654$130,532$264,474
$11,343$4,238
$793$102,075
$0$0
$129,895$16,425
$42,614$17,974$1,365
$0
$0$5,800
$0$2,055
$0$11,000
$0$0
$5,664Educational Funds* $6,387
$0$0$0
$138,518 $153,078
$333,706 $54,640
$68,936

December 2005 Federal Child Count
0Deaf-Blind
015
0
DeafSpeech/Language
Autism
3Emotionally Disturbed20
17100
Mental RetardationHearing ImpairedLearning DisabledMultiple DisabilitiesOrthopedic ImpairmentVisually Impaired
2
05
Other Health Impaired
Traumatic Brain InjuryDevelopmental Delay
45Total
0
3
43
00
33
1
0
1
0
0
Home
Early Childhood Setting
PT Early Child and SEEarly Childhood SE Setting
Separate SchoolResidential Facility
Regular Classroom
Resource Room
Self-Contained Classroom
Day Program
24 Hour Program
Home/Hospital Program
Special Education Placement Categories
Total 45
Student to Staff Ratio 14.1
K-8 178.4149-12 91.353
183.42794.339
ADA ADM
Total 269.767 277.766
Student Data
PK-12 Enrollment 288Open Enrolled Students Rec'd 8District Dropout Rate 0.7%
% Special Needs Students 15.6%% Eligible for Free/Red. Lunch 32.2%
Students Transported 280
District Attendance RateNumber of Graduates
97.1%21
Enrollment
Stanford Achievement Test Series, Tenth Edition (SAT10)
79
86
81
65
77
77
Math
Social Science
Language Arts
Reading
Complete Battery
Science
Stanford Writing Assessment Program, Third Edition
Grade 5
Grade 9
American College Test (ACT)
Grade 5Total
PRSpEd
PR
Number Tested
English
62%
Total PR
Sp Ed PR
72
65
61
69
66
66
63
64
58
54
72
62
67%
Grade 4 Grade 3Total
PRSp Ed
PR
Grade 6Total
PRSp Ed
PR
20 30 253 1 3
Sp EdTotal
Number Tested
Grade 7Total
PRSp Ed
PR
Grade 8 Total
PRSp Ed
PR
Grade 11Total
PRSp Ed
PR
MathReadingScienceComposite Score
63
69
62
47
60
60
17 3
64
75
79
67
60
67
77
67
65
72
66
69
75
74
77
73
72
73
20 221 222
Percent Proficient or Higher
No assessment data are reported when less than ten students were tested.
Ideas and Development
Sp EdTotal
Organization, Unity, and Coherence
Sp EdTotal
Word Choice
Sp EdTotal
Sentences and Paragraphs
Sp EdTotal
Grammer and Usage
Sp EdTotal
Writing Mechanics
Sp EdTotal
NumberTested
53% 42% 58%
52%
38%
62%
53%
62%
47%
76%
19
21

General ($9,129)Capital Outlay $88,788
PensionSpecial Education ($6,629)
Ending Fund Balance
Bond Redemption $0Capital Projects $0
Other Fund Data
Agricultural $3.19Non-Ag Z $4.19Owner Occupied $5.13Other Non-Ag/Utilities $11.00Special Education $1.40
Bond Redemption $0.00Pension Fund $0.00
Capital Outlay $3.00
2005 Payable 2006 Levy per Thousand
$255,994$0$0
General AidSpecial EducationExtraordinary Cost Fund - SE
$255,994Total State Aid
State Aid
Special Education Federal Flowthrough
$17,228IDEA Part BPart B, Sec. 619, PK $0
$17,228Total
K-12 Instruction $694,395PK Instruction $0Adult Instruction $0
$52,223$0$0
General Special Education
Expenditures
Community Services $0Non-Programmed $0Debt Service $0Co-Curricular $37,804
$0$0$0$0
Total Expenditures $1,322,789 $77,647
2005 Payable 2006Taxable Valuations
Agricultural $24,556,365Owner Occupied $3,350,395Non-Ag Z $1,997,735Other Non-Ag/Utilities $1,756,353Total $31,660,848
$37,6776.8
25.0%11.9
$32,788Average Teacher SalaryExperience Adjusted SalaryAvg Years of Experience% with Advanced DegreesCertified Instructional Staff
Teaching Staff Data
ADM of Tuitioned Out Paid 0.000
General State Aid Adj. ADM 95.755Non-Public / Home Sch ADM 0.000
ADM Data
Local $372,996County $3,359State $260,157Federal $124,583Total $761,095
$103,371$0$0
$5,096
$46,517$0$0
$22,491
General Capital Outlay Special Education Pension
$108,467 $69,009 $0
Revenue
Classroom Staff 2.0
ADM of Contracted Out Paid 0.000
Other Special Revenue $0
625 Walnut, Oelrichs, SD 57763
2005-2006 Profile of Oelrichs School District 23-3
Capital Outlay Pension
Student/Staff ServicesAdministration ServicesTransportation ServicesOther Support Services
Enterprise Funds
Cost per ADM
General Fund Only
Revenue Expenditures
* Includes General, Special Education and Pension Funds
Home County: Fall RiverArea in Square Miles: 564
2005 K-12 Fall Enrollment: 104
$0$0$0$0
$0$0
$0$0$0
$43,637$287,140
$44,284$215,529
$0$0$0
$47,285$0$0$0$0
$22,424$3,000
$0$0
$0$0$0$0$0$0$0$0
$12,872Educational Funds* $13,628
$0$0
$469,610$43,373 $65,908
$91,369 $0
$44,084

December 2005 Federal Child Count
0Deaf-Blind
02
0
DeafSpeech/Language
Autism
0Emotionally Disturbed009000
Mental RetardationHearing ImpairedLearning DisabledMultiple DisabilitiesOrthopedic ImpairmentVisually Impaired
1
00
Other Health Impaired
Traumatic Brain InjuryDevelopmental Delay
12Total
0
0
00
00
12
0
0
0
0
0
Home
Early Childhood Setting
PT Early Child and SEEarly Childhood SE Setting
Separate SchoolResidential Facility
Regular Classroom
Resource Room
Self-Contained Classroom
Day Program
24 Hour Program
Home/Hospital Program
Special Education Placement Categories
Total 12
Student to Staff Ratio 7.5
K-8 65.8799-12 28.013
71.25930.503
ADA ADM
Total 93.892 101.762
Student Data
PK-12 Enrollment 104Open Enrolled Students Rec'd 57District Dropout Rate 1.4%
% Special Needs Students 11.5%% Eligible for Free/Red. Lunch 68.3%
Students Transported 80
District Attendance RateNumber of Graduates
92.3%6
Enrollment
Stanford Achievement Test Series, Tenth Edition (SAT10)
37
22
27
12
18
24
Math
Social Science
Language Arts
Reading
Complete Battery
Science
Stanford Writing Assessment Program, Third Edition
Grade 5
Grade 9
American College Test (ACT)
Grade 5Total
PRSpEd
PR
Number Tested
English
1
25%
Total PR
Sp Ed PR
34
18
26
27
23
27
51
53
28
29
48
41
13%
Grade 4 Grade 3Total
PRSp Ed
PR
Grade 6Total
PRSp Ed
PR
7 8 64 2
Sp EdTotal
Number Tested
Grade 7Total
PRSp Ed
PR
Grade 8 Total
PRSp Ed
PR
Grade 11Total
PRSp Ed
PR
MathReadingScienceComposite Score
62
46
31
33
37
44
9 1
61
59
43
39
40
49
76
44
46
41
31
50
45
21
27
32
22
31
19 210 9
Percent Proficient or Higher
No assessment data are reported when less than ten students were tested.
Ideas and Development
Sp EdTotal
Organization, Unity, and Coherence
Sp EdTotal
Word Choice
Sp EdTotal
Sentences and Paragraphs
Sp EdTotal
Grammer and Usage
Sp EdTotal
Writing Mechanics
Sp EdTotal
NumberTested
18% 0% 27%
13%
0%
25%
18%
13%
18%
50%
11
8

General $620,493Capital Outlay $280,107
Pension $115,765Special Education $21,802
Ending Fund Balance
Bond Redemption $0Capital Projects $0
Other Fund Data
Agricultural $4.82Non-Ag Z $6.33Owner Occupied $7.75Other Non-Ag/Utilities $16.62Special Education $1.40
Bond Redemption $0.00Pension Fund $0.30
Capital Outlay $1.07
2005 Payable 2006 Levy per Thousand
$306,562$0$0
General AidSpecial EducationExtraordinary Cost Fund - SE
$306,562Total State Aid
State Aid
Special Education Federal Flowthrough
$30,681IDEA Part BPart B, Sec. 619, PK $2,014
$32,695Total
K-12 Instruction $695,998PK Instruction $0Adult Instruction $0
$108,233$0$0
General Special Education
Expenditures
Community Services $0Non-Programmed $0Debt Service $0Co-Curricular $23,998
$0$0$0$0
Total Expenditures $1,052,465 $153,731
2005 Payable 2006Taxable Valuations
Agricultural $89,857,156Owner Occupied $9,064,461Non-Ag Z $743,284Other Non-Ag/Utilities $5,234,557Total $104,899,458
$28,41014.3
0.0%20.6
$28,241Average Teacher SalaryExperience Adjusted SalaryAvg Years of Experience% with Advanced DegreesCertified Instructional Staff
Teaching Staff Data
ADM of Tuitioned Out Paid 0.000
General State Aid Adj. ADM 152.299Non-Public / Home Sch ADM 0.000
ADM Data
Local $660,663County $13,442State $331,053Federal $69,260Total $1,074,418
$110,755$0$0$0
$139,962$0$0
$37,331
General Capital Outlay Special Education Pension
$110,755 $177,293 $29,966
Revenue
Classroom Staff 0.0
ADM of Contracted Out Paid 0.000
Other Special Revenue $0
220 W 2nd St, Ramona, SD 57054
2005-2006 Profile of Oldham - Ramona School District 39-5
Capital Outlay Pension
Student/Staff ServicesAdministration ServicesTransportation ServicesOther Support Services
Enterprise Funds
Cost per ADM
General Fund Only
Revenue Expenditures
* Includes General, Special Education and Pension Funds
Home County: LakeArea in Square Miles: 192
2005 K-12 Fall Enrollment: 126
$29,966$0$0$0
$0$0
$0$0$0
$18,529$109,543
$52,798$151,600
$0$0
$25,169$29,294
$0$0$0$0
$38,104$7,393
$0$0
$0$0$0$0$0$0$0$0
$8,278Educational Funds* $9,489
$0$0$0
$92,458 $89,205
*District has opted out of General Fund levy
$71,896 $0
$17,433

December 2005 Federal Child Count
0Deaf-Blind
04
0
DeafSpeech/Language
Autism
0Emotionally Disturbed10
10200
Mental RetardationHearing ImpairedLearning DisabledMultiple DisabilitiesOrthopedic ImpairmentVisually Impaired
4
00
Other Health Impaired
Traumatic Brain InjuryDevelopmental Delay
21Total
0
0
00
00
17
3
1
0
0
0
Home
Early Childhood Setting
PT Early Child and SEEarly Childhood SE Setting
Separate SchoolResidential Facility
Regular Classroom
Resource Room
Self-Contained Classroom
Day Program
24 Hour Program
Home/Hospital Program
Special Education Placement Categories
Total 21
Student to Staff Ratio 6.3
K-8 80.7039-12 42.252
82.98743.824
ADA ADM
Total 122.955 126.811
Student Data
PK-12 Enrollment 130Open Enrolled Students Rec'd 1District Dropout Rate 1.3%
% Special Needs Students 16.2%% Eligible for Free/Red. Lunch 61.1%
Students Transported 69
District Attendance RateNumber of Graduates
97.0%12
Enrollment
Stanford Achievement Test Series, Tenth Edition (SAT10)
81
64
73
47
59
65
Math
Social Science
Language Arts
Reading
Complete Battery
Science
Stanford Writing Assessment Program, Third Edition
Grade 5
Grade 9
American College Test (ACT)
Grade 5Total
PRSpEd
PR
Number Tested
English
9
40%
Total PR
Sp Ed PR
62
55
67
60
61
60
66
76
62
62
75
69
60%
Grade 4 Grade 3Total
PRSp Ed
PR
Grade 6Total
PRSp Ed
PR
12 14 112 1
Sp EdTotal
Number Tested
Grade 7Total
PRSp Ed
PR
Grade 8 Total
PRSp Ed
PR
Grade 11Total
PRSp Ed
PR
MathReadingScienceComposite Score
70
60
72
57
55
61
8 2
78
67
76
60
68
70
80
49
82
67
72
72
65
59
50
61
45
55
7 16 111
Percent Proficient or Higher
No assessment data are reported when less than ten students were tested.
Ideas and Development
Sp EdTotal
Organization, Unity, and Coherence
Sp EdTotal
Word Choice
Sp EdTotal
Sentences and Paragraphs
Sp EdTotal
Grammer and Usage
Sp EdTotal
Writing Mechanics
Sp EdTotal
NumberTested
57% 71% 43%
50%
29%
10%
57%
40%
57%
20%
7
10

General $539,871Capital Outlay $435,344
Pension $95,704Special Education ($12,188)
Ending Fund Balance
Bond Redemption $0Capital Projects $0
Other Fund Data
Agricultural $3.19Non-Ag Z $4.19Owner Occupied $5.13Other Non-Ag/Utilities $11.00Special Education $1.40
Bond Redemption $0.00Pension Fund $0.30
Capital Outlay $3.00
2005 Payable 2006 Levy per Thousand
$1,297,392$45,105
$0
General AidSpecial EducationExtraordinary Cost Fund - SE
$1,342,497Total State Aid
State Aid
Special Education Federal Flowthrough
$82,707IDEA Part BPart B, Sec. 619, PK $5,064
$87,771Total
K-12 Instruction $1,229,677PK Instruction $0Adult Instruction $0
$192,516$34,272
$0
General Special Education
Expenditures
Community Services $0Non-Programmed $12,328Debt Service $0Co-Curricular $124,035
$0$0$0$0
Total Expenditures $2,233,819 $337,047
2005 Payable 2006Taxable Valuations
Agricultural $71,979,357Owner Occupied $44,155,833Non-Ag Z $1,447,897Other Non-Ag/Utilities $11,953,636Total $129,536,723
$29,56313.8
6.3%30.9
$30,425Average Teacher SalaryExperience Adjusted SalaryAvg Years of Experience% with Advanced DegreesCertified Instructional Staff
Teaching Staff Data
ADM of Tuitioned Out Paid 4.960
General State Aid Adj. ADM 437.423Non-Public / Home Sch ADM 4.103
ADM Data
Local $755,408County $12,446State $1,354,533Federal $111,023Total $2,233,411
$392,307$0$0$0
$173,553$0
$45,105$92,657
General Capital Outlay Special Education Pension
$392,307 $311,315 $37,202
Revenue
Classroom Staff 0.0
ADM of Contracted Out Paid 0.000
Other Special Revenue $0
330 W 2nd, Parker, SD 57053-0517
2005-2006 Profile of Parker School District 60-4
Capital Outlay Pension
Student/Staff ServicesAdministration ServicesTransportation ServicesOther Support Services
Enterprise Funds
Cost per ADM
General Fund Only
Revenue Expenditures
* Includes General, Special Education and Pension Funds
Home County: TurnerArea in Square Miles: 138
2005 K-12 Fall Enrollment: 402
$37,202$0$0$0
$0$0
$0$0$0
$152,178$206,007$131,213$378,380
$6,612$0$0
$93,869$0$0
$125,847$10,159
$89,232$12,319$8,708
$0
$0$0$0
$14,279$0$0$0$0
$5,517Educational Funds* $6,198
$0$0$0
$321,734 $303,853
$353,500 $14,279
$117,013

December 2005 Federal Child Count
0Deaf-Blind
020
0
DeafSpeech/Language
Autism
3Emotionally Disturbed10
27000
Mental RetardationHearing ImpairedLearning DisabledMultiple DisabilitiesOrthopedic ImpairmentVisually Impaired
8
00
Other Health Impaired
Traumatic Brain InjuryDevelopmental Delay
59Total
0
0
09
00
27
17
0
6
0
0
Home
Early Childhood Setting
PT Early Child and SEEarly Childhood SE Setting
Separate SchoolResidential Facility
Regular Classroom
Resource Room
Self-Contained Classroom
Day Program
24 Hour Program
Home/Hospital Program
Special Education Placement Categories
Total 59
Student to Staff Ratio 13.3
K-8 252.3019-12 136.493
261.186143.744
ADA ADM
Total 388.794 404.930
Student Data
PK-12 Enrollment 409Open Enrolled Students Rec'd 48District Dropout Rate 0.9%
% Special Needs Students 14.4%% Eligible for Free/Red. Lunch 14.9%
Students Transported 258
District Attendance RateNumber of Graduates
96.0%37
Enrollment
Stanford Achievement Test Series, Tenth Edition (SAT10)
77
75
80
65
77
75
Math
Social Science
Language Arts
Reading
Complete Battery
Science
Stanford Writing Assessment Program, Third Edition
Grade 5
Grade 9
American College Test (ACT)
Grade 5Total
PRSpEd
PR
Number Tested
English
32
63%
Total PR
Sp Ed PR
80
73
64
60
68
68
84
79
63
63
82
74
86%
Grade 4 Grade 3Total
PRSp Ed
PR
Grade 6Total
PRSp Ed
PR
33 31 315 5 2
Sp EdTotal
Number Tested
Grade 7Total
PRSp Ed
PR
Grade 8 Total
PRSp Ed
PR
Grade 11Total
PRSp Ed
PR
MathReadingScienceComposite Score
21.222.320.6
21.821.6
87
77
73
78
84
80
30 2
79
82
84
75
75
77
87
84
79
79
78
81
84
82
84
85
80
81
228 327 435
Percent Proficient or Higher
No assessment data are reported when less than ten students were tested.
Ideas and Development
Sp EdTotal
Organization, Unity, and Coherence
Sp EdTotal
Word Choice
Sp EdTotal
Sentences and Paragraphs
Sp EdTotal
Grammer and Usage
Sp EdTotal
Writing Mechanics
Sp EdTotal
NumberTested
52% 69% 48%
74%
56%
57%
45%
71%
48%
71%
29
35

General $985,193Capital Outlay $280,901
Pension $51,112Special Education $120,706
Ending Fund Balance
Bond Redemption $282,273Capital Projects $0
Other Fund Data
Agricultural $3.19Non-Ag Z $4.19Owner Occupied $5.13Other Non-Ag/Utilities $11.00Special Education $1.40
Bond Redemption $1.34Pension Fund $0.30
Capital Outlay $2.05
2005 Payable 2006 Levy per Thousand
$1,923,095$148,006
$0
General AidSpecial EducationExtraordinary Cost Fund - SE
$2,071,101Total State Aid
State Aid
Special Education Federal Flowthrough
$107,301IDEA Part BPart B, Sec. 619, PK $7,627
$114,928Total
K-12 Instruction $2,143,101PK Instruction $0Adult Instruction $3,212
$355,260$47,589
$0
General Special Education
Expenditures
Community Services $0Non-Programmed $0Debt Service $0Co-Curricular $185,506
$0$0$0$0
Total Expenditures $3,433,581 $584,911
2005 Payable 2006Taxable Valuations
Agricultural $153,445,904Owner Occupied $40,239,500Non-Ag Z $353,057Other Non-Ag/Utilities $15,134,874Total $209,173,335
$30,12717.7
18.0%49.8
$33,128Average Teacher SalaryExperience Adjusted SalaryAvg Years of Experience% with Advanced DegreesCertified Instructional Staff
Teaching Staff Data
ADM of Tuitioned Out Paid 1.000
General State Aid Adj. ADM 646.332Non-Public / Home Sch ADM 1.000
ADM Data
Local $1,113,545County $23,589State $2,073,175Federal $356,718Total $3,567,027
$367,650$0$0$0
$283,215$0
$194,396$107,670
General Capital Outlay Special Education Pension
$367,650 $585,281 $60,806
Revenue
Classroom Staff 0.0
ADM of Contracted Out Paid 0.000
Other Special Revenue $0
102C S Chapman Drive, Parkston, SD 57366
2005-2006 Profile of Parkston School District 33-3
Capital Outlay Pension
Student/Staff ServicesAdministration ServicesTransportation ServicesOther Support Services
Enterprise Funds
Cost per ADM
General Fund Only
Revenue Expenditures
* Includes General, Special Education and Pension Funds
Home County: HutchinsonArea in Square Miles: 307
2005 K-12 Fall Enrollment: 639
$60,806$0$0$0
$0$0
$0$0$0
$209,352$343,011$141,297$408,102
$1,259$4,275
$36,688$52,202
$0$0
$55,395$6,792
$135,744$29,295$3,239
$13,785
$0$0$0$0$0
$36,157$0$0
$5,303Educational Funds* $6,156
$335,770$0$0
$245,641 $272,261
$280,702 $36,157
$124,092

December 2005 Federal Child Count
0Deaf-Blind
221
2
DeafSpeech/Language
Autism
3Emotionally Disturbed42
17510
Mental RetardationHearing ImpairedLearning DisabledMultiple DisabilitiesOrthopedic ImpairmentVisually Impaired
7
03
Other Health Impaired
Traumatic Brain InjuryDevelopmental Delay
67Total
0
0
52
00
39
10
8
3
0
0
Home
Early Childhood Setting
PT Early Child and SEEarly Childhood SE Setting
Separate SchoolResidential Facility
Regular Classroom
Resource Room
Self-Contained Classroom
Day Program
24 Hour Program
Home/Hospital Program
Special Education Placement Categories
Total 67
Student to Staff Ratio 13.4
K-8 433.6689-12 192.636
443.506202.352
ADA ADM
Total 626.304 645.858
Student Data
PK-12 Enrollment 668Open Enrolled Students Rec'd 9District Dropout Rate 0.7%
% Special Needs Students 10.0%% Eligible for Free/Red. Lunch 14.7%
Students Transported 360
District Attendance RateNumber of Graduates
97.0%41
Enrollment
Stanford Achievement Test Series, Tenth Edition (SAT10)
78
75
77
54
58
67
Math
Social Science
Language Arts
Reading
Complete Battery
Science
Stanford Writing Assessment Program, Third Edition
Grade 5
Grade 9
American College Test (ACT)
Grade 5Total
PRSpEd
PR
Number Tested
English
37
63%
Total PR
Sp Ed PR
3
67
69
63
66
66
2
71
62
52
72
64
76%
Grade 4 Grade 3Total
PRSp Ed
PR
Grade 6Total
PRSp Ed
PR
46 48 472 2 6
Sp EdTotal
Number Tested
Grade 7Total
PRSp Ed
PR
Grade 8 Total
PRSp Ed
PR
Grade 11Total
PRSp Ed
PR
MathReadingScienceComposite Score
21.421.520.5
21.421.4
83
78
85
61
55
68
44 7
87
83
89
77
72
81
86
72
73
67
67
74
81
71
71
71
67
71
440 346 560
Percent Proficient or Higher
No assessment data are reported when less than ten students were tested.
Ideas and Development
Sp EdTotal
Organization, Unity, and Coherence
Sp EdTotal
Word Choice
Sp EdTotal
Sentences and Paragraphs
Sp EdTotal
Grammer and Usage
Sp EdTotal
Writing Mechanics
Sp EdTotal
NumberTested
70% 70% 72%
69%
60%
65%
67%
74%
58%
74%
43
54

General $1,750,633Capital Outlay $939,749
Pension ($852)Special Education $143,968
Ending Fund Balance
Bond Redemption $988,569Capital Projects $0
Other Fund Data
Agricultural $3.19Non-Ag Z $4.19Owner Occupied $5.13Other Non-Ag/Utilities $11.00Special Education $1.40
Bond Redemption $1.42Pension Fund $0.30
Capital Outlay $3.00
2005 Payable 2006 Levy per Thousand
$6,186,984$657,844
$0
General AidSpecial EducationExtraordinary Cost Fund - SE
$6,844,828Total State Aid
State Aid
Special Education Federal Flowthrough
$504,037IDEA Part BPart B, Sec. 619, PK $21,815
$525,852Total
K-12 Instruction $7,961,841PK Instruction $0Adult Instruction $0
$1,350,590$142,679
$0
General Special Education
Expenditures
Community Services $0Non-Programmed $240,895Debt Service $0Co-Curricular $539,462
$0$0$0$0
Total Expenditures $13,519,470 $2,322,305
2005 Payable 2006Taxable Valuations
Agricultural $65,961,276Owner Occupied $429,317,481Non-Ag Z $4,418,899Other Non-Ag/Utilities $219,841,356Total $719,539,012
$36,44316.1
19.0%161.2
$37,422Average Teacher SalaryExperience Adjusted SalaryAvg Years of Experience% with Advanced DegreesCertified Instructional Staff
Teaching Staff Data
ADM of Tuitioned Out Paid 18.049
General State Aid Adj. ADM 2,561.024Non-Public / Home Sch ADM 209.952
ADM Data
Local $5,156,671County $197,633State $6,639,625Federal $1,348,654Total $13,342,583
$2,328,018$0$0$0
$973,980$0
$657,844$528,304
General Capital Outlay Special Education Pension
$2,328,018 $2,160,127 $209,669
Revenue
Classroom Staff 0.0
ADM of Contracted Out Paid 0.000
Other Special Revenue $0
211 S Poplar Ave, Pierre, SD 57501
2005-2006 Profile of Pierre School District 32-2
Capital Outlay Pension
Student/Staff ServicesAdministration ServicesTransportation ServicesOther Support Services
Enterprise Funds
Cost per ADM
General Fund Only
Revenue Expenditures
* Includes General, Special Education and Pension Funds
Home County: HughesArea in Square Miles: 355
2005 K-12 Fall Enrollment: 2,560
$209,669$0$0$0
$0$0
$167,697$0$0
$1,351,589$1,152,353
$70,040$2,203,289
$24,999$53,070$45,629
$709,848$0$0
$587,239$6,676
$580,153$140,291$108,591
$0
$0$38,321
$0$0$0$0$0$0
$5,307Educational Funds* $6,152
$975,538$0
$39,590$964,212 $976,376
$1,967,838 $206,018
$540,378

December 2005 Federal Child Count
0Deaf-Blind
082
8
DeafSpeech/Language
Autism
5Emotionally Disturbed20
0131
520
Mental RetardationHearing ImpairedLearning DisabledMultiple DisabilitiesOrthopedic ImpairmentVisually Impaired
11
031
Other Health Impaired
Traumatic Brain InjuryDevelopmental Delay
295Total
0
12
330
00
190
45
9
1
4
1
Home
Early Childhood Setting
PT Early Child and SEEarly Childhood SE Setting
Separate SchoolResidential Facility
Regular Classroom
Resource Room
Self-Contained Classroom
Day Program
24 Hour Program
Home/Hospital Program
Special Education Placement Categories
Total 295
Student to Staff Ratio 15.9
K-8 1,651.3559-12 762.146
1,724.703820.001
ADA ADM
Total 2,413.501 2,544.704
Student Data
PK-12 Enrollment 2,566Open Enrolled Students Rec'd 43District Dropout Rate 1.6%
% Special Needs Students 11.5%% Eligible for Free/Red. Lunch 26.3%
Students Transported 140
District Attendance RateNumber of Graduates
94.8%187
Enrollment
Stanford Achievement Test Series, Tenth Edition (SAT10)
75
74
74
51
67
67
Math
Social Science
Language Arts
Reading
Complete Battery
Science
Stanford Writing Assessment Program, Third Edition
Grade 5
Grade 9
American College Test (ACT)
Grade 5Total
PRSpEd
PR
Number Tested
English
153
58%
47
51
51
27
33
40
Total PR
Sp Ed PR
70
69
67
63
67
66
26
38
34
24
26
29
79
77
68
56
79
72
61%
Grade 4 Grade 3Total
PRSp Ed
PR
Grade 6Total
PRSp Ed
PR
178 214 17921 14 4
Sp EdTotal
Number Tested
Grade 7Total
PRSp Ed
PR
Grade 8 Total
PRSp Ed
PR
Grade 11Total
PRSp Ed
PR
MathReadingScienceComposite Score
23.022.821.3
22.922.6
70 54
65 56
66 58
57 39
65 44
64 49
165 22
78 63
73 64
75 58
65 42
69 53
72 56
79 54
70 42
78 58
66 46
68 38
72 47
81 33
73 37
78 50
73 36
66 25
73 35
16168 23180 17240
Percent Proficient or Higher
No assessment data are reported when less than ten students were tested.
Ideas and Development
Sp EdTotal
Organization, Unity, and Coherence
Sp EdTotal
Word Choice
Sp EdTotal
Sentences and Paragraphs
Sp EdTotal
Grammer and Usage
Sp EdTotal
Writing Mechanics
Sp EdTotal
NumberTested
67% 57% 70%
67%
38%
61%
56%
68%
45%
73%
165
228

General $580,491Capital Outlay $346,863
Pension $99Special Education $108,358
Ending Fund Balance
Bond Redemption $168,840Capital Projects $0
Other Fund Data
Agricultural $4.30Non-Ag Z $5.65Owner Occupied $6.92Other Non-Ag/Utilities $14.83Special Education $1.40
Bond Redemption $1.30Pension Fund $0.30
Capital Outlay $0.38
2005 Payable 2006 Levy per Thousand
$540,022$0$0
General AidSpecial EducationExtraordinary Cost Fund - SE
$540,022Total State Aid
State Aid
Special Education Federal Flowthrough
$35,953IDEA Part BPart B, Sec. 619, PK $2,044
$37,997Total
K-12 Instruction $768,279PK Instruction $13,901Adult Instruction $0
$162,511$1,840
$0
General Special Education
Expenditures
Community Services $19,212Non-Programmed $0Debt Service $0Co-Curricular $52,108
$0$0$0$0
Total Expenditures $1,416,871 $228,313
2005 Payable 2006Taxable Valuations
Agricultural $108,418,045Owner Occupied $12,235,586Non-Ag Z $2,000,516Other Non-Ag/Utilities $8,072,509Total $130,726,656
$31,73814.9
0.0%18.7
$30,835Average Teacher SalaryExperience Adjusted SalaryAvg Years of Experience% with Advanced DegreesCertified Instructional Staff
Teaching Staff Data
ADM of Tuitioned Out Paid 0.000
General State Aid Adj. ADM 242.301Non-Public / Home Sch ADM 0.000
ADM Data
Local $764,679County $15,721State $569,225Federal $110,866Total $1,460,491
$77,239$0$0$0
$173,835$0$0
$35,789
General Capital Outlay Special Education Pension
$77,239 $209,624 $36,278
Revenue
Classroom Staff 0.0
ADM of Contracted Out Paid 0.000
Other Special Revenue $0
404 E. Davenport, Plankinton, SD 57368
2005-2006 Profile of Plankinton School District 01-1
Capital Outlay Pension
Student/Staff ServicesAdministration ServicesTransportation ServicesOther Support Services
Enterprise Funds
Cost per ADM
General Fund Only
Revenue Expenditures
* Includes General, Special Education and Pension Funds
Home County: AuroraArea in Square Miles: 277
2005 K-12 Fall Enrollment: 205
$36,278$0$0$0
$0$0
$29,950$600
$0$97,136
$189,963$69,651
$206,621
$7,487$0$0
$31,874$0$0$0
$11,975
$63,963$0$0$0
$2,300$3,350
$0$0$0$0$0$0
$6,882Educational Funds* $8,118
$171,991$0$0
$81,150 $90,973
*District has opted out of General Fund levy
$58,201 $36,200
$6,865

December 2005 Federal Child Count
0Deaf-Blind
07
1
DeafSpeech/Language
Autism
2Emotionally Disturbed00
17100
Mental RetardationHearing ImpairedLearning DisabledMultiple DisabilitiesOrthopedic ImpairmentVisually Impaired
5
10
Other Health Impaired
Traumatic Brain InjuryDevelopmental Delay
34Total
0
6
00
00
21
6
0
0
1
0
Home
Early Childhood Setting
PT Early Child and SEEarly Childhood SE Setting
Separate SchoolResidential Facility
Regular Classroom
Resource Room
Self-Contained Classroom
Day Program
24 Hour Program
Home/Hospital Program
Special Education Placement Categories
Total 34
Student to Staff Ratio 12.1
K-8 129.3959-12 65.087
133.18167.874
ADA ADM
Total 194.482 201.055
Student Data
PK-12 Enrollment 225Open Enrolled Students Rec'd 8District Dropout Rate 0.0%
% Special Needs Students 15.1%% Eligible for Free/Red. Lunch 38.0%
Students Transported 72
District Attendance RateNumber of Graduates
96.7%14
Enrollment
Stanford Achievement Test Series, Tenth Edition (SAT10)
95
83
86
68
88
87
Math
Social Science
Language Arts
Reading
Complete Battery
Science
Stanford Writing Assessment Program, Third Edition
Grade 5
Grade 9
American College Test (ACT)
Grade 5Total
PRSpEd
PR
Number Tested
English
9
70%
Total PR
Sp Ed PR
69
58
58
47
67
62
52
67
51
45
54
52
70%
Grade 4 Grade 3Total
PRSp Ed
PR
Grade 6Total
PRSp Ed
PR
10 11 143 3
Sp EdTotal
Number Tested
Grade 7Total
PRSp Ed
PR
Grade 8 Total
PRSp Ed
PR
Grade 11Total
PRSp Ed
PR
MathReadingScienceComposite Score
93
90
75
89
91
88
16 4
87
85
79
64
73
78
67
61
68
56
59
62
85
75
80
82
70
77
117 315 112
Percent Proficient or Higher
No assessment data are reported when less than ten students were tested.
Ideas and Development
Sp EdTotal
Organization, Unity, and Coherence
Sp EdTotal
Word Choice
Sp EdTotal
Sentences and Paragraphs
Sp EdTotal
Grammer and Usage
Sp EdTotal
Writing Mechanics
Sp EdTotal
NumberTested
63% 69% 81%
65%
69%
55%
69%
50%
63%
50%
16
20

General $808,692Capital Outlay $607,071
Pension $44,562Special Education $176,186
Ending Fund Balance
Bond Redemption $0Capital Projects $0
Other Fund Data
Agricultural $3.19Non-Ag Z $4.19Owner Occupied $5.13Other Non-Ag/Utilities $11.00Special Education $1.40
Bond Redemption $0.00Pension Fund $0.30
Capital Outlay $2.75
2005 Payable 2006 Levy per Thousand
$1,047,534$30,508
$0
General AidSpecial EducationExtraordinary Cost Fund - SE
$1,078,042Total State Aid
State Aid
Special Education Federal Flowthrough
$87,535IDEA Part BPart B, Sec. 619, PK $2,696
$90,231Total
K-12 Instruction $1,440,214PK Instruction $0Adult Instruction $0
$213,278$16,614
$0
General Special Education
Expenditures
Community Services $21,920Non-Programmed $0Debt Service $0Co-Curricular $159,320
$0$0$0$0
Total Expenditures $2,522,129 $370,733
2005 Payable 2006Taxable Valuations
Agricultural $158,341,255Owner Occupied $37,335,520Non-Ag Z $408,868Other Non-Ag/Utilities $20,543,406Total $216,629,049
$32,06419.5
13.2%34.1
$33,662Average Teacher SalaryExperience Adjusted SalaryAvg Years of Experience% with Advanced DegreesCertified Instructional Staff
Teaching Staff Data
ADM of Tuitioned Out Paid 2.861
General State Aid Adj. ADM 460.124Non-Public / Home Sch ADM 107.693
ADM Data
Local $1,142,041County $34,363State $1,124,328Federal $238,017Total $2,538,749
$591,957$0$0$0
$295,368$0
$30,508$85,813
General Capital Outlay Special Education Pension
$591,957 $411,688 $62,972
Revenue
Classroom Staff 0.0
ADM of Contracted Out Paid 0.000
Other Special Revenue $0
400 Illinois, Platte, SD 57369-0140
2005-2006 Profile of Platte Community School District 11-3
Capital Outlay Pension
Student/Staff ServicesAdministration ServicesTransportation ServicesOther Support Services
Enterprise Funds
Cost per ADM
General Fund Only
Revenue Expenditures
* Includes General, Special Education and Pension Funds
Home County: Charles MixArea in Square Miles: 458
2005 K-12 Fall Enrollment: 425
$62,972$0$0$0
$0$0
$0$0$0
$201,166$338,845
$60,701$299,964
$22,438$3,929
$0$59,389
$0$0
$174,625$25,277
$123,649$0
$17,193$0
$0$0$0$0$0
$20,881$0$0
$5,762Educational Funds* $6,520
$0$0
$76,507$165,701 $165,278
$433,735 $20,881
$148,077

December 2005 Federal Child Count
0Deaf-Blind
06
1
DeafSpeech/Language
Autism
1Emotionally Disturbed40
22200
Mental RetardationHearing ImpairedLearning DisabledMultiple DisabilitiesOrthopedic ImpairmentVisually Impaired
1
10
Other Health Impaired
Traumatic Brain InjuryDevelopmental Delay
38Total
0
0
02
00
20
10
3
2
1
0
Home
Early Childhood Setting
PT Early Child and SEEarly Childhood SE Setting
Separate SchoolResidential Facility
Regular Classroom
Resource Room
Self-Contained Classroom
Day Program
24 Hour Program
Home/Hospital Program
Special Education Placement Categories
Total 38
Student to Staff Ratio 12.5
K-8 280.8749-12 143.945
286.612148.167
ADA ADM
Total 424.819 434.779
Student Data
PK-12 Enrollment 425Open Enrolled Students Rec'd 15District Dropout Rate 0.5%
% Special Needs Students 8.9%% Eligible for Free/Red. Lunch 53.9%
Students Transported 0
District Attendance RateNumber of Graduates
97.7%33
Enrollment
Stanford Achievement Test Series, Tenth Edition (SAT10)
82
67
71
54
64
68
Math
Social Science
Language Arts
Reading
Complete Battery
Science
Stanford Writing Assessment Program, Third Edition
Grade 5
Grade 9
American College Test (ACT)
Grade 5Total
PRSpEd
PR
Number Tested
English
17
59%
Total PR
Sp Ed PR
73
65
61
64
61
65
82
80
72
69
85
78
54%
Grade 4 Grade 3Total
PRSp Ed
PR
Grade 6Total
PRSp Ed
PR
38 34 311 1 2
Sp EdTotal
Number Tested
Grade 7Total
PRSp Ed
PR
Grade 8 Total
PRSp Ed
PR
Grade 11Total
PRSp Ed
PR
MathReadingScienceComposite Score
24.722.422.9
23.423.5
80
74
79
66
66
71
22 3
86
85
84
75
73
80
85
72
69
73
70
75
85
71
75
80
71
76
229 334 334
Percent Proficient or Higher
No assessment data are reported when less than ten students were tested.
Ideas and Development
Sp EdTotal
Organization, Unity, and Coherence
Sp EdTotal
Word Choice
Sp EdTotal
Sentences and Paragraphs
Sp EdTotal
Grammer and Usage
Sp EdTotal
Writing Mechanics
Sp EdTotal
NumberTested
77% 70% 73%
67%
43%
54%
50%
59%
63%
77%
30
39

General $14,628Capital Outlay $10,759
Pension $934Special Education $18,898
Ending Fund Balance
Bond Redemption $0Capital Projects $0
Other Fund Data
Agricultural $6.39Non-Ag Z $8.39Owner Occupied $10.28Other Non-Ag/Utilities $22.03Special Education $1.40
Bond Redemption $0.00Pension Fund $0.30
Capital Outlay $0.89
2005 Payable 2006 Levy per Thousand
$267,211$26,440$50,466
General AidSpecial EducationExtraordinary Cost Fund - SE
$344,117Total State Aid
State Aid
Special Education Federal Flowthrough
$15,871IDEA Part BPart B, Sec. 619, PK $2,474
$18,345Total
K-12 Instruction $524,808PK Instruction $0Adult Instruction $0
$73,058$13,829
$0
General Special Education
Expenditures
Community Services $0Non-Programmed $0Debt Service $0Co-Curricular $39,325
$0$0$0$0
Total Expenditures $824,274 $112,325
2005 Payable 2006Taxable Valuations
Agricultural $23,813,643Owner Occupied $6,407,356Non-Ag Z $5,739Other Non-Ag/Utilities $3,781,550Total $34,008,288
$32,31112.8
7.7%12.2
$30,362Average Teacher SalaryExperience Adjusted SalaryAvg Years of Experience% with Advanced DegreesCertified Instructional Staff
Teaching Staff Data
ADM of Tuitioned Out Paid 1.000
General State Aid Adj. ADM 95.894Non-Public / Home Sch ADM 0.000
ADM Data
Local $359,926County $6,375State $279,371Federal $11,023Total $656,695
$30,454$0$0$0
$47,152$0
$76,906$18,345
General Capital Outlay Special Education Pension
$30,454 $142,403 $10,097
Revenue
Classroom Staff 0.6
ADM of Contracted Out Paid 0.000
Other Special Revenue $0
916 F Ave, Pollock, SD 57648
2005-2006 Profile of Pollock School District 10-2
Capital Outlay Pension
Student/Staff ServicesAdministration ServicesTransportation ServicesOther Support Services
Enterprise Funds
Cost per ADM
General Fund Only
Revenue Expenditures
* Includes General, Special Education and Pension Funds
Home County: CampbellArea in Square Miles: 200
2005 K-12 Fall Enrollment: 77
$10,097$0$0$0
$0$0
$9,884$0$0
$13,364$89,540$51,650
$105,587
$0$0
$56,950$17,555
$0$0$0$0
$25,438$0$0$0
$0$532$65
$1,346$0$0$0
$572
$10,445Educational Funds* $11,680
$0$0
$66,631$37,038 $45,353
*District has opted out of General Fund levy
$121,275 $12,398
$46,770

December 2005 Federal Child Count
0Deaf-Blind
02
0
DeafSpeech/Language
Autism
0Emotionally Disturbed104100
Mental RetardationHearing ImpairedLearning DisabledMultiple DisabilitiesOrthopedic ImpairmentVisually Impaired
1
00
Other Health Impaired
Traumatic Brain InjuryDevelopmental Delay
9Total
0
0
10
00
6
1
0
1
0
0
Home
Early Childhood Setting
PT Early Child and SEEarly Childhood SE Setting
Separate SchoolResidential Facility
Regular Classroom
Resource Room
Self-Contained Classroom
Day Program
24 Hour Program
Home/Hospital Program
Special Education Placement Categories
Total 9
Student to Staff Ratio 6.0
K-8 44.7609-12 31.923
46.21232.700
ADA ADM
Total 76.683 78.912
Student Data
PK-12 Enrollment 77Open Enrolled Students Rec'd 1District Dropout Rate 0.0%
% Special Needs Students 11.7%% Eligible for Free/Red. Lunch 46.6%
Students Transported 38
District Attendance RateNumber of Graduates
97.2%9
Enrollment
Stanford Achievement Test Series, Tenth Edition (SAT10)
66
84
72
41
53
62
Math
Social Science
Language Arts
Reading
Complete Battery
Science
Stanford Writing Assessment Program, Third Edition
Grade 5
Grade 9
American College Test (ACT)
Grade 5Total
PRSpEd
PR
Number Tested
English
7
20%
Total PR
Sp Ed PR
86
84
74
78
72
79
77
65
60
61
67
66
20%
Grade 4 Grade 3Total
PRSp Ed
PR
Grade 6Total
PRSp Ed
PR
4 9 102
Sp EdTotal
Number Tested
Grade 7Total
PRSp Ed
PR
Grade 8 Total
PRSp Ed
PR
Grade 11Total
PRSp Ed
PR
MathReadingScienceComposite Score
70
67
64
80
66
68
4
85
87
77
68
54
74
78
77
78
62
54
69
75
59
59
75
44
63
4 17 4
Percent Proficient or Higher
No assessment data are reported when less than ten students were tested.
Ideas and Development
Sp EdTotal
Organization, Unity, and Coherence
Sp EdTotal
Word Choice
Sp EdTotal
Sentences and Paragraphs
Sp EdTotal
Grammer and Usage
Sp EdTotal
Writing Mechanics
Sp EdTotal
NumberTested
50% 50% 50%
20%
50%
20%
25%
40%
25%
40%
4
5

General $99,793Capital Outlay $32,145
Pension $2,548Special Education $55,945
Ending Fund Balance
Bond Redemption $0Capital Projects $0
Other Fund Data
Agricultural $5.67Non-Ag Z $7.45Owner Occupied $9.12Other Non-Ag/Utilities $19.55Special Education $0.14
Bond Redemption $0.00Pension Fund $0.17
Capital Outlay $0.22
2005 Payable 2006 Levy per Thousand
$2,341$0$0
General AidSpecial EducationExtraordinary Cost Fund - SE
$2,341Total State Aid
State Aid
Special Education Federal Flowthrough
$4,281IDEA Part BPart B, Sec. 619, PK $0
$4,281Total
K-12 Instruction $143,210PK Instruction $0Adult Instruction $0
$733$0$0
General Special Education
Expenditures
Community Services $0Non-Programmed $0Debt Service $0Co-Curricular $1,364
$0$0$0$0
Total Expenditures $247,404 $5,775
2005 Payable 2006Taxable Valuations
Agricultural $32,835,860Owner Occupied $1,079,199Non-Ag Z $291,497Other Non-Ag/Utilities $424,217Total $34,630,773
$28,12223.0
50.0%1.8
$26,083Average Teacher SalaryExperience Adjusted SalaryAvg Years of Experience% with Advanced DegreesCertified Instructional Staff
Teaching Staff Data
ADM of Tuitioned Out Paid 0.000
General State Aid Adj. ADM 22.800Non-Public / Home Sch ADM 0.000
ADM Data
Local $212,115County $1,196State $8,187Federal $18,453Total $239,951
$7,212$0$0$0
$7,622$0$0
$4,281
General Capital Outlay Special Education Pension
$7,212 $11,903 $5,872
Revenue
Classroom Staff 0.0
ADM of Contracted Out Paid 10.000
Other Special Revenue $0
17989 Polo Dr, Orient, SD 57467
2005-2006 Profile of Polo School District 29-2
Capital Outlay Pension
Student/Staff ServicesAdministration ServicesTransportation ServicesOther Support Services
Enterprise Funds
Cost per ADM
General Fund Only
Revenue Expenditures
* Includes General, Special Education and Pension Funds
Home County: HandArea in Square Miles: 130
2005 K-12 Fall Enrollment: 9
$5,872$0$0$0
$0$0
$3,509$0$0
$8,396$25,488
$272$68,675
$0$0$0
$7,658$0$0$0$0
$4,809$232
$0$0
$0$552
$0$1,704
$0$0$0
$24
$21,045Educational Funds* $22,330
$0$0$0$0 $0
*District has opted out of General Fund levy
$7,658 $5,789
$0

December 2005 Federal Child Count
0Deaf-Blind
00
0
DeafSpeech/Language
Autism
0Emotionally Disturbed001100
Mental RetardationHearing ImpairedLearning DisabledMultiple DisabilitiesOrthopedic ImpairmentVisually Impaired
0
00
Other Health Impaired
Traumatic Brain InjuryDevelopmental Delay
2Total
0
0
00
00
1
0
0
0
0
1
Home
Early Childhood Setting
PT Early Child and SEEarly Childhood SE Setting
Separate SchoolResidential Facility
Regular Classroom
Resource Room
Self-Contained Classroom
Day Program
24 Hour Program
Home/Hospital Program
Special Education Placement Categories
Total 2
Student to Staff Ratio 5.0
K-8 8.8419-12 0.000
9.0000.000
ADA ADM
Total 8.841 9.000
Student Data
PK-12 Enrollment 9Open Enrolled Students Rec'd 0District Dropout Rate 1.0%
% Special Needs Students 10.5%% Eligible for Free/Red. Lunch 0.0%
Students Transported 0
District Attendance RateNumber of Graduates
98.2%0
Enrollment
Stanford Achievement Test Series, Tenth Edition (SAT10)
78
76
89
62
82
79
Math
Social Science
Language Arts
Reading
Complete Battery
Science
Stanford Writing Assessment Program, Third Edition
Grade 5
Grade 9
American College Test (ACT)
Grade 5Total
PRSpEd
PR
Number Tested
English
Total PR
Sp Ed PR
Grade 4 Grade 3Total
PRSp Ed
PR
Grade 6Total
PRSp Ed
PR
2
Sp EdTotal
Number Tested
Grade 7Total
PRSp Ed
PR
Grade 8 Total
PRSp Ed
PR
Grade 11Total
PRSp Ed
PR
MathReadingScienceComposite Score
73
30
85
59
75
70
1
96
83
92
53
41
79
84
87
77
52
93
82
1 1
Percent Proficient or Higher
No assessment data are reported when less than ten students were tested.
Ideas and Development
Sp EdTotal
Organization, Unity, and Coherence
Sp EdTotal
Word Choice
Sp EdTotal
Sentences and Paragraphs
Sp EdTotal
Grammer and Usage
Sp EdTotal
Writing Mechanics
Sp EdTotal
NumberTested
100% 100% 100% 100% 100% 100%1
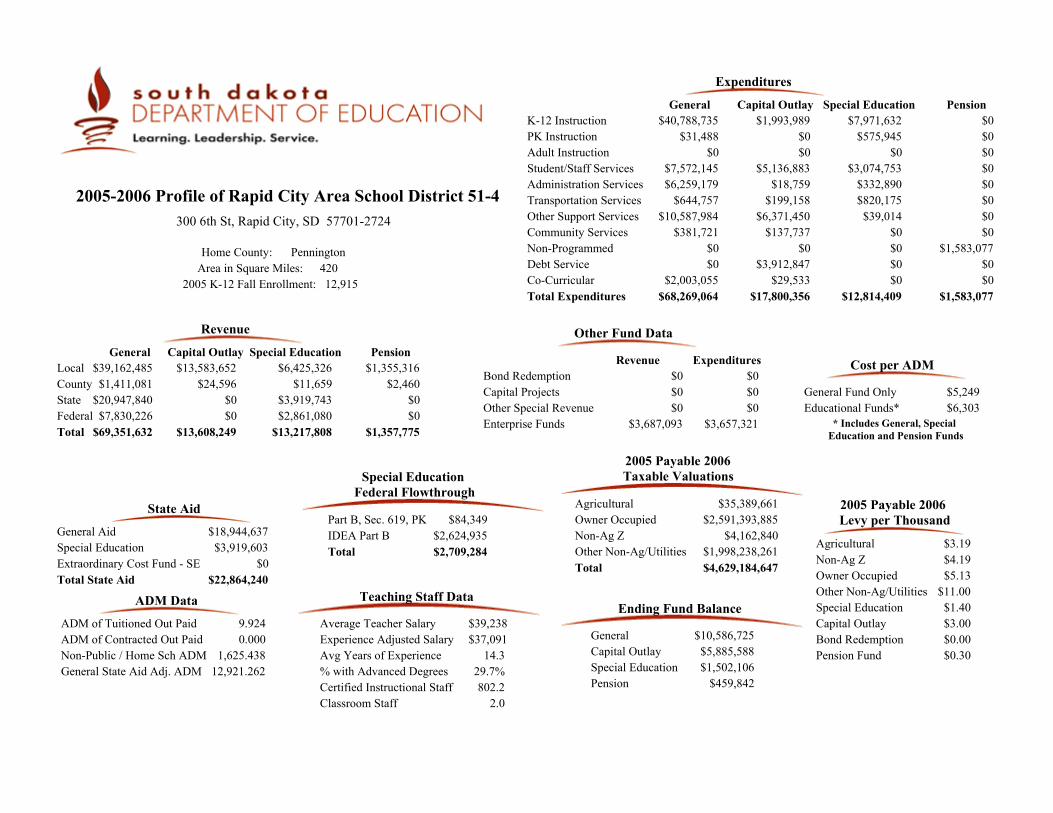
General $10,586,725Capital Outlay $5,885,588
Pension $459,842Special Education $1,502,106
Ending Fund Balance
Bond Redemption $0Capital Projects $0
Other Fund Data
Agricultural $3.19Non-Ag Z $4.19Owner Occupied $5.13Other Non-Ag/Utilities $11.00Special Education $1.40
Bond Redemption $0.00Pension Fund $0.30
Capital Outlay $3.00
2005 Payable 2006 Levy per Thousand
$18,944,637$3,919,603
$0
General AidSpecial EducationExtraordinary Cost Fund - SE
$22,864,240Total State Aid
State Aid
Special Education Federal Flowthrough
$2,624,935IDEA Part BPart B, Sec. 619, PK $84,349
$2,709,284Total
K-12 Instruction $40,788,735PK Instruction $31,488Adult Instruction $0
$7,971,632$575,945
$0
General Special Education
Expenditures
Community Services $381,721Non-Programmed $0Debt Service $0Co-Curricular $2,003,055
$0$0$0$0
Total Expenditures $68,269,064 $12,814,409
2005 Payable 2006Taxable Valuations
Agricultural $35,389,661Owner Occupied $2,591,393,885Non-Ag Z $4,162,840Other Non-Ag/Utilities $1,998,238,261Total $4,629,184,647
$37,09114.3
29.7%802.2
$39,238Average Teacher SalaryExperience Adjusted SalaryAvg Years of Experience% with Advanced DegreesCertified Instructional Staff
Teaching Staff Data
ADM of Tuitioned Out Paid 9.924
General State Aid Adj. ADM 12,921.262Non-Public / Home Sch ADM 1,625.438
ADM Data
Local $39,162,485County $1,411,081State $20,947,840Federal $7,830,226Total $69,351,632
$13,583,652$24,596
$0$0
$6,425,326$11,659
$3,919,743$2,861,080
General Capital Outlay Special Education Pension
$13,608,249 $13,217,808 $1,357,775
Revenue
Classroom Staff 2.0
ADM of Contracted Out Paid 0.000
Other Special Revenue $0
300 6th St, Rapid City, SD 57701-2724
2005-2006 Profile of Rapid City Area School District 51-4
Capital Outlay Pension
Student/Staff ServicesAdministration ServicesTransportation ServicesOther Support Services
Enterprise Funds
Cost per ADM
General Fund Only
Revenue Expenditures
* Includes General, Special Education and Pension Funds
Home County: PenningtonArea in Square Miles: 420
2005 K-12 Fall Enrollment: 12,915
$1,355,316$2,460
$0$0
$0$0
$0$0$0
$7,572,145$6,259,179
$644,757$10,587,984
$5,136,883$18,759
$199,158$6,371,450
$137,737$0
$3,912,847$29,533
$3,074,753$332,890$820,175
$39,014
$0$0$0$0$0
$1,583,077$0$0
$5,249Educational Funds* $6,303
$0$0$0
$3,687,093 $3,657,321
$17,800,356 $1,583,077
$1,993,989
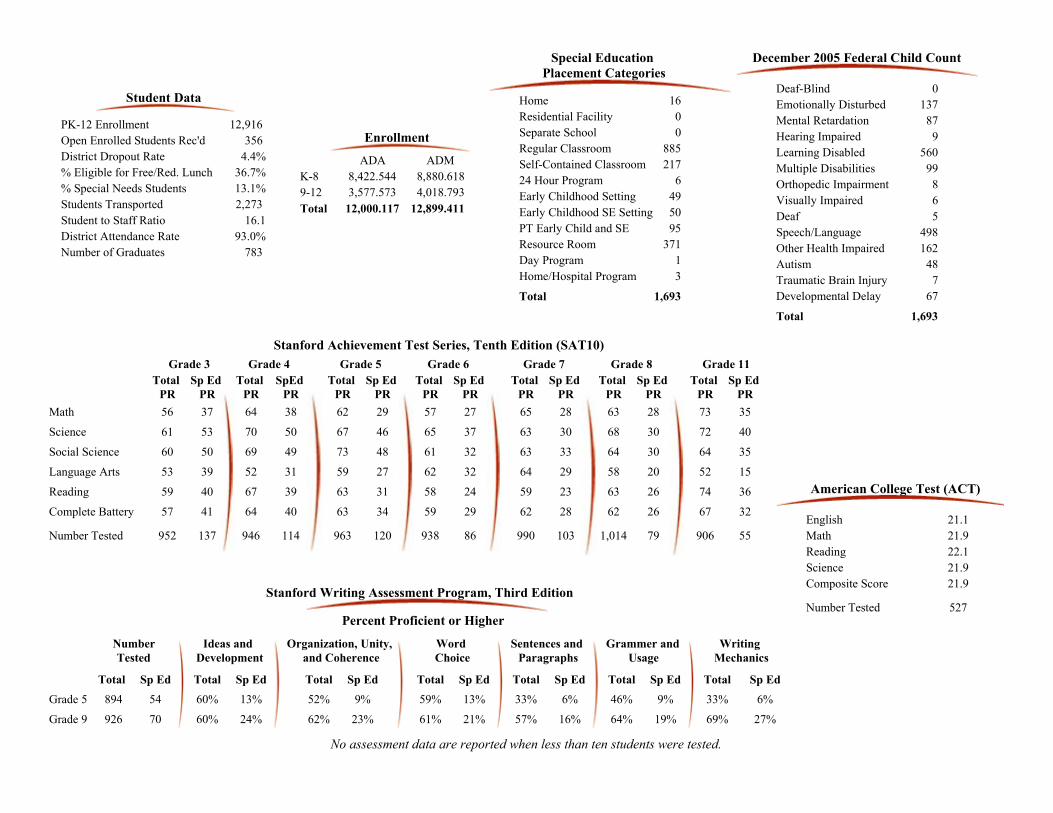
December 2005 Federal Child Count
0Deaf-Blind
5498
48
DeafSpeech/Language
Autism
137Emotionally Disturbed87
9560
9986
Mental RetardationHearing ImpairedLearning DisabledMultiple DisabilitiesOrthopedic ImpairmentVisually Impaired
162
767
Other Health Impaired
Traumatic Brain InjuryDevelopmental Delay
1,693Total
16
49
9550
00
885
371
217
1
6
3
Home
Early Childhood Setting
PT Early Child and SEEarly Childhood SE Setting
Separate SchoolResidential Facility
Regular Classroom
Resource Room
Self-Contained Classroom
Day Program
24 Hour Program
Home/Hospital Program
Special Education Placement Categories
Total 1,693
Student to Staff Ratio 16.1
K-8 8,422.5449-12 3,577.573
8,880.6184,018.793
ADA ADM
Total 12,000.117 12,899.411
Student Data
PK-12 Enrollment 12,916Open Enrolled Students Rec'd 356District Dropout Rate 4.4%
% Special Needs Students 13.1%% Eligible for Free/Red. Lunch 36.7%
Students Transported 2,273
District Attendance RateNumber of Graduates
93.0%783
Enrollment
Stanford Achievement Test Series, Tenth Edition (SAT10)
64
70
69
52
67
64
Math
Social Science
Language Arts
Reading
Complete Battery
Science
Stanford Writing Assessment Program, Third Edition
Grade 5
Grade 9
American College Test (ACT)
Grade 5Total
PRSpEd
PR
Number Tested
English
527
62% 23%
38
50
49
31
39
40
Total PR
Sp Ed PR
63
68
64
58
63
62
28
30
30
20
26
26
73
72
64
52
74
67
35
40
35
15
36
32
60% 24%
Grade 4 Grade 3Total
PRSp Ed
PR
Grade 6Total
PRSp Ed
PR
946 1,014 906114 79 55
Sp EdTotal
Number Tested
Grade 7Total
PRSp Ed
PR
Grade 8 Total
PRSp Ed
PR
Grade 11Total
PRSp Ed
PR
MathReadingScienceComposite Score
22.121.921.1
21.921.9
56 37
61 53
60 50
53 39
59 40
57 41
952 137
62 29
67 46
73 48
59 27
63 31
63 34
57 27
65 37
61 32
62 32
58 24
59 29
65 28
63 30
63 33
64 29
59 23
62 28
120963 86938 103990
Percent Proficient or Higher
No assessment data are reported when less than ten students were tested.
Ideas and Development
Sp EdTotal
Organization, Unity, and Coherence
Sp EdTotal
Word Choice
Sp EdTotal
Sentences and Paragraphs
Sp EdTotal
Grammer and Usage
Sp EdTotal
Writing Mechanics
Sp EdTotal
NumberTested
60% 13% 52% 9% 59%
61%
13%
21%
33%
57%
6%
16%
46%
64%
9%
19%
33%
69%
6%
27%
894
926
54
70

General $1,558,183Capital Outlay $732,894
Pension $64,014Special Education $623,275
Ending Fund Balance
Bond Redemption $0Capital Projects $0
Other Fund Data
Agricultural $3.60Non-Ag Z $4.73Owner Occupied $5.79Other Non-Ag/Utilities $12.61Special Education $1.25
Bond Redemption $0.00Pension Fund $0.30
Capital Outlay $3.00
2005 Payable 2006 Levy per Thousand
$2,127,914$574,590
$0
General AidSpecial EducationExtraordinary Cost Fund - SE
$2,702,504Total State Aid
State Aid
Special Education Federal Flowthrough
$132,206IDEA Part BPart B, Sec. 619, PK $9,065
$141,271Total
K-12 Instruction $1,943,517PK Instruction $0Adult Instruction $0
$653,772$76,073
$0
General Special Education
Expenditures
Community Services $0Non-Programmed $0Debt Service $0Co-Curricular $137,641
$0$0$0$0
Total Expenditures $3,266,005 $984,983
2005 Payable 2006Taxable Valuations
Agricultural $109,129,795Owner Occupied $32,478,656Non-Ag Z $1,643,107Other Non-Ag/Utilities $23,804,933Total $167,056,491
$30,40217.5
12.5%47.0
$33,612Average Teacher SalaryExperience Adjusted SalaryAvg Years of Experience% with Advanced DegreesCertified Instructional Staff
Teaching Staff Data
ADM of Tuitioned Out Paid 1.714
General State Aid Adj. ADM 622.926Non-Public / Home Sch ADM 5.995
ADM Data
Local $1,246,451County $24,363State $2,203,056Federal $207,825Total $3,681,695
$533,300$0$0
$3,849
$206,506$0
$578,812$192,497
General Capital Outlay Special Education Pension
$537,149 $977,815 $49,501
Revenue
Classroom Staff 0.0
ADM of Contracted Out Paid 0.000
Other Special Revenue $0
502 E 2nd St, Redfield, SD 57469
2005-2006 Profile of Redfield School District 56-4
Capital Outlay Pension
Student/Staff ServicesAdministration ServicesTransportation ServicesOther Support Services
Enterprise Funds
Cost per ADM
General Fund Only
Revenue Expenditures
* Includes General, Special Education and Pension Funds
Home County: SpinkArea in Square Miles: 411
2005 K-12 Fall Enrollment: 618
$49,501$0$0$0
$0$0
$36,026$0$0
$258,383$274,344$150,407$501,713
$42,015$0
$52,074$109,936
$0$0
$185,946$38,017
$49,778$91,104$2,401
$111,856
$0$33,661
$0$0$0$0$0$0
$5,249Educational Funds* $6,582
$0$0$0
$170,705 $176,797
*District has opted out of General Fund levy
$520,667 $69,687
$92,678

December 2005 Federal Child Count
0Deaf-Blind
121
2
DeafSpeech/Language
Autism
5Emotionally Disturbed80
3743
00
Mental RetardationHearing ImpairedLearning DisabledMultiple DisabilitiesOrthopedic ImpairmentVisually Impaired
3
011
Other Health Impaired
Traumatic Brain InjuryDevelopmental Delay
131Total
0
4
92
00
58
11
4
0
43
0
Home
Early Childhood Setting
PT Early Child and SEEarly Childhood SE Setting
Separate SchoolResidential Facility
Regular Classroom
Resource Room
Self-Contained Classroom
Day Program
24 Hour Program
Home/Hospital Program
Special Education Placement Categories
Total 131
Student to Staff Ratio 13.3
K-8 385.6499-12 211.904
398.727221.480
ADA ADM
Total 597.553 620.207
Student Data
PK-12 Enrollment 623Open Enrolled Students Rec'd 35District Dropout Rate 2.2%
% Special Needs Students 21.0%% Eligible for Free/Red. Lunch 20.3%
Students Transported 231
District Attendance RateNumber of Graduates
96.3%58
Enrollment
Stanford Achievement Test Series, Tenth Edition (SAT10)
83
77
80
67
69
74
Math
Social Science
Language Arts
Reading
Complete Battery
Science
Stanford Writing Assessment Program, Third Edition
Grade 5
Grade 9
American College Test (ACT)
Grade 5Total
PRSpEd
PR
Number Tested
English
34
62%
Total PR
Sp Ed PR
77
75
66
71
67
71
80
75
61
62
76
71
64%
Grade 4 Grade 3Total
PRSp Ed
PR
Grade 6Total
PRSp Ed
PR
46 40 385 3 3
Sp EdTotal
Number Tested
Grade 7Total
PRSp Ed
PR
Grade 8 Total
PRSp Ed
PR
Grade 11Total
PRSp Ed
PR
MathReadingScienceComposite Score
22.923.021.3
21.922.5
81 64
75 73
80 64
63 44
66 38
72 53
46 10
77
73
78
74
59
71
82
69
78
78
66
74
76
72
76
71
60
69
238 349 956
Percent Proficient or Higher
No assessment data are reported when less than ten students were tested.
Ideas and Development
Sp EdTotal
Organization, Unity, and Coherence
Sp EdTotal
Word Choice
Sp EdTotal
Sentences and Paragraphs
Sp EdTotal
Grammer and Usage
Sp EdTotal
Writing Mechanics
Sp EdTotal
NumberTested
79% 79% 76%
64%
71%
55%
74%
66%
58%
62%
38
53

General $1,000,530Capital Outlay $316,819
PensionSpecial Education $95,154
Ending Fund Balance
Bond Redemption $0Capital Projects $0
Other Fund Data
Agricultural $3.85Non-Ag Z $5.05Owner Occupied $6.19Other Non-Ag/Utilities $13.27Special Education $1.40
Bond Redemption $0.00Pension Fund $0.00
Capital Outlay $2.75
2005 Payable 2006 Levy per Thousand
$706,974$557
$0
General AidSpecial EducationExtraordinary Cost Fund - SE
$707,531Total State Aid
State Aid
Special Education Federal Flowthrough
$37,342IDEA Part BPart B, Sec. 619, PK $608
$37,950Total
K-12 Instruction $772,699PK Instruction $0Adult Instruction $0
$70,968$7,973
$0
General Special Education
Expenditures
Community Services $0Non-Programmed $0Debt Service $0Co-Curricular $85,603
$0$0$0$0
Total Expenditures $1,416,127 $136,554
2005 Payable 2006Taxable Valuations
Agricultural $74,441,640Owner Occupied $12,331,440Non-Ag Z $900,837Other Non-Ag/Utilities $5,547,380Total $93,221,297
$29,73412.7
5.9%16.4
$29,985Average Teacher SalaryExperience Adjusted SalaryAvg Years of Experience% with Advanced DegreesCertified Instructional Staff
Teaching Staff Data
ADM of Tuitioned Out Paid 0.479
General State Aid Adj. ADM 252.933Non-Public / Home Sch ADM 1.834
ADM Data
Local $555,066County $35,233State $735,691Federal $160,501Total $1,486,490
$259,445$0$0$0
$76,888$0
$557$43,495
General Capital Outlay Special Education Pension
$259,445 $120,940 $0
Revenue
Classroom Staff 0.9
ADM of Contracted Out Paid 0.000
Other Special Revenue $0
202 Finley Avenue, Rosholt, SD 57260
2005-2006 Profile of Rosholt School District 54-4
Capital Outlay Pension
Student/Staff ServicesAdministration ServicesTransportation ServicesOther Support Services
Enterprise Funds
Cost per ADM
General Fund Only
Revenue Expenditures
* Includes General, Special Education and Pension Funds
Home County: RobertsArea in Square Miles: 173
2005 K-12 Fall Enrollment: 174
$0$0$0$0
$0$0
$0$0$0
$31,979$141,929
$75,294$308,623
$0$0
$54,563$23,072
$0$0
$39,389$3,000
$57,613$0$0$0
$0$0$0$0$0$0$0$0
$6,793Educational Funds* $7,426
$0$0$0
$97,061 $100,297
*District has opted out of General Fund levy
$153,608 $0
$33,584

December 2005 Federal Child Count
0Deaf-Blind
05
0
DeafSpeech/Language
Autism
1Emotionally Disturbed00
17100
Mental RetardationHearing ImpairedLearning DisabledMultiple DisabilitiesOrthopedic ImpairmentVisually Impaired
1
03
Other Health Impaired
Traumatic Brain InjuryDevelopmental Delay
28Total
3
0
00
01
22
2
0
0
0
0
Home
Early Childhood Setting
PT Early Child and SEEarly Childhood SE Setting
Separate SchoolResidential Facility
Regular Classroom
Resource Room
Self-Contained Classroom
Day Program
24 Hour Program
Home/Hospital Program
Special Education Placement Categories
Total 28
Student to Staff Ratio 10.1
K-8 140.9809-12 54.437
145.47757.785
ADA ADM
Total 195.417 203.262
Student Data
PK-12 Enrollment 174Open Enrolled Students Rec'd 30District Dropout Rate 0.9%
% Special Needs Students 16.1%% Eligible for Free/Red. Lunch 40.3%
Students Transported 153
District Attendance RateNumber of Graduates
96.1%15
Enrollment
Stanford Achievement Test Series, Tenth Edition (SAT10)
82
79
80
64
77
77
Math
Social Science
Language Arts
Reading
Complete Battery
Science
Stanford Writing Assessment Program, Third Edition
Grade 5
Grade 9
American College Test (ACT)
Grade 5Total
PRSpEd
PR
Number Tested
English
11
69%
Total PR
Sp Ed PR
72
81
75
84
76
75
75
69
66
80
83
75
75%
Grade 4 Grade 3Total
PRSp Ed
PR
Grade 6Total
PRSp Ed
PR
12 17 124 1
Sp EdTotal
Number Tested
Grade 7Total
PRSp Ed
PR
Grade 8 Total
PRSp Ed
PR
Grade 11Total
PRSp Ed
PR
MathReadingScienceComposite Score
22.920.922.6
22.922.5
69
62
77
69
61
66
15 2
86
85
88
81
80
83
76
76
78
71
77
74
43
49
45
57
50
47
117 218 522
Percent Proficient or Higher
No assessment data are reported when less than ten students were tested.
Ideas and Development
Sp EdTotal
Organization, Unity, and Coherence
Sp EdTotal
Word Choice
Sp EdTotal
Sentences and Paragraphs
Sp EdTotal
Grammer and Usage
Sp EdTotal
Writing Mechanics
Sp EdTotal
NumberTested
68% 68% 74%
75%
69%
69%
58%
94%
58%
88%
19
16

General $428,365Capital Outlay $77,648
Pension $40,604Special Education $51,996
Ending Fund Balance
Bond Redemption $113,709Capital Projects $0
Other Fund Data
Agricultural $3.19Non-Ag Z $4.19Owner Occupied $5.13Other Non-Ag/Utilities $11.00Special Education $1.40
Bond Redemption $1.87Pension Fund $0.30
Capital Outlay $1.25
2005 Payable 2006 Levy per Thousand
$400,901$34,347
$0
General AidSpecial EducationExtraordinary Cost Fund - SE
$435,248Total State Aid
State Aid
Special Education Federal Flowthrough
$35,543IDEA Part BPart B, Sec. 619, PK $570
$36,113Total
K-12 Instruction $552,629PK Instruction $0Adult Instruction $0
$136,376$0$0
General Special Education
Expenditures
Community Services $0Non-Programmed $0Debt Service $0Co-Curricular $76,155
$0$0$0$0
Total Expenditures $1,016,703 $168,340
2005 Payable 2006Taxable Valuations
Agricultural $37,308,096Owner Occupied $12,185,777Non-Ag Z $1,161,183Other Non-Ag/Utilities $18,484,558Total $69,139,614
$26,65220.4
12.5%14.5
$29,547Average Teacher SalaryExperience Adjusted SalaryAvg Years of Experience% with Advanced DegreesCertified Instructional Staff
Teaching Staff Data
ADM of Tuitioned Out Paid 0.019
General State Aid Adj. ADM 157.338Non-Public / Home Sch ADM 1.836
ADM Data
Local $474,579County $12,900State $419,231Federal $88,178Total $994,888
$80,976$140
$0$0
$93,453$166
$34,347$39,179
General Capital Outlay Special Education Pension
$81,116 $167,144 $21,679
Revenue
Classroom Staff 0.0
ADM of Contracted Out Paid 0.000
Other Special Revenue $0
302 East Bjornson Avenue, Roslyn, SD 57261
2005-2006 Profile of Roslyn School District 18-2
Capital Outlay Pension
Student/Staff ServicesAdministration ServicesTransportation ServicesOther Support Services
Enterprise Funds
Cost per ADM
General Fund Only
Revenue Expenditures
* Includes General, Special Education and Pension Funds
Home County: DayArea in Square Miles: 214
2005 K-12 Fall Enrollment: 134
$21,643$36$0$0
$0$0
$38,100$0$0
$41,001$86,384
$104,761$155,772
$0$0
$20,816$40,957
$0$0$0
$14,400
$31,964$0$0$0
$0$0$0$0$0$0$0$0
$7,717Educational Funds* $9,292
$122,237$0$0
$73,568 $83,916
$115,145 $38,100
$38,971

December 2005 Federal Child Count
0Deaf-Blind
04
0
DeafSpeech/Language
Autism
3Emotionally Disturbed407100
Mental RetardationHearing ImpairedLearning DisabledMultiple DisabilitiesOrthopedic ImpairmentVisually Impaired
1
00
Other Health Impaired
Traumatic Brain InjuryDevelopmental Delay
20Total
0
1
00
00
9
9
0
0
0
1
Home
Early Childhood Setting
PT Early Child and SEEarly Childhood SE Setting
Separate SchoolResidential Facility
Regular Classroom
Resource Room
Self-Contained Classroom
Day Program
24 Hour Program
Home/Hospital Program
Special Education Placement Categories
Total 20
Student to Staff Ratio 9.2
K-8 64.9959-12 60.044
67.52063.576
ADA ADM
Total 125.039 131.096
Student Data
PK-12 Enrollment 134Open Enrolled Students Rec'd 37District Dropout Rate 3.1%
% Special Needs Students 14.9%% Eligible for Free/Red. Lunch 63.0%
Students Transported 110
District Attendance RateNumber of Graduates
95.4%14
Enrollment
Stanford Achievement Test Series, Tenth Edition (SAT10)
90
89
84
58
79
79
Math
Social Science
Language Arts
Reading
Complete Battery
Science
Stanford Writing Assessment Program, Third Edition
Grade 5
Grade 9
American College Test (ACT)
Grade 5Total
PRSpEd
PR
Number Tested
English
11
31%
Total PR
Sp Ed PR
45
52
43
42
45
45
66
71
59
49
58
59
56%
Grade 4 Grade 3Total
PRSp Ed
PR
Grade 6Total
PRSp Ed
PR
6 7 151 1 2
Sp EdTotal
Number Tested
Grade 7Total
PRSp Ed
PR
Grade 8 Total
PRSp Ed
PR
Grade 11Total
PRSp Ed
PR
MathReadingScienceComposite Score
19.117.718.2
20.518.8
53
52
54
42
50
50
6 1
65
60
75
58
60
63
58
47
42
52
34
46
56
53
58
58
66
58
6 14 418
Percent Proficient or Higher
No assessment data are reported when less than ten students were tested.
Ideas and Development
Sp EdTotal
Organization, Unity, and Coherence
Sp EdTotal
Word Choice
Sp EdTotal
Sentences and Paragraphs
Sp EdTotal
Grammer and Usage
Sp EdTotal
Writing Mechanics
Sp EdTotal
NumberTested
100% 83% 83%
50%
50%
56%
67%
69%
33%
56%
6
16

General $185,670Capital Outlay $189,809
PensionSpecial Education $63,183
Ending Fund Balance
Bond Redemption $0Capital Projects $0
Other Fund Data
Agricultural $5.63Non-Ag Z $7.39Owner Occupied $9.05Other Non-Ag/Utilities $19.41Special Education $1.40
Bond Redemption $0.00Pension Fund $0.30
Capital Outlay $1.44
2005 Payable 2006 Levy per Thousand
$280,770$0$0
General AidSpecial EducationExtraordinary Cost Fund - SE
$280,770Total State Aid
State Aid
Special Education Federal Flowthrough
$19,558IDEA Part BPart B, Sec. 619, PK $537
$20,095Total
K-12 Instruction $533,740PK Instruction $0Adult Instruction $0
$75,516$0$0
General Special Education
Expenditures
Community Services $0Non-Programmed $0Debt Service $0Co-Curricular $40,413
$0$0$0$0
Total Expenditures $910,378 $120,545
2005 Payable 2006Taxable Valuations
Agricultural $69,673,642Owner Occupied $9,570,224Non-Ag Z $849,805Other Non-Ag/Utilities $1,452,345Total $81,546,016
$23,11719.4
15.8%16.7
$24,569Average Teacher SalaryExperience Adjusted SalaryAvg Years of Experience% with Advanced DegreesCertified Instructional Staff
Teaching Staff Data
ADM of Tuitioned Out Paid 0.461
General State Aid Adj. ADM 131.820Non-Public / Home Sch ADM 0.000
ADM Data
Local $598,324County $38,071State $294,296Federal $49,226Total $979,918
$111,911$8,652
$0$3,100
$108,828$21
$0$18,588
General Capital Outlay Special Education Pension
$123,663 $127,437 $23,311
Revenue
Classroom Staff 0.0
ADM of Contracted Out Paid 0.000
Other Special Revenue $0
102 School Street, Rutland, SD 57057-0089
2005-2006 Profile of Rutland School District 39-4
Capital Outlay Pension
Student/Staff ServicesAdministration ServicesTransportation ServicesOther Support Services
Enterprise Funds
Cost per ADM
General Fund Only
Revenue Expenditures
* Includes General, Special Education and Pension Funds
Home County: LakeArea in Square Miles: 125
2005 K-12 Fall Enrollment: 110
$23,306$4$0$0
$0$0
$22,457$0$0
$36,531$97,332$52,359
$150,003
$0$13,175$11,197$58,003
$0$0$0$0
$37,501$7,528
$0$0
$422$432
$0$0$0$0$0$0
$8,322Educational Funds* $9,637
$0$0$0
$47,561 $53,888
*District has opted out of General Fund levy
$144,532 $23,311
$62,156

December 2005 Federal Child Count
0Deaf-Blind
04
1
DeafSpeech/Language
Autism
1Emotionally Disturbed400000
Mental RetardationHearing ImpairedLearning DisabledMultiple DisabilitiesOrthopedic ImpairmentVisually Impaired
3
00
Other Health Impaired
Traumatic Brain InjuryDevelopmental Delay
13Total
0
0
00
00
9
4
0
0
0
0
Home
Early Childhood Setting
PT Early Child and SEEarly Childhood SE Setting
Separate SchoolResidential Facility
Regular Classroom
Resource Room
Self-Contained Classroom
Day Program
24 Hour Program
Home/Hospital Program
Special Education Placement Categories
Total 13
Student to Staff Ratio 6.6
K-8 74.9159-12 31.530
76.88932.500
ADA ADM
Total 106.445 109.389
Student Data
PK-12 Enrollment 110Open Enrolled Students Rec'd 12District Dropout Rate 1.6%
% Special Needs Students 11.8%% Eligible for Free/Red. Lunch 25.2%
Students Transported 60
District Attendance RateNumber of Graduates
97.3%11
Enrollment
Stanford Achievement Test Series, Tenth Edition (SAT10)
70
65
77
44
61
63
Math
Social Science
Language Arts
Reading
Complete Battery
Science
Stanford Writing Assessment Program, Third Edition
Grade 5
Grade 9
American College Test (ACT)
Grade 5Total
PRSpEd
PR
Number Tested
English
7
50%
Total PR
Sp Ed PR
70
75
60
57
71
67
67
50
61
61
70
62
83%
Grade 4 Grade 3Total
PRSp Ed
PR
Grade 6Total
PRSp Ed
PR
9 11 8
Sp EdTotal
Number Tested
Grade 7Total
PRSp Ed
PR
Grade 8 Total
PRSp Ed
PR
Grade 11Total
PRSp Ed
PR
MathReadingScienceComposite Score
63
47
44
46
2
50
5 2
78
72
78
69
65
71
75
51
70
74
62
67
79
82
62
73
77
74
211 14 10
Percent Proficient or Higher
No assessment data are reported when less than ten students were tested.
Ideas and Development
Sp EdTotal
Organization, Unity, and Coherence
Sp EdTotal
Word Choice
Sp EdTotal
Sentences and Paragraphs
Sp EdTotal
Grammer and Usage
Sp EdTotal
Writing Mechanics
Sp EdTotal
NumberTested
64% 91% 55%
83%
36%
67%
45%
67%
45%
50%
11
6

General $617,553Capital Outlay $460,854
Pension $37,464Special Education $301,592
Ending Fund Balance
Bond Redemption $0Capital Projects $0
Other Fund Data
Agricultural $3.19Non-Ag Z $4.19Owner Occupied $5.13Other Non-Ag/Utilities $11.00Special Education $1.40
Bond Redemption $0.00Pension Fund $0.30
Capital Outlay $3.00
2005 Payable 2006 Levy per Thousand
$799,796$0$0
General AidSpecial EducationExtraordinary Cost Fund - SE
$799,796Total State Aid
State Aid
Special Education Federal Flowthrough
$56,122IDEA Part BPart B, Sec. 619, PK $2,573
$58,695Total
K-12 Instruction $972,645PK Instruction $15,229Adult Instruction $0
$96,050$0$0
General Special Education
Expenditures
Community Services $103,376Non-Programmed $0Debt Service $0Co-Curricular $64,702
$0$0$0$0
Total Expenditures $1,621,100 $147,271
2005 Payable 2006Taxable Valuations
Agricultural $120,835,106Owner Occupied $8,229,887Non-Ag Z $710,680Other Non-Ag/Utilities $3,893,678Total $133,669,351
$30,62813.7
8.7%21.5
$29,222Average Teacher SalaryExperience Adjusted SalaryAvg Years of Experience% with Advanced DegreesCertified Instructional Staff
Teaching Staff Data
ADM of Tuitioned Out Paid 0.000
General State Aid Adj. ADM 283.881Non-Public / Home Sch ADM 0.000
ADM Data
Local $659,083County $16,971State $819,065Federal $249,816Total $1,744,936
$417,939$0$0$0
$178,089$0$0
$53,859
General Capital Outlay Special Education Pension
$417,939 $231,948 $37,464
Revenue
Classroom Staff 1.0
ADM of Contracted Out Paid 0.000
Other Special Revenue $0
40405 SD Hwy 34, Forestburg, SD 57314
2005-2006 Profile of Sanborn Central School District 55-5
Capital Outlay Pension
Student/Staff ServicesAdministration ServicesTransportation ServicesOther Support Services
Enterprise Funds
Cost per ADM
General Fund Only
Revenue Expenditures
* Includes General, Special Education and Pension Funds
Home County: SanbornArea in Square Miles: 380
2005 K-12 Fall Enrollment: 251
$37,464$0$0$0
$0$0
$0$0$0
$55,459$146,797$102,579$160,312
$2,198$0$0
$36,689$0$0
$228,134$5,249
$42,268$8,458
$495$0
$0$0$0$0$0$0$0$0
$6,155Educational Funds* $6,758
$0$256
$0$144,917 $146,194
$294,556 $0
$22,285

December 2005 Federal Child Count
0Deaf-Blind
010
0
DeafSpeech/Language
Autism
0Emotionally Disturbed209200
Mental RetardationHearing ImpairedLearning DisabledMultiple DisabilitiesOrthopedic ImpairmentVisually Impaired
1
01
Other Health Impaired
Traumatic Brain InjuryDevelopmental Delay
25Total
0
1
40
00
17
2
1
0
0
0
Home
Early Childhood Setting
PT Early Child and SEEarly Childhood SE Setting
Separate SchoolResidential Facility
Regular Classroom
Resource Room
Self-Contained Classroom
Day Program
24 Hour Program
Home/Hospital Program
Special Education Placement Categories
Total 25
Student to Staff Ratio 11.2
K-8 163.9599-12 72.447
168.29975.063
ADA ADM
Total 236.406 243.362
Student Data
PK-12 Enrollment 252Open Enrolled Students Rec'd 23District Dropout Rate 0.0%
% Special Needs Students 9.9%% Eligible for Free/Red. Lunch 59.7%
Students Transported 136
District Attendance RateNumber of Graduates
97.1%0
Enrollment
Stanford Achievement Test Series, Tenth Edition (SAT10)
75
69
70
43
56
63
Math
Social Science
Language Arts
Reading
Complete Battery
Science
Stanford Writing Assessment Program, Third Edition
Grade 5
Grade 9
American College Test (ACT)
Grade 5Total
PRSpEd
PR
Number Tested
English
11
46%
Total PR
Sp Ed PR
83
74
73
81
74
77
89
92
58
54
80
76
31%
Grade 4 Grade 3Total
PRSp Ed
PR
Grade 6Total
PRSp Ed
PR
17 20 211 2
Sp EdTotal
Number Tested
Grade 7Total
PRSp Ed
PR
Grade 8 Total
PRSp Ed
PR
Grade 11Total
PRSp Ed
PR
MathReadingScienceComposite Score
24.524.822.1
23.223.7
81
65
68
60
70
69
19 1
91
78
78
76
68
79
81
70
59
75
45
66
80
68
64
80
66
71
114 117 129
Percent Proficient or Higher
No assessment data are reported when less than ten students were tested.
Ideas and Development
Sp EdTotal
Organization, Unity, and Coherence
Sp EdTotal
Word Choice
Sp EdTotal
Sentences and Paragraphs
Sp EdTotal
Grammer and Usage
Sp EdTotal
Writing Mechanics
Sp EdTotal
NumberTested
29% 43% 36%
23%
48%
38%
50%
31%
64%
38%
14
13

General $905,384Capital Outlay $415,495
Pension $49,471Special Education $24,323
Ending Fund Balance
Bond Redemption $0Capital Projects $172,275
Other Fund Data
Agricultural $5.15Non-Ag Z $6.76Owner Occupied $8.28Other Non-Ag/Utilities $17.76Special Education $1.40
Bond Redemption $0.00Pension Fund $0.30
Capital Outlay $1.50
2005 Payable 2006 Levy per Thousand
$835,334$26,197$87,847
General AidSpecial EducationExtraordinary Cost Fund - SE
$949,378Total State Aid
State Aid
Special Education Federal Flowthrough
$70,470IDEA Part BPart B, Sec. 619, PK $1,623
$72,093Total
K-12 Instruction $901,117PK Instruction $0Adult Instruction $0
$231,833$18,888
$0
General Special Education
Expenditures
Community Services $10,138Non-Programmed $0Debt Service $0Co-Curricular $103,818
$0$0$0$0
Total Expenditures $1,756,423 $357,414
2005 Payable 2006Taxable Valuations
Agricultural $113,456,856Owner Occupied $21,495,607Non-Ag Z $29,930Other Non-Ag/Utilities $9,058,665Total $144,041,058
$29,56219.5
17.9%24.8
$30,966Average Teacher SalaryExperience Adjusted SalaryAvg Years of Experience% with Advanced DegreesCertified Instructional Staff
Teaching Staff Data
ADM of Tuitioned Out Paid 0.792
General State Aid Adj. ADM 315.240Non-Public / Home Sch ADM 0.000
ADM Data
Local $1,004,408County $11,246State $880,407Federal $169,649Total $2,065,710
$223,512$0$0$0
$192,786$0
$114,044$74,366
General Capital Outlay Special Education Pension
$223,512 $381,196 $42,150
Revenue
Classroom Staff 0.0
ADM of Contracted Out Paid 0.000
Other Special Revenue $0
711 4th St., Scotland, SD 57059
2005-2006 Profile of Scotland School District 04-3
Capital Outlay Pension
Student/Staff ServicesAdministration ServicesTransportation ServicesOther Support Services
Enterprise Funds
Cost per ADM
General Fund Only
Revenue Expenditures
* Includes General, Special Education and Pension Funds
Home County: Bon HommeArea in Square Miles: 258
2005 K-12 Fall Enrollment: 284
$42,150$0$0$0
$0$0
$32,000$0$0
$111,889$210,704$126,794$291,963
$0$0
$25,579$81,278
$0$0$0
$15,916
$101,948$3,413$1,333
$0
$0$0$0$0$0
$48,105$0$0
$6,296Educational Funds* $7,725
$0$0$0
$127,009 $129,506
*District has opted out of General Fund levy
$181,585 $80,105
$58,812

December 2005 Federal Child Count
1Deaf-Blind
018
0
DeafSpeech/Language
Autism
1Emotionally Disturbed50
20400
Mental RetardationHearing ImpairedLearning DisabledMultiple DisabilitiesOrthopedic ImpairmentVisually Impaired
1
00
Other Health Impaired
Traumatic Brain InjuryDevelopmental Delay
50Total
0
0
05
00
29
16
0
0
0
0
Home
Early Childhood Setting
PT Early Child and SEEarly Childhood SE Setting
Separate SchoolResidential Facility
Regular Classroom
Resource Room
Self-Contained Classroom
Day Program
24 Hour Program
Home/Hospital Program
Special Education Placement Categories
Total 50
Student to Staff Ratio 11.7
K-8 158.8469-12 107.337
162.718112.627
ADA ADM
Total 266.183 275.345
Student Data
PK-12 Enrollment 290Open Enrolled Students Rec'd 16District Dropout Rate 0.7%
% Special Needs Students 17.2%% Eligible for Free/Red. Lunch 35.7%
Students Transported 117
District Attendance RateNumber of Graduates
96.7%14
Enrollment
Stanford Achievement Test Series, Tenth Edition (SAT10)
81
67
68
53
66
68
Math
Social Science
Language Arts
Reading
Complete Battery
Science
Stanford Writing Assessment Program, Third Edition
Grade 5
Grade 9
American College Test (ACT)
Grade 5Total
PRSpEd
PR
Number Tested
English
10
72%
Total PR
Sp Ed PR
63
68
69
39
49
57
84
83
79
65
84
79
69%
Grade 4 Grade 3Total
PRSp Ed
PR
Grade 6Total
PRSp Ed
PR
16 11 392 6
Sp EdTotal
Number Tested
Grade 7Total
PRSp Ed
PR
Grade 8 Total
PRSp Ed
PR
Grade 11Total
PRSp Ed
PR
MathReadingScienceComposite Score
21.023.321.6
23.422.6
73
58
63
57
56
61
23 1
80
81
86
64
58
72
63
78
70
62
57
61
74
76
77
65
63
70
217 220 221
Percent Proficient or Higher
No assessment data are reported when less than ten students were tested.
Ideas and Development
Sp EdTotal
Organization, Unity, and Coherence
Sp EdTotal
Word Choice
Sp EdTotal
Sentences and Paragraphs
Sp EdTotal
Grammer and Usage
Sp EdTotal
Writing Mechanics
Sp EdTotal
NumberTested
65% 71% 76%
66%
47%
59%
59%
56%
53%
63%
17
32

General $1,565,522Capital Outlay $507,061
Pension $115,694Special Education $32,641
Ending Fund Balance
Bond Redemption $0Capital Projects $0
Other Fund Data
Agricultural $5.39Non-Ag Z $7.08Owner Occupied $8.67Other Non-Ag/Utilities $18.59Special Education $1.40
Bond Redemption $0.00Pension Fund $0.23
Capital Outlay $0.53
2005 Payable 2006 Levy per Thousand
$533,682$2,032
$15,451
General AidSpecial EducationExtraordinary Cost Fund - SE
$551,165Total State Aid
State Aid
Special Education Federal Flowthrough
$47,236IDEA Part BPart B, Sec. 619, PK $3,524
$50,760Total
K-12 Instruction $838,468PK Instruction $0Adult Instruction $0
$117,868$24,160
$0
General Special Education
Expenditures
Community Services $0Non-Programmed $0Debt Service $0Co-Curricular $89,778
$0$0$0$0
Total Expenditures $1,585,889 $254,364
2005 Payable 2006Taxable Valuations
Agricultural $116,700,396Owner Occupied $12,976,455Non-Ag Z $101,967Other Non-Ag/Utilities $12,197,982Total $141,976,800
$29,33018.0
10.0%19.7
$31,598Average Teacher SalaryExperience Adjusted SalaryAvg Years of Experience% with Advanced DegreesCertified Instructional Staff
Teaching Staff Data
ADM of Tuitioned Out Paid 0.000
General State Aid Adj. ADM 250.344Non-Public / Home Sch ADM 22.234
ADM Data
Local $1,159,916County $24,609State $570,258Federal $94,163Total $1,848,945
$85,225$0$0$0
$196,157$0
$17,483$63,676
General Capital Outlay Special Education Pension
$85,225 $277,316 $34,601
Revenue
Classroom Staff 0.0
ADM of Contracted Out Paid 0.000
Other Special Revenue $0
108 E Dakota St, Selby, SD 57472-0324
2005-2006 Profile of Selby Area School District 62-5
Capital Outlay Pension
Student/Staff ServicesAdministration ServicesTransportation ServicesOther Support Services
Enterprise Funds
Cost per ADM
General Fund Only
Revenue Expenditures
* Includes General, Special Education and Pension Funds
Home County: WalworthArea in Square Miles: 665
2005 K-12 Fall Enrollment: 210
$34,601$0$0$0
$0$0
$0$0$0
$93,754$145,261$138,617$280,011
$39,910$100
$54,499$16,148
$0$0$0$0
$78,171$30,061$4,033
$71
$0$0$0$0$0
$10,765$0$0
$7,583Educational Funds* $8,713
$0$0$0
$100,306 $122,378
*District has opted out of General Fund levy
$120,509 $10,765
$9,851

December 2005 Federal Child Count
0Deaf-Blind
010
1
DeafSpeech/Language
Autism
0Emotionally Disturbed11
14200
Mental RetardationHearing ImpairedLearning DisabledMultiple DisabilitiesOrthopedic ImpairmentVisually Impaired
0
01
Other Health Impaired
Traumatic Brain InjuryDevelopmental Delay
30Total
1
0
31
00
15
8
0
0
0
2
Home
Early Childhood Setting
PT Early Child and SEEarly Childhood SE Setting
Separate SchoolResidential Facility
Regular Classroom
Resource Room
Self-Contained Classroom
Day Program
24 Hour Program
Home/Hospital Program
Special Education Placement Categories
Total 30
Student to Staff Ratio 11.2
K-8 129.7569-12 72.432
133.59275.538
ADA ADM
Total 202.188 209.130
Student Data
PK-12 Enrollment 221Open Enrolled Students Rec'd 5District Dropout Rate 0.0%
% Special Needs Students 13.6%% Eligible for Free/Red. Lunch 30.0%
Students Transported 111
District Attendance RateNumber of Graduates
96.7%17
Enrollment
Stanford Achievement Test Series, Tenth Edition (SAT10)
91
89
86
79
86
85
Math
Social Science
Language Arts
Reading
Complete Battery
Science
Stanford Writing Assessment Program, Third Edition
Grade 5
Grade 9
American College Test (ACT)
Grade 5Total
PRSpEd
PR
Number Tested
English
15
79%
Total PR
Sp Ed PR
85
83
85
82
85
83
83
75
62
63
85
75
89%
Grade 4 Grade 3Total
PRSp Ed
PR
Grade 6Total
PRSp Ed
PR
14 16 152 2 1
Sp EdTotal
Number Tested
Grade 7Total
PRSp Ed
PR
Grade 8 Total
PRSp Ed
PR
Grade 11Total
PRSp Ed
PR
MathReadingScienceComposite Score
20.022.019.5
22.521.2
92
84
86
86
85
85
10 1
67
75
84
62
67
69
89
84
83
79
74
81
86
82
72
78
63
75
14 113 320
Percent Proficient or Higher
No assessment data are reported when less than ten students were tested.
Ideas and Development
Sp EdTotal
Organization, Unity, and Coherence
Sp EdTotal
Word Choice
Sp EdTotal
Sentences and Paragraphs
Sp EdTotal
Grammer and Usage
Sp EdTotal
Writing Mechanics
Sp EdTotal
NumberTested
46% 54% 69%
79%
50%
79%
54%
74%
62%
74%
13
19

General $408,687Capital Outlay ($86,080)
Pension $44,490Special Education $42,820
Ending Fund Balance
Bond Redemption $0Capital Projects $0
Other Fund Data
Agricultural $3.19Non-Ag Z $4.19Owner Occupied $5.13Other Non-Ag/Utilities $11.00Special Education $1.40
Bond Redemption $0.00Pension Fund $0.30
Capital Outlay $3.00
2005 Payable 2006 Levy per Thousand
$4,039,530$1,282,415
$0
General AidSpecial EducationExtraordinary Cost Fund - SE
$5,321,945Total State Aid
State Aid
Special Education Federal Flowthrough
$490,153IDEA Part BPart B, Sec. 619, PK $19,956
$510,109Total
K-12 Instruction $6,552,348PK Instruction $553,996Adult Instruction $0
$1,410,290$286,786
$0
General Special Education
Expenditures
Community Services $84,759Non-Programmed $176,134Debt Service $0Co-Curricular $101,547
$0$0$0$0
Total Expenditures $12,763,501 $2,362,497
2005 Payable 2006Taxable Valuations
Agricultural $17,709,520Owner Occupied $2,036,310Non-Ag Z $924,760Other Non-Ag/Utilities $1,879,294Total $22,549,884
$40,2819.5
6.5%107.0
$36,815Average Teacher SalaryExperience Adjusted SalaryAvg Years of Experience% with Advanced DegreesCertified Instructional Staff
Teaching Staff Data
ADM of Tuitioned Out Paid 0.000
General State Aid Adj. ADM 993.320Non-Public / Home Sch ADM 593.270
ADM Data
Local $972,032County $2,419State $4,307,892Federal $5,545,341Total $10,827,684
$40,358$0$0
$175,785
$24,176$0
$1,282,415$767,315
General Capital Outlay Special Education Pension
$216,143 $2,073,906 $3,563
Revenue
Classroom Staff 0.0
ADM of Contracted Out Paid 34.393
Other Special Revenue $0
1st & Main St, Batesland, SD 57716
2005-2006 Profile of Shannon County School District 65-1
Capital Outlay Pension
Student/Staff ServicesAdministration ServicesTransportation ServicesOther Support Services
Enterprise Funds
Cost per ADM
General Fund Only
Revenue Expenditures
* Includes General, Special Education and Pension Funds
Home County: ShannonArea in Square Miles: 2,099
2005 K-12 Fall Enrollment: 973
$3,563$0$0$0
$0$0
$0$0$0
$1,453,438$742,009
$1,194,174$1,905,096
$5,337$0
$289,506$2,086,729
$0$0
$329,050$0
$531,608$103,545
$30,269$0
$0$0$0$0$0$0$0$0
$12,453Educational Funds* $14,486
$0$0
$5,790,686$650,832 $847,654
$2,926,737 $0
$216,115

December 2005 Federal Child Count
0Deaf-Blind
075
5
DeafSpeech/Language
Autism
8Emotionally Disturbed35
09510
10
Mental RetardationHearing ImpairedLearning DisabledMultiple DisabilitiesOrthopedic ImpairmentVisually Impaired
1
314
Other Health Impaired
Traumatic Brain InjuryDevelopmental Delay
247Total
2
5
450
00
180
6
4
0
2
3
Home
Early Childhood Setting
PT Early Child and SEEarly Childhood SE Setting
Separate SchoolResidential Facility
Regular Classroom
Resource Room
Self-Contained Classroom
Day Program
24 Hour Program
Home/Hospital Program
Special Education Placement Categories
Total 247
Student to Staff Ratio 9.7
K-8 870.1589-12 0.000
958.9270.000
ADA ADM
Total 870.158 958.927
Student Data
PK-12 Enrollment 1,037Open Enrolled Students Rec'd 0District Dropout Rate 4.5%
% Special Needs Students 24.9%% Eligible for Free/Red. Lunch 91.7%
Students Transported 1,185
District Attendance RateNumber of Graduates
90.7%0
Enrollment
Stanford Achievement Test Series, Tenth Edition (SAT10)
32
36
32
18
23
27
Math
Social Science
Language Arts
Reading
Complete Battery
Science
Stanford Writing Assessment Program, Third Edition
Grade 5
Grade 9
American College Test (ACT)
Grade 5Total
PRSpEd
PR
Number Tested
English
14
21
18
11
8
12
Total PR
Sp Ed PR
34
29
27
24
28
29
Grade 4 Grade 3Total
PRSp Ed
PR
Grade 6Total
PRSp Ed
PR
99 8126 4
Sp EdTotal
Number Tested
Grade 7Total
PRSp Ed
PR
Grade 8 Total
PRSp Ed
PR
Grade 11Total
PRSp Ed
PR
MathReadingScienceComposite Score
30 12
33 23
30 15
21 10
25 11
28 14
105 20
30 18
32 27
30 24
27 21
25 12
29 19
30 11
28 15
35 18
34 22
24 5
28 12
32
26
31
34
27
30
1893 13109 883
Percent Proficient or Higher
No assessment data are reported when less than ten students were tested.
Ideas and Development
Sp EdTotal
Organization, Unity, and Coherence
Sp EdTotal
Word Choice
Sp EdTotal
Sentences and Paragraphs
Sp EdTotal
Grammer and Usage
Sp EdTotal
Writing Mechanics
Sp EdTotal
NumberTested
19% 16% 16% 12% 8% 11%97 1

General $16,276,651Capital Outlay $1,632,552
PensionSpecial Education $5,703,755
Ending Fund Balance
Bond Redemption $2,951,680Capital Projects $5,565,769
Other Fund Data
Agricultural $3.40Non-Ag Z $4.47Owner Occupied $5.47Other Non-Ag/Utilities $11.72Special Education $1.40
Bond Redemption $0.33Pension Fund $0.30
Capital Outlay $2.25
2005 Payable 2006 Levy per Thousand
$30,068,142$9,386,878
$0
General AidSpecial EducationExtraordinary Cost Fund - SE
$39,455,020Total State Aid
State Aid
Special Education Federal Flowthrough
$4,112,689IDEA Part BPart B, Sec. 619, PK $204,382
$4,317,071Total
K-12 Instruction $64,106,494PK Instruction $1,356,412Adult Instruction $0
$13,339,061$2,051,874
$0
General Special Education
Expenditures
Community Services $5,027Non-Programmed $8,740Debt Service $0Co-Curricular $3,209,161
$0$62,305
$0$0
Total Expenditures $105,074,330 $22,873,203
2005 Payable 2006Taxable Valuations
Agricultural $24,057,603Owner Occupied $3,991,570,451Non-Ag Z $5,216,242Other Non-Ag/Utilities $3,089,473,229Total $7,110,317,525
$37,68616.4
51.0%1,260.3
$38,785Average Teacher SalaryExperience Adjusted SalaryAvg Years of Experience% with Advanced DegreesCertified Instructional Staff
Teaching Staff Data
ADM of Tuitioned Out Paid 29.059
General State Aid Adj. ADM 19,678.609Non-Public / Home Sch ADM 3,625.050
ADM Data
Local $62,382,582County $1,086,740State $35,087,043Federal$11,471,633Total $110,027,998
$15,679,181$0
$443,401$398,002
$10,004,361$0
$9,399,867$4,883,348
General Capital Outlay Special Education Pension
$16,520,584 $24,287,576 $2,103,170
Revenue
Classroom Staff 8.1
ADM of Contracted Out Paid 0.000
Other Special Revenue $0
201 E 38th St, Sioux Falls, SD 57105-5898
2005-2006 Profile of Sioux Falls School District 49-5
Capital Outlay Pension
Student/Staff ServicesAdministration ServicesTransportation ServicesOther Support Services
Enterprise Funds
Cost per ADM
General Fund Only
Revenue Expenditures
* Includes General, Special Education and Pension Funds
Home County: MinnehahaArea in Square Miles: 72
2005 K-12 Fall Enrollment: 19,562
$2,103,170$0$0$0
$133,885$0
$1,016,605$0$0
$9,025,354$10,045,056
$1,960,417$15,357,668
$46,516$42,806
$304,641$2,392,809
$0$0
$7,856,440$236,582
$2,823,140$1,355,432$1,729,724$1,511,667
$0$0$0$0$0
$1,087,249$0$0
$5,279Educational Funds* $6,292
$2,764,145$319,403
$0$9,490,924 $9,660,947
*District has opted out of General Fund levy
$12,074,151 $2,103,853
$1,060,471

December 2005 Federal Child Count
0Deaf-Blind
7540
109
DeafSpeech/Language
Autism
132Emotionally Disturbed206
30892316
214
Mental RetardationHearing ImpairedLearning DisabledMultiple DisabilitiesOrthopedic ImpairmentVisually Impaired
260
17305
Other Health Impaired
Traumatic Brain InjuryDevelopmental Delay
2,839Total
1
9
115367
91
1,328
686
194
111
17
1
Home
Early Childhood Setting
PT Early Child and SEEarly Childhood SE Setting
Separate SchoolResidential Facility
Regular Classroom
Resource Room
Self-Contained Classroom
Day Program
24 Hour Program
Home/Hospital Program
Special Education Placement Categories
Total 2,839
Student to Staff Ratio 15.4
K-8 13,007.8049-12 5,587.883
13,552.4456,083.984
ADA ADM
Total 18,595.687 19,636.429
Student Data
PK-12 Enrollment 19,569Open Enrolled Students Rec'd 756District Dropout Rate 3.1%
% Special Needs Students 14.5%% Eligible for Free/Red. Lunch 23.8%
Students Transported 6,957
District Attendance RateNumber of Graduates
94.7%1,180
Enrollment
Stanford Achievement Test Series, Tenth Edition (SAT10)
74
70
70
53
64
65
Math
Social Science
Language Arts
Reading
Complete Battery
Science
Stanford Writing Assessment Program, Third Edition
Grade 5
Grade 9
American College Test (ACT)
Grade 5Total
PRSpEd
PR
Number Tested
English
826
70% 0%
53
52
54
31
38
44
Total PR
Sp Ed PR
73
74
66
66
67
68
29
35
30
24
29
28
79
74
71
63
80
73
26
30
26
15
26
23
70% 0%
Grade 4 Grade 3Total
PRSp Ed
PR
Grade 6Total
PRSp Ed
PR
1,380 1,484 1,249219 117 61
Sp EdTotal
Number Tested
Grade 7Total
PRSp Ed
PR
Grade 8 Total
PRSp Ed
PR
Grade 11Total
PRSp Ed
PR
MathReadingScienceComposite Score
22.822.722.3
22.922.8
70 48
65 50
66 50
55 36
62 41
63 44
1,529 240
72 45
66 51
70 49
60 36
61 38
65 44
67 31
67 33
67 33
66 38
64 25
65 30
71 35
66 38
68 38
71 41
65 32
66 35
2161,447 1651,508 1391,491
Percent Proficient or Higher
No assessment data are reported when less than ten students were tested.
Ideas and Development
Sp EdTotal
Organization, Unity, and Coherence
Sp EdTotal
Word Choice
Sp EdTotal
Sentences and Paragraphs
Sp EdTotal
Grammer and Usage
Sp EdTotal
Writing Mechanics
Sp EdTotal
NumberTested
62% 33% 59% 0% 62%
67%
0%
0%
38%
60%
0%
0%
50%
63%
0%
33%
39%
66%
0%
33%
1,385
1,711
3
3

General $1,560,423Capital Outlay $320,222
Pension $32,684Special Education $79,185
Ending Fund Balance
Bond Redemption $0Capital Projects $0
Other Fund Data
Agricultural $4.23Non-Ag Z $5.56Owner Occupied $6.80Other Non-Ag/Utilities $14.59Special Education $1.40
Bond Redemption $0.00Pension Fund $0.00
Capital Outlay $3.00
2005 Payable 2006 Levy per Thousand
$1,415,610$103,766
$0
General AidSpecial EducationExtraordinary Cost Fund - SE
$1,519,376Total State Aid
State Aid
Special Education Federal Flowthrough
$105,394IDEA Part BPart B, Sec. 619, PK $4,175
$109,569Total
K-12 Instruction $1,684,284PK Instruction $0Adult Instruction $0
$327,476$26,179
$0
General Special Education
Expenditures
Community Services $0Non-Programmed $0Debt Service $0Co-Curricular $215,697
$0$0$0$0
Total Expenditures $2,959,436 $494,582
2005 Payable 2006Taxable Valuations
Agricultural $82,142,319Owner Occupied $71,796,810Non-Ag Z $1,543,140Other Non-Ag/Utilities $27,211,292Total $182,693,561
$31,09816.7
14.0%39.8
$31,765Average Teacher SalaryExperience Adjusted SalaryAvg Years of Experience% with Advanced DegreesCertified Instructional Staff
Teaching Staff Data
ADM of Tuitioned Out Paid 0.000
General State Aid Adj. ADM 576.548Non-Public / Home Sch ADM 41.203
ADM Data
Local $1,360,630County $64,673State $1,526,614Federal $154,719Total $3,106,636
$700,288$594
$0$0
$248,875$277
$103,766$111,452
General Capital Outlay Special Education Pension
$700,882 $464,370 $633
Revenue
Classroom Staff 0.0
ADM of Contracted Out Paid 0.000
Other Special Revenue $0
200 Hansina Ave, Volga, SD 57071
2005-2006 Profile of Sioux Valley School District 05-5
Capital Outlay Pension
Student/Staff ServicesAdministration ServicesTransportation ServicesOther Support Services
Enterprise Funds
Cost per ADM
General Fund Only
Revenue Expenditures
* Includes General, Special Education and Pension Funds
Home County: BrookingsArea in Square Miles: 185
2005 K-12 Fall Enrollment: 568
$633$0$0$0
$0$0
$0$0$0
$202,399$320,965
$95,029$441,062
$8,834$1,218
$0$3,566,153
$0$0
$420,249$16,084
$139,779$944$203
$0
$0$0$0$0$0
$12,192$0$0
$5,127Educational Funds* $5,838
$0$0$0
$253,794 $246,786
*District has opted out of General Fund levy
$4,053,980 $12,192
$41,442

December 2005 Federal Child Count
0Deaf-Blind
015
2
DeafSpeech/Language
Autism
1Emotionally Disturbed00
37700
Mental RetardationHearing ImpairedLearning DisabledMultiple DisabilitiesOrthopedic ImpairmentVisually Impaired
3
04
Other Health Impaired
Traumatic Brain InjuryDevelopmental Delay
69Total
0
0
50
00
49
11
1
3
0
0
Home
Early Childhood Setting
PT Early Child and SEEarly Childhood SE Setting
Separate SchoolResidential Facility
Regular Classroom
Resource Room
Self-Contained Classroom
Day Program
24 Hour Program
Home/Hospital Program
Special Education Placement Categories
Total 69
Student to Staff Ratio 14.4
K-8 384.3229-12 167.547
397.066174.792
ADA ADM
Total 551.869 571.858
Student Data
PK-12 Enrollment 572Open Enrolled Students Rec'd 58District Dropout Rate 0.7%
% Special Needs Students 12.1%% Eligible for Free/Red. Lunch 19.2%
Students Transported 215
District Attendance RateNumber of Graduates
96.5%41
Enrollment
Stanford Achievement Test Series, Tenth Edition (SAT10)
69
70
71
52
59
63
Math
Social Science
Language Arts
Reading
Complete Battery
Science
Stanford Writing Assessment Program, Third Edition
Grade 5
Grade 9
American College Test (ACT)
Grade 5Total
PRSpEd
PR
Number Tested
English
38
85%
Total PR
Sp Ed PR
71
66
61
60
61
64
76
69
59
64
75
68
85%
Grade 4 Grade 3Total
PRSp Ed
PR
Grade 6Total
PRSp Ed
PR
46 45 399 3 3
Sp EdTotal
Number Tested
Grade 7Total
PRSp Ed
PR
Grade 8 Total
PRSp Ed
PR
Grade 11Total
PRSp Ed
PR
MathReadingScienceComposite Score
21.722.122.8
22.422.3
80
86
83
63
74
76
33 7
86
73
84
71
67
76
74
80
72
68
74
73
76
72
70
73
70
71
540 446 940
Percent Proficient or Higher
No assessment data are reported when less than ten students were tested.
Ideas and Development
Sp EdTotal
Organization, Unity, and Coherence
Sp EdTotal
Word Choice
Sp EdTotal
Sentences and Paragraphs
Sp EdTotal
Grammer and Usage
Sp EdTotal
Writing Mechanics
Sp EdTotal
NumberTested
54% 59% 51%
81%
46%
72%
54%
87%
41%
83%
39
47

General $1,934,398Capital Outlay $1,746,529
PensionSpecial Education $311,325
Ending Fund Balance
Bond Redemption $0Capital Projects $0
Other Fund Data
Agricultural $3.19Non-Ag Z $4.19Owner Occupied $5.13Other Non-Ag/Utilities $11.00Special Education $1.20
Bond Redemption $0.00Pension Fund $0.00
Capital Outlay $1.55
2005 Payable 2006 Levy per Thousand
$3,578,220$562,102
$0
General AidSpecial EducationExtraordinary Cost Fund - SE
$4,140,322Total State Aid
State Aid
Special Education Federal Flowthrough
$277,813IDEA Part BPart B, Sec. 619, PK $11,873
$289,686Total
K-12 Instruction $5,244,754PK Instruction $0Adult Instruction $0
$805,695$39,184
$0
General Special Education
Expenditures
Community Services $0Non-Programmed $37,926Debt Service $0Co-Curricular $257,110
$0$0$0$0
Total Expenditures $8,652,237 $1,138,111
2005 Payable 2006Taxable Valuations
Agricultural $196,785,877Owner Occupied $65,597,341Non-Ag Z $2,532,319Other Non-Ag/Utilities $38,403,718Total $303,319,255
$33,80117.7
6.7%102.3
$35,142Average Teacher SalaryExperience Adjusted SalaryAvg Years of Experience% with Advanced DegreesCertified Instructional Staff
Teaching Staff Data
ADM of Tuitioned Out Paid 5.584
General State Aid Adj. ADM 1,058.403Non-Public / Home Sch ADM 11.419
ADM Data
Local $2,026,245County $320,256State $3,856,450Federal $1,063,429Total $7,266,379
$514,437$0$0
$24,712
$383,657$0
$562,102$184,940
General Capital Outlay Special Education Pension
$539,149 $1,130,700 $0
Revenue
Classroom Staff 0.0
ADM of Contracted Out Paid 0.000
Other Special Revenue $0
516 8th Ave W, Sisseton, SD 57262-1262
2005-2006 Profile of Sisseton School District 54-2
Capital Outlay Pension
Student/Staff ServicesAdministration ServicesTransportation ServicesOther Support Services
Enterprise Funds
Cost per ADM
General Fund Only
Revenue Expenditures
* Includes General, Special Education and Pension Funds
Home County: RobertsArea in Square Miles: 850
2005 K-12 Fall Enrollment: 1,052
$0$0$0$0
$0$0
$0$0$0
$604,934$606,910$577,236
$1,323,367
$32,662$10,242$58,951
$366,897$0$0$0$0
$282,888$0
$10,344$0
$0$0$0$0$0$0$0$0
$8,245Educational Funds* $9,197
$0$10,010
$2,174,875$519,997 $553,712
$553,984 $0
$85,232
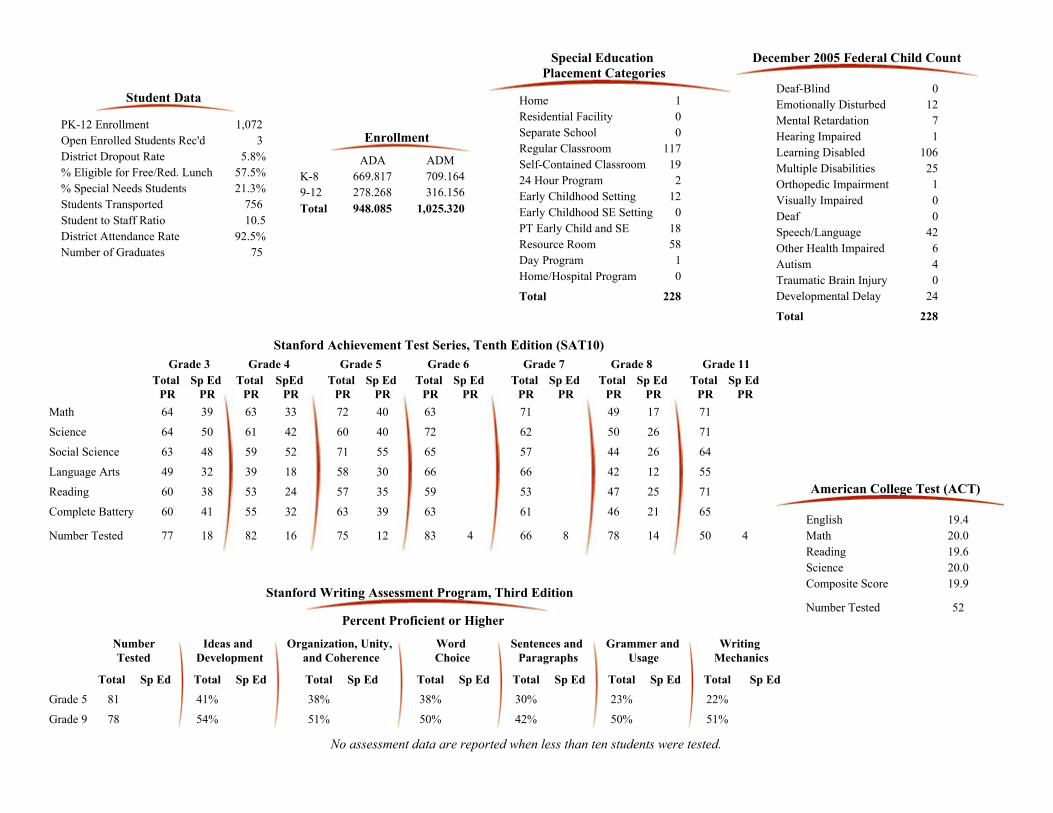
December 2005 Federal Child Count
0Deaf-Blind
042
4
DeafSpeech/Language
Autism
12Emotionally Disturbed71
10625
10
Mental RetardationHearing ImpairedLearning DisabledMultiple DisabilitiesOrthopedic ImpairmentVisually Impaired
6
024
Other Health Impaired
Traumatic Brain InjuryDevelopmental Delay
228Total
1
12
180
00
117
58
19
1
2
0
Home
Early Childhood Setting
PT Early Child and SEEarly Childhood SE Setting
Separate SchoolResidential Facility
Regular Classroom
Resource Room
Self-Contained Classroom
Day Program
24 Hour Program
Home/Hospital Program
Special Education Placement Categories
Total 228
Student to Staff Ratio 10.5
K-8 669.8179-12 278.268
709.164316.156
ADA ADM
Total 948.085 1,025.320
Student Data
PK-12 Enrollment 1,072Open Enrolled Students Rec'd 3District Dropout Rate 5.8%
% Special Needs Students 21.3%% Eligible for Free/Red. Lunch 57.5%
Students Transported 756
District Attendance RateNumber of Graduates
92.5%75
Enrollment
Stanford Achievement Test Series, Tenth Edition (SAT10)
63
61
59
39
53
55
Math
Social Science
Language Arts
Reading
Complete Battery
Science
Stanford Writing Assessment Program, Third Edition
Grade 5
Grade 9
American College Test (ACT)
Grade 5Total
PRSpEd
PR
Number Tested
English
52
51%
33
42
52
18
24
32
Total PR
Sp Ed PR
49
50
44
42
47
46
17
26
26
12
25
21
71
71
64
55
71
65
54%
Grade 4 Grade 3Total
PRSp Ed
PR
Grade 6Total
PRSp Ed
PR
82 78 5016 14 4
Sp EdTotal
Number Tested
Grade 7Total
PRSp Ed
PR
Grade 8 Total
PRSp Ed
PR
Grade 11Total
PRSp Ed
PR
MathReadingScienceComposite Score
19.620.019.4
20.019.9
64 39
64 50
63 48
49 32
60 38
60 41
77 18
72 40
60 40
71 55
58 30
57 35
63 39
63
72
65
66
59
63
71
62
57
66
53
61
1275 483 866
Percent Proficient or Higher
No assessment data are reported when less than ten students were tested.
Ideas and Development
Sp EdTotal
Organization, Unity, and Coherence
Sp EdTotal
Word Choice
Sp EdTotal
Sentences and Paragraphs
Sp EdTotal
Grammer and Usage
Sp EdTotal
Writing Mechanics
Sp EdTotal
NumberTested
41% 38% 38%
50%
30%
42%
23%
50%
22%
51%
81
78

General $63,829Capital Outlay $44,039
Pension $2,007Special Education ($36,062)
Ending Fund Balance
Bond Redemption $0Capital Projects $0
Other Fund Data
Agricultural $3.19Non-Ag Z $4.19Owner Occupied $5.13Other Non-Ag/Utilities $11.00Special Education $1.40
Bond Redemption $0.00Pension Fund $0.30
Capital Outlay $3.00
2005 Payable 2006 Levy per Thousand
$1,157,636$230,785
$77,514
General AidSpecial EducationExtraordinary Cost Fund - SE
$1,465,935Total State Aid
State Aid
Special Education Federal Flowthrough
$63,528IDEA Part BPart B, Sec. 619, PK $3,555
$67,083Total
K-12 Instruction $1,423,315PK Instruction $39,501Adult Instruction $0
$404,729$0$0
General Special Education
Expenditures
Community Services $0Non-Programmed $0Debt Service $0Co-Curricular $77,948
$0$0$0$0
Total Expenditures $2,564,656 $487,102
2005 Payable 2006Taxable Valuations
Agricultural $2,891,478Owner Occupied $122,250Non-Ag Z $85,325Other Non-Ag/Utilities $358,348Total $3,457,401
$35,2098.3
6.9%25.1
$30,698Average Teacher SalaryExperience Adjusted SalaryAvg Years of Experience% with Advanced DegreesCertified Instructional Staff
Teaching Staff Data
ADM of Tuitioned Out Paid 4.253
General State Aid Adj. ADM 273.048Non-Public / Home Sch ADM 0.000
ADM Data
Local $93,810County $1,678State $1,179,345Federal $634,328Total $1,909,161
$16,786$0$0
$29,159
$6,398$0
$308,299$156,960
General Capital Outlay Special Education Pension
$45,945 $471,657 $1,360
Revenue
Classroom Staff 0.0
ADM of Contracted Out Paid 0.000
Other Special Revenue $0
12250 SD Highway 1806, Wakpala, SD 57658
2005-2006 Profile of Smee School District 15-3
Capital Outlay Pension
Student/Staff ServicesAdministration ServicesTransportation ServicesOther Support Services
Enterprise Funds
Cost per ADM
General Fund Only
Revenue Expenditures
* Includes General, Special Education and Pension Funds
Home County: CorsonArea in Square Miles: 200
2005 K-12 Fall Enrollment: 236
$1,360$0$0$0
$0$0
$35,616$1,893
$0$196,388$241,500$172,980$413,024
$0$0
$153,477$22,074
$0$0$0$0
$78,439$0
$3,934$0
$6,682$8,046$3,213$7,547
$0$0$0
$2,111
$11,065Educational Funds* $12,509
$0$0
$1,046,594$180,823 $292,179
$178,607 $65,108
$3,056

December 2005 Federal Child Count
0Deaf-Blind
024
0
DeafSpeech/Language
Autism
0Emotionally Disturbed30
33400
Mental RetardationHearing ImpairedLearning DisabledMultiple DisabilitiesOrthopedic ImpairmentVisually Impaired
4
00
Other Health Impaired
Traumatic Brain InjuryDevelopmental Delay
68Total
0
4
00
00
59
1
0
0
3
1
Home
Early Childhood Setting
PT Early Child and SEEarly Childhood SE Setting
Separate SchoolResidential Facility
Regular Classroom
Resource Room
Self-Contained Classroom
Day Program
24 Hour Program
Home/Hospital Program
Special Education Placement Categories
Total 68
Student to Staff Ratio 10.0
K-8 141.6959-12 59.472
155.91272.044
ADA ADM
Total 201.167 227.956
Student Data
PK-12 Enrollment 251Open Enrolled Students Rec'd 114District Dropout Rate 17.3%
% Special Needs Students 27.1%% Eligible for Free/Red. Lunch 100.0%
Students Transported 240
District Attendance RateNumber of Graduates
88.2%12
Enrollment
Stanford Achievement Test Series, Tenth Edition (SAT10)
48
46
45
32
46
45
Math
Social Science
Language Arts
Reading
Complete Battery
Science
Stanford Writing Assessment Program, Third Edition
Grade 5
Grade 9
American College Test (ACT)
Grade 5Total
PRSpEd
PR
Number Tested
English
11
11%
Total PR
Sp Ed PR
21
30
30
13
19
19
29
28
17
7
24
12
17%
Grade 4 Grade 3Total
PRSp Ed
PR
Grade 6Total
PRSp Ed
PR
22 21 168 3 3
Sp EdTotal
Number Tested
Grade 7Total
PRSp Ed
PR
Grade 8 Total
PRSp Ed
PR
Grade 11Total
PRSp Ed
PR
MathReadingScienceComposite Score
16.415.114.2
15.515.5
40
29
36
35
38
37
21 7
34
27
46
25
30
27
36
26
41
42
23
33
40
39
39
32
27
35
213 414 316
Percent Proficient or Higher
No assessment data are reported when less than ten students were tested.
Ideas and Development
Sp EdTotal
Organization, Unity, and Coherence
Sp EdTotal
Word Choice
Sp EdTotal
Sentences and Paragraphs
Sp EdTotal
Grammer and Usage
Sp EdTotal
Writing Mechanics
Sp EdTotal
NumberTested
18% 9% 18%
17%
0%
22%
27%
11%
9%
33%
11
18

General $193,735Capital Outlay $92,864
PensionSpecial Education ($10,809)
Ending Fund Balance
Bond Redemption $0Capital Projects $1,892
Other Fund Data
Agricultural $5.07Non-Ag Z $6.66Owner Occupied $8.16Other Non-Ag/Utilities $17.48Special Education $1.34
Bond Redemption $0.00Pension Fund $0.00
Capital Outlay $1.92
2005 Payable 2006 Levy per Thousand
$411,471$47,548$40,883
General AidSpecial EducationExtraordinary Cost Fund - SE
$499,902Total State Aid
State Aid
Special Education Federal Flowthrough
$22,643IDEA Part BPart B, Sec. 619, PK $1,517
$24,160Total
K-12 Instruction $473,788PK Instruction $0Adult Instruction $0
$123,766$4,998
$0
General Special Education
Expenditures
Community Services $0Non-Programmed $0Debt Service $0Co-Curricular $37,110
$0$0$0$0
Total Expenditures $767,479 $164,501
2005 Payable 2006Taxable Valuations
Agricultural $31,746,801Owner Occupied $6,241,789Non-Ag Z $115,944Other Non-Ag/Utilities $2,112,442Total $40,216,976
$30,8999.2
15.4%12.2
$27,445Average Teacher SalaryExperience Adjusted SalaryAvg Years of Experience% with Advanced DegreesCertified Instructional Staff
Teaching Staff Data
ADM of Tuitioned Out Paid 1.314
General State Aid Adj. ADM 132.884Non-Public / Home Sch ADM 2.000
ADM Data
Local $309,116County $9,189State $433,978Federal $50,868Total $803,151
$62,803$0$0$0
$49,446$0
$88,431$22,366
General Capital Outlay Special Education Pension
$62,803 $160,243 $0
Revenue
Classroom Staff 0.0
ADM of Contracted Out Paid 0.000
Other Special Revenue $0
203 S School St, South Shore, SD 57263
2005-2006 Profile of South Shore School District 14-3
Capital Outlay Pension
Student/Staff ServicesAdministration ServicesTransportation ServicesOther Support Services
Enterprise Funds
Cost per ADM
General Fund Only
Revenue Expenditures
* Includes General, Special Education and Pension Funds
Home County: CodingtonArea in Square Miles: 140
2005 K-12 Fall Enrollment: 110
$0$0$0$0
$0$0
$0$0$0
$6,456$71,837$49,933
$128,355
$894$0
$59,265$38,461
$0$0$0
$3,507
$35,305$432
$0$0
$0$0$0$0$0$0$0$0
$7,014Educational Funds* $8,162
$0$12,500
$0$41,579 $48,497
*District has opted out of General Fund levy
$122,896 $0
$20,769

December 2005 Federal Child Count
0Deaf-Blind
15
0
DeafSpeech/Language
Autism
2Emotionally Disturbed109100
Mental RetardationHearing ImpairedLearning DisabledMultiple DisabilitiesOrthopedic ImpairmentVisually Impaired
2
00
Other Health Impaired
Traumatic Brain InjuryDevelopmental Delay
21Total
0
0
00
00
21
0
0
0
0
0
Home
Early Childhood Setting
PT Early Child and SEEarly Childhood SE Setting
Separate SchoolResidential Facility
Regular Classroom
Resource Room
Self-Contained Classroom
Day Program
24 Hour Program
Home/Hospital Program
Special Education Placement Categories
Total 21
Student to Staff Ratio 9.1
K-8 70.4539-12 34.286
72.27536.175
ADA ADM
Total 104.739 108.450
Student Data
PK-12 Enrollment 111Open Enrolled Students Rec'd 16District Dropout Rate 3.2%
% Special Needs Students 18.9%% Eligible for Free/Red. Lunch 37.1%
Students Transported 46
District Attendance RateNumber of Graduates
96.6%11
Enrollment
Stanford Achievement Test Series, Tenth Edition (SAT10)
59
81
74
71
74
70
Math
Social Science
Language Arts
Reading
Complete Battery
Science
Stanford Writing Assessment Program, Third Edition
Grade 5
Grade 9
American College Test (ACT)
Grade 5Total
PRSpEd
PR
Number Tested
English
5
91%
Total PR
Sp Ed PR
63
52
66
57
59
59
36
59
56
51
60
52
100%
Grade 4 Grade 3Total
PRSp Ed
PR
Grade 6Total
PRSp Ed
PR
8 10 71 3 1
Sp EdTotal
Number Tested
Grade 7Total
PRSp Ed
PR
Grade 8 Total
PRSp Ed
PR
Grade 11Total
PRSp Ed
PR
MathReadingScienceComposite Score
51
54
62
42
49
50
9 2
75
81
77
49
59
69
74
57
67
57
46
60
74
49
51
63
54
59
16 311 26
Percent Proficient or Higher
No assessment data are reported when less than ten students were tested.
Ideas and Development
Sp EdTotal
Organization, Unity, and Coherence
Sp EdTotal
Word Choice
Sp EdTotal
Sentences and Paragraphs
Sp EdTotal
Grammer and Usage
Sp EdTotal
Writing Mechanics
Sp EdTotal
NumberTested
33% 17% 33%
91%
33%
82%
50%
100%
50%
100%
6
11

General $2,989,727Capital Outlay $1,166,681
Pension $343,980Special Education $378,384
Ending Fund Balance
Bond Redemption $637,313Capital Projects $0
Other Fund Data
Agricultural $3.19Non-Ag Z $4.19Owner Occupied $5.13Other Non-Ag/Utilities $11.00Special Education $1.40
Bond Redemption $1.10Pension Fund $0.30
Capital Outlay $3.00
2005 Payable 2006 Levy per Thousand
$3,406,126$368,200
$0
General AidSpecial EducationExtraordinary Cost Fund - SE
$3,774,326Total State Aid
State Aid
Special Education Federal Flowthrough
$365,788IDEA Part BPart B, Sec. 619, PK $18,990
$384,778Total
K-12 Instruction $5,868,612PK Instruction $0Adult Instruction $0
$979,470$208,017
$0
General Special Education
Expenditures
Community Services $6,020Non-Programmed $198,719Debt Service $0Co-Curricular $410,995
$0$0$0$0
Total Expenditures $9,652,939 $1,592,592
2005 Payable 2006Taxable Valuations
Agricultural $15,694,011Owner Occupied $423,116,703Non-Ag Z $5,211,801Other Non-Ag/Utilities $259,137,416Total $703,159,931
$38,17815.1
30.4%122.6
$38,443Average Teacher SalaryExperience Adjusted SalaryAvg Years of Experience% with Advanced DegreesCertified Instructional Staff
Teaching Staff Data
ADM of Tuitioned Out Paid 0.200
General State Aid Adj. ADM 1,939.340Non-Public / Home Sch ADM 77.273
ADM Data
Local $5,371,684County $347,869State $3,840,879Federal $620,947Total $10,181,379
$2,034,579$0$0$0
$926,328$0
$368,200$374,582
General Capital Outlay Special Education Pension
$2,034,579 $1,669,110 $257,712
Revenue
Classroom Staff 0.0
ADM of Contracted Out Paid 0.000
Other Special Revenue $0
525 E Illinois, Spearfish, SD 57783
2005-2006 Profile of Spearfish School District 40-2
Capital Outlay Pension
Student/Staff ServicesAdministration ServicesTransportation ServicesOther Support Services
Enterprise Funds
Cost per ADM
General Fund Only
Revenue Expenditures
* Includes General, Special Education and Pension Funds
Home County: LawrenceArea in Square Miles: 285
2005 K-12 Fall Enrollment: 1,953
$257,712$0$0$0
$0$0
$0$0$0
$742,423$865,624$199,595
$1,360,949
$273,453$0$0
$1,808,605$0$0
$93,292$45,941
$381,942$0
$20,163$3,000
$0$0$0$0$0
$20,697$0$0
$4,975Educational Funds* $5,691
$814,433$0$0
$569,795 $506,429
$2,439,655 $20,697
$218,365

December 2005 Federal Child Count
0Deaf-Blind
066
2
DeafSpeech/Language
Autism
8Emotionally Disturbed14
0116
651
Mental RetardationHearing ImpairedLearning DisabledMultiple DisabilitiesOrthopedic ImpairmentVisually Impaired
7
135
Other Health Impaired
Traumatic Brain InjuryDevelopmental Delay
261Total
1
2
438
01
183
26
5
0
0
1
Home
Early Childhood Setting
PT Early Child and SEEarly Childhood SE Setting
Separate SchoolResidential Facility
Regular Classroom
Resource Room
Self-Contained Classroom
Day Program
24 Hour Program
Home/Hospital Program
Special Education Placement Categories
Total 261
Student to Staff Ratio 16.2
K-8 1,243.5169-12 595.717
1,301.032638.108
ADA ADM
Total 1,839.233 1,939.140
Student Data
PK-12 Enrollment 1,989Open Enrolled Students Rec'd 43District Dropout Rate 1.4%
% Special Needs Students 13.1%% Eligible for Free/Red. Lunch 24.3%
Students Transported 605
District Attendance RateNumber of Graduates
94.8%126
Enrollment
Stanford Achievement Test Series, Tenth Edition (SAT10)
78
75
76
61
75
73
Math
Social Science
Language Arts
Reading
Complete Battery
Science
Stanford Writing Assessment Program, Third Edition
Grade 5
Grade 9
American College Test (ACT)
Grade 5Total
PRSpEd
PR
Number Tested
English
95
69%
47
62
61
39
50
50
Total PR
Sp Ed PR
72
77
71
70
71
71
36
54
31
33
39
38
85
78
74
57
83
74
69%
Grade 4 Grade 3Total
PRSp Ed
PR
Grade 6Total
PRSp Ed
PR
167 169 16615 15 9
Sp EdTotal
Number Tested
Grade 7Total
PRSp Ed
PR
Grade 8 Total
PRSp Ed
PR
Grade 11Total
PRSp Ed
PR
MathReadingScienceComposite Score
22.922.222.1
23.022.7
76 57
65 64
66 51
59 34
63 46
66 50
137 17
84
74
77
68
73
76
76
66
66
65
69
69
73 40
69 41
60 34
70 25
62 28
66 34
6138 9152 17148
Percent Proficient or Higher
No assessment data are reported when less than ten students were tested.
Ideas and Development
Sp EdTotal
Organization, Unity, and Coherence
Sp EdTotal
Word Choice
Sp EdTotal
Sentences and Paragraphs
Sp EdTotal
Grammer and Usage
Sp EdTotal
Writing Mechanics
Sp EdTotal
NumberTested
78% 75% 83%
62%
41%
66%
58%
66%
41%
70%
133
162

General $268,674Capital Outlay $62,724
Pension $12,444Special Education $376,547
Ending Fund Balance
Bond Redemption $0Capital Projects $0
Other Fund Data
Agricultural $3.19Non-Ag Z $4.19Owner Occupied $5.13Other Non-Ag/Utilities $11.00Special Education $1.25
Bond Redemption $0.00Pension Fund $0.30
Capital Outlay $1.23
2005 Payable 2006 Levy per Thousand
$1,114,922$0$0
General AidSpecial EducationExtraordinary Cost Fund - SE
$1,114,922Total State Aid
State Aid
Special Education Federal Flowthrough
$104,967IDEA Part BPart B, Sec. 619, PK $3,206
$108,173Total
K-12 Instruction $1,750,754PK Instruction $0Adult Instruction $0
$265,662$0$0
General Special Education
Expenditures
Community Services $0Non-Programmed $0Debt Service $0Co-Curricular $187,395
$0$0$0$0
Total Expenditures $3,196,823 $334,224
2005 Payable 2006Taxable Valuations
Agricultural $152,045,712Owner Occupied $72,151,972Non-Ag Z $279,247Other Non-Ag/Utilities $42,765,811Total $267,242,742
$31,86916.5
23.1%39.0
$33,213Average Teacher SalaryExperience Adjusted SalaryAvg Years of Experience% with Advanced DegreesCertified Instructional Staff
Teaching Staff Data
ADM of Tuitioned Out Paid 3.225
General State Aid Adj. ADM 528.442Non-Public / Home Sch ADM 5.995
ADM Data
Local $1,396,624County $59,122State $1,164,769Federal $318,700Total $2,939,214
$315,808$0$0
$2,293
$334,615$0$0
$99,637
General Capital Outlay Special Education Pension
$318,101 $434,252 $78,152
Revenue
Classroom Staff 0.0
ADM of Contracted Out Paid 0.000
Other Special Revenue $0
3 East 2nd Avenue, Fort Pierre, SD 57532
2005-2006 Profile of Stanley County School District 57-1
Capital Outlay Pension
Student/Staff ServicesAdministration ServicesTransportation ServicesOther Support Services
Enterprise Funds
Cost per ADM
General Fund Only
Revenue Expenditures
* Includes General, Special Education and Pension Funds
Home County: StanleyArea in Square Miles: 1,516
2005 K-12 Fall Enrollment: 532
$78,152$0$0$0
$0$0
$28,176$0$0
$243,290$431,826
$51,066$532,492
$12,492$21,100
$0$104,311
$0$0
$99,088$2,913
$55,289$13,273
$0$0
$8,473$13,276
$0$11,005
$0$17,709
$0$0
$6,228Educational Funds* $7,005
$0$0
$539,417$216,468 $265,231
$321,950 $78,638
$82,046

December 2005 Federal Child Count
0Deaf-Blind
113
3
DeafSpeech/Language
Autism
0Emotionally Disturbed31
22200
Mental RetardationHearing ImpairedLearning DisabledMultiple DisabilitiesOrthopedic ImpairmentVisually Impaired
9
16
Other Health Impaired
Traumatic Brain InjuryDevelopmental Delay
61Total
0
0
51
00
42
11
1
0
1
0
Home
Early Childhood Setting
PT Early Child and SEEarly Childhood SE Setting
Separate SchoolResidential Facility
Regular Classroom
Resource Room
Self-Contained Classroom
Day Program
24 Hour Program
Home/Hospital Program
Special Education Placement Categories
Total 61
Student to Staff Ratio 13.6
K-8 330.1329-12 155.272
340.887170.715
ADA ADM
Total 485.404 511.602
Student Data
PK-12 Enrollment 532Open Enrolled Students Rec'd 13District Dropout Rate 2.1%
% Special Needs Students 11.5%% Eligible for Free/Red. Lunch 16.6%
Students Transported 0
District Attendance RateNumber of Graduates
94.9%34
Enrollment
Stanford Achievement Test Series, Tenth Edition (SAT10)
67
70
69
45
53
58
Math
Social Science
Language Arts
Reading
Complete Battery
Science
Stanford Writing Assessment Program, Third Edition
Grade 5
Grade 9
American College Test (ACT)
Grade 5Total
PRSpEd
PR
Number Tested
English
15
87%
Total PR
Sp Ed PR
71
69
62
58
64
63
63
61
54
45
62
57
69%
Grade 4 Grade 3Total
PRSp Ed
PR
Grade 6Total
PRSp Ed
PR
38 43 403 3 3
Sp EdTotal
Number Tested
Grade 7Total
PRSp Ed
PR
Grade 8 Total
PRSp Ed
PR
Grade 11Total
PRSp Ed
PR
MathReadingScienceComposite Score
22.119.619.9
22.321.1
79
65
79
69
74
69
28 4
61
61
76
53
52
59
82
65
66
61
59
67
66
61
64
66
61
63
436 443 348
Percent Proficient or Higher
No assessment data are reported when less than ten students were tested.
Ideas and Development
Sp EdTotal
Organization, Unity, and Coherence
Sp EdTotal
Word Choice
Sp EdTotal
Sentences and Paragraphs
Sp EdTotal
Grammer and Usage
Sp EdTotal
Writing Mechanics
Sp EdTotal
NumberTested
46% 33% 41%
71%
27%
69%
21%
73%
23%
80%
39
45

General $328,088Capital Outlay $621,498
Pension $55,510Special Education $84,831
Ending Fund Balance
Bond Redemption $0Capital Projects $0
Other Fund Data
Agricultural $3.19Non-Ag Z $4.19Owner Occupied $5.13Other Non-Ag/Utilities $11.00Special Education $1.40
Bond Redemption $0.00Pension Fund $0.30
Capital Outlay $2.25
2005 Payable 2006 Levy per Thousand
$455,502$0$0
General AidSpecial EducationExtraordinary Cost Fund - SE
$455,502Total State Aid
State Aid
Special Education Federal Flowthrough
$26,372IDEA Part BPart B, Sec. 619, PK $0
$26,372Total
K-12 Instruction $602,702PK Instruction $5,500Adult Instruction $0
$68,973$0$0
General Special Education
Expenditures
Community Services $99,261Non-Programmed $0Debt Service $0Co-Curricular $107,676
$0$0$0$0
Total Expenditures $1,204,673 $116,755
2005 Payable 2006Taxable Valuations
Agricultural $73,904,866Owner Occupied $7,515,890Non-Ag Z $367,528Other Non-Ag/Utilities $3,345,364Total $85,133,648
$29,12421.1
5.3%15.9
$30,908Average Teacher SalaryExperience Adjusted SalaryAvg Years of Experience% with Advanced DegreesCertified Instructional Staff
Teaching Staff Data
ADM of Tuitioned Out Paid 0.000
General State Aid Adj. ADM 168.204Non-Public / Home Sch ADM 8.000
ADM Data
Local $402,081County $10,852State $477,533Federal $175,690Total $1,066,156
$203,989$0$0
$12,935
$114,093$0$0
$25,415
General Capital Outlay Special Education Pension
$216,924 $139,508 $24,751
Revenue
Classroom Staff 0.0
ADM of Contracted Out Paid 0.000
Other Special Revenue $0
506 E Main, Stickney, SD 57375
2005-2006 Profile of Stickney School District 01-2
Capital Outlay Pension
Student/Staff ServicesAdministration ServicesTransportation ServicesOther Support Services
Enterprise Funds
Cost per ADM
General Fund Only
Revenue Expenditures
* Includes General, Special Education and Pension Funds
Home County: AuroraArea in Square Miles: 189
2005 K-12 Fall Enrollment: 143
$24,751$0$0$0
$0$0
$0$0$0
$60,081$126,227
$37,696$165,530
$0$0$0
$8,525$0$0$0
$8,791
$47,782$0$0$0
$0$0$0$0$0$0$0$0
$7,840Educational Funds* $8,673
$0$0$0
$61,843 $70,088
$35,711 $0
$18,396

December 2005 Federal Child Count
0Deaf-Blind
01
0
DeafSpeech/Language
Autism
0Emotionally Disturbed005100
Mental RetardationHearing ImpairedLearning DisabledMultiple DisabilitiesOrthopedic ImpairmentVisually Impaired
4
00
Other Health Impaired
Traumatic Brain InjuryDevelopmental Delay
11Total
0
0
10
00
7
3
0
0
0
0
Home
Early Childhood Setting
PT Early Child and SEEarly Childhood SE Setting
Separate SchoolResidential Facility
Regular Classroom
Resource Room
Self-Contained Classroom
Day Program
24 Hour Program
Home/Hospital Program
Special Education Placement Categories
Total 11
Student to Staff Ratio 9.1
K-8 86.4219-12 45.295
88.84147.133
ADA ADM
Total 131.716 135.974
Student Data
PK-12 Enrollment 144Open Enrolled Students Rec'd 2District Dropout Rate 0.0%
% Special Needs Students 7.6%% Eligible for Free/Red. Lunch 57.8%
Students Transported 54
District Attendance RateNumber of Graduates
96.9%12
Enrollment
Stanford Achievement Test Series, Tenth Edition (SAT10)
90
84
82
71
84
83
Math
Social Science
Language Arts
Reading
Complete Battery
Science
Stanford Writing Assessment Program, Third Edition
Grade 5
Grade 9
American College Test (ACT)
Grade 5Total
PRSpEd
PR
Number Tested
English
12
89% 100%
Total PR
Sp Ed PR
82
80
76
66
64
73
88
85
76
56
74
76
78% 0%
Grade 4 Grade 3Total
PRSp Ed
PR
Grade 6Total
PRSp Ed
PR
15 14 13 1
Sp EdTotal
Number Tested
Grade 7Total
PRSp Ed
PR
Grade 8 Total
PRSp Ed
PR
Grade 11Total
PRSp Ed
PR
MathReadingScienceComposite Score
24.924.424.3
22.624.2
89
82
75
48
62
73
9
81
82
86
74
69
77
92
87
81
76
80
84
86
76
74
85
70
77
10 8 12
Percent Proficient or Higher
No assessment data are reported when less than ten students were tested.
Ideas and Development
Sp EdTotal
Organization, Unity, and Coherence
Sp EdTotal
Word Choice
Sp EdTotal
Sentences and Paragraphs
Sp EdTotal
Grammer and Usage
Sp EdTotal
Writing Mechanics
Sp EdTotal
NumberTested
90% 40% 70%
78% 0%
20%
89% 0%
60%
78% 0%
50%
78% 0%
10
9 1

General $180,791Capital Outlay $99,308
PensionSpecial Education $13,985
Ending Fund Balance
Bond Redemption $0Capital Projects $0
Other Fund Data
Agricultural $3.19Non-Ag Z $4.19Owner Occupied $5.13Other Non-Ag/Utilities $11.00Special Education $1.40
Bond Redemption $0.00Pension Fund $0.00
Capital Outlay $2.15
2005 Payable 2006 Levy per Thousand
$464,621$8,017
$0
General AidSpecial EducationExtraordinary Cost Fund - SE
$472,638Total State Aid
State Aid
Special Education Federal Flowthrough
$29,211IDEA Part BPart B, Sec. 619, PK $1,530
$30,741Total
K-12 Instruction $491,872PK Instruction $0Adult Instruction $227
$70,327$5,234
$0
General Special Education
Expenditures
Community Services $0Non-Programmed $0Debt Service $0Co-Curricular $55,705
$0$0$0$0
Total Expenditures $885,367 $113,330
2005 Payable 2006Taxable Valuations
Agricultural $32,640,186Owner Occupied $3,692,542Non-Ag Z $22,958Other Non-Ag/Utilities $1,744,783Total $38,100,469
$28,99810.8
7.1%12.4
$26,365Average Teacher SalaryExperience Adjusted SalaryAvg Years of Experience% with Advanced DegreesCertified Instructional Staff
Teaching Staff Data
ADM of Tuitioned Out Paid 0.300
General State Aid Adj. ADM 151.838Non-Public / Home Sch ADM 0.000
ADM Data
Local $206,570County $17,189State $480,786Federal $83,829Total $788,375
$75,546$0$0$0
$51,138$0
$8,017$30,134
General Capital Outlay Special Education Pension
$75,546 $89,290 $0
Revenue
Classroom Staff 0.0
ADM of Contracted Out Paid 0.000
Other Special Revenue $0
400 Sherman Ave, Summit, SD 57266
2005-2006 Profile of Summit School District 54-6
Capital Outlay Pension
Student/Staff ServicesAdministration ServicesTransportation ServicesOther Support Services
Enterprise Funds
Cost per ADM
General Fund Only
Revenue Expenditures
* Includes General, Special Education and Pension Funds
Home County: RobertsArea in Square Miles: 156
2005 K-12 Fall Enrollment: 124
$0$0$0$0
$0$0
$0$0$0
$31,215$123,058
$52,534$130,757
$0$0
$3,034$21,015
$0$0$0
$2,952
$37,769$0$0$0
$0$0$0$0$0$0$0$0
$7,012Educational Funds* $7,868
$0$0
$31,872$62,994 $61,931
$35,124 $0
$8,124

December 2005 Federal Child Count
0Deaf-Blind
05
0
DeafSpeech/Language
Autism
0Emotionally Disturbed00
15000
Mental RetardationHearing ImpairedLearning DisabledMultiple DisabilitiesOrthopedic ImpairmentVisually Impaired
3
04
Other Health Impaired
Traumatic Brain InjuryDevelopmental Delay
27Total
1
0
10
00
24
1
0
0
0
0
Home
Early Childhood Setting
PT Early Child and SEEarly Childhood SE Setting
Separate SchoolResidential Facility
Regular Classroom
Resource Room
Self-Contained Classroom
Day Program
24 Hour Program
Home/Hospital Program
Special Education Placement Categories
Total 27
Student to Staff Ratio 10.8
K-8 84.6889-12 37.948
86.84839.384
ADA ADM
Total 122.636 126.232
Student Data
PK-12 Enrollment 134Open Enrolled Students Rec'd 13District Dropout Rate 0.0%
% Special Needs Students 20.1%% Eligible for Free/Red. Lunch 53.7%
Students Transported 58
District Attendance RateNumber of Graduates
97.2%13
Enrollment
Stanford Achievement Test Series, Tenth Edition (SAT10)
86
77
81
71
71
76
Math
Social Science
Language Arts
Reading
Complete Battery
Science
Stanford Writing Assessment Program, Third Edition
Grade 5
Grade 9
American College Test (ACT)
Grade 5Total
PRSpEd
PR
Number Tested
English
9
100%
Total PR
Sp Ed PR
66
60
58
59
52
59
45
52
54
42
50
47
100%
Grade 4 Grade 3Total
PRSp Ed
PR
Grade 6Total
PRSp Ed
PR
6 13 91 4 3
Sp EdTotal
Number Tested
Grade 7Total
PRSp Ed
PR
Grade 8 Total
PRSp Ed
PR
Grade 11Total
PRSp Ed
PR
MathReadingScienceComposite Score
64
41
58
40
48
51
12 1
86
65
78
56
61
71
79
53
59
63
51
63
70
48
63
71
59
62
13 210 310
Percent Proficient or Higher
No assessment data are reported when less than ten students were tested.
Ideas and Development
Sp EdTotal
Organization, Unity, and Coherence
Sp EdTotal
Word Choice
Sp EdTotal
Sentences and Paragraphs
Sp EdTotal
Grammer and Usage
Sp EdTotal
Writing Mechanics
Sp EdTotal
NumberTested
67% 42% 67%
100%
68%
100%
50%
100%
50%
83%
12
6
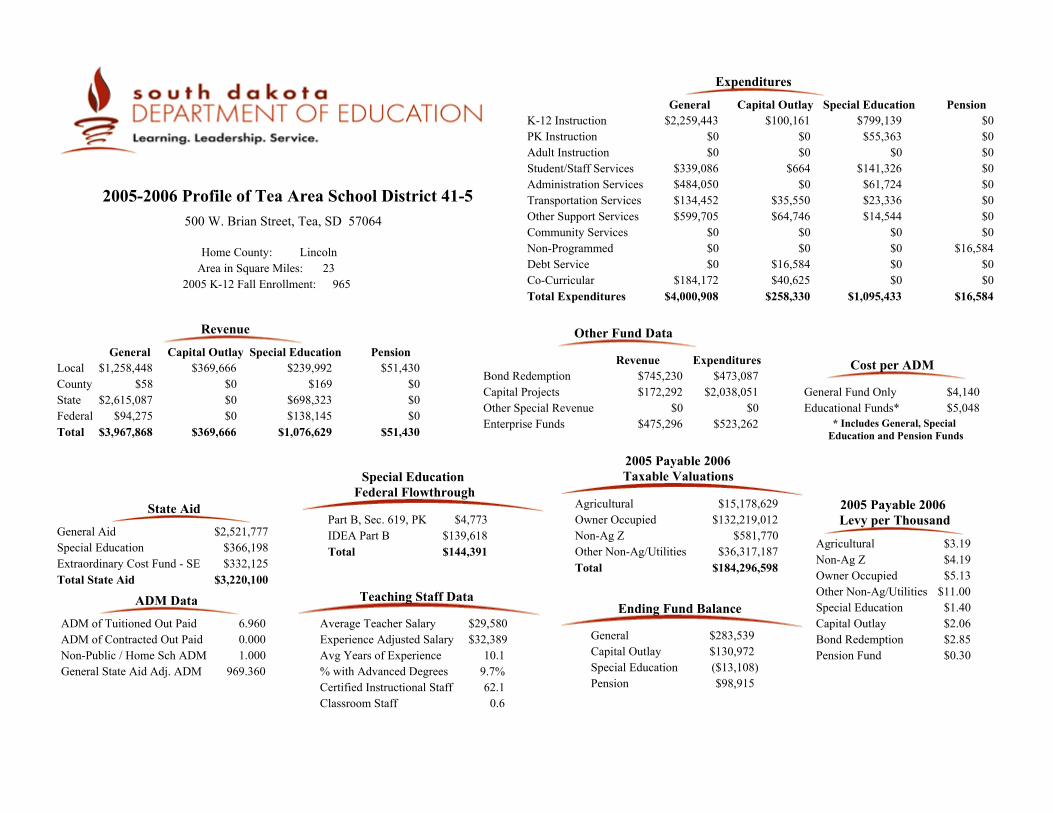
General $283,539Capital Outlay $130,972
Pension $98,915Special Education ($13,108)
Ending Fund Balance
Bond Redemption $473,087Capital Projects $2,038,051
Other Fund Data
Agricultural $3.19Non-Ag Z $4.19Owner Occupied $5.13Other Non-Ag/Utilities $11.00Special Education $1.40
Bond Redemption $2.85Pension Fund $0.30
Capital Outlay $2.06
2005 Payable 2006 Levy per Thousand
$2,521,777$366,198$332,125
General AidSpecial EducationExtraordinary Cost Fund - SE
$3,220,100Total State Aid
State Aid
Special Education Federal Flowthrough
$139,618IDEA Part BPart B, Sec. 619, PK $4,773
$144,391Total
K-12 Instruction $2,259,443PK Instruction $0Adult Instruction $0
$799,139$55,363
$0
General Special Education
Expenditures
Community Services $0Non-Programmed $0Debt Service $0Co-Curricular $184,172
$0$0$0$0
Total Expenditures $4,000,908 $1,095,433
2005 Payable 2006Taxable Valuations
Agricultural $15,178,629Owner Occupied $132,219,012Non-Ag Z $581,770Other Non-Ag/Utilities $36,317,187Total $184,296,598
$32,38910.1
9.7%62.1
$29,580Average Teacher SalaryExperience Adjusted SalaryAvg Years of Experience% with Advanced DegreesCertified Instructional Staff
Teaching Staff Data
ADM of Tuitioned Out Paid 6.960
General State Aid Adj. ADM 969.360Non-Public / Home Sch ADM 1.000
ADM Data
Local $1,258,448County $58State $2,615,087Federal $94,275Total $3,967,868
$369,666$0$0$0
$239,992$169
$698,323$138,145
General Capital Outlay Special Education Pension
$369,666 $1,076,629 $51,430
Revenue
Classroom Staff 0.6
ADM of Contracted Out Paid 0.000
Other Special Revenue $0
500 W. Brian Street, Tea, SD 57064
2005-2006 Profile of Tea Area School District 41-5
Capital Outlay Pension
Student/Staff ServicesAdministration ServicesTransportation ServicesOther Support Services
Enterprise Funds
Cost per ADM
General Fund Only
Revenue Expenditures
* Includes General, Special Education and Pension Funds
Home County: LincolnArea in Square Miles: 23
2005 K-12 Fall Enrollment: 965
$51,430$0$0$0
$0$0
$0$0$0
$339,086$484,050$134,452$599,705
$664$0
$35,550$64,746
$0$0
$16,584$40,625
$141,326$61,724$23,336$14,544
$0$0$0$0$0
$16,584$0$0
$4,140Educational Funds* $5,048
$745,230$172,292
$0$475,296 $523,262
$258,330 $16,584
$100,161

December 2005 Federal Child Count
0Deaf-Blind
070
4
DeafSpeech/Language
Autism
7Emotionally Disturbed33
42520
Mental RetardationHearing ImpairedLearning DisabledMultiple DisabilitiesOrthopedic ImpairmentVisually Impaired
10
04
Other Health Impaired
Traumatic Brain InjuryDevelopmental Delay
150Total
0
1
621
00
109
7
1
5
0
0
Home
Early Childhood Setting
PT Early Child and SEEarly Childhood SE Setting
Separate SchoolResidential Facility
Regular Classroom
Resource Room
Self-Contained Classroom
Day Program
24 Hour Program
Home/Hospital Program
Special Education Placement Categories
Total 150
Student to Staff Ratio 15.7
K-8 747.8029-12 176.025
776.345186.055
ADA ADM
Total 923.827 962.400
Student Data
PK-12 Enrollment 982Open Enrolled Students Rec'd 177District Dropout Rate 0.8%
% Special Needs Students 15.3%% Eligible for Free/Red. Lunch 17.5%
Students Transported 382
District Attendance RateNumber of Graduates
96.0%19
Enrollment
Stanford Achievement Test Series, Tenth Edition (SAT10)
69
81
75
54
63
67
Math
Social Science
Language Arts
Reading
Complete Battery
Science
Stanford Writing Assessment Program, Third Edition
Grade 5
Grade 9
American College Test (ACT)
Grade 5Total
PRSpEd
PR
Number Tested
English
51%
Total PR
Sp Ed PR
57
62
58
57
56
56
64
69
61
53
70
63
49%
Grade 4 Grade 3Total
PRSp Ed
PR
Grade 6Total
PRSp Ed
PR
93 66 416 8 2
Sp EdTotal
Number Tested
Grade 7Total
PRSp Ed
PR
Grade 8 Total
PRSp Ed
PR
Grade 11Total
PRSp Ed
PR
MathReadingScienceComposite Score
49 42
54 54
54 48
45 34
49 37
49 42
86 18
61
70
71
56
60
61
66
67
57
58
50
58
62
61
59
70
63
62
886 668 989
Percent Proficient or Higher
No assessment data are reported when less than ten students were tested.
Ideas and Development
Sp EdTotal
Organization, Unity, and Coherence
Sp EdTotal
Word Choice
Sp EdTotal
Sentences and Paragraphs
Sp EdTotal
Grammer and Usage
Sp EdTotal
Writing Mechanics
Sp EdTotal
NumberTested
53% 54% 60%
52%
36%
44%
42%
51%
36%
59%
83
61

General $154,941Capital Outlay $101,968
PensionSpecial Education $52,107
Ending Fund Balance
Bond Redemption $0Capital Projects $0
Other Fund Data
Agricultural $4.79Non-Ag Z $6.29Owner Occupied $7.70Other Non-Ag/Utilities $16.52Special Education $1.40
Bond Redemption $0.00Pension Fund $0.00
Capital Outlay $3.00
2005 Payable 2006 Levy per Thousand
$1,179,203$95,980
$0
General AidSpecial EducationExtraordinary Cost Fund - SE
$1,275,183Total State Aid
State Aid
Special Education Federal Flowthrough
$58,960IDEA Part BPart B, Sec. 619, PK $7,963
$66,923Total
K-12 Instruction $1,516,008PK Instruction $0Adult Instruction $0
$136,202$60,211
$0
General Special Education
Expenditures
Community Services $0Non-Programmed $0Debt Service $0Co-Curricular $129,277
$0$0$0$0
Total Expenditures $2,632,125 $254,865
2005 Payable 2006Taxable Valuations
Agricultural $48,034,165Owner Occupied $4,205,524Non-Ag Z $0Other Non-Ag/Utilities $2,542,047Total $54,781,736
$34,37612.7
10.0%29.0
$32,789Average Teacher SalaryExperience Adjusted SalaryAvg Years of Experience% with Advanced DegreesCertified Instructional Staff
Teaching Staff Data
ADM of Tuitioned Out Paid 0.000
General State Aid Adj. ADM 308.400Non-Public / Home Sch ADM 3.000
ADM Data
Local $283,551County $199State $1,199,584Federal $303,758Total $1,787,092
$166,464$0$0
$10,551
$77,854$0
$95,980$98,890
General Capital Outlay Special Education Pension
$177,015 $272,723 $0
Revenue
Classroom Staff 0.0
ADM of Contracted Out Paid 0.000
Other Special Revenue $0
500 Main St, Timber Lake, SD 57656-1000
2005-2006 Profile of Timber Lake School District 20-3
Capital Outlay Pension
Student/Staff ServicesAdministration ServicesTransportation ServicesOther Support Services
Enterprise Funds
Cost per ADM
General Fund Only
Revenue Expenditures
* Includes General, Special Education and Pension Funds
Home County: DeweyArea in Square Miles: 996
2005 K-12 Fall Enrollment: 272
$0$0$0$0
$0$0
$0$0$0
$151,040$399,424$130,071$306,306
$14,669$13,494$12,899$98,150
$0$0$0
$3,868
$22,562$0
$2,405$33,485
$0$0$0$0$0$0$0$0
$9,552Educational Funds* $10,238
$0$0
$1,452,151$104,587 $139,631
*District has opted out of General Fund levy
$161,087 $0
$18,007

December 2005 Federal Child Count
0Deaf-Blind
012
1
DeafSpeech/Language
Autism
0Emotionally Disturbed20
19200
Mental RetardationHearing ImpairedLearning DisabledMultiple DisabilitiesOrthopedic ImpairmentVisually Impaired
1
01
Other Health Impaired
Traumatic Brain InjuryDevelopmental Delay
38Total
0
1
40
00
28
4
1
0
0
0
Home
Early Childhood Setting
PT Early Child and SEEarly Childhood SE Setting
Separate SchoolResidential Facility
Regular Classroom
Resource Room
Self-Contained Classroom
Day Program
24 Hour Program
Home/Hospital Program
Special Education Placement Categories
Total 38
Student to Staff Ratio 9.4
K-8 152.6029-12 101.855
161.316107.613
ADA ADM
Total 254.457 268.929
Student Data
PK-12 Enrollment 273Open Enrolled Students Rec'd 31District Dropout Rate 0.6%
% Special Needs Students 13.9%% Eligible for Free/Red. Lunch 58.9%
Students Transported 167
District Attendance RateNumber of Graduates
94.6%24
Enrollment
Stanford Achievement Test Series, Tenth Edition (SAT10)
91
89
80
79
83
84
Math
Social Science
Language Arts
Reading
Complete Battery
Science
Stanford Writing Assessment Program, Third Edition
Grade 5
Grade 9
American College Test (ACT)
Grade 5Total
PRSpEd
PR
Number Tested
English
19
74%
Total PR
Sp Ed PR
69
65
58
65
66
64
78
66
72
51
69
67
56%
Grade 4 Grade 3Total
PRSp Ed
PR
Grade 6Total
PRSp Ed
PR
16 18 291 2 3
Sp EdTotal
Number Tested
Grade 7Total
PRSp Ed
PR
Grade 8 Total
PRSp Ed
PR
Grade 11Total
PRSp Ed
PR
MathReadingScienceComposite Score
20.221.017.7
22.220.4
60
63
76
56
63
63
22 5
92
78
93
72
78
84
71
59
63
58
52
60
61
48
51
60
54
55
16 219 320
Percent Proficient or Higher
No assessment data are reported when less than ten students were tested.
Ideas and Development
Sp EdTotal
Organization, Unity, and Coherence
Sp EdTotal
Word Choice
Sp EdTotal
Sentences and Paragraphs
Sp EdTotal
Grammer and Usage
Sp EdTotal
Writing Mechanics
Sp EdTotal
NumberTested
69% 63% 75%
59%
50%
59%
44%
74%
44%
70%
16
27

General $869,919Capital Outlay $783,629
Pension $65Special Education $197,071
Ending Fund Balance
Bond Redemption $0Capital Projects $0
Other Fund Data
Agricultural $3.19Non-Ag Z $4.19Owner Occupied $5.13Other Non-Ag/Utilities $11.00Special Education $1.40
Bond Redemption $0.00Pension Fund $0.30
Capital Outlay $3.00
2005 Payable 2006 Levy per Thousand
$8,092,210$1,369,074
$0
General AidSpecial EducationExtraordinary Cost Fund - SE
$9,461,284Total State Aid
State Aid
Special Education Federal Flowthrough
$558,434IDEA Part BPart B, Sec. 619, PK $15,227
$573,661Total
K-12 Instruction $12,500,695PK Instruction $305,027Adult Instruction $0
$1,682,809$130,486
$0
General Special Education
Expenditures
Community Services $214,072Non-Programmed $0Debt Service $0Co-Curricular $437,017
$0$0$0$0
Total Expenditures $22,433,889 $2,729,198
2005 Payable 2006Taxable Valuations
Agricultural $67,471,732Owner Occupied $8,458,980Non-Ag Z $0Other Non-Ag/Utilities $8,831,244Total $84,761,956
$35,13011.4
17.9%194.8
$33,209Average Teacher SalaryExperience Adjusted SalaryAvg Years of Experience% with Advanced DegreesCertified Instructional Staff
Teaching Staff Data
ADM of Tuitioned Out Paid 4.526
General State Aid Adj. ADM 1,971.679Non-Public / Home Sch ADM 34.908
ADM Data
Local $1,547,804County $3,038State $8,320,758Federal $6,696,240Total $16,567,840
$260,257$0$0
$231,335
$328,562$0
$1,369,074$870,856
General Capital Outlay Special Education Pension
$491,592 $2,568,493 $25,065
Revenue
Classroom Staff 2.1
ADM of Contracted Out Paid 0.000
Other Special Revenue $0
E Denver Drive, Mission, SD 57555
2005-2006 Profile of Todd County School District 66-1
Capital Outlay Pension
Student/Staff ServicesAdministration ServicesTransportation ServicesOther Support Services
Enterprise Funds
Cost per ADM
General Fund Only
Revenue Expenditures
* Includes General, Special Education and Pension Funds
Home County: ToddArea in Square Miles: 1,390
2005 K-12 Fall Enrollment: 2,006
$25,065$0$0$0
$0$0
$25,000$0$0
$3,211,246$1,613,300
$875,916$3,276,617
$0$0$0
$985,169$0$0$0$0
$594,621$274,678
$46,603$0
$0$0$0$0$0$0$0$0
$11,120Educational Funds* $12,335
$0$0
$8,478,396$787,624 $931,675
$985,169 $25,000
$0

December 2005 Federal Child Count
0Deaf-Blind
066
2
DeafSpeech/Language
Autism
3Emotionally Disturbed27
3186
1701
Mental RetardationHearing ImpairedLearning DisabledMultiple DisabilitiesOrthopedic ImpairmentVisually Impaired
2
028
Other Health Impaired
Traumatic Brain InjuryDevelopmental Delay
335Total
0
11
1624
00
208
29
27
11
5
4
Home
Early Childhood Setting
PT Early Child and SEEarly Childhood SE Setting
Separate SchoolResidential Facility
Regular Classroom
Resource Room
Self-Contained Classroom
Day Program
24 Hour Program
Home/Hospital Program
Special Education Placement Categories
Total 335
Student to Staff Ratio 10.2
K-8 1,360.6769-12 376.952
1,498.082470.071
ADA ADM
Total 1,737.628 1,968.153
Student Data
PK-12 Enrollment 2,012Open Enrolled Students Rec'd 0District Dropout Rate 7.0%
% Special Needs Students 16.7%% Eligible for Free/Red. Lunch 76.6%
Students Transported 1,371
District Attendance RateNumber of Graduates
88.3%73
Enrollment
Stanford Achievement Test Series, Tenth Edition (SAT10)
44
43
41
24
33
37
Math
Social Science
Language Arts
Reading
Complete Battery
Science
Stanford Writing Assessment Program, Third Edition
Grade 5
Grade 9
American College Test (ACT)
Grade 5Total
PRSpEd
PR
Number Tested
English
39
32%
20
33
26
12
14
19
Total PR
Sp Ed PR
27
31
26
26
29
26
12
8
12
7
10
8
33
54
41
38
55
44
34%
Grade 4 Grade 3Total
PRSp Ed
PR
Grade 6Total
PRSp Ed
PR
170 144 6630 17 2
Sp EdTotal
Number Tested
Grade 7Total
PRSp Ed
PR
Grade 8 Total
PRSp Ed
PR
Grade 11Total
PRSp Ed
PR
MathReadingScienceComposite Score
17.616.215.0
17.516.8
33 26
31 30
26 29
24 17
30 16
30 23
155 16
35 13
40 21
43 23
37 16
34 10
35 16
25 14
27 14
29 14
34 18
20 5
26 12
28 14
24 7
29 7
34 12
24 5
26 9
13153 17167 19154
Percent Proficient or Higher
No assessment data are reported when less than ten students were tested.
Ideas and Development
Sp EdTotal
Organization, Unity, and Coherence
Sp EdTotal
Word Choice
Sp EdTotal
Sentences and Paragraphs
Sp EdTotal
Grammer and Usage
Sp EdTotal
Writing Mechanics
Sp EdTotal
NumberTested
39% 35% 39%
32%
25%
28%
20%
31%
21%
40%
145
136
1
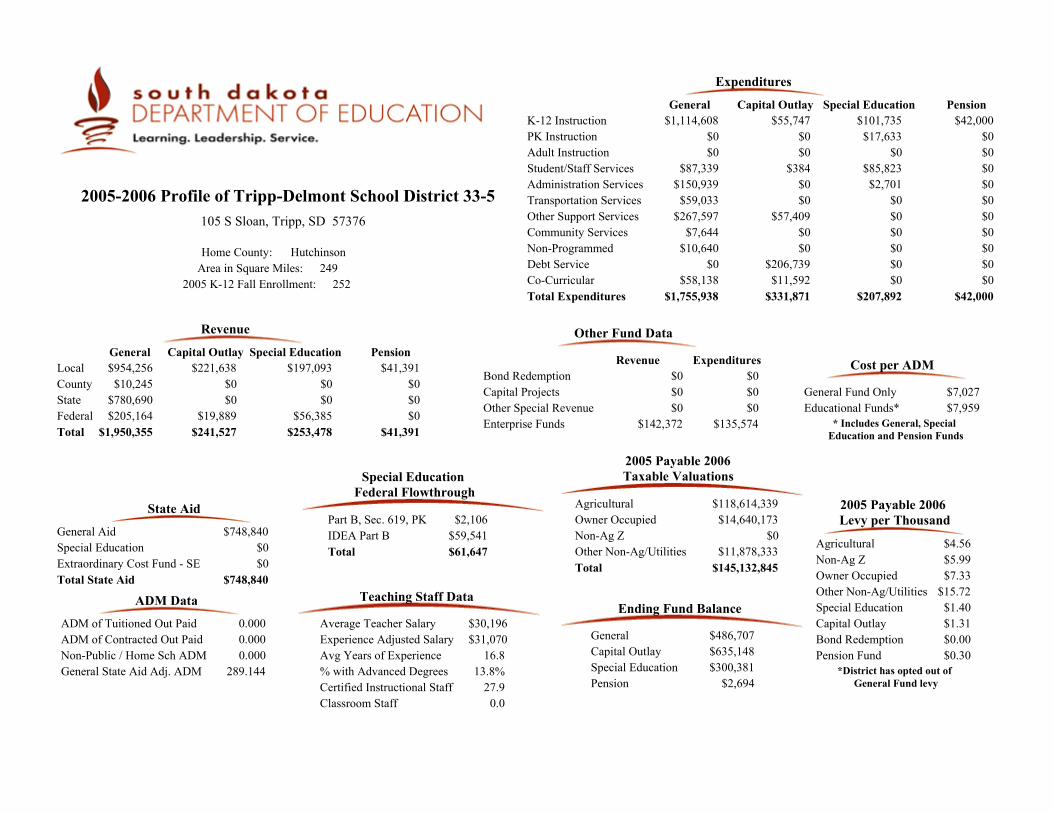
General $486,707Capital Outlay $635,148
Pension $2,694Special Education $300,381
Ending Fund Balance
Bond Redemption $0Capital Projects $0
Other Fund Data
Agricultural $4.56Non-Ag Z $5.99Owner Occupied $7.33Other Non-Ag/Utilities $15.72Special Education $1.40
Bond Redemption $0.00Pension Fund $0.30
Capital Outlay $1.31
2005 Payable 2006 Levy per Thousand
$748,840$0$0
General AidSpecial EducationExtraordinary Cost Fund - SE
$748,840Total State Aid
State Aid
Special Education Federal Flowthrough
$59,541IDEA Part BPart B, Sec. 619, PK $2,106
$61,647Total
K-12 Instruction $1,114,608PK Instruction $0Adult Instruction $0
$101,735$17,633
$0
General Special Education
Expenditures
Community Services $7,644Non-Programmed $10,640Debt Service $0Co-Curricular $58,138
$0$0$0$0
Total Expenditures $1,755,938 $207,892
2005 Payable 2006Taxable Valuations
Agricultural $118,614,339Owner Occupied $14,640,173Non-Ag Z $0Other Non-Ag/Utilities $11,878,333Total $145,132,845
$31,07016.8
13.8%27.9
$30,196Average Teacher SalaryExperience Adjusted SalaryAvg Years of Experience% with Advanced DegreesCertified Instructional Staff
Teaching Staff Data
ADM of Tuitioned Out Paid 0.000
General State Aid Adj. ADM 289.144Non-Public / Home Sch ADM 0.000
ADM Data
Local $954,256County $10,245State $780,690Federal $205,164Total $1,950,355
$221,638$0$0
$19,889
$197,093$0$0
$56,385
General Capital Outlay Special Education Pension
$241,527 $253,478 $41,391
Revenue
Classroom Staff 0.0
ADM of Contracted Out Paid 0.000
Other Special Revenue $0
105 S Sloan, Tripp, SD 57376
2005-2006 Profile of Tripp-Delmont School District 33-5
Capital Outlay Pension
Student/Staff ServicesAdministration ServicesTransportation ServicesOther Support Services
Enterprise Funds
Cost per ADM
General Fund Only
Revenue Expenditures
* Includes General, Special Education and Pension Funds
Home County: HutchinsonArea in Square Miles: 249
2005 K-12 Fall Enrollment: 252
$41,391$0$0$0
$0$0
$42,000$0$0
$87,339$150,939
$59,033$267,597
$384$0$0
$57,409$0$0
$206,739$11,592
$85,823$2,701
$0$0
$0$0$0$0$0$0$0$0
$7,027Educational Funds* $7,959
$0$0$0
$142,372 $135,574
*District has opted out of General Fund levy
$331,871 $42,000
$55,747

December 2005 Federal Child Count
0Deaf-Blind
06
1
DeafSpeech/Language
Autism
0Emotionally Disturbed40
12120
Mental RetardationHearing ImpairedLearning DisabledMultiple DisabilitiesOrthopedic ImpairmentVisually Impaired
3
01
Other Health Impaired
Traumatic Brain InjuryDevelopmental Delay
30Total
0
0
22
00
20
6
0
0
0
0
Home
Early Childhood Setting
PT Early Child and SEEarly Childhood SE Setting
Separate SchoolResidential Facility
Regular Classroom
Resource Room
Self-Contained Classroom
Day Program
24 Hour Program
Home/Hospital Program
Special Education Placement Categories
Total 30
Student to Staff Ratio 9.1
K-8 187.3759-12 54.721
192.16756.646
ADA ADM
Total 242.096 248.813
Student Data
PK-12 Enrollment 254Open Enrolled Students Rec'd 0District Dropout Rate 0.0%
% Special Needs Students 11.8%% Eligible for Free/Red. Lunch 55.0%
Students Transported 150
District Attendance RateNumber of Graduates
97.3%11
Enrollment
Stanford Achievement Test Series, Tenth Edition (SAT10)
65
65
51
43
61
59
Math
Social Science
Language Arts
Reading
Complete Battery
Science
Stanford Writing Assessment Program, Third Edition
Grade 5
Grade 9
American College Test (ACT)
Grade 5Total
PRSpEd
PR
Number Tested
English
10
100%
Total PR
Sp Ed PR
79
76
74
76
68
74
80
79
75
78
82
78
91%
Grade 4 Grade 3Total
PRSp Ed
PR
Grade 6Total
PRSp Ed
PR
14 23 181
Sp EdTotal
Number Tested
Grade 7Total
PRSp Ed
PR
Grade 8 Total
PRSp Ed
PR
Grade 11Total
PRSp Ed
PR
MathReadingScienceComposite Score
23.421.621.3
21.422.0
86
71
80
76
77
78
20 4
67
61
75
55
63
65
74
57
55
57
55
62
79
86
77
76
64
75
227 429 11
Percent Proficient or Higher
No assessment data are reported when less than ten students were tested.
Ideas and Development
Sp EdTotal
Organization, Unity, and Coherence
Sp EdTotal
Word Choice
Sp EdTotal
Sentences and Paragraphs
Sp EdTotal
Grammer and Usage
Sp EdTotal
Writing Mechanics
Sp EdTotal
NumberTested
61% 46% 64%
91%
32%
91%
43%
82%
32%
91%
28
11

General $2,360,839Capital Outlay $462,592
PensionSpecial Education ($29,763)
Ending Fund Balance
Bond Redemption $0Capital Projects $0
Other Fund Data
Agricultural $3.19Non-Ag Z $4.19Owner Occupied $5.13Other Non-Ag/Utilities $11.00Special Education $1.40
Bond Redemption $0.00Pension Fund $0.00
Capital Outlay $3.00
2005 Payable 2006 Levy per Thousand
$2,133,483$214,028$117,518
General AidSpecial EducationExtraordinary Cost Fund - SE
$2,465,029Total State Aid
State Aid
Special Education Federal Flowthrough
$124,396IDEA Part BPart B, Sec. 619, PK $3,312
$127,708Total
K-12 Instruction $2,241,325PK Instruction $0Adult Instruction $0
$464,070$47,711
$0
General Special Education
Expenditures
Community Services $12,123Non-Programmed $11,708Debt Service $0Co-Curricular $214,153
$0$0$0$0
Total Expenditures $4,139,315 $815,168
2005 Payable 2006Taxable Valuations
Agricultural $98,100,482Owner Occupied $139,951,311Non-Ag Z $1,945,977Other Non-Ag/Utilities $36,850,796Total $276,848,566
$33,88712.2
5.7%52.9
$32,410Average Teacher SalaryExperience Adjusted SalaryAvg Years of Experience% with Advanced DegreesCertified Instructional Staff
Teaching Staff Data
ADM of Tuitioned Out Paid 7.346
General State Aid Adj. ADM 821.166Non-Public / Home Sch ADM 20.240
ADM Data
Local $1,647,219County $43,978State $2,439,391Federal $174,006Total $4,304,594
$822,685$0$0$0
$367,573$0
$331,546$129,970
General Capital Outlay Special Education Pension
$822,685 $829,090 $0
Revenue
Classroom Staff 2.3
ADM of Contracted Out Paid 0.000
Other Special Revenue $0
46450 252nd St, Colton, SD 57018
2005-2006 Profile of Tri-Valley School District 49-6
Capital Outlay Pension
Student/Staff ServicesAdministration ServicesTransportation ServicesOther Support Services
Enterprise Funds
Cost per ADM
General Fund Only
Revenue Expenditures
* Includes General, Special Education and Pension Funds
Home County: MinnehahaArea in Square Miles: 148
2005 K-12 Fall Enrollment: 836
$0$0$0$0
$0$0
$0$0$0
$396,773$415,660$268,182$579,391
$98,276$0
$37,000$1,976,431
$0$0
$323,419$0
$228,722$11,407$63,258
$0
$0$0$0$0$0$0$0$0
$5,041Educational Funds* $5,746
$0$0$0
$329,590 $331,671
$2,482,996 $0
$47,871

December 2005 Federal Child Count
0Deaf-Blind
015
6
DeafSpeech/Language
Autism
4Emotionally Disturbed81
32501
Mental RetardationHearing ImpairedLearning DisabledMultiple DisabilitiesOrthopedic ImpairmentVisually Impaired
24
05
Other Health Impaired
Traumatic Brain InjuryDevelopmental Delay
101Total
0
1
08
00
60
26
0
4
2
0
Home
Early Childhood Setting
PT Early Child and SEEarly Childhood SE Setting
Separate SchoolResidential Facility
Regular Classroom
Resource Room
Self-Contained Classroom
Day Program
24 Hour Program
Home/Hospital Program
Special Education Placement Categories
Total 101
Student to Staff Ratio 15.3
K-8 553.6989-12 234.717
571.499242.320
ADA ADM
Total 788.415 813.819
Student Data
PK-12 Enrollment 844Open Enrolled Students Rec'd 30District Dropout Rate 0.5%
% Special Needs Students 12.0%% Eligible for Free/Red. Lunch 17.0%
Students Transported 684
District Attendance RateNumber of Graduates
96.9%55
Enrollment
Stanford Achievement Test Series, Tenth Edition (SAT10)
85
81
75
63
73
76
Math
Social Science
Language Arts
Reading
Complete Battery
Science
Stanford Writing Assessment Program, Third Edition
Grade 5
Grade 9
American College Test (ACT)
Grade 5Total
PRSpEd
PR
Number Tested
English
39
75%
Total PR
Sp Ed PR
71
79
73
70
69
71
71
75
67
55
73
68
68%
Grade 4 Grade 3Total
PRSp Ed
PR
Grade 6Total
PRSp Ed
PR
64 67 576 2 2
Sp EdTotal
Number Tested
Grade 7Total
PRSp Ed
PR
Grade 8 Total
PRSp Ed
PR
Grade 11Total
PRSp Ed
PR
MathReadingScienceComposite Score
22.520.321.0
21.921.5
78
84
82
65
76
76
54 7
85
81
75
77
74
78
74
75
73
72
69
72
69
69
62
72
64
65
667 572 967
Percent Proficient or Higher
No assessment data are reported when less than ten students were tested.
Ideas and Development
Sp EdTotal
Organization, Unity, and Coherence
Sp EdTotal
Word Choice
Sp EdTotal
Sentences and Paragraphs
Sp EdTotal
Grammer and Usage
Sp EdTotal
Writing Mechanics
Sp EdTotal
NumberTested
67% 70% 68%
65%
48%
65%
56%
68%
42%
73%
66
75
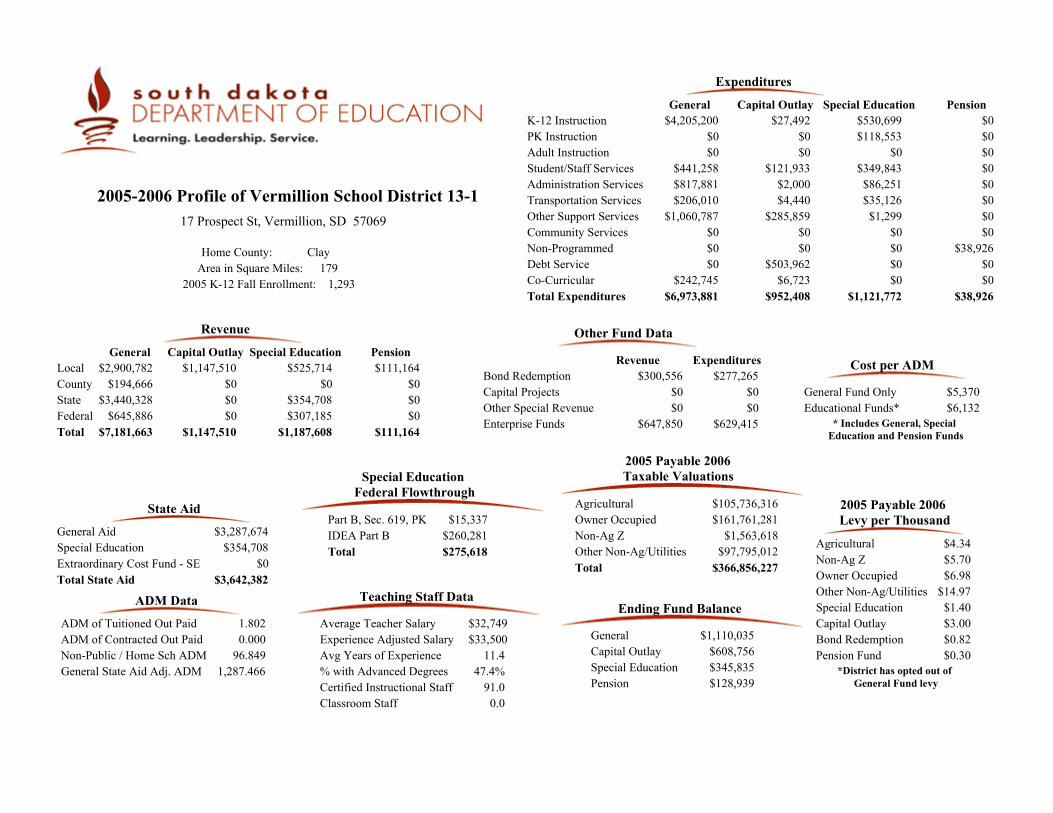
General $1,110,035Capital Outlay $608,756
Pension $128,939Special Education $345,835
Ending Fund Balance
Bond Redemption $277,265Capital Projects $0
Other Fund Data
Agricultural $4.34Non-Ag Z $5.70Owner Occupied $6.98Other Non-Ag/Utilities $14.97Special Education $1.40
Bond Redemption $0.82Pension Fund $0.30
Capital Outlay $3.00
2005 Payable 2006 Levy per Thousand
$3,287,674$354,708
$0
General AidSpecial EducationExtraordinary Cost Fund - SE
$3,642,382Total State Aid
State Aid
Special Education Federal Flowthrough
$260,281IDEA Part BPart B, Sec. 619, PK $15,337
$275,618Total
K-12 Instruction $4,205,200PK Instruction $0Adult Instruction $0
$530,699$118,553
$0
General Special Education
Expenditures
Community Services $0Non-Programmed $0Debt Service $0Co-Curricular $242,745
$0$0$0$0
Total Expenditures $6,973,881 $1,121,772
2005 Payable 2006Taxable Valuations
Agricultural $105,736,316Owner Occupied $161,761,281Non-Ag Z $1,563,618Other Non-Ag/Utilities $97,795,012Total $366,856,227
$33,50011.4
47.4%91.0
$32,749Average Teacher SalaryExperience Adjusted SalaryAvg Years of Experience% with Advanced DegreesCertified Instructional Staff
Teaching Staff Data
ADM of Tuitioned Out Paid 1.802
General State Aid Adj. ADM 1,287.466Non-Public / Home Sch ADM 96.849
ADM Data
Local $2,900,782County $194,666State $3,440,328Federal $645,886Total $7,181,663
$1,147,510$0$0$0
$525,714$0
$354,708$307,185
General Capital Outlay Special Education Pension
$1,147,510 $1,187,608 $111,164
Revenue
Classroom Staff 0.0
ADM of Contracted Out Paid 0.000
Other Special Revenue $0
17 Prospect St, Vermillion, SD 57069
2005-2006 Profile of Vermillion School District 13-1
Capital Outlay Pension
Student/Staff ServicesAdministration ServicesTransportation ServicesOther Support Services
Enterprise Funds
Cost per ADM
General Fund Only
Revenue Expenditures
* Includes General, Special Education and Pension Funds
Home County: ClayArea in Square Miles: 179
2005 K-12 Fall Enrollment: 1,293
$111,164$0$0$0
$0$0
$0$0$0
$441,258$817,881$206,010
$1,060,787
$121,933$2,000$4,440
$285,859$0$0
$503,962$6,723
$349,843$86,251$35,126$1,299
$0$0$0$0$0
$38,926$0$0
$5,370Educational Funds* $6,132
$300,556$0$0
$647,850 $629,415
*District has opted out of General Fund levy
$952,408 $38,926
$27,492

December 2005 Federal Child Count
0Deaf-Blind
060
2
DeafSpeech/Language
Autism
4Emotionally Disturbed12
071
900
Mental RetardationHearing ImpairedLearning DisabledMultiple DisabilitiesOrthopedic ImpairmentVisually Impaired
11
028
Other Health Impaired
Traumatic Brain InjuryDevelopmental Delay
197Total
1
1
040
00
114
35
6
0
0
0
Home
Early Childhood Setting
PT Early Child and SEEarly Childhood SE Setting
Separate SchoolResidential Facility
Regular Classroom
Resource Room
Self-Contained Classroom
Day Program
24 Hour Program
Home/Hospital Program
Special Education Placement Categories
Total 197
Student to Staff Ratio 14.5
K-8 850.4309-12 382.316
883.688401.360
ADA ADM
Total 1,232.746 1,285.048
Student Data
PK-12 Enrollment 1,323Open Enrolled Students Rec'd 44District Dropout Rate 2.1%
% Special Needs Students 14.9%% Eligible for Free/Red. Lunch 33.1%
Students Transported 338
District Attendance RateNumber of Graduates
95.9%72
Enrollment
Stanford Achievement Test Series, Tenth Edition (SAT10)
78
83
79
68
72
74
Math
Social Science
Language Arts
Reading
Complete Battery
Science
Stanford Writing Assessment Program, Third Edition
Grade 5
Grade 9
American College Test (ACT)
Grade 5Total
PRSpEd
PR
Number Tested
English
64
77%
70
76
73
54
55
64
Total PR
Sp Ed PR
79
74
74
65
68
72
84
81
78
68
85
79
81%
Grade 4 Grade 3Total
PRSp Ed
PR
Grade 6Total
PRSp Ed
PR
89 103 9011 6 4
Sp EdTotal
Number Tested
Grade 7Total
PRSp Ed
PR
Grade 8 Total
PRSp Ed
PR
Grade 11Total
PRSp Ed
PR
MathReadingScienceComposite Score
23.022.122.5
22.122.5
78 61
68 66
73 68
63 52
60 50
66 57
90 16
76 56
79 72
79 70
71 50
70 52
74 58
71
75
69
66
63
67
75 19
70 15
69 22
72 22
64 13
69 18
13104 7102 1094
Percent Proficient or Higher
No assessment data are reported when less than ten students were tested.
Ideas and Development
Sp EdTotal
Organization, Unity, and Coherence
Sp EdTotal
Word Choice
Sp EdTotal
Sentences and Paragraphs
Sp EdTotal
Grammer and Usage
Sp EdTotal
Writing Mechanics
Sp EdTotal
NumberTested
79% 66% 74%
68%
65%
68%
61%
66%
62%
77%
97
112

General $288,961Capital Outlay $265,641
Pension $66,998Special Education $51,892
Ending Fund Balance
Bond Redemption $292,633Capital Projects $0
Other Fund Data
Agricultural $3.19Non-Ag Z $4.19Owner Occupied $5.13Other Non-Ag/Utilities $11.00Special Education $1.40
Bond Redemption $3.65Pension Fund $0.30
Capital Outlay $1.50
2005 Payable 2006 Levy per Thousand
$974,044$69,403
$0
General AidSpecial EducationExtraordinary Cost Fund - SE
$1,043,447Total State Aid
State Aid
Special Education Federal Flowthrough
$51,044IDEA Part BPart B, Sec. 619, PK $3,060
$54,104Total
K-12 Instruction $844,749PK Instruction $0Adult Instruction $0
$149,707$27,647
$0
General Special Education
Expenditures
Community Services $0Non-Programmed $0Debt Service $0Co-Curricular $77,144
$0$0$0$0
Total Expenditures $1,505,523 $234,859
2005 Payable 2006Taxable Valuations
Agricultural $56,927,147Owner Occupied $16,794,769Non-Ag Z $518,751Other Non-Ag/Utilities $6,235,177Total $80,475,844
$32,20511.9
13.6%20.5
$30,195Average Teacher SalaryExperience Adjusted SalaryAvg Years of Experience% with Advanced DegreesCertified Instructional Staff
Teaching Staff Data
ADM of Tuitioned Out Paid 1.000
General State Aid Adj. ADM 309.385Non-Public / Home Sch ADM 5.240
ADM Data
Local $451,526County $10,274State $994,973Federal $66,997Total $1,523,770
$113,134$124
$0$0
$105,592$115
$69,403$55,170
General Capital Outlay Special Education Pension
$113,257 $230,280 $22,649
Revenue
Classroom Staff 0.0
ADM of Contracted Out Paid 0.000
Other Special Revenue $0
203 W Park Ave, Viborg, SD 57070
2005-2006 Profile of Viborg School District 60-5
Capital Outlay Pension
Student/Staff ServicesAdministration ServicesTransportation ServicesOther Support Services
Enterprise Funds
Cost per ADM
General Fund Only
Revenue Expenditures
* Includes General, Special Education and Pension Funds
Home County: TurnerArea in Square Miles: 105
2005 K-12 Fall Enrollment: 272
$22,624$25$0$0
$0$0
$11,315$0$0
$58,897$188,748
$76,480$259,506
$1,389$0
$9,023$16,271
$0$0$0
$10,065
$45,199$12,306
$0$0
$744$1,851
$0$1,596
$0$0$0
$664
$5,557Educational Funds* $6,383
$286,319$0$0
$114,821 $115,589
$89,447 $16,171
$52,700
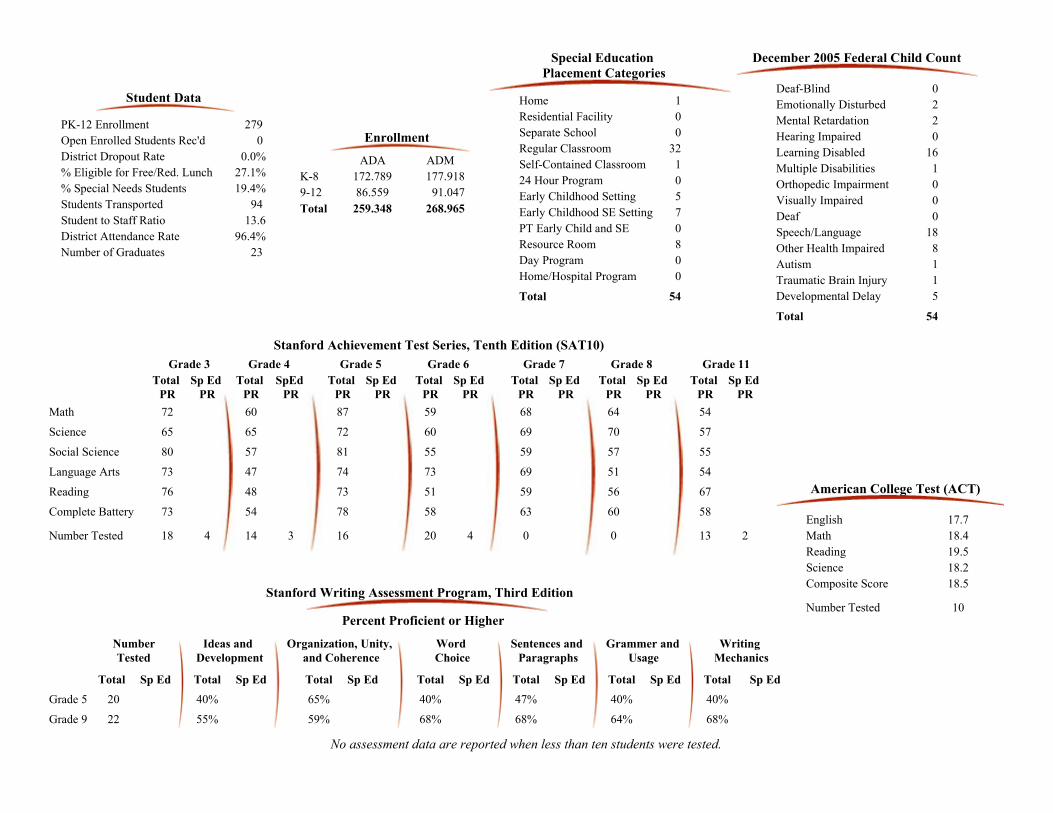
December 2005 Federal Child Count
0Deaf-Blind
018
1
DeafSpeech/Language
Autism
2Emotionally Disturbed20
16100
Mental RetardationHearing ImpairedLearning DisabledMultiple DisabilitiesOrthopedic ImpairmentVisually Impaired
8
15
Other Health Impaired
Traumatic Brain InjuryDevelopmental Delay
54Total
1
5
07
00
32
8
1
0
0
0
Home
Early Childhood Setting
PT Early Child and SEEarly Childhood SE Setting
Separate SchoolResidential Facility
Regular Classroom
Resource Room
Self-Contained Classroom
Day Program
24 Hour Program
Home/Hospital Program
Special Education Placement Categories
Total 54
Student to Staff Ratio 13.6
K-8 172.7899-12 86.559
177.91891.047
ADA ADM
Total 259.348 268.965
Student Data
PK-12 Enrollment 279Open Enrolled Students Rec'd 0District Dropout Rate 0.0%
% Special Needs Students 19.4%% Eligible for Free/Red. Lunch 27.1%
Students Transported 94
District Attendance RateNumber of Graduates
96.4%23
Enrollment
Stanford Achievement Test Series, Tenth Edition (SAT10)
60
65
57
47
48
54
Math
Social Science
Language Arts
Reading
Complete Battery
Science
Stanford Writing Assessment Program, Third Edition
Grade 5
Grade 9
American College Test (ACT)
Grade 5Total
PRSpEd
PR
Number Tested
English
10
59%
Total PR
Sp Ed PR
64
70
57
51
56
60
54
57
55
54
67
58
55%
Grade 4 Grade 3Total
PRSp Ed
PR
Grade 6Total
PRSp Ed
PR
14 0 133 2
Sp EdTotal
Number Tested
Grade 7Total
PRSp Ed
PR
Grade 8 Total
PRSp Ed
PR
Grade 11Total
PRSp Ed
PR
MathReadingScienceComposite Score
19.518.417.7
18.218.5
72
65
80
73
76
73
18 4
87
72
81
74
73
78
59
60
55
73
51
58
68
69
59
69
59
63
16 420 0
Percent Proficient or Higher
No assessment data are reported when less than ten students were tested.
Ideas and Development
Sp EdTotal
Organization, Unity, and Coherence
Sp EdTotal
Word Choice
Sp EdTotal
Sentences and Paragraphs
Sp EdTotal
Grammer and Usage
Sp EdTotal
Writing Mechanics
Sp EdTotal
NumberTested
40% 65% 40%
68%
47%
68%
40%
64%
40%
68%
20
22

General $824,275Capital Outlay ($84,214)
Pension $14,292Special Education $47,532
Ending Fund Balance
Bond Redemption $0Capital Projects $1,961,119
Other Fund Data
Agricultural $3.19Non-Ag Z $4.19Owner Occupied $5.13Other Non-Ag/Utilities $11.00Special Education $1.40
Bond Redemption $0.00Pension Fund $0.30
Capital Outlay $0.50
2005 Payable 2006 Levy per Thousand
$2,599,711$297,500
$0
General AidSpecial EducationExtraordinary Cost Fund - SE
$2,897,211Total State Aid
State Aid
Special Education Federal Flowthrough
$170,594IDEA Part BPart B, Sec. 619, PK $16,553
$187,147Total
K-12 Instruction $3,057,042PK Instruction $0Adult Instruction $0
$714,002$51,039
$0
General Special Education
Expenditures
Community Services $0Non-Programmed $0Debt Service $0Co-Curricular $159,869
$0$0$0$0
Total Expenditures $5,316,574 $993,897
2005 Payable 2006Taxable Valuations
Agricultural $119,546,326Owner Occupied $28,634,918Non-Ag Z $897,221Other Non-Ag/Utilities $17,935,162Total $167,013,627
$34,84412.2
11.3%62.0
$33,167Average Teacher SalaryExperience Adjusted SalaryAvg Years of Experience% with Advanced DegreesCertified Instructional Staff
Teaching Staff Data
ADM of Tuitioned Out Paid 17.835
General State Aid Adj. ADM 764.884Non-Public / Home Sch ADM 1.944
ADM Data
Local $1,232,219County $64,020State $2,775,617Federal $1,048,451Total $5,120,307
$81,250$0$0$0
$227,444$0
$297,500$196,837
General Capital Outlay Special Education Pension
$81,250 $721,781 $26,524
Revenue
Classroom Staff 0.0
ADM of Contracted Out Paid 0.000
Other Special Revenue $58,939
101 Walnut Ave SW, Wagner, SD 57380
2005-2006 Profile of Wagner Community School District 11-4
Capital Outlay Pension
Student/Staff ServicesAdministration ServicesTransportation ServicesOther Support Services
Enterprise Funds
Cost per ADM
General Fund Only
Revenue Expenditures
* Includes General, Special Education and Pension Funds
Home County: Charles MixArea in Square Miles: 330
2005 K-12 Fall Enrollment: 757
$26,524$0$0$0
$0$0
$0$0$0
$445,065$563,040$240,932$850,625
$813,619$0
$70,598$229,874
$0$0$0
$26,164
$228,856$0$0$0
$0$0$0$0$0
$12,232$0$0
$7,044Educational Funds* $8,003
$0$33,114
$3,946,558$410,049 $451,653
$1,290,522 $12,232
$150,268

December 2005 Federal Child Count
0Deaf-Blind
173
2
DeafSpeech/Language
Autism
6Emotionally Disturbed60
41900
Mental RetardationHearing ImpairedLearning DisabledMultiple DisabilitiesOrthopedic ImpairmentVisually Impaired
9
034
Other Health Impaired
Traumatic Brain InjuryDevelopmental Delay
181Total
0
10
3810
00
109
8
0
1
5
0
Home
Early Childhood Setting
PT Early Child and SEEarly Childhood SE Setting
Separate SchoolResidential Facility
Regular Classroom
Resource Room
Self-Contained Classroom
Day Program
24 Hour Program
Home/Hospital Program
Special Education Placement Categories
Total 181
Student to Staff Ratio 12.8
K-8 544.6149-12 164.903
572.549174.500
ADA ADM
Total 709.517 747.049
Student Data
PK-12 Enrollment 796Open Enrolled Students Rec'd 33District Dropout Rate 2.1%
% Special Needs Students 22.7%% Eligible for Free/Red. Lunch 58.4%
Students Transported 396
District Attendance RateNumber of Graduates
95.0%31
Enrollment
Stanford Achievement Test Series, Tenth Edition (SAT10)
67
71
68
42
56
58
Math
Social Science
Language Arts
Reading
Complete Battery
Science
Stanford Writing Assessment Program, Third Edition
Grade 5
Grade 9
American College Test (ACT)
Grade 5Total
PRSpEd
PR
Number Tested
English
33
83%
54
58
54
29
35
44
Total PR
Sp Ed PR
76
77
75
70
70
72
72
65
53
45
71
54
85%
Grade 4 Grade 3Total
PRSp Ed
PR
Grade 6Total
PRSp Ed
PR
70 47 3514 5 2
Sp EdTotal
Number Tested
Grade 7Total
PRSp Ed
PR
Grade 8 Total
PRSp Ed
PR
Grade 11Total
PRSp Ed
PR
MathReadingScienceComposite Score
19.619.219.0
20.119.6
48 31
50 42
47 36
43 37
59 42
52 39
54 13
73 67
65 67
69 58
53 59
53 48
63 59
55
64
55
60
56
55
61
60
63
68
59
60
1162 262 650
Percent Proficient or Higher
No assessment data are reported when less than ten students were tested.
Ideas and Development
Sp EdTotal
Organization, Unity, and Coherence
Sp EdTotal
Word Choice
Sp EdTotal
Sentences and Paragraphs
Sp EdTotal
Grammer and Usage
Sp EdTotal
Writing Mechanics
Sp EdTotal
NumberTested
43% 46% 42%
81%
29%
73%
22%
69%
38%
75%
72
48

General $195,058Capital Outlay $500,501
Pension $60,764Special Education $205,075
Ending Fund Balance
Bond Redemption $0Capital Projects $0
Other Fund Data
Agricultural $4.31Non-Ag Z $5.66Owner Occupied $6.93Other Non-Ag/Utilities $14.86Special Education $1.40
Bond Redemption $0.00Pension Fund $0.30
Capital Outlay $3.00
2005 Payable 2006 Levy per Thousand
$341,575$0$0
General AidSpecial EducationExtraordinary Cost Fund - SE
$341,575Total State Aid
State Aid
Special Education Federal Flowthrough
$40,314IDEA Part BPart B, Sec. 619, PK $2,026
$42,340Total
K-12 Instruction $627,931PK Instruction $14,039Adult Instruction $0
$91,360$13,229
$0
General Special Education
Expenditures
Community Services $0Non-Programmed $0Debt Service $0Co-Curricular $62,890
$0$0$0$0
Total Expenditures $1,240,046 $157,159
2005 Payable 2006Taxable Valuations
Agricultural $71,046,788Owner Occupied $14,491,174Non-Ag Z $1,001,211Other Non-Ag/Utilities $11,399,559Total $97,938,732
$31,30010.5
9.5%17.9
$28,562Average Teacher SalaryExperience Adjusted SalaryAvg Years of Experience% with Advanced DegreesCertified Instructional Staff
Teaching Staff Data
ADM of Tuitioned Out Paid 0.000
General State Aid Adj. ADM 172.723Non-Public / Home Sch ADM 0.000
ADM Data
Local $654,214County $24,992State $369,789Federal $76,927Total $1,125,921
$287,531$0$0$0
$132,836$0$0
$44,048
General Capital Outlay Special Education Pension
$287,531 $176,884 $28,469
Revenue
Classroom Staff 1.0
ADM of Contracted Out Paid 0.000
Other Special Revenue $0
202 Nebraska, Wakonda, SD 57073
2005-2006 Profile of Wakonda School District 13-2
Capital Outlay Pension
Student/Staff ServicesAdministration ServicesTransportation ServicesOther Support Services
Enterprise Funds
Cost per ADM
General Fund Only
Revenue Expenditures
* Includes General, Special Education and Pension Funds
Home County: ClayArea in Square Miles: 137
2005 K-12 Fall Enrollment: 146
$28,469$0$0$0
$0$0
$13,355$0$0
$84,422$159,773
$78,341$212,651
$1,606$11,492$13,868$33,697
$0$0
$95,083$13,281
$37,368$14,442
$0$760
$2,370$3,000
$0$1,275
$0$0$0$0
$8,508Educational Funds* $9,642
$0$0$0
$65,025 $66,706
*District has opted out of General Fund levy
$191,571 $20,000
$22,545

December 2005 Federal Child Count
0Deaf-Blind
019
0
DeafSpeech/Language
Autism
0Emotionally Disturbed10
14100
Mental RetardationHearing ImpairedLearning DisabledMultiple DisabilitiesOrthopedic ImpairmentVisually Impaired
1
02
Other Health Impaired
Traumatic Brain InjuryDevelopmental Delay
38Total
0
0
012
00
25
1
0
0
0
0
Home
Early Childhood Setting
PT Early Child and SEEarly Childhood SE Setting
Separate SchoolResidential Facility
Regular Classroom
Resource Room
Self-Contained Classroom
Day Program
24 Hour Program
Home/Hospital Program
Special Education Placement Categories
Total 38
Student to Staff Ratio 7.7
K-8 87.6689-12 51.602
90.11153.825
ADA ADM
Total 139.270 143.936
Student Data
PK-12 Enrollment 146Open Enrolled Students Rec'd 10District Dropout Rate 1.3%
% Special Needs Students 26.0%% Eligible for Free/Red. Lunch 44.1%
Students Transported 49
District Attendance RateNumber of Graduates
96.8%14
Enrollment
Stanford Achievement Test Series, Tenth Edition (SAT10)
81
73
57
47
71
69
Math
Social Science
Language Arts
Reading
Complete Battery
Science
Stanford Writing Assessment Program, Third Edition
Grade 5
Grade 9
American College Test (ACT)
Grade 5Total
PRSpEd
PR
Number Tested
English
8
65%
Total PR
Sp Ed PR
63
69
52
49
46
55
90
85
78
69
82
81
71%
Grade 4 Grade 3Total
PRSp Ed
PR
Grade 6Total
PRSp Ed
PR
13 6 112 1 1
Sp EdTotal
Number Tested
Grade 7Total
PRSp Ed
PR
Grade 8 Total
PRSp Ed
PR
Grade 11Total
PRSp Ed
PR
MathReadingScienceComposite Score
85
75
52
61
53
65
8 1
97
93
94
89
87
91
79
73
79
71
64
72
73
53
51
55
54
59
5 513 112
Percent Proficient or Higher
No assessment data are reported when less than ten students were tested.
Ideas and Development
Sp EdTotal
Organization, Unity, and Coherence
Sp EdTotal
Word Choice
Sp EdTotal
Sentences and Paragraphs
Sp EdTotal
Grammer and Usage
Sp EdTotal
Writing Mechanics
Sp EdTotal
NumberTested
80% 80% 80%
76%
100%
59%
100%
65%
100%
82%
5
17

General $322,254Capital Outlay $314,298
PensionSpecial Education $169,382
Ending Fund Balance
Bond Redemption $0Capital Projects $1,108,657
Other Fund Data
Agricultural $3.19Non-Ag Z $4.19Owner Occupied $5.13Other Non-Ag/Utilities $11.00Special Education $0.90
Bond Redemption $0.00Pension Fund $0.00
Capital Outlay $3.00
2005 Payable 2006 Levy per Thousand
$578,767$0$0
General AidSpecial EducationExtraordinary Cost Fund - SE
$578,767Total State Aid
State Aid
Special Education Federal Flowthrough
$58,478IDEA Part BPart B, Sec. 619, PK $3,562
$62,040Total
K-12 Instruction $1,075,081PK Instruction $0Adult Instruction $0
$117,816$2,727
$0
General Special Education
Expenditures
Community Services $43,339Non-Programmed $0Debt Service $0Co-Curricular $108,437
$0$0$0$0
Total Expenditures $1,988,068 $177,785
2005 Payable 2006Taxable Valuations
Agricultural $107,772,430Owner Occupied $21,779,838Non-Ag Z $243,811Other Non-Ag/Utilities $24,674,109Total $154,470,188
$32,71017.6
25.0%24.4
$33,372Average Teacher SalaryExperience Adjusted SalaryAvg Years of Experience% with Advanced DegreesCertified Instructional Staff
Teaching Staff Data
ADM of Tuitioned Out Paid 0.000
General State Aid Adj. ADM 294.012Non-Public / Home Sch ADM 3.344
ADM Data
Local $1,053,722County $24,062State $610,072Federal $271,632Total $1,959,488
$550,604$555
$0$0
$175,077$211
$0$63,428
General Capital Outlay Special Education Pension
$551,159 $238,715 $0
Revenue
Classroom Staff 0.0
ADM of Contracted Out Paid 0.000
Other Special Revenue $0
401 South Blvd West, Wall, SD 57790-0414
2005-2006 Profile of Wall School District 51-5
Capital Outlay Pension
Student/Staff ServicesAdministration ServicesTransportation ServicesOther Support Services
Enterprise Funds
Cost per ADM
General Fund Only
Revenue Expenditures
* Includes General, Special Education and Pension Funds
Home County: PenningtonArea in Square Miles: 1,320
2005 K-12 Fall Enrollment: 257
$0$0$0$0
$0$0
$0$0$0
$170,327$327,467
$35,382$228,034
$2,218$0$0
$139,693$0$0
$127,768$0
$40,704$14,464
$179$1,895
$0$0$0$0$0$0$0$0
$7,644Educational Funds* $8,329
$0$12,345
$1,593,647$77,935 $76,294
$279,050 $0
$9,371

December 2005 Federal Child Count
0Deaf-Blind
08
0
DeafSpeech/Language
Autism
0Emotionally Disturbed20
15000
Mental RetardationHearing ImpairedLearning DisabledMultiple DisabilitiesOrthopedic ImpairmentVisually Impaired
2
00
Other Health Impaired
Traumatic Brain InjuryDevelopmental Delay
27Total
0
0
42
00
17
3
1
0
0
0
Home
Early Childhood Setting
PT Early Child and SEEarly Childhood SE Setting
Separate SchoolResidential Facility
Regular Classroom
Resource Room
Self-Contained Classroom
Day Program
24 Hour Program
Home/Hospital Program
Special Education Placement Categories
Total 27
Student to Staff Ratio 10.5
K-8 141.6319-12 99.022
147.668105.859
ADA ADM
Total 240.653 253.527
Student Data
PK-12 Enrollment 257Open Enrolled Students Rec'd 8District Dropout Rate 0.6%
% Special Needs Students 10.5%% Eligible for Free/Red. Lunch 20.8%
Students Transported 0
District Attendance RateNumber of Graduates
94.9%29
Enrollment
Stanford Achievement Test Series, Tenth Edition (SAT10)
75
71
80
75
72
74
Math
Social Science
Language Arts
Reading
Complete Battery
Science
Stanford Writing Assessment Program, Third Edition
Grade 5
Grade 9
American College Test (ACT)
Grade 5Total
PRSpEd
PR
Number Tested
English
22
65%
Total PR
Sp Ed PR
81
76
72
67
73
74
68
54
53
60
62
56
65%
Grade 4 Grade 3Total
PRSp Ed
PR
Grade 6Total
PRSp Ed
PR
17 20 271 1
Sp EdTotal
Number Tested
Grade 7Total
PRSp Ed
PR
Grade 8 Total
PRSp Ed
PR
Grade 11Total
PRSp Ed
PR
MathReadingScienceComposite Score
21.419.319.3
20.520.2
96
96
97
98
98
96
7
89
75
82
77
73
80
73
71
69
73
67
69
84
69
63
77
69
72
115 314 124
Percent Proficient or Higher
No assessment data are reported when less than ten students were tested.
Ideas and Development
Sp EdTotal
Organization, Unity, and Coherence
Sp EdTotal
Word Choice
Sp EdTotal
Sentences and Paragraphs
Sp EdTotal
Grammer and Usage
Sp EdTotal
Writing Mechanics
Sp EdTotal
NumberTested
100% 93% 93%
82%
64%
82%
86%
88%
79%
88%
14
17

General $588,152Capital Outlay $314,930
Pension $234,408Special Education $117,245
Ending Fund Balance
Bond Redemption $166,798Capital Projects $0
Other Fund Data
Agricultural $3.19Non-Ag Z $4.19Owner Occupied $5.13Other Non-Ag/Utilities $11.00Special Education $0.65
Bond Redemption $1.35Pension Fund $0.30
Capital Outlay $1.50
2005 Payable 2006 Levy per Thousand
$919,875$1,154
$0
General AidSpecial EducationExtraordinary Cost Fund - SE
$921,029Total State Aid
State Aid
Special Education Federal Flowthrough
$52,830IDEA Part BPart B, Sec. 619, PK $2,581
$55,411Total
K-12 Instruction $860,216PK Instruction $0Adult Instruction $0
$80,803$13,162
$0
General Special Education
Expenditures
Community Services $31,212Non-Programmed $0Debt Service $0Co-Curricular $70,490
$0$0$0$0
Total Expenditures $1,627,568 $152,637
2005 Payable 2006Taxable Valuations
Agricultural $90,520,310Owner Occupied $17,868,778Non-Ag Z $2,533,146Other Non-Ag/Utilities $11,120,639Total $122,042,873
$31,33011.7
8.7%20.9
$29,093Average Teacher SalaryExperience Adjusted SalaryAvg Years of Experience% with Advanced DegreesCertified Instructional Staff
Teaching Staff Data
ADM of Tuitioned Out Paid 0.006
General State Aid Adj. ADM 342.813Non-Public / Home Sch ADM 5.000
ADM Data
Local $596,199County $27,813State $946,310Federal $90,109Total $1,660,431
$152,747$9$0$0
$82,086$6
$1,154$50,761
General Capital Outlay Special Education Pension
$152,757 $134,007 $43,138
Revenue
Classroom Staff 0.0
ADM of Contracted Out Paid 0.000
Other Special Revenue $0
110 1st Ave SW, Warner, SD 57479-0020
2005-2006 Profile of Warner School District 06-5
Capital Outlay Pension
Student/Staff ServicesAdministration ServicesTransportation ServicesOther Support Services
Enterprise Funds
Cost per ADM
General Fund Only
Revenue Expenditures
* Includes General, Special Education and Pension Funds
Home County: BrownArea in Square Miles: 187
2005 K-12 Fall Enrollment: 308
$43,135$3$0$0
$0$0
$0$0$0
$103,466$219,942
$72,010$270,232
$3,062$0
$53,829$178,874
$0$0$0$0
$42,112$16,329
$230$0
$0$0$0$0$0$0$0$0
$5,217Educational Funds* $5,672
$166,774$0$0
$122,252 $123,670
$235,765 $0
$0

December 2005 Federal Child Count
0Deaf-Blind
018
5
DeafSpeech/Language
Autism
0Emotionally Disturbed10
16000
Mental RetardationHearing ImpairedLearning DisabledMultiple DisabilitiesOrthopedic ImpairmentVisually Impaired
4
01
Other Health Impaired
Traumatic Brain InjuryDevelopmental Delay
45Total
0
0
36
00
27
9
0
0
0
0
Home
Early Childhood Setting
PT Early Child and SEEarly Childhood SE Setting
Separate SchoolResidential Facility
Regular Classroom
Resource Room
Self-Contained Classroom
Day Program
24 Hour Program
Home/Hospital Program
Special Education Placement Categories
Total 45
Student to Staff Ratio 14.8
K-8 209.0579-12 88.371
213.98391.529
ADA ADM
Total 297.428 305.512
Student Data
PK-12 Enrollment 308Open Enrolled Students Rec'd 73District Dropout Rate 0.0%
% Special Needs Students 14.6%% Eligible for Free/Red. Lunch 25.1%
Students Transported 145
District Attendance RateNumber of Graduates
97.4%31
Enrollment
Stanford Achievement Test Series, Tenth Edition (SAT10)
86
82
78
73
76
79
Math
Social Science
Language Arts
Reading
Complete Battery
Science
Stanford Writing Assessment Program, Third Edition
Grade 5
Grade 9
American College Test (ACT)
Grade 5Total
PRSpEd
PR
Number Tested
English
19
88%
Total PR
Sp Ed PR
76
78
71
72
68
72
87
76
61
66
76
73
77%
Grade 4 Grade 3Total
PRSp Ed
PR
Grade 6Total
PRSp Ed
PR
23 18 151 4
Sp EdTotal
Number Tested
Grade 7Total
PRSp Ed
PR
Grade 8 Total
PRSp Ed
PR
Grade 11Total
PRSp Ed
PR
MathReadingScienceComposite Score
21.025.721.8
22.522.9
83
74
77
70
71
74
22 1
86
88
88
78
78
82
76
71
75
75
82
76
86
86
84
80
78
82
124 224 120
Percent Proficient or Higher
No assessment data are reported when less than ten students were tested.
Ideas and Development
Sp EdTotal
Organization, Unity, and Coherence
Sp EdTotal
Word Choice
Sp EdTotal
Sentences and Paragraphs
Sp EdTotal
Grammer and Usage
Sp EdTotal
Writing Mechanics
Sp EdTotal
NumberTested
74% 78% 83%
77%
57%
88%
57%
85%
57%
85%
23
26

General $3,859,134Capital Outlay $1,381,508
Pension $751,043Special Education $841,634
Ending Fund Balance
Bond Redemption $204,100Capital Projects $0
Other Fund Data
Agricultural $3.19Non-Ag Z $4.19Owner Occupied $5.13Other Non-Ag/Utilities $11.00Special Education $1.40
Bond Redemption $0.00Pension Fund $0.30
Capital Outlay $3.00
2005 Payable 2006 Levy per Thousand
$8,450,746$1,377,099
$0
General AidSpecial EducationExtraordinary Cost Fund - SE
$9,827,845Total State Aid
State Aid
Special Education Federal Flowthrough
$750,909IDEA Part BPart B, Sec. 619, PK $18,619
$769,528Total
K-12 Instruction $12,870,776PK Instruction $0Adult Instruction $0
$2,766,906$42,743
$0
General Special Education
Expenditures
Community Services $38,656Non-Programmed $0Debt Service $0Co-Curricular $790,789
$0$0$0$0
Total Expenditures $19,631,151 $3,844,622
2005 Payable 2006Taxable Valuations
Agricultural $106,485,820Owner Occupied $651,962,316Non-Ag Z $1,147,343Other Non-Ag/Utilities $379,081,538Total $1,138,677,017
$36,06516.3
15.5%245.0
$37,309Average Teacher SalaryExperience Adjusted SalaryAvg Years of Experience% with Advanced DegreesCertified Instructional Staff
Teaching Staff Data
ADM of Tuitioned Out Paid 10.622
General State Aid Adj. ADM 3,815.793Non-Public / Home Sch ADM 444.275
ADM Data
Local $8,507,786County $335,656State $9,008,349Federal $1,711,465Total $19,563,256
$3,562,088$0$0$0
$1,525,092$0
$1,377,099$803,394
General Capital Outlay Special Education Pension
$3,562,088 $3,705,585 $351,274
Revenue
Classroom Staff 1.0
ADM of Contracted Out Paid 0.000
Other Special Revenue $0
200 NE 9th St, Watertown, SD 57201
2005-2006 Profile of Watertown School District 14-4
Capital Outlay Pension
Student/Staff ServicesAdministration ServicesTransportation ServicesOther Support Services
Enterprise Funds
Cost per ADM
General Fund Only
Revenue Expenditures
* Includes General, Special Education and Pension Funds
Home County: CodingtonArea in Square Miles: 326
2005 K-12 Fall Enrollment: 3,833
$351,274$0$0$0
$0$0
$0$0$0
$1,770,456$1,475,553
$610,669$2,074,252
$0$0
$143,519$869,345
$0$0
$1,192,077$17,027
$698,450$202,113
$74,707$59,705
$0$0$0$0$0
$494,082$0$0
$4,963Educational Funds* $5,956
$27,487$0$0
$1,224,250 $1,236,661
$3,546,477 $494,082
$1,324,510

December 2005 Federal Child Count
0Deaf-Blind
0167
14
DeafSpeech/Language
Autism
31Emotionally Disturbed33
6211
2641
Mental RetardationHearing ImpairedLearning DisabledMultiple DisabilitiesOrthopedic ImpairmentVisually Impaired
12
27
Other Health Impaired
Traumatic Brain InjuryDevelopmental Delay
514Total
0
1
2620
00
230
191
36
4
6
0
Home
Early Childhood Setting
PT Early Child and SEEarly Childhood SE Setting
Separate SchoolResidential Facility
Regular Classroom
Resource Room
Self-Contained Classroom
Day Program
24 Hour Program
Home/Hospital Program
Special Education Placement Categories
Total 514
Student to Staff Ratio 15.7
K-8 2,484.8079-12 1,133.269
2,575.8051,227.700
ADA ADM
Total 3,618.076 3,803.505
Student Data
PK-12 Enrollment 3,857Open Enrolled Students Rec'd 100District Dropout Rate 3.5%
% Special Needs Students 13.3%% Eligible for Free/Red. Lunch 34.6%
Students Transported 666
District Attendance RateNumber of Graduates
95.1%275
Enrollment
Stanford Achievement Test Series, Tenth Edition (SAT10)
85
80
77
65
77
77
Math
Social Science
Language Arts
Reading
Complete Battery
Science
Stanford Writing Assessment Program, Third Edition
Grade 5
Grade 9
American College Test (ACT)
Grade 5Total
PRSpEd
PR
Number Tested
English
193
79%
76
76
71
47
63
67
Total PR
Sp Ed PR
76
76
67
66
71
71
50
34
39
28
38
39
73
72
64
50
74
66
23
39
35
16
34
30
80%
Grade 4 Grade 3Total
PRSp Ed
PR
Grade 6Total
PRSp Ed
PR
271 323 27431 29 16
Sp EdTotal
Number Tested
Grade 7Total
PRSp Ed
PR
Grade 8 Total
PRSp Ed
PR
Grade 11Total
PRSp Ed
PR
MathReadingScienceComposite Score
22.421.921.5
22.522.3
81 57
72 56
77 61
64 46
70 47
72 52
253 39
84 71
77 67
80 69
72 63
72 55
77 64
84 57
82 62
76 58
75 50
74 52
77 56
85 64
76 48
73 57
74 39
70 44
75 52
31263 25267 25303
Percent Proficient or Higher
No assessment data are reported when less than ten students were tested.
Ideas and Development
Sp EdTotal
Organization, Unity, and Coherence
Sp EdTotal
Word Choice
Sp EdTotal
Sentences and Paragraphs
Sp EdTotal
Grammer and Usage
Sp EdTotal
Writing Mechanics
Sp EdTotal
NumberTested
66% 64% 67%
77%
55%
68%
62%
70%
49%
75%
266
310

General $150,394Capital Outlay $337,552
PensionSpecial Education $92,695
Ending Fund Balance
Bond Redemption $0Capital Projects $0
Other Fund Data
Agricultural $3.19Non-Ag Z $4.19Owner Occupied $5.13Other Non-Ag/Utilities $11.00Special Education $1.40
Bond Redemption $0.00Pension Fund $0.00
Capital Outlay $2.31
2005 Payable 2006 Levy per Thousand
$773,999$76,751
$0
General AidSpecial EducationExtraordinary Cost Fund - SE
$850,750Total State Aid
State Aid
Special Education Federal Flowthrough
$49,598IDEA Part BPart B, Sec. 619, PK $1,593
$51,191Total
K-12 Instruction $873,176PK Instruction $0Adult Instruction $0
$97,870$8,514
$0
General Special Education
Expenditures
Community Services $0Non-Programmed $0Debt Service $0Co-Curricular $65,578
$0$0$0$0
Total Expenditures $1,594,340 $174,809
2005 Payable 2006Taxable Valuations
Agricultural $32,241,300Owner Occupied $10,503,548Non-Ag Z $190,489Other Non-Ag/Utilities $11,000,352Total $53,935,689
$29,10613.3
9.1%20.2
$28,101Average Teacher SalaryExperience Adjusted SalaryAvg Years of Experience% with Advanced DegreesCertified Instructional Staff
Teaching Staff Data
ADM of Tuitioned Out Paid 0.000
General State Aid Adj. ADM 222.697Non-Public / Home Sch ADM 7.000
ADM Data
Local $372,650County $28,258State $806,195Federal $206,468Total $1,413,571
$127,975$5,098
$0$0
$75,207$59
$76,751$60,106
General Capital Outlay Special Education Pension
$133,073 $212,123 $0
Revenue
Classroom Staff 0.0
ADM of Contracted Out Paid 0.000
Other Special Revenue $0
202 West School Road, Waubay, SD 57273
2005-2006 Profile of Waubay School District 18-3
Capital Outlay Pension
Student/Staff ServicesAdministration ServicesTransportation ServicesOther Support Services
Enterprise Funds
Cost per ADM
General Fund Only
Revenue Expenditures
* Includes General, Special Education and Pension Funds
Home County: DayArea in Square Miles: 199
2005 K-12 Fall Enrollment: 184
$0$0$0$0
$0$0
$0$0$0
$120,686$145,644
$96,473$292,783
$0$350
$13,576$35,143
$0$0
$5,008$0
$61,815$0
$6,610$0
$0$0$0$0$0$0$0$0
$8,366Educational Funds* $9,183
$0$0
$340,677$91,372 $101,893
$114,216 $0
$60,139

December 2005 Federal Child Count
0Deaf-Blind
05
2
DeafSpeech/Language
Autism
3Emotionally Disturbed30
15000
Mental RetardationHearing ImpairedLearning DisabledMultiple DisabilitiesOrthopedic ImpairmentVisually Impaired
1
05
Other Health Impaired
Traumatic Brain InjuryDevelopmental Delay
34Total
0
4
31
00
13
10
2
1
0
0
Home
Early Childhood Setting
PT Early Child and SEEarly Childhood SE Setting
Separate SchoolResidential Facility
Regular Classroom
Resource Room
Self-Contained Classroom
Day Program
24 Hour Program
Home/Hospital Program
Special Education Placement Categories
Total 34
Student to Staff Ratio 9.3
K-8 99.8959-12 79.267
103.14082.442
ADA ADM
Total 179.162 185.582
Student Data
PK-12 Enrollment 189Open Enrolled Students Rec'd 9District Dropout Rate 3.0%
% Special Needs Students 18.0%% Eligible for Free/Red. Lunch 69.2%
Students Transported 85
District Attendance RateNumber of Graduates
96.5%20
Enrollment
Stanford Achievement Test Series, Tenth Edition (SAT10)
79
84
80
58
77
75
Math
Social Science
Language Arts
Reading
Complete Battery
Science
Stanford Writing Assessment Program, Third Edition
Grade 5
Grade 9
American College Test (ACT)
Grade 5Total
PRSpEd
PR
Number Tested
English
16
53%
Total PR
Sp Ed PR
84
57
54
58
56
65
76
61
70
55
72
66
60%
Grade 4 Grade 3Total
PRSp Ed
PR
Grade 6Total
PRSp Ed
PR
12 18 183 4
Sp EdTotal
Number Tested
Grade 7Total
PRSp Ed
PR
Grade 8 Total
PRSp Ed
PR
Grade 11Total
PRSp Ed
PR
MathReadingScienceComposite Score
19.519.118.3
19.119.2
59
58
67
37
55
55
12 1
77
67
69
62
64
69
82
63
71
67
70
71
69
46
36
37
39
46
8 9 220
Percent Proficient or Higher
No assessment data are reported when less than ten students were tested.
Ideas and Development
Sp EdTotal
Organization, Unity, and Coherence
Sp EdTotal
Word Choice
Sp EdTotal
Sentences and Paragraphs
Sp EdTotal
Grammer and Usage
Sp EdTotal
Writing Mechanics
Sp EdTotal
NumberTested
40% 40% 40%
53%
40%
47%
40%
47%
40%
60%
5
15 1

General $399,945Capital Outlay $85,677
Pension $13,419Special Education ($16,916)
Ending Fund Balance
Bond Redemption $0Capital Projects $0
Other Fund Data
Agricultural $6.90Non-Ag Z $9.07Owner Occupied $11.09Other Non-Ag/Utilities $23.80Special Education $1.37
Bond Redemption $0.00Pension Fund $0.29
Capital Outlay $1.05
2005 Payable 2006 Levy per Thousand
$571,736$50,344$11,951
General AidSpecial EducationExtraordinary Cost Fund - SE
$634,031Total State Aid
State Aid
Special Education Federal Flowthrough
$22,847IDEA Part BPart B, Sec. 619, PK $561
$23,408Total
K-12 Instruction $630,564PK Instruction $0Adult Instruction $0
$75,855$6,181
$0
General Special Education
Expenditures
Community Services $0Non-Programmed $0Debt Service $0Co-Curricular $40,257
$0$0$0$0
Total Expenditures $1,065,656 $162,280
2005 Payable 2006Taxable Valuations
Agricultural $39,752,778Owner Occupied $6,863,186Non-Ag Z $655,949Other Non-Ag/Utilities $927,505Total $48,199,418
$28,8538.3
5.3%17.0
$26,961Average Teacher SalaryExperience Adjusted SalaryAvg Years of Experience% with Advanced DegreesCertified Instructional Staff
Teaching Staff Data
ADM of Tuitioned Out Paid 0.000
General State Aid Adj. ADM 171.660Non-Public / Home Sch ADM 0.000
ADM Data
Local $458,691County $9,230State $594,956Federal $52,905Total $1,115,783
$58,320$0$0$0
$67,642$0
$62,305$24,492
General Capital Outlay Special Education Pension
$58,320 $154,439 $12,378
Revenue
Classroom Staff 0.0
ADM of Contracted Out Paid 0.000
Other Special Revenue $0
319 Mary Place, Waverly, SD 57201-9700
2005-2006 Profile of Waverly School District 14-5
Capital Outlay Pension
Student/Staff ServicesAdministration ServicesTransportation ServicesOther Support Services
Enterprise Funds
Cost per ADM
General Fund Only
Revenue Expenditures
* Includes General, Special Education and Pension Funds
Home County: CodingtonArea in Square Miles: 110
2005 K-12 Fall Enrollment: 149
$12,378$0$0$0
$0$0
$0$0$0
$38,531$126,978
$56,436$172,890
$2,168$0$0
$25,987$0$0$0$0
$47,877$32,367
$0$0
$0$0$0
$183$0$0$0$0
$7,411Educational Funds* $8,493
$0$0$0
$56,432 $57,044
*District has opted out of General Fund levy
$57,101 $183
$28,946

December 2005 Federal Child Count
0Deaf-Blind
06
1
DeafSpeech/Language
Autism
0Emotionally Disturbed10
11110
Mental RetardationHearing ImpairedLearning DisabledMultiple DisabilitiesOrthopedic ImpairmentVisually Impaired
0
01
Other Health Impaired
Traumatic Brain InjuryDevelopmental Delay
22Total
0
0
30
10
16
1
1
0
0
0
Home
Early Childhood Setting
PT Early Child and SEEarly Childhood SE Setting
Separate SchoolResidential Facility
Regular Classroom
Resource Room
Self-Contained Classroom
Day Program
24 Hour Program
Home/Hospital Program
Special Education Placement Categories
Total 22
Student to Staff Ratio 9.5
K-8 99.9409-12 38.618
102.11239.953
ADA ADM
Total 138.558 142.065
Student Data
PK-12 Enrollment 161Open Enrolled Students Rec'd 74District Dropout Rate 3.0%
% Special Needs Students 13.7%% Eligible for Free/Red. Lunch 33.8%
Students Transported 117
District Attendance RateNumber of Graduates
97.5%10
Enrollment
Stanford Achievement Test Series, Tenth Edition (SAT10)
82
83
74
64
73
74
Math
Social Science
Language Arts
Reading
Complete Battery
Science
Stanford Writing Assessment Program, Third Edition
Grade 5
Grade 9
American College Test (ACT)
Grade 5Total
PRSpEd
PR
Number Tested
English
6
86%
Total PR
Sp Ed PR
53
33
57
50
52
49
54
76
72
41
81
66
79%
Grade 4 Grade 3Total
PRSp Ed
PR
Grade 6Total
PRSp Ed
PR
12 10 53 1 2
Sp EdTotal
Number Tested
Grade 7Total
PRSp Ed
PR
Grade 8 Total
PRSp Ed
PR
Grade 11Total
PRSp Ed
PR
MathReadingScienceComposite Score
71
63
65
43
57
7 2
82
78
86
54
70
75
80
71
73
73
62
71
79
73
82
80
74
76
18 116 110
Percent Proficient or Higher
No assessment data are reported when less than ten students were tested.
Ideas and Development
Sp EdTotal
Organization, Unity, and Coherence
Sp EdTotal
Word Choice
Sp EdTotal
Sentences and Paragraphs
Sp EdTotal
Grammer and Usage
Sp EdTotal
Writing Mechanics
Sp EdTotal
NumberTested
63% 63% 50%
71%
50%
64%
50%
64%
38%
86%
8
14

General $320,225Capital Outlay $286,575
Pension $6,246Special Education $39,832
Ending Fund Balance
Bond Redemption $67,110Capital Projects $26,899
Other Fund Data
Agricultural $3.19Non-Ag Z $4.19Owner Occupied $5.13Other Non-Ag/Utilities $11.00Special Education $1.40
Bond Redemption $0.44Pension Fund $0.30
Capital Outlay $3.00
2005 Payable 2006 Levy per Thousand
$1,397,232$60,050
$0
General AidSpecial EducationExtraordinary Cost Fund - SE
$1,457,282Total State Aid
State Aid
Special Education Federal Flowthrough
$105,167IDEA Part BPart B, Sec. 619, PK $5,617
$110,784Total
K-12 Instruction $1,588,764PK Instruction $0Adult Instruction $0
$302,630$18,760
$0
General Special Education
Expenditures
Community Services $2,780Non-Programmed $0Debt Service $0Co-Curricular $174,576
$0$0$0$0
Total Expenditures $2,742,641 $460,863
2005 Payable 2006Taxable Valuations
Agricultural $73,984,306Owner Occupied $42,513,375Non-Ag Z $1,275,046Other Non-Ag/Utilities $37,515,419Total $155,288,146
$28,42119.4
13.9%35.3
$30,728Average Teacher SalaryExperience Adjusted SalaryAvg Years of Experience% with Advanced DegreesCertified Instructional Staff
Teaching Staff Data
ADM of Tuitioned Out Paid 0.000
General State Aid Adj. ADM 515.626Non-Public / Home Sch ADM 1.971
ADM Data
Local $1,008,072County $42,706State $1,463,183Federal $151,791Total $2,665,752
$495,555$1,264
$0$0
$217,358$590
$60,050$104,316
General Capital Outlay Special Education Pension
$496,819 $382,314 $46,628
Revenue
Classroom Staff 2.5
ADM of Contracted Out Paid 0.000
Other Special Revenue $0
102 E Ninth Ave, Webster, SD 57274
2005-2006 Profile of Webster School District 18-4
Capital Outlay Pension
Student/Staff ServicesAdministration ServicesTransportation ServicesOther Support Services
Enterprise Funds
Cost per ADM
General Fund Only
Revenue Expenditures
* Includes General, Special Education and Pension Funds
Home County: DayArea in Square Miles: 387
2005 K-12 Fall Enrollment: 498
$46,502$126
$0$0
$0$0
$0$0$0
$110,804$257,106$240,557$368,055
$234,383$0
$47,138$158,936
$0$0
$176,273$25,498
$139,473$0$0$0
$0$0$0$0$0
$48,443$0$0
$5,374Educational Funds* $6,257
$69,001$0$0
$161,330 $163,722
$719,221 $48,443
$76,993

December 2005 Federal Child Count
0Deaf-Blind
09
5
DeafSpeech/Language
Autism
0Emotionally Disturbed10
36010
Mental RetardationHearing ImpairedLearning DisabledMultiple DisabilitiesOrthopedic ImpairmentVisually Impaired
3
09
Other Health Impaired
Traumatic Brain InjuryDevelopmental Delay
64Total
0
0
100
00
45
8
1
0
0
0
Home
Early Childhood Setting
PT Early Child and SEEarly Childhood SE Setting
Separate SchoolResidential Facility
Regular Classroom
Resource Room
Self-Contained Classroom
Day Program
24 Hour Program
Home/Hospital Program
Special Education Placement Categories
Total 64
Student to Staff Ratio 13.5
K-8 326.9579-12 156.002
335.676164.133
ADA ADM
Total 482.959 499.809
Student Data
PK-12 Enrollment 511Open Enrolled Students Rec'd 32District Dropout Rate 2.2%
% Special Needs Students 12.5%% Eligible for Free/Red. Lunch 32.4%
Students Transported 183
District Attendance RateNumber of Graduates
96.6%45
Enrollment
Stanford Achievement Test Series, Tenth Edition (SAT10)
89
88
81
81
79
82
Math
Social Science
Language Arts
Reading
Complete Battery
Science
Stanford Writing Assessment Program, Third Edition
Grade 5
Grade 9
American College Test (ACT)
Grade 5Total
PRSpEd
PR
Number Tested
English
30
59%
Total PR
Sp Ed PR
79
69
69
67
70
71
77
72
68
59
79
70
76%
Grade 4 Grade 3Total
PRSp Ed
PR
Grade 6Total
PRSp Ed
PR
38 32 443 5 4
Sp EdTotal
Number Tested
Grade 7Total
PRSp Ed
PR
Grade 8 Total
PRSp Ed
PR
Grade 11Total
PRSp Ed
PR
MathReadingScienceComposite Score
21.520.720.8
21.221.1
86
75
75
69
72
75
36 4
80
75
82
76
73
76
69
72
70
67
62
66
84
78
76
69
74
76
340 241 442
Percent Proficient or Higher
No assessment data are reported when less than ten students were tested.
Ideas and Development
Sp EdTotal
Organization, Unity, and Coherence
Sp EdTotal
Word Choice
Sp EdTotal
Sentences and Paragraphs
Sp EdTotal
Grammer and Usage
Sp EdTotal
Writing Mechanics
Sp EdTotal
NumberTested
88% 83% 78%
65%
65%
62%
75%
73%
78%
70%
40
37

General $193,798Capital Outlay $278,018
Pension $61,673Special Education $139,784
Ending Fund Balance
Bond Redemption $0Capital Projects $0
Other Fund Data
Agricultural $4.03Non-Ag Z $5.29Owner Occupied $6.48Other Non-Ag/Utilities $13.90Special Education $1.40
Bond Redemption $0.00Pension Fund $0.30
Capital Outlay $1.47
2005 Payable 2006 Levy per Thousand
$674,289$0$0
General AidSpecial EducationExtraordinary Cost Fund - SE
$674,289Total State Aid
State Aid
Special Education Federal Flowthrough
$67,255IDEA Part BPart B, Sec. 619, PK $2,590
$69,845Total
K-12 Instruction $1,224,929PK Instruction $0Adult Instruction $0
$234,430$0$0
General Special Education
Expenditures
Community Services $0Non-Programmed $0Debt Service $0Co-Curricular $113,005
$0$0$0$0
Total Expenditures $2,116,668 $318,004
2005 Payable 2006Taxable Valuations
Agricultural $184,529,552Owner Occupied $15,245,067Non-Ag Z $1,356,745Other Non-Ag/Utilities $8,322,244Total $209,453,608
$29,67017.5
12.1%30.2
$31,624Average Teacher SalaryExperience Adjusted SalaryAvg Years of Experience% with Advanced DegreesCertified Instructional Staff
Teaching Staff Data
ADM of Tuitioned Out Paid 0.000
General State Aid Adj. ADM 339.839Non-Public / Home Sch ADM 0.000
ADM Data
Local $1,141,574County $36,240State $711,875Federal $197,349Total $2,087,039
$304,465$891
$0$0
$288,444$844
$0$64,841
General Capital Outlay Special Education Pension
$305,356 $354,129 $61,978
Revenue
Classroom Staff 0.0
ADM of Contracted Out Paid 0.000
Other Special Revenue $0
302 Dakota Ave N., Wessington Springs, SD 57382
2005-2006 Profile of Wessington Springs School District 36-2
Capital Outlay Pension
Student/Staff ServicesAdministration ServicesTransportation ServicesOther Support Services
Enterprise Funds
Cost per ADM
General Fund Only
Revenue Expenditures
* Includes General, Special Education and Pension Funds
Home County: JerauldArea in Square Miles: 745
2005 K-12 Fall Enrollment: 258
$61,797$181
$0$0
$0$0
$48,180$0$0
$130,647$245,190$120,258$282,638
$2,572$317
$0$85,586
$0$0$0
$9,759
$83,574$0$0$0
$3,190$7,700
$0$6,150
$0$0$0
$2,655
$7,001Educational Funds* $8,278
$0$0$0
$127,233 $125,475
*District has opted out of General Fund levy
$349,270 $67,875
$251,036

December 2005 Federal Child Count
0Deaf-Blind
08
3
DeafSpeech/Language
Autism
1Emotionally Disturbed40
13100
Mental RetardationHearing ImpairedLearning DisabledMultiple DisabilitiesOrthopedic ImpairmentVisually Impaired
4
00
Other Health Impaired
Traumatic Brain InjuryDevelopmental Delay
34Total
0
0
00
00
32
1
1
0
0
0
Home
Early Childhood Setting
PT Early Child and SEEarly Childhood SE Setting
Separate SchoolResidential Facility
Regular Classroom
Resource Room
Self-Contained Classroom
Day Program
24 Hour Program
Home/Hospital Program
Special Education Placement Categories
Total 34
Student to Staff Ratio 8.5
K-8 185.6199-12 108.003
189.579112.795
ADA ADM
Total 293.622 302.374
Student Data
PK-12 Enrollment 258Open Enrolled Students Rec'd 23District Dropout Rate 2.8%
% Special Needs Students 13.2%% Eligible for Free/Red. Lunch 54.7%
Students Transported 149
District Attendance RateNumber of Graduates
97.1%27
Enrollment
Stanford Achievement Test Series, Tenth Edition (SAT10)
71
76
76
54
72
69
Math
Social Science
Language Arts
Reading
Complete Battery
Science
Stanford Writing Assessment Program, Third Edition
Grade 5
Grade 9
American College Test (ACT)
Grade 5Total
PRSpEd
PR
Number Tested
English
19
85%
Total PR
Sp Ed PR
83
73
81
67
70
75
77
73
57
53
65
64
95%
Grade 4 Grade 3Total
PRSp Ed
PR
Grade 6Total
PRSp Ed
PR
20 28 28 1
Sp EdTotal
Number Tested
Grade 7Total
PRSp Ed
PR
Grade 8 Total
PRSp Ed
PR
Grade 11Total
PRSp Ed
PR
MathReadingScienceComposite Score
21.620.520.1
22.321.4
56
71
67
50
77
66
16
62
67
74
66
68
66
61
66
60
66
58
61
84
70
71
78
70
74
19 15 25
Percent Proficient or Higher
No assessment data are reported when less than ten students were tested.
Ideas and Development
Sp EdTotal
Organization, Unity, and Coherence
Sp EdTotal
Word Choice
Sp EdTotal
Sentences and Paragraphs
Sp EdTotal
Grammer and Usage
Sp EdTotal
Writing Mechanics
Sp EdTotal
NumberTested
55% 50% 60%
85%
40%
85%
35%
80%
55%
95%
20
20

General $1,062,858Capital Outlay $497,185
Pension $239,585Special Education ($12,737)
Ending Fund Balance
Bond Redemption $252,030Capital Projects $677,025
Other Fund Data
Agricultural $3.19Non-Ag Z $4.19Owner Occupied $5.13Other Non-Ag/Utilities $11.00Special Education $1.40
Bond Redemption $0.82Pension Fund $0.30
Capital Outlay $3.00
2005 Payable 2006 Levy per Thousand
$3,137,819$306,977
$44,271
General AidSpecial EducationExtraordinary Cost Fund - SE
$3,489,067Total State Aid
State Aid
Special Education Federal Flowthrough
$210,109IDEA Part BPart B, Sec. 619, PK $12,222
$222,331Total
K-12 Instruction $3,048,968PK Instruction $0Adult Instruction $0
$594,702$52,202
$0
General Special Education
Expenditures
Community Services $47,344Non-Programmed $0Debt Service $0Co-Curricular $312,041
$0$0$0$0
Total Expenditures $5,775,214 $1,015,740
2005 Payable 2006Taxable Valuations
Agricultural $84,479,559Owner Occupied $177,024,730Non-Ag Z $4,496,364Other Non-Ag/Utilities $42,941,846Total $308,942,499
$33,08213.3
19.5%75.6
$32,207Average Teacher SalaryExperience Adjusted SalaryAvg Years of Experience% with Advanced DegreesCertified Instructional Staff
Teaching Staff Data
ADM of Tuitioned Out Paid 18.383
General State Aid Adj. ADM 1,155.649Non-Public / Home Sch ADM 12.861
ADM Data
Local $1,956,156County $59,648State $3,452,757Federal $245,984Total $5,714,545
$889,766$0$0
$7,903
$412,330$0
$351,248$231,747
General Capital Outlay Special Education Pension
$897,669 $995,324 $93,793
Revenue
Classroom Staff 0.0
ADM of Contracted Out Paid 0.000
Other Special Revenue $0
115 N Main, Hartford, SD 57033-0730
2005-2006 Profile of West Central School District 49-7
Capital Outlay Pension
Student/Staff ServicesAdministration ServicesTransportation ServicesOther Support Services
Enterprise Funds
Cost per ADM
General Fund Only
Revenue Expenditures
* Includes General, Special Education and Pension Funds
Home County: MinnehahaArea in Square Miles: 165
2005 K-12 Fall Enrollment: 1,135
$93,793$0$0$0
$0$0
$0$0$0
$524,062$600,717$288,878$953,205
$25,192$4,810
$16,964$737,962
$0$0
$377,548$41,376
$273,782$62,631$32,423
$0
$0$0$0$0$0
$27,866$0$0
$5,029Educational Funds* $5,687
$254,150$82,870
$0$513,120 $511,601
$1,373,632 $27,866
$169,781

December 2005 Federal Child Count
0Deaf-Blind
133
1
DeafSpeech/Language
Autism
8Emotionally Disturbed40
62620
Mental RetardationHearing ImpairedLearning DisabledMultiple DisabilitiesOrthopedic ImpairmentVisually Impaired
11
028
Other Health Impaired
Traumatic Brain InjuryDevelopmental Delay
156Total
0
0
031
00
89
25
1
7
3
0
Home
Early Childhood Setting
PT Early Child and SEEarly Childhood SE Setting
Separate SchoolResidential Facility
Regular Classroom
Resource Room
Self-Contained Classroom
Day Program
24 Hour Program
Home/Hospital Program
Special Education Placement Categories
Total 156
Student to Staff Ratio 15.0
K-8 768.4399-12 331.184
789.484346.903
ADA ADM
Total 1,099.623 1,136.387
Student Data
PK-12 Enrollment 1,135Open Enrolled Students Rec'd 4District Dropout Rate 0.5%
% Special Needs Students 13.7%% Eligible for Free/Red. Lunch 14.5%
Students Transported 488
District Attendance RateNumber of Graduates
96.8%80
Enrollment
Stanford Achievement Test Series, Tenth Edition (SAT10)
82
80
78
59
68
73
Math
Social Science
Language Arts
Reading
Complete Battery
Science
Stanford Writing Assessment Program, Third Edition
Grade 5
Grade 9
American College Test (ACT)
Grade 5Total
PRSpEd
PR
Number Tested
English
55
72%
52
65
53
28
31
43
Total PR
Sp Ed PR
79
78
73
72
67
73
78
74
63
53
72
68
77%
Grade 4 Grade 3Total
PRSp Ed
PR
Grade 6Total
PRSp Ed
PR
78 102 8911 5 7
Sp EdTotal
Number Tested
Grade 7Total
PRSp Ed
PR
Grade 8 Total
PRSp Ed
PR
Grade 11Total
PRSp Ed
PR
MathReadingScienceComposite Score
21.522.020.9
21.421.6
80 49
75 53
80 61
65 39
66 44
71 44
76 15
82
83
87
61
75
76
75 37
80 58
71 39
70 41
60 24
70 37
71
75
73
71
66
69
682 1693 797
Percent Proficient or Higher
No assessment data are reported when less than ten students were tested.
Ideas and Development
Sp EdTotal
Organization, Unity, and Coherence
Sp EdTotal
Word Choice
Sp EdTotal
Sentences and Paragraphs
Sp EdTotal
Grammer and Usage
Sp EdTotal
Writing Mechanics
Sp EdTotal
NumberTested
78% 77% 79%
80%
61%
75%
65%
84%
52%
89%
82
75

General $482,247Capital Outlay $620,719
Pension $700Special Education $40,256
Ending Fund Balance
Bond Redemption $0Capital Projects $0
Other Fund Data
Agricultural $5.08Non-Ag Z $6.67Owner Occupied $8.17Other Non-Ag/Utilities $17.52Special Education $1.40
Bond Redemption $0.00Pension Fund $0.30
Capital Outlay $1.25
2005 Payable 2006 Levy per Thousand
$457,358$0$0
General AidSpecial EducationExtraordinary Cost Fund - SE
$457,358Total State Aid
State Aid
Special Education Federal Flowthrough
$28,953IDEA Part BPart B, Sec. 619, PK $575
$29,528Total
K-12 Instruction $676,061PK Instruction $0Adult Instruction $0
$120,215$0$0
General Special Education
Expenditures
Community Services $23,942Non-Programmed $0Debt Service $0Co-Curricular $62,773
$0$0$0$0
Total Expenditures $1,196,204 $164,666
2005 Payable 2006Taxable Valuations
Agricultural $83,516,822Owner Occupied $6,590,152Non-Ag Z $228,770Other Non-Ag/Utilities $3,418,951Total $93,754,695
$30,90416.5
10.5%16.2
$30,523Average Teacher SalaryExperience Adjusted SalaryAvg Years of Experience% with Advanced DegreesCertified Instructional Staff
Teaching Staff Data
ADM of Tuitioned Out Paid 1.000
General State Aid Adj. ADM 195.809Non-Public / Home Sch ADM 0.000
ADM Data
Local $582,958County $13,632State $482,640Federal $161,358Total $1,240,588
$125,563$0$0$0
$123,296$0$0
$27,356
General Capital Outlay Special Education Pension
$125,563 $150,652 $26,766
Revenue
Classroom Staff 0.0
ADM of Contracted Out Paid 0.000
Other Special Revenue $104,434
502 E Division St, White Lake, SD 57383
2005-2006 Profile of White Lake School District 01-3
Capital Outlay Pension
Student/Staff ServicesAdministration ServicesTransportation ServicesOther Support Services
Enterprise Funds
Cost per ADM
General Fund Only
Revenue Expenditures
* Includes General, Special Education and Pension Funds
Home County: AuroraArea in Square Miles: 246
2005 K-12 Fall Enrollment: 163
$26,766$0$0$0
$0$0
$24,982$0$0
$55,250$134,697
$41,551$201,929
$25,957$727
$1,783$22,282
$0$0
$43,356$1,725
$43,933$0$0
$518
$0$875
$0$0$0$0$0$0
$7,200Educational Funds* $7,976
$0$0
$104,434$81,623 $92,206
*District has opted out of General Fund levy
$118,989 $25,857
$23,159
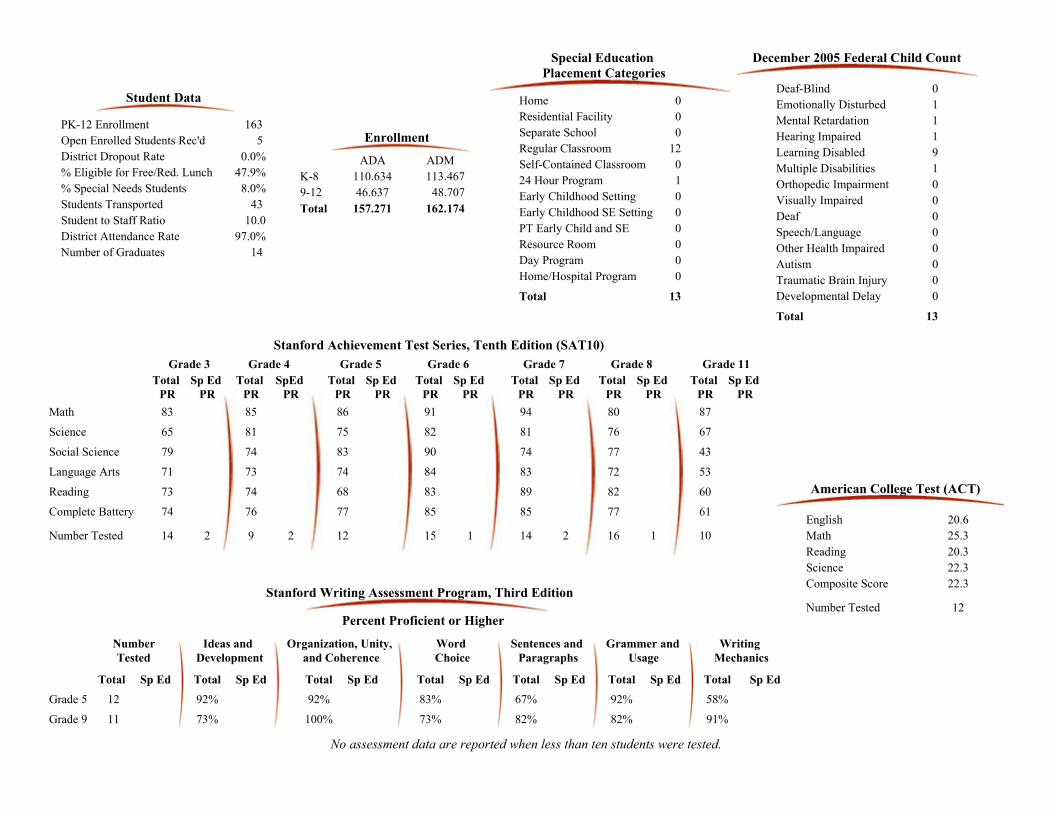
December 2005 Federal Child Count
0Deaf-Blind
00
0
DeafSpeech/Language
Autism
1Emotionally Disturbed119100
Mental RetardationHearing ImpairedLearning DisabledMultiple DisabilitiesOrthopedic ImpairmentVisually Impaired
0
00
Other Health Impaired
Traumatic Brain InjuryDevelopmental Delay
13Total
0
0
00
00
12
0
0
0
1
0
Home
Early Childhood Setting
PT Early Child and SEEarly Childhood SE Setting
Separate SchoolResidential Facility
Regular Classroom
Resource Room
Self-Contained Classroom
Day Program
24 Hour Program
Home/Hospital Program
Special Education Placement Categories
Total 13
Student to Staff Ratio 10.0
K-8 110.6349-12 46.637
113.46748.707
ADA ADM
Total 157.271 162.174
Student Data
PK-12 Enrollment 163Open Enrolled Students Rec'd 5District Dropout Rate 0.0%
% Special Needs Students 8.0%% Eligible for Free/Red. Lunch 47.9%
Students Transported 43
District Attendance RateNumber of Graduates
97.0%14
Enrollment
Stanford Achievement Test Series, Tenth Edition (SAT10)
85
81
74
73
74
76
Math
Social Science
Language Arts
Reading
Complete Battery
Science
Stanford Writing Assessment Program, Third Edition
Grade 5
Grade 9
American College Test (ACT)
Grade 5Total
PRSpEd
PR
Number Tested
English
12
100%
Total PR
Sp Ed PR
80
76
77
72
82
77
87
67
43
53
60
61
73%
Grade 4 Grade 3Total
PRSp Ed
PR
Grade 6Total
PRSp Ed
PR
9 16 102 1
Sp EdTotal
Number Tested
Grade 7Total
PRSp Ed
PR
Grade 8 Total
PRSp Ed
PR
Grade 11Total
PRSp Ed
PR
MathReadingScienceComposite Score
20.325.320.6
22.322.3
83
65
79
71
73
74
14 2
86
75
83
74
68
77
91
82
90
84
83
85
94
81
74
83
89
85
12 115 214
Percent Proficient or Higher
No assessment data are reported when less than ten students were tested.
Ideas and Development
Sp EdTotal
Organization, Unity, and Coherence
Sp EdTotal
Word Choice
Sp EdTotal
Sentences and Paragraphs
Sp EdTotal
Grammer and Usage
Sp EdTotal
Writing Mechanics
Sp EdTotal
NumberTested
92% 92% 83%
73%
67%
82%
92%
82%
58%
91%
12
11

General $90,699Capital Outlay $6,985
Pension $12,600Special Education $45,809
Ending Fund Balance
Bond Redemption $0Capital Projects $923,537
Other Fund Data
Agricultural $3.19Non-Ag Z $4.19Owner Occupied $5.13Other Non-Ag/Utilities $11.00Special Education $1.40
Bond Redemption $0.00Pension Fund $0.30
Capital Outlay $0.50
2005 Payable 2006 Levy per Thousand
$1,399,950$152,784
$0
General AidSpecial EducationExtraordinary Cost Fund - SE
$1,552,734Total State Aid
State Aid
Special Education Federal Flowthrough
$101,498IDEA Part BPart B, Sec. 619, PK $8,049
$109,547Total
K-12 Instruction $1,964,340PK Instruction $0Adult Instruction $0
$378,695$0$0
General Special Education
Expenditures
Community Services $1,028Non-Programmed $0Debt Service $0Co-Curricular $132,802
$0$0$0$0
Total Expenditures $3,419,670 $445,875
2005 Payable 2006Taxable Valuations
Agricultural $76,745,771Owner Occupied $5,243,471Non-Ag Z $0Other Non-Ag/Utilities $3,824,909Total $85,814,151
$32,48610.5
14.6%40.4
$31,720Average Teacher SalaryExperience Adjusted SalaryAvg Years of Experience% with Advanced DegreesCertified Instructional Staff
Teaching Staff Data
ADM of Tuitioned Out Paid 0.000
General State Aid Adj. ADM 397.611Non-Public / Home Sch ADM 7.910
ADM Data
Local $470,394County $18,978State $1,445,173Federal $695,971Total $2,630,516
$28,115$0$0$0
$111,627$0
$152,784$138,280
General Capital Outlay Special Education Pension
$28,115 $402,691 $23,148
Revenue
Classroom Staff 3.1
ADM of Contracted Out Paid 0.000
Other Special Revenue $0
S 2nd & Brock, White River, SD 57579-0273
2005-2006 Profile of White River School District 47-1
Capital Outlay Pension
Student/Staff ServicesAdministration ServicesTransportation ServicesOther Support Services
Enterprise Funds
Cost per ADM
General Fund Only
Revenue Expenditures
* Includes General, Special Education and Pension Funds
Home County: MelletteArea in Square Miles: 914
2005 K-12 Fall Enrollment: 386
$23,148$0$0$0
$0$0
$0$0$0
$200,164$474,965
$93,480$552,892
$36,579$736
$0$46,056
$0$0$0
$7,560
$49,956$17,056
$168$0
$0$0$0$0$0
$33,547$0$0
$9,144Educational Funds* $10,403
$0$882,703$812,662$178,616 $206,023
$172,306 $33,547
$81,375

December 2005 Federal Child Count
0Deaf-Blind
020
2
DeafSpeech/Language
Autism
3Emotionally Disturbed21
54200
Mental RetardationHearing ImpairedLearning DisabledMultiple DisabilitiesOrthopedic ImpairmentVisually Impaired
0
06
Other Health Impaired
Traumatic Brain InjuryDevelopmental Delay
90Total
0
2
120
00
47
26
1
0
0
2
Home
Early Childhood Setting
PT Early Child and SEEarly Childhood SE Setting
Separate SchoolResidential Facility
Regular Classroom
Resource Room
Self-Contained Classroom
Day Program
24 Hour Program
Home/Hospital Program
Special Education Placement Categories
Total 90
Student to Staff Ratio 9.4
K-8 252.9979-12 106.612
268.121106.679
ADA ADM
Total 359.609 374.800
Student Data
PK-12 Enrollment 409Open Enrolled Students Rec'd 15District Dropout Rate 5.8%
% Special Needs Students 22.0%% Eligible for Free/Red. Lunch 68.0%
Students Transported 152
District Attendance RateNumber of Graduates
95.9%22
Enrollment
Stanford Achievement Test Series, Tenth Edition (SAT10)
36
39
35
18
36
35
Math
Social Science
Language Arts
Reading
Complete Battery
Science
Stanford Writing Assessment Program, Third Edition
Grade 5
Grade 9
American College Test (ACT)
Grade 5Total
PRSpEd
PR
Number Tested
English
14
71%
Total PR
Sp Ed PR
65
61
61
62
62
62
38
50
39
43
46
44
50%
Grade 4 Grade 3Total
PRSp Ed
PR
Grade 6Total
PRSp Ed
PR
25 29 244 7 4
Sp EdTotal
Number Tested
Grade 7Total
PRSp Ed
PR
Grade 8 Total
PRSp Ed
PR
Grade 11Total
PRSp Ed
PR
MathReadingScienceComposite Score
20.217.519.1
19.419.1
47
45
37
33
48
45
24 3
43
47
45
34
46
43
50
44
36
45
35
42
61
33
51
38
29
42
738 832 624
Percent Proficient or Higher
No assessment data are reported when less than ten students were tested.
Ideas and Development
Sp EdTotal
Organization, Unity, and Coherence
Sp EdTotal
Word Choice
Sp EdTotal
Sentences and Paragraphs
Sp EdTotal
Grammer and Usage
Sp EdTotal
Writing Mechanics
Sp EdTotal
NumberTested
42% 31% 42%
45%
28%
42%
31%
53%
25%
74%
36
38

General $480,830Capital Outlay $593,488
PensionSpecial Education ($2,278)
Ending Fund Balance
Bond Redemption $0Capital Projects $0
Other Fund Data
Agricultural $4.08Non-Ag Z $5.36Owner Occupied $6.56Other Non-Ag/Utilities $14.07Special Education $1.40
Bond Redemption $0.00Pension Fund $0.30
Capital Outlay $2.00
2005 Payable 2006 Levy per Thousand
$716,293$46,386$15,254
General AidSpecial EducationExtraordinary Cost Fund - SE
$777,933Total State Aid
State Aid
Special Education Federal Flowthrough
$44,486IDEA Part BPart B, Sec. 619, PK $1,094
$45,580Total
K-12 Instruction $946,005PK Instruction $837Adult Instruction $0
$192,192$8,278
$0
General Special Education
Expenditures
Community Services $0Non-Programmed $6,797Debt Service $0Co-Curricular $44,367
$0$0$0$0
Total Expenditures $1,433,802 $263,695
2005 Payable 2006Taxable Valuations
Agricultural $87,866,944Owner Occupied $6,004,966Non-Ag Z $2,323,822Other Non-Ag/Utilities $3,740,760Total $99,936,492
$30,85419.3
15.4%22.7
$31,759Average Teacher SalaryExperience Adjusted SalaryAvg Years of Experience% with Advanced DegreesCertified Instructional Staff
Teaching Staff Data
ADM of Tuitioned Out Paid 0.231
General State Aid Adj. ADM 237.643Non-Public / Home Sch ADM 0.000
ADM Data
Local $535,611County $17,066State $747,951Federal $132,169Total $1,432,796
$215,053$0$0$0
$140,533$0
$61,640$43,652
General Capital Outlay Special Education Pension
$215,053 $245,825 $30,467
Revenue
Classroom Staff 0.0
ADM of Contracted Out Paid 0.000
Other Special Revenue $0
400 Garfield St, Willow Lake, SD 57278-0170
2005-2006 Profile of Willow Lake School District 12-3
Capital Outlay Pension
Student/Staff ServicesAdministration ServicesTransportation ServicesOther Support Services
Enterprise Funds
Cost per ADM
General Fund Only
Revenue Expenditures
* Includes General, Special Education and Pension Funds
Home County: ClarkArea in Square Miles: 302
2005 K-12 Fall Enrollment: 198
$30,467$0$0$0
$0$0
$30,467$0$0
$58,322$109,861
$91,180$176,432
$32$0
$61,215$41,991
$0$0
$57,330$3,514
$60,883$1,847
$403$92
$0$0$0$0$0$0$0$0
$7,271Educational Funds* $8,721
$0$0$0
$86,725 $94,244
*District has opted out of General Fund levy
$201,940 $30,467
$37,859

December 2005 Federal Child Count
0Deaf-Blind
03
2
DeafSpeech/Language
Autism
2Emotionally Disturbed00
13300
Mental RetardationHearing ImpairedLearning DisabledMultiple DisabilitiesOrthopedic ImpairmentVisually Impaired
0
00
Other Health Impaired
Traumatic Brain InjuryDevelopmental Delay
23Total
0
0
10
00
17
1
2
1
1
0
Home
Early Childhood Setting
PT Early Child and SEEarly Childhood SE Setting
Separate SchoolResidential Facility
Regular Classroom
Resource Room
Self-Contained Classroom
Day Program
24 Hour Program
Home/Hospital Program
Special Education Placement Categories
Total 23
Student to Staff Ratio 8.7
K-8 138.5499-12 51.595
143.20553.887
ADA ADM
Total 190.144 197.092
Student Data
PK-12 Enrollment 198Open Enrolled Students Rec'd 5District Dropout Rate 0.0%
% Special Needs Students 11.6%% Eligible for Free/Red. Lunch 65.5%
Students Transported 72
District Attendance RateNumber of Graduates
96.5%13
Enrollment
Stanford Achievement Test Series, Tenth Edition (SAT10)
71
65
74
61
64
65
Math
Social Science
Language Arts
Reading
Complete Battery
Science
Stanford Writing Assessment Program, Third Edition
Grade 5
Grade 9
American College Test (ACT)
Grade 5Total
PRSpEd
PR
Number Tested
English
7
75%
Total PR
Sp Ed PR
79
75
58
72
68
71
81
80
73
59
81
75
75%
Grade 4 Grade 3Total
PRSp Ed
PR
Grade 6Total
PRSp Ed
PR
14 17 131 3
Sp EdTotal
Number Tested
Grade 7Total
PRSp Ed
PR
Grade 8 Total
PRSp Ed
PR
Grade 11Total
PRSp Ed
PR
MathReadingScienceComposite Score
75
63
66
59
51
61
13 2
72
69
59
56
44
59
74
69
81
60
62
69
80
78
68
71
64
71
415 118 320
Percent Proficient or Higher
No assessment data are reported when less than ten students were tested.
Ideas and Development
Sp EdTotal
Organization, Unity, and Coherence
Sp EdTotal
Word Choice
Sp EdTotal
Sentences and Paragraphs
Sp EdTotal
Grammer and Usage
Sp EdTotal
Writing Mechanics
Sp EdTotal
NumberTested
27% 27% 20%
58%
7%
92%
27%
83%
27%
92%
15
12

General $271,714Capital Outlay $127,771
PensionSpecial Education $34,216
Ending Fund Balance
Bond Redemption $110,865Capital Projects $0
Other Fund Data
Agricultural $3.19Non-Ag Z $4.19Owner Occupied $5.13Other Non-Ag/Utilities $11.00Special Education $1.00
Bond Redemption $1.29Pension Fund $0.00
Capital Outlay $1.61
2005 Payable 2006 Levy per Thousand
$854,566$41,000
$0
General AidSpecial EducationExtraordinary Cost Fund - SE
$895,566Total State Aid
State Aid
Special Education Federal Flowthrough
$50,448IDEA Part BPart B, Sec. 619, PK $3,058
$53,506Total
K-12 Instruction $952,056PK Instruction $21,128Adult Instruction $0
$136,871$0$0
General Special Education
Expenditures
Community Services $0Non-Programmed $0Debt Service $0Co-Curricular $67,926
$0$0$0$0
Total Expenditures $1,675,289 $205,740
2005 Payable 2006Taxable Valuations
Agricultural $65,280,467Owner Occupied $16,597,206Non-Ag Z $1,560,092Other Non-Ag/Utilities $10,840,664Total $94,278,429
$30,30414.7
3.8%24.3
$29,737Average Teacher SalaryExperience Adjusted SalaryAvg Years of Experience% with Advanced DegreesCertified Instructional Staff
Teaching Staff Data
ADM of Tuitioned Out Paid 0.000
General State Aid Adj. ADM 293.727Non-Public / Home Sch ADM 0.000
ADM Data
Local $548,919County $51,316State $889,006Federal $147,223Total $1,636,464
$156,280$0$0$0
$105,242$0
$41,000$51,327
General Capital Outlay Special Education Pension
$156,280 $197,569 $0
Revenue
Classroom Staff 0.0
ADM of Contracted Out Paid 0.000
Other Special Revenue $0
800 Ordway St, Wilmot, SD 57279
2005-2006 Profile of Wilmot School District 54-7
Capital Outlay Pension
Student/Staff ServicesAdministration ServicesTransportation ServicesOther Support Services
Enterprise Funds
Cost per ADM
General Fund Only
Revenue Expenditures
* Includes General, Special Education and Pension Funds
Home County: RobertsArea in Square Miles: 225
2005 K-12 Fall Enrollment: 255
$0$0$0$0
$0$0
$0$0$0
$96,222$212,612$122,600$202,744
$0$0
$11,975$84,062
$0$0
$53,460$0
$68,809$60
$0$0
$0$0$0$0$0$0$0$0
$6,523Educational Funds* $7,335
$119,498$0$0
$134,165 $134,618
$149,496 $0
$0

December 2005 Federal Child Count
0Deaf-Blind
07
0
DeafSpeech/Language
Autism
3Emotionally Disturbed00
13300
Mental RetardationHearing ImpairedLearning DisabledMultiple DisabilitiesOrthopedic ImpairmentVisually Impaired
2
02
Other Health Impaired
Traumatic Brain InjuryDevelopmental Delay
30Total
1
0
51
00
19
4
0
0
0
0
Home
Early Childhood Setting
PT Early Child and SEEarly Childhood SE Setting
Separate SchoolResidential Facility
Regular Classroom
Resource Room
Self-Contained Classroom
Day Program
24 Hour Program
Home/Hospital Program
Special Education Placement Categories
Total 30
Student to Staff Ratio 10.5
K-8 166.3629-12 83.126
167.78385.793
ADA ADM
Total 249.488 253.576
Student Data
PK-12 Enrollment 255Open Enrolled Students Rec'd 19District Dropout Rate 1.5%
% Special Needs Students 11.8%% Eligible for Free/Red. Lunch 41.4%
Students Transported 160
District Attendance RateNumber of Graduates
98.4%17
Enrollment
Stanford Achievement Test Series, Tenth Edition (SAT10)
84
80
77
53
75
75
Math
Social Science
Language Arts
Reading
Complete Battery
Science
Stanford Writing Assessment Program, Third Edition
Grade 5
Grade 9
American College Test (ACT)
Grade 5Total
PRSpEd
PR
Number Tested
English
15
71%
Total PR
Sp Ed PR
79
75
79
71
66
73
69
78
65
56
71
67
57%
Grade 4 Grade 3Total
PRSp Ed
PR
Grade 6Total
PRSp Ed
PR
15 21 241 4
Sp EdTotal
Number Tested
Grade 7Total
PRSp Ed
PR
Grade 8 Total
PRSp Ed
PR
Grade 11Total
PRSp Ed
PR
MathReadingScienceComposite Score
20.520.319.1
20.020.1
61
79
74
47
67
65
20 2
78
82
87
62
59
73
74
70
71
65
61
68
78
62
67
67
61
67
224 124 317
Percent Proficient or Higher
No assessment data are reported when less than ten students were tested.
Ideas and Development
Sp EdTotal
Organization, Unity, and Coherence
Sp EdTotal
Word Choice
Sp EdTotal
Sentences and Paragraphs
Sp EdTotal
Grammer and Usage
Sp EdTotal
Writing Mechanics
Sp EdTotal
NumberTested
32% 24% 24%
71%
39%
67%
32%
71%
28%
71%
25
21

General $214,970Capital Outlay $426,363
PensionSpecial Education $213,721
Ending Fund Balance
Bond Redemption $0Capital Projects $0
Other Fund Data
Agricultural $3.19Non-Ag Z $4.19Owner Occupied $5.13Other Non-Ag/Utilities $11.00Special Education $1.30
Bond Redemption $0.00Pension Fund $0.00
Capital Outlay $3.00
2005 Payable 2006 Levy per Thousand
$2,355,229$188,926
$0
General AidSpecial EducationExtraordinary Cost Fund - SE
$2,544,155Total State Aid
State Aid
Special Education Federal Flowthrough
$181,050IDEA Part BPart B, Sec. 619, PK $6,836
$187,886Total
K-12 Instruction $2,985,342PK Instruction $0Adult Instruction $0
$516,997$74,550
$0
General Special Education
Expenditures
Community Services $18,711Non-Programmed $82,607Debt Service $0Co-Curricular $400,408
$0$0$0$0
Total Expenditures $5,394,650 $840,426
2005 Payable 2006Taxable Valuations
Agricultural $238,509,438Owner Occupied $61,026,909Non-Ag Z $3,131,425Other Non-Ag/Utilities $32,122,491Total $334,790,263
$28,55115.1
6.6%74.3
$29,179Average Teacher SalaryExperience Adjusted SalaryAvg Years of Experience% with Advanced DegreesCertified Instructional Staff
Teaching Staff Data
ADM of Tuitioned Out Paid 0.799
General State Aid Adj. ADM 846.594Non-Public / Home Sch ADM 7.882
ADM Data
Local $1,855,956County $51,240State $2,469,536Federal $676,581Total $5,053,313
$975,694$0$0$0
$423,378$0
$188,926$210,778
General Capital Outlay Special Education Pension
$975,694 $823,083 $0
Revenue
Classroom Staff 0.0
ADM of Contracted Out Paid 0.000
Other Special Revenue $0
431 East 7th Street, Winner, SD 57580
2005-2006 Profile of Winner School District 59-2
Capital Outlay Pension
Student/Staff ServicesAdministration ServicesTransportation ServicesOther Support Services
Enterprise Funds
Cost per ADM
General Fund Only
Revenue Expenditures
* Includes General, Special Education and Pension Funds
Home County: TrippArea in Square Miles: 1,185
2005 K-12 Fall Enrollment: 856
$0$0$0$0
$0$0
$0$0$0
$561,615$501,159
$95,361$749,447
$119,560$4,099
$13,886$205,172
$0$0
$363,880$4,353
$142,235$89,317$15,107$2,220
$0$0$0$0$0$0$0$0
$6,298Educational Funds* $7,110
$0$0
$218,800$301,936 $308,405
$804,707 $0
$93,758

December 2005 Federal Child Count
0Deaf-Blind
023
6
DeafSpeech/Language
Autism
1Emotionally Disturbed81
49400
Mental RetardationHearing ImpairedLearning DisabledMultiple DisabilitiesOrthopedic ImpairmentVisually Impaired
0
124
Other Health Impaired
Traumatic Brain InjuryDevelopmental Delay
117Total
0
10
190
00
71
10
5
1
1
0
Home
Early Childhood Setting
PT Early Child and SEEarly Childhood SE Setting
Separate SchoolResidential Facility
Regular Classroom
Resource Room
Self-Contained Classroom
Day Program
24 Hour Program
Home/Hospital Program
Special Education Placement Categories
Total 117
Student to Staff Ratio 12.1
K-8 532.4539-12 276.050
554.133297.663
ADA ADM
Total 808.503 851.796
Student Data
PK-12 Enrollment 896Open Enrolled Students Rec'd 30District Dropout Rate 2.1%
% Special Needs Students 13.1%% Eligible for Free/Red. Lunch 25.1%
Students Transported 24
District Attendance RateNumber of Graduates
94.9%72
Enrollment
Stanford Achievement Test Series, Tenth Edition (SAT10)
71
74
69
46
63
64
Math
Social Science
Language Arts
Reading
Complete Battery
Science
Stanford Writing Assessment Program, Third Edition
Grade 5
Grade 9
American College Test (ACT)
Grade 5Total
PRSpEd
PR
Number Tested
English
51
64%
Total PR
Sp Ed PR
76
78
69
72
71
73
63
62
55
51
69
59
63%
Grade 4 Grade 3Total
PRSp Ed
PR
Grade 6Total
PRSp Ed
PR
67 73 637 3 4
Sp EdTotal
Number Tested
Grade 7Total
PRSp Ed
PR
Grade 8 Total
PRSp Ed
PR
Grade 11Total
PRSp Ed
PR
MathReadingScienceComposite Score
22.221.321.3
21.821.8
83
69
72
64
63
70
48 6
75
77
84
65
68
73
71
76
68
69
64
68
76
69
69
72
67
70
766 359 259
Percent Proficient or Higher
No assessment data are reported when less than ten students were tested.
Ideas and Development
Sp EdTotal
Organization, Unity, and Coherence
Sp EdTotal
Word Choice
Sp EdTotal
Sentences and Paragraphs
Sp EdTotal
Grammer and Usage
Sp EdTotal
Writing Mechanics
Sp EdTotal
NumberTested
65% 60% 60%
57%
55%
41%
55%
56%
46%
67%
65
75

General $478,801Capital Outlay $261,772
Pension $9,329Special Education $51,819
Ending Fund Balance
Bond Redemption $0Capital Projects $0
Other Fund Data
Agricultural $3.19Non-Ag Z $4.19Owner Occupied $5.13Other Non-Ag/Utilities $11.00Special Education $1.40
Bond Redemption $0.00Pension Fund $0.30
Capital Outlay $2.50
2005 Payable 2006 Levy per Thousand
$526,428$0$0
General AidSpecial EducationExtraordinary Cost Fund - SE
$526,428Total State Aid
State Aid
Special Education Federal Flowthrough
$46,796IDEA Part BPart B, Sec. 619, PK $1,575
$48,371Total
K-12 Instruction $793,253PK Instruction $0Adult Instruction $0
$225,309$0$0
General Special Education
Expenditures
Community Services $70,185Non-Programmed $4,253Debt Service $0Co-Curricular $61,378
$0$0$0$0
Total Expenditures $1,438,828 $316,306
2005 Payable 2006Taxable Valuations
Agricultural $122,949,662Owner Occupied $13,518,025Non-Ag Z $1,715,568Other Non-Ag/Utilities $14,863,723Total $153,046,978
$28,10316.4
14.3%20.3
$28,452Average Teacher SalaryExperience Adjusted SalaryAvg Years of Experience% with Advanced DegreesCertified Instructional Staff
Teaching Staff Data
ADM of Tuitioned Out Paid 0.000
General State Aid Adj. ADM 263.808Non-Public / Home Sch ADM 8.780
ADM Data
Local $719,337County $22,994State $625,086Federal $147,097Total $1,514,514
$312,590$0$0$0
$200,942$0$0
$44,168
General Capital Outlay Special Education Pension
$312,590 $245,111 $43,059
Revenue
Classroom Staff 0.7
ADM of Contracted Out Paid 0.000
Other Special Revenue $0
375 Ash St SE, Wolsey, SD 57384
2005-2006 Profile of Wolsey Wessington Sch District 02-6
Capital Outlay Pension
Student/Staff ServicesAdministration ServicesTransportation ServicesOther Support Services
Enterprise Funds
Cost per ADM
General Fund Only
Revenue Expenditures
* Includes General, Special Education and Pension Funds
Home County: BeadleArea in Square Miles: 397
2005 K-12 Fall Enrollment: 225
$43,059$0$0$0
$0$0
$29,960$0$0
$49,138$122,529$102,576$235,516
$0$0
$68,473$44,649
$0$0
$93,415$0
$79,818$0
$7,900$3,279
$595$3,850
$0$4,570
$0$0$0$0
$6,204Educational Funds* $7,805
$0$0$0
$98,442 $113,408
$256,565 $38,975
$50,028

December 2005 Federal Child Count
0Deaf-Blind
04
3
DeafSpeech/Language
Autism
1Emotionally Disturbed20
14010
Mental RetardationHearing ImpairedLearning DisabledMultiple DisabilitiesOrthopedic ImpairmentVisually Impaired
3
21
Other Health Impaired
Traumatic Brain InjuryDevelopmental Delay
31Total
0
1
10
00
22
6
0
0
0
1
Home
Early Childhood Setting
PT Early Child and SEEarly Childhood SE Setting
Separate SchoolResidential Facility
Regular Classroom
Resource Room
Self-Contained Classroom
Day Program
24 Hour Program
Home/Hospital Program
Special Education Placement Categories
Total 31
Student to Staff Ratio 10.7
K-8 148.2759-12 62.464
153.17666.663
ADA ADM
Total 210.739 219.839
Student Data
PK-12 Enrollment 225Open Enrolled Students Rec'd 38District Dropout Rate 0.0%
% Special Needs Students 13.8%% Eligible for Free/Red. Lunch 35.9%
Students Transported 161
District Attendance RateNumber of Graduates
95.9%23
Enrollment
Stanford Achievement Test Series, Tenth Edition (SAT10)
78
78
74
58
77
74
Math
Social Science
Language Arts
Reading
Complete Battery
Science
Stanford Writing Assessment Program, Third Edition
Grade 5
Grade 9
American College Test (ACT)
Grade 5Total
PRSpEd
PR
Number Tested
English
82%
Total PR
Sp Ed PR
79
71
60
59
63
67
58
80
65
45
77
66
82%
Grade 4 Grade 3Total
PRSp Ed
PR
Grade 6Total
PRSp Ed
PR
18 25 131 4 1
Sp EdTotal
Number Tested
Grade 7Total
PRSp Ed
PR
Grade 8 Total
PRSp Ed
PR
Grade 11Total
PRSp Ed
PR
MathReadingScienceComposite Score
77
74
59
69
69
70
15 3
74
69
82
69
59
70
72
65
57
65
55
63
83
75
69
76
67
73
116 213 317
Percent Proficient or Higher
No assessment data are reported when less than ten students were tested.
Ideas and Development
Sp EdTotal
Organization, Unity, and Coherence
Sp EdTotal
Word Choice
Sp EdTotal
Sentences and Paragraphs
Sp EdTotal
Grammer and Usage
Sp EdTotal
Writing Mechanics
Sp EdTotal
NumberTested
65% 59% 65%
82%
59%
73%
65%
64%
41%
82%
17
11

General ($12,962)Capital Outlay ($34)
PensionSpecial Education $147,978
Ending Fund Balance
Bond Redemption $0Capital Projects $0
Other Fund Data
Agricultural $4.69Non-Ag Z $6.16Owner Occupied $7.54Other Non-Ag/Utilities $16.17Special Education $1.02
Bond Redemption $0.00Pension Fund $0.00
Capital Outlay $0.07
2005 Payable 2006 Levy per Thousand
$93,952$0$0
General AidSpecial EducationExtraordinary Cost Fund - SE
$93,952Total State Aid
State Aid
Special Education Federal Flowthrough
$11,047IDEA Part BPart B, Sec. 619, PK $514
$11,561Total
K-12 Instruction $352,438PK Instruction $0Adult Instruction $0
$39,853$0$0
General Special Education
Expenditures
Community Services $0Non-Programmed $0Debt Service $0Co-Curricular $0
$0$0$0$0
Total Expenditures $522,825 $76,721
2005 Payable 2006Taxable Valuations
Agricultural $56,424,434Owner Occupied $2,717,326Non-Ag Z $0Other Non-Ag/Utilities $939,897Total $60,081,657
$30,63914.8
0.0%6.0
$30,803Average Teacher SalaryExperience Adjusted SalaryAvg Years of Experience% with Advanced DegreesCertified Instructional Staff
Teaching Staff Data
ADM of Tuitioned Out Paid 0.000
General State Aid Adj. ADM 68.676Non-Public / Home Sch ADM 0.000
ADM Data
Local $312,830County $3,969State $102,871Federal $55,288Total $474,958
$4,173$0$0$0
$63,064$0$0
$14,789
General Capital Outlay Special Education Pension
$4,173 $77,853 $0
Revenue
Classroom Staff 0.0
ADM of Contracted Out Paid 15.508
Other Special Revenue $0
102 School St, Wood, SD 57585
2005-2006 Profile of Wood School District 47-2
Capital Outlay Pension
Student/Staff ServicesAdministration ServicesTransportation ServicesOther Support Services
Enterprise Funds
Cost per ADM
General Fund Only
Revenue Expenditures
* Includes General, Special Education and Pension Funds
Home County: MelletteArea in Square Miles: 480
2005 K-12 Fall Enrollment: 42
$0$0$0$0
$0$0
$0$0$0
$2,009$67,771$17,534$83,074
$0$0$0
$4,510$0$0$0$0
$36,868$0$0$0
$0$0$0$0$0$0$0$0
$10,721Educational Funds* $12,560
$0$0
$25,536$0 $0
*District has opted out of General Fund levy
$8,377 $0
$3,867

December 2005 Federal Child Count
0Deaf-Blind
01
0
DeafSpeech/Language
Autism
0Emotionally Disturbed004000
Mental RetardationHearing ImpairedLearning DisabledMultiple DisabilitiesOrthopedic ImpairmentVisually Impaired
0
02
Other Health Impaired
Traumatic Brain InjuryDevelopmental Delay
7Total
0
0
10
00
6
0
0
0
0
0
Home
Early Childhood Setting
PT Early Child and SEEarly Childhood SE Setting
Separate SchoolResidential Facility
Regular Classroom
Resource Room
Self-Contained Classroom
Day Program
24 Hour Program
Home/Hospital Program
Special Education Placement Categories
Total 7
Student to Staff Ratio 7.0
K-8 38.9589-12 0.000
41.7220.000
ADA ADM
Total 38.958 41.722
Student Data
PK-12 Enrollment 42Open Enrolled Students Rec'd 2District Dropout Rate 0.0%
% Special Needs Students 12.2%% Eligible for Free/Red. Lunch 0.0%
Students Transported 0
District Attendance RateNumber of Graduates
93.4%0
Enrollment
Stanford Achievement Test Series, Tenth Edition (SAT10)
28
39
40
17
23
29
Math
Social Science
Language Arts
Reading
Complete Battery
Science
Stanford Writing Assessment Program, Third Edition
Grade 5
Grade 9
American College Test (ACT)
Grade 5Total
PRSpEd
PR
Number Tested
English
Total PR
Sp Ed PR
78
69
68
63
69
70
Grade 4 Grade 3Total
PRSp Ed
PR
Grade 6Total
PRSp Ed
PR
2 3
Sp EdTotal
Number Tested
Grade 7Total
PRSp Ed
PR
Grade 8 Total
PRSp Ed
PR
Grade 11Total
PRSp Ed
PR
MathReadingScienceComposite Score
76
74
88
66
89
79
79
75
80
71
68
74
71
60
51
59
46
57
14 6 212
Percent Proficient or Higher
No assessment data are reported when less than ten students were tested.
Ideas and Development
Sp EdTotal
Organization, Unity, and Coherence
Sp EdTotal
Word Choice
Sp EdTotal
Sentences and Paragraphs
Sp EdTotal
Grammer and Usage
Sp EdTotal
Writing Mechanics
Sp EdTotal
NumberTested
75% 75% 75% 75% 75% 50%4

General $627,103Capital Outlay $366,152
Pension $35,157Special Education $79,866
Ending Fund Balance
Bond Redemption $0Capital Projects $297,209
Other Fund Data
Agricultural $4.66Non-Ag Z $6.12Owner Occupied $7.49Other Non-Ag/Utilities $16.07Special Education $1.40
Bond Redemption $0.00Pension Fund $0.30
Capital Outlay $2.50
2005 Payable 2006 Levy per Thousand
$544,038$54,009
$0
General AidSpecial EducationExtraordinary Cost Fund - SE
$598,047Total State Aid
State Aid
Special Education Federal Flowthrough
$35,419IDEA Part BPart B, Sec. 619, PK $2,033
$37,452Total
K-12 Instruction $716,298PK Instruction $7,763Adult Instruction $0
$114,928$1,408
$0
General Special Education
Expenditures
Community Services $43,196Non-Programmed $0Debt Service $0Co-Curricular $69,127
$0$0$0$0
Total Expenditures $1,281,828 $189,884
2005 Payable 2006Taxable Valuations
Agricultural $63,290,199Owner Occupied $10,026,845Non-Ag Z $762,275Other Non-Ag/Utilities $6,703,460Total $80,782,779
$28,77615.9
19.0%18.7
$28,628Average Teacher SalaryExperience Adjusted SalaryAvg Years of Experience% with Advanced DegreesCertified Instructional Staff
Teaching Staff Data
ADM of Tuitioned Out Paid 0.000
General State Aid Adj. ADM 204.034Non-Public / Home Sch ADM 0.000
ADM Data
Local $646,893County $12,878State $563,649Federal $135,774Total $1,359,194
$145,953$0$0$0
$106,367$0
$54,076$37,452
General Capital Outlay Special Education Pension
$145,953 $197,895 $22,725
Revenue
Classroom Staff 0.2
ADM of Contracted Out Paid 0.000
Other Special Revenue $0
101 N 2nd Ave, Woonsocket, SD 57385-0428
2005-2006 Profile of Woonsocket School District 55-4
Capital Outlay Pension
Student/Staff ServicesAdministration ServicesTransportation ServicesOther Support Services
Enterprise Funds
Cost per ADM
General Fund Only
Revenue Expenditures
* Includes General, Special Education and Pension Funds
Home County: SanbornArea in Square Miles: 220
2005 K-12 Fall Enrollment: 169
$22,725$0$0$0
$0$0
$0$0$0
$32,520$100,961
$63,591$248,372
$0$0$0
$100,825$0$0
$39,690$7,651
$26,895$46,654
$0$0
$0$0$0$0$0$0$0$0
$7,222Educational Funds* $8,299
$0$0$0
$73,620 $80,512
*District has opted out of General Fund levy
$166,212 $0
$18,046

December 2005 Federal Child Count
0Deaf-Blind
011
2
DeafSpeech/Language
Autism
1Emotionally Disturbed305000
Mental RetardationHearing ImpairedLearning DisabledMultiple DisabilitiesOrthopedic ImpairmentVisually Impaired
1
00
Other Health Impaired
Traumatic Brain InjuryDevelopmental Delay
23Total
0
0
40
00
14
5
0
0
0
0
Home
Early Childhood Setting
PT Early Child and SEEarly Childhood SE Setting
Separate SchoolResidential Facility
Regular Classroom
Resource Room
Self-Contained Classroom
Day Program
24 Hour Program
Home/Hospital Program
Special Education Placement Categories
Total 23
Student to Staff Ratio 9.0
K-8 111.1249-12 53.629
113.52256.506
ADA ADM
Total 164.753 170.028
Student Data
PK-12 Enrollment 170Open Enrolled Students Rec'd 9District Dropout Rate 1.0%
% Special Needs Students 13.5%% Eligible for Free/Red. Lunch 38.6%
Students Transported 47
District Attendance RateNumber of Graduates
96.9%13
Enrollment
Stanford Achievement Test Series, Tenth Edition (SAT10)
77
77
81
57
80
77
Math
Social Science
Language Arts
Reading
Complete Battery
Science
Stanford Writing Assessment Program, Third Edition
Grade 5
Grade 9
American College Test (ACT)
Grade 5Total
PRSpEd
PR
Number Tested
English
9
78%
Total PR
Sp Ed PR
74
62
65
67
64
67
86
72
74
84
91
83
56%
Grade 4 Grade 3Total
PRSp Ed
PR
Grade 6Total
PRSp Ed
PR
9 14 171 3
Sp EdTotal
Number Tested
Grade 7Total
PRSp Ed
PR
Grade 8 Total
PRSp Ed
PR
Grade 11Total
PRSp Ed
PR
MathReadingScienceComposite Score
83
77
79
69
68
73
15
88
85
86
77
75
82
88
81
81
69
74
79
90
77
79
77
75
79
28 311 17
Percent Proficient or Higher
No assessment data are reported when less than ten students were tested.
Ideas and Development
Sp EdTotal
Organization, Unity, and Coherence
Sp EdTotal
Word Choice
Sp EdTotal
Sentences and Paragraphs
Sp EdTotal
Grammer and Usage
Sp EdTotal
Writing Mechanics
Sp EdTotal
NumberTested
63% 38% 75%
78%
50%
89%
50%
56%
50%
89%
8
9

General $5,961,306Capital Outlay $1,525,904
Pension $6,775Special Education $439,910
Ending Fund Balance
Bond Redemption $984,618Capital Projects $0
Other Fund Data
Agricultural $3.19Non-Ag Z $4.19Owner Occupied $5.13Other Non-Ag/Utilities $11.00Special Education $1.40
Bond Redemption $1.26Pension Fund $0.30
Capital Outlay $3.00
2005 Payable 2006 Levy per Thousand
$7,655,029$1,254,147
$0
General AidSpecial EducationExtraordinary Cost Fund - SE
$8,909,176Total State Aid
State Aid
Special Education Federal Flowthrough
$607,604IDEA Part BPart B, Sec. 619, PK $20,088
$627,692Total
K-12 Instruction $9,076,673PK Instruction $0Adult Instruction $3,271
$2,004,320$0$0
General Special Education
Expenditures
Community Services $0Non-Programmed $0Debt Service $0Co-Curricular $637,606
$0$0$0$0
Total Expenditures $15,321,280 $2,941,579
2005 Payable 2006Taxable Valuations
Agricultural $92,868,338Owner Occupied $437,618,496Non-Ag Z $1,913,225Other Non-Ag/Utilities $238,397,903Total $770,797,962
$37,37117.7
51.7%174.5
$39,127Average Teacher SalaryExperience Adjusted SalaryAvg Years of Experience% with Advanced DegreesCertified Instructional Staff
Teaching Staff Data
ADM of Tuitioned Out Paid 8.383
General State Aid Adj. ADM 2,966.190Non-Public / Home Sch ADM 343.121
ADM Data
Local $6,051,210County $445,073State $7,948,231Federal $949,538Total $15,394,051
$2,325,314$0$0$0
$1,084,793$0
$1,254,147$709,333
General Capital Outlay Special Education Pension
$2,325,314 $3,048,273 $227,920
Revenue
Classroom Staff 0.0
ADM of Contracted Out Paid 0.000
Other Special Revenue $0
1900 Ferdig, Yankton, SD 57078
2005-2006 Profile of Yankton School District 63-3
Capital Outlay Pension
Student/Staff ServicesAdministration ServicesTransportation ServicesOther Support Services
Enterprise Funds
Cost per ADM
General Fund Only
Revenue Expenditures
* Includes General, Special Education and Pension Funds
Home County: YanktonArea in Square Miles: 216
2005 K-12 Fall Enrollment: 2,990
$227,920$0$0$0
$0$0
$223,000$0$0
$1,226,389$1,593,749
$311,415$2,472,177
$29,710$4,337
$105,032$665,254
$0$0
$531,855$99,635
$690,247$177,288
$69,012$712
$0$0$0$0$0$0$0$0
$5,176Educational Funds* $6,121
$1,005,298$0
$65,928$1,206,901 $1,322,212
$2,056,958 $223,000
$621,136

December 2005 Federal Child Count
0Deaf-Blind
0122
12
DeafSpeech/Language
Autism
15Emotionally Disturbed47
2224
1201
Mental RetardationHearing ImpairedLearning DisabledMultiple DisabilitiesOrthopedic ImpairmentVisually Impaired
14
15
Other Health Impaired
Traumatic Brain InjuryDevelopmental Delay
455Total
0
0
824
00
262
128
24
2
7
0
Home
Early Childhood Setting
PT Early Child and SEEarly Childhood SE Setting
Separate SchoolResidential Facility
Regular Classroom
Resource Room
Self-Contained Classroom
Day Program
24 Hour Program
Home/Hospital Program
Special Education Placement Categories
Total 455
Student to Staff Ratio 17.2
K-8 1,881.3349-12 958.425
1,943.4771,014.118
ADA ADM
Total 2,839.759 2,957.595
Student Data
PK-12 Enrollment 2,995Open Enrolled Students Rec'd 20District Dropout Rate 1.9%
% Special Needs Students 15.2%% Eligible for Free/Red. Lunch 34.0%
Students Transported 922
District Attendance RateNumber of Graduates
96.0%219
Enrollment
Stanford Achievement Test Series, Tenth Edition (SAT10)
76
79
75
61
70
71
Math
Social Science
Language Arts
Reading
Complete Battery
Science
Stanford Writing Assessment Program, Third Edition
Grade 5
Grade 9
American College Test (ACT)
Grade 5Total
PRSpEd
PR
Number Tested
English
162
81%
49
60
59
35
34
42
Total PR
Sp Ed PR
76
74
64
72
67
68
84
80
76
70
83
78
77%
Grade 4 Grade 3Total
PRSp Ed
PR
Grade 6Total
PRSp Ed
PR
205 249 25325 8
Sp EdTotal
Number Tested
Grade 7Total
PRSp Ed
PR
Grade 8 Total
PRSp Ed
PR
Grade 11Total
PRSp Ed
PR
MathReadingScienceComposite Score
22.322.322.9
22.722.7
71 48
71 59
72 56
66 45
67 46
68 47
202 31
74 48
78 67
80 61
65 45
65 41
71 50
67
68
72
65
61
65
74
74
67
68
60
66
27216 194 242
Percent Proficient or Higher
No assessment data are reported when less than ten students were tested.
Ideas and Development
Sp EdTotal
Organization, Unity, and Coherence
Sp EdTotal
Word Choice
Sp EdTotal
Sentences and Paragraphs
Sp EdTotal
Grammer and Usage
Sp EdTotal
Writing Mechanics
Sp EdTotal
NumberTested
62% 62% 62%
74%
56%
70%
55%
71%
38%
75%
222
265