
Density-matrix formalism for the photoion-electron entanglement in atomic photoionization
Upload
independentCategory
view
1download
0
SPECTROCHIMICA ACTA
PART B
E L S E V I E R Spectrochimica Acta Part B 52 (1997) 295-304
Analytical time-resolved laser enhanced ionization spectroscopy I. Collisional ionization and photoionization of the Hg Rydberg states in
a low pressure gas
W.L. Clevenger, L.S. Mordoh, O.I. Matveev a, N. Omenetto 2, B.W. Smith, J.D. Winefordner*
Department of Chemistry, University of Florida, Gainesville, FL 32611-7200, USA
Received 7 June 1996; accepted 4 September 1996
Abstract
The temporal behavior of the laser enhanced ionization signal of mercury was studied in a quartz cell under low buffer gas pressure. Using fast electronics and a short (34 ns) laser pulse, it was possible to distinguish, in one single time-resolved ionization waveform, the non-selective photoionization component of the signal from that which was due to collisional ionization from selected levels. Experimental results were shown to agree with those obtained by computer simulation, and optimal conditions for deconvolution of the two components were studied. © 1997 Elsevier Science B.V.
Keywords: Mercury; Time-resolved Ionization; Rydberg Levels; Photoionization; Collisional Ionization
I. Introduct ion
In laser enhanced ionization (LEI) spectroscopy [1], the process of ion formation due to collisional ionization of analyte atoms can practically always be accompanied by their resonance photoionization and by non-selective ionization of molecules and/or atoms of buffer gas. Often, in order to improve the limit of detection, one needs to acquire separate infor- mation about the contribution of the LEI signal bearing useful analytical information and the signal due to non-selective photoionization. This subject has been treated in several papers, together with the
* Corresponding author. ~On leave from Department of Chemistry, Moscow State
University, Moscow, Russia. 2 Present address: Environment Institute, Joint Research Centre,
Ispra, (Va) Italy.
different concepts associated with the two definitions of ion yield and ionization efficiency [2-6]. Most work has been performed in flames operated at atmospheric pressure. Recently, it has been suggested [7] that when using flames as atomizers, this informa- tion can be obtained by observing a single time- resolved ionization waveform under conditions when the faster photoionization component and the slower collisional ionization component of the signal can be distinguished from one another. This idea can be extended to other atom reservoirs, such as a low pressure buffer gas. The deconvolution becomes pos- sible when (1) the duration of the laser pulse is shorter than the average time in the collisional ionization process and (2) the distance between the collection electrode and the laser beam is less than the average distance traveled by the electron as a result of its drift velocity during the process of the collisional
0584-8547/97/$17.00 © 1997 Elsevier Science B.V. All rights reserved, PH $0584-8547(96)01589-3

296 W.L. Clevenger et al./Spectrochimica Acta Part B 52 (1997) 295-304
ionization; that is, the duration of the ionization signal from a single electron should be less than the recipro- cal of the rate of collisional ionization. This last con- dition is not always mandatory; in principle, if one knows all of the experimental parameters including the mobility of electrons in a gaseous media, the con- figuration of the electric field between electrodes, and certain parameters of the preamplifier and input cir- cuit, information on photoionization and collisional ionization can be obtained by mathematical deconvo- lution of the computerized digital information from the signal waveform. However, the second require- ment is necessary in this work, as it will allow signal that is due only to the analyte (collisional ionization) to be distinguished and extracted from the non-selec- tive or background signal (photoionization and sec- ondary ionization effects) without computerized deconvolution. It is essential to stress here that space charge effects must be absent. In fact, their presence would distort the shape of the ionization
pulse and make their interpretation in terms of ioniza- tion mechanism difficult [7].
Time-resolved measurements of the current induced by the charges produced in a flame and in hollow cathode discharges have been theoretically modeled and experimentally observed [1,8-12]. However, the aim of these studies (with the exception of [8]) was to elucidate the process of charge detec- tion, with the assumption that charge creation was instantaneous.
In this work, the temporal behavior of the ioniza- tion signal was studied in a quartz cell containing mercury vapor and a buffer gas at low pressure in order to elucidate the processes of ion formation. A three-step LEI scheme of mercury [13] was utilized, in which the third step excited the analyte to a Rydberg level near the ionization continuum. Ioniza- tion signal waveforms were obtained by tuning the third laser step to levels with different principal quan- tum number (n = 10-26) under different buffer gas
. . . .....- , .
......... ...-
y . . . - ' "
.......................... kBS ............... ............
tO' t
I-IV Sour~
Oscilloscope
//////~,
J ~'12
Fig. 1. Experimental setup. The optical arrangement shown is oversimplified; the exact arrangement can be obtained from the authors. M = mirror, BS ~ beam splitter. The insert shows a basic schematic of the ionization scheme.

W.L. Clevenger et al./Spectrochimica Acta Part B 52 (1997) 295-304 297
pressures (0.05-600 Torr), with variable voltage and beam position between the electrodes. In this way, two clearly distinguishable components of the signal were observed, which could be attributed to collisional ionization and to photoionization.
2. Experimental
The experimental setup used in this work is shown in Fig. 1. Three dye lasers (laser 1, Molectron, Portland, OR; lasers 2 and 3, Model Scanmate 1, Lambda Physik, Acton, MA) were pumped by an
Table 1 Excitation transitions for Hg for laser-connected levels 1, 2, 3, and 4 (Rydberg level) a
Excitation Level Energy Wavelength step (cm -I) (nm)
) k 1 2
X23 X34
6p3P~ 39412.3 253.652 7s3S1 62350.5 435.832 9p3P~ 79412.7 585.925 9p3P~ 79613.3 579.118 10p3p~ 80916.7 538.463 lOp3p°2 81022.9 535.400 llp3p~ 81811.9 513.694 llp3P~ 81873.8 512.064 12p3p~ 82379.0 499.148 12p3p~ 82422.6 498.064 13p3p° I 82765.9 489.689 13p3p~ 82795.0 488.991 14p3p~ 83039.3 483.217 14p3P~ 83061.2 482.706 15p~P~ 83240.1 478.572 15p~PII 2 83258.7 478.145 16p~P~ 83396.7 475.011 16p3p~ 83407.2 474.774 17p3P~ 83512.7 472.408 17p3p~ 83521.6 472.209 18p3p°l 83601.9 470.425 18p3p~ 83613.9 470.159 19p3p~ 83677.9 468.748 19p3p~ 83686.0 468.570 20p3P~ 83745.7 467.263 21p3P°2 83792.8 466.236 22p3P~ 83834.5 465.329 23p3P~ 83868.0 464.609 24p3p~ 83892.6 464.075 25p3p~ 83920.8 463.468 26p3pl~ 2 83942.0 463.013
excimer laser (Model LPX-240i, Lambda Physik, Acton, MA) operated with XeCI. The wavelengths of the three dye lasers are listed in Table 1. Laser dyes used include Coumarin 500 (Exciton, Dayton OH), frequency doubled, for h12, Coumarin 120 (Lambda Physik, Acton MA) for ),23, and Coumarin 153 and 47 (Lambda Physik) for the different )k34 wavelengths. The frequencies of the first and second lasers remained constant, while the wavelength of the third laser was tuned to levels with different principal quantum number. Pulse energies were typically 150 mJ for the excimer, 100-150/xJ for ~k12 , 200- 300 tzJ for X23, and 0.5-1 mJ for X34. Laser pulse durations were approximately 34 ns (FWHM), rather than the LPX-240i nominal duration of 14 ns.
The temporal behavior of this unusual laser pulse is presented in Fig. 2. Here, the output of dye lasers one, two, and three were observed with a fast photodiode (Model ET 2000, rise time < 200 ps, Electro-Optics Technology, Fremont CA) and recorded with the fast digitizing oscilloscope (Model 602A, 500 MHz band- width, Tektronix, Beaverton, OR). Each pulse con- sisted of two maxima, the first more intense than the second, with a minimum in between them. After observing the pulse from the excimer itself, it was confirmed that this behavior is characteristic of the pump beam and not the dye output. At present, we have no explanation of such unusual behavior. How- ever, rather than hindering our work, this behavior was very helpful in identifying the different sources of ionization. This is because in general, if one
900
8OO
~" 700 e,
600 >
"~ 500
~_~ 400
300
"~ 200
I O0
' I i F ~ i i
~23
~34
0 10 20 30 40 5t0 ' 60 ' 70 time (ns)
a The energy levels were taken from Ref. [ 17]. The corresponding Fig. 2. Experimentally observed laser pulse shape for dye lasers 1, 2, wavelengths have been calculated, and 3 and for the excimer pump laser.

298 W.L. Clevenger et al./Spectrochimica Acta Part B 52 (1997) 295-304
excludes those cases in which the electrons created have enough energy to modify the signal shape, any photoionization shape resembles the pulse which created it. In this work, signal due only to photo- ionization was observed when only the first two laser connected steps were excited, XI2 and ~k23 , SO the photoionization resembles the shape of the X23 because its power exceeds that of )k12 and is enough to saturate the third level. Therefore, photoionization was very easy to identify and distinguish from other sources of ionization.
The beams were directed with mirrors and prisms into a quartz cell which contained a small amount of mercury and varying pressures of buffer gas (air or argon). At atmospheric pressure, the Hg number density in the cell would be 8 x 1013 cm -3. The cell also housed two planar Ni electrodes and was connected to a vacuum pump. One electrode was con- nected to a high voltage source which applied varying potentials (0-1.5 kV) to the cell, while the other was connected to a low-noise high-frequency preamplifier (Model 310, Sonoma Instruments, Santa Rosa, CA). The amplified LEI waveform was displayed on a fast digitizing oscilloscope. These waveforms were gener- ated using different pressures, voltages, and beam positions for different Rydberg levels with the goal of distinguishing between different ionization mechanisms.
Along with the experimental determinations, the ionization waveforms were theoretically simulated using DensMat [14], a computer program which is used to model fully time-resolved simulations of two-step pulsed laser excitation of atoms in highly collisional media. The main purpose of this simulation was to estimate under what experimental parameters one should expect the duration of the pulse due to collisional ionization to exceed that due to photo- ionization. This program uses the density matrix mathematical treatment of these processes and is very suitable for predicting the various level popula- tions as a result of laser enhanced ionization. The only incompatibility between this experiment and the model was because DensMat can only simulate a two-step excitation of three laser-connected levels, whereas our system consisted of four laser-connected levels. To adapt the three-step system to the dual laser model, the assumption was made that all of the atoms were excited to the first level of Hg during a short
period of time (much shorter than the duration of the laser pulse); because the radiative lifetime of the 6p3p ° state of Hg is much longer (118 ns) than the duration of the laser pulse and quenching was deter- mined to be negligible, at the working pressures of the experiments, in both argon and air, we could consider this state having a steady state population during the period of laser irradiation. In this case, the ~23 and )k34 transitions corresponded to step one and step two in the DensMat simulation. In order to account for the loss in the ion population occurring at the electrodes, a non-laser connected level was added to the scheme as a trap, in which the lost ions could accumulate (and not return to the ground state), just as it occurs experi- mentally at the electrodes. The rate constant for this loss from the ion level to the trap was set as 1 x 10¹¹ Hz, as it occurs at a higher rate than the colli- sional ionization from the third level to the ionization continuum. The rate constants for collisional ioniza- tion that were studied with DensMat varied from 1 x 101° Hz to 1 x 10 6 Hz. Step 1 was fixed at 435.834 nm and Step 2 at 470.159, with both lasers being charac- terized by a spectral bandwidth of 3 GHz. The irradiance at step 1 was 50 W cm -2 and that for step 2 was 5 kW cm-2. The transition probability of the first step was taken from tabulated [15] values as 125 MHz while that of step 2 is not known and was therefore assumed to be 5 MHz. In addition, a normal- ized, digitally simulated X23 profile (like that shown in Fig. 2) was entered into the program as our laser pulse, as this excited level has the shortest lifetime in this scheme ( - 8 ns), and therefore this level determines the temporal performance of the system. The only two parameters that were varied are the collisional rate constant and the lifetime of this fourth level (74). The output of DensMat consists of a plot of fractional level populations vs. time, which is directly propor- tional to the output of the oscilloscope, current vs. time. In this way, a direct, albeit qualitative, com- parison between simulated and experimental results can be made.
3. Results and discussion
3.1. DensMat simulations
The waveforms generated using DensMat are seen

W.L. Clevenger et al./Spectrochimica Acta Part B 52 (1997) 295-304 2 9 9
in Fig. 3(a) and (b). In Fig. 3(a), it is observed that when the collisional ionization rate constant is 10 GHz, the signal due to collisional ionization occurs so rapidly that it cannot be distinguished from that which is due to photoionization. In this case, the sig- nal waveform is identical to the )k23 pulse. As the rate drops to 1 GHz and then to 0.2 GHz, the signal inten- sity drops, its temporal behavior broadens and it loses the distinguishing characteristics of )~23. This trend continues for the lower collisional ionization rates presented in Fig. 3(b); it was also observed that increasing the lifetime of level 4 from 200 ns to 1 ps would further broaden this waveform. From these simulations, one can conclude that, as the rate of
collisional ionization increases, the signal occurs more rapidly for a higher rate (shorter temporal sig- nal) and more slowly for a lower rate (longer temporal signal). The collisional ionization rate can be changed experimentally in two ways: (1) increasing the buffer gas pressure and (2) changing the level from which the collisional ionization occurs, namely, the Rydberg level. From the results of this simulation, it appears that as the principal quantum number of the Rydberg level is increased (i.e., as it becomes closer to the ionization continuum), an increase in the rate of colli- sional ionization should occur and this increase should be reflected in the ionization waveform in the sense that its shape will increasingly resemble the original waveform of the k 2 3 laser pulse.
~ 6.0xl 0 "4 ,.-,
._~ 4.0x10 ~4
",---." 2.0x10⁴
" ~ 0.0
16o 260 36o time (ns)
k = 1 x 10 I°
k = l x l 0 9
k = 2 x l 0 8
k = 2 x 10⁷
460
(b)
, .-, 8.0xlO ~5
6.0xlO "6
..~ ~ 4.0x10 ~' E
'-~ ~ 2"0xl0"6
"~ 0.0
0 160 260 " 360 " 460 " 560 "
k = 4 x l 0 6
k = 1 x l 0 6
k = 1 x 10⁶, x 4 = 1 ~ts
time (ns)
Fig. 3. D e n s M a t - g e n e r a t e d w a v e f o r m s i m u l a t i o n s fo r LEI o f H g
a toms : un l e s s o t h e r w i s e no ted , z4 = 2 0 0 ns.
3.2. Exc i ta t ion o f levels n = 1 0 - 1 4
The first Rydberg levels studied experimentally were n = 10-14. The temporal differences in behavior for these levels are shown in Fig. 4 (along with the signal from only Xx2 + X23, a signal due only to photoionization). A trend emerges as one observes levels n = 10 to n = 14. The waveforln corresponding to n = 10 resembles the signal with n o )k34 , with a smaller addition of a longer temporal signal. This second component steadily increased from n = 11 to n --- 12 until, at n = 13, it clearly began to dominate. In fact, at n = 14, the photoionization component became almost hidden by the second component. The reasons for this are as follows: at n = 10, the fourth excited
n=141/ 600 • I l l l / I I " - ~ - ~ "
500
4 0 0 . n
300 '
• ~ 200
I00
0 ~ -200 0 200 400 600 800
t i m e (ns )
Fig . 4. S i g n a l b e h a v i o r fo r n = 1 0 - 1 4 . T h e air p r e s s u r e in the cel l is
7 0 m T o r L the po ten t i a l app l i ed to the e l e c t rodes is 2 5 0 V. T h e
s i g n a l s h a v e no t b e e n n o r m a l i z e d w i t h respec t to l a se r p o w e r .

300 W.L. Clevenger et al./Spectrochimica Acta Part B 52 (1997) 295-304
level was still too far from the ionization continuum (0.39 eV) for significant collisional ionization to occur at 60 mTorr buffer gas pressure; for this reason, the signal was clearly dominated by photoionization. From n = 11-14, however, a second, longer signal component began to emerge next to that component due to photoionization; the longer signal was a result of collisional ionization. For n = 14, the energy gap to the ionization continuum is only 0.14 eV, and there- fore collisional ionization is very significant. Most importantly, this rate of collisional ionization increased with increasing principal quantum number. This trend can be seen even more clearly from the higher-lying levels.
3.3. Exci tat ion o f levels n = 18 -21
The three-step ionization waveforms from Rydberg levels with principal quantum numbers n = 18-21 were also observed. For these levels, the energy gap between the excited level and the ionization continuum became even smaller (0.071 eV for n = 18, 0.049 eV for n = 21), resulting in high rates of collisional ionization. This can be clearly observed in Fig. 5. As )k34 populated principal quantum num- bers from n = 18 to n = 21, the time duration of the signal shortened due to the increasing rate. What was most striking here was the re-emergence, at n = 20, of the laser pulse shape. Although this shape was observed for the lower quantum energy levels (n =
500
400 >
300
~ 200
I00
n = 2 1
n = 2 0
n = 1 9
n o ~'34 ]1
.~00 200 400 600 800 time (ns)
Fig. 5. Signal behavior for n = 18-21. The air pressure in the cell is 60 mTorr, the potential applied to the electrodes is 250 V. The signals have not been normalized with respect to laser power.
10-12) because of the low efficiency of collisional ionization, its reappearance at these high-lying levels is due to an entirely different reason: the rate of colli- sional ionization was so large that its reciprocal value was much shorter than the duration of the laser pulse. At n = 21, collisional ionization was so fast that the waveform resembled that of the exciting laser beam; as a consequence, at these higher levels, deconvolu- tion of the collisional and photoionization compo- nents again became difficult. This waveform can be compared to that generated with DensMat for a colli- sional rate constant of k--0.2 GHz (see Fig. 3); it is clear that the trend observed as the principal quantum number of the Rydberg level increased follows the trend simulated for increasing the collisional rate con- stant. As previously stated, we attributed this trend to the collisional ionization component of the signal; the remainder of our work sets out to further prove this hypothesis.
3.4. Signal vs. pressure
The effect of the buffer gas pressure on the colli- sional ionization signal is shown in Fig. 6. Here, the parameter chosen to show this effect was the Full Width at Half Maximum (FWHM), plotted as a func- tion of the pressure of the buffer gas in the cell. The component related to collisional ionization was visually extracted from that due to photoionization. As the pressure increased to about 1 Torr, a decrease in signal duration occurred, showing a minimum around 2 Torr. After that, an increase in signal dura- tion with increasing pressure was again observed.
1500-
~ 1 0 0 0 -
500-
/
\ /
0 . . . . . . . . , . . . . . . . . , . . . . . . . . r . . . . . . . . , . . . . .
0.01 0. l 1 10 100 pressure (Torr)
Fig. 6. FWHM of signal vs. pressure. ~k34 is tuned to n = 13. The potential applied to the electrodes is 240 V, the buffer gas is argon. Neutral density filters attenuated all three beams to remove possible photoionization sources.

W.L. Clevenger et al./Spectrochimica Acta Part B 52 (1997) 295-304 3 0 1
This result further confirmed the source of this component as being due to collisional ionization according to the following explanation. At lower pressures ( -< 1 Torr), the FWHM depended only on the rate of collisional ionization. On this descending part of the curve, photoionization and collisional ionization could be independently observed as they occurred and could be identified as a function of their rates (photoionization resembles the laser pulse shape and the collisional ionization rate is a function of the Rydberg state excited). At these lower pressures, the rate coefficient for collisional ionization can be expressed as
Rc = naVa (1)
where Rc is the collisional ionization rate coefficient (Hz), n a is the concentration of buffer gas (molecules cm-3), v is the velocity of the buffer gas (cm s -1) and a is the cross-section of collisional ionization (cm2). Therefore, the collisional rate increased with increasing pressure because of the increase in the concentration of collision partners. From ~ 5 Torr to ~ 100 Torr, the FWHM was no longer a function of the collisional rate, but instead a function of electron mobility; that is, the time it takes the electrons to travel from the point of ionization to the electrode. At pressures > 5 Torr, the FWHM began to increase because of a lower electron drift velocity caused by the increase of buffer gas concen- tration in the cell. In this pressure range, the collisional ionization and photoionization signal components were hidden within a longer signal profile which gradually became a function of ion population vs. time rather than an observation of the two ioniza- tion processes. In this case, since we are dealing with the convolution of both the ion formation and detection processes the two components could not be identified or distinguished from each other without difficulty. That is to say, the signal observed was temporally dependent primarily on the electron drift velocity and therefore could not be simply attributed to the ion formation process, like that seen at 1 Torr. To increase the velocity of these electrons and observe again separately the two components, a higher potential could have been applied to the electrodes. However, this would have introduced a risk of electrical breakdown and possible damage to the preamplifier. For this reason, this technique is limited
to lower potentials and, as a result, to pressures < 5 Torr.
The effect of pressure on the ionization signal, at constant collection voltage, can be further observed in Fig. 7. In (a), the effect of the buffer gas pressure on the two-step ( )k l2 4" )k23 , with n o )k34 ) signal is pre- sented. At 60 mTorr, the characteristic laser pulse waveform was observed, indicating that photoioniza- tion was dominating. Increasing the pressure to 600 mTorr allowed some collisional ionization to occur, while increasing the pressure to 6 Torr showed a decrease in signal intensity. At 60 Torr, the signal was barely detectable. This behavior was then com- pared to that of the three-step (~34 added) waveform at n = 18, as seen in (b). At 60 mTorr, a collisional ionization signal lasted ~ 150 ns. When the pressure was increased to 600 mTorr, a much more intense signal occurred lasting about the same amount of time, but with an unexpected longer tail which is dif- ficult to explain at present. The collisional ionization
(a)
1000
~., 800 > E 600
. ~ 400
200
60 Ton"
6 Torr ~ .
600 mTorr
o160 mTorr -200 " 6 " 260 ' 460
time (ns) 660 860
(b)
2500
~-~ 2000 6
1500 f f 7 -
" ~ 1000 ~ 600 mTo~
500
o: 60 m T o r r ~
-200 " 6 " 2 6 0 ' 4 6 0 660 860 time (ns)
Fig. 7. Signal behavior vs. pressure, (a) for two-step only, (b) for three-step (n = 18). The potential applied to the electrodes is 250 V.
302 W.L. Clevenger et al./Spectrochimica Acta Part B 52 (1997) 295-304
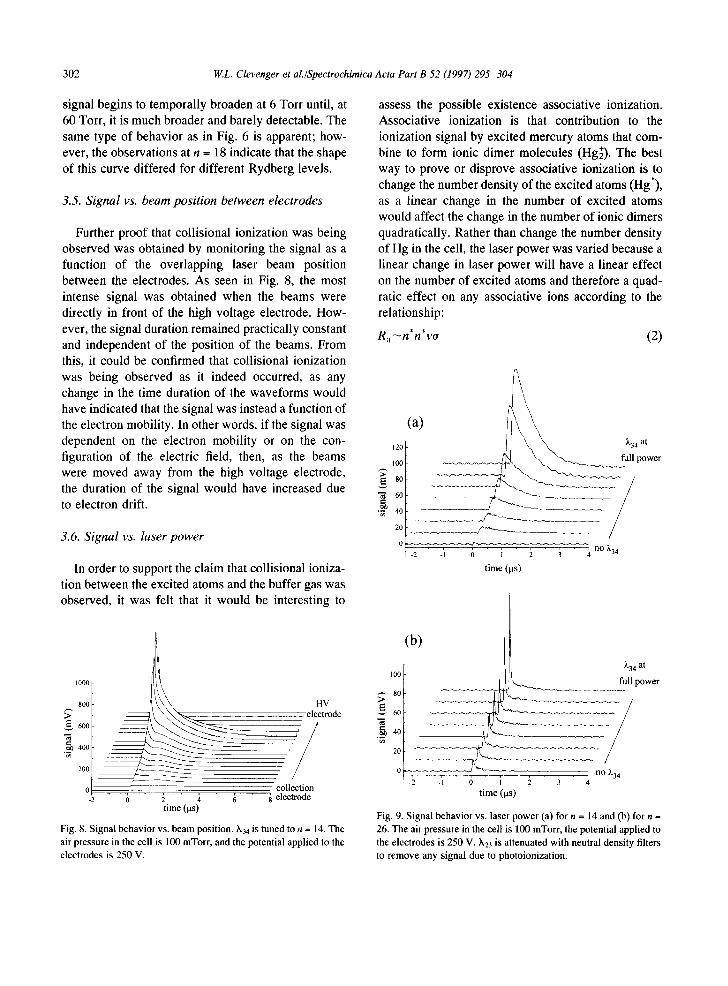
signal begins to temporally broaden at 6 Torr until, at 60 Torr, it is much broader and barely detectable. The same type of behavior as in Fig. 6 is apparent; how- ever, the observations at n = 18 indicate that the shape of this curve differed for different Rydberg levels.
3.5. Signal vs. beam position between electrodes
Further proof that collisional ionization was being observed was obtained by monitoring the signal as a function of the overlapping laser beam position between the electrodes. As seen in Fig. 8, the most intense signal was obtained when the beams were directly in front of the high voltage electrode. How- ever, the signal duration remained practically constant and independent of the position of the beams. From this, it could be confirmed that collisional ionization was being observed as it indeed occurred, as any change in the time duration of the waveforms would have indicated that the signal was instead a function of the electron mobility. In other words, if the signal was dependent on the electron mobility or on the con- figuration of the electric field, then, as the beams were moved away from the high voltage electrode, the duration of the signal would have increased due to electron drift.
3.6. Signal vs. laser power
In order to support the claim that collisional ioniza- tion between the excited atoms and the buffer gas was observed, it was felt that it would be interesting to
I000
800
, ~ 600
.~o 400
200
HV electrode
collection -2 ' 6 ~ ' ,~ ~ s electrode
time (p.s)
Fig. 8. Signal behav io r vs. b e a m position, k34 is tuned to n = 14. The
air pressure in the cell is 100 mTor r , and the potential appl ied to the
e lect rodes is 250 V.
assess the possible existence associative ionization. Associative ionization is that contribution to the ionization signal by excited mercury atoms that com- bine to form ionic dimer molecules (Hg~). The best way to prove or disprove associative ionization is to change the number density of the excited atoms (Hg'), as a linear change in the number of excited atoms would affect the change in the number of ionic dimers quadratically. Rather than change the number density of Hg in the cell, the laser power was varied because a linear change in laser power will have a linear effect on the number of excited atoms and therefore a quad- ratic effect on any associative ions according to the relationship:
Ra~n*n*vo (2)
120
100
'N 40
20
(a) L ~34 at
full power
. . . . ~ . . . . . . . . no M~ -2 -I 0 I 2 3 4 J~
t ime (las)
(b)
100
8o[ >
"N
~ 40
20
L34 at
full power
, . , , . . . . . . , . , no )'34 -2 -I 0 1 2 3 4
t ime 0as)
Fig. 9. Signal behav io r vs. laser p o w e r (a) for n = 14 and (b) for n =
26. The air p ressure in the cell is 100 mTor r , the potent ial appl ied to
the e lec t rodes is 250 V. h23 is a t tenuated with neutral densi ty filters
to r e m o v e any signal due to photoionizat ion.

W.L. Clevenger et al./Spectrochimica Acta Part B 52 (1997) 295-304 303
where R a is the associative ionization rate constant (Hz cm-3), n* is the concentration of the excited state population (atoms cm-3), v is the velocity of buffer gas (cm s -t) and a is the cross-section of associative ionization (cm2). While a linear relation- ship between laser power and ionization signal does not prove associative ionization, it is indicative of a collisional rather than an associative ionization mechanism. As with the location of the overlapping beams, a decrease in laser power of k34 should have no effect on the temporal duration of collisional ioniza- tion, while any associative ionization would be affected. The effect can be seen in Fig. 9 for levels with principal quantum numbers n = 14 (Fig. 9(a)) and n = 26 (Fig. 9(b)). In this case, the 9x23 power was attenuated such that there was no detectable signal from only X12 + ~,23; in this way, the photoionization source was almost eliminated. As can be seen in Fig. 9, the signal dropped in intensity as the ~34 power was attenuated, but the temporal behavior and duration remained unchanged. The decrease of the signal inten- sity with respect to the laser intensity at )x34 was linear, supporting the claim that the signal is due to colli- sional ionization. Also, because the duration and shape of the signal did not change, it could be assumed that the concentration of species responsible for collisional ionization did not change. This proves that collisional ionization depends on the concentra- tion of buffer gas atoms and/or molecules (as in eqn (1)) and not the excited Hg atoms (as in eqn (2)).
model [14]. Observations ranged from n = 10, from which little detectable collisional ionization could be observed, to n = 26, where collisional ionization occurred so rapidly that this part of the signal could not be distinguished from the photoionization com- ponent. It was further observed that this type of measurement must be made at a pressure < 5 Torr; above this, the lower electron mobili ty makes it difficult to extract the specific process from the signal. From these results, we can conclude that any analyti- cal measurements made using this technique, for a buffer gas at room temperature, must be made at a gas pressure of < 5 Torr and with ionization from levels n = 10-20 in order to achieve greater selectivity.
Future work will include studying Rydberg line broadening, the temperature dependence of the rate of ionization, and the use of fluorescence dip spectros- copy [16] to estimate the efficiency of collisional ionization from different excited Rydberg levels.
Acknowledgements
The authors would like to thank K. Niemax for helpful discussions concerning this work and the National Institutes of Health which funded this research (5-R01-GM49638-03). O.I.M. was supported by a National Research Council CAST grant.
References
4. Conclusions
This work has demonstrated the possibility of obtaining simultaneous, and yet separate, information about photoionization and collisional ionization in a single t ime-resolved waveform, obtained when atoms are excited in a low pressure gas cell. It has been shown that the signal due to photoionization resembled the laser pulse shape that created it and therefore occurred during the time duration of this pulse, while the collisional ionization signal had a longer temporal duration (200-800 ns), depending on the buffer gas pressure and the Rydberg level from which collisional ionization occurred. This experimental evidence agrees with that obtained by simulating the actual conditions with the DensMat
[1] J.C. Travis and G.C. Turk (eds.), Laser Enhanced Ionization Spectroscopy, in J.D. Winefordner (ed.), Wiley Series on Chemical Analysis, Vol. 136, Wiley, New York, 1996.
[21 A.G. Marunkov and N.V. Chekalin, Opt. Spectrosc. (USSR), 61 (1986) 461.
[3] O. Axner and T. Berglind, Appl. Spectrosc., 43 (1989) 940. [4] N. Omenetto, B.W. Smith, P.B. Farnsworth and J.D.
Winefordner, J. Anal. At. Spectrom., 7 (1992) 89. [5] I.l. Vlasov and N.V. Chekalin, Spectrochim. Acta Part B, 48
(1993) 597. [6] K. Niemax, Appl. Phys. B, 32 (1983) 59. [7] O.I. Matveev and N. Omenetto, Spectrochim. Acta Part B, 49
(1994) 691. [8] M. Broglia, F. Catoni, A. Montone and P. Zampetti, Phys. Rev.
A, 36 (1987) 705. [9] T. Berthoud, J. Lipinsky, P. Camus and J.L. Stelhe, Anal.
Chem., 55 (1983) 960. [10] G. Havrilla, P.K. Schenck, J.C. Travis and G.C. Turk, Anal.
Chem., 56 (1984) 186.

304 W.L. Clevenger et al./Spectrochimica Acta Part B 52 (1997) 295-304
[11] I. Magnusson, Spectrochim. Acta Part B, 42 (1987) 1113. [12] O.I. Matveev, Ph.D. Dissertation, Moscow State University,
Moscow (Russia), 1979. [13] O.I. Matveev, P. Cavalli and N. Omenetto, AlP Conf. Proc.
(RIS-94, Bernkastel-Kues, Germany), 329 (1994) 269. [14] D. Boudreau, P. Ljungberg and O. Axner, Spectrochim. Acta
Part B, 51 (1996) 413.
[15] E.B. Saloman, Spectrochim. Acta Part B, 46 (1991) 367. [16] N. Omenetto and P.B. Farnsworth, in J.C. Travis and G.C.
Turk (eds.), Laser Enhanced Ionization Spectroscopy in J.D. Winefordner (ed.), Wiley Series on Chemical Analysis, Vol. 136, Wiley, New York, 1996, Chapter 6.
[17] C.E. Moore, Atomic Energy Levels, Vol. III, NSRDS-NBS 35, Dec. 1971, p. 191.
Copyright © 2022 FDOKUMEN