
ANALYSIS OF TOP OF DESCENT (TOD) UNCERTAINTY
10
978-1-61284-798-6/11/$26.00 ©2011 IEEE 2E3-1 ANALYSIS OF TOP OF DESCENT (TOD) UNCERTAINTY Craig M. Johnson, The MITRE Corporation, Center for Advanced Aviation System Development, McLean, VA Abstract As the National Airspace System (NAS) transitions to Trajectory-Based Operations (TBO), it is becoming increasingly important to understand the factors that contribute to differences in aircraft trajectories. Mid-term concepts include enhanced automation capabilities in the form of Decision Support Tools (DSTs) that rely on accurate predictions of aircraft trajectories to increase the efficiency and safety of the NAS by improving adherence to metering schedules and minimizing the number of interactions controllers take in streamlining flight operations. However, the benefits afforded by these concepts are only as good as the accuracy of their underlying trajectory modelers. Specifying a trajectory modeler that provides a sufficient level of accuracy is a non-trivial task, due to the vast number of factors that can affect a trajectory, many of which are accompanied by uncertainty. One area of the flight trajectory in which inaccurate trajectory predictions can be particularly problematic centers around an aircraft’s Top of Descent (ToD) point, where loss of separation can occur very quickly if an aircraft begins its descent earlier or later than a controller might expect (or was led to believe by automation). As such, there is a need to identify and understand the significant factors that can affect the location of ToD for a wide range of aircraft types and configurations, as well as a better understanding of the magnitude of the differences attributed to these factors. The MITRE Corporation’s Center for Advanced Aviation System Development (CAASD) conducted an analysis to begin identifying significant factors that contribute to ToD variability within an aircraft model, and the associated magnitude of that variability. It is widely understood that wind and aircraft weight are two factors that significantly contribute to ToD location. However, the contribution of other factors to ToD location is less understood. This analysis examined three factors of interest for Boeing 737 (B737) aircraft to determine their influence on the location of ToD. The factors examined include the specific series of B737, the presence of winglets, and equipped engine thrust. Wind and aircraft weight were held constant to isolate the effects of the factors of interest. The data for the analysis was generated using CAASD’s General Electric (GE) Aviation Flight Management System (FMS) test bench, which simulates the actual hardware and software systems of a B737. Twenty- six configurations of B737 aircraft, which included various combinations of series (600, 700, 800, and 900 series), winglets (with and without), and equipped engine thrust values, were flown via the FMS test bench in a defined scenario. Results of the analysis indicate that two of the factors, the series of B737 and the presence (or absence) of winglets, are likely to be significant factors that can affect the location of ToD for B737 aircraft. The B737’s equipped engine thrust was seen to be less significant. There are, potentially, many other factors that can affect ToD location, such as pilot-configurable settings within the FMS. Further analysis is needed to determine the impact that these additional factors may have on ToD location. This analysis also examined only a single cruising altitude of 37,000 ft. It may be beneficial to execute similar scenarios at other cruising altitudes to observe the effect that altitude may have on the magnitude, or on the relative significance of the factors, with respect to ToD location. Further analysis is also suggested for other aircraft types, beyond the B737, to determine if similar findings hold true for other aircraft types. Understanding the factors that affect ToD location, and their magnitude of effect, can be used to help to improve the accuracy and performance of trajectory modeling algorithms for current and future automation tools, and to identify areas where alternative mitigation strategies to account for that uncertainty may be required.
-
Upload
independent -
Category
Documents
-
view
1 -
download
0
Transcript of ANALYSIS OF TOP OF DESCENT (TOD) UNCERTAINTY
978-1-61284-798-6/11/$26.00 ©2011 IEEE 2E3-1
ANALYSIS OF TOP OF DESCENT (TOD) UNCERTAINTY Craig M. Johnson, The MITRE Corporation, Center for Advanced Aviation System Development,
McLean, VA
Abstract As the National Airspace System (NAS)
transitions to Trajectory-Based Operations (TBO), it is becoming increasingly important to understand the factors that contribute to differences in aircraft trajectories. Mid-term concepts include enhanced automation capabilities in the form of Decision Support Tools (DSTs) that rely on accurate predictions of aircraft trajectories to increase the efficiency and safety of the NAS by improving adherence to metering schedules and minimizing the number of interactions controllers take in streamlining flight operations. However, the benefits afforded by these concepts are only as good as the accuracy of their underlying trajectory modelers. Specifying a trajectory modeler that provides a sufficient level of accuracy is a non-trivial task, due to the vast number of factors that can affect a trajectory, many of which are accompanied by uncertainty. One area of the flight trajectory in which inaccurate trajectory predictions can be particularly problematic centers around an aircraft’s Top of Descent (ToD) point, where loss of separation can occur very quickly if an aircraft begins its descent earlier or later than a controller might expect (or was led to believe by automation). As such, there is a need to identify and understand the significant factors that can affect the location of ToD for a wide range of aircraft types and configurations, as well as a better understanding of the magnitude of the differences attributed to these factors.
The MITRE Corporation’s Center for Advanced Aviation System Development (CAASD) conducted an analysis to begin identifying significant factors that contribute to ToD variability within an aircraft model, and the associated magnitude of that variability. It is widely understood that wind and aircraft weight are two factors that significantly contribute to ToD location. However, the contribution of other factors to ToD location is less understood. This analysis examined three factors of
interest for Boeing 737 (B737) aircraft to determine their influence on the location of ToD. The factors examined include the specific series of B737, the presence of winglets, and equipped engine thrust. Wind and aircraft weight were held constant to isolate the effects of the factors of interest. The data for the analysis was generated using CAASD’s General Electric (GE) Aviation Flight Management System (FMS) test bench, which simulates the actual hardware and software systems of a B737. Twenty-six configurations of B737 aircraft, which included various combinations of series (600, 700, 800, and 900 series), winglets (with and without), and equipped engine thrust values, were flown via the FMS test bench in a defined scenario.
Results of the analysis indicate that two of the factors, the series of B737 and the presence (or absence) of winglets, are likely to be significant factors that can affect the location of ToD for B737 aircraft. The B737’s equipped engine thrust was seen to be less significant.
There are, potentially, many other factors that can affect ToD location, such as pilot-configurable settings within the FMS. Further analysis is needed to determine the impact that these additional factors may have on ToD location. This analysis also examined only a single cruising altitude of 37,000 ft. It may be beneficial to execute similar scenarios at other cruising altitudes to observe the effect that altitude may have on the magnitude, or on the relative significance of the factors, with respect to ToD location. Further analysis is also suggested for other aircraft types, beyond the B737, to determine if similar findings hold true for other aircraft types.
Understanding the factors that affect ToD location, and their magnitude of effect, can be used to help to improve the accuracy and performance of trajectory modeling algorithms for current and future automation tools, and to identify areas where alternative mitigation strategies to account for that uncertainty may be required.
2E3-2
Introduction
Problem Description Understanding the factors that contribute to
differences in aircraft trajectories is becoming increasingly important as the National Airspace System (NAS) transitions towards Trajectory-Based Operations (TBO). Mid-term concepts include enhanced automation capabilities in the form of Decision Support Tools (DSTs) that rely on accurate predictions of aircraft trajectories to increase the efficiency and safety of the NAS by improving time-based delivery schedules and minimizing the number of controller interactions required to maintain efficient flight operations. However, the benefits afforded by these concepts are only as good as the accuracy of their underlying trajectory modelers. Specifying a trajectory modeler that provides a sufficient level of accuracy is a non-trivial task, due to the vast number of factors that can affect a trajectory, many of which are accompanied by uncertainty.
One area of the flight trajectory in which inaccurate trajectory predictions can be particularly problematic centers around an aircraft’s Top of Descent (ToD) point, where loss of separation can occur very quickly if an aircraft begins its descent earlier or later than a controller might expect (or was led to believe by automation). The ToD point can vary from aircraft to aircraft and flight to flight due to differences in airframe characteristics, on-board avionics, and environmental conditions. When pilots of equipped aircraft utilize the Vertical Navigation (VNAV) capabilities of the aircraft’s Flight Management System (FMS), the FMS will calculate an efficient descent trajectory (generally using idle or near idle power) that projects the expected ToD point, given the current state of the aircraft (e.g., altitude, heading, speed, weight), the environment (e.g., winds), preferred operator settings configured within the FMS (e.g., cost index), and procedural constraints. However, there is currently no fielded system in place that allows for the exchange of aircraft FMS trajectory information with Air Traffic Control (ATC) ground automation to provide controllers with accurate trajectory intent information for an aircraft, and specifically, the location of the ToD point. To account for the uncertainty, controllers today are likely to issue incremental step-downs in
altitude during busy traffic periods to provide a more predictable descent for traffic management purposes, which comes at the expense of aircraft efficiency. As such, there is a need to identify and understand the significant factors that can affect the location of ToD for a wide range of aircraft types and configurations, as well as to gain a better understanding of the magnitude of the differences attributed to these factors, so that improvements that help maintain efficient operations can be pursued.
Objective of Analysis The MITRE Corporation’s Center for Advanced
Aviation System Development (MITRE/CAASD) was asked by the Federal Aviation Administration (FAA) to analyze ToD variability that exists within an aircraft model. This analysis represents a first step in the process of identifying the significant factors that contribute most to ToD variability for similar aircraft types, and the associated magnitude of that variability.
Understanding the factors that affect ToD location and their respective magnitudes can be used to improve the accuracy of trajectory modeling algorithms by improving built-in error models that account for known uncertainties or by identifying additional input parameters that can be incorporated into trajectory modelers to improve the precision of trajectory predictions. In the case where improvements to trajectory modeling is not feasible, a better understanding of the factors influencing ToD location can be used to identify alternative mitigation strategies to convey, or protect for, that uncertainty (e.g., Computer Human Interface [CHI] enhancements, procedure modifications).
Experimental Design
Scope and Factors of Interest This analysis examined three factors of interest
hypothesized to influence the location of ToD. The factors are limited to those pertaining to specific airframe characteristics of Boeing 737 (B737) aircraft and include the specific series of the B737 model, the presence of winglets, and engine thrust. Each of these factors is considered to be static, meaning they are established at the time a particular aircraft is built and would not change from one flight to the next.
2E3-3
Follow-on analyses may examine additional factors for their effect on ToD location, such as settings or parameters within the aircraft’s FMS, which can be adjusted or set by the pilot on a flight-by-flight basis.
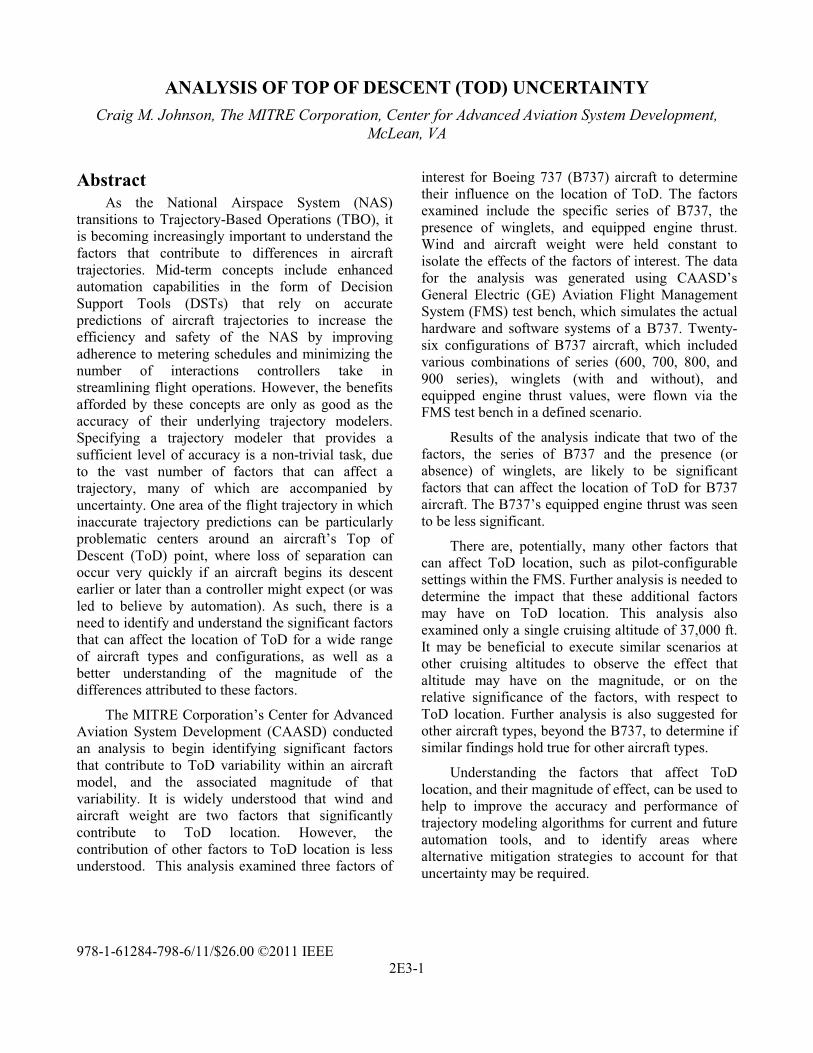
Aircraft Series Four series of B737 aircraft were included in the
analysis: the 600, 700, 800, and 900 series. Each of these series belongs to the Next Generation (NG) class of B737 aircraft. Two variants of the 700 series, the 700ER (Extended Range) and the 700IGW (Increased Gross Weight), were also included to evaluate whether differences in ToD location are present within a given series. The B737 series evaluated are summarized below. Figure 1 provides a fuselage size comparison of the four B737 NG series aircraft.
� 600 Series � 700 Series
o 700 Base Series o 700ER Series (700 series
fuselage with 800 series wings [to carry more fuel] and landing gear)
o 700IGW Series � 800 Series—extended version � 900 Series—extended version
Figure 1. Size Comparison of the Boeing 737 NG Series
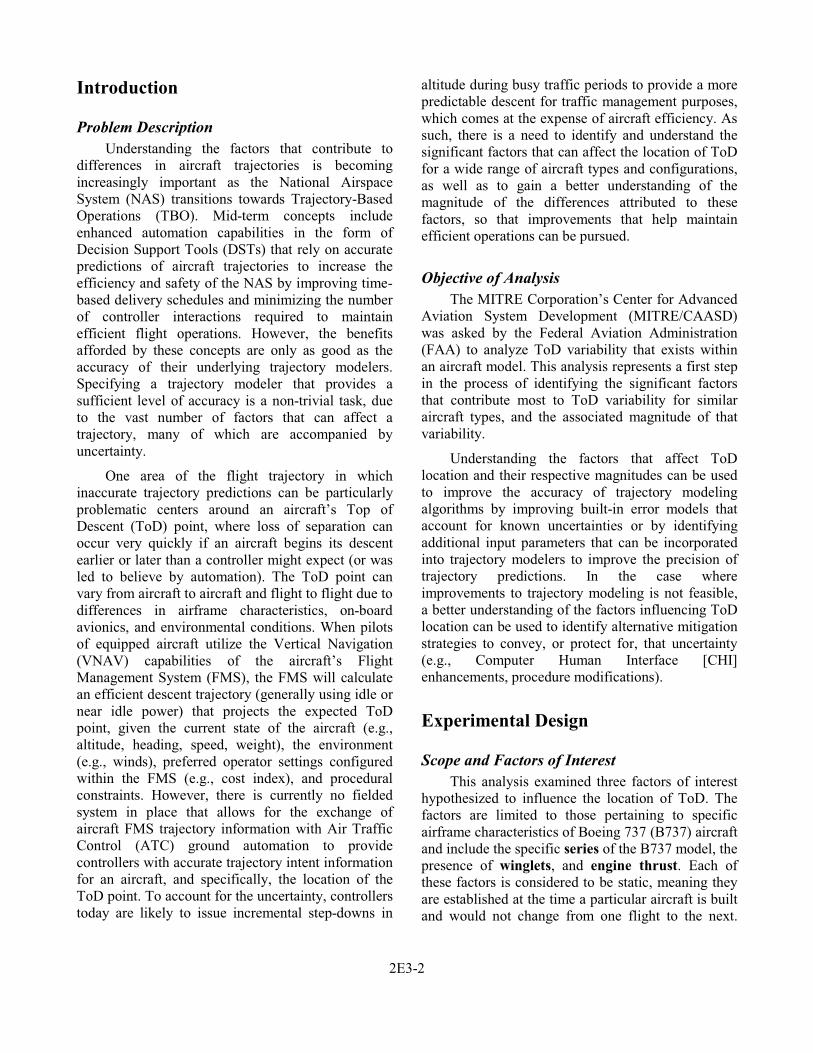
Winglets Several of the B737 series that were evaluated
have the option of being equipped with winglets. Winglets are wing tip extensions that provide performance and efficiency benefits over a similar aircraft without winglets. Figure 2 depicts the style of winglets equipped on a B737. Winglets are not an available option on the B737-600 series, however.
Figure 2. Boeing 737 Equipped with Winglets
Engine Thrust Five engine thrust values were evaluated,
represented in terms of 1000 (K) pounds of thrust. The engine thrust values include:
� 20K � 22K � 24K � 26K � 27K
All B737 NG models use CFM56-7 engines produced by CFM International, a joint venture of General Electric (GE) of the United States and Snecma of France, so any potential differences in ToD locations due to differences in engine makes or models was not a factor. It should be noted that each series of B737 aircraft evaluated is not capable of being equipped with all five of the engine thrust options listed above. For example, the maximum thrust available for a B737-700 is 26K. Therefore, the 27K thrust engine would not be an option. The combinations of series and engine thrust values that were evaluated are provided in the test matrix.
Analysis Tools FMS Test Bench
Flight data for the analysis was generated using CAASD’s GE Aviation PCSim sFMS simulator for a B737 aircraft, also referred to more generically as a FMS test bench. The FMS test bench simulates the actual hardware and software systems of a B737 with detail and accuracy, providing software interfaces that replicate those of a B737 to include the Mode Control Panel (MCP), Multi-function Control Display Unit (MCDU), and Display Control Panel (DCP). Using the FMS test bench, one can simulate the entire flight process, from setup, to takeoff, to landing.
2E3-4
Data produced by the FMS test bench can be recorded and output at five-second intervals. The data at each interval includes aircraft state information, such as aircraft position (in latitude/longitude coordinates) and altitude, heading, and speed, as well factors such as fuel flow, weight, and engine thrust at each interval. The FMS test bench also outputs track information, which can be loaded into a software package, such as the Terminal Area Route Generation Evaluation and Traffic Simulation (TARGETS1) software, for further analysis.
In order to capture full trajectory data from the FMS test bench, flights must be flown in real-time, meaning either a human pilot must “fly” and manipulate the simulated controls as they would during an actual flight, or an automated process is needed to perform the actions of a pilot in the absence of human interaction. Data for this analysis was recorded from takeoff to just past the meter fix, KARLA, which is located on the Dallas/Fort Worth (D10) Terminal Radar Approach Control (TRACON) airspace boundary. Data recorded from the FMS test bench was parsed to identify the time at which the aircraft left its cruise altitude of 37,000 feet (ft). This time was matched to the coordinate location of the aircraft at that time, and the corresponding ToD point was plotted in TARGETS. The along-track distance from the meter fix, KARLA, to the plotted ToD point was measured to establish the ToD location as a function of distance, so that relative comparisons between configurations could be made.
FMS Operator To configure and execute each run on the FMS
test bench, a CAASD developed tool, FMS Operator, was used to facilitate the process. FMS Operator encapsulates the expert pilot knowledge required to control the FMS test bench, and presents to the user a simplified user interface (UI) that follows common computer UI conventions, such as menus, dialog boxes, and clickable buttons. By using FMS Operator, an analyst can develop, execute, and collect data from user-defined scenarios powered by the FMS test bench.
1TARGETS is a CAASD developed software application that is used for airspace and procedure design, track data analysis, and enables closed-loop fast-time and Human-in-the-Loop (HITL) simulations.
As previously noted, each configuration had to be flown through the FMS test bench in real-time to collect full trajectory data. With 26 configurations, and each run taking approximately 1 hour to setup and execute in FMS Operator, the data collection process would have been quite time consuming. To improve the efficiency of the process, CAASD developed a method to automate the execution of all runs in a sequential batch process, with the capability to distribute the load across multiple test benches, if desired. However, to ensure consistency of the data, and to minimize the impact of any differences that may exist among different FMS test benches, only one FMS test bench was used for data collection in this analysis.
Previous uses of FMS Operator were intended for configurations using a single hardware pin, so multiple configuration runs using different hardware pins was not part of its feature set. The hardware pin is a numbered identifier that defines a particular airframe configuration (i.e., engine type, winglets, etc.) for the purpose of hardware programming. When an actual FMS is installed in an aircraft, the appropriate pin that corresponds to the configuration of the aircraft is programmed into the FMS. To support the automation of multiple runs using different hardware pins, several software enhancements needed to be made to FMS Operator. First, it was necessary to reverse engineer the engine pin file format to make it possible to configure the FMS test bench for the correct configuration of aircraft at the start of each run. Second, a capability needed to be added to the B737 daemon to dynamically generate the appropriate hardware pin files that would be automatically loaded into the FMS test bench prior to each run. Lastly, it was necessary to add an Application Programming Interface (API) call in FMS Operator to use the configuration file capability.
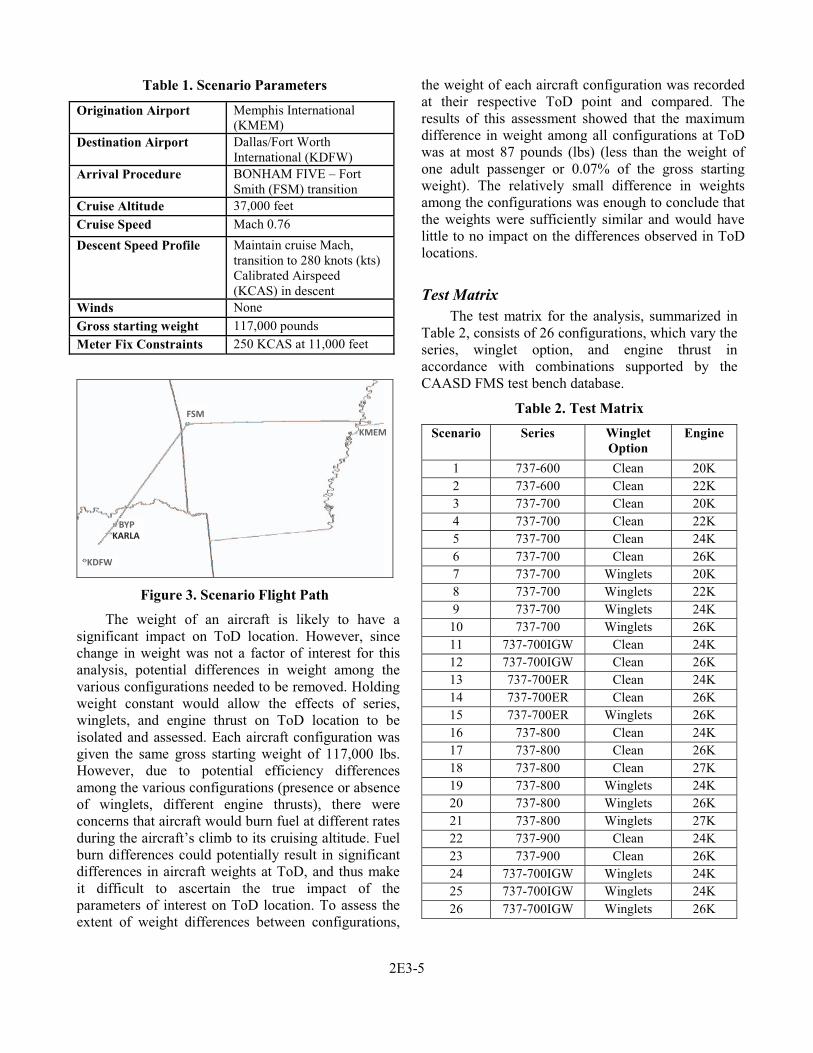
Scenario Parameters Each configuration was flown via the FMS test
bench using the scenario parameters defined in Table 1. Figure 3 illustrates the flight path flown for each scenario.
2E3-5
Table 1. Scenario Parameters
Origination Airport Memphis International (KMEM)
Destination Airport Dallas/Fort Worth International (KDFW)
Arrival Procedure BONHAM FIVE – Fort Smith (FSM) transition
Cruise Altitude 37,000 feet Cruise Speed Mach 0.76 Descent Speed Profile Maintain cruise Mach,
transition to 280 knots (kts) Calibrated Airspeed (KCAS) in descent
Winds None Gross starting weight 117,000 pounds Meter Fix Constraints 250 KCAS at 11,000 feet
FSM
KMEM
KARLABYP
KDFW
Figure 3. Scenario Flight Path
The weight of an aircraft is likely to have a significant impact on ToD location. However, since change in weight was not a factor of interest for this analysis, potential differences in weight among the various configurations needed to be removed. Holding weight constant would allow the effects of series, winglets, and engine thrust on ToD location to be isolated and assessed. Each aircraft configuration was given the same gross starting weight of 117,000 lbs. However, due to potential efficiency differences among the various configurations (presence or absence of winglets, different engine thrusts), there were concerns that aircraft would burn fuel at different rates during the aircraft’s climb to its cruising altitude. Fuel burn differences could potentially result in significant differences in aircraft weights at ToD, and thus make it difficult to ascertain the true impact of the parameters of interest on ToD location. To assess the extent of weight differences between configurations,
the weight of each aircraft configuration was recorded at their respective ToD point and compared. The results of this assessment showed that the maximum difference in weight among all configurations at ToD was at most 87 pounds (lbs) (less than the weight of one adult passenger or 0.07% of the gross starting weight). The relatively small difference in weights among the configurations was enough to conclude that the weights were sufficiently similar and would have little to no impact on the differences observed in ToD locations.
Test Matrix The test matrix for the analysis, summarized in
Table 2, consists of 26 configurations, which vary the series, winglet option, and engine thrust in accordance with combinations supported by the CAASD FMS test bench database.
Table 2. Test Matrix Scenario Series Winglet
Option Engine
1 737-600 Clean 20K 2 737-600 Clean 22K 3 737-700 Clean 20K 4 737-700 Clean 22K 5 737-700 Clean 24K 6 737-700 Clean 26K 7 737-700 Winglets 20K8 737-700 Winglets 22K 9 737-700 Winglets 24K 10 737-700 Winglets 26K 11 737-700IGW Clean 24K 12 737-700IGW Clean 26K 13 737-700ER Clean 24K 14 737-700ER Clean 26K 15 737-700ER Winglets 26K 16 737-800 Clean 24K 17 737-800 Clean 26K 18 737-800 Clean 27K 19 737-800 Winglets 24K20 737-800 Winglets 26K 21 737-800 Winglets 27K 22 737-900 Clean 24K 23 737-900 Clean 26K 24 737-700IGW Winglets 24K 25 737-700IGW Winglets 24K 26 737-700IGW Winglets 26K
2E3-6
Results and Observations ToD Location Measurements
For analysis purposes, the ToD for each aircraft configuration was defined in terms of a distance from the meter fix, KARLA, to the coordinate point at which the aircraft left its cruise altitude of 37,000 ft along a given ground track defined by the BONHAM
FIVE arrival procedure. This format allows for relative comparisons to be made between aircraft configurations. The ToD distance measurements for the 26 configurations, relative to KARLA, are presented in Table 3.
Table 3. Top of Descent (ToD) Location – Distance from ToD to Meter Fix
Configuration Series Winglet Option Engine Distance from ToD to KARLA (NM)
1 737-600 Clean 20K 75.59 2 737-600 Clean 22K 75.88 3 737-700 Clean 20K 75.01 4 737-700 Clean 22K 74.86 5 737-700 Clean 24K 74.47 6 737-700 Clean 26K 74.75 7 737-700 Winglets 20K 75.57 8 737-700 Winglets 22K 75.47 9 737-700 Winglets 24K 75.48
10 737-700 Winglets 26K 75.71 11 737-700IGW Clean 24K 74.77 12 737-700IGW Clean 26K 74.80 13 737-700ER Clean 24K 74.95 14 737-700ER Clean 26K 74.50 15 737-700ER Winglets 26K 75.24 16 737-800 Clean 24K 71.20 17 737-800 Clean 26K 71.69 18 737-800 Clean 27K 71.29 19 737-800 Winglets 24K 73.94 20 737-800 Winglets 26K 73.62 21 737-800 Winglets 27K 74.09 22 737-900 Clean 24K 71.58 23 737-900 Clean 26K 71.78 24 737-700IGW Winglets 24K 75.23 25 737-700IGW Winglets 24K 75.50 26 737-700IGW Winglets 26K 75.62
There is likely to be some error in the determination of ToD, due to the fact that the FMS test bench only reports position data at five-second intervals. This means that the aircraft’s actual departure from cruise altitude may have occurred anywhere from 1 – 4 seconds prior to what is indicated in the FMS test bench data output. An analysis of the potential magnitude of this error showed that the error in ToD would be, at most, on the order of 0.1 – 0.2 nautical miles (NM). This small
magnitude of error is not expected to have a meaningful impact on the findings of this analysis.
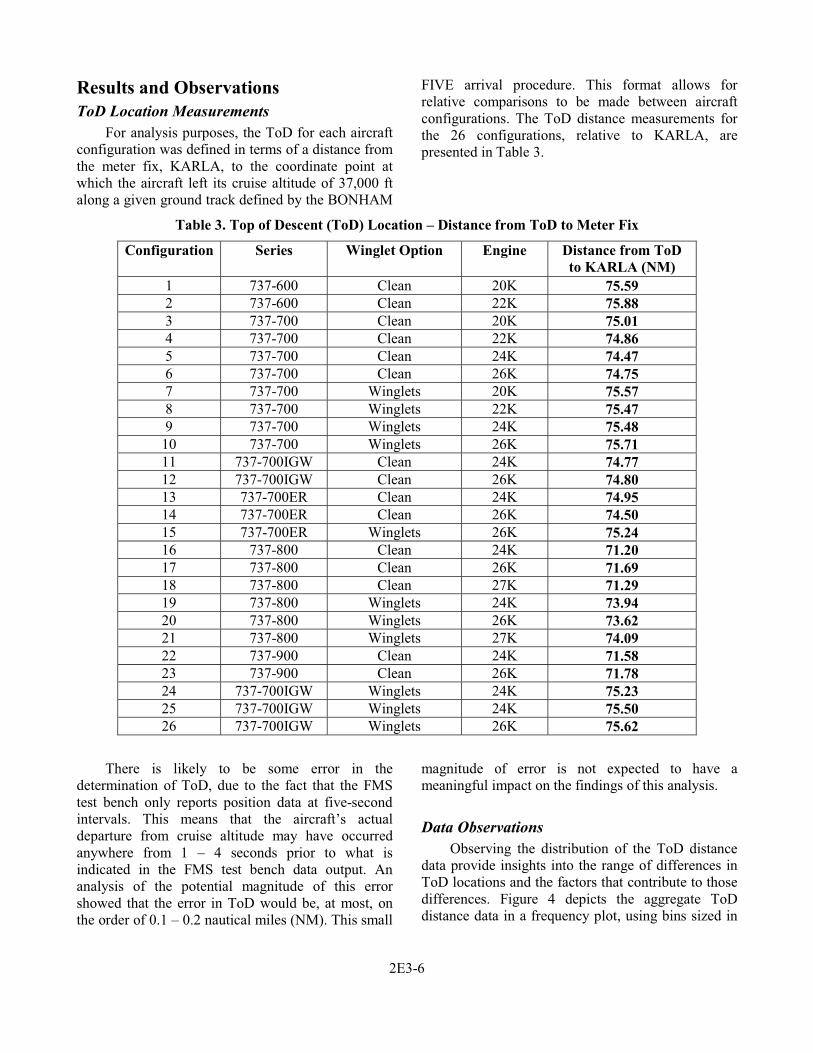
Data Observations Observing the distribution of the ToD distance
data provide insights into the range of differences in ToD locations and the factors that contribute to those differences. Figure 4 depicts the aggregate ToD distance data in a frequency plot, using bins sized in
2E3-7
0.5 NM increments. From this figure it can be seen that the range of ToD locations are grouped into two distinct clusters, with five observations falling within the 71 – 72 NM bins and 21 observations falling within the 73.5 – 76 NM bins.
0
1
2
3
4
5
6
7
71 71.5 72 72.5 73 73.5 74 74.5 75 75.5 76 More
Freq
uenc
y
TOD Distance from KARLA (NM)
Frequency
Figure 4. Distribution of Aggregate ToD Location Data
The range of ToD locations for all 737 configurations tested spans approximately 5 NM (4.68 NM to be exact).
Series Factor Figure 5 introduces the “series” factor to the
frequency plot, with each of the four series (600, 700, 800, and 900) represented by a shade of gray. This figure provides a strong indication that series is likely a significant factor that affects ToD location. As seen in the figure, the 800 and 900 series aircraft begin their descents closer to the meter fix, while the 700 and 600 series aircraft tend to begin their descents further from the meter fix.
0
1
2
3
4
5
6
7
71 71.5 72 72.5 73 73.5 74 74.5 75 75.5 76 More
Freq
uenc
y
TOD Distance from KARLA (NM)
900 Series
800 Series
700 Series
600 Series
Figure 5. Distribution of ToD Location by Series
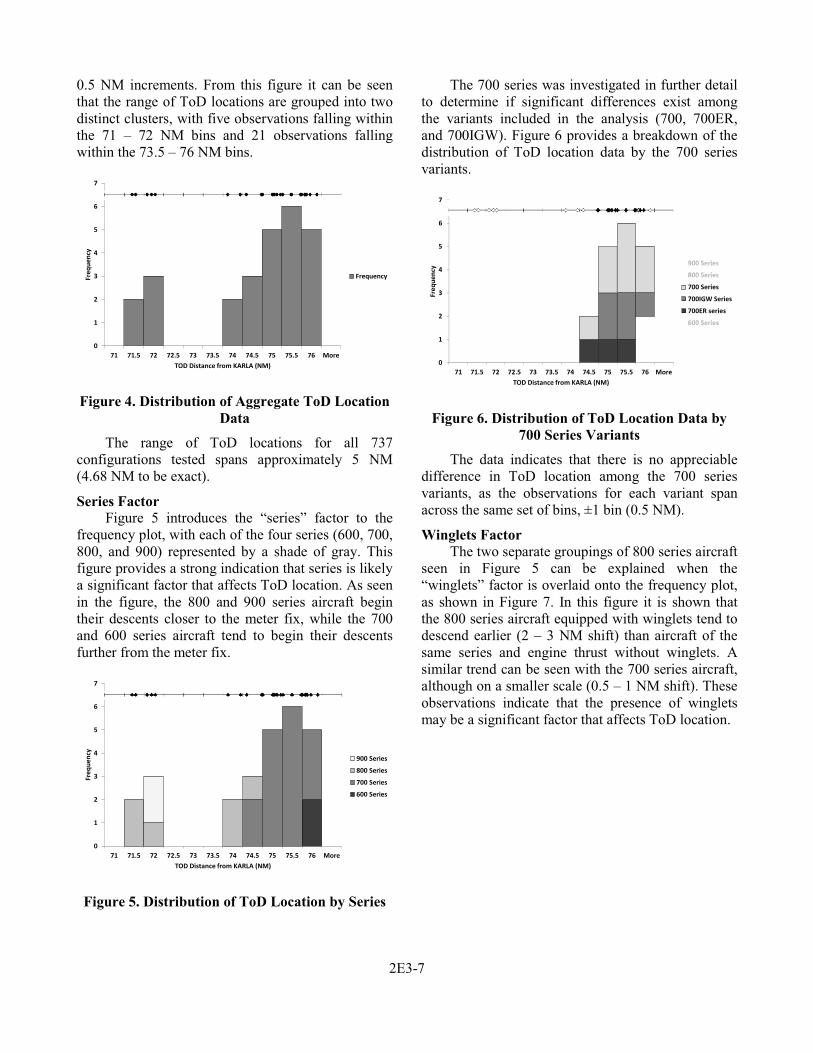
The 700 series was investigated in further detail to determine if significant differences exist among the variants included in the analysis (700, 700ER, and 700IGW). Figure 6 provides a breakdown of the distribution of ToD location data by the 700 series variants.
0
1
2
3
4
5
6
7
71 71.5 72 72.5 73 73.5 74 74.5 75 75.5 76 More
Freq
uenc
y
TOD Distance from KARLA (NM)
900 Series
800 Series
700 Series
700IGW Series
700ER series
600 Series
900 Series
800 Series
600 Series
7
Figure 6. Distribution of ToD Location Data by 700 Series Variants
The data indicates that there is no appreciable difference in ToD location among the 700 series variants, as the observations for each variant span across the same set of bins, ±1 bin (0.5 NM).
Winglets Factor The two separate groupings of 800 series aircraft
seen in Figure 5 can be explained when the “winglets” factor is overlaid onto the frequency plot, as shown in Figure 7. In this figure it is shown that the 800 series aircraft equipped with winglets tend to descend earlier (2 – 3 NM shift) than aircraft of the same series and engine thrust without winglets. A similar trend can be seen with the 700 series aircraft, although on a smaller scale (0.5 – 1 NM shift). These observations indicate that the presence of winglets may be a significant factor that affects ToD location.
2E3-8
0
1
2
3
4
5
6
7
71 71.5 72 72.5 73 73.5 74 74.5 75 75.5 76 More
Freq
uenc
y
TOD Distance from KARLA (nm)
900 Series
800 Series
700 Series
600 Series
Winglets
Figure 7. Distribution of ToD Distance Data by Series and Winglets
While this analysis doesn’t attempt to explain the exact reasoning for this shift, it can be hypothesized that the winglets, which reduce drag and improve aerodynamic performance, also reduce the rate at which an aircraft descends during an idle power descent (due to the improved aerodynamics). As such, an aircraft equipped with winglets would need to begin its decent earlier under idle power, as it will take longer for the aircraft to descend to reach a target altitude. The advantage to this is that the aircraft will reduce its power earlier to begin the descent, and will remain at reduced power over a longer distance, thus providing improved fuel efficiency.
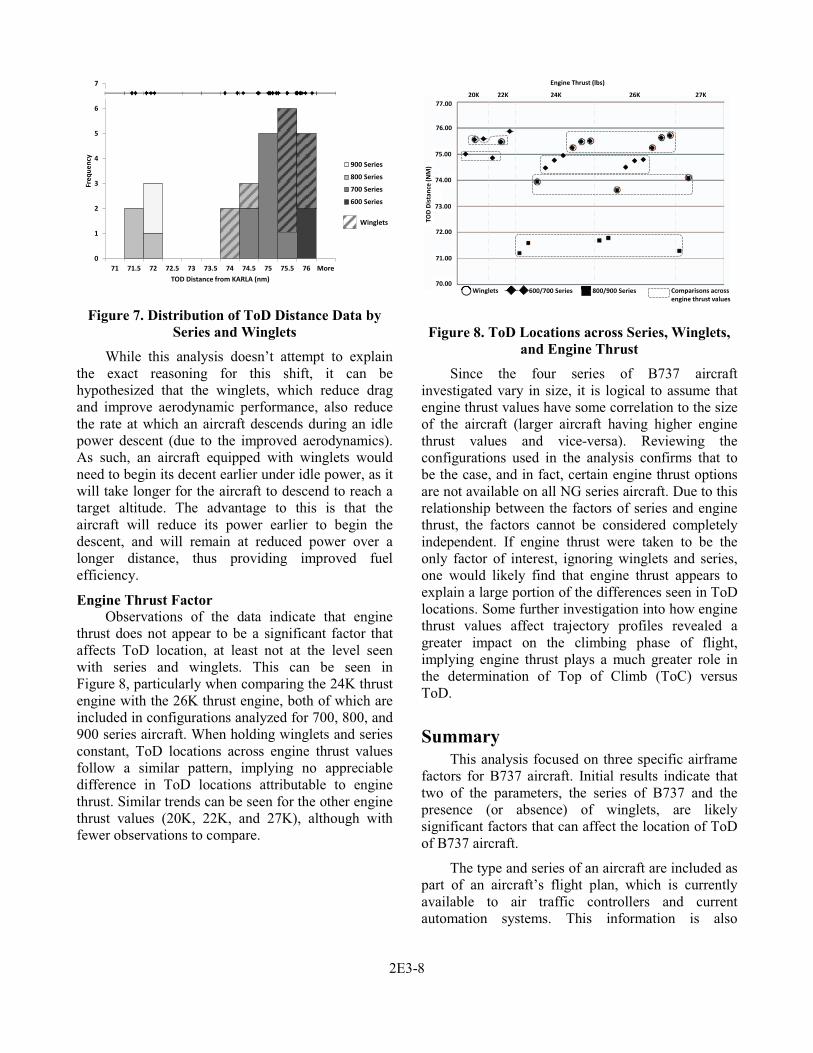
Engine Thrust Factor Observations of the data indicate that engine
thrust does not appear to be a significant factor that affects ToD location, at least not at the level seen with series and winglets. This can be seen in Figure 8, particularly when comparing the 24K thrust engine with the 26K thrust engine, both of which are included in configurations analyzed for 700, 800, and 900 series aircraft. When holding winglets and series constant, ToD locations across engine thrust values follow a similar pattern, implying no appreciable difference in ToD locations attributable to engine thrust. Similar trends can be seen for the other engine thrust values (20K, 22K, and 27K), although with fewer observations to compare.
20K 22K 24K 26K 27K
Winglets 600/700 Series 800/900 Series
20K 22K 24K 26K 27K
Winglets 600/700 Series 800/900 Series
77.00
76.00
75.00
74.00
73.00
72.00
71.00
70.00
TOD
Dist
ance
(NM
)
Engine Thrust (lbs)
Comparisons across engine thrust values
Figure 8. ToD Locations across Series, Winglets, and Engine Thrust
Since the four series of B737 aircraft investigated vary in size, it is logical to assume that engine thrust values have some correlation to the size of the aircraft (larger aircraft having higher engine thrust values and vice-versa). Reviewing the configurations used in the analysis confirms that to be the case, and in fact, certain engine thrust options are not available on all NG series aircraft. Due to this relationship between the factors of series and engine thrust, the factors cannot be considered completely independent. If engine thrust were taken to be the only factor of interest, ignoring winglets and series, one would likely find that engine thrust appears to explain a large portion of the differences seen in ToD locations. Some further investigation into how engine thrust values affect trajectory profiles revealed a greater impact on the climbing phase of flight, implying engine thrust plays a much greater role in the determination of Top of Climb (ToC) versus ToD.
Summary This analysis focused on three specific airframe
factors for B737 aircraft. Initial results indicate that two of the parameters, the series of B737 and the presence (or absence) of winglets, are likely significant factors that can affect the location of ToD of B737 aircraft.
The type and series of an aircraft are included as part of an aircraft’s flight plan, which is currently available to air traffic controllers and current automation systems. This information is also
2E3-9
displayed on a controller’s situation display as part of an aircraft’s datablock. However, information on the presence of winglets is not currently captured in any data source that is available to air traffic controllers or automation systems. If the differences in ToD locations caused by winglets are determined to be a critical factor for achieving a desired level of trajectory prediction performance, then additional research will be needed to identify how this aircraft characteristic can be made available to automation or to identify methods for mitigating the potential error around ToD predictions if this information cannot be made available.
Other Factors It is recognized that there are, potentially, many
other factors that can affect ToD location. Some of those factors include the pilot-configurable settings within the FMS itself that can vary from flight-to-flight. One example of a particular setting that is likely to affect the location of ToD is the anti-ice setting, which increases engine power when in use.
Other factors such as weight—how different magnitudes of weight can affect the range of ToD—and winds—how different magnitudes and directions of winds can affect the ToD range for a given aircraft type—should also be considered for further analysis in order to ascertain the full magnitude of ToD variability when all significant factors are included. This analysis also examined only a single cruising altitude of 37,000 ft. It may be beneficial to execute similar scenarios at other cruising altitudes to observe the effect that altitude may have on the magnitude, or on the relative significance of the factors, with respect to ToD location.
Understanding how these additional factors affect ToD location and the range of ToD possibilities would be beneficial for improving trajectory prediction performance.
Other Aircraft Types It would also be useful to conduct a similar
analysis for aircraft types other than the B737, to identify if similar trends for ToD location hold true for other aircraft types. According to data from a fleet mix forecast analysis [1], conducted by CAASD in 2010, the B737 NG aircraft (600, 700, 800, and 900 series) used in this analysis accounted for
approximately 13.7% of all arrival operations in 2009 into 24 medium and high density TRACONs, with the B737-700 and B737-800 accounting for 9.2% and 4.0% of arrival operations respectively (the B737-600 and B737-900 account for less than 1% combined). At seven of the TRACONs, the B737 NG aircraft accounted for over 20% of the arrival operations. Projections for 2016 (an estimated timeframe that several TBO concepts that leverage trajectory prediction capabilities have targeted for implementation) indicate a similar distribution, with the B737 NG aircraft accounting for approximately 14% of arrival operations (9.4% and 4.1% for the B737-700 and B737-800, respectively) into the 24 TRACONs.
Other aircraft types may include additional factors of interest, relevant to the determination of TOD location, which may not be present on, or applicable to, the B737 and may warrant further study. In addition, factors that are in common may not have the same magnitude of impact as the ones included in this analysis. For example, some aircraft types that are equipped with winglets utilize a different winglet style than the blended winglet found on the B737. Current Airbus aircraft use a style of winglet known as a wingtip fence, which resembles an arrowhead and extends both above and below the tip of the wing. However, beginning in 2012, Airbus plans to offer a blended winglet option for their A320 family of aircraft, with a style similar to the winglet type examined in this analysis. The manner in which different winglet styles affect ToD location is not known and constitutes a potential topic for further research.
References [1] Gaydos, T., et al., February 2010, Three Dimensional (3D) Path Arrival Management (PAM) Concept: Future Equipage and Operations Analysis, Enclosure to Letter F045-L10-017, McLean, VA, The MITRE Corporation.
Acknowledgements The author wishes to acknowledge several
individuals at MITRE/CAASD for their help and support in developing this analysis. The author would like to thank Robin Kirkman for providing development support for the configuration and

2E3-10
automation of the Flight Management System (FMS) Operator tool. The author would like to thank Justin Ferrante for his support in parsing the raw data. The author would like to acknowledge Al Herndon, Sam Miller, and Carmen Villani for contributing their knowledge and expertise in the operation and configuration of aircraft FMSs, which was critical in the formulation of the test configurations used in this analysis. Lastly, the author would like to acknowledge Laurel Stell at the National Aeronautics and Space Administration (NASA) for providing inputs to the scenario parameters used for the analysis.
Disclaimer The contents of this material reflect the views of
the author and/or the Director of the Center for Advanced Aviation System Development. Neither the Federal Aviation Administration nor the Department of Transportation makes any warranty or guarantee, or promise, expressed or implied, concerning the content or accuracy of the views expressed herein.
30th Digital Avionics Systems Conference
October 16-20, 2011