
Analysis of the Outer Retina Reconstructed by High-Resolution, Three-Dimensional Spectral Domain...
10
Analysis of the Outer Retina Reconstructed by High-Resolution, Three-Dimensional Spectral Domain Optical Coherence Tomography Jakub J. Kaluzny, MD, Maciej Wojtkowski, PhD, Bartosz L. Sikorski, MD, Maciej Szkulmowski, PhD, Anna Szkulmowska, MSc, Tomasz Bajraszewski, PhD, James G. Fujimoto, PhD, Jay S. Duker, MD, Joel S. Schuman, MD, and Andrzej Kowalczyk, PhD Department of Ophthalmology, Collegium Medicum, Nicolaus Copernicus University, Bydgoszcz, Poland (JJK, BLS); the Institute of Physics, Nicolaus Copernicus University, Torun, Poland (MW, MS, AS, TB, AK); the Department of Electrical Engineering and Computer Science and Research Laboratory of Electronics, Massachusetts Institute of Technology, Cambridge, Massachusetts (JGF); New England Eye Center, Tufts-New England Medical Center, Tufts University, Boston, Massachusetts (JSD); and UPMC Eye Center, Department of Ophthalmology, University of Pittsburgh School of Medicine, Pittsburgh, Pennsylvania (JSS) Abstract Background and Objective—A retrospective cross-sectional study was conducted to demonstrate an analysis of an outer retinal layer reconstructed by the three-dimensional and high- speed spectral domain optical coherence tomography (SD-OCT) instrument. Patients and Methods—New measurement protocols for SD-OCT and methods of analysis and visualization of the individual segmented retinal layer reconstructed by SD-OCT were proposed. Three contour maps representing mutual distances between the basal part of the retinal pigment epithelium, the junction between the inner and outer segments of photoreceptors, and a reference contour representing the shape of a healthy retina were introduced. Results—The analysis of the outer retina was performed on pathological eyes. Three cases of central serous chorioretinopathy, age-related macular degeneration, and acute zonal occult outer retinopathy are demonstrated. Conclusion—Three contour maps reconstructed for clinical cases demonstrate high variability of observed patterns depending on analyzed pathology. The authors believe this can help to present OCT data simultaneously in a more comprehensive and convenient way to assist in everyday clinical diagnosis. Introduction Optical coherence tomography (OCT) is one of the modern optical imaging technologies useful in ophthalmology when used in addition to standard fundus photography and fluorescein angiography, which are currently accepted as the “gold standard” of diagnostic ophthalmic imaging methods. Address correspondence to Maciej Wojtkowski, PhD, Institute of Physics, Nicolaus Copernicus University, ul. Grudziadzka 5, 87-100 Torun, Poland. Drs. Fujimoto and Schuman receive royalties from intellectual property licensed from M.I.T. to Carl Zeiss Meditec, Inc., Dublin, California. Drs. Kaluzny, Sikorski, Szkulmowski, Szkulmowska, Bajraszewski, Duker, and Kowalczyk have no financial or proprietary interest in the materials presented herein. Drs. Duker and Schuman did not participate in the editorial review of this manuscript. NIH Public Access Author Manuscript Ophthalmic Surg Lasers Imaging. Author manuscript; available in PMC 2009 September 14. Published in final edited form as: Ophthalmic Surg Lasers Imaging. 2009 ; 40(2): 102–108. NIH-PA Author Manuscript NIH-PA Author Manuscript NIH-PA Author Manuscript
-
Upload
independent -
Category
Documents
-
view
0 -
download
0
Transcript of Analysis of the Outer Retina Reconstructed by High-Resolution, Three-Dimensional Spectral Domain...
Analysis of the Outer Retina Reconstructed by High-Resolution,Three-Dimensional Spectral Domain Optical CoherenceTomography
Jakub J. Kaluzny, MD, Maciej Wojtkowski, PhD, Bartosz L. Sikorski, MD, Maciej Szkulmowski,PhD, Anna Szkulmowska, MSc, Tomasz Bajraszewski, PhD, James G. Fujimoto, PhD, Jay S.Duker, MD, Joel S. Schuman, MD, and Andrzej Kowalczyk, PhDDepartment of Ophthalmology, Collegium Medicum, Nicolaus Copernicus University, Bydgoszcz,Poland (JJK, BLS); the Institute of Physics, Nicolaus Copernicus University, Torun, Poland (MW,MS, AS, TB, AK); the Department of Electrical Engineering and Computer Science and ResearchLaboratory of Electronics, Massachusetts Institute of Technology, Cambridge, Massachusetts(JGF); New England Eye Center, Tufts-New England Medical Center, Tufts University, Boston,Massachusetts (JSD); and UPMC Eye Center, Department of Ophthalmology, University ofPittsburgh School of Medicine, Pittsburgh, Pennsylvania (JSS)
AbstractBackground and Objective—A retrospective cross-sectional study was conducted todemonstrate an analysis of an outer retinal layer reconstructed by the three-dimensional and high-speed spectral domain optical coherence tomography (SD-OCT) instrument.
Patients and Methods—New measurement protocols for SD-OCT and methods of analysis andvisualization of the individual segmented retinal layer reconstructed by SD-OCT were proposed.Three contour maps representing mutual distances between the basal part of the retinal pigmentepithelium, the junction between the inner and outer segments of photoreceptors, and a referencecontour representing the shape of a healthy retina were introduced.
Results—The analysis of the outer retina was performed on pathological eyes. Three cases of centralserous chorioretinopathy, age-related macular degeneration, and acute zonal occult outer retinopathyare demonstrated.
Conclusion—Three contour maps reconstructed for clinical cases demonstrate high variability ofobserved patterns depending on analyzed pathology. The authors believe this can help to presentOCT data simultaneously in a more comprehensive and convenient way to assist in everyday clinicaldiagnosis.
IntroductionOptical coherence tomography (OCT) is one of the modern optical imaging technologies usefulin ophthalmology when used in addition to standard fundus photography and fluoresceinangiography, which are currently accepted as the “gold standard” of diagnostic ophthalmicimaging methods.
Address correspondence to Maciej Wojtkowski, PhD, Institute of Physics, Nicolaus Copernicus University, ul. Grudziadzka 5, 87-100Torun, Poland.Drs. Fujimoto and Schuman receive royalties from intellectual property licensed from M.I.T. to Carl Zeiss Meditec, Inc., Dublin,California. Drs. Kaluzny, Sikorski, Szkulmowski, Szkulmowska, Bajraszewski, Duker, and Kowalczyk have no financial or proprietaryinterest in the materials presented herein.Drs. Duker and Schuman did not participate in the editorial review of this manuscript.
NIH Public AccessAuthor ManuscriptOphthalmic Surg Lasers Imaging. Author manuscript; available in PMC 2009 September 14.
Published in final edited form as:Ophthalmic Surg Lasers Imaging. 2009 ; 40(2): 102–108.
NIH
-PA Author Manuscript
NIH
-PA Author Manuscript
NIH
-PA Author Manuscript
Spectral domain OCT (SD-OCT) is a novel variant that enables collecting three-dimensionaldata within seconds and increases the effective coverage of the retina, revealing small and focalpathological changes.1 A primary purpose of our study was the creation of a tool based on OCTtechnology that can be easily compared with fundus photography and fluorescein angiographyimages. A unique feature of the SD-OCT technology, and one of the most promising, is thepossibility of quantitative analysis of photoreceptor layers. It has been demonstrated thatincreased axial resolution significantly improves visualization of photoreceptor morphology.2-4 Using the combined high axial resolution and high speed offered by SD-OCT instruments,it is possible to create maps of the thickness of outer retinal layers. Preliminary results of usingthis technology in healthy eyes were published in 2005.1
Three-dimensional imaging performed by the SD-OCT instrument provides a significantamount of data. Precise analysis of 200 or more B-scans is often difficult and time consuming.Thickness maps enable simultaneous access to all B-scans. Unlike a single B-scan, thethickness maps reveal the exact location and dimensions of pathologies in respect to the retinalvasculature in a way that is easy to compare with fluorescein angiography and retinalphotography. Pathological changes present in the OCT images of outer retinal regionsdemonstrate high variability of reconstructed patterns. Therefore, we assume that thicknessmaps of this region can also help to perform detailed analysis, providing better diagnosis andunderstanding of pathogenesis. Another important issue is that thickness maps enable obtainingobjective, quantitative data corresponding to the extent of elevations and depressions presentin different pathologies.
In this article, we present for the first time maps of outer retinal layer thickness in pathologicaleyes using a new method of numerical analysis of SD-OCT data. Exhaustive, technicaldescription of this new algorithm, including a layer segmentation procedure, has been recentlypresented by our group.5 Additionally, new, specialized measurement protocols have beenapplied to obtain SD-OCT data in the ophthalmology clinic. We use these new methods ofanalysis and visualization of the individual segmented layer representing the complex of theretinal pigment epithelium (RPE) and outer segments of photoreceptors, which we believe canprovide a better understanding of disease pathogenesis, more sensitive diagnostic indicatorsof early disease, and better ways to follow the progress of and recovery from disease in thefuture.
Patients and MethodsMeasurement System
In our experiments, we used a prototype SD-OCT instrument, which has been optimized foruse in clinical conditions. The instrument was constructed at Nicolaus Copernicus Universityand is described in detail elsewhere.5 Two scanning protocols were implemented. To collectgeneral information about pathological changes in retinal structure, 35 cross-sectional imageswere taken, each consisting of 3,000 lines (optical A-scans) covering an area of X = 6 mm/Y= 3 mm within less than 4 seconds. For quantitative analysis, the second protocol was applied:200 cross-sectional images, each consisting of 400 A-scans, covering an area of X = 6 mm/Y= 6 mm within 3 seconds.
Data Analysis ToolOCT provides information on retinal structure based on the intensity and distribution of back-scattered or back-reflected light. We implemented a method of retinal layer segmentation thatdelineates areas characterized by similar distribution of back-scattered intensity. A detaileddescription of the segmentation algorithm is published elsewhere.5 We will briefly describe a
Kaluzny et al. Page 2
Ophthalmic Surg Lasers Imaging. Author manuscript; available in PMC 2009 September 14.
NIH
-PA Author Manuscript
NIH
-PA Author Manuscript
NIH
-PA Author Manuscript
numerical procedure that is optimized for analysis of the outer retina, the merged layers of theRPE, and the outer segments of the photoreceptors.
Figure 1 shows the data processing scheme. In the first step, the operator chooses one imagefrom the set of 200 cross-sectional images and defines the rectangular region of interest insidethe layer of interest (Fig. 1A, ROI 1). This region enables the operator to calculate parameters,which will be used for the further automated analysis of the entire 3D set of data.
In the second step, our algorithm enables the operator to create a reference plane correspondingto the shape of the posterior retina. The natural architecture of the eye and the properties of theOCT scanning system usually result in an approximately parabolic shape for the reconstructedretina. Therefore, our software uses a simple parabolic fit procedure applied to the contourdelineating the posterior retina for each cross-sectional image. The set of such parabolic curvescreates the reference surface outer retinal contour (Fig. 1B, ORC).
In the third step, each OCT scan is realigned to flatten the ORC while preserving the originalradial dimensions (Fig. 1C). Once the cross-sectional images are flattened and cropped, onecan perform a detailed analysis of the outer retina. The parameters previously set forsegmentation are no longer valid, a new ROI can be chosen manually by the operator (Fig. 1D,ROI 2), and the automated processing of the entire 3D set of data is repeated, this time providingexact delineation of OCT layers corresponding to the RPE and the inner segment/outer segment(IS/OS) junction.
In the final step, our software automatically provides two contour lines most likely representingthe basal part of the RPE and the IS/OS junction, respectively (Fig. 1E). As a result of the entireprocessing procedure, one obtains 200 sets of three contours, the RPE, the IS/OS, and the ORC(Fig. 1F), which can be analyzed with respect to each other and the results displayed as contourmaps in a false color scale (Fig. 1G). We think that the simultaneous analysis of the three mapsrepresenting separations between the RPE and IS/OS, the IS/OS and ORC, and the RPE andORC may provide additional diagnostic information significant from the clinical perspective.
Additionally, it is possible to construct the SD-OCT fundus view based on cropped andflattened SD-OCT cross-sectional images (Fig.1C).1,6 This procedure augments pathologicalchanges present in the posterior retina. All images of the SD-OCT fundus view presented inResults are created in this way.
Patients and ExaminationThe prototype SD-OCT device operates on an everyday basis at the ophthalmology clinic. Thequantitative analysis of the outer retina was performed on 34 eyes from 20 patients and anadditional 15 healthy eyes from volunteers with normal vision (20–76 years of age). In thisarticle, we present the most representative cases demonstrating various patterns of contourmaps depending on the group of pathological changes.
Patient age ranged from 18 to 81 years. After complete ophthalmologic examination, includingfluorescein angiography and color fundus photography (TRC-50 EX; Topcon, Tokyo, Japan),early age-related macular degeneration in the form of soft drusen was diagnosed in 24 eyes.Central serous chorioretinopathy was discovered in seven eyes. Features of photoreceptoratrophies or dysfunctions were found in three eyes.
The optical power incident on the eye was 750 μW, which is consistent with Polish norms andAmerican National Standards Institute safety standards.7,8 The examination was conducted inaccordance with the Declaration of Helsinki. Written informed consent was obtained from allsubjects after all consequences of the study had been explained. The study protocol was
Kaluzny et al. Page 3
Ophthalmic Surg Lasers Imaging. Author manuscript; available in PMC 2009 September 14.
NIH
-PA Author Manuscript
NIH
-PA Author Manuscript
NIH
-PA Author Manuscript
approved by the ethics committee of the Collegium Medicum Nicolaus Copernicus University,Bydgoszcz, Poland.
SD-OCT examination was performed in each eye according to the measurement protocolsdescribed above. The SD-OCT measurements were made after pupil dilation (0.5%tropicamide) with the patient in the sitting position with the head placed on a chin rest.
ResultsSimultaneous analysis of the RPE-ORC, IS/OS-RPE, and IS/OS-ORC maps calculatedseparately for each of the eyes examined revealed high variability depending on the type oflesion. In healthy eyes, all three thickness maps showed almost uniform distribution of colorsrepresenting constant thicknesses of analyzed layers.5 Contour maps of different pathologicaleyes demonstrate patterns composed from areas of increased (yellow-red) and decreased (blue-black) distances between segmented layers. To demonstrate high variability of thickness maps,we describe three cases of retinal diseases.
Elevations of RPEThe common feature of RPE elevations, independent of their origin, is an increased distancebetween the ORC and RPE. This can be observed as changes in shape, size, and location ofelevations in the RPE-ORC map. Theoretically, the IS/OS junction should be intact, and nosignificant changes should be visible in the IS/OS-RPE map.
Figure 2 demonstrates multifocal detachment of the RPE in a patient with chronic central serouschorioretinopathy. Cross-sectional SD-OCT scan through the central macula shows two areasof fluid under the RPE. The most prominent RPE elevation on the RPE-ORC map (Fig. 2D)has an irregular shape and is located temporal to the foveal center. Two smaller areas of RPEelevation are visible superiorly to the fovea and a third, smaller one directly in the foveola.
The IS/OS-ORC map (Fig. 2F) shows the same areas of the RPE detachment as the RPE-ORCmap, but the elevations are displayed as yellow-red islands surrounded by green areas wherethe 80-μm distance between the RPE and IS/OS junction, which is characteristic for a healthyretina, is maintained. The loss of reflectivity from the IS/OS junction above the highest RPEelevation, especially in areas not perpendicular to the direction of illuminating light, is probablythe reason for the decrease in separation observed in the IS/OS-RPE map (Fig. 2E). However,some photoreceptor damage cannot be excluded. This loss of reflectivity is not observed in thecase of small RPE elevations, as can be seen in the foveal center.
Elevation of RPE and Neurosensory RetinaFigure 3 shows soft drusen in an eye with age-related macular degeneration. The drusen visibleon the RPE-ORC map have the form of oval elevations of up to 200 μm, with a relativelysmooth regular surface. We observed that the dimensions and localization of drusen differsignificantly from eye to eye. The common feature is an increased separation between the RPEand IS/OS junction around the drusen that strains the overlying neurosensory retina. As a result,concave elevations (red) surrounding the oval area of deposits (green) under the RPE may bevisible on the IS/OS-RPE maps (Fig. 3E). Photoreceptor atrophy, which sometimes appearsanteriorly to the drusen, may be responsible for the small localized depressions (blue dots)located centrally in the drusen areas (green).
The IS/OS-ORC map (Fig. 3F) can be understood as a combination of the IS/OS-RPE and theRPE-ORC map. It helps to evaluate the distribution and height of the RPE elevations withrespect to areas of increased separation between the RPE and IS/OS junction. The highest
Kaluzny et al. Page 4
Ophthalmic Surg Lasers Imaging. Author manuscript; available in PMC 2009 September 14.
NIH
-PA Author Manuscript
NIH
-PA Author Manuscript
NIH
-PA Author Manuscript
elevations in this map (up to 240 μm) are localized exactly in the areas of RPE elevationscorresponding to the drusen in the RPE-ORC map (Fig. 3D).
Atrophy of PhotoreceptorsFigure 4 illustrates a case of acute zonal occult outer retinopathy. The characteristic feature ofOCT cross-sectional images of retinal photoreceptor cell atrophy is a loss in reflectivity of theIS/OS junction. The IS/OS junction is defined as the border between the inner and outerphotoreceptor segments. Therefore, it is natural to expect that this layer will disappear togetherwith the photoreceptor cell bodies. In areas of atrophy the contour line, which in other casescorresponds to the IS/OS junction, now appears almost at the level of the ORC. This results ineffective areas of depression (blue) in both the IS/OS-RPE and IS/OS-ORC maps (Figs. 4Eand 4F). A similar situation will be present if the reflectivity of the IS/OS junction is muchsmaller than that observed in healthy eyes.
In this patient, broad zones of photoreceptor dysfunction confirmed by electrophysiologicalexamination can be seen in the IS/OS-RPE and IS/OS-ORC maps as a blue depression. Theyellow-green irregular island in the center is the area of highest IS/OS reflectivity. Theseparation between the RPE and the IS/OS junction, as well as between the ORC and the IS/OS junction, is normal in this region (60-80 μm) because the photoreceptors in this area areunaffected. In the peripheral part of the fovea, the blue color in the IS/OS-RPE map and theblue-green color in the IS/OS-ORC map are dominating. In these regions, the contour lines runclose to each other, indicating zones of lower reflectivity of the IS/OS junction. Due to lack ofsignificant abnormalities in the RPE, the RPE-ORC map (Fig. 4D) does not demonstrate anyelevations or depressions and is uniformly black.
DiscussionBased on our preliminary results, we observed that specific patterns visible on the contourthickness maps can be attributed to different groups of RPE elevations, depending on theirorigin. There are also specific patterns of the contour maps associated with different origin ofdetachments of neurosensory retina and dysfunctions of photoreceptors. However, it isimportant to note that the correct interpretation of observed morphological changes should bebased on all three maps and spectral domain OCT cross-sectional images analyzed together.This is caused by limited information provided by the measurement and the analysis based onthe distribution of back-reflected intensity The proposed contour maps can be also treated asa convenient way of displaying 3D data, enhancing morphological changes and helping anophthalmologist in the timely and reliable evaluation of the disease. Moreover, the contourmaps provide additional information of morphological features such as shape and dimensions.
Despite many advantages, thickness maps also have some limitations. They can be generatedonly if the OCT signal is strong enough to reconstruct easily recognizable hyperreflective linescorresponding to the RPE and IS/OS junction. This condition is usually fulfilled in early stagesof macular diseases. Another source of artifacts is a decrease of the IS/OS reflectivity withinelevated retina in the areas of the RPE detachment. As a result, the reference line running alongthe IS/OS junction jumps to the level of the RPE. Due to the decreased reflectivity of the IS/OS junction, the depression is visible (Fig. 2E) instead of normal-constant distance.
Our newly developed algorithm enables segmentation of highly reflective OCT signals fromposterior retina, including the RPE and outer segments of photoreceptors, in healthy andpathological cases. After calculation of an additional reference line called the ORC, three typesof thickness maps can be generated. These contour maps reconstructed for clinical casesdemonstrate high variability of observed patterns depending on analyzed pathology. Despitethe presence of artifacts in more advanced cases, we believe that simultaneous analysis of SD-
Kaluzny et al. Page 5
Ophthalmic Surg Lasers Imaging. Author manuscript; available in PMC 2009 September 14.
NIH
-PA Author Manuscript
NIH
-PA Author Manuscript
NIH
-PA Author Manuscript

OCT cross-sectional images together with all three proposed contour maps can bring additionalvaluable and clinically significant information. In the future, this also can help to find new,more sensitive diagnostic markers for early detection of retinal diseases and can provide abetter understanding of disease pathogenesis and progression.
AcknowledgmentsSupported by Polish Ministry of Science, grants for years 2006 to 2009. Dr. Wojtkowski receives additional supportof Foundation for Polish Science (Homing 34 project) and Rector of NCU for the scientific grant 504-F.
References1. Wojtkowski M, Srinivasan V, Fujimoto JG, Schuman JS, Kowalczyk A, Duker JS. Three-dimensional
retinal imaging with high-speed ultrahigh-resolution optical coherence tomography. Ophthalmology2005;112:1734–1746. [PubMed: 16140383]
2. Ko TH, Fujimoto JG, Duker JS, et al. Comparison of ultrahigh- and standard-resolution opticalcoherence tomography for imaging macular hole pathology and repair. Ophthalmology2004;111:2033–2043. [PubMed: 15522369]
3. Ko TH, Adler DC, Fujimoto JG, et al. Ultrahigh resolution optical coherence tomography imagingwith a broadband superluminescent diode light source. Optics Express 2004;12:2112–2119. [PubMed:19475046]
4. Srinivasan VJ, Wojtkowski M, Witkin AJ, et al. High-definition and 3-dimensional imaging of macularpathologies with high-speed ultrahigh-resolution optical coherence tomography. Ophthalmology2006;113:e1–e14. [PubMed: 17074565]
5. Szkulmowski M, Wojtkowski M, Sikorski B, et al. Analysis of posterior retinal layers in spectral opticalcoherence tomography images of the normal retina and retinal pathologies. J Biomed Optics2007;12:041207, 1–11.
6. Jiao SL, Knighton R, Huang XR, Gregori G, Puliafito CA. Simultaneous acquisition of sectional andfundus ophthalmic images with spectral-domain optical coherence tomography. Optics Express2005;13:444–452. [PubMed: 19488371]
7. Polskie, N. Bezpieczenstwo przy promieniowaniu emitowanym przez urzadzenia laserowe.Klasyfikacja sprzetu. Wymagania i wytyczne dla uzytkownika. Warsaw, Poland: WydawnictwoNormalizacyjne Alfa-Wero; 1992. PN-91/T-06700
8. American National Standards Institute. American National Standard for Safe Use of Lasers. Orlando,FL: Laser Institute of America; 2000. ANSI Z136.1-2000
Kaluzny et al. Page 6
Ophthalmic Surg Lasers Imaging. Author manuscript; available in PMC 2009 September 14.
NIH
-PA Author Manuscript
NIH
-PA Author Manuscript
NIH
-PA Author Manuscript
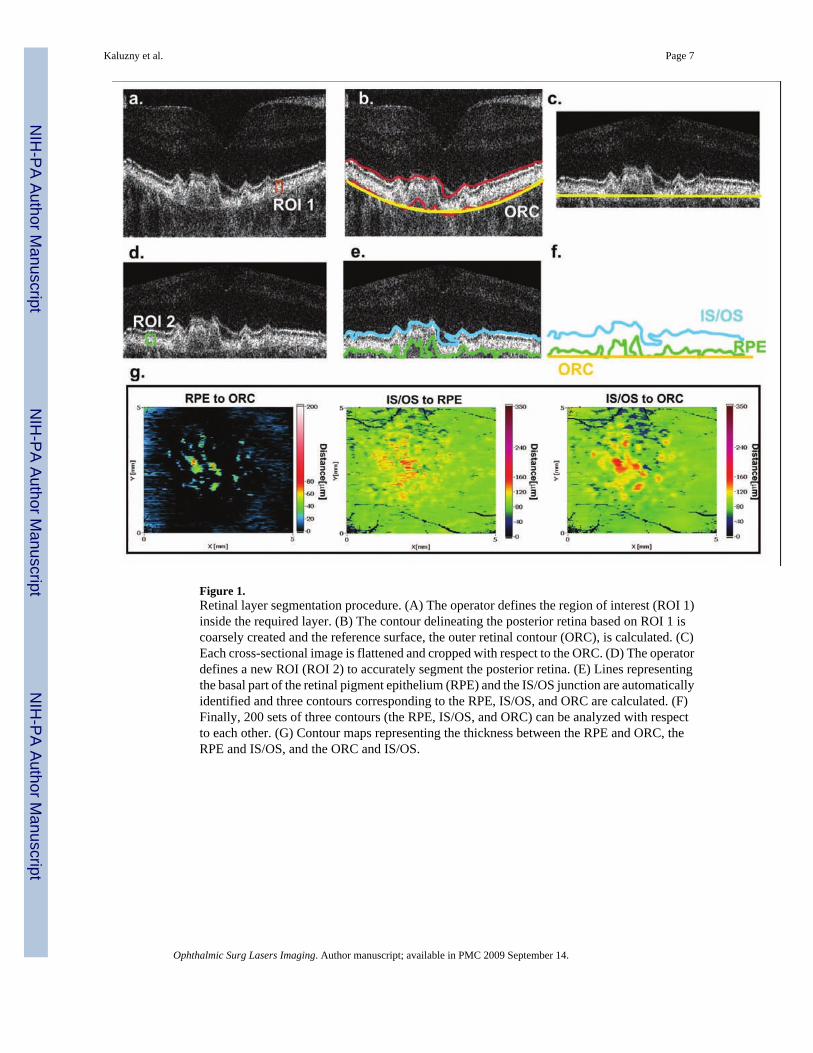
Figure 1.Retinal layer segmentation procedure. (A) The operator defines the region of interest (ROI 1)inside the required layer. (B) The contour delineating the posterior retina based on ROI 1 iscoarsely created and the reference surface, the outer retinal contour (ORC), is calculated. (C)Each cross-sectional image is flattened and cropped with respect to the ORC. (D) The operatordefines a new ROI (ROI 2) to accurately segment the posterior retina. (E) Lines representingthe basal part of the retinal pigment epithelium (RPE) and the IS/OS junction are automaticallyidentified and three contours corresponding to the RPE, IS/OS, and ORC are calculated. (F)Finally, 200 sets of three contours (the RPE, IS/OS, and ORC) can be analyzed with respectto each other. (G) Contour maps representing the thickness between the RPE and ORC, theRPE and IS/OS, and the ORC and IS/OS.
Kaluzny et al. Page 7
Ophthalmic Surg Lasers Imaging. Author manuscript; available in PMC 2009 September 14.
NIH
-PA Author Manuscript
NIH
-PA Author Manuscript
NIH
-PA Author Manuscript

Figure 2.Fluid under the RPE in a patient with multifocal RPE detachments in chronic central serouschorioretinopathy. (A) Fluorescein angiography reveals three hyperfluorescent areas of RPEdetachments (indicated by arrows) within the square area limited by yellow lines representingthe retina scanned by SD-OCT. (B) Cropped and flattened 3D OCT data can be displayed asa SD-OCT fundus view representing the sum of RPE and IS/OS reflectivity. (C) SD-OCTcross-sectional image scanned along the yellow line reveals two areas of fluid under the RPE,the first larger one located temporal to the fovea (thick arrow) and the second smaller onelocated in the foveolar center (thin arrow). (D) The RPE-ORC map shows the same areas ofRPE detachments as fluorescein angiography: significant RPE elevation temporal to the maculatogether with a second smaller elevation in the foveal center and a third elevation localizedclose to the superior margins of the fovea. (E) The IS/OS-RPE map indicates areas of thinningof this layer above the pigment epithelial detachments (arrows) and increased distance overthe smaller detachment in the foveal center (thick arrow). (F) Elevations in the IS/OS-ORCmap correspond to areas of RPE detachment also visible on the RPE-ORC map.
Kaluzny et al. Page 8
Ophthalmic Surg Lasers Imaging. Author manuscript; available in PMC 2009 September 14.
NIH
-PA Author Manuscript
NIH
-PA Author Manuscript
NIH
-PA Author Manuscript

Figure 3.Deposits under the RPE in the form of soft drusen in age-related macular degeneration. (A)The late phase of fluorescein angiography demonstrates large soft drusen in the center andsmall hard drusen in the periphery of the examined area (yellow lines). (B) Scattered harddrusen in the periphery are also visible on the SD-OCT fundus view. (C) Regular elevationsof the RPE by homogenous material of low reflectivity visible in the spectral domain OCTimage correspond to drusen (thick arrows). The places of increased separation between the IS/OS junction and RPE around drusen are marked (thin arrows). A small, highly reflectivestructure indicated by the red arrow is probably related to a pigment deposit visible onfluorescein angiography as a hypofluorescent spot (red arrow). (D) Regular, high elevationsof the RPE due to drusen are visible on the RPE-ORC map (thick arrows). (E) The IS/OS-RPEmap reveals concave areas of increased distance between the RPE and IS/OS junction arounddrusen (thin arrows). (F) The IS/OS-ORC map helps to assess the distribution of RPE elevationsin respect to the IS/OS elevations.
Kaluzny et al. Page 9
Ophthalmic Surg Lasers Imaging. Author manuscript; available in PMC 2009 September 14.
NIH
-PA Author Manuscript
NIH
-PA Author Manuscript
NIH
-PA Author Manuscript
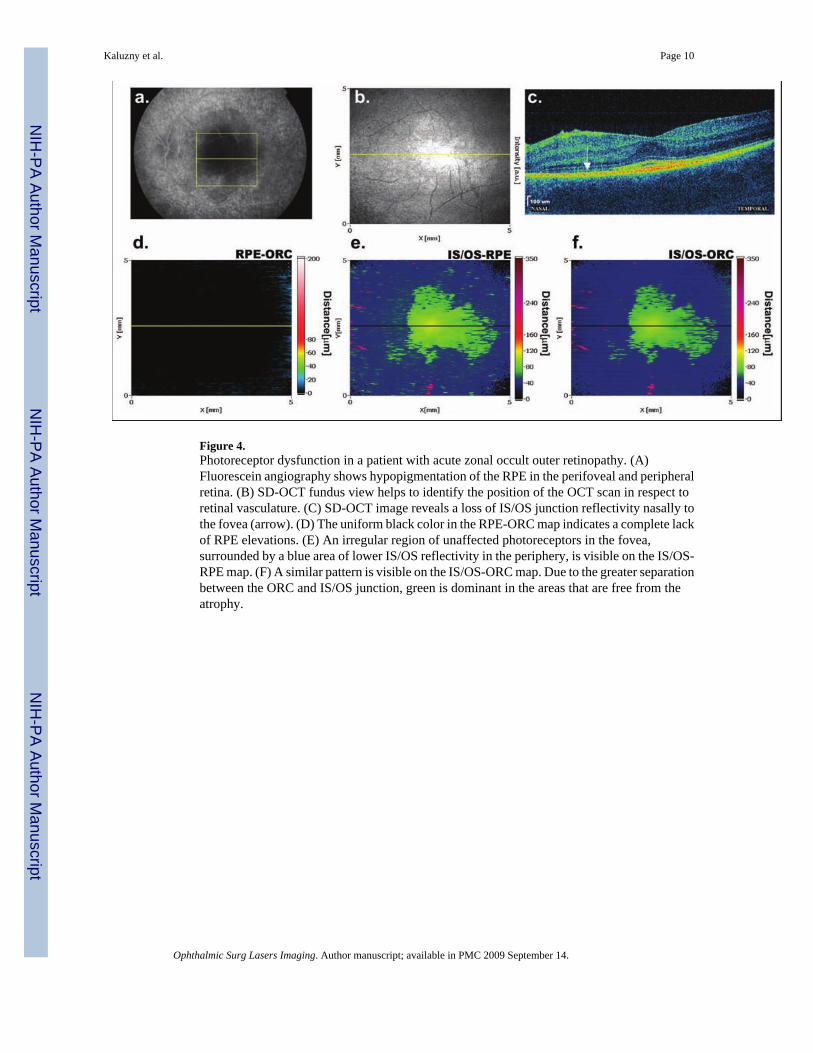
Figure 4.Photoreceptor dysfunction in a patient with acute zonal occult outer retinopathy. (A)Fluorescein angiography shows hypopigmentation of the RPE in the perifoveal and peripheralretina. (B) SD-OCT fundus view helps to identify the position of the OCT scan in respect toretinal vasculature. (C) SD-OCT image reveals a loss of IS/OS junction reflectivity nasally tothe fovea (arrow). (D) The uniform black color in the RPE-ORC map indicates a complete lackof RPE elevations. (E) An irregular region of unaffected photoreceptors in the fovea,surrounded by a blue area of lower IS/OS reflectivity in the periphery, is visible on the IS/OS-RPE map. (F) A similar pattern is visible on the IS/OS-ORC map. Due to the greater separationbetween the ORC and IS/OS junction, green is dominant in the areas that are free from theatrophy.
Kaluzny et al. Page 10
Ophthalmic Surg Lasers Imaging. Author manuscript; available in PMC 2009 September 14.
NIH
-PA Author Manuscript
NIH
-PA Author Manuscript
NIH
-PA Author Manuscript