Analysis of Multiphase Flow and Heat and Mass Transfer for ...
24
materials Article Analysis of Multiphase Flow and Heat and Mass Transfer for Ammonium Chloride Crystallization of the High-Pressure Heat Exchanger in Hydrogenation Unit Jianwen Zhang 1, *, Yahui Zhao 2 , Yan Li 1 and Fan Zhang 2 Citation: Zhang, J.; Zhao, Y.; Li, Y.; Zhang, F. Analysis of Multiphase Flow and Heat and Mass Transfer for Ammonium Chloride Crystallization of the High-Pressure Heat Exchanger in Hydrogenation Unit. Materials 2021, 14, 7754. https://doi.org/ 10.3390/ma14247754 Academic Editor: Kwangsuk Park Received: 25 November 2021 Accepted: 13 December 2021 Published: 15 December 2021 Publisher’s Note: MDPI stays neutral with regard to jurisdictional claims in published maps and institutional affil- iations. Copyright: © 2021 by the authors. Licensee MDPI, Basel, Switzerland. This article is an open access article distributed under the terms and conditions of the Creative Commons Attribution (CC BY) license (https:// creativecommons.org/licenses/by/ 4.0/). 1 College of Mechanical and Electrical Engineering, Beijing University of Chemical Technology, Beijing 100029, China; [email protected] 2 College of Chemical Engineering, Beijing University of Chemical Technology, Beijing 100029, China; [email protected] (Y.Z.); [email protected] (F.Z.) * Correspondence: [email protected]; Tel.: +86-010-64413196 Abstract: The corrosion failure of the high-pressure heat exchanger in a petrochemical enterprise was simulated. A multiphase flow and heat and mass transfer simulation shows that the vortex core with a higher gas phase content and lower temperature is the region of easy crystallization, located on both sides of the center of the tube. The crystallization process occurs in the gas phase. As the reaction progresses, the crystallization range spreads from the tube wall to the center of the tube bundle, and the inner diameter of the tube bundle decreases continuously. In Fluent, a user-defined function, based on the ammonium chloride crystallization reaction, is loaded. The results show that crystallization first occurs in the tube bundles on both sides of the center of the tube and that the corrosion is aggravated by the erosion wall surface of crystal particles at the elbow, which is consistent with the actual corrosion failure location. Keywords: high-pressure heat exchanger for hydrogenation unit; inferior crude oil; ammonium salt crystallization; numerical simulation; corrosion 1. Introduction With the aggravation of heavy and inferior crude oil, the content of chlorine, sulfur and nitrogen in inferior crude oil is increasing day by day. In the petrochemical produc- tion process, hydrogenation products of chlorine, nitrogen and sulfur are ubiquitous in the hydrogenation reaction effluent system due to its production characteristics. These impurities lead to the corrosion and leakage of operating equipment in the hydrogena- tion unit. Among them, the main corrosion of the high-pressure heat exchanger in the cooling equipment is multi-phase flow erosion and ammonium salt corrosion because of its high-pressure working conditions and the particularity of the multi-phase medium containing oil, water and gas [1]. Ammonium salt corrosion is an important reason for equipment failure in the heat exchange system of the hydrogenation unit. When the process is cooled, solid NH 4 Cl salt is formed by gaseous NH 3 and HCl and deposited on the inner surface of the pipeline or equipment. When the deposited salt is diluted in water, a high concentration of the NH 4 Cl solution may be produced. NH 4 Cl is highly corrosive when it is close to the dew point of water or when the concentration is high, which will lead to the corrosion failure of the heat exchanger, affect the normal operation of equipment and bring huge economic losses [2]. Therefore, the safety of the heat exchanger has become an important hidden danger in the chemical industry and the corrosion of ammonium salt has also attracted extensive attention of researchers. In order to prevent, reduce or even avoid safety accidents caused by ammonium chloride corrosion, a large number of studies on the reasons and corrosion properties of ammonium salt crystallization have been carried out. They are mainly divided into mecha- nism studies, experimental studies and numerical simulation studies of ammonium salt Materials 2021, 14, 7754. https://doi.org/10.3390/ma14247754 https://www.mdpi.com/journal/materials
-
Upload
khangminh22 -
Category
Documents
-
view
0 -
download
0
Transcript of Analysis of Multiphase Flow and Heat and Mass Transfer for ...

materials
Article
Analysis of Multiphase Flow and Heat and Mass Transfer forAmmonium Chloride Crystallization of the High-Pressure HeatExchanger in Hydrogenation Unit
Jianwen Zhang 1,*, Yahui Zhao 2, Yan Li 1 and Fan Zhang 2
�����������������
Citation: Zhang, J.; Zhao, Y.; Li, Y.;
Zhang, F. Analysis of Multiphase
Flow and Heat and Mass Transfer for
Ammonium Chloride Crystallization
of the High-Pressure Heat Exchanger
in Hydrogenation Unit. Materials
2021, 14, 7754. https://doi.org/
10.3390/ma14247754
Academic Editor: Kwangsuk Park
Received: 25 November 2021
Accepted: 13 December 2021
Published: 15 December 2021
Publisher’s Note: MDPI stays neutral
with regard to jurisdictional claims in
published maps and institutional affil-
iations.
Copyright: © 2021 by the authors.
Licensee MDPI, Basel, Switzerland.
This article is an open access article
distributed under the terms and
conditions of the Creative Commons
Attribution (CC BY) license (https://
creativecommons.org/licenses/by/
4.0/).
1 College of Mechanical and Electrical Engineering, Beijing University of Chemical Technology,Beijing 100029, China; [email protected]
2 College of Chemical Engineering, Beijing University of Chemical Technology, Beijing 100029, China;[email protected] (Y.Z.); [email protected] (F.Z.)
* Correspondence: [email protected]; Tel.: +86-010-64413196
Abstract: The corrosion failure of the high-pressure heat exchanger in a petrochemical enterprisewas simulated. A multiphase flow and heat and mass transfer simulation shows that the vortex corewith a higher gas phase content and lower temperature is the region of easy crystallization, locatedon both sides of the center of the tube. The crystallization process occurs in the gas phase. As thereaction progresses, the crystallization range spreads from the tube wall to the center of the tubebundle, and the inner diameter of the tube bundle decreases continuously. In Fluent, a user-definedfunction, based on the ammonium chloride crystallization reaction, is loaded. The results showthat crystallization first occurs in the tube bundles on both sides of the center of the tube and thatthe corrosion is aggravated by the erosion wall surface of crystal particles at the elbow, which isconsistent with the actual corrosion failure location.
Keywords: high-pressure heat exchanger for hydrogenation unit; inferior crude oil; ammonium saltcrystallization; numerical simulation; corrosion
1. Introduction
With the aggravation of heavy and inferior crude oil, the content of chlorine, sulfurand nitrogen in inferior crude oil is increasing day by day. In the petrochemical produc-tion process, hydrogenation products of chlorine, nitrogen and sulfur are ubiquitous inthe hydrogenation reaction effluent system due to its production characteristics. Theseimpurities lead to the corrosion and leakage of operating equipment in the hydrogena-tion unit. Among them, the main corrosion of the high-pressure heat exchanger in thecooling equipment is multi-phase flow erosion and ammonium salt corrosion because ofits high-pressure working conditions and the particularity of the multi-phase mediumcontaining oil, water and gas [1]. Ammonium salt corrosion is an important reason forequipment failure in the heat exchange system of the hydrogenation unit. When the processis cooled, solid NH4Cl salt is formed by gaseous NH3 and HCl and deposited on the innersurface of the pipeline or equipment. When the deposited salt is diluted in water, a highconcentration of the NH4Cl solution may be produced. NH4Cl is highly corrosive whenit is close to the dew point of water or when the concentration is high, which will lead tothe corrosion failure of the heat exchanger, affect the normal operation of equipment andbring huge economic losses [2]. Therefore, the safety of the heat exchanger has become animportant hidden danger in the chemical industry and the corrosion of ammonium salthas also attracted extensive attention of researchers.
In order to prevent, reduce or even avoid safety accidents caused by ammoniumchloride corrosion, a large number of studies on the reasons and corrosion properties ofammonium salt crystallization have been carried out. They are mainly divided into mecha-nism studies, experimental studies and numerical simulation studies of ammonium salt
Materials 2021, 14, 7754. https://doi.org/10.3390/ma14247754 https://www.mdpi.com/journal/materials
Materials 2021, 14, 7754 2 of 24
crystallization. Various methods are used to explore the corrosion mechanism. Ossai et al.summarized the causes of pipeline corrosion, including physical, chemical, environmentaland material properties, and pointed out the consequences and damage degree of pipelinefailure [3]. Liu et al. [4] used thermodynamic calculation to fit the crystallization curve andthe actual working curve to determine the crystallization temperature of NH4Cl. Basedon that, Zhu et al. [5] explored the influence of factors such as the raw material contentand pressure on the crystallization temperature, obtained an empirical formula of thecrystallization rate of ammonium salt and preliminarily studied the trend of the dynamicprocess [6]. Some scholars also carried out experimental studies on the corrosion behaviorof the ammonium chloride solution, obtained corrosion-resistant materials through experi-ments and obtained the corrosion change trend based on environmental factors affectingcorrosion [2,7–12]. However, there is much research on the corrosion of ammonium saltin an air cooler, but little research on the corrosion of ammonium salt in a heat exchanger.Ou et al. [13] believed that the interaction between the multiphase flow and air coolerstructure leads to the corrosion of the tube bundle and affects the crystallization position.CFD analysis shows that the location of the maximum shear stress is subject to erosionrisk. Through a simulation analysis of the temperature and distribution of ammoniumchloride, Zhu et al. believed that an insufficient water injection caused corrosion underthe ammonium salt scale [5]. Zheng et al. [14] simulated the position of the ammoniumchloride deposition and the corresponding position of maximum concentration. The reasonfor the ammonium salt in the air cooler was analyzed from multi-flow field coupling, andthe corrosion rate under scale was measured through experiments that were consistentwith the actual situation and well verified [15]. Jin et al. [16] believed that the differencein the distribution of the multiphase flow field was the cause of corrosion thinning. Thepipeline area with a high liquid content and high particle mass flow rate had a high riskof local corrosion thinning, and there was acid corrosion caused by ammonium chloridedeliquescent. However, most of the current research on the corrosion cause only focuses onthe distribution of multiphase flow field, whereas there are less analyses of the distributionof each phase and the mass transfer of the crystal phase in the heat exchange equipment.In addition, the specific behavior of the crystallization corrosion of the multiphase flow israrely studied, and needs to be supplemented and developed continuously.
The aim of this paper is the analysis of the multiphase flow and heat and masstransfer for ammonium chloride crystallization in the high-pressure heat exchanger of ahydrogenation unit. During the operation of the heat exchanger, tube blockage and leakageappears. The crystallization of ammonium salt and corrosion failure mechanism of the heatexchanger tube bundle in the hydrogenation unit were studied, and the failure equipmentwas analyzed by numerical simulation. The multi-phase flow field and temperature fieldwere simulated by establishing a model of the heat exchanger and using C language todevelop the ammonium salt crystallization model for Fluent three-dimensional multi-phaseflow calculation. The multi-phase flow and heat and mass transfer process determinedthe position of the corrosion of ammonium salt, resulting in the crystallization differencebetween different tube bundles. The results show that the ammonium salt is first generatedin the gas phase, mainly distributed around the tube wall and gradually gets closer tothe center of the tube bundle along the tube wall. The region with a higher gas phasecontent and lower temperature is the position of the easily crystallized tube bundle, whichis located at the top corner of the first tube side of the heat exchanger and the bottom cornerof the corresponding second tube side. In addition, the crystalline particles erode the outerbundle at the elbow and aggravate the corrosion. At the same time, scale corrosion and acidcorrosion occur, caused by ammonium salt deliquescence in the area of easy crystallization.
2. Overview of Corrosion Failure2.1. Technological Process
In this paper, the corrosion system in petrochemical enterprises is mainly based ondirect diesel, coking gasoline and diesel and a small amount of catalytic diesel, such as

Materials 2021, 14, 7754 3 of 24
raw material IV diesel and national V diesel. The processing capacity is 375 t/h, and thecontents of sulfur, chlorine and nitrogen in the raw material oil are 2441.5 ppm, 0.92 ppmand 337.4 ppm, respectively. Five high pressure heat exchangers are designed. The reactionproducts first pass through two reaction products/mixed hydrogen oil heat exchanger(E-101A/B), then through the reaction products/low oil heat exchanger (E-102) and finallythrough the reaction products/cold mixed hydrogen oil heat exchanger (E-104A/B) to thereaction product heat exchanger (EA-101). In the cooling process of the reaction effluents,the corrosive components, such as ammonia, hydrogen chloride and hydrogen sulfide, thatare formed after the hydrogenation reaction form crystals and may deposit on the surfaceof the tube bundle. Under certain conditions, this will lead to local deposition corrosion.The reaction product/cold mixed hydrogen oil heat exchanger E-104A is the corrosionfailure equipment of this study. The heat exchanger has a double-shell tube structure, thetube diameter of the bundle is 19 mm, the one-way tube length is 7 m, the material is15CrMo, the operating pressure is 7.78 MPa and the inlet temperature is 185 ◦C. The inlettemperature of the shell side is 129.8 ◦C, the outlet pressure is 8 MPa and the materialis 15CrMoR.
2.2. Failure Case
The high-pressure heat exchanger E104 is a typical horizontal double pass U-shapedtube and shell heat exchanger. The inlet and outlet of the heat exchanger are verticallyarranged, in which the inlet of the pipe pass is in the upper of the heat exchanger andthe outlet is in the lower; the inlet of the shell side is in the lower of the heat exchangerand the outlet is in the upper. In 2016, when the factory maintained the heat exchangeequipment, it was found that ammonium chloride scaling was serious at the outlet of theE-104A pipeline and that there was leakage at the elbow due to perforation.
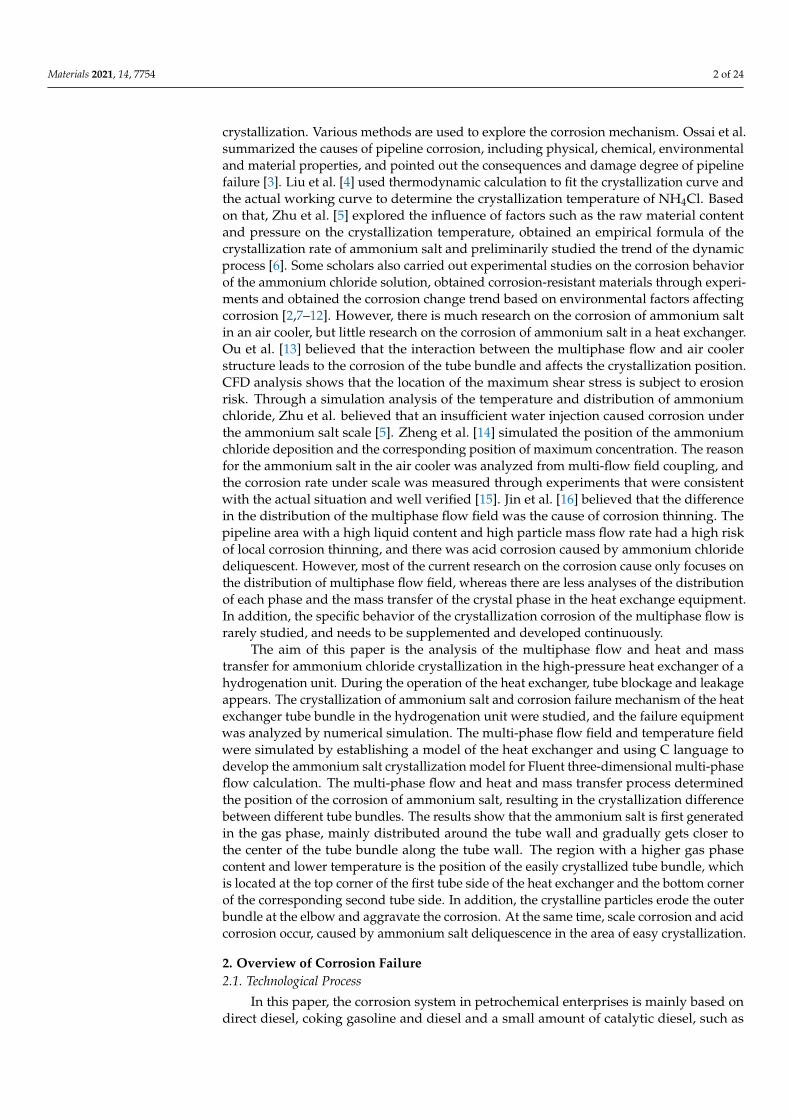
The maintenance personnel of the factory provided the corrosion failure morphologyof the equipment, mainly for the scaling and perforation of the heat exchanger tube bundle,as shown in Figures 1 and 2. It can be found that the tube bundle at the bottom corner ofthe outlet of the heat exchanger contains more white crystals, and that more white crystalsare accumulated at the tube wall, resulting in a reduced circulation area and tube blockage.The perforation at the bend of the u-shaped tube may be caused by the multi-phase flowerosion of the medium in the tube during the flow of fluid. Tang [17–19] et al. believedthat the multi-phase flow would undergo electrochemical corrosion and scouring corrosionduring the flow and that the phenomenon of flow acceleration corrosion would occur. Achemical analysis was carried out on white crystal samples in order to obtain the elementcontent of corrosion products, as shown in Table 1. The results showed that the chlorinecontent was high, which was presumed to be ammonium chloride crystal. The corrosion ofammonium salt may also occur during the operation of the heat exchanger.
Figure 1. Scaling morphology of the heat exchanger tube bundle.
Materials 2021, 14, 7754 4 of 24
Figure 2. Perforation morphology of the heat exchanger tube bundle.
Table 1. Composition of scaling material.
Element ω, % x, %
N 22.89 40.86O 5.08 7.94Al 6.71 6.21S 0.83 0.65Cl 60.05 42.34Fe 4.44 1.99
3. Analysis of the Crystallization Process3.1. Determination of Crystallization Temperature
The crystallization data of ammonium chloride were collected by literature, andthe original data were summarized to obtain the crystallization curve of ammoniumchloride [20,21], as shown in Figure 3. NH4Cl crystallization was generated according toEquation (1).
NH4 (g) + HCl (g)→ NH4Cl (s) (1)
After the fitting, the relation diagram of the t-lgKp ammonium chloride crystallizationcurve is obtained and the corresponding relation is Equations (2) and (3):
lg (Kp) = −0.0001186T2 + 0.0880699T − 13.5762237 (2)
T = 0.0769 (lg (Kp))3 + 1.6404(lg (Kp))2 + 218.45 (3)
Kp = PNH3·PHCl (4)
According to the operating conditions provided by the factory, the actual operatingline is obtained by fitting. The crystallization curve of ammonium chloride intersects theoperation line and the crystallization temperature is determined to be 216.5 ◦C, as shownin Figure 4. It can be known that the common part of the two curves is the crystallizationregion. The critical condition of crystallization is lower than the crystallization temperature,or the equilibrium constant is greater than the corresponding value in the crystallizationcurve. The calculation of Kp is shown in Equation (4). According to the process conditions,the inlet temperature of the heat exchanger in this paper is 185 ◦C, so there is a risk ofcrystallization in the whole heat exchanger.

Materials 2021, 14, 7754 5 of 24
Figure 3. Measured data of ammonium chloride crystallization industry.
Figure 4. Determination of crystallization temperature of NH4Cl.
In order to study the influence of the pressure, raw material content and other factorson the crystallization temperature of ammonium chloride, the crystallization temperaturecan be obtained by making operation lines under different conditions and intersecting thecrystallization curve. Figure 5 shows the distribution of the crystallization temperatureat different pressures. It can be seen that the corresponding temperature change withinthe range of the pressure drop is approximately 1 ◦C, so the influence of pressure onthe crystallization temperature can be ignored. The different chlorine content of the rawmaterial has a relatively great influence on the crystallization temperature. The higher thechlorine content of the raw material, the greater the mole fraction of hydrogen chloride inthe gas phase, and the corresponding crystallization temperature will also become higher,

Materials 2021, 14, 7754 6 of 24
as shown in Figure 6. Therefore, the crystallization temperature should be determinedaccording to the actual operating conditions, and the production amount of ammoniumchloride is different at different temperatures.
Figure 5. Effect of pressure on crystallization temperature.
Figure 6. Effect of chlorine content on crystallization temperature.

Materials 2021, 14, 7754 7 of 24
3.2. Crystallization Mechanism of Ammonium Salt
After the reaction, the medium flows into the heat exchanger and begins to carry outheat transfer between fluids. As long as there is a temperature difference, heat transferwill occur, so the fluid and metal in the bundle also have heat transfer. After the fluidflows out of the reactor, the temperature is high. Ammonia gas and hydrogen chlorideare in a gaseous phase. Due to the small specific heat of the metal in the tube wall, thereis a large temperature difference in the tube wall under the condition of absorbing thesame heat. When the critical reaction condition is reached, the generated ammonium saltwill first attach to the upper tube wall of the tube bundle and accumulate continuouslyaround the tube wall. The generated white crystals will also flow or dissolve with the fluid.When a large number of ammonium salt particles are generated and accumulated, thephenomenon of tube blockage will occur. In this process, under the influence of gravity,white crystals will fall to the lower part of the bundle, and continuous accumulation maylead to the phenomenon of ammonium salt deposition. To sum up, ammonium chloridecrystallization in the bundle occurs according to this mechanism. Each bundle is affectedby uneven flow field distribution, flow condition and temperature distribution, and thefinal amount of ammonium salt generated will be different. The formation process andcorrosion mechanism of the crystallization and deposition of ammonium salt are shownin Figure 7, which can explain that the white crystals in the tube bundle in the figure areclustered around the tube wall in the field failure.
Figure 7. Crystallization and deposition corrosion mechanism of ammonium salt.
By analyzing the mechanism diagram of the crystallization and deposition corrosionof ammonium salt, it can be seen that the multiphase flow field, temperature field andcomponent distribution determine the multiphase flow and heat and mass transfer, affectthe changing trend of flow field and temperature component distribution and lead to thedifference in crystal distribution between the tube bundles in the heat exchanger. Therefore,by analyzing the fluid flow and heat and mass transfer phenomenon in the heat exchanger,the easy crystallization area and the serious corrosion position can be determined.
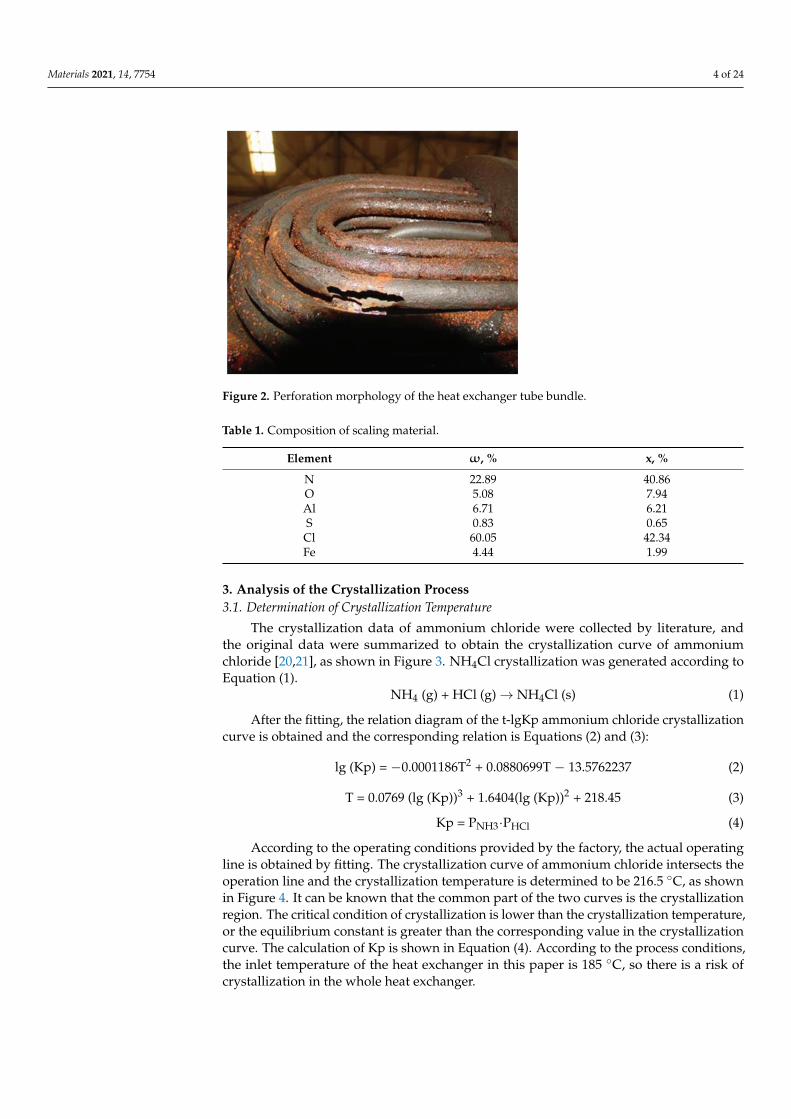
The phase diagram of ammonium salt crystallization mainly shows the correspondingrelationship between the temperature and actual lgKp, as shown in Figure 8. Salt formationvaries at different temperatures. A low temperature is conducive to the occurrence ofammonium salt crystallization. Based on this phase diagram, the actual situation of saltformation in the heat exchanger can be divided into three kinds: crystallization reactionoccurs; crystallization reaction reaches equilibrium; crystallization reaction does not occur.The actual limit of the salt formation depends on inlet conditions, such as low contentcomponents and the operating temperature.
Materials 2021, 14, 7754 8 of 24
Figure 8. Crystal equilibrium curve of ammonium chloride.
3.3. User-Defined Function Calculation Principle
In order to study the distribution of ammonium salt in the heat exchanger, combinedwith the specific analysis of the crystallization process, this paper mainly programmed thecalculation model of the crystallization reaction HCl + NH3 → NH4Cl and obtained the ssource term user-defined function that defines the actual crystallization rate of ammoniumsalt, which is used for the flow heat and mass transfer of three-dimensional multiphaseflow. The generation of ammonium chloride was obtained by simulation calculation. Thepreparation of the source term user-defined function is mainly based on the crystallizationcurve as the basis to judge whether ammonium chloride generation occurs. When thetemperature difference limit is small, the reduction in hydrogen chloride or ammonia gasis considered as the generation of ammonium chloride. On this basis, the formula of thecrystallization rate is obtained as Equation (5).
Speed = (PHCl − PHCl-t)/Pres/δt × n ×MNH4Cl (5)
where PHCl is the actual partial pressure of hydrogen chloride; PHCl-t is the partial pressureof hydrogen chloride on the corresponding crystallization curve at the operating temper-ature, namely the equilibrium partial pressure; n is the number of moles; MNH4Cl is themolecular weight of ammonium chloride; δt is a time step and can be set in the process ofnumerical simulation. Pres is the actual total pressure.
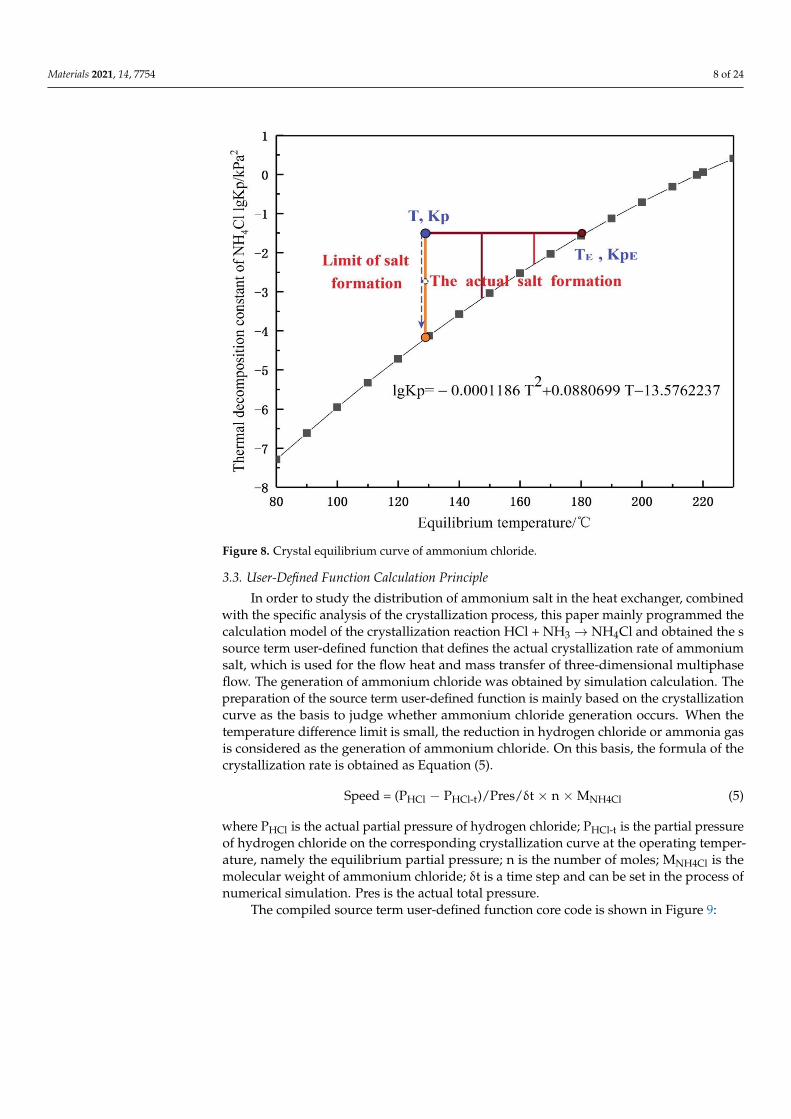
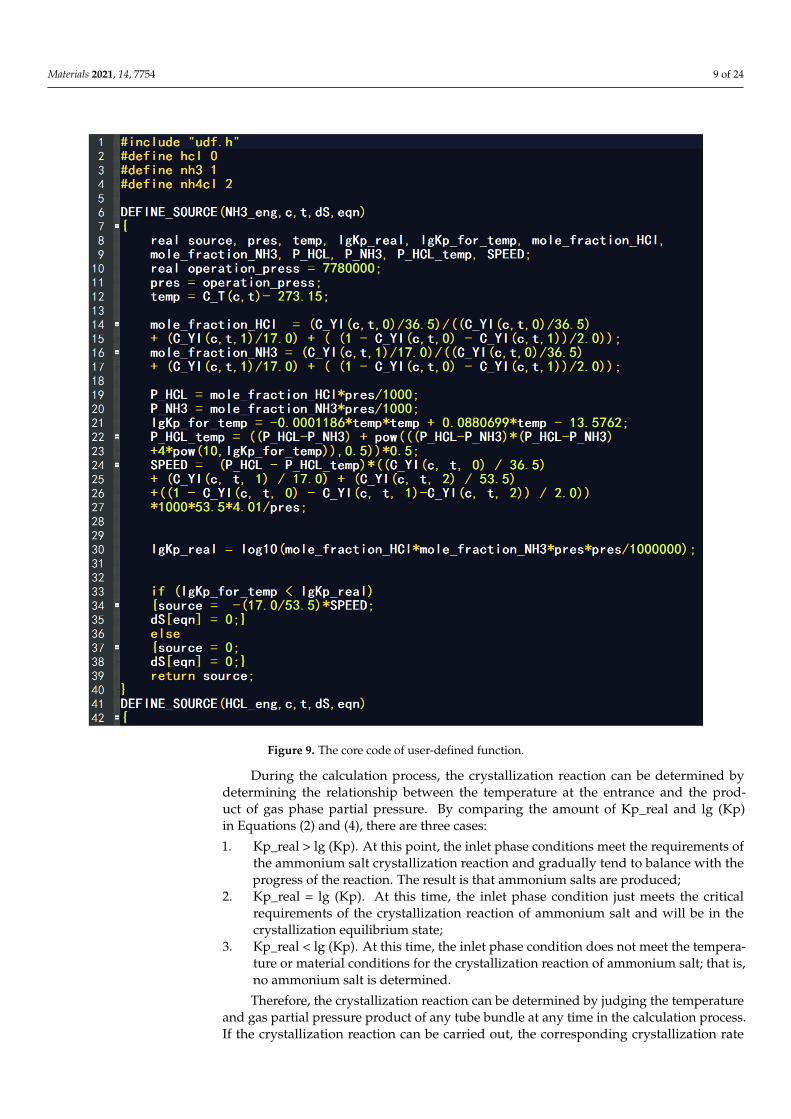
The compiled source term user-defined function core code is shown in Figure 9:
Materials 2021, 14, 7754 9 of 24
Figure 9. The core code of user-defined function.
During the calculation process, the crystallization reaction can be determined bydetermining the relationship between the temperature at the entrance and the prod-uct of gas phase partial pressure. By comparing the amount of Kp_real and lg (Kp)in Equations (2) and (4), there are three cases:
1. Kp_real > lg (Kp). At this point, the inlet phase conditions meet the requirements ofthe ammonium salt crystallization reaction and gradually tend to balance with theprogress of the reaction. The result is that ammonium salts are produced;
2. Kp_real = lg (Kp). At this time, the inlet phase condition just meets the criticalrequirements of the crystallization reaction of ammonium salt and will be in thecrystallization equilibrium state;
3. Kp_real < lg (Kp). At this time, the inlet phase condition does not meet the tempera-ture or material conditions for the crystallization reaction of ammonium salt; that is,no ammonium salt is determined.
Therefore, the crystallization reaction can be determined by judging the temperatureand gas partial pressure product of any tube bundle at any time in the calculation process.If the crystallization reaction can be carried out, the corresponding crystallization rate

Materials 2021, 14, 7754 10 of 24
is given and the reaction can be carried out under the given conditions. The generationof ammonium salt is a dynamic process, so, in the process of iterative calculation, theremaining gas phase at the last moment is regarded as the reference value at the nextmoment, which is the same as the determination method of the inlet, and the cycle repeatsuntil the calculation converges. Convergence is judged based on the mass, momentumand energy transport conservation for the whole field and each control unit. During eachiteration, user-defined functions are called for simulation calculation.
3.4. Numerical Methods and Modeling
Through the actual investigation of field working conditions, relevant data wereobtained to establish the heat exchanger model, as shown in Figure 10.
Figure 10. Schematic diagram of heat exchanger model.
According to the symmetry characteristics of the 3D geometry model, a 1/2 geometrystructure is selected as the computational domain model. Based on the two-dimensionalgrid, the three-dimensional grid model is gradually established by stretching, rotation,translation, mirroring, merging and other operations. The number of grids is approximately100 million. In Fluent, the mixture model is set to calculate the flow of gas and oil phases,the K-ωmodel of SST is used to solve the temperature field and flow field and the non-slipwall condition is used to calculate. In the setting of the boundary conditions, the inlettemperature of the pipe side is 185 ◦C, the inlet temperature of the shell side is 129.8 ◦C,the inlet type is a mass flow inlet and the outlet is a pressure outlet. The governingequations adopted in this paper include the law of conservation of mass, the law ofconservation of momentum and the energy conservation equation. The correspondingboundary conditions are shown in Tables 2 and 3. After initialization, a relevant simulationcalculation is initiated.
Table 2. Mass flow of the inlet.
Gas Phase Oil Phase
mass flow (kg/s) 3.6225 104.1667
Table 3. Gas phase component content at inlet.
The Gas Phase Composition The Mole Fraction of Each Component
NH3 0.001844221HCl 7.667234 × 10⁻⁶
H2 0.9981484108
Materials 2021, 14, 7754 11 of 24
4. Results and Discussion4.1. Multiphase Flow Field Analysis
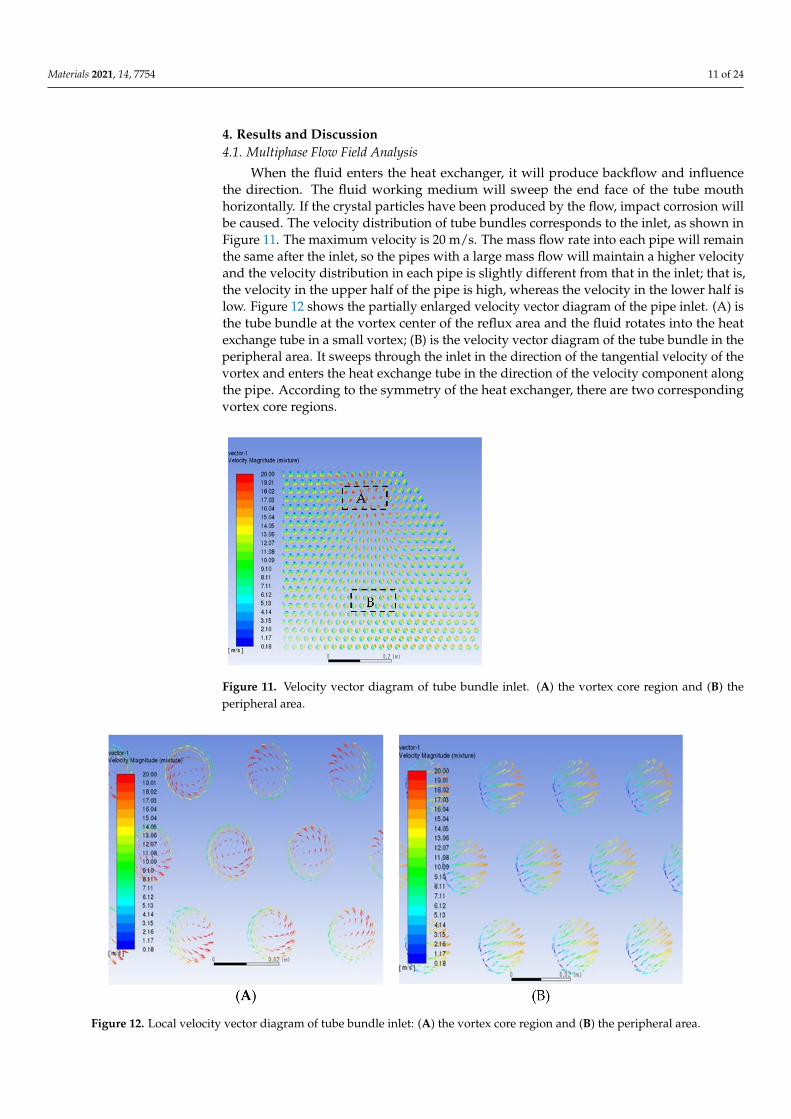
When the fluid enters the heat exchanger, it will produce backflow and influencethe direction. The fluid working medium will sweep the end face of the tube mouthhorizontally. If the crystal particles have been produced by the flow, impact corrosion willbe caused. The velocity distribution of tube bundles corresponds to the inlet, as shown inFigure 11. The maximum velocity is 20 m/s. The mass flow rate into each pipe will remainthe same after the inlet, so the pipes with a large mass flow will maintain a higher velocityand the velocity distribution in each pipe is slightly different from that in the inlet; that is,the velocity in the upper half of the pipe is high, whereas the velocity in the lower half islow. Figure 12 shows the partially enlarged velocity vector diagram of the pipe inlet. (A) isthe tube bundle at the vortex center of the reflux area and the fluid rotates into the heatexchange tube in a small vortex; (B) is the velocity vector diagram of the tube bundle in theperipheral area. It sweeps through the inlet in the direction of the tangential velocity of thevortex and enters the heat exchange tube in the direction of the velocity component alongthe pipe. According to the symmetry of the heat exchanger, there are two correspondingvortex core regions.
Figure 11. Velocity vector diagram of tube bundle inlet. (A) the vortex core region and (B) theperipheral area.
Figure 12. Local velocity vector diagram of tube bundle inlet: (A) the vortex core region and (B) the peripheral area.
Materials 2021, 14, 7754 12 of 24
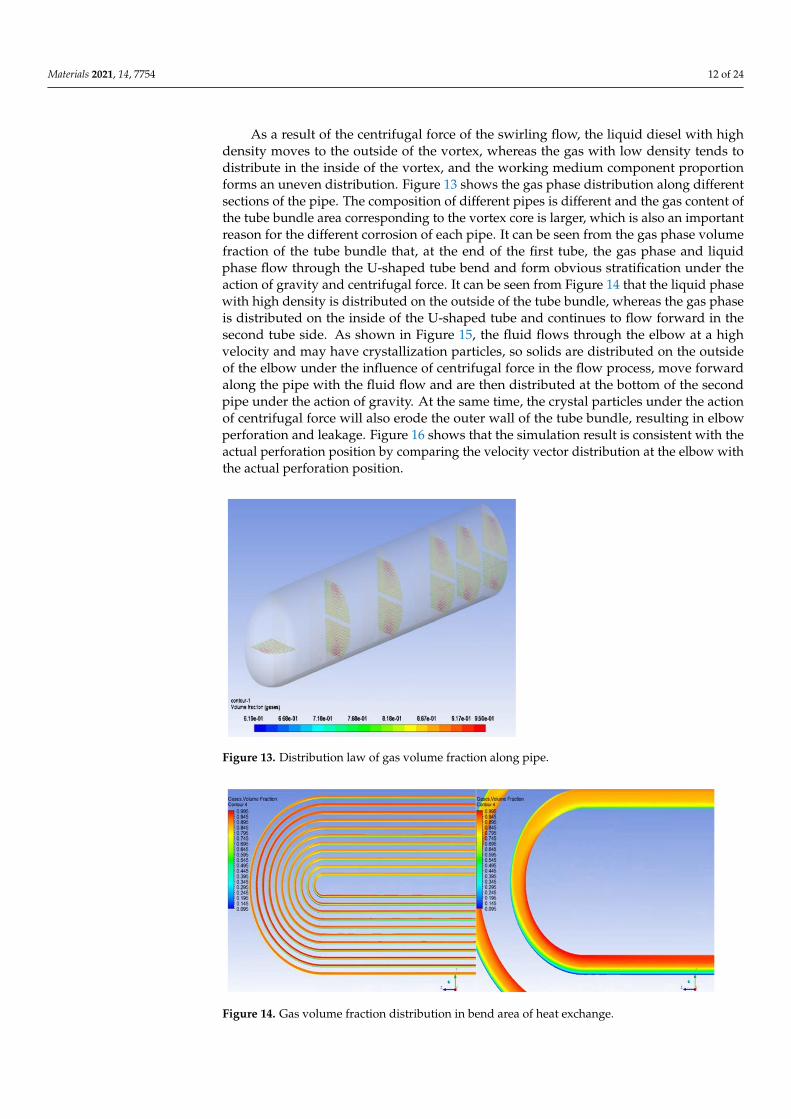
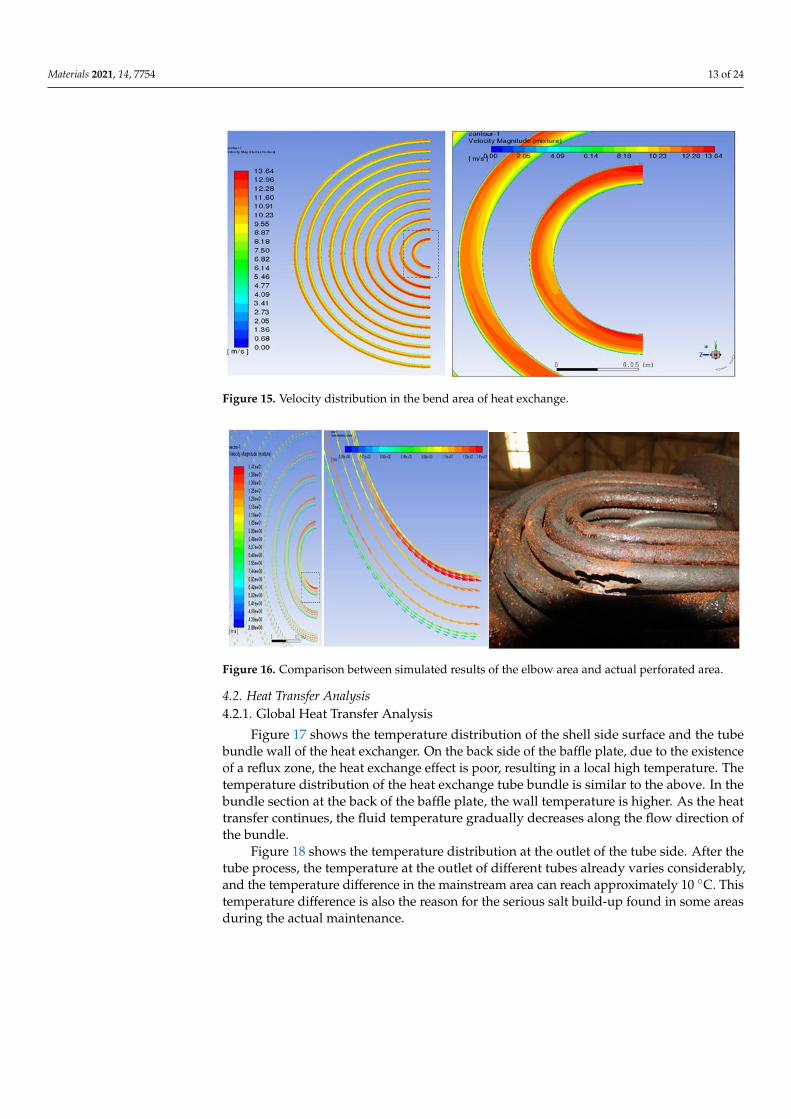
As a result of the centrifugal force of the swirling flow, the liquid diesel with highdensity moves to the outside of the vortex, whereas the gas with low density tends todistribute in the inside of the vortex, and the working medium component proportionforms an uneven distribution. Figure 13 shows the gas phase distribution along differentsections of the pipe. The composition of different pipes is different and the gas content ofthe tube bundle area corresponding to the vortex core is larger, which is also an importantreason for the different corrosion of each pipe. It can be seen from the gas phase volumefraction of the tube bundle that, at the end of the first tube, the gas phase and liquidphase flow through the U-shaped tube bend and form obvious stratification under theaction of gravity and centrifugal force. It can be seen from Figure 14 that the liquid phasewith high density is distributed on the outside of the tube bundle, whereas the gas phaseis distributed on the inside of the U-shaped tube and continues to flow forward in thesecond tube side. As shown in Figure 15, the fluid flows through the elbow at a highvelocity and may have crystallization particles, so solids are distributed on the outsideof the elbow under the influence of centrifugal force in the flow process, move forwardalong the pipe with the fluid flow and are then distributed at the bottom of the secondpipe under the action of gravity. At the same time, the crystal particles under the actionof centrifugal force will also erode the outer wall of the tube bundle, resulting in elbowperforation and leakage. Figure 16 shows that the simulation result is consistent with theactual perforation position by comparing the velocity vector distribution at the elbow withthe actual perforation position.
Figure 13. Distribution law of gas volume fraction along pipe.
Figure 14. Gas volume fraction distribution in bend area of heat exchange.
Materials 2021, 14, 7754 13 of 24
Figure 15. Velocity distribution in the bend area of heat exchange.
Figure 16. Comparison between simulated results of the elbow area and actual perforated area.
4.2. Heat Transfer Analysis4.2.1. Global Heat Transfer Analysis
Figure 17 shows the temperature distribution of the shell side surface and the tubebundle wall of the heat exchanger. On the back side of the baffle plate, due to the existenceof a reflux zone, the heat exchange effect is poor, resulting in a local high temperature. Thetemperature distribution of the heat exchange tube bundle is similar to the above. In thebundle section at the back of the baffle plate, the wall temperature is higher. As the heattransfer continues, the fluid temperature gradually decreases along the flow direction ofthe bundle.
Figure 18 shows the temperature distribution at the outlet of the tube side. After thetube process, the temperature at the outlet of different tubes already varies considerably,and the temperature difference in the mainstream area can reach approximately 10 ◦C. Thistemperature difference is also the reason for the serious salt build-up found in some areasduring the actual maintenance.

Materials 2021, 14, 7754 14 of 24
Figure 17. Temperature distribution of heat exchanger: (a) temperature of the tube side and(b) temperature of the shell side.
Figure 18. Temperature distribution in the outlet area.
4.2.2. Local Heat Transfer Analysis of Tube Bundle
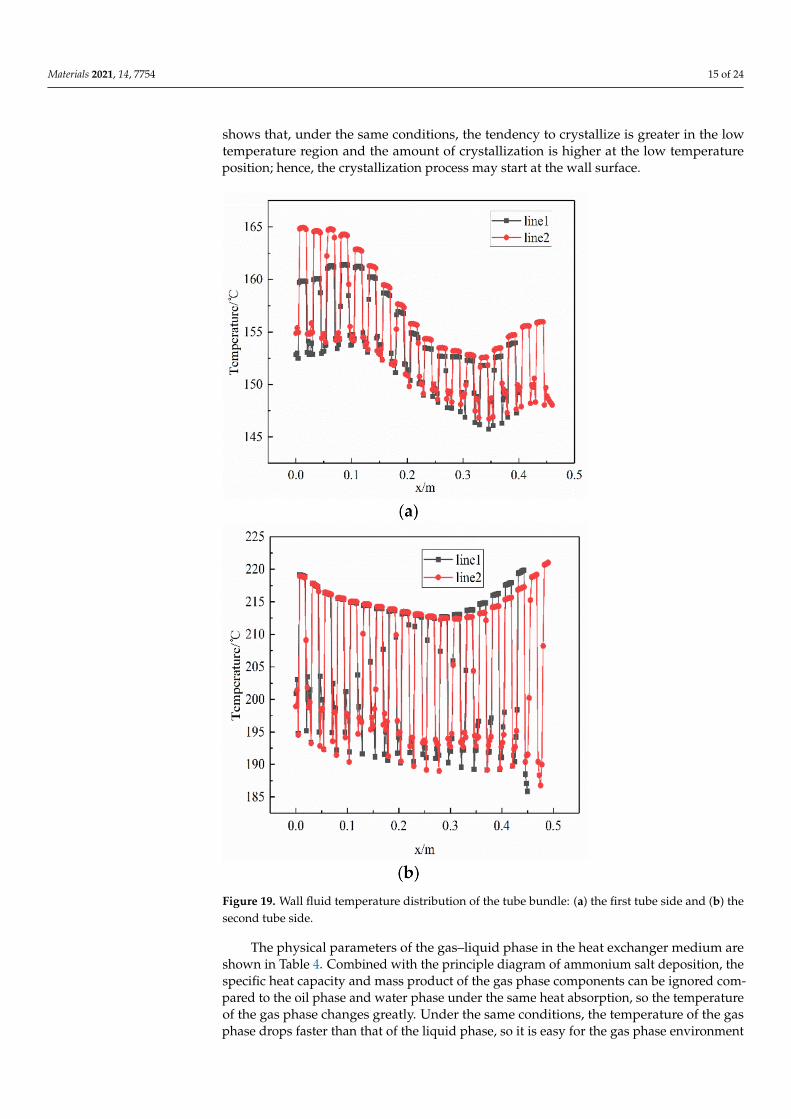
The analysis of the velocity field of the multiphase flow shows that there is a backflowof the fluid and, therefore, that a vortex is formed. At the core of the vortex, the velocity ishigher and the gas phase is more abundant. Two rows of tube bundles located in the vortexregion at the outlet of the pipe side were selected for a local analysis of its temperature.Figure 19 shows the temperature variation of the tube bundle in the x-direction. Thetemperature of the tube bundle fluctuates along the x-axis and is lower between 0.1 m and0.4 m. The temperature difference between the wall and the fluid in the tube bundle isapproximately 10 ◦C, where the wall temperature is lower, and the energy change andtransfer caused by the fluid flow may affect the temperature distribution of the wholesystem, resulting in a radial temperature gradient. The crystallization phase diagram
Materials 2021, 14, 7754 15 of 24
shows that, under the same conditions, the tendency to crystallize is greater in the lowtemperature region and the amount of crystallization is higher at the low temperatureposition; hence, the crystallization process may start at the wall surface.
Figure 19. Wall fluid temperature distribution of the tube bundle: (a) the first tube side and (b) thesecond tube side.
The physical parameters of the gas–liquid phase in the heat exchanger medium areshown in Table 4. Combined with the principle diagram of ammonium salt deposition, thespecific heat capacity and mass product of the gas phase components can be ignored com-pared to the oil phase and water phase under the same heat absorption, so the temperatureof the gas phase changes greatly. Under the same conditions, the temperature of the gasphase drops faster than that of the liquid phase, so it is easy for the gas phase environment
Materials 2021, 14, 7754 16 of 24
to meet the critical conditions for the reaction, and ammonium chloride crystals are firstproduced in the gas phase, so the amount of the reaction depends on what is less abundantin ammonia and hydrogen chloride.
Table 4. Gas phase component content at inlet.
Multiphase Flow Component Specific Heat Capacity (J/kg·K) Mass Flow (kg/s)
H2 14,180.6 3.312NH3 2303.1 0.05198HCl 988.9 0.0004644
Oil phase 2135 104.2Water phsae 4200 6.944
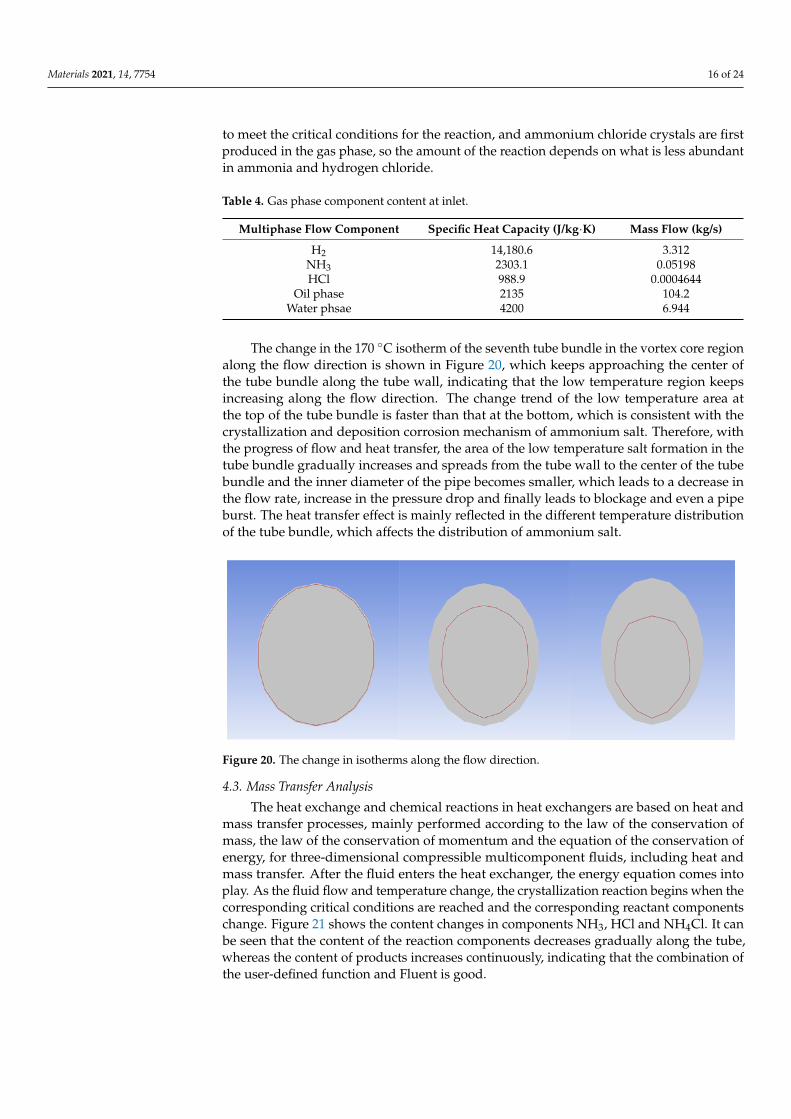
The change in the 170 ◦C isotherm of the seventh tube bundle in the vortex core regionalong the flow direction is shown in Figure 20, which keeps approaching the center ofthe tube bundle along the tube wall, indicating that the low temperature region keepsincreasing along the flow direction. The change trend of the low temperature area atthe top of the tube bundle is faster than that at the bottom, which is consistent with thecrystallization and deposition corrosion mechanism of ammonium salt. Therefore, withthe progress of flow and heat transfer, the area of the low temperature salt formation in thetube bundle gradually increases and spreads from the tube wall to the center of the tubebundle and the inner diameter of the pipe becomes smaller, which leads to a decrease inthe flow rate, increase in the pressure drop and finally leads to blockage and even a pipeburst. The heat transfer effect is mainly reflected in the different temperature distributionof the tube bundle, which affects the distribution of ammonium salt.
Figure 20. The change in isotherms along the flow direction.
4.3. Mass Transfer Analysis
The heat exchange and chemical reactions in heat exchangers are based on heat andmass transfer processes, mainly performed according to the law of the conservation ofmass, the law of the conservation of momentum and the equation of the conservation ofenergy, for three-dimensional compressible multicomponent fluids, including heat andmass transfer. After the fluid enters the heat exchanger, the energy equation comes intoplay. As the fluid flow and temperature change, the crystallization reaction begins when thecorresponding critical conditions are reached and the corresponding reactant componentschange. Figure 21 shows the content changes in components NH3, HCl and NH4Cl. It canbe seen that the content of the reaction components decreases gradually along the tube,whereas the content of products increases continuously, indicating that the combination ofthe user-defined function and Fluent is good.

Materials 2021, 14, 7754 17 of 24
Figure 21. Changes in the content of the components: (a) ammonia, (b) hydrogen chloride and(c) ammonium chloride.

Materials 2021, 14, 7754 18 of 24
The seventh bundle in the low-temperature region was selected as the research object.Figure 22 shows the crystal distribution near the tube wall. The heat exchange betweentwo gas–liquid phases continues to strengthen along the flow direction, so the temperaturekeeps decreasing and the amount of crystallization keeps increasing. Crystals were foundaround the wall of the tube, indicating the formation of ammonium chloride in the gasphase. This is consistent with the rule in the crystallization phase diagram.
Figure 22. Crystal distribution of the seventh bundle.
4.4. Determination of the Region of Easy Crystallization
The above analysis of the flow field and heat and mass transfer, combined with thedistribution characteristics of the flow and gas phase concentration, shows that the temper-ature is lower at the vortex core due to the high gas velocity and high heat transfer capacity.In addition, because it is the region with a high gas concentration, the critical salt formationcondition and generation of ammonium salt is easier to reach, and the correspondingbundle at the vortex core is determined to be the region with easy crystallization.
The crystallization reaction proceeds to different degrees at different times and theheat exchange process is the interaction of fluids in a dynamic process of constant flow.In this study, three rows of tube bundles located in the area of easy crystallization, whichbelong to the X-Y section of the inlet and outlet of the heat exchanger, were selected toanalyze changes in the gas phase content and crystallization amount at the initial, middleand late stage of calculation. Moreover, the region where ammonium chloride was firstgenerated was identified. The gas phase distribution and ammonium salt content wereobtained as shown in Figures 23 and 24. The simulation results show that the gas phasecontent is the largest in the region of 0.15−0.35 m perpendicular to the direction of thefluid flow. At the beginning of the fluid entering the heat exchanger, the ammoniumchloride crystallization reaction also begins. The vortex core region at the inlet of the tubeside generates ammonium chloride at the earliest. As the reaction goes on, the amountof ammonium chloride keeps increasing and the maximum mass fraction of ammoniumchloride in the vortex core region at the outlet of the tube side is 1.16 × 10⁻⁴.

Materials 2021, 14, 7754 19 of 24
Figure 23. Distribution of the gas phase volume fraction in differentstages: (a) initial stage ofcalculation, (b) middle stage of calculation and (c) late stage of calculation.

Materials 2021, 14, 7754 20 of 24
Figure 24. Distribution of the crystallization amount of ammonium chloride in tube bundles indifferent stages: (a) initial stage of calculation, (b) middle stage of calculation and (c) late stageof calculation.

Materials 2021, 14, 7754 21 of 24
Figure 25 shows a comparison between the actual corrosion position and the dis-tribution of ammonium salt in the inlet and outlet sections of the heat exchanger. Theammonium salt in the first pipe side is mainly distributed in the upper tube bundle and,after flowing, it is located at the bottom of the second pipe side, namely the vortex coreregion with the high gas phase content and low temperature, which is consistent withthe actual location of ammonium salt crystallization. It shows that the simulation studyin this paper has the value of guiding actual production, which can be used to predictthe actual crystallization area of ammonium salt in the high-pressure heat exchanger ofthe hydrogenation unit and to reduce the loss of equipment and production caused byammonium chloride corrosion.
Figure 25. Comparison of actual corrosion locations to simulated results.
4.5. Corrosion Risk of Ammonium Chloride
Reports indicate a higher risk of under-deposit corrosion in areas with s high am-monium content, and it is believed that the crystallization-prone areas in this study havecorrosion failure caused by ammonium chloride crystallization in the following two mainforms. One is under-deposit corrosion caused by ammonium chloride deposition. Crys-tallization particles are deposited on the wall of the pipe to form a closed area, whichmakes the difference between the media inside and outside the area. Therefore, a batteryenvironment with a cathode and anode exists around the scale layer. The wall metalcovered by the scale layer is the anode and the wall metal material around the scale layer isthe cathode. Electrons flow between the cathode and anode faster than normal, resulting inelectrochemical corrosion [22,23]. From the actual corrosion failure diagram, it can be seenthat the scaling of the tube bundle and the existence of crystallization particles will alsolead to the occurrence of multiphase flow erosion corrosion. The other is the acid corrosioncaused by the deliquescence of ammonium chloride salt.
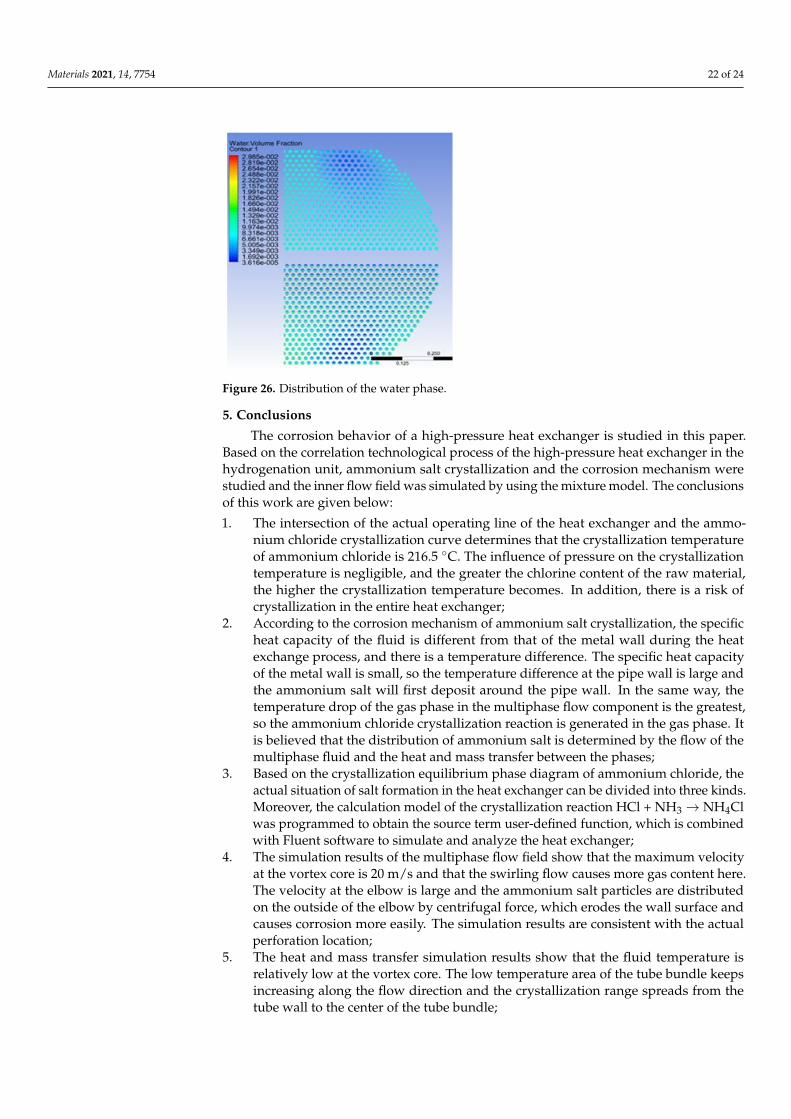
As shown in Figure 26, the water phase distribution is uneven after the water injection,and is mainly distributed in the first pipe side and the bottom of the tube bundles in thesecond pipe side. The difference in the water phase distribution results in an uneven mixingof ammonium chloride and water. There is less water in the area prone to crystallization.When the deposited salt is diluted in water, a high concentration of the NH4Cl solutionmay be produced. The NH4Cl salt is highly corrosive when it is close to the dew pointof water or at a high concentration level, so the risk of acid corrosion is higher in regionsprone to crystallization.
Materials 2021, 14, 7754 22 of 24
Figure 26. Distribution of the water phase.
5. Conclusions
The corrosion behavior of a high-pressure heat exchanger is studied in this paper.Based on the correlation technological process of the high-pressure heat exchanger in thehydrogenation unit, ammonium salt crystallization and the corrosion mechanism werestudied and the inner flow field was simulated by using the mixture model. The conclusionsof this work are given below:
1. The intersection of the actual operating line of the heat exchanger and the ammo-nium chloride crystallization curve determines that the crystallization temperatureof ammonium chloride is 216.5 ◦C. The influence of pressure on the crystallizationtemperature is negligible, and the greater the chlorine content of the raw material,the higher the crystallization temperature becomes. In addition, there is a risk ofcrystallization in the entire heat exchanger;
2. According to the corrosion mechanism of ammonium salt crystallization, the specificheat capacity of the fluid is different from that of the metal wall during the heatexchange process, and there is a temperature difference. The specific heat capacityof the metal wall is small, so the temperature difference at the pipe wall is large andthe ammonium salt will first deposit around the pipe wall. In the same way, thetemperature drop of the gas phase in the multiphase flow component is the greatest,so the ammonium chloride crystallization reaction is generated in the gas phase. Itis believed that the distribution of ammonium salt is determined by the flow of themultiphase fluid and the heat and mass transfer between the phases;
3. Based on the crystallization equilibrium phase diagram of ammonium chloride, theactual situation of salt formation in the heat exchanger can be divided into three kinds.Moreover, the calculation model of the crystallization reaction HCl + NH3 → NH4Clwas programmed to obtain the source term user-defined function, which is combinedwith Fluent software to simulate and analyze the heat exchanger;
4. The simulation results of the multiphase flow field show that the maximum velocityat the vortex core is 20 m/s and that the swirling flow causes more gas content here.The velocity at the elbow is large and the ammonium salt particles are distributedon the outside of the elbow by centrifugal force, which erodes the wall surface andcauses corrosion more easily. The simulation results are consistent with the actualperforation location;
5. The heat and mass transfer simulation results show that the fluid temperature isrelatively low at the vortex core. The low temperature area of the tube bundle keepsincreasing along the flow direction and the crystallization range spreads from thetube wall to the center of the tube bundle;
Materials 2021, 14, 7754 23 of 24
6. The region of easy crystallization was determined to be the vortex core area witha lower temperature, higher velocity and greater gas phase content, located in thearea enclosed by the top of the first pipe side and the bottom of the second pipeside in the vertical flow direction between 0.1−0.4 m. Those are the two sides of thecenter of the tube. It is determined that crystallization occurs first in this area, andthat the amount of crystallization is relatively large. The maximum mass fraction ofammonium chloride is 1.16 × 10⁻⁴;
7. The corrosion failure forms caused by ammonium chloride in the area of easy crys-tallization are under-deposit corrosion and acid corrosion. It can be seen from theactual corrosion failure morphology that under-deposit corrosion occurs in the heatexchanger. When the ammonium chloride is diluted in water, a high concentration ofthe ammonium chloride solution is formed, which causes the acid corrosion.
Author Contributions: Conceptualization, J.Z., Y.Z. and Y.L.; methodology, Y.Z. and Y.L.; software,Y.Z. and F.Z.; validation, Y.Z. and F.Z.; formal analysis, Y.Z.; investigation, Y.Z. and F.Z.; data curation,Y.Z., Y.L. and F.Z.; writing—original draft preparation, Y.Z. and F.Z.; writing—review and editing,J.Z., Y.Z. and Y.L.; visualization, Y.Z.; supervision, Y.L. All authors have read and agreed to thepublished version of the manuscript.
Funding: This research was funded by National Key Research and Development Program of China:2021YFB3301101 and Key R & D and Transformation Project of Qinghai Province: 2018-SF-138.
Institutional Review Board Statement: Not applicable.
Informed Consent Statement: Not applicable.
Data Availability Statement: The data presented in this study are available upon request.
Conflicts of Interest: The authors declare no conflict of interest.
References1. Groysman, A. Corrosion problems and solutions in oil, gas, refining and petrochemical industry. Koroze A Ochr. Mater. 2017, 61,
100–117. [CrossRef]2. Akpanyung, K.V.; Loto, R.T.; Fajobi, M.A. An Overview of Ammonium Chloride (NH4Cl) Corrosion in the Refining Unit. J. Phys.
Conf. Ser. 2019, 1378, 022089. [CrossRef]3. Ossai, C.I.; Boswell, B.; Davies, I.J. Pipeline failures in corrosive environments—A conceptual analysis of trends and effects. Eng.
Fail. Anal. 2015, 53, 36–58. [CrossRef]4. Liu, X.; Zhu, H.; Yu, C.; Jin, H.; Wang, C.; Ou, G. Analysis on the corrosion failure of U-tube heat exchanger in hydrogenation
unit. Eng. Fail. Anal. 2021, 125, 105448. [CrossRef]5. Zhu, M.; Ou, G.; Jin, H.; Wang, K.; Zheng, Z. Top of the REAC tube corrosion induced by under deposit corrosion of ammonium
chloride and erosion corrosion. Eng. Fail. Anal. 2015, 57, 483–489. [CrossRef]6. Wang, K. Prediction of ammonium salt crystallization deposition and study on corrosion law in petrochemical system. Master’s
Thesis, Zhejiang Sci-Tech University, Hangzhou, China, March 2014.7. Toba, K.; Ueyama, M.; Kawano, K.; Sakai, J. Corrosion of Carbon Steel and Alloys in Concentrated Ammonium Chloride Solutions.
Corrosion 2012, 68, 1049–1056. [CrossRef]8. Wang, H.; Li, Y.; Cheng, G.; Wu, W.; Zhang, Y.; Li, X. Electrochemical Investigation of Corrosion of Mild Steel in NH4Cl Solution.
Int. J. Electrochem. Sci. 2018, 13, 5268–5283. [CrossRef]9. Wang, H.; Li, Y.; Cheng, G.; Wu, W.; Zhang, Y.-H. A Study on the Corrosion Behavior of Carbon Steel Exposed to a H2S-Containing
NH4Cl Medium. J. Mater. Eng. Perform. 2018, 27, 2492–2504. [CrossRef]10. Laitinen, T. Localized corrosion of stainless steel in chloride, sulfate and thiosulfate containing environments. Corros. Sci. 2000,
42, 420–441. [CrossRef]11. Baranwal, P.K.; Rajaraman, P.V. Electrochemical investigation on effect of sodium thiosulfate (Na2S2O3) and ammonium chloride
(NH4Cl) on carbon steel corrosion. J. Mater. Res. Technol. 2019, 8, 1366–1378. [CrossRef]12. Baranwal, P.K.; Venkatesh, R.P. Investigation of carbon steel anodic dissolution in ammonium chloride solutions using electro-
chemical impedance spectroscopy. J. Solid State Electrochem. 2017, 21, 1373–1384. [CrossRef]13. Ou, G.; Wang, K.; Zhan, J.; Tang, M.; Liu, H.; Jin, H. Failure analysis of a reactor effluent air cooler. Eng. Fail. Anal. 2013, 31,
387–393. [CrossRef]14. Zheng, Z.; Ou, G.; Ye, H.; Tan, J.; Jin, H. Analysis on the under deposit corrosion of air cooler tubes: Thermodynamic, numerical
and experimental study. Eng. Fail. Anal. 2017, 79, 726–752. [CrossRef]
Materials 2021, 14, 7754 24 of 24
15. Ou, G.; Jin, H.; Xie, H.; Cao, J.; Qiu, J. Prediction of ammonium salt deposition in hydroprocessing air cooler tubes. Eng. Fail.Anal. 2011, 18, 1458–1464. [CrossRef]
16. Jin, H.; Chen, X.; Ou, G.; Zhang, J. Potential failure analysis and prediction of multiphase flow corrosion thinning behavior in thereaction effluent air cooler system. Eng. Fail. Anal. 2020, 109, 104274. [CrossRef]
17. Tang, P.; Yang, J.; Zheng, J.; Wong, I.; He, S.; Ye, J.; Ou, G. Failure analysis and prediction of pipes due to the interaction betweenmultiphase flow and structure. Eng. Fail. Anal. 2009, 16, 1749–1756. [CrossRef]
18. El-Gammal, M.; Mazhar, H.; Cotton, J.S.; Shefski, C.; Pietralik, J.; Ching, C.Y. The hydrodynamic effects of single-phase flow onflow accelerated corrosion in a 90-degree elbow. Nucl. Eng. Des. 2010, 240, 1589–1598. [CrossRef]
19. Mohammadi, F.; Luo, J. Effects of particle angular velocity and friction force on erosion enhanced corrosion of 304 stainless steel.Corros. Sci. 2010, 52, 2994–3001. [CrossRef]
20. Wu, Y. Calculations estimate process stream depositions. Oil Gas J. 1994, 92, 38–41.21. Sun, A.; Fan, D. Prediction, Monitoring, and Control of Ammonium Chloride Corrosion in Refining Processes. In Proceedings of
the Corrosion Conference and Expo 2010, San Antonio, TX, USA, 14–18 March 2010; Curran Associates, Inc.: Houston, TX, USA,2010; pp. 4649–4665.
22. Sliem, M.H.; Fayyad, E.M.; Abdullah, A.M.; Younan, N.A.; Arora, D. Monitoring of Under deposit Corrosion for the Oil and GasIndustry: A Review. J. Pet. Sci. Eng. 2021, 204, 108752. [CrossRef]
23. Liu, X.; Duan, A.; Quan, J.; Jin, H.; Wang, C. A study on the corrosion failure induced by the ammonium chloride deposition in ahigh-pressure air cooler system. Eng. Fail. Anal. 2020, 112, 104529. [CrossRef]