IGF-I in a normal population: relation to psychosocial factors
Upload
khangminh22Category
view
2download
0
ICOHS 2017International Conference of Occupational Health and Safety (ICOHS-2017)Volume 2018
Conference Paper
Analysis of Ergonomic Risk Factors inRelation to Musculoskeletal DisorderSymptoms in Office WorkersAgnestifa Dinar, Indri Hapsari Susilowati, Azhary Azwar, Kristin Indriyani, andMufti WirawanOccupational Health and Safety Department, Faculty of Public Health, Universitas Indonesia,Depok, Indonesia
AbstractThe development of technology has increased the number of activities workers areable to perform while using visual display units (VDUs), as well as the amount oftime spent executing those activities; the developing technology, however, has alsoincreased the probability of musculoskeletal disorders (MSDs), which can decrease aworker’s productivity and result in a company’s economic loss. Workers at PT. X useVDUs 8 hours per day. This research aimed to analyse the risk factors that are thelikely cause of some MSD symptoms experienced by PT. X workers, such as individualand psychological factors, the work environment, VDU, chair and the work patterns.This research was a cross-sectional study that used proportional stratified randomsampling with 95 participants. The study found that most of the workers experiencedMSD symptoms (78.6%), of which 70.52 percent were chronic complaints, 1.37 percentwere acute complaints and 6.71 percent were a combination of both acute and chroniccomplaints. On the other hand, 16.84 percent of the respondents did not have anyMSD complaints. Risk factors that were shown to be related to MSDs include high BMI(p = 0.031), work patterns period (p = 039), job stress perception (p = 0.005) and workposture (p = 0.036). Work posture relates to seat length (p = 0.041) and seat height(p = 0.005). Job stress perception is related to the details of assignments or work (p =0.047), duration of work (p = 0.04), duration of rest (p = 0.000), work demands (p =0.018) and job control (p = 0.009). Based on multivariate analysis, the most dominantrisk factors associated with MSD complaints were the duration of rest, work postureand job stress perception.
Keywords: MSDs, office ergonomics, VDU, work posture
How to cite this article: Agnestifa Dinar, Indri Hapsari Susilowati, Azhary Azwar, Kristin Indriyani, andMufti Wirawan, (2018), “Analysis of ErgonomicRisk Factors in Relation to Musculoskeletal Disorder Symptoms in Office Workers” in International Conference of Occupational Health and Safety(ICOHS-2017), KnE Life Sciences, pages 16–29. DOI 10.18502/kls.v4i5.2536
Page 16
Corresponding Author:
Indri Hapsari Susilowati
Received: 15 May 2018
Accepted: 3 June 2018
Published: 19 June 2018
Publishing services provided by
Knowledge E
Agnestifa Dinar et al. This
article is distributed under the
terms of the Creative Commons
Attribution License, which
permits unrestricted use and
redistribution provided that the
original author and source are
credited.
Selection and Peer-review under
the responsibility of the ICOHS
2017 Conference Committee.

ICOHS 2017
1. Introduction
Technological developments have led to changes in activities performed by officeworkers using visual display units (VDUs) to complete required tasks. The number ofVDU users has increased since 1989, and this increased use can lead tomusculoskeletaldisorders (MSDs) [1–4]. Since the occurrence of MSDs in theworkplace has become oneof the most prevalent occupational diseases, it is an issue of concern to some gov-ernments, such as those of the North American and Nordic countries, Thailand, Indiaand Japan [5–7]. The disadvantages of MSDs include a decline in work productivity andeconomic loss [8–10]. MSDs begin with symptoms of localised pain in one ormore partsof the body, the level of which may differ depending upon the individual [11]. The PT. Xoffice workers’ activities are most often performed with VDUs, approximately 8 hoursper day. At present, the research on MSDs conducted by PT. X is limited. Therefore,this study aimed to analyse risk factors that are the likely cause of some of the MSDsymptoms experienced by the PT. X workers, such as individual and psychologicalfactors, the work environment, VDU, chair and work patterns.
2. Methods
This study used a cross-sectional design to analyse the relationships between inde-pendent variables comprising individual characteristics (age, sex, BMI, working period,body posture, job stress), work pattern (duration of rest and duration ofwork), environ-mental factor (lighting and illumination), psychosocial factors (work demands, socialsupport, job satisfaction, job control and work stress), size of desk and chair, and theworkers’ anthropometry with MSD complaints as dependent variable. The study wasconducted on office workers in PT. X during February throughMay 2017. The populationin this study is 95 workers found by proportional stratified random sampling methodusing Slovin’s formula.
The research instruments used in this study were: a digital camera, the company’sdocumented reports (worker’s anthropometry, size of desk and chair), checklist of MSDcomplaint by Nordic Body Map (NBM), a checklist of body posture by ROSA (RapidOffice Strain Assessment) and a checklist of psychosocial factors by COPSOQ II (Copen-hagen Psychosocial Questionnaire II) as references. Authors also conducted the validityand reliability test of psychosocial factors checklist. The data were analysed via threedifferent methods: univariate analysis (frequency distribution table), bivariate analysis
DOI 10.18502/kls.v4i5.2536 Page 17

ICOHS 2017
(chi-square test or Fisher’s exact test) and multivariate analysis ordinal regression)using SPSS statistics 23.0.
3. Results
As seen in Table 1, the relationships between ergonomic risk factors and MSD com-plaints are BMI (p = 0.031; OR = 0.141; CI 95% = 0.016 – 1.251), work period (p = 0.039;OR = 4.444; CI 95% = 1.175 – 16.815), p = 0.007; OR = 8.700; CI 95% = 1.092 – 69.312),job stress perception (p = 0.005; OR = 3.732; CI 95% = 1.514 – 21.730), rest duration (p= 0.001; OR = 7.948; CI 95% = 2.454 – 25.745) and duration of work (p = 0.040; OR =4.034; CI 95% = 1.116 – 14.585).
Table 1: The relationship of individual factors and work pattern with MSD’s complaints on the workers inPT. X in the year 2017.
Category Symptoms Present Symptoms Not Present p OR CI 95%
n % n % Lower Upper
Gender Women 21 22.1 4 4.2 0.896 1.086 0.315 3.741
Men 58 61.1 12 12.6
Age > 30 years 54 56.8 13 13.7 0.302 0.498 0.130 1.907
< 30 years 25 26.3 3 3.2
BMI Obese 16 16.8 0 0 0.031* 0.141 0.016 1.251
Overweight 18 18.9 8 8.4 0.402 0.046 3.524
Thin–Normal
45 47.4 8 8.4
Workingperiod
> 5 years 50 52.6 3 3.2 0.039* 4.444 1.175 16.815
< 5 years 41 43.1 13 13.7
Bodyposture
> ActionLevel
29 30.5 1 1.1 0.036* 8.700 1.092 69.312
< ActionLevel
50 52.6 15 15.8
WorkStress
Job Stress 45 47.4 3 3.2 0.005* 5.732 1.514 21.730
No JobStress
34 35.8 13 13.7
Durationof Rest
High risk 68 71.6 7 8.4 0.000* 7.948 2.454 25.745
Low risk 11 11.6 9 9.5
Durationof work
High risk 71 74.7 11 11.6 0.040* 4.034 1.116 14.585
Low risk 8 8.4 5 5.2
Note: * = p-value < 0.05 = Significant Correlation.
DOI 10.18502/kls.v4i5.2536 Page 18

ICOHS 2017
As seen in Table 2, variables that significantly correlate with the suitability of toolsused on the job andwork posture are length of the chair and popliteal bottom (p = 0.04;OR = 2.647; CI 95% = 0.996 – 7.033), height of the chair and height of the popliteal towork posture (p = 0.005; OR = 5.625; CI 95% = 1.543 – 25.500). As shown in Table 2,environmental factors are not related to the body posture of the workers while usingVDUs.
Table 2: The relationship of working tools suitability. Environmental factors to workers’ body postures inPT. X in the year 2017.
Category Body Posture p OR CI 95%
> Action Level < Action Level
n % n % Lower Upper
The width ofback chair:Shoulderwidth
Not suitable 0 0.0 2 2.1 0.332 0.677 0.589 0.779
Suitable 30 31.6 63 66.3
Height ofarmrests:Height ofelbow sitting
Not suitable 18 18.9 38 40.0 0.887 1.066 0,441 2.573
Suitable 12 12.6 27 28.4
Length ofchair:Popliteal
Not suitable 23 24.2 36 37.9 0.041* 2.647 0.996 7.033
Suitable 7 7.4 29 30.5
Width ofchair: Hipwidth
Not suitable 0 0.0 0 0.0
Suitable 30 31.6 65 68.4
Height ofchair: Heightof popliteal
Not suitable 27 28.4 40 42.1 0.005* 5.625 1.543 25.50
Suitable 3 3.2 25 26.3
Height ofdesk: Heightof elbowsitting +popliteal
Not suitable 29 30.5 56 58.9 0.121 4.661 0.563 38.6
Suitable 1 1.1 9 9.5
Temperature Not suitablewith NAB
3 3.2 5 5.3 0.704 1.333 0.297 5.986
Suitable withNAB
27 28.4 60 63.2
Lighting Not suitablewith NAB
8 8.4 12 12.6 0.420 1.606 0.577 4.464
Suitable withNAB
22 23.2 53 55.8
Note: * = p-value < 0.05 = Significant Correlation.
DOI 10.18502/kls.v4i5.2536 Page 19
ICOHS 2017
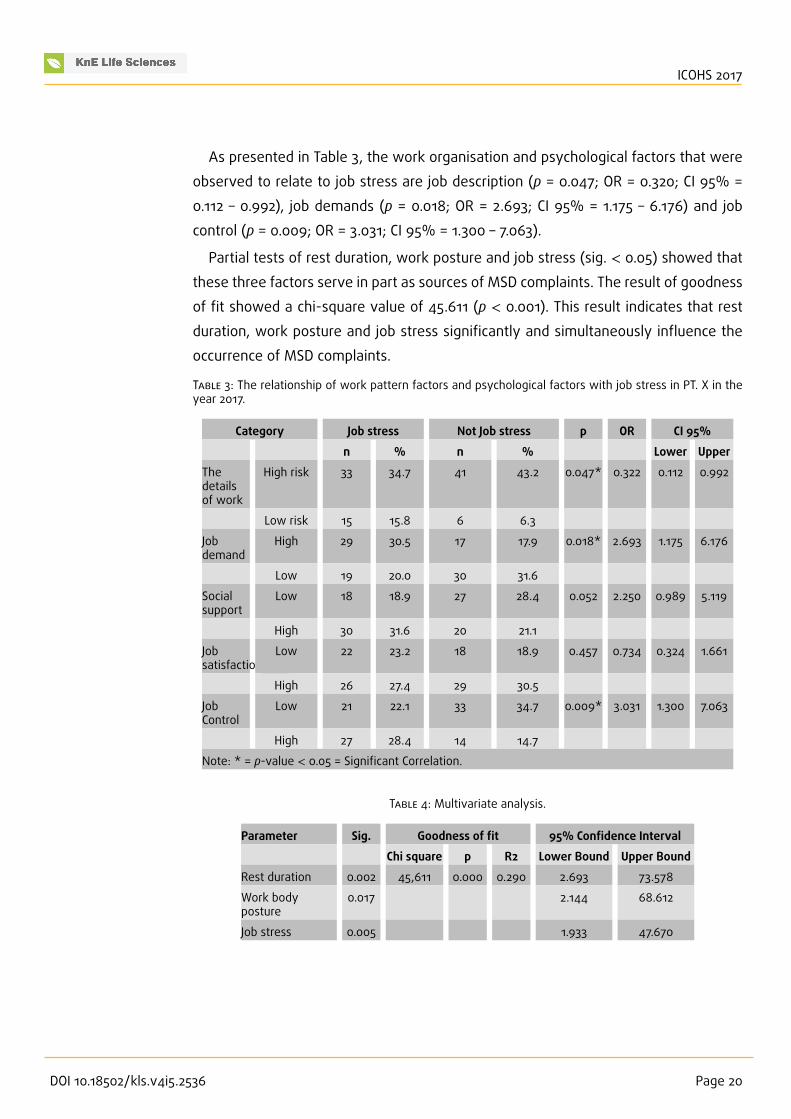
As presented in Table 3, the work organisation and psychological factors that wereobserved to relate to job stress are job description (p = 0.047; OR = 0.320; CI 95% =0.112 – 0.992), job demands (p = 0.018; OR = 2.693; CI 95% = 1.175 – 6.176) and jobcontrol (p = 0.009; OR = 3.031; CI 95% = 1.300 – 7.063).
Partial tests of rest duration, work posture and job stress (sig. < 0.05) showed thatthese three factors serve in part as sources of MSD complaints. The result of goodnessof fit showed a chi-square value of 45.611 (p < 0.001). This result indicates that restduration, work posture and job stress significantly and simultaneously influence theoccurrence of MSD complaints.
Table 3: The relationship of work pattern factors and psychological factors with job stress in PT. X in theyear 2017.
Category Job stress Not Job stress p OR CI 95%
n % n % Lower Upper
Thedetailsof work
High risk 33 34.7 41 43.2 0.047* 0.322 0.112 0.992
Low risk 15 15.8 6 6.3
Jobdemand
High 29 30.5 17 17.9 0.018* 2.693 1.175 6.176
Low 19 20.0 30 31.6
Socialsupport
Low 18 18.9 27 28.4 0.052 2.250 0.989 5.119
High 30 31.6 20 21.1
Jobsatisfaction
Low 22 23.2 18 18.9 0.457 0.734 0.324 1.661
High 26 27.4 29 30.5
JobControl
Low 21 22.1 33 34.7 0.009* 3.031 1.300 7.063
High 27 28.4 14 14.7
Note: * = p-value < 0.05 = Significant Correlation.
Table 4: Multivariate analysis.
Parameter Sig. Goodness of fit 95% Confidence Interval
Chi square p R2 Lower Bound Upper Bound
Rest duration 0.002 45,611 0.000 0.290 2.693 73.578
Work bodyposture
0.017 2.144 68.612
Job stress 0.005 1.933 47.670
DOI 10.18502/kls.v4i5.2536 Page 20

ICOHS 2017
4. Discussion
4.1. The relationship between MSD complaints andindividual factors
In this research, the percentage of respondents who experienced MSDs was around83.15 percent, while the percentage of those who did not experience MSDs wasapproximately 16.84 percent. These results indicate that MSDs do not occur as acutecomplaints but rather accumulate continuously and/or slowly over a long period oftime.
The results of this study also demonstrate that there is no relationship betweengender or age with the occurrence of MSDs. This is in line with the theory [12] thatthere is no maximum capacity index on static activity; muscle strength is thereforenot related to MSD complaints. In addition, with respect to the age factor, a previousstudy [13] found that there was no association between age and MSD complaints. Inthis study, 70 percent of the respondents were 24–40 years old and therefore stillproductive. This condition can influence the workers’ physical activities and life habits.However, the information provided in this study reflects only the working conditionsat PT. X and cannot be generalized to working conditions in other industries.
This study also showed that MSD complaints were related to the workers’ BMI, workperiod, work posture and work stress [14]. Based on field observations conducted bythe researcher, most PT. X workers have BMIs that canmake them susceptible toMSDs.In this research, there was also a relationship between MSDs and a work period of >5 year.
The occupational seat-posture risk level can be identified based on the value on theROSA form. If the posture is below the action level, workstation and posture conditionsare acceptable. If posture is over the action level, the workstation and worker postureare in poor condition and have the potential to cause injury to the worker. This studyrevealed that MSDs are associated with work postures over the action level. This isconsistent with a study [15] that found that awkward posture can lead to an increasedrisk of injury. Based on the observations, most PT. Xworkers had not applied ergonomicprinciples even though they had been using seats based on their anthropometry. Interms of the display screens used, 72 percent of the workers at PT. X use laptops,which cause awkward posture and increase the risk of neck pain while working. At thetime the workers were interviewed, most were unaware of the risks of using laptops
DOI 10.18502/kls.v4i5.2536 Page 21

ICOHS 2017
for long periods of time [16]. Illustrations of workers’ activities while using VDUs arepresented in Figures 1, 2 and 3.
In this study, there was a correlation between MSDs and workers with job stressperception. This finding is consistent with studies [12, 17] indicating that workers withjob stress perception have a higher risk of experiencing MSD complaints and tend tospend 30moreminutes interacting with VDUs. The job stress perception of theworkersat PT. X showed that job stress can be influenced by job demands and job control. Theworkers with job stress perception tend to spend more time working with computers.
Figure 1: Knee angle > 900. The thigh is too short—more than 3 inches. The backbone does not lean onthe back of the chair. Monitor is too low < 300. The keyboard is too high, so the shoulders are too high.
4.2. The relationship between work equipmentrisk factors and posture
In this study, the researcher found no relationship between the width of the backsof workers’ seats and the occurrence of MSD complaints. Ninety-eight per cent ofthe seats used by the workers in PT. X provide adequate support for the workers’shoulders; however, most of the workers do not use the backs of the seats becausetheir size and height do not conform to the workers’ popliteal height. This conditionis in accordance with the theory [18, 19] suggesting that the optimal dimensions of
DOI 10.18502/kls.v4i5.2536 Page 22

ICOHS 2017
Figure 2: Knee angle > 900. Monitor is too low—i.e., < 300. The keyboard is too high. Hand position whentyping is > 1.
work equipment are measured by looking at the reach capacity of the users, such aswhether or not the size of the backs of seats can support the spinal cord.
The function of arm rests is to support theweight of hands, arms and the upper bodyparts while providing flexibility. In this study, the researcher found that there was norelationship between posture > action level and workers whose chairs have high armrests (i.e., conform to elbow height while sitting) and workers whose chairs have higharmrests (i.e., do not conform to elbow height while sitting). The field observationsshowed that the workers were less likely to use arm rests, but generally use the desksurface for their hand support when they are typing or using the mouse. Most of theworkers indicated that the arm rests of their chairs do not correspond to the size ofthe desk arch.
In this study, the researcher found that there is a relationship between the postureaction level of workers who use the chair length that conforms to the popliteal lengthand the workers who use the chair length that does not conform to the popliteallength. This result is in line with the theory [20] that states that if the user’s seat sizeis not appropriate, the body mass will not be effectively distributed, resulting in anawkward position. Based on field observations, workers who do not have a seat size
DOI 10.18502/kls.v4i5.2536 Page 23

ICOHS 2017
Figure 3: Leg room > 3 inch. Neck twisting > 30∘.
that matches the length of the popliteal butt tend to bend their body forward so thatthe spine does not lean back to rest on the backs of the seats. This condition increasesthe risk of MSD complaints.
The analysis of the width of chairs cannot be processed because all respondentsused the seats having an appropriate width. Results of the analyses of the workers’chair heights and work postures concluded that there is a relationship between workposture > action level and the workers who have high seats that conform to theirpopliteal height and the workers who have high seats that do not conform to poplitealheight. According to a previous study [18], the seat height significantly influences theworker’s posture when using the chair. If the seat height is less than the poplitealheight, the user tends to incline the spine, making an acute angle between the thighand the spine itself.
Workers’ desks of an ideal size can reduce MSD complaints. The results of this studyshowed that there is a relationship between work posture over action level and theworkers who use an appropriate table. This is consistent with findings [12, 18, 21] thatsuggest that the inappropriate use of a work table may lead to MSDs. To obtain an
DOI 10.18502/kls.v4i5.2536 Page 24

ICOHS 2017
appropriate working height, workers with short legs who work at high tables shouldadjust their seats continuously. As a result, the workers tend to sit on the front edgeof the chair and thus lose support from the back. In contrast, if a worker lowers thechair, the elbow position will rise, thereby causing neck and shoulder problems.
4.3. The relationship between environmentalrisk factors and posture
Exposure to cold temperatures can decrease the agility, sensitivity and strength ofworkers. If this exposure is not balanced with the energy supply to the muscle,the blood circulation will be disturbed, and the oxygen supply to the muscle will bedecreased, creating an accumulation of lactic acid that can cause muscle pain [22, 23].This research revealed no relationship between posture > action level of the workersin ambient temperatures that comply to the TLV (Threshold Limits Value) and theworkers working in ambient temperatures that do not comply with the NAB. Duringthe researcher’s observations, 91 percent of the environmental temperature at PT. Xwas consistent with the recommendation given by the Ministry of Health, Act No. 48(2016).
Illumination is a quantity that is closely related to the power of light [22]. If theworkplace illumination is inadequate, it causes flexion of the neck (bowing) and body(bending), which increases the risk of MSDs [24]. The standard levels for office illu-mination are 300–500 Lux, based on the Ministry of Health, Act No. 48 (2016). In thisstudy, no relationship was found between work posture below the action level andthe work area lighting level. The observations revealed only a few work areas at PT. Xthat were insufficiently illuminated, and 55 percent of the company’s remaining workareas had already implemented lighting that meet the standard levels.
4.4. The relationship between work pattern factors and MSDs
High-risk work durations are also related to MSD complaints. This is consistent withprevious findings [20, 25–27] indicated that a long work duration (4–8 hours in 1 day)causes localized job stress, discomfort, decreased muscle performance and musclecontractions that reduce the blood supply, thereby significantly increasing the risk ofMSDs.
The duration of irregular breaks is also related to MSD complaints. More frequentbreaks of short durations are better than one long break. The implementation of having
DOI 10.18502/kls.v4i5.2536 Page 25

ICOHS 2017
more frequent short breaks has a positive effect by reducing MSD complaints, espe-cially for workers who use VDUs with short breaks at 20-minute intervals [22, 27–29].
4.5. The relationship between work pattern andpsychological factors with job stress perception
The details of a job description present detailed activities that should be done by aworkerwithin the organization in terms ofmanagingwork-related stress, which affectsthe occurrence of MSD complaints [4]. This idea is in line with the results of this study,which indicates that there is a relationship between MSD complaints and the high-risktasks. The field observations in this study demonstrated that workers with high-riskjob tend to spend most of their work time in front of VDUs.
Based on the analysis of the job demand factor, this study found a relationshipbetween job demands and MSD complaints. The VDU workers’ combination of psy-chosocial demands, such as tasks that cause mental pressures and require high con-centration, and physical demands, such as posture and motions that tend to increasemuscle tension or strength while using the keyboard or mouse, potentially result inMSD complaints [27]. During the interviews, the workers stated that they generallyhave high job demands that require continuous motivation and ideas as well as repet-itive activities and motions.
This study found no relationship betweenMSD complaints and social support. Basedon the interview results, most of the workers received good social support from theirfamilies or co-workers.
Job satisfaction is an emotional condition whereby workers feel happy or unhappywith their jobs. In this research, no association between job satisfaction and MSDs wasfound. Most of the PT. X workers stated that they were sufficiently satisfied with theirjob prospects as well as with the management.
Previous studies have shown that a low level of control related to decision latitudepotentially causes MSDs [25, 30], a finding consistent with the results of this study,which found that there is a relationship between job control and MSD complaints [1].
5. Conclusions
In this study, 78.6 percent of the respondents experienced MSD complaints. Ergonomicrisk factors that were found to be associated with MSD symptoms are individual fac-tors, such as BMI, work period, job stress perception and work posture. The equipment
DOI 10.18502/kls.v4i5.2536 Page 26

ICOHS 2017
risk factors that contribute to the occurrence of MSD symptoms include the lengthof the seat and the seat height. The work organization risk factors that lead to MSDsymptoms are duration of work and duration of rest. In addition, the psychologicalfactors, through job stress, that also cause MSDs symptoms are job description, jobdemands and job control. Finally, the factors which most contribute to ergonomic risksthat cause MSDs symptoms are rest duration, posture and job stress perception.
References
[1] Lin, Z. and Popovic, A. (April 2003). Workingwith computers in Canada: An empiricalanalysis of incidence, frequency and purpose. Analysis.
[2] Mani, L. and Gerr, F. (2000). Work-related upper extremity musculoskeletaldisorders. Primary Care - Clinics in Office Practice, vol. 27, no. 4, pp. 845–864.
[3] Hedman, R. L. (1988). VDT users and eyestrain. Display, vol. 1, no. 1, pp.1986–1988.
[4] Wærsted, M. and Westgaard, R. H. (1997). An experimental study of shouldermuscle activity and posture in a paper version versus a VDU version of amonotonous work task. International Journal of Industrial Ergonomics, vol. 19, no.3, pp.175–185.
[5] Maakip, I., Keegel, T., and Oakman, J. (2016). Prevalence and predictors formusculoskeletal discomfort in Malaysian office workers: Investigating explanatoryfactors for a developing country. Applied Ergonomics, vol. 53, pp. 252–257.
[6] Poochada, W. and Chaiklieng, S. (2015). Ergonomic risk assessment among callcenter workers. Procedia Manufacturing, vol. 3, pp. 4613–4620. Available at: http://www.sciencedirect.com/science/article/pii/S2351978915005442
[7] Moom, R. K., Sing, L. P., and Moom, N. (2015). Prevalence of musculoskeletaldisorder among computer bank office employees in Punjab (India): A case study.Procedia Manufacturing, vol. 3, pp. 6624–6631.
[8] Wellnomics. (2008). What are the Productivity Losses Caused By Musculoskeletal
Disorders (MSDs)?—A Review of the Current Literature (pp. 1–5).
[9] Australian Safety and Compensation Council. (April 2005). Work-related Muscu-
loskeletal Disease in Australia (p. 56).
[10] Korhan, O. and Mackieh, A. (2010). A model for occupational injury risk assessmentof musculoskeletal discomfort and their frequencies in computer users. Safety
Science, vol. 48, no. 7, pp. 868–877.
DOI 10.18502/kls.v4i5.2536 Page 27

ICOHS 2017
[11] Cush, J. J., Kavanaugh, A., and Stein, C. M. (2005). Musculoskeletal Disorders (p. 5).Retrieved from: https://www.iosh.co.uk/Books?and?resources/Our?OH?toolkit/Musculoskeletal?disorders.aspx
[12] Karwowski, W. (2006). International Encyclopedia of Ergonomics and Human Factors.Philadelphia, PA: Taylor & Francis Group.
[13] Collins, J. D. and O’Sullivan, L. W. (2015). Musculoskeletal disorder prevalenceand psychosocial risk exposures by age and gender in a cohort of officebased employees in two academic institutions. International Journal of Industrial
Ergonomics, vol. 46, pp. 85–97. Retrieved from: http://dx.doi.org/10.1016/j.ergon.2014.12.013
[14] Tarwaka, Bakri, S. H., and Sudiajeng, L. (2004). Ergonomi untuk Keselamatan,
Kesehatan Kerja dan Produktivitas. Retrieved from: http://shadibakri.uniba.ac.id/wp-content/uploads/2016/03/Buku-Ergonomi.pdf
[15] Kroemer, K. H. E. and Grandjean, E. (2009). Fitting the Task to the Human Fifth Edition,Philadelphia, PA: UK Taylor & Francis.
[16] McKeown, C. ( July 2008). Office Ergonomics (pp. 22–30). CRC Press.
[17] Eijckelhof, B. H., Huysmans, M. A., Blatter, B. M., et al. (2014). Office workers’computer use patterns are associatedwith workplace stressors. Applied Ergonomics,vol. 45, no. 6, pp.1660–1667.
[18] Pheasant, S. (1996). Bodyspace: Anthropometry, Ergonomics and the Design of Work.CRC Press.
[19] Chuan, T. K., Hartono, M., and Kumar, N. (2010). Anthropometry of the Singaporeanand Indonesian populations. International Journal of Industrial Ergonomics, vol. 40,no. 6, pp.757–766. Retrieved from: http://dx.doi.org/10.1016/j.ergon.2010.05.001
[20] Kroemer, K. H. E. and Grandjean, E. (2009). Fitting the Task to the Human (5th edition).Philadelphia, PA: UK Taylor & Francis.
[21] Kroemer, K. H. E. (2008). Fitting the Human: Introduction to Ergonomics (6thedition). Taylor & Francis Group, LLC. Retrieved from: https://books.google.com/books?id=RibNBQAAQBAJ&pgis=1
[22] Dul, J. and Weerdmeester, B. (2008). Ergonomics for Beginners. Boca Rotan: CRCPress, Taylor & Francis Group.
[23] Ndivhudzannyi, E. M. (2003). The Study of Work-related Musculoskeletal Disorders.Master’s thesis.
[24] Bridger, R. S. (2003). Introduction to Ergonomics. Philadelphia, PA: Taylor & FrancisInc.
DOI 10.18502/kls.v4i5.2536 Page 28

ICOHS 2017
[25] Bandores, J. A., Cullen, M. R., and de Lateur, B. (2001). Disorders And the Workplace
Low Back and Upper Extremities Panel on Musculoskeletal Disorders and theWorkplace. Washington, DC: National Academy Press.
[26] Helland, M., Horgen, G., Kvikstad T. M, et al. (2008). Musculoskeletal, visual andpsychosocial stress in VDU operators after moving to an ergonomically designedoffice landscape. Applied Ergonomics, vol. 39, no. 3, pp. 284–295.
[27] Griffiths, K. L., Mackey, M. G., and Adamson, B. J. (2007). The impact of a comput-erized work environment on professional occupational groups and behavioural andphysiological risk factors for musculoskeletal symptoms: A literature review. Journalof Occupational Rehabilitation, vol. 17, no. 4, pp. 743–765.
[28] Mclean, L., et al. (2001). Computer terminal work and the benefit of micro-breaks. Applied Ergonomics, vol. 32, no. 3, pp. 225–237. Retrieved from: http://www.sciencedirect.com/science/article/pii/S0003687000000715
[29] Niekerk, G. (1995). Office ergonomics training effectiveness. Proceedings of the
Human Factors and Ergonomics Society Annual Meeting, vol. 39, no. 10, pp. 578–581.
[30] Karwowski, W. (2006). International Encyclopedia of Ergonomics and Human Factors.Philadelphia, PA: Taylor & Francis Group.
DOI 10.18502/kls.v4i5.2536 Page 29
Copyright © 2022 FDOKUMEN