EXPLORING THE RELATION BETWEEN POSTGRADUATE ...
303
EXPLORING THE RELATION BETWEEN POSTGRADUATE STUDENT SATISFACTION AND ACADEMIC STAFF SATISFACTION MONA NASSAR Salford Business School University of Salford, Salford, UK Submitted in Partial fulfilment of the Requirements of the Degree of Doctor of Philosophy, November 2016
-
Upload
khangminh22 -
Category
Documents
-
view
2 -
download
0
Transcript of EXPLORING THE RELATION BETWEEN POSTGRADUATE ...

EXPLORING THE RELATION BETWEEN
POSTGRADUATE STUDENT SATISFACTION AND
ACADEMIC STAFF SATISFACTION
MONA NASSAR
Salford Business School
University of Salford, Salford, UK
Submitted in Partial fulfilment of the Requirements of the Degree of
Doctor of Philosophy, November 2016
i
Contents
List of Tables ...................................................................................................................................... iv
List of Figures .................................................................................................................................... vi
Dedication ........................................................................................................................................ viii
Acknowledgements ............................................................................................................................ ix
Declaration .......................................................................................................................................... x
Glossary of Terms and Abbreviations ................................................................................................ xi
Definition of Terms ........................................................................................................................... xii
Abstract ............................................................................................................................................ xiii
Chapter One: Introduction .................................................................................................................. 1
1.1 Background ........................................................................................................................1
1.1.1 The importance of the Higher Education sector to the UK .......................................... 1
1.1.2 The Challenges faced by HE ........................................................................................ 1
1.1.3 Current research............................................................................................................ 3
1.2 Research rationale ..............................................................................................................9
1.3 Research aim ................................................................................................................... 10
1.4 Research questions .......................................................................................................... 10
1.5 Conceptual framework .................................................................................................... 10
1.6 Originality and contribution to knowledge and practice ................................................. 12
1.7 Thesis structure ............................................................................................................... 13
Chapter Two: Literature Review ...................................................................................................... 15
2.1 Service quality ................................................................................................................ 15
2.1.1 Service quality ............................................................................................................ 16
2.1.2 Service quality in Higher Education ........................................................................... 19
2.1.3 Service quality measurement ...................................................................................... 21
2.1.4 Management commitment to service quality .............................................................. 24
2.2 Satisfaction ..................................................................................................................... 26
2.2.1 Students’ satisfaction .................................................................................................. 27
2.2.2 Job satisfaction ........................................................................................................... 36
2.2.3 Service quality and satisfaction .................................................................................. 51
2.3 Marketisation of HE........................................................................................................ 52
2.3.1 Are student customers? ............................................................................................... 53
2.4 Cognitive Consistency Theories ..................................................................................... 56
2.4.1 Cognitive Dissonance Theory .................................................................................... 56

ii
2.4.2 Balance Theory ........................................................................................................... 57
2.5 Conceptual framework .................................................................................................... 60
2.5.1 Customisation of balance Theory direct route (Based on Balance Theory) ............... 62
2.5.2 Indirect route (Based on Herzberg's Motivation-Hygiene Theory) ............................ 63
2.6 Chapter summary ............................................................................................................ 64
Chapter Three: Research Context .................................................................................................... 65
3.1 The HE sector in the UK ................................................................................................. 65
3.2 League tables .................................................................................................................. 71
3.3 Quality in the HE ............................................................................................................ 75
3.3.1 RAE ............................................................................................................................ 75
3.3.2 QAA ........................................................................................................................... 77
3.4 University of Salford (UoS) ............................................................................................ 78
3.4.1 Salford Business School (SBS) .................................................................................. 79
3.5 Chapter Summary ........................................................................................................... 84
Chapter Four: Research Methodology ............................................................................................. 85
4.1 Research methodology .................................................................................................... 85
4.2 Research philosophy ....................................................................................................... 87
4.2.1 Positivism ................................................................................................................... 88
4.2.2 Interpretivism ............................................................................................................. 89
4.2.3 Critical research .......................................................................................................... 90
4.2.4 Current research philosophy ....................................................................................... 91
4.3 Research approaches ....................................................................................................... 94
4.3.1 Qualitative research .................................................................................................... 94
4.3.2 Quantitative research .................................................................................................. 96
4.3.3 Mixed method ............................................................................................................. 96
4.3.4 Current research approach ........................................................................................ 100
4.4 Research strategy .......................................................................................................... 101
4.5 Data collection tools ..................................................................................................... 106
4.6 Research integrity ......................................................................................................... 110
4.7 Research quality ............................................................................................................ 112
4.8 Sampling ....................................................................................................................... 115
4.9 Data analysis ................................................................................................................. 117
4.10 Pilot study ..................................................................................................................... 119
4.11 Ethical approval ............................................................................................................ 119

iii
4.12 Researcher background ................................................................................................. 120
4.13 Chapter summary .......................................................................................................... 120
Chapter Five: Data Analysis chapter .............................................................................................. 122
5.1 How can PG student satisfaction be linked to academic staff satisfaction and explored in
relation to Herzberg’s Motivation-Hygiene Theory and the Balance Theory? .......................... 127
5.1.1 Part one: quality and satisfaction .............................................................................. 127
5.1.2 Part two: satisfaction and feedback .......................................................................... 159
5.2 How does the marketisation affect PG student perceptions of HE? ............................. 185
5.3 Chapter summary .......................................................................................................... 188
Chapter Six: Discussion ................................................................................................................. 189
6.1 How can PG student satisfaction be linked to academic staff satisfaction and explored in
relation to Herzberg’s Motivation-Hygiene Theory and the Balance Theory? .......................... 190
6.1.1 Part one: quality and satisfaction .............................................................................. 190
6.1.2 Part two: satisfaction and feedback .......................................................................... 222
6.2 How does the marketisation affect PG student perceptions of HE? ............................. 230
6.3 Chapter summary .......................................................................................................... 234
Chapter Seven: Conclusion ............................................................................................................ 235
7.1 Research summary ........................................................................................................ 235
7.2 Methodological contribution ......................................................................................... 241
7.3 Practical contributions .................................................................................................. 243
7.4 Research evaluation ...................................................................................................... 244
7.5 Research limitations ...................................................................................................... 246
7.6 Future Research ............................................................................................................ 247
References ...................................................................................................................................... 248
Appendix 1... Ethical Approval ...................................................................................................... 277
Appendix 2... Consent Form .......................................................................................................... 278
Appendix 3... Information Sheet .................................................................................................... 279
Appendix 4... Interview Questions ................................................................................................. 281
Appendix 5... PhD research map .................................................................................................... 285
Appendix 6... Staff Interview Coding ............................................................................................ 287
Appendix 7... Students Interview Coding ...................................................................................... 288

iv
List of Tables
Table 2. 1: Different definitions of students’ satisfaction adapted from literature.............. 29
Table 2. 2: Service quality factors affecting students' satisfaction ...................................... 35
Table 2. 3: Adapted from Mullins (2005) Applying Maslow’s need hierarchy .................. 38
Table 2. 4: Established Workplace Motivation-hygiene Factors (Herzberg, 1966, 1974) .. 41
Table 2. 5: Linking Maslow’s, and Herzberg’s theories of motivation ............................... 42
Table 2. 6: Conceptual Framework of Faculty Job Satisfaction ......................................... 47
Table 2. 7: Factors affect academic staff job satisfaction adapted from literature .............. 50
Table 2.8: Studies that support and oppose the idea of dealing with students as higher
education customers. ......................................................................................................... 55
Table 3. 1: Universities four main categories ...................................................................... 67
Table 3. 2: Main league tables in the UK ............................................................................ 72
Table 3. 3: Summary of the league tables argument. .......................................................... 75
Table 4. 1: A comparative overview of the key rhetoric of major IS research paradigms .. 93
Table 4. 2: Strength and weakness of research approaches ................................................. 98
Table 4. 3: Differences between deductive and inductive approaches to research ........... 100
Table 4. 4: Relevant situations for different research methods ......................................... 102
Table 4. 5: Data sources used in the current research ....................................................... 110
Table 4. 6: Quality in positivist and interpretivist research. .............................................. 113
Table 4. 7: Research quality used tactics. .......................................................................... 115
Table 5. 1: Students’ interviews ........................................................................................ 125
Table 5. 2: Staff interviews................................................................................................ 126
Table 6. 1: Summary of the communication findings and literature ................................. 193
Table 6. 2: Academic staff knowledge and experience in the current research, literature and
PTES. .............................................................................................................................. 194
Table 6. 3: Effective use of technology (by lecturers) and students’ satisfaction. ............ 194
Table 6. 4: Research environment and students satisfaction. ............................................ 195
Table 6. 5: International experience and students’ satisfaction ......................................... 196
Table 6. 6: Personal tutor and student satisfaction. ........................................................... 197
Table 6. 7: Facilities effect on students satisfaction. ......................................................... 198
Table 6. 8: Supporting staff effect on student satisfaction. ............................................... 199
Table 6. 9: Block delivery from students, literature and PTES perspectives. ................... 201
Table 6. 10: Current research findings and literature concerning social activities and
interaction ........................................................................................................................ 202
Table 6. 11: Students experience in the current research and literature. ........................... 202
Table 6. 12: Applying Gronroos dimensions .................................................................... 206
Table 6. 13: Workload and staff satisfaction. .................................................................... 209
Table 6. 14: Career progression. ........................................................................................ 210
Table 6. 15: Rewarding and recognition. .......................................................................... 211
Table 6. 16: Supporting staff and academic staff satisfaction. .......................................... 212
Table 6. 17: IT services and academic staff satisfaction ................................................... 213
Table 6. 18: Facilities and academic staff satisfaction ...................................................... 214
Table 6. 19: Empowerment and academic staff satisfaction ............................................. 215

v
Table 6. 20: Academic staff training and Job satisfaction ................................................. 216
Table 6. 21: Organisational support and academic staff satisfaction ................................ 217
Table 6. 22: Academic freedom and job satisfaction ........................................................ 217
Table 6. 23: Autonomy and academic staff satisfaction .................................................... 218
Table 6. 24: Respect and academic staff satisfaction. ....................................................... 218
Table 6. 25: Teamwork and academic staff satisfaction ................................................... 219
Table 6. 26: Academic staff teaching and experience and its effect on students' satisfaction
......................................................................................................................................... 224
Table 6. 27: Communication and students satisfaction ..................................................... 225
Table 6. 28: Friendly and fair academics and its effect on students satisfaction .............. 226
Table 6. 29: Students satisfaction and feedback ................................................................ 227
Table 6. 30: Feedback and academic staff satisfaction ..................................................... 229
Table 7. 1: Research evaluation summary ......................................................................... 246
vi
List of Figures
Figure 1.1: Conceptual framework ...................................................................................... 12
Figure 2. 1: Sections diagram for chapter two..................................................................... 15
Figure 2.2: Adapted from Mullins (2005) Representation of Herzberg's Motivation-
Hygiene Theory ................................................................................................................. 40
Figure 2.3: Basic model of expectancy Theory ................................................................... 45
Figure 2.4: adapted from Eagly and Chaiken (1993) Balanced and imbalanced triads. ..... 59
Figure 2.5: Conceptual framework ...................................................................................... 62
Figure 4.1: The research ‘onion’ ......................................................................................... 87
Figure 4.2: Underlying philosophical assumptions ............................................................. 95
Figure 4.3: Overlapping stages in qualitative data analysis .............................................. 117
Figure 5.1: NVivo explorer screenshot as of 16 December 2015 after transcribing all
interviews ........................................................................................................................ 124
Figure 5.2: Screenshot of NVivo illustrating document visible coding (6/2/2016). ......... 127
Figure 5.3: Criteria of academic staff ................................................................................ 131
Figure 5.4: Academic service node and associate sub nodes. ........................................... 134
Figure 5.5: Facilities node and its sub nodes. .................................................................... 135
Figure 5.6: The 'lectures' as a main node and the related sub nodes. ................................ 139
Figure 5.7: Students experience node and related sub nodes. ........................................... 140
Figure 5.8: Nodes and sub-nodes representing quality factors mentioned by students ..... 142
Figure 5.9: Matrix query of the text passages coded for students. .................................... 143
Figure 5.10: Nodes emerged from the coding process ...................................................... 143
Figure 5.11: Model representing the opinions of the eight staff interviewed regarding
financial rewards ............................................................................................................. 147
Figure 5.12: Job design node. ............................................................................................ 149
Figure 5.13: Facilities node and the two sub nodes IT services and physical facilities. ... 150
Figure 5.14: School environment node and related sub nodes .......................................... 155
Figure 5.15: Nodes and sub-nodes representing quality factors from staff point of view. 157
Figure 5.16: Matrix query of the text passages coded for academic staff. ........................ 158
Figure 5.17: Nodes emerged from the analysis process. ................................................... 158
Figure 5.18: Relation between student and staff through the feedback (unit 1) ................ 162
Figure 5.19: Summary for Unit two relationships. ............................................................ 165
Figure 5.20: Summary for Unit three relationships. .......................................................... 169
Figure 5.21: Summary for Unit four relationships. ........................................................... 172
Figure 5.22: Summary for Unit five relationships. ............................................................ 174
Figure 5.23: Summary for Unit six relationships. ............................................................. 177
Figure 5.24: Summary for Unit seven relationships. ......................................................... 179
Figure 5.25: Summary for Unit eight relationships. .......................................................... 182
Figure 5.26: Summarises the relationship between the students interviewed and feedback.
......................................................................................................................................... 182
Figure 5.27: Summarises the relationship between feedback and the staff interviewed. .. 183
Figure 5.28: Represents the whole conceptual framework along with the nodes that
emerged from the interviews ........................................................................................... 184
vii
Figure 5.29: Students’ feedback regarding grades. ........................................................... 187
Figure 5.30: Nodes and sub-nodes related to the students perception as customer........... 188
Figure 6.1: Conceptual framework .................................................................................... 189
Figure 6.2: Management commitment to quality effect on both students and staff
satisfaction ....................................................................................................................... 190
Figure 6.3: Criteria of academic staff ................................................................................ 192
Figure 6.4: Academic service node and associate sub nodes. ........................................... 195
Figure 6.5: Facilities node and its sub nodes. .................................................................... 197
Figure 6.6: the 'lectures' as a main node and related sub nodes. ....................................... 200
Figure 6.7: Nodes and sub-nodes representing quality factors mentioned by students ..... 207
Figure 6.8: Job design node. .............................................................................................. 208
Figure 6.9: Facilities node and the two sub nodes IT services and physical facilities. ..... 213
Figure 6.10: School environment node and related sub nodes .......................................... 214
Figure 6.11: Perceived appreciation role in the relation between student satisfaction and
staff satisfaction. ............................................................................................................. 222
Figure 6.12: Relation between satisfaction and feedback ................................................. 228
Figure 6.13: Comparison between Frey et al., (2013) research conclusions and this
research. .......................................................................................................................... 230
Figure 6.14: Students’ feedback regarding grades. ........................................................... 233
Figure 6.15: The effect of tuition fees and service provided by the school on students
perception of themselves as customers. .......................................................................... 234
viii
Dedication
I would like to dedicate this research to my parents Eng. Abdel Rahman Nassar and Dr.
Thanaa Nassar. Their prayers, patience and support has motivated me during this journey.
My brother Ahmed has also been a great companion. I also send a special dedication to my
wonderful beloved son, Youssef for his continuous encouragement and love over these
years.

ix
Acknowledgements
All Praise to Allah the Almighty who has given me the strength to complete my PhD
thesis.
I am indebted to my supervisor Dr. Aleksej Heinze, for his support, guidance, constructive
feedback, comments and time. He has never failed to give me the help and support that I
needed. I do not have the words to express how thankful I am to him. I would also like to
extend my thanks to Chris Proctor my co-supervisor for his feedback and suggestions.
Thanks are also due to the Salford Business School postgraduate students and academics
who gave their valuable time participating in my research.
Finally, to my PhD friends and colleagues who shared their knowledge, experience,
support and care, I thank you all for the parts you played.

x
Declaration
This is to certify that this research is the result of my own work, and has not previously
submitted to qualify for any other academic reward. Any material used in this research is
properly referenced.

xi
Glossary of Terms and Abbreviations
AMBA The Association of MBAs
CEEMAN International Association for Management Development in Dynamic Societies
CIM The Chartered Institute of Marketing
CIPS The Chartered Institute of Purchasing & Supply
CIPD The Chartered Institute of Personnel Development
CIT Critical Incident Technique
DEL The Department for Employment and Learning, Northern Ireland
EPAS International programme accreditation system operated by EFMD
EU European Union
FTE Full-time equivalent
GDP Gross Domestic Product
HE Higher Education
HEFCE Higher Education Funding Council for England
HEFCW The Higher Education Funding Council for Wales
HESA The Higher Education Statistics Agency
MBA Master of Business Administration
MOOCs Massive Open Online Courses
NSS The National Student Survey
NVivo Qualitative data analysis (QDA) computer software package produced by QSR
International.
PDR Personal Development Review
PRES Postgraduate Research Experience Survey
PTES Postgraduate Taught Experience Surveys
QAA Quality Assurance Agency for Higher Education
RAE Research Assessment Exercise
REF Research Excellence Framework
SBS Salford Business School
SFC The Scottish Funding Council
SHEFC The Scottish Higher Education Funding Council
UK The United Kingdom
UKBA UK Border Agency (currently: UK Visas and Immigration)
UoS University of Salford
VC Vice-Chancellor
VLE Virtual Learning Environment

xii
Definition of Terms
Academic staff satisfaction: “the ability of the teaching job to meet teachers’ needs and
improve their job/teaching performance” (Ololube, 2006; p. 1).
Block delivery: Generally means that only one subject is being studied at a time and the
course is delivered in a sequential manner. This is different to the parallel delivery where
multiple subjects are studied at the same time, which is the traditional approach for
structuring teaching and learning activities. In the current case study, courses are delivered
in an intensive six weeks long block of single subject learning and teaching. Each block of
teaching is broken down into two three weeks periods. These three weeks comprise of
intensive two and a half day face-to-face study at the beginning followed by flexible and
online learning activities in the following weeks. Each module also has two assignments
submitted at the end of the two halves of the module in weeks 3 and 6.
Conceptual framework: using graphical or narrative form to explain the main themes,
variables or key factors to be studied and the assumed relationships among them (Miles,
Huberman, & Saldana, 2014). The conceptual framework also sets out the boundaries of
the study.
Customer: “the recipient or beneficiary of the outputs of work efforts or the purchaser of
products and services” (Maguad, 2007: p. 334)
Management commitment to quality: “Employees’ appraisal of an organization’s
commitment to nurture, develop, support, and reward its employees to achieve service
excellence” (Babakus, Yavas, Karatepe, & Avci, 2003: p. 275).
Service quality: A set of features of a service that have a long-term effect on the provider–
customer relationship (Sultan and Wong, 2014).
Satisfaction: generally accepted to be a post-purchase phenomenon (Giese and Cote,
2002).
Students satisfaction: Satisfaction results when student expectations fit their perceptions
of service quality. If the service offered is beyond expectations, student will be very
satisfied (Petruzzellis, D’Uggento, & Romanazzi, 2006).

xiii
Abstract
The Higher Education (HE) sector is a major contributor to the UK economy. Beyond its
financial contribution HE adds value to society and generally advances global culture.
Along with funding, league tables ranking and rising tuition fees one of the major
challenges HE faces is competition on both national and international levels. So as to gain
competitive advantage HE institutions need to satisfy their stakeholders. This research is
concerned with two categories of HE stakeholder:
1. Postgraduate (PG) taught students
2. Academic staff.
The focus of this study is to explore the relation between postgraduate student satisfaction
and academic staff satisfaction. The University of Salford’s Salford Business School (SBS)
in the UK was chosen to be an exploratory case study. This study is underpinned by two
research questions:
1. How can PG student satisfaction be linked to academic staff satisfaction and
explored in relation to Herzberg’s Motivation-Hygiene Theory and the Balance
Theory?
2. How does the marketisation affect PG student perceptions of HE?
Unlike previous studies which adopted positivist standpoints, this research uses an
interpretive paradigm. A total of twenty-eight in-depth interviews were conducted between
the 20th October 2014 and the 30th November 2015. The data subjects were twenty PG
students and eight academic staff in a dyadic relationship. Participants were selected based
on their knowledge and experience of SBS. NVivo software was used to analyse the semi-
structured interviews as well as critical incidents discussed.
This study contributes to knowledge by investigating the relation between student
satisfaction and staff satisfaction, using both Herzberg theory and the Balance theory.
Findings of this research suggests there is a relation between PG student satisfaction and
academic staff satisfaction, although in some cases it was not activated. It contributes to
Herzberg’s Motivation-Hygiene Theory in that it shows a need to augment his framework
with the impact of negative feedback when using it in future studies, particularly if
considering HE. Moreover, one of the key findings is that PG students consider themselves
as customers. This means that they expect high quality of service in return for the student
fees paid. The methodological contribution of this research shows that data collected from

xiv
members of the dyadic relationship of PG students and academic staff who teach them,
offers a rich understanding of services provided by SBS.
Finally, the practical contribution of this work challenges the reliability of student surveys
being conducted to measure satisfaction of students as in reality unhappy experiences were
those that were shared more easily and this highlights the need to change the feedback
culture in HE. Research findings highlight both the benefits and drawbacks of the Block
delivery mode currently used at SBS. The findings also imply that one of the HE system
drawbacks is that it focuses on and rewards research output. So it identifies a need within
the management of the school to focus on and reward teaching excellence.

1
Chapter One: Introduction
This chapter introduces the background for this research, followed by the research
rationale, research aim, questions, conceptual framework and expected contributions.
Finally, it will explain the structure of the thesis that follows.
1.1 Background
This section introduces the main themes and sets the background for the current research.
1.1.1 The importance of the Higher Education sector to the UK
The Higher Education (HE) sector is an important contributor in the UK economy. As
reported by Universities and Science Minister, David Willetts, this sector generated more
than £27.9 billion revenues and contributed more than 2.8% to the Gross Domestic Product
in 2011 (Willetts, 2014). This contribution to GDP is more than four times that of
agriculture (Lock, 2015). It also supports around 760,000 full-time equivalent (FTE) UK
jobs1 (UniversitiesUK, 2014b, 2014d, 2015b). London First report in 2015 explained that
international students, in the capital, net contribution to the economy was roughly £2.3
billion (London First, 2015). In addition to monetary value, international students bring
cultural and academic contribution to UK HE institutions (Soo & Elliott, 2010).
Furthermore, collaborative research between industry and universities is worth more than
£3.5 billion (UniversitiesUK, 2015a) indicated by the World Economic Forum that says:
“the UK ranks fourth in the world for university-industry collaboration in R&D”
(Dowling, 2015; p. 16).
Beyond this financial contribution HE adds value to society (Rothwell, 2016), the
innovation ecosystem (Ugnich, Chernokozov, & Velichko, 2015) and general advancement
of global culture (Soo & Elliott, 2010). This demonstrates the importance of HE is not just
about income generated but also its further impact on society as a whole.
1.1.2 The Challenges faced by HE
As discussed, HE is a major contributor to the UK economy. That said, in recent years,
many challenges have arisen for the HE sector such as reduction and sustainability of
funding and increased marketisation (both on national and international levels).
1 FTE represents the number of working hours worked during a fixed time period: a month or a year, by one
full-time employee

2
Higher Education in the UK has been “subject to a gradual process of marketisation since
the early 1980s” (Brown, 2015: p. 5). Bolton (2014) discusses how, in 1982, the
government introduced annual tuition fees of £1,000. This amount represented a quarter of
course average cost. Many students from lower income families were allowed continued
access to free tuition. This tuition scheme was active for the academic years 1998/99 until
2006/07. In the 2006/07 academic year, the Office of Fair Access (OFFA) approved plans
to charge new undergraduate student tuition fees up to £ 3,000 in England. It was extended
to Northern Ireland the same year and Wales in 2007/2008. In 2012/2013 the fee cap
increased to £9,000 (Bolton, 2014). Furthermore, the HM Treasury (2015) indicates that
the government will allow “institutions offering high teaching quality to increase their
tuition fees in line with inflation from 2017-18, and consult on the mechanisms to do this”
(p. 59). Bolton (2014) also suggests that current tuition fees in England are “likely to be the
highest for public or state-dependent private institutions in the developed world” (p. 18)
and ranked second highest after the United States of America. Additionally, The
Conservative Party 2015 General Election manifesto (p. 35) confirmed their commitment
to eliminate caps on student numbers, which will inevitably lead to greater competition
between universities (Hart, 2015; UniversitiesUK, 2014b).
A further challenge is a result of the changes to funding policy in relation to HE. The
Higher Education Funding Council for England (HEFCE) distributes billions to HE
institutions each academic year; for example, £4 billion was distributed to universities and
colleges in 2015/2016 (HEFCE, 2015). The fund is calculated based on where and what
subjects students study. According to this report, the largest sums are allocated to research,
and due to the limited funds, these are provided to institutions where research quality is
highest. The second largest funding is allocated to teaching so as to ensure availability of
high quality education (HEFCE, 2015). While the government suggests that increasing
competition between universities will drive improvement in the service quality offered,
Brown (2015) argues that there will be an increase in marketisation. In effect, this will turn
“higher education into an economic good” conflicting with a fundamental tenet of HE
which is to offer “intellectual (and moral) development of the individual” (Brown, 2015; p.
7).
Additionally, league tables also pose a challenge for universities. Since their introduction
in the early 1990's, they have been used to provide information regarding universities’
overall performance to different stakeholders groups (potential, current and past students in

3
addition to their parents, and staff) (Jobbins, Kingston, Nunes, & Polding, 2008). League
tables are fed by various sources to provide their ranking data: The National Student
Survey (NSS), Quality Assurance Agency (QAA), and the Higher Education Funding
Council for England (HEFC) (Chapter 3). Research has suggested that league table ranking
do not reflect the education quality offered by a university (Dill & Soo, 2005; Soo, 2013).
That said, league tables still play a large part in students application decisions (Broecke,
2012; Gibbons, Neumayer, & Perkins, 2013). League tables will be further discussed in
section 3.2.
The possibility of a tuition fees increase, competition for both funds and students, in
addition to league tables suggests the need for high level of service quality to be offered so
as to be able to compete and attract high quality domestic and international students. Alves
& Raposo (2010) suggest that high levels of competition between universities can result in
movement of academic staff to other organisations; this could result in some universities
suffer from shortage of staff and in consequence losing an increasingly larger part of their
competitive advantage. That said, this competition is not unique to UK universities, with
the UniversitiesUK (2014c) report suggesting that the UK is second to the United States in
ranking of perceived quality of education. This aligns with the research of Slade, Harker &
Harker (2000) (cited in O’Neill & Palmer, 2004) who argue how the service sector needs
to ensure quality to positively drive their competitiveness within the market.
1.1.3 Current research
The challenges that face the HE sector mean that:
“… universities are forced to establish and improve their relationships with new
and existing stakeholders…” (Schüller, Chlebovský, Doubravský, & Chalupský,
2014; p.75).
This suggests that universities should be more concerned with stakeholders satisfaction.
The current research is concerned with two categories of HE stakeholder: Post Graduate
(PG) taught students and academic staff in a UK Business school.
There has been little research into these two stakeholder groups:
The Higher Education Commission report indicates that there is limited knowledge
about postgraduate provision in comparison to undergraduate (Higher Education
Commission, 2012). Additionally, the UK is considered as a destination for

4
postgraduate studies more so than undergraduate studies for international students
(UniversitiesUK, 2014c). These students formed more than 50% of the
postgraduates studying in the UK in 2012/2013.
Research by Sabharwal & Corley (2009) suggests that scholars have focused on the
industrial context, with little research examining academic staff job satisfaction.
A review of previous research showed a lack of literature covering the relation between PG
students' satisfaction and academic staff satisfaction. To be further discussed in chapter
two, researches such as Bhaskar & Khera (2013) and Jeon & Choi (2012) examined the
relation between employee and customers satisfaction in the commercial environment.
However, this research thesis adopts an opposing perspective for studying this relationship
following the work of Frey, Bayón, & Totzek (2013), who researched the relation between
customer satisfaction and its impact on employees satisfaction in professional services
companies. This is further explained and justified in chapter two.
The following section will highlight some key concepts and theories that will be used
within this research, such as:
Service quality and management commitment to quality
Balance Theory
Students satisfaction
Academic staff satisfaction.
These concepts and theories will be explained in greater detail as part of chapter two.
1.1.3.1 Service quality and management commitment to quality
Service quality has been defined as the difference between the expected and perceived
quality, leading to satisfaction if the perceived is greater than the expected (Parasuraman,
Zeithaml, & Berry, 1985). It has been also defined as:
“Providing something intangible in a way that pleases the consumer” (Brysland &
Curry, 2001: p. 391).
In consequence, service quality reflects characteristics and features of a service that
support its ability to satisfy customers implied or stated needs (Sultan & Wong, 2012).
In 2005, Russell’s research indicated that service quality has been identified as one of the
factors that attracts international students. This was further supported by Munteanu,
Ceobanu, Bobâlca, & Anton (2010) who argued that in an HE context it is important to

5
identify service quality dimensions and their affects on customers satisfaction, because
satisfied customers are more likely to maintain a relationship with that provider.
Furthermore, they may recommend a service and attract further prospective customers
(Munteanu et al., 2010; Voss, Gruber, & Szmigin, 2007). Moreover, it has been suggested
that in the context of HE, service quality is a critical determinant of perceived satisfaction
(Carlson & O’Cass, 2010; Sumaedi, Bakit, & Metasari, 2011).
High levels of competition in the HE sector have been discussed for many years by
academics such as Abdullah (2006) and O’Neill & Palmer (2004). These researches have
highlighted a trend of educational institutions being driven towards commercial
competition, particularly evidenced in the UK with the introduction and increases in tuition
fees. Consequentially, institutions are required to go through extensive student research
identifying factors that affect student evaluation of services provided (Abdullah, 2006;
O’Neill & Palmer, 2004). This aligns with recent research by Sultan & Wong (2013)
comparing public sector HE with the commercial private sector. They find that service
quality is relatively new in the HE sector and most adopted models originated in the
“business sector” (p. 72).
One of the ways that maintains quality culture in an organisation is a continuous
commitment to quality by management. As a part of the quality system provided by
organisations, management commitment to quality has been defined as effective
management desire to improve unit service quality (Hartline & Ferrell, 1996).
Additionally, in the business sector management commitment to quality has been defined
as:
“Employees’ appraisal of an organization’s commitment to nurture, develop,
support, and reward its employees to achieve service excellence” (Babakus, Yavas,
Karatepe, & Avci, 2003; p. 275).
Management commitment to quality has been demonstrated in various ways. According to
Sakthivel (2007), when management are committed to quality, “adequate resources will be
allocated to quality improvement efforts” (p. 260). In relation to this:
Infrastructure facilities.
Learning environment - for example in HE sector this would include university
buildings, lecture rooms and social spaces
Learning support facilities - for example in HE sector this would include students
services, computing facilities, libraries, and student accommodation
6
Were considered as indicators of management commitment to quality (Ardi, Hidayatno, &
Yuri M. Zagloel, 2012; Sakthivel, 2007).
Furthermore, Ardi et al. (2012) argued that strong management commitment to quality
would result in an organisational culture with high commitment to quality by all staff.
Management commitment to quality has also been linked to customer satisfaction
(Malhotra & Mukherjee, 2004), employees' satisfaction (Azadehdel, Chegini, & Delshad,
2013; Cheung & To, 2010), work attitude (H. J. Kim, Tavitiyaman, & Kim, 2009) and
organisational effectiveness (Babakus et al., 2003).
Therefore, management commitment to quality has been included in the conceptual
framework for the current study (section 2.4). It will be used in conjunction with balance
theory to explore the research aim as discussed in the following sub-section.
1.1.3.2 Balance Theory
Balance Theory is a cognitive consistency theory that explains human attitude to others. As
mentioned in the previous sub-section, in order to explore the research aim, management
commitment to quality will be used as a proxy through applying the Balance Theory.
Balance Theory (Heider, 1946) is concerned with how an individuals’ mind views relations
and attitudes towards people and objects (Bohner & Wänke, 2002; Eagly & Chaiken, 1993;
Heider, 1946; Singh, 2015). Balance Theory has been used to explore the relation between
staff satisfaction and customer satisfaction in commercial organisations (Frey et al., 2013).
Frey et al. (2013) argued that satisfied customers have made a positive impact on staff
satisfaction. This study has been a key motivator for the current work, which aims to
explore the same relation in the HE sector examining the link between PG student
satisfaction and academic staff satisfaction.
Balance Theory is based on a model consisting of three elements (Oskamp & Schultz,
2005):
1. The perceiver (P)
2. Another person (O)
3. And a person, an idea or an object (X)
Within Balance Theory there is a relationship between each two elements, which is either
an attitude (sentiment relation) or a unit relationship (belonging relation). According to
Heider (1946), people strive to find equilibrium in their life, because the lack of this

7
equilibrium leads to an unbalanced and unpleasant state in which people try to find and
restore their equilibrium (Bohner & Wänke, 2002). This means that if there is a positive
relation between P and O and a positive relation between P and X, there will be a positive
relation between O and X. This theory will be justified and explained in more details in the
literature review chapter found in section 2.3.2.
1.1.3.3 Students satisfaction
As mentioned in section 1.1.3.1, service quality is linked to satisfaction. The current
research is concerned with the relation between PG student satisfaction and academic staff
satisfaction. This section will briefly consider students' satisfaction and the following
section will look at staff satisfaction.
Students satisfaction has been defined as a short-term situation that results from evaluating
students educational experience, whereby students are satisfied when received performance
meets or exceeds their expectations (Elliott & Healy, 2001). In 2010, Alves & Raposo,
indicated that perceived quality plays a role in affecting students satisfaction. This
highlights that quality as a concept is subjective by nature and is informed mainly by past
experience and communication of individuals making the judgement. This aligns with
Coskun (2014) research that found that student satisfaction is proportional to student
educational and experience perceived value. Equally, information gathered by students in
relation to an institution before enrolment, either directly or indirectly, has a role in
students perception and satisfaction (Devlin, Gwynne, & Ennew, 2002; O’Neill & Palmer,
2004; Zeithaml, Berry, & Parasuraman, 1993). Thus, the implication is that activities
engaged in by universities improve their image in the student mind and in effect attract
new students – this can be done through open days, electronic communications as well as
past student reviews and opinions, which now are widely available online on third party
website forming part of the view of the reputation for a HE institution (Sultan & Wong,
2013).
Customer satisfaction is an important topic in marketing literature. That said, it cannot be
applied to HE without taking into account the debate about whether students can be
perceived as customers. Finney & Finney (2010) have stated that treating students as
customers might decrease student responsibility and “subverts academic rigor to students”
(p. 277). Comparatively, researchers such as DeShields Jr, Kara, & Kaynak (2005) and
Durkin, Filbey, & McCartan-Quinn (2014) have argued that students should be considered
as customers. Section 2.2.1 expands and discusses the literature in relation to this debate.

8
1.1.3.4 Academic staff satisfaction
Job satisfaction remains a complex area, reflecting personal beliefs and feelings towards
employment (Aziri, 2011). Job satisfaction is an integral aspect, especially for academic
staff (Ololube, 2006). Nonetheless, the majority of scholars have focused on industrial
contexts, with minimal research focusing on academic staff job satisfaction (Sabharwal &
Corley, 2009). Furthermore, only a limited number of studies have investigated the
relationship between customers satisfaction and staff satisfaction (Frey et al., 2013).
Noordin & Jusoff (2009) indicated that job satisfaction amongst academics is very
important for effective academic institutions. This view was supported by Machado,
Soares, Brites, Ferreira, & Gouveia (2011) who find that satisfaction and motivation are
essential for both excellence in academic performance and maintaining quality in HE.
Different theories have been used to explain job satisfaction. Mullins (2005) has classified
theories into two main categories.
1. Content theories - where researchers attempt to explain factors that motivate
individuals, which emphasise the nature of requirements and motivation (i.e.
through the theories of Maslow and Herzberg's Motivation-Hygiene Theory).
2. Process theories – where researchers try to find a correlation between variables that
affect individual motivation. These describe “the actual process of motivation” (p.
260) through examples such as found in Expectancy Theory.
In this research one aspect of Herzberg's Motivation-Hygiene Theory will be used within
the conceptual framework; this is perceived appreciation. Herzberg found that job
satisfaction is not the opposite of job dissatisfaction. He argued that factors that lead to
satisfaction are contrasting to those that lead to dissatisfaction (Daft & Marcic, 2008;
Herzberg, 1989; Mullins, 2005). His conclusion was that satisfaction factors (motivators)
are related to the job itself, whilst the factors that influence job dissatisfaction (hygiene)
are extrinsic to the job (Herzberg, 1989). For him, perceived appreciation, is one of the
motivators.
Herzberg's Motivation-Hygiene Theory has been tested in different settings and sectors
such as hospitality and tourism (Lundberg, Gudmundson, & Andersson, 2009), the
healthcare sector (Kacel, Miller, & Norris, 2005), as well as the Higher Education sector
(DeShields Jr et al., 2005). Owens (2001) states that it has been researched and argued

9
extensively more than any other Theory that deals with motivation at work. The theories in
relation to job satisfaction will be justified and discussed further in section 2.2.4.
1.2 Research rationale
Consideration of the above and a review of current literature has identified the following
two gaps in literature with a rationale summarised as follows:
PG student satisfaction linked to academic staff satisfaction
As discussed, there is little literature exploring the relation between PG students
satisfaction and academic staff satisfaction. Research (Bhaskar & Khera, 2013; Jeon &
Choi, 2012; Wangenheim, Evanschitzky, & Wunderlichc, 2007) has investigated the
relationship between employee satisfaction and customer satisfaction in commercial
environment, while Frey et al., (2013) researched the relation between customer
satisfaction and its impact on employees satisfaction in professional services companies.
The current research provides insight and knowledge of how:
- The harmonisation of the various academic degrees may lead to students and
academic staff moving to different universities, effecting less competitive
universities through loss of both their human capital (academics) and students
(Alves & Raposo, 2010).
- PG degrees are becoming more important than in previous years as a route to
success in industry. The Higher Education Commission report (2012) states that
there is a need to improve the understanding of PG student satisfaction because of
the limited knowledge that exists in comparison to undergraduate provision.
Marketisation affect on PG students perception
Saunders (2014) and Vuori (2013) have found there is a lack of recent empirical studies
investigating PG student perception of being HE customers.
Additionally, student fees face global price competition across UK HE. In order to attract
more students and have international market penetration, universities need to provide better
quality care and services (Binsardi & Ekwulugo, 2003). Furthermore, Thompson &
Bekhradnia (2010) suggest that funds will follow students motivating universities to
improve teaching quality. Whilst government argues increased competition between

10
universities will drive improved service quality, Brown (2015) makes the point that
competition will increase marketisation.
These two areas highlight the need to study PG student satisfaction, academic staff
satisfaction and the impact of marketisation at SBS. As a relatively new UK business
school, over the last four years it has transformed its postgraduate teaching and learning
approach to innovative block delivery practice. This move was primarily driven to respond
to the market need and to offer a competitive advantage of six student intakes per year as
well as learning. Section 3.4.1 will discuss the SBS context further. That said, the level of
marketisation of SBS is sector leading and the school was awarded the THE business
school of the year 2014 recognising their advancement in the postgraduate offerings.
1.3 Research aim
The rationale and the research contextualised through SBS have informed the aim: to
explore the relation between both postgraduate student satisfaction and academic
staff satisfaction within a marketised UK HE institution.
1.4 Research questions
The research aim will be achieved through answering the following questions:
How can PG student satisfaction be linked to academic staff satisfaction and
explored in relation to Herzberg's Motivation-Hygiene Theory and the Balance
Theory?
How does the marketisation affect PG student perceptions of HE?
1.5 Conceptual framework
There is scant literature covering the relation between customers and employee satisfaction
(Frey et al., 2013). Additionally, previous researches such as those of Bhaskar & Khera
(2013), Jeon & Choi (2012) and Wangenheim et al., (2007) have focussed inversely on the
investigation of the relationship between employee and customer satisfaction. Moreover,
there is a debate on whether we should consider students as customers or not.
Consequently, to explore the relation between PG student satisfaction and academic staff
satisfaction, the current study considers two theories: Balance Theory and Herzberg's
11
Motivation-Hygiene Theory (with one aspect used that being perceived appreciation). This
is further discussed in the following literature review chapter.
As discussed above, researches by Azadehdel et al., (2013) and Cheung & To (2010)
concluded that management commitment to service quality affects employees satisfaction,
and in turn customers satisfaction. This research assumes that there are positive relation
between P and O and a positive relation between P and X and in effect there should be a
positive relation between O and X. Through this the conceptual framework for the current
study is constructed:
P – Management through their commitment to quality
O – Students satisfaction
X – Academic staff satisfaction
Balance Theory indicates if there is a positive relation between management commitment
(P) to quality, students satisfaction at SBS (O) and academic staff satisfaction (X), and in
effect a positive relation might exist between students satisfaction (O) and academic staff
satisfaction (X), which forms the initial part of the conceptual framework. Thus, this will
explore how PG students and academic staff perceive management commitment to quality
and if this has an effect on their satisfaction. This forms the upper section of the conceptual
framework illustrated in Figure 1.1 with dotted arrows.
In contrast, research by Söderlund, (1998) and Tohidinia & Haghighi (2011) linked
satisfaction to positive feedback. That said, in the case of Herzberg (1989) job satisfaction
is affected by recognition (perceived appreciation). Through this, examination will be
made of how PG student satisfaction may lead to positive or negative feedback and how
this feedback affects academic staff satisfaction. This form the lower part of the conceptual
framework illustrated in Figure 1.1 with red arrows.
The conceptual framework will be discussed in detail in section 2.4 following the literature
review in relation to satisfaction, service quality and cognitive consistency theories.

12
Perceived
Appreciation
Student
Satisfaction (O)
Staff Satisfaction
(X)
Management
Commitment to
Quality (P)
Figure 1.1: Conceptual framework
Adapted from Frey et al., (2013), “How Customer Satisfaction Affects Employee
Satisfaction and Retention in a Professional Services Context”. Original work
modifications are italicised.
1.6 Originality and contribution to knowledge and practice
By responding to the questions this research expects to contribute to knowledge and
practice of the research that is:
Academic
The existence of a relation between PG student satisfaction and academic staff satisfaction
is considered the primary contribution of this research.
Along this primary contribution, there are subsidiary ones:
- It will contribute to the literature in relation to balance theory as discussed in
section 2.3.2.
- It will use a qualitative approach along with Critical Incident Technique (CIT) to
help the school to identify the quality dimensions that affect PG student and
academic staff satisfaction.
- The current research uses Herzberg's Motivation-Hygiene Theory (explained
further in the literature review chapter, section 2.2.4) in a new scenario. A rich
insight into the area of PG student feedback and its effect on academic staff
satisfaction within the HE context will be created.

13
- The current research will explore how marketisation affects PG student perception
of HE
Methodological
The current research makes a methodological contribution through its use of a qualitative
approach and the data that is collected using interviews, CIT and dyadic data sampling.
This method will provide a rich understanding of the relationship between quality factors
from student and staff perspectives.
Practical
- Based on this researches findings PG student satisfaction affects academic staff
satisfaction. This suggests that the investing into student satisfaction may have
value in increasing and enhancing both student and academic staff satisfaction.
- This research explores how PG students consider themselves as customer of UK
HE institutions, in that they pay tuition fees and in effect expect the service
qualities that they were promised on the school website and through open days. The
research findings suggest the benefits of school management reflecting student
feedback in their policies and presenting this to students and continually
emphasising the feedback channels available for student use.
Contributions of this research are further discussed in detail in sections: 7.1, 7.2 and 7.3.
1.7 Thesis structure
The current thesis is made up of seven chapters and is organised as below:
Chapter One: Introduction
This chapter introduces the research background and significance. It also states the
research aim and questions, and expected contributions to knowledge and practice.
Chapter Two: Literature Review
This chapter covers the literature related to four main areas:
1. Service quality
2. Satisfaction theories
3. Marketisation of universities
4. Cognitive consistency theories.

14
It also examines in detail the conceptual framework.
Chapter Three: Research Context
This chapter provides an overview of UK HE, institution classification including league
tables and adopted quality systems. Finally, it provides context through the case of the
Salford Business School (SBS).
Chapter Four: Research Methodology
This chapter discusses the research methodology, including philosophy, paradigm, strategy
and data collection. It provides a rationale and justification for the choice of an interpretive
paradigm and the case study strategy. Furthermore, it also explains in detail the data
collection tools and techniques of analysis used.
Chapter Five: Data Analysis and Research Findings
This chapter presents analysis of interviews conducted with PG students and academic
staff at SBS.
Chapter Six: Discussion
This chapter discusses the findings compared to the literature review; through this the two
main research questions are examined in relation to both the primary and secondary data.
Chapter Seven: Conclusion, Contribution and Recommendations
This final chapter presents conclusions, knowledge contribution and practical contribution.
It will lay out recommendations and examine the limitations of the current research, while
suggesting directions for future studies in this area.

15
Literature review
Service quality Satisfaction MarketisationCognitive
consistency theories
Chapter Two: Literature Review
As discussed in the previous chapter, the current research aims to explore the relation
between postgraduate student satisfaction and academic staff at SBS. This chapter outlines
existing work in the two themes defined in chapter 1, and is divided into five sections
(Figure 2.1). The initial section, 2.1, of the literature review will cover service quality, with
emphasis on the HE sector. Satisfaction in general with a special focus on student and
employee satisfaction will be covered in section 2.2 where discussion of the relation
between service quality and satisfaction will also be found, as these two issues are
regularly discussed together. Section 2.3 will cover HE marketisation and the debate
between scholars as to whether students should be considered HE customers. Cognitive
consistency theories, including Cognitive Dissonance Theory and Balance Theory will be
discussed in section 2.4. In section 2.5 the final section of this chapter an explanation of
the conceptual framework for the research that combines both Balance Theory and
Herzberg's Motivation-Hygiene Theory will be found.
Figure 2. 1: Sections diagram for chapter two
2.1 Service quality
This section covers service quality in four main areas:
Service quality
Service quality in higher education
Measurements of service quality
Management commitment to service quality.

16
2.1.1 Service quality
It has been said that “quality is in the eyes of the beholder” (Peters, 1999; p. 6), which
means that quality is defined by the customer. Peters also described quality as a “magic
bullet” (p. 7), providing:
Better products.
Higher customer service.
Lower costs.
Higher margins.
There have been various definitions for service quality in academic literature and it has
been challenging to reach a definitive definition (Brysland & Curry, 2001). Parasuraman et
al., (1985) defined service quality as the difference between expected and perceived
quality, which leads to satisfaction if the perceived is greater than the expected. A further
definition was provided by Parasuraman, Zeithaml, & Berry (1988), who found that
service quality is an attitude or global judgement related to the overall excellence of
service. Gronroos (1990) added that it is a subjective process relative to the client.
In 2001, service quality was defined by Brysland & Curry as:
“Providing something intangible in a way that pleases the consumer and that
preferably gives some value to that consumer” (p. 391).
Sultan & Wong (2014) affirmed that service quality is:
“A set of market driven and dominant features of an offered service that have a
long-term performance effect on sustained provider–customer relationship” (p.
490).
In 1985, Parasuraman et al. defined the concept of service quality through three themes:
1. Service quality is very difficult to be evaluated by the consumer in comparison to the
quality of goods.
2. Service quality perception is a result of comparison between consumer expectations
and the actual service delivery.
3. Evaluation of service quality includes both the outcome and the process of service
delivery.
17
In literature, service quality has been linked to customer satisfaction, customer loyalty, and
customer retention (Caruana, 2002; Venetis & Ghauri, 2004). This aligns to the Theory of
Parasuraman et al. (1985) that emphasises that excellent service provision drives success
and failure of organisations. Similarly, Ladhari (2009) mentioned that service quality has
been recognised as an important success factor for companies that differentiates them from
their competitors. In consequence, if service sector businesses such as HE view the
importance of quality in creation of a positive contribution to their competitive advantage,
then the provision of outstanding service quality should be thought of as majorly
significant (Slade at al., 2000 cited in O’Neill & Palmer, 2004). Indeed, this is evidenced
through negative ‘word-of-mouth’, which can affect organisational efforts to attract new
customers, as people tend to discuss poor service experiences rather than positive ones
(Smith, Smith, & Clarke, 2007).
In order to increase understanding of service quality, scholars (Gronroos, 2000; Lewis,
2007; Lovelock & Gummesson, 2004; Zeithaml, Parasuraman, & Berry, 1985) have set a
list of unique service quality characteristics and dimensions as discussed below.
Characteristics and dimensions of service quality
The service quality characteristics of intangibility, heterogeneity, inseparability and
perishability help provide an understanding of the service quality (Zeithaml et al., 1985).
However, service quality cannot be measured objectively through these specific
characteristics (Patterson and Johnson, 1993 cited in Gruber et al., 2010).
i. Intangibility
Intangibility refers to the concept that most services cannot be measured, tested, counted
and verified in advance, as contrary to physical goods. Therefore, it can be difficult to
predict consumer evaluation and perception of a service. In general, minimal or no tangible
evidence exists once the service is performed (Foster, 2012; Lewis, 2007). Furthermore,
Schneider & White (2004) found that because of service intangibility, services often yield
psychological experiences rather than physical tangible product.
ii. Heterogeneity
Heterogeneity means that consistency of the service is challenging, difficult to standardise,
and varies depending on the supplier and customer. Consequentially, consistency of quality
is difficult to be achieved in labour-intensive services. This may lead the organisation to
deliver a service that is completely different to that intended (Foster, 2012; Lewis, 2007;
18
O’Brien & Deans, 1996). According to Lovelock & Gummesson (2004), it is difficult to
control service quality when customers become involved in the processes of production
(Eiglier and Langeard (1975, 1977) cited in Lovelock & Gummesson, 2004).
In addition, Ghobadian, Speller, & Jones (1994) identified some factors that can affect the
heterogeneity of a service, such as:
The delivery of a service including service provider behaviour
Customer provision of accurate information and articulation of their needs
Consumer priorities and expectations that can vary each time a service is used.
Zeithaml, Bitner, & Gremler (2009) find also that heterogeneity applies to the time the
individual spends consuming the service which challenges the concept that services are
short-lived experiences.
iii. Inseparability
Inseparability means that quality occurs during the delivery process through interaction
between the client and the contact person of the service providing organisation forming an
integral part of service delivery process (Lewis, 2007). Thus, a service is produced and
consumed simultaneously. This makes the service process, as well as the contact person,
integral to service quality (Foster, 2012). In some situations where there is a high level of
customer involvement, there is little or no managerial control of the quality of service
(Parasuraman et al., 1985).
iv. Perishability
Perishability means that services are consumed once produced and cannot be stored. This
means that service companies need to develop systems to control supply and demand (Hill,
1995; Lewis, 2007; Lovelock & Gummesson, 2004). Consequently, as it cannot be stored
it is more challenging to balance demand and supply. Perishability is a major concern for
producers especially when they cannot meet the consumer demand (Hartman & Lindgren,
1993).
In addition to those characteristics, Gronroos (1982) defined two dimensions of service
quality (Gronroos, 1982 cited in Sánchez Pérez, Carlos Gázquez Abad, María Marín
Carrillo, & Sánchez Fernández, 2007):
Technical quality - an indication of what the customer receives

19
Functional quality - how the customer receives the service
Furthermore, in 2000, Gronroos highlighted seven dimensions of good perceived service
quality:
Professionalism and skills: employees, service provider, physical resources, in
addition to the required skills and knowledge that are used in order to solve
customer issues professionally.
Accessibility and flexibility: provision of easy access to a service and its provider
through their location and operating hours, which are prepared in a flexible way in
order to address customer requirements.
Attitudes and behaviour: how contact persons (service employees) interact with
customers and help them in solving their problems in a friendly manner.
Reliability and trustworthiness: customer dependence on the service provider to
perform and to keep promises, in the knowledge that customer best interest is
central to the organisation.
Service recovery: at any time during which something unpredictable occurs or
something goes wrong, the service provider will take an immediate and active
response to find an acceptable and a new solution.
Serviscape: the physical surrounding in addition to aspects of the service
environment that help and support a positive experience throughout the service
process.
Reputation and credibility: trust for the service provider to provide sufficient
value for money representing value and good execution to the customer.
These seven dimensions will be used in the discussion chapter to reflect on the current
research findings.
2.1.2 Service quality in Higher Education
As discussed above, service quality is important in creating a positive contribution to
service provider competitive position. This also applies to HE sector service provision.
Moreover, extensive competition in the field of HE and the fact that educational
institutions have been driven towards commercial competition, means that institutions need
to go through extensive student research to identify the factors that affect student
evaluation of the service provided by a university (Abdullah, 2006; O’Neill & Palmer,
2004).

20
Despite this Chong & Ahmed (2015) have stated that the service quality definition varies
amongst individuals. Sahney, Banwet, & Karunes (2004) argued that quality in HE may
align with the general definitions of quality, such as meeting or exceeding customer
expectations of education, or excellence in education. In the HE sector, in which students
are customers and universities are suppliers an agreement to meet expectations, needs and
requirements of customers is a mutual decision and referred to as quality and quality
management (Lewis, 1993 cited in Jackson, Helms, & Ahmadi, 2011).
Understanding the concept of quality in education and developing strategies to achieve this
is imperative to the continual improvement of HE institutions. In 2001, Gold found that
quality issues should be a main concern for all university employees: front line contact
staff; academic and administrative staff; as well as non-contact staff in administrative or
management positions (Gold, 2001 cited in Devinder & Datta, 2003). Joseph & Joseph
(1997) and Zineldin, Akdag, & Vasicheva (2011) argued that quality concepts for students
cover a broad range of issues, including excellent academic facilities, as well as an
appealing campus. This was supported by Munteanu et al. (2010), who argued that in a HE
context it is very important to identify the service quality dimensions and how they
subsequently affect customer satisfaction, as satisfied customers are more likely to retain a
relationship with a service provider. Likewise, they may recommend a service and attract
prospective customers.
Furthermore, in the context of HE, Petruzzellis et al. (2006) stressed the importance of
continuous evaluation of performance of service quality and resources provided.
According to O’Neill (2003):
“existing measurement methodologies may be flawed due to their ignorance of the
time effect on students’ perceptions” (p. 320).
This is supported by Douglas, Douglas, & Barnes (2006), who found that between pre-
decision and experience, students shift their focus from the tangible to teaching quality.
This suggests that there is an importance in measuring and assessing the service quality
provided by comparison between expected and provided quality and examining to what
extent this provided quality satisfies stakeholders. The following sub section will provide
an overview of service quality measurement.

21
2.1.3 Service quality measurement
Measurement of service quality is often complicated as it requires measuring the intangible
(Webster & Hung, 1994). Moreover, due to the varied nature of HE customers (students,
faculty staff, employers, government and society), it is very difficult to have a definition
for service quality that meets all stakeholder expectations. This aligns with Zeithaml et al.
(2009) who suggested that customers do not look at service quality in a one-dimensional
manner, instead judging quality based on multiple dimensions that are relevant to the
context. Overall, through reviewing the literature, two models have dominated the field of
service quality measurement: SERVQUAL and SERVPERF (Arokiasamy & Abdullah,
2012).
2.1.3.1 SERVQUAL
This is a multiple item scale proposed by Parasuraman et al. (1985, 1988) for measuring
service quality. The scale design was based on the data collected by Parasuraman et al.
(1985), through interviews carried out with data subjects from four service categories:
Credit card service
Security brokerage
Retail banking
Product repair and maintenance.
Originally, SERVQUAL assessed service quality through ten dimensions (Parasuraman et
al., 1985), yet, following several revisions the final scale suggested five dimensions:
Tangibles: Equipment, facilities and personnel appearance.
Reliability: The ability to execute the service as promised on time with accuracy
and dependability.
Responsiveness: Willingness to assist clients in an effective way and provide
services promptly.
Assurance: Employee knowledge and courtesy, in addition to their abilities to
inspire confidence and trust.
Empathy: How the organisation provides its clients care and individual attention.
Their survey consisted of two sets of 22 statements, which revealed the gap between
perceptions and expectations of customers towards service quality. The first set determined
the customer expectations towards the service organisation, while the second set aimed to

22
discover customer perception of organisational performance (Gregorio & Cronemyr,
2011). In 2001, Brysland & Curry underlined some of the aims of the SERVQUAL model
in order to determine customer service levels, such as:
Continuous examination of customer perception and expectation overtime allow the
organisation to reflect and self-analyse as a part of their monitoring process
Determination of the starting point and the priorities for service improvement
activities.
Prioritisation of service quality dimensions according to customer needs help from
the organisation set action plans and allocate resources.
Determining the impact of improvements that have taken place based on customer
expectations and priorities.
In common with many measurement scales, SERVQUAL has been criticised by different
researchers. In 1990, Carman stated that SERVQUAL would require redefinition and
customisation to specific services. Furthermore, in 1992, Cronin & Taylor suggested that
SERVPERF (performance based scale) is more efficient, in comparison with SERVQUAL,
in relation to the measurement of service quality; this idea was rejected by Parasuraman,
Zeithaml, & Berry (1994). In Buttle’s 1996 research criticism of SERVQUAL was split
into two categories:
a) Theoretical criticism:
- There is minimal evidence that the consumer evaluates service quality based
on perception and expectation.
- Focussed on service delivery processes not outcomes.
- Demonstrating a high level of inter-correlation between the five dimensions
and that these dimensions used are not universal.
b) Operational criticism:
- In order to evaluate the service quality customers use standards instead of
expectations; “SERVQUAL fails to measure absolute SQ expectations” (p.
11).
- Four or five items are not sufficient to determine inconsistency within each
service dimension.
- Reversed scale polarity of items causes error.
- The seven point Likert scale is faulty.

23
The SERVQUAL model was criticised by Sureshchandar, Rajendran, & Anantharaman
(2002) because the majority of items focussed on human interaction and intervention in
service delivery. In addition to service tangibles features such as design, appearance of
equipment, the way staff dress and decor. The authors argued that the model missed some
important aspects such as the core service and standardisation of service delivery.
Despite criticism, Yeo (2008) supported the use of SERVQUAL in the education sector, as
it covers the whole experience rather than just teaching. He also suggested that it can be
used in a qualitative sense in cases of exploratory research. In 2008, Zafiropoulos & Vrana
stated that SERVQUAL is an appropriate measure for service quality in HE, having been
implemented widely in different industries such as: educational institutions, library
services, banking, fast food and others. These researches were conducted in different
countries such as: the UK, the United States, Australia, the Netherlands, China, Malaysia,
Cyprus, Korea, Hong Kong, as well as South Africa (Ladhari, 2009). This model
incorporates the entire personal experience, examining the gap between expected service
and perceived service.
According to Parasuraman et al. (1988) SERVQUAL:
“Provides a basic skeleton ... the skeleton, when necessary, can be adapted or
supplemented to fit the characteristics or specific research needs of a particular
organization” (p. 30).
2.1.3.2 SERVPERF
This model was developed in 1992 by Cronin and Taylor in response to SERVQUAL
criticism. This model kept the five quality dimensions and eliminated the expected items
(reducing items by 50%). Nonetheless, it was criticised for the methodology used and the
interpretation of findings (Parasuraman et al., 1994). Moreover, Parasuraman et al. (1994)
stated that the concerns raised by Cronin & Taylor were based on misinterpretation of the
original works conducted in 1985 and 1988. In more recent times, Carrillat, Jaramillo, &
Mulki (2007) conducted an investigation into the differences between SERVQUAL and
SERVPERF validity, with research results suggesting that both models are equally valid
and the choice to use either scale depends on the purpose of the research.

24
Current research
Based on O’Neill (2003) findings that current measurement tools may be faulty and also
because part of the research assesses service quality from student and staff points of view,
it was appropriate to use semi-structured in-depth interviews. These interviews provide
both students and staff with the opportunity to evaluate service quality based on their needs
and experience.
One way to maintain quality culture in an organisation is continuous commitment to
quality by management. The following section will review management commitment to
quality literature that will be used in conceptual framework (section 2.4).
2.1.4 Management commitment to service quality
Service quality is strongly related to management practices (Potočnik, Tordera, Martínez-
Tur, Peiró, & Ramos, 2011; Slåtten, 2010). Moreover, service oriented environments
emphasise the importance of commitment to service quality by management to create a
culture for quality service (Schneider et al., 2005).
Management commitment to service quality has been defined as:
“Consciously choosing quality initiatives as operational and strategic operations
for the organization, and engaging in activities such as providing visible quality
leadership and resources for the adoption and implementation of quality
initiatives” (Ahmed and Parasuraman, 1994 cited in Cheung & To, 2010: p. 261).
It was also defined as the effective desire of managers to improve their unit's service
quality (Hartline & Ferrell, 1996). Furthermore, Babakus et al. (2003) referred to
management commitment to quality as employee evaluation of their organisation’s
commitment to support, develop and reward its employees for achievement of service
excellence. This definition is based on Forrester’s argument that the perspective of
employees should be the base for defining this concept (Forrester, 2000 cited in Babakus et
al. 2003).
Management commitment to service quality has been linked to several topics such as:
Employee satisfaction (Azadehdel et al., 2013; Cheung & To, 2010)
Work attitude and organizational effectiveness (Kim et al., 2009)
Affective organizational commitment (Babakus et al., 2003)
25
Customer satisfaction (that can be influenced directly by employee satisfaction)
(Malhotra & Mukherjee, 2004).
Both Babakus et al., (2003) and Kim et al., (2009) indicated that training, empowerment
and rewarding are the best tools demonstrating commitment by management to service
quality:
Training: This improves employee job-related skills and behavioural skills in
dealing with customer needs and circumstance. It also enhances employee
motivation, confidence and knowledge when fulfilling organisational goals.
Furthermore, research has indicated that there are four main steps for the training
process which consists of: evaluation and analysis of training needs, designing
training courses, delivering, and finally evaluating and following up (Bimpitsos &
Petridou, 2012).
Empowerment: This enhances employee ability and motivation to develop, make
quick decisions and take action. Moreover, Forrester (2000) indicated that
empowerment implies more involvement than freedom, responsibility and ability to
make decisions and commitments; instead they are integral to the enacting of
decisions and commitments (Forrester, 2000 cited in Babakus et al., 2003). Rafiq &
Ahmed (1998) found that the more autonomy and empowerment employees
practice in their jobs, the greater job satisfaction they have, and indicated that
empowerment has effects on recruitment, training and labour costs.
Rewarding: These are appropriate payment levels in addition to other rewards. Kim
et al. (2009) mentioned that generally, there are two types of rewards: nonfinancial
and financial. These can vary from “a simple thank you note” to “a large reward
such as wage increase and promotion” (p. 384). However, they stressed that the
reward must be meaningful to the employee, based on their job performance, whilst
simultaneously reflecting organisational objectives.
Kim et al. (2009) and Kim, Leong, & Lee (2005) stated that one indicator of management
commitment to service quality is organisational support which is linked to job satisfaction.
They found that organisational support is defined as the extent to which employees
perceive the organisation provides attention to overall well-being, respect, encouragement
and recognition of employee commitment (Kim et al. 2009).

26
Current research
For this research, management commitment to quality will be defined as the desire of
management to adopt and implement quality from student and academic staff perspectives.
Most related academic literature has measured management commitment to quality
quantitatively (Azadehdel et al., 2013; Babakus et al., 2003; Cheung & To, 2010; Kim et
al., 2009). This research will adopt a qualitative approach (Sureeyatanapas, Yang, &
Bamford, 2015). This is because this research does not aim to measure the degree of
management commitment to quality; instead, it aims to explore and understand the how
school PG students and academic staff define it and to have a full picture of the context.
This will help achieve the research aim.
Service quality has been linked to satisfaction in literature. Therefore, the next section will
cover satisfaction with particular emphasis on the HE sector as well as the relation between
service quality and satisfaction.
2.2 Satisfaction
The word 'satisfaction' is Latin based, from satisfacere, where the term 'Satis' – meaning
'enough' and 'Facere' meaning 'to do'. Thus, in the current meaning this translates as
“fulfilment of one's own expectations” (Oxford Advanced Dictionary). Satisfaction
according to Andreassen & Lindestad (1998) is an established concept in contrasting
disciplines such as consumer research, marketing, economics, welfare-economics and
economic psychology. Consequently, satisfaction is an important area of interest for both
management and academic research.
Scholars have defined satisfaction in various ways, either as a process or a response to an
evaluation process (Giese & Cote, 2000; Parker & Mathews, 2001). Satisfaction as a
process focuses on satisfaction outcomes rather than the satisfaction itself. According to
this approach, customer satisfaction is the evaluation process of what was expected and
what is received from a product or service (Tse & Wilton, 1988). In the same manner,
Equity Theory has been used to explain customer satisfaction (Parker & Mathews, 2001).
Yi (1990) has explained that Equity Theory is the comparison made by individuals
between the input/output ratio with others. In fact, consumers will be satisfied if the
outcome is considered to be fair (Yi 1990, citied in Parker & Mathews 2001). However,
the opposite approach deals with the nature of satisfaction; with this satisfaction is as an
outcome, where the customer deals with satisfaction as the surprise element of

27
consumption experience, or as a customer fulfilment response, or as a state (Parker &
Mathews, 2001). Despite these definitions, satisfaction is generally accepted to be a post-
purchase phenomenon (Giese & Cote, 2000).
This current research will deal with satisfaction as meeting or exceeding individual
(students and academic staff) expectations.
As discussed in chapter one, the current research is contextualised in HE. Therefore,
satisfaction of students and academic staff, as two principle stakeholders, will be discussed
in the following sections.
2.2.1 Students’ satisfaction
Researchers such as Cheong Cheng & Ming Tam (1997) and Coskun (2014) found that to
be recognised as a service providing industry, higher education has to meet the needs and
expectations of its student customers. The overall student experience in higher education is
very important, thus, the term “student experience” is used repetitively in the report of the
Select Committee for Innovation, Universities, Science and Skills (2009), which indicates
that “the experience of the student is at the heart of higher education” (Sabri, 2011, cited in
Grebennikov & Shah, 2013).
Focusing on student satisfaction enables Universities to gauge how effectively they meet or
exceed student needs. Moreover, student satisfaction is considered as an essential element
of HE marketisation (Palmer & Koenig-Lewis, 2011). A further benefit of satisfying
students is that higher customer satisfaction leads to greater customer loyalty, increased
consumption and acquisition of new students (Petruzzellis et al., 2006). This is supported
the research of Elliott & Shin (2002) who found that satisfaction has an important effect on
recruitment, student retention, motivation and fundraising. Alves & Raposo (2010) also
linked satisfaction to positive “word of mouth”.
HE institutions provide teaching as their core service, even though there are several other
services are provided as well, such as advising, counselling and career planning. These
demonstrate that student satisfaction is not purely related to education (Kotler & Fox,
1995). Elliott & Shin (2002) described student satisfaction as a subjective evaluation of the
different outcomes and experiences associated with their education and that it is
continually moulded by their experiences of campus life (Oliver & DeSarbo, 1989 cited in
Elliott & Shin, 2002). Based on this, student overall satisfaction is comprised of their

28
academic, social and physical experiences. That said, Palmer & Koenig-Lewis (2011) have
critisied HE satisfaction measurements as focussing on “Peripheral processes such as
accommodation and catering facilities” (p. 1121) rather than provision of education.
Student satisfaction has been defined as a short-term situation resulting from evaluation of
student educational experiences; students are satisfied when the received performance
meets or exceeds their expectations (Elliott & Healy, 2001). Despite the clarity of this
definition, Richardson (2005) argued that measuring student satisfaction is a complex
process and a multi-dimensional concept. This argument is supported by other scholars
who stress that student satisfaction does not merely depend on education (Elliott & Shin,
2002; Hanaysha, Abdullah, & Warokka, 2011; Kotler & Fox, 1995). Richardson (2005)
found that student feedback is important for prospective students in the selection process
and that tools used by institutions are generally developed ‘in-house’ and may never have
received any form of external sense-checking. He also recommended collecting
questionnaires as soon as possible after the relevant course. Table 2.1 presents some of the
research that defined students' satisfaction.
Author (year) Article title Definition of satisfaction
Elliott & Healy
(2001)
Key factors influencing
student satisfaction related
to recruitment and retention
used Student Satisfaction
Inventory.
Short-term attitude resulting from an
evaluation of a student’s educational
experience.
Student satisfaction results when
actual performance meets or exceeds
the student’s expectations.
Sweeney &
Ingram (2001)
A Comparison of Traditional
and Web-Based Tutorials in
Marketing Education: An
Exploratory Study (year 3
marketing students)
Student satisfaction: perception of
enjoyment and accomplishment
associated with the learning
environment.
Elliott & Shin
(2002)
Student satisfaction: an
alternative approach to
assessing this important
concept
used Student Satisfaction
Inventory
Subjective evaluation of the different
outcomes and experiences associated
with education (Oliver & DeSarbo,
1989 cited in Elliot 2002). It is
continually shaped by the repeated
experiences within campus life.

29
Mai (2005)
A comparative study
between the UK and the
US: The student satisfaction
in higher education and its
influential factors
(undergraduate &
postgraduate students)
Satisfaction is typically measured as
an overall feeling or as satisfaction
with elements of the transaction
(Fornell, 1992)
Petruzzellis,
D’Uggento, &
Romanazzi
(2006)
Student satisfaction and quality
of service in Italian universities
(undergraduate students)
Satisfaction results when student
expectations fit their perceptions of
service quality. If the service offered
is beyond expectations, student will be
very satisfied.
Ware &
Williams
(1975)
Dr Fox Effect (undergraduate
students)
Students are not competent examiners
of quality since they are not always
aware of what they should expect
Table 2. 1: Different definitions of students’ satisfaction adapted from literature.
Scholars considered the information that students receive pre-enrolment to be an important
antecedent for satisfaction. Information that affects the student experience and
consequently satisfaction starts with the information provided through prior experiences
that relate either to the same university, or with similar institutions (Devlin et al., 2002;
O’Neill & Palmer, 2004). Moreover, information students gather about the institution prior
to enrolment, explicit, implicit, direct and indirect has a role in their perception and
satisfaction (Sultan & Wong, 2013; Zeithaml et al., 1993). Therefore, the importance of the
implemented activities by universities, such as open days, career fairs, electronic
communications, as well as similar activities, suggest that universities need these things to
improve their image in student minds (Sultan & Wong, 2013).
Several studies (Arambewela & Hall, 2009; Briggs, 2006; Douglas et al., 2006; Elliott &
Shin, 2002; Grebennikov & Shah, 2012; Gruber et al., 2010; Nair, Bennett, & Shah, 2012;
Shah, Roth, & Nair, 2010; Shah & Widin, 2010) have been conducted to determine the
factors that affect student satisfaction. Factors identified include
Academic reputation
Staff teaching abilities
Learning resources

30
Approachability of teaching staff
Placements
Quality of courses
Class times and locations
Electronic access to library resources
Registration process
Facilities (i.e. libraries, cafeteria and computer labs)
Cleanliness of classrooms
Cleanliness of toilets
Accommodation costs and standards
As many of these studies were conducted using UG students as data subjects, Jancey &
Burns (2013) argue that PG students have different needs.
Appleton-Knapp & Krentler (2006) categorise factors that affect student satisfaction into
two main categories:
Personal factors, which include: gender, age, preferred learning style, and
employment.
Institutional factors, such as: instructor teaching style, quality instruction, feedback
quality, class sizes and the research emphasis of the school.
Oldfield & Baron (2000) found that there were three categories of factors that affect
student satisfaction:
Requisite elements; these factors are essential for students to fulfil their study
requirements and include academic staff understanding of students needs and having
knowledge of their course provision.
Functional element: these factors are desirable elements, but not essential to a
course of study. They include access to IT equipment and granting students
permission to use these at weekends.
Acceptable elements – these factors are of a practical nature, usually related to the
manner students are treated by academic staff. These include academic willingness
to provide students with individual attention, or if the faculty provide a service
within the expected timeframe.

31
Additionally, Bitner and Hubbert (1994) find that customers tend to develop a tolerance in
the case of long-term service relation and do not focus on the negative experience if an
earlier one was positive (Bitner and Hubbert, 1994, cited in Van Doorn, 2008).
A further factor that affected student satisfaction was delivery mode. Davies (2006)
defined block delivery as an intensive teaching model structured into large blocks of time
that facilitates the use of different instructional activities; they are generally entire day
sessions offered in blocks that are delivered in singular, two or three week patterns. This
specific delivery model has been supported by various scholars. Ho & Polonsky (2007) felt
that students did not report any major differences in learning through this delivery style,
and in fact found that students preferred it over more traditional ones. Moreover, Karaksha
et al. (2013) argued that there is an opportunity to improve student performance through
block delivery. An article by McCarthy (2010) suggested that this mode provides students
more time for in-depth understanding, and availability of the material on the Virtual
Learning Environment (VLE) site gives students access to lecture slides, notes and
assessments at any time. Similarly, Ramsay (2011) was also amongst the researchers who
supported intensive teaching believing that it can provide better educational outcomes.
That said, spending long hours in lectures was a noted drawback (Hesterman, 2015)
supported by Young, Robinson, & Alberts (2009) research recommending short breaks,
different presentation and media material usage to maintain students attention.
Additionally, literature has highlighted the effect of international exposure and how it
affects programme quality (Banerjee & Mandal, 2013). It has been also linked to
intellectual development and communication skills (Durkin, McKenna, & Cummins, 2012;
Williams, 2005), but not linked directly to student satisfaction. In continuation of this
theme Gregory (2008) argued that having international students provides a diverse culture
ensuring positive outcome for students. Shaw, Mitchell, & Fabbro (2015) have supported
the idea of having international students in learning groups finding it “broadened the
exposure of domestic students” (p. 127).
Lecturers' competencies and students' satisfaction
In addition to the above discussed factors, various researches over many countries have
examined the important attributes of lecturers that affect student satisfaction has been
carried out. Chireshe's (2011) research revealed that effective lecturers are:
“… well organized, competent, friendly and readily available” (p. 265).

32
The study also set other criteria for effective lecturers, such as:
Being fair in their marking where they highlight the strengths and weakness of
students
Planning of their lectures
Lecture punctuality
Having beneficial knowledge about their subject
Involving students in discussions.
This aligns with the research of Hill, Lomas, & MacGregor (2003), where the quality of
the lecturer was one of four themes indicating quality of education. This is derived from
the lecturers’ delivery to the class, their organisation, knowledge, and the feedback they
give to students, either in class or about assignments. Moreover, Hill et al. (2003) found
that the quality of student educational experience “is influenced by teacher expertise in the
classroom” (p. 19). This is consistent with Kashif & Ting (2014) who concluded that “the
knowledge of the subject along with the experience and expertise” (p. 172) are considered
an essential attribute of a good lecturer. There is agreement by students that an effective
lecturer must be knowledgeable, enthusiastic, approachable, and friendly (Voss et al.,
2007; Voss & Gruber, 2006; Voss, 2014). Voss & Gruber (2006) found also that academic
staff friendliness is associated with “nonverbal signals like open body posture, forward
body lean, and casual smiling” (p. 233) which consequently makes students “feel good” (p.
233).
In 2014, Long, Ibrahim, & Kowang conducted a survey on 260 students. Findings
concluded that 14 lecturer competencies affect student satisfaction. These included clarity
of presentation, knowledge of subject, lecture notes, interaction with students and
clarification of learning outcomes. Moreover, interaction and communication between
lecturer and students were the two main criteria that Northrup (2001) (cited in Long et al.,
2014) felt were essential elements for student learning. This matches the research of
Brophy (2001), who suggested that lecturers perform different tasks in the teaching
process. These include giving feedback on achievements, stimulating students to continue,
supporting students to engage in learning activities and encouraging them to reflect on
content (Brophy, 2001 cited in Long et al. 2014). Heffernan, Morrison, Sweeney, & Jarratt
(2010) also found dynamic delivery, rapport (ability to maintain harmonious relationships),
overall subject knowledge and effective communication skills are perceived by students as
effective lecturer competencies.
33
Most studies agree on the factors that affect student satisfaction, except in relation to
grades. Research by Dong & Lucey (2013) concluded that there is a correlation between
student feedback and assessment performance. These findings agree with Elliott & Healy
(2001) and Umbach & Porter (2002) who see a relationship existing between grades and
satisfaction. Bean and Bradley (1986; cited in Umbach & Porter, 2002), challenged this
finding that there is practically no relation between student satisfaction and grades.
Table 2.2 summarises scholarly studies of service quality factors that consider sources of
student satisfaction. These factors will be discussed further in the discussion chapter
(Chapter 6).

34
Factor Researchers
Academic staff quality: interaction, delivery in the classroom,
feedback during sessions and assignments, understandable,
practical and entertaining.
(Angell, Heffernan, & Megicks, 2008; Arambewela & Hall, 2009;
Coskun, 2014; Hill et al., 2003; Kashif & Ting, 2014; Lazibat, Baković,
& Dužević, 2014; Letcher & Neves, 2010; Northrup, 2002; Stukalina,
2012; Sultan & Wong, 2013; Sumaedi, Bakti, & Metasari, 2012;
Wilkins & Stephens Balakrishnan, 2013; Zineldin et al., 2011)
Access, availability and quality of resources: Library, IT services
(computer facilities), course material, entertainment facilities,
career counseling, transport facilities, dining facilities, access to
workshops, seminars and conferences.
(Arambewela & Hall, 2009; Hanssen & Solvoll, 2015; Hill et al., 2003;
Sherifi, 2015; Sultan & Wong, 2013; Sumaedi et al., 2012; Wilkins &
Stephens Balakrishnan, 2013; Wismantoro, 2014)
Accommodation: Reasonable cost, good standard (Arambewela & Hall, 2009)
Administrative staff: availability, capability, competence, politeness
and attitude of university personnel in delivering their responsibilities
and their willingness to help students, or giving the impression of
being interested in the student; providing support.
(Douglas et al., 2015; Lazibat et al., 2014; Poon & Brownlow, 2015;
Stukalina, 2012; Sultan & Wong, 2013; Sumaedi et al., 2012; Zineldin
et al., 2011)
Approachability, availability, interaction and communication
with the academic staff.
(Arambewela & Hall, 2009; Coskun, 2014; J. A. Douglas et al., 2015;
Heffernan et al., 2010; Y. K. Kim & Sax, 2009; Lazibat et al., 2014;
Northrup, 2002; Stukalina, 2012)
Effective use of technology: lecturing rooms have good audio-
visual facilities, lecturers use technology in their teaching.
(Arambewela & Hall, 2009; Stukalina, 2012; Wilkins & Stephens
Balakrishnan, 2013)
Grades (Gruber et al., 2010; Lazibat et al., 2014; Umbach & Porter, 2002)
Industry link: related to the help students receive in making links (Angell et al., 2008; Letcher & Neves, 2010)

35
with industry.
Institution prestige and reputation (internationally and in home
country).
(Angell et al., 2008; Arambewela & Hall, 2009; Lazibat et al., 2014)
Personal tutors (Braine & Parnell, 2011; J. Douglas et al., 2006; Wilcox, Winn, &
Fyvie‐Gauld, 2005)
Physical aspects of the service, such as: classrooms, buildings
and equipment.
(Alam Malik, Hassan, & Zahid Iqbal, 2012; Gruber et al., 2010; Khan,
Ahmed, & Nawaz, 2011; Lazibat et al., 2014; Oldfield & Baron, 2000;
Robertson et al., 2012; Sumaedi et al., 2012; Zineldin et al., 2011)
Safety and security: the sense of physical security that the
students felt on the university campus.
(Arambewela & Hall, 2009; Zineldin et al., 2011)
Social activities that help students interact, work and build
relationships with other students.
(Arambewela & Hall, 2009; Douglas et al., 2015; Sumaedi et al., 2012)
Social/emotional support and counseling services: student
support unit.
(Arambewela & Hall, 2009; Hill et al., 2003; Lazibat et al., 2014;
Sumaedi et al., 2012)
Student engagement with learning: course curriculum, extra
curriculum activities and assignments relevant to workplace or in
real life situations.
(Douglas et al., 2015; Hill et al., 2003; Letcher & Neves, 2010; Sumaedi
et al., 2012)
Value for money (Angell et al., 2008; Douglas et al., 2015)
Table 2. 2: Service quality factors affecting students' satisfaction

36
2.2.2 Job satisfaction
The nature of this research explores whether a relation exists between student satisfaction
and academic staff satisfaction at SBS, following on from the discussion of student
satisfaction in the previous section; this section will now review the literature related to job
satisfaction in general and then in the HE sector.
In 1969, Locke defined job satisfaction as the:
“Pleasurable emotional state resulting from the appraisal of one's job as achieving
or facilitating one's job values. Job dissatisfaction is the unpleasurable emotional
state resulting from the appraisal of one's job as frustrating or blocking the
attainment of one's values” (Locke, 1969: p. 316).
Furthermore, the research of Cranny, Smith, and Stone (1992) argued that there is an
agreement on job satisfaction definition as:
“An affective (that is, emotional) reaction to one’s job, resulting from the
incumbent’s comparison of actual outcomes with those that are desired (expected,
deserved, and so on.)" (Cranny, Smith, and Stone, 1992 cited in Weiss 2002: p.
174).
Spector (1997) defines job satisfaction simply as the degree to which people like their jobs.
Similarly, Weiss (2002) defines job satisfaction as an attitude; a positive evaluation
decision that people generate in relation to their job or job situation. Furthermore, job
satisfaction or dissatisfaction does not only depend on the nature of the job, but extends to
the individual expectation of what will be offered from the job (Lu, While, & Barriball,
2005).
The effect of job satisfaction on long term growth of global educational organisations
(Ololube, 2006) means that it is necessary to have a deep comprehension of job satisfaction
theories.
Satisfaction Theories
Extensive research, by Lu, While, and Barriball (2005) found that focusing on the feelings
of employees towards their jobs (as in traditional models) is insufficient. They stated that
in addition to the nature of the job defining satisfaction or dissatisfaction, expectations of
the employees were of relevance.
According to Fox (1997) the most valid motivation theories are:

37
Maslow's Hierarchy of Needs
Herzberg's Motivation-Hygiene Theory
Vroom's Expectancy Theory, and McGregor's Theory X and Y.
Mullins book classified theories into two main categories (Mullins, 2005):
Content theories – these demonstrate the attempts of researchers to explain the
factors that motivate individuals. They emphasise the nature of needs and
potential motivations. Examples are the theories of Maslow, Alderfer,
Herzberg, and McClelland.
Process theories - these show researchers’ attempts to find the relation between
variables that affecting individual’s motivation. In these the actual motivational
process is described, for example in the instance, expectancy, equity, goal and
attribution theories.
In this section, the three theories (Maslow's Hierarchy of Needs, Herzberg's Motivation-
Hygiene Theory, and Vroom's Expectancy Theory) that Fox (1997) highlighted and relate
to satisfaction will be reviewed.
- Maslow’s Theory:
Maslow’s Theory presented needs as a hierarchy, where the lower needs have to be
fulfilled before progressing upwards; this made Goodell & Coding (1994) to suggest that
this Theory may be applied to job satisfaction, although it was not considered as Theory of
worker satisfaction. They applied it to work, as employees require sufficient payment and
job security before consideration of higher levels such as personal achievement. Similarly,
Mullins (2005) found that Maslow’s hierarchy has significant impact on motivation and
management approaches, even though it was never intended to be applied to work
situations.
Wahba & Bridwell (1976) explained that the appeal of Maslow’s Theory is that it presents
two theories:
Human Motives basic human needs
Human Motivations - through relating human needs to the general behaviour
According to Maslow’s Theory, there are five desired needs in life (Maslow, 1970):
Physiological needs: food, water, clothing …
Safety and security needs: security, stability, freedom of fear…

38
Belongingness and love needs: friendship, feeling of love, belonging and
acceptance ...
Self-esteem needs: desire for strength and desire for reputation or prestige …
Self-actualisation needs: morality, creativity…
Each level of need has to be fulfilled and satisfied before addressing the subsequent level
of needs.
In their literature review Wahba & Bridwell (1976) found that Maslow’s hierarchy is
partially supported. That said, Mullins (2005) feels the hierarchy is merely a useful base
for motivational evaluation at work. Moreover, he highlights that Steers and Proctor (1991)
listed different organisational factors that are used to satisfy different needs (See Table
2.3).
Needs level General rewards Organizational factors
Physiological Food, water, sex, sleep Pay
Pleasant working conditions
Cafeteria
Safety Safety, security, stability,
protection
Safe working conditions
Company benefits
Job security
Social Love, affection, belongingness Cohesive work group
Friendly supervision
Professional associations
Esteem Self-esteem, self-respect,
prestige, status
Social recognition
Job title
High status job
Feedback from job itself
Self-actualisation Growth, advancement, creativity Challenging job
Opportunity for creativity
Achievement in work
Advancement in the
organization
Table 2. 3: Adapted from Mullins (2005) Applying Maslow’s need hierarchy
Source: Management and organisational behaviour (Mullins, 2005).
- Herzberg's Motivation-Hygiene Theory
Through an initial review of 2000 articles discussing job satisfaction, Herzberg and his
colleagues found factors leading to satisfaction contrast to those leading to job
dissatisfaction (Sachau, 2007). Subsequently, they started to use critical incident method
through interviewing 203 employees, where Herzberg asked them to provide description of
events that made them feel exceptionally good or exceptionally bad (Mullins, 2005).

39
Herzberg suggested that job satisfaction and dissatisfaction are not opposite to each other,
but are actually separate things. So, the opposite of job satisfaction is no job satisfaction
and the same for dissatisfaction (Herzberg, 1989). Based on this, Herzberg argued that the
factors that influence job satisfaction (motivators) contrast the factors that influence job
dissatisfaction (Hygiene) (Daft & Marcic, 2008; Herzberg, 1989; Mullins, 2005).
According to Herzberg, motivational (growth) factors are intrinsically represented by
achievement, responsibility, work itself, as well as recognition of achievement, growth or
advancement (Herzberg, 1989). Those factors affect the feelings of satisfaction or no
satisfaction. That said, Hygiene factors are extrinsic to the job and include:
Organisational policies.
Supervision.
Working conditions.
Salary.
Job security.
Additionally, his research revealed that motivators are the main cause of satisfaction, while
hygiene factors are the principle reason for unhappiness within a job. Figure 2.2 looks at
Herzberg’s Motivation-Hygiene Theory.

40
Hygiene or Maintenance Factors
Salary
Job security
Working conditions
Level and quality of supervision
Company policy and administration
Interpersonal relations
The Dissatisfiers
Motivation and Job Satisfaction
The Satisfiers
Sense of achievement
Recognition
Responsibility
Nature of work
Personal growth and advancement
Motivators or Growth Factors
Figure 2.2: Adapted from Mullins (2005) Representation of Herzberg's Motivation-
Hygiene Theory
Source: Management and organizational behavior (Mullins, 2005)
In 2009, Katt & Condly summarised factors which, according to them, had a "fairly stable
taxonomy" (See Table 2.4).
Motivators Hygiene Factors
Achievement
Completion of a job, solution to a
problem, seeing the results of one’s
efforts. This category also allowed for
incidents involving failure (the absence of
Company policy and administration
Events involving the ‘‘adequacy or
inadequacy’’ (Herzberg, 1966: p. 197) or
‘‘harmfulness or beneficial effects’’ (p.
197) of the company’s organisation and

41
achievement). management.
Recognition for achievement
An act of notice, positive or negative,
from anyone (supervisor, peer, or general
public)
Supervision
Events that centre on the behaviour of
one’s supervisor.
Work itself
Events centred on the variety/routineness,
Difficulty/ease, or creativity/lack of
creativity of respondent’s work.
Interpersonal relations
Reports of events in which there is
specific reference to the characteristics of
interaction between respondent and
superiors, subordinates, or peers.
Responsibility
Events involving the status of
respondent’s authority or responsibility.
Working conditions
Events involving the physical adequacy or
inadequacy of the work environment, (i.e
lighting, ventilation, tools, space, etc.)
Advancement
An actual change in a ‘‘person’s status or
position in the company’’ (Herzberg,
1966: p. 195).
Salary
‘‘Sequences of events in which
compensation plays a role’’ (Herzberg,
1966: p. 195).
Growth
Situations that resulted in respondents
learning new skills, acquiring a new
outlook, or the opening of a ‘‘previously
closed door’’ (Herzberg, 1966: p. 194).
Job security
Responses involving a specific reference
to the presence or absence of job security.
Table 2. 4: Established Workplace Motivation-hygiene Factors (Herzberg, 1966, 1974)
Source: Adapted from: A Preliminary Study of Classroom Motivators and De-motivators
from a Motivation-hygiene Perspective (Katt & Condly, 2009).
Herzberg suggests that in order to motivate people, management should focus on either
factors related to the work itself or the direct outcomes derived from it, such as (Robbins &
Judge, 2013):
Personal growth opportunities.
Achievement responsibility.
Promotional opportunities and recognition.

42
Despite similarities between Herzberg's Motivation-Hygiene Theory and Maslow’s
hierarchy (Table 2.5) Owens found that two differences exist (Owens, 2001):
Maslow deals with all potential motivators, while Herzberg deals with “high order
needs”.
Herzberg's Motivation-Hygiene Theory addresses the working environment, while
Maslow considers the individual’s environment “at work and away from work”.
Maslow’s Hierarchy of Needs Herzberg’s two factor Theory
Physiological Hygiene factors
Safety
Love
Esteem Motivators
Self-actualisation
Table 2. 5: Linking Maslow’s, and Herzberg’s theories of motivation
Source: Adapted from Management and organizational behaviour (Mullins, 2005).
There have been many studies with different conclusions about the effectiveness of
Herzberg's Motivation-Hygiene Theory.
“Perhaps no other Theory of motivation at work has been more extensively
researched and argued about than this [Herzberg’s Theory], and in all likelihood
none has been as widely applied to complex organizations” (Owens, 2001: p. 359).
Similarly, Porter, Bigley, & Steers (2003) found in their book that, although this Theory
was supported by practitioners because of its simplicity, precision and clarity, academic
society has taken a long time to accept the Theory. Moreover, Fox (1997) stated that
Herzberg's Motivation-Hygiene Theory had been tested by Hill (1986-1987), where he
found that the Theory is applicable to HE.
In 1964, Lodahl claimed that the relationship between motivation and job satisfaction is
superficial. By using different methods and samples, his findings indicated that the attitude
factor patterns form a replication of Herzberg’s work and that there might be a general
theoretical background that differentiates between “satisfiers” and “motivators”.
Despite the popularity of Herzberg's Motivation-Hygiene Theory, it has continually been
criticised. House & Wigdor (1967) criticised Herzberg's Motivation-Hygiene Theory on
several grounds:

43
Limitations of the methodology used - Critical Incident Technique.
The faulty research base.
That the Theory was not consistent with previous research evidence of satisfaction
and motivation.
Through analysing the data provided by the Herzberg research, they concluded that the
findings contradicted the propositions that satisfiers and dissatisfiers are independent. The
following year, 1968, another study conducted by Winslow & Whitsett defended and
supported the two-factor Theory by criticising the research of House & Wigdor.
“Satisfaction was related to performance” (Lawler, 1970; p: 224).
Later on, in 1995 Johnston research revealed that sources of satisfaction are not always
opposite to sources of dissatisfaction. In his research, some of the factors acted as a source
of satisfaction and dissatisfaction, which contradicts Herzberg Theory.
Lawler questioned this relationship through an investigation that overlooked several
studies. He found that satisfaction affects employee motivation which he related to job
performance in an indirect way. Simultaneously, he found that performance might affect
satisfaction in a direct way in certain situations. He stated that the importance of this
relation is that it can provide an idea about the reward system within an organisation.
The following year, a further research supported Herzberg's Motivation-Hygiene Theory.
Schwab, Devitt, & Cummings (1971) conducted a study with a sample of 99 male
supervisors investigate criticism of the two-factor Theory. Their study revealed similar
results to Herzberg's Motivation-Hygiene Theory, although they also indicated that they
had failed in predicting certain responses using Herzberg's Motivation-Hygiene Theory.
Kacel et al. (2005) joined in supporting the Theory. Their study aimed to identify job
satisfaction levels among practicing nurses where the results revealed that the:
“highest satisfaction scores in this study were all intrinsic factors and the lowest
satisfaction scores among nurses practitioners in this study consisted of the
extrinsic factors” (p. 30).
In the same field, Sharp (2008) conducted research to check for a relationship between:
ability compensation, utilisation, achievement, job satisfaction and co-workers for
psychiatric nurses. Sharp’s results supported Herzberg's Motivation-Hygiene Theory and
showed a reasonable correlation between ability utilisation, achievement and job
satisfaction by using a short form of the Minnesota Satisfaction Questionnaire.
Additionally Lundberg et al. (2009) incorporated questionnaires and in depth interviews

44
into their investigation of motivation amongst seasonal workers at tourism destinations.
Their study supported Herzberg's Motivation-Hygiene Theory and stressed its validity.
Furthermore, Ahmed et al. (2010) supported the Theory by conducting research within a
university revealing that intrinsic factors affect employee job satisfaction, whereas hygiene
factors had little significant effect on employee satisfaction.
In 2007, Smerek and Peterson conducted a survey in a public research university with a
2700 employees sample to test Herzberg's Motivation-Hygiene Theory. They found that
the results did not support the Theory in a conclusive way, though they revealed that:
“… work itself is the strongest predictor of job satisfaction after controlling both
personal and job characteristics” (Smerek & Peterson, 2007: p. 229).
During the same period, Sachau (2007) claimed that despite the mistakes of Herzberg,
there remains lots of misinterpretations. He stressed the relationship between Herzberg's
Motivation-Hygiene Theory and intrinsic motivation as found in recent academic
researches.
- Vroom Theory
“Expectancy Theory (Vroom, 1964) has held a major position in the study of work
motivation” (p. 575); this is how Vroom Theory was described by Van Eerde & Thierry
(1996). The Theory’s important feature is its:
“View of behaviour as subjectively rational and as directed toward the attainment
of desired outcomes and away from aversive outcomes” (Vroom, 1964: p. 276)
The Theory is based on the belief that individuals choose a behaviour that brings them the
maximum return of satisfaction and the lowest return (or avoidance) of dissatisfaction.
Moreover, Vroom argued that individuals choose their behaviour depending on their
preference of particular activity and expected results (Mullins, 2005; Vroom, 1964). Unlike
Maslow’s Theory, it focuses on outcomes rather than needs (Sinclaire, 2011).
Expectancy Theory states that people will perform their jobs if they (Fox, 1997; Sullivan &
Garland, 2010):
1. Believe that they have the ability to perform the job
2. Will be rewarded for doing the job (expectancy)
3. Will receive the reward they require (valence).
Figure 2.3 examines Vroom’s Expectancy Theory.

45
Expectancy – perceived
probability that effort will lead to
first- level outcomes
Instrumentality – extent to which
first level outcomes lead to
second –level outcomes
Effort expected
(motivational
force)
Level of
performance
High
productivity
First – level outcomes
Performance – related
For example:
Praise from
superior
High wages
Promotion
Friendship of
co-workers
Second – level outcomes
Need – related
Figure 2.3: Basic model of expectancy Theory
Source: Adapted from Management and organisational behaviour (Mullins, 2005).
Current research
Herzberg’s Motivation-Hygiene Theory has been used as the basis of the conceptual
framework for this research. The objective of using this Theory is not to assess academic
staff satisfaction in general, but to assess the effect of feedback on their satisfaction.
Herzberg’s Motivation-Hygiene Theory is the main theory which does this.
Satisfaction among academic staff
Having reviewed general job satisfaction, this section will review job satisfaction in the HE
sector. Job satisfaction is a very important aspect especially for academic staff, although
most scholarly work has focused on industrial contexts, with minimal research of academic
staff job satisfaction (Sabharwal & Corley, 2009).
Machado et al.'s (2011) article mentioned that satisfaction and motivation are essential for
academic performance and quality HE provision. This was reiterated by Noordin & Jusoff
(2009) who found job satisfaction amongst academics is an intrinsic motivator in effective
academic institutions. Moreover, in 2006 Ololube found that job satisfaction for academic
staff is as important as:
46
“… professional knowledge and skills, centre competencies, educational resources
and strategies” (p. 1).
And that it is an essential part of the performance and success of an educational system
(Ololube, 2006).
In 1983, Powell, Barrett, & Shanker conducted twenty-four interviews with university
academic staff in order to assess their professional lives. The research revealed that
teaching is the main reason for satisfaction, though many pointed out that they had the
feeling that:
“…this was under-valued by the institution” (Powell et al., 1983).
In his 1997 research Oshagbemi conducted a survey covering eight basic job and
demographic elements, which included 566 university teachers from 23 universities across
the UK. He found that the same factor can contribute to both individual satisfaction and
dissatisfaction. These findings contradict Herzberg's Motivation-Hygiene Theory which
stated that factors that lead to satisfaction are completely different and distinct from factors
that lead to dissatisfaction. This was supported by the research of Ssesanga & Garrett
(2005) who concluded that Hygiene factors contribute to academics job satisfaction and
dissatisfaction. In their research, Byrne, Chughtai, Flood, & Willis (2012) concluded that
job content and work context factors contribute to the job satisfaction among academics,
which contradicts Herzberg's Motivation-Hygiene Theory. In 2006, Ololube defined job
satisfaction among academic staff as:
“…the ability of the teaching job to meet teachers’ needs and improve their
job/teaching performance” (p. 1).
In 2000, Hagedorn identified six triggers and three mediators that affect job satisfaction.
She defined a trigger as:
“… a significant life event that may be either related or unrelated to the job”
while a mediator is:
“a variable or situation that influences (moderates) the relationships between other
variables or situations producing an interaction effect” (p. 6).
Table 2.6 represents the triggers and mediators that were included in the framework.

47
Mediators Triggers
Motivators &
Hygienes
Demographics Environmental
conditions
Change or Transfer
Achievement
Recognition
Work itself
Responsibility
Advancement
Salary
Gender
Ethnicity
Institutional type
Academic
discipline
Collegial
relationships
Student quality or
relationships
Administration
Institutional climate
or culture
Change in life Stage
Change in family-related
or personal circumstances
Change in rank or tenure
Transfer to a new
institution
Change in perceived
justice
Change in mood or
emotional state.
Table 2. 6: Conceptual Framework of Faculty Job Satisfaction
Source: Adapted from Conceptualizing faculty job satisfaction: Components, theories, and
outcomes. (Hagedorn, 2000).
According to a US study by Sanderson, Phua, & Herda (2000), academics were satisfied
mainly with the opportunity to teach and educate students, and teaching interesting
courses. Additionally, a flexible working schedule, the ability to work independently and
job security were among the main reasons for satisfaction. That said, for those who
considered changing career, (five percent said that they would probably not want to be an
academic), and the main reasons were:
Financial compensation.
Ability to maintain the balance between work and family.
Inadequate research resources.
Workload.
Ahsan, Abdullah, Fie, & Alam (2009) research findings indicated that workload was one of
the factors that had both a positive relationship to job stress and a negative relationship to
job satisfaction. Their research also showed how role ambiguity negatively affects job
satisfaction. This contrasts that relationships with others that do not affect job satisfaction.
This aligns with the research of Bozeman & Gaughan (2011), which concluded that as with
other types of workers, academics tend to be satisfied when they receive respect from their
colleagues and have a salary reflecting their value. Additionally, Awang, Ahmad, & Zin
(2010) concluded that there are three factors that affect job satisfaction amongst lecturers:
Workload.
48
Promotional opportunities.
Relationship with colleagues.
They also concluded that programmes such as team building help to increase job
satisfaction levels.
In contrast, workload was related negatively to job satisfaction in the research of Mustapha
& Ghee (2013). More so, the study by Rhodes, Hollinshead, & Nevill (2007) indicated 30
factors that affected academic staff satisfaction. Collaborative working, opportunities for
self-management and friendliness of colleagues were the highly ranked factors that
affected satisfaction, while factors such as the time spent on administration and workload
were ranked highly as sources of dissatisfaction.
Osakwe (2014) defined academic autonomy as incorporating the control over work;
possessing varieties of tasks including:
Teaching
Research
Offering courses
Evolving evaluation methods.
In addition to autonomy, Osakwe linked job satisfaction to the work environment,
professional development, safety and security, promotional opportunities, empowerment
and authority. It was also concluded by Renzulli, Parrott, & Beattie (2011) that autonomy
is strongly related to job satisfaction among American school teachers. Following this, De
Lourdes Machado-Taylor et al. (2014) indicated that along with the working environment,
personal and professional development, facilities, and colleagues, supporting-staff are
considered a source of academic staff satisfaction in the Portuguese HE.
Another point related to academic staff satisfaction was academic freedom. Ong (2012)
defined academic freedom as having the:
“ … right to speak freely without fear of reprisal, the right to determine specific
teaching methodologies, the right to transmit knowledge openly, and the right to
research in one’s field” (p. 2).
Moreover, Ong indicated that the United Nations Educational, Scientific and Cultural
Organisation stressed that academic freedom should be observed scrupulously. In their
research, Williams and Blackstone (1974) indicated that freedom is a factor that is highly
valued by academics (Williams and Blackstone (1974) cited in Rhodes et al., 2007). This

49
agrees with Cornuel & Verhaegen (2005), Houston, Meyer, & Paewai (2006) and De
Lourdes Machado-Taylor et al. (2014) who linked academic freedom with satisfaction.
Table 2.7 lists some of the factors that affect academic staff job satisfaction. These factors
will be reviewed in the discussion chapter (section 6.1.1) to cross check them with the
themes emerged from the interviews.

50
Factor Researchers
Academic Freedom (Cornuel & Verhaegen, 2005; de Lourdes Machado-Taylor, 2014; Houston et al., 2006; Ong, 2012; Rhodes et
al., 2007; Shin & Jung, 2014; Verhaegen, 2005)
Autonomy (Bellamy, Morley, & Watty, 2003; Osakwe, 2014; Renzulli et al., 2011; Roelen, Koopmans, & Groothoff,
2008; Watty, Bellamy, & Morley, 2008)
Career Progression and
Academic Goals
(Metcalf, Rolfe, Stevens, & Weale, 2005; Noordin & Jusoff, 2009; Roelen et al., 2008)
Empowerment (Babakus et al., 2003; Kim et al., 2009; Osakwe, 2014; Shin & Jung, 2014)
Facilities (Adetoro, 2014; Bellamy et al., 2003; De Lourdes Machado-Taylor et al., 2014; Karabit-Yik & Anbar, 2008;
Shin & Jung, 2014)
Organisational Support (H. J. Kim et al., 2009; W. G. Kim et al., 2005; Susskind, Borchgrevink, Kacmar, & Brymer, 2000)
Relationship with colleagues (Awang et al. 2010 ; Bozeman & Gaughan, 2011)
Respect (Bozeman & Gaughan, 2011; Kim et al., 2009; Kim et al., 2005; Lockwood, 2007)
Rewards (Babakus et al., 2003; Bustamam, Teng, & Abdullah, 2014; Hofmans, Gieter, & Pepermans, 2013; H. J. Kim
et al., 2009; Noordin & Jusoff, 2009; Terera & Ngirande, 2014)
Supporting Staff (De Lourdes Machado-Taylor et al., 2014; Noordin & Jusoff, 2009)
Teamwork (Ahmed et al., 2010; Houston et al., 2006; Lockwood, 2007; Noordin & Jusoff, 2009; Renzulli et al., 2011;
Rhodes et al., 2007; Roelen et al., 2008)
Training (Babakus et al., 2003; Bimpitsos & Petridou, 2012; Cheung & To, 2010; H. J. Kim et al., 2009)
Workload (Ahsan et al., 2009; Awang et al., 2010; Bellamy et al., 2003; Karabit-Yik & Anbar, 2008; Mustapha & Ghee,
2013; Noordin & Jusoff, 2009; Rhodes et al., 2007; Roelen et al., 2008; Sanderson et al., 2000)
Table 2. 7: Factors affect academic staff job satisfaction adapted from literature

51
2.2.3 Service quality and satisfaction
As discussed, the literature has indicated that there is a strong connection between service
quality and satisfaction (Angell et al., 2008; Athanassopoulos, 2000; Cronin & Taylor,
1992; Smith et al., 2007; Sultan & Wong, 2013). This has been supported by Bigne,
Moliner, & Sánchez (2003) who suggest this correlation is relevant in HE context. That
said it is a more complicated relationship, with universities being considered as
multiservice organisations, which have a core service and one or more complementary
services (Berry, 1995 cited in Bigne at al., 2003).
There has been debate as to whether service quality influences satisfaction or vice versa.
While Cronin and Taylor (1992) and Voss and Gruber (2006) concluded that service
quality is a cause of customer satisfaction, other scholars such as Parasuraman et al. (1985,
1994, 1988) stated that consumer satisfaction leads to perceived service quality. However,
the majority of recent research considers service quality a cause of customer satisfaction
(Gruber et al., 2010). Despite the debate into which came first, it was clear that a
correlation exists between satisfaction and service quality. Indeed, Zeithaml et al. (2009)
suggested that service quality can be considered as a component part of satisfaction, as a
wider and broader concept than simple service quality. Through this research, aligning
with the research aim, an assumption will be made that service quality is a reason of
satisfaction.
Jongbloed, Enders, & Salerno (2008) stated that HE institutions should evaluate their
commitment to servicing the demands of their stakeholders, and it was noted that once
needs are identified, a superior quality of service is achieved. According to literature,
student perceived service quality is an antecedent to satisfaction (Browne et al., 1998
and Guolla, 1999 cited in Gruber et al., 2010; Voss & Gruber, 2006). Moreover, Alves &
Raposo (2010) indicated that perceived quality plays a role affecting student satisfaction.
This supports the conclusion of Gruber at al. (2010) that shows that student satisfaction
reflects the perception of quality differences in services offered by universities. Invariably,
satisfied students may return to the University for further education and attract new
students via word of mouth (Voss et al., 2007).
According to Bowden (2011), students who have a high quality perception of the
university are more likely to develop a stronger connection with the brand. Additionally,
Bowden indicated that a HE sector commitment may eventually be established by staff and
institutions adapting their service styles to meet their customer needs.

52
2.3 Marketisation of HE
Marketisation has been defined as the process of opening the market to competitive forces
and increasing the influence of this competition on academic life (Judson & Taylor, 2014).
It has been also defined as:
“… the attempt to put the provision of higher education on a market basis, where
the demand and supply of student education, academic research and other
university activities are balanced through the price mechanism” (Brown, 2015; p.
5).
Marketisation aims to encourage HE institutions to provide and dedicate more attention to
students, teaching and research (Jongbloed, 2003). According to Tomlinson (2016), HE
marketisation has been felt more in countries that have “broadly liberal market economy”
(p.3) such as the USA, UK, Australia and Canada. In most western countries, marketisation
has been viewed as a:
“Compromise between privatization, academic autonomy and blatant state control
in the face of the backlash against government intrusion in western socioeconomic
life” (Hemsley-Brown & Oplatka, 2006: p. 317)
According to Brown (2011), accommodating high numbers of students while maintaining
the same quality was one driver of marketisation.
In 2015, Ashwin, Abbas, & McLean stated that the introduction and increase of tuition fees
strengthened HE marketisation. They agreed that marketisation put HE quality central
focus of attention to satisfy HE customers (students) by the need to provide “information
about the quality of the product” (p. 610).
Marketisation has some academic support. In 2003, Jongbloed argued that marketisation
improves student choice and service quality provided by HE institutions. Naidoo, Shankar,
& Veer (2011) suggest that marketisation can help universities to identify and fulfil student
needs. That said, Molesworth, Nixon & Scullion (2009) noted that marketisation of HE
undermines students reflection, engagement and reinvention. Additionally, Brown (2015)
sees how it makes HE “economic goods” (p. 7). Moreover, Brown feels that it will direct
institutions to focus on student surveys as the “best proxy for quality” and consequently
this will affect professional assessments and in effect “learning gains”.
Some of these researches have contributed to the debate as to whether students should be
treated as customers or not. Jongbloed (2003) states that by being a customer of HE student
have a fundamental contribution to the teaching process. As mentioned in section 1.4 the

53
second research question explores the effect of HE marketisation on PG student
perception. For this reason literature that examines the debate surrounding the ‘student as a
customer' will be discussed in the following section.
2.3.1 Are student customers?
As discussed in the introduction, customer satisfaction is an important topic in the
marketing literature, though it cannot be applied to HE without considering the current
debate that questions the perception of students as customers. Some scholars considered
students as internal customers and some as external customers, while others simply refuse
to accept the concept of students being customers of HE.
Sax (2004) argued that in order to be a customer, there is a requirement to have more than
a single exchange. This is why people usually buy from someone they know and trust. The
same principle applies to the relationship between current students and universities.
Recruiters recommend universities to new students, suggesting that they join one of those
universities that offer special privileges or discounts. It has also been stated that new
technology helps define students as customers by connecting them to the university by
bonds of familiarity and trust over an extended period. In the same vein, Yeo (2008)
indicated that students are considered as HE customers, either as primary customers,
involved in the learning process input and output, or as secondary customers for those who
consider future employers as their primary customers.
That said, scholars like Parsell (2000) argue that students are not customers, although this
does not suggest a lack of involvement from those students in their education. However, it
is suggested that students should be treated as “learning workers” who have the power to
participate, in a positive and productive way within the educational process.
Similarly, Durkin et al. (2014) agree on this perception of students as customers, as the
unique situation of education means that outcome quality depends on the consumer
(student) efforts. DeShields Jr et al. (2005) argues that students should be considered as
customers due to the fact that without them, there would be no customers to be served by
the educational institutions. This was also supported by Voss et al., (2007), who claimed
that due to the tuition fees application in Germany, the "consumerist" concept will be most
likely strengthened and German universities would need to offer value for money.
Moreover, the main income for universities tends to originate from tuition fees
54
(UniversitiesUK, 2014d) and so it is of paramount importance to the HE sustainability
model.
Sharrock (2000) and Cuthbert (2010) classified students into four categories:
Customers who need routine information.
Clients who needs guidance from an expert.
Citizens who have a right to appeal against someone or an act.
Subjects who maintain obligations, such as working to achieve a grade.
Moreover, Hart & Coates (2010) who conducted a study on international (East Asian)
students suggested that students view themselves as customers when they are dissatisfied
and subsequently provide feedback to the university. Twersky, Buchanan, & Threlfall
(2013) also concluded that students are beneficiaries, as they benefit directly from the HE
system.
In the investigation of Finney & Finney (2010) the correlation between students perceiving
themselves as customers of their universities and their educational attitude or behaviour
was examined. The research argues that students who perceive themselves as customers
feel that they are entitled to receive positive outcomes from the university. In this case,
students view that for their input of fees and tuition payment, and in exchange they will
receive their grades and qualifications. Treating students as customers might decrease
student responsibilities and destabilise student academic rigor (Finney & Finney, 2010).
Similarly, Clayson and Haley (2005) stated that the application of customer orientation
may have some implications, such as anticipating good grades; an “easy A” in return for
the tuition paid regardless of the effort made. Students will also act as judges whenever
they feel unsatisfied, and they will fill out a service form even if it is not related to teaching
(Clayson & Haley, 2005).
Table 2.8 demonstrated the concept in regards to other scholars who support or refute the
idea of treating students as customers.
Scholars
supporting the
idea of treating
students as
customers
Hill (1995). In the UK, students are the primary customers of HE.
Michael, Sower, & Motwani (1997). Students are customers of higher
education; they are consumers of service and knowledge. On the
other hand, future employers are consumers of the student product.
Joseph & Joseph (1998). Due to high competition, universities are
required to understand students’ needs in order to develop strategies
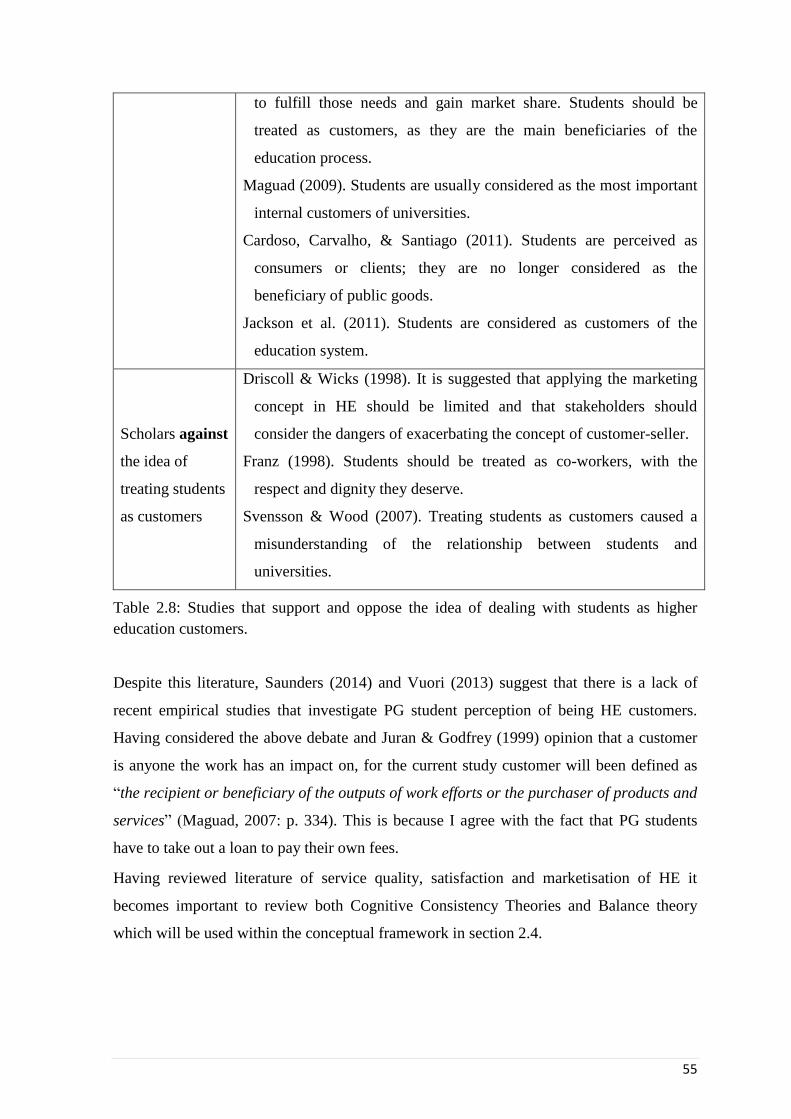
55
to fulfill those needs and gain market share. Students should be
treated as customers, as they are the main beneficiaries of the
education process.
Maguad (2009). Students are usually considered as the most important
internal customers of universities.
Cardoso, Carvalho, & Santiago (2011). Students are perceived as
consumers or clients; they are no longer considered as the
beneficiary of public goods.
Jackson et al. (2011). Students are considered as customers of the
education system.
Scholars against
the idea of
treating students
as customers
Driscoll & Wicks (1998). It is suggested that applying the marketing
concept in HE should be limited and that stakeholders should
consider the dangers of exacerbating the concept of customer-seller.
Franz (1998). Students should be treated as co-workers, with the
respect and dignity they deserve.
Svensson & Wood (2007). Treating students as customers caused a
misunderstanding of the relationship between students and
universities.
Table 2.8: Studies that support and oppose the idea of dealing with students as higher
education customers.
Despite this literature, Saunders (2014) and Vuori (2013) suggest that there is a lack of
recent empirical studies that investigate PG student perception of being HE customers.
Having considered the above debate and Juran & Godfrey (1999) opinion that a customer
is anyone the work has an impact on, for the current study customer will been defined as
“the recipient or beneficiary of the outputs of work efforts or the purchaser of products and
services” (Maguad, 2007: p. 334). This is because I agree with the fact that PG students
have to take out a loan to pay their own fees.
Having reviewed literature of service quality, satisfaction and marketisation of HE it
becomes important to review both Cognitive Consistency Theories and Balance theory
which will be used within the conceptual framework in section 2.4.

56
2.4 Cognitive Consistency Theories
The fundamental assumption of cognitive consistency theories is that people try to
maximise consistency and equilibrium among their cognitions (Awa & Nwuche, 2010).
Cognitive theories are concerned with the “relationship of cognitions in a person's mind”
(Cobley & Schulz, 2013: p. 274). The following sections will review two theories:
Cognitive Dissonance Theory and Balance Theory.
2.4.1 Cognitive Dissonance Theory
The original Theory was proposed in the mid 1950's, with the completed version,
appearing in 1957 (Harmon-Jones, 2012). The Theory is built on the concept that people
strive toward consistency, and in order to reach this, they attempt to rationalise
inconsistencies in order to reduce psychological discomfort (Festinger, 1962; Shasha, Wei,
& Wei, 2014). Cognitive Dissonance has been defined as:
“A uncomfortable psychological state caused by holding dissonant cognitions
simultaneously” (Cobley & Schulz, 2013: p. 275).
Festinger (1962) stated that the relation between a pair of elements might be 'dissonance' or
'consonance'. Dissonance refers to an unpleasant state, which may occur when an
individual has two or more knowledge elements that are relevant, even if they do not fit
together. Comparatively, if they are inconsistent, a state of discomfort 'dissonance' takes
place (Festinger, 1962; Harmon-Jones, 2012). It can rise from logical inconsistency,
cultural mores, one specific opinion, or from past experience (Festinger, 1962: p. 14).
Furthermore, the amount and importance of inconsistent elements affects the magnitude of
the dissonance (Cobley & Schulz, 2013). This dissonance stimulates individuals to 'engage
in psychological work' in order to minimise or eliminate inconsistency. Moreover, people
might:
“… change behavioural cognitive elements, environmental cognitive elements or
add new cognitive elements” (Metin & Camgoz, 2011: p. 132)
In doing so they may be able to restore consonance and decrease the dissonance
magnitude. This was explained by Metin and Camgoz (2011), as for example, when a
cigarette smoker knows that smoking has bad effects on his health he might:
Change behaviour, actions or cognition - stop smoking.
Change knowledge and believes – begin to believe that smoking is not dangerous.

57
Change their perception by adding new element that agree with smoking – for
example believing that traffic is more dangerous.
Festinger (1962: p. 31) summarised the core of the Theory:
1. There may exist dissonant or 'non-fitting' relations among cognitive elements.
2. The existence of dissonance gives rise to pressures to reduce the dissonance and to
avoid increases in dissonance.
3. Manifestations of the operation of these pressures include behavioural changes,
changes of cognition, and circumspect exposure to new information and new
opinions.
However, Shasha et al. (2014) stated that there are some limitations to this Theory:
It is not capable of predicting human behaviour accurately.
Dissonance is not easily observed and measured.
It does not provide a reliable tool to measure the dissonance magnitude.
The use of this theory in the current research will be examined later in this chapter after
alternative options have been considered.
2.4.2 Balance Theory
Heider’s initial work on Balance Theory was conducted in 1946, which was extended into
a book chapter in 1958. He was interested in how individual (perceiver) minds link
between the attitudes towards objects and people (Bohner & Wänke, 2002; Eagly &
Chaiken, 1993; Heider, 1946).
The model proposed by Heider consists of three elements (Oskamp & Schultz, 2005):
The perceiver (P)
Another person (O)
An idea or an object (X)
Between each two elements, there are two possibilities for the relationship. These are
either Attitude or Unit relationships, where a relation can be established between a person
P and another person O or object or situation X.
Attitude relation (L) can be either positive or negative relationships, such as to like, to
love, to value, to esteem, where a Unit relation (U) refers to what can be perceived as
belonging together, for example. unit formations such as similarity, causality, ownership,
proximity which can also be both positive or negative (Heider, 1946; Oskamp & Schultz,

58
2005). Moreover, it was outlined that through a unit relation as an example, pUo is the
same as oUp, as they belong to a unit (symmetrical relation), while in the case of attitude,
pLo (p likes o) does not imply that o likes p pLo (non-symmetrical relation). Indeed, it was
suggested that:
“attitudes towards persons and causal unit formations influence each other”
(Heider, 1946; p. 107).
Unit formation depends mainly on similarity, past experience, logical continuation, and
proximity, so that a person can be considered as a cognitive unit with others because of
“kinship, nationality, or religion” (Heider, 1958: p. 178). Nonetheless, unit formation does
not only depend on the perception of belonging between entities, but also on surroundings
properties. If two persons (one from New York and one from Boston) met in a party in
which there was no other Americans, they would feel that they belong to together, while if
the met in a party where half was from New York and half from Boston, very likely that
they would feel that they belonged to different units. Based on a study conducted by
Festinger and Hutte (1954) in the United States and Holland, Heider explained that the
direct relation between emotions “sentiments” and cognitive structure do not depend on
culture.
“An attitude towards an event can alter the attitude towards the person who caused
the event, and if the attitudes towards a person and an event are similar, the event
is easily ascribed to the person” (Heider, 1946: p. 107).
Figure 2.4 shows the possible balanced and unbalanced patterns, with the solid arrow
representing a positive relationship, while the dashed one represents a negative
relationship. For example, in triad (b), both P and O dislike X, and P likes O, which
represents a balanced triad. On the other hand, if both P and O dislike X and P dislike O as
well, this forms an unbalanced triad. Eagly and Chaiken simplified the concept through the
description: “we can say that agreement with friends and disagreement with enemies are
balanced or steady states, whereas disagreement with friends and agreement with enemies
are imbalanced or unsteady states” (Eagly & Chaiken, 1993: p. 135).

59
P
O X
(a
)
O
(c
)
P
X O X
(b
)
P
(d
)
O
P
X
P
X
(f
)
O
P
X
(g
)
O
P
(h
)
O X
P
(e
)
O X
Balanced
Unbalanced
Figure 2.4: adapted from Eagly and Chaiken (1993) Balanced and imbalanced triads.
Source: The Psychology of attitudes (Eagly & Chaiken, 1993).
According to Heider, the Theory assumes that people try to find consistency in their life
relations through equilibrium, and that lack of equilibrium causes an unbalanced and
unpleasant state, upon which people try to find and restore equilibrium (Bohner & Wänke,
2002). The triad consists of 3 elements, at which the relation is either balanced or
unbalanced. Balanced relations occur when there are three positive relations, or two
negative and one positive, between elements. While unbalanced relations appear when
there are three negative relations or two positive and one negative (Eagly & Chaiken,
1993; Heider, 1946). In other words, there is a balance state when the signs algebraic
multiplication in the triad relation is positive (Khanafiah & SItungkir, 2004). Indeed, a
balanced situation exists if there are similar attitudes towards the parts of a causal unit.
Balance Theory had certain limitations, and it has not been used extensively in research
mainly because of its simplicity and lack of clarity at some points. These two reasons are
the main motivations for revision of the Theory (Oskamp & Schultz, 2005). It also has
experienced few modifications since it was proposed in 1946. Attempts have been made
by: Cartwright and Harary, in 1956 using mathematical principles; Rosenberg and
Abelson, 1960 through using matrix algebra. These modifications extended the model to

60
involve more than three units, but the model has not been revisited recently (Eagly &
Chaiken, 1993). Oskamp & Schultz (2005) also addressed another issue, which is the
degree of liking something, as the balance Theory described situations either positively or
negatively, and neglected that there are degrees of positivity or negativity.
A further limitation was the assumption that relations between the elements are one way
and this does not consider that it may be a two-way relationship (Cartwright & Harary,
1956; Oskamp & Schultz, 2005). Heider emphasised that relations are not symmetrical -
i.e. P L O does not necessarily mean O L P, although he suggested that these relations have
the tendency to become symmetrical:
“… we want people we like to like us, and we tend to like people who like us”
(Heider, 1958: p. 205).
Despite those limitations, Eagly and Chaiken (1993) claim that the Theory has contributed
in an innovative and creative way to the social psychology field. Another study by
Khanafiah and Situngkir in 2004 stated that Heider’s Theory dominated the social
psychology field in the 1960’s as one of the cognitive consistency theories.
Current research
Balance Theory will be used in this research, as it is appropriate to the research setting.
Balance Theory is concerned mainly with studying and describing the relationship amongst
systems and how it can be maintained, while the Cognitive Dissonance Theory tries to
predict what happens if the balance is disturbed. Moreover, the Balance Theory is
concerned with peoples' attitude toward others, while the Cognitive Dissonance Theory is
concerned with the decisions people make which might be consistent or inconsistent with
previous behaviour (Singh, 2015). In this research the Balance Theory will be used to
explore if management commitment to quality (as a proxy) has an effect on the relation
between postgraduate student satisfaction and academic staff satisfaction.
2.5 Conceptual framework
In previous sections, literature dealing with service quality and satisfaction has been
explored, especially in relation to HE. The fourth part of the literature provided an
overview of the cognitive consistency theories. These will be used to build the conceptual
framework, which has been defined as a visual tool or a written product that:
61
"… explains, either graphically or in narrative form, the main things to be studied
– the key factors, variables or constructs– and the presumed relationships among
them" (Miles, Huberman, & Saldana, 2014: p. 20).
Relationship marketing literature discusses the relation between employee satisfaction and
customers' satisfaction (Bhaskar & Khera, 2013; Jeon & Choi, 2012; Wangenheim et al.,
2007). That said, a recent research conducted by Frey et al., (2013) investigated the
relation between customer satisfaction and employee satisfaction. That research was based
on the assumption that customers have authority and so their satisfaction will directly
affect employee satisfaction. In addition, they linked customers and employee through
positive feedback using quantitative approach.
Because there was no direct relation or literature that links customer satisfaction to
employee satisfaction, this research tries to explore if this relation exists through
application of two theories: the Balance Theory and Herzberg's Motivation-Hygiene
Theory.
In order to explore whether there is a directional relation between student satisfaction and
academic staff satisfaction, there is a need to adopt a conceptual framework (See Figure
2.5). This framework is based on two theories: Herzberg's Motivation-Hygiene Theory,
which has been explained in section 2.2.3 as one motivational theory; and Balance Theory,
which was explained in section 2.4.2.

62
Student
Satisfaction
Staff
Satisfaction
Perceived
Appreciation
Management
Commitment to
Quality
Figure 2.5: Conceptual framework
Source: Adapted from “How Customer Satisfaction Affects Employee Satisfaction and
Retention in a Professional Services Context” (Frey et al., 2013) Original work
modifications are italicised.
The Herzberg's Motivation-Hygiene Theory and Balance Theory formed the skeleton for
the conceptual framework through two routes: both direct and indirect.
2.5.1 Customisation of balance Theory direct route (Based on Balance Theory)
“Many organizations are keen to provide service quality but fail simply because
they do not have an accurate understanding of what customers require of them”
(Oldfield & Baron, 2000: p. 87).
Due to increased educational institution numbers, not only in the UK, but also globally it is
imperative that universities gain a competitive advantage so as to attract more students
(Oldfield & Baron, 2000; Paswan & Ganesh, 2009). Therefore, it is important for
educational institutions to:
“… Look at what their students want and not to collect data based upon what the
institution perceives its students find important” (Oldfield & Baron, 2000: p. 86).
However, although service quality is not a new topic, service quality in HE is still
relatively new in comparison with other sectors (Sultan & Wong, 2013). Universities must
work diligently in order to meet their customer needs and expectations of their service

63
(DeShields Jr et al., 2005). They need to deliver a high service quality to their customers;
not only students but staff as well (Sahney et al., 2004).
Based on the research by Cheung & To (2010), and Azadehdel et al. (2013), there is a
direct relationship between management commitment to service quality standards and
employee job and customer satisfaction. Moreover, through application of Balance Theory,
which states that people seek to have balanced relationships, a relationship between student
satisfaction and staff satisfaction may exist. There is a need to explore the effect of
management commitment to quality on student satisfaction from one side and the effect of
management commitment to quality on staff satisfaction from another side.
2.5.2 Indirect route (Based on Herzberg's Motivation-Hygiene Theory)
According to Söderlund (1998) and Tohidinia and Haghighi (2011), customer feedback to
a service supplier has been defined as customer communication with the supplier to
express his feedback that reflects overall satisfaction with the service offered. Through this
feedback, the supplier identifies the areas that require improvement. Through their
research, both Söderlund (1998) and Tohidinia and Haghighi, (2011) reported that there is
a significant relationship between customer satisfaction and customer positive feedback.
Meanwhile, Saha and Theingi (2009) concluded that a weak positive relationship exists
between customer satisfaction and feedback. They argued that dissatisfied customers prefer
to change service provider rather than provide feedback. Moreover, they indicated that
although feedback seems to be important in all cultures, the degree of importance
“might be amplified in certain collectivist societies (Hofstede, 1980)” (Saha &
Theingi, 2009: p. 351).
According to Hofstede (1986), the UK was categorised as the country with a lower power
distance and higher individualism. Additionally, Fundin and Bergman (2003) suggested
that feedback can be used as a tool to assess service.
On the other hand, Herzberg's Motivation-Hygiene Theory, which was supported by Kacel
et al. (2005), states that there is a relationship between motivators and job satisfaction.
According to this Theory, the two main motivators are achievement and recognition which
has been defined as “direct feedback” (Herzberg, 1987). This, concluded, Winfrey (2009)
demonstrated that student positive feedback affects tutors in a positive way.
Therefore, based on these two premises, the current research will explore whether these
relationships work in the HE service sector.

64
2.6 Chapter summary
This literature review chapter has discussed the literature that distinguishes satisfaction,
student satisfaction, why students are considered HE customers by some scholars, together
with academic staff satisfaction and satisfaction theories. Moreover, literature has been
reviewed dealing with service quality and service quality measurements, with special
attention to the service quality in a HE context. Cognitive consistency theories were
discussed with emphasis given to Balance Theory. Finally, using Herzberg's Motivation-
Hygiene Theory and Balance Theory, a conceptual framework has been constructed that
will be used to explore whether there is a relation between student satisfaction and
academic staff satisfaction. The following chapter will review the HE system in the UK,
along with league tables and quality within HE. Finally, an overview of these in relation to
the University of Salford and SBS will be made.

65
Chapter Three: Research Context
The word “university” is derived from the Latin word “universitas” which refers to:
“a number of persons associated into one body, a society, company, community,
guild, corporation, etc.” (Andrews, Freund, Lewis, & Short, 1879: p. 1933).
This definition is similar to modern definitions of a university as (Oxford Dictionary,
2016):
“… an institution of HE offering tuition in mainly non-vocational subjects and
typically having the power to confer degrees”.
UNSECO (2016) claim that the oldest university in the world is University of Al
Quaraouiyine in Morocco, while the University of Bologna (Italy) is considered the ‘oldest
university in the Western world’.
In 2008, Altbach stated that the:
“Teaching mission of the university is a central responsibility. The goal is to
educate people to work effectively in an increasingly technological world” (p. 5).
Over time, the roles of universities have changed reacting to the pressures placed on them
by higher student numbers. Universities are forced to fulfil more roles with the same or
fewer resources, which may result in a decrease in quality (Altbach, 2008). Nowadays, the
HE institution focus has diversified to include teaching, research, enterprise activities,
industry engagement and professional training.
Following the literature review of satisfaction, service quality, and cognitive consistency
theories, this chapter will examine HE in the UK including the league tables that are used
to rank universities and the sources used to compile this data. Additionally, overviews of
quality in HE Institutions, UoS and SBS are presented.
3.1 The HE sector in the UK
There are a total of 130 universities in the 165 HE institutions in the UK (HESA, 2016). To
be awarded the title of “university”, institutions must meet criteria, which are assessed by
the Quality Assurance Agency QAA (UniversitiesUK, 2015c).
Universities in the UK do both teaching and research, and the proportion of those two
activities differ between universities. Some focus on teaching while others on research.

66
According to the speech by Professor Sir Christopher Snowden in 2014, the UK
contributes to global research and development expenditures by only 3.2%, which accounts
for 15.9% of the most cited articles (UniversitiesUK, 2014e). Furthermore, the growth of
knowledge transfer partnerships means that universities use their knowledge and expertise
to develop local business communities.
Boehm & Lees-Spalding (2006) categorised universities into six categories, based on
several factors. These included such things as:
How long the university has existed.
Whether the university focuses on research or is teaching centric.
Whether it is selective of quality students or focussed on recruitment of high
volumes of students.
According to the 1994 group policy report (2010), there are four main university
categories:
Russell Group
Million+
1994 Group,
University Alliance.
Category Description
Russell
Group
This group represents 24 leading UK universities, comprised from the more
traditional Universities (such as Oxford, Cambridge, Glasgow and
Edinburgh). The group is so-called because it first met at the Russell
Hotel, London.
The Russell Group are large research-intensive universities (mostly with
medical schools), committed to maintaining the very best research along
with an outstanding teaching and learning experience that links with
business and the public sector.
Million + Million + universities focus on access. These 26 universities focus mainly
on teaching with less emphasis on research.
They work to solve complex problems in HE and to ensure that policy
reflects the potential of the UK's world-class university system.
According to Drennan and Beck (2001), this group needs to enhance its

67
research reputation to secure research grant funding that can improve their
other performance indicators. They include London South Bank
University, Middlesex University and the University of Bolton.
1994 Group This group was formed of smaller research-intensive universities (without
medical schools). Their mission was to establish and promote excellence in
university research as well as teaching. They include the Universities of
Bath, Surrey, Reading, St Andrews and Durham.
Formally, the 1994 group was formed of 15 universities which were
reduced to 12 (Grove, 2012) and eventually disbanded in 2013.
University
Alliance
This group is formed of 20 universities, mainly post-1992 universities that
have a balanced portfolio of teaching, research, innovation and enterprise
integral to their missions. The alliance was formally launched in 2007. It
comprises of 20 universities which include UoS, Coventry University and
Manchester Metropolitan University.
Table 3. 1: Universities four main categories
Source: Adapted from UniversitiesUK (2015c), Jager (2011), NAID-UE (2015), O’Connell
(2015).
In 2001, Drennan & Beck analysed the Russell, the 1994 and post-1992 groups in terms of:
Average TQA scores (Teaching Quality Assessments)
RAE scores (Research Assessment Exercise)
Student entry standards
Student/staff ratios
Library and computing spending.
The analysis revealed that the Russell Group had the highest score on all except student to
staff ratio; the 1994 group came second, and finally, the post-1992 group was lowest in all
respects, except the student to staff ratio.
According to Jager (2011) in terms of research funding there is a difference between the
Russell and 1994 groups in comparison to the Million+ and University Alliance groups.:
“The share of the total recurrent research funding of the Million+ and University
Alliance is dwarfed by that of the Russell and 1994 groups. The first two accounted
for 2.9% and 5.1% respectively of all recurrent research funding in the 2009/10

68
budget year, whereas the Russell Group alone accounted for 62.3% (source:
HEFCE Funding Recurrent Grant 2009-10)” (Jager, 2011; p. 7).
Importance of the HE Sector in the UK
The HE sector is an important contributor to the UK economy. In 2011/2012, UK
universities generated £73 billion as an output, with revenue amounting to £27.9 billion.
This contributed directly to UK GDP by more than £36.4 billion, equivalent to 2.8% of
GDP in 2011 (Willetts, 2014). This contribution is more than four times as the agricultural
contribution to GDP (Lock, 2015). Moreover, the UK’s HE sector generated and supported
nearly 760,000 full-time equivalent jobs in the UK:
“For every 100 jobs created directly within a university, 117 extra jobs are
generated elsewhere in the economy, not including the off-campus expenditure
from non-UK students, which, on its own, created or supported an additional
62,380 FTE jobs in 2011–12” (UniversitiesUK, 2014c: p. 4).
Overseas students form an integral part of the HE sector in the UK. In the academic year
2011/2012 there were 435,235 students enrolled (17% of the total students) from outside
the UK (UniversitiesUK, 2014d). Soo & Elliott (2010) stressed the importance of
international students, not just for the monetary benefits, but others such as diversity of
students, experiences and alumni networks.
Furthermore, research collaboration between universities and businesses worth generate
value of more than £3.5 billion (UniversitiesUK, 2014d) and according to the World
Economic Forum:
"…the UK ranks fourth in the world for university-industry collaboration in R&D"
(Dowling, 2015; p. 14).
As discussed in the introduction chapter (section 1.1.1), HE contribution goes beyond
financial contribution. It also contributes to the society (Rothwell, 2016), the innovation
ecosystem (Ugnich et al., 2015) and general advancement of global culture (Soo & Elliott,
2010). This demonstrates how HE is important in that it generates not only income but has
further impact on society as a whole.
International competition
The HE sector is one of the UK's top exports. That said, it faces a strong competition
(Higher Education Commission, 2012). Many emerging economies have heavily invested
69
in international postgraduate education, by creating cultures of teaching and research in
their domestic HE systems. According to the HE commission report (2012), the investment
in international PG education will decrease with time. That said provision of courses taught
in English by European universities is considered another threat to the UK HE sector
especially in the postgraduate taught market (Mitchell, 2016).
Competition in this sector is not limited to UK universities. Particularly, the research of
Binsardi & Ekwulugo (2003) indicated that international student perception is mainly
related to recognise the worldwide qualifications and the positive quality of education.
Likewise, Russell (2005) found that word of mouth and service quality are considered
important factors for attracting international students. According to the UniversitiesUK
(2014c) report, the UK is second only to the United States when it comes to perceived
quality of education (compared to the five main English speaking destinations).
Nevertheless, it was at the bottom of the list in terms of “perceived graduate employment
opportunities” and in fourth place in terms of “student visa requirements/policies”.
Due to globalisation and the changes in the UK industrial base, PG degrees are becoming
more important than in previous years in order to get ahead in the labour market (Higher
Education Commission, 2012). The Higher Commission report also noted the importance
of PG studies and indicated that in order to support PG provision the government needs to
develop a strategy across all departments, and improve understanding of PG studies, as
there is limited knowledge in comparison to UG provision.
In addition, the UK is considered as a destination for PG more than UG studies for
international students (UniversitiesUK, 2014c); they form more than 50% of the PG
students studying in the UK in 2012/2013. The same report stated that international student
enrolment can support provision of some subjects, and it has a significant contribution to
research in the UK. In 2012/2013, PG international students in business and administrative
studies made up 54% of total students enrolled (8% EU and the rest were UK students).
Moreover, the majority of PG students that qualified with an MBA or Masters in
2012/2013 were from outside the EU. Attracting international students is imperative,
particularly in regards to PG students, as they are considered a valuable source of income
to universities and local communities (UniversitiesUK, 2014c). Additionally, the Higher
commission report (2012) suggested that international students are an important part of HE
infrastructures. They have academic, economic and diplomatic benefits and make courses
viable as in some PG subjects, are sustained by international student cohorts.
70
The commercialisation of HE in the UK
In 2012, Durkin et al. stated that government funding for teaching and research will
decrease. Based on their new framework:
“… funding will largely be a function of market demand” (p.153)
The fund is calculated in a manner that reflects where and what subjects students study.
According to the report, the largest part of the fund is allocated to research, and because of
limited amounts, funds are provided where research quality is highest. The second largest
part is allocated to teaching in order to ensure availability of high quality education
(HEFCE, 2015). While the government argues that increasing the competition between
universities will help improve the service quality offered, Brown (2015) feels that this
competition will increase marketisation. Consequently, this will turn:
“HE into an economic good” (p. 7).
This is against the principle notion of HE systems which are about the:
“… intellectual (and moral) development of the individual” (Brown, 2015; p. 7).
According to the HM Treasury report (2015), the government will permit:
“… institutions offering high teaching quality to increase their tuition fees in line
with inflation from 2017-18, and consult on the mechanisms to do this” (p. 59).
The new government plans may affect EU student figures, as well as research funding
through voting on EU Referendum in 2016 (Hamlyn's, 2015).
Similarly, university teaching processes will be evaluated through the ‘teaching REF’,
while tuition fees may increase to £11,500 (Lyons, Shipman, & Woolf, 2015; Wintour,
2015). This will affect university league table rankings and attractiveness to full-time UG
students. There may also be a wide range of fees dependant on university market position
and the values they offer, which will ultimately encourage increased commercialisation.
Overall, the HE sector in the UK is vitally important, not just economically, but also
educationally and culturally. As a result, there have been different mechanisms adopted to
ensure quality and standards of service provided in this sector. Data provided through these
mechanisms are compiled into league tables.

71
3.2 League tables
League tables provide a basis of comparison for quality between HE Institutions for
external stakeholders. Rankings generate a lot of interest and positive value from a media
perspective, which is often opposite to what academics feel (Policano, 2007). League
tables were introduced in the early 1990's, and provided information related to university
overall performance to different stakeholder groups (potential, current and past students in
addition to their parents, and staff) (Jobbins et al., 2008).
League tables use different sources to generate their rankings, and alternative indicators
with different weights, such as:
Employment rates
Teaching quality
Student experience
Academic quality of university intake
Research quality.
Table 3.2 summarises the four main league tables in the UK.
The Guardian The Times Sunday Times
The Complete
University
Guide
First year of
publication 1999 1992 1998
2007 (Good
University Guide)
Number of
institutions 120 113 123 126
Sources of
Data
The HE
Statistics
Agency (HESA)
The National
Student Survey
(NSS), published
by HEFCE
HESA
The HE Funding
Council for
England (HEFC)
(including NSS
& RAE)
Own surveys
HESA
HEFCE
(including NSS
& RAE)
QAA
SFC
The HE Funding
Council for
Wales HEFCW
NSS
HEFCE
The Scottish HE
Funding Council
(SHEFC)
HEFCW
HESA
In few cases data
were obtained
directly from the

72
individual
universities.
Indicators
(wt %)
Assessment &
Feedback NSS
(10%)
Teaching NSS
(10%)
Overall
Satisfaction NSS
(5%)
Entry Scores
(16.25)
Expenditure per
Student (10%)
Value Added
(16.25%)
Career Prospects
(16.25)
Student-Staff
Ratio (16.25)
NSS (17%)
Entry Standards
(11)
Spending (11)
Good Honours
(11)
Completion/drop
out (11)
Graduate
prospects (11)
Research
assessment (17)
Student: staff
ratio (11)
NSS (16%)
TQA/ subject
review (7)
Head teacher
survey (4.5)
Entry Standards
(23)
Good Honours
(9)
Completion
/dropout
(Variable:
bonus/ penalty
mark)
Unemployment
(9)
Research
assessment (18)
Student: staff
ratio (9)
Peer survey (4.5)
Entry Standards
(1)
Student
satisfaction (1.5)
Research
assessment (1)
Research
intensity (0.5)
Graduate
prospects (1)
Student – staff
ratio (1)
Academic
services spend
(0.5)
Facilities spend
(0.5)
Good honours
(1)
Degree
completion (1)
Table 3. 2: Main league tables in the UK
Source: Adapted from Locke, Verbik, Richardson, & King (2008); Jobbins et al. (2008);
The Complete University Guide (2016).
In 2007 Policano argued that creation of rankings is driven mainly by media in order to
increase circulation of publications, and that the value of rankings has reduced, despite the
fact that overall impact remains important. One impact is influencing candidates to place
more importance on factors, such as “perceived prestige” (p. 44) rather than things like
relevance and quality of programmes (Policano, 2007). Instead of rankings, Policano
(2007) recommends rating, in which HE institutions should be rated on a 1-5 star basis and
that the top 20 schools worldwide would receive five stars.

73
Bowden (2011) also found that the methodologies and data used in the various league
tables (The Times, The Guardian, Financial Times, Daily Telegraph, etc) negated their
benefits to future students by not offering key information that will help them in making
informed correct decisions in relation to their university choices. However, it was
suggested that students use league tables throughout early stages of their decision-making
process. This is supported by the research of Locke et al. (2008), who criticised the
methodologies used to assemble league tables as counting what is measured instead of
measuring what counts. Furthermore, Briggs' (2006) research indicated that student
perceptions of universities are more important than league tables ranking, suggesting
academic reputation strongly influences student choice (either negatively or positively) and
that:
“League tables are not synonymous with academic reputation” (p. 719).
That said, Dill & Soo (2005) concluded that market competition, not just across
universities, but also globally, force governments to adopt strategies of information
management and collation as methods to ensure academic quality. They also found league
tables compare university performance, acting as a potentially effective and efficient
source of information to students, universities and policy makers. Indeed, this agrees with
Thakur (2007), who suggested because of global competition league tables are considered
an important part of the HE sector.
Some UK universities have been motivated to improve their internal data gathering
processes through their academic quality rankings (Locke et al., 2008). However,
according to Dill (2014), commercial league tables do not depend on tested models or
theories of university educational performance, and:
“It is not clear this investment in information leads to institutional actions that
actually improve the educational quality of academic programs" (Dill, 2014: p. 8).
One of the criticisms facing league tables in HE is that treating inputs and outputs the same
for different universities, without considering the university mission, will place different
emphases on research and teaching quality, means no two institutions will have the same
input and output patterns (Turner, 2005). Turner also argues that use of league tables to
benchmark universities is far too simple.
Soo (2013) examined the effect of the Sunday Times University Guide league table on the
perception of university quality using data from between 2005 and 2009. This research

74
concluded that university ranking influences head teacher and academic perceptions, but
does not impact university applications. Furthermore, Soo suggested that there are more
important factors that affect perception and applications, such as reputation factors. These
results contrast Broecke (2012); he found that student applications between 2002 and 2009
were affected by ranking with greatest effect amongst the prestigious universities.
Research by Gibbons et al (2013) supported Broecke (2012) suggesting that:
“The impact of information on quality derived from league tables is strongly
influenced by the number of providers in a particular subject area” (Gibbons et al.,
2013: p. 26).
Soo’s research contradicts that of Tight (2000) who found that league tables and university
ranking has an impact on students’ choice.
Thakur's (2007) research also showed evidence that ranking systems have an impact on
universities and their stakeholders. Locke et al. (2008) suggested that the impact of ranking
on students depends on which student group is considered. League table impact tends to be
much less in regards to mature students but of high importance to international student
processes for selection of which university in the UK to apply to. Locke et al. (2008) also
argued that league tables are used by universities as Key Performance Indicators (KPI).
Later on in 2011, Brown stressed that league tables and ranking influence put pressure on
HE institutions that should not be underestimated.
In their research Locke et al. (2008) discussed the contrasting views regarding the league
tables (Table 3.3).
Supporting
Argument
Newspaper league tables compensate for a perceived deficit of
information about universities and their performance.
With the introduction of variable fees for fulltime UG courses,
applicants are becoming more discerning in choice of a university,
and competition between HE institutions is increasing.
Most of the data used by league table compilers are published by
official agencies and other respected sources.
Where opinion surveys are used, league table compilers seek the
views of experts.
The collection of statistics about performance is part of sound
institutional management practice.

75
Compilers positively seek to engage with institutions to ensure the
data they use is as accurate as possible.
In particular subjects, such as business and management, league
tables can help delineate and clarify the field.
Against
Argument
League tables are an inadequate form of guidance for prospective
students in choosing a course.
League tables present an inaccurate picture of HE.
The methods used to compile league tables are not justifiable.
League tables promote perverse behaviours amongst students and
institutions.
Rankings largely reflect reputational factors and not necessarily the
quality or performance of institutions.
Focus on generally on full-time UG students.
Table 3. 3: Summary of the league tables argument.
Source: Adapted from Counting What Is Measured or Measuring What Counts? League
Tables and Their Impact on HE Institutions in England (Locke et al., 2008).
3.3 Quality in the HE
The HE Funding Council for England (HEFCE, 2008) mentioned that university league
tables look at reputational factors which do not necessarily indicate true quality of
universities (HEFCE, 2008 cited in Soo, 2013). Dill & Soo, (2005) agreed indicating that
ranking is not a true indicator of university quality.
Unlike accreditation, which is voluntary (in theory, but compulsory in reality), Quality
Assurance is compulsory in Britain in both theory and practice (Alderman, 2000).
According to Radice (2013) and Tight (2000) the Research Assessment Exercise (RAE,
now REF) and the Quality Assurance Agency (QAA) are the two of the bodies that impose
quality control systems for both research and teaching.
3.3.1 RAE
The first RAE was introduced in 1986 and formalised explicit procedure to assess research
quality. It was then repeated in the UK in 1989, 1992, 1996, 2001 and 2008. The RAE
2008 was collaboration between:

76
The HE Funding Council for England (HEFCE),
The Scottish Funding Council (SFC),
The HE Funding Council for Wales (HEFCW) and
The Department for Employment and Learning, Northern Ireland (DEL).
Driven by peer review the RAE has direct impact on funding given by HEFCE to support
research (Radice, 2013; Tight, 2000).
Each department needs to submit four research outputs for all full-time members of staff
and research output is evaluated in terms of:
The quality of published papers (in academic journals, books, monographs or
conference proceedings).
Evidence in relation to the research environment and esteem received (can be
awards, recognition from an academic community, participation in the work of
advisory).
In 2004, The Eleventh House of Commons Science and Technology Report indicated that
the RAE had a positive effect on universities and that there is a marked improvement in
their research performance:
“… the RAE had had positive effects: it had stimulated universities into managing
their research and had ensured that funds were targeted at areas of research
excellence”.
Yet, the report suggested “the RAE in its present form had had its day”. It proposed a
model for funding:
“We proposed a funding model which combined an alternative method of
allocating money to the top departments with a reformed RAE and a development
fund for new or improving departments”.
Nevertheless, the RAE has been criticised. Tight (2000) suggested that although the
assessment is based on largely qualitative (and possibly subjective) assessment, the output
from the RAE is purely quantitative:
“no more than a single number for each subject unit” (p. 24).
Another point is that publications of fulltime researchers are ignored “Research assistants
are not eligible to be listed as research active staff” (Research Assessment Exercise, 2005:
p.18).

77
In 2014 RAE was replaced by REF (Research Excellence Framework). Through REF
quality of research is assessed, as well as its impact on society and economy by expert
panels. The results which affect university reputation are also used to allocate public
funding.
3.3.2 QAA
The Quality Assurance Framework in the UK was described by Brown (2000) as:
“The most complex anywhere in the world” (p. 335).
The Quality Assurance Agency (QAA) was formed in 1997 and has three aims (QAA,
2014):
1. Enhance the quality and secure standards of UK HE wherever delivered so as to
maintain public confidence.
2. Provide leadership through knowledge and resources, assuring and enhancing the
quality of UK HE and internationally.
3. Extend and enhance the value and reach of QAA's services within and beyond UK
HE.
The QAA (2015) code of practice covers three main parts, and each is subdivided to cover
especial themes:
1. Part A - academic standards.
2. Part B - academic quality.
3. Part C - information about HE provision.
According to the QAA report (2005) its code of practice is the:
“… guideline on good practice about management of academic standards and
quality for universities and colleges” (p. 10).
It contains 10 sections:
1. Postgraduate research programmes
2. Collaborative provision
3. Students with disabilities
4. External examination
5. Academic appeals and student complaints about academic matters
6. Assessment of students
7. Programme approval, monitoring and review

78
8. Career education, information and guidance
9. Placement learning
10. Student recruitment and admissions
The QAA assesses teaching quality through documentation and visits to institutions. The
output (TQA) is a mainly qualitative as a written report, but it is usually reduced to a group
of numbers that have an impact on league tables (Radice, 2013; Tight, 2000). However, in
contrast to RAE, QAA has no impact on funding (Radice, 2013).
In HE quality can mean service quality or quality assurance. This research is discussing the
service quality at SBS.
3.4 University of Salford (UoS)
UoS origins trace back to 1896. Its mission as an enterprising university is to:
“…transform individuals and communities through excellent teaching, research,
innovation and engagement” (UoS, 2016).
According to the University’s vision, by 2017, it will be:
“an outstanding University renowned for the quality of its engagement, humanity,
global reach and leadership in education, research, innovation”.
The university has about 2,500 staff and 20,000 students from over 80 countries, and is
divided into seven schools:
1. School of Arts & Media
2. School of the Built Environment
3. School of Computing, Science & Engineering
4. School of Environment & Life Sciences
5. School of Health Sciences
6. School of Nursing, Midwifery, Social Work & Social Sciences
7. Salford Business School
As discussed university research performance is measured by REF (previously RAE). UoS
results in REF 2014 showed an improvement from RAE 2008 in research impact and
quality. According to the university alliance, UoS is considered as:
“one of the UK’s most enterprising universities with academics taking their
research out into the real world”.

79
50% of the university’s research is considered internationally excellent in terms of
significance and originality, and 90% was of international quality (UoS, 2016). Moreover,
this quality has been reflected in the Vitae HR Excellence in Research Award and in the
2014 awards for Outstanding Contribution to Innovation and Technology and Business
School of the Year (UoS, 2016).
In the QAA report (2013) the university met UK expectations for:
Academic standards,
Quality of student learning opportunities
Quality of the information produced by the University about its learning
opportunities
Enhancement of student learning opportunities at the University.
3.4.1 Salford Business School (SBS)
The School was originally formed of four different schools:
1. School of Accounting, Economics & Management Science.
2. The School of Management.
3. The School of Leisure, Hospitality & Food Management
4. The Information Institute (which as of 2006 was deemed the name of the school).
In 2013, Salford Law School was integrated into SBS.
SBS has an excellent national and international reputation for teaching quality (SBS,
2016). Moreover, SBS courses are some of the most accredited and quality assured courses
of most universities. There are a number of globally recognised quality benchmarks, such
as:
The Association of MBAs (AMBA).
The Chartered Institute of Marketing (CIM).
The Chartered Institute of Purchasing & Supply (CIPS)
The Chartered Institute of Personnel Development (CIPD)
EPAS, the international programme accreditation system operated by EFMD.
It is also a member in the International Association for Management Development in
Dynamic Societies (CEEMAN). Furthermore, SBS offers courses with partner college
80
Robert Kennedy teaching the same materials which are delivered online. Finally, SBS won
the Times HE Business School of the Year in 2014.
Since 2012 PG taught courses at SBS have been delivered using a Block Teaching mode.
Courses are delivered in an intensive six weeks long block of single subject learning and
teaching. This means that each semester of 12 weeks would comprise two block modules.
The flexibility of this mode allows students to join the programme at practically any point
with six intakes per academic year. Each block of teaching is broken down into two three
weeks periods. These three weeks comprise of intensive two and a half day face-to-face
study at the beginning followed by flexible and online learning activities in the following
weeks. Each module also has two assignments submitted at the end of the two halves of the
module in weeks 3 and 6.
SBS uses different forms of surveys to access student feedback:
- National Student Survey (NSS)
The NSS started in 2005 as a tool to gain UG student feedback on course experience
(HEA, 2016b; HEFCE, 2016). Cheng & Marsh (2010) suggested that the NSS is not linked
directly to quality; however it shows student level of satisfaction with their experience. It is
used for all final year students in HE whether part or full-time.
NSS is run by MORI and managed by HEFCE on behalf of the UK funding bodies (MORI,
2016):
HE Funding Council for England (HEFCE).
Scottish Funding Council (SFC).
HE Funding Council for Wales (HEFCW).
Health Education England (HEE), Department of Employment and Learning
Northern Ireland, (DELNI).
National College for Teaching and Learning (NCTL)
The survey is formed of 21 questions that cover six aspects:
1. Teaching of my Course
2. Assessment and Feedback
3. Academic Support
4. Organisation and Management
5. Learning Resources

81
6. Personal Development
In addition, two more questions are included in the survey related to overall satisfaction
and satisfaction with the student union. It gives student opportunity to make comments on
their experience whether positive or negative. Students answer the survey by choosing
between:
Definitely agree
Mostly agree,
Neither agree nor disagree
Mostly disagree
Definitely disagree
Not applicable.
NSS results are often included in league tables such as those of The Times, The Guardian,
Sunday Times and The Complete University Guide. In 2015, the general response rate was
71% (HEFCE, 2016) and at University of Salford it was 77%.
- Postgraduate Taught Experience Surveys (PTES)
The PTES was launched in 2009 by the HE Academy (HEA) to gather insight about taught
PG student (Masters, PG certificate, or Diploma course) teaching and learning experience.
It’s run by as a collaboration between the HEA and participating institutions (Leman,
2015). According to the HEA (2016a), the survey focuses on:
Teaching and learning
Engagement
Assessment and feedback
Organisation and management
Resources and services
Skills development
Students’ motivations for taking their programme and – where relevant – their
experience of undertaking a dissertation or major project.
This survey is used as a tool to benchmark a university performance against others in the
sector at both university and department levels. Comparison can be customised and broken
down by course or demographics. Moreover, in order to compare between UG and PG

82
provision, some questions from the NSS are used in the PTES. Unlike with the NSS,
PTES:
“Institutional-level results are confidential so cannot be used to form league
tables. This gives institutions the freedom to treat survey results as useful but
partial indicators of where things might be going well and where improvements
might be required” (Leman, 2015: p. 5).
100 institutions participated in the PTES in 2015. The University of Salford took part in
the 2015 survey for the second time and the response rate was 16% in comparison to the
sector response rate of 29%. Data supports a need for this current study to offers further
insight into this area.
- Postgraduate Research Experience Survey (PRES)
This was launched in 2007 by HEA to gain insight from PG research students (doctoral or
masters) about their learning and supervision experience. It aims to help improve PG
researcher experience. Similar to PTES, institutional level results are not public and cannot
be used in league tables (Turner, 2015).
In this survey, students are asked to rate overall satisfaction and experience of:
Supervision
Resources
Research community
Progress and assessment
Skills and professional development
The survey runs bi-annually and the 2015 survey was the first in which UoS has taken part.
The response rate at UoS was 29% in comparison to the sector response rate of 40.4%.
- Module Evaluation Questionnaire (MEQ)
Following each module students are asked to give a feedback on that module. The MEQ is
a one sheet questionnaire formed of 21 questions cover:
Module teaching.
Assessment and feedback they received from the lecturer.
Module organisation and management.

83
Learning resources.
Personal development.
Overall satisfaction about module quality.
Students answer the questionnaire by choosing between:
Definitely agree
Mostly agree
Neither agree nor disagree
Mostly disagree
Definitely disagree.
This sheet is designed to be machine readable. Although it does not give students a space
to add comments, it encourages them to talk to the ‘programme’s student representative’ if
they have any further comments about their experience.
In addition to these surveys, there are a number of internal surveys at UoS:
The welcome recognition
Induction survey
The Salford University experience survey.
SBS is also keen to understand staff satisfaction. The Staff Experience Survey was first
conducted in 2008, then 2011 and most recently in 2014. The survey covered the following
aspects:
Overall satisfaction
Employee commitment
Leadership of the University
Leadership of my Organisational Unit
Working for the University of Salford
Immediate management/ supervision
Working environment
Working with colleagues
Working Life: Discrimination, Harassment and Bullying
Communication
PDR or appraisal
Personal objectives

84
Career development and training
Pay, benefits and recognition
Change and the future of the University
Our community and environment
Across the University the response rate was 59%, and within SBS the response rate was
55%.
In 2016 SBS took the “b‐heard” survey on colleague engagement where the response rate
was 56%. It was too late to include the survey results for this research.
3.5 Chapter summary
In this chapter an overview of UK HE has been provided. It looked at universities’ main
four categories, the importance of the HE sector in the UK, as well as the international
competition that UK HE faces. Discussion has been made of commercialisation of UK HE
and the number of funding and processes implications. The chapter has also briefly
considered league tables and how they evaluate rankings, together with criticism of these
tables. Moreover, this chapter has presented quality assessment of the HE sector through
QAA and REF, as well as an overview of UoS and SBS. In the following chapter, research
methodology, philosophy, and paradigms will all be presented along with justification for
these.

85
Chapter Four: Research Methodology
In the previous chapter, the research context of the commercialised HE Sector in the UK
has been outlined. As mentioned in the introduction chapter, this current study aims to
investigate the relation between PG student satisfaction and academic staff satisfaction
within the HE context of SBS.
According to Creswell (2013) in order to conduct research there should be a research
design, defined as:
“A flexible set of guidelines that connect theoretical paradigms, first, to strategies
of inquiry, and second to methods for collecting empirical material” (Denzin &
Lincoln, 2000: p. 22).
Research has been defined as a systematic and methodical manner used by a researcher to
ascertain scope and increase knowledge (Collis & Hussey, 2014; M. Saunders, Lewis, &
Thornhill, 2009). According to Saunders, Lewis, & Thornhill (2016) by possessing a clear
purpose, systematic data collection and interpretation are the resulting main research
characteristics. The main aim of PhD level research is contribution to knowledge through
implementation of the most suitable processes in order to satisfy the aims of the research
(Oates, 2013).
Based on this previous definition, this chapter will outline the choice and use of methods
and tools used in this research link them to the outcomes. In this chapter I will discuss:
Research methodology and the criteria for research design selection.
Research philosophy and the philosophy adopted in this study.
Research approaches and data collection tools developed and utilised to achieve the
research aim.
Research quality and its application to this research.
Adopted sampling techniques, data analysis and pilot study.
Ethical approval, researcher background and finally the chapter summary.
4.1 Research methodology
The terms method and methodology are often used as synonyms by various authors.
Therefore in the current study it is vital to distinguish between these two terms (Bryman,
1984; Saunders et al., 2009, 2016):
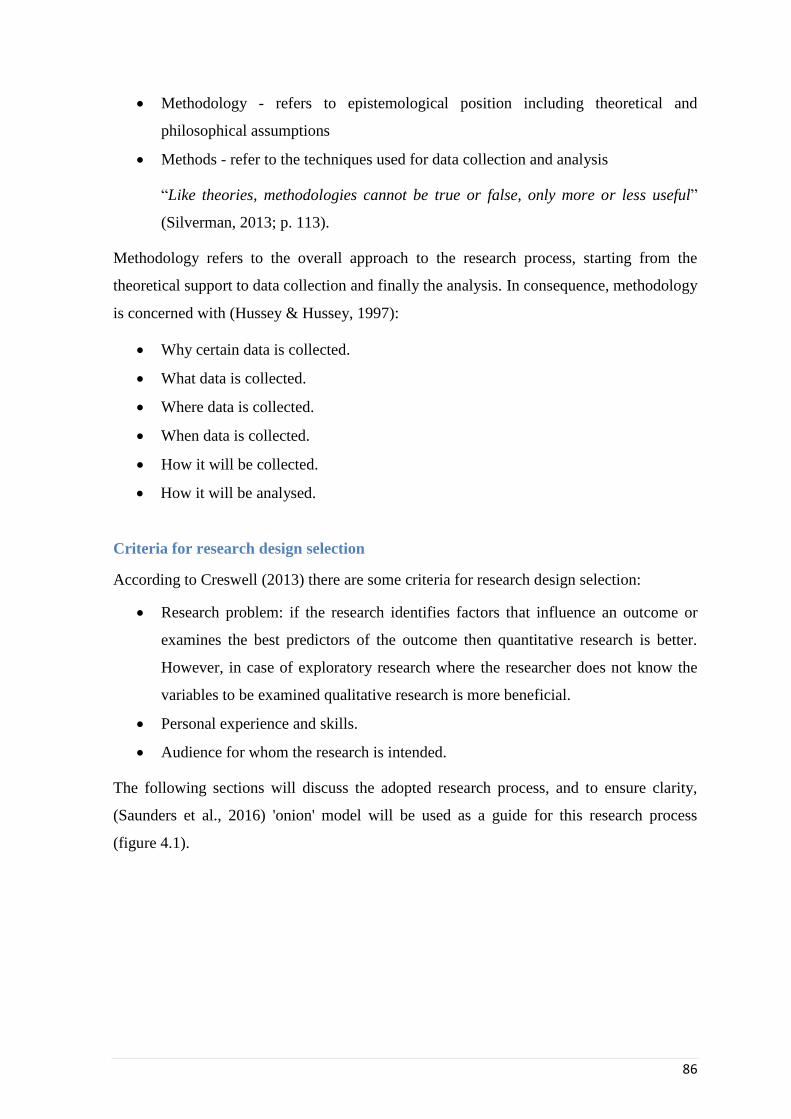
86
Methodology - refers to epistemological position including theoretical and
philosophical assumptions
Methods - refer to the techniques used for data collection and analysis
“Like theories, methodologies cannot be true or false, only more or less useful”
(Silverman, 2013; p. 113).
Methodology refers to the overall approach to the research process, starting from the
theoretical support to data collection and finally the analysis. In consequence, methodology
is concerned with (Hussey & Hussey, 1997):
Why certain data is collected.
What data is collected.
Where data is collected.
When data is collected.
How it will be collected.
How it will be analysed.
Criteria for research design selection
According to Creswell (2013) there are some criteria for research design selection:
Research problem: if the research identifies factors that influence an outcome or
examines the best predictors of the outcome then quantitative research is better.
However, in case of exploratory research where the researcher does not know the
variables to be examined qualitative research is more beneficial.
Personal experience and skills.
Audience for whom the research is intended.
The following sections will discuss the adopted research process, and to ensure clarity,
(Saunders et al., 2016) 'onion' model will be used as a guide for this research process
(figure 4.1).

87
Figure 4.1: The research ‘onion’
Source: Research methods for business students (Saunders et al., 2016).
4.2 Research philosophy
In their book, Easterby-Smith, Thorpe, & Jackson (2004) listed three reasons why it is
important to understand and comprehend research philosophy. Firstly, it can help clarify
research designs through appraisal of data collection and interpretation, and provide
answers for basic research questions. Secondly, it can assist the researcher to set a suitable
research design and determine the limitations of the chosen approach. Finally, it can also
help the researcher use new research designs and assist in adopting designs, which depend
on constraints of different knowledge or subject structures. Furthermore, the importance of
research philosophy was emphasised by Guba & Lincoln (1994, p. 105):
“Both qualitative and quantitative methods may be used appropriately with any
research paradigm. Questions of methods are secondary to questions of paradigm,
which we define as the basic belief system or world view that guides the
Narrative Inquiry
Longitudinal
Cross-
sectional Survey
Case study
Ethnography
Action research
Grounded
Theory
Experiment
Data collection and data
analysis
Mono method
quantitative
Mono method
qualitative
Multi-method
qualitative
Multi-method
quantitative
Mixed Method simple
Mixed Method complex
Deduction
Abduction
Induction
Positivism
Critical
Realism
Interpretivism
Post-
modernism
Pragmatism
Philosophies
Approach to
theory
development
Methodological
choice
Strategy(ies)
Time
horizons
Techniques and
procedures

88
investigation, not only in choices of method but in ontologically and
epistemologically fundamental ways”.
Research philosophy has been defined as:
“The use of reason and argument in seeking truth and knowledge, especially of
ultimate reality or of general causes and principles” (Oxford Compact Dictionary
and Thesaurus, 1997: p. 557, cited in Collis & Hussey, 2009).
This is related to the development and nature of knowledge, which are Ontology and
Epistemology (Saunders et al., 2009, 2016) and known as the research paradigm (Scotland,
2012). Paradigm is defined as the set of beliefs, assumptions or ways of thinking that deal
with certain world aspects (Guba & Lincoln, 1994; Oates, 2013), that is, how the research
is conducted (Hussey & Hussey, 1997). Different paradigms result from their different
views about the world nature and how knowledge can be acquired (Oates, 2013), which are
based on “ontology, epistemology and methodological assumptions” (Guba & Lincoln,
1994).
Whilst ontology is the philosophy of the reality of the nature a researcher investigates
(Collis & Hussey, 2009), epistemology is defined in the Concise Oxford English
Dictionary as the:
“Theory of knowledge, especially with regards to its methods, validity and scope”
(Soanes & Stevenson 2004, cited in Myers, 2013; p. 36).
Finally, the methodology refers to the procedures used to generate knowledge (Khazanchi
& Munkvold, 2003).
Academic communities have different concepts in relation to research philosophies.
According to Neuman (2011) and Oates (2013), there are three main types: Positivism,
Interpretivism, and Critical research. That said, Collis & Hussey (2009) classify research
paradigms into two main categories: positivist and phenomenological, referred to as
interpretivism by Saunders et al. (2016).
4.2.1 Positivism
Among the three philosophies, this is the oldest one, and has evolved over around 500
years (since Bacon, Galilio and Newton) (Oates, 2013). This philosophy perceives reality
as objective and describable by “measurable properties” (Myers, 1997). It assumes that
there is a single reality (Levy, 2006) independent of the researcher and the tools used in the

89
research. Moreover, it is generally assumed that the researcher is neither affected nor
unaffected by the research subject (Remenyi et al., 1993: p. 33 cited in Saunders et al.,
2009, 2016). Oates (2013) states that this approach has two basic assumptions: the world is
ordered and not random, and that it can be investigated in an objective way.
Positivists assume that knowledge obtained is “hard, secure and objective” (Levy, 2006; p.
375). In addition to this, they usually have highly structured methodologies which facilitate
replication processes and help generalisation to a wider context (Levy, 2006; Saunders et
al., 2009, 2016).
In general, this approach is used to test theories to increase the understanding of
phenomena (Myers, 1997). Data integrity in positivism is higher than in phenomenological
research (Bonoma 1985, cited in Hussey & Hussey, 1997). However, these concepts have
been changed through creation of software packages that help process and analyse data
such as NVivo.
4.2.2 Interpretivism
Unlike positivist research, which is dependent on quantitative data and statistics, the main
aim of interpretivist research is to understand social life by acquiring detailed qualitative
data and interpreting this to understand the phenomenon being studied (Bryman, 2008,
2012; Neuman, 2011). Myers (2013) argues that the data generated through this philosophy
is not detachable from theory, as:
“data is determined in the light of some theoretical interpretation” (Myers, 2013; p.
41).
Similarly, validity of generalisation depends on plausibility and cogency of logic used
when describing results and drawing conclusions (Walsham, 1993, cited in Myers, 2013).
The researcher using this philosophy assumes that access to reality is done through social
structures such as consciousness and language (Myers, 1997), and actually that there is no
single reality (Levy, 2006). By choosing this philosophy, the researcher needs to
understand and explore problems through the meanings people assign to them within a
specific contexts so as to comprehend the phenomena (Levy, 2006; Myers, 1997).
Interpretivism focuses on meaning in context with the context defining the situation
(Myers, 2013).
Interpretivism has six characteristics (Oates, 2013):

90
Multiple subjective realities where there is no single reality
Dynamic and socially constructed meaning.
Researchers who are not neutral.
The research is conducted in the peoples’ natural social settings.
Qualitative data analysis is preferred.
The researcher expects multiple interpretations and explanations for what happened
in the research.
In support Saunders et al. (2009, 2016) argue that due to the uniqueness and complexity of
any business situation, this philosophy is highly appropriate in cases of business and
management studies. This is especially relevant to Marketing, Human Resources and
Organisational Behaviour, as these situations result from interaction of individuals in a
specific time and particular circumstances (Saunders et al., 2009, 2016). Ultimately, this
agrees with Myers (1997), who found that this kind of research focuses on the:
“full complexity of human sense making as the situation emerges” (Kaplan and
Maxwell, 1994 cited in Myers, 1997).
4.2.3 Critical research
Critical research assumes that social reality is produced and reproduced by people. Critical
researchers focus on social critique of current conditions, as is the case with interpretivists
(Myers, 2013; Oates, 2013). Nonetheless, in comparison to the other two philosophies,
critical research is less common, although there are signs that this philosophy is becoming
more popular (Myers, 2013).
Critical researchers agree with interpretivists in criticising positivism, as they too discount
the social context. They also criticise interpretivism for being relativist and too subjective
(Neuman, 2011). This philosophy focuses on:
“The oppositions, conflicts and contradictions in contemporary society, and seeks
to be emancipatory i.e. it should help to eliminate the causes of alienation and
domination” (Myers, 1997).

91
4.2.4 Current research philosophy
Saunders et al. (2016) argue there is no better philosophy, each one being:
“better at doing different things” (p. 149).
Thus, research questions and context are the main points that determine research
philosophies (Oates, 2013; Saunders et al., 2016).
This research aims to explore the relation between PG student satisfaction and academic
staff satisfaction. Rather than testing a hypothesis, the current research questions are
concerned with “how” in a specific social context which has the possibility of leading to
multiple explanations and interpretations. With this in mind, the most suitable philosophy
is interpretivism. This avoids strict structural frameworks, unlike with a positivist
approach, and allows the researcher to flex and adopt measures to help to understand the
phenomena. It also avoids misleading results that could result from using a single
measurement or assessing the relation quantitatively. Furthermore it can capture the
meanings, understandings and perceptions of what makes reality of the data subjects
(Black, 2006; Carson, Gilmore, Perry, & Gronhaug, 2001; Collis & Hussey, 2009).
As this research aims to capture PG students and academic staff perceptions, it is necessary
to have personal interaction with the interviewees in their natural social settings to gain
understanding of the researched phenomenon (Oates, 2013). In addition to these points and
based on ontological and epistemological assumptions of this research (Table 4.1), an
Interpretivist approach seem the most suitable for this research.

92
Positivist Interpretivist Critical Research Current research
Ontological
Assumptions
"Naive Realism", in which an
understandable reality is
assumed to exist, is driven by
immutable natural laws. True
nature of reality can only be
obtained by testing theories
about actual objects,
processes or structures in the
real world.
Relativist; the social world is
produced and reinforced by
humans through their action
and interaction.
Historical realist; social reality
is historically constituted;
human beings, organisations,
and societies are not confined
to existing in a particular state.
The current research aims to
understand a social phenomenon in
SBS, which leads to subjective
interpretations. I believe that
reality is subjective.
Epistemological
Assumptions
Verification of hypothesis
through rigorous empirical
testing
Search for universal laws
or principles
Tight coupling among
explanation, prediction and
control
Understanding of the
social world from the
participants' perspective,
through interpretation of
their meanings and actions
Researchers' prior
assumptions, beliefs,
values, and interests
always intervene to shape
their investigations
Knowledge is grounded in
social and historical
practices
Knowledge is generated
and justified by a critical
evaluation of social systems
in the context of
researchers' theoretical
framework adopted to
conduct research
I believe that reality is subjective
and that I'm a part of the research.
Moreover, the interaction is
essential to understand the social
reality and context.
Data is collected in its natural
setting.
Relationship
between Theory
It is possible to discover
universal laws that govern
the external world
Generative mechanisms
identified for phenomena
in the social sciences
Generalisations point to
regularities of process
rather than cross sectional
I have no previous assumptions of a
relation and aim to gain
explanation of it.

93
and Practice should be viewed as
'tendencies', which are
valuable to explanations of
past data, but not wholly
predictive for future
situations
differences
Generalisations in critical
research focus on the
"totality" of relationships
There can be no Theory
independent collection and
interpretation of evidence
to conclusively prove or
disprove a Theory
Role of the
Researcher
Objective, impartial
observer, passive, value-
neutral
Interactive; the researcher
interacts with the human
subjects of the enquiry,
changing the perceptions
of both parties
Transformative; initiating
change in social relations
and practices, helping to
eliminate the bases of
alienation and domination
Interaction between me and the
subjects is essential to gain better
understanding of research and the
surrounding environment.
Table 4. 1: A comparative overview of the key rhetoric of major IS research paradigms
Source: Adapted from On the rhetoric and relevance of IS research paradigms: a conceptual framework and some propositions (Khazanchi &
Munkvold, 2003). Original work modifications are italicised

94
4.3 Research approaches
In the previous section a case has been established for the interpretive philosophy as the
most appropriate philosophy for the current study. This section will discuss briefly
qualitative, quantitative and mixed approaches and justifies the use of a qualitative route.
Newman & Benz (1998) state that qualitative and quantitative approaches should not be
considered two distinct categories. Instead, they should be thought of as equally valid but
two different ends of one continuum. In the same way, Creswell (2013) identified three
approaches to research:
Qualitative.
Quantitative.
Mixed methods.
He also argued that studies were either generally more quantitative than qualitative or vice
versa. On the basis of Newman and Benz’s idea, it was stated that mixed methods exist in
the middle of the continuum, and include both qualitative and quantitative approaches.
4.3.1 Qualitative research
Qualitative research has been defined as an approach used to understand social or human
phenomena and how individuals exist within them (Creswell, 2013). For this reason the
studies are detailed and in-depth when following a qualitative research route (Patton,
2002).
The qualitative research process includes questions and procedures where data is collected
and analysed inductively to build general themes or theories (Creswell, 2013; Newman &
Benz, 1998). The researcher approaches field work without predetermined categories of
analysis, which contributes to openness, depth and level of detail in qualitative research
(Patton, 2002). Qualitative research focuses on meaning to individuals and the importance
of causes of situational complexity; it emphasises words and observations rather than
numbers that quantify data describing people in real in-context situations (Amaratunga,
Baldry, Sarshar, & Newton, 2002; Bryman, 2012; Creswell, 2013). It was described by
Bryman (1984) to be a “more fluid and flexible” form of research in comparison to
quantitative research, as it looks to discover new findings that may lead the researcher to
flex their research plan.

95
This form of research is related to context and in fact sensitive to it, giving the research the
ability to examine deeper understanding of the complex social phenomenon (Punch, 2005).
According to Miles, Huberman, & Saldana (2014) qualitative data focuses on events that
occur in their natural surroundings. Additionally, it provides enhanced descriptions, and
through flexibilities in data collection tools and time, qualitative data provides a fuller
guide of the research context.
Analysis of words is the main criticism facing qualitative research, as it is argued that they
do not often provide enough details regarding data analysis (Oates, 2013). Regardless of
this, Newman & Benz (1998) stress that the qualitative research frequently provides
foundation strategies and starting points that are followed up by quantitative research.
According to Myers (2013), qualitative research can be interpretive, positivist or critical,
and it really depends on the researcher philosophical assumptions (See Figure 4.2).
Figure 4.2: Underlying philosophical assumptions
Source: Adapted from Qualitative research in business and management (Myers, 2013)
Qualitative
research
Positivist Interpretive Critical
Underlying epistemology
Influences/guides

96
4.3.2 Quantitative research
Creswell (2013) identified quantitative research as:
“…an approach for testing objective theories by examining the relationship among
variables” (p. 4).
In comparison to the qualitative approach, quantitative approaches begin with a hypothesis
(or Theory) for testing correlation between variables. The data collected is subsequently
analysed through statistical procedures determining if relations and hypotheses are correct
or not (Creswell, 2013; Newman & Benz, 1998). This research approach stresses the value
of quantification of data collected and statistical analysis tools (Bryman, 2008, 2012).
In quantitative research, researchers do not generally write about the nature of the research
(Bryman, 1984). This form of research necessitates the use of measures that are
standardised in order to fit different experiences of people into a predetermined limited
number of categories (Patton, 2002). Furthermore, whenever possible, quantitative
researchers generalise their conclusions using measures that produce quantified data (Bell,
2010).
4.3.3 Mixed method
Creswell (2013) states qualitative and quantitative techniques can be combined. Integrating
both forms of data can provide a better and more complete understanding of the problem
than a single approach. That said, Bryman (1984) suggests that using multiple approaches
may not always be applicable, and is not to be considered superior to using a single
approach. Ideally, using a combination of both qualitative and quantitative methods and
procedures should provide the best answer for research questions (Johnson &
Onwuegbuzie, 2004). Invariably, by combining methodologies (Triangulation) can be
conducted through different stages: method, strategy, time, space, investigator, and
theoretical (Johnson & Onwuegbuzie, 2004; Oates, 2013).
Table 4.2 distinguishes the concepts of strengths and weakness from the three approaches.

97
Strength Weakness
Qualitative * It is useful for studying a limited number of cases in-depth.
* It is useful for describing complex phenomena.
* Provides individual case information.
* Can conduct cross-case comparisons and analysis.
* Provides understanding and description of people's personal
experiences of phenomena (i.e., the "emic" or insider's viewpoint).
* Can describe, in rich detail, phenomena as they are situated and
embedded in local contexts.
* The researcher can study dynamic processes (i.e., documenting
sequential patterns and change).
* The researcher can use the primary qualitative method of
"grounded Theory" to generate inductively a tentative but
explanatory Theory about a phenomenon.
* Qualitative researchers are responsive to changes that occur during
the conduct of a study.
* It is more difficult to test hypotheses and theories.
* It generally takes more time to collect the data when compared to
quantitative research.
* Data analysis is often time consuming.
* The results are more easily influenced by the researcher's personal
biases and idiosyncrasies.
Quantitative * Testing and validating already constructed theories.
* Can generalize a research finding when it has been replicated on
many different populations and subpopulations.
* Provides precise, quantitative, numerical data.
* Data analysis is relatively less time consuming.
* The research results are relatively independent of the researcher.
* The researcher may miss out on phenomena occurring due to the
focus on Theory or hypothesis testing rather than on Theory or
hypothesis generation (referred to as the confirmation bias).
* Knowledge produced may be too abstract and general for direct
application to specific local situations, contexts, and individuals.
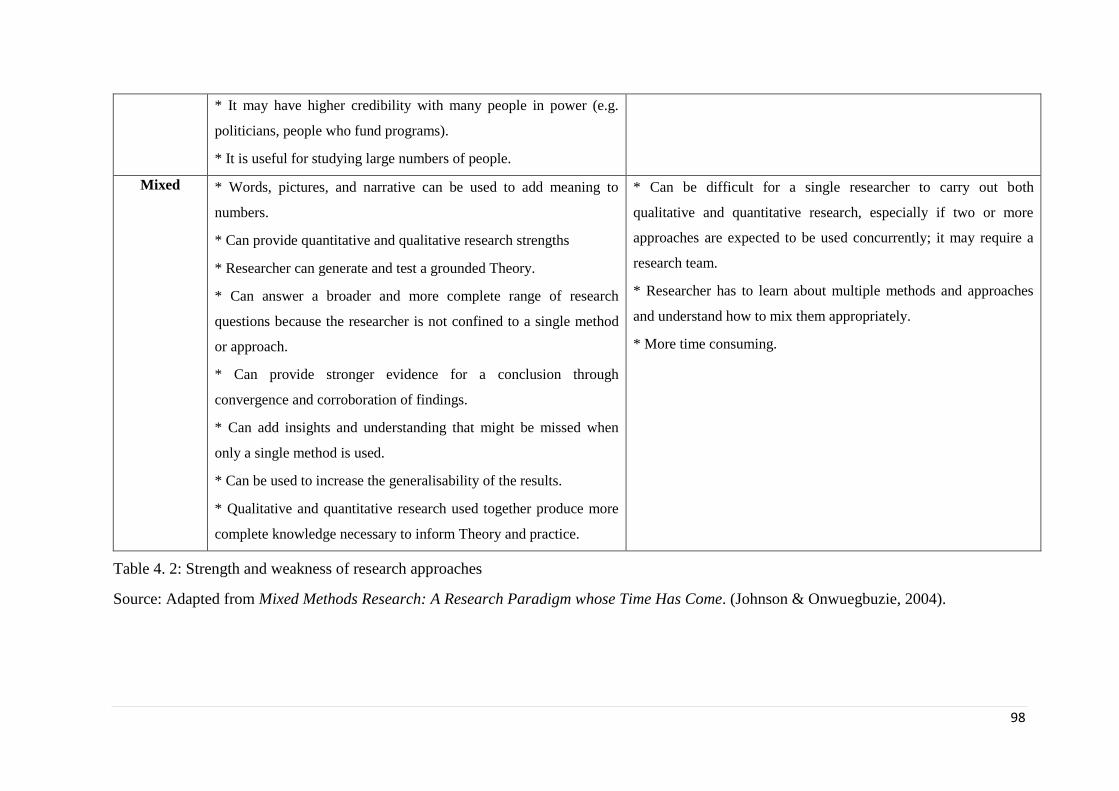
98
* It may have higher credibility with many people in power (e.g.
politicians, people who fund programs).
* It is useful for studying large numbers of people.
Mixed * Words, pictures, and narrative can be used to add meaning to
numbers.
* Can provide quantitative and qualitative research strengths
* Researcher can generate and test a grounded Theory.
* Can answer a broader and more complete range of research
questions because the researcher is not confined to a single method
or approach.
* Can provide stronger evidence for a conclusion through
convergence and corroboration of findings.
* Can add insights and understanding that might be missed when
only a single method is used.
* Can be used to increase the generalisability of the results.
* Qualitative and quantitative research used together produce more
complete knowledge necessary to inform Theory and practice.
* Can be difficult for a single researcher to carry out both
qualitative and quantitative research, especially if two or more
approaches are expected to be used concurrently; it may require a
research team.
* Researcher has to learn about multiple methods and approaches
and understand how to mix them appropriately.
* More time consuming.
Table 4. 2: Strength and weakness of research approaches
Source: Adapted from Mixed Methods Research: A Research Paradigm whose Time Has Come. (Johnson & Onwuegbuzie, 2004).
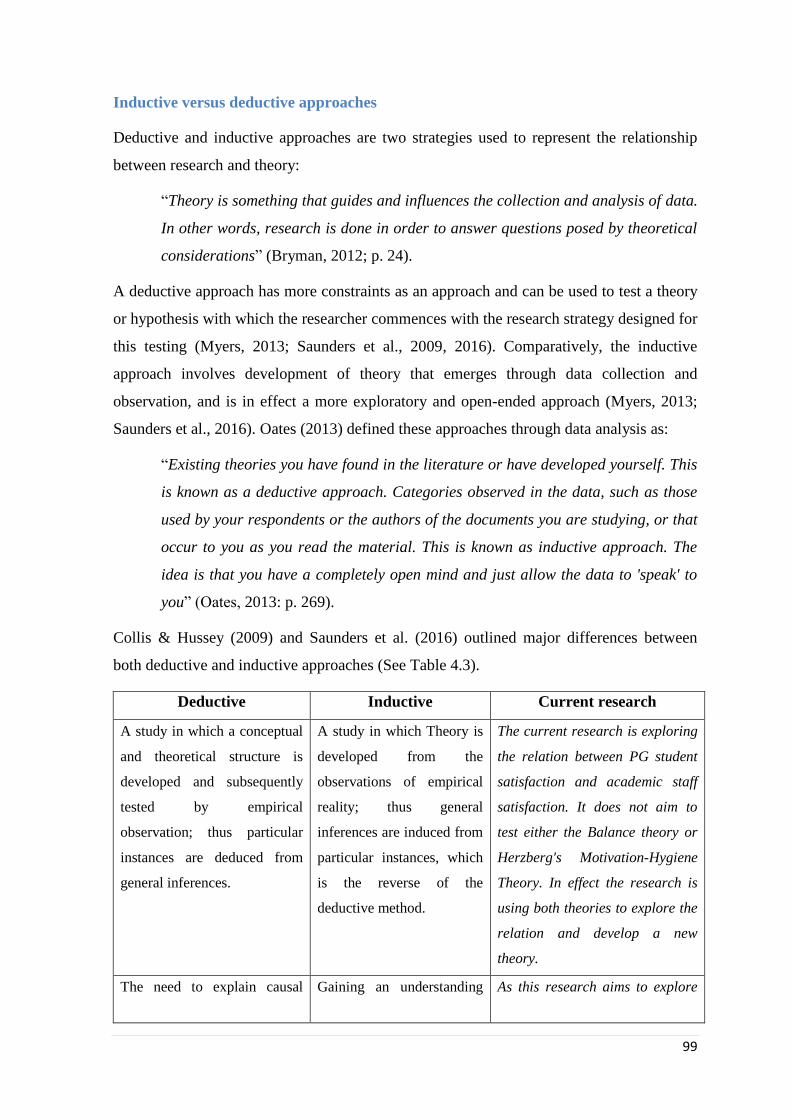
99
Inductive versus deductive approaches
Deductive and inductive approaches are two strategies used to represent the relationship
between research and theory:
“Theory is something that guides and influences the collection and analysis of data.
In other words, research is done in order to answer questions posed by theoretical
considerations” (Bryman, 2012; p. 24).
A deductive approach has more constraints as an approach and can be used to test a theory
or hypothesis with which the researcher commences with the research strategy designed for
this testing (Myers, 2013; Saunders et al., 2009, 2016). Comparatively, the inductive
approach involves development of theory that emerges through data collection and
observation, and is in effect a more exploratory and open-ended approach (Myers, 2013;
Saunders et al., 2016). Oates (2013) defined these approaches through data analysis as:
“Existing theories you have found in the literature or have developed yourself. This
is known as a deductive approach. Categories observed in the data, such as those
used by your respondents or the authors of the documents you are studying, or that
occur to you as you read the material. This is known as inductive approach. The
idea is that you have a completely open mind and just allow the data to 'speak' to
you” (Oates, 2013: p. 269).
Collis & Hussey (2009) and Saunders et al. (2016) outlined major differences between
both deductive and inductive approaches (See Table 4.3).
Deductive Inductive Current research
A study in which a conceptual
and theoretical structure is
developed and subsequently
tested by empirical
observation; thus particular
instances are deduced from
general inferences.
A study in which Theory is
developed from the
observations of empirical
reality; thus general
inferences are induced from
particular instances, which
is the reverse of the
deductive method.
The current research is exploring
the relation between PG student
satisfaction and academic staff
satisfaction. It does not aim to
test either the Balance theory or
Herzberg's Motivation-Hygiene
Theory. In effect the research is
using both theories to explore the
relation and develop a new
theory.
The need to explain causal Gaining an understanding As this research aims to explore

100
relationships between
variables.
of the meanings that
humans attach to events.
relations between PG student and
academic staff, it needs better
understanding of their perception
of the service provided and the
effect on their satisfaction and
feedback.
The highly structured
approach.
A more flexible structure to
permit changes as the
research progresses.
Using semi structure interviews, I
was able to change and add more
questions according to the
conversation to elicit further
details.
The collection of quantitative
data.
The collection of qualitative
data.
Qualitative data was collected.
Researcher independence of
what is being researched.
A realisation that the
researcher is part of the
research process.
I was a part of the research,
interacting with the interviewees.
The necessity to select
samples of sufficient size in
order to generalise
conclusions.
Less concern with the need
to generalise.
This research generalises to the
theory.
Table 4. 3: Differences between deductive and inductive approaches to research
Source: Adapted from Research methods for business students (Saunders et al., 2016);
Business research: A practical guide for UG and PG students (Collis & Hussey, 2009).
Original work modifications are italicised
Despite the classification of deductive as a quantitative approach, and inductive as a
qualitative approach, Myers (2013) argued that both approaches can be used for qualitative
research, even though the inductive is more common in qualitative research.
4.3.4 Current research approach
Based on characteristics of the approaches and the social nature of this current research
that focuses on feelings and perception of people, a qualitative inductive approach is used
throughout. This will enable me to interact with PG students and academic staff by
conducting in-depth interviews, helping to explore if there is a relation between PG student
satisfaction and staff satisfaction. A qualitative approach was adopted as a tool to help

101
describe and interpret interviewee experience (Creswell, 2013). Moreover, the qualitative
approach capitalises on the principle strengths mentioned by Maxwell (2012) through its
ability to:
Understand the meaning from the interviewee perspective of both PG students and
academic staff.
Understand the research context and how it affects the participants, in this case
SBS.
Understand the process of events and actions.
Embraces openness and flexibility that helps me to identify and flex the research
for unanticipated issues.
Finally, it can explain causal relationships.
Furthermore, Carson et al. (2001) indicated that this approach is appropriate for marketing
fields mainly because it provides in depth understanding of phenomenon.
4.4 Research strategy
Above the research philosophies and justified adoption of an interpretive philosophy have
been linked to form a suitable research approach. In this case a qualitative inductive
approach is suitable and appropriate. This section will discuss the research strategy, and
more specifically, the adoption of a case study strategy for this current research.
Saunders et al. (2016) identified research strategy as the plan used to satisfy research
objectives through the answering of research questions:
“Your choice of research strategy will therefore be guided by your research
question(s) and objectives, the coherence with which these link to your philosophy,
research approach and purpose, and also to more pragmatic concerns including
the extent of existing knowledge, the amount of time and other resources you have
available, and access to potential participants and to other sources of data”” (p.
178).
In order to select the appropriate strategy, Yin (2009) listed three factors:
1. The type of research question posed.
2. The extent of control an investigator has over actual behavioural events.
3. The degree of focus on contemporary, as opposed to historical, events.

102
According to Yin (2009) five different types of research strategies exist, and he states that
a case study strategy should be used when research questions start with either 'How' and
'Why', if the researcher has little control over events, and if the strategy focuses on
contemporary phenomenon (See Table 4.4).
Strategy Form of
research
question
Requires
control over
behavioral
events
Focuses on
contemporary
events
Current research
Experiment How, why Yes Yes The current
research
questions: How
No need to
control
behavioral
events
It is focusing on
contemporary
events.
Survey Who, what,
where, how
many, how
much
No Yes
Archival
analysis
Who, what,
where, how
many, how
much
No Yes/No
History How, why No No
Case study How, why No Yes
Table 4. 4: Relevant situations for different research methods
Source: Adapted from Case Study Research (Yin, 2009). Original work modifications are
italicised.
The current research is guided by two questions:
How can PG student satisfaction be linked to academic staff satisfaction and
explored in relation to Herzberg’s Motivation-Hygiene Theory and the Balance
Theory?
How does the marketisation affect PG student perceptions of HE?
The nature of the questions has led to the adoption of the present case study and research
strategy.

103
Stake (1995) defined a case study as the study of the particularity and complexity of a
single case leading to an understanding of its activity within important situations. Yin
(2009) contended that by setting a definition for a case study as a research strategy
produces:
“An empirical inquiry that investigates a contemporary phenomenon within its
real-life context, especially when the boundaries between phenomenon and context
are not clearly evident” (p. 18).
This form of research incorporates an:
“… all-encompassing method, covering the logic of design, data collection
techniques, and specific approaches to data analysis” (Yin, 2009: p. 18).
Yin also stated case study research is interested in interaction of factors and in some cases
it is can be the preferred design for research. According to (Remenyi, Williams, Money, &
Swartz, 1998) the aim of case study is to:
“Provide a multi-dimensional picture of the situation” (p. 51).
They also found that it is useful to show and explain relationships and patterns of influence
in some contexts. Denscombe (2014) argued that case studies focus on one or a few
instances of a particular phenomenon, providing an in-depth account of events,
experiences, processes, or relationships that occurs in that specific instance.
It is argued that case study approaches are suitable for researches providing the opportunity
to identify a deep understanding of the problem to be studied within a restricted timescale
(Bell, 1999). Moreover, it provides an explanation that can cope with the complexity of
real life situations through focusing on a sequence of events or a process description, via
studying individual or group behaviour in its 'social settings' (Denscombe, 2014; Remenyi
et al., 1998).
There are two kinds of case study strategies: single and multiple case studies. While
multiple case studies were supported by researchers as a significant strategy that can lead
to generalisation (Miles & Huberman, 1994; Yin, 2009), other researchers have supported
the single case study strategy. Dyer & Wilkins (1991) concluded that a single deep case
study is the optimum form of case study research and that multiple case studies will not
guarantee rich theoretical insight. Moreover, in 2007, Siggelkow stated that a single case
study can be used as a very powerful example:

104
“… individual cases can sometimes suffice to falsify theories, as a single
counterexample is enough” (p. 21).
Easton (2010) also supported the use of a single study:
“I believe, that it is possible that understanding one instance in depth can offer
universal understanding that study of millions of cases cannot” (p. 15).
Similarly, Darke, Shanks & Broadbent (1998) stated that a single case study allows a
researcher to conduct in-depth investigations of the phenomenon through rich description
and understanding. Benbasat, Goldstein & Mead (1987) suggested that a single case study
is highly valuable in exploratory or pilot research studies, as well as to advance more
comprehensive studies at a later stage, supported by Klenke (2008). Patton (2002) argued
that using a single case study is appropriate in three circumstances:
1. Unusual cases
2. When the case challenges, confirms or extends a Theory
3. When it is exploratory in nature and tends to set the foundations for further
comprehensive research.
Despite the fact that single case studies do not form a strong base for generalisation, “we
can learn much that is general from a single case” (Klenke, 2008, p. 65). On the other
hand, multiple case studies allow comparisons and cross case analysis, together with
investigation of specific phenomenon in diverse settings.
For the current research, a single case study approach will be adopted due to the nature of
this exploratory research in order to obtain rich data and to gain more understanding of the
context, which agrees with Denscombe (2014) that a case study works well because
“…rather than deal with isolated factors it takes a holistic view of what is going
on” (p. 56).
This also was supported by Saunders et al. (2016) who indicated that single case study
might be appropriate if it:
“… provides you with an opportunity to observe and analyse a phenomenon that
few have considered before” (p. 186).
This applies to the current research as the impact of student satisfaction on academic staff
satisfaction has had little previous attention. Moreover, limited time and resources will
mean that implementation of more than a single case study is impractical.

105
Case study justification
The UK is an example of marketisation in the HE sector. PG students have been chosen as
they are better informed and tend to look for international study opportunities in
comparison to UG markets. According to the UniversitiesUK report (2014a), the
percentage of international PG students rose from 19.2% in 2004 to 28% in 2013.
Additionally, there is a need to improve understanding of PG provision, for which in
comparison to the UG provision very little is known about it (Higher Education
Commission, 2012). The marketisation of HE in the UK has made an impact on
organisational structure, as suggested by Svensson & Wood (2007) marketing departments
have been strengthened at universities to differentiate themselves and recruit more
students. In particular business schools are at the forefront of commercialisation due to the
competitive international market (D’Alessio & Avolio, 2011; Prest, 2010). Moreover,
according to the Department for Business, Innovation and Skills report (2013) Business
and Administrative studies are the most popular PGT subject areas. One business school
that has gone through a major change programme is SBS, and can thus be perceived as a
progressive institution. This is confirmed through a number of industry awards determining
commitment of quality. Specifically, SBS has been chosen as a case study because of the
following reasons:
SBS adopts an intensive teaching mode (Block delivery), where PG students attend
lectures for two and half days then they take two - three weeks to work on
assignments. They then return to the school for other two and half days of lectures.
Two - three weeks later they have to submit another assignment or have an exam
(as it was explained in section 3.4.1).
SBS has been awarded “Times HE Business School of the Year 2014”, in addition
of being accredited from: AMBA, CIM, CIPS, CIPD and EPAS.
Data availability and accessibility. I am embedded within SBS and I have access to
PG students and academic staff. Being familiar with the school increases the
probability of accessing data.
Finally, because of the nature of some interview questions, which might include
some negative replies, interview requests were more likely to be accepted by the
staff and students from within the school. Interview questions raised some concerns
from interviewees, as some refused to record interviews, some stressed many times
the confidentiality, and some asked not to use the data in any publications other

106
than this PhD research. Therefore, this attitude made it difficult to convince
interviewees to participate in focus groups.
4.5 Data collection tools
In research, there are two types of data: primary data and secondary data. While the former
refers to the data collected through surveys, interviews, and focus groups; the later refers to
the information collected from existing sources such as publications, internal records and
databases (Collis & Hussey, 2009; Saunders et al., 2009, 2016).
As the current research is concerned with exploring whether a relation exists between
students satisfaction and employee satisfaction through answering “how” questions, I will
use in-depth semi-structured interviews in order to collect data required for this research, in
addition to the documents that are produced by SBS which are relevant to the research.
The processing of interviewing is one qualitative data collection tool involving questioning
the interviewee (Myers, 2013). In 1996, Kvale stated that the purpose of qualitative
research interviews is:
“… to gather descriptions of the life-world of the interviewee with respect to
interpretation of the meaning of the described phenomena” (Kvale 1996, cited in
Amaratunga et al., 2002: p 25).
Indeed, it has been one of the most valuable and widely used data collection tools for
qualitative research (Amaratunga et al., 2002; Myers, 2013). Interviews are used in almost
all kinds of qualitative research, positivist, interpretivist or critical, and can be conducted
face to face, on the telephone or over the internet (Hussey & Hussey, 1997; Myers, 2013;
Saunders et al., 2009, 2016).
There are three types of interviews: structured, semi-structured, and unstructured
interviews (Myers, 2013; Oates, 2013; Saunders et al., 2009, 2016). Semi-structured type is
the most suitable form to be used, as it uses the most beneficial parts of the other two types
and minimises risk. It provides a structure focusing on the main points, with the ability to
add more questions depending on the flow of the interview (Myers, 2013; Oates, 2013).
Using one-to-one in-depth interview has advantages. They encourage personal thoughts,
and gives the interviewer the ability to notice the non-verbal feedback (Sokolow, 1985;
cited in Levy, 2006).

107
Moreover, Critical Incident Technique (CIT) has been used, which according to Bitner,
Booms, & Tetreault (1990), provides more details and in-depth understanding than
questionnaires. Saunders et al. (2016) argued that it is important to use questions that are:
“grounded in the real life experience of your participants rather than being
discussed as abstract concepts” (p. 407).
Critical Incident Technique (CIT) was introduced by Flanagan (1954). It relies on a set of
steps in order to collect, analyse, interpret and categorise “observations of human
behavior" collected from participants. In 1998, Chell defined CIT as a qualitative interview
procedure where significant events or incidents are, identified by the respondent and are
investigated. It aims to:
“Gain an understanding of the incident from the perspective of the individual,
taking into account cognitive, affective and behavioural elements" (Chell, 2004; p.
48).
This technique has been used widely in several sectors such as: healthcare, airline travel,
hospitality, education, information science and banking (Douglas, McClelland, Davies, &
Sudbury, 2009; Hughes, 2012).
As with any data collection tool, CIT has advantages and drawbacks discussed in the
literature (Chell, 2004; Gremler, 2004; Hughes, 2012). Some of the advantages listed were:
CIT collect data from interviewee points of view using their own vocabulary based
on their perceptions, and this provides a rich source of data. It is a suitable tool for
data collection “because it does not restrict observations to a limited set of
variables or activities” (Gremler, 2004; p. 67).
Due to its inductive nature it is useful in case of exploratory research where little is
known about a phenomenon or in case of explanatory or descriptive research. It
highlights real live activities related to the research aim.
Using CIT in different locations give the researcher the opportunity to search for
evidence through common themes which increases generalisability.
Through the analysis process and searching for repetitive patterns, the researcher
manages to relate context, strategy and outcomes to build a larger picture. This
consequently helps relate the context to the outcome.
It enables the researcher “to manage the large amounts of qualitative data”
(Hughes, 2012; p. 75).

108
It provides rich sets of data which can “create a strong memorable impression on
management when shared throughout an organization” (Gremler, 2004; p. 67).
Moreover, it can suggest improvement in some areas.
It is useful to assess the perceptions of interviewees from different cultures.
Gremler (2004) defined CIT as a “less culturally bound technique than traditional
surveys”.
On the other hand, CIT has limitations such as:
On a methodological level, Hughes (2012) pointed out that “semi-structured
interviews were producing a wealth of data that were not accommodated by CIT”
(p. 76). It has also been criticised as dependant on the interviewee stories that could
be misunderstood or misinterpreted.
A further disadvantage is that it is 'retrospective'; participants need to recall an
incident. As incidents recalled are 'critical' this means that the participants usually
remember it.
It requires time and will power from the respondent to describe complete stories of
incidents in detail.
Flanagan (1954) argued that the CIT is flexible and does not have a rigid set of rules. He
proposed a
“… flexible set of principles which must be modified and adapted to meet the
specific situation at hand” (p. 335).
To align with Flanagan (1954) it is recommended that the following tasks are followed:
- Sponsorship of the study: he suggested the value of identifying by 'what authority
the interview is being held' to avoid wasting time in side conversations. In the
current research, a brief introduction was done at the beginning either to the
students or academic staff.
- Purpose of the study: a brief statement about the study aim and the requirements.
This has been achieved through provision of an information sheet with all details
about the research (Appendix 3).
- The group being interviewed: some participants may question why they are
participating this research. This has also been answered through the information
sheet and discussion pre-interview.

109
- Anonymity of data: participants must be convinced that their identity will not be
revealed; to give “actual descriptions of techniques” used (Flanagan, 1954).
Through the current research, each participant was given a code on the consent
form (Appendix 2). Moreover, it was stated clearly that participant identity will be
hidden and quotes made anonymous.
- The question: the most important part at the data collection process are the
questions used. This is why two pilot studies have been conducted to insure that the
output of the interview answers the research questions.
- The conversation: leading questions should be avoided. In addition, the researcher
should accept the participant is the ‘expert’ and consequently should remain neutral
to give the participant opportunity to talk. Some participants shared more than one
incident.
Through this research, the data collection process was undertaken through conducting
semi-structured interviews supported by critical incidents underpinned by SBS
documentation. The literature review has acted as a base for interview questions. Semi
structured interviews helped me to follow up using probing questions when necessary to
gain a full and clear answer to questions. It also gave the flexibility to modify questions
according to situations (Saunders et al., 2009, 2016). In order to minimise drawbacks,
interviews were accompanied by CIT. Participants had freedom to talk and even
reschedule the interview if so desired.
When a student was willing to participate in the research, we agreed on an interview date
and time. During the interview, participants were asked to discuss some critical incidents
to back up their answers. After conducting the interview, the academic staff mentioned
during the interview were contacted so as to arrange for an interview. This student and
academic staff form a dyadic relationship unit. Later, if students mentioned this academic
staff member I included him/her within that unit.
Table 4.5 represents an overview of data sources utilised through the current research.
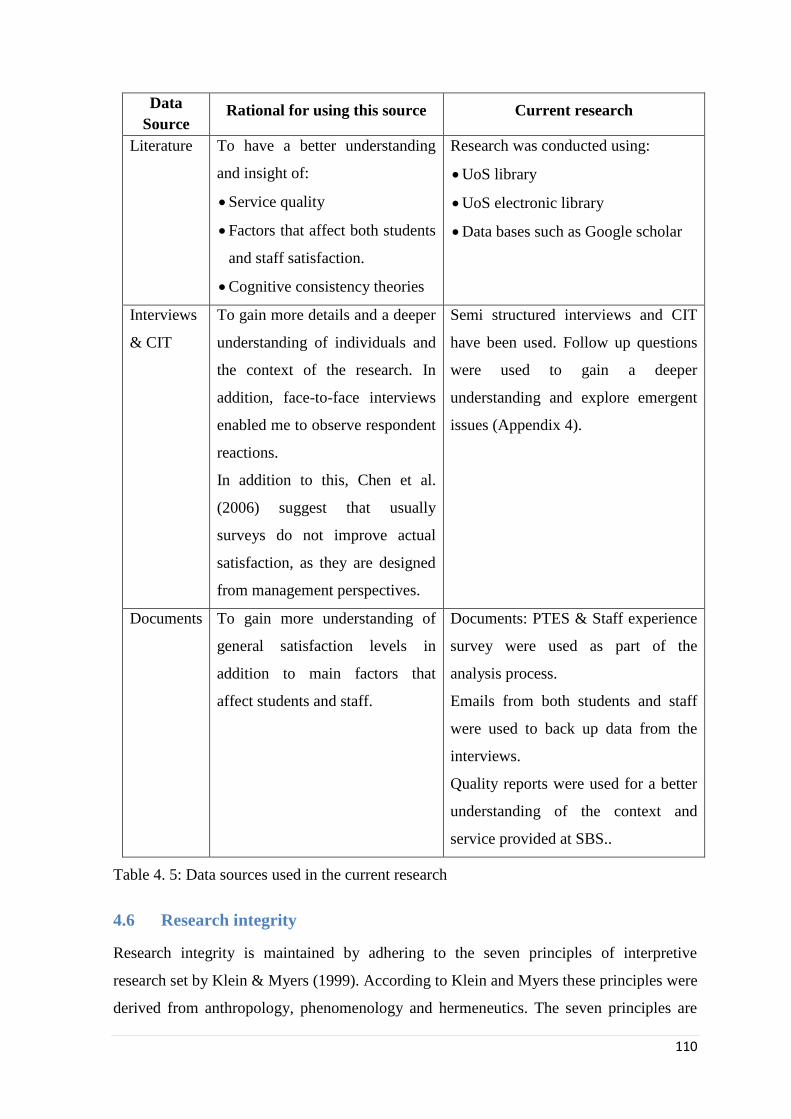
110
Data
Source Rational for using this source Current research
Literature To have a better understanding
and insight of:
Service quality
Factors that affect both students
and staff satisfaction.
Cognitive consistency theories
Research was conducted using:
UoS library
UoS electronic library
Data bases such as Google scholar
Interviews
& CIT
To gain more details and a deeper
understanding of individuals and
the context of the research. In
addition, face-to-face interviews
enabled me to observe respondent
reactions.
In addition to this, Chen et al.
(2006) suggest that usually
surveys do not improve actual
satisfaction, as they are designed
from management perspectives.
Semi structured interviews and CIT
have been used. Follow up questions
were used to gain a deeper
understanding and explore emergent
issues (Appendix 4).
Documents To gain more understanding of
general satisfaction levels in
addition to main factors that
affect students and staff.
Documents: PTES & Staff experience
survey were used as part of the
analysis process.
Emails from both students and staff
were used to back up data from the
interviews.
Quality reports were used for a better
understanding of the context and
service provided at SBS..
Table 4. 5: Data sources used in the current research
4.6 Research integrity
Research integrity is maintained by adhering to the seven principles of interpretive
research set by Klein & Myers (1999). According to Klein and Myers these principles were
derived from anthropology, phenomenology and hermeneutics. The seven principles are

111
not mandatory, although they provide the researcher with some discretion in deciding how
and when these principles may be applied.
The first principle, fundamental to the hermeneutic circle is the concept whereby
understanding and knowledge of the parts and their relationship to the whole lead to
understanding the complex entirety (Klein & Myers, 1999). This principle defines the base
for the other six principles and it guides the researcher’s application of them (Klein &
Myers, 1999). Additionally, it helps define the information the researcher seeks and how it
will be obtained. It can be used to assist in understanding and resolving contradictions in a
case study by encouraging the researcher to go back and search for missing information.
Subsequently, it can modify understanding of the whole issue.
The second principle that Klein & Myers (1999) argued was contextualisation that
demonstrates that results must be reported and analysed within the social and historical
contexts in which they were acquired.
“Interpretivists argue that organizations are not static and that relationships
between people, organizations and technology are not fixed but constantly
changing” (Klein & Myers, 1999: p. 73).
Hence, in order to gain meaningful understanding, it can only be conducted through
explicit acknowledgement of the context. This applies to the current research in that
satisfaction and service quality are greatly affected by contextual influence. Thus, context
and contextual influence can help explain respondent decisions.
The third principle is the interaction between the researcher and the subject. This
principle recognises the effect of interaction between researcher and participant (through
their understanding and perception). Similarly, this indicates that participants can be
interpreters (Klein & Myers, 1999). Moreover, researcher preconceptions regarding
participants may affect documentation, construction and process of material organisation.
Researchers must acknowledge this interaction and describe how the data was collected
and how this was affected by these interactions. In fact, within the current research, it
would be better if the researcher could remove all potential factors that affect data through
interaction with participants. However, this is not viable as interviews are the main tool of
data collection. Therefore, through investigation I attempt to avoid bias in the data
collection and analysis, and the potential effect of this interaction is accepted.

112
The fourth principle is abstraction and generalisation. While positivists test data against a
formal hypothesis, Klein & Myers (1999) encourage the use of theoretical abstractions and
generalisations to help readers to see the researcher’s theoretical insights and logic.
“Theory plays a crucial role in interpretive research and clearly distinguishes it from
anecdotes” (Klein and Myers, 1999: p. 75).
The fifth principle is dialogical reasoning. In this the researcher acknowledges and
declares their preconceptions, assumptions and prejudices that guide the original processes
of the research (Klein & Myers, 1999). Nonetheless, even though preconceptions have
been acknowledged in the first principle (Hermeneutics) in order to gain better
understanding, researchers must be aware of these preconceptions during analysis.
Invariably, Klein & Myers (1999) point out that bias and prejudice may lead to a skewed
understanding of findings.
The sixth principle is multiple interpretation, which requires the researcher to study
influences and multiple viewpoints for actions. Where applicable, researchers should
highlight and explain any contradictions and revise understandings. In the current research,
interviews were conducted with several individuals from SBS in to gain greater
understanding of their actions and influences on opinions.
The final principle is suspicion, where researchers have to search for and ascertain false
preconceptions and distortions in the data collected (Klein & Myers 1999). This principle
does not deal with just understanding words, as the researcher is also required to
understand the “social world behind the words” (Klein & Myers, 1999).
4.7 Research quality
According to Oates (2013) and Denzin & Lincoln (2000), interpretivist research quality is
assured through a set of criteria that are equivalent to those used in positivist research
(Table 4.6).

113
Positivism Interpretivism (current study)
Validity
Objectivity
Reliability
Internal validity
External validity
Trustworthiness
Confirmability
Dependability
Credibility
Transferability
Table 4. 6: Quality in positivist and interpretivist research.
Source: Adapted from Researching information systems and computing (Oates, 2013).
Those criteria have been applied to the current research as follows:
Criteria Techniques used in the current research
Trustworthiness: refers to the
amount of trust that can be
placed in the research
- Participants were assured that all information will be
dealt in a confidential and anonymous manner
(Saunders et al., 2009, 2016) in order to make them
more relaxed and willing to discuss the information
freely. Consequently, this will increase the level of
confidence and decrease the possibility of participants'
bias.
- Direct quotations were used, rather than using
summaries.
Confirmability: to check if the
findings flow from the data.
This can be tested by an audit
trial, where a research auditor
proceeds with analyzing the
raw data
- Main questions used for the interview were prepared
before the interview.
- Data analysis was based on the data derived from the
interviews only.
- NVivo software was used to ensure a clear view of the
analysis process used.
- Detailed methodological descriptions were used to
enable readers to see how themes emerged from data
collected (Shenton, 2004).
Dependability: represents the
recording and documentation
of data collection and research
- The research process (the research design and its
implementation) was reported thoroughly in order to
help readers understand the process and repeat it in
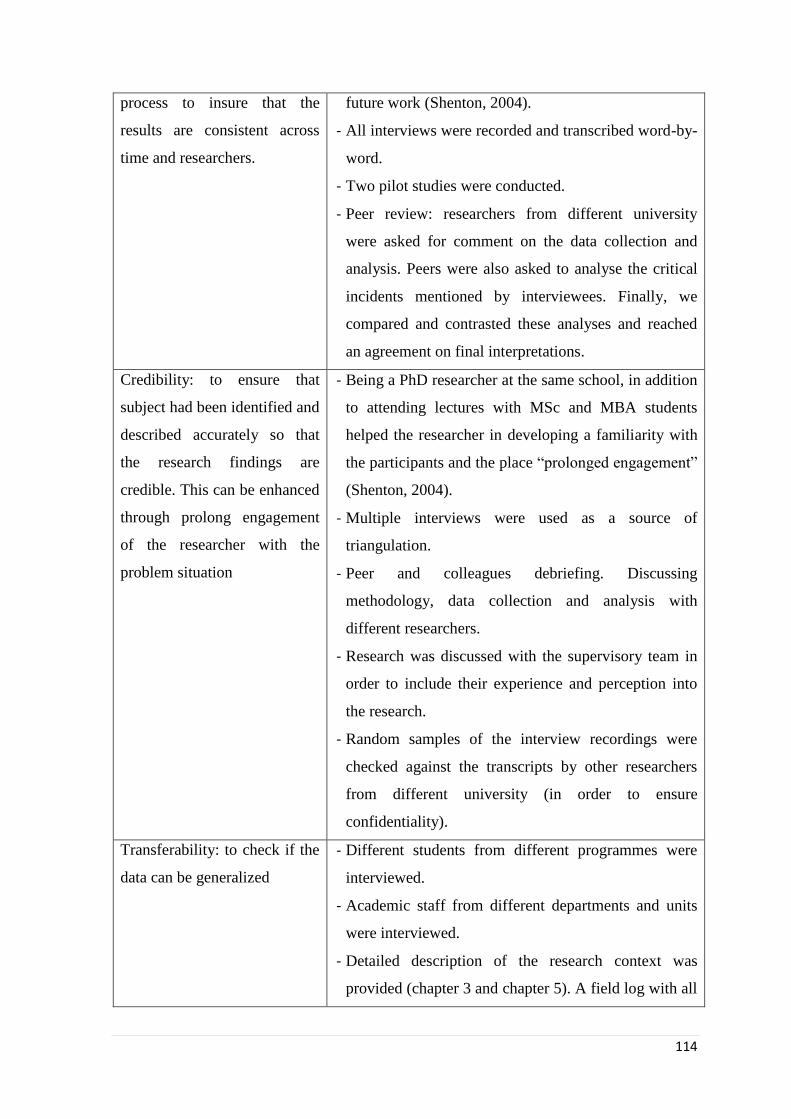
114
process to insure that the
results are consistent across
time and researchers.
future work (Shenton, 2004).
- All interviews were recorded and transcribed word-by-
word.
- Two pilot studies were conducted.
- Peer review: researchers from different university
were asked for comment on the data collection and
analysis. Peers were also asked to analyse the critical
incidents mentioned by interviewees. Finally, we
compared and contrasted these analyses and reached
an agreement on final interpretations.
Credibility: to ensure that
subject had been identified and
described accurately so that
the research findings are
credible. This can be enhanced
through prolong engagement
of the researcher with the
problem situation
- Being a PhD researcher at the same school, in addition
to attending lectures with MSc and MBA students
helped the researcher in developing a familiarity with
the participants and the place “prolonged engagement”
(Shenton, 2004).
- Multiple interviews were used as a source of
triangulation.
- Peer and colleagues debriefing. Discussing
methodology, data collection and analysis with
different researchers.
- Research was discussed with the supervisory team in
order to include their experience and perception into
the research.
- Random samples of the interview recordings were
checked against the transcripts by other researchers
from different university (in order to ensure
confidentiality).
Transferability: to check if the
data can be generalized
- Different students from different programmes were
interviewed.
- Academic staff from different departments and units
were interviewed.
- Detailed description of the research context was
provided (chapter 3 and chapter 5). A field log with all
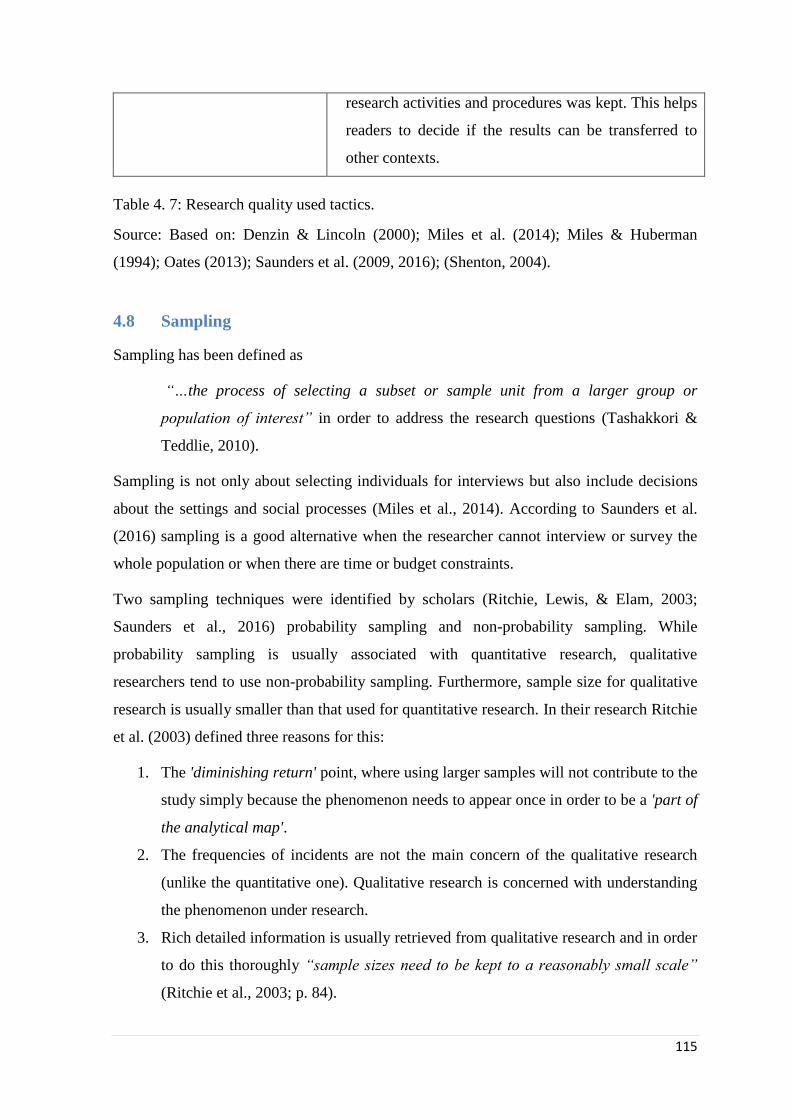
115
research activities and procedures was kept. This helps
readers to decide if the results can be transferred to
other contexts.
Table 4. 7: Research quality used tactics.
Source: Based on: Denzin & Lincoln (2000); Miles et al. (2014); Miles & Huberman
(1994); Oates (2013); Saunders et al. (2009, 2016); (Shenton, 2004).
4.8 Sampling
Sampling has been defined as
“…the process of selecting a subset or sample unit from a larger group or
population of interest” in order to address the research questions (Tashakkori &
Teddlie, 2010).
Sampling is not only about selecting individuals for interviews but also include decisions
about the settings and social processes (Miles et al., 2014). According to Saunders et al.
(2016) sampling is a good alternative when the researcher cannot interview or survey the
whole population or when there are time or budget constraints.
Two sampling techniques were identified by scholars (Ritchie, Lewis, & Elam, 2003;
Saunders et al., 2016) probability sampling and non-probability sampling. While
probability sampling is usually associated with quantitative research, qualitative
researchers tend to use non-probability sampling. Furthermore, sample size for qualitative
research is usually smaller than that used for quantitative research. In their research Ritchie
et al. (2003) defined three reasons for this:
1. The 'diminishing return' point, where using larger samples will not contribute to the
study simply because the phenomenon needs to appear once in order to be a 'part of
the analytical map'.
2. The frequencies of incidents are not the main concern of the qualitative research
(unlike the quantitative one). Qualitative research is concerned with understanding
the phenomenon under research.
3. Rich detailed information is usually retrieved from qualitative research and in order
to do this thoroughly “sample sizes need to be kept to a reasonably small scale”
(Ritchie et al., 2003; p. 84).
116
According to Saunders et al. (2009, 2016) non-probability sampling was classified into five
categories: quota, purposive, snowball, self-selection and convenience. And in qualitative
research, purposeful sampling is the most used sampling technique (Bryman, 2012; Miles
et al., 2014; Patton, 2002). Purposive sampling is also called criterion based or judgement
sampling. Nonetheless, although this technique does not allow generalisation of research
findings, it is practical when choosing individuals who have the knowledge or the best
practice in the research area. This facilitates greater understanding and exploration of the
research purpose (Bryman, 2012; Denscombe, 2014; Remenyi et al., 1998; Ritchie et al.,
2003). Furthermore, Remenyi et al. (1998) argued that this technique is "extensively used
in the exploratory research stage".
The current research is conducted at SBS. In order to achieve the research aim,
interviewees need to have knowledge and experience of SBS, thus, non-probability
sampling is most appropriate (Easterby-Smith et al., 2004). As it was essential to
interview students and staff who are informed with more experience of SBS convenience
sampling, snowball sampling, and quota sampling were not appropriate for this research.
Students studying their final module or within the dissertation process were the targeted
group. Moreover, for academic staff, they needed to have been at SBS at least for a year in
order to be more informative and help achieve the research aim. Therefore, the appropriate
sampling strategy for this study was purposive.
Along with purposive sampling, dyadic data was used. Dyad was defined as a 'something'
that consists of two parts (Soanes & Stevenson, 2006). According to Kenny, Kashy, &
Cook (2006); dyad is a:
“… fundamental unit of interpersonal interaction and interpersonal relations” (p.
1).
Due to the difficulties associated with gathering dyadic data (Arnett, Macy, & Wilcox,
2005; Lambe, Spekman, & Hunt, 2002):
“… few studies employ this advanced sampling method in the context of client-
employee interactions” (Frey et al., 2013, p. 4).
The current research used dyadic data. Dyadic refers to the relation between PG students
and academic staff. I interviewed PG students (MSc and MBA) in addition to academic
staff who teach these PG students.

117
Data collection
Data analysis
1. Data reduction
Data analysis
2. Data display
Data analysis
3. Conclusion and verification
4.9 Data analysis
Prior to analysis collected data must be prepared. According to Seidman (2013) this
process is important in tracking interview data at all stages of the research.
The second step is conducted through the initiation of collected data analysis. Qualitative
analysis for Miles & Huberman (1994) & Miles et al. (2014) was adopted as the leading
framework for the process in this research. They found that there are three concurrent
activities for analysing qualitative data: “data reduction, data display, and conclusion
drawing/verification” (Miles et al., 2014: p. 10). Figure 4.3 shows how the data analysis
activities overlap and that it starts during data collection process.
Figure 4.3: Overlapping stages in qualitative data analysis
Source: Adapted from Business Research (Collis & Hussey, 2014).
The first stage is data reduction, which has been defined as:
“the process of selecting, focusing, simplifying, abstracting and transforming the
data that appear in written up field notes or transcriptions” (Miles et al., 2014: p.
12).
Data reduction starts before the data collection phase by selecting the appropriate
conceptual framework and data collection tools. This stage continues through data
collected by different means, such as writing, summarising and coding continuing until the
final report is completed. This can be applied to qualitative data through selection,
summarising / paraphrasing, or through submitting in a larger pattern. Through this
research, interview transcripts were read several times to search for similar and different

118
themes. Once themes were detected, they were organised into nodes themed by interviewee
perspectives.
As the second stage data should be organised and compressed in a form that permits
ascertainment of conclusions and taking action through the process of:
“You know what you display” (Miles et al., 2014: p. 13).
Qualitative data is normally displayed as extended text. Additionally, Miles et al. (2014)
discussed different formats, such as charts, graphs, matrices and networks that aim to
compile data in an organised and compact form, helping to move to the next analysis step
of drawing justified conclusions. This was done with NVivo software (as it will be
described in details in Chapter 5). Tree node, free nodes in addition to models and charts
were developed in order to summarise information and provide a visualisation of the data
reduced.
The third stage is focused on conclusion and verification which involves identification of
emerging meanings and inducing conclusions from collated data, as well as testing for
credibility and validity (which was described section 4.7). According to Miles et al. (2014),
the final conclusion might not be reached until the data collection process is finalised.
Based on various forms of literature the following steps have been used for the analysis
process (Maxwell, 2012; Miles et al., 2014; Miles & Huberman, 1994; Seidman, 2013):
Students were approached via:
- Emails, which were circulated by the school admin team and some module
leaders.
- Attendance of some of modules sessions and inviting students to participate.
Based on student interviews, academic staff at SBS were interviewed, who had
been working at SBS for at least a year.
Consent forms along with participant information were filled in a safe place.
Recordings were labelled accurately.
Interviews were transcribed along with notes taken during the interview process.
Interview scripts were read carefully and thoroughly several times before starting
the analysis process. This helped increase the familiarity with the data and raise
awareness of its importance.
Memos and notes were taken while reading in order to develop an idea about the
codes and themes.

119
NVivo software was used to organise data into nodes.
4.10 Pilot study
Wilson (2010) defined the pilot study as a smaller scale study conducted prior to the main
research. It is carried out in order to:
"… test a questionnaire, interview checklist or observation schedule, to minimise
the likelihood of respondents having problems in answering the questions and of
data recording problems as well as to allow some assessment of the questions’
validity and the reliability of the data that will be collected" (Saunders et al., 2009;
p. 597).
As Yin (2009) and Maxwell (2012) stated, pilot studies are used to test ideas, refine
different aspects of a study (such as research design), data collection tools, as well as
develop further analysis and presentation. Moreover, Wilson (2010) indicated that the main
purpose of the pilot study is to increase research validity and reliability. With this in, two
pilot studies were conducted in this research. All interviews, in addition to the main study
interviews, were conducted privately with the interviewee in order to avoid bias or unclear
answers that might be given due to another’s presence.
The first pilot study was conducted with four PhD students. Two of them were academic
staff members before joining the SBS PhD programme who were interviewed as academic
staff at their own universities. The other two PhD students were interviewed as students of
SBS. Overall, the four interviews were recorded (following interviewee permission) to
ensure that data was captured accurately prior to being transcribed and analysed. The
received responses and comments helped refine questions and eliminate repetition.
After modification of the interview questions, the second pilot study was undertaken with
one member of academic staff and one MSc student at SBS. Both interviews were
recorded, transcribed and analysed to make sure that the questions were sufficient to
collect required data. The second pilot study provided in-depth information that was
supported by incidents.
4.11 Ethical approval
As this research deals with human perceptions ethical issues must be considered. Prior to
commencing data collection, I applied for the ethical approval. UoS Ethical approval for

120
this work was obtained before data was collected (Appendix 1). Before conducting
interviews each participant was informed regarding the research. The information sheet
that states the purpose and aim of the research and the rationale behind selection of
participants was given out before starting interviews. Participants were informed regarding
their rights to privacy and data confidentiality. Moreover, consent forms (Appendix 2)
were signed by interviewees before commencing. The consent form states clearly that
participation is voluntary, anonymous and that participants have the right to withdraw from
the research at any time. So as to record the interviews, participants had to approve this
which was stated clearly in the consent form. Furthermore, to ensure anonymity,
participant names were replaced by codes during the transcription process. Recordings and
data are kept on my personal laptop in a password protected folder to ensure confidentiality
of the data collected.
4.12 Researcher background
Being interpretivist and believing in subjective reality, I stipulated the relevant personal
background, which will inevitably impact on research interpretations. Therefore in this
thesis I will write in first person and I declare my interests and worldviews. Originally, I
was graduated from a faculty of pharmacy in 2001, from Ain Shams University, Egypt,
which provided a scientific background that instilled a more positivist than interpretivist
researcher perspective. In my MBA at the Maastricht School of Management the research
was structured by the criteria for managerial and leadership effectiveness and I started data
collection with surveys which did not lead to anything. So, it was necessary to re-conduct
the data collection phase using Critical Incident Technique (CIT), which produced a
completely different outcome. Through this process I lost considerable time but managed
to learn that the nature of research can be the best tool to decide a research methodology.
In addition, following training sessions conducted at the SBS I became convinced that
dealing with social nature and human behaviour requires more in depth research which can
only be achieved through in-depth interviews.
4.13 Chapter summary
Chapter four illustrates the methodology adopted for the current research in order to
achieve the research aims, as well as answer the research questions. Also, the interpretive
philosophy has been justified for the exploratory nature of the study. This includes the

121
approaches discussed, their relevance to the social nature of this study and the qualitative
inductive approach implemented through semi-structured interviews and CIT. The
following chapter discusses the findings that have emerged from the data analysis.

122
Chapter Five: Data Analysis chapter
This chapter will present the findings of interviews conducted with PG students and
academic staff at SBS. These findings will be critically discussed in relation to literature
discussed in the subsequent chapter (Chapter Six).
To achieve the research aim of exploring the relation between PG student satisfaction and
academic staff satisfaction within the marketisation of the HE context, it was necessary to
interview both PG students and academic staff at SBS. As mentioned in the previous
chapter, semi structured interviews along with CIT were used to collect data (Appendix 4).
Questions were focused around the quality factors to be provided by higher education
institutes and whether these factors are provided by SBS management or not. It also
examined satisfaction and how this links to feedback (either positively or negatively).
The main study
Not all the interviews conducted for the main study were used in the final evaluation. As
part of the quality assurance process considered for the current research some interviews
were discarded. This was due to incomplete information or because participants did not
share any useful information - i.e. they responded with yes or no and were not willing to
explain or provide details for incidents experienced during their studies. Sometimes when
students identified a member of staff, that member of staff was not available or did not
wish to take part in an interview. According to this, five interviews were discarded.
Interviews were transcribed after each interview and important notes of the responses of
the interviewees were taken.
NVivo software was used throughout the analysis. The process of learning NVivo was
started with a two-day workshop conducted by the University. Knowledge was improved
through online tutorials to gain better understanding of the software and become familiar
with the processes. I also communicated via emails with NVivo consultants for further
advice.
As with other analysis tools NVivo has been supported and criticised by researchers.
Budding & Cools (2008) mentioned that a drawback of computer-assisted qualitative data
analysis software (CAQDAS) is the time invested in the learning of the software versus the
actual advantages of using the package. Moreover, they suggest that it is not worth using

123
software for small data sets as it can be processed quicker manually. Form my experience,
as with any other software the user needs to keep a backup at all times as file corruption
occurred twice during the current research.
However, NVivo was used for the advantages it provides (Bringer, Johnston, &
Brackenridge, 2004):
1. Ability to organise data to help throughout the analysis process.
2. Ability to set a password and have multiple backups to protect data from loss or
theft.
3. Provision of quick access for data coding and retrieval.
4. Although claimed there is the possibility that it creates a distance between the
researcher and the data , Bringer et al. (2004) found instead that automation allows
the researcher more time for the analysis process.
5. Help with complex "Boolean" (e.g. and, or, not) searches which is highly
complicated when using manual tools.
6. It creates links between documents, memos, nodes and models to increase
transparency, which can be complicated when using manual methods.
The Data collection process began after obtaining the ethical approval (as it was discussed
in section 4.11). According to Patton (2002) the number of interviews required for
qualitative research depends on the purpose or the study and the resources and time
available. In the current research, the data collection process was continued until the data
collected no longer reveals any new nodes “no new insights are being discovered in the
interviews” (Myers, 2013: p. 123).
The first interview was conducted on 20 October 2014 and the last one on 30 November
2015. After analysis it was clear that there were some information missing from academic
staff interviewed. So a second round of interviews were conducted with the same academic
staff to ask them more questions and clarify few points (during March 2016).
From the tables below (Table 5.1 and Table 5.2) it is clear that the student interviews were
conducted before staff, simply and these determined which staff to interview (as I
mentioned in section 4.5 that I'm using dyadic set of data). Moreover, students and staff
were given codes to ensure that they would not be identified. Staff members were coded
St1, St2 (Staff 1 and Staff 2), and students so as to be linked with staff were given St1S1,
St2S1 (Staff 1 Student 1 and Staff 2 Student 1). Once an interview was conducted, it was
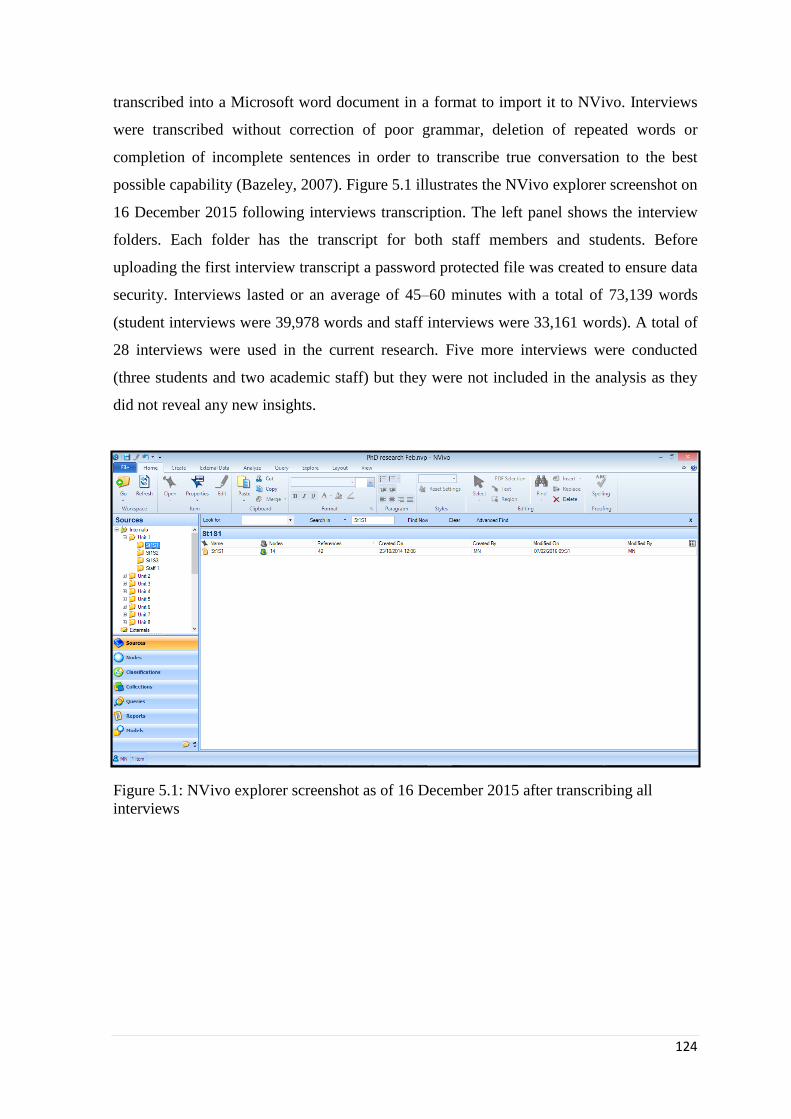
124
transcribed into a Microsoft word document in a format to import it to NVivo. Interviews
were transcribed without correction of poor grammar, deletion of repeated words or
completion of incomplete sentences in order to transcribe true conversation to the best
possible capability (Bazeley, 2007). Figure 5.1 illustrates the NVivo explorer screenshot on
16 December 2015 following interviews transcription. The left panel shows the interview
folders. Each folder has the transcript for both staff members and students. Before
uploading the first interview transcript a password protected file was created to ensure data
security. Interviews lasted or an average of 45–60 minutes with a total of 73,139 words
(student interviews were 39,978 words and staff interviews were 33,161 words). A total of
28 interviews were used in the current research. Five more interviews were conducted
(three students and two academic staff) but they were not included in the analysis as they
did not reveal any new insights.
Figure 5.1: NVivo explorer screenshot as of 16 December 2015 after transcribing all
interviews

125
Student
ID Date Past experience
Number
of words
St1S1 20/10/2014; 11:30 am Undergraduate degree from the UK (Salford) 1980
St1S2 25/10/2014; 10:30 am Undergraduate degree from the UK (London) 1527
St1S3 5/12/2014; 1:00 pm; Undergraduate degree from the UK (Salford) 1972
St2S1 27/10/2014; 12:30 pm Undergraduate from Nigeria 1200
St2S2 28/10/2014; 1:00 pm Undergraduate from Oman 1300
St2S3 5/10/2015; 3:00 pm Undergraduate from Nigeria 1583
St3S1 27/10/2014; 5:00 pm Undergraduate from Nigeria 2185
St3S2 30/10/2014; 2:00 pm Premasters in UK (Salford) 1933
St4S1 10/4/2015; 11:00 am Undergraduate from Jordan 2205
St4S2 20/4/2015; 12:30 pm Undergraduate from the UK 3659
St5S1 27/4/2015; 4:30 pm Undergraduate degree from the UK (Salford) 1902
St5S2 28/4/2015; 12:30 pm Undergraduate degree from the UK
(Wolverhampton) 1205
St6S1 16/2/2015; 10:00 am Undergraduate from Nigeria 2526
St6S2 18/9/2015; 12:30 pm Undergraduate in Canada 4258
St6S3 23/10/2015; 10:30 am Undergraduate degree from the UK (Salford) 2509
St6S4 10/11/2015; 1:00 pm Undergraduate degree from the UK (Salford) 2154
St7S1 1/10/2015; 9:30 am Undergraduate from Nigeria 1292
St7S2 30/11/2015; 11:30 am Undergraduate degree from the UK
(Greenwich) 1878
St8S1 8/9/2015; 10:30 am Undergraduate degree from the UK (Salford) 1300
St8S2 1/10/2015; 12:30 pm Undergraduate degree from the UK (Salford) 1440
Table 5. 1: Students’ interviews

126
Staff ID Date Background Number of words
St1 5/11/2014; 4:30 pm Academic 5161
St2 3/11/2014; 11:00 am Academic 1650
St3 11/11/2014; 12:00 pm Non- Academic 4263
St4 28/4/2015; 2:30 pm Academic 5306
St5 7/5/2015; 10:00 am Academic 3138
St6 5/11/2015; 11:30 am Academic 5041
St7 12/10/2015; 5:00 pm Academic 3282
St8 20/10/2015; 2:30 pm Academic 5320
Table 5. 2: Staff interviews
The following step was to code interviews and develop nodes. Nodes were developed
inductively and deductively according to interviewee answers and questions asked. For
example when staff were asked about quality factors they consider important to be
provided by school management, several factors were mentioned, and these were the base
of the tree nodes (inductive). Comparatively, questions related to organisational support
and training, for example, mentioned in literature as an indicator of management
commitment to quality were free nodes that were formed deductively. After the initial
stage of analysis the free nodes were integrated into the tree nodes by allocating the
relevant stage of these based on logic of analysis.
Figure 5.2 illustrates one of the student interviews transcribed text and the nodes
developed.

127
Figure 5.2: Screenshot of NVivo illustrating document visible coding (6/2/2016).
In order to organise the analysis process the first research question is analysed in two parts,
followed by the second research question.
5.1 How can PG student satisfaction be linked to academic staff satisfaction
and explored in relation to Herzberg’s Motivation-Hygiene Theory and
the Balance Theory?
To analyse the data related to this question, it was necessary to:
1. Analyse service quality from the student perspective, prior to opinion from staff.
2. Analyse the relation between satisfaction and feedback from the student perspective
prior to that of the staff.
5.1.1 Part one: quality and satisfaction
According to Jongbloed, Enders, & Salerno (2008) HE institutions should evaluate their
commitment to serving the demands of their stakeholders, and once the stakeholder needs
are identified, a superior quality of service can be achieved. There are various stakeholders
in HE institution and each one has their own idea about quality (Voss et al., 2007). That
said, this research is concerned with two stakeholders:
PG students
Academic staff.

128
To explore the impact of management commitment to quality on student and academic
staff satisfaction the first step is to determine what service quality factors students consider
essential in HE institutions, and whether these factors are present in SBS. Also staff
members were asked about service quality factors that they expect to be present in an HE
learning environment and whether these factors are provided by SBS. Student perspectives
were reviewed followed by those of the academic staff.
Service quality factors affecting students' satisfaction (link 1)
Through the analysis process of student interviews, five main nodes emerged in addition to
sub nodes. These five nodes were:
1. Academic staff
2. Academic services
3. Facilities
4. Supporting staff
5. Student experience.
a. Academic staff
Academic staff were the first and the main factor mentioned throughout all interviews,
based not only on the lecturers themselves but factors such as their experience and
communication.
One of the factors that was given high importance by most of the students was the attention
they received and the communication from lecturers:
“Connected with the students... we are allowed to express our feelings, our
thoughts, not just memorise… it's more engaging, more personal” (St6S4, MSc
student, 10/11/2015).
This was repeated nine times during the coding process indicating that the communication
was positive. Nonetheless, this factor was also a source of dissatisfaction for other five
students. This may have been because of the mode of teaching (Block teaching) or because
they used different communication methods during their undergraduate degrees either in
the UK or home countries.
“One thing I did find is when we have problems, even though they said email me,
Skype sessions or ever, they are never there, never answered your emails... I never
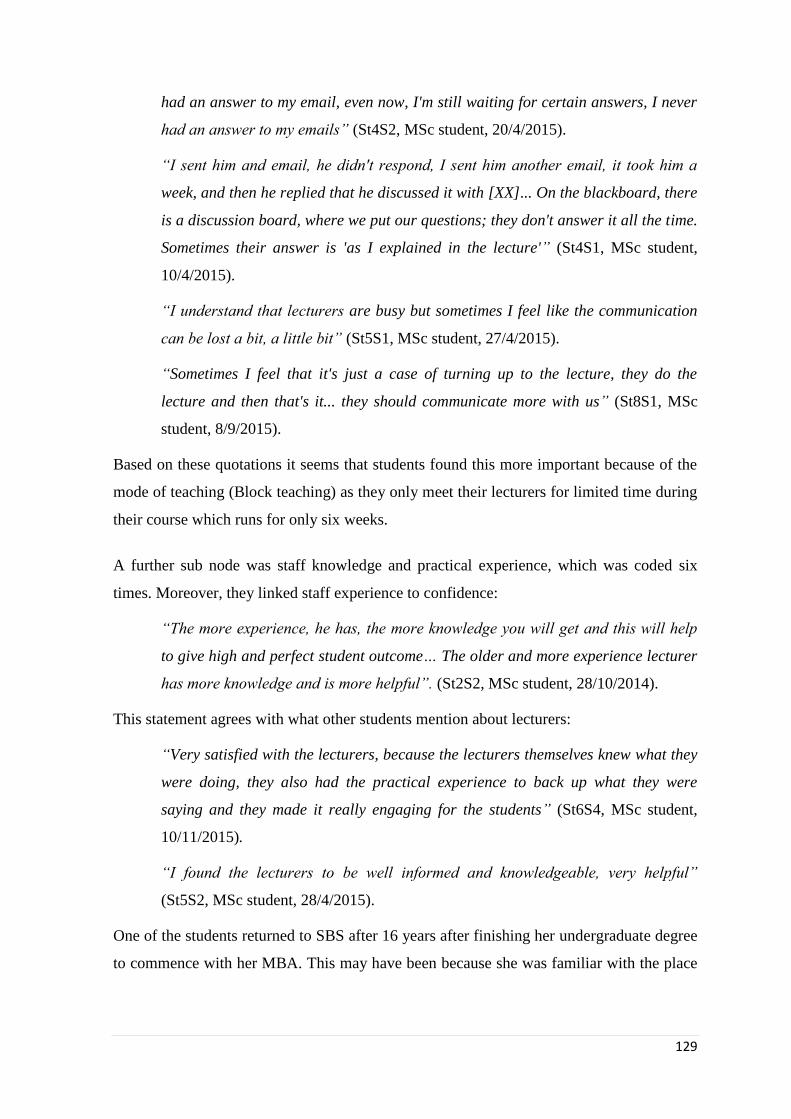
129
had an answer to my email, even now, I'm still waiting for certain answers, I never
had an answer to my emails” (St4S2, MSc student, 20/4/2015).
“I sent him and email, he didn't respond, I sent him another email, it took him a
week, and then he replied that he discussed it with [XX]... On the blackboard, there
is a discussion board, where we put our questions; they don't answer it all the time.
Sometimes their answer is 'as I explained in the lecture'” (St4S1, MSc student,
10/4/2015).
“I understand that lecturers are busy but sometimes I feel like the communication
can be lost a bit, a little bit” (St5S1, MSc student, 27/4/2015).
“Sometimes I feel that it's just a case of turning up to the lecture, they do the
lecture and then that's it... they should communicate more with us” (St8S1, MSc
student, 8/9/2015).
Based on these quotations it seems that students found this more important because of the
mode of teaching (Block teaching) as they only meet their lecturers for limited time during
their course which runs for only six weeks.
A further sub node was staff knowledge and practical experience, which was coded six
times. Moreover, they linked staff experience to confidence:
“The more experience, he has, the more knowledge you will get and this will help
to give high and perfect student outcome… The older and more experience lecturer
has more knowledge and is more helpful”. (St2S2, MSc student, 28/10/2014).
This statement agrees with what other students mention about lecturers:
“Very satisfied with the lecturers, because the lecturers themselves knew what they
were doing, they also had the practical experience to back up what they were
saying and they made it really engaging for the students” (St6S4, MSc student,
10/11/2015).
“I found the lecturers to be well informed and knowledgeable, very helpful”
(St5S2, MSc student, 28/4/2015).
One of the students returned to SBS after 16 years after finishing her undergraduate degree
to commence with her MBA. This may have been because she was familiar with the place

130
or because her friends decided to do an MBA at SBS. But upon asking her for the reason
for returning, she stated that the main reason was the quality of teaching at SBS:
“Teaching I had here previously was good" (St1S1, MBA student, 20/10/2014).
This is further supported by another who compared SBS to institutions where he had
completed both his undergraduate degree and other courses:
“Excellent lecturing, the quality of the lecturers and the knowledge the lecturers
bring and the way they deliver that, so it got to be really clear and easily
understandable to the students, and guide you enough but you can still develop
your own ideas as well” (St5S2, MSc student, 28/4/2015).
Some interviewed students pointed out that having a high number of publications and high
academic position at the school is not an indication of lecturer knowledge or experience,
talking about one of the professors, one student stated that:
“His assignment wasn’t clear; it wasn’t clearly expressed or defined. No clear
guidelines... even his feedback wasn’t clear. I feel that he didn’t care” (St2S2, MSc
student, 27/10/2014).
This agrees with a lecturer who stated:
“We have good professors, which might be good researchers, but they are not good
teachers” (St4, 28/4/2015).
The same idea was discussed by an MBA student, who claimed not all staff members
shared the expected level:
“I was quite lucky that every single module I've studied here I had very good
teachers... Apart from one, the [XX] course, but other than that, the quality of the
teachers was very good” (St1S1, MBA student, 20/10/2014).
However, one student noted that although communication is very important that sometimes
having knowledge is not enough to deliver information:
“The lecturer had a whole of knowledge but in order to communicate that the
teaching was bad” (St4S2, MSc student, 20/4/2015).
These opinions were in line with PTES (postgraduate taught experience survey) results
conducted by the school, where 80% of the students indicated that they felt that staff
members are capable of explaining things.

131
Moreover, two students believed that being able to use and implement new technology and
link it to the course is one criteria of a successful lecturer. One of the students, who had her
undergraduate degree at SBS was satisfied due to the ability of the academic staff to use
and implement technology in the courses they taught:
“They are up to date with what the technology progressing into and that was very
good” (St1S1, MBA student, 20/10/2014).
This was not mentioned by any of the other students. This could be because students who
mentioned this were involved in courses that needed good knowledge of technology or
equally because they did not have good technological backgrounds versus other students.
Through the revising of courses students were studying, it seems that those two students
did not have a technological background, as I interviewed other students from the same
courses and they did not mention the use of technology as one of the factors that affects
their satisfaction.
Overall, it seems that students believe that academic staff are the most important factor that
affects service quality provided by the school. Moreover, they set a list of criteria for those
staff such as:
- Attention and communication they devote for students
- Knowledge and experience they have,
- Ability to use technology
Figure 5.3 illustrates the main node (academic staff) and the three sub nodes linked to it.
Figure 5.3: Criteria of academic staff

132
b. Academic service
The Academic service provided by SBS from the student point of view was concerned with
three sub nodes:
Providing research environment
Providing international experience,
Providing personal tutors.
The first sub node, providing suitable research environment, was highlighted by less than
half of the interviewees (five students), mainly those who had their undergraduate outside
the UK. A research environment is offered by the school (according to the students)
through experienced lecturers and through the training courses which are delivered by
specialised staff:
“The school gave me a whole week training to prepare for my dissertation from
Monday to Friday. We were taught various techniques and methods that will
prepare us if we were going to have the dissertation” (St2S2, MSc student,
28/10/2014).
Courses offered by the university are not only related to the MSc or MBA degrees that
students will have by the end of their programme. It also helps students when English is
not their first language, or those who have not been trained to write in an academic style:
“Programs those support students to improve their research and writing activities,
like right now I just came from a wordscope class which gave me basic background
on how to write”. (St3S1, MSc student, 27/10/2014).
“There are a lot of workshops here... a lot like my old school, my university,
undergrad, they provided workshops here as well but I feel that here is just easily
accessible, like they constantly send you emails, you feel like you never miss an
opportunity to go to one... you always know what's going on.” (St6S2, MSc
student, 18/9/2015).
These courses and workshops, helped the students to develop their researching skills
through the course, which was presented in the PTES, as 85% of students believed their
research skills have been developed during their courses.

133
The second sub node was providing the students with an international experience. This was
highly appreciated by the students who had the opportunity to visit Hong Kong, Spain and
Dubai (four students):
“The opportunities that were given to actually go abroad and see the business abroad,
my trip was to Hong Kong I have the So ya this was one of attractive things that came
along with the package” (St1S1, MBA student, 20/10/2014).
“We went a step further and we went to see how businesses have been marketed in a
foreign country” (St6S1, MSc student, 16/2/2015).
Moreover, students who had this opportunity were more satisfied with the tuition fees they
paid than others:
“In that price, for international business students in the masters, it included a trip to
Spain, which is really nice and very helpful as well to get in some knowledge of how
operations are done in environments different than the UK” (St6S4, MSc student,
10/11/2015).
The final factor related to academic services offered by the school was personal tutors. It
was mentioned eight times during the coding process and the feedback on that factor
varied. Two students did not know that they have personal tutors:
“I don't know if I have personal tutor” (St5S2, MSc student, 28/4/2015).
Whilst two students who knew their personal tutors had not managed to meet them were
not satisfied with this:
“I didn't communicate with my personal tutor” (St8S1, MSc student, 8/9/2015).
“I sent an email to her when I first got here, she wasn't available; when she was
available, I wasn't available. I didn't have any relationship with her” (St6S1, MSc
student, 16/2/2015).
But those who had a chance to meet their personal tutors were very satisfied with them
(four students):
“You have one to one meetings and that's what I really like here because at my old
school you wouldn't get the same persons. So it's like when you have a family
doctor, they know your history, they already know, like ok so this is how you were
last month, so with the personal tutor they already kind of have a history on you,

134
every time you meet them you, that relationship builds and I think that's really good
here” (St6S2, MSc student, 18/9/2015).
“She's brilliant, very good person” (St7S1, MBA Student, 1/10/2015).
Overall, academic services provided by the school were appreciated by students and
affected their satisfaction. Figure 5.4 summarises this node.
Figure 5.4: Academic service node and associate sub nodes.
c. Facilities
From student points of view facilities were divided into two parts:
Physical facilities
IT services
Physical facilities such as the physical library and classes in addition to the media city
campus were another factor that were considered important by the majority of the students
(twelve students). Nonetheless one student felt that she “cannot compare it to the
Manchester business school” (St1S1, MBA student, 20/10/2014), although this was not the
opinion of other students:
“The facilities are very good, this is a fantastic building (Salford Business School -
Media City Building). The library is awesome too. The fact that we can spend the
whole day there, it is open 24 hours... the fact that it is open around the clock is a
plus for us and it's quite spacious... I mean there is a lot of space for you to come
and study... So, the facilities are really good” (St3S2, MSc student, 30/10/2014).
“As the business school… having all the books that you need and all of kind of,
reference material that you need” (St5S2, MSc student, 28/4/2015).
In addition to physical facilities, student satisfaction was affected by the IT services

135
provided by the school. It was coded four times and one of them was a source of
dissatisfaction.
“The technology that is been in place, for instance may be you with your ID card
can do everything, you can access your records, you can do everything” (St2S3,
MSc student, 5/10/2015).
Blackboard was one of the factors that affected student satisfaction. While three of the
students interviewed were satisfied with it:
“I like the interactive blackboard thing, I like the fact that I can go online and
access what I want to see, what I'm gonna have for the next week... It's fantastic”
(St6S1, MSc student, 16/2/2015).
“The blackboard is really good so you can easily access the information, quickly
and easily” (St5S2, MSc student, 28/4/2015).
One student had issues with it:
“I have an issue with for the past one year and currently as I speak to you now, I'm
just appealing with the school board about my marks because of the incidents that
happened this time I'm not being able to meet up, you know, with the deadlines”
(St6S3, MSc student, 23/10/2015).
Despite this it seems that students were satisfied with the facilities provided by the school,
yet agree that there is a room for improvement. It also confirmed the PTES results that
around 86% of the students were satisfied with the library, resources and support services.
Figure 5.5 summarises this node.
Figure 5.5: Facilities node and its sub nodes.

136
d. Supporting staff
One factor highlighted by students was supporting staff who are part of the school and
from whom students expect to receive help alongside their studies. This factor was coded
eleven times during analysis. While one student was satisfied with the supporting staff:
“like the fact that the staff there particularly the non academic staff at the front
desk, they are very approachable, you can just walk in and say I have a problem
and then they are there for you” (St6S1, MSc student, 16/2/2015).
The rest of the students (ten students) expressed their dissatisfaction with SBS supporting
staff. One student mentioned that she anticipated the supporting staff to assist her in
obtaining certain new contacts for her final project, and when this was not offered she
became disappointed (St1S1). Furthermore, another student mentioned that he had been
disappointed when the email he was expecting from the university to assign him a
supervisor was delayed by a week (his expectation was based on a piece of information
that was delivered by the university) (St3S1).
Other students said that the communication between them and the supporting staff needed
to be improved:
“I've noticed that with some of my peers, they might have been told something and
then they tell me and I wasn't aware of this... I've also received an email about my
next module which is my dissertation and I emailed like for more information about
it and they said oh sorry that was an old email, you shouldn't have got that, from
last year!... And it's a lot as well; you get sent a lot of stuff and its hard” (St5S1,
MSc student, 27/4/2015).
“I found that a little bit tricky to start off with, booking on to the course... I did
have to email quite a lot of people and different departments to trying to get me
actually to the course, that was a lot of persistent from me to do that” (St5S2, MSc
student, 28/7/2015).
“They change the venues without prior notice!” (St8S2, MSc student, 1/10/2015)
Overall, students were not satisfied with supporting staff at SBS.

137
e. Lectures
Students interviewed discussed the quality of the lectures offered at SBS from two angles:
The nature of the lectures, as students at SBS are exposed to Block delivery mode;
Venues and timing of lectures.
Block delivery was one issue that was discussed during the interviews. One of the students
described this mode as a 'bus' in a positive way, as it enabled her the opportunity to meet
different students from different courses:
“I don't think you understand it until you do it, so you're in and then not in for
three weeks, but then the work load; you need the three weeks to do the work.... It's
like a bus, everyone get-in in a different time” (St5S1, MSc Student, 27/4/2015).
However, opposing ideas were very clear during the interviews and six students
appreciated this mode:
“I think it is a good thing because it helps us, the students, to concentrate and focus
on a particular module and get it done while when you have to study different
things at different times you lose focus there and at the end of the semester you get
start for preparing for three or four modules to have exams...you take more time to
focus and understand” (St3S2, MSc student, 30/10/2014).
“The block delivery is the best thing that has happened to any university... a lot of
people have jobs... I come here for 3 days, I go back to Nigeria for one month and
then to come back again... so without block delivery you are missing out a lot of
opportunities”. (St7S1, MBA Student, 1/10/2015).
Others (eleven) were against this mode:
“I think it's the worst thing here. To have lectures from 10 - 5 we get a lot of
information... It's an advantage to start in November, as you have 5 intakes per
year, it's very flexible, but for me, I would rather wait for a year and join a
university with traditional delivery mode” (St4S1, MSc Student, 10/4/2015).
Another student explained that block delivery needs commitment from lecturers to respond
to student queries:
“I think if they fulfilled what they said, ‘I'll be available for emails’... it would be
fine, but if you not, then it might be better to go with the traditional way” (St4S2,
MSc Student, 20/4/2015).

138
“The negative part is information overload" (St7S2, 30/11/2015).
Regardless, this form also had other disadvantages, as according to one student, the two-
and-a-half days were not enough to build a relationship with other students, which was
augmented by the fact that attending the drop-in sessions was not obligatory. This
consequently affects new students who sometimes do not understand specific parts of their
assignments when they are new, do not have friends to discuss it with them, or they are too
shy to ask the lecturer:
“I have a friend who is doing a MSc in HR and she was telling me that she didn't
think she did so well in the assignment because she didn't really understand the
questions so just went ahead and did what she understood. When she go back to
class, she got realise that she would've done it a bit better than what she did in her
assignments, now she learned to go and ask the lecturer... speak to him or her and
get to know what she needs to do” (St3S2, MSc student, 30/10/2014).
Overall, some students interviewed were not very satisfied with the time and tools
allocated for communication with their lecturers away from the class. Through the PTES
survey, around 45% of the students failed to agree that the contact time was sufficient.
In addition, a further factor was in relation to the duration of the lectures, as the long hours
of teaching can result in students becoming tired and it “become harder to follow up with
the lecturer” (St2S2) after finishing the first 4 hour lecture. However, not only long hours
affected student satisfaction regarding the service quality provided by the school, but also
the venues allocated for the lectures. This point links back to the administrative staff, as it
was mentioned repeatedly during the interviews that there were no clear communication
between the administrative staff from one side and the students and the lecturers from the
other side:
“We once had a lecture and we didn’t start on time because the venue wasn’t
available” (St2S2, MSc student, 27/10/2014).
This was also pointed out by one of the lecturers:
“Timetabling staff have changed the venue of one of the seminars, but I didn't know
as a lecturer, I went to one building and I was waiting for students. All students
were in another building and were waiting for the lecturer” (St4, 28/4/2015).
One of the students who had completed his undergraduate studies at SBS was disappointed
with venues, as they were smaller to the ones he used during his undergraduate degree.

139
This links back again to physical facilities. The other students were very satisfied with the
Media City building, apart from one student who was disappointed:
“It has theatre seating... We had two lectures where the mic didn't work and we
didn't hear a lot of parts of the lecture” (St4S1, MSc student, 10/4/2015).
Figure 5.6 summarises the current node.
Figure 5.6: The 'lectures' as a main node and the related sub nodes.
f. Students Experience
Apart from the academic and educational side; students stated that having a social life is
one of the services they expect from the school as well.
Some students (four), especially international students, highlighted the importance of
having social activities, especially if they don't have contact with their colleague except on
two-and-a-half days every two or three weeks:
“As an international student, they should help me with the simplest things... kind of
get you involved in a lot of things” (St6S2, MSc student, 18/9/2015).
“Despite uni life, but outside uni... we students, sometimes you need a break from
your head; you can't just be studying all the time; so I'd be expect the university to
be engaging with the student, but I feel that the university is more engaging with
undergraduates than postgraduates and PhD students, we are more left behind like
they don't care about us as they do with undergraduate” (St7S2, MSc student,
30/11/2015).
Having international students was one of the factors that attracted some student attention
(four students). They marked that as evidence for the quality of service provided at the
school. They also noted that this presence enriches their experience:

140
“Having a multinational culture at SBS is one of the positive points about the
school” (St1S1, MBA student, 20/10/2014).
“International environment, having students from different countries... different
cultures and different experience” (St6S3, MSc student, 23/10/2015).
Moreover, one staff member mentioned this point as one of the strengths of SBS:
“… every single person is being from different country; that's fantastic” (St8,
20/10/2015).
Figure 5.7: Students experience node and related sub nodes.
Despite the fact that all of the students interviewed were satisfied with the service offered
by the school which they thought was good, when they were asked whether there was
anything absent or possible to improve, they shared some of the factors that were either
provided by the school and needed to be improved, or ones that were not provided
presently that they believed should made available by the school.
One student suggested synchronising between the School system and the university
accommodation facilities especially in that the school offer a great opportunity for students
to join through six intakes during the year, whereas, the accommodation starts at the
beginning of September:
“You know because Salford Business School we have six intakes (I think the other
schools have two intakes), so I'm having issues with them because they are saying I
came-in in September, which is not so... I had to come in November and the system
says that I came-in in September, so they are charging me extra, so that's
something that needs to be worked. They should synchronise between school and
admin systems” (St3S2, MSc student, 30/10/2014).

141
Another student was dissatisfied with the UKBA forms (which has been replaced by
UKVI) that he and other international students had to fill in daily and thought that a
different way must have be feasible. He knew that it was obligatory, but:
“I mean this country is advanced, do we have to fill-in forms in class all the time?
Could not that be like an electronic system?” (St3S2, MSc student, 30/10/2014).
All interviewed students agreed that management through their commitment to quality
affects service quality they receive as students. Indeed, management control the service
delivery factors that affect students’ satisfaction:
“I think both management of the school and of the course are linked and committed
to quality... both affects students’ satisfaction... The management of the school are
responsible for the quality of the lecturers they engage and yes, it all has impact...
how much they spend on the resources and what's needed for the lectures and the
innovation... this has impact on the quality of the service provided” (S2S2, MSc
student, 27/10/2014).
Another student mentioned that even if management are committed to service quality then
there should be a clear way to deliver it:
“They knew what they were doing, it was clear to them what they were doing, but I
don't think it was communicated very well” (St4S2, MSc Student, 20/4/2015).
Where some of students questioned the current management commitment to quality
regulations, apart from their efforts to gain external recognition in the form of
accreditation:
“Probably no... It's probably just something to say to make them look good and to
give them good reputation but probably no” (St8S1, MSc student, 8/9/2015)
“Yes sure... if they are looking into quality of the university differently, they have to
find that from students about how they feel, but I think the university... well they
might do that, they find out from students but they are doing nothing about it”
(St7S2, MSc student, 30/11/2015)
To summarise the first part from section one, it was clear that there are several
factors affecting student satisfaction with service quality. These included academic
staff, facilities, supporting staff and academic services. From the opinions of students
who were interviewed throughout the research (either MSc or MBA students), overall they

142
were satisfied with the service quality provided by the school and they agreed that
management commitment to quality affects student satisfaction. Figure 5.8 shows the
quality factors mentioned by students.
Figure 5.8: Nodes and sub-nodes representing quality factors mentioned by students
Figure 5.9 represents the nodes mentioned by students. The width of the coloured strips is
proportional to the number of times this node was coded through interviews. From this
figure it is clear that academic staff was the most mentioned factor by students, while
students experience was the least one. Figure 5.10 represents the nodes emerged through
the analysis process where the sources represents the number of students mentioned this
node and the references refer to the number of times this node was coded.

143
Figure 5.9: Matrix query of the text passages coded for students.
Figure 5.10: Nodes emerged from the coding process

144
Quality factors affecting academic staff satisfaction (link 2)
Based on the literature it was anticipated that the service quality factors that affect student
satisfaction are contrasting to those that affect staff satisfaction, although both are
considered stakeholders of HE.
Through analysis four main nodes were identified by academic staff as the factors that
affect the quality of service provided to them by school management:
Job design
Supporting staff
Facilities
The school environment.
a. Job design
The analysis process of the academic staff interviews perception on factors that affect the
quality of service provided by SBS found that there were three sub nodes related to job
design:
Workload
Rewarding
Career progression & academic goals.
There was high consistency amongst participants with regards to workload. This factor was
mentioned in all interviews. The majority of them (seven) mentioned workload as a factor
that affects their satisfaction in a negative manner and it was given high importance. While
one staff stated that workload is intensive but he did not feel that it was a source of
dissatisfaction.
In an ideal situation, there should be a balance between teaching, research, office work,
and life, which is not always available in reality:
“We have unhealthy work life balance... it seems to be the nature of the work that
we do” (St5. 7/5/2015).
This might be because of the long teaching hours as SBS has adopted an intensive teaching
mode (Block delivery). In addition, the school has a high staff turnover, which meant that
two of the eight staff that took part in the current study left the school within 12 months.
According to the school, since 2006 (until 2016) there were 125 starter academic staff and

145
170 leavers. That said, based on the interviews, in addition to notable workload for
teaching, there are other activities that take place and consume time; for example:
accreditation, events, enterprise activity with companies, and PG workshops. All of these
activities alongside teaching loads leave little time to research leading to dissatisfaction of
the academic staff:
“In terms of workload allocation, I believe I'm overloaded with teaching and I'm
not really happy about it” (St2, 3/11/2014).
“If everybody contributed towards that pot, other colleagues, the pot will be shared
out more, but there is only a certain amount people who share the pot, who
contribute and those who don’t contribute towards it… they just seem to have more
spare time than we do and you never know who is these colleagues are. And that is
a pain” (St3, 11/11/2014).
Furthermore, another lecturer stated that workload is not merely teaching, but often relates
to solving certain problems related to timetabling, which should be one of the
responsibilities of administrative staff:
“Admin staff I think are not doing their job really good... The workload in this
university is high not only because of just teaching, some of my workload is coming
from poor organisation” (St4, 28/4/2015).
“We have to spend hours and hours going around, finding stats on students” (St6,
5/11/2015).
This workload is exaggerated because of Block delivery and this consequently shrinks the
time allocated for research:
“It's like a production line... two and a half days block delivery, teach them, two
weeks later they got exams, you gotta get the exams marked within two weeks, and
all the marks back at the external... and then it starts again. So, it's... it's a factory...
and then of course you've got the added delights of them saying in your yearly
assessment: I noticed that you haven't publish any articles, no I haven't... been too
busy teaching, marking, running programmes, running modules, attending
meetings... things like this” (St6, 5/11/2015)
“There's no time... I also teach undergraduates; so if your undergraduate is
finished and you are not doing the block delivery; you may be got... may be got a

146
week or two weeks time before the next block delivery; but then it goes back again!
It's not enough for research” (St8, 20/10/2015).
Despite high workload, more than half of the staff (coded six times) expressed their
satisfaction with their career progression and academic goals at SBS:
“We have a PDR system. So annually we have goals and set these goals, three
times a year which is a lot more than other places. You know normally in [XX] I
would've met the management once a year to discuss my goals and at the end of the
year, did I meet them, did I not? Why not? At Salford, I have to meet them three
times a year to make sure that I'm on target... so it's a bit more monitored here”
(S5, 7/5/2015).
While two staff felt that the school do not care about their progression because of the high
workload, which means that they do not have enough time for research: “They could care
less” (St6, 5/11/2015).
Rewarding was another sub node related to the job design. Upon asking the staff, the
majority (seven) agreed that financial rewards do not depend on the good performance of
lectures or student evaluation. Financial rewards are linked to promotion, which depends
on research. Ultimately, this leaves staff members in a situation where they have to manage
publications to receive promotion and at the same time they indicated that their workload
was very high, unconducive to helping them conduct research.
“The rewarding is based on their research and enterprise and engagement, but it
doesn't recognise staff whose primary responsibility teaching/learning” (St1,
5/11/2014).
“Reward here from my understanding... is all based on your publications you won't
get promoted until you get publication... In terms of monetary reward... it all goes
back to your publications and publication is always attached to your teaching and
that's what I'm saying, my teaching workload are more loaded... I wish I can have
more time for publication” (St2, 3/11/2014).
These two opinions were contrary to what the third staff member indicated. She stated that
there is an award (VC award) dependant on student feedback:
“You had to embed students feedback with the VC, as an evidence base we have to
put a lot of comments of the students in there” (St3, 11/11/2014).

147
This response contradicted another staff member, who believed this reward was
independent of student feedback:
“Sometimes there is no enough time to apply; the application process... it takes a
lot; because you are trying to do your own work!” (St7, 12/10/2015)
“If you are in the middle of teaching... you don't have any other time to kind of
apply to something like that. And I suppose it's not based on the student feedback,
students' aren't going to write lovely things about you, if it isn't true, so why can't
they use that feedback to decide on who gets a reward or not” (St5, 7/5/2015).
In addition, the same lecturer (St5) indicated that in certain universities lecturers get
rewarded when they publish in a 3 or 4 star journal, which is not the case at SBS.
In the staff experience survey 2014, just 10% indicated that they either strongly agreed or
agreed that “Excellent performance is financially rewarded by the University”. While 87%
stated that they strongly disagreed or disagreed with the same statement.
Overall, dissatisfaction with the financial rewarding system was mentioned in seven
instances of coding in NVivo, while there was one instance of satisfaction with the
financial rewarding system of the school. Figure 5.11 illustrates staff interviewed opinions
regarding financial rewards.
Figure 5.11: Model representing the opinions of the eight staff interviewed regarding
financial rewards
As for recognition, the majority of staff (coded five times during analysis) indicated that
they did not receive recognition for their work as academic staff members at the school;

148
“Nothing... Occasionally there will be an email comes out towards the end of the
year: hope you all have a nice Christmas, thanks for all your hard work and that's
it” (St6, 5/11/2015)
This was the same as another staff who indicated that credit goes to the school but failure
goes to the staff:
“If you do a bad job... if you get below a certain level, they make it public... then
you can get pulled into a meeting” (St8, 20/10/2015)
And according to those two staff, this affects staff motivation:
“I can't be bothered any more... and that shows you the knock on effect on the
motivation of staff” (St6, 5/11/2015).
On the other hand, one staff member indicated that he did receive recognition for his work:
“I was speaking at an international event in [XX], this was circulated through the
department and to the business school through emails and on the website and
university communication” (St2, 3/11/2014).
This opinion was consistent with other staff:
“I don't know, I suppose you would receive it if you are progressing... it's based on
the research or your teaching or your enterprises... based on all of your activities
as long as you evidence... so you would receive recognition from that I suppose.
And I suppose you might get mentioned if you done something in the news letter's
or something like that” (St3, 11/11/2014).
The staff experience survey (2014, p. 54) agrees with these statements, that half of the staff
are satisfied with the recognition they receive, taking into consideration that the percentage
of employees that believe their pay and benefits system are fair have declined from 80%
(2011) to 76% (2014). The same applies to the staff percentage that dropped from 19% in
2011 to 10% in 2014, in relation to the financial rewards of UoS for excellent performance.
Figure 5.12 summarises the three sub nodes associated with the job design node.

149
Figure 5.12: Job design node.
b. Supporting staff
Although that this factor was mentioned by a few academic staff (three), it was coded ten
times during the analysis process. This factor was a source of dissatisfaction. This aligns
with student opinion during interviews.
“Lack of proper time tabling... Admin staff I think are not doing their job really
good” (St4, 28/4/2015).
“When we get stats from central office they are generally wrong, they are out of
date... I just had to contact five of my personal tutees to arrange meetings with
them, three they gave me the wrong email address, got hold of them eventually and
two have left the programme and nobody... makes me feel that I'm wasting my time
and makes me feel stupid and they must think I'm stupid, don't they know who is my
personal tutor? Don't they know I finished?” (St6, 5/11/2016).
c. Facilities
Another factor raised by the majority of the staff (seven staff) was the facilities. There
were two kinds of facilities: IT services and physical facilities. Half of the staff members
interviewed were convinced IT services could be improved in terms of quality and speed:
“In terms of infrastructure, I'm not satisfied at all, breakdown is always annoying.
Sometimes configuration at the system, most of the time I had to solve it my own I
think I can do better than the IT staff” (St2, 3/11/2014).
Moreover, one of the staff indicated that in the last training he went to “the computers all
were broken” (St6, 5/11/2015).
Even though the physical facilities at the Media City provision were a source of
satisfaction (for one member), facilities in different places were a source of dissatisfaction

150
for most of the staff (four):
“I think media city provision is excellent... I think they have really good
environment to work in and to use the facilities down there...The rooms on the 8th
floor, the 9th floor here... I think Maxwell really wants knocking down. It's fine for
a one to one kind of a PhD meeting, but for a class, it's not a good quality
environment” (St5, 7/5/2015).
“We don't have enough seminar rooms, in one of my seminars I had more students
more than the number of chairs, so during the seminars, if students come 5 minutes
late, I have to tell them go and bring a chair from another seminar room, they will
bring the chair but they don't have table, they don't have a side desk to use, so it's
inconvenient” (St4, 28/4/2015).
Moreover, relocation of some of the university staff to the 5th floor of Maxwell building
and moving some staff out was again a source of dissatisfaction:
“Human resources and finance are moving to floor 5, well, we are losing
classrooms, staff offices... all of which worked extremely well; we lost computer
lab” (St8, 20/10/2015).
Figure 5.13: Facilities node and the two sub nodes IT services and physical facilities.
d. School environment
The working environment at SBS as with any other working environment, had both
positive and negative aspects. Participants highlighted different factors (sub nodes) that
affected working environment at SBS. There were main seven factors:
1. Empowerment
2. Training
3. Organisational support

151
4. Teamwork
5. Autonomy
6. Academic freedom
7. Respect
Empowerment was one of the factors that affect staff satisfaction. Upon asking staff about
management policy, they all agreed that the school management encouraged them to
handle student problems themselves. Indeed, according to one of the staff members: “you
have the power to do that”, and they do not need to have the management approval or
permission before handling any problem. Likewise, this agrees with what was said by
another member of staff:
“You can deal with the students” (St2, 3/11/2014)
Another recalled a recent incident with one of her students. According to her:
“I didn't go to my line manager and say I'm doing this and I'm doing that I would
mention to him in person if it came over... I'll sorted out myself” (St3, 11/11/2014)
Overall, staff members think that they do not require more authority. This means that the
management, to an extent, empowers its employees.
Moving to another service quality factor related to the working environment, staff
indicated that they had training once they started their jobs. As some of the lecturers
indicated, some training sessions were compulsory and considered as a part of the
probation, which took various forms. For example, for those who joined the school as an
academic member of staff, they had training sessions once they joined:
“When I first started working I had to go through all these induction sessions and
trainings and over the time I still have to attend few trainings which is relevant to
my work” (St2, 3/11/2014).
For those who joined while studying their PhD, they had the training over a long period of
time, starting from their PhD training sessions and continuing until they join as full time
staff:
“I had a part time post here in the school as a researcher and I was just still doing
my PhD... I’ve done that for 5 years and I was then an academic fellow... I was
teaching for 20% of the time for one year, 40%, 60%, 80% and then 100 after five
years, so that’s my training, so I suppose yes” (St3, 11/11/2014).

152
This also applies to those who joined SBS after working in other universities for several
years:
“It's quite interesting looking at my CV actually, you know between my time in
[XX] University and my time in Salford, even in the two years I've been here at
Salford, the training courses that I've on in my two years are twice the amount that
I've been on in my 7 years at [XX]” (St5, 7/5/2015).
These training sessions provided by the school are an on-going process and not limited to
new staff. This helps staff to develop their skills and knowledge and consequently to
provide better service to the students:
“This Thursday I'm attending training on the [XX] which is very relevant to my job
as an international tutor” (St2, 3/11/2014).
Training sessions are delivered by external bodies or by the school using their own staff or
external mentors that enrich the staff experience:
“I had just completed the senior leadership programme within the university which
I found really good and that involve working in action learning sets and it included
360 degree appraisal, which is always helpful and we were signed a mentor
external to the university and that again is a very useful experience” (St1,
5/11/2014).
The school also encourages staff to attend training courses that help them to develop and
gain more knowledge and experience and allocate both time and money. All interviewed
staff, who applied for external training, agreed that school does cover expenses (direct cost
which is the actual physical cost in addition to the cost of covering for those staff).
“I requested to attend a very expensive course in London last year; it was a three
day workshop in London costs around 3,000 pounds. It's a full board course, three
full days plus accommodation. It is very expensive course and the school paid for
me because that is relevant to the curriculum development and to what I'm
teaching” (St2, 3/11/2014).
Despite allocation of time and money for the staff to attend training sessions, SBS does not
evaluate their training courses if not organised by the school. This may be due to the nature
of this job and the knowledge that will be integrated in the work:
“Now, no one goes: alright you went away did a day training... I'm going to come
back and embed that into my teaching” (St3, 11/11/2014).

153
Meanwhile, the school evaluates training courses organised by the school:
“At the end of your training; you will complete one of these module evaluation
forms” (St5, 7/5/2015).
When staff members are taking a qualification from another university, if they have not
received this qualification the school starts to enquire. Overall, staff members were quite
satisfied with training received. Through the eight interviews conducted no one had a
negative opinion regarding school policy for training, except for two lecturers who
discerned training courses to be more beneficial when they were customised.
“Our group... should have more resources... Bring a lecturer, set up a seminar for
us, training sessions, very experienced professor from another university” (St4,
28/4/2015).
“No... not effective at all, it's efficient because you can manage to train fifteen
people in one hour but they are not trained, so it's not effective... it's the big classic
thing about efficiency and effectiveness” (St6, 5/11/2015).
In terms of organisational support, interviewed staff had varied opinions. The majority
(six) stated that the management support employee welfare, not merely because of policy
but also as part of school regulations and culture:
“I suppose if you came and you have a sort of illness, you get time off, that’s in the
regulations” (St3, 11/11/2014).
Academic staff members were also convinced that they would be supported if they faced
any problems during their work:
“I have experienced students complain, students discipline procedures, and the
management were very supportive. I even myself once complained about students
and it was treated very well” (St2, 3/11/2014).
One member of staff explained that the support she received, not only from her line
manager, but also from her colleagues, presents the teamwork environment positively that
is available at the school:
“I report directly to the [XX] who is my line manager… He researches and teaches
in the same discipline area as me, so if it's an issue concerning my teaching or my
research (my discipline based research) then I can certainly go to him. I'm also

154
very well supported in terms of professional services colleagues… I do feel that I'm
well supported” (St1, 5/11/2014).
One member, who had not faced any problems, could not answer this question based on
their experience:
“I haven't any problem... I have asked my colleagues and they have told me that
their welfare has been reduced during the last 5 or 10 years” (St4, 28/4/2015).
Another two members had a different opinion. They both agreed that “they have not being
supportive... no” (St8, 20/10/2015). Moreover, they mentioned that they solve any issues
by themselves “I go to people I know in authority and speak to them about it” (St6,
5/11/2015).
In addition to organisation support, staff highlighted other factors such as academic
freedom.
“I mean freedom to work, freedom to do whatever you want to do without any
restrictions, without bullying without pressure without harassment” (St2,
3/11/2014).
Though this was mentioned by four of the interviewed staff that the school supports
academic freedom, two of the staff did not agree on that, while the rest did not mention this
factor. One stated that due to the shortage of staff, the school appointed him as a supervisor
for students whose work was in a completely different research area:
“Their dissertation is not in my area, so they have told me that they have lack of
staff and they have to allocate more students to each staff because that department
we don't have enough staff so we have shifted those students to this department,
please ask them to do something in relation to [XYZ]!” (St4, 24/8/2015).
The same was with autonomy; less than half of the staff (three members) mentioned this
factor. Two of them expressed their satisfaction with the level of autonomy they enjoy at
SBS:
“I also value autonomy or relative level of autonomy and decision making within
kind of clear parameters about what's required... we’ve got a voice, we have lots of
different ways that we’ve supported with our voice… I have a voice within the
management team” (St1, 5/11/2014).

155
“I do research, I do teaching, I do enterprising activity with companies,
consultancy work, I do travelling as part of research and also possibly as an
external visiting professor in universities abroad” (St7, 12/10/2015).
On the other hand, one staff indicated that she does not have this privilege:
“Unit manager decide who are you going to teach with!” (St8, 20/10/2015).
It was interesting that just two staff mentioned respect during interviews. While one of
them was very satisfied with the respect she receives at SBS:
“I’ve worked in organizations where you know someone is shouting at you from the
day in, to the day out... from the second you walk in there” (St3, 11/11/2014).
The other one was on the other side; she was extremely dissatisfied:
“You wouldn't believe it unless you witnessed it... the most dreadful situation...
shouting...” (St8, 20/10/2015).
Finally, teamwork was highlighted by a two members of staff. In two incidents staff
mentioned that there was a good working relationship with their colleagues:
“My colleagues are supportive, within team we are working good” (St4,
28/4/2015).
“Work as a part of an effective team” (St1, 5/11/2014).
Figure 5.14 summarises the school environment main node and the related seven sub
nodes.
Figure 5.14: School environment node and related sub nodes

156
Possessing previous experience in different fields and different places (either academic or
non-academic jobs) provided an advantage to the staff from the student perspective that
staff members were capable of integrating their experience into teaching, which would
enrich the module and students knowledge. It also provided management with the
advantage of staff being able to appreciate flexibility, and how their jobs are designed in an
attractive and interesting way. This is in addition to the autonomy three staff members at
SBS confirmed they enjoyed:
“If you come to this job after working in… SME… you know, you got to be there
quarter to nine in the morning, you can’t be leaving at least until half past five; five
days a week… this is a very nice job” (St3, 11/11/2014).
While another member of the staff saw that the autonomy that they had was not enough:
“You can't just say you so this from this time to this time, and then you can do that.
It's about personal interaction, it's about developing relationships, it's about all
sort of things and you need to have a great deal of flexibility, you need to have
support” (St6, 5/11/2015).
Even though most of the interviewed members of staff were satisfied with their jobs and
the quality of service they received, two of them indicated that if they got a better offer,
where they would get a chance to work more on research, then they would certainly
consider moving. Another two members stated that they were dissatisfied because of the
working environment.
Moreover, while five staff stated that they would recommend SBS as a place to work, for
their colleagues at other schools:
“I'm quite happy to come in here, so I do have job satisfaction” (St3, 11/11/2014).
One staff indicated that he would recommend it for new staff due to the insufficient time
allocated for research, which is essential to academic career:
“For start yes, if you have good publication it might be worth more to someone
else” (St2, 3/11/2015).
Another two mentioned that they would not recommend SBS as a place to work.
Finally, when staff members were asked about whether they perceive management
commitment to quality affecting staff satisfaction, they all agreed. One of the staff

157
members added that this commitment would lead to improvements and enhancements, and
that this has a positive effect on the staff. While another stated:
“It depends what they mean by quality. If they were really interested in quality then
they would do two things: they would make sure that the staff are happy, because
happy staff give a better service. Secondly, instead of allocating personal tutors
meetings with this, ticking boxes, filling in forms... why don't you just get a meeting
with the students from somebody else, not from me and just talk to them and say
what's the problems if any?” (St6, 5/11/2015).
Interviewed staff member pointed out that management commitment to quality means
providing appropriate resources that help them to do their jobs such as: “Infra structure, IT
working properly, timetabling” (St7, 12/10/2015), having a clear communication strategy,
and supporting academic staff to do more research were among the factors they used to
define management commitment to quality. Staff also stated that having standard levels of
the courses offered by SBS (on campus and of campus) is an indicator of management
commitment to quality:
“Observing how that is done... because you do see different levels of what I
consider quality... There is a vast range of quality in how people produce materials
for the students, produce assignments, how they produce feedback sessions... and I
don't think SBS really manage that... They try” (St3, 11/11/2014)
Overall, staff interviewed believed that the previous management team were committed to
quality and it was still early to judge the new team. Figure 5.15 illustrates the nodes that
were mentioned by staff.
Figure 5.15: Nodes and sub-nodes representing quality factors from staff point of view.
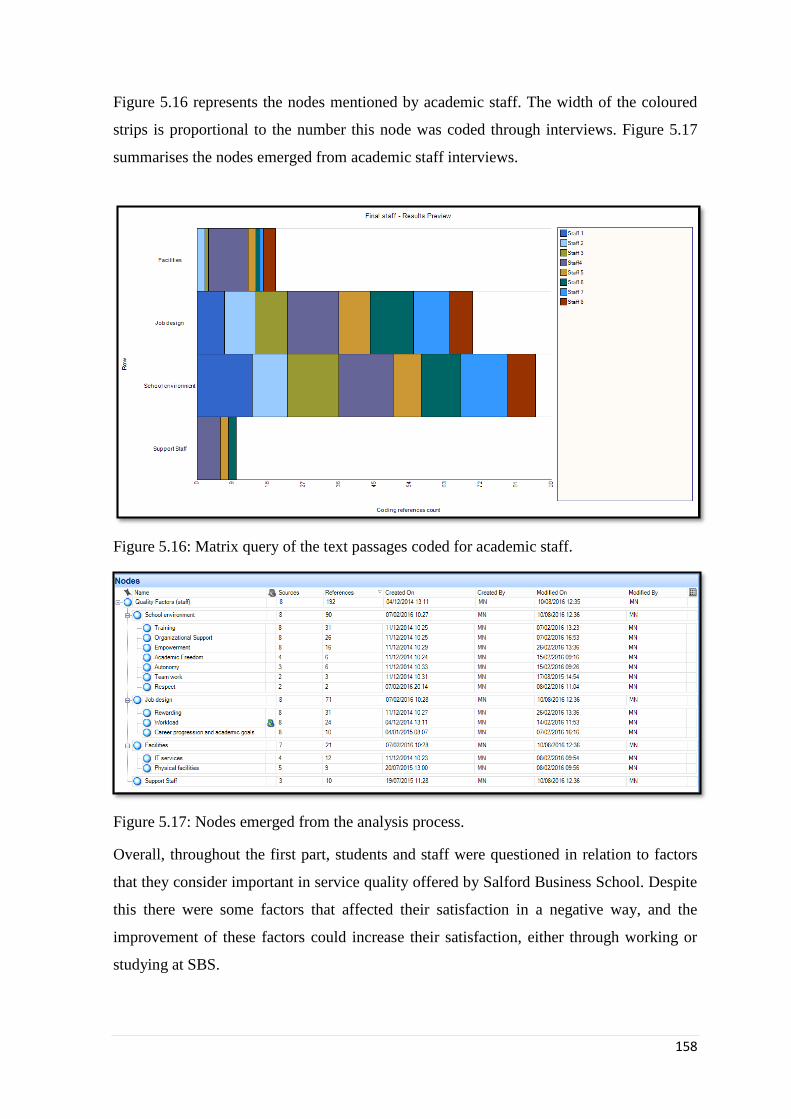
158
Figure 5.16 represents the nodes mentioned by academic staff. The width of the coloured
strips is proportional to the number this node was coded through interviews. Figure 5.17
summarises the nodes emerged from academic staff interviews.
Figure 5.16: Matrix query of the text passages coded for academic staff.
Figure 5.17: Nodes emerged from the analysis process.
Overall, throughout the first part, students and staff were questioned in relation to factors
that they consider important in service quality offered by Salford Business School. Despite
this there were some factors that affected their satisfaction in a negative way, and the
improvement of these factors could increase their satisfaction, either through working or
studying at SBS.

159
As mentioned in the literature (section 2.1.3), O’Neill (2003) argued that the tools used
currently are faulty and needs to be revised. Based on the findings, using interviews along
with CIT was useful in explaining student and academic staff reaction. Moreover, a few
factors emerged during interviews that were not highlighted in the literature which will be
explained in the discussion chapter.
5.1.2 Part two: satisfaction and feedback
Throughout part one, students and academic staff discussed the service quality factors that
they considered important in HE service. In part two, I asked the students about a specific
lecturer and discussed with them whether their satisfaction levels affect their feedback, and
whether they express this feedback to the lecturers from one side. From the other side, I
interviewed lecturers who were mentioned by students and tried to understand whether this
feedback affected their job satisfaction.
To understand student feedback, it was important to evaluate whether the students were
satisfied with this lecturer or not, which is why they were asked about how they evaluate
lecturers. I also asked about their teaching skills, accessibility and other items that affect
their satisfaction with a lecturer. In this part the analysis is conducted in units, i.e. for each
lecturer there is a group of students who will talk about him/her.
5.1.2.1 Unit one
Through this unit, three students were talking about one of their lecturers. Students were
very satisfied with the lecturer's accessibility:
“She was very busy... We had to communicate via emails and arrange meetings, I
don't think I could’ve just dropped in or called when I wanted” (St1S1,
20/10/2014).
“She was accessible... online, through our blackboard discussions and emails”
(St1S3, MBA student, 5/12/2014).
Additionally, students indicated that despite the busy schedule, the lecturer had regular
meetings with the groups, and was keen to help them, answer their questions, as well as
advise them. She understood that as students they needed guidance:
“She has helped us a lot if we were not sure about something or we did a piece of
work we would ask her advice to make sure that we are on the right track” (St1S1,
MBA student, 20/10/2014).

160
Regarding her teaching and communication skills, one student was satisfied with the
lecturer, until she started to compare her to another tutor (in the same block module). She
stated that:
“She was good in the communication skills, but in the teaching skills she wasn't
good as [XX]” (St1S1, MBA student, 20/10/2014).
She returned that feeling to the nature of the course:
“It's probably because that the particular project was very technical and we
needed a lot help on the technology part… and she wasn't as hot as [XX] in the
technological side” (St1S1, MBA student, 20/10/2014).
While the other two students were satisfied with that lecturer:
“Really engaging... using mixture of different learning materials” (St1S2, MSc
student, 25/10/2014).
Students were satisfied with the lecturer’s overall attitude as friendly and fair. One of the
students also agreed that the grades had an impact on her evaluation of the lecturer,
although not extensively, as the assignment was a group task, and she had stated that not
the entire group participated in the assignment: “it was the group problem” (St1S1,
20/10/2014). Thus, it had been challenging to obtain a high grade, and that the lecturer
could not be blamed for that. This was also supported by the interviews of the other two
students:
“No it doesn't because sometimes it's you who didn't put much effort into it!”
(St1S3, MBA student, 5/12/2014).
When students were asked specifically to think about taking the course again with the same
lecturer, two of them confirmed they would, while for the third student the answer was
delayed. That student said that she would attend it with another lecturer because the course
needed technological knowledge, which he exceeded in, and overall she was more satisfied
with that lecturer. Likewise, when asked in regards to their feedback whether they had
expressed it previously, two stated that although they were satisfied with that lecturer, they
had not informed anyone and the third student had sent the lecturer a card to say thank you:
“Ya I sent her a card [the participant smiled]” (St1S2, MSc student, 25/10/2014).
On the other hand, one of the students stipulated an incident where she and other students
had not been satisfied with a lecturer, which they had reported to the director of MBA,
where consequently the lecturer was changed.

161
Despite the fact that two of the students’ positive feedback for the lecturer was not
provided, one of them thought that the feedback might have provided a positive effect on
the lecturer:
“I think it does it's always nice to get the pat on the back that someone is happy
with them... it's always nice to get this pat especially from those who you have
being teach” (St1S1, MSC student, 20/10/2014)
While the other student believed that his feedback would not make a difference:
“I think it's down to the individual perception. If that person is like me, I don't think
they would take other people opinion as such, so whether they are satisfied or not I
don't think it would affect that individual... because I know the level of, the
standard I produce” (St1S3, MBA student, 5/12/2014)
Upon interviewing that lecturer I asked about the manner of assessing students satisfaction.
The lecturer indicated that she used the MEQ in addition to the surveys that are used by the
university such as the postgraduate taught experience surveys (PTES), which gives
students the opportunity to express positive or negative feedback.
As students stated, they value the lecturer's expertise and belief that it enriches their
learning experience. Upon discussing this issue with the lecturer, she said: “I think they
really value us bringing case studies and examples from my research into the classroom”.
“I think it’s the reason we all come into teaching... Is a reward in itself...” this is how the
lecture described the effect of positive feedback on her satisfaction. She mentioned that she
received positive feedback several times as a lecturer and that this positive feedback duly
affects her satisfaction. However, she also received some negative feedback remarks
because of her teaching style or administered grades. According to the lecturer, she used
this negative feedback as a process of personal learning, and following certain occurrences
she asked other colleagues’ advice about this feedback. Nonetheless, the lecturer stated
that: “you always take it personally” especially if it came from good student. She also
receives feedback from students as their personal tutor; “I always make sure that if its
positive that I feed it back to other members of staff and if it is negative that I will take
steps to see why did that happen”.
Throughout this unit, although that the three students were satisfied with the lecturer
and two of them knew that their feedback would affect that lecturer job satisfaction,
two of them did not report it. On the other hand, the lecturer stated that positive and

162
negative feedback affected her satisfaction in both positive and negative ways. Figure
5.18 represents this relation, as the blue dotted line indicates that the relation is not
present, and the black solid line indicates that this relation is evident.
Figure 5.18: Relation between student and staff through the feedback (unit 1)
5.1.2.2 Unit two
Through this unit, three students discussed their opinions in regards to one tutor.
Regarding this lecturer’s accessibility, students agreed that he was very accessible; not
only after the lecture, but also through emails and office hours:
“He was very accessible, once I send him an email he replies. He has office hours,
where I can see him. He was very accessible and helpful” (St2S1, MSc student,
27/10/2014).
“He is a very good lecturer with a strong background; he has great knowledge and
experience. He helped us to understand what is research” (St2S2, MSc student,
27/10/2014).
This is how one described his teaching skills. All interviewed students mentioned that
although he was tough and very committed to work, he was an exceptional lecturer and
that he managed simultaneously to balance between appearing friendly and acting tough in
order to coerce them to work harder:
“He has a great combination, he is very friendly and helpful and at the same time
he is tough” (St2S1, MSc student, 27/10/2014).
“He's friendly, very helpful. He was fair; you feel that he wants to help you to
understand the subject” (St2S3, MSc student, 5/10/2015).
163
One of the students indicated that it was his first course of his MSc and his first time to
hear about research, but he felt that if this lecturer did not push him to work harder, he
would have had problems with the rest of the courses.
Students indicated that he was fair in his treatment and in his grades. One student added:
“your English doesn’t matter as long as he understands you, and this gave me confidence”
(St2S2, MSc student, 27/10/2014). She considered him fair as he did not discriminate or
give her the feeling that she was less than others who their first language is English or
those who had “better English” according to her.
It was clear during the interviews that students were very satisfied with this lecturer. This
satisfaction could be due to the high grades or because this lecturer was friendly. What was
interesting was when they were asked if the grading affects their satisfaction or their
evaluation, the St2S1 student indicated that her grades were fine, and to some extent it
affected her evaluation. But the two other students stated that their grades were not as
expected, but they were grateful for what they learnt:
“We are here to learn, so we need someone to guide us and he did” (St2S2, MSc
student, 27/10/2014).
“The grade I had wasn't up to my expectation, but what I got at the end of the day,
the knowledge I was impacted. The impact that his lectures, or his teaching, had on
me influence the choice of my dissertation topic” (St2S3, MSc student, 5/10/2015).
They all indicated that he understands students, and how students come from different
backgrounds and had different needs. They all would be happy to take this course or any
other course with him again:
“It was just one course. If I will have it here, defiantly I'll take it with him” (St2S2,
MSc student, 27/10/2014).
Overall, students were very happy with their experience with this lecturer. Nonetheless,
when students were asked whether they expressed this extremely positive feedback to that
lecturer, their answer was invariably “No”. The St2S2 student indicated that the only
relative feedback that she provided was when she marked that she felt “very satisfied” on a
Module Evaluation Questionnaire (MEQ) at the end of the module, although she did not
send any emails or even talk to him. When she was asked to think whether feedback affects
satisfaction, she stated: “No, I don’t think they care”.

164
A similar response was provided by St2S1. When questioned about his feedback, he said
that he did not try to express his feedback or say “thank you”, even though he was very
satisfied, as he stated that, “he did his job and I don't feel that I have to thank him for doing
his job” according to him. Furthermore, the student’s answer in relation to whether this
feedback could affect the satisfaction of the lecturer was negative: “I don't think it will
have any effect on him”. Subsequently, when he was asked why he thought that his
feedback would not make any difference he indicated that he felt that the lecturer was just
doing his job and that he would not care about feedback. Similarly, this was mentioned by
St2S2, who said that the lecturer is just determined to do his job and that he would not care
whether they are happy or not, as long as he undertakes what is necessary in the role.
As for the third student, St2S3, he didn't provide any feedback as well as he did not think
about it, though when he was asked if the feedback, in his opinion could affect staff
satisfaction, he said:
“It should... because... there is a saying in where I'm coming from that a leader is
not successful until his subordinates' succeed. If you are a leader now and I'm
working under you, if you in a position and I'm working under you... you cannot
say that you are successful yet until I succeed. So it's when I'm satisfied that he will
note as he can joy... yes he will be satisfied... just like customer and employee, so if
your customer is not satisfied so you have not deliver any service” (St2S3, MSc
student, 5/10/2015).
Students were very satisfied with that lecturer, and stated that they were willing to have the
same course instructed by him again. Indeed, neither of these students met their personal
tutor.
The second step following these interviews was to interview the particular academic staff
member. He indicated that the only form of assessing student satisfaction is through the
MEQs, which are distributed at the end of the module. He added that in some modules
when he has a very small class (average 7-8 students) he receives feedback directly from
students which is usually positive feedback relating to the fact that they learnt something
new. However, in large classes, responses are often mixed which depends on the nature of
the student; whether they are serious and willing to take pressure or not. “I may say, it
depends very much on the course, depends on the teaching and students”, was one
statement by this specific lecturer into how he perceives the situation.

165
In relation to lecturer response to student feedback, he explained that positive feedback
does affect him, and in terms of course development, specific comments help him to
review and improve his teaching syllabus, topics and activities used in class. Likewise,
positive feedback would also increase his satisfaction. As for negative feedback, he stated
that “sometimes it's quite disappointing and de-motivating”, whereas sometimes it does not
affect him at all (depends on the student). Moreover, he believed that a relation between
the feedback and the students did exist, as good students came and provided positive or
constructive feedback.
To summarise this unit, it can be stated that even though the three students were very
satisfied with their lecturer, they did not express their feedback to him, as two of
simply thought that he would not care and that it would not affect his satisfaction,
and one did not think about it. Nevertheless, this belief is completely contrary to the
reality, because the lecturer believed that positive or constructive feedback affects his
overall satisfaction with his job and he would care about constructive feedback
whether positive or negative.
Figure 5.19 summarises the relationship, the dotted link between students and feedback
indicating that this link is not available due to the students feeling that their feedback does
not affect the staff satisfaction. While the link between feedback and staff satisfaction is
solid as the academic staff stated that feedback affects his satisfaction.
Figure 5.19: Summary for Unit two relationships.
166
5.1.2.3 Unit three
Two students were interviewed and they shared their ideas and thoughts about one lecturer,
who was also subsequently interviewed.
Both students agreed that the lecturer very accessible, although she was very busy:
“I know that St3 is very busy as well but she manages to see us” (St3S2, MSc
student, 30/10/2014).
Moreover, they indicated that she generally responded to their emails immediately:
“She was the most accessible lecturer I had in the university, very accessible.
Somebody who responds to emails quickly, once I email her about anything I get
her feedback instantly. Even if she is not going to answer my email she will tell me
that she is in weekend and she will reply when she is back. One thing that I'm
certain about is that she replies. Not only me; we discussed that among us
(students)” (St3S1, MSc student, 27/10/2014).
Nonetheless, it was evident when I attempted to arrange a potential interview with this
specific lecturer that she was very busy, her schedule was full, although she did manage to
find time.
Her teaching was admired by both of the interviewed students not merely due to her
experience and knowledge, but also because:
“She tries to involve everybody in the class; she tries to make sure that everybody
has something to contribute. She is really good” (St3S2, MSc student, 30/10/2014).
Moreover, she commonly organised informal meetings with students outside the classes to
discuss their assignments in a friendly environment:
“We sit down to discuss about our assignments. This extra miles... very unlike any
other lecturer, there is no lecturer that sparing time outside classroom to give the
students the opportunity to come and interact in a different ground not as in typical
running learning environment” (St3S1 MSc student, 30/10/2014).
This student was also distinctly satisfied and happy thought that her style should be
adopted back in his native country:
“I even told one of my lecturers after I went back to Nigeria, for semester break,
that you need to see how can you progress and connect between you and your
students” (St3S1, MSc student, 27/10/2014).

167
When the lecturer was asked about those informal meetings, she indicated they had started
these because of the new block delivery model when she realised that quiet students might
not find sufficient time in getting to know other students. Thus, they would be alone during
the first two or three weeks, the reason why she began to invite them to her informal
sessions and has subsequently continued to do the same, as students get to know each other
and get the opportunity to talk about their assignments and ideas.
The lecturer was described as a very friendly person and very fair by both students:
“Part of her fairness that when everybody send her email she replies, it's part of
the fairness to make the drop in session for everyone where you can go and meet
her with your own problem and leave, No, she created an opportunity where all the
students come at a time and raise any issues that will ordinarily you as a student
you will not be able to raise... another student will ask in front of you his own area
of concern so you will be able to learn from your colleague student so that's
fairness... it will open another way of thinking” (St3S1, MSc student, 27/10/2014).
While one of the students stated that grades do not have an effect on his satisfaction, the
other students agreed that grades had an effect. He was very keen to send me a message
that she was very fair regarding grades:
“Students feel safe in the hands of [XX]” (St3S1, MSc student, 27/10/2014).
During the interview this student stated that most of his friends as well as himself, wished
to have this specific lecturer as their supervisor. He said that it was not because of the
grades, but because she was knowledgeable and capable of assisting students.
Both students agreed that she understood that students have needs, and she was keen to
help them, not just during her course, but even following that. One of the students was
confused about what he would work on during his dissertation, so before assigning him a
supervisor, he sent her an email asking for guidance for his dissertation, to which she
offered him an appointment:
“She even... she took a paper and I sat down and I explained what I want to write
and she gave me a scope of what I should do. In terms of this how you write a
proposal, and this is how you go about it... I still have the paper with her
handwriting and I can show you. She also did the same thing to my friends but the
level of our presentation to her may be varied some didn't know or have a clear

168
idea of what they want to they didn't have as much guidance as I do have from her”
(St3S1, MSc student, 27/10/2014).
This was consistent with what the lecturer mentioned during the interview; that she helped
certain students who had specific problems with their supervisor, and especially when she
knew that they were committed students.
Both students appreciated her knowledge and expertise. What was more appreciated was
that she accepted others’ opinions and contribution to the learning process:
“During the last module, we had assignments; there was something I saw that it's
going to be helpful to everybody, so during one of our drop-in sessions I pointed
out to her. I sent her and email with a copy of the material I saw, she saw it and
went through it and she emailed the resource to everyone personally. She tries to
involve you in the whole process” (St3S2, MSc student, 30/10/2014).
This statement agrees with the lecturer, who noted that “I don't think I know every single
thing in the world, I'm not arrogant in any shape or form...”, and added that she is attempts
to engage the students and make them talk.
They were both very happy with their experiences together with that lecturer and they both
answered that they definitely would love to enrol on another course with her (through the
knowledge that it was the first time to be taught by this lecturer):
“If I can sneak and enter one of her current students' class I will go to her class
again” (St3S1, MSc student, 27/10/2014).
Both students were so satisfied with the process, that they sent emails to express their
gratitude and thanks to this lecturer. In their opinion, positive feedback will have a positive
effect on her:
“Certainly that this will affect her, she is human being... when you sit down at your
own office seeing an email from your students telling you yes I'm happy, certainly
you should feel sort of encouragement, to do better and see how can you assess and
help students” (St3S1, MSc student, 27/10/2014).
“Everybody like to be appreciated definitely ya. I think it is going to encourage her
to just keep doing what she is doing” (St3S2, MSc student, 30/10/2014).
In fact, they did not just use the MEQ to express their satisfaction, as they sent emails to
thank the lecturer for her efforts and demonstrate that they appreciated and enjoyed
everything that she had done through the course delivery. Similarly, this aligns with the

169
lecture interview. During the interview she indicated that she is not solely dependent on
MEQ to assess student satisfaction, but rather alternative ways. For instance, this can
originate from: emails she receives to thank her, thank you cards, when she sees them
during graduation, or when she sees them in corridors or in the cafeteria, “they don't sort of
avoid you” as she said.
According to her, positive feedback does affect her satisfaction: “it's quite nice if you do
speak to them or if they do sort of send emails back: thanks very much, that's obviously,
you know you are a human being”. One of her students took an additional step presenting
her with a video of the module she taught. He collected lots of photos and recordings
during her class and added a musical background to say “thank you”. However, unlike
positive feedback, negative feedback does not affect her: “because generally they are
students who all of our colleagues had an issue with” and it depends on the source of this
negative feedback.
Through this unit, both students were very satisfied with their lecturer, not just her
knowledge and expertise, but also her communication skills and manner of treating
the students. They both expressed their satisfaction through emails of thanks to her
for her efforts, and they believed that this would encourage her to offer more for
students in the future. Likewise, the lecturer appreciated positive feedback and stated
that it affects her satisfaction. Figure 5.20 summarises the correlation between
students and feedback from one side and between the feedback and lecturer
satisfaction from the other side.
Figure 5.20: Summary for Unit three relationships.

170
5.1.2.4 Unit four
Unlike previous units, the two students in this particular interview expressed overall
negative feedback. Indeed, the first student was not completely satisfied with this lecturer:
“His teaching was fine; especially if we compared him to [YY]” (St4S1, MSc
student, 10/4/2015).
He explained that this lecturer was good in attempting to explain everything, while the
other lecturer [YY] according to the student “might had a lot of information, but he didn't
give me any”.
While the other student mentioned that:
“I find him quite well; it went well with him actually” (St4S2, MSc student,
20/4/2015).
In regards to communication, the first student (St4S1) indicated that communication with
this lecturer (and others in the same module) was of a particularly poor standard:
“They don't reply on emails... and if you kept asking the answer you receive is 'as I
explained in the lecture'. Even if something outside the assignment and you want to
understand it, you don't get any answer!” (St4S1, MSc student, 10/4/2015).
This opinion was supported by the second student (St4S2). She stated that when she
initially emailed the lecturer that she still had to re-sit an exam and enquire to how she
should proceed, the lecturer did not reply. Nonetheless, St4S2 indicated that other emails
were responded to, such as when she had a problem with the blackboard and could not
view her grades.
In addition, when the lecturer was interviewed, he explained that in certain cases he
receives a lot of emails. More specifically, in one incident there was a problem with the
turnitin system, as instead of hiding grades from students, they were hidden from the
lecturers:
“I had received about 60 emails” (St4, MSc student, 28/4/2015).
He also explained that in some courses that he personally taught, the number of students
might exceed 100, which increases his workload, even though the school treat it equally
through other classes with fewer students.
Through looking at the effect of grades on students' satisfaction, St4S1 indicated that it
might not be the grade itself that is indicative, but the entire process. He explained that
there was a specific problem with his exam, as they did not mark one question, as well as

171
another question graded incorrectly, which resulted in the student attempting to rectify his
grades. His lecturer supported him but did not encourage him to ask for a remarking, which
was not fair from his perspective. Additionally, he mentioned that the grading system was
not fair, as according to him: “I saw that some students, they get 80's in their assignments
and in the exam 50's and when you discuss something with him or her, it's clear that they
don't have the knowledge that gives him or her 80!”. On the other hand, St4S2 agreed that
grades have an impact on satisfaction.
Overall, St4S1 believed that the lecturer was good at teaching, although he did not
understand his personal needs or that he was an international student. Consequently, St4S1
would not choose the same lecturer if he was presented with the opportunity. Furthermore,
St4S2 was not satisfied with his communication, which she felt very important because of
the block delivery mode.
The two students did not express dissatisfaction with the communication to their lecturers
or tutors directly. While St4S2 used the MEQ to provide her feedback, St4S1 thought that
his opinion would not prove beneficial:
“As lecturers? I don't think they care about our satisfaction. If they care, they
would receive us, answer our questions (as students), and explain the parts that we
don't understand, so I don't think they care” (St4S1, MSc student, 10/4/2015).
Regardless of their thoughts, St4 stated that he enjoyed teaching as a lecturer and that it
was the main reason for leaving the industrial field. Moreover, the positive feedback he
received via emails or MEQ did affect him in a positive way. Similarly, he stated that the
negative feedback affected him “Definitely” and this depends on the student and how does
he / she express their negative feedback. He explained that he became frustrated “when
students are disrespectful”.
Despite the fact that both students were not satisfied with the lecturer, they both agreed
with him that block delivery is not a good system:
“I don't think that the block delivery works, block delivery system is good for
people who are working, not good for fulltime students” (St4, 28/4/2015)
This unit contrasts to the previous three units, as both students in this unit were not
satisfied with the lecturer due to his manner of communication. Moreover, they
indicated that if they had the opportunity, they would not take this course with him
again, although this was not due to his teaching but because of communication, which

172
retains great value for them in block delivery. Despite this dissatisfaction, this unit
was similar to other units in relation to students not sharing their feedback with the
lecturer, as they believed that the lecturer did not care. On the other hand, the
lecturer stated that both positive and negative feedback affect him, although he
described negative feedback as “Definitely” affecting him. Figure 5.21 summarises
unit four’s relationships.
Figure 5.21: Summary for Unit four relationships.
5.1.2.5 Unit five
One of the students described her lecturer by stating that:
“I enjoyed [XX], because she like gave real life experiences, which is good and she
engage with you a bit more” (St5S1, MSc student, 27/4/2015).
In addition to her very good teaching, knowledge and communication skills, both students
appreciated her previous experience, as she managed to incorporate this into teaching,
which confirms what the lecturer mentioned during her own interview:
“I was a researcher; my research does come through in my teaching” (St5,
7/5/2015).
She was also able to engage with students more than the other lecturers in the same
module. Additionally, being accessible, helpful and supportive was reflected in one
specific student satisfaction, especially because it was his first module:
“She was very accessible. She responds to your email within the day or so... She is
knowledgeable; she is excellent, very supportive as well... She was very supportive
especially that it was my first module in the MSc” (St5S2, MSc student, 28/4/2015).
As for the grades, both students thought that it did not affect their satisfaction:
173
“Not really because I had put that down to maybe myself” (St5S1, MSc student,
27/4/2015).
“Well, I passed, I could've done better but with working full time job as well... it's a
lot to do” (St5S2, MSc student, 28/4/2015).
It was the first time to have that particular lecturer for both students, and they would have
been willing to take another course with her. Both students expressed their satisfaction:
“I did, we said thank you at the end” (St5S2, MSc student, 28/4/2015).
In addition, it was interesting when one student indicated that it was not easy to express the
negative feedback, and that in this case she preferred to use the forms:
“I don't know how would you say that you are dissatisfied, it's awkward, isn't it?
But I think it would affect her because she'd be... I think it depends on the person,
doesn't it? If they can take negative feedback... I think that's what are the forms are
for, aren't they? Because it's anonymous as well” (St5S1, MSc student, 27/4/2015).
On the other hand, the lecturer was clear that she depended mainly on the MEQ to obtain
students feedback, and sometimes emails can be another tool, as she stated that they would
take time to write if they were dissatisfied (as with all consumers):
“You know, I think it can be measured to some extent the enjoyment by not saying
anything. But you know little things like last year one of my student blocks, they
gave me a Christmas card and they'd signed it, they all signed it, you know it said
we've really enjoyed this module and that was really nice. So little things like that
can tell you that...” (St5, 7/5/2015).
Moreover, she stated that neither positive nor negative feedback affects her own
satisfaction:
“I'm not sure that increases my satisfaction... I think you know that's good or that's
really worked well, but you can never go into the next block thinking that will work
as well... so I suppose I can just take it as it is for about moment in time, that was
good and that worked well and I'm really happy with that” (St5, 7/5/2015).
“I suppose I'm quite thick skinned, I think academics are quite thick skinned, I try
not to take it personally, and ok I need improve this or I need to change this... If it's
personal then I'll take it down to just personality differences” (St5, 7/5/2015).
In this unit two students were satisfied with their lecturer, and they were keen to let

174
their lecturer know that they were satisfied, as well as showing appreciation for her
efforts and knowledge. They would take a course with her again if the chance
presented itself. Unlike the previous units, the lecturer in this unit stated that neither
negative or the positive feedback affected her satisfaction. Figure 5.22 summarises
unit five’s relationships.
Figure 5.22: Summary for Unit five relationships.
5.1.2.6 Unit six
In this unit, four MSc students evaluated the criteria of one of their lecturers. As a starting
point, the four students agreed that this lecturer is knowledgeable and experienced:
“I particularly loved his method of teaching because he was very approachable,
he's very funny... down to earth, he breaks it down he doesn't just teach in class, he
relate it to real life situations, what's happening, contemporary situations” (St6S1,
MSc student, 16/2/2015).
This was also supported by one of the students who had her undergraduate degree from
SBS and he was one of her lecturers then:
“He's very good; he has the top teaching skills I received during my experience
both in undergrad and masters... He knows how to engage with students, he knows
how to captivate their attention but at the same time he does it in a way that makes
the material very accessible and understandable” (St6S4, MSc Student,
10/11/2015).
Though, two of his students had a slightly different opinion. Despite that they agree that he
is a very good lecturer in terms of knowledge and experience but:
“If students are struggling on his course, from my personal point of view, and you
needed help like verify things or have a question, he's not very interested to be
honest” (St6S3, MSc student, 23/10/2015).

175
This was supported by another:
“He's a good lecturer I'm gonna give him credit for that, engaged in the class, he
knows the stuff but it's just what he's outside of the classroom I just felt intimidated,
I felt like wasn't welcomed, it was more just... like don't bother me, just leave me
alone” (St6S2, MSc student, 28/4/2015).
This feeling was due to an incident where the students had to submit their assignment on
turnitin:
“There was a problem with one of the submission links and I had emailed him
about it, like sir this is the issue, do you have any suggestions as how can I resolve
it? And he just simply says I'm not a technician, this is not my job I suggest you...
you know talk to [XYZ]... you know you can say it in such a nice way... So, it's just
like... little things like that” (St6S2, MSc Student, 28/4/2015).
While two students (St6S2 and St6S3) indicated that his communication was not very good
and he was not helpful outside the class:
“He is not interested in you asking any questions” (St6S3, MSc student,
23/10/2015).
The other two students had a different opinion:
“You could go and meet him, he gives you an appointment, he will be there, and go
and see him... He was very approachable” (St6S1, MSc Student, 16/2/2015).
“He responds to emails as quickly as he could... but the way he did it was: yes you
sent me an email with a phone number and if I can't reply to your email I'll contact
you by phone, which is very helpful because I don't need to wait for weeks to
receive an email or an answer to a question I've post, I just email him and either on
the next day I receive a reply or I get a phone call say ok we can meet at this time is
it ok for you? ” (St6S4, MSc student, 10/11/2015).
Upon asking about his friendliness and fairness the same response was received. While
St6S2 and St6S3 saw that he is not friendly and to some extent not fair because he is not
willing to help them outside the class: "He's not friendly as well" (St6S3, MSc Student,
23/10/2015). The other two students St6S1 and St6S4 stated that he was very friendly, fair
and helpful:
“He was very friendly, very engaging, there was pretty much no barrier that
separates students from a lecturer, he wanted to talk with us, it was very easy to

176
communicate with him during the breaks as well” (St6S4, Msc Student,
10/11/2015).
As for grades, again there were two different opinions. St6S1 and St6S3 mentioned that
grades have an effect on their satisfaction:
“Yes of course it does relate... definitely because at the end of the day, you came
here for a reason... your good grades is gonna give you satisfaction” (St6S3, MSc
student, 23/10/2015).
On the contrary, St6S2 and St6S4 argued that grades have no effect on their satisfaction:
“Grades represent how much effort you put into your work... I got a really good
feedback I wrote to X said look this is my assignment and this is the grade I got
what did I do wrong? He sat down, he explained; look this is you did very well, this
you need to work on because of this, this and this... the grade for me is not that
important, it's what I get from the material, from the lectures” (St6S4, Msc Student,
10/11/2015).
Overall, students were satisfied with the lecturer’s knowledge though they have different
opinions regarding his communication and friendliness. Three students were satisfied with
their overall experience and one was not. Only one student was keen to inform the tutor
that she is satisfied with him:
“I managed to talk to him about case classes... I expressed that I was really
satisfied; he was glade” (St6S4, Msc Student, 10/11/2015).
As for the rest of the students, they did not provide any feedback. Two of them thought
that feedback affects staff satisfaction and though they didn't express their satisfaction, and
the last one believed that being dissatisfied will not affect his satisfaction:
“I don't think it will affect him... because I think... he's older in age and when you
are in a certain stature, you don't really care about a 20 something years old
student giving you advice, it's like who are you in comparison to me...” (St6S2,
MSc Student, 28/4/2015).
Following the interviews, I interviewed the identified lecturer. He stated:
“The only thing we have at the moment is the official one is the MEQs... I have
quite a few who come up and say to me, thanks very much and we really enjoyed
it... there are a few who come and say things, others send cards and things”.

177
Moreover, he added that he knows that sometimes students might not express their
satisfaction because of cultural aspects such as “power distance” or consumer behaviour
psychology, and they might be very satisfied but not sufficiently satisfied to come over and
say that.
However, in relation to the effect of positive or negative feedback, he explained that he
received positive feedback, but he never received a negative feedback regarding his
teaching and that the negative feedback is usually related to the facilities. He also
mentioned that receiving positive feedback is very nice and it is appreciated but “what
good does it do me and my career, absolutely nothing!” and when he was asked how will a
negative feedback affects him, he said that “It depends what the feedback was and where it
come from”.
To summarise this unit, it can be stated that even though three students were satisfied
with their lecturer, just one student took it one step further and expressed her
feedback to him, as the rest thought that it would not affect his satisfaction or simply
did not think about it. Even for the last student, she did not express her negative
feedback as well. This assumption was somehow true, because the lecturer stated that
it's nice to receive a positive feedback but he believed that it does not affect his career.
As for the negative feedback, it might affect him but it depends on the source.
Figure 5.23 summarises the relationship with the dotted link between students and
feedback indicating that this link is not available due to the students feeling that their
feedback does not affect the staff satisfaction. While the link between feedback and staff
satisfaction is dotted as the academic staff stated that feedback does not do any good for
his career.
Figure 5.23: Summary for Unit six relationships.

178
5.1.2.7 Unit seven
Throughout this unit two students shared their thoughts and opinions about one of the
lecturers they were satisfied with at their MSc and MBA programmes at SBS. Both
students agreed that he was accessible:
“He responds as soon as he can... I don't find any problem with communicating
with him” (St7S2, MSc student, 1/10/2015).
Moreover, he had a good knowledge, helped students and encouraged them to
communicate:
“It was an interactive class, where you actually benefit from others experience”
(St7S1, MBA student, 1/10/2015).
He was also friendly and encouraged students to participate and ask questions. As for
being fair there were different opinions. While the first student saw he was fair, the second
student disagreed because of an incident where he did not stick to the guidelines he put out
for the assignment: “I felt that he wasn't fair” St7S2.
Despite this issue, both students agreed that grades did not have an impact on their
satisfaction with this lecturer:
“I evaluated him on his professional teaching and delivery” (St7S1, MBA student,
1/10/2015).
Additionally, the second student added that the grades represent her effort:
“With me, not really, because I feel like for each grade I get; 75% is me and 25% is
the lecturer; but 75% it's me, because… this is what they teach me, if I don't
understand, it's up to me to book to see them because they are literally open to help
me up! But if I don't want to book in to go and ask questions to them then I'm the
one who is having problem, so for each grade I get, I don't blame lecturers, I blame
it on myself cause it means that I didn't put much effort” (St7S2, MSc student,
1/10/2015).
Though it was the first time for both students to meet this lecturer, when they were asked
to think about having another course with the same lecturer they both welcomed the idea.
Likewise, both stated that they expressed their satisfaction with his knowledge, teaching
and communication after the course. They believe that his satisfaction will be affected by
this positive feedback:
“I told him that towards the end of the module, it was the last day, I don't know if

179
he has carried it on with others... I saw that he was excited” (St7S1, MBA student,
1/10/2015).
“In a positive way, yeah; cause I think every person... you get affected by a positive
comment; people really do care about you, people really value what you do... so I
feel like yeah it would” (St7S2, MSc student, 1/10/2015).
From the lecturer side, when he was asked how he would evaluate his student satisfaction,
he mentioned four ways: “At the end of each module there is the MEQ… Another way of
assessing it is you ask feedback from your students in an informal manner… Sometimes
students do go and give positive feedback, and also staff students' committee meetings”.
When he was asked if he received positive or negative feedback and how did this affect his
satisfaction, he replied saying that he didn’t receive any negative feedback directly form
students, whereas on the other hand he stated that sometimes students just pass by to say
thank you or send emails or even cards. He also mentioned that this affects his satisfaction:
“Definitely, it gives you a buzz, because you think yeah somebody recognised what
I've done or somebody appreciated and taken the botheration to write you an email
because they don't have to, but they are taking the effort to write an email so
therefore, that's quite positive, yeah”.
In this unit both students were satisfied with the lecturer in regards to his teaching
and knowledge. Furthermore, they took it one step further and they were keen to
express their satisfaction to him, though one of them was not satisfied with her
grades, but this did not affect her overall satisfaction. As for the lecturer, he stated
that he is affected by positive feedback. Figure 5.24 summarises unit four’s
relationships.
Figure 5.24: Summary for Unit seven relationships.

180
5.1.2.8 Unit eight
“She was good... she has experience and she knows what she's talking about... her
communication during lectures was good, encourages students to participate”
(St8S1, MSc student, 8/9/2015).
This is how one of the students described her lecturer. This description aligns with the
other student opinion. Both students agreed on the lecture's experience, knowledge and
communication. They also both agreed that due to her busy schedule she was not
communicating with them properly outside the class:
“Even when you send emails to her, it took long for her to answer... you need to
send emails to book an appointment... she is not very easy to get... I know that she
has other responsibilities... So she is not really accessible like that!” (St8S2, MSc
student, 1/10/2015).
They also agreed that she was fair and friendly:
“She does the right thing like... she sugar coat what she's gonna tell you if you are
doing something and it's not right or... not up to the right level; this is better I think
rather than... be awfully harsh and kind of make you feel a bit silly but she's fine
about it, she just tells you: no that's how it should be...” (St8S1, MSc student,
8/9/2015).
With regards to the grades and their effect on satisfaction, they both agreed that grades do
not affect satisfaction. Moreover, one of the students joked saying that:
“we received the grades and I wasn't happy with the grade, so I should be saying a
lot worse about her [the participant smiled]” (St8S1, MSc student, 8/9/2015).
While the other student explained that grades are an outcome of students effort:
“Her grades were good... I passed this course, it's more about... you know at time,
it's not all about like teaching, teaching, teaching; there times you should be able to
sit down and read for yourself... so if she is giving you the notes and giving you
handouts, explained it to you to the best of her knowledge, it's now left to you to go
sit down read and understand it much better in a way” (St8S2, MSc student,
1/10/2015).
Students also were happy with overall experience of her, though it was her first time to
teach them. Upon asking if they would take another course with her, one said yes, while

181
the other one stated that she did not like the block delivery so most probably she will go
somewhere else:
“I'm not sure... it might be because of the long hours lecture, it's boring...” (St8S2,
MSc student, 1/10/2015).
As for the feedback, despite that both of the students were satisfied, they did not tell the
lecturer, one of them stated: “if something really bad happened or something really good,
something not in their line of duty; probably then I would take it up” (St8S1). They just
filled in the evaluation form. And they had different views of the effect of this feedback on
the lecturer satisfaction:
“Yes, because may be if you... if a student said thank you, it was great; then maybe
you are gonna be like happier and may be you are gonna carry on and keep trying
to help students” (St8S1, MSc student, 8/9/2015).
While the other student believed that her opinion will not affect lecturer satisfaction:
“No I don't think so... because whenever you gave them negative or positive
feedback; I don't really think it moves them or makes them understand that... You
know and in most cases, even on those forms, because everybody is kind of in a
rush to fill it in and go, so sometimes people don't really give their honest opinion
about if the class was really that horrible or it was good, so I would say it doesn't
really affect” (St8S2, MSc student, 1/10/2015).
Upon interviewing the academic staff she explained that she assesses students satisfaction
via MEQ at the end of the module and reflection. She asks the students to write down the
three things they enjoyed and the three things they learned during the module. She also
explained that she receives positive feedback and that it affects her satisfaction. On the
other hand, she stated that she received negative feedback and again it depends on the
source of this feedback:
“Well, negative feedback, you listen and you think well, are they right? are they
wrong? Why are they saying it?... it's welcomed as well, it depends what it is and
what's wrong”.
Through this unit, although those students were satisfied with the lecturer and one of
them realised that this feedback would affect that lecturer’s job satisfaction, she did
not report it. On the other hand, the lecturer stated that positive feedback affects her
satisfaction in positive way, and that negative feedback might affect her depending on

182
its source. Figure 5.25 represents this relation, as the blue dotted line indicates that
the relation is not present, and the black solid line indicates that this relation is
evident.
Figure 5.25: Summary for Unit eight relationships.
Students were interviewed throughout the eight units. More than half of the students
(twelve) did not express their feedback to their lecturers, although that the majority were
satisfied. This was either simply because they did not think about it, or because they
thought that the lecturer would not care about their feedback (as shown in Figure 5.26). On
the other hand, interviews revealed that most of the academic staff members are highly
affected by positive feedback, as it increases their satisfaction (as shown in Figure 5.27).
They also stated that negative feedback might affect their satisfaction, but this depends on
the source of this feedback.
Figure 5.26: Summarises the relationship between the students interviewed and feedback.

183
Figure 5.27: Summarises the relationship between feedback and the staff interviewed.
Finally, Figure 5.28 represents the whole conceptual framework along with the nodes that
emerged throughout the interviews.

184
Figure 5.28: Represents the whole conceptual framework along with the nodes that emerged from the interviews

185
5.2 How does the marketisation affect PG student perceptions of HE?
To investigate the second research question, students were asked about their expectations
of the service provided by SBS and the tuition fees they pay.
Through the interviews, it was ascertained that students built their expectations from
several factors, such as their experience during their UG studies. Also of note is that eight
students had their done UG degree at SBS. Expectations also were based on what students
were promised through the school website; the ranking of the school and finally the open
days that were organised by the school.
“I look at the ranking… I looked at what the university provides, the quality of the
teaching which was known by recommendation” (St1S1, MBA student,
20/10/2014).
Students interviewed saw that the tuition fee price as an indicator of the quality of service
they had anticipated.
“I think for me it has impact it will serve as a factor that student will consider, the
price... for me, it worth the service I received compared to other universities. It
worth what I have been enjoying here” (St3S1, MSc student, 27/10/2014).
Invariably, this factor depended on the background of students. Even though international
students evaluated the fees as high, some of them were satisfied with the quality of service
offered by the university and perceived the price to be value because of past experiences of
HE in their native countries.
“Being from the Middle East, the price is high, so I expect high level of service. For
what I paid, I think I received good service, it's worth it” (St2S2, MSc student,
28/10/2014).
While others were expecting more especially because they are paying more than home
students:
“I think the fees are, it's all business, really, I just know they appeal to international
students because we do pay more of it. But I think we get the same services as
everybody else does and I think fees is just basically you pay the fee, you can learn
here” (St6S2, MSc student, 18/9/2015).
As for the MBA students because they pay high fees they consider themselves customers:
“We are paying customers and we want the best for the money we pay for it... I'm

186
paying a lot of money for it and I will make sure that I get the maximum that I paid
for”. (St1S3, MBA student, 12/5/2014).
“I believe giving up that money; it's a lot of money, so I consider myself as a
customer” (St7S1, MBA Student, 1/10/2015).
Students explained that they are customers not just because of the tuition fees but because
of the promise they had from the school to provide a high quality service. According to the
students, these promises gave them the right to complain if they are not happy with the
service provided:
“One tutor, we were not happy with and we have complained to the director of the
MBA about it and subsequently the module was actually... The lecturer was
changed for the subsequent part of the module and this purely because there was
some complains about her” (St1S1, MBA student, 20/10/2014).
They also explained that good service covers several items such as: lecturers with
knowledge, experience and good communication skills, physical facilities, and helpful
administrative staff. They indicated that the school should offer more than just teaching:
“Free Gym membership or something like that… make something free, you are
paying so much money...” (St6S2, MSc student, 18/9/2015).
“As a customer... I expect a better service” (St1S2, MSc student, 25/10/2014).
“You know a very good customer service like fast in response even though when
things are wrong… at least they respond. That's good that someone has an interest
and trying to help rather than no interest at all.” (St6S3, MSc student, 23/10/2015).
As explained in part two (feedback), students had different ideas about grades. While four
students saw that it contributes to their satisfaction, fourteen stated that it is not:
“I'm really satisfied ... because I felt that I learnt something. The feedback I got
from him was 'strong' good” (St2S2, MSc student, 28/10/2014)
Other students explained that though they did not get a high grade they do not blame the
school or the lecturer:
“Not really because I had put that down to maybe myself” (St5S1, MSc student,
27/4/2015).
Moreover, one of the students explained that although he didn’t receive a high grade he
was satisfied with the lecturer and he was praising the lecturer during the interview:

187
“I wasn't happy with the grade, so I should be saying a lot worse about he [the
participant smiled]” (St8S1, MSc student, 8/9/2015).
Most of the students interviewed (fourteen students) stated that grades do not affect their
satisfaction (as shown in Figure 5.29).
Figure 5.29: Students’ feedback regarding grades.
Overall, most of the students interviewed considered themselves as customers. Out of the
twenty interviews, seventeen stated explicitly that they consider themselves as customers.
They even compared the service provided by the school with service provided by other
suppliers:
“We are the reason why they are here (referring to the academic staff), he as a
lecturer has to teach us ‘the students’ so if we are not satisfied... just like customer
and employee, so if your customer is not satisfied so you have not deliver any
service” (St2S3, MSc student, 5/10/2015).
“If you buy anything online even on Amazon people always look at the customer
reviews before they even look at the product description because you wanna know
how satisfied are these people with this product, so I think it's the same that works
with anything... universities services are the same thing so, you can make it all look
pretty on your website but one bad comment... because you just like oh it could be
that bad, is it really worth it?” (St4S2, MSc student, 20/4/2015).
The tuition fees they pay along with school marketing communications and previous
experience, made them capable of assessing the service provided and this adds to their
feeling of being customers. Despite that feeling, the PG student had a mature approach to

188
learning and did not expect to receive a high grade as results of paying fees. They were
concerned more about the knowledge they acquire during their study.
Figure 5.30 illustrates the factors that contribute to students perception as being customers:
this includes both tuition fees and service provided by the school. As explained above, the
expectations students have from their previous experience along with marketing
communication affects student perception of service provision. It was also noted that
grades were not amongst the factors that contributes to this perception.
Figure 5.30: Nodes and sub-nodes related to the students perception as customer.
5.3 Chapter summary
This chapter started by presenting the steps of analysis using NVivo along with the
advantages and disadvantages of using this software. Later, the data drawn from interviews
were analysed into two main sections based on the research questions. As it was explained,
data sourced from two key groups; PG students and academic staff at SBS.
The first section of this chapter presented PG student and academic staff point of view
regarding the service provided at SBS and if management through their commitment to
quality affects their satisfaction (part one). As for the second part, the data is presented in
terms of units. Each unit represents one academic staff and their students. On the other
hand, the second section explored the effect of HE marketisation on PG students'
perception. The findings represented in this chapter will be discussed thoroughly in
relation to the literature discussed in chapter two.
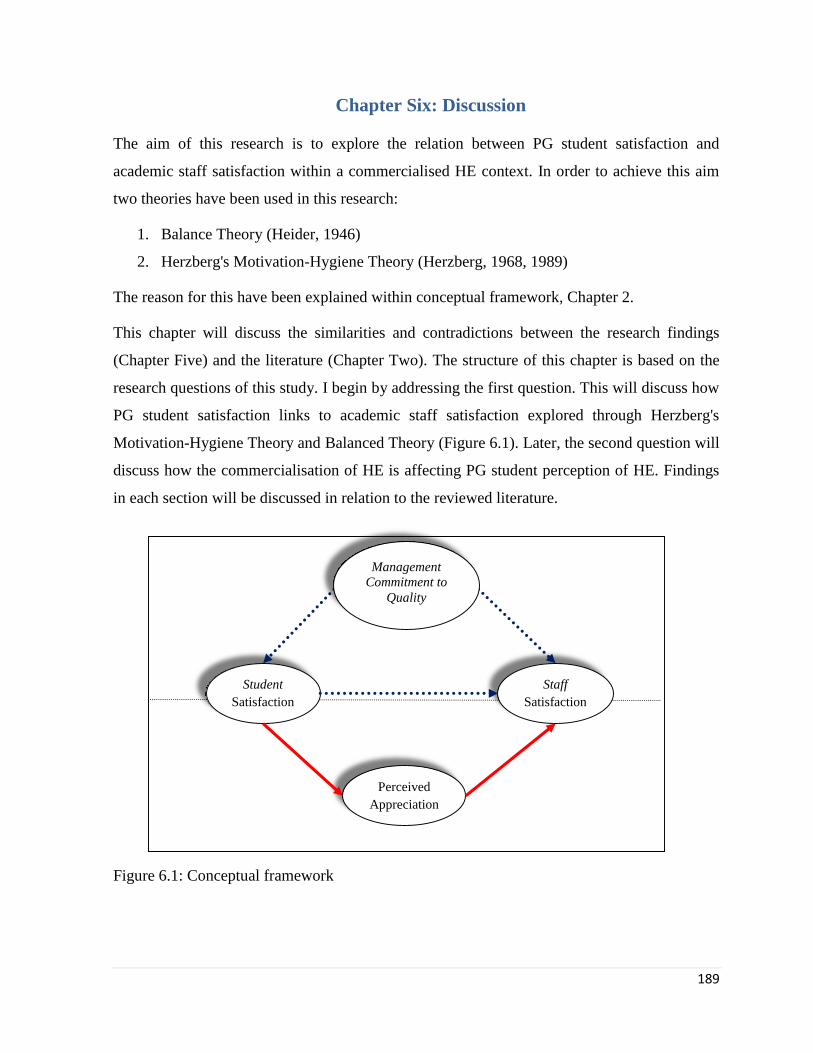
189
Student
Satisfaction
Staff
Satisfaction
Perceived
Appreciation
Management
Commitment to
Quality
Chapter Six: Discussion
The aim of this research is to explore the relation between PG student satisfaction and
academic staff satisfaction within a commercialised HE context. In order to achieve this aim
two theories have been used in this research:
1. Balance Theory (Heider, 1946)
2. Herzberg's Motivation-Hygiene Theory (Herzberg, 1968, 1989)
The reason for this have been explained within conceptual framework, Chapter 2.
This chapter will discuss the similarities and contradictions between the research findings
(Chapter Five) and the literature (Chapter Two). The structure of this chapter is based on the
research questions of this study. I begin by addressing the first question. This will discuss how
PG student satisfaction links to academic staff satisfaction explored through Herzberg's
Motivation-Hygiene Theory and Balanced Theory (Figure 6.1). Later, the second question will
discuss how the commercialisation of HE is affecting PG student perception of HE. Findings
in each section will be discussed in relation to the reviewed literature.
Figure 6.1: Conceptual framework
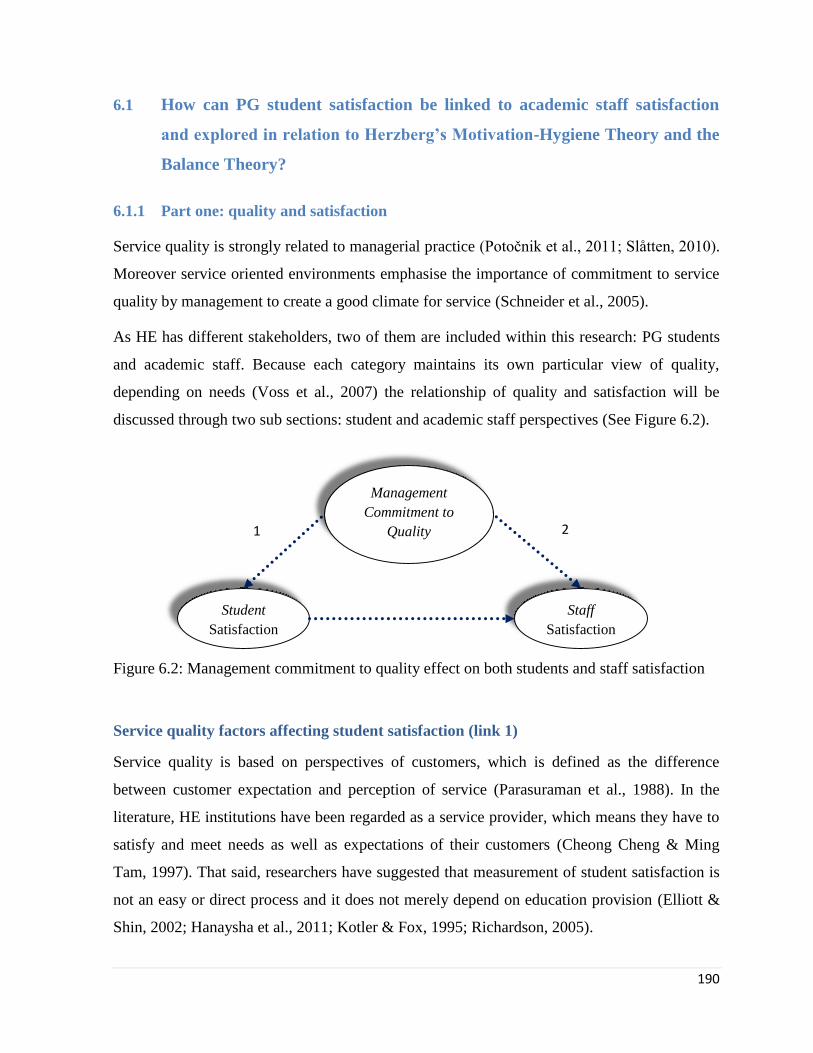
190
6.1 How can PG student satisfaction be linked to academic staff satisfaction
and explored in relation to Herzberg’s Motivation-Hygiene Theory and the
Balance Theory?
6.1.1 Part one: quality and satisfaction
Service quality is strongly related to managerial practice (Potočnik et al., 2011; Slåtten, 2010).
Moreover service oriented environments emphasise the importance of commitment to service
quality by management to create a good climate for service (Schneider et al., 2005).
As HE has different stakeholders, two of them are included within this research: PG students
and academic staff. Because each category maintains its own particular view of quality,
depending on needs (Voss et al., 2007) the relationship of quality and satisfaction will be
discussed through two sub sections: student and academic staff perspectives (See Figure 6.2).
Figure 6.2: Management commitment to quality effect on both students and staff satisfaction
Service quality factors affecting student satisfaction (link 1)
Service quality is based on perspectives of customers, which is defined as the difference
between customer expectation and perception of service (Parasuraman et al., 1988). In the
literature, HE institutions have been regarded as a service provider, which means they have to
satisfy and meet needs as well as expectations of their customers (Cheong Cheng & Ming
Tam, 1997). That said, researchers have suggested that measurement of student satisfaction is
not an easy or direct process and it does not merely depend on education provision (Elliott &
Shin, 2002; Hanaysha et al., 2011; Kotler & Fox, 1995; Richardson, 2005).
1 2
Student
Satisfaction
Staff
Satisfaction
Management
Commitment to
Quality

191
Many studies have linked student satisfaction to service quality. Through these studies,
satisfaction has been linked to product quality, tuition (fees) and other factors. Invariably,
student satisfaction has been considered as a source of advantage for which universities
compete against each other. Therefore, throughout the current research the assessment of
student satisfaction is based on student perspectives.
In chapter two (section 2.2.1) several service quality definitions were discussed. It was
explained how all client judgments are subjective. They are based on the difference between
expected and perceived quality, leading to satisfaction if perceived is greater than the expected
(Gronroos, 1990; Zeithaml et al., 1985). In 2014, Sultan & Wong defined service quality as:
“… a set of market driven and dominant features of an offered service that have a
long-term performance effect on sustained provider–customer relationship” (p. 490).
In HE Sahney et al. (2004) stated that quality may follow the general definitions of quality,
such as:
Meeting or exceeding customer expectations of education.
Excellence in education.
That said, Chong & Ahmed (2015) found that service quality definition varies amongst
individuals.
In this section students were asked to list service quality factors that they consider important
from their point of view. Their answers (presented in chapter 5) will be discussed in relation to
the literature review.
a. Academic Staff:
This was the first factor mentioned by students and repeated in the coding process of all SBS
student interviews. They explained that skills such as tutor communication, knowledge and
experience are the most important quality factors in their perception (Figure 6.3).

192
Figure 6.3: Criteria of academic staff
As discussed (section 5.1.1) more than half of students highlighted the importance of
communication between themselves and academic staff. This was repeated nine times during
the coding process where communication was positive, while on five occasions,
communication was discussed negatively. Consequently, it can be perceived that some
students are not satisfied with current levels of communication. This aligns with the literature:
Douglas et al. (2015) found that communication can be a source of dissatisfaction.
Stukalina (2012) emphasises the essential nature of internal communication for
knowledge transfer in educational institutions and that technology is a vital factor in
driving this.
These findings contradict Herzberg's Motivation-Hygiene Theory (1968, 1989): in theory
communication is part of interpersonal relations and should be considered as a source of
dissatisfaction and not satisfaction as indicated by my findings.
During interviews most students indicated that they prefer tutors who enable them with
opportunity to engage, participate and create through active environments. This is consistent
with the findings of Angell et al., (2008) which indicated that being a skilled and engaging
lecturer are amongst the most important factors to students. That said, this contradicts the
findings of Zineldin et al., (2011), which found that the skill of lecturers is ranked third in
relation to perceived quality factors (following quality of atmosphere and quality of
infrastructure, including classroom cleanliness).
Table 6.1 summarises the findings of the current research, literature and Herzberg's
Motivation-Hygiene Theory.
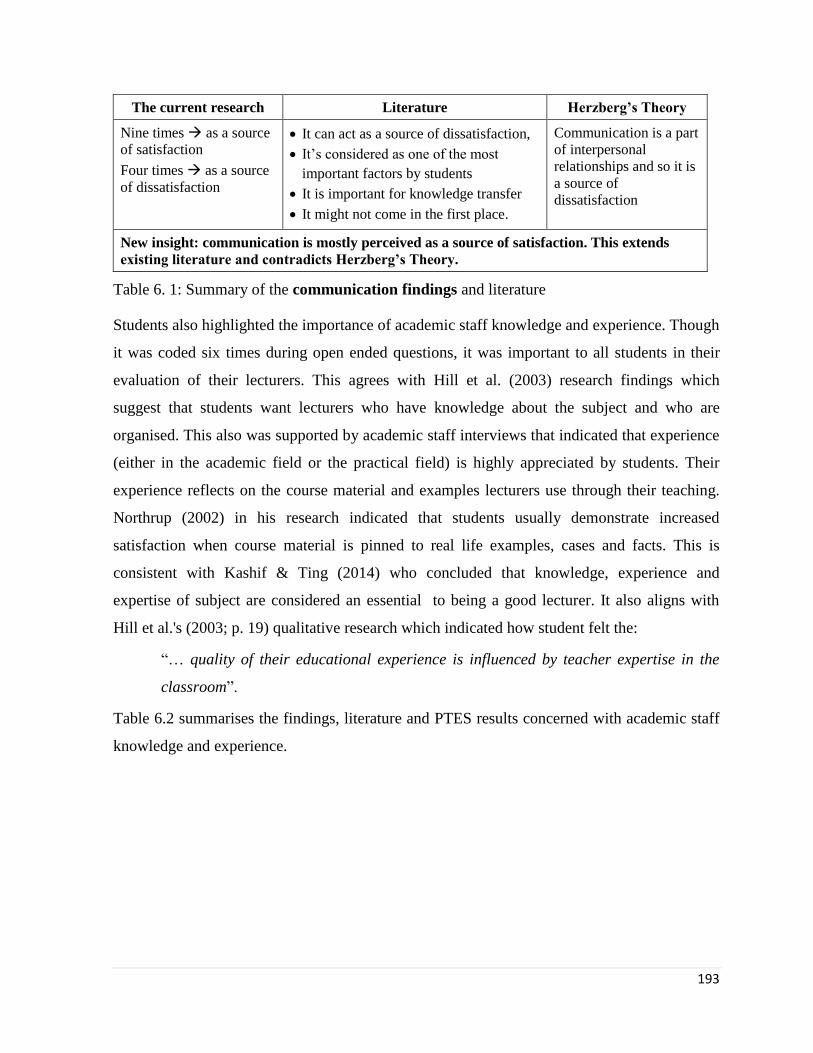
193
The current research Literature Herzberg’s Theory
Nine times as a source
of satisfaction
Four times as a source
of dissatisfaction
It can act as a source of dissatisfaction,
It’s considered as one of the most
important factors by students
It is important for knowledge transfer
It might not come in the first place.
Communication is a part
of interpersonal
relationships and so it is
a source of
dissatisfaction
New insight: communication is mostly perceived as a source of satisfaction. This extends
existing literature and contradicts Herzberg’s Theory.
Table 6. 1: Summary of the communication findings and literature
Students also highlighted the importance of academic staff knowledge and experience. Though
it was coded six times during open ended questions, it was important to all students in their
evaluation of their lecturers. This agrees with Hill et al. (2003) research findings which
suggest that students want lecturers who have knowledge about the subject and who are
organised. This also was supported by academic staff interviews that indicated that experience
(either in the academic field or the practical field) is highly appreciated by students. Their
experience reflects on the course material and examples lecturers use through their teaching.
Northrup (2002) in his research indicated that students usually demonstrate increased
satisfaction when course material is pinned to real life examples, cases and facts. This is
consistent with Kashif & Ting (2014) who concluded that knowledge, experience and
expertise of subject are considered an essential to being a good lecturer. It also aligns with
Hill et al.'s (2003; p. 19) qualitative research which indicated how student felt the:
“… quality of their educational experience is influenced by teacher expertise in the
classroom”.
Table 6.2 summarises the findings, literature and PTES results concerned with academic staff
knowledge and experience.

194
The current research Literature PTES
Coded six times as a source
of satisfaction.
Students appreciate lecturers who
have good knowledge about the
subject, experience and who are
well organised.
Students show more satisfaction if
the course material involves real
life examples, cases and facts.
80% of the students indicated
that staff members are capable
of explaining things
Insight: Current study supports the literature and PTES findings that staff knowledge and
experience acts as a source of satisfaction by the students
Table 6. 2: Academic staff knowledge and experience in the current research, literature and
PTES.
Effective use of technology (by lecturers) was mentioned twice by students. They used this to
compare between two lecturers teaching on the same module. The students justified this by
explaining that this module required experience and knowledge of new technologies, which
may be the main reason this factor was not mentioned by other interviewed students, whose
specialisations did not require technology teaching. That said, this factor was considered a
main factor that affects student satisfaction by Wilkins & Stephens Balakrishnan (2013). This
was not found in the literature as a factor that affects the quality of the service provided at
universities.
Table 6.3 compares the current research findings and literature.
The current research Literature
Coded once as a source of satisfaction
Coded once as a source of dissatisfaction
One of the main factors that affect students’
satisfaction.
Insight: Current study does not fully support the literature findings. Effective use of technology
was not as important for SBS PG students as it was in literature.
Table 6. 3: Effective use of technology (by lecturers) and students’ satisfaction.
b. Academic services
As discussed in section 5.1.1, students divided the academic services provided by SBS into
three sub nodes: research environment, international experience, and personal tutors (Figure
6.4).

195
Figure 6.4: Academic service node and associate sub nodes.
As an academic service provided by SBS, students discussed the research environment that
was provided through workshops and trainings held by the school. They highlight the
advantages of the training courses as well as English courses that helped students to improve
their academic writing. These findings were consistent with Sultan & Wong (2014, 2013) and
Hill et al. (2003); they found that workshops, seminars and conferences, which are held by the
university as service facilities are required to create a competitive HE environment.
Table 6.4 compare the current research findings to the literature and PTES results.
The current research Literature PTES
Coded five times as a source
of satisfaction.
Training courses, workshops,
and seminars affects students’
satisfaction.
85% of students believed their
research skills have been
developed during their courses.
Insight: Current study findings are consistent with the literature and PTES results that
training courses, seminars and workshops acts as a source of satisfaction by the students
Table 6. 4: Research environment and students satisfaction.
On the other hand, the international experience provided by the school to its MBA and MSc
students was a source of satisfaction, especially since it was not highlighted when applying for
their course – in reality they gained more than they had expected. The literature highlighted
the benefits of international exposure and linked it to intellectual development (Durkin et al.,
2012). It was also found to develop intercultural communication skills (Williams, 2005).
Moreover, in their research Banerjee & Mandal (2013) concluded that global exposure

196
improves programme quality and increases student opportunities to achieve employment. That
said, the literature did not find it to be one of the factors that affect student satisfaction.
Table 6.5 summarises the findings and literature concerned with international experience
provided by SBS.
The current research Literature
Coded four times as a source of satisfaction. Did not link between international exposure
and satisfaction.
Insight: Current study findings indicated that international experience acts as a source of
satisfaction by the students, which was not highlighted by literature.
Table 6. 5: International experience and students’ satisfaction
Despite the rich body of literature that explores the role of personal tutors in supporting
students and their positive effect on student satisfaction (Braine & Parnell, 2011; J. Douglas et
al., 2006; Wilcox et al., 2005), this factor was coded only eight times during the analysis
process. Four of the students did not have any contact with or knew their personal tutors. This
may be linked to high workload of lecturers, in addition to the fact that sometimes they do not
have access to their personal tutees. This was mentioned by one of the staff:
“I just had to contact five of my personal tutees to arrange meetings with them, three
they gave me the wrong email address... and two have left the programme and nobody
told me” (St6, 5/11/2015)
As for those who managed to communicate with their personal tutors, they were very satisfied
and their feedback aligned with the literature. Overall, it seems that the school needs to make
more effort to establish a link between the students and their personal tutors; from this
research personal tutors increase student satisfaction, by helping and supporting them through
their studies at SBS.
Table 6.6 compare personal tutor effect on students’ satisfaction in the current research
findings to the literature review.

197
The current research Literature
Coded eight times:
Two times Did not know that they have personal tutor
Two times Did not manage to meet them (source of
dissatisfaction)
Four times managed to meet their personal tutor (source of
satisfaction).
Personal tutor contributes
positively to students’
satisfaction.
Insight: Current study supports the literature that personal tutors acts as a source of
satisfaction by the students.
Table 6. 6: Personal tutor and student satisfaction.
c. Facilities
As mentioned in the previous chapter (section 5.1.1), facilities were considered in two parts:
physical and IT services provided by SBS (figure 6.5).
Figure 6.5: Facilities node and its sub nodes.
Despite this Khan et al., (2011: p. 163) emphasised that:
“Students don’t rate institute on the basis of building and physical appearance but on
the grounds of quality of education”.
As mentioned in the analysis chapter (section 5.1.1) twelve students indicated that resources
provided by the university (such as library, buildings, venues, IT equipment) were to their
expectations which in turn affected their satisfaction. This supports Wells and Daunt (2011),
who proposed a conceptual model where student satisfaction is affected by the physical
environment of a HE institute (Wells and Daunt, 2011 cited in Wilkins & Stephens
Balakrishnan, 2013). Similarly, Oldfield and Baron (2000) also stated that physical evidence,
which is linked to the service, can be developed to create higher levels of satisfaction.

198
Moreover, research of Hanssen & Solvoll (2015) concluded that library quality influence
student satisfaction with institution facilities and overall satisfaction with their HE provider.
This was supported by students who expressed their satisfaction with the library and services
provided there.
During interviews students highlighted that IT services affect their satisfaction. This agrees
with Wismantoro (2014) and Sherifi (2015) who concluded that IT services have a positive
impact on student satisfaction.
On the other hand, these findings do not align with Herzberg's Motivation-Hygiene Theory
(1989). In his Theory Herzberg considered resources as a hygiene factor, i.e. resources are
considered as a source of dissatisfaction not satisfaction as interviewees indicated.
Nonetheless, even though findings contradict parts of Herzberg's Motivation-Hygiene Theory,
it appears that infrastructure and facilities provided by the school are very important for
students who consider it a source of satisfaction. Their satisfaction was displayed through a
high agreement percentage in the Postgraduate survey, where 88% of the students indicated
that library and services were good.
Table 6.7 compares research findings to the literature, Herzberg's Motivation-Hygiene Theory
and PTES.
The current research Literature Herzberg’s Theory PTES
Physical facilities:
Coded twelve times as a
source of satisfaction
IT services (including
Blackboad):
coded eight times, two
of them as a source of
dissatisfaction
Most of the literature
linked between
facilities (physical and
IT) and students’
satisfaction.
Facilities are
considered as a part
of the working
conditions which
are a source of
dissatisfaction.
88% of the students
were satisfied with the
library, resources and
support services
New insight: Facilities are generally perceived as a source of satisfaction which aligns with
existing literature and PTES results but contradicts Herzberg’s Theory.
Table 6. 7: Facilities effect on students satisfaction.

199
d. Support staff
In addition to academic staff the research findings showed that through ten incidents students
were dissatisfied with supporting staff members. This contradicts the research of Sumaedi et
al. (2012) that defined supporting staff as having influence on student satisfaction.
These findings emphasise the importance of supporting staff and this aligns with the research
of Sultan and Wong (2013). They suggest that supporting staff are important to quality and
need to be considered in research alongside academic aspects of HE service (Angell et al.,
2008). It is also supported by Poon & Brownlow (2015) who argued that in order to deliver a
high quality service HE institutions must ensure interaction between students and supporting
staff:
“… adheres to the principles of quality customer service” (P. 105).
That said, these findings contradict Coskun’s (2014) research, which suggested that
administrative staff members are the final factor that affects student satisfaction following
academic staff, technology, campus facilities and relationships.
In consequence, it appears that in this current research, supportive staff members play a major
role in student satisfaction, which means management need to develop and train these staff to
provide a supportive administrative environment within SBS.
A comparison between current research findings and literature is presented in table 6.8.
The current research Literature
Coded eleven times:
One time as a source of satisfaction.
Ten times as a source of dissatisfaction
Most of the literature confirmed that
supporting staff contributes positively to
students’ satisfaction.
Insight: Current study contradicts the literature as supporting staff acted as a source of
dissatisfaction.
Table 6. 8: Supporting staff effect on student satisfaction.
e. Lectures
Through interview analysis (section 5.1.1) there were two major points that were used to
assess the lectures delivered to MSc and MBA students at SBS. The first one was the delivery
mode used (Block delivery) and the second was the venues and timing (figure 6.6).
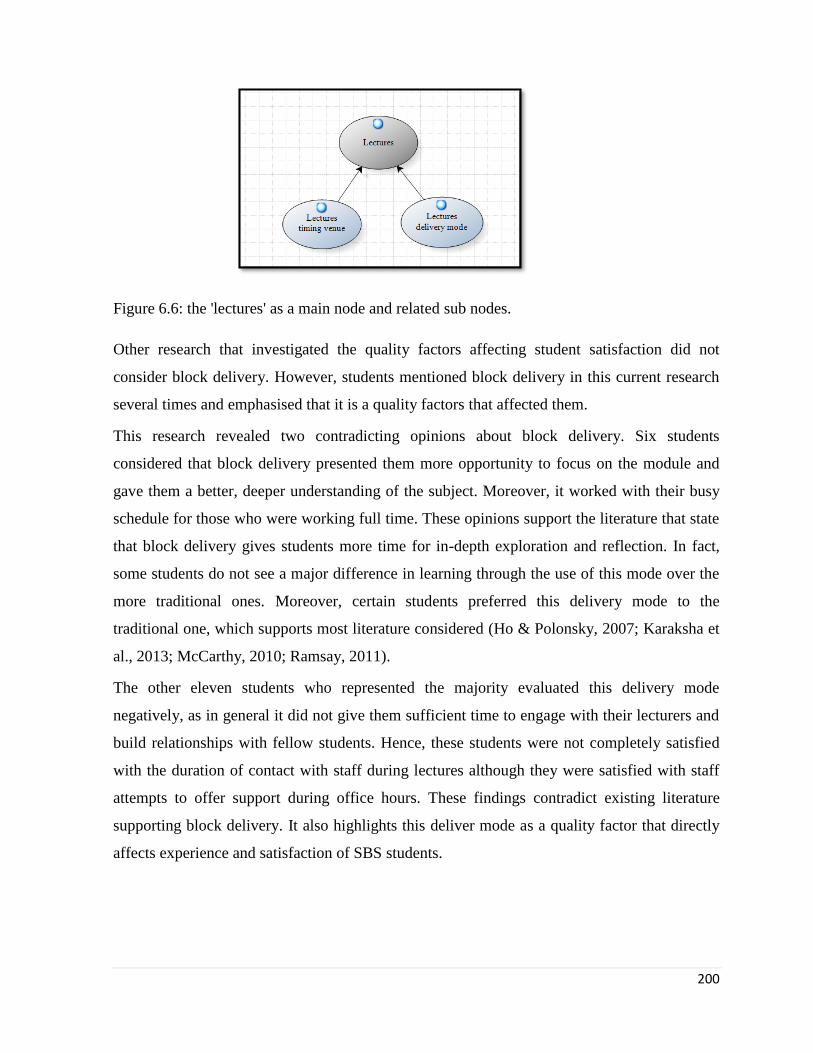
200
Figure 6.6: the 'lectures' as a main node and related sub nodes.
Other research that investigated the quality factors affecting student satisfaction did not
consider block delivery. However, students mentioned block delivery in this current research
several times and emphasised that it is a quality factors that affected them.
This research revealed two contradicting opinions about block delivery. Six students
considered that block delivery presented them more opportunity to focus on the module and
gave them a better, deeper understanding of the subject. Moreover, it worked with their busy
schedule for those who were working full time. These opinions support the literature that state
that block delivery gives students more time for in-depth exploration and reflection. In fact,
some students do not see a major difference in learning through the use of this mode over the
more traditional ones. Moreover, certain students preferred this delivery mode to the
traditional one, which supports most literature considered (Ho & Polonsky, 2007; Karaksha et
al., 2013; McCarthy, 2010; Ramsay, 2011).
The other eleven students who represented the majority evaluated this delivery mode
negatively, as in general it did not give them sufficient time to engage with their lecturers and
build relationships with fellow students. Hence, these students were not completely satisfied
with the duration of contact with staff during lectures although they were satisfied with staff
attempts to offer support during office hours. These findings contradict existing literature
supporting block delivery. It also highlights this deliver mode as a quality factor that directly
affects experience and satisfaction of SBS students.

201
Students also felt that the long hours created by use of this mode (two and a half days) make it
hard for them to retain focussed on the current subject and that by the end of the lecture and it
is harder to follow up with a specific lecturer. This is one of the intensive delivery mode
drawbacks mentioned by Hesterman (2015). When universities apply this mode of teaching
the research of Young et al. (2009) recommended short breaks, different presentations and
media material to be used in order to maintain student attention.
Table 6.9 compares research findings to the literature and PTES.
The current research Literature PTES
Six times as a source of
satisfaction.
Eleven times as a source
of dissatisfaction
Most of the literature highlighted
the advantages of the Block
Delivery mode. Few authors
mentioned that long hours are the
main negative aspect of Block
Delivery.
Around 45% of the students
failed to agree that the contact
time was sufficient as they
meet their lecturers for two
and half days every three
weeks.
New insight: Block delivery is mostly perceived as a source of dissatisfaction which extends
existing literature and aligns with the PTES results.
Table 6. 9: Block delivery from students, literature and PTES perspectives.
Students also highlighted that some venues allocated to them as PG students were not to
expectation. This is either because the layout did not support group activities or because if
they arrived late and this forced them sit at the end of the room without a sound system. This
agrees with the literature that linked between student satisfaction to lecture venues (Alam
Malik et al., 2012; Gruber et al., 2010; Robertson et al., 2012).
f. Students Experience
Arambewela and Hall, (2009); Douglas et al. (2015); and Sumaedi et al., (2012) emphasised
the importance of social activities that help students interact and build relationships.
Comparatively, students at SBS did not feel having social activities was overly important. It
was mentioned only four times during the coding process as being one of the drawbacks of
block delivery leading to a lack of interaction time between students.

202
The current research Literature
Coded four times as a source of
dissatisfaction
Literature highlights the importance of having social
activities as contributing positively to student
satisfaction.
Insight: Current study supports the literature and emphasise on the importance of having social
activities and interaction between students.
Table 6. 10: Current research findings and literature concerning social activities and
interaction
Despite literature such as Gregory (2008) highlighting the importance of having international
students on campus to create a diversified culture and ensure student positive outcome, this
was just mentioned only by four students. This implies that this does not affect students
satisfaction yet it remained a positive aspect of studying at SBS. In their research, Shaw et al.
(2015) concluded that having international students in learning groups:
“…broadened the exposure of domestic students” (p. 127).
This agrees with the opinion of students that showed increased satisfaction through:
“International environment, having students from different countries... different
cultures and different experience” (St6S3, MSc student, 23/10/2015).
Table 6.11 compares students experience from students’ perspective to literature review.
The current research Literature
Coded four times as a source of
satisfaction.
Few literature links between having an
international environment and students’ positive
outcome.
New insight: Having international environment was perceived as a source of satisfaction
which extends existing literature.
Table 6. 11: International environment in the current research and literature.
Despite most previous studies using a quantitative approach, this research used the qualitative
data to explore the service quality factors that affect student satisfaction. Also, most previous
researches looked at UG students, while this current research deals only with PG taught
students.
As a consequence, this leads to some factors not mentioned in the literature, as well as other
discussed in the literature that were not mentioned by SBS PG students; these include things

203
such as the UKBA (UKVI) regulations. International students were dissatisfied with the paper
process. They believed the school need to clarify the process and who is responsible for what.
Furthermore, they should explain to all that it is a national border control policy and not
internal to UoS.
International students highlighted the importance of synchronising systems between the school
and their university accommodation so that they did not need to pay for time before starting
their programme. This agrees with the research of Arambewela and Hall (2009) which stated
that international students expect accommodation to be provided by universities with at least
minimum standards of comfort and at an acceptable price.
Comments of interviewed students reflected the importance of supportive services and the
effect they had on their satisfaction. Services considered were:
IT services.
Library
Research environment
Accommodation
This contradicts Elliott & Healy (2001) research that stated that student satisfaction results
only from HE educational experience. Findings also contradict Ware & Williams (1975) who
found that students are incapable of assessing the service quality provided since they do not
know what to expect. This may be applicable to UG students, but the current research suggests
that PG students had knowledge and experience raising their awareness of what they could
expect from SBS.
The findings of the current research match that conducted by Letcher & Neves (2010). Their
research indicated that students do not relate their satisfaction with a specific subject to
general programme satisfaction. This was demonstrated when some students stated that they
were dissatisfied with one of the courses. That said, when asked about their overall satisfaction
they indicated that they were very satisfied with the programme as a whole. This was also
shown by other students who were dissatisfied with personal tutor or lecturers they had
worked with for supervision, as overall they were satisfied with the programmes they were
doing. This also agrees with the research of Bitner and Hubbert (1994) that highlights that a
tolerance is developed by a customer in the case of long-term service relationships when

204
previous experiences has been positive; in these cases a customer does not overemphasise
negative ones (Bitner and Hubbert, 1994, cited in Van Doorn, 2008).
These research findings also contradicts Jancey & Burns (2013) who concluded that PG
students have different needs to UG students. Many of the same factors in this research were
identified in their researched conducted with UG students (Yusoff et al., 2015; Coskun, 2014;
Sumaedi & Bakti, 2012; Briggs, 2006; Oldfield & Baron, 2000) as in this body of research.
Overall, the findings of the current study are consistent with the research by Cheung and To
(2010) which showed management commitment to quality affects student satisfaction. All
students interviewed indicated that management commitment to quality affects the quality of
service provided and consequently their satisfaction.
In the literature considered it was found that a relationship between service quality and
satisfaction exists (Angell et al., 2008; Smith et al., 2007; Sultan & Wong, 2013), and the
present research agrees with those studies.
Based on the above discussion, in the current study using Critical Incident Technique in
HE sector, the service quality scope covers a broad range of factors: academic and
supporting staff, academic services, facilities, lectures and students experience.
Nonetheless, there were some factors that had a negative impact on their satisfaction. That said
overall they were satisfied with their experience at SBS. Therefore, these findings indicate a
positive relationship between management commitment to quality and student
satisfaction (Link 1).
So, quality in HE is about having both academic and professional services, infrastructure
to deliver an educative service, student life and personal development meeting student
expectations that match the pre-student offer acceptance communications. Student
satisfaction can thus be summarised as:
The overall perception of pleasure and enjoyment achieved by students.
The feeling that results when their expectations of teaching, facilities and learning
support are met by the actual experience.

205
The result of student comparison of expectations to their previous experience,
word of mouth and HE institution promises (through their websites, open days
and marketing).
The expectations related to educational and their lives on campus.
These findings support Gruber’s (2010) claims that service quality measurement is a difficult
process. Moreover, through the interviews it was clear that it is a subjective process where the
level of satisfaction is affected by student background. The findings support Gronroos (2000)
seven dimensions of good perceived service quality (section 2.1.1):
Dimension Description Current research
Professionalism
and skills
Employees, service provider,
physical resources, in addition to
the required skills and knowledge
that are used in order to solve
customer issues professionally.
SBS have highly trained and
experienced academic staff, as well
as up to date resources to provide a
high level of service to PG students
Accessibility
and flexibility
Provision and easy access to a
service and its provider through
their location and operating hours,
which are prepared in a flexible
way in order to address customer
requirements.
SBS provides the students with
both online and physical libraries
that are available 24/7. Also most
academic staff are approachable
via email.
That said, students were not
entirely satisfied with the
supporting team.
Attitudes and
behaviour
How contact people (service
employees) interact with customers
and help them solve their problems
in a friendly manner.
Academics were the main factor
affecting students satisfaction:
most of them were approachable
and showed real interest in helping
students.
Reliability and Customer dependence on the SBS is keen to satisfy their

206
trustworthiness
service provider to perform and
keep promises. Thus demonstrates
that the customers’ best interest is
central to the organisation.
students and they use different
surveys to assess the service they
provide. Moreover, they assign
personal tutors to each PG student
to make sure that that if they face
any problem they have someone to
go to.
As mentioned, the school needs to
stress the importance of personal
tutors as some of the students did
not know about them or never
managed to meet them.
Service
recovery
At times when something
unpredictable occurs or goes
wrong, the service provider will
take an immediate and active
response to find an acceptable and
a new solution.
SBS is keen to provide an
immediate recovery to problems as
mentioned by the MBA students.
Serviscape
Physical surrounding in addition to
aspects of the service environment
that help and support positive
experiences throughout the service
process.
As discussed, physical facilities
had an important role in student
satisfaction.
Reputation and
credibility
Trust that the service provider will
provide value for money that
represents value and good product
execution for the customer.
As it will be discussed in section
6.2, the tuition fee plays a role in
students expectations and
satisfaction.
Table 6. 12: Applying Gronroos dimensions

207
Based on the level of the service provided, students assess management commitment to
quality. Moreover, the current research indicates that the quality of the academic service
provided at the school is not the only source of satisfaction. Students also assess the
physical facilities as well as other services provided including those they expected to be
provided by the school. Figure (6.7).
Figure 6.7: Nodes and sub-nodes representing quality factors mentioned by students
Quality factors affecting academic staff satisfaction (link 2)
According to Sabharwal & Corley (2009) academic staff has not received much attention,
because it has been presumed that a high level of job satisfaction exists in universities.
However, various literatures have tried to explore factors that affect academic staff satisfaction
and dissatisfaction (Adetoro, 2014; Machado et al., 2011; Ololube, 2006).
In order to explore the effect of management commitment to quality on academic staff
satisfaction, as mentioned in the previous chapter (section 5.1.1), academic staff members
were asked to share their ideas about factors they consider an indicator of management
commitment to quality. In addition, they were asked to provide feedback regarding
organisational support, training, empowerment and rewards, which were the factors that were
highlighted in literature as indicators of management commitment to quality (Babakus et al.,
2003; Kim et al., 2009; Cheung and To, 2010).

208
As discussed in the analysis chapter (section 5.1.2), four main nodes emerged from the
interviews analysis. The following part will discuss each of these nodes, and their sub nodes,
in the light of the literature discussed in chapter two (section 2.2.4).
a. Job design
Staff mentioned three points that are related to their job design, which are: workload, career
progression and rewarding.
Figure 6.8: Job design node.
Research findings revealed that workload is one factor associated with academic staff
dissatisfaction (table 6.12). It was the first factor that was mentioned, repeated and coded
throughout all interviews. This indicates its importance to the academic staff. Moreover, one
explained that workload might include tasks which are not related to teaching or research, but
this affects the time allocated for research. This is consistent with the researches of Sanderson
et al. (2000); Roelen et al., (2008); Ahsan et al. (2009); Awang et al. (2010) and Mustapha &
Ghee (2013) which indicate that there is a negative relation between workload and job
satisfaction. It also agrees with the research by Porter and Umbach (2000) that found academic
staff workload covers multiple factors other than teaching, such as (Porter and Umbach 2000,
cited in Mustapha, 2013).:
Research time.
Administrative work.
Student evaluation.
Courses and material preparation.

209
The research of Herzberg et al. (2010) identified work itself as one of the factors that can
impact job satisfaction positively. This contradicts what staff members said during my
research. They stipulated that it can be a factor that causes dissatisfaction. During interviews it
was also noted that workload affects the time allocated for research, which subsequently
causes increased dissatisfaction.
Table 6.13 summarises the current research findings, literature and Herzberg's Motivation-
Hygiene Theory.
The current research Literature Herzberg theory
Coded seven times as a
source of dissatisfaction
There is a negative relation between
workload and satisfaction
Workload is due to duties such as
teaching, research and administrative
time.
Workload is a part of
work. According to
Herzberg, work is a
source of satisfaction
Insight: workload is mostly perceived as a source of dissatisfaction which aligns with existing
literature and contradicts Herzberg’s Theory.
Table 6. 13: Workload and staff satisfaction.
While workload was a source of dissatisfaction, career progression was generally a source of
satisfaction for most of the interviewed academic staff. Moreover, they were satisfied with
their Personal Development Review (PDR). Six of the staff were satisfied with their career
progression while the other two stated that the school does not care about the academic
progression. This does not align with the research of Rolfe, Stevens & Weale (2005). They
noted that career progression equally raised and lowered academic staff satisfaction. The two
who were dissatisfied had issues with the school actions. In their opinion high workload
means they do not have enough time for research and consequently they cannot work towards
their PDR objectives.
Nonetheless, this factor aligns with Herzberg's Motivation-Hygiene Theory as the PDR is
merely a part of the work itself and a source of satisfaction.
Table 6.14 compares the current research findings, literature and Herzberg's Motivation-
Hygiene Theory.

210
The current research Literature Herzberg Theory
Coded six times as a
source of satisfaction
Coded twice as a
source of dissatisfaction
Career progression raise and lower
academic staff satisfaction.
PDR is a part of work.
According to Herzberg, work
is a source of satisfaction.
Insight: Current study supports the literature that PDR can act as a source of satisfaction and
dissatisfaction. At the same time, findings contradict Herzberg’s Theory as the same factor
cannot be a source of satisfaction and dissatisfaction.
Table 6. 14: Career progression.
In addition to linking rewards to employee satisfaction, Babakus at al. (2003) indicated that
rewarding is perceived by employees as:
“… genuine commitments on the part of management” (p. 276).
This creates positive responses from employees. Through interviews staff members were
presented with two opinions. The majority of staff (seven) indicated that financial rewards are
linked to promotion, which are consequently linked to research and publications, and that they
are not based on student feedback. Thus, they do not depend on the quality of teaching,
which is actually the main aim for the school. Ultimately, this puts pressure on staff
members as they are forced to balance their workload and research in order to be promoted
and consequently rewarded. Furthermore, some staff members stated that there were financial
rewards such as the VC award based on student feedback. Despite this, other staff argued that
they did not have time to apply for this. Overall, it seems that the majority of staff were
dissatisfied with the rewarding system. This aligns with Bustamam, Teng, & Abdullah's
(2014) research that linked rewards to job satisfaction. This was also shown in the staff
experience survey 2014 results that indicated that only 10% of staff thought the university
sufficiently financially rewarded excellent performance. These findings contradicts literature
by Hofmans et al. (2013) and Terera & Ngirande (2014) who found that rewarding is not
related to job satisfaction although it affects employee retention.
As for non-financial rewarding through recognition, in two incidents staff indicated that
through having published or by attending a conference as a speaker, they had received praise
through the university website or internal newsletters and emails. That said, the majority of
staff members indicated that working as an academic staff member was not recognised. They
felt that not being recognised affected their satisfaction negatively. This aligns with Osakwe

211
(2014) who concluded that recognition has a positive impact on academic staff satisfaction.
That said, the findings of the current research contradict Herzberg et al. (2010) who identified
recognition as an intrinsic factor that can positively affect job satisfaction.
In the context of SBS it seems that rewarding is linked merely to publication and discounts the
teaching and learning which are the main jobs of lecturers. Even with the VC award, lecturers
need to apply, supporting their application with student comments and feedback and it is not
driven by school management. As for the recognition it appears this needs to be handled
positively by school management.
Table 6.15 represents the current research findings, literature, Herzberg's Motivation-Hygiene
Theory and staff experience survey.
The current research Literature Herzberg’s Theory Staff Experience Survey
2014
Rewards do not depend
on teaching coded
seven times as a source
of dissatisfaction
Literature
linked between
rewards and job
satisfaction.
Just 10% indicated that
they either strongly
agreed or agreed that
"Excellent performance is
financially rewarded by
the University". While
87% stated that they
strongly disagreed or
disagreed with the same
statement.
Recognition coded
five times as a source
of dissatisfaction
Literature
suggested that
recognition
increase
academic staff
satisfaction.
Recognition as one of
the intrinsic factors that
can affect job
satisfaction which are a
source of dissatisfaction.
Half of the staff are
satisfied with the
recognition they receive,
taking into consideration
that the percentage of
employees that believe
their pay and benefits
system to be fair to have
declined from 80% (2011)
to 76% (2014).
New insight: rewarding and recognition were mostly perceived as a source of dissatisfaction
which agrees with existing literature and contradicts Herzberg’s Theory. The findings also
support the staff experience survey 2014 results.
Table 6. 15: Rewarding and recognition.

212
b. Support staff
Support staff have been recognised as one factor that lead staff dissatisfaction. It was coded as
a source of dissatisfaction ten times from three members of the staff:
“In order to be good academic we need good academic support in terms of time
tabling, in terms of students support” (St5, 7/5/2015).
In 2014 De Lourdes Machado-Taylor et al. indicated that along with the working environment,
personal and professional development, facilities, and colleagues, support staff are considered
as a source of academic staff satisfaction in Portuguese HE. The findings of this research
contradict De Lourdes Machado-Taylor et al. (2014) and Noordin & Jusoff (2009) researches
in that the supporting staff affecting academic staff were found to be a source of
dissatisfaction.
As an extrinsic factor supporting staff are a source of dissatisfaction which aligns with
Herzberg's Motivation-Hygiene Theory.
It is worth considering that in the current research support staff were a source of
dissatisfaction for half of the students and part of the academic staff interviewed at SBS.
Table 6.16 summarises the current research findings, literature and Herzberg's Motivation-
Hygiene Theory.
The current research Literature Herzberg’s Theory
Coded ten times by three
members of academic
staff as a source of
dissatisfaction
Literature mainly classifies
supporting staff as a source of
satisfaction for academic staff.
Supporting staff can be
classified under personal
relations and work environment;
both are Hygiene factors that
cause dissatisfaction.
New insight: supporting staff was perceived as a source of dissatisfaction which extends
existing literature and aligns with Herzberg’s Theory.
Table 6. 16: Supporting staff and academic staff satisfaction.
c. Facilities
Findings from this research have indicated that facilities, whether IT services or physical
services (figure 6.9), can be a source of satisfaction and dissatisfaction.

213
Figure 6.9: Facilities node and the two sub nodes IT services and physical facilities.
Four academic staff members indicated that the IT service were of low standard and that they
could be improved upon. Moreover, half of them indicated that it is one thing that caused
dissatisfaction. This agrees with the study done by Shin and Jung (2014) which indicated that
there is a relationship between job satisfaction and extrinsic factors such as “Technology
support”. On the other hand, these findings contradict Adetoro’s (2014) research which
indicated that the availability and use of IT had no direct relation to job satisfaction of
academic staff.
The findings of the current research agree with Herzberg (1989) Theory that there are factors
that can lead to job dissatisfaction (Hygiene Factors) and one of these factors is working
conditions including tools that the employee uses.
Table 6.17 compares the current research findings, literature and Herzberg's Motivation-
Hygiene Theory
The current research Literature Herzberg’s Theory
IT services was coded
four times as a source
of dissatisfaction
Literature concluded that IT services
affect academic staff satisfaction or
there is no relation between IT services
and satisfaction.
Working conditions are
Hygiene factors that cause
dissatisfaction.
New insight: IT services were perceived as a source of dissatisfaction which extends existing
literature and supports Herzberg’s Theory.
Table 6. 17: IT services and academic staff satisfaction
On the other hand physical facilities were one of the reasons that four academic staff members
were dissatisfied. That said, the new and modern facilities at Media City were a source of
satisfaction for another two staff. These findings partially contradict Karabit-Yik & Anbar

214
(2008) and De Lourdes Machado-Taylor et al. (2014) who considered facilities as a source of
academic staff satisfaction. Furthermore, these findings do contradict Herzberg's Motivation-
Hygiene Theory, as factors which are classified as source of satisfaction cannot be a source of
dissatisfaction. Moreover, it indicates that the working environement as tools and space are
considered sources of dissatisfaction.
Table 6.18 compares the current research findings, literature and Herzberg's Motivation-
Hygiene Theory.
The current research Literature Herzberg’s Theory
Coded four times as a
source of dissatisfaction
Coded once as a source
of satisfaction
Most of the literature concluded that
facilities affect academic staff
satisfaction.
Working conditions are
Hygiene factors that cause
dissatisfaction.
New insight: Physical facilities is mostly perceived as a source of dissatisfaction which extends
existing literature and contradicts Herzberg’s Theory.
Table 6. 18: Facilities and academic staff satisfaction
d. School environment
Academic staff interviewed mentioned seven factors that relate to the school and working
environment, which were: empowerment, training, organisational support, teamwork,
autonomy, academic freedom, and respect (figure 6.10).
Figure 6.10: School environment node and related sub nodes
Research findings indicated that the academic staff interviewed were satisfied with levels of
empowerment. They also stated that they did not require further empowerment and they were
well supported by line managers. This agrees with Rafiq and Ahmed (1998) and Babakus et al.
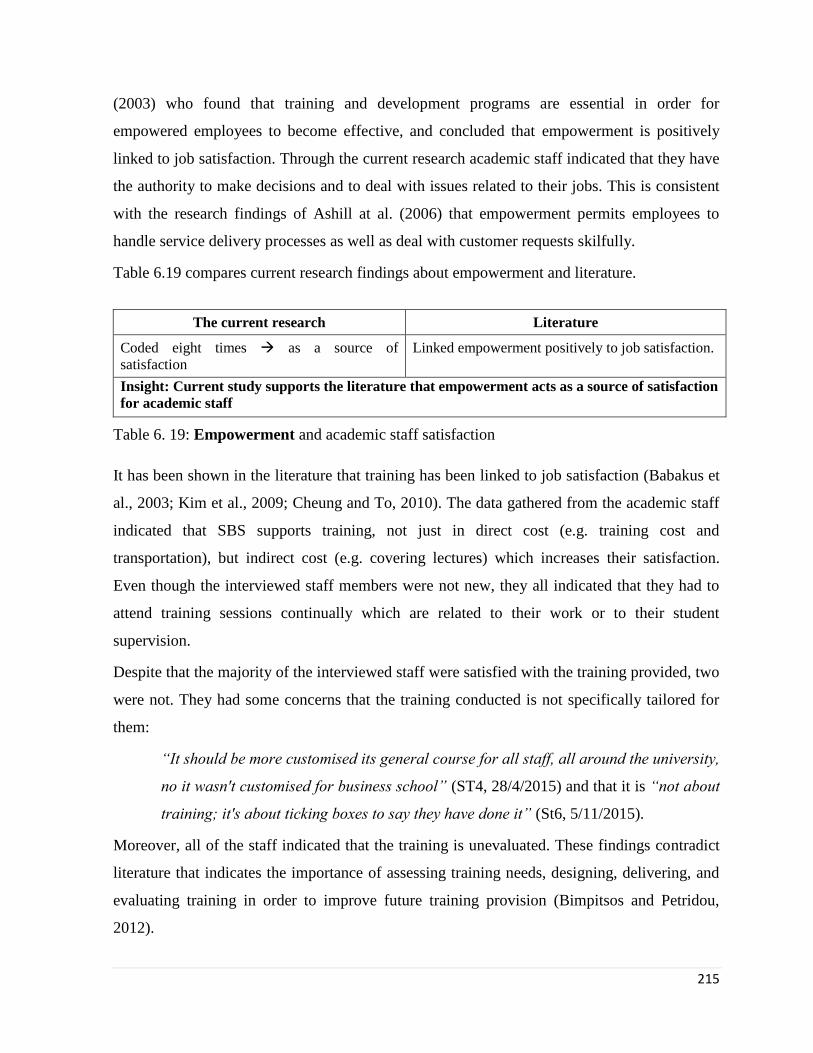
215
(2003) who found that training and development programs are essential in order for
empowered employees to become effective, and concluded that empowerment is positively
linked to job satisfaction. Through the current research academic staff indicated that they have
the authority to make decisions and to deal with issues related to their jobs. This is consistent
with the research findings of Ashill at al. (2006) that empowerment permits employees to
handle service delivery processes as well as deal with customer requests skilfully.
Table 6.19 compares current research findings about empowerment and literature.
The current research Literature
Coded eight times as a source of
satisfaction
Linked empowerment positively to job satisfaction.
Insight: Current study supports the literature that empowerment acts as a source of satisfaction
for academic staff
Table 6. 19: Empowerment and academic staff satisfaction
It has been shown in the literature that training has been linked to job satisfaction (Babakus et
al., 2003; Kim et al., 2009; Cheung and To, 2010). The data gathered from the academic staff
indicated that SBS supports training, not just in direct cost (e.g. training cost and
transportation), but indirect cost (e.g. covering lectures) which increases their satisfaction.
Even though the interviewed staff members were not new, they all indicated that they had to
attend training sessions continually which are related to their work or to their student
supervision.
Despite that the majority of the interviewed staff were satisfied with the training provided, two
were not. They had some concerns that the training conducted is not specifically tailored for
them:
“It should be more customised its general course for all staff, all around the university,
no it wasn't customised for business school” (ST4, 28/4/2015) and that it is “not about
training; it's about ticking boxes to say they have done it” (St6, 5/11/2015).
Moreover, all of the staff indicated that the training is unevaluated. These findings contradict
literature that indicates the importance of assessing training needs, designing, delivering, and
evaluating training in order to improve future training provision (Bimpitsos and Petridou,
2012).

216
Overall, it seems that the school is interested and cares about increasing staff knowledge and
skills, as well as keeping this up to date. That said they still need to revise the training process
and consider staff needs during its development.
Table 6.20 summarises the current research findings, literature and Herzberg's Motivation-
Hygiene Theory.
The current research Literature Herzberg’s Theory
It was coded six times
as a source of satisfaction.
Coded twice as a
source of dissatisfaction
Literature that training has been linked to
job satisfaction.
Literature highlighted the importance of
assessing training needs, designing,
delivering, and evaluating the training in
order to improve the training provided
Factors can either
cause satisfaction or
dissatisfaction.
Insight: Current study supports the literature that training is considered as a source of
satisfaction. On the other hand, findings contradict Herzberg’s Theory.
Table 6. 20: Academic staff training and Job satisfaction
Organisational support is considered a factor that indicates management commitment to
service excellence (Kim et al., 2009). The literature reviewed has confirmed a link between
organisational support and job satisfaction especially in service providing organisations
(Susskind et al., 2000; Kim et al., 2005; Kim et al., 2009). This is supported in the findings of
this research as the majority of the interviewed staff members felt that supporting staff welfare
is a part of the policy of SBS as well as being embedded in its organisational culture. They
also indicated that the school supports them with their problems, which makes them feel that
they can rely on management. Management also support staff with their careers and through
their personal development reviews. Thus, this psychological process creates a trust link
between employees and SBS, which consequently increase employee commitment and
satisfaction (Kim et al., 2009). It also seems that support depends largely on line managers.
Several respondents indicated that they receive support from their line manager.
Table 6.21 compares organisational support in the current research, literature and Herzberg's
Motivation-Hygiene Theory perspectives.

217
The current research Literature Herzberg’s Theory
It was coded six times as a
source of satisfaction
Coded twice as a source of
dissatisfaction
Linked between
organisational support and
job satisfaction.
Factors can either cause
satisfaction or dissatisfaction.
Insight: Current study aligns with the literature that organisational support affects
academic staff satisfaction. Findings contradict Herzberg’s Theory.
Table 6. 21: Organisational support and academic staff satisfaction
Throughout analysis of data, academic freedom was cited four times. A staff member
mentioned that he had the freedom to do what he felt appropriate in terms or teaching,
research or expression without bullying, pressure or harassment, and another explained that
she had a voice where she could express her opinions. Both staff members demonstrated
throughout their interviews that their academic freedom is a source of satisfaction. On the
other hand, another two expressed their dissatisfaction with the degree of freedom and
mentioned that they actually feel constrained. It was interesting that only half of the
interviewed staff discussed this during interviews. This implies that either they are satisfied
which is why they did not mention it or that it is unimportant to the staff. This potentially
could be the reason as they tended to mention factors that either caused satisfaction or
dissatisfaction. The literature highlighted the link that exists between academic freedom and
job satisfaction and stressed its importance (de Lourdes Machado-Taylor, 2014; Houston et
al., 2006; Verhaegen, 2005). These findings contradict Herzberg's Motivation-Hygiene as the
same factor (academic freedom) causes job satisfaction and dissatisfaction (Table 6.22).
The current research Literature Herzberg’s Theory
Coded twice as a source
of satisfaction
Coded twice as a source
of dissatisfaction
Linked between academic freedom
and job satisfaction.
Factors can either cause
satisfaction or dissatisfaction.
Insight: Current study aligns with the literature that academic freedom affects academic staff
satisfaction. Findings contradict Herzberg’s Theory.
Table 6. 22: Academic freedom and job satisfaction
During the interviews 'Autonomy' was not a factor mentioned by the staff. It was mentioned
by less than half of staff and only one of them was dissatisfied with the level of autonomy at

218
SBS. This contradicts Bellamy & Watty (2003), Watty et al. (2008). Renzulli et al. (2011) and
Osakwe (2014) who indicated that autonomy is the most important factor that affects staff
satisfaction representing the positive aspects of academic life quality. Furthermore, two of
them suggested that it is one of the main reasons for why staff remain in academic fields (table
6.23).
The current research Literature Herzberg’s Theory
Coded twice as a
source of satisfaction
Coded once as a source
of dissatisfaction
Concluded that autonomy is the most
important factor that affects academic
staff satisfaction.
Factors can either cause
satisfaction or dissatisfaction.
Insight: Current study findings did not highlight autonomy as an important factor as in
Literature. Furthermore, findings contradict Herzberg’s Theory.
Table 6. 23: Autonomy and academic staff satisfaction
Interviewees also did not pay attention to respect as a factor, except in two cases where one
was very satisfied and another very dissatisfied. Again these findings support literature that
highlights the concept that organisations that treat their employees with respect help create
workplace environments that promotes loyalty and engagement. This leads to satisfaction
(Lockwood, 2007). Also it has been stated that respect affects staff satisfaction (Bozeman &
Gaughan, 2011). That said, these findings contradict Herzberg (1989) as this factor is both a
cause of satisfaction and dissatisfaction (table 6.24).
The current research Literature Herzberg’s Theory
Coded once as a source
of satisfaction
Coded once as a source
of dissatisfaction
Respect has a positive effect on
academic staff satisfaction.
Factors can either cause
satisfaction or dissatisfaction.
Insight: Current study findings did not highlight respect as an important factor that affects
staff satisfaction as in Literature. Furthermore, findings contradict Herzberg’s Theory.
Table 6. 24: Respect and academic staff satisfaction.
Throughout this research teamwork was mentioned twice as a source of satisfaction; it was not
a primary factor and it was just mentioned in positive terms. This is contrary to the research
findings of Renzulli et al. (2011). They felt that support from co-workers is strongly related to

219
job satisfaction. Teamwork was found to be positively related to job satisfaction in several
scholarly works (Houston et al. 2006; Rhodes at al. 2007; Volkwein and Parmley 2000 cited in
Ahmed et al, 2010). The current research findings contradict Herzberg (1989) as relations
between peers are considered a source of dissatisfaction (table 6.25).
The current research Literature Herzberg’s Theory
Coded twice as a
source of satisfaction
Teamwork was positively related
to job satisfaction.
Personal relations are Hygiene
factors that cause dissatisfaction.
New insight: Teamwork was not one of the main factors that affects staff satisfaction, which
extends existing literature and contradicts Herzberg’s Theory.
Table 6. 25: Teamwork and academic staff satisfaction
Overall, throughout the second section staff members were asked to discuss and assess quality
factors that affect their satisfaction along with factors that they consider indicator of
management commitment to quality. Job design, facilities, supportive staff and school
environment were some factors mentioned by academic staff. The results of this research
support some literature regarding the relation between some factors such as job design,
facilities, supportive staff and academic staff satisfaction. It also revealed that some factors
were unimportant to staff such as autonomy and team work. In general, despite a distinct level
of dissatisfaction academic staff members were generally satisfied and they agreed that
management commitment to quality affects their satisfaction. This aligns with Forrester (2000)
and Babakus et al. (2003) who confirmed that management commitment to service quality has
an impact on job satisfaction. They emphasised the need to measure the commitment to
quality from the employee perspective.
Through the interviews academic staff pointed out that management commitment to quality
means:
Providing appropriate resources to help them to do their jobs.
Having a clear communication strategy.
Supporting academic staff to do more research
These were among the factors staff used to define management commitment to quality. These
findings align to Cheung and To’s (2010) definition of management commitment to quality
220
(section 2.4.1) that management needs to provide resource and engage in activities that create
a culture for quality service.
The current findings support all factors mentioned in the literature as an indicator of
management commitment to quality. That said the reward related factors amongst
academics means that research paper production is the rewarded activity and of higher
value than teaching.
Part one summary:
Now it is useful to review some points:
As this study was conducted using a qualitative approach with PG students who are
taught through Block delivery mode, it should be noted that quality factors mentioned
are slightly different than in previous researches. Moreover, some factors such as
teaching mode have been highlighted as affecting student satisfaction. The
international experience, in addition to having international students and staff on
campus enriched student experience and caused satisfaction. Academic staff, lectures
and facilities provided by the school were the most important factors from student
points of view.
On the other hand, academic staff had their own unique factors that affected their
satisfaction. Using the qualitative approach gave staff freedom to express their feeling
and talk about things that they consider important. It was interesting to find out that
academic freedom, team work and autonomy were not mentioned in the majority of
interviews. Workload, rewarding and career progression were amongst the most
common factors discussed by the staff.
It is also worth mentioning that facilities and supporting staff were common factors for
both staff and students.
It was also noted repeatedly that different factors acted as sources of satisfaction and
dissatisfaction contradicting Herzberg's Motivation-Hygiene Theory (1989). This
supports Johnston’s research (1995) that sources of satisfaction are not always contrary
to sources of dissatisfaction.

221
The research findings support the idea that management commitment to quality affects
both customer and employee satisfaction (Azadehdel et al., 2013; Cheung and To,
2010; Malhotra & Mukherjee, 2004).
To summarise this first part which examines the relation between management commitment to
quality and satisfaction, both students and staff members agree that school management
through their commitment to quality affects satisfaction in a positive way. This draws
attention to the fact that both students and staff members were satisfied with the quality
offered by the school, meaning that the link between management commitment to quality
and student satisfaction is positively linked, and the connection between management
commitment to quality and staff satisfaction is equally positive.
As discussed in Chapter two the Balance Theory argues that people try to find consistency in
their life’s relations through equilibrium and that a lack of equilibrium causes unbalanced and
unpleasant states from which people try to find and restore their equilibrium. It also states that
in the three elements model proposed by Heider in 1946 balance occurs when there are three
positive relations or two negative and one positive between elements. In the current research
the links between management commitment to quality (from one side) and students and
academic staff satisfaction (from the other side) are positive. According to Balance
Theory this means that there is a positive relationship between student and academic
staff satisfaction.
Despite the difference between this research and the research of Frey et al., (2013) in that:
This research is qualitative, while the study by Frey et al., (2013) is quantitative.
This research applied the Balance Theory using three elements as in Heider’s original
model, while the study by Frey et al., (2013) suggested that the client as a “person with
more social power” is the most powerful part in the professional services triadic
relationship, and this convinces others (employees) to amend their attitudes.
This research was conducted in SBS in the UK. The study by Frey et al., (2013) was
conducted using data subjects that were within professional services in EU nations.
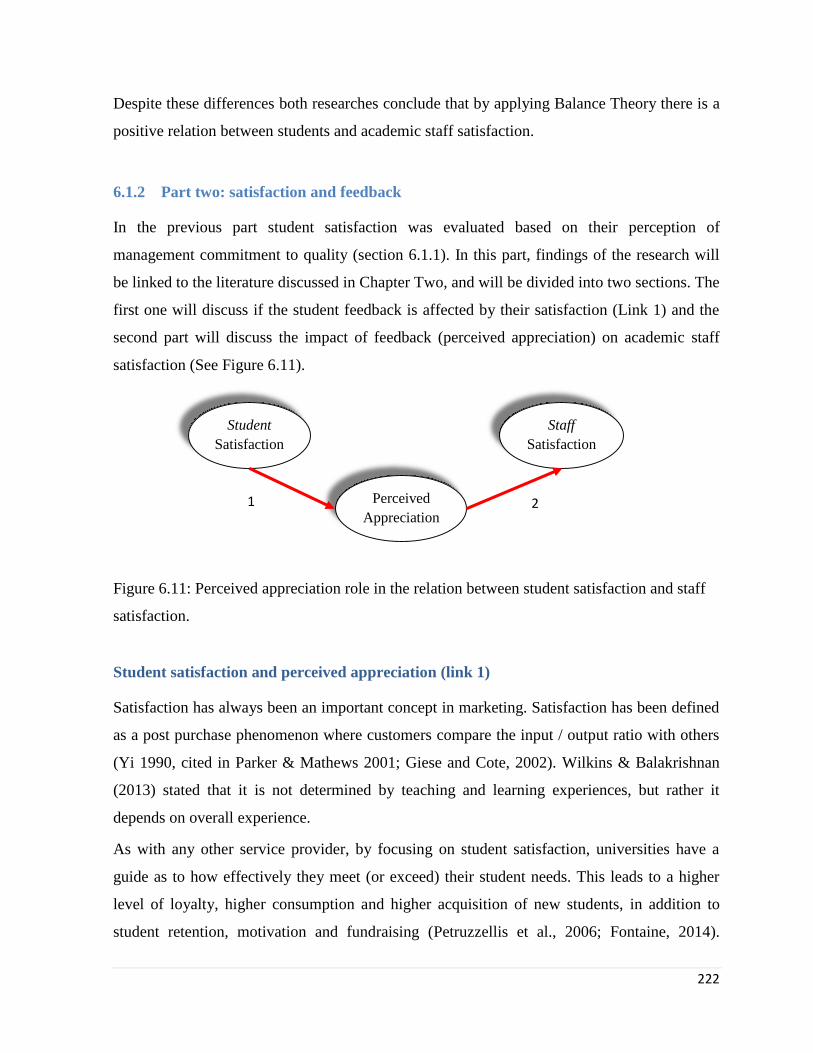
222
Despite these differences both researches conclude that by applying Balance Theory there is a
positive relation between students and academic staff satisfaction.
6.1.2 Part two: satisfaction and feedback
In the previous part student satisfaction was evaluated based on their perception of
management commitment to quality (section 6.1.1). In this part, findings of the research will
be linked to the literature discussed in Chapter Two, and will be divided into two sections. The
first one will discuss if the student feedback is affected by their satisfaction (Link 1) and the
second part will discuss the impact of feedback (perceived appreciation) on academic staff
satisfaction (See Figure 6.11).
Figure 6.11: Perceived appreciation role in the relation between student satisfaction and staff
satisfaction.
Student satisfaction and perceived appreciation (link 1)
Satisfaction has always been an important concept in marketing. Satisfaction has been defined
as a post purchase phenomenon where customers compare the input / output ratio with others
(Yi 1990, cited in Parker & Mathews 2001; Giese and Cote, 2002). Wilkins & Balakrishnan
(2013) stated that it is not determined by teaching and learning experiences, but rather it
depends on overall experience.
As with any other service provider, by focusing on student satisfaction, universities have a
guide as to how effectively they meet (or exceed) their student needs. This leads to a higher
level of loyalty, higher consumption and higher acquisition of new students, in addition to
student retention, motivation and fundraising (Petruzzellis et al., 2006; Fontaine, 2014).
Student
Satisfaction
Staff
Satisfaction
Perceived
Appreciation 1 2

223
Additionally, there is a relationship between satisfaction and positive “word of mouth” (Alves
& Raposo, 2010; Elliott & Shin, 2002).
Using the dyadic sampling technique (section 4.8) this part will explore student satisfaction
with a specific lecturer. The concept of selecting a specific lecturer was made in order to
connect a student to a lecturer and evaluate whether the student was satisfied or not and the
effect of their feedback on lecturer satisfaction.
Academic staff were the first factor mentioned by students as an indicator of service quality
offered by SBS (as highlighted in section 5.1.1). Literature defined effective lecturers as being
competent, well organised, friendly, always involving students, and as a readily available. A
lecturer who fulfils these criteria influences student satisfaction (Chireshe, 2011; Hill et al.,
2003). Through this, students were asked to name specific lecturers and questioned in regards
to several factors they consider important in a lecturer such as:
Teaching.
Communication skills.
Friendless.
Ability to understand their needs to assess satisfaction with the lecturer.
Subsequently, they were asked about their feedback and whether they tried to send it to their
lecturer by direct or indirect means.
Teaching and experience
Research findings give high importance to academic staff (section 5.1.2); students were
generally satisfied with their lecturers teaching and experience. This aligns with Hill et al.'s
(2003) research findings indicating that students appreciate lecturers who have good
knowledge about the subject and who are organised. This also was supported when academic
staff mentioned that they feel that their experience (either academic or the industrial fields) is
appreciated. This experience reflects in the course material and the examples lecturers use in
their teaching. Northrup (2002) in his research found that students usually show more
satisfaction if the course material involves real life examples, cases and facts (Kashif & Ting,
2014; Northrup, 2002) (table 6.26).

224
The current research Literature
Coded twenty times lecturer’s
knowledge and experience is a source of
satisfaction
Lecturers who: have subject knowledge, organised and
use real life experience act as a source of satisfaction.
Insight: Current study supports the literature: academic staff teaching and experience affects
students’ satisfaction.
Table 6. 26: Academic staff teaching and experience and its effect on students' satisfaction
Communication Skills
Communication has been defined as both formal and informal means that are used to share
information. This has been related to a lecturer ability to explain complicated issues clearly
(Hefferman et al., 2010). Moreover, it is one of the characteristics that Voss (2014) and Voss
& Gruber (2006) identified in effective instructors. Through interviews some students
mentioned that being able to participate in the lecture was reason for satisfaction. This agrees
with the literature and specifically Brophy’s (2001) research that lecturers must perform
different tasks in addition to their teaching. These include providing feedback, stimulating
students motivating them, and assisting engagement in the learning process (Brophy, 2011
cited in Long et al., 2013). This also agrees with Northrup’s (2002) research, which stated that
course design should have potential to initiate rich communication and it has an impact on
student learning and satisfaction.
At SBS, communication was not limited to the lectures. Students found that they were able to
book appointments with their lecturers even though they were increasingly busy. This was a
source of satisfaction for the students. This agrees with the research of Oldfield & Baron
(2000) which indicates that showing courtesy and genuine interest towards students has great
benefits and cost nothing. Moreover, some students explained that in some cases they just go
for quick and urgent consultation. According to the interviewees most of the academic staff
members were accessible either through their office hours or by booking an appointment. Voss
et al. (2007) indicated that approachable members of staff affect student satisfaction.
Furthermore, Kim and Sax (2009) stated that contact between faculty and students, either
inside or outside class, increases student development and aids their learning outcomes. Long

225
et al., (2013) also indicated that interaction between student and lecturer is imperative to the
learning process as well as knowledge construction and social relationships. Invariably, this
process of exchanging information about educational content is essential for learning, as it
affects student satisfaction. Long (2013) indicated that staff should be able to understand the
diverse, different natures and backgrounds of students. This was the case for SBS interviewed
students who indicated that most staff members understood their needs and were capable of
considering the different backgrounds of students.
That said, these findings contradict Herzberg's Motivation-Hygiene Theory. Considering
communication as a part of student working conditions and interpersonal relations, it should
be a source of dissatisfaction, not satisfaction. These findings are outlined below in table 6.27.
The current research Literature Herzberg’s Theory
Coded sixteen times as a
source of satisfaction
Coded four times as a
source of dissatisfaction
Lecturers’ communication with
students inside and outside classes
increase learning outcomes and it
affects students’ satisfaction.
Factors can either cause
satisfaction or
dissatisfaction.
Insight: communication is mostly perceived as a source of satisfaction which extends existing
literature and contradicts Herzberg’s Theory.
Table 6. 27: Communication and students satisfaction
Friendly and Fair
In their researches Voss and Gruber (2006) and Chireshe (2011) linked friendly and fair staff
to effectiveness. Their findings indicate that being friendly and fair are amongst the
characteristics that are perceived by students to define effective lecturers. Overall, these
findings were supported throughout the study research. The current study findings point out
that friendly lecturers encourage students to ask questions which affects their learning process
and satisfaction. In addition, students mention that fairness is not merely in relation to their
grades but also in the manner of their treatment, which links again to the communication (table
6.28).

226
The current research Literature Herzberg’s Theory
Coded seventeen times as a
source of satisfaction
Coded three times as a
source of dissatisfaction
Friendly and fair lecturers
contribute to students’
satisfaction.
Factors can either cause
satisfaction or dissatisfaction.
Insight: being a friendly and fair lecturer is mostly perceived as a source of students’
satisfaction. This aligns with existing literature and contradicts Herzberg’s Theory.
Table 6. 28: Friendly and fair academics and its effect on students satisfaction
Overall satisfaction
Overall, through analysis of the interviews (section 5.1.1 and 5.1.2) most students were
satisfied with their lecturers because of their knowledge, experience, and teaching skills.
Despite that, all of those lecturers were busy in both student’s opinions and lecturers’
statements that their workload is high; that said, most were accessible to their students. Their
communication skills and grades provided students with the feeling that they were fair and that
they did not differentiate between students. Those lecturers also took into consideration the
student backgrounds and managed to help them by understanding their needs whether home or
international students. This agrees with Long et al. (2013) who stated in their research that a
good lecturer has three dimensions:
1. Competence - referring to the degree the lecturer is perceived as a source of knowledge
by students.
2. Care - referring to the extent that the lecturer expresses concern and attention about
students.
3. Character – referring to the extent that a lecturer is considered honest and trustworthy
by students.
Furthermore, students expressed that when they were satisfied with a lecturer it encouraged
them to attend further classes with this particular lecturer and recommend them to other
students. This agrees with Devinder and Datta (2003) research.
Relation between satisfaction and feedback
Students at SBS demonstrated that they were generally satisfied. The following step was to
investigate how their satisfaction affected the feedback they gave.
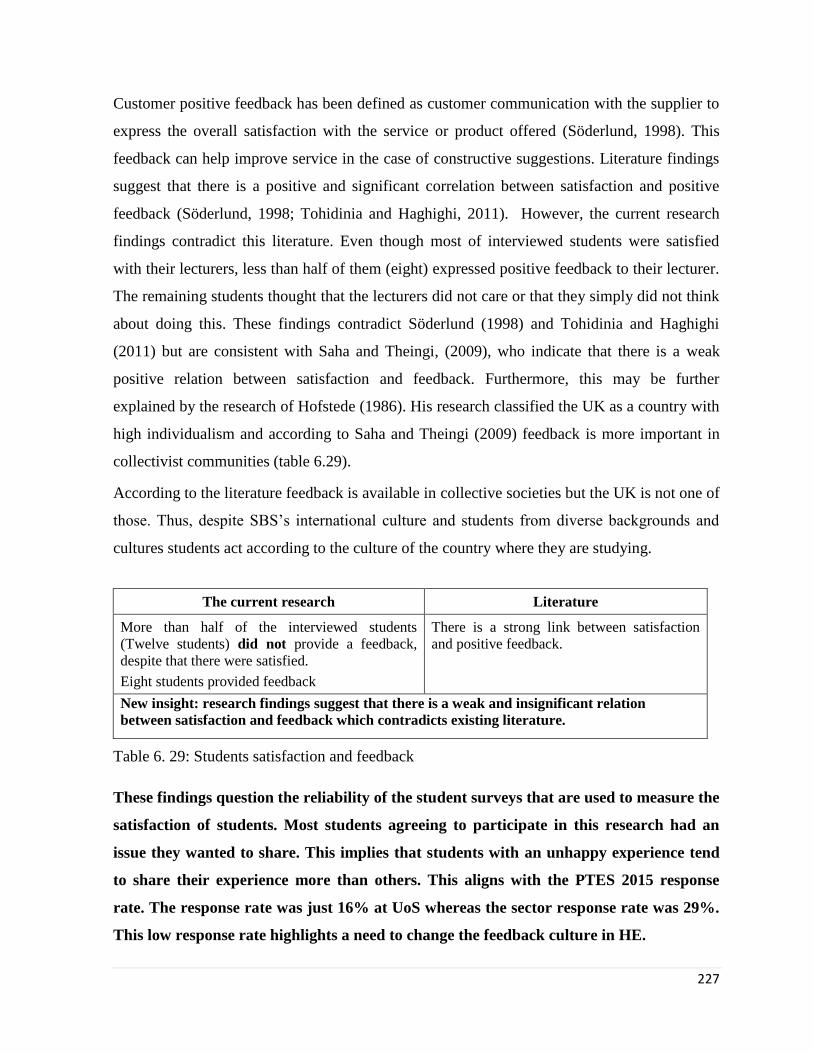
227
Customer positive feedback has been defined as customer communication with the supplier to
express the overall satisfaction with the service or product offered (Söderlund, 1998). This
feedback can help improve service in the case of constructive suggestions. Literature findings
suggest that there is a positive and significant correlation between satisfaction and positive
feedback (Söderlund, 1998; Tohidinia and Haghighi, 2011). However, the current research
findings contradict this literature. Even though most of interviewed students were satisfied
with their lecturers, less than half of them (eight) expressed positive feedback to their lecturer.
The remaining students thought that the lecturers did not care or that they simply did not think
about doing this. These findings contradict Söderlund (1998) and Tohidinia and Haghighi
(2011) but are consistent with Saha and Theingi, (2009), who indicate that there is a weak
positive relation between satisfaction and feedback. Furthermore, this may be further
explained by the research of Hofstede (1986). His research classified the UK as a country with
high individualism and according to Saha and Theingi (2009) feedback is more important in
collectivist communities (table 6.29).
According to the literature feedback is available in collective societies but the UK is not one of
those. Thus, despite SBS’s international culture and students from diverse backgrounds and
cultures students act according to the culture of the country where they are studying.
The current research Literature
More than half of the interviewed students
(Twelve students) did not provide a feedback,
despite that there were satisfied.
Eight students provided feedback
There is a strong link between satisfaction
and positive feedback.
New insight: research findings suggest that there is a weak and insignificant relation
between satisfaction and feedback which contradicts existing literature.
Table 6. 29: Students satisfaction and feedback
These findings question the reliability of the student surveys that are used to measure the
satisfaction of students. Most students agreeing to participate in this research had an
issue they wanted to share. This implies that students with an unhappy experience tend
to share their experience more than others. This aligns with the PTES 2015 response
rate. The response rate was just 16% at UoS whereas the sector response rate was 29%.
This low response rate highlights a need to change the feedback culture in HE.

228
Overall, findings from this section indicate that the first link between student satisfaction
and positive feedback (perceived appreciation) is not activated even though students
were satisfied. It also contradicts findings of Frey et al., (2013) that showed how satisfied
clients express feeling of satisfaction with service they receive through positive feedback
and provide more rapid feedback than that the employees may receive from supervisors
(figure 6.12).
At professional services, Frey et al., (2013):
Satisfaction
At SBS:
Satisfaction
Figure 6.12: Relation between satisfaction and feedback
Perceived appreciation and academic staff satisfaction (Link 2)
The feedback employees receive can be from supervisors as well as co-workers or customers.
The current research is concerned with feedback from students. As mentioned in the last
chapter (section 5.1.2) there were different ways in which academic staff assessed student
satisfaction such as MEQs, reflection, direct conversations, and reception of emails or cards.
Research results revealed that most academic staff members are highly affected by positive
feedback, as it increases their satisfaction. Moreover, one of them stressed the importance of
this positive feedback by saying:
“I think it’s the reason we all come into teaching” (St1, 5/11/2014).
Despite that one member of staff stated that although he appreciates positive feedback it does
not do anything for his career:
“What good does it do me and my career, absolutely nothing!” (St6, 5/11/2015).
This is consistent with Herzberg's Motivation-Hygiene Theory and supported by Kacel et al.
(2005) who state that there is a relation between motivators and job satisfaction. According to
Positive
feedback
No feedback

229
Theory the two main motivators are achievement and recognition - this has been defined as
receiving “direct feedback” (Herzberg, 1987) (as it was explained in section 2.2.4). In her
research Winfrey (2009) stressed that perceived appreciation from students affects tutors in a
positive way.
Despite this positive relation in the current research, academic staff had different reactions
towards negative feedback. The majority indicated that it affects them negatively:
“You always take it personally” (St1, 5/11/2014).
While two lecturers indicated that negative feedback does not affect them. Overall, staff
agreed that the source of negative feedback determines its value. Receiving feedback from
good students whether positive or constructive is what academic staff care about.
To summarise, results reveal that positive feedback affects academic staff satisfaction while in
the case of negative feedback it depends more on the student and it may not be considered by
staff (table 6.30).
The current research Herzberg’s Theory
Positive feedback contributes to academic staff
satisfaction.
Negative feedback contributes to academic staff
dissatisfaction depending on the feedback
source.
Perceived appreciation (positive feedback)
is one of the motivators that contributes to
employees’ satisfaction.
The theory did not mention the effect of
negative feedback.
New insight: positive feedback is mostly perceived as a source of satisfaction which extends
existing literature and contradicts Herzberg’s Theory.
Table 6. 30: Feedback and academic staff satisfaction
Part two summary:
Through the second part of this chapter I explored whether there is an indirect relation
between student and academic staff satisfaction through perceived appreciation (feedback). It
appears that this relation is not activated, as not all students wanted to share their
feedback with their lecturers whether satisfied or not. Moreover, some of them thought
that lecturers did not care. These thoughts were related to lecturer behaviour through their
lectures. That said, although positive feedback affects lecturer satisfaction, negative feedback

230
is linked to student academic achievement and personality. So in order to consider this
negative feedback it should originate from a good student. Overall, it can be argued that
students underestimate the importance of giving feedback to their academics which in
turn reduces the likelihood of the staff to be motivated to teach (Figure 6.13).
At professional services, Frey et al., (2013):
At SBS:
Figure 6.13: Comparison between Frey et al., (2013) research conclusions and this research.
6.2 How does the marketisation affect PG student perceptions of HE?
As presented in the analysis chapter (section 5.2) students were asked to determine sources of
information that affected their experience and consequently their satisfaction. In the literature
it has been stipulated that consumer perceptions may be influenced by the prior experiences.
This may be either with the same provider or a similar one. Similarly, direct, indirect explicit
or implicit information received from institutions before enrolment has a role in student
perception (Devlin et al., 2002; O’Neill, 2003; Sultan & Wong, 2013; Zeithaml et al., 1993).
This aligns with students interviews, as they had built their expectations on past experiences
(either at SBS or any other educational institution), through information sent by SBS through
its website, school rankings and finally open days organised by the school (section 5.2).
Despite various sources of information being evident it seems that student past experiences
were the main source that provided them with a concept about what to expect and determined
their expected standards of future service which they used to make their evaluations.
One finding of the current research indicated that for those students who had previous
experience of SBS and were satisfied, this was the main motive encouraging them to choose
SBS when decided to study for a PG degree qualification. This agrees with the literature that a
Positive feedback Satisfied
Customers'
Employees'
satisfaction
Feedback Satisfied
Students'
Academic
staff
satisfaction

231
positive perception is the main aim for any organisation. It will help to retain and attract new
customers and as the literature indicated there is a strong relation existing between positive
perceptions of service quality and customer retention and loyalty. This is also related to
studying further at the same institution (Caruana, 2002; Petruzzellis et al., 2006; Sultan &
Wong, 2013; Venetis & Ghauri, 2004). It is worth to highlight that eight of the students
interviewed had taken their undergraduate degree at SBS. This implies that SBS had
succeeded in building positive perceptions during previous degree programmes.
Through the discussion into the price and its effect on the student satisfaction all interviewed
students agreed that the price they had paid (whether they were home or international students)
was used as an indicator of the quality of service they had anticipated (section 5.2). Despite
this, it was mentioned that international students pay too much in comparison to home
students. Overall, most students were satisfied with the service that they received. This might
be explained by the research by Angell et al. (2008) which found that PG students are different
from UG students, as they consider overall expenditure secondary to the knowledge and
quality of service they receive.
Even though interviewed MBA students were satisfied one mentioned that she expected a
service worth paying for. When she and her colleagues had a problem in a module they
complained to the director and behaved like customers because they pay more than the MSc
students:
“We are paying customers and we want the best for the money we pay for it... I'm
paying a lot of money for it and I will make sure that I get the maximum that I paid
for”. (St1S3, MBA student, 12/5/2014).
This agrees with the research by Voss et al. (2007) who discussed that the introduction of
tuition fees will probably create a consumerist approach. Moreover, they stressed that
universities should offer value for the money that they receive from students. The MBA
student interview also agreed with Gruber et al. (2010) in regards to introducing the:
“… price variable in the Zeithaml et al. (2008) model of customer perceptions of
quality and customer satisfaction, may have an impact on student satisfaction as well”
(p. 119).

232
In addition to previous experience and fees literature linked grades to students perception of
being customers. Different research has investigated whether there is a direct relation between
grades and student satisfaction. In 2001 Elliott & Healy suggested that a relation exists
between grades, student retention and satisfaction. Unlike Gruber et al. (2010) who indicated
that student class ranking could also impact satisfaction, Dong & Lucey (2013); Lazibat et al.
(2014) and Umbach & Porter (2002) concluded that there is a relation between student
performance (reflected by their marks) and satisfaction. The findings of this research
challenge previous researches. In this current research the majority of the students
interviewed at SBS stated that grades had none or only a slight impact on their
evaluation (figure 6.14). Even when low grades were achieved they were satisfied with the
tutor because either:
It was a group task.
They felt that they were still learning and receiving low grades was part of the learning
process.
This was true throughout except for two cases. One occurred when there was a problem with
marking and the student did not feel that he received the necessary support. The other incident
highlighted that a student failed a course because of improper communication (in her opinion).
This agrees with the findings of Bean and Bradley that there is no evidential correlation
between grades and student satisfaction (Bean & Bradley (1986) cited in Umbach & Porter,
2002). These findings contradict Herzberg's Motivation-Hygiene Theory which
considered recognition for achievement (grades in this case) as a source of satisfaction;
most of the students in this research agreed that it had no effect on their satisfaction.

233
Figure 6.14: Students’ feedback regarding grades.
Finally, it seems that the tuition fees along with the service provided increased student
feelings of being customers of the HE system (seventeen students out of the twenty
interviewed). The fees students pay along with the school marketing communications and
previous experience, make students capable to assess the service provided and this adds
to their feeling as customers. That said, PG students had a mature approach to learning
and did not expect to receive a high grade as results of paying fees. This contradicts
researchers such as: Finney & Finney (2010), Clayson & Haley (2005) and Parsell (2000).
Moreover, the findings of this current research argue there is a weak link between
grades and satisfaction (Figure 6.15).

234
Figure 6.15: The effect of tuition fees and service provided by the school on students
perception of themselves as customers.
6.3 Chapter summary
In this chapter findings from interviews (Chapter 5) were discussed and compared to the
literature considered in chapter 2. The discussion shows that students and staff are satisfied
with the service quality provided by SBS management. When applying Balance Theory
this supports a positive relation between student and academic staff satisfaction at SBS.
This means that there may be a relation between these based on the Balance Theory.
Comparatively, interviewees revealed that being a satisfied student does not mean that you
provide positive feedback to your lecturer. Nonetheless, lecturers indicated that positive
feedback affected their satisfaction and some indicated that they were affected by negative
feedback too. This means that by applying Herzberg's Motivation-Hygiene Theory the relation
between student and academic staff satisfaction exists but it is not activated since
students do not actually feedback.
Furthermore, this chapter discussed the effects of HE commercialisation on PG student
perception. The findings suggest that PG students consider themselves HE customers.
The next chapter will summarise the thesis, contributions of the research as well as the
limitations and future research possibilities.

235
Chapter Seven: Conclusion
This is the final chapter of the current research. Firstly this chapter will revisit the research
rationale and look again at how the research was conducted. It then reviews the contributions
to knowledge, methodology and practice. Then Klein & Myers' (1999) guidance for
interpretive research evaluation will be used to outline and research limitations. The final part
of the chapter focuses on potential future directions for future studies in this area building on
the knowledge acquired in the current study.
7.1 Research summary
The aim of this research was exploration of the relation between PG student and academic
staff satisfaction within the context of commercialised HE.
As discussed in the introduction and literature review there is a lack of literature that covers
the relation between student satisfaction and academic staff satisfaction. With increased
commercialisation of the HE sector the relationship between student satisfaction and academic
satisfaction is very important (Nassar & Heinze, 2016; Tomlinson, 2016). The current study
builds on previous established research such as those of Bhaskar & Khera (2013) and Jeon &
Choi (2012) who investigated the relation between employee satisfaction and customer
satisfaction in commercial environments. However, the current study adopts an opposite
perspective for studying this relationship following Frey et al., (2013) who researched the
relation between customer satisfaction and its impact on employee satisfaction in professional
services companies.
The tension of the drive to commercialise in the HE field is part of another related debate of
whether we should consider students as customers (DeShields Jr et al., 2005; Yeo, 2008) or
not (Finney & Finney, 2010; Svensson & Wood, 2007) (as argued in chapter 2). This debate is
answered in the current study with an original angle targeting taught PG students on block
delivery modes of teaching and learning at SBS (as discussed in chapter 3).
Consequently, in order to generalise findings of this work to theory, two theories were
combined: Balance Theory and Herzberg's Motivation-Hygiene Theory. This was justified in
chapter 2.

236
The research aim was explored using an interpretive paradigm that accommodates the
exploratory nature of the current study. Due to the social nature of the current research, a
qualitative interpretive approach has been implemented through in-depth semi-structured
interviews. Using Critical Incident Technique interviews were conducted with twenty PG
students and eight academic staff mentioned by students in their critical incidents.
In order to evaluate the research outcome each research question has been addressed using the
structure of interpretive research contributions suggested by Walsham (2006):
“Construct our piece to aim at a particular type of audience or audiences. In addition,
we can ask to what literature we are aiming to contribute. Thirdly, what does the piece
of written work claim to offer that is new to the audience and the literature? Finally,
how should others use the work?” (Walsham, 2006: p. 326).
The first question addressed in this study is:
Q1: How can PG student satisfaction be linked to academic staff satisfaction and explored
in relation to Herzberg’s Motivation-Hygiene Theory and the Balance Theory?
Based on the adopted conceptual framework, two theories were used to explore the relation.
What is the audience? - The audience for this question are researchers who are asking for
more work in subject areas such as management commitment to quality (Sureeyatanapas,
Yang, & Bamford, 2015; Cheung & To, 2010; Babakus, Yavas, Karatepe, & Avci, 2003),
service marketing (Svensson & Wood, 2007) service quality in the HE sector (Jackson &
Helms, 2011; Munteanu et al., 2010) and particular those who are interested in intensive
block teaching models (Karaksha et al., 2013; McCarthy, 2010).
What literature? - The findings of this research will contribute to HE management
research literature that addresses the service quality factors that affect PG student
satisfaction. As argued by Jancey & Burns (2013) few scholars evaluated the satisfaction
of PG students. It will also contribute to literature concerned with academic staff
satisfaction (Mustapha & Ghee, 2013; Sabharwal & Corley, 2009). Finally, this research
responds to the recommendations of Frey et al. (2013). Their recommendations
emphasises a need to investigate the relationship between customer satisfaction and
employee satisfaction in service contexts.

237
What is new? - The Balance Theory was used as a proxy to explain the effect of
management commitment to quality on relations between PG student satisfaction and
academic staff satisfaction. The findings revealed that in terms of service quality PG
students have similar needs as UG students. This contradicts Jancey & Burns (2013)
who concluded that PG students have different needs to UG students. In the current
research, students mentioned service quality factors they consider important and essential
to them. These included academic reputation, staff teaching abilities, approachability of
teaching staff, learning resources and physical learning environment such as campus,
building and classrooms. The same factors were identified in research conducted with UG
students (Yusoff et al., 2015; Coskun, 2014; Sumaedi & Bakti, 2012; Briggs, 2006;
Oldfield & Baron, 2000).
Having done this work, the contribution to the theoretical understanding of student satisfaction
is definable as;
The overall pleasure and enjoyment perception achieved by a student
The feeling that results when student expectations of teaching, facilities and learning
support are met or exceeded by the experience of reality.
The sum of student expectations based on their previous experience, word of mouth
and educational institution promises (through their websites, open days and marketing
communications). These expectations are related to the educational aspects as well as
campus life.
Furthermore, through the literature review it was demonstrated that previous research
investigated management commitment to quality in different sectors:
Manufacturing sector (Sureeyatanapas et al., 2015).
Service sectors such as public sector of governmental department, health care, banking
and hotels (Cheung & To, 2010; Rod & Ashill, 2010; Kim et al., 2009; Ashill et al.,
2008; Babakus et al., 2003).
The literature highlighted organisational support, training, empowerment and rewards as
factors that demonstrate the management commitment to service quality. The current findings
support all but rewards factors; amongst academics the rewards are research activity

238
focused and not for high quality teaching. The contribution to knowledge is that the HE
sector has moved into a commercial age but its teaching and quality systems have not
kept pace with this commercialisation.
It was found that PG students and academic staff at SBS were overall satisfied with the
management commitment to quality at SBS. This is despite their partial dissatisfaction with
the quality of some services offered to them by SBS. Thus, management commitment to
quality affects both student and academic staff satisfaction positively. By applying the Balance
Theory, there is a demonstrable relation between student satisfaction and academic staff
satisfaction. This means that when applying Balance Theory if students are satisfied
academic staff are also satisfied.
That said, the second part of the conceptual framework used Herzberg's Motivation-Hygiene
Theory to explore this relation. It was noted that PG students were not keen on expressing
feedback. Though the majority were satisfied with the lecturers less than half of the students
expressed this satisfaction to lecturers. These findings contradict the literature that
suggests there is a positive and significant relationship between satisfaction and positive
feedback (Tohidinia & Haghighi, 2011; Söderlund, 1998). This also challenges the
reliability of student surveys being conducted to measure satisfaction of students. The
current study found that unhappy experiences are shared more rapidly and this
highlights the need to change feedback cultures in HE.
Moreover, most of the academic staff members stated that they were affected by positive
feedback. At the same time they all stated that negative feedback might only affect them
depending on the type of student giving the feedback. The academics said that if the students
were “good students” their views would have more impact compared to those students who
were less engaged with their learning.
This finding means that depending on the type of student, feedback might act as a source
of dissatisfaction therefore making it a “hygiene factor”. This contradicts Herzberg's
Motivation-Hygiene Theory, which declares that factors affecting satisfaction
(Motivators) cannot be the same as those affecting dissatisfaction (Hygiene Factors).

239
The role of feedback contributes to Herzberg's Motivation-Hygiene Theory
understanding within HR settings. His original theory did not consider the effect of
negative feedback. That said Herzberg Motivation-Hygiene theory should be amended to
consider negative feedback when used in the HE context. This aligns with the findings of
Johnston (1995) which were applied to the banking sector.
However, although this research was not designed to test the Herzberg's Motivation-Hygiene
Theory, some points of his Theory were supported through the current study, such as the
effect of workload and IT services. In this current research these are examples of working
condition factors that impact on satisfaction. Comparatively, other points contradicted his
Theory through the consideration of factors such as:
Facilities
Communication process between students and academic staff
Effect of grades on student
Administrative staff
Some suggested that these factors were sources of both satisfaction and dissatisfaction. These
finding support other critics of Herzberg's Motivation-Hygiene Theory who argue that
the same factors can be both motivators and hygiene factors (Byrne et al., 2012;
Oshagbemi, 1997; Ssesanga & Garrett, 2005).
Overall, by using Herzberg's Motivation-Hygiene Theory we can see that there is a relation
between PG student satisfaction and academic staff satisfaction. This means that when
applying Herzberg's Motivation-Hygiene Theory, having satisfied students means that
the academic staff are also satisfied. However, there is a disconnect. This is due to the
fact that students do not actively share their positive feedback with their lecturer.
Instead they only prefer to focus on negative aspects. The current study highlights that
students underestimate the importance of giving feedback to academics. This in turn
may reduce staff motivation to teach.
The methodological conclusion is that both the Balance Theory and the Herzberg's
Motivation-Hygiene Theory findings in support one another in the current research.

240
How should this new knowledge be used? - The current research findings conclude that
Herzberg's Motivation-Hygiene Theory can be augmented to acknowledge that motivators
can also be hygiene factors. Moreover, it should now consider the negative feedback
impacts as well. Findings also recommend combination of the two theories in future
researches concerned with students and academic staff satisfaction.
The data analysis and findings of the current research highlight that the rewarding structure
in HE systems are out of synch with the increasing commercialised view of HE.
Rewarding structures in HE need further exploration.
Q2: How does the marketisation affect PG student perceptions of HE?
What is the audience? - The primary audience for this question is researchers who are
interested in students as HE customers (D. B. Saunders, 2014; Watjatrakul, 2010). Also,
researchers interested in studying the effect of tuition fees on student perceptions
(Tomlinson, 2016; Wilkins & Stephens Balakrishnan, 2013; Voss, Gruber, & Szmigin,
2007). Moreover, marketing researchers are considered amongst the audience for this
question, in that they need to identify the factors that satisfy PG students.
What literature? - As a contribution to literature this exploratory case study is of the HE
service sector. According to Saunders (2014) and Vuori (2013) there is a lack of recent
empirical studies in this area. Given the likely increase in tuition fees in coming years
where national governments are searching for resources to fund HE this is becoming a
drastically important area of study.
What is new? - Even though some of the literature contradicts considering students as
customers (Finney & Finney, 2010; Clayson & Haley, 2005; Parsell, 2000), the key
finding is that PG students do consider themselves as customers. The fees students pay
along with the school marketing communications and previous experience mean students
are able to assess the service provided and this contributes to their feeling of being
customers. This means that they expect high quality service in return for the fees they
pay. Despite this, the majority of interviewed PG students had a mature approach to
learning and did not expect to receive a high grade as results of paying fees. In return for
their fees most importantly in terms of value, they expected to gain knowledge and
experience. The findings of this research contradict Dong & Lucey (2013) who said that

241
grades are a proxy for student satisfaction. The current study identified that there is
a weak link between grades and their satisfaction. This means that PG taught
students care about the knowledge they receive more than their grades. These
findings supports Rothwell's (2016) article that argued that universities are not just
about degrees and grades, but they should “broaden your horizons and deepen your
awareness, give you opportunities to grasp new experiences” (Rothwell, 2016).
Consequently, universities should start to change their image from being a gate to a
better career into being a route to: i). gain better understanding of the community;
ii). have an opportunity to benefit from this community and; iii). gain better
experience.
How should this new knowledge be used? - Finding should be considered by both HE
researchers and institutions. University systems and processes do not encourage staff to
recognise that students are customers. This means that while students as ‘customers’ care
about teaching, universities systems care primarily about research. The rewarding and
recognition systems of HE are based on research not teaching.
In order to engage with satisfied customers Bowden (2011) suggests that relationship
marketing could be appropriate for HE institutions. Effective usage of relationship marketing
leads to progress in the recruiter and prospective student relationship. Moreover, these
findings should be considered during the planning and execution of marketing plans.
7.2 Methodological contribution
What is the audience? - The audience for this theoretical contribution are researchers
who are interested in studying quality and satisfaction in HE (Bhaskar & Khera, 2013;
Frey et al., 2013; Jeon & Choi, 2012).
What literature? - The current research contributes to the literature that uses dyadic
sampling. As stated by scholars (Arnett et al., 2005; Frey et al., 2013; Lambe et al., 2002)
few studies employ this method due to the difficulties associated with gathering dyadic
data (Arnett et al., 2005; Lambe et al., 2002). Additionally this data is gathered by a third

242
party not a student or member of staff which introduced an additional level of objectivity
and cross-modular comparison.
What is new? – Adoption of a qualitative approach using in-depth semi-structured
interviews and CIT helped to identify important service quality factors provided by
students and academic staff of SBS. The methodological contribution lies in the use of a
dyadic sampling study design combined with CIT – only when a student mentioned a
critical incident was a particular lecturer contacted and interviewed. As highlighted in
literature there are only a few studies that use the dyadic sampling (Arnett et al., 2005;
Frey et al., 2013; Lambe et al., 2002). None that I am aware of have combined CIT and
dyadic sampling. The original contribution shows that data collected from members of
the dyadic relationship, PG students and academic staff who teach them, offers a
good understanding of services provided by SBS. Applying this technique was not an
easy process taking over a year (from between 20th October 2014 until 30th November
2015). That said it helped enrich the insights into the relations between PG students and
their corresponding academic staff at SBS.
How should this new knowledge be used? - These findings should be considered by
other researchers who are interested in the relation between students and staff in the HE
sector. Moreover, as a part of future studies it is recommended to use this technique to
explore the relation between academic staff and management. This approach is a good
example of how data driven analysis and investigation helps develop understanding of
relations. In this research it was particularly valuable for investigating the block teaching
delivery mode. This is because there were multiple lecturers involved in the delivery of a
module. Due to difficulties identifying relevant samples of staff and students dyadic
sampling with CIT introduces a level of complexity and takes the research directions and
along many dead ends. Sometimes when students identified a member of staff they were
often not available or did not want to take part in an interview.

243
7.3 Practical contributions
The practical contribution of this research can be presented in five main points:
1. Using the qualitative data collection tools (interviews & CIT) along with dyadic data gave
insight and more details about factors that PG students and academic staff consider
important from their perspective and that should be prioritised by management. Using
questionnaires does not give students the opportunity to express their feedback and reflect
on the module. Furthermore, staff do not get a detailed constructive feedback that
highlights the strong points or parts that need to modified. It also gives SBS an idea of the
competencies that academic staff should have.
2. Based on the current research findings PG student satisfaction affects academic staff
satisfaction. This means that investing in student satisfaction may have value increasing
and enhancing both student and academic staff satisfaction.
3. PG students consider themselves HE customers because of the tuition fees they pay and
service quality they were promised. Findings suggest that it would be beneficial if the
school management can highlight the effect of student feedback on their policies and
present this to students. SBS should also emphasise the feedback channels that students
can use.
4. Moreover, findings suggest that one of the HE system drawbacks is its focus on research.
These findings were supported by Rothwell's (2016) article. She discussed how a
university’s reputation is derived from research quality. This acts as the main focus of
universities meaning that teaching is often neglected. So it would be positive if
management could focus more on teaching. Currently, with the VC teaching award staff
must apply. Applying for this award may be problematic in two ways. Some of the staff
indicated that time constraints mean they cannot go through with the application process.
Others asked why should they apply when the school has all the student feedback from the
MEQ? This implies that the Key Performance Indicators (KPIs) used in the current system
are aligned to research not for teaching which is fundamentally one of the university
missions. The school management need to highlight the role of the academic staff in terms
of their teaching.
5. SBS should consider the drawbacks of the Block delivery mode. These include low levels
of student community engagement, low levels of staff-student interaction and long

244
learning hours for intensive parts of the course. On the other hand, the school should
highlight the benefits of block teaching as suggested by students. These include flexible
start dates and the opportunity to combine study and work. This means students do not
have to attend daily classes and can focus on one subject at a time.
7.4 Research evaluation
As discussed in chapter four (section 4.8), research integrity will be maintained by adhering to
seven principles set out by Klein & Myers' (1999) that are used to evaluate interpretive
research.
Table 7.1 summarises the principles and how they were reflected through this research.
Klein and Myers’ principle How is reflected in the current research
Hermeneutic circle:
The understanding and knowledge
of the parts and their relationship to
the whole and how will this lead to
an understanding of the complex
whole.
Data analysis was an iterative work process, where
reading and rereading of gathered material was
undertaken several times in order to make the right
link and get a better understanding of the whole
problem. This also helped in defining the information
needed and how it would be obtained. Moreover,
comparisons between the meaning of single
statements, surrounding statements and the data as a
whole have been made. Categories were also created
in order to describe interviewee ideas as precisely as
possible.
Principle of contextualisation:
Research results must be reported
within the social and historical
context that they were acquired, as
the relationships between people,
organisations and technology are
not fixed but constantly changing.
In order to meet this principle literature has been
reviewed in Chapter Two. A description of the SBS
context has also been used to connect the reader with
the research context and explain interviewee
responses.

245
Principle of interaction between
the researcher and the subject:
This principle recognises the effects
of the interaction between the
researcher and the participants
(through their understanding and
perception).
It would be ideal if the researcher could remove all
potential factors that affect data through interaction
with participants. However, in the current study the
researcher avoided presenting preconceptions to the
respondents. Interviewee participation was completely
voluntary and they were willing to participate, which
indicates that they were happy to talk about their own
understanding in of events.
In order to avoid bias throughout the data collection
and analysis, a detailed description of the data
collection process, as well as the analysis was
documented to minimise this.
The research aim was used as the base for interpreting
interviewees’ answers.
Principle of abstraction and
generalisation:
Data collected needs to be related
to general concepts and one and
two general principles describing
the human nature.
In trying to fulfil this principle, detailed descriptions
and illustrations of interviewee statements were
categorised. The principle of generalisation is met
through discussion of the research results in relation
to the ideas and concepts originating in previous
research papers. By doing this the research results will
apply to multiple situations.
Dialogical reasoning principle:
This principle requires the
researcher to acknowledge and
declare the preconceptions,
prejudices and assumptions that
guided the original research
process.
The researcher’s background, previous experience
and assumptions were all documented in the fourth
chapter (section 4.11). Subsequently, the researcher
explained the philosophical approach, literature and
provided a detailed explanation for each step through
data analysis and coding process to make it
transparent for the reader.

246
Multiple interpretation principle:
Requires sensitivity to possible
differences in interpretations
amongst participants as are
typically expressed in multiple
narratives or stories of the same
sequence of events under study.
Similar to multiple witness
accounts even if all tell it as they
saw it.
Interview transcripts were analysed iteratively
following the interviews. After forming categories,
data was re-visited so as to be re-analysed. The next
step was to compare the categories formed with the
results, and this was done to increase sensitivity to
possible differences in interpretations.
Multiple interpretations were given in the Analysis
Chapter. During interviews follow up questions were
issued when situations arose where multiple
interpretations were possible for answers. For
example, when students stated that they did not give
feedback, they were asked about the reasons where
some indicated because of the lecturers or because of
their background.
Principle of suspicion:
Requires sensitivity to possible
“biases” and systematic
“distortions” in the narratives
collected from the participants.
The main aim was to avoid possible biases. This has
been done by collecting data from different
individuals and analysing it in different stages. The
researcher background was also introduced (section
1.6). Discussions with senior researchers as well as
describing data collection and analysis processes in
details help the reader to follow the narrative flow of
the research.
Table 7. 1: Research evaluation summary
7.5 Research limitations
As with any research, this research has limitations:
1. This research was limited to a single case, SBS, so generalisation of the findings is
limited to SBS.

247
2. It is English HE specific to universities where students pay tuition fees. In other
countries tuition fees may not apply and research results may be different.
3. Research findings are limited to one university of the University Alliance group.
Findings may change upon using data from research intensive universities that focus
on research more than customer satisfaction.
4. There is a lack of studies previously conducted in this area.
5. Large amounts of data were collected during the interviews. In order to avoid missing
important information, data was transcribed following interviews along with notes and
memos to minimise the risk of missing important information.
6. During interviews the researcher did not know if respondents were divulging true
information or if they were concealing certain aspects. This limitation was minimised
by asking for incidents and asking for the same information in different terms.
Furthermore, the researcher stressed research anonymity in order to give participants
the confidence that their data would not be revealed.
7. Some students either refused to participate in the research, refused to allow recording
or gave very short answers. These limitations were overcome by discounting these
problematic interviews, and by sourcing new more valuable ones.
8. This research is limited to PG taught student cohorts. Future research should consider
PG research students.
9. The research findings are limited by the use of the Balance Theory and Herzberg's
Motivation-Hygiene Theory.
7.6 Future Research
As this research has focused on a single case at SBS, further research could be done in other
schools of UoS and UK business schools in order to generalise findings of this study. The
choice of sample in this research considered only taught PG students. That said it would be
beneficial to investigate if the findings of this research apply also to PG research students who
deal with multiple supervisors for at least three years. Rothwell (2016) has indicated that
universities are much more than a “passport to a better career”. With this in mind future
researches should consider student motive to go to university.

248
References
Abdullah, F. (2006). Measuring service quality in higher education: HEdPERF versus
SERVPERF. Marketing Intelligence & Planning, 24(1), 31–47.
Adetoro, N. (2014). Information Technology Availability, Use and Job Satisfaction of
Academic Staff at Tai Solarin University of Education, Nigeria: A Correlative Study.
Journal of Balkan Libraries Union, 2(1), 5–10.
Ahmed, I., Nawaz, M. M., Iqbal, N., Ali, I., Shaukat, Z., & Usman, A. (2010). Effects of
motivational factors on employees job satisfaction a case study of University of the Punjab,
Pakistan. International Journal of Business and Management, 5(3), 70–80.
Ahsan, N., Abdullah, Z., Fie, D. G., & Alam, S. S. (2009). A study of job stress on job
satisfaction among university staff in Malaysia: Empirical study. European Journal of
Social Sciences, 8(1), 121–131.
Alam Malik, S., Hassan, S., & Zahid Iqbal, M. (2012). Measuring students’ perceptions and
expectations in business schools of Pakistan. Asian Education and Development Studies,
1(3), 222–236.
Alderman, G. (2000). Quality Assurance in Higher Education: An Anglo-American View.
Altbach, P. (2008). The complex roles of universities in the period of globalization. In Higher
Education in the World. Vol. 3: New Challenges and Emerging Roles for Human and
Social Development. London, Palgrave Mcmillan.
Alves, H., & Raposo, M. (2010). The influence of university image on student behaviour.
International Journal of Educational Management, 24(1), 73–85.
Amaratunga, D., Baldry, D., Sarshar, M., & Newton, R. (2002). Quantitative and qualitative
research in the built environment: application of “mixed” research approach. Work Study,
51(1), 17–31.
Andreassen, T. W., & Lindestad, B. (1998). Customer loyalty and complex services: The
impact of corporate image on quality, customer satisfaction and loyalty for customers with
varying degrees of service. International Journal of Service Industry Management , 9(1),
7–23.
Andrews, E. A., Freund, W., Lewis, C. T., & Short, C. (1879). A Latin dictionary: founded on
Andrews’ edition of Freund's Latin dictionary. Oxford: Clarendon Press.
Angell, R. J., Heffernan, T. W., & Megicks, P. (2008). Service quality in postgraduate
education. Quality Assurance in Education, 16(3), 236–254.

249
Appleton-Knapp, S. L., & Krentler, K. A. (2006). Measuring student expectations and their
effects on satisfaction: The importance of managing student expectations. Journal of
Marketing Education, 28(3), 254–264.
Arambewela, R., & Hall, J. (2009). An empirical model of international student satisfaction.
Asia Pacific Journal of Marketing and Logistics, 21(4), 555–569.
Ardi, R., Hidayatno, A., & Yuri M. Zagloel, T. (2012). Investigating relationships among
quality dimensions in higher education. Quality Assurance in Education, 20(4), 408–428.
Arnett, D. B., Macy, B. A., & Wilcox, J. B. (2005). The role of core selling teams in supplier–
buyer relationships. Journal of Personal Selling & Sales Management, 25(1), 27–42.
Arokiasamy, A. R. A., & Abdullah, A. G. (2012). Service quality and students’ satisfaction at
higher learning institutions: a case study of Malaysian University competitiveness.
International Journal of Management and Strategy, 3(5), 1–16.
Ashill, N., Rod, M., & Carruthers, J. (2008). management commitment to service quality on
frontline employees’ job attitudes, turnover intentions and service recovery performance in
a new public management …. Journal of Strategic Marketing, 16(5), 437–462.
Ashwin, P., Abbas, A., & McLean, M. (2015). Representations of a high-quality system of
undergraduate education in English higher education policy documents. Studies in Higher
Education, 40(4), 610 – 623.
Athanassopoulos, A. D. (2000). Customer satisfaction cues to support market segmentation
and explain switching behavior. Journal of Business Research, 47(3), 191–207.
Awa, H. O., & Nwuche, C. A. (2010). Cognitive consistency in purchase behaviour:
Theoretical & empirical analyses. International Journal of Psychological Studies,
2(1), 44–54.
Awang, Z., Ahmad, J. H., & Zin, N. (2010). Modelling job satisfaction and work commitment
among lecturers: A case of UiTM Kelantan. Journal of Statistical Modeling and Analytics,
1(2), 45–59.
Azadehdel, M. R., Chegini, M. G., & Delshad, M. (2013). Effective Employees Participation
and Organizational Outcomes. Arabian Journal of Business and Management Review
(Nigerian Chapter), 1(9), 1–7.
Aziri, B. (2011). Job Satisfaction: A Literature Review. Management Research and Practice,
3(4), 77–86.
Babakus, E., Yavas, U., Karatepe, O. M., & Avci, T. (2003). The effect of management
commitment to service quality on employees’ affective and performance outcomes. Journal

250
of the Academy of Marketing Science, 31(3), 272 – 286.
Banerjee, C. K., & Mandal, K. (2013). Differences In Opinion Between Industry And
Academia In Relation To Relevant Issues On Academic Service Quality: A Study on
Management Education.
Bazeley, P. (2007). Qualitative data analysis with NVivo. Los Angeles, Calif. ; London :
SAGE .
Bell, J. (1999). Doing Your Research Project: A guide for first-time researchers in education
and social science. (3rd ed.). Buckingham : Open University Press.
Bell, J. (2010). Doing your research project. McGraw-Hill International.
Bellamy, S., Morley, C., & Watty, K. (2003). Why business academics remain in Australian
universities despite deteriorating working conditions and reduced job satisfaction: An
intellectual puzzle. Journal of Higher Education Policy and Management, 25(1), 13–28. 0
Benbasat, I., Goldstein, D. K., & Mead, M. (1987). The case research strategy in studies of
information systems. MIS Quarterly, 11(3), 369–386.
Bhaskar, S. S., & Khera, S. N. (2013). Interdisciplinary Journal Of Contemporary Research In
Business Employee Satisfaction -Customer Satisfaction Link: A Literature Review of
Theoretical Explanations. Interdisciplinary Journal of Contemporary Research In Business,
4(11), 626.
Bigne, E., Moliner, M. A., & Sánchez, J. (2003). Perceived quality and satisfaction in
multiservice organisations: the case of Spanish public services. Journal of Services
Marketing, 17(4), 420–442.
Bimpitsos, C., & Petridou, E. (2012). A transdisciplinary approach to training: preliminary
research findings based on a case analysis. European Journal of Training and
Development, 36(9), 911–929.
Binsardi, A., & Ekwulugo, F. (2003). International marketing of British education: research on
the students’ perception and the UK market penetration. Marketing Intelligence &
Planning, 21(5), 318–327.
Bitner, M. J., Booms, B. H., & Tetreault, M. S. (1990). The service encounter: diagnosing
favorable and unfavorable incidents. The Journal of Marketing, 54(1), 71–84.
Black, I. (2006). The presentation of interpretivist research. Qualitative Market Research: An
International Journal, 9(4), 319–324.
Boehm, K., & Lees-Spalding, J. (2006). Boehm, K. & Lees-Spalding, J. (2006). Student

251
book 2007 : the essential guide for applicants to UK universities and colleges. Quality in
higher education. Richmond, Trotman .
Bohner, G., & Wänke, M. (2002). Attitudes and attitude change. Psychology Press.
Bolton, P. (2014). Tuition fee statistics. Retrieved from http://dera.ioe.ac.uk/22729/1/SN00917
(1).pdf
Bowden, J. L. H. (2011). Engaging the student as a customer: A relationship marketing
approach. Marketing Education Review, 21(3), 211–228.
Bozeman, B., & Gaughan, M. (2011). Job satisfaction among university faculty: Individual,
work, and institutional determinants. The Journal of Higher Education, 82(2), 154–186.
Braine, M. E., & Parnell, J. (2011). Exploring student’s perceptions and experience of
personal tutors. Nurse Education Today, 31(8), 904–910.
Briggs, S. (2006). An exploratory study of the factors influencing undergraduate student
choice: The case of higher education in Scotland. Studies in Higher Education, 31(6), 705–
722.
Bringer, J. D., Johnston, L. H., & Brackenridge, C. (2004). Maximizing transparency in a
doctoral thesis1: The complexities of writing about the use of QSR* NVIVO within a
grounded theory study. Qualitative Research, 4(2), 247–265.
Broecke, S. (2012). University rankings: do they matter in the UK? Education Economics,
2(137-161).
Brown, R. (2000). The New UK Quality Framework. Higher Education Quarterly, 54(4),
323–342.
Brown, R. (2011). The march of the market. In The marketisation of higher education and the
student as consumer (pp. 11–24). Routledge.
Brown, R. (2015). The Marketisation Of Higher Education: Issues And Ironies. New Vistas,
1(1), 4–9.
Bryman, A. (1984). The debate about quantitative and qualitative research: a question of
method or epistemology? British Journal of Sociology, 35(1), 75–92.
Bryman, A. (2008). Social research methods (3rd ed.). Oxford university press.
Bryman, A. (2012). Social research methods (4th ed.). Oxford university press.
Brysland, A., & Curry, A. (2001). Service improvements in public services using
SERVQUAL. Managing Service Quality: An International Journal, 11(6), 389–401.

252
Budding, T., & Cools, M. (2008). Using computer software to analyze qualitative data:
Accounting versus other disciplines.
Bustamam, F. L., Teng, S. S., & Abdullah, F. Z. (2014). Reward Management and Job
Satisfaction among Frontline Employees in Hotel Industry in Malaysia. Procedia - Social
and Behavioral Sciences, 144, 392–402.
Buttle, F. (1996). SERVQUAL: review, critique, research agenda. European Journal of
Marketing, 30(1), 8–32.
Byrne, M., Chughtai, A. A., Flood, B., & Willis, P. (2012). Job satisfaction among accounting
and finance academics: empirical evidence from Irish higher education institutions. Journal
of Higher Education Policy and Management, 34(2), 153–167.
Cardoso, S., Carvalho, T., & Santiago, R. (2011). From Students to Consumers: reflections on
the marketisation of Portuguese higher education. European Journal of Education, 46(2),
271–284.
Carlson, J., & O’Cass, A. (2010). Exploring the relationships between e-service quality,
satisfaction, attitudes and behaviours in content-driven e-service web sites. Journal of
Services Marketing, 24(2), 112–127.
Carman, J. M. (1990). Consumer Perceptions Of Service Quality: An Assessment Of T.
Journal of Retailing, 66(1), 33–55.
Carrillat, F. A., Jaramillo, F., & Mulki, J. P. (2007). The validity of the SERVQUAL and
SERVPERF scales: A meta-analytic view of 17 years of research across five continents.
International Journal of Service Industry Management, 18(5), 472–490.
Carson, D., Gilmore, A., Perry, C., & Gronhaug, K. (2001). Qualitative marketing research.
Sage.
Cartwright, D., & Harary, F. (1956). Structural balance: a generalization of Heider’s theory.
Psychological Review, 63(5), 277–293.
Caruana, A. (2002). Service loyalty: The effects of service quality and the mediating role of
customer satisfaction. European Journal of Marketing, 36(7/8), 811–828.
Chell, E. (2004). The critical incident technique. In Essential guide to qualitative methods in
organizational research. London : SAGE.
Cheng, J. H. S., & Marsh, H. W. (2010). National Student Survey: are differences between
universities and courses reliable and meaningful? Oxford Review of Education, 36(6), 693–
712.
253
Cheong Cheng, Y., & Ming Tam, W. . (1997). Multi-models of quality in education. Quality
Assurance in Education, 5(1), 22–31.
Cheung, M. F., & To, W. M. (2010). Management commitment to service quality and
organizational outcomes. Managing Service Quality: An International Journa, 20(3), 259–
272.
Chireshe, R. (2011). Effective and ineffective lecturers: University students’ perspective in
Zimbabwe. Anthropologist, 13(4), 265–269.
Chong, Y. S., & Ahmed, P. K. (2015). Student motivation and the “feel good”factor: an
empirical examination of motivational predictors of university service quality evaluation.
Studies in Higher Education, 40(1), 158–177.
Clayson, D. E., & Haley, D. A. (2005). Marketing models in education: students as customers,
products, or partners. Marketing Education Review, 15(1), 1–10.
Cobley, P., & Schulz, P. (2013). Theories and models of communication (Vol. 1). Walter De
Gruyter.
Collis, J., & Hussey, R. (2009). Business research: A practical guide for undergraduate and
postgraduate students (3rd ed.). Palgrave Macmillan.
Collis, J., & Hussey, R. (2014). Business research: A practical guide for undergraduate and
postgraduate students (4th ed.). Palgrave Macmillan.
Cornuel, E., & Verhaegen, P. (2005). Academic talent: Quo vadis? Recruitment and retention
of faculty in European business schools. Journal of Management Development, 24(9), 807–
818.
Coskun, L. (2014). Investigating the Essential Factors on Student Satisfaction: A Case of
Albanian Private University. Journal of Educational and Social Research, 4(1), 489.
Creswell, J. (2013). Research design: Qualitative, quantitative, and mixed methods
approaches. Sage publications.
Cronin, J. J. J., & Taylor, S. A. (1992). Measuring service quality: a reexamination and
extension. The Journal of Marketing, 55(3), 55–68.
Cuthbert, R. (2010). Students as customers. Higher Education Review, 42(3), 3–25.
D’Alessio, F., & Avolio, B. (2011). Business schools and resources constraints: A task for
deans or magicians? Research in Higher Education Journal, 13, 1–37.
Daft, R. L., & Marcic, D. (2008). Management: The new workplace (Internatio). Evans
Publishing Group.

254
Darke, P., Shanks, G., & Broadbent, M. (1998). Successfully completing case study research:
combining rigour, relevance and pragmatism. Information Systems Journal, 8(4), 273–289.
Davies, W. M. (2006). Intensive teaching formats: A review. Issues in Educational Research,
16(1), 1–20.
De Lourdes Machado-Taylor, M. (2014). A cross national study of job satisfaction of
academics in Portuguese Higher Education. Revista Universidade Em Debate, 2(1), 38–50.
De Lourdes Machado-Taylor, M., Meira Soares, V., Brites, R., Brites Ferreira, J.,
Farhangmehr, M., Gouveia, O., & Peterson, M. (2014). Academic job satisfaction and
motivation: findings from a nationwide study in Portuguese higher education. Studies in
Higher Education, 41(3), 541–559.
Denscombe, M. (2014). The good research guide: for small-scale social research projects
(5th ed.). Maidenhead, Berkshire, England : Open University Press .
Denzin, N., & Lincoln, Y. (2000). The discipline and practice of qualitative research. In
Handbook of qualitative research. (2nd ed., pp. 1–28). Thousand Oaks, CA: Sage.
Department for Business, I. and S. (2013). Exploring Student Demand for Postgraduate Study.
DeShields Jr, O. W., Kara, A., & Kaynak, E. (2005). Determinants of business student
satisfaction and retention in higher education: applying Herzberg’s two-factor theory.
International Journal of Educational Management, 19(2), 128 – 139.
Devinder, K., & Datta, B. (2003). A study of the effect of perceived lecture quality on post-
lecture intentions. Work Study, 52(2), 234–243.
Devlin, J. F., Gwynne, A. L., & Ennew, C. (2002). The antecedents of service expectations.
Service Industries Journal, 22(4), 117–152.
Dill, D. D. (2014). Assuring the Public Good in Higher Education: Essential Framework
Conditions and Academic Values. Higher Education as a Public Good: Critical
Perspectives on Theory, Policy and Practice. New York: Peter Lang.
Dill, D. D., & Soo, M. (2005). Academic quality, league tables, and public policy: A cross-
national analysis of university ranking systems. Higher Education, 49(4), 495–533.
Dong, Y., & Lucey, A. (2013). Relationships between student satisfaction and assessment
grades in a first-year engineering unit. In In Design, develop, evaluate: The core of the
learning environment. Proceedings of the 22nd Annual Teaching Learning Forum.
Douglas, J. A., Douglas, A., McClelland, R. J., & Davies, J. (2015). Understanding student
satisfaction and dissatisfaction: an interpretive study in the UK higher education context.
255
Studies in Higher Education, 40(2), 329–349.
Douglas, J. A., McClelland, R., Davies, J., & Sudbury, L. (2009). Using critical incident
technique (CIT) to capture the voice of the student. The TQM, 21(4), 305–318.
Douglas, J., Douglas, A., & Barnes, B. (2006). Measuring student satisfaction at a UK
university. Quality Assurance in Education, 14(3), 251–267.
Dowling, A. (2015). The Dowling Review of Business-University Research Collaborations.
Drennan, L. T., & Beck, M. (2001). Teaching quality performance indicators-key influences
on the UK universities’ scores. Quality Assurance in Education, 9(2), 92–102.
Driscoll, C., & Wicks, D. (1998). The customer-driven approach in business education: a
possible danger? Journal of Education for Business, 74(1), 58–61.
Durkin, M., Filbey, L., & McCartan-Quinn, D. (2014). Marketing to the mature learner:
exploring the role of web communications. The Service Industries Journal, 34(1), 56–70.
Durkin, M., McKenna, S., & Cummins, D. (2012). Emotional connections in higher education
marketing. International Journal of Educational Management, 26(2).
Dyer, W. G., & Wilkins, A. L. (1991). Better stories, not better constructs, to generate better
theory: A rejoinder to Eisenhardt. Academy of Management Review, 16(3), 613–619.
Eagly, A. H., & Chaiken, S. (1993). The psychology of attitudes. Harcourt Brace Jovanovich
College Publisher.
Easterby-Smith, M., Thorpe, R., & Jackson, P. R. (2004). Management research (2nd ed.).
London: Sage Publications.
Easton, G. (2010). One case study is enough.
Elliott, K. M., & Healy, M. A. (2001). Key factors influencing student satisfaction related to
recruitment and retention. Journal of Marketing for Higher Education, 10(4), 1–11.
Elliott, K. M., & Shin, D. (2002). Student satisfaction: An alternative approach to assessing
this important concept. Journal of Higher Education Policy and Management, 24(2), 197–
209.
Festinger, L. (1962). A theory of cognitive dissonance Vol. 2. Stanford university press.
Finney, T. . G., & Finney, R. Z. (2010). Are students their universities’ customers? An
exploratory study. Education+ Training, 52(4), 276–291.
Flanagan, J. C. (1954). The critical incident technique. Psychological Bulletin, 51(4), 327–
358.

256
Foster, S. T. (2012). Managing quality: Integrating the supply chain (5th ed). Harlow :
Pearson Education .
Fox, K. A. (1997). An investigation of factors affecting job satisfaction and career motivation
of on‐air radio personalities. Journal of Radio Studies, 4(1), 30–44.
Franz, R. S. (1998). Whatever you do, don’t Treat your Students Like Customers! Journal of
Management Education, 22(1), 63–69.
Frey, R. V., Bayón, T., & Totzek, D. (2013). How customer satisfaction affects employee
satisfaction and retention in a professional services context. Journal of Service Research,
16(4), 1–15.
Ghobadian, A., Speller, S., & Jones, M. (1994). Service quality: concepts and models.
International Journal of Quality & Reliability Management, 11(9), 43–66.
Gibbons, S., Neumayer, E., & Perkins, R. (2013). Student satisfaction, league tables and
university applications. London School of Economics and Political Science.
Giese, J. L., & Cote, J. A. (2000). Defining consumer satisfaction. Academy of Marketing
Science Review, 1(1), 1–22.
Goodell, T. T., & Coding, H. V. E. (1994). Outcomes of nurses’ job satisfaction. Journal of
Nursing Administration, 24(11), 36–41.
Grebennikov, L., & Shah, M. (2012). Investigating attrition trendsin order to improvestudent
retention. Quality Assurance in Education, 20(3), 223–236.
Grebennikov, L., & Shah, M. (2013). Monitoring trends in student satisfaction. Tertiary
Education and Management, 19(4), 301–322.
Gregorio, R., & Cronemyr, P. (2011). From expectations and needs of service customers to
control chart specification limits. The TQM Journal, 23(2), 164–178.
Gregory, L. D. (2008). International Students on the US College Campus: Intercultural
Communication and Enrollment Management. Enrollment Management Journal .
Gremler, D. D. (2004). The critical incident technique in service research. Journal of Service
Research, 7(1), 65–89.
Gronroos, C. (1990). Service management and marketing: managing the moments of truth in
service competition. Jossey-Bass.
Gronroos, C. (2000). Service management and marketing : A customer relationship
management approach (2nd ed.). Chichester: Wiley.

257
Grove, J. (2012). Will the last university to leave the 1994 Group please turn out the lights.
The Times Higher Eduaction.
Gruber, T., Fuß, S., Voss, R., & Gläser‐Zikuda, M. (2010). Examining student satisfaction
with higher education services: Using a new measurement tool. International Journal of
Public Sector Management, 23(2), 105–123.
Guba, E. G., & Lincoln, Y. S. (1994). Competing paradigms in qualitative research. In
Handbook of qualitative (2nd ed., pp. 163–194). Sage Publications, Newbury Park, CA.
Hagedorn, L. S. (2000). Conceptualizing faculty job satisfaction: Components, theories, and
outcomes. New Directions for Institutional Research, 2000(105), 5–20.
Hamlyn, M. (2015). What will a Conservative government mean for UK universities?
Retrieved from http://www.theguardian.com/higher-education-network/2015/may/11/what-
will-a-conservative-government-mean-for-uk-universities
Hanaysha, J. R. M., Abdullah, H. H., & Warokka, A. (2011). Service quality and students’
satisfaction at higher learning institutions: The competing dimensions of Malaysian
universities' competitiveness. The Journal of Southeast Asian Research, 2011, 1–10.
Hanssen, T., & Solvoll, G. (2015). The importance of university facilities for student
satisfaction at a Norwegian University. Facilities, 33(13/14), 744 – 759.
Harmon-Jones, E. (2012). Cognitive dissonance theory. In Ramachandran, V. (2012).
Encyclopedia of Human Behavior (2nd ed.). (pp. 543–549). Burlington: Elsevier Science.
Hart, D. J., & Coates, N. F. (2010). International student complaint behaviour: how do East
Asian students complain to their university? Journal of Further and Higher Education,
34(3), 303–319.
Hart, L. (2015). How manifesto pledges would affect the future of UK universities. Retrieved
from http://www.out-law.com/en/articles/2015/may/how-manifesto-pledges-would-affect-
the-future-of-uk-universities/
Hartline, M. D., & Ferrell, O. C. (1996). The management of customer-contact service
employees: An empirical investigation. The Journal of Marketing, 60(4), 52–70.
Hartman, D. E., & Lindgren, J. H. (1993). Consumer evaluations of goods and services:
Implications for services marketing. Journal of Services Marketing, 7(2), 4–15.
HEA. (2016a). Postgraduate Taught Experience Survey (PTES). Retrieved from
https://www.heacademy.ac.uk/research/surveys/postgraduate-taught-experience-survey-
ptes

258
HEA. (2016b). Usine the National Student Survey (NSS) for enhancement. Retrieved from
https://www.heacademy.ac.uk/research/surveys/using-national-student-survey-nss-
enhancement
HEFCE. (2015). HEFCE Guide to funding 2015-16, How HEFCE allocates its funds.
Retrieved from
http://www.hefce.ac.uk/media/HEFCE,2014/Content/Pubs/2015/201504/2015_04.pdf
HEFCE. (2016). National Student Survey. Retrieved June 23, 2016, from
http://www.hefce.ac.uk/lt/nss/
Heffernan, T., Morrison, M., Sweeney, A., & Jarratt, D. (2010). Personal attributes of
effective lecturers: The importance of dynamism, communication, rapport and applied
knowledge. International Journal of Management Education, 8(3), 13–27.
Heider, F. (1946). Attitudes and cognitive organization. The Journal of Psychology, 21(1),
107–112.
Heider, F. (1958). The psychology of interpersonal relations. New York ; London: Wiley.
Hemsley-Brown, J., & Oplatka, I. (2006). Universities in a competitive global marketplace: A
systematic review of the literature on higher education marketing. International Journal of
Public Sector Management, 19(4), 316–338.
Herzberg, F. (1968). One more time: How do you motivate employees. Boston: Harvard
Business Review.
Herzberg, F. (1989). One more time: How do you motivate employees. In It comes with the
territory: An inquiry concerning work and the person (pp. 230–237).
HESA. (2016). Higher Education Provider Contacts. Retrieved from
https://www.hesa.ac.uk/component/heicontacts/
Hesterman, D. (2015). Intensive mode delivery of courses in engineering, computer science
and mathematics Final Report.
Higher Education Commission. (2012). Postgraduate Education An Independent Inquiry By
The Higher Education Commission. Retrieved from
http://www.policyconnect.org.uk/hec/sites/site_hec/files/report/329/fieldreportdownload/he
c-postgraduateeducationreport.pdf
Hill, F. M. (1995). Managing service quality in higher education: the role of the student as
primary consumer. Quality Assurance in Education, 3(3), 10–21.
259
Hill, Y., Lomas, L., & MacGregor, J. (2003). Students’ perceptions of quality in higher
education. Quality Assurance in Education, 11(1), 15–20.
HM Treasury. (2015). Policy Paper. Summer Budget 2015. Retrieved from
https://www.gov.uk/government/publications/summer-budget-2015/summer-budget-2015
Ho, H. W. L., & Polonsky, M. (2007). Marketing students’ perception of traditional and
intensive delivery: An exploratory study. In In ANZMAC 2007: 3Rs, reputation
responsibility relevance (pp. 3268– 3273).
Hofmans, J., Gieter, S. D., & Pepermans, R. (2013). Individual differences in the relationship
between satisfaction with job rewards and job satisfaction. Journal of Vocational Behavior,
82(1), 1–9.
Hofstede, G. (1986). Cultural differences in teaching and learning. International Journal of
Intercultural Relations, 10(3), 301–320.
House, R. J., & Wigdor, L. A. (1967). Herzberg’s dual‐factor theory of job satisfaction and
motivation: A review of the evidence and a criticism. Personnel Psychology, 20(4), 369–
390.
Houston, D., Meyer, L. H., & Paewai, S. (2006). Academic staff workloads and job
satisfaction: Expectations and values in academe. Journal of Higher Education Policy and
Management, 28(1), 17–30.
Hughes, H. (2012). An expanded critical incident approach for exploring information use and
learning. Library and Information Research, 36(112), 72–95.
Hussey, J., & Hussey, R. (1997). Business research: A practical guide for undergraduate and
postgraduate students. Basingstoke: Macmillan Press Ltd.
Jackson, M. J., Helms, M. M., & Ahmadi, A. (2011). Quality as a gap analysis of college
students’ expectations. Quality Assurance in Education, 19(4), 392 – 412.
Jager, G. de. (2011). Missions on the move: university systems in England, New York State
and California. Higher Education Management and Policy, 23(1), 1–24.
Jancey, J., & Burns, S. (2013). Institutional factors and the postgraduate student experience.
Quality Assurance in Education, 21(3), 311 – 322.
Jeon, H., & Choi, B. (2012). The relationship between employee satisfaction and customer
satisfaction. Journal of Services Marketing, 26(5), 332 – 341.

260
Jobbins, D., Kingston, B., Nunes, M., & Polding, R. (2008). The complete university guide–a
new concept for league table practices in the United Kingdom. Higher Education in
Europe, 33(2-3), 357–359.
Johnson, R. B., & Onwuegbuzie, A. J. (2004). Mixed methods research: A research paradigm
whose time has come. Educational Researcher, 33(7), 14–26.
Johnston, R. (1995). The determinants of service quality: satisfiers and dissatisfiers.
International Journal of Service Industry, 6(5), 53–71.
Jongbloed, B. (2003). Marketisation in higher education, Clark’s triangle and the essential
ingredients of markets. Higher Education Quarterly, 57(2), 110–135.
Jongbloed, B., Enders, J., & Salerno, C. (2008). Higher education and its communities:
Interconnections, interdependencies and a research agenda. Higher Education, 56(3), 303–
324.
Joseph, M., & Joseph, B. (1997). Service quality in education: a student perspective. Quality
Assurance in Education, 5(1), 15–21.
Joseph, M., & Joseph, B. (1998). Identifying needs of potential students in tertiary education
for strategy development. Quality Assurance in Education, 6(2), 90–96.
Judson, K. M., & Taylor, S. A. (2014). Moving from marketization to marketing of higher
education: The co-creation of value in higher education. Higher Education Studies, 4(1),
51–67.
Kacel, B., Miller, M., & Norris, D. (2005). Measurement of nurse practitioner job satisfaction
in a Midwestern state. Of the American Academy of Nurse Practitioners, 17(1), 27–32.
Karabit-Yik, L., & Anbar, A. (2008). Determınıng The Factors That Affect Burnout Among
Academıcıans. Ankara Üniversitesi SBF Dergisi, 63(2), 91–115.
Karaksha, A., Anoopkumar-Dukie, S., Grant, G., Davey, A., Nirthanan, S., Arora, D., ..., &
Haywood, A. (2013). Benefits of Intensive Mode Teaching to Improve Student
Performance. In ICERI2013 proceedings (pp. 5212–5218).
Kashif, M., & Ting, H. (2014). Service-orientation and teaching quality: business degree
students’ expectations of effective teaching. Asian Education and Development Studies,
3(2), 163–180.
Katt, J. A., & Condly, S. J. (2009). A preliminary study of classroom motivators and de-
motivators from a motivation-hygiene perspective. Communication Education, 58(2), 213–
234.

261
Kay Michael, R., Sower, V. E., & Motwani, J. (1997). A comprehensive model for
implementing total quality management in higher education. Benchmarking for Quality
Management & Technology, 4(2), 104–120.
Kenny, D. A., Kashy, D. A., & Cook, W. L. (2006). Dyadic data analysis. New York:
Guilford Press.
Khan, M. M., Ahmed, I., & Nawaz, M. M. (2011). Student’s perspective of service quality in
higher learning institutions; an evidence based approach. International Journal of Business
and Social Science, 2(11), 159–164.
Khanafiah, D., & SItungkir, H. (2004). Social Balance Theory: Revisiting Heider’s Balance
Theory for Many Agents.
Khazanchi, D., & Munkvold, B. E. (2003). "On the rhetoric and relevance of IS research
paradigms: a conceptual framework and some propositions". System Sciences. In
Proceedings of the 36th Annual Hawaii International Conference on IEEE.
Kim, H. J., Tavitiyaman, P., & Kim, W. G. (2009). The effect of management commitment to
service on employee service behaviors: The mediating role of job satisfaction. Journal of
Hospitality & Tourism, 33(3), 369–390.
Kim, W. G., Leong, J. K., & Lee, Y. K. (2005). Effect of service orientation on job
satisfaction, organizational commitment, and intention of leaving in a casual dining chain
restaurant. International Journal of Hospitality Management, 24(2), 171–193.
Kim, Y. K., & Sax, L. J. (2009). Student–faculty interaction in research universities:
Differences by student gender, race, social class, and first-generation status. Research in
Higher Education, 50(5), 437–459.
Klein, H. K., & Myers, M. D. (1999). A set of principles for conducting and evaluating
interpretive field studies in information systems. MIS Quarterly, 23(1), 67–93.
Klenke, K. (2008). Qualitative research in the study of leadership (1st ed.). Emerald Group
Publishing Limited.
Kotler, P., & Fox, K. F. A. (1995). Strategic marketing for educational institutions (2nd ed.).
Englewood Cliffs, N.J.: Prentice-Hall.
Ladhari, R. (2009). A review of twenty years of SERVQUAL research. International Journal
of Quality and Service Sciences, 1(2), 172–198.
Lam/be, C. J., Spekman, R. E., & Hunt, S. D. (2002). Alliance competence, resources, and
alliance success: conceptualization, measurement, and initial test. Journal of the Academy
of Marketing Science, 30(2), 141–158.

262
Lawler, E. E. (1970). Job Attitudes And Employee Motivation: Theory, Research, And
Practice. Personnel Psychology, 23(2), 223–237.
Lazibat, T., Baković, T., & Dužević, I. (2014). How perceived service quality influences
students’ satisfaction? Teachers' and students' perspectives. Total Quality Management &
Business Excellence, 25(7-8), 923–934.
Leman, J. (2015). What do taught postgraduates want? Retrieved from
https://www.heacademy.ac.uk/sites/default/files/ptes_2015_what_do_pgts_want.pdf
Letcher, D. W., & Neves, J. S. (2010). Determinants of undergraduate business student
satisfaction. Research in Higher Education Journal, 6(1), 1–26.
Levy, D. (2006). Qualitative methodology and grounded theory in property research. Pacific
Rim Property Research Journal, 12(4), 369–388.
Lewis, B. R. (2007). Chapter Eleven Managing Service Quality. In Managing quality (pp.
234–253). Oxford: Blackwell.
Lock, H. (2015, July 9). Six ways higher education benefits the UK economy. The Gaurdian.
Retrieved from: https://www.theguardian.com/higher-education-network/2015/jul/09/six-
ways-higher-education-benefits-the-uk-economy
Locke, E. A. (1969). What is job satisfaction? Organizational Behavior and Human
Performance, 4(4), 309–336.
Locke, W., Verbik, L., Richardson, J. T. E., & King, R. (2008). Counting what is measured or
measuring what counts? League tables and their impact on higher education institutions in
England. Higher Education Founding Council for England, Bristol.
Lockwood, N. R. (2007). Leveraging employee engagement for competitive advantage.
Society for Human Resource Management Research Quarterly, 1(1-12).
Lodahl, T. M. (1964). Patterns of job attitudes in two assembly technologies. Administrative
Science Quarterly, 8(4), 482–519.
London First & Pricewaterhouse Coopers. (2015). London calling: international students’
contribution to Britain's economic growth.
Long, C. S., Ibrahim, Z., & Kowang, T. O. (2014). An analysis on the relationship between
lecturers’ competencies and students' satisfaction. International Education Studies, 7(1),
37–46.
Lovelock, C., & Gummesson, E. (2004). Whither services marketing? In search of a new
paradigm and fresh perspectives. Journal of Service Research, 7(1), 20–41.

263
Lu, H., While, A. E., & Barriball, K. L. (2005). Job satisfaction among nurses: a literature
review. International Journal of Nursing Studies, 42(2), 211–227.
Lundberg, C., Gudmundson, A., & Andersson, T. D. (2009). Herzberg’s Two-Factor Theory
of work motivation tested empirically on seasonal workers in hospitality and tourism.
Tourism Management, 30(6), 890–899.
Lyons, J., Shipman, T., & Woolf, M. (2015). Labour warns Tories will push up tuition fees.
Retrieved from http://www.thesundaytimes.co.uk/sto/news/Election/article1551992.ece
Machado, M. de L., Soares, V. M., Brites, R., Ferreira, J. B., & Gouveia, O. M. R. (2011). A
look to academics job satisfaction and motivation in Portuguese higher education
institutions. Procedia-Social and Behavioral Sciences, 29, 1715–1724.
Maguad, B. A. (2009). Using QFD to integrate the voice of the customer into the academic
planning process. Proceedings of ASBBS Annual Conference, 16(1).
Maguad, B. A. (2007). Identifying the needs of customers in higher education. Education,
127(3), 332-343.
Mai, L. W. (2005). A comparative study between UK and US: The student satisfaction in
higher education and its influential factors. Journal of Marketing Management, 21(7-8),
859–878.
Malhotra, N., & Mukherjee, A. (2004). The relative influence of organisational commitment
and job satisfaction on service quality of customer-contact employees in banking call
centres. Journal of Services Marketing, 18(3), 162–174.
Maslow, A. H. (1970). Motivation and personality (2nd ed.). New York ; London: Harper &
Row.
Maxwell, J. A. (2012). Qualitative research design: An interactive approach: An interactive
approach (3rd ed.). Thousand Oaks, Calif. ; London : SAGE .
McCarthy, G. (2010). Approaches to the postgraduate education of business coaches.
Australian Journal of Adult Learning, 50(2), 323–357.
Metcalf, H., Rolfe, H., Stevens, P., & Weale, M. (2005). Recruitment and retention of
academic staff in higher education. National Institute of Economic and Social Research.
Metin, I., & Camgoz, S. M. (2011). The advances in the history of cognitive dissonance
theory. Journal of Humanities and Social Science, 1(6), 131–136.
Miles, M. B., & Huberman, A. M. (1994). Qualitative data analysis: An expanded
sourcebook. (2nd ed.). Thousand Oaks, Calif. ; London : Sage.

264
Miles, M. B., Huberman, A. M., & Saldana, J. (2014). Qualitative data analysis: A methods
sourcebook. (3rd ed.). Thousand Oaks, Califorinia : SAGE Publications, Inc.
Mitchell, N. (2016). Universities compete by teaching in English. Retrieved from
http://www.bbc.co.uk/news/business-35429233
Molesworth, M., Nixon, E., &, & Scullion, R. (2009). Having, being and higher education:
The marketisation of the university and the transformation of the student into consumer.
Teaching in Higher Education, 14(3), 277– 287.
MORI. (2016). The National Student Survey. Retrieved from https://www.ipsos-
mori.com/researchspecialisms/socialresearch/specareas/highereducation/nss.aspx
Mullins, L. J. (2005). Management and organisational behaviour (7th ed.). Harlow: Prentice
Hall/Financial Times.
Munteanu, C., Ceobanu, C., Bobâlca, C., & Anton, O. (2010). An analysis of customer
satisfaction in a higher education context. International Journal of Public Sector
Management, 23(2), 124 – 140.
Mustapha, N., & Ghee, W. (2013). Examining Faculty Workload as a Single Antecedent of
Job Satisfaction among Higher Public Education Staff in Kelantan, Malaysia. Business and
Management Horizons, 1(1), 10–16.
Myers, M. D. (1997). Qualitative research in information systems. Management Information
Systems Quarterly, 21(2), 241–242.
Myers, M. D. (2013). Qualitative research in business and management. Sage.
Naidoo, R., Shankar, A., & Veer, E. (2011). The consumerist turn in higher education: Policy
aspirations and outcomes. Journal of Marketing Management, 27(11-12), 1142–1162.
NAID-UE. (2015). Overview, Quality Assurance System in HIgher Education United
Kingdom. Retrieved from http://www.niad.ac.jp/english/overview_uk_e_ver2.pdf
Nair, C. S., Bennett, L., & Shah, M. (2012). The Student Experience in Private Higher
Education in Australia. The ACPET Journal for Private Higher Education, 1(2), 23–29.
Nassar, M., & Heinze, A. (2016). Are students customers – what are the marketisation lessons
from UK Business School postgraduate students? In Academy of Marketing Conference.
Neuman, W. L. (2011). Social research methods: Quantitative and qualitative approaches.
Boston MA: Pearshon Education: Inc.
Newman, I., & Benz, C. R. (1998). Qualitative-quantitative research methodology: Exploring
the interactive continuum. SIU Press.

265
Noordin, F., & Jusoff, K. (2009). Levels of job satisfaction amongst Malaysian academic staff.
Asian Social Science, 5(5), 122–128.
Northrup, P. T. (2002). Online Learners’ Preferences for Interaction. Quarterly Review of
Distance Education, 3(2), 219–226.
O’Brien, E. M., & Deans, K. R. (1996). Educational supply chain: a tool for strategic planning
in tertiary education? Marketing Intelligence & Planning, 14(2), 33–40.
O’Connell, C. (2015). Close‐Up Examination of Discourses Associated with Global
University Rankings: Counter‐Narratives in UK Policy Context. Higher Education
Quarterly, 69(3), 279–294.
O’Neill, M. (2003). The influence of time on student perceptions of service quality: the need
for longitudinal measures. Journal of Educational Administration, 41(3), 310–325.
O’Neill, M. A., & Palmer, A. (2004). Importance‐performance analysis: a useful tool for
directing continuous quality improvement in higher education. Quality Assurance in
Education, 12(1), 39–52.
Oates, B. J. (2013). Researching information systems and computing. Sage Publications.
Oldfield, B. M., & Baron, S. (2000). Student perceptions of service quality in a UK university
business and management faculty. Quality Assurance in Education, 8(2), 85–95.
Ololube, N. P. (2006). Teachers Job Satisfaction and Motivation for School Effectiveness: An
Assessment. Essays in Education (EIE), 18, 1–19.
Ong, V. Y. S. (2012). Complexities of multiple paradigms in higher education leadership
today. Journal of Global Management, 4(1).
Osakwe, R. N. (2014). Factors affecting motivation and job satisfaction of academic staff of
universities in South-South Geopolitical Zone of Nigeria. International Education Studies,
7(7), 43–51.
Oshagbemi, T. (1997). Job satisfaction and dissatisfaction in higher education. Education+
Training, 39(9), 354–359.
Oskamp, S., & Schultz, P. W. (2005). Attitudes and opinions (3rd ed.). Psychology Press.
Owens, R. G. (2001). Organizational Behavior in Education: Instructional Leadership and
School Reform. Pearson.
Palmer, A., & Koenig-Lewis, N. (2011). The effects of pre-enrolment emotions and peer
group interaction on students’ satisfaction. Journal of Marketing Management, 27(11-12),
1208–1231.
266
Parasuraman, A., Zeithaml, V. A., & Berry, L. L. (1985). A conceptual model of service
quality and its implications for future research. The Journal of Marketing, 49(4), 41–50.
Parasuraman, A., Zeithaml, V. A., & Berry, L. L. (1994). Reassessment of expectations as a
comparison standard in measuring service quality: implications for further research. The
Journal of Marketing, 58(1), 111–124.
Parasuraman, A., Zeithaml, V., & Berry, L. (1988). SERVQUAL: a multiple-item scale for
measuring consumer perceptions of service quality. Journal of Retailing, 64(1), 140.
Parker, C., & Mathews, B. P. (2001). Customer satisfaction: contrasting academic and
consumers’ interpretations. Marketing Intelligence & Planning, 19(1), 38 – 44.
Parsell, G. (2000). Students as customers. Medical Education, 34(5), 328–329.
Paswan, A. K., & Ganesh, G. (2009). Higher education institutions: satisfaction and loyalty
among international students. Journal of Marketing for Higher Education, 19(1), 65–84.
Patton, M. Q. (2002). Qualitative evaluation and research methods . (3rd ed.). London : Sage
Publications.
Peters, V. J. (1999). Total service quality management. Managing Service Quality: An
International Journal, 9(1), 6–12.
Petruzzellis, L., D’Uggento, A. M., & Romanazzi, S. (2006). Student satisfaction and quality
of service in Italian universities. Managing Service Quality: An International Journal,
16(4), 349–364.
Policano, A. J. (2007). The rankings game: and the winner is... Journal of Management
Development, 26(1), 43–48.
Poon, J., & Brownlow, M. (2015). Real estate student satisfaction in Australia: what matters
most? Property Management, 33(2), 100–132.
Porter, L. W., Bigley, G. A., & Steers, R. M. (2003). Motivation and work behavior (7th ed.).
McGraw-Hill/Irwin.
Potočnik, K., Tordera, N., Martínez-Tur, V., Peiró, J. M., & Ramos, J. (2011). Is service
climate strength beneficial or detrimental for service quality delivery? European Journal of
Work and Organizational Psychology, 20(10), 681–699.
Powell, J. P., Barrett, E., & Shanker, V. (1983). How academics view their work. Higher
Education, 12(3), 297–313.
Prest, M. (2010). How to stand out from the crowded marketplace. Retrieved from
http://www.independent.co.uk/student/postgraduate/mbas-guide/how-to-stand-out-from-
267
the-crowded-marketplace-2099738.html
Punch, K. F. (2005). Introduction to social research: Quantitative and qualitative approaches
(2nd ed.). London : SAGE.
QAA. (2005). Quality assurance in UK higher education: A guide for international readers.
QAA. (2014). STRATEGY twenty fourteen twenty seventeen. Retrieved from
http://www.qaa.ac.uk/en/Publications/Documents/QAA-Strategy-2014-17.pdf
Radice, H. (2013). How we got here: UK higher education under neoliberalism. ACME: An
International E-Journal for Critical Geographies, 12(2), 407–418.
Rafiq, M., & Ahmed, P. K. (1998). A customer-oriented framework for empowering service
employees. Journal of Services Marketing, 12(5), 379–396.
Ramsay, I. (2011). Intensive teaching in law subjects. The Law Teacher, 45(1), 87–100.
Research Assessment Exercise (rae, 2008). About the RAE 2008. Retrived from:
http://www.rae.ac.uk/aboutus/ (accessed 12/07/2015)
Research Assessment Exercise (rae, 2008). RAE 2008 Guidance on submissions. Retrived
from: http://www.rae.ac.uk/pubs/2005/03/rae0305.pdf (accessed 12/07/2015)
Research Excellence Framework (REF 2014). About the REF. Retrived from:
http://www.ref.ac.uk/about/ (accessed 12/07/2015)
Remenyi, D., Williams, B., Money, A., & Swartz, E. (1998). Doing research in business and
management an introduction to process and method. London : SAGE.
Renzulli, L. A., Parrott, H. M., & Beattie, I. R. (2011). Racial mismatch and school type
teacher satisfaction and retention in charter and traditional public schools. Sociology of
Education, 84(1), 23–48.
Rhodes, C., Hollinshead, A., & Nevill, A. (2007). Changing times, changing lives: a new look
at job satisfaction in two university Schools of Education located in the English West
Midlands. Research in Post‐Compulsory Education, 12(1), 71–89.
Richardson, J. T. E. (2005). Instruments for obtaining student feedback: A review of the
literature. Assessment & Evaluation in Higher Education, 30(4), 387–415.
Ritchie, J., Lewis, J., & Elam, G. (2003). Designing and selecting samples. In practice: A
guide for social science … (pp. 77–108). London : SAGE .
Robbins, S. P., & Judge, T. A. (2013). Organizational behavior (15th ed.). Prentice Hall.

268
Robertson, G., Baumann, C., Bilgin, A. A., Bulger, D., Coutts, p. M., Engel, R. M., …
Tomossy, G. F. (2012). The Impact of space on students’ perceptions of the value and
quality of their learning experience: a case study of the Collaborative Learning Forum. In
Macquarie University, Sydney.
Rod, M., & Ashill, N. J. (2010). Management commitment to service quality and service
recovery performance: A study of frontline employees in public and private hospitals.
International Journal of Pharmaceutical and Healthcare Marketing, 4(1), 84–103.
Roelen, C. A. M., Koopmans, P. C., & Groothoff, J. W. (2008). Which work factors determine
job satisfaction? Work, 30(4), 433–439.
Rothwell, N. (2016). There is more to university than money. Retrieved April 17, 2016, from
http://www.ft.com/cms/s/0/c56ee05e-0301-11e6-99cb-83242733f755.html#axzz464i3I8sP
Russell, M. (2005). Marketing education: A review of service quality perceptions among
international students. International Journal of Contemporary Hospitality Management,
17(1), 65–77.
Sabharwal, M., & Corley, E. A. (2009). Faculty job satisfaction across gender and discipline.
The Social Science Journal, 46(3), 539–556.
Sachau, D. A. (2007). Resurrecting the motivation-hygiene theory: Herzberg and the positive
psychology movement. Human Resource Development Review, 6(4), 377–393.
Saha, G. C., & Theingi. (2009). Service quality, satisfaction, and behavioural intentions: A
study of low-cost airline carriers in Thailand. Managing Service Quality: An International
Journal, 19(3), 350–372.
Sahney, S., Banwet, D. K., & Karunes, S. (2004). Conceptualizing total quality management
in higher education. The TQM Magazine, 16(2), 145–159.
Sakthivel, P. B. (2007). Top management commitment and overall engineering education
excellence. The TQM Magazine, 19(3), 259–273.
Sánchez Pérez, M., Carlos Gázquez Abad, J., María Marín Carrillo, G., & Sánchez Fernández,
R. (2007). Effects of service quality dimensions on behavioural purchase intentions: A
study in public-sector transport. Managing Service Quality: An International Journal,
17(2), 134–151.
Sanderson, A., Phua, V. C., & Herda, D. (2000). The American Faculty Poll.
Saunders, D. B. (2014). Exploring a customer orientation: Free-market logic and college
students. The Review of Higher Education, 37(2), 197–219.

269
Saunders, M., Lewis, P., & Thornhill, A. (2009). Research Methods for business students (5th
ed.). Pearson education limited.
Saunders, M., Lewis, P., & Thornhill, A. (2016). Research Methods for business students.
Pearson education limited.
Sax, B. (2004). Students as “customers.” On the Horizon, 12(4), 158–160.
SBS. (2016). About Salford Business School. Retrieved from
http://www.salford.ac.uk/business-school/about-salford-business-school
Schneider, B., Ehrhart, M. G., Mayer, D. M., Saltz, J. L., & Niles-Jolly, K. (2005).
Understanding organization-customer links in service settings. Academy of Management
Journal, 48(6), 1017–1032.
Schneider, B., & White, S. S. (2004). Service quality : Research perspectives (Foundations for
organizational science). Thousand Oaks, Calif. ; London: Sage Publications.
Schüller, D., Chlebovský, V., Doubravský, K., & Chalupský, V. (2014). The Conceptual
Scheme for Managing University Stakeholders’ Satisfaction. Acta Universitatis
Agriculturae Et Silviculturae Mendelianae Brunensis, 62(4), 719–727.
Schwab, D. P., Devitt, H. W., & Cummings, L. (1971). A Test Of The Adequacy Of The Two
Factor Theory As A Predictor Of Self‐Report Performance Effects. Personnel Psychology,
24(2), 293–303.
Scotland, J. (2012). Exploring the Philosophical Underpinnings of Research: Relating
Ontology and Epistemology to the Methodology and Methods of the Scientific,
Interpretive, and Critical Research Paradigms. English Language Teaching, 5(9), 9–16.
Seidman, I. (2013). Interviewing as qualitative research: A guide for researchers in education
and the social sciences (3rd ed.). New York : Teachers’ College Press.
Shah, M., Roth, K., & Nair, S. (2010). Improving the quality of offshore student experience:
Findings of a decade in three Australian universities. In Australian International Education
Conference, Sydney, Australia.
Shah, M., & Widin, J. (2010). Indigenous Students’ Voices: Monitoring Indigenous Student
Satisfaction and Retention in a Large Australian University. Journal of Institutional
Research, 15(1), 28–41.
Sharp, T. P. (2008). Job satisfaction among psychiatric registered nurses in New England.
Journal of Psychiatric and Mental Health Nursing, 15(5), 374–378.

270
Sharrock, G. (2000). Why students are not (just) customers (and other reflections on life after
George). Journal of Higher Education Policy and Management, 22(2), 149–164.
Shasha, T., Wei, K., & Wei, G. (2014). Persuasive Communication: A Comparison of Major
Attitude-Behaviour Theories in a Social Media Context. Proceedings Book of ICETSR,
2014, Malaysia.
Shaw, J., Mitchell, C., & Fabbro, L. Del. (2015). Group work: Facilitating the learning of
international and domestic undergraduate nursing students. Education for Health, 28(2),
124.
Shenton, A. K. (2004). Strategies for ensuring trustworthiness in qualitative research projects.
Education for Information, 22(2), 63–75.
Sherifi, I. (2015). Impact Of Information Systems In Satisfying Students Of The University:
Case Study From Epoka University. European Journal of Business and Social Sciences,
4(04), 167–175.
Shin, J. C., & Jung, J. (2014). Academics job satisfaction and job stress across countries in the
changing academic environments. Higher Education, 67(5), 603–320.
Siggelkow, N. (2007). Persuasion with case studies. Academy of Management Journal, 50(1),
20–24.
Silverman, D. (2013). Doing qualitative research: A practical handbook (4th ed.). London :
SAGE.
Sinclaire, J. K. (2011). Student satisfaction with online learning: Lessons from organizational
behavior. Research in Higher Education Journal, 11, 1–19.
Singh, A. (2015). Social Psychology. New Delhi: Rekha Printers Private Limited.
Slåtten, T. (2010). Do employees’ feelings really matter in service-quality management?
European Business Review, 22(3), 318–338.
Smerek, R. E., & Peterson, M. (2007). Examining Herzberg’s theory: Improving job
satisfaction among non-academic employees at a university. Research in Higher Education,
48(2), 229–250.
Smith, G., Smith, A., & Clarke, A. (2007). Evaluating service quality in universities: a service
department perspective. Quality Assurance in Education, 15(3), 334–351.
Soanes, C., & Stevenson, A. (2006). Concise Oxford English Dictionary (11th ed.). Oxford :
Oxford University Press.

271
Söderlund, M. (1998). Customer satisfaction and its consequences on customer behaviour
revisited: The impact of different levels of satisfaction on word-of-mouth, feedback to the
supplier. International Journal of Service Industry Management, 9(2), 69 – 188.
Soo, K. T. (2013). Does anyone use information from university rankings? Education
Economics, 21(2), 176–190.
Soo, K. T., & Elliott, C. (2010). Does price matter? Overseas students in UK higher education.
Economics of Education Review, 29(4), 553–565.
Spector, P. E. (1997). Job satisfaction: Application, assessment, causes, and consequences.
Thousand Oaks, Calif. ; London: SAGE.
Ssesanga, K., & Garrett, R. M. (2005). Job satisfaction of university academics: Perspectives
from Uganda. Higher Education, 50(1), 33–56.
Stake, R. (1995). The art of case study research. Thousand Oaks, Calif. ; London: Sage.
Stukalina, Y. (2012). Addressing service quality issues in higher education: the educational
environment evaluation from the students’ perspective. Technological and Economic
Development of Economy, 18(1), 84–98.
Sullivan, E. J., & Garland, G. (2010). Practical leadership and management in nursing.
Harlow : Pearson .
Sultan, P., & Wong, H. (2014). An integrated-process model of service quality, institutional
brand and behavioural intentions: The case of a University. Managing Service Quality,
24(5), 487–521.
Sultan, P., & Wong, H. Y. (2012). Service quality in a higher education context: An integrated
model. Asia Pacific Journal of Marketing and Logistics, 24(5), 755–784.
Sultan, P., & Wong, H. Y. (2013). Antecedents and consequences of service quality in a
higher education context: a qualitative research approach. Quality Assurance in Education,
21(1), 70–95.
Sumaedi, S., Bakit, I. G. M. Y., & Metasari, N. (2011). The effect of students’ perceived
service quality and perceived price on student satisfaction. Management Science and
Engineering, 5(1), 88–97.
Sumaedi, S., Bakti, G., & Metasari, N. (2012). An empirical study of state university students’
perceived service quality. Quality Assurance in Education, 20(2), 164 – 183.

272
Sureeyatanapas, P., Yang, J. B., & Bamford, D. (2015). The sweet spot in sustainability: a
framework for corporate assessment in sugar manufacturing. Production Planning &
Control, 26(13), 1128–1144.
Sureshchandar, G. S., Rajendran, C., & Anantharaman, R. N. (2002). The relationship
between service quality and customer satisfaction-a factor specific approach. Journal of
Services Marketing, 16(4), 363–379.
Susskind, A. M., Borchgrevink, C. P., Kacmar, K. M., & Brymer, R. A. (2000). Customer
service employees’ behavioral intentions and attitudes: An examination of construct
validity and a path model. International Journal of Hospitality Management, 19(1), 53–77.
Svensson, G., & Wood, G. (2007). Are university students really customers? When illusion
may lead to delusion for all! International Journal of Educational Management, 21(1), 17 –
28.
Sweeney, J. C., & Ingram, D. (2001). A comparison of traditional and web-based tutorials in
marketing education: An exploratory study. Journal of Marketing Education, 23(1), 55–62.
Tashakkori, A., & Teddlie, C. (2010). Sage handbook of mixed methods in social &
behavioral research (2nd ed.). London : SAGE.
Terera, S. R., & Ngirande, H. (2014). The impact of rewards on job satisfaction and employee
retention. Mediterranean Journal of Social Sciences, 5(1), 481–487.
Thakur, M. (2007). The impact of ranking systems on higher education and its stakeholders.
Journal of Institutional Research, 13(1), 83–96.
The Complete University Guide. (2016). League Tables Methodology. Retrieved June 22,
2016, from http://www.thecompleteuniversityguide.co.uk/league-tables/methodology/
The Conservative Party. (2015). The Conservative Party Manifesto 2015.
Thompson, J., & Bekhradnia, B. (2010). The Government’s Proposals for Higher Education
Funding and Student Finance: An Analysis. Oxford: Higher Education Policy Institute .
Tight, M. (2000). Do league tables contribute to the development of a quality culture? Football
and higher education compared. Higher Education Quarterly, 54(1), 22–42.
Tohidinia, Z., & Haghighi, M. (2011). Predictors and outcomes of relationship quality: a guide
for customer-oriented strategies. Business Strategy Series, 12(5), 242–256.
Tomlinson, M. (2016). Student perceptions of themselves as “consumers” of higher education.
British Journal of Sociology of Education, 1–15.

273
Tse, D. K., & Wilton, P. C. (1988). Models of consumer satisfaction formation: An extension.
Journal of Marketing Research, 25(2), 204–212.
Turner, D. (2005). Benchmarking in universities: League tables revisited. Oxford Review of
Education, 31(3), 353–371.
Turner, G. (2015). PRES 2015. The research student journey.
Twersky, F., Buchanan, P., & Threlfall, V. (2013). Listening to those who matter most, the
beneficiaries. Stanford Social Innovation, 11, 41–45.
Ugnich, E. A., Chernokozov, A. I., & Velichko, E. V. (2015). Innovation Ecosystem of Higher
Educational Institution as a Driver of Commercialization of Intellectual Activity Results.
Mediterranean Journal of Social Sciences, 6(6), 239–245.
Umbach, P. D., & Porter, S. R. (2002). How do academic departments impact student
satisfaction? Understanding the contextual effects of departments. Research in Higher
Education, 43(2), 209–234.
UniversitiesUK. (2014a). Patterns and Trends in UK Higher Education. Retrieved from
http://www.universitiesuk.ac.uk/highereducation/Documents/2014/PatternsAndTrendsInU
KHigherEducation2014.pdf
UniversitiesUK. (2014b). THE FUNDING ENVIRONMENT FOR UNIVERSITIES 2014.
Retrieved from
http://www.universitiesuk.ac.uk/highereducation/Documents/2014/InternationalStudentsIn
HigherEducation.pdf
UniversitiesUK. (2014c). The funding environment for universities 2014. International
students in UK higher education : the UK and its competition. Retrieved from
http://dera.ioe.ac.uk/26202/1/InternationalStudentsInHigherEducation.pdf
UniversitiesUK. (2014d). The Impact Of Universities On The Uk Economy. Retrieved from
http://www.universitiesuk.ac.uk/highereducation/Documents/2014/TheImpactOfUniversitie
sOnTheUkEconomy.pdf
UniversitiesUK. (2014e). Universities UK - President’s address to 2014 Members' Annual
Conference: Strength in Diversity. Retrieved from
http://www.universitiesuk.ac.uk/highereducation/Pages/StrengthinDiversityConference201
4.aspx#.VxTSTvkrLIU
UniversitiesUK. (2015a). Efficiency, effectiveness and value for money. Retrieved from
http://www.universitiesuk.ac.uk/highereducation/Documents/2015/EfficiencyEffectiveness
ValueForMoney.pdf

274
UniversitiesUK. (2015b). The funding environment for universities 2015 - The economic role
of UK universities. Retrieved from http://www.universitiesuk.ac.uk/policy-and-
analysis/reports/Documents/2015/the-economic-role-of-uk-universities.pdf
UniversitiesUK. (2015c). Universities UK - An overview of the higher education sector.
Retrieved April 18, 2016, from
http://www.universitiesuk.ac.uk/linksforstudents/Pages/Anoverviewofthehighereducationse
ctor.aspx
In Oxford English dictionary online (2016). Retrieved from http://www.oed.com/
UNSECO. (2016). UNESCO World Heritage Centre. Retrieved from
http://whc.unesco.org/en/list/170
UoS. (2016). History. University of Salford. Retrieved June 22, 2016, from
http://www.salford.ac.uk/about-us/heritage
Van Doorn, J. (2008). Is there a halo effect in satisfaction formation in business-to-business
services? Journal of Service Research, 11(2), 124–141.
Van Eerde, W., & Thierry, H. (1996). Vroom’s expectancy models and work-related criteria:
A meta-analysis. Journal of Applied Psychology, 81(5), 575–586.
Venetis, K. A., & Ghauri, P. N. (2004). Service quality and customer retention: building long-
term relationships. European Journal of Marketing, 38(11/12), 1577–1598.
Verhaegen, P. (2005). Academic talent: Quo vadis? Recruitment and retention of faculty in
European business schools. Journal of Management Development, 24(9), 807 – 818.
Voss, R. (2014). Characteristics of Effective Instructors from the Students’ Perspective in
Swiss Higher Education. International Journal of Science and Research (IJSR), 3(7), 905–
908.
Voss, R., & Gruber, T. (2006). The desired teaching qualities of lecturers in higher education:
a means end analysis. Quality Assurance in Education, 14(3), 217–242.
Voss, R., Gruber, T., & Szmigin, I. (2007). Service quality in higher education: The role of
student expectations. Journal of Business Research, 60(9), 949 – 959.
Vroom, V. (1964). Work and motivation. New York ; London: Wiley.
Vuori, J. (2013). Are students customers in Finnish higher education? Tertiary Education and
Management, 19(2), 176–187.
Wahba, M. A., & Bridwell, L. G. (1976). Maslow reconsidered: A review of research on the
need hierarchy theory. Organizational Behavior and Human Performance, 15(2), 212–240.

275
Walsham, G. (2006). Doing interpretive research. European Journal of Information Systems,
15(3), 320–330.
Wangenheim, F., Evanschitzky, H., & Wunderlichc, M. (2007). Does the employee–customer
satisfaction link hold for all employee groups? Journal of Business Research, 60(7), 690–
697.
Ware, J. E. J., & Williams, R. G. (1975). The Dr. Fox effect: a study of lecturer effectiveness
and ratings of instruction. Academic Medicine, 50(2), 155–156.
Watjatrakul, B. (2010). Using the students-as-customers concept in technology disciplines:
students’ perspectives. International Journal of Social, Behavioral, Educational, Economic,
Business and Industrial Engineering, 3(3), 213–217.
Watty, K., Bellamy, S., & Morley, C. (2008). Changes in higher education and valuing the
job: The views of accounting academics in Australia. Journal of Higher Education Policy
and Management, 30(2), 139–151.
Webster, C., & Hung, L. C. (1994). Measuring service quality and promoting decentring. The
TQM Magazine, 6(5), 50–55.
Weiss, H. M. (2002). Deconstructing job satisfaction: Separating evaluations, beliefs and
affective experiences. Human Resource Management Review, 12(2), 173–194.
Wilcox, P., Winn, S., & Fyvie‐Gauld, M. (2005). It was nothing to do with the university, it
was just the people’: the role of social support in the first‐year experience of higher
education. Studies in Higher Education, 30(6), 707–722.
Wilkins, S., & Stephens Balakrishnan, M. (2013). Assessing student satisfaction in
transnational higher education. International Journal of Educational Management, 27(2),
143–156.
Willetts, D. (2014). Contribution of UK universities to national and local economic growth.
Department for Business, Innovation and Skills.
Williams, T. R. (2005). Exploring the impact of study abroad on students’ intercultural
communication skills: Adaptability and sensitivity. Journal of Studies in International
Education, 9(4), 356–371.
Wilson, J. (2010). Essentials of business research: A guide to doing your research project.
Los Angeles, Calif. ; London : SAGE.
Winfrey, D. (2009). How Teachers Perceive Their Job Satisfaction is Influenced by Their
Principals’ Behaviors and Attitudes Related to Race and Gender. ProQuest.

276
Winslow, E. K., & Whitsett, D. A. (1968). Dual‐Factor Theory: A Reply To House And
Wigdor. Personnel Psychology, 21(1), 55–58.
Wintour, P. (2015). Coalition plans to increase tuition fees to £11,500 a year, says Labour.
Retrieved from http://www.theguardian.com/politics/2015/may/03/coalition-plans-
increased-tuition-fees-11500-university
Wismantoro, Y. (2014). Experiences In Using It-Based Service Toward Students Satisfaction
At University (The Study On Private Universities In Central Java Indonesia). International
Journal of Business, Economics and Law, 5(2), 42–51.
Yeo, R. (2008). Brewing service quality in higher education: Characteristics of ingredients
that make up the recipe. Quality Assurance in Education, 16(3), 266 – 286.
Yin, R. K. (2009). Case study research: Design and methods (4th ed.). Thousand Oaks, CA
London : SAGE .
Young, M. S., Robinson, S., & Alberts, P. (2009). Students pay attention! Combating the
vigilance decrement to improve learning during lectures. Active Learning in Higher
Education, 10(1), 41–55.
Yusoff, M., McLeay, F., & Woodruffe-Burton, H. (2015). Dimensions driving business
student satisfaction in higher education. Quality Assurance in Education, 23(1), 86–104.
Zafiropoulos, C., & Vrana, V. (2008). Service quality assessment in a Greek higher education
institute. Journal of Business Economics and Management, 9(1), 33–45.
Zeithaml, V. A., Berry, L. L., & Parasuraman, A. (1993). The nature and determinants of
customer expectations of service. Journal of the Academy of Marketing Science, 21(1), 1–
12.
Zeithaml, V. A., Bitner, M. J., & Gremler, D. D. (2009). Services marketing: Integrating
customer focus across the firm (5th ed.). New York: McGraw-Hill.
Zeithaml, V. A., Parasuraman, A., & Berry, L. L. (1985). Problems and strategies in services
marketing. The Journal of Marketing, 49(2), 33–46.
Zineldin, M., Akdag, H. C., & Vasicheva, V. (2011). Assessing quality in higher education:
New criteria for evaluating students’ satisfaction. Quality in Higher Education, 17(2), 231–
243.
1994 group. (2010). Policy report, Analysis of postgraduate provision at UK Universities.
Retrieved from
http://www2.le.ac.uk/departments/gradschool/about/external/publications/pgprovision.pdf

277
Appendix 1... Ethical Approval

278
Appendix 2... Consent Form
Participant Consent Form / Consent Withdrawal
Full title of Project: Exploring the relation between students' satisfaction and staff
satisfaction: Salford Business School case study
Name of Researcher: Mona Nassar
Participant Identification Number for this project:
Please Initial
Box
1. I confirm that I have read and understand the information sheet dated: [ /
/2014] for the above study and have had the opportunity to ask questions.
2. I understand that my participation is voluntary and that I am free to withdraw
at any time, without giving reason.
3. I understand that my responses will be anonymised before analysis. I give
permission for members of the research team to have access to my anonymised
responses.
4. I agree to the interview being audio recorded
5. I agree to the use of anonymised quotes in publications
6. I agree to take part in the above study.
Please complete Section A or B at any one time - Thank you.
Section A. Consent Form:
Name of Participant Date Signature
Mona Nassar
Name of Researcher Date Signature
Signed consent form will be stored securely by the researcher.
Section B. Consent Withdrawal:
I withdraw my consent to participate in research outlined above. By signing below I agree
that any information given by me will not be used for the above research purpose.
Name of Participant Date Signature

279
Appendix 3... Information Sheet
Research Project Title
Exploring the relation between students' satisfaction and staff satisfaction: Salford Business
School case study
Invitation paragraph
I would like to invite you to take part in a research project. Before deciding, you need to
understand why this research is being done and what it will involve. Please take a minute to read
the following information carefully. Ask questions if anything is not clear or if you would like
more information. Take time to decide whether or not to take part.
What is the purpose of the study?
To explore the impact of students' satisfaction on academic staff satisfaction in Salford Business
School. This research study is part of my thesis for the degree of: Doctorate of Science from the
University of Salford, Salford Business School (SBS).
Why have I been invited?
The interviews will be conducted with academic staff from SBS and some of their students who
had spent at least one semester in the school. You have been invited because you can provide a
comprehensive illustration on your experience and perception on the quality of service provided
by the school.
Do I have to take part?
It is totally up to you to take part or not. In case you agree to participate, we will discuss the study
and go through the information sheet (which you will get). You will be also asked to sign a
consent form and you still have the freedom to withdraw your consent at any time without giving
any reasons.
What will happen to me if I take part?
The interview will take 20 - 30 minutes (approximately). You as an interviewee will be asked to
sign the consent form. The interview will be recorded with your permission. Your identity will be
confidential and no one other then the researcher will have access to these interviews.
What do I have to do?
During the interview, you will need to answer the questions based on your experience in SBS. You
have the right not to answer any question without giving a reason.
What will happen if I don’t carry on with the study?
You have the freedom to withdraw at any point without giving a reason. In that case, all
information and data collected from you will be destroyed.
What are the possible disadvantages or risks of taking part?
There will be no possible disadvantage or risk of taking part of this research. In case any
disadvantage or risk appeared during the interview, this should be brought immediately to

280
attention of the researcher. If you are a student, your participation will not have any impact on
your grades.
What are the possible benefits of taking part?
There will be no intended benefit for the participants in this research process, but the information
of the study will help to increase the understanding of satisfaction (for students and academic
staff).
What happens if the research study stops earlier than expected?
If the research study stopped earlier, another meeting will be scheduled based on the interviewee
convenience.
What if there is a problem?
If there is a problem or a complain regarding the study, participant can report this to the researcher
supervisor.
Will my taking part in the study be kept confidential?
All collected data will be kept strictly confidential.
Transcribed interviews will be kept in a password protected file.
All data will be kept anonymous and participants will be given a research code which is
known just to the researcher.
Under no circumstances your identity will be revealed in this report or any other
publications.
Data will be anonymously shared mostly in an aggregated format. Hard copy files will be
held securely. All raw data will be destroyed after the completion of this research.
What will happen to the results of the research project?
All data will be entirely confidential and will not be shared with any third party. The results of this
research will be available at University of Salford.
Who is organising and funding the research?
The researcher is organising this research. It is a self funded research.
Who has ethically reviewed the research project?
The research has been ethically approved via the college Research Ethics Panel (REP) of the
University of Salford and its Code of Ethics.
Contact for further information
PhD student Contact:
Mona Nassar
Salford Business School
University of Salford
Room (517), Maxwell building
Greater Manchester
United Kingdom, M5 4WT
Mobile: +44 (0) 77 06 222 540
Email: [email protected]
PhD Supervisor Contact:
Dr: Aleksej Heinze
Salford Business School
University of Salford
Room (511c), Maxwell building
Greater Manchester
United Kingdom, M5 4WT
Tel: +44 (0) 161 29 55024
Email: [email protected]

281
Appendix 4... Interview Questions
Staff Interview Questions
Research Questions Literature Interview Questions Relevant Literature
* How can PG student
satisfaction be linked to
academic staff satisfaction
and explored in relation to
Herzberg’s Motivation-
Hygiene Theory and the
Balance Theory?
- Balance Theory
- Service quality
perception
- Herzberg Theory
- Customer feedback
1. What are the factors that you consider important in evaluating service
quality at SBS? Are they provided by SBS?
2. What does management commitment to quality means to you?
3. Does the school management consider employees’ welfare? If you have a
work related problem, do you receive support? Can you rely on them if
there is a problem? Does the management consider your goals? Do they
design your job in an interesting and rewarding way? (incident)
4. Is there job specific training made by SBS? What do you think of it? Is it
effective? Was it before starting your job or after it? Did it help you to
deal with students? Do they help you through allocating money and time
for training? Are these training courses evaluated? Do you think it’s
useful? (incident)
5. Does SBS management provide financial rewards for good performance?
Is it based on students' evaluation? Is it affected by your ability to teach
and handle students’ issues? Do you receive recognition when you do a
good job? (incident)
6. Does the SBS management encourage you to handle students’ problems
(work related problems) by yourself or do you need to get management
approval first? To what degree? Do you think you need more authority?
(incident)
7. What does management commitment to quality mean to you? Is the
- Ashill et al. (2006)
- Babakus et al.
(2003)
- Cheung, M. F., &
To, W. M. (2010).
- Frey et al., (2013)
- Herzberg (1987).
- Herzberg (1989).
- Kim et al. (2009)
- Parasurman et al.,
(1985)

282
management at SBS committed to quality?
8. If you could choose, would you work in the future with any other
Business School (other than SBS)? Would you recommend SBS?
9. Overall do you think that you are satisfied with your job and the quality of
service provided by the school management?
10. Overall, does school management commitment to quality affect staff
satisfaction? How? Does SBS management committed to quality?
11. How do you assess your students' satisfaction at SBS?
12. Do you feel that your expertise is appreciated by your students at SBS?
13. Do you receive feedback from your students at SBS? What kind of
feedback is it? Can you explain?
14. What does it mean to you? How does it affect you?
15. Do you receive feedback on other colleagues from your personal tutees at
SBS?
16. Can you give me two examples for an incident where you received
feedback from a student (one positive and one negative) in SBS? How did
you feel?
17. How does it affect your satisfaction with your job?

283
Students Interview Questions
Research Questions Literature Interview Questions Relevant Literature
* How can PG student
satisfaction be linked
to academic staff
satisfaction and
explored in relation to
Herzberg’s
Motivation-Hygiene
Theory and the
Balance Theory?
- Balance Theory
- Service quality
perception
- Herzberg Theory
- Customer
feedback
- Students as HE
customers
1. What are the factors that you consider important in evaluating service
quality at SBS? Are they provided by SBS?
2. What does management commitment to quality means to you?
3. Can you describe an instance of satisfaction or dissatisfaction with the
service provided by SBS? Why?
4. What do you think about the ideal service in SBS?
5. What does management commitment to quality mean to you?
6. Overall, does commitment to quality of the SBS management affect
students’ satisfaction at SBS? How? Does SBS management committed to
quality?
7. What are the factors that you consider important in a lecturer? (incident)
8. What do you think about the accessibility of lecturer (during office hours,
outside class, i.e. emails, telephone, individual contact)? (incident)
9. What do you think about the Teaching & Communication skills of your
lecturer at SBS (well prepared, skilled, encourage participation and
questions, dynamic and energetic, hold your interest)? (incident)
10. What do you think about the friendliness & fairness of academic staff at
SBS towards students? For example, are they making students feel welcome
in seeking help? (incident)
11. What do you think about the Evaluation grades at SBS (assignments grade
influence your evaluations of the lecturer)? (incident)
12. What do you think of the tuition fees you are paying? Does it affect your
- Angell et al.,
(2008)
- Arambewela and
Hall (2009)
- Douglas et al.
(2015)
- Finney & Finney
(2010)
- Frey et al., (2013)
- Gruber et al.
(2010)
- Malhotra &
Mukherjee, 2004
- Parasurman et al.,
(1985)
- Söderlund (1998)
- Sultan and Wong
(2013)
- Voss et al. (2007)
- Zeithaml et al.,
(1993)
* How does the
marketisation affect
PG student perceptions
of HE

284
perception with the service provided? How?
13. Did this lecturer teach you before at SBS? If you have the chance to start
over, would you choose him/her?
14. Does your tutor understand your needs at SBS? (incident)
15. Overall, are you happy with your experience with your lecturer at SBS?
16. Can you give me two examples for an incident where you gave feedback to
any member of academic staff (one positive and one negative) in SBS? How
did they feel? How does it affect their satisfaction with their job?
17. Do you inform the lecturer directly or do you talk to your personal tutor?
18. What do you think about the role of tuition fees (price) in service quality at
SBS?
19. What are your expectations concerning the service provided by the SBS?
Why? On what basis did you build those expectations?

285
Appendix 5... PhD Research Map
Research map: The relation between postgraduate students' satisfaction and academic staff satisfaction: exploratory case study of Salford
Business School
Chapter 1
Research Problems:
Chapter 1
R. Questions
Chapter 2
Literature
Chapter 5
Data
Chapter 6/7
Research Contributions
Lack of literature on the
using the Balance
Theory and Herzberg’s
Motivation -Hygiene
Theory in studying PG
student feedback effect
on academic staff
satisfaction in higher
education sector
- How can PG
student
satisfaction be
linked to academic
staff satisfaction
and explored in
relation to
Herzberg’s
Motivation-
Hygiene Theory
and the Balance
Theory?
- Balance Theory
- Herzberg’s
Motivation -
Hygiene Theory
- Service quality (&
Management
commitment to
quality)
- Customer feedback
(Case of Salford
Business School).
Interviews
PTES
Staff experience
survey.
Using the Balance Theory and Herzberg’s
Motivation-Hygiene Theory in a new
setting.
Using two theories and the same set of data
to look at the same aspect, I found that one
theory supported the relation while the
other did not. According to the Balance
Theory, there is a relation between PG
student satisfaction and academic staff
satisfaction, while the Herzberg’s
Motivation - Hygiene Theory shows that
there is no relation. The Balance Theory
findings contradict the Herzberg’s
Motivation- Hygiene Theory findings in the
current case study.
Based on my interpretation, using
management commitment to quality and the

286
Balance theory, the results were not
conclusive as it assumes that there will be a
positive relation between PG student;
satisfaction and academic staff satisfaction.
Consequently, studies that use Balance
theory in this context might be questioned
and their reliability is in doubt. This
question also concludes that the method
used can determine the results of the
research. As it was highlighted; using the
same data set and two different theories
resulted in different outcomes.
Lack of literature of the
effect of tuition fees on
PG students (using
intensive teaching
mode) perception of HE.
- How does the
marketisation
affect PG student
perceptions of
HE?
- Review literature
that represents the
debate whether
students should be
considered as
customers or not.
(Case of Salford
Business School).
Interviews
Exploratory case study of commercialised
view in the service sector that is “higher
education”: confirming the increasing
perception of students as customers – even
at PG level, although there are some who
still don’t see themselves as customers. On
the other hand, university systems and
processes do not encourage staff to
recognise that students are customers, as the
rewarding and recognition system is based
on research not teaching.

287
Appendix 6... Staff Interview Coding

288
Appendix 7... Students Interview Coding