
international postgraduate research conference 2017
1075
13 TH INTERNATIONAL POSTGRADUATE RESEARCH CONFERENCE 2017 CONFERENCE PROCEEDINGS 14-15 SEPTEMBER 2017
-
Upload
khangminh22 -
Category
Documents
-
view
1 -
download
0
Transcript of international postgraduate research conference 2017

13TH INTERNATIONAL POSTGRADUATE
RESEARCH CONFERENCE 2017
CONFERENCE PROCEEDINGS
14-15 SEPTEMBER 2017

2
FOREWORD
Welcome to the 13th International Postgraduate Research Conference (IPGRC 2017) hosted
by the School of the Built Environment at University of Salford, UK. This year’s IPGRC is
organised as part of the International Research Week 2017- ‘Shaping Tomorrow’s Built
Environment: Construction and Design for the Modern World’ and also the year we celebrate
the 50th anniversary of Salford as a University, which makes this year’s conference very
special. This conference creates a unique opportunity for researchers from Salford and other
parts of the world to share their research interests, and outputs and to network and interact
within a professional and friendly environment, with high profile academics and leaders
within the built environment.
This year’s conference brings together participants from a number of countries including the
UK, USA, Australia, New Zealand, Canada, Sri Lanka, Hong Kong, Iran, Italy, Ireland,
Norway, India, Brazil, South Korea, Nigeria, Turkey, UAE, South Africa, Iraq, Ghana,
Estonia, Saudi Arabia and many more. The conference received over 100 papers and posters
covering the following themes:
• Business, Economics and Finance
• Property and Project Management
• ICT, Technology and Engineering
• People, Skills and Education
• Design and Urban Development
• Sustainability and Environmental Systems
Conference will provide a forum for novel discussions into the development and application
of new and emerging practices to challenge current design and construction practice in the
areas of people, process and technology issues. On behalf of School of the Built
Environment, the conference co-chairs and organisers, we wish you an enjoyable and fruitful
experience. We hope that you will obtain useful feedback to your research work, gain insight
from work of others and forge connections for future.
Dr. Chaminda Pathirage
Conference Chair
Director of Postgraduate Research Studies
School of the Built Environment
University of Salford
United Kingdom

3
CONFERENCE ORGANISERS
Conference Chair
Dr. Chaminda Pathirage
Conference Co-Chair
Dr. Udayangani
Kulatunga
Dr. Rod Gameson
Dr. Chika Udeaja
Dr. Yingchun Ji
Organising Committee
Dr. Claudia Trillo
Dr. Mohammad
Takhtravanchi
Dr. Belqais Allali

4
THE SCIENTIFIC COMMITTEE
Dr Belqais Allali, University of Tripoli, Libya
Dr Solomon Babatunde, University of Ibadan, Nigeria
Dr Sara Biscaya, University of Salford, UK
Dr Jiangtao Du, Liverpool John Moores University, UK
Mr Damilola Ekundayo, Oxford Brookes University, UK
Prof Fidelis Emuze, Central University of Technology, South Africa
Dr Peter Farrell, University of Bolton, UK
Dr Rod Gameson, University of Salford, UK
Prof Bob Giddings, Northumbria University, UK
Dr Anthony Higham, University of Salford, UK
Prof Bingu Ingirige, University of Huddersfield, UK
Dr Yingchun Ji, University of Salford, UK
Dr Kaushal Keraminiyage, University of Huddersfield, UK
Dr Ivan Korolija, University College London, UK
Dr Udayangani Kulatunga, University of Salford, UK
Dr Champika Liyanage, University of Central Lancashire, UK
Dr Patrick Manu, University of West of England, UK
Dr Amanda Marshall-Ponting, University of Salford, UK
Dr Athina Moustaka, University of Salford, UK
Dr Temitope Omotayo, Robert Gordon University, UK
Dr Alex Opoku, University College London, UK
Dr James Parker, Leeds Beckett University, UK
Dr Chaminda Pathirage, University of Salford, UK
Prof Srinath Perera, Western Sydney University, Australia
Dr Rameez Rameezdeen, University of South Australia, Australia
Dr Yasangika Sandanayake, University of Moratuwa, Sri Lanka
Dr Stefan Smith, University of Reading, UK
Dr Noralfish Sulaiman, Universiti Tun Hussein Onn, Malaysia
Dr Mohammad Takhtravanchi, University of Salford, UK
Dr Menaha Thayaparan, London South Bank University, UK
Dr Niraj Thurairajah, Birmingham City University, UK
Dr. Claudia Trillo, University of Salford, UK
Dr Chika Udeaja, University of Salford, UK
Dr Gayan Wedawatta, Aston University, UK
Dr Tong Yang, Middlesex University London, UK

5
KEYNOTE SPEAKERS
Professor Chris Harty – University of Reading
Chris Harty is Professor of Technology and Organisation and
Head of the School of the Built Environment at the University
of Reading. He has been the Director of two EPSRC Centres
and since 2010 has been Principal Investigator / Lead
Academic on over £3.5 million of research funding. He has
authored over 50 refereed papers, is an Editor of Construction
Management and Economics and reviewer for over 30 journals
in areas of built environment, organisation and technology
management. He is currently a visiting professor at Chalmers
University of Technology in Sweden, and was previously
Visiting Professor at Copenhagen Business School in
Denmark. Chris has internationally recognised expertise in
understanding cultural and strategic change in organisations, implementation of new
technologies and working practices, future scenario development and the connection between
physical space and working practices.
Title: The Futures of Construction Management Research
How do academic fields come about, grow and change and, more importantly, how do
researchers shape and be shaped by them? Construction management today is a well-
established academic area with departments and schools, conferences, journals, a broad
community of researchers and PhD students and a diverse range of interests. It also has a
history. One might argue that it was established in universities as a professional discipline,
and has expanded from education and practice to include multi-disciplinary research, and to
encompass researchers from a range of science, engineering and social science traditions. It
has also, perhaps, expanded from interests in the operation of construction firms and projects
to examine the effect of building and the built environment on societies and economics.
However, the landscape of universities are constantly shifting. Current trends in individual
and institutional performance measurement, new financial pressures and reprioritisation of
research funding are leading to new dynamics for us all to navigate. This keynote will begin
by outlining some of those dynamics and the effects they are having, in order to open up a
discussion of the future of construction management research. Drawing on future scenario
development, four possible futures are outlined - convergence, retrenchment, disappearance
and hybridisation. These each speculate on possible futures for the community, on the kinds
of research questions we might ask, and the research we produce.

6
Professor David Boyd – Birmingham City University
David Boyd is Professor of Construction and Director of the
Centre for Environment and Society Research, based at the
School of Engineering and the Built Environment. He teaches
on the MSc Construction Project Management course. David
has a background in engineering, but is better known for his
management insights of the industry. He has researched and
designed solar heating schemes for housing estates, as well as
developing a model of projects in the industry as complex
adaptive sociotechnical systems. He has completed research on
construction clients, which was then published as a book and
adopted by the Construction Clients’ Group. He has been PI on
funded knowledge management and expertise-in-practice
projects which explored perceptual knowledge, developing
inquiry techniques and inter-disciplinary communications
approaches. Currently, he is investigating digital construction focusing on the better use of
Building Information Modelling within practice as an engagement tool between disciplines.
Title: Problematisation in Construction in a Post Truth era
This keynote will explore the implication of the way we problematise issues in construction
research particularly in our post-truth era. Construction is particularly difficult to research as
it operates with uncertainty because of its inherent complexity and with conflicting
viewpoints because of its interdependence between multiple organisation and tasks. We, as
researchers, have a challenge about what viewpoint to adopt and what narratives to promote.
We must ask why some viewpoints are prioritised over others and the implications of this for
our results and the industry. Are we as researchers then promoting a deception and if so to
whose benefit? Thus, we, as construction researchers, need to understand the implications of
our problematisation and its implications for our methodology as part of our work.

7
TABLE OF CONTENTS
FOREWORD ...................................................................................................................... 2
CONFERENCE ORGANISERS ............................................................................................... 3
THE SCIENTIFIC COMMITTEE ............................................................................................. 4
KEYNOTE SPEAKERS .......................................................................................................... 5
TABLE OF CONTENTS ........................................................................................................ 7
Business, Economics and Finance .................................................................................... 14
ID 035............................................................................................................................. 15 CRITICAL REVIEW OF THE SUCCESS FACTORS OF STRATEGIC ALLIANCES IN THE UK CONSTRUCTION INDUSTRY .............................................................................................................................. 15
ID 040............................................................................................................................. 27 ENTERING NEW INTERNATIONAL CONSTRUCTION MARKETS – LESSONS FROM NEW ZEALAND ... 27
ID 068............................................................................................................................. 38 MARKET SHARES DISTRIBUTION AND COMPETITIVENESS OF CONSTRUCTION FIRMS IN NIGERIA 38
ID 095............................................................................................................................. 48 A RESEARCH FRAMEWORK FOR EFFECTIVE RISK MANAGEMENT IN PUBLIC-PRIVATE PARTNERSHIP (PPP) INFRASTRUCTURE PROJECTS IN PAKISTAN ....................................................................... 48
ID 132............................................................................................................................. 61 TARGET COST CONTRACTS AND THE DEVELOPMENT OF COLLABORATIVE BEHAVIOURS AND VALUE FOR MONEY IN THE UK CONSTRUCTION INDUSTRY ........................................................ 61
ID 133............................................................................................................................. 75 CASE STUDY AS RESEARCH STRATEGY FOR INVESTIGATING BARRIERS TO ACHIEVEMENT OF VALUE FOR MONEY IN NIGERIAN PUBLIC CONSTRUCTION PROCUREMENT ........................................... 75
ID 139............................................................................................................................. 85 SCALING UP HOUSING MICROFINANCE FOR INCREMENTAL BUILDING A CASE STUDY OF MICROFINANCE BANKS IN NIGERIA .......................................................................................... 85
ID 146............................................................................................................................. 98 FACTORS LEADING TO THE RENEGOTIATION OF PRIVATE FINANCE INITIATIVE (PFI) DESIGN-BUILD-FINANCE-OPERATE (DBFO) ROAD PROJECTS IN THE UK ............................................................. 98
Design and Urban Development ................................................................................... 109
ID 020........................................................................................................................... 110 SAUDI HOUSING POLICIES AND PROGRAMS: A REVIEW OF THE PAST AND PRESENT IN LIGHT OF THE 2030 VISION .................................................................................................................. 110
ID 052........................................................................................................................... 121 CRITERIA FOR PUBLIC SCHOOL CONSTRUCTION IN POLLUTED ENVIRONMENT: A CASE OF THE NIGER DELTA AREA OF NIGERIA ............................................................................................. 121
ID 053........................................................................................................................... 133 STRATEGY OF DEVELOPING A DIGITAL TOOL FOR COLLABORATIVE CONCEPT DESIGN ............... 133
ID 084........................................................................................................................... 142 MICRO TO MACRO; UTILIZATION OF THE ARCHITECTURAL DRESS FOR THE FLOW OF URBAN SPACES ................................................................................................................................ 142

8
ID 116........................................................................................................................... 151 TOWARDS SOCIO-CULTURAL SUSTAINABILITY IN DESERT DWELLING DESIGN IN SOUTHWEST LIBYA............................................................................................................................................ 151
ID 119........................................................................................................................... 168 CHANGES IN ARCHITECTURAL DESIGN PROCESS IN THE DIGITAL AGE: RECENT PHENOMENA AND FUTURE POTENTIAL OF COMPUTATIONAL DESIGN ................................................................. 168
ID 129........................................................................................................................... 182 MANAGING CHALLENGES TO LOCAL CULTURE IN CONSTRUCTION: PRESERVING ARCHITECTURAL IDENTITY IN THE CITY OF BASRA ............................................................................................ 182
ICT, Technology and Engineering .................................................................................. 195
ID 037........................................................................................................................... 196 EFFICIENT RE-DESIGN OF CONTINUOUS CONCRETE-STEEL COMPOSITE BEAMS ........................ 196
ID 077........................................................................................................................... 210 FACTORS IMPACTING BUILDING INFORMATION MODELLING (BIM) IMPLEMENTATION IN COST MONITORING AND CONTROL ................................................................................................ 210
ID 099........................................................................................................................... 225 DEVELOPMENT OF A BIM AND BARCODE BASED MATERIAL MANAGEMENT SYSTEM FOR CURTAIN WALL INDUSTRY ................................................................................................................... 225
ID 100........................................................................................................................... 236 BIOMECHANICAL TESTING OF ERGONOMIC INTERVENTIONS FOR REBAR TYING ....................... 236
ID 111........................................................................................................................... 245 BUILDING INFORMATION MODELLING (BIM) EDUCATIONAL FRAMEWORK FOR THE QUANTITY SURVEYING STUDENTS: SRI LANKAN PERSPECTIVE .................................................................. 245
ID 122........................................................................................................................... 257 A BIM MATURITY-KPI ASSESSMENT: LITERATURE REVIEW ....................................................... 257
ID 128........................................................................................................................... 271 LIBYAN HIDDEN GEMS: VERNACULAR ARCHITECTURE ON THE NAFUSA MOUNTAINS ............... 271
ID 142........................................................................................................................... 283 A CRITICAL REVIEW OF THE PERCEPTION, AWARENESS AND IMPLEMENTATION OF THE LEVEL 2 BUILDING INFORMATION MODELLING (BIM) REQUIREMENTS BY THE UK AEC INDUSTRY .......... 283
ID 143........................................................................................................................... 295 CLOUD COMPUTING FOR DISASTER RESPONSE MANAGEMENT STEMMING FROM TERRORISM IN IRAQ .................................................................................................................................... 295
People, Skills and Education ......................................................................................... 307
ID 005........................................................................................................................... 308 POSITIONING COST OVERRUN RESEARCH IN THE PHILOSOPHICAL DEBATE: A CASE FOR CRITICAL REALISM .............................................................................................................................. 308
ID 023........................................................................................................................... 317 UTILIZING INNOVATION POTENTIALS ON CAMPUS OUTDOORS: FOR THE DEVELOPMENT OF THE UNIVERSITY OF SALFORD ...................................................................................................... 317
ID 039........................................................................................................................... 332 BUSINESS INTELLIGENCE AND CULTURAL CHANGE IN SOCIAL HOUSING ................................... 332

9
ID 051........................................................................................................................... 343 A THEORETICAL MODEL FOR BUILT ENVIRONMENT PRACTITIONER RESEARCH AT DOCTORAL LEVEL............................................................................................................................................ 343
ID 083........................................................................................................................... 355 ENHANCING NURSE LEADERSHIP THROUGH RESEARCH, EDUCATION AND TRAINING ............... 355
ID 087........................................................................................................................... 363 A COMPARISON OF UK AND CHINESE HEALTH AND SAFETY CULTURE IN CONSTRUCTION ......... 363
ID 107........................................................................................................................... 372 TECHNICAL AND VOCATIONAL SKILLS GAP IN THE NIGERIAN CONSTRUCTION INDUSTRY: A LITERATURE REVIEW ............................................................................................................. 372
ID 121........................................................................................................................... 382 EDUCATION MISMATCH OF UNIVERSITY GRADUATES WITH LABOUR MARKET REQUIREMENT IN LIBYA CONSTRUCTION SECTOR .............................................................................................. 382
ID 134........................................................................................................................... 391 THE IMPACT OF NATIONAL CULTURE ON DISPUTE RESOLUTION: A LITERATURE REVIEW IN THE CONTEXT OF STATUTORY ADJUDICATION IN THE CONSTRUCTION INDUSTRY ........................... 391
Property and Project Management ............................................................................... 402
ID 004........................................................................................................................... 403 THE NOMENCLATURE OF GEOTECHNICAL ERROR TRAPS AS A THEORETICAL FRAMEWORK FOR ASSESSING FINANCIAL RISK IN TRANSPORTATION INFRASTRUCTURE PROJECTS ....................... 403
ID 009........................................................................................................................... 415 EXAMINING AND MAPPING THE BIDDING PROCESS OF IRAQI QUASI-GOVERNMENTAL CONSTRUCTION COMPANIES ................................................................................................ 415
ID 017........................................................................................................................... 428 THREE PERSPECTIVES OF PUBLIC SECTOR CONSTRUCTION PROJECT CULTURE: AN EXPLORATORY CASE STUDY IN SRI LANKA ..................................................................................................... 428
ID 018........................................................................................................................... 442 A THEORETICAL TRANSFORMATIONAL ORGANISATIONAL FRAMEWORK TO IMPROVE IRAQI QUASI-GOVENMENTAL CONSTRUCTION COMPANIES’ PERFORMANCE .................................... 442
ID 024........................................................................................................................... 456 THE USE OF OFFSITE CONSTRUCTION METHOD TO RECONSTRUCT IRAQ .................................. 456
ID 034........................................................................................................................... 466 EVALUATING DISASTER RESPONSE MANAGEMENT STEMMING FROM WAR OPERATIONS AND TERRORISM IN IRAQ: A METHODOLOGICAL APPROACH .......................................................... 466
ID 038........................................................................................................................... 478 THE NEED FOR THE RECONSTRUCTION OF AFFORDABLE HOUSING FOR THE INTERNALLY DISPLACED PEOPLE DUE TO CONFLICT IN NIGERIA: A LITERATURE REVIEW .............................. 478
ID 045........................................................................................................................... 488 KEYS ELEMENTS OF EFFICIENCY OF LAND TENURE SECURITY AND PROPERTY’ RIGHTS .............. 488
ID 048........................................................................................................................... 504 STAKEHOLDERS RESPONSIBILITIES’ FOR TIME OVERRUN RISKS OF HIGHWAY PROJECTS IN TERRORISM AFFECTED AREAS ............................................................................................... 504
ID 059........................................................................................................................... 516

10
PERFORMANCE MEASUREMENTAND MANAGEMENT IN CONSTRUCTION: A CONCEPTUAL FRAMEWORK ....................................................................................................................... 516
ID 060........................................................................................................................... 529 ASSESSING THE SAFETY CLIMATE IN GHANA’S UPSTREAM OIL AND GAS SECTOR ...................... 529
ID 064........................................................................................................................... 542 DEVELOPMENT OF A FRAMEWORK TO IMPROVE MATERIALS MANAGEMENT ON LIBYAN CONSTRUCTION PROJECTS .................................................................................................... 542
ID 073........................................................................................................................... 552 THE POTENTIAL OF BIM FOR STAKEHOLDER MANAGEMENT IN INFRASTRUCTURE PROJECTS .... 552
ID 085........................................................................................................................... 564 THE EVOLUTION OF ETHICS IN THE IRISH REAL ESTATE PROFESSION ........................................ 564
ID 089........................................................................................................................... 576 A PHENOMENOLOGICAL STUDY ON DECISION MAKING UNDER UNCERTAINTY IN REAL ESTATE INVESTMENTS IN SUB-SAHARAN AFRICA - A CRITICAL REVIEW OF LITERATURE ........................ 576
ID 104........................................................................................................................... 584 HOW PROJECT MANAGEMENT OFFICE (PMO) CAN BE USED TO IMPROVE BUSINESS PERFORMANCE AND CONSTRUCTION PROJECT SUCCESS ........................................................ 584
ID 106........................................................................................................................... 597 HOW PROJECT MANAGEMENT OFFICE (PMO) CAN BE ESTABLISHED IN THE SAUDI ARABIAN CONSTRUCTION ORGANISATIONS.......................................................................................... 597
ID 114........................................................................................................................... 609 CONSTRUCTION MANAGERS’ CULTURAL ORIENTATION IN NIGERIA ......................................... 609
ID 115........................................................................................................................... 624 TOWARDS A STAKEHOLDER RELATIONSHIP MANAGEMENT MODEL FOR CONSTRUCTION SMES IN BOTSWANA: AN EXPLORATORY STUDY .................................................................................. 624
ID 120........................................................................................................................... 637 A QUANTIFIABLE METHOD OF ASSESSING THE RISK OF SELECTING THE LOWEST BIDDER IN CONSTRUCTION PROJECTS: A LITERATURE REVIEW ................................................................ 637
ID 127........................................................................................................................... 647 AN INTEGRATED BIM-IBS MODEL FOR IMPROVING PRODUCTIVITY IN CONSTRUCTION ............. 647
ID 131........................................................................................................................... 658 THE HOUSE BUILDING SECTOR: ARE CUSTOMERS CORE TO THE HOUSE BUILDING PROCESS OR JUST AN INCONVENIENCE? .................................................................................................... 658
ID 137........................................................................................................................... 668 KEY SUCCESS FACTORS OF TOTAL QUALITY MANAGEMENT AND EMPLOYEES PERFORMANCE IN IRAQI OIL INDUSTRY ............................................................................................................. 668
ID 138........................................................................................................................... 680 THE EFFECTIVINESS OF PROJECT RISK MANAGEMENT: A STUDY WITHIN THE LIBYAN OIL AND GAS INDUSTRY ............................................................................................................................ 680
ID 140........................................................................................................................... 692 A STUDY OF BARRIERS TO ACHIEVEMENT OF VALUE FOR MONEY IN PUBLIC CONSTRUCTION PROJECTS PROCURED UNDER THE NIGERIAN PUBLIC PROCUREMENT ACT (2007) .................... 692
ID 145........................................................................................................................... 705

11
AN ASSESSMENT OF CRITICAL SUCCESS FACTORS FOR IMPLEMENTATION OF CRITICAL INFRASTRUCTURE PPP PROJECTS IN GHANA........................................................................... 705
ID 147........................................................................................................................... 718 EXAMINING THE KEY LEADERSHIP ATTRIBUTES THAT LEAD TO SUCCESSFUL DELIVERY OF COMPLEX CONSTRUCTION PROJECTS IN THE UK .................................................................................... 718
ID 148........................................................................................................................... 730 THE NEED FOR QUALITY CULTURE IN IRAN’S OIL AND GAS PROJECTS: A CRITICAL REVIEW ........ 730
ID 160........................................................................................................................... 741 EXPLORING THE EFFECTS OF PERFORMANCE MEASUREMENT PRACTICES IN OIL AND GAS PIPELINE MAINTENANCE ..................................................................................................................... 741
Sustainability and Environmental Systems .................................................................... 753
ID 010........................................................................................................................... 754 IMPROVING THE REGULATORY FRAMEWORK OF FLOODPLAIN MANAGEMENT AND DEVELOPMENT IN THE UNITED KINGDOM ............................................................................. 754
ID 011........................................................................................................................... 762 IMPROVING PRODUCTIVITY OF ROAD SURFACING OPERATIONS BY USING VALUE STREAM MAPPING AND DISCRETE EVENT SIMULATION ........................................................................ 762
ID 029........................................................................................................................... 773 SUSTAINABLE BUILDINGS AND POST-OCCUPANCY EVALUATION: AN END-USER BEHAVIOR BASED APPROACH FOR CERTIFIED OFFICE BUILDINGS ....................................................................... 773
ID 032........................................................................................................................... 786 CLIMATE CHANGE RISK ON INFRASTRCTURE AND POLICY IMPLICATIONS OF APPROPRIATE MITIGATION MEASURES IN THE NIGERIAN AGRICULTURAL SECTOR ......................................... 786
ID 041........................................................................................................................... 798 TOWARDS A CONCEPTUAL INTEGRATED FRAMEWORK FOR SUSTAINABLE RURAL DEVELOPMENT PROJECTS IN NIGERIA ........................................................................................................... 798
ID 042........................................................................................................................... 809 TECHNOLOGICAL INNOVATION AND FACILITIES MANAGEMENT PRACTICE: IMPLICATIONS FOR SOCIAL SUSTAINABILITY ........................................................................................................ 809
ID 044........................................................................................................................... 822 THE ROLE OF HUMAN ERROR IN ACCIDENTS WITHIN OIL AND GAS INDUSTRY IN BAHRAIN ....... 822
ID 063........................................................................................................................... 835 CHANGE MANAGEMENT IN PUBLIC AGENCIES TO ATTAIN EFFICIENCIES .................................. 835
ID 071........................................................................................................................... 844 HOUSING AND URBAN REGENERATION: HONING AN EXISTING ASSESSMENT METHOD THROUGH THE DESIGN SOCIENCE METHODOLOGY ................................................................................. 844
ID 086........................................................................................................................... 860 IMPORTANCE OF COMMUNITY PARTICIPATION IN DISASTER RECOVERY .................................. 860
ID 093........................................................................................................................... 870 SUSTAINABLE BUILDING CONSTRUCTION PRACTICES IN LAGOS STATE, NIGERIA ....................... 870
ID 109........................................................................................................................... 881 MOBILITY AND ACCESS TO TRANSPORTATION FOR THE RURAL POOR: EXAMINING THE ROLE OF INTERMEDIATE MEANS OF TRANSPORT (IMTS) IN GHANA ...................................................... 881

12
ID 112........................................................................................................................... 891 ADAPTING SUSTAINABILITY IN PALESTINE; BARRIERS AND MOTIVATORS IN THE IMPLEMENTATION OF GREEN ARCHITECTURE ..................................................................................................... 891
ID 113........................................................................................................................... 902 RATING THE COMPONENTS OF INDOOR ENVIRONMENTAL QUALITY IN STUDENTS CLASSROOMS IN WARM HUMID CLIMATE OF ULI, NIGERIA .......................................................................... 902
ID 125........................................................................................................................... 915 THE DEVELOPMENT OF PERFORMANCE SPECIFICATIONS TO PREDEFINE THE NEEDS OF REFUGE DWELLINGS IN HOT DRY CLIMATES ........................................................................................ 915
ID 126........................................................................................................................... 926 ENHANCING DISASTER RISK TRANSFER AND SHARING IN THE BUILT ENVIRONMENT THROUGH CONSTRUCTION CONTRACTS ................................................................................................. 926
ID 130........................................................................................................................... 936 NATURAL HAZARDS AND BUILDING SKIN: SYSTEMATIC LITERATURE REVIEW ........................... 936
MAPS-LED .................................................................................................................... 948
ID 046........................................................................................................................... 949 TOWARDS A NOVEL FRAMEWORK OF KEY PERFORMANCE INDICATOR FOR MEASURING THE MPACTS OF SMART CITIES IN EMERGING ECONOMIES ............................................................ 949
ID 069........................................................................................................................... 964 ON EMERGING CIVIC SPACES’ ROLE IN INNOVATIVE LOCAL SOCIO-ECONOMIC DEVELOPMENT, RIACE AS A CASE ................................................................................................................... 964
ID 072........................................................................................................................... 974 FROM BROWN-FIELDS TO INNOVATION DISTRICTS: A COMPREHENSIVE APPROACH TO SUSTAINABILITY.................................................................................................................... 974
ID 076........................................................................................................................... 990 PRODUCTIVE STRUCTURE AND SPATIAL INEQUALITIES: THE ROLE OF INNOVATIVE CLUSTERS ... 990
ID 079......................................................................................................................... 1003 PUBLIC-PRIVATE PARTNERSHIPS FOR THE KNOWLEDGE ECONOMY: THE CASE OF INNOVATION CENTERS ............................................................................................................................ 1003
ID 094......................................................................................................................... 1015 CLUSTERS IN DESIGNING S3-ORIENTED POLICIES .................................................................. 1015
ID 101......................................................................................................................... 1028 A FOURTH WAY: CULTURAL HERITAGE AS THE KEY TO UNLOCKING SUSTAINABLE PLACE-DRIVEN INNOVATION ...................................................................................................................... 1028
ID 135......................................................................................................................... 1040 THE URBAN DIMENSION OF INNOVATION POLICY: ROXBURY INNOVATION CENTER ............... 1040
ID 162......................................................................................................................... 1054 GREEN ECONOMY AS A DRIVER FOR URBAN REGENERATION: INSIGHTS FROM GREENTOWN LABS, USA ................................................................................................................................... 1054
POSTERS ..................................................................................................................... 1065
ID 153......................................................................................................................... 1066 CRITICAL REVIEW OF OCCUPATIONAL ACCIDENTS DATA AND STATISTICS IN OIL AND GAS INDUSTRY IN BAHRAIN ........................................................................................................ 1066

13
ID 154......................................................................................................................... 1067 STATISTICS ABOUT TERRORIST OPERATIONS IN IRAQ ............................................................ 1067
ID 155......................................................................................................................... 1068 MAPPING STREAM FLOW CHANGES AND ITS IMPLICATIONS ON IRRIGATION INFRASTRUCTURE IN AGRARIAN COMMUNITIES OF NIGERIA ................................................................................ 1068
ID 156......................................................................................................................... 1069 DEVELOPMENT OF A RESILIENCY FRAMEWORK FOR CRITICAL INFRASTRUCTURE IN EXTREME WEATHER EVENTS .............................................................................................................. 1069
ID 157......................................................................................................................... 1070 CHALLENGES FACED THE UK CONSTRUCTION INDUSTRIES, THE MOTIVATION, BENEFITS OF ADOPTING OF STRATEGIES ALLIANCES STRATEGY ................................................................. 1070
ID 158......................................................................................................................... 1071 BUSINESS MODEL INNOVATION FOR THE DELIVERY OF SUSTAINABLE HOUSING IN THE KINGDOM OF SAUDI ARABIA ............................................................................................................... 1071
ID 159......................................................................................................................... 1072 RE-INTERPRETATION OF THE CONTEXTUAL VALUES INNOVATIVE CAMPUS OUTDOORS AS A PLATFORM FOR ENHANCING STUDENT EXPERIENCE IN UK HIGHER EDUCATION SECTOR ........ 1072
ID 161......................................................................................................................... 1073 THE RELATIONSHIPS BETWEEN TRAVEL PATTERNS AND URBAN LANDUSE: REALISING THE 21ST CENTURY GAZA CITY? ......................................................................................................... 1073
ID 163......................................................................................................................... 1074 THE CHALLENGES TOWARDS PROVIDING AFFORDABLE HOUSING TO THE INTERNALLY DISPLACED PEOPLE IN MAIDUGURI, NIGERIA ......................................................................................... 1074

14
BUSINESS, ECONOMICS AND FINANCE

15
ID 035
CRITICAL REVIEW OF THE SUCCESS FACTORS OF STRATEGIC
ALLIANCES IN THE UK CONSTRUCTION INDUSTRY
W. Hameed and C. Abbott
School of the Built Environment, University of Salford, Salford, M5 4WT, UK
Email: [email protected]
Abstract: With an increasingly competitive environment in the world and in the UK
particularly, industries that are operating today face many complex technological challenges
with regards to both hard and soft systems. Consequently, skills and knowledge are required,
that are better accessed by firms through strategic alliances, which allow individual firms to
jointly leverage their comparative advantages to gain an edge. This has now become a
fundamental business strategy in several industries, where individual firms that are less
competitive are forming strategic alliances to compete. In other industries, the resource-based
and transaction cost theories show that strategic alliances are insufficient; when assets and
capabilities are acquired and where internal contracts and investment are not efficient. Due to
the lack of empirical data in this field particularly regarding strategic alliances in the UK, this
paper provides a critical literature review that discusses the nature of strategic alliances in
general and aims to identify the theoretical factors that influence alliance success in
construction. These factors are divided into five categories: trust, commitment, knowledge
sharing, communication & IT technology and dependency. This research, therefore, identifies
the fundamental success factors of strategic alliances, through a systemic examination of a
strategic alliance literature review. It is intended to further test these factors in a range of case
studies.
Keywords: Strategic alliances, Construction, Trust, Commitment, Knowledge Sharing.
1. INTRODUCTION
Over the previous two decades, inter-organisational collaborative arrangements have
increased as a means of improving a firm’s competitive advantage. Companies are focusing
on the essential activities of providing good quality products and services through the
formation of strategic alliances with suppliers and customers (Sambasivan et al., 2013).
Strategic alliances have received attention in previous studies, mainly on how alliances are
providing rare and valuable resources, as well as knowledge and skills, that are critical for a
firm’s survival and growth (Nielsen, 2007). Strategic alliances are considered an important
way to quickly develop success strategies and maximise shareholder equity. Thus, research
and development strengths could be integrated to obtain external resources and skills, leading
to the development and implementation of successful external strategies, which may have a
positive or negative effect on a firm’s performance (Lin et al., 2011). As a result, the strategic
cooperative perspective represents strategic alliances as an alternative mechanism to market
strategies, as well as exploring the system of hierarchies amongst firms for tackling specific
strategic requirements (Williamson, 1991, Nielsen, 2007).
There are many reasons behind a firms desire to establish strategic alliances (Gulati, 1998).
For instance, cutting edge information and communication technology have created
opportunities for cooperative business activities. Also, a challenging competitive
environment has led firms to form alliances, because if firms operate alone, they may incur
significant costs and generate low value. Hence, through cooperation, firms can increase

16
effectiveness and speed up innovation processes leading to greater market share and success
(Tariq, 2012, Stuart, 2000). Furthermore, the main motivator for establishing strategic
alliances is to cooperate and explore the possibility of mixing together compatible assets
owned by different firms. In addition, alliances may be created when one company has
strengths in different operational stages, such as in the product’s value chain or when trying
to share competitive risk (Stuart, 2000).
However, many researchers have stated that the percentage of strategic alliances failing has
increased by more than 50% around the world (Sambasivan et al., 2013, Dyer et al., 2001,
Das and Rahman, 2010, Sivadas and Dwyer, 2000). To overcome this high rate of failure in
strategic alliances, a better understanding is required of what the factors are, that are
necessary for successful strategic alliances (Sambasivan et al., 2013). In fact, when firms are
establishing alliances, they can possibly engage with unqualified partners, which can lead to
potential opportunistic behaviour, eventually leading to a loss of specific assets (Gaur et al.,
2011).
Noticeably, literature on the strategic alliance of construction industries in the UK has already
been somewhat covered. For example, according to (Ingirige and Sexton, 2006), alliances in
the construction industry can be used as an instrument to assure a sustainable competitive
edge. With studies focusing on the challenge of generalising and preserving the perspective
of alliances in the long-term, to improve the environment of projects. Moreover, (Black et al.,
2000) have tried to expand the literature on partnerships, by analysing empirical success
factors and benefits. Concentrating on how working together to achieve partnership targets
within an environment of trust helped realise the project sufficiently, without any
opportunistic behaviour or conflict. It also increased end-customer satisfaction for all parties
contributing in an alliance that strived to fulfil success (Mohr and Spekman, 1994).
This paper aims to provide a background study regarding the concept of strategic alliances in
general as well as the factors for successful strategic alliances. It particularly concentrates on
factors that encourage successful strategic alliances within the UK.
2. STRATEGIC ALLIANCES OVERVIEW
The number of strategic alliances has increased dramatically since the late 1970s, specifically
in technological industries, where they have been increasingly used as a means to manage the
practical risks and improve market performance (Lee et al., 2010). Additionally, alliances
could help achieve success in environmental instability through the sharing of crucial
information among partners, by identifying reciprocal responsibilities, control partnership
implementation, and assessing the outcome of the alliance (Li et al., 2013). To realise the
concept of strategic alliances, many researchers in the literature review have defined this
concept. For instance, Das and Teng (1998) define strategic alliances as inter-organisational
collaborative arrangements, whose purpose is to achieve the strategic targets of partners. In a
similar way, Li et al. (2013) state that strategic alliances are facilitating access to partner
resources, to absorb sufficient knowledge, as well as maintaining and developing abilities, by
combining skills with their partners in order to minimise costs that appear from cooperative
risks.
Furthermore, Nielsen and Nielsen (2009) agree with the view that a function of strategic
alliances is generating realisation for the managers within the alliance to improve their

17
capabilities. This can be achieved by providing better products and services with the
possibility of obtaining access to partner technology, or effective skills and knowledge
portfolios. Also, (Chen et al., 2015, Chan et al., 1997) indicate that strategic alliances can be
defined when two or more firms cooperate, involving a partnership through agreement ,which
identifies sharing resources in production, marketing, and IT technologies. Thereby
benefiting from mutual participation for all partners. More specifically, strategic alliances are
considered as a type of dynamic capability that supports firms with external resources, which
otherwise would have been missed (Ma et al., 2012).
Notably, López-Duarte et al. (2016) point out that strategic alliances identified as a field, are
a fundamental area to study, as they explore alliances within both international management
and international business research. This study will be aligned with the definition of strategic
alliances being generic and relevant to the plan, where (Yasir Yasin and Maqsood Ahmad,
2013) state that strategic alliances are a purposive partnership between two or more
independent firms working together and trying to achieve strategic objectives for mutual
benefit through sharing, co-development, exchange of resources and capabilities.
In other words, cooperative alliances work as an incentive for partners to increase trust and
commitment by providing other members with resources for maintaining the relationship. As
well as reducing the competitive level among partners, in turn leading to an enhanced feeling
of trust and a higher commitment to work together. Indeed, collaborative firms have found
alliances to be a good step towards maintaining lower overall costs, as well as obtaining
greater trust internally between workers (Holt et al., 2000). Thus, Furrer et al. (2012) indicate
that strategic alliances can be considered as a mixed motivator venture in which partners
simultaneously collaborate and compete.
In fact, the researcher is aligned with the discussion mentioned above, that strategic alliances
could appear as an instrument in which supporting partners are united together by various
advantages such as lower costs, resource distribution, sharing significant knowledge and
enhancing the spirit of trust and commitment. In addition, it plays a significant role in
growing the needs of competition, to establish the spirit of innovation among workers
throughout the alliance. Thereby in this study, strategic alliances will be defined as a
horizontal collaborative agreement among two or more firms working at a similar level,
aimed at enhancing the joint development of processes, services, operation, and distribution
products.
3. STRATEGIC CONSTRUCTION ALLIANCES
When reviewing the literature on construction alliances, there are several principles which
have been noted. For instance, (Bennett and Jayes, 1998) demonstrate that partnerships
within construction industries have three testified stages, each of which is partially different
in concept due to their evolution. While most researchers in construction have taken the
principle of “partnering” to represent an alliance within the supply chain, concept of
“strategic partnering”, “alliance” and “strategic alliance” are also utilised in describing such
relationship. Additionally, many of the researchers and empirical studies demonstrate that
strategic alliances in construction can provide a lot of benefits to all stakeholders. Such as
those involved in a project, fundamentally due to its ability to change following adversarial
behaviour among partners. It has emerged as an essential strategy for avoiding opportunistic

18
and conflict relations among partners, as well as enabling / or guiding those who are seeking
a strategy for long-term relationships and commitments.
However, the application strategy of strategic alliances is different from project partnering.
The latest theory of strategic alliances concludes that achievement of alliance targets and
project performance are the main goals, while the former model concentrates on opening the
scope for a consistent relationship between involved partners. Therefore, the strategy of
alliances can be considered as process-oriented, and project partnering as result-oriented.
Regarding the rethinking of construction, (Egan, 1998) expresses that alliances and
organisational learning are the main mechanism for developing the performance and
competitiveness of firms within construction industries. While, knowledge sharing is
undoubtedly a way to fulfil competitive advantage. Thereby this component should be
incorporated as a core mechanism of strategic alliances.
According to (Kululanga et al., 2001) there are two underlying principles of organisational
learning:
1- The knowledge which is generated and or imbibed considers results through a
learning process produced in both internal and external business environments.
2- Application of knowledge is maintained to continuously improve alliance
performance.
Aligned with these facts, most of the researchers in construction take the term of alliance as
reciprocal relationships within the supply chain. In general, alliances or strategic alliances
work to empower the relationships between stakeholders via respect, commitment, trust,
teamwork, knowledge sharing, communication and shared goals. These relationships are
usually determined through good faith in alliance rules, rather than a formal contract. (Cheng
et al., 2004) state that alliances within construction usually create an informal climate rather
than formal relations.
The fundamental reason for using a strategic alliance is to fit the targets of engaged partners,
which are involved with various incentives and benefits. There is an even more important
belief that an alliance should lead to worthwhile jobs for the partners, and quality and time
completion for the owner. This might be the essential reason for partners involved to consider
utilising it. (Cheng et al., 2004) illustrate that strategic alliances in construction should aid
engaged companies to earn actual benefits within the project, and corporate levels. These
benefits include decreased risks, developed quality, reduced cost, decreased rework, provided
market share, increased profits, improved competitive position, enhanced opportunity of
innovation, developed labour productivity and efficiency.
Furthermore, to enhance these incentives and benefits within the alliance, partners should be
involved in sharing experiences and skills. While, top management should support these
parties by making the execution of an alliance smooth. Ensuring that all partners should be
willing to contribute within the alliance as the effort will not be worthwhile without the
support of top management. Meanwhile, the main obstacles of alliances are known to be
inappropriate technological knowledge, lack of training programmes, conflict, and
opportunism (Lu and Yan, 2007).

19
However, the success of a strategic alliance within construction does not only depend on
suitable top management but can also be enhanced via the accomplishment of a current
approach such as TQM. (Schultzel and Unruh, 1996) believe that allied organisations should
provide a unique contribution to all parties and that construction companies should
understand the ability to satisfy the demands of a project which is planned. Thus, the
familiarity of knowledge and skills are an essential base for alliance success, with those who
have these experiences preferable to those without or lacking when faced with partner
selection. Meanwhile, a whole chain of projects can be provided by large developers in order
to facilitate long-term collaboration between partners and this can help promote the success
of alliance use (Wong and Cheung, 2004).
Moreover, (Egan, 1998) focuses on some major clients of the British Airport Authority and
the relationships among objectives of organisations, stating that capabilities are the main
incentive for alliance success. While, (Cheng and Li, 2002) provide a framework of
management skills and contextual characteristics that can be used to identify critical success
factors for a construction alliance. Stressing that alliance can become more successful using
proper management mechanisms, which involve alliance tools and individual measures.
Thus, to achieve alliance success, the owners of allied organisations should formulate a
process of partner forming, which may include the following steps: (1) ensure partners are
willing to participate within the alliance, (2) select a facilitator, (3) determine who will
participate within alliance workshop, (4) schedule the alliance workshop, (5) choose and
provide materials, (6) prepare the agenda and hold the workshop.
4. MOTIVATION FOR FORMATION OF STRATEGIC ALLIANCES
Many firms are using strategic alliances to exchange resources, share risks, respond quickly
to environmental changes, accelerate technological advancement, and obtain access to global
markets (Yasuda, 2005). Hence, strategic alliances could also be understood to have, in some
instances, a sharing arrangement among partners to learn and obtain skills with knowledge
that was not available within these firms otherwise (Chen and Chen, 2002). Nonetheless,
many scholars have argued regarding the importance of strategic alliances and what the
motivation is for firms to form these alliances.
For example, Das and Teng (2000) identify that alliances are usually formed following two
theories that are: resource-based and transaction cost. According to the resource-based view,
firms engage within alliances rationally with the aim to enhance and maximise their value
through pooling and utilising valuable resources and skills as an alternative strategy for firms
to gain access to another firm’s resources. On the other hand, the transaction-cost theory
states that firms target each other to minimise the total of transaction costs, production cost,
and the sum of fixed costs via ownership decision centres (Yasuda, 2005).
Das and Teng (1998) argue that there are many reasons behind the formation of alliances.
According to the resource-based view, the essential motivation pushing firms to form
alliances is to maximise profit in the long-term. While, the fundamental reason leading to
instability in alliances is the limitation of resources by partners. On the other hand, the
transaction-cost view points out that the main motivation of constituting alliances is that it
optimises and economises transaction costs and the primary reason behind the instability in
alliances is the opportunistic behaviours of partners.

20
Meanwhile, (Chen and Chen, 2002) argue that there are three important motivations behind
the formation of alliances:
1- Huge transaction costs resulting from the small amount of bargaining accrued between
partners.
2- A strategic attitude that targets the supporting firm’s competitive position or market
power.
3- A search to find organisational knowledge and skills or try to learn and acquire critical
knowledge by partners from others.
According to the network theory, the essence of strategic alliances is to make formal
relationships among partners to manage and facilitate a continuing exchange of resources.
This is because no firm can be considered as self-contained, so that they do not collaborate
with other firms in some way or form. Hence, strategic alliances are considered a remarkable
solution with a long-term need (Chen and Chen, 2002). Moreover, Vyas et al. (1995)
categorise the following points as possible motivation for the formation of strategic alliances:
- Distribution Channels (going around entry barriers).
- Synergy (to pool resources, increase efficiency, share expertise, reduce cost, increase
market share and become more competitive).
- Diversification (to reduce/share risk, gain access to new market segments), and
- Sourcing Raw Material.
To summarize the discussion above, the main goal of establishing strategic alliances is to
pool resources among partners, to fill gaps in their strategies and achieve their objectives. In
addition to sharing tacit and explicit knowledge between partners of the alliance that could
improve innovation skills and technologically develop the firm’s capabilities to enter new
markets.
5. BENEFITS OF FORMING STRATEGIC ALLIANCES
Many researchers have referred to the benefits of alliance formation and the resulting
valuable feedback on the firm’s performance and attributes. Lee et al. (2010) state that
strategic alliances may change the evolution of the firms entirely and enhance their strategic
position between other competitors through the sharing of overall costs and risks among
partners. As well as improving innovation skills by supporting the spirit of competition
among employees, obtaining access to innovative technologies and markets, gathering and
learning complementary skills, and accelerating the commercialisation processes.
At the same time, (Chen et al., 2009, Li et al., 2013, Lee, 2007, Nielsen, 2010) argue that
strategic alliances offer benefits such as the sharing of vital or critical resources, blocking the
appearance of stronger competitors, improving learning and innovativeness, external
legitimacy, dealing and managing environmental dynamism. While, (Rai et al., 1996, Chen
and Chen, 2002) propose that firms are relying on strategic alliances in order to achieve more
profit in which alliances enhance effective means to evolve both economies of scale and
scope, through investment in learning and adaptation.

21
To conclude, strategic alliances play a significant role in identifying policies and decisions,
which could be followed to enhance a firm’s strategic position within a complex changing
business environment. Nevertheless, allied firms should also be prepared for challenges at
various stages of the alliance and understand the regulations in selecting partners, managing
or leveraging the alliance to achieve the objectives of the cooperation. Moreover, the benefit
of alliance formation will not be achieved, if trust, commitment, and the sharing of
knowledge are not found in that cooperation.
6. FACTORS SUCCESS STRATEGIC ALLIANCES
6.1 Trust
The concept of trust differs in either an individual’s belief or a groups’ belief, as it is
embedded within the habits and culture of individuals, groups and industries, at a national
stage and on an international level. It has been conceptualised as willingness for one party to
exchange confidence with another reliably and integrally (De Ruyter et al., 2001, Kumar et
al., 1994, Morgan and Hunt, 1994).
In other words, trust in an alliance context is defined as an individual’s belief or a common
belief among a group of individuals that another individual or group can be relied upon
(Yasir Yasin and Maqsood Ahmad, 2013). Within a strategic alliance perspective, a
transaction view proposes that the presence of trust is considered a vital factor in the
relational governance structure of the partnership because of co-ordination and mutual
dependency problems. This suggestion implies that trust has the ability to lower transaction
costs via preventing opportunistic behaviour, thus helping partners to extend their view in
order to take a long-term perspective to the relationship (Kauser and Shaw, 2004).
In respect of the relationship between trust and alliance performance, many theorists have
noted that trust works as a trigger for various structuring, organising, and mobilising
mechanisms to enable an alliance to fulfil an extreme performance outcome (Robson et al.,
2008). As a result, Chang et al. (2011) propose that the main factor making the actual firm
successful is trust, when virtual interaction and interpersonal processes possibly exist,
meaning that the outcome will be great. However, disrupting the flow of information between
partners could lead to an absence of trust, which could in turn result in conflicts and
coordination problems.
6.2 Commitment
Commitment is a main element in the paradigm of a strategic alliance. Several researchers
have provided definitions of commitment. For instance, Bianchi and Saleh (2010) define
commitment as reciprocal to a partner’s beliefs, that helps an ongoing relationship with
another, which is so important that it warrants maximum effort to sustain it. Also,
commitment is generally defined as an implied promise of relational continuity among
exchange partners (Kauser and Shaw, 2004). Thus, if the partners do not sustain the pledges
and try to act opportunistically, the value of its commitment will be lost with other firms (Li
et al., 2013). However, sharing resources, risks and costs all refer to a partner’s commitment,
this mean the motivation for firms to make a commitment is the partner's promises of sharing
potential outcomes (Li et al., 2013).

22
With regards to the importance of commitment in establishing long-term relationships,
Pesämaa and Hair Jr (2008) identify that inter-organisational commitment is essential for a
partnership. This is because it illustrates how success and strength can be accomplished via
integration of resources from several firms engaged within the same destination level. For an
enduring relationship to evolve, commitment and joint action of the engaged partners is
required to encourage the recurring reciprocity. Commitment, therefore, is a significant
variable for long-term success, because a partners’ alliance is willing to invest valuable
resources and sacrifice short-term advantages for long-term success. Furthermore, firms are
building and sustaining a long-term relationship, in which if they reciprocate, beneficial gains
can result from such a commitment (Chen et al., 2011).
Ultimately, it is suggested that commitment as an element discriminates among relationships
that persist and those that have collapsed. So that, the enduring business transaction
relationship between partners in a strategic alliance requires commitment to accomplish their
common alliance targets. Thereby, commitment is the key for continuing a relationship and
the fulfilment of desired outcomes for allied firms, and it has a positive impact on
performance (Chen et al., 2011).
6.3 Sharing Knowledge
Sharing and absorbing knowledge can successfully occur by accumulating a range of
performance benefits across partnership boundaries, including decreased failure rates and
increased productivity (Squire et al., 2009). In turn, transaction values will grow because
mobilised partners willingly share sensitive and proprietary knowledge necessary to
cooperate and improve their workflow (Katsikeas et al., 2009, McEvily et al., 2003). Inkpen
(2000) identifies that the generation of new knowledge is a huge challenge for a firm, so, it is
worth doing it because sharing knowledge assures organisational actions and will provide
organisational renewal (experimentation, change and innovation, competitive edge) (Lo et al.,
2016).
According to the theoretical perspectives on strategic alliances, Inkpen and Tsang (2005)
state that learning and knowledge can be obtained by partners engaged within an alliance
through their past experiences and their tacit knowledge and experiences. In this sense, trust
is considered a fundamental instrument as, if alliance actors are willing to share knowledge at
a strategic and operational level, partners will share knowledge with confidence because of
the development of trust (Nielsen and Nielsen, 2009). If trust and commitment among the
partners are lost, sharing skills and knowledge of technology are commonly inhibited (Yasir
Yasin and Maqsood Ahmad, 2013).
6.4 Communication and IT Capabilities
To achieve a successful strategic alliance operation, the partners are required to realise, share,
exchange and obtain learning and skills from each other. So to achieve alliance targets,
communication should be effectively sufficient to manage pooled resources (Youngtae et al.,
2010). Therefore, communication quality can be defined as the level to which the content of
communication is received and understood by the other partner in the alliance (Sengupta et
al., 2000). The process of communication allows partners who share the information, to
improve a relatively informal method. With the quality of information transferred and joint
participation by parties in the planning and objective setting, transmitting very important

23
signals to the trading partners. This means that in virtual teams, a successful alliance depends
on effective communication and the sharing of knowledge between partners (Sengupta et al.,
2000).
Thus, communication has been realised as an important factor in facilitation and can be
effectively used to strengthen the relationship of partners (Mohr and Spekman, 1994). Also,
Costa e Silva et al. (2012) propose that communication is an essential asset that assures
alliance partners learn skills from each other and co-ordinate their tasks, helping the alliance
to enhance and sustain viable bonds. Importantly, achieving a satisfactory partnership can be
gained by the development of effective communication skills, which is important for enabling
ties of allied partners (Youngtae et al., 2010).
On the other side, information technology plays an effective role as a factor in aggregating
essential information, which is responsible for the achievement of alliance targets.
Information technology permits allied firms to share efficient and secure information. It is an
infrastructure for exchanging information about the levels of demand and patterns, as well as
other events that have been created by web based applications and information technology.
These events have an important impact on cost reduction and partners’ supply chain plans.
However, it is clear that information technology alone is not sufficient for firms, who need to
exchange critical and proprietary decision making information in order to develop trust and
commitment (Chen et al., 2011). When firms have information technology capabilities it can
leverage appropriate IT to aggregate a variety of information, which is considered important
to fulfil an alliance’s goals (information regarding the progress of the alliance duties, specific
problems encountered, partner’s participations, etc.). Hence, if a firm is engaged in an
alliance, the managerial IT abilities become even more vital for achieving a high level of
performance (Lioukas et al., 2016).
6.5 Dependency
The concept of dependency is effectively used as a factor to achieve success in a firms’
relationship through the exchange of various aspects of (explicit, tacit) resources. According
to Lefroy and Tsarenko (2013) dependence refers to the extent that the firm relies on its
alliance partners for economic, social and financial resources. Following a resource
dependence theory, alliances and maintenance are considered critical resources in the
condition of organisational survival, in which firms work widely in an environment of
resource uncertainty and thereby rely on cooperate partners to create resources necessary to
accomplish the outcomes (Murray and Kotabe, 2005). Bearing this in mind, to deal with the
uncertainty of an environment, the amount of information and knowledge that firms need to
achieve cooperation and execution of alliance duties relies not only on the amount of
activities performed, but on the extent to which actors depend on others to fulfil these
activities. This dependence on each other is best captured via the level of dependency in an
alliance (Lioukas et al., 2016). Even though, some of the suggestions assert that dominance
by one partner might be better for performance, which can efficiently lead to a successful
alliance (Liu et al., 2010). It certainly receives more purpose, as it shapes partnership
objectives and increases the chances of accomplishing positive profits, by the facilitation of
decision-making and empowerment of the action (Chen and Chen, 2002). This aspect can
ultimately enable both partners rather than just one that is dominant, by enhancing ability and
willingness to pursue target fulfilment, prompting higher satisfaction with the results, and
improving new opportunities, as such solving problems through finding new solutions and
access to new markets (Chen and Chen, 2002).

24
7. CONCLUSION
This paper provides a general overview on strategic alliances and strategic construction
alliances specifically. In doing so, it presents the motivations and benefits that can be
considered as core motivators for adopting the concept. It has revealed that a group of factors
can fundamentally enhance the success of alliances. Nowadays, increasingly more clients
consider trust and commitment to be essential factors for alliance success. Thus, it is
important for clients and partners to have a better understanding regarding these fundamental
success factors. Inhibiting knowledge sharing is a challenge for alliance success because it
leads to decreased trust between partners. Furthermore, without a proper communication
strategy among the clients, partners and project teams, the alliance is likely to underform and
may even fail. Consequently, effective knowledge sharing helps to create innovation,
problem-solving, increased performance, and satisfied partners. Additionally, the
interdependency between partners helps in reducing the costs of collecting resources, whilst
enhancing the trust and commitment to achieve alliance targets. Future research efforts will
concentrate on strategic alliances and attempt to illustrate the critical factors that lead to
fulfilling alliance success in the construction industry in every single country. Additionally, a
suggested conceptual framework will be developed to properly test and validate the research
findings.
8. REFERENCES
BENNETT, J. & JAYES, S. 1998. The seven pillars of partnering: a guide to second generation partnering,
Thomas Telford.
BIANCHI, C. & SALEH, A. 2010. On importer trust and commitment: a comparative study of two developing
countries. International Marketing Review, 27, 55-86.
BLACK, C., AKINTOYE, A. & FITZGERALD, E. 2000. An analysis of success factors and benefits of
partnering in construction. International Journal of Project Management, 18, 423-434.
CHAN, S. H., KENSINGER, J. W., KEOWN, A. J. & MARTIN, J. D. 1997. Do strategic alliances create
value? Journal of Financial Economics, 46, 199-221.
CHANG, H. H., CHUANG, S.-S. & CHAO, S. H. 2011. Determinants of cultural adaptation, communication
quality, and trust in virtual teams' performance. Total Quality Management & Business Excellence, 22, 305-
329.
CHEN, H.-H., LEE, P.-Y. & LAY, T.-J. 2009. Drivers of dynamic learning and dynamic competitive
capabilities in international strategic alliances. Journal of Business Research, 62, 1289-1295.
CHEN, H. & CHEN, T.-J. 2002. Asymmetric strategic alliances: A network view. Journal of Business
Research, 55, 1007-1013.
CHEN, J., KING, T.-H. D. & WEN, M.-M. 2015. Do joint ventures and strategic alliances create value for
bondholders? Journal of Banking & Finance, 58, 247-267.
CHEN, J. V., YEN, D. C., RAJKUMAR, T. & TOMOCHKO, N. A. 2011. The antecedent factors on trust and
commitment in supply chain relationships. Computer Standards & Interfaces, 33, 262-270.
CHENG, E. W. & LI, H. 2002. Construction partnering process and associated critical success factors:
quantitative investigation. Journal of management in engineering, 18, 194-202.
CHENG, E. W., LI, H., LOVE, P. & IRANI, Z. 2004. A learning culture for strategic partnering in construction.
Construction innovation, 4, 53-65.
COSTA E SILVA, S., BRADLEY, F. & SOUSA, C. M. P. 2012. Empirical test of the trust–performance link in
an international alliances context. International Business Review, 21, 293-306.
DAS, T. & RAHMAN, N. 2010. Determinants of Partner Opportunism in Strategic Alliances: A Conceptual
Framework. Journal of Business and Psychology, 25, 55-74.
DAS, T. K. & TENG, B.-S. 1998. Between trust and control: Developing confidence in partner cooperation in
alliances. Academy of management review, 23, 491-512.

25
DAS, T. K. & TENG, B.-S. 2000. A resource-based theory of strategic alliances. Journal of management, 26,
31-61.
DE RUYTER, K., MOORMAN, L. & LEMMINK, J. 2001. Antecedents of commitment and trust in customer–
supplier relationships in high technology markets. Industrial Marketing Management, 30, 271-286.
DYER, J. H., KALE, P. & SINGH, H. 2001. How to make strategic alliances work. MIT Sloan management
review, 42, 37.
EGAN, J. 1998. Rethinking construction, construction task force report for department of the environment,
transport and the regions. HMSO, London.
FURRER, O., TJEMKES, B. & HENSELER, J. 2012. A Model of Response Strategies in Strategic Alliances: A
PLS Analysis of a Circumplex Structure. Long Range Planning, 45, 424-450.
GAUR, A., MUKHERJEE, D., GAUR, S. S. & SCHMID, F. 2011. Environmental and Firm Level Influences
on Inter-Organizational Trust and SME Performance. J. Manage. Stud., 48, 1752-1781.
GULATI, R. 1998. Alliances and networks. Strategic Management Journal, 19, 293-317.
HOLT, G. D., LOVE, P. E. & LI, H. 2000. The learning organisation: toward a paradigm for mutually beneficial
strategic construction alliances. International journal of project management, 18, 415-421.
INGIRIGE, B. & SEXTON, M. 2006. Alliances in construction: investigating initiatives and barriers for long-
term collaboration. Engineering, Construction and Architectural Management, 13, 521-535.
INKPEN, A. C. 2000. Learning through joint ventures: a framework of knowledge acquisition. Journal of
management studies, 37, 1019-1044.
INKPEN, A. C. & TSANG, E. W. 2005. Social capital, networks, and knowledge transfer. Academy of
management review, 30, 146-165.
KATSIKEAS, C. S., SKARMEAS, D. & BELLO, D. C. 2009. Developing successful trust-based international
exchange relationships. Journal of international business studies, 40, 132-155.
KAUSER, S. & SHAW, V. 2004. The influence of behavioural and organisational characteristics on the success
of international strategic alliances. International Marketing Review, 21, 17-52.
KULULANGA, G., EDUM-FOTWE, F. & MCCAFFER, R. 2001. Measuring construction contractors'
organizational learning. Building Research & Information, 29, 21-29.
KUMAR, N., HIBBARD, J. D. & STERN, L. W. 1994. The nature and consequences of marketing channel
intermediary commitment. REPORT-MARKETING SCIENCE INSTITUTE CAMBRIDGE
MASSACHUSETTS.
LEE, C.-W. 2007. Strategic alliances influence on small and medium firm performance. Journal of Business
Research, 60, 731-741.
LEE, J., PARK, S. H., RYU, Y. & BAIK, Y.-S. 2010. A hidden cost of strategic alliances under Schumpeterian
dynamics. Research Policy, 39, 229-238.
LEFROY, K. & TSARENKO, Y. 2013. From receiving to achieving The role of relationship and dependence
for nonprofit organisations in corporate partnerships. Eur. J. Market., 47, 1641-1666.
LI, L., QIAN, G. & QIAN, Z. 2013. Do partners in international strategic alliances share resources, costs, and
risks? Journal of business research, 66, 489-498.
LIN, T.-M., CHANG, H.-C. & LIN, C.-W. 2011. Enhancing performance through merger and acquisition or
strategic alliances? In knowledge innovation based. African Journal of Business Management, 5, 5929-
5937.
LIOUKAS, C. S., REUER, J. J. & ZOLLO, M. 2016. Effects of Information Technology Capabilities on
Strategic Alliances: Implications for the Resource‐Based View. Journal of Management Studies, 53, 161-
183.
LIU, C.-L. E., GHAURI, P. N. & SINKOVICS, R. R. 2010. Understanding the impact of relational capital and
organizational learning on alliance outcomes. Journal of World Business, 45, 237-249.
LO, F.-Y., LO, F.-Y., STEPICHEVA, A., STEPICHEVA, A., PENG, T.-J. A. & PENG, T.-J. A. 2016.
Relational capital, strategic alliances and learning: In-depth analysis of Chinese-Russian cases in Taiwan.
Chinese Management Studies, 10, 155-183.
LÓPEZ-DUARTE, C., GONZÁLEZ-LOUREIRO, M., VIDAL-SUÁREZ, M. M. & GONZÁLEZ-DÍAZ, B.
2016. International Strategic Alliances and National Culture: Mapping the field and developing a research
agenda. Journal of World Business.
LU, S. & YAN, H. 2007. A model for evaluating the applicability of partnering in construction. International
Journal of Project Management, 25, 164-170.
MA, C., YANG, Z., YAO, Z., FISHER, G. & FANG, E. 2012. The effect of strategic alliance resource
accumulation and process characteristics on new product success: Exploration of international high-tech
strategic alliances in China. Industrial Marketing Management, 41, 469-480.
MCEVILY, B., PERRONE, V. & ZAHEER, A. 2003. Trust as an organizing principle. Organization science,
14, 91-103.

26
MOHR, J. & SPEKMAN, R. 1994. Characteristics of partnership success: partnership attributes, communication
behavior, and conflict resolution techniques. Strategic management journal, 15, 135-152.
MORGAN, R. M. & HUNT, S. D. 1994. The commitment-trust theory of relationship marketing. The journal of
marketing, 20-38.
MURRAY, J. Y. & KOTABE, M. 2005. Performance implications of strategic fit between alliance attributes
and alliance forms. Journal of Business Research, 58, 1525-1533.
NIELSEN, B. B. 2007. Determining international strategic alliance performance: A multidimensional approach.
International Business Review, 16, 337-361.
NIELSEN, B. B. 2010. Multilevel issues in strategic alliance research. Researching strategic alliances:
Emerging issues, 1-26.
NIELSEN, B. B. & NIELSEN, S. 2009. Learning and innovation in international strategic alliances: An
empirical test of the role of trust and tacitness. Journal of Management Studies, 46, 1031-1056.
PESÄMAA, O. & HAIR JR, J. F. 2008. Cooperative strategies for improving the tourism industry in remote
geographic regions: An addition to trust and commitment theory with one key mediating construct.
Scandinavian Journal of Hospitality and Tourism, 8, 48-61.
RAI, A., BORAH, S. & RAMAPRASAD, A. 1996. Critical Success Factors for Strategic Alliances in the
Information Technology Industry: An Empirical Study*. Decision Sciences, 27, 141-155.
ROBSON, M. J., KATSIKEAS, C. S. & BELLO, D. C. 2008. Drivers and performance outcomes of trust in
international strategic alliances: The role of organizational complexity. Organization Science, 19, 647-665.
SAMBASIVAN, M., SIEW-PHAIK, L., MOHAMED, Z. A. & LEONG, Y. C. 2013. Factors influencing
strategic alliance outcomes in a manufacturing supply chain: role of alliance motives, interdependence,
asset specificity and relational capital. International Journal of Production Economics, 141, 339-351.
SCHULTZEL, H. J. & UNRUH, V. P. 1996. Successful partnering: Fundamentals for project owners and
contractors, John Wiley & Sons.
SENGUPTA, S., KRAPFEL, R. E. & PUSATERI, M. A. 2000. An empirical investigation of key account
salesperson effectiveness. Journal of Personal Selling & Sales Management, 20, 253-261.
SIVADAS, E. & DWYER, F. R. 2000. An examination of organizational factors influencing new product
success in internal and alliance-based processes. Journal of marketing, 64, 31-49.
SQUIRE, B., COUSINS, P. D. & BROWN, S. 2009. Cooperation and Knowledge Transfer within Buyer–
Supplier Relationships: The Moderating Properties of Trust, Relationship Duration and Supplier
Performance *. British Journal of Management, 20, 461-477.
STUART, T. E. 2000. Interorganizational alliances and the performance of firms: A study of growth and
innovation rates in a high-technology industry. Strategic management journal, 21, 791-811.
TARIQ, M. 2012. First mover, strategic alliances and performance: context of turmoil in China. Chinese
Management Studies, 6, 647-667.
VYAS, N. M., SHELBURN, W. L. & ROGERS, D. C. 1995. An analysis of strategic alliances: forms, functions
and framework. Journal of business & industrial marketing, 10, 47-60.
WILLIAMSON, O. E. 1991. Comparative economic organization: The analysis of discrete structural
alternatives. Administrative science quarterly, 269-296.
WONG, P. S.-P. & CHEUNG, S.-O. 2004. Trust in construction partnering: views from parties of the partnering
dance. International Journal of Project Management, 22, 437-446.
YASIR YASIN, F. & MAQSOOD AHMAD, S. 2013. The role of trust on the performance of strategic alliances
in a cross-cultural context A study of the UAE. Benchmarking: An International Journal, 20, 106-128.
YASUDA, H. 2005. Formation of strategic alliances in high-technology industries: comparative study of the
resource-based theory and the transaction-cost theory. Technovation, 25, 763-770.
YOUNGTAE, C., RICHARD, T. H., RICHARD, P. B. & PAUL, A. F. 2010. Communication, utilization, and
performance in international strategic alliances An investigation of the post-formation process.
International Journal of Commerce and Management, 20, 8-25.

27
ID 040
ENTERING NEW INTERNATIONAL CONSTRUCTION MARKETS –
LESSONS FROM NEW ZEALAND
S. Wilkinson1, L.S Lim1 and H.S. Jang2
1 Civil and Environmental Engineering, University of Auckland, 20 Symonds Street, New Zealand 2 School of Architecture, Seoul National University of Science & Technology, South Korea
Email: [email protected]
Abstract: Construction activities in New Zealand make a vital contribution to the national
GDP. As the industry grows and matures, companies increasingly look for international
markets. Participation in international markets allows the industry to become more resilient
and competitive. This research aims to understand the competitiveness of construction
companies in New Zealand, especially those companies focusing on infrastructure projects and
wanting to engage, or are currently engaged, in international markets. New Zealand has an
international reputation in projects such as international aid programme infrastructure projects,
power plant projects, and dairy industry projects. New Zealand companies also have a
reputation of being fair and honest in business. New Zealand's construction professional
services have strong capabilities, networks, and linkages throughout the international
construction market. Using literature, government documents, company reports and national
statistics, this research assesses how the construction industry prepares for engagement in the
international arena and how it develops collaboration strategies. The research adds new
insights into the New Zealand construction industry role in international markets and directs
future research on enhancing New Zealand’s competitiveness and efficiently in international
markets.
Keywords: Construction Industry, International Business, New Zealand, Trade
Competitiveness.
1. INTRODUCTION
The construction sector is a significant contributor to New Zealand's economy, contributing
to GDP, employment, and business. There is a relationship between construction activity,
economic growth, and economic development, including international trade, but New
Zealand companies have not taken full advantage of international opportunities because it has
traditionally been fragmented and risk averse (MacKenzie, 2000; Gillies, 2014). The
encouragement to expand and diversify into international markets is becoming more
important for the sector to develop greater economic stability. The Minister for Business
Innovation and Enterprise of New Zealand determined that there is a potential construction
market boom over the next decade due to population increases and economic transformation
of the service industry. In order to meet demands, New Zealand businesses are increasingly
seeking international partnerships and overseas opportunities from these partnerships as they
become available. As the NZ further matures, there are likely to be international companies
bringing newer technology, experiences, and competition to New Zealand, whilst New
Zealand companies will seek more integration within the global market. As demand in global
construction market increases, larger New Zealand companies are looking to build a
sustainable sector which contributes strongly to the New Zealand economy, and an
international focus forms part of this strategy. Open markets to international trade and
improved international communication and information networks have allowed New Zealand

28
companies to start to compete and expand. In this paper, an exploration and analysis of the
ways in which construction companies access international markets is presented.
2. CONSTRUCTION COMPANIES AND COMPETITIVENESS
New Zealand construction businesses have had some success internationally and have
gradually been extending their operations into international markets especially those in
developing countries through aid work. However, these companies are competing with other
well-established contractors from Japan, Korea, China, the United States, the United
Kingdom, Italy and other countries that have been in international markets for decades (Han,
2015). New Zealand companies have recognised the need to upskill by improving innovation
and technology use in order to be competitive in the international markets. The variables that
affect the performance of construction companies in overseas markets needs to be analysed
and ways to increase opportunities, enhance competitiveness and reduce risks considered. In
investigating the factors influencing the performance of New Zealand construction firms in
international markets, the need to understand shortcomings of previous experiences, and
develop optimized solutions which reduce risk and enhance competitiveness become
apparent.
The World Competitiveness Annual Report (WCAR, 2015) rates the level of competitiveness
of 58 countries. The report uses assets, process, and performance including perspectives of
investors, employers, and clients to make a determination. The report gives and overall
country focus but it is difficult to determine the competitiveness of the construction industry
from the data. What is clear from the data is that internationalized companies generally must
possess certain features for competitiveness. Technological capability, firm size, firm
reputation, project management and specialist expertise, strong equipment support, access to
capital and international experience are important factors influencing construction firms'
performance in international markets (Awil and Abdul Aziz, 2012; Ahmad et al., 2008).
Strong financial, and managerial, expertise are also important factors to entry (Ahmad et al.,
2008). Gunhan and Arditi (2005) state that company strength in international construction
markets include track record, specialist expertise, and the capability of delivering project
management services are critical. Additionally the network of contacts that can supply critical
information about international projects is also important. Ofori (2003), further stresses that
managerial expertise, financial resources and expertise, risk management, management of
cultural issues and ability to deal with political issues are important for competitiveness and
success. Ofori (2006) also showed that international success depends upon access to key
inputs, in particular, the skilled labour, competitive and quality building materials, production
and engineering knowledge, and access to capital. In general, key features that have been
known to improve the competitive advantage for international industries appear to be costs,
experience, technology and resources.
3. RISK/CHALLENGES AS PART OF ENHANCED COMPETITIVENESS
Firms need to address the challenges the international construction market poses. The ability
to manage risk is part of the competitiveness factor and leads to success. Root (1998) views
business activity and operation in foreign market as inherently risky, and argues that firms
need to minimize risk when they first enter the international market including political,
economic and legal risks. Javernick-Will (2009) concluded that the majority of international
project risk arises from international joint venture risks, contractual risks, cultural or social

29
risks, regulatory risks, and political risks. Instability in the host country increases risk
including 1) economic losses for foreign companies; 2) political risks where unstable
governments in the host country can harm the operations of foreign companies; 3) operational
obstacles of the host countries; 4) taxation systems, business and contract laws of host
country that may be disadvantageous to foreign companies, and 5) security risks that can
harm the operations (Gunhan and Arditi, 2005). . Risks have costs associated with them
which acts as a barrier to doing business for construction companies (Gunhan and Arditi,
2005).
4. CURRENT POSITION OF NEW ZEALAND CONSTRUCTION FIRMS IN
INTERNATIONAL MARKET
Construction companies at different stages of maturity in internationalization will have
different needs. Figure 1 illustrates the stages of internationalisation from Cavusgil (1980).
This is still relevant as a starting point to understand how construction companies enter the
international markets and the risks they face.
Figure 1: Stages in exporting by Cavusgil (1980)
According to Johanson and Vahlne (1977) there is a series of incremental decisions toward
internationalization which increase in complexity as entry progresses. As companies develop
international experience, so will the size and the complexity of these operations. In
Cavusgil’s model the export/sales ratio reflects the operational involvement and companies’
increasing dependence on foreign market exports. Awil and AbdulAziz (2002) suggest that
the commitment to international activities increases with movement between each stage, as
incremental success builds confidence and greater experience in management attitude
towards costs, risks, and strategies, leading to more extensive export activity, and to greater
internationalization. This stage model of Cavusgil (1980) can be used as a model for
evaluation of the progress of New Zealand construction firms. Gankema et al. (2000) found
that the time frame of around two years for the transition from one export stage to the next
export stage. Reuber and Fischer (1997) stresses that firms with internationally experienced
management teams can internationalize much faster than other firms. Culture plays a
significant role in overseas activities and motivated by initial test markets to the countries
sharing the same culture, language or regulating laws (Fisher and Ranasinghe, 2001).
The New Zealand construction industry is in early exploring stage, Statistic New Zealand, in
2016, reported that there is a small portion of the total construction GDP are oversea income.
It is more common for large firms to generate overseas income than small businesses, but it is
Stage 1: Domestic Marketing
The firm is only interested in the domestic market and does not export at all.
The export/sales ratio is 0
Stage 2: Pre-export
Searches for information and evaluates the feasibility of exporting activities.
Stage 3: Experimental involvement
Starts exporting on a small basis. Physical and cultural distances are limited. Marginal and intermittent involvement on experiment exporter.
The export/sales ratio varies from 0–9%
Stage 4: Active involvement
There is systematic effort to increase sales through export to multiple countries. A suitable organizational structure is in place to support these activities.
The export/sales ratio is 10–39%
Stage 5: Committed involvement
The firm depends heavily on foreign markets. Managers are continuously faced with choices for allocation of the limited resource to either domestic or foreign market.
The export/sales ratio is 40% or more

30
recorded that no more than 6% of 56,000 construction firms have ever generated overseas
income (Statistic New Zealand, 2016). The level of international engagement is positively
associated with firm size. The Small Business Sector Report by Ministry of Business,
Innovation and Employment New Zealand (MBIE, 2016) reported that small companies
either do not have the capacity or are not interested in exporting services as the risk are high
in the international market. New Zealand largest construction company (Fletcher Building)
first reportedly ventured overseas in Samoa on 1946 and later expanded into Australia on
1949. The international expansion of Fletcher initially remained predominantly in the same
market with a small amount of international revenue ratio from South Pacific but more recent
movement has seen the business in newer markets, moving them in the experimental
involvement stage. Another one of the largest New Zealand construction companies,
(McConnell Dowel), expanded into Singapore initially then Asia, Middle East, and Italy.
5. THE REGION DISTRIBUTION OF AWARDED OVERSEAS PROJECTS
Figure 2 is shows the international projects of Non-residential Building and Heavy & Civil
Engineering Construction companies in New Zealand from the year 2005-2016 of the 7
largest contractors in New Zealand.
Figure 2: Percentage of total international projects by region, 2005-2016 (Source: authors
own figures and analysis)
The majority of international projects developed and managed for the past ten years by NZ
construction companies are in South Pacific Islands. This expansion is not unexpected as
construction firms are mostly comfortable doing work in neighbouring countries, ans there
are many Pacifica communities in New Zealand. Investment in a nearby country is common
for international construction companies because of familiarity and proximity to the home
country, low political risk in the target market, and knowledge of host government
regulations, location, cultural understanding and safety. For New Zealand companies, another
reason is that most of the projects involve NZ government funding to support developing
neighbouring countries and also means that the risk of payment is more secure and there is
familiarity with contract standards. Ahmand and Kitchen (2008) pointed out that due to the
international knowledge and experience deficits, firms internationalize to market that they
most easily understand. The similarity in cultural and legal standard backgrounds in South
Pacific Islands and the proximity encourages New Zealand companies to undertake business.
Pacific Region
84%
Asia
11%
others
5%
Data base on major Non-residential building and
Heavy & civil engineering Construction firm
company in New Zealand only
1. Fulton Hogon
2. Downer NZ
3. Heb Construction
4. McConnell Dowell
5.Hawkins Infrastruture
6. Fletcher Construction
7.CBP/Leighton's Contractors

31
6. PROJECT TYPE
Projects have been classified into two types; Construction or Concession. Construction
involves pre-construction and technical advisory, design, construction and project
management. Concession (also known as Private Finance Initiative (PFI) or Built Operate
Transfer (BOT)) takes the form of an invitation from a local government based on a
company's reputation on specialty projects (Mustaffa et.al , 2012). The successful
development of BOT/PFI type projects requires strong financial capability and creates more
risk for companies.
Most NZ construction firms are keener on construction type projects, but even in concession
projects they prefer to participant in scoping activities. New Zealand construction firms
appear to have an estimated 1 in 16 projects as concession projects.
7. ENTRY MODE AND TYPE OF WORK AT POINT OF ENTRY
Construction could take the form of acquiring local firms or forging joint ventures with a host
company for the purpose of carrying out specific projects in the international market.
Crosthwaite (2000) explained that the most common approach to internationalizing operation
is to create a joint venture or establish a wholly owned subsidiary. Construction firms can
take positions on smaller contracts, or buy into local construction firms which enables them
to familiarizing themselves with the major growth markets, securing local supply chains,
understanding the local legislation and procurement policies of major clients.
*Office = Representative office, liaison office, branch office
Figure 3: Market Entries Composition for NZ companies (Analysis from sources including
Stats NZ, Govt documents and company reports)
Type of Work
Entry Mode
Pacific Region
Office (17%)
Industrial Work (14%)
AID Agency Work (3%)
Project-Based (25%)
Industrial Work (16%)
AID Agency Work (9%)
JV (58%)
Industrial Work (9%)
AID Agency Work (49%)
Type of Work
Entry Mode
Asia and Other
Office (34%)
Industrial Work (26%)
AID Agency Work (8%)
Project-Based (17%)
Industrial Work (8%)
AID Agency Work (8%)
JV (50%)
Industrial Work (8%)
AID Agency Work (42%)

32
International joint ventures are an effective way of getting started in the international market.
International joint ventures also have less risk involved and minimizing political and market
risks (Root, 1998). Construction organizations have often used this entry strategy (Ahmad
and Kicten, 2008). International joint ventures are also used by New Zealand companies as
entry modes to new international markets. New Zealand construction firms often prefer to
associate with host country local construction firm when undertaking work overseas. As the
nature of construction works matures, New Zealand construction firms establish project base
representative offices to operate overseas businesses and then local branch offices if there is
sufficient local market demand.
Typical type of work at point of entry is industrial work (mostly privately financed projects)
and AID agency work. AID agency work is project funded through New Zealand government
loans or financial aid to developing countries, loans from the World Bank or Asian
Development Bank, or obtained through New Zealand government bilateral trade agreements.
The developing countries which are registered selected member countries under foreign
funded projects (mainly with an AID agency) are attractive to foreign contractors as they tend
to be more payment secure (Mustaffa et.al, 2012). Most of the New Zealand contractors’
overseas entry pattern falls into AID agency work, as there are great opportunities to bid for
projects in the selected developing member countries by New Zealand Government.
8. AWARDED OVERSEAS PROJECTS BY SCOPE
Figure 4: Total international project awarded to New Zealand construction firms by scope,
2005-2016 (Source: Authors from MBIE, Statistics NZ and Company Reports)
The main contracting activities of New Zealand construction firms involved in the
international market are shown in Figure 4. Commercial building such as resort, hospital,
school and other public buildings are recorded as the highest awarded projects according to
scope. The second biggest contracting activities are the construction of highways followed by
water/waste water treatment and pipelines. According to Strassman and Wells (1988), there
are three distinct types of projects which are graduated by complexity and are the types of
progression seen in the New Zealand international marketplace. These are projects which are
small and simple; large but conventional, and technologically complex and sophisticated. In
general, the majority of New Zealand construction firms have undertaken international work
0
2
4
6
8
10
12
14

33
related to civil engineering projects. Civil engineering projects are more suitable for
international contracts, as the scope of the work is large and may need some financing by the
foreign construction firms. Construction export in New Zealand remains concentrated in civil
engineering projects, more precisely large but conventional projects, mainly because of
access to markets and good track record. A contributing reason is the expertise of New
Zealand construction firms in large but conventional civil engineering works gained from the
same type of work undertaken in New Zealand.
9. STRATEGY
The choice of strategy is considered the most critical decision of international marketing
because it determines how the company will position itself and be competitive. Mustaffa et.
al.(2012) suggest that firms cannot afford poor decisions in assigning their limited resources
to diminishing markets. The strategy to exploit the opportunities to international market
expansion is crucial. The three major entry decisions 1) location - to decide which market to
enter, 2) timing - to decide when to enter and 3) entry mode to decide how to enter
international markets, are major factors in expansion into the international market (Mustaffa
et.al., 2012; Isa et.al., 2011,2015; Preece et.al., 2016;).
10. INTERNAL CAPABILITIES OF NEW ZEALAND CONSTRUCTION TO
COMPETE
The joint venture entry mode may enable firms to enter earlier, as it increases the firm's
resource availability, lowering the risk and increase market power (Isa, 2011; Preece, 2016),
but, without internal strengths in the firm, the entry strategy itself is not enough. The
combination of strategy with both resource availability and capabilities increases the chance
of success. For most international contracts, evaluation of a prefer contractor will integrate
price and non-price attributes. New Zealand construction firms do not have a cost advantage
as high salaries of New Zealand expertise and location has made New Zealand cost
prohibitive. It is difficult to meet the competition in current markets especially when Chinese
construction firms have the advantage in labor cost and resources. New Zealand construction
firms have developed adaption and technical innovation strategies to enhance internal
strengths. Other than pricing strategy, a company needs to strengthen its capabilities such as
1) project management; 2) financial strength; 3) specialist expertise as a competitive
advantage in technological frontiers and niches; 4) international networks and connections; 5)
track record; 6) capacity of equipment, material, labour support to commit resources (Gunhan
and Arditi,2005).
11. TRACK RECORD
Gunhan and Arditi (2005) reported that the most important factor to have a competitive edge
in international markets is the track record. Track record demonstrates that the firms have the
capabilities in resources and technical knowledge through previous experiences to overcome
challenges and issues occur. The track record of New Zealand construction firms in large and
conventional projects play an important role in attracting future work. The firms transfer the
knowledge and expertise they have built in New Zealand to support developing communities.
This achievement is one of the main reasons why New Zealand construction firms are

34
performing well in South Pacific Islands, especially where there is high demand for core
infrastructure services. The firm's track record can be improved with the expanding business
into new countries which would help to establish new and more extensive networks.
Table 1: Type of capabilities accumulative with track record from year 2010-2017
(source: Authors own from various documents)
Main Construction Capabilities Numbers of firms offering
those Capabilities
Transport Services Road and bridges 6
Rail 2
Tunnel 2
Airports 4
Ports 4
Energy and Industrial
Engineering
Oil and gas 1
Industrial developments 3
Utilities Power Plants/Dams/Renewable Energy 2
Gas 2
Water and wastewater 5
Mining 1
Technology and communication services 2
Parks and open spaces 6
Mix Development 3
Commercial Building / Government Building 3
Earthquake Engineering 3
As outlined in Table 1, 6 out of the 7 selected firms have capabilities in construct road and
bridge and 5 of them have specific competencies in developing and maintaining water and
wastewater treatment. In additional to capabilities, firms gain a competitive advantage
through their resources and reputation.
12. INTERNATIONAL BUSINESS NETWORKS
Networking is an accompanying factor to be competitive in international markets. A good
international network could enhance reputation. Mustaffa et.al (2012) observed that teaming
with foreign companies and developing long-term relationships with foreign companies are
promising approaches to international business. Some local New Zealand construction firms
had previously established international contacts which have facilitated international
business. Spence (2003) showed the importance of an international network in reducing the
effect of a lack of resources. Firms with well-developed business networks are less likely to
be constrained by a lack of resources. Good international networks bring opportunity for
alliances, enhance reputation and reduce risk.
13. KEY TECHNOLOGY BREAKTHROUGHS
Key technology and resources possessed by a construction firm are considered to give
strategic advantage. The international market expansion for some of New Zealand
construction firms come from sophisticated projects. For example, two international
geothermal projects awarded to a New Zealand construction firm as the specialist knowledge
35
and skills that have developed on geothermal projects in New Zealand. According to Quak
(1991), distinct knowledge incorporated in structures and equipment that is novel improves
competitiveness. Gunhan and Arditi (2005) showed that smaller companies move into the
international markets with the specialist technologies and becoming desired consortium
partners. Ofori (2006) stated that the industry's products and operations has been influenced
by information technology. For New Zealand, sophisticated use of advanced project
management tools has helped project operation and management in new markets.
Table 2: Key niche technology and resources offered by NZ companies (source: Authors own
from various documents)
Key technology and resources
Material/Baggage Handling & Airport System Technology
Traffic Engineering & Network Modelling
Waste/Water Treatment network and system control
Energy Generation and Conservation, Design Build and Operation
Environmental Sustainable Architecture and urban design including smart city system
Earthquake seismic advisory and construction
New Zealand construction firms experience shows that having a special expertise can be one
of the major strengths of a company that looks for opportunities in international markets. The
service and technology offered by New Zealand construction companies are well established,
especially in area of traffic, waste/water treatment and earthquake engineering.
14. KNOWLEDGE OF THE NEW ENVIRONMENT
New Zealand’s multicultural background and migrant history has allowed New Zealand
construction firms experience in dealing with people from different countries and working
behaviours which are usually the norm in international construction projects. A legal
understanding is necessary for international construction projects, particularly the operating
laws, host country codes, labour laws, taxation laws, insurance policies, land laws and
contractual differences. The amount of labour and equipment required from the local area
will be influenced by the host country operating law, so it is crucial to understand the laws to
allow estimating on cost, productivity, quality and availability of labour, equipment, and
materials within the area. This is a concern for most New Zealand construction firms.
Logistics is important to an international project. Companies need to know how they will ship
and transport resources, mobilize at the site location, work with currency and banks, ensure
safety and security and set up camps for workers.
15. GOVERNMENT SUPPORT
Government support appears influential in competitiveness in international construction.
Ofori (2006) shows that support of governments contribute to international firms’
competitiveness. To help construction industries to undertake international projects and
export their services and generate economic growth, some initiatives have been implemented
by several governments in Asia such as Japan, China, Malaysia, Singapore and South Korea.
Developing export capability, tied or targeted aid, soft loans for contractors, market
information and bidding data assistance, market development grants and tax concessions, and
suppliers' credits and insurance support are all mechanisms used. Pooling of resources can
36
help in exploring more opportunities and reducing the risks. The Malaysia Construction
Industry Development Board (CIDB) promotes local construction firms to export
construction services and products. The Singapore Enterprise Promotion Department of the
Building and Construction Authority (BCA) assists Singaporean based construction and
construction-related firms to operate in international markets, providing them with relevant
information and new skills, facilitating the preparation of feasibility studies, the formation of
value-chain consortia, sourcing of funds, and liaising with host country agencies. The
Overseas Construction Association of Japan, (OCAJI) provides support in the development of
overseas activities by Japanese construction companies.
In New Zealand, New Zealand Trade and Enterprise (NZTE) provide general support to
businesses that want to grow and succeed internationally including refining strategy,
improving performance, building global networks and providing in-market support.
16. ENHANCE THE EFFICIENCY OF COMPETITIVENESS
New Zealand construction firms, have gained access to foreign countries using a combination
of strategies and have been gradually extending their operations in international markets. The
contributors to New Zealand construction firms’ success are:
formation of the joint venture, and alliance to create larger entities;
international track record of large and conventional projects and early entry in
sophisticated projects;
client management and networking;
modern project management techniques capabilities; and
high degree of working within multicultural environments.
The research shows that New Zealand construction firms may have difficulties due to weak
financial capacity to ensure solid cash flow, funding support for capital and bonding, and lack
of experience in international projects other than South Pacific Region.
17. CONCLUSION
New Zealand construction companies are increasingly seeking international markets.
Operation in international markets is different from the domestic market, as the level of risk
is higher, and decisions are influenced by factors such as resource availability and internal
capabilities. Alliances, joint ventures, and other forms of cooperation help the survival and
growth of New Zealand construction firms and success of entering the international markets.
The technology coalitions and subcontracting with advanced construction firms have allowed
New Zealand construction firms to make inroads into the international markets. The study
provides suggestions for future entry, survival and growth of New Zealand companies in
international markets. Further work will develop a decision model to guide construction
companies in aiding their internationalization strategy.
18. REFERENCES
Ahmad S. Z., Kitchen P.J. (2008). International expansion strategies of Malaysian construction firms: entry
mode choice and motives for investment, Problem and perspectives in Management 16(3):15-21

37
Awil A.U. and Aziz A.R. A. (2012). International Markets: Malaysian Construction Contractors and The Stage
Theory the Australian Journal of Construction Economics and Building Vol.2 No.1 94-106
Cavusgil, S.T. (1980)."On the Internationalization Process of Firms," European Research 8(6), 273-281.
Crosthwaite D., (2000). The global construction market: a cross-sectional analysis, Construction Management
and Economics, 18:5, 619-627
Fisher T. F., and Ranasinghe M. (2001). “Culture and foreign companies’ choice of entry mode: The case of the
Singapore building and construction.” J. of Construction Management and Economic. 19(4), 343–353.
Gankema H.G.J., Snuif H.R. and Zwart P.S., (2000) The Internationalization Process of Small and Medium-
sized Enterprises: An Evaluation of Stage Theory, Journal of Small Business Management. 38(4): 15-27
Gunhan S.and Arditi D., (2005). Factors Affecting International Construction, Journal of Construction
Engineering and Management 131(3): 273-282
Gunhan S.and Arditi D., (2005). International Expansion Decision for Construction Companies, Journal of
Construction Engineering and Management, 131(8): 928-937
Gillies N. (2014) New Zealand's Looming Construction Boom. Hesketh Henry The Art of Law
Han J., Park H., Ock J., and Jang H., (2015). An International Competitiveness Evaluation Model in the Global
Construction Industry, KSCE Journal of Civil Engineering 19(3):465-477
Isa C.M.M., Saman H.M. and Preece C.N., (2015) Determining Significant Factors Influencing Malaysian
Construction Business Performance in International Markets, J. Constr.in Developing Countries, 20(2):1–23
Isa C.M.M. and others, (2011). Timing of Entry by Malaysian Construction Firms into The International
Construction Market, International Construction Business & Management Symposium
Javernick-Will A. and Levitt R., (2009). Acquiring Local Knowledge for International Projects, Construction
Research Congress
Johanson J., and Vahlne J.E. (1977). The Internationalization Process of the Firm: A Model of Knowledge
Development and Increasing Foreign Market Commitment, J. of International Business Studies 8:35-40.
MacKenzie S., Kilpatrick A. R. & Akintoye A. (2000). UK construction skills shortage response strategies and
an analysis of industry perceptions, Construction Management and Economics, 18(7): 853-862
Mustaffa N. K., Adnan H., Zakaria M. Z., (2012). Entry Strategies for Malaysian Construction Related
Companies Going Abroad, Australian Journal of Basic and Applied Sciences, 6(6): 323-330
Ofori G., (2003). Frameworks for analysing international construction, Constr. Manage. and Econom.21(4):379-
391
Ofori G., (2006). Chinese Contractors and International Construction: Tentative Analytical Models and
Research Agenda, The CRIOCM 2006 International Symposium on “Advancement of Construction
Management and Real Estate”
Preece C.N., Isa C.M.M., Saman H.M. & Ibrahim C.KC. (2016) Development of entry location, entry timing
and entry mode decision model for construction firms in international markets, Construction Management
and Economics, 34:4-5, 236-257
Quak, S. K. (1991). Marketing Abroad: Competitive Strategies and Market Niches for the Singapore
Construction Industry, Pacific Trade Press Pte Ltd., Singapore.
Reuber A & Fischer E. (2011). International Entrepreneurship in Internet-Enable Markets. (journal of Business
Venturing, 26:660-679.
Root FR, 1998, Entry Strategies for International Markets, Revised end Jossey-Bass, San Francisco
Strassman P. and Wells J. (1988) Introduction. In Global Construction Industry, Croom Helm, London, pp.1–21
Spence, M. (2003), “International strategy formation in small Canadian high-technology companies – a case
study approach”, Journal of International Entrepreneurship 1(3): 277-96.
38
ID 068
MARKET SHARES DISTRIBUTION AND COMPETITIVENESS OF
CONSTRUCTION FIRMS IN NIGERIA
I.B. John1 and W.A. Isola2
1Department of Quantity Surveying, University of Lagos, Nigeria 2Department of Economics, University of Lagos, Nigeria
Email: [email protected]
Abstract: Firm level competitiveness results in market sharing. Dominant firms in a market
own the largest market shares and maximize profit. Construction firms earn market shares
from construction projects contract award. Construction firms’ ability to earn market share
indicates their level of competitiveness. The market share distribution of construction firms
quoted on the Nigerian stock exchange was assessed. The objective of this study is to assess
the market shares and competitiveness of Quoted Construction Firms (QCF’s) in Nigeria. The
population covered construction firms quoted on the Nigerian Stock Exchange. Convenience
sampling technique was adopted for this study. Secondary data was collected from the
published annual financial reports of construction companies quoted on the Nigerian Stock
Exchange for a period of 1978 to 2013. This study showed that there is an uneven distribution
of market shares among QCFs which results in low competitiveness levels of the construction
sector. Few firms dominates over 80% of QCFs market shares across the period of the study.
Market shares dominance leads to increased market power and predatory pricing among
dominant construction firms. This explains the high construction prices among dominants
construction firms in Nigeria despite measures put in place to reduce construction prices. The
study recommends that a more even distribution of market shares among construction firms is
required to enhance competitiveness.
Keywords: Competition, Market Power, Market Share, Nigeria, Quoted Construction Firms
1. INTRODUCTION
Poor economic growth in Africa has been attributed to weak policy formation and
implementation. This situation has been sustained by the general lack of competitiveness and
poor performance of firms in various industries. Government reforms and private sector
intervention has not proven effective in revitalising the industrial sectors of the African
economy. Nigerian is currently undergoing a period of recession despite its large population
and vast investments across sectors. This indicates the need to understudy the dynamics of
firm level competitiveness in individual sectors in order to ascertain the current economic
state of each sectors.
KPMG (2014) conducted a global construction survey in 2013 and found that among 165
leading construction firms, almost half are planning to compete in the African construction
market. Two out of five construction firms with turnover in excess of US$5 billion are
willing to do business in the African construction market (World Bank, 2012). The
construction market for basic infrastructural investment and maintenance of infrastructure in
Africa is over US$ 1OO billion per year. This huge construction market is the point of
attraction for international construction firm’s competition. Nigeria has been a point of
attraction for international construction firms from the pre-colonial era. International
competition within the Nigerian construction industry is also evident in the crop of firms
awarded infrastructural projects in Nigeria. There is a need to investigate the structure of the

39
construction industry, which influences the allocation of market shares and competiveness of
the Nigerian construction industry.
Construction firm’s ability to meet clients’ demand and operate profitably in the face of
intensified global competition and persistent economic dislocation in Nigeria determines
firms competitiveness and economic performance. Competitiveness is construction firms’
ability to be awarded and selected to design, engineer, construct, finance, deliver, operate,
maintain and manage construction works effectively thereby making profit and gaining
market shares above rival firms. The nature of construction market, as characterized by its
structure underpins the competitiveness that exists in the construction industry. The level of
competitiveness within the market plays a significant role, among other fundamentals, in the
determination of market shares owned by construction firms in each market segment. The
control of market shares arising from the contracts awarded to the largest construction firms
indicates the intensity of competition in a market Leon (2014) consequently asserted that
market structure studies examine the competitiveness of the firms in an industry. The size
structure or market shares of firms in a market is dependents on the market structure in which
such firms operate (Tafesse2007). The objective of this study is to investigate how market
shares have been distributed among QFCs and its implications on the competitiveness of the
Nigerian construction industry.
2. AN OVERVIEW OF THE NIGERIAN CONSTRUCTION INDUSTRY
Economic growth in Nigeria has been stagnated due to inadequate physical infrastructure
(AfDB, 2012). Infrastructural development has been the focus of government across various
regimes since independence. The Federal Government has been the main client of the
construction industry in Nigeria for the construction of physical infrastructures. Various
policy and reform agenda have focused on infrastructural development in Nigeria. Much is
yet to be accomplished despite government’s effort at infrastructural and economic
development through the four major developmental policy agenda, plans programmes and
projects since independence. The vision 20:2020, which was targeted at positioning Nigeria
among the first 20 global economies by the year 2020 has not sufficiently addressed the
infrastructural deficit particularly with the current recession in the Nigerian economy. The
Federal government is the primary financier and initiator of infrastructural projects in Nigeria
through budget allocations. A total of US$ 350 billion at 2010 constant price will be required
to develop the proposed infrastructure within a decade (2011-2020). The huge capital outlay
required for funding and maintaining infrastructure in Nigeria is capable of sustaining a
competitive construction sector. However, the competitiveness of the construction industry in
Nigeria places a demand on the structure of construction industry
The economic performance of the Nigerian construction industry is evident in the
competitiveness of all economic entities within the industry. The Nigerian construction
industry has performed poorly in terms of its contribution to real Gross Domestic Product in
Nigeria (CBN, 2008). The poor contribution of the construction industry to real GDP since
independence point in the direction of Bain’s (1951) assertion that industry structure
variables are the key determinants of economic performance. Although Nigeria is largely an
agricultural economy, the low contribution of the construction industry to real GDP is
worrisome. The low contribution of the construction industry to GDP also shows that the
construction industry is yet to realize its potentials despite the infrastructural deficit and the
huge investment in the sector by various government administrations. The low contribution

40
of the Nigerian construction industry to GDP despite the huge financial investment in the
sector requires scrutiny. In 2012, the building and construction industry contributed 2.19
percent of GDP while the agricultural sector retains its leading position with 39.21%
contribution to GDP. With the situation worsening over the years, there is need for policy
driven intervention to initiate and sustain real growth in the Nigerian construction industry.
The physical infrastructures of any economy are products of the construction industry. These
physical infrastructures foster economic growth. However, Momaya (1998) argues that in
many countries, the construction Industry is neglected. A well-structured and functional
construction sector is dependent on the market structure within which market players operate.
Economies growth and development in any country is dependent on the economic, social,
environmental and physical infrastructure built and sustained by the construction industry.
3. MARKET SHARE: AN OVERVIEW OF RESEARCH DIRECTION
Capitalist economics view markets as central institutions (Beckert, 2009). Market dynamics
and interplay are fundamental to growth and development in an economy. Industrial
economics paradigms address market structure predominantly. Classical and non-classical
traditions characterize market research in industrial economics (IE). Industrial economics is a
knowledge area that concerns itself with competition between firms in a market structure of
industries, firms, plants, markets, regions in an economy. Industrial economics research
focuses on how market structure drives competitiveness within an industry or market (Ma,
Weng & Yu, 2015). Industrial economics further concerns itself with the behaviour of firms
and markets in order to understand the departures from perfect competition (Einav & Levin,
2010). Firms’ departures from perfect competition can be analysed from various viewpoints.
These viewpoints include strategic behaviour, transaction costs, information friction and scale
economies.
Industrial economics models give substance to traditional neoclassical abstract concept of
market types. However, the theoretical base of IE was deepened as a result of criticisms, to
the work of Bain (1951) which presented a deterministic structure - conduct - performance
(SCP) approach to industrial analysis. Market share is an important indicator of market
structure which is capable of influencing the conduct of firms with a market which in turn
affects the performance of market players and the market in general. The structure conduct
performance paradigm and the relative market power hypothesis are found in the market
power paradigm. The relative market power hypothesis posits that only large firms with high
market shares enjoy increased profit (Fiona, 2006). This priority placed by large firms in
increasing market shares is explainable by the increased profitability of such firms over time.
The relative market power hypothesis proposes that large market shares allows large firms to
enjoy brand recognition and allows them to influence prices in any market. The benefits that
accrue due to increased market share of firms shape the nature of competition within a
market. It becomes pertinent to study the market share distribution of large firms within an
industry in order to understand the nature of competition that exist and further guide policy
interventions within such markets.
The efficiency-structure hypothesis (ESH) proposed by Demestz (1973) and Peltzman (1977)
considers market shares dominance as a reflection of firms’ efficiency. ESH which has been
supported by various studies (Samad, 2008; Fu & Heffernan, 2009; Seelanatha, 2010)
deviates from the market power hypothesis which alludes increased profit, brand recognition
and predatory pricing to increase in market shares.. Abbasoglu, Ahmet and Gunes (2007)

41
state that the ESH stipulates that firms with superior efficiency improve their market shares
and become more profitable. Scale-efficiency and the X- efficiency hypothesis are
approaches within the ESH. The scale-efficiency hypothesis places more emphasis on the
economies of scale. The scale-efficiency approach posits that large firms are able to increase
profits due to lower unit cost resulting from economies of scale. The lower unit cost may
result in higher market share. In contrast, the X-efficiency hypothesis posits that efficient
firms are more profitable because of efficient production technology and efficient
management (Fiona, 2006). Efficiency in management and production technology allows
firms to increase their market shares
There is a dearth of knowledge on the market share distribution of construction firms in
Nigeria. This is further deepened by the level of secrecy which shrouds construction firms
activities. Studies on the market share distribution of large construction firms in Nigeria
could provide some explanation on the increasing prices of construction product and the
underperformance of the construction industry in Nigeria. The study could also highlight
areas of policy direction necessary to enhancing a competitive construction industry in
Nigeria.
4. RESEARCH METHOD
The population covered by the study included construction firms quoted on the Nigerian
Stock Exchange. Convenience sampling technique was adopted for this study in other to
isolate two quoted construction firms that were delisted within the time frame Secondary
data was collected from the published annual financial reports of construction companies
quoted on the Nigerian Stock Exchange for a period of 1978 to 2013
This time frame avails this study of robust data useful for exploring the stability of market
shares among QCFs. The time frame 4lso covers various economic policies implemented in
Nigeria. This also avails the study the opportunity to assess QCFs gains and loss of market
shares across various economic policies. This further provides insights into the impact of
such policies on construction firms competitiveness.
Market structure studies can focus on structural or non-structural features of a market. The
structural dimensions of a market includes market shares, market concentration, and
collusion. However, non-structural features of a market includes entry barriers, product
differentiation, advertisement, technology as well as research and development. This study
focused on the structural features of QCFs market only. The percentages of QCF market
shares were investigated.
4. DISCUSSION OF FINDINGS
4.1. Market Share Distribution of QFC’s
The Market share of Arbico Plc. was low throughout the study period. The highest market
share attained by Arbico Plc. being less than 4%. The market share of Arbico Plc. was very
low from 1978 to 1986 which covered the period of the third national development plan and
the fourth national development plan. The period of implementation of the Structural
Adjustment Programme (SAP), which was an offshoot of the fourth national development
plan. However, the period of the SAP saw slight improvement in Arbico Plc’s market shares

42
from 1992 to 1995. The improvement however began to decline in 1996. The performance of
Arbico Plc. in gaining market shares was poor throughout the period considered in the study
and thus presents threat to the survival of the firm in the Nigerian construction industry.
Cappa and D’alberto Plc’s market share distribution shows some similarities and differences
with the market share distribution of Arbico Plc. The trend line for Cappa & D’Albeto Plc.
presents a slow growth pattern for market shares. The market share distribution of Cappa and
D’alberto Plc. from 1978 to 1986 has been low. However, a significant improvement is
noticeable in 1986 which also coincides with the period of the fourth national development
plan and introduction of the SAP. Reduction in market shares was however, experienced by
Cappa and D’alberto Plc. from 1988 to 1991. This period preceded a short period of increase
in market shares for Cappa and D’alberto Plc. There has been a decline in growth of market
shares from 2005 to 2013.
In sharp contrast with Arbico Plc. and Cappa and D’albeto Plc, Costain (West Africa) gained
market share of over 80% from 1978 to 1986. However, the trend line shows a steady decline
in market share from the period of 1986 to 2013. The loss in market share by Costain (West
Africa) can explain the gains in market share by the other QCFs during the period of the
fourth national development plan and beyond.
G. Cappa Plc. showed a decline in market share ownership from 1976 to 1986. Increase in G.
Cappa Plc. market share, which spanned from 1987 to 2004 was followed by a sharp drop in
market share in 2005. The period of SAP also presented G. Cappa Plc. a period of increasing
market shares as enjoyed by some QCFs. The market share of G. Cappa Plc. has been low
and continued to decline throughout the period of the study.
Market share distribution of Julius Berger Nigeria Plc. has been on the rise 1986 to 2013.
Although, the period covering the third and fourth national development plan also presents
Julius Berger Nigeria Plc. with little market share, the period of implementation of SAP
showed an increase in market share by the firm. Julius Berger Nigeria Plc. Preceded by a
sharp increase in market shares in 1986, Julius Berger Nig. Plc. Julius Berger Nig. Plc. owns
an average of 80% of the QCFs market share starting from 1986 to 2013. The trend line also
shows steady increase in Julius Berger Nig. Plc. market shares throughout the period of the
study. This presents the possibility of firm survival and business growth in the QCF market.
Roads Nigeria Plc, market share distribution is presented on Figure 1. Low market shares was
experienced up until 1986 when the firm began to gain market shares. Market share of Roads
Nig. Plc. throughout the study period was less than 10 percent. Roads Nigerian Plc. has never
been a market leader throughout the study period. This low market share poses a threat to the
survival of Roads Nigeria Plc.
The trend of market share distribution for Dumez Nigeria Plc. showed a decline in market
share ownership as presented in Figure 1. Dumez Nigeria Plc. appeared to be one of the QCF
market leader from 1978 to 1984. This period covered the second and third national
development plans which preceded the Nigerian civil war and these development plans were
geared at rebuilding the destroyed infrastructure of Nigeria. Dumez Nig. Plc. maximised the
period of the second and third national development plans in gaining market shares.
However, beyond the period of the fourth national development plan, Dumez Nigeria Plc.
declined in market share ownership and consequently, lost its market leadership position.

43
The market share distribution shown in Figure 1 shows a comparative presentation of the
market share distribution among QCFs in the study. A shift in the market share dominance of
construction firms in favour of a single firm which retains the largest market share among
QCFs is visible. Dumez Nig. Plc. led QFCs with a market share of 51.58% and 58.29% from
1978 to 1979. However, Costain W.A. clearly dominated the construction industry in 1980,
1985 and 1986 with market share of 84.77%, 87.16% and 83.99% respectively.
Figure 1: Market shares distribution of QCFs in Nigeria from 1978-2013
Julius Berger Plc. assumed dominance of QCFs in 1987 with a market share of 55.64% and
sustained this dominance throughout the study period. However, between 2005 and 2013,
Julius Berger Plc. dominates QCFs with over 80% market share. Throughout the study period
(1978-2013), it is observed that there is high inequality in market share distribution among
the firms. This suggests a relatively low degree of competition.
-20
0
20
40
60
80
100
1978 1980 1982 1984 1986 1988 1990 1992 1994 1996 1998 2000 2002 2004 2006 2008 2010 2012
Arbico Plc
Cappa & D’Alberto Plc
Costain (West Africa)
G.Cappa Plc
Julius Berger (Nig)
Roads (Nig) Plc
Dumez Nig. Plc

44
The size distribution of firms is an important determinant of competition in a market (Beck,
Scott & Yelowitz, 2010). However, limited evidence exist on the size distribution of
construction firms in Nigeria. This study therefore assessed the market share as a measure of
the size distribution of quoted construction firms in Nigeria. Market shares indicate the
strength of individual firms within a market. The market share of QCFs from 1978 to 1986
was dominated by two leading construction firms. During this period, the political climate
was volatile and characterized by political instability and military rule. The Nigerian
Enterprises Promotion decree of 1972 and 1977 aimed at reducing foreign participation in the
economy and high repatriation of profit did not appear to influence the market shares
distribution of QCFs. The participation of more QCFs or the redistribution of market shares
among QCFs was not evident from 1978 – 1986. These two dominant firms jointly held over
83% market share in 1978. Dumez Nig. Plc. which held over 51% of market shares was
incorporated on 5th May 1958 while Costain West Africa which held over 32% market shares
was incorporated on 16th July 1948. The market share held by house building firms in Britain
from 1978 to 1980 presents a sharp contrast with QCFs in Nigeria within that period. Ball
(1983) found that 47% of market share were held by 89 large (producing over 250 buildings
per annum) house building firms in Britain in 1978.
In 1979, the two dominant QCFs jointly held over 99% market share among QCFs. In 1980,
there was a sharp decline in the market shares held by Dumez Nig Plc. to 14% while Costain
West Africa held market shares of over 84%. Both firms held over 90% market shares of
QCFs till 1986. The market share dominance of these two firms was a reflection of the
deteriorating state of the Nigerian economy at that time. The period saw GDP growth rate
turn negative and a decline in capacity utilization across sectors of the Nigerian economy.
Bee (2009) opined that average rate of return for business with over 40% market shares is
more than double for firms with less than 10% market share. This assertion holds true for
QCFs between 1978 and 1986. The dominant firms maintained their market shares while
other QCFs were barely surviving. However, a turnaround became evident in 1987 with
significant increase in the market shares of all QCFs. except the previous market leaders who
experienced a sharp decline in market leadership. This was a year after the government
adopted the Structural Adjustment Program (SAP) to re-establish some control over the
economy and create a business-enabling atmosphere for economic growth and development.
SAP which was in effect until 1990 helped to reverse GDPs’ negative growth rate and
provided a stable investment climate amidst high inflation rates. Market shares of QCFs
during the period of the implementation of SAP were considerably higher than the pre-SAP
era. However, Julius Berger (Nig.) assumed market share dominance of QCFs from 1987 to
date with an average market share of over 75%.
The market share distribution of the top three leading firms with dominant market shares
from 2009 to 2010 was a subject of enquiry for Stefan and Coca (2011). The study showed
increases and decreases in market share distribution within the period of the study. The
market shares distribution of QCFs in Nigeria has shown increases and decreases within
firms but there is clear market share dominance by a single QCF. The uneven distribution of
market shares among QCFs shows a low competitiveness in the construction sector. This is
further influenced by the market share dominance of either one or two firms throughout the
study period.
In the construction industry of Australia (de Valence, 2003), Hong Kong (Chiang et al 2001)
and Japan (Woddall 1996), over 70% of the industry turnover was accounted for by the

45
largest construction firms. FTC/DOJ (2007) reports that over 50% of the northeastern Ohio
real estate market was controlled by two firms, while one firm controlled over 50% of the
Des Moines real estate market. This is similar with the Nigerian construction industry where
two firms held market dominance but thereafter one firm enjoys market dominance. Also the
FTC/DOJ (2007) report also showed that a single firm controlled over 75% of the Lincoln
NE real estate market. Similarly, studies show that few construction companies (Ibrahim,
Githae & Stephen, 2014; Chukwudi & Tobechukwu, 2014; Aniekwu & Audu, 2010; Olatunji,
2010; Ogbebor, 2002) control over 90% of market share in the Nigerian construction
industry. This study also agrees that a single firm dominates over 80% of QCFs market
shares. This leads to increased market power of the dominant firm. Increased market power
results in predatory pricing for dominant construction firms. This explains the high
construction prices among dominants despite measures put in place to reduce c High
performance enjoyed by QCFs with high market shares is sustained because such
construction firm have opportunity to increase their capacity, purchase modern plants and
equipment. This capacity building is required for construction firms to work at different or
multiple sites (projects) simultaneously without delaying one project for another. However,
the insignificant effect of this result indicate that other factors such as contracts from
government, jumbo returns, unhealthy rivalry, collusion and other uncompetitive behaviour
characterise the construction industry.
5. CONCLUSION AND RECOMMENDATION
The market shares acquired by construction firms are highly unequal throughout the study
eriod. The study period showed uneven and slow growth pattern in market shares among
most QFCs. The dominance of market shares by few firms among QCF leads to low
competitiveness. It is crucial to provide government intervention in the supply side of the
construction industry by way of policy to align the distribution of market shares more
effectively among construction firms along desired paths particularly to enhance
competitiveness. The mode of acquiring market shares (contract award) in the construction
industry is different from the mode of acquiring market shares in other sectors (product
sales), this peculiarity can be advantageous to the construction industry. Effective monitoring
and regulation of contract awards system particularly for public projects, which the
construction industry currently lacks, can help distribute market shares among construction
firms more evenly.
Construction firms ability to earn market share shows their level of competitiveness. This
study recommends that market shares should be more evenly distributed among QCFs. This
is possible among QCFs because government investment in the construction industry in
Nigeria remains the highest. Constant monitoring of market shares distribution among QCFs
through contract award monitoring must be carried out to provide the possibility of
distributing market shares more evenly among construction firms and fostering a highly
competitive construction industry. Government can also encourage construction firms
increased participation in the industry through its policies.
Market shares is not evenly distributed among quoted construction firms in Nigeria. The
uneven distribution of market shares can result in a near monopoly structure capable of
sustaining predatory pricing and low competitiveness in the construction industry. There is
need for government as the single largest client of the construction industry in Nigerian to
facilitate a more rational and even distribution of market shares in the construction industry.

46
Contract award which is a tool for the distribution of market shares in the construction
industry can be better structured to enhance the competitiveness of the construction industry.
6. REFERENCES
Abbasoglu, F. O., Ahmet, F. A. & Gunes, A. (2007). Concentration, competition, efficiency and profitability of
the Turkish banking sector in the post-crises period. MPRA Paper No. 5494
African Development Bank Group (2012). An infrastructure action plan for Nigeria: closing the infrastructure
gap and accelerating economic transformation. AfDB
Aniekwu, A. N., & Audu, H. O. (2010). The effects of management on productivity: a comparative study of
indigenous and foreign firms in the Nigerian construction industry. Paper presented at West Africa Built
Environment (WABER) Conference, 27-18 July 2010, 567-578. Accra-Ghana: WABER.
Bain J. S. (1951). Relation of profit rate to concentration: American Manufacturing, 1936 -1940. Quarterly
Journal of Economics, 65(3), 293-324
Ball, M. (1983). Housing policy and economic power. London: Menthuen
Beck, J., Scott, F., & Yelowitz, A. (2010). Competition and market structure in Local real estate market.
retrieved on 12th January 2017
Beckert, J. (2009). The social order of markets. Theor Soc, 38
Bee, A. H. (2009). Market shares strategies in the Pharmaceutical industry. Unitar E-Journal, 5(1), 50 – 67.
CBN (2008). Central Bank of Nigeria Statistical Bulletin; 50 years special anniversary edition. CBN, Nigeria.
Chiang, Y. H., Tang, B. S., & Leung. W. Y. (2001). Market structure of the construction industry in Hong
Kong. Construction Management and Economics, 19(7), 675–687.
Chukwudi U. S., & Tobechukwu O. (2014). Participation of indigenous contractors in Nigerian public sector
construction projects and their challenges managing working capital. International Journal of Civil
Engineering, Construction and Estate Management, 1(1), 1-21.
Coiacetto E. (2006). Real Estate development industry structure: Is it competitive and why? Unpublished Work,
Urban research program, Griffith University, Brisbane.
Demsetz, H. (1973). Industry structure, market rivalry, and public policy. Journal of law and Economics, 76
(1), 146 – 148
DeValence, G. (2003). Market structure, barriers to entry and competition in construction markets. Proceedings
of the joint international symposium of CIB W55/W65/W107 working commission held in National
University of Singapore on October 22, 2003. Pp 819-828.
DeValence, G. (2005). Project finance model for small contractors in USA. The Australian journal of
construction Economics, 7(1), 29-36.
Federal Trade Commission and U.S. Department of Justice (2007). Competition in the Real
Estate Brokerage Industry. FTC/DOJ
Fiona, T. (2006). An empirical investigation of the effects of concentration on profitability among US banks.
retrieved September, 2014 from http://mpra.ub.uni-murnchrn.de/13731/
Fu, X., & Heffernan, S. (2007). Cost Xefficiency in China’s Banking Sector. China Economic Review,18, 35-53.
Hajipour, B., Talari, M., Shahin, A. (2011). An investigation of the relationship between structure, strategy type,
organizational characteristics and organizational performance: A case study of the food and chemical
industries of Iran. African Journal of Business Management, 5(16) 7085-7098Ibrahim, Githae & Stephen,
2014
KPMG (2014). Competitive alternative: KPMG’s guide to international business location costs. Retrieved from
https://www.kpmg.com/UA/en/IssuesAndInsights/ArticlesPublications/Documents/competitive-
alternatives.pdf
Leon, F. (2014). Measuring competition in banking: A critical review of methods. Serie etudes et documents du
CERDI, Etudes et documents no 12
Ma, M., Weng, J. & Yu, L. (2015). Market size, scale economies, and tourism market structure:
A case of historic water town tourism in China. Tourism Management, 49, 119-137.
Momaya, K. (1998). Evaluating international competitiveness at the industry level. Vikalpa 23(2), 39 - 46.
Ogbebor, P.O. (2002). Enhancing indigenous construction industry as a national goal in Nigerian development.
In Akintunde I. (Eds.). The Nigerian Construction Industry: Past, Present, problems and Prospects (pp.
230-239). Ibadan: Ibadan University Printery.
Olatunji, A. A. (2010). Influences on Construction Project Delivery Time. South Africa,
Unplished PhD thesis, NMMU
Peltzman, S. (1977). The gains and losses from industrial concentration. Journal of Law and Economics, 20(3),
229-263.

47
Samad, A. (2008). Market Structure, Conduct and Performance: Evidence From the Bangladesh Banking
Industry. Journal of Asian Economics, 19,181-193
Seelanatha, L. (2010). Market Structure, Efficiency and Performance of Banking Industry in Sri Lanka. Banks
and Bank Systems, 5(1), 20-31Shefan, G. & Coca, O. (2011). The competitive environment’s analysis on
the wine market. Lucrari stiintifice, 54(2), 468 – 471.
Tafesse, Y. (2007). Market structure, conduct and performance of some selected large and medium scale food
manufacturing companies. Unpublished MBA thesis of the Faculty of Business and Economics, Addis
Ababa University
Woodall, B. (1996). Japan under Construction – Corruption, Politics, and Public Works. Berkeley; Los
Angeles: University of California Press
World Bank (2012). World Bank group infrastructural action plan. African Region. World Bank.

48
ID 095
A RESEARCH FRAMEWORK FOR EFFECTIVE RISK
MANAGEMENT IN PUBLIC-PRIVATE PARTNERSHIP (PPP)
INFRASTRUCTURE PROJECTS IN PAKISTAN
K.M. Mazher1, A.P.C. Chan1, H. Zahoor2
1 Department of Building and Real Estate, The Hong Kong Polytechnic University, Hung Hom, 999077, Hong
Kong 2 Construction Engineering and Management Department, National University of Sciences and Technology,
Risalpur Campus, 24080, Pakistan
Email: [email protected]
Abstract Public-private partnerships (PPPs) are being heralded as a potentially promising
alternative to overcome the chronic inefficiencies which characterize the traditional public
infrastructure delivery and shortage of development budgets to meet increasing demands for
public services. However, such arrangements present their own set of challenges which are
primarily attributable to the complex organizational structures and long duration of underlying
contractual relationships. In particular, the need for effective risk management becomes all the
more important to ensure a successful project and a lapse in this domain is known to deliver
disastrous outcomes. Pakistan, a developing country with a large population, abundant natural
resources and geopolitical significance, boasts all the drivers to promote and benefit from
PPPs. It also harbors elements that expose the stakeholders to significant risks. Therefore, a
research framework is developed to identify critical risks, determine risk allocation practices,
develop robust models for efficient project risk assessment and allocation, and determine
measures to ensure efficient risk management on future PPP projects. Existing literature is
reviewed and summarized to determine the significance, drivers, barriers, and risk
management characteristics of infrastructure PPPs in the Pakistani context. In addition, results
of the preliminary interviews with experts have uncovered multiple lifecycle risks and suggest
immature and unsystematic risk management practices, which subsequently inform the
development of the research framework.
Keywords: Effective Risk Management, Pakistan, Public-Private Partnerships, Risk
Allocation, Risk Assessment.
1. INTRODUCTION
Economic activity and growth of a country and delivery of essential services for domestic and
industrial purposes is dependent on investment in economic and social infrastructure (Martini
and Lee, 1996; East Asia Analytical Unit, 1998). Traditionally, the provision of infrastructure
has been seen as an exclusive responsibility of the government (Grimsey and Lewis, 2007).
However, multiple issues have forced the key stakeholders to consider an alternative which
relies on an increased participation of the private sector by partnering with the public
authorities. The characteristic poor performance of project delivery using traditional
procurement strategies, which is marked by time and cost overruns and/or poor quality, and
the fiscal constraints of governments constitute some of the key drivers leading to this change
(Ahsan and Gunawan, 2010; Beckett et al., 2009; Raisbeck, Duffield and Xu, 2010; Allen &
Overy, 2010). Given the existing evidence of better performance of projects delivered
through PPPs as opposed to traditional procurement strategies, there is also ample debate
against PPPs for not being able to deliver Value for Money (VfM) and that the arrangements
prove expensive to taxpayers by providing excessive profits to the private companies
(Shaoul, Stafford and Stapleton, 2006; Hodge and Greve, 2007). Moreover, both the public

49
and private sectors are exposed to additional risks due to the complexity of financing
arrangements and uncertainty inherent in the long concession period (Dey and Ogunlana,
2004; Zhang, 2005). Therefore, effective risk management is the key to project success since
risks have a direct bearing on the project objectives (Baloi and Price, 2003). A major
difference between the traditional and PPP based project delivery methods lies in the way
risks are apportioned to each party (FHWA, 2013). Furthermore, the context is very
important. Risks and their management are influenced by country, sector, project specific
features (Ameyaw and Chan, 2013; Carbonara et al., 2015), and the capabilities of the parties
handling such projects (Ng and Loosemore, 2007), in addition to other factors. Zhang (2005)
contended that owing to the lack of PPP experience and expertise in many countries and
regions, systematic risk identification and management are essential to the success of PPPs.
In terms of gross domestic product (GDP), Pakistan is the second largest economy in South
Asia (World Bank, 2015), and ranks 6th as the most populous country in the world, with a
total population of 188.924 million as of, 2015 (World Bank, 2016b). The infrastructure
situation in Pakistan is relatively poor as it ranks 117 in overall infrastructure out of 140
countries (Schwab, 2015). Poor governance and lack of resources characterize the challenges
being faced by Pakistan; thus resulting in a shortage of energy, road networks, passenger and
freight train services, mass rapid transit in urban areas, efforts to improve irrigation
efficiency, safe water, basic sanitation services (ADB, 2015a), and oil and gas transportation
networks (Mubin and Ghaffar, 2008). Pakistan requires investment at a rate of 10% of the
GDP to meet infrastructure needs, as opposed to the existing six percent (average), according
to the State Bank of Pakistan (Bhatti, 2015), which cannot be met entirely by public
resources. PPPs have been suggested as a suitable strategy to partly fill the void between
Pakistan’s infrastructure needs and available fiscal resources (ADB, 2015b; GoP, 2010). In
addition, poor performance of projects delivered through traditional methods of procurement
serve as another important driver to promote PPPs (ADB, 2015b; Noor, 2011; Shaukat,
Choudhry and Gabriel, 2011). The concept of PPPs is not new to Pakistan since a number of
power projects have been developed using private investment (ADB, 2015b), however, the
implementation of PPPs in other sectors is lagging such as transportation and water
infrastructure sector (Economist Intelligence Unit, 2015). Furthermore, PPP projects in
Pakistan are exposed to a myriad of risks that need to be studied systematically. Equally
important is the need to explore the current practices towards allocation of specific risks in
different sectors and the efficiency and efficacy of such practices. The existing literature has
highlighted inadequate risk management efforts on PPP projects, world over, that have led to
failures or sub-optimal results, and therefore, there is a need to identify measures to promote
effective risk management on PPP infrastructure projects. Such studies will be instrumental
in informing future policy design and development of frameworks to assist in decision
making and in complementing efforts to ensure successful PPP projects. This paper presents a
research framework to study risks and their management in the Pakistani infrastructure
(economic) PPPs context, and to develop models to assist the key stakeholders in ensuring
effective risk management efforts on such projects. A review based on published literature is
also presented that attempts to summarize current knowledge on barriers, drivers, risks
specific to PPP projects, and the risk management characteristics of the local industry. The
results of the semi-structured interviews, conducted with relevant stakeholders from public
and private sector, are also included to develop and support the research objectives and to
establish the significance of research in the Pakistani context.

50
2. PPPS IN PAKISTAN - IMPLEMENTATION STATUS
In recognition of the severe infrastructure shortage and its effect in hampering economic
growth, the Ministry of Finance established Infrastructure Project Development Facility
(IPDF) in 2006 and mandated it to develop PPP policy and oversee its implementation. The
revised PPP policy of 2010 provides support for all infrastructure sectors, at the federal and
provincial level (Economist Intelligence Unit, 2015). Recently, the government passed the
Public Private Partnership Authority Bill 2016, that aims to provide the necessary regulatory
and enabling environment for promoting PPPs (The Nation, 2017). With the support and
assistance of Asian Development Bank (ADB), the provincial governments of Punjab and
Sindh are developing legal and institutional capacity in order to procure infrastructure
projects using the PPP modality (ADB, 2015b). Several projects have been executed at the
federal and provincial level with the power and transport infrastructure sector being the most
active. A huge bulk of investment under the China Pakistan Economic Corridor (CPEC)
program is envisaged for the development of energy infrastructure projects (Malik, 2015),
where all the energy projects will be implemented under the Independent Power Producer
(IPP) mode (Ministry of Planning, Development, and Reform, 2016), that may be based on
the Build-Own-Operate (BOO) / Build-Own-Operate-Transfer (BOOT) models, similar to the
previously delivered IPP projects. According to The News, some of the projects under CPEC
will be financed through the Public Sector Development Program (PSDP) of the government
of Pakistan (GoP) using public funds. Realizing the fiscal constraints, the GoP has instituted
the Pakistan Development Fund Limited (PDFL) to finance the multi-billion dollar projects
on PPP pattern. The company is intended to provide complementary long-term project
finance to encourage private sector participation (Haider, 2016). Amid increased
attractiveness of Pakistan to foreign investment, as evident from interest of UK, France,
Germany, Japan, (APP, 2016; Rana, 2015; The News, 2017; Hussain, 2017; Mirza, 2017),
and other countries to partner in CPEC related/infrastructure projects, and the available
opportunities, there may be more projects in future that are funded internationally and
executed through the PPP mode. As of now, a relatively large number of projects are
operational in the power sector, followed by some projects in transport infrastructure sector.
2.1 Power Infrastructure Development Using PPPs
Pakistan initiated work on private investment in power infrastructure development with the
assistance of the World Bank in 1987 and established the initial framework of incentives by
1988. The efforts materialized in to success with Hub power project (Hubco), the first private
power project in Pakistan, reaching financial close in 1995. It was also a huge undertaking in
terms of the sheer size of the project which can generate 1292 MW of electricity and costed
USD 1.6 billion at that time. Since it was the first private deal in the power sector and the
country, the project faced multiple issues in the political domain. The efforts also led to the
development of the first power policy of 1994 (Fraser, 2005). Many projects have been
procured since then under various versions of the policy. A total of 59 power generation
projects, based on various technologies including Diesel, Waste, Natural Gas, Hydro,
Geothermal, Solar, Nuclear, Wind, and Coal are active, as per Private Participation in
Infrastructure Database (World Bank, 2016a). Many more projects are under development in
the renewable and nonrenewable energy sectors.

51
2.2 Transport infrastructure development using PPPs
Procurement of projects through private investment in the transport infrastructure sector
started late. There was one PPP project in, 2010 (Economist Intelligence Unit, 2015). A total
of ten projects are currently under construction or in operation phase including the
Hyderabad-Mirpurkhas dual carriageway, Sir Agha Khan Jhirk Mulla Katiyar bridge (over
river Indus), Karachi-Thatta dual carriageway, Karachi-Hyderabad motorway (M9), Kahna
Kachha flyover (Lahore), Lahore ring road (southern loop), Lahore-Sheikhupura-Faisalabad
expressway, Lahore-Islamabad Motorway (M2) (Rehabilitation and Modernization),
Habibabad flyover (GT Road, Pattoki), and Lakpass tunnel (Mastung) with two projects
being procured using the Design-Build-Finance-Operate-Transfer (DBFOT) modality and
rest based on BOT modality. The World Bank’s PPI database lists only one airport (BOO)
and 13 port sector projects that were procured under various modalities of PPP including
Rehabilitate-Operate-Transfer (ROT), Build-Rehabilitate-Operate-Transfer (BROT), and
BOT. At present, several other projects at federal and provincial level are under the
development phase.
3. ISSUES HIGHLIGHTED IN LITERATURE
According to Khan, Jamil and Sattar (2008), in the past, Pakistan had not been successful in
exploiting the full potential of BOT form of project procurement as witnessed by very low
interest of multinational firms and ventures, operating in Pakistan, to support the proposals
initiated by the government. Poor sovereign credit rating (SCR), peculiar to developing
countries, leads to difficulty in arranging debt financing for PPP projects (Chowdhury and
Charoenngam, 2009) and therefore, securing long-term debt financing in Pakistan is
difficult/problematic (Mubin and Ghaffar, 2008, ADB, 2015b). The government has to
provide sovereign guarantees to attract private investment. Noor, Khalfan and Maqsood
(2012) identified multiple barriers to non-traditional methods (BOT/BOOT/BOO) of
procurement in Pakistan which include a lack of understanding of methods, resistance to
change, issues related to project revenues, impact of environmental factors, and long
gestation period of PPP projects. Financial, economic and security situation of Pakistan is
believed to have increased the overall cost of doing business. Poor security situation of
Pakistan was reported as the most important impediment to project procurement and
implementation in the country. These issues in conjunction with risk of political instability
and immaturity of public sector organizations and institutions lead to a lack of investor
interest, both domestic and foreign. Significant delays in project initiation due to financial
issues have also been reported (Noor, 2011). Other barriers include loopholes in the dispute
resolution framework. An outdated Pakistan’s Arbitration Act (1940) is in force; the
Regulation and Enforcement Act (2011) ensures enforcement of international arbitral awards
does not apply to local courts (Economist Intelligence Unit, 2015). A recent review by ADB,
of the PPP frameworks in Punjab and Sindh provinces of Pakistan revealed three major
barriers, which include ‘weak PPP capacity in the government’; ‘lack of alignment between
various provincial PPP policy, legislative documents, and sector specific regulations (if
available)’; and ‘lack of off-budget viability gap funding’ (ADB, 2015b).
PPP Projects in Pakistan face political, financial, legal and regulatory, and project specific
risks (Soomro and Zhang, 2011; Tillmann, Robert and Shouqing, 2007; Economist
Intelligence Unit, 2015; Fraser, 2005). Moreover, Pakistan’s construction industry lacks risk
management maturity (includes all the main stakeholders i.e., clients, consultants and

52
contractors) (Choudhry and Iqbal, 2012). Public sector organizations tasked with project
procurement responsibilities don’t have a systematic risk management framework in place
and exhibit variation in risk management practices across federal and provincial boundaries
(Noor, 2011; Economist Intelligence Unit, 2015; PDD, 2011). According to a study
commissioned by the World Bank, optimal allocation of risks, including those that are
retained by the government, ‘is not well understood and likely to be underestimated’ (World
Bank, 2010).
In addition, a review of risk management research in the international PPPs risk management
domain emphasizes the need to study measures of effective risk management to determine
what influences the quality and success of risk management on PPP projects. Many failed
PPP projects have been reported to have suffered the ill fate due to inadequate risk
management efforts that occur as a result of low quality feasibility studies, poor contract
management, lack of experience and skills of the project company, inflexible contracts, and
lack of risk management maturity of project stakeholders, to name a few (Asian Business,
1996; European Commission, 2004; Ke, Wang and Chan, 2009; Lee and Schaufelberger,
2013; Loosemore and Cheung, 2015). Katrin et al. (2010) argued that there is a sheer lack of
attention towards the managerial aspect of risk management, specific to PPP projects. As
inefficiencies may be introduced due to a number of factors, there is a need to identify
significant measures that can potentially improve the risk management process outcomes i.e.,
positively influence risk identification, analysis (qualitative/quantitative), response planning,
and control.
Risk identification, analysis, and response planning form the core processes of the risk
management activity. Adequate risk analysis and equitable risk allocation on PPP projects are
essential for implementing and delivering successful projects (Chan et al., 2011). A number
of models exist to assess project risks (Zayed and Chang, 2002; Xu et al., 2010; Ke et al.,
2011), however, these models suffer from limitations that impact the accuracy of project risk
assessment. A notable limitation lies in treating project risk events/factors as independent of
each other, which can introduce errors in project risk assessment and subsequent decision
making by relevant stakeholders. Furthermore, the subjectivity inherent in human judgements
introduce uncertainty in risk evaluations and hence it must be catered for appropriately.
Project risk allocation between the public and private sector, termed as the most critical
exercise to ensure project success, is often done inefficiently by disregarding the necessity of
allocating risks based on the risk management capability paradigm (Arndt, 2000). Existing
models to assist fair risk allocation decisions (Ameyaw and Chan, 2016; Khazaeni, Khanzadi
and Afshar, 2012; Lam et al., 2007) accommodate human subjectivity and treat the risk
allocation exercise as a multi-attribute decision making (MADM) problem. However, these
models are either difficult to understand and apply or limited in application by prescribing
allocation of risks either generally or specific to a sector and do not provide a project specific
insight.
4. EXPLORATORY INTERVIEWS
In order to develop the objectives of the research and to provide a firm grounding in the
context of Pakistan, eight semi-structured interviews were conducted with key public (five)
and private sector (three) stakeholders in the Pakistani PPP infrastructure projects industry.
Questions asked included inquiries in to the risks impacting projects in each sector
(power/transport) over their lifecycle, an exploration of how the respective organizations

53
were practicing risk allocation on various projects, and issues relevant to the adequacy of risk
management efforts on PPP infrastructure projects. It was considered sufficient to limit the
interviews to eight PPP experts due to their senior positions and representation of the apex
public sector PPP infrastructure project procurement organizations in Pakistan, in both Power
and Transport infrastructure sectors. Furthermore, the respondents from the private sector
represent private firms that are involved in multiple PPP projects in Pakistan in various
states/provinces, thus harboring a broad-spectrum view of peculiarities of operating in
Pakistan. Based on the interviews of public and private sector stakeholders, problematic
factors were determined through content analysis and classified in to ten categories (Table 1).
The risks identified are diverse and impact the PPP project across all the phases of the project
life-cycle, which according to Liu et al. (2014), includes initiation and planning,
procurement, and partnership (construction, operation and maintenance) phase. Several
studies geared at identifying and assessing risks on PPP projects have been conducted
previously, either focusing on a specific infrastructure sector such as water, transport, or
power, or generally identifying risks across multiple sectors. The risk registers employed in
these studies share many common risk factors which lie in regulatory, political, financial,
partnership, market, technical, and operational domains (Thomas, Kalidindi and
Ananthanarayanan, 2003; Wibowo and Mohamed, 2010; Hwang, Zhao and Gay, 2013; Chan,
et al., 2014). Thomas, Kalidindi and Ananthanarayanan (2003) contended that risk
assessment is based on risk perceptions of individuals with regards to a risk exposure, and
that these perceptions are influenced by factors such as profit aspirations or investment in
each project, experience, risk communication, and geographical factors. These perceptions
not only determine the criticality of risks but may also influence how these risks will be
allocated. The difference of risk perception due to the contextual (sector/country) factors is
apparent from the review of top ranking/critical risk factors, which vary across the studies
mentioned above. Among the risk factors identified from the interviews, political violence,
country geopolitical situation, and issues related to capacity and capability of
institutions/organizations standout from other factors in the context of Pakistan, due to the
reasons discussed in the literature review. However, the criticality of the various risk factors
needs to be further established based on the broader concerns and perspective of all the key
stakeholders in Pakistan.
For both the power and transport sectors, interviewees (which represent federal government
organizations/authorities) contended that standard contract documents have been prepared
that pre-define the risk allocation regime between the public and private sectors. Negotiations
that may potentially alter this pre-defined structure of risk allocation are undesirable. This
practice ignores the fact that risk profile of project participants varies according to their
resources and capabilities (Ng and Loosemore, 2007), and hence a standard risk allocation
may not be suitable. Quiggin (2005) argued that standard form of PPP contracts rarely
provides prospects of optimum risk allocation in projects. For the transport sector, there is an
indication of diverse practices (at federal and provincial level) concerning risk allocation, as
evident from the literature, where the provinces seem to allow risk allocation negotiations on
a project basis (Economist Intelligence Unit, 2015; PDD, 2011). Which of these practices
serve the best interest of the public and private sectors, in the local context, is a question that
needs further investigation.
With regards to the factors that significantly influence risk management performance on PPP
projects, institutional capacity/maturity (public/private sector) was highlighted as a point of
major concern, the lack of which was considered as a significant cause of problems at the
pre-financial close stage for projects. One of the interviewee held the opinion that the projects

54
which bring foreign investment have seen good risk management efforts, principally
attributable to foreign experience and expertise of the lenders. Local lenders were also
maturing over time, however, the local lenders may be forced to act outside principles, at
times, under political influence. The interviewees also held that public sector lacked
understanding of risks and exhibited weak contract administration skills in privately financed
power projects. Another point
Table 1: Risk factors reported by interviewees
Risk category Risk factors
Political Political risk (Political violence, geopolitical situation, country political
stability), corruption, government intervention/interference, price change
Legal Small gaps in legal and regulatory framework
Natural Hydrological risks (hydropower projects), geological risks, flood risk, force
majeure, environmental risk (loss of or damage to biodiversity/environment)
Social Public opposition (opposition against high tolls)
Development
Development risk (late changes in government project procurement
requirements/policies resulting in loss of project development costs),
significant delays in financial closure, lack of competition, lack of
international participation in bidding, land acquisition, resource assessment
(wind/solar resource assessment data)
Construction Technology risk, poor quality (construction), construction equipment risk
(breakdown, repair and maintenance), project changes
Operation
Operations and maintenance risk, availability/performance risk, power
evacuation risks (lack of transmission infrastructure), input/resource risk
(supply/cost)
Economic
Poor local economy, poor global economy (escape or lack of interest of
western investors), inflation, foreign exchange (availability and volatility),
financing risk (local investors’ credibility/difficulty in attracting foreign
investment)
Market Demand risk, competition risk
Capacity /
Capability
Institutional capacity issues (lack of skilled manpower), turnover of public
sector officials (loss of corporate knowledge), high internal resistance to
PPPs (within public authorities – lack of ownership / understanding),
coordination issues between government departments,
long and protracted public decision making process, delays in obtaining
permit/licenses
raised by an interviewee was that sponsor characteristics such as foreign/local, experience,
risk attitude, capacity to absorb risks, etc., also matter when it comes to risk management on
projects. Proper planning and joint risk management were recommended to be effective in
solving issues on projects. For the transport/highway sector, the interviewees expressed
dissatisfaction with the pre-tender risk management efforts on projects, on behalf of the
public authority. It was argued that the government was particularly weak in understanding
risks and in exerting appropriate contract administration efforts. In addition, the interviewee
expressed dissatisfaction with the quality of pre-feasibility and feasibility studies conducted
by the government for the privately financed transport/highway infrastructure projects. It was
also contended that risk mitigation instruments (derivatives) are either not available or too
costly to employ. Lack of historical data over which to assess risks for upcoming projects was

55
also reported to be a barrier to effective risk management. Two of the interviewees expressed
that risk management plans are neither made nor managed by the public sector and that risks
are only discussed within the framework of contract agreements. One interviewee expressed a
great desire to develop detailed and specific risk management plans for PPP projects and
asserted that his organization had once procured services of an independent consultant for the
development of risk management plan for a previous project but the experience of the
interviewee was unsatisfactory.
5. RESEARCH AIM AND OBJECTIVES
In view of the state of research on risk management in PPP projects in Pakistan, the context
specific nature of risks, and the identified issues and knowledge gaps, the proposed research
seeks to establish a comprehensive understanding of the risks inherent in PPP projects in
Pakistan, and to present models to assess and allocate risks appropriately for future projects.
The research aims to achieve this goal by delivering the following objectives:
1. To investigate the project delivery trends in infrastructure procurement in the
Pakistani construction industry and to evaluate the scope of applicability and issues
related to the PPP model for infrastructure procurement
2. To develop and evaluate the measures of effective risk management (ERM) for PPP
infrastructure projects to enhance and complement the efficiency of risk management
efforts on projects
3. To identify risks, assess the stakeholders’ perceptions on identified risks, and to
develop a risk assessment model for PPP infrastructure projects
4. To develop a risk allocation model to assist efficient risk allocation on projects
6. RESEARCH METHODOLOGY
The overall research framework to achieve each of the above stated objectives is provided in
Figure 1. The project management body of knowledge by project management institute (PMI)
defines six processes for project risk management knowledge area (Project Management
Institute, 2013). Based on the issues identified from the literature review and the interviews,
the objectives set for this research aim to study key processes in the risk management
planning domain, including risk identification, analysis, and allocation (which is one of the
most critical risk response strategy), and go a step further to identify those attributes that
influence the overall effectiveness of the risk management activity. This research adopts a
mixed-methods approach involving qualitative and quantitative methods and data to identify
and assess relevant risk factors, risk allocation mechanism, and measures of effective risk
management, based on the literature review, interviews, case study, and questionnaire survey.

56
Figure 1: Overall research framework
6.1 Data Collection
Questionnaire surveys and case-studies have been employed widely in construction
management research in general, and PPP research in particular as the most popular research
methodologies (Zhang et al., 2016). For this research, a questionnaire instrument has been
developed that identifies various risk factors and measures of effective risk management,
based on a meticulous literature review and semi-structured interviews of public and private
sector experts from the local industry. A pilot study was also conducted with the local experts
to improve the survey questionnaire. Relevant stakeholders in the public and private sectors
have been invited to participate for data collection, including public authorities/public
infrastructure procurement departments/PPP units, investors (equity providers/lenders),
project companies (consortiums), consultants/transaction advisors etc. In addition, case-
studies will be conducted on real projects in each sector (power/transport infrastructure), to
assess risks and obtain information on actual risk allocation and risk management capability
of public and private sector stakeholders, to assist in development and validation of models
for project risk assessment and risk allocation.
6.2 Data Analysis and Model Development
The data collected from questionnaires will be subjected to quantitative analysis to rank the
factors (risks and measures of ERM) based on their criticality and importance, as applicable,
and to identify principal factors using factor analysis. A framework for promoting ERM on
PPP infrastructure projects will also be proposed based on the literature review, interviews,
and results of the survey. Keeping in view the above-mentioned limitations in the existing
models for project risk assessment and allocation, as a part of this research, quantitative
models will be developed to assist the stakeholders in the critical decision making during
project evaluation and risk allocation. Fuzzy set theory, proposed by Zadeh (1965), in
conjunction with suitable decision making techniques will be employed to overcome the
limitations in the existing models.
So far, based on completed literature review and semi-structured interviews, a questionnaire
instrument has been developed and piloted with the respondents from the interview panel.

57
Now, the data is being collected from relevant stakeholders in Pakistan, based on the
methodology specified above, and will be analyzed to develop models and to obtain the
research outcomes.
7. SIGNIFICANCE AND VALUE OF THE RESEARCH
Given the importance and the role of PPPs in the backdrop of a developing and under-
resourced economy of Pakistan and the lack of research in the national context, this research
has identified important objectives that will provide useful answers that determine the status
of risks beings faced by PPP projects and the state of management of such risks along with
recommendations to improve the situation, considering the expert opinion and reviewed
international best practices. Moreover, the research results will have implications,
internationally, as the proposed models potentially provide a superior ability to analyze data,
reliably, and will assist the decision makers in project risk assessment and allocation. The
proposed framework for effective risk management on PPP projects will be a unique addition
to the literature as it views project success from a narrowly focused, risk management process
based perspective which varies from the existing broad focused approaches of product or
project management success (Liu et al., 2015).
8. CONCLUSIONS
Project delivery using PPPs is gaining momentum in the Pakistani infrastructure industry,
however, the risks that plague these projects and their effective management has not been
studied systematically. Consequently, backed by an extensive literature review and semi-
structured interviews with relevant experts from the local industry, a research effort has been
initiated to identify the critical risks in the most active infrastructure sectors for PPP
procurement (power and transport), determine existing risk allocation practices, and develop
measures of effective risk management in combination with development of quantitative
models to assist the decision makers in reliably analyzing and allocating risks on PPP
projects. The paper presents the research framework, its significance, and results of the
preliminary data collected for this research. The proposed models are intended to be generic
so that the methodology can be applied to any project, irrespective of the country and
infrastructure sector contexts.
9. ACKNOWLEDGEMENT
Financial support from The Hong Kong Polytechnic University to carry out this research is
greatly appreciated.
10. REFERENCES
Ahsan, K. and Gunawan, I. (2010). Analysis of cost and schedule performance of international development
projects. International Journal of Project Management, 28(1), pp.68-78.
Allen & Overy (2010). Global guide to public-private partnerships. 1st ed. [online] London: Allen & Overy.
Available at: https://goo.gl/p7kpHv [Accessed: 19 Oct. 2016].
Ameyaw, E. E. and Chan, A. P. C. (2013). Identifying public‐private partnership (PPP) risks in managing water
supply projects in Ghana. Journal of Facilities Management, 11(2), pp.152-182.

58
Ameyaw, E. and Chan, A. P. C. (2016). A fuzzy approach for the allocation of risks in public–private
partnership water-infrastructure projects in developing countries. Journal of Infrastructure Systems, 22(3),
p. 4016016.
Arndt, R.H. (2000). Getting a fair deal: Efficient risk allocation in the private provision of infrastructure. PhD
Thesis. The University of Melbourne, Melbourne, Australia.
Asian Business (1996). Race to keep up with growth. Asian Business, 32(3), 4.
Asian Development Bank (ADB) (2015a). Country partnership strategy (2015-2019). [online] Asian
Development Bank. Available at: https://goo.gl/OIUWIx [Accessed: 21 Nov. 2016].
Asian Development Bank (ADB) (2015b). Public-private partnership in Pakistan. [online] Asian Development
Bank. Available at: https://goo.gl/1FaIz4 [Accessed: 22 Nov. 2016].
Associated Press of Pakistan (APP) (2016). CPEC attracting more investment in infrastructure development:
Dar. Associated Press of Pakistan. 04 Nov. [online] Available at: https://www.app.com.pk/cpec-attracting-
more-investment-in-infrastructure-development-dar/ (Accessed: 28 May 2017).
Baloi, D. and Price, A. D. F. (2003). Modelling global risk factors affecting construction cost performance.
International Journal of Project Management, 21(4), pp.261-269.
Beckett, M., Drazin, S., Finlay, D., Kingsley-Smith, H., Martin, N., Neathey, R., Robertson, J. and Wynniatt, M.
(2009) Performance of PFI Construction. [online] London: National Audit Office. Available at:
https://goo.gl/ez00WC [Accessed: 19 Oct. 2016].
Bhatti, R. (2015). To close infrastructure gap: country needs to invest 10 percent of GDP until, 2020: SBP.
Business Recorder. 27 March. [online] Available at: https://goo.gl/65GNcb [Accessed: 12 Feb. 2017].
Carbonara, N., Costantino, N., Gunnigan, L. and Pellegrino, R. (2015). Risk management in motorway PPP
projects: Empirical-based guidelines. Transport Reviews, 35(2), pp.162-182.
Chan, A.P.C., Lam, P.T.I., Wen, Y., Ameyaw, E.E., Wang, S. and Ke, Y. (2014). Cross-sectional analysis of
critical risk factors for PPP water projects in China. Journal of Infrastructure Systems, 21(1).
Chan, A.P.C., Yeung, J.F.Y., Yu, C.C.P., Wang, S.Q. and Ke, Y. (2011). Empirical study of risk assessment and
allocation of public-private partnership projects in China. Journal of Management in Engineering, 27(3),
pp.136–148.
Choudhry, R. and Iqbal, K. (2012). Identification of Risk Management System in Construction Industry in
Pakistan. Journal of Management in Engineering, 29(1), pp.42-49.
Chowdhury, A. N. and Charoenngam, C. (2009). Factors influencing finance on IPP projects in Asia: A legal
framework to reach the goal. International Journal of Project Management, 27(1), pp.51-58.
Dey, P. K. and Ogunlana, S. O. (2004). Selection and application of risk management tools and techniques for
build-operate-transfer projects. Industrial Management and Data Systems, 104(3), pp.334-346.
East Asia Analytical Unit (1998). Asia's infrastructure in the crisis: harnessing private enterprise, Dept. of
Foreign Affairs and Trade: Canberra.
Economist Intelligence Unit (2015). Evaluating the environment for public-private partnerships in Asia-Pacific:
The, 2014 Infrascope. [online] Asian Development Bank. Available at: https://goo.gl/V9sgdK [Accessed:
16 Nov. 2016).
European Commission (2004). Resource book on PPP case studies. 1st ed. [online] Brussels: Europenan
Commission, Directorate-General Regional Policy. Available at:
http://ec.europa.eu/regional_policy/sources/docgener/guides/pppresourcebook.pdf [Accessed: 19 July
2016).
Federal Highway Administration (FHWA) (2013). Guidebook for risk assessment in public private
partnerships. 1st ed. [online] Federal Highway Administration, US Department of Transportation. Available
at: https://www.fhwa.dot.gov/ipd/pdfs/p3/p3_guidebook_risk_assessment_030314.pdf [Accessed: 19 Oct.
2016).
Fraser, J. M. (2005). Lessons from the independent private power experience in Pakistan. 1st ed. [online]
Washington, DC: The International Bank for Reconstruction
and Development/The World Bank. Available from: https://goo.gl/R9c3zC [Accessed: 02 Jan. 2017].
Government of Pakistan (GoP) (2010). Pakistan policy on public private partnerships: private participation in
infrastructure for better public services. [online] Available at: https://goo.gl/a1m63z [Accessed: 22 Nov.,
2016).
Grimsey, D. and Lewis, M. (2007). Public private partnerships: The worldwide revolution in infrastructure
provision and project finance. Edward Elgar Publishing.
Haider, M. (2016). Govt establishes fund for mega projects. The News. 14 May. [online] Available at:
https://www.thenews.com.pk/print/119799-Govt-establishes-fund-for-mega-projects [Accessed: 12 Feb.
2017].
Hodge, G. A. and Greve, C. (2007). Public-private partnerships: An international performance review. Public
Administration Review, 67(3), pp.545-558.

59
Hussain, K. (2017). German companies express interest in CPEC projects. The Express Tribune. 12 May.
[online] Available at: https://goo.gl/V9C5gO (Accessed: 28 May 2017).
Hwang, B., Zhao, X. and Gay, M.J.S. (2013). Public private partnership projects in Singapore: Factors, critical
risks and preferred risk allocation from the perspective of contractors. International Journal of Project
Management, 31(3), pp.424–433.
Katrin, F., Katja, L., Alexander, R. and Hans Wilhelm, A. (2010). An integrated risk management system
(IRMS) for PPP projects. Journal of Financial Management of Property and Construction, 15(3), pp.260-
282.
Ke, Y. J., Wang, S. Q. and Chan, A. P. C. (2009). 'Public-Private Partnerships in China’s infrastructure
development: lessons learnt' In: Wamelink, H., Prins, M. & Geraedlts, R., (eds) Proceedings of the
International Conference on Changing Roles: New Roles and New Challenges, Oct. 5-9, 2009, TU Delft,
The Netherlands, pp. 177-188.
Ke, Y., Wang, S., Chan, A.P.C. and Cheung, E. (2011). Understanding the risks in China’s PPP projects:
Ranking of their probability and consequence. Engineering, Construction and Architectural Management,
18(5), pp.481–496.
Khan, A. H., Jamil, M. and Sattar, M. (2008). The trend of build operate and transfer (BOT) projects in
Pakistan. In: Lodi, S. H., Ahmed, S. M. Farooqi, R. U. and Saqib, M. (eds) Proceedings of the First
International Conference on Construction In Developing Countries (ICCIDC–I): Advancing and
Integrating Construction Education, Research & Practice, Aug. 4-5, 2008, NED University of Engineering
& Technology, Karachi, pp. 88-97.
Khazaeni, G., Khanzadi, M. and Afshar, A. (2012). Optimum risk allocation model for construction contracts:
fuzzy TOPSIS approach. Canadian Journal of Civil Engineering, 39(7), pp.789–800.
Lam, K.C., Wang, D., Lee, P.T.K. and Tsang, Y.T. (2007). Modelling risk allocation decision in construction
contracts. International Journal of Project Management, 25(5) pp.485–493.
Lee, N. and Schaufelberger, J. (2013). Risk Management Strategies for Privatized Infrastructure Projects: Study
of the Build–Operate–Transfer Approach in East Asia and the Pacific. Journal of Management in
Engineering, 30(3), p.05014001.
Liu, J., Love, P. E. D., Smith, J., Regan, M., and Davis, P. R. (2014). Conceptual framework for the
performance measurement of publicprivate partnerships. Journal of Infrastructure Systems, 21(1),
p.04014023.
Liu, J., Love, P. E. D., Smith, J., Regan, M. and Davis, P. R. (2015). Life Cycle Critical Success Factors for
Public-Private Partnership Infrastructure Projects. Journal of Management in Engineering, 31(5),
p.04014073.
Loosemore, M. and Cheung, E. (2015). Implementing systems thinking to manage risk in public private
partnership projects. International Journal of Project Management, 33(6), 1325-1334.
Malik, A. R. (2015). A miracle on the Indus river?. The Diplomat. 7 December. [online] Available at:
http://thediplomat.com/2015/12/a-miracle-on-the-indus-river/ (Accessed: 04 Jan., 2017).
Martini, C. and Lee, D. (1996). Difficulties in infrastructure financing. Journal of Applied Finance and
Investment, 1(1), pp.24-7.
Ministry of Planning, Development, and Reform (2017). FAQS | China-Pakistan Economic Corridor (CPEC)
Official Website. [online] Available at: http://www.cpec.gov.pk/faqs [Accessed: 26 Nov. 2016].
Mirza, J. (2017). Japan wants Pakistan to open CPEC for other countries. The News. 16 May. [online] Available
at: https://goo.gl/PCcy7Y (Accessed: 28 May 2017).
Mubin, S. and Ghaffar, A. (2008). BOT Contracts: Applicability in Pakistan for infrastructure development.
Pakistan Journal of Engineering and Applied Sciences, 3, pp.33-46.
Ng, A. and Loosemore, M. (2007). Risk allocation in the private provision of public infrastructure. International
Journal of Project Management, 25(1), 66-76.
Noor, M. A. (2011). Investigating the role of procurement practices in effective implementation of infrastructure
projects in a developing country: A case of Pakistan. Ph.D, RMIT University, Melbourne.
Noor, M. A., Khalfan, M. M. A. and Maqsood, T. (2012). Methods used to procure infrastructure projects in
Pakistan: an overview. International Journal of Procurement Management, 5(6), pp.733-752.
Planning and Development Department (2011). Risk management manual for public-private partnerships in
infrastructure. 1st ed. [online] Planning & Development Department, Government of Punjab. Available at:
https://goo.gl/d1xGD4 (Accessed: 19 Oct. 2016).
Project Management Institute (2013). A guide to the Project Management Body of Knowledge (PMBOK guide).
Newtown Square, Pa.: Project Management Institute.
Quiggin, J. (2005). Public-private partnerships: Options for improved risk allocation. Australian Economic
Review, 38(4), pp.445-450.
Raisbeck, P., Duffield, C. and Xu, M. (2010). Comparative performance of PPPs and traditional procurement in
australia. Construction Management and Economics, 28(4), pp.345-359.

60
Rana, S. (2015). UK to partner in CPEC, provide $121.6 million grant. The Express Tribune. 01 Sept. [online]
Available at: https://goo.gl/ep9onF (Accessed: 28 May 2017).
Schwab, K. (2015). The global competitiveness report, 2015-2016: Full data edition. [online] Geneva: World
Economic Forum. Available at: https://goo.gl/0WLCMh (Accessed: 15 Jan. 2017).
Shaoul, J., Stafford, A. and Stapleton, P. (2006). Highway robbery? A financial analysis of design, build,
finance and operate (DBFO) in UK roads. Transport Reviews, 26(3), pp.257-274.
Shaukat, A., Choudhry, R. and Gabriel, H. (2011). Comparison of project delivery methods used in building
construction projects. In: Ahmed S. M., Adnan H., Panthi K., Azhar S., Takim R., and Bozai G., (eds)
Proceedings of the Sixth International Conference on Construction in the 21st Century (CITC-VI):
Construction Challenges in the New Decade, July 5-7, 2011, CITC-VI, Kuala Lumpur, Malaysia, pp.
468.76
Soomro, M. A. and Zhang, X. (2011). Analytical review on transportation public private partnerships failures.
International Journal of Sustainable Construction Engineering and Technology, 2(2).
The Nation (2017). Public private partnership bill approved with amendments. The Nation. [online] Available
at: https://goo.gl/KighG3 (Accessed: 08 April 2017).
The News (2017). France eyes business opportunities offered under CPEC. The News. 05 April. [online]
Available at: https://goo.gl/zOndxM (Accessed: 28 May 2017).
Thomas, A. V, Kalidindi, S.N. and Ananthanarayanan, K. (2003). Risk perception analysis of BOT road project
participants in India. Construction Management and Economics, 21(4), pp.393–407.
Tillmann, S., Robert, T. and Shou Qing, W. (2007). Analysis of political risks and opportunities in public
private partnerships (PPP) in China and selected Asian countries: Survey results. Chinese Management
Studies, 1(2), pp.126-148.
Wibowo, A. and Mohamed, S. (2010). Risk criticality and allocation in privatised water supply projects in
Indonesia. International Journal of Project Management, 28(5), pp.504–513.
World Bank (2010). Pakistan - Operational design for the project development fund and for the viability gap
fund, [online] Washington, DC: World Bank. Available at: https://goo.gl/Y4xCyf (Accessed: 20 Nov.
2016).
World Bank (2015). World Development Indicators (GDP ranking, 2015). [online] Available at:
http://data.worldbank.org/data-catalog/GDP-ranking-table (Accessed: 12 Feb. 2017).
World Bank (2016a). Private participation in infrastructure database. [online] Available at:
http://ppi.worldbank.org/ (Accessed: 26 Nov. 2016).
World Bank (2016b). World development indicators (Population, Total). [online] Available at:
https://goo.gl/jatFMC (Accessed: 12 Feb. 2017).
Xu, Y., Yeung, J.F.Y., Chan, A.P.C., Chan, D.W.M., Wang, S.Q. and Ke, Y. (2010). Developing a risk
assessment model for PPP projects in China-A fuzzy synthetic evaluation approach. Automation in
Construction, 19(7), pp.929–943.
Zadeh, L. A. (1965). Fuzzy sets. Information and Control, 8(3), pp.338-353.
Zhang, X. (2005). Critical success factors for public-private partnerships in infrastructure development. Journal
of Construction Engineering and Management, 131(1), pp.3-14.
Zhang, S., Chan, A.P.C., Feng, Y., Duan, H. and Ke, Y. (2016). Critical review on PPP research – A search
from the Chinese and international journals. International Journal of Project Management, 34(4), pp.597–
612.
Zayed, T.M. and Chang, L.M. (2002). Prototype model for build-operate-transfer risk assessment. Journal of
Management in Engineering, 18(1), pp.7–16.

61
ID 132
TARGET COST CONTRACTS AND THE DEVELOPMENT OF
COLLABORATIVE BEHAVIOURS AND VALUE FOR MONEY IN THE
UK CONSTRUCTION INDUSTRY
A. Smith and G. Wood
School of the Built Environment, University of Salford, Salford, M5 4WT, UK
Email: [email protected]
Abstract:TCCs are seen to be an effective procurement model through aligning the objectives
of the parties to reduce costs and many clients are now turning to them in a bid to obtain value
for money. This research paper investigates the extent to which TCCs promote collaborative
behaviours and provide value for money within the UK construction industry. More
particularly, the research explores the following: which projects TCCs should be used on and
how the maturity of the design when agreeing the target cost can affect value for money; how
setting both the target cost and the pain/gain mechanism can affect the incentivisation of the
contractor to minimise costs; the extent to which TCCs promote collaboration between the
contractor, client and supply chain; and what is required to manage a TCC post-contract to
ensure that incentivisation is maintained. It is apparent that TCCs are complex procurement
models which require extensive consideration and management to ensure parties are
incentivised to minimise costs. The research also reveals that although TCCs can promote
collaborative behaviours and provide value for money, there is a prerequisite to doing so:
developing and managing the TCC correctly to ensure that the objectives of the parties are
aligned.
Keywords: Target Cost, Value, Collaboration, Pain:Gain
1. INTRODUCTION
1.1 Background
Incentivisation contracts have long been used in the UK construction industry in order to
align the objectives of the parties to a construction contract to achieve better performance. A
TCC is a type of incentive contracting commonly used on projects within the UK
construction industry. TCCs seek to align the objectives of the parties which helps create a
collaborative environment (Bresnen & Marshall, 2000). TCCs were created for use on large
infrastructure projects which were complex and high risk due to unknown ground conditions
(Heaphy, 2011). Due to their success on these projects their use has grown year on year with
standard TCC forms of contract such as the NEC options C and D being established.
TCCs are associated with reimbursable contracts as the contractor is reimbursed the actual
defined costs incurred in carrying out the works. However, unlike reimbursable contracts, the
financial risks of projects are shared by both the contractor and client through the use of a
pain/gain mechanism. A pain/gain mechanism is employed so that any underspend or
overspend against the pre-agreed contractual target cost is shared between the parties. If the
actual costs are lower than the target, the client and contractor will share the savings based on
the pre-agreed share ratio. Conversely, if the actual costs exceed the target, both parties will
share any overspend based on the pre-agreed share ratio. The sharing of risk through the
pain/gain mechanism should actively encourage parties to collaborate to manage and reduce
costs to a minimum (Lewedon, 2017 & RICS, 2014).

62
During recent years, TCCs have become increasingly popular within the UK construction
industry as clients look to obtain value for money through incentivising contractors (RICS,
2017). The UK Government Construction Strategy recognises TCCs as a cost led
procurement model capable of producing the 15-20% cost savings required for public sector
construction projects by 2015 (Cabinet Office, 2012). TCCs have successfully provided
value for money on a variety of recent major projects such as Heathrow Airport Terminal 5,
Crossrail Procurement Strategy and the 2012 Olympic and Paralympics Games Infrastructure.
However, they have also proved unsuccessful on other projects. Within AMEC v Secretary
of State for Defence (2013), value for money was not achieved and disputes arose over who
was liable to pay cost overruns above the Guaranteed Maximum Price Target Cost (RPC,
2013).
Although it is understood that TCCs in theory should reduce costs through aligning the
objectives of the parties, often clients are disillusioned with the financial outcome of TCCs.
As the popularity of TCCs has grown in the UK construction industry, clients are questioning
whether they really do provide value for money. It seems that it is only in certain
circumstances where prerequisites are met, that TCCs promote collaboration and provide
value for money. Clients need to be fully aware of the implications of TCCs and the
requirements to provide value for money prior to using them.
1.2 Aims and Objectives
The overall research aim is to investigate the extent to which TCCs promote collaborative
behaviours and provide value for money in the UK construction industry. The objectives of
this research are to:
explore which projects are suitable for use with a TCC and how the development of
design can affect value for money when agreeing the target costs;
analyse how setting the target cost and pain/gain mechanism can affect the incentivisation
of the contractor to reduce costs;
assess whether TCCs promote collaboration between the client and contractor;
evaluate what is required to manage a TCC post-contract to maintain incentivisation.
In order to achieve the aim of this research paper, the methodology included a literature
review of a large body of existing literature. The pre-existing literature has been examined
and analysed to build the argument that TCCs do promote collaboration and provide value for
money, but only when parties fully understand the contract process.
2. CRITICAL REVIEW OF LITERATURE
2.1 Introduction
This part of the research paper has been split into four sections. The first section looks at
which projects are appropriate for TCCs and how the level of design at the time the target
cost is agreed influences value for money. The second section looks at how setting the target
cost itself and the pain/gain mechanism can influence value for money through aligning the
objectives of the parties. The third section looks at the extent to which TCCs can influence
collaboration. The final section explores what is required post-contract award to ensure that
collaboration and incentivisation are maintained to achieve value for money.

63
2.2 Value for Money in Target Cost Contracts
TCCs intend to promote collaboration and provide value for money through incentivising the
contractor to control costs. The main constituents of TCCs include the target cost, the fee and
the share formula (Perry & Thompson, 1982). The target cost is agreed between both parties
normally through a competitive procedure and should reflect a best estimate of likely outturn
costs to deliver the scope of work. The fee covers overheads and profit for the contractor and
is normally a fixed percentage. The share formula introduces the incentive into the contract
by determining how any savings or cost overruns against the target cost will be shared
between the parties. Scottish Futures Trust [SFT] (2016, p30), within their review of Scottish
public sector procurement, state that “the principle benefit of target cost arrangements is their
ability to align the objectives of the parties, which helps to create a partnering environment”.
Further, they argue that as objectives are aligned, the parties are encouraged to work together
to control costs, sharing the risk through the pre-agreed pain/gain mechanism.
In order to achieve value for money on any project, the most appropriate contract needs to be
selected. A study of the use of TCCs was undertaken by Perry & Thompson (1982) within
the CIRIA 85 report which is still very influential within the field today. Within this report,
they identify that high risk projects where costs are likely to escalate are appropriate for
TCCs. This is because TCCs offer more flexibility in terms of change than typical fixed
priced contracts. Broome (1999), who has provided influential literature on TCCs, agrees
with Perry and Thompson that TCCs are appropriate for projects when a high level of design
change is anticipated and thus flexibility is required. It is also suggested by various sources
that TCCs are not suitable for low value contracts as they contain the burden of high
administrative costs through the use of unfamiliar administrative procedures such as open
book accounting (Broome, 1999; Lewedon, n.d.; Hughes & Gruneberg, 2009). Therefore,
for smaller projects with minimal to medium levels of risk, clients should look to use
alternative contracting models to provide value for money.
Within the literature, there is no general consensus on how defined the scope of works/design
needs to be at the point the target cost is calculated. Various sources suggest that TCCs can
be useful and may be the most appropriate contract where the extent of work to be carried out
has not been fully defined (Broome, 1999; McInnis, 2001; Fenwick Elliot, 2016). The reason
behind this argument is that a target cost can be agreed based on an initial specification and
can be amended following confirmation of the final specification following contract award.
Heaphy (2011) recognises that as work can commence based on an initial design and target
cost, earlier starts on site can be achieved when compared with traditional lump-sum
contracts. This can provide value for money to the client as the project should in theory
finish earlier if a TCC is selected over a lump-sum contract.
Conversely, a different view established within the literature is that value for money will only
be secured if the contract is let with a well-defined target cost to enable the contractor to be
able to price the works accurately (SFT, 2016; Lewedon, n.d.; International Law Office,
2003). Rawlinson (2007) agrees with this viewpoint that value for money is not achieved on
insufficiently defined projects. He suggests that TCCs should be used on well-defined
projects with a full set of works information as loosely defined projects provide the contractor
with the opportunity to renegotiate the target cost through design amendments. Research
undertaken by Tirole (1986) demonstrates that contractors will be less incentivised to
minimise costs if there are future opportunities to renegotiate the target cost. Brumm (1992)
further develops this viewpoint, suggesting that TCCs in fact incentivise contractors to

64
propose frequent modifications in order to increase the target instead of reducing actual costs.
Where this is the case value for money will be significantly compromised.
Drawing on the research, it needs to be recognised that a sufficient level of design does need
to be defined to allow a target cost to be agreed which reflects a best estimate of likely
outturn costs. Although Broome (1999) suggests that TCCs are suitable for contracts where
the extent of work is not fully designed, he does highlight that the scope of work still needs to
be ‘sufficiently’ developed. If the scope of work is insufficiently developed, then the
contractor will have numerous opportunities to renegotiate the target cost and may
subsequently focus their efforts on increasing the target to maximise gain-share potential
rather than creating efficiencies. Moreover, TCCs which involve large amounts of scope
change present significant risks to the client in terms of value for money. This is because if
the scope and value of contract changes significantly so that changes are assessed
retrospectively, then TCCs can easily become fully reimbursable contracts (Broome, 1999).
Value for money is not achieved on reimbursable contracts as the contractor is not
incentivised to control costs. Therefore, although the design does not need to be complete,
clients should ensure that they have an adequate level of design to enable a target cost to be
set that, although may need firming up as the design is finalised, will not require drastic
changes.
Furthermore, value for money can also be affected on TCCs by reduced quality standards as a
consequence of contractors trying to minimise costs to increase gain-share potential. Kwawu
& Laryea (2013) argue that with cost often being the biggest element of risk in contracting,
incentivisation contracts tend to focus on cost which impacts other areas of the project. Both
quality and time become less important than completing under the target cost and
subsequently these aspects of TCCs can be neglected. Contractors may look to rush work,
reduce quality of materials or use in-experienced and cheaper resources to minimise costs. In
the long term this can affect value for money due to higher maintenance and repair costs. To
the contrary, Perry & Thompson (1982) and McInnis (2001) argue that quality and time are
also principle elements which clients wish to control through the use of TCCs. This is
because in order to minimise costs, contractors are incentivised to complete on time and to
maintain quality standards through minimising defects. As pre-completion defects form part
of the defined cost, but do not constitute an increase to the target cost, the contractor is
incentivised to keep defects to a minimum to increase gain-share potential (Fenwick Elliot,
2016). Therefore, although cost is the main focus, both time and quality should not be
adversely impacted as a result of using TCCs.
2.3 Setting the Target Cost & Pain/Gain Mechanism
The target cost and pain/gain mechanism are fundamental in aligning the objectives of the
parties and driving the right behaviours to reduce costs and obtain value for money. It is
therefore vital that clients understand the implications of setting target costs and pain/gain
mechanisms.
Target Costs
Within his paper to the Society of Construction Law, Heaphy (2011, p.1) a partner at EC
Harris Law firm, defines a target cost as a “genuine pre-estimate of the most likely outturn
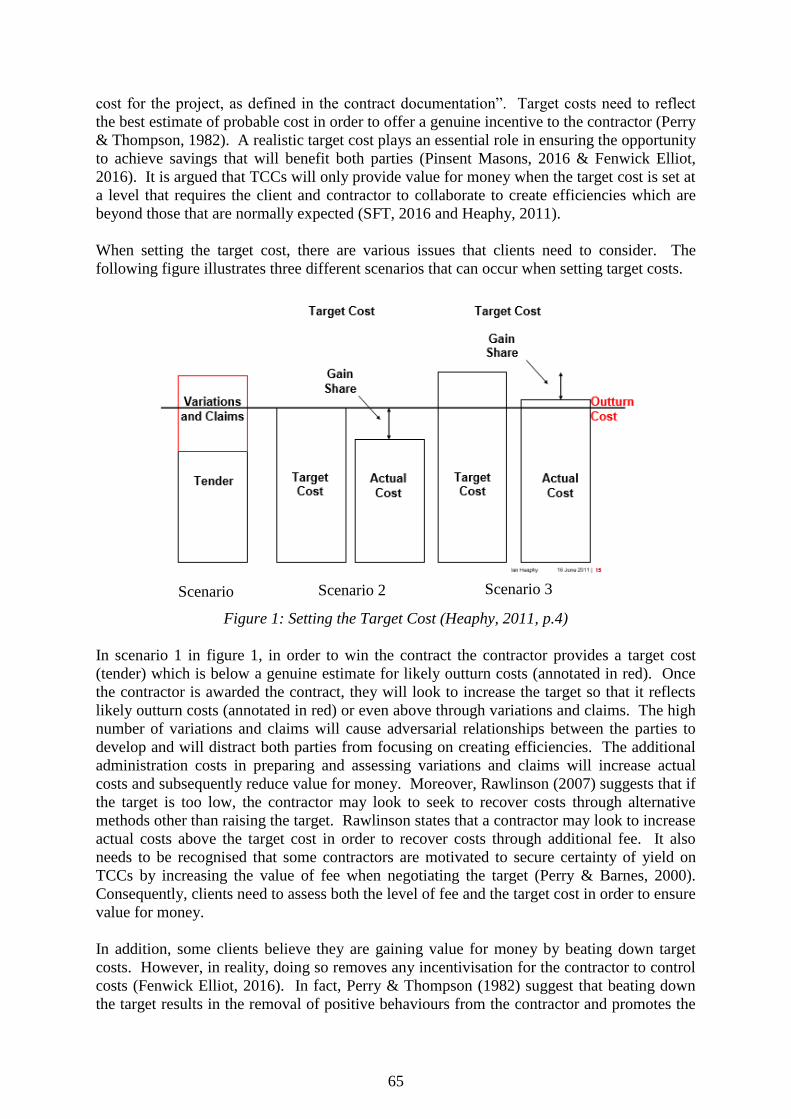
65
cost for the project, as defined in the contract documentation”. Target costs need to reflect
the best estimate of probable cost in order to offer a genuine incentive to the contractor (Perry
& Thompson, 1982). A realistic target cost plays an essential role in ensuring the opportunity
to achieve savings that will benefit both parties (Pinsent Masons, 2016 & Fenwick Elliot,
2016). It is argued that TCCs will only provide value for money when the target cost is set at
a level that requires the client and contractor to collaborate to create efficiencies which are
beyond those that are normally expected (SFT, 2016 and Heaphy, 2011).
When setting the target cost, there are various issues that clients need to consider. The
following figure illustrates three different scenarios that can occur when setting target costs.
Figure 1: Setting the Target Cost (Heaphy, 2011, p.4)
In scenario 1 in figure 1, in order to win the contract the contractor provides a target cost
(tender) which is below a genuine estimate for likely outturn costs (annotated in red). Once
the contractor is awarded the contract, they will look to increase the target so that it reflects
likely outturn costs (annotated in red) or even above through variations and claims. The high
number of variations and claims will cause adversarial relationships between the parties to
develop and will distract both parties from focusing on creating efficiencies. The additional
administration costs in preparing and assessing variations and claims will increase actual
costs and subsequently reduce value for money. Moreover, Rawlinson (2007) suggests that if
the target is too low, the contractor may look to seek to recover costs through alternative
methods other than raising the target. Rawlinson states that a contractor may look to increase
actual costs above the target cost in order to recover costs through additional fee. It also
needs to be recognised that some contractors are motivated to secure certainty of yield on
TCCs by increasing the value of fee when negotiating the target (Perry & Barnes, 2000).
Consequently, clients need to assess both the level of fee and the target cost in order to ensure
value for money.
In addition, some clients believe they are gaining value for money by beating down target
costs. However, in reality, doing so removes any incentivisation for the contractor to control
costs (Fenwick Elliot, 2016). In fact, Perry & Thompson (1982) suggest that beating down
the target results in the removal of positive behaviours from the contractor and promotes the
Scenario
1
Scenario 2 Scenario 3

66
wrong behaviours. Subsequently, instead of aiming to lower the target cost as much as
possible which can damage relationships, clients should ensure that the target cost reflects a
best estimate of likely outturn costs. Scenario 2 in figure 1 shows a target cost which
represents a best estimate of likely outturn cost. With a genuine target that reflects the scope
of work, the contractor can focus on creating efficiencies to increase potential gain-share.
Value for money is likely to be obtained in scenario 2 as both parties are focusing on creating
efficiencies.
Scenario 3 in figure 1 however will not provide value for money to the client. In this
scenario, the target cost agreed does not represent a best estimate of likely outturn cost
(annotated in red) as it is overinflated. Wamuziri & Seywright (2005) recognise that creating
efficiencies on TCCs is not the only way contractors can maximise their payoff. They
suggest that seeking an inflated target, illustrated in scenario 3, helps maximise payoff.
Clients need to be wary of inflated target costs as they remove any incentive for the
contractor to create efficiencies and subsequently impair value for money. Inflated targets
may reward the contractor through gain-share for ordinary or poor performance, completing
the work at the expected outturn cost or even above (Heaphy, 2011).
Furthermore, in order to achieve value for money on TCCs, clients require sufficient
knowledge and experience to be able to accurately estimate the likely outturn costs of the
project (Designing Buildings Wiki, 2017). Fisher (1969) in his evaluation of incentive
contracting in the defence sector recognises that more accurate methods of determining target
costs will increase value for money potential rather than elaborative incentive sharing
arrangements. In order to obtain an accurate target cost, clients need “good cost reporting
information systems from historical projects, improved costs analysis and estimating
capability” (Wamuziri & Seywright, 2005). In addition, in order to ensure the target is
robust, clients should seek to use experts to challenge the costs provided by the contractor
(Heaphy, 2011).
Pain / Gain Share
Heaphy (2011) and SFT (2016) both recognise that the pain/gain mechanism is the key driver
in achieving value for money and contractor efficiency in TCCs. The pain/gain mechanism is
tantamount in aligning the objectives of the parties to reduce costs and therefore it is essential
that clients understand the implications of setting the pain/gain mechanism (Heaphy, 2011).
Within the literature, there is no general consensus on the ideal sharing ratio to achieve value
for money. Weitzman (1980) suggests that the optimal sharing ratio depends on the
contractor’s ability to reduce costs, risk aversion and project uncertainty.
The most common share ratio adopted is a straight 50/50 split between the contractor and
client. A large body of research advocates that clients should avoid setting the contractor’s
share at less than 50% as this removes any incentivisation for the contractor to control costs
(Weitzman, 1980; Perry & Barnes, 2000; Williams, Williams & Ryall, 2013; Broome, 1999;
& Heaphy, 2011). The reason being is that contractors will not be incentivised to create
efficiencies if savings are not shared on an equal basis (Pinsent Masons, 2016). If a share
percentage less than 50% is allocated to the contractor, they may look to increase the target
cost to maximise pay off instead of focusing on creating efficiencies. Heaphy (2011) also
argues that the straight 50/50 split is the simplest share method that helps to drive partnering
behaviours as the risk is shared equally. If the share formula is weighted in favour of one

67
party, then the incentive power can be effected as parties are not seen to be working equally
(Williams, Williams & Ryall, 2013).
Research undertaken by Wood (2005), within an RICS research paper which involved
interviews with 10 national contractors, highlights examples of TCCs where clients had
implemented unfair sharing mechanisms which were considered to contradict the spirit of
partnering. Within the research, one contractor provided an example of where all underspend
against the target cost was allocated to the client. Where this is the case, the contractor will
not be incentivised to create efficiencies and consequently both collaboration and value for
money will be jeopardised.
When considering a straight 50/50 split, clients need to determine the contractor’s potential to
reduce costs. Weitzman (1980) argues that where the contractor has great potential to reduce
costs through contributing to the development of the design, then they should benefit from a
share ratio above 50%. To the contrary, Broome (2002) believes that if there is limited
potential for the contractor to provide large costs savings then the split should also be above
50% to motivate contractors. Although clients need to ensure that contractors have the
potential to reduce costs, they also need to ensure that the potential is limited in order to
motivate the contractor to create efficiencies which are beyond those normally expected. To
create efficiencies beyond those normally expected, clients should ensure that value
engineering has been undertaken prior to agreeing the target cost and share ratio.
Clients also need be aware of the potential ability of other stakeholders to reduce costs. Perry
& Thompson (1982) suggest that the engineer or designer has a considerable influence on the
execution of a contract and subsequently can affect the ability of a contractor to meet a target.
Subsequently, Perry & Thompson (1982) suggest that engineers are linked into the pain/gain
mechanism. However, Williams, Williams & Ryall (2013) argue that linking numerous
parties into the pain/gain mechanism contractually can be complex and time consuming
which can reduce value for money. It is therefore advisable that clients should only look to
include designers and subcontractors into the sharing mechanism if they have a substantial
potential to reduce costs, otherwise value for money could be compromised.
Moreover, although most contractors will usually request a share ratio above 50%, this is not
always the case. This is because a straight 50/50 split can affect a contractor’s profit margin
if the actual costs far exceed the target (Perry & Thompson, 1982). Therefore, on high risk
projects, contractors may not want to bear the risk associated with a 50% split, especially
where the contractor’s potential to control costs is limited. Enforcing a 50% split on a high
risk project, where the contractor has limited potential to control costs will result in less value
for money. This is because the target cost will be inflated with risk due to cost uncertainty.
In addition, the contractor will look to renegotiate the target cost through claims and
variations in order to further reduce his risk of overspend. Subsequently, when setting the
share ratio, client’s need to consider the contractors risk aversion as implementing a high
ratio could significantly impair value for money depending on the organisation.
Broome (1999), within his previous research has advocated that the contractor’s share not be
less than 50%. Despite this and contrary to the views of others (Weitzman, 1980; Heaphy,
2011; Perry & Barnes, 2000), Broome (2013) now suggests that this may not always be the
case. Developing on his previous research, Broome (2013) now suggests that where the
client is larger than the contractor and is better able to carry the risk, then the cost overrun
above a certain percentage should entirely lie with the client. Alternatively, if the contractor

68
is a large organisation, then it may be advisable to cap the over run at 100% to the contractor
as they have the financial capacity to bear the risk (Broome, 2013). Where the over spend is
fully allocated to the contractor the contract becomes a guaranteed maximum price (GMP)
contract. It needs to be recognised that where there is a GMP, once the contractor is
perceived to complete the project above the target cost, the client will be substantially less
motivated to reduce costs (Broome & Perry, 2002). Where this happens, collaboration and
value for money will be impaired as disputes are likely to arise if the contractor feels they are
entitled to an increase to the target cost to limit their pain exposure.
Clients also need to consider whether they intend to work with the same contractor in the
future on similar projects. Wood (2005) suggests that clients who are going to work with
contractors on future schemes tend to be more generous when setting the share ratio because
of the potential to replicate any savings on subsequent projects. Increasing the contractor’s
share will incentivise the contractor to create efficiencies on the first project which will
benefit the client in terms of value for money on future schemes.
It can be concluded from the research that setting the share ratio is complex and requires a
substantial amount of consideration. Clients need to provide sufficient time to review the
impact of different share ratios in order to ensure that the optimum share ratio is employed
that aligns the objectives of the parties to provide value for money.
2.4 Collaboration in Target Cost Contracts
Collaboration is a key success factor in ensuring value for money is achieved on projects.
There is a strong consensus in the existing literature suggesting that TCCs promote
collaboration in projects. Various studies (Perry & Thompson, 1982; Heaphy, 2011; Broome,
1999) highlight that the principle benefit of target cost arrangements is their ability to align
the objectives of the parties, which helps create a partnering environment and a resulting
identity of interest. Further studies (Hughes, Williams & Zhaomin, 2012; Constructing
Excellence, 2011; Bresnen & Marshall, 2000) also suggest that target cost arrangements
deliver value for money through creating a collaborative working environment by aligning
the objectives of the parties. The contractor is aligned to the client’s objective to minimise
costs in order to increase their profit margin.
Conversely, research undertaken by Williams, Williams & Ryall (2013), which involved
interviews with industry professionals who have experience managing TCCs, disagrees with
this general consensus by suggesting that TCCs create a misalignment of objectives between
the client, contractor and design team as parties are motivated for different things. This is
because the client is motivated by cost, time and quality, the contractor just profit and the
design team just quality. In order for collaboration to occur and thus value for money, clients
need to ensure that the objectives of all key stakeholders are aligned. Although the research
undertaken by Williams, Williams & Ryall (2013) involved personnel experience of
interviewees, and therefore does not represent all professional views, the professionals
interviewed had years of experience managing TCCs and therefore their direct experience is
important to consider. Therefore, in order to align the client’s time objective to the
contractor, clients should look to use bonus payments or liquidated damages. In order to
incentivise the design team and main subcontractors to reduce costs, clients should include
the design team and main subcontractors into the contractual pain/gain mechanism.

69
When the objectives between parties are aligned in TCCs, they should reduce conflict and
adversarial relationships associated with other types of contracts. McInnis (2001) argues that
TCCs promote teamwork, in replacement of the traditional adversarial relationships and
claims conscious attitudes normally associated with traditional procurement methods.
Further, numerous studies (Kawau & Laryea, 2013; Eriksson, Atkin & Nilsson, 2009) argue
that the sharing of risk and the high level of cooperation associated with TCCs reduces the
occurrence and opportunity of conflicts and disputes occurring.
The high level of cooperation present in TCCs stems from the use of open book accounting
which enables trust to be built between the parties. Perry & Thompson (1982) argue that the
use of open book accounting on TCCs reduces the number of claims greatly and simplifies
the resolution of claims that do occur. The openness of information through open book
accounting increases confidence and should lead to greater collaboration through the closer
alignment of motivation (Perry & Barnes, 2000). In addition, as the client has access to the
accounts and records of the contractors actual costs, agreeing variations is easier and less
confrontational than with other forms of contract (Heaphy, 2011). Heaphy also suggests that
open book accounting will deter contractors from wasting time applying for claims which
cannot be justified and will instead focus this time on seeking efficiencies, thus providing
value for money. Subsequently, it can be concluded that the use of open book accounting
should in theory reduce disputes due to a greater level of collaboration.
Although there is a large body of research recognising TCCs ability to promote collaboration,
there are various sources that believe TCCs promote adversarial behaviours. SFT (2016) and
Fenwick Elliot (2016) suggest that the use of open book accounting can in fact cause disputes
and adversarial behaviours to occur when the client scrutinises the contractor’s cost records
to ensure they are valid. As the client has access to the contractor’s cost records, difficulty
can arise when agreeing variations if the contractor submits a quotation inflated with risk to
increase the target cost and thus potential gain-share. Broome (1999) recognises that where
this is the case, the objectives and motivations of the parties are not aligned.
Similarly, Williams, Williams & Ryall (2013) agree with the aforementioned sources that
TCCs can promote adversarial behaviours by suggesting there is a need for the contractor to
be claims conscious. This statement can be explained by referring back to scenario 1 in
figure 1 where the contractor submits a low target cost to win the work. With a low target,
the contractor will try to increase the target cost through overinflated variations and claims.
Consequently, it can be argued that TCCs which contain low targets will discourage
collaboration and promote adversarial relationships as there will be an increased number of
claims and disputes put forward by the contractor. Therefore, as aforementioned, it is
imperative that target costs are not set too low as doing so will drive the wrong behaviours
which will impair value for money.
It is also needs to be recognised that TCCs require clear definitions of what is payable and
disallowable under the contract. If the contract does not define payable and disallowable
costs then disputes are likely to arise. Therefore, is it essential that the contract explicitly
states what is payable in order to promote collaboration and reduce disputes and claims.
It can be concluded that when the target cost and share ratio are set at a level which
encourages the contractor to reduce costs, collaboration will increase due to the alignment of
objectives. However, Rose & Manly (2010) recognise that although TCCs are intended to
promote collaboration in the whole supply chain, a criticism in the published literature is that
they only incentivise the client and contractor only. Other sources (SFC, 2016 and

70
Rawlinson, 2007) suggest that TCCs incentivise the contractor, subcontractors and suppliers
to reduce costs and promote collaboration in the whole supply chain. Although TCCs can
incentivise all of the aforementioned parties, SFT and Rawlinson do not state how this can be
achieved. Williams, Williams & Ryall (2013) recognise that to deliver a gain under a TCC it
requires collaboration not just between the contractor and client but also between the
consultants, sub-contractors, design team, supply chain and manufacturers. This is because
TCCs do not incentivise other stakeholders to minimise costs if they are not linked into the
share ratio. Subsequently, in order to incentivise the key stakeholders, who have a high
potential to reduce costs, they need to be linked into the share ratio to benefit from creating
efficiencies. This will ensure that all key players who can affect cost performance are
motivated to control costs, thus providing value for money.
2.5 Managing Target Cost Contracts Post Contract Award
The previous sections within this paper have predominantly focused on how pre-contract
activities affect value for money on TCCs. However, clients need to recognise that post-
contract management on TCCs is essential in providing value for money. Without good TCC
post-contract management, incentivisation to control costs will be lost and value for money
will be jeopardised.
In order to achieve value for money, clients need to recognise that TCCs involve the client
carrying a greater amount of risk than they would do with conventional priced contracts
(Perry & Barnes, 2000). Often, problems arise where the client does not realise they are
carrying a greater amount of risk than compared with a fixed price contract. They then do not
manage this additional risk properly. This can result in the target cost not being amended to
reflect scope, and subsequently the share mechanism becoming invalid. Where this occurs
the contract may revert to an entirely reimbursable basis and value for money will be
jeopardised (SFC, 2016). To prevent this from happening, clients need to be aware that
TCCs involve clients bearing greater risk than fixed priced contracts and therefore require
greater amount of resources to manage post-contract.
Furthermore, as TCCs are a complex contracting mechanism, which are administratively
heavy, they require competent project managers as effective project management is a key
instrument in ensuring benefits are realised by both parties (Fenwick Elliot, 2016 &
Rawlinson, 2007). A common issue that inhibits value for money on TCCs is recognised by
Perry & Thompson (1982) who suggest that site personnel who lack proper TCC training
may not understand the significance of the target cost and may subsequently treat and manage
the contract as if it were reimbursable. Further, the administrative demands of TCCs create a
risk that the link between the target cost and actual cost could be lost and the client could be
exposed to a significant transfer of risk (Rawlinson, 2007). As a result, in order to maintain
incentivisation and value for money potential, it is essential that competent professionals who
have experience and training on how to manage TCCs are employed.
Broome and Perry (2002) highlight that the use of open book accounting on TCCs places an
extra burden on the client in terms of administration costs as additional time is required to
assess subcontractors, types of resources and calculation of productivities. Other studies
(Williams, Williams & Ryall, 2013; Lewedon, n.d.; Chan et al, 2011) agree with Broome &
Perry, proposing that TCCs are often criticised for the additional time and cost required for
administration due to unfamiliar administration procedures such as open book accounting

71
which impair value for money. They agree that greater client involvement is essential in
TCCs and that competent professionals are required. If good purchasing and post-contract
management are not present on TCCs then value for money will be impaired as
incentivisation will not be maintained.
Although the previous sources referred to suggest that TCCs increase administration costs,
Perry & Thompson (1982) believe that TCCs can in fact reduce administration costs in
comparison with other procurement models. They suggest that due to the improved facility
for evaluating change and the greater collaboration between the parties, the protracted
negotiation of claims should be reduced. Therefore, it can be argued that although TCCs are
resource intensive, they may actually be less resource intensive when compared with fixed
priced contracts where great amounts of change are present. This is because open book
accounting should allow for easier agreement of variations and the final account and should
therefore reduce the number of disputes as compared with fixed priced contracts whereby the
client does not have access to the contractor’s records.
The most important factor in maintaining incentivisation post-contract is to ensure that the
target cost remains visible to the contractor. To do so, clients need to ensure that the target is
adjusted for variations so that it reflects the latest scope of work. Heaphy (2011) highlights
that in order to maintain the target cost; changes need to be agreed as soon as they occur. A
key factor which is often neglected in managing TCCs is agreeing change as soon as it
occurs. Not agreeing change prior to or at the time it occurs means that the increase to the
target cost will be based on actual costs incurred. If the target is being increased based on
actual costs, the contractor will not be incentivised to create efficiencies and the contract
essentially becomes fully reimbursable. Target costs which are unmaintained for long
periods and do not reflect actual scope can result in the sharing mechanisms becoming
invalid. Where this occurs, the contract will revert to an entirely reimbursable basis and
value for money will be impaired.
Moreover, it is fundamental that both parties understand what constitutes a legitimate change
to the target cost under the contract to reduce the potential of claims and disputes occurring.
The contract needs to identify the risks which the contractor cannot manage and are therefore
at the client’s risk. These client’s risks need to be clearly stipulated in the contract
documentation and if any materialise, the contractor shall be entitled to an increase to the
target (Broome, 2002). In addition, Perry & Barnes (2000) highlight that the project manager
needs to be fair when assessing target cost adjustments as reliable and fair methods of target
adjustments are an important component of successful TCCs. They also highlight the
importance of precise and clear definitions of actual cost and fee within the contract. Doing
so will reduce the administrative costs in time spent preparing and rejecting claims and time
spent disallowing costs in payment applications.
3. CONCLUSIONS
In summary, this paper has investigated the extent to which TCCs promote collaborative
behaviours and provide value for money in the UK construction industry. The following part
of the conclusion revisits the objectives of the paper and summarises the findings.
The literature review has revealed that TCCs are favourable to provide value for money when
used on high risk, complex and large projects where change is likely to occur. The flexibility

72
that TCCs provide will enable change to be administered more efficiently than if a fixed price
contract is selected. Value for money will be compromised when using TCCs on simple, low
value and low risk projects due to the complexity of the contract and high administrative
burdens.
This paper further recognises that TCCs are useful contracting models for projects where the
design has not yet been finalised. However, it has become apparent that ensuring an adequate
level of design is completed prior to going out to the market will enable a contractor to
provide a more accurate target cost. Further, the more developed the design, the fewer
opportunities the contractor will have to renegotiate the target cost. Subsequently, they will
be more focused on creating efficiencies and providing value for money rather than seeking
to increase the target.
The literature review has also revealed that value for money is likely to be achieved on
projects where the target cost is set at a level which reflects a genuine pre-estimate of the
most likely outturn cost for a project. Doing so incentivises the contractor to focus on
creating efficiencies to increase gain-share potential. Target costs that are too low and are
over inflated with risk cause the objectives of the parties to become unaligned and thus value
for money will be impaired.
It is evident that the pain/gain mechanism is the core driver of aligning the parties’ objectives
to work collaboratively to achieve value for money. There are a variety of share ratios that
can be employed and the optimal share ratio depends on the project conditions. The research
has revealed that there is a strong consensus advocating that the share ratio to the contractor
not be set any less than 50% as doing so removes incentivisation to reduce costs. Further, it
appears that adopting a straight 50/50 split may be the most desirable share ratio due to the
simplicity and impartiality of sharing risk equally. However, clients need to recognise that a
50% share ratio may not always be the optimum share ratio to promote collaboration and
provide value for money. Clients need to consider the contractor’s ability to reduce costs,
risk aversion and project uncertainty to ensure that the optimal share ratio is employed.
The research has also identified that in certain projects, it may be necessary to incentivise all
key supply chain members including the design team through the pain/gain mechanism if
they have a strong potential to reduce costs. However, this paper has not analysed how far
down the supply chain the share ratio should be employed. It has become apparent that this is
an area for further research and consideration.
In addition, the research suggests that there is a strong consensus that TCCs do promote
collaborative behaviours: reducing conflict, disputes and adversarial relationships. The
literature suggests that collaboration prospers through the alignment of the objectives of the
parties through the pain/gain mechanism and through the use of open book accounting.
However, the research also recognises that collaboration can be significantly impaired when
the objectives of the parties become unaligned. The research suggests that TCCs promote
collaborative behaviours when: the target cost reflects a best estimate of likely outturn costs;
the pain/gain mechanism aligns the objectives of the parties; open book accounting is not
abused through clients scrutinising cost records; the contract explicitly defines payable and
disallowable costs; and the contract explicitly states what constitutes a change to the target
cost. It needs to be recognised that although TCCs provide the foundation for collaboration to
prosper, collaboration still relies upon the willingness of personnel to co-operate.
Furthermore, this research has highlighted that TCCs often do not promote collaboration
throughout the supply chain. Many contracts are let with only the contractor and client linked

73
into the pain/gain mechanism. It has become apparent that on certain projects other
stakeholders have a strong potential to reduce costs. Subsequently, not including these key
stakeholders into the share mechanism drives the wrong behaviours and can significantly
impair value for money.
Finally, it is evident that good contract management on TCCs is a fundamental requirement
in ensuring value for money. Clients need to recognise that they are bearing a greater amount
of risk with a TCC than they would be with a fixed priced contract. Thus, competent
resources are required to manage the contract and ensure that the target cost is maintained.
This involves agreeing change as soon as it occurs to ensure that the target cost reflects the
scope of work and the pain/gain mechanism remains valid.
The overall conclusion that can be drawn from the research is that TCCs are a complex
procurement model which are capable of promoting collaborative behaviours and providing
value for money in the UK construction industry but only when they are developed and
managed correctly to ensure that the objectives of the parties are aligned. Further research
and consideration is required on this subject in order to establish further how clients can align
the objectives of all key parties to achieve value for money.
4. REFERENCES
Bresnen, M. & Marshall, N. (2000). Motivation, commitment and the use of incentives in partnerships and
alliances. Construction Management and Economics, 18(5), 587-98.
Broome, J. (1999). The NEC Engineering and Construction Contract: A user’s guide. London: Thomas Telford
Publishing.
Broome, J. (2002). Procurement Routes for Partnering: A Practical Guide. London: Thomas Telford
Publishing.
Broome, J. & Perry, J. (2002). How practitioners set share fractions in target cost contracts. International
Journal of Project Management. 20, 59-66.
Broome, J. (2013). How to intelligently set the Contractor’s share percentages and share ranges. Retrieved 20
February, 2017, from https://builtintelligence.com/blogs/opinions-blog/9101211-how-to-intelligently-set-
the-contractor-s-share-percentages-and-share-ranges
Brumm, H., J. (1992). Incentives in incentive contracting: an application of the MIMIC model. Applied
Economics, 24, 337-345.
Cabinet Office. (2012). Government Construction Strategy: Final Report to Government by the Procurement /
Lean Client Task Group, July 2012.
Chan, D., W., Chan., A., P., Lam, P., T., & Wong, J., M. (2011). An empirical survey of the motives and
benefits of adopting guaranteed maximum price and target cost contracts in construction. International
Journal of Project Management., 29, 577-590
Constructing Excellence. (2011). The business case for lowest price tendering. Retrieved 20 March, 2017, from
http://constructingexcellence.org.uk/wp-content/uploads/2015/01/CE-business-case-against-lowest-price-
tendering-May-2011.pdf
Designing Buildings Wiki. (2017). Target cost for construction. Retrieved 18 February, 2017, from
https://www.designingbuildings.co.uk/wiki/Target_cost_for_construction
Eriksson, P., Atkin, B., & Nilsson, T. (2009). Overcoming barriers to partnering through cooperative
procurement procedures. Engineering, Construction and Architectural Management, 16(6), 598-611.
Fenwick Elliot. (2016). NEC 3 and Target Cost Contracts: Defined Costs, Disallowed Costs and Defects.
Retrieved 20 March, 2017, from http://www.fenwickelliott.com/research-insight/newsletters/insight/62
Fisher, I., N. (1969). An evaluation of incentive contracting experience. Naval Research Logistics Quarterly,
16(1), 63-83.
Heaphy, I. (2011). Do Target Cost Contracts Deliver Value for Money? A paper presented to the Society of
Construction Law. Society of Construction Law.
Hughes, W. & Gruneberg, S. (2009). Review of Performance-Based Contraction, Reading: School of
Construction Management and Engineering, University of Reading

74
Hughes, D., Williams, T. & Zhaomin, R (2012). Is incentivisation significant in ensuring successful partnered
projects. Engineering, Construction and Architectural Management, 19(3), 306-319.
International Law Office (2003). Target Cost Contracts – the Lawyer’s Perspective. Retrieved 12 March, 2017,
from http://www.internationallawoffice.com/Newsletters/Construction/United-Kingdom/Shadbolt-
Co/Target-Cost-Contracts-the-Lawyers-Perspective
Kwawu, W. & Laryea, S. (2013). Incentive contracting in construction. In: Smith, S.D & Ahiaga-Dagbui, D.D
(Eds) Procs 29th Annual ARCOM Conference, 2-4, Reading, UK, Association of Researchers in
Construction Management, 729-738.
Lewedon, S. (n.d). The Use of NEC: Engineering and Construction. Retrieved 15 August, 2017, from
https://www.waterways.org.uk/pdf/restoration/the_use_of_nec__engineering_and_construction_contract
McInnis, A. (2001). The New Engineering Contract: A legal Commentary. London: Thomas Telford
Publishing.
Perry, J., G. & Barnes, M. (2000). Target Cost Contracts: an analysis of the interplay between fee, target, share
and price. Engineering, Construction, and Architectural Management, 7(2), 202-8.
Perry, J., G. & Thompson, P., A. (1982). CIRIA Report 85; Target cost-reimbursable construction contracts.
CIRIA: London.
Pinsent Masons. (2016). Innovation in the Supply Chain. Theory and practice of innovation in construction.
Retrieved 22 March, 2017, from https://www.pinsentmasons.com/PDF/2016/Innovation-in-the-supply-
chain.pdf
Rawlinson, S. (2007). Procurement: Target price contracts. Retrieved 10 March, 2017, from
http://www.building.co.uk/procurement-target-price-contracts/3095062.article
Reynolds Porter Chamberlain [RPC]. (2013). Cost Overruns in Target Cost contracts. Retrieved 10 March,
2017, from https://www.rpc.co.uk/perspectives/built-environment/costs-overruns-in-target-costs-contracts
RICS. (2014). RICS guidance note, UK; Appropriate contract selection (1st ed.). Royal Institution of Chartered
Surveyors (RICS): Coventry, UK.
RICS. (2017). Working with Target Cost Contracts. Retrieved 16 April, 2017, from
http://www.rics.org/uk/training-events/training-courses/working-with-target-cost-contracts-/london121/
Rose, T. & Manly, K. (2010). Client recommendations for financial incentives on construction projects.
Engineering, Construction and Architectural Management, 17(3), 252-267
Scottish Futures Trust [SFT]. (2016). Review of Scottish Public Sector Procurement in Construction. Retrieved
http://www.scottishfuturestrust.org.uk/files/publications/Guidance_on_Procurement_Strategy_16_17_18_Fi
nal_26July16.pdf
Tirole, J. (1986). Procurement and renegotiation. Journal of Political Economy, 94(2), 235-9.
Weitzman, M., L. (1980). Efficient incentive contracts. Quarterly Journal of Economics, 94(4), 719-730.
Williams, T., Williams, M. & Ryall, P. (2013). Target cost contracts: adopting innovative incentive
mechanisms to improve the project delivery process. In: Smith, S.D. & Ahiaga-Dagbui, D.D (Eds) Procs
29th Annual ARCOM Conference, 2-4, Reading, UK, Association of Researchers in Construction
Management, 759-768.
Wamuziri, S. & Seywright, A. (2005). Risk sharing and effective incentives in collaborative procurement. In:
Khosrowshahi, F. (Ed.), 21st Annual ARCOM Conference, 7-9 September 2005, SOAS, University of
London. Association of Researchers in Construction Management, Vol 2, 1175-84.
Wood, G. (2005). Partnering practice in the relationship between clients and main contractors. RICS Research
paper series. 5(2), 19.
5. CASES
AMEC Group Limited v Secretary of State for Defence [2013] EWHC 110

75
ID 133
CASE STUDY AS RESEARCH STRATEGY FOR INVESTIGATING
BARRIERS TO ACHIEVEMENT OF VALUE FOR MONEY IN
NIGERIAN PUBLIC CONSTRUCTION PROCUREMENT
I. D. Obieje and G. Wood
School of the Built Environment, University of Salford, Salford, M5 4WT, UK
Email: [email protected]
Abstract: A research strategy is an important element of a research design which provide the
overall direction for the research to enable it to achieve its objectives. For doctoral research
students, selection and justification of a research strategy as appropriate to their research
problem is key to successful completion. The implementation of Nigeria’s Public Procurement
Act (2007) to public construction procurement over the years has achieved little in-terms of its
aim for value for money. Existing knowledge on this problem indicate apparent lack of in-
depth qualitative understanding based on real-life construction project context. This paper
posits that there are prospects for in-depth understanding of the problem through the
application of the case study research strategy. The justifications for this position includes: the
suitability of the strategy for achieving the research objective of gaining rich understanding of
context and process being enacted, the form of research question investigated, suitability of
case study strategy compared with alternative research strategies and the successful
application of case study strategy in previous similar studies. A rich picture understanding of
the barriers limiting the achievement of value for money based on a real-life project context
could lead to suggestions on how future improvement can be made.
Keywords: Case Study, Public Construction Procurement, Value for Money.
1. INTRODUCTION
A research design is the conceptual structure within which research is organized and
conducted. It essentially comprises of the plans and procedures that span the decisions from
broad assumptions to detailed method of data collection and analysis (Walliman, 2006;
Creswell, 2009; Easterby-Smith, 2015). A research design provides a framework for the
collection and analysis of data and subsequently indicates which research strategy is most
appropriate (Walliman, 2006, p. 42; Bryman, 2008). The design of a research would depend
on the nature of the problem being investigated; how the research questions will be answered
and the goal is to arrive at an operational plan that is most appropriate to the problem being
investigated (Yin, 2014).
A research strategy as an element of a research design, provides the overall direction of the
research including the route by which the research would be conducted (Wadawatta, et al,
2011). According to Saunders, et al, (2009), choice of strategy is guided by a number of
factors, including: the research question and objectives, the extent of existing knowledge, the
amount of time and other resources available to the researcher and the philosophical
assumptions guiding the study. Common research strategies include (Saunders, et al, 2009):
Experiment, Survey, Case Study, Action research, Grounded theory, Ethnography and
Archival research. No research strategy is innately superior or inferior to any other, the goal
in selecting a strategy is to arrive at one that is most appropriate to the problem being
investigated.

76
This paper presents the rationale for selecting case study strategy as an appropriate strategy
for investigating the barriers to achievement of value for money in public construction
procurement in Nigeria under the regulatory framework of the Nigeria public procurement
Act of 2007. This is part of an on-going doctoral research aimed at developing a framework
for the implementation of the Nigerian Public Procurement Act (2007) that will improve the
opportunity for achievement of value for money on public construction projects.
Terminologies such as “research method”, “research strategy”, “research approach”, found in
Research methodology literatures for example, Yin (2014); Creswell (2009), Saunders, et al,
(2009), Naoum, 2013, Easterby-Smith (2015), etc., are often used to mean different things by
different authors and this can sometimes be very confusing, especially for a doctoral
researcher. To provide clarity and consistency, this paper adopted mainly the terms and
general meaning of the terminologies as defined in the Research “onion” model proposed by
Saunders, et al (2009).
2. BACKGROUND TO THE RESEARCH PROBLEM
In 2007, the Nigerian legislative arm of government enacted an Act of Parliament known as
the Public Procurement Act (PPA 2007) to govern the public-sector procurements. The PPA
(2007) amongst other objectives, aim to achieve value for money in government
procurement. Value for money is a phrase in common use, but for practical purposes,
attaching a precise meaning to it has been described as inconsistent and problematic
(MacDonald, et al, 2012; Glendinning, 1988). According to MacDonald, et al, (2012) there is
lack of consistency in the definition of value for money resulting from aspects of it which can
be interpreted differently: the dimensions of value and timeframe of evaluation. This
notwithstanding, a common feature from most definitions is the multi-dimension
understanding of value from a broad perspective, encompassing not just the intuitive
economic aspect of cost savings but also the criteria for efficiency and effectiveness
(Glendinning, 1988; HM Treasury, 2006; Barnett, et al, 2010; DFID, 2011; Eze, 2012;
National Office Audit, 2013).
The reality for public construction projects in Nigeria would suggest that there is a limited
scope of achievement of the PPA (2007) aim for value for money. Symptoms indicating that
there are problems with public construction procurements in-terms of achievement of value
for money evident in literature includes: high cost of construction works, construction cost
over-runs, construction time over-runs, poor quality of works, increasing cases of re-work,
use of in-efficient procurement strategies, and abandonment of projects (Bima, et al, 2015;
Ajayi & Oyeyipo, 2015; Adegboye, 2014; Ekung, et al, 2013; Ade-ojo & Babalola, 2013;
Shittu, et al 2013; Shwarka & Anigbogu, 2012; Onyema, 2011; Ibrahim & Musa-Haddary,
2010; Ayangade, et al, 2009; Olatunji, 2008). What is not evident in literature is what is
causing the problem.
Literature search also reveal that the implementation of the PPA (2007) is faced with many
challenges which mitigate its effective implementation. Familoye, et al, (2015) collated
sixteen (16) of these challenges and assessed them to determine the most significant through
quantitative survey of public procurement practitioners’ opinion. It concluded that
procurement practitioners ranked ‘Size and Complexity of procurement’, ‘Political
interference’ and ‘Shortage of public procurement practitioners’ as the top three (3)

77
significant challenges facing the effective implementation of PPA (2007). It did not however,
provide evidence towards what can be concluded in terms of the ability of the PPA (2007)
achieving its stated aims on account of these implementation challenges.
Furthermore, examination of literature sources reveal that evidence in support of the
implementation challenges mainly relied on secondary data sources and a few from
practitioners’ collective reflections and experiences across a number projects over some
period of time based on a quantitative survey. There appears a knowledge gap mainly due to
lack of evidence based on in-depth qualitative rich picture understanding of the
implementation of PPA (2007) on construction project. Likewise, the scope of these
implementations challenges on a real-life construction project and their implication on
achievement of value for money objective of the PPA (20007) is largely unknown because
literature sources lacked evidence based on a real-life project context. For a more complete
understanding of the problems that affect construction performance, Love, et al, (2002) &
Dainty (2008) both advocated the need for a robust investigation that consider all
philosophical viewpoints.
This paper therefore contends that for a better understanding of the problems with public
construction procurement in Nigeria in-terms of achievement of value for money, there is
need for in-depth qualitative investigation of the implementation of PPA (2007) on a real-life
public construction project to obtain a richer picture and more profound understanding of
experiences on a project by project basis. This could help explain why the PPA (2007) is
underachieving and lead to suggestions on how future improvements can be made. The case
study strategy provides the opportunity for gaining rich understanding of context and process
being enacted and has its niche where a “how” and “why” question is being asked about a
contemporary set of events (Saunders, et al, 2009; Yin, 2014). According to Proverbs &
Gameson (2008), the case study strategy is highly relevant to a project driven industry like
construction but have low level application among construction management researchers.
3. CASE STUDY RESEARCH STRATEGY
Yin (2014) provides a comprehensive definition of case study as an empirical inquiry that:
Investigates a contemporary phenomenon in depth and within its real-life context,
especially when the boundaries between phenomenon and context are not clearly
evident.
Copes with technically distinctive situation in which there will be many more
variables of interest than data points, and as on result
Relies on multiple sources of evidence, with data needing to converge in a
triangulating fashion, and as another result
Benefits from prior development of theoretical propositions to guide data collection
and analysis.
The data for case studies come from variety of sources including observations, interviews,
questionnaires, reports and archival records and this gives the researcher the advantage of
arriving at a consensus of findings that could be considered robust (Fellows & Liu, 2008;
Proverbs and Gameson, 2008).

78
There are positivists criticisms of case study strategy for lack of scientific rigor, that they
rarely allow generalizations to be made from specific cases to the general population and they
produce large amount of data, which allow researchers to make any interpretations they want
(Easterby-Smith, et al, 2015). However, a contrasting position, more relevant to the position
of this paper, is the constructionist view point of case study strategy, which is more less
concerned with issues of validity, but more concerned with providing a rich picture of life
and behavior in organizations or groups by investigating cases because of their unique
features, which may or may not be generalizable to other contexts. (Easterby-Smith, et al,
2015).
Yin (2014) identified five important components of research design for a case study:
1. Study’s Question
2. Its Propositions or Purpose (if any)
3. The Units of analyses
4. The logic linking the data to the proposition; and
5. The criteria for interpreting the findings.
In response to the positivist criticism, it is suggested that making clear decision on this these
components prior to data collection would to some degree demonstrate rigor and improve
validity (Easterby-Smith, et al, 2015).
4. THE UNIT OF ANALYSES
The Unit of analyses component of Case study design is related to the fundamental problem
of defining what the case is (Yin, 2014). According to Proverbs and Gameson (2008), the unit
of analyses is a key issue in identifying and selecting case(s), and in the context of the built
environment, unit of analyses maybe a construction project, a company or organization, or an
individual or group of individuals such as project managers, architects, etc.
The unit of analyses suggested by this paper for investigating the barriers to achievement of
value for money is the construction project. This is on ground that the judgement for
achievement of value for money is determined by the value or benefits derived from the
project outcome. To understand why PPA (2007) is having limited scope of achievement in
terms of value for money and how this may be improved, data collected from the selected
construction projects will be used to assess how value for money has been achieved (or not
achieved), the enablers and barriers to achievement of value for money, the effects the
implementation challenges of PPA (2007) have on the capability of the regulations to support
achievement of value for money, what has gone well or not gone well on the project, and
why. Relying on multiple sources of information for answers, as typical with the case study
strategy, could result to a robust understanding of the problem and lead to suggestions on
how future improvements may be made.
5. CASE STUDY DESIGNS AND TYPE PROPOSED
Yin (2014) categorized Case study designs into four basic types based on two distinguishing
factors; whether they are single or multiple case and whether they are holistic or embedded:
79
Type 1 – Single-case (holistic) designs
Type 2 – Single-case (embedded) designs
Type 3 – Multiple-case (holistic) designs
Type 4 – Multiple-case (embedded) designs
The primary distinction in designing case studies is between single-case dealing with only
one case or multiple-case dealing with more than one case (Yin, 2014). Embedded case,
distinguished from holistic case, occurs when in the same single-case (or multiple-case)
attention is given to a subunit or subunits of analyses.
According to Yin (2014), there are five rationales for assessing when the single-case is an
appropriate design. These are when the case represents a critical case, an unusual case, a
common case, a revelatory case or a longitudinal case. On the other hand, Saunders, et al,
(2009) suggested that the rationale for using multiple cases focuses upon the need to establish
whether the findings of the first case occur in other cases and, therefore the need to generalize
from these findings. According to Proverbs & Gameson (2008), results from investigations
based on a single-case will to some extent be treated with some degree of circumspection
because no one can be sure how the results apply to other cases. In contrast, evidence from
multiple cases are often considered more compelling and the overall study is regarded as
being more robust (Yin, 2014).
Therefore, this paper favors the choice of the multiple-case (holistic) design over a single-
case design. Consideration for this was for a more compelling evidence that could lead to
some level of generalizability of the research outcome and for a better data saturation. For a
start, three public sector construction projects were selected, one each form Nigeria’s main
three geo-political regions of North, South-East and South-west. The construction project is
the unit of analyses and each project represent a ‘common case’ public construction
procurement. Using a replication logic, the paper proposes to establish whether the findings
from one case occur in the other cases. Again, Proverbs & Gameson, (2008) suggests that
when results from multiple-cases support each other, the evidence will always be more
compelling. The study proposes to continue adding cases as necessary to achieve data
saturation.
6. RATIONALE FOR CHOOSING CASE STUDY STRATEGY
The case study strategy has been considered as a more appropriate strategy over other
alternative strategies for the research problem at hand due to a number of reasons. Firstly, the
strategy is more advantageous for the achievement of the research objectives as it provides
the opportunity for rich in-depth investigation on a real-life project context. Review of
existing knowledge on the research problem generally indicate lack of evidence based on in-
depth qualitative investigation on a real-life project context. Case Study strategy provides a
good prospect for contributions towards filling this knowledge gap.
Secondly, the Case Study strategy has also been considered over other strategies because of
the form of the research question. The form of research question, according to Yin (2014), is
one of three factors to consider while deciding upon an appropriate strategy and recommends
case study to be more appropriate for answering the “how” and “why” research questions.

80
Table 1 shows the consideration that has been made relating to three conditions to satisfy
while deciding upon case study strategy.
Table 1- Consideration of Situations Relevant for Different Research Strategies (Adapted
from Yin, 2014)
Method
[Strategy]
Form of
research
question
Requires
control of
behaviora
l events
Focuses on
contemporar
y events?
Consideration for this
Research
Experiment How,
Why?
yes yes Not selected because
behavioral control is not
practical for the research
subject
Survey Who,
What,
Where,
How many,
How
much?
no yes Not selected because the
suggested form of research
question is not consistent with
the research question being
investigated
Archival
analyses
Who,
What,
Where,
How many,
How much
No Yes/no Not selected because the
suggested form of research
question is not consistent with
the research question being
investigated
History How,
Why?
no no Not selected because the
research need to focus on
contemporary events
Case Study How, why? no yes Selected because of the
research focus on
contemporary events which
requires no behavioral control.
The suggested form of research
question is also consistent with
the research question
investigated
Thirdly, the suitability of Case Study strategy compared with strategies for the study at hand
was considered, and case study strategy remained the most suitable. While Action research
provides an alternative strategy for achieving the research objective for in-depth
understanding based on a real-life context, it has not been selected mainly due to practical
reasons. Action research, is a research in action to bring about a change, where the researcher
is often part of the change process (Saunders, et al, 2009; Easterby-Smith, 2015). There are
concerns with the length of time of typical public construction procurement from start to
finish required for the often-iterative procedure to cause and evaluate a change compared
with the period for a full-time PhD study. Also, the researcher is not an employee of a public-
sector organization and therefore unrestricted access was a genuine concern. Perhaps, Action

81
research can be considered next best alternative as it is also compactible with the research
aim of making suggestions that will bringing about a change.
Similarly, Grounded theory and Ethnography strategies, although presents opportunity for in-
depth qualitative data in-line with the research objectives, were also not considered suitable.
Grounded theory involves the development of theory from primary data (Easterby-Smith, et
al, 2015). In contrast, the proposed study does not aim to develop theory, but to understand a
phenomenon in a real-life context; why the PPA (2007) is having limited achievement in-
terms of value for money and how achievement of value for money may be improved, partly
relying on existing theory. Ethnography on the other hand, requires the researcher to be
immersed in the setting of the social world being studied as completely as possible in a way
to describe and explain the phenomenon being studied just as the subjects of the research
would (Saunders, et al, 2009). This is time and resource consuming beyond what is available
to the researcher, therefore the Ethnography strategy was also not selected.
Also, as described in Table 1, Experiment, Surveys and Archival research strategies have not
been selected because, they are not suitable for answering the research question and generally
not consistent with the Relativist/Constructionist philosophical view point assumed by the
study.
Finally, the case study strategy has been used successfully in similar previous studies. For
example, Nisar (2007) used case study strategy to investigate value for money drivers in
public private partnership projects in the United Kingdom. Also, National Audit Office
(2004) used real-life project contexts to illustrate how design quality impacts value for money
in public sector construction projects.
7. SAFEGUARDING RELIABILITY AND VALIDITY
Reliability and Validity are the logical tests used to assess the quality of a piece of research.
Therefore, it was essential while proposing the case study strategy as appropriate for
investigating the barriers to achievement of value for money in public construction
procurement in Nigeria, to ensure that the research measure up with the criteria for a good
quality. Reliability and validity are concerned with the credibility of the finding or
conclusions drawn from a piece of research.
According to Bryman (2008), Reliability is concerned with the question whether the results
of a study are repeatable. The extent to which data collection technique or analyses procedure
will yield consistent findings (Saunders, et al, 2015). On the other hand, Validity is concerned
with the integrity of the conclusions that are generated from a piece of research (Bryman,
2008). Whether the findings are really what they appear to be about (Saunders, et al, 2015).
Yin (2014), suggests four tests commonly used to establish the quality of a case study
research strategy as indeed used for assessing any empirical social research, and identified
tactics for dealing with the tests. These are reproduced in Table 2 below alongside tactics
proposed by this paper for use while investigating the research problem.
Table 2 - Tests for assessing the quality of research and tactics employed (adapted from Yin,
2014)
TEST Purpose Case Study Tactic Tactic proposed

82
Construct
validity
Identifying correct
operational measures
for concepts being
studied
Use of multiple
sources of evidence
Establish chain of
evidence
Have key informants
review draft case
study report
Use of interviews
and Documents as
multiple sources of
evidence
Review of draft
report by key
informants
Internal
validity
Seeking to establish a
causal relationship as
distinguished from
spurious relationship
Do pattern matching
Do explanation
building
Address rival
explanations
Use logic models
Explanation
building
Use of logic
models
External
validity
Defining the domain
to which the study
finding can be
generalized
Use theory in single-
case studies
Use replication logic
in multiple-case
studies
Use of replication
logic in the
multiple-case
projects selected
Reliability Demonstrating that
the operations of the
study can be repeated
with the same result
Use of case study
protocol
Develop case study
database
Use of case study
protocol
Development of
case study
database
8. CONCLUSION
This paper has presented the need to deepen the understanding of the problem with public
construction procurement in Nigeria, in-terms of achievement of value for money, through a
research design that employ the case study strategy. The implementation of Nigeria’s Public
Procurement Act (2007) to public construction procurement over the years has achieved little
in-terms of its aim for achievement of value for money. Existing knowledge of this problem
have mainly relied on evidence from literature review and quantitative survey of experiences
across a number of projects over some period of time. There is currently lack of in-depth
qualitative understanding of why the implementation of the PPA (2007) to construction
procurement is achieving limited success in terms of achievement of value for money and
how it may be improved. This paper posits that there are prospects for deeper understanding
of this problem by investigating through the case study research strategy. The rationale for
this position comes from the advantage the case study strategy offer for gaining rich
understanding of context and process on contemporary set of events. A profound rich picture
understanding of the barriers limiting the achievement of value for money based on a real-life
project context is necessary and could lead to suggestions on how future improvement can be
made. And that is the niche of the case study strategy.
9. REFERENCES
Adegboye, K. (2014, February 3). Experts decry high cost of construction in Nigeria. Vanguard News, p.
[online]. Retrieved December 9, 2015, from http://www.vanguardngr.com/2014/02/experts-decry-high-
cost-construction-nigeria/

83
Ade-ojo, C. O., & Babalola, A. A. (2013). Cost and Time of Construction Projects under the Due Process
Reforms in Nigeria. Research Inventy: International Journal of Engineering And Science, 3(6), 01-06.
Ajayi, O., & Oyeyipo, O. (2015). Effect of Rework on Project Performance in Building Projects in Nigeria.
International Journal of Engineering Research & Technology (IJERT), 4(02), 294-300.
Ayangade, J. A., Wahab, A. B., & Alake, O. (2009). An Investigation of the Performance of Due Process
Mechanism in the Execution of Construction Projects in Nigeria. Civil Engineering Dimension, Vol 11(1),
1-7.
Barnett, C., Barr, J., Christie, A., Duff, B., & Hext, S. (2010). Measuring the Impact and Value for money of
Governance and Conflict Programme. DFID.
Bima, A. M., Tafida, A., & Baba, D. L. (2015). Appraisal of Construction Project Procurement Policies in
Nigeria. American Journal of Engineering Research, 4(3), 19-24.
Bryman, A. (2008). Social Research Methods. Oxford: Oxford University Press.
Creswell, J. (2009). Research design. Los Angeles: Sage.
Dainty, A. (2008). Methodological pluralism in construction management. In A. Knight, & L. Ruddock,
Advanced Research Methods in the Built Environment (pp. 1-13). West Sussex: Wiley-Blackwell.
Easterby-Smith, M., Thorpe, R., & Jackson, P. (2015). Management & Business Research (5th Edition ed.).
London: SAGE.
Ekung, S., Siriwardena, M., & Adeniran, L. (2013). Optimised Selection and Use of Project Procurement
Strategy in Nigeria: A Practical Case Study. Ethiopian Journal of Enviromental Studies and Management,
6(6), 661-669.
Ezeh, E. (2012). Acheiving Value for Money in Building and Construction Projects. Proceedings of the 2nd
Annual Building & Construction conomic Round-Table [BCERT2] (pp. 77-81). Abuja: Quantity Surveyors
Registration Board of Nigeria.
Familoye, O., Ogunsemi, D. R., & Awodele, O. A. (2015, November). Assessment of the challenges facing the
effective operation of the Nigeria Public Procurement Act 2007. International Journal of Economics,
Commerce and Management, III(11), 957-968.
Fellow, R., & Liu, A. (2008). Research Methods for Construction. Oxford: Wiley-Blackwell.
Glendinning, R. (1988). The Concept of Value for Money. International Jornal of Public Sector Management,
1(1), 42-50.
Ibrahim, A. D., & Musa-Haddary, Y. G. (2010). Concept of Value for Money in Public Infrastructure
Development. International Workshop organized by NIQS July 15 - 15 2010. Abuja.
Love, P. D., Holt, G., & Li, H. (2002). Triangulation in construction management research. Engineering,
Construction and Architectural Management, 9(4), 294-303.
MacDonald, C., Walker, D. H., & Moussa, N. (2012). Value for money in project alliances. International
Journal of Managing Projects in Business, 5(2), 311-324.
Naoum, S. (2013). Dissertation research & writing for construction students. New York: Routeledge.
National Audit Office. (2004). Getting Value for Money from Construction Projects through Design - how
auditors can help. Retrieved from National Audit Office: https://www.nao.org.uk/report/getting-value-for-
money-from-construction-projects-how-auditors-can-help-2/
National Audit Office. (2013). Getting Value for Money from Procurement. Retrieved June 30, 2015, from
National Audit Office: http://www.nao.org.uk/wp-content/uploads/2013/02/vfmprocurementguide.pdf
Nisar, T. (2007). Value for money drivers in public private partnership schemes. International Journal of Public
Sector management, 20(2), 147-156.
Olatunji, O. A. (2008). Due Process and Contractor Selection for Public works in Nigeria. Building Abroad:
Procurement of Construction and Reconstruction Projects in the International Context, 385-395.
Onyema, E. (2011, September 2011). Challenges and prospects of public procurement practice in Nigeria: An
analysis. Nigeriaworld, p. (online).
Proverbs, D., & Gameson, R. (2008). Case study research. In A. Knight, & L. Ruddock (Eds.), Advanced
Research Methods in the Built Environment (pp. 99-110). Chichester, UK,: Wiley-Blackwel.
Saunders, M., Lewis, P., & Thornhill, A. (2009). Research Method for Business Students, fifth edition. Essex:
Pearson Education Limited.
Shittu, A. A., Adamu, A. D., Mohammed, A., Suleiman, B., Isa, R. B., Ibrahim, K., & Shehu, M. A. (2013).
Appraisal of Building Defects Due To Poor Workmanship In Public Building Projects In Minna, Nigeria.
IOSR Journal of Engineering (IOSRJEN), 3(9), 30-38.
Shwarka, S. M., & Anigbogu, N. A. (2012). Impact of the Public Procurement Reform on public building
projects delivery in Nigeria. In S. D. Smith (Ed.), Procs 28th Annual ARCOM Conference (pp. 969-977).
Edinburgh, UK: Association of Researchers in Construction Management.
Walliman, N. (2006). Social research methods. London: SAGE.

84
Wedawatta, G., Ingirige, B., & Amaratunga, D. (2011). Case Study as a research strategy: Investigating extreme
weather resilience of construction SMEs in the UK. ARCOM doctoral workshop. Kandalama, Sri Lanka:
International Conference on building resilience.
Yin, R. K. (2014). Case Study Research; Designs and Methods (5th Edition ed.). Los Angeles: SAGE
Publications Inc.

85
ID 139
SCALING UP HOUSING MICROFINANCE FOR INCREMENTAL
BUILDING A CASE STUDY OF MICROFINANCE BANKS IN
NIGERIA
O. Aturamu and G. Wood
School of the Built Environment, University of Salford, Salford, M5 4WT, UK
Email: [email protected]
Abstract: Providing financing options for low income earners is one of the most complex
challenges faced by financial institutions worldwide. Low income earners require financing
options to meet their basic needs such as housing however, accessing finance for housing
purposes remains a critical issue and many households struggle with obtaining access to
housing finance. Nigeria is no exception and has over the years grappled with huge housing
deficit with a rapidly growing population and requires a minimum of an additional one million
housing units per annum to avert a housing crisis in the country. The inability of low income
earners to access formal forms of finance and the extortionary terms of informal finance for
the low income earners have provided a strong need for innovative approaches such as
housing microfinance. However, with a few exceptions, most Nigerian Microfinance banks
don’t offer housing finance mainly because they are small in size, region specific
(concentrated in the south) and with a limited collective outreach and there remains a need to
scale up their operations. Adopting a qualitative research methodology, this paper finds three
major variables which deter the scaling up of housing microfinance with the housing policy
being the fixed variable on which the other variables depend. For there to be a scaling up of
housing microfinance, there has to be an overall growth of the microfinance industry with the
Government integrating housing microfinance into the current housing policy while
microfinance institutions form partnerships with the formal financial institutions to mobilise
deposits and reach out to a wider pool of borrowers.
Keywords: Housing Finance, Housing Microfinance, Housing Finance Policy.
1. INTRODUCTION
With over 186 million inhabitants, Nigeria is Africa’s most populous country and over the
past decade has achieved a stable and strong economic growth making it Africa’s largest
economy with its GDP accounting for 35% of Sub-Saharan Africa (STATISTICS 2014).
Despite this, Nigeria trails its peers in Sub-Saharan Africa in essential infrastructures such as
housing and has a very high rate of poverty and income inequality with about 65% of its
population being classed as low- income earners (International Business Times 2015). With
over 65% of Nigeria’s population being classed as low income earners and being excluded
from financial services for basic needs such as housing, (CBN, 2012) it is obvious that the
housing sector needs urgent intervention to ensure that it functions efficiently. (Okupe 2000)
and (Olayiwola, Adeleye et al. 2005) have identified one way of achieving this through the
introduction of inventive products such as housing microfinance, which have been effectively
adopted by other countries with similar macroeconomic indices. However, despite the vast
potential of housing microfinance being used as an avenue for facilitating housing in other
developing countries, it still exists on a very small scale and therefore has very little positive
effect on housing supply in Nigeria and how to scale it up remains an on-going challenge
within the microfinance sector. As at 2014, the number of MFI’S in Nigeria stands at 986

86
(CBN NIGERIA 2014) but despite this large number of microfinance banks focusing on low-
income earners and their ability to access finance for various purposes, only the largest 7 of
these banks offer housing finance as one of their core products (Mix Market, 2014). The
market for Housing microfinance in Nigeria can potentially be much larger than the current
portfolio suggests as it is estimated that between 10% and 33% of all microfinance loans
given is applied to housing in some way whether directly or indirectly (Habitat for Humanity,
2013). This goes to show the existence of the market and its potential to facilitate new
housing delivery on an incremental basis. For housing microfinance to fulfil its full potential
as a strategy to meet Nigeria’s housing shortfall, the constraints that actively and passively
deter the growth and expansion of Housing Microfinance as a key component for housing
finance must be overcome and the critical success factors which help in scaling up housing
microfinance in other nations need to be identified and implemented. More importantly, there
has to be an acceptance and support of housing microfinance as an effective route by which
low‐income earners can meet their housing needs. Drawing on interviews with management
staff and loan officers of three selected microfinance institutions in Nigeria, the research will
investigate and examine their views on factors which deter and affect the achievement of
scale.This research adopts a qualitative approach using multiple case studies to explore the
perspectives of identified stakeholders in microfinance banks and also combines an extensive
review of literature on the challenges microfinance banks face both in the form of policy,
processing and the public perception in providing housing finance to the low income earners
in the society .The research focuses on some identified stakeholders in microfinance banks
and uses a qualitative (interview) method to gain an in-depth understanding of their
perceptions, opinions and experiences in the research area.
2. LITERATURE
Housing is a very crucial factor necessary for the development of any nation and many issues
have been raised on this subject. (Onibokun 1985, Olotuah 2002) observed that housing not
only acts as a physical construction of dwelling units but also performs three important
functions such as material functions in terms of shelter provision, symbolic functions in terms
of status or social class and the external functions which refers to the strategic location of
housing in geographical space. In developed economies such as the United States, housing is
financed mainly through mortgage financing and represents one of the largest components of
the capital markets however in developing countries such as Nigeria, contrary to what can be
obtained in developed economies, mortgage financing is an option that is largely under-
utilized and the opportunities in the mortgage sector remains unexploited. Housing in
Nigeria is characterized by various inadequacies which can be classified into qualitative and
quantitative inadequacies (Oladapo 2006). The quantitative housing problem refers to the
inadequate number of existing stock while the qualitative inadequacies refers to the condition
and state of the housing stock and this can be equally enormous and complex. Several
researchers have identified various reasons for the shortage of housing in
Nigeria.(Akinmoladun and Oluwoye 2007)identified limited land supply and acquisition
obstacles as major factors affecting housing supply in Nigeria while (Merrill and Mesarina
2006) identified finance as a major obstacle because low income earners (who make up
majority of the population) don’t get access to credit facilities for housing purposes .More
recently, (Onu and Onu 2012) supported the view that even when there is available supply of
land, access to the land is still very difficult because of poor access to credit facilities and
finance.In Nigeria, housing is financed either through formal or informal sources of finance,
(Adedeji and Olotuah 2012). Formal housing finance however does not reach majority of

87
those classed as low income earners due to various reasons such as complex procedures,
insufficient financial resources, the inadequacy and sparse coverage of the banking network
and the inadequacy of housing standards prescribed by banks for eligibility for lending. Most
importantly, the formal financial institutions consider the low income earners as high-risk
borrowers (Ferguson 1999). This risk is shown in the high interest rates charged which are
often times not affordable by the low income earners. To therefore overcome the limitations
brought about by the lack of financing options, housing microfinance has been identified as
one of the options available to low income earners to access finance for housing purposes
however, the potential role which it can play for housing needs has not been fully recognized
and enough effort has not yet been put into studying how it can be scaled up to increase its
outreach.(Otero 1999) defined microfinance as the provision of financial services such as
savings, credits and other financial services (insurance and payment services) to low income
earners while (Ferguson and Haider 2000) defined housing microfinance as small loans given
to low/moderate income households typically for self-help home improvement, expansion
and new construction of basic core units .(Daphnis and Ferguson 2004) also defined it as a
discrete practice that intersects housing finance and microfinance as shown in Figure 1
below. It is said to be an intersection between microenterprise finance and mortgage finance
because it shares the same characteristics with both microenterprise finance and mortgage
finance.
Figure 1: Link between Housing and Microfinance
Source: (Daphnis and Ferguson 2004)
Housing microfinance fits in perfectly with incremental housing whereby the lender provides
funding for housing related issues in small loans sufficient to cover a specific housing phase.
It is primarily the provision of unsecured microcredit, to meet the demand of low-income
earners to either repair or improve their existing homes or build their own homes
incrementally one loan at a time. It intersects both housing finance and microfinance while
attempting to fill the existing gap that exists between government subsidy programmes and
the traditional sector by adapting the principles of microenterprise finance. (Daphnis and
Ferguson 2004) envisaged that the idea behind housing microfinance is to adopt the
principles of microfinance to provide financial services that allow the poor and low income
earners finance their housing needs. These principles are listed in Table 1 below:
Table 1: Principles of Microfinance
Source: (Daphnis and Ferguson 2004)
Loans are relatively small amounts and are based on clients’ capacity to repay
Repayment periods are short (especially in comparison to mortgage lending) and

88
are on par with mid- to high-end microfinance individual loans
Loan pricing is expected to cover the long run operational costs of providing the
service
Loans are not heavily collateralized, if at all, collateral substitutes are often used.
Loans tend to finance habitat needs in an incremental manner, with short repayment
periods and relatively low monthly payments
Incremental building accounts for 70% of all housing investments in Africa (AUHF, 2015).
Building incrementally allows a household to put together its shelter needs, step by step as
the finance becomes available. Housing microfinance fits perfectly with incremental building.
It fills a real finance gap and adds value to the housing process of low income households and
small home improvement or home construction loans can easily be applied to various
incremental building activities, such as roofing, finishing units, extending and other tasks.
Incremental housing facilitates access to housing options through a phased process whereby
borrowers complete the construction of their homes through a series of small loans (Hasan
2010) .However, for housing microfinance to be effective, it must be able to achieve a level
of scale that allows it to be implemented sustainably. This can only be feasible in an
environment where there is a vibrant informal housing sector with people already building
incrementally such as Nigeria.
3. CHALLENGES FACING HOUSING MICROFINANCE
Several issues have been identified as deterring microfinance institutions from scaling up the
provision of housing microfinance. Firstly, it has been observed that most microfinance
institutions that provide housing microfinance operate on a small scale and only focus on
housing improvements because they need a larger credit base for the land acquisition
component. This is evident in a country like Nigeria that has 986 microfinance banks licensed
by the CBN to operate within the country (Mix Market, 2011) with only 7 of them having the
capacity to offer specific finance options tailored towards housing.Most Nigerian MFBs are
small in size, region specific and have limited collective outreach. In addition to the relatively
small scale of their operations, Nigerian MFBs also tend to have a narrow scope, offering
only a limited range of financial services beyond credit. For housing microfinance to work, it
has to respond to the needs of those in the informal economy and for a microfinance bank to
operate successfully, it must be sustainable.(Ehigiamusoe 2005) opined that for a
microfinance institution to attain sustainability, it must first of all operate efficiently. He
argues that only efficient institutions can reach large numbers of people to make any impact
on their standard of living. More recently, (Martin 2008) hinged the factors that limit the expansion of
housing microfinance globally to be mainly risk related. He envisaged the factors to include: “the perceived
risk of the market, the perceived risk of the product methodology and the bank’s operations.
Long-term loans contribute to credit risk, because the longer the term of the loan, the higher
the probability of defaulting borrowers. If the MFIs bear the cost of the risk, it will impose
substantial cost on the institution such that it might not be sustainable in the long run and if
passes this cost over to the borrowers it will increase the default risk as they may not be able
to pay for this service. Also, financing long-term assets like housing, can lead to term
mismatch especially when MFIs rely on deposits as their source of funding. This is especially
true in developing countries like Nigeria which experience macro-economic instability, such
that within a long loan term, inflation can rise and therefore may call for increase in interest
rates to offset effect. Loan diversion is another risk which arises when customer use part or
all their loans for purposes other than the intended purpose. How a client uses his or her loan

89
will affect the outcomes or impact that it can have. Understanding the clients' needs is also
important so that services can be tailored, risks managed and impact maximised (Nelson and
Nelson 2010). While loan diversion may be a serious risk to the microfinance bank, with
regards to housing microfinance, it will distort the incremental building process hence lead to
default of loans because housing does not produce income in the short term. (Mesarina and
Stickney 2007) also discovered that the most important argument managers made to explain
their reluctance to expanding their housing microfinance portfolio is because they believe the
product not being explicitly part of their business or social mission. The institution’s core
business and mission is defined around the concept of financial services for microenterprises
whereas housing microfinance is defined not as a loan for productive microenterprise
purposes, but as a consumer loan. Having identified the challenges that microfinance banks
face when offering housing microfinance options, it becomes critical to identify how these
factors deter them from scaling up their housing finance options and develop a framework
that can be used by various stakeholders to overcome this challenges and scale up housing
microfinance.
4. METHODOLOGY
For a problem to be adequately investigated and a suitable solution proffered, the investigator
needs to adopt a methodology that will help achieve its aim.This study adopts a case study
research approach. (Yin 2009) defines a case study as “an empirical inquiry that investigates
a contemporary phenomenon in-depth and within its real-life context, especially when the
boundaries between phenomenon and context are not clearly evident”. Case studies are useful
where there is a need to understand a particular problem in great-depth with identification of
case study areas rich in information (Noor 2008). It can either be a single or multiple case
study which can include quantitative evidence, rely on multiple sources of evidence and
benefit from the prior development of theoretical propositions (Bryman 2012).This research
will base its approach on case study approach on a constructivist paradigm. The case study
approach provided an opportunity to explore the problem statement within a local context and
a multiple case study design was chosen to promote the richness, depth and complexity that
will be drawn from multiple events which help in understanding the phenomenon of interest
that is shared among the diverse cases. However, (Stoecker 1991) was of the opinion that a
multiple case study risks reducing complex cases to a few comparable variables, resulting in
the loss of the peculiarity of individual cases therefore to mitigate this risk, the study focuses
on the three largest microfinance banks in Nigeria offering housing loans in line with
(Creswell 1998) who suggests that no more than four cases be examined to allow individual
cases to be adequately explored. Lagos state has the most number of microfinance banks in
Nigeria(Mix Market, 2015), and over 93% of these microfinance banks have their head office
in Lagos state mainly because Lagos state is arguably the most economically important state
in Nigeria and the nation's largest urban area hence why it has the largest concentration of
microfinance institutions. It is also the second most populated state in Nigeria and the most
economically viable state in Nigeria. The three microfinance banks selected make up over
60% of the total customer base of all 7 microfinance banks that provide housing loans as a
core product.The primary data obtained from these three microfinance banks is a
representative sample of microfinance banks that provide housing loans and the selection of
these banks was based on two different criterions namely the customer base and outreach.
Figure 2 below shows the spread of microfinance banks in Nigeria

90
Figure 2: Spread of Microfinance banks in Nigeria
Source: CBN (2015)
Using face to face semi structured interviews, the selected staffs of the banks were
interviewed in order to gain information that helps to determine issues limiting the scaling up
of housing microfinance and this was deduced based on the perception and experiences of the
management staff and loan officers of the microfinance banks. The information generated
enabled the researcher to determine the challenges and barriers that deter the microfinance
banks from providing housing loans directly or indirectly to low-income earners thereby
limiting the provision and expansion of housing microfinance. The scope of this research is
limited to 3 of the 7 microfinance banks which provide housing loans and have the largest
customer base thereby providing a wider database on the lending and demand pattern of
funds of these banks. Information for this selection was obtained from the Mix market. The
Mix Market (www.mixmarket.org) is a data hub where microfinance institutions (MFIs) and
supporting organizations share institutional data to broaden transparency and market insight.
All the semi structured interviews were tape recorded and transcribed before the
commencement of the data analysis. Conceptual content analysis was used for the data
analysing process. All the transcripts were scrutinized carefully with the aim of identifying
concepts related to the research questions. While going through the transcripts, they were
broken down into meaningful content categories which related to a particular concept. A code
was then assigned for each concept identified from the transcripts. When a concept is
identified, a code is assigned from the provisional list of codes developed through theory or
assigned a new code. This process was carried out in repetitive cycles until no new concept is
identified. This process permitted the researcher to be more familiar with the interview
transcripts and to generate new concepts from the text. The coding was done using
descriptive key words where the key words were chosen from the original words and phrases
used in the transcripts.
5. RESULTS AND DISCUSSION
From the interviews transcribed and analysed the following results were deduced. For all
three microfinance banks, housing microfinance is not a core product which the bank offers
rather it is a product which is added to the bank’s portfolio mainly for customer retention.
Figure 3 below reflects the reasons why the banks offer housing microfinance loans to its
customers, the sources of funds and the target group of the banks.
0
50
100
150
200
No of MFI in Nigeria

91
Figure 3: Sources of funds and Target Group of Banks
Source: Field Surveys
Bank management staffs interviewed are of the opinion that the demand for housing
microfinance is on the increase both in the rural and urban areas. They reasons they have
given for this increase borders on increase in population , an increase in awareness on the part
of the customers and an increase in general public awareness, the level of education of their
customers and the corresponding knowledge about the lending system. Bank customers are
becoming more aware of the option of housing microfinance and because these customers
can neither want nor afford a large long-term traditional mortgage to purchase their houses,
they are turning more to the option available to them which is housing microfinance. Also,
more people are becoming aware of the importance of having a bank account and therefore
come in contact with the bank officials who make them aware of the options available to
them through the bank. From figure 8 below we can see there has been a reduction in the
exclusion rate over the years from 53.0% in 2008 to 39.7% in 2012 so this confirms the views
of the management staff showing that more people are becoming more aware of the
importance of having a bank account hence the demand for housing microfinance is
increasing because more and more people are also becoming aware of the option of housing
microfinance.
Figure 4: Exclusion rate in Nigeria
Source: CBN (2015)
2006
2008
2010
2012
53.00% 46.30% 39.70%
Exclusion rate
exclusion rate

92
6. PRODUCT DIFFERENTIATION AND PRICING
From the interviews conducted with the management staff of the selected microfinance
banks, it was discovered that there is no clear differentiation between housing loans and
other types of loans as housing loans are still sometimes been classified as enterprises loan.
The banks tend to have targets set out for them monthly and because housing loans can
sometimes be difficult to process and approve, the bank staff tend to process enterprise loans
as housing loans and the management staff have no issues against this as long as each branch
meets its target for the month. In this case therefore, it is difficult to determine the current
supply and determine if the supply is meeting the demand from the customers. From data
gathered it was discovered that bank management refer to these loans as housing loans not
because they are interested in providing housing loans to improve housing supply but rather
to increase revenue for the bank and also retain the loyalty of their existing customers. So
providing this housing loan deters customers from going to other microfinance banks that
might be offering the service. Of the three banks selected, Bank A and C offer home
improvement/construction loans while Bank C provides personal and business loans to its
customers however what the customers use the loan for was entirely their own decision.
Interest rate for home loans at the three selected banks was seen to be higher than that of all
other loans. The managers interviewed indicated that housing loans tend to be less profitable
than other loans such as business loans or enterprise loans because business loans have a
higher turnover than housing loans. This goes to show that housing loans have not been
identified as a core business objective of any of the banks. While the banks are looking for
short term investment with profit maximisation, the customers are looking for long term loans
with low interest rate to finance their housing needs .The managers are of the opinion that if
the government can include housing microfinance in the policy ,prioritise housing related
issues and provide subsidies to microfinance banks (like what is presently applicable with
agricultural intervention fund which is accessible through commercial banks in Nigeria) this
could help reduce any potential loss of capital by the microfinance bank (arising from the
risk of default loans) thereby making the banks more willing to give out more housing loans
to its customers. Also it will enable the banks reduce the interest rate being charged on
housing loans and if the interest rate is low , it will encourage customers to borrow more for
home improvement and construction and will boost effective demand for home loans
7. PROCESSING OF LOANS/LENDING METHODOLOGIES
The average time identified by the management staff to process a housing loan is 25days. The
method by which the housing loans are processed and disbursed was found to be a bit
cumbersome and time consuming. Loan processing and disbursement is handled by the
operations department with the loan officers acting as front liners. As long as the customers
fulfil all the eligibility criteria of the bank and fill out the application forms, the maximum
processing time identified so far is 60 days. However, before the bank can even start to
process any loans the customer has to produce documents such as the building permit etc.
This can be very cumbersome and time consuming. Figure 9 shows the average time taken by
the loan officers to process a housing loan. With all three banks, for a customer to qualify for
a loan, he has to open an account with the bank and operate same for a minimum of 3
months. When the customer fulfils all the eligibility criteria, he/she then fills an application
form where he/she attaches documents of the land or house he intends to build or improve.
Completed loan applications forms are then submitted to a Loan Committee which then
reviews the application based on the amount requested vis-a-vis repayment capacity of the

93
client. This is done using software where the net monthly income of the applicant is inputted
and the monthly repayment is automatically generated. In instances where the client’s
monthly income cannot support the monthly repayment, the loan amount is reduced to an
amount which is affordable by the customer .With all three banks, there was a consensus that
the monthly repayment must not be more than 40% of the net income of the customer.
Figure 5: Loan Processing days
Source: CBN (2015)
When the loan officers were asked how long it took the bank to process the housing loans, the
first respondent said it took 14 days, another said it took approximately 30 days and the other
said it took nothing more than 60 days. The main reason for the time difference in the
processing times can be attributed to the time frame it took to produce the required
documentation and the time it took to verify the information provided by the customers due
to lack of appropriate database and technology. The lending method adopted by all three
microfinance banks is the individual lending methodology where loans are extended to
individuals rather than a group. According to the management staff of all three banks, there
was a general consensus that housing loans are extended to customers who are eligible for
them and whose credit history has been determined based on the premise that these customers
have previously been offered microenterprise loans and have been customers of the bank for
over 3 months so a history and relationship has already been determined. Their views on this
is that if a customer is eligible for an individual microenterprise loan and has the capacity to
repay it, then it stands to reason that the same customer will be able to pay for the home loan
as well. It is jointly believed that because all customers operate in different socio-cultural and
economic conditions, it can be tedious getting people with different backgrounds and social
setting to come together to form a group. Also because housing microfinance loans are for
larger amounts compared to microenterprise loans and have longer repayment periods, using
group lending methodology will not be a viable option because it will involve using peer
pressure and group guarantee systems which imply holding the group collectively liable for
repayment over a long time. This results into higher default risks as repayment fatigue can set
in overtime. This supports the work of (Klinkhamer 2000) who opinioned that it is good
practice to use individual lending methodology for housing microfinance rather than the
group lending methodology due to the risks associated with the group guarantee system
especially as loan sizes become bigger.
0
20
40
60
A B C
1430
60
Loan Processing days
DAYS

94
8. ELIGIBILITY, LOAN TERMS AND SIZES
From the interviews conducted, it was discovered that the criteria to be eligible for a housing
loan depends on the customers current financial profile and therefore not very rigid. The
eligibility criteria only acts as a guideline to ensure that the customers will be able to meet the
loan repayment so as to avoid default risk. The eligibility criteria as stated by the
management staff at all three banks tend to be similar. Information gathered from all three
banks, it is shown that all potential customers must have been operating a savings account
with the bank for a minimum of 3 months and be able to demonstrate the 5 c’s of credit
(capacity, collateral, capital, character and condition) Customers must be able to provide land
documents (C of O) showing the ownership of the land where the proposed house will be
built and provide a letter from a guarantor who will stand as surety for the loan when
approved. This is to reduce the risk of default loans. This however limits the number of
customers who are eligible for housing loans because majority of the customers cannot meet
the criteria. One of the principles of microfinance is providing Loans that are not heavily
collateralized, and if at all, collateral substitutes can be used. This isn’t applicable though
showing that banks are not operating as purely microfinance banks and hence missing their
expected targets (low income earners).The repayment terms vary from all three banks. For
bank A, three types of repayment are available daily, weekly and monthly repayments and the
customer can select which ever option works best for him while at bank B repayment was
fixed at a specific date each month and at Bank C repayment was monthly at any time during
the month convenient for the customer however, one fixed issue amongst all three banks was
that the repayment terms must not exceed the maximum duration periods agreed by the
customer with the bank
9. LOAN SECURITY/UNDERWRITING
The strategies mainly used to secure loans for home construction by the three microfinance
banks is grouped into two namely– savings and co-signers. These three banks provide home
construction loans to two main categories of customers: Those self-employed and the salary
earners who work either in the public or private sector but are classed as low income earners
based on the level of their incomes. The guarantee required for self-employed customers is
the savings they have in their savings account. As part of the eligibility criteria, savings is
mandatory for this category of clients and as such a pre-condition for the disbursement of the
loan. Potential clients must save at least an agreed percentage of the loan amount they intend
to take and have to continue saving even when they have taken the loan. On the other hand,
for salaried workers, the monthly repayment should not exceed 35% of the net monthly
income and they are required to provide either co-signers or personal guarantors. Based on
the views of the management staff at the three banks, providing guarantors for the loans helps
to locate the customer should in case the customer defaults and decides to either relocate or
abscond and the guarantor services the loan by repaying the loan he/she guaranteed should in
case the customer absconds
10. STAFF TRAINING/TARGET BENEFICIARIES
An interview with the management staff revealed that credit officers were not employed
based on any background relating to housing issues rather they tend to be trained on the job
(learn on the job). Management staff observed that loan officers employed reported that

95
construction technical assistance should be made a condition attached to the housing loan. In
their perspective, this will help in the monitoring of customers housing projects and help keep
the customer in check. Monitoring of customers was found to be quite difficult because the
bank staff saw it as extra work load which they had to do without any extra incentive. So
rather than go from house to house checking up on the progress which the customers had
made on their houses, they simply fabricated up results. They believe that if construction
assistance was made compulsory, there will be an expert on ground to give advice and
monitor what the customer is building and the progress being made. However, the
management staffs see construction assistance as an unnecessary expenditure that will simply
increase the cost of the loan which will then be transferred to the customer thereby making
the housing loans even more expensive for the customer and could result into loss of profit
for the bank. This cost can also deter customers from applying for housing loans as well. Data
collected from the management staff of the microfinance banks indicates that the banks tend
to target more of salaried staffs who are classified as low income levels based on the amount
they earn. This goes to show that the microfinance banks are still not targeting the right set of
customers. They believe the risk of targeting the self-employed will be too high. However,
the essence of microfinance is to provide financing options for the low income earners.
11. LACK OF HOUSING SUPPORT FROM GOVERNMENT
There was general agreement among all participants that the Nigerian government does not
identify housing as one of the core needs of the people. When asked about the government’s
role in housing matters, the replies given by the respondents are listed below:
Table 2: Responses from respondents
Source: Field Survey
Bank A Government is ineffective in providing support to microfinance
banks who provide housing finance for low income earners
Bank B The government is not interested in providing support for housing
because it doesn’t see housing as a major issue in Nigeria. The
government concentrates all its efforts on issues relating to oil and
gas and agriculture
Bank C Housing is not a major concern for the government. The
government is not interested in long term projects because the
govt. is so unstable. Housing needs time. The govt. has no time
because the government can change at any time. This also deters
investors who want to invest in Nigeria.
Participants interviewed were of the opinion that until the government actually sees housing
issues as a major cause of concern, the financing of housing through housing loans will never
be recognised as a core product of any bank. An example of the importance the government
places on agriculture was given .Based on the fact that Nigeria is a major food exporter the
federal government provides commercial banks with Special credit intervention fund to fast
track the development of the agricultural sector. Likewise it also provides Special
intervention fund to provide low cost, long tenured funds to MSMEs to enhance their
capacity for employment generation, economic development and inclusive growth. However,
because the government doesn’t see housing as a major issue, there hasn’t been any provision
of any intervention fund .Also, with regards to what they think should be done by the federal
government to improve the process of incremental housing and microfinance, all the staff

96
interviewed were of the opinion that there should be new governmental housing programs
incorporating the existing housing stock while two of the participants recommended the
provision of services and utilities and advocated for an interest-free banking system and
some flexibility in government policies.
12. RECOMMENDATIONS/CONCLUSION
From this study, it has been observed that though there is a great demand for housing loans,
microfinance Banks are failing to meet this demand mainly due to lack of loanable funds and
an aversion to risk taking. As a way forward, it is recommended that the government through
partnerships with the private sector integrate Microfinance banks into the broader financial
system so as to address the financial needs of the low income people. Similarly, it is also
recommended that more microfinance banks diversify their loan products to include housing
loans to tap into the lucrative market by extending the housing microfinance loans to more of
their client’s thereby increasing outreach. Scaling up will require increasing the scope
(number of individuals reached), impact (effect on the well-being of borrowers), and depth
(ability to reach the poorest of the poor) of microfinance banks. The emerging consensus
from interviews conducted shows that to achieve a positive result in the scaling up housing
microfinance will require deposit mobilization which can be facilitated through the
commercialization of microfinance banks i.e. more MFBs transforming themselves into
formal financial institutions, and commercial banks offering microfinance products. As
housing microfinance expands, the level of government intervention and commitment must
also increase. The government can obtain double benefit from supporting incremental
housing. First it will increase the capacity of low income earners to find solutions to their
housing need and secondly, it will lead to an improvement in the existing housing supply
with minimum government intervention. The government should develop new schemes and
finance options such as the introduction of an intervention fund which will help reduce risk
arising from default loans to microfinance banks and will enable the microfinance banks
increase their allocation for housing loans to construct houses for low-income earners.
Government should consider low income earners when issuing loans and should introduce
more lending organizations. All participants interviewed suggested the provision of services
and utilities and advocated for an interest-free banking system while suggesting that some
level of flexibility in government policies will be helpful. Low income earners tend to build
their houses incrementally over time. However in Nigeria, the building codes are designed for
the construction of complete homes, thus making incremental building difficult however,
having a more comprehensive housing government policy could better support incremental
housing expansion. It is also recommended that the federal government provide a national
loan guarantee scheme which can be managed by microfinance banks .This has been done
previously by the Federal Government through the provision of the of the agricultural Credit
Guarantee Scheme Fund (ACGSF) which was established in 1977 in Nigeria (CBN
NIGERIA 2014) for agricultural purposes. The Fund guarantees credit facilities extended to
farmers by banks by up to 75% of the amount in default net of any security realized. If this
can be implemented for housing microfinance, it will make it easier for low income earners to
borrow money from the microfinance banks because the government is willing to underwrite
the loans. This will then make the microfinance banks more willing to lend to the low income
earners because they have less risk of losing the money.Scaling up housing microfinance will
provide an option for the majority of the popultaion who are classed as low income earners
with options on how to build and finance their housing needs incrementally over time. It is
submitted that if the Nigerian housing policy is modified to inculde housing microfinance and

97
the government provides an option to microfinance banks on how to reduce the risks
involved in offering housing finance, housing microfinance can be used as an option of
achieving the millennium dvelopment goal which is to provide adequate housing for all by
the year 2050.
13. REFERENCES
Adedeji, Y. D. and A. O. Olotuah (2012). "An evaluation of accessibility of low-income earners to housing
finance in Nigeria." European Scientific Journal 8(12).
Akinmoladun, O. I. and J. Oluwoye (2007). "An assessment of why the problems of housing shortages persist in
developing countries: A case of study of Lagos Metropolis, Nigeria." Pakistan Journal of Social Science
4(4): 589-598.
Bryman, A. (2012). Social research methods, Oxford university press.
Central Bank of Nigeria (2014). Annual report and statement of accounts for the year2014.: Retrieved from
https://www.cbn.gov.ng/documents/cbnannualreports
Creswell, J. W. (1998). "Five qualitative traditions of inquiry." Qualitative inquiry and research design: 47-72.
Daphnis, F. and B. Ferguson (2004). Housing microfinance: a guide to practice, Kumarian Press.
Ehigiamusoe, G. (2005). Tested institutional practices for effective microfinance services delivery. Proceedings
of seminar in microfinance policy, regulatory and supervisory framework for Nigeria.
Ferguson, B. (1999). "Micro-finance of housing: a key to housing the low or moderate-income majority?"
Environment and Urbanization 11(1): 185-200.
Ferguson, B. and E. Haider (2000). "Mainstreaming microfinance of housing." Housing Finance International
15(1): 3-17.
Hasan, A. (2010). High-density housing that works for all, International Institute for Environment and
Development.
Klinkhamer, M. (2000). "Microfinance Housing Products and Experience with Land Title as Collateral." Latin
American and Caribbean Division, World Bank Paper.
Martin, C. (2008). Going to Scale with Housing Microfinance: The Role of Commercial Banks, Micro Report.
Merrill, S. and N. Mesarina (2006). "Expanding microfinance for housing." Housing Finance International
21(2): 3.
Mesarina, N. and C. Stickney (2007). "Getting to Scale in Housing Microfinance." Acción Insight 21.
Nelson, E.-U. E. and I. E. Nelson (2010). "Micro-credit programme and poverty alleviation in rural Nigeria: A
case study of Akwa Ibom State." International Journal of Economic Development Research and Investment
1(2): 168-180.
Noor, K. B. M. (2008). "Case study: A strategic research methodology." American journal of applied sciences
5(11): 1602-1604.
Okupe, L. (2000). The Role of the Private Sector in Housing Delivery in Nigeria. National Seminar of the
Nigerian Institute of Building.
Oladapo, A. A. (2006). "A study of tenants’ maintenance awareness, responsibility and satisfaction in
institutional housing in Nigeria." International Journal of Strategic Property Management 10(4): 217-231.
Olayiwola, L., et al. (2005). "Public housing delivery in Nigeria: Problems and challenges."
Olotuah, A. (2002). "Recourse to earth for low-cost housing in Nigeria." Building and environment 37(1): 123-
129.
Onibokun, A. G. (1985). Housing in Nigeria: A Book of Readings, Nigerian Institute of Social and Economic
Research.
Onu, V. and A. Onu (2012). "Urban Residential Housing and Low-income Earners: A study of Makurdi
Metropolis, Benue state, Nigeria." European Scientific Journal 8(28).
Otero, M. (1999). "Bringing development back, into microfinance." Journal of Microfinance/ESR Review 1(1):
8-19.
STATISTICS, V. A. (2014). "National Bureau of Statistics." Retrieved from
http://www.nigerianstat.gov.ng/
Stoecker, R. (1991). "Evaluating and rethinking the case study." The sociological review 39(1): 88-112.
Yin, R. K. (2009). Case study research: Design and methods, 4th, Sage Inc CA.
98
ID 146
FACTORS LEADING TO THE RENEGOTIATION OF PRIVATE
FINANCE INITIATIVE (PFI) DESIGN-BUILD-FINANCE-OPERATE
(DBFO) ROAD PROJECTS IN THE UK
A. Fatokun1, C. Liyanage1 and A. Akintoye2
1 School of Engineering, University of Central Lancashire, UK 2 School of Built Environment and Engineering, Leeds Beckett University, UK
Email: [email protected]
Abstract The renegotiation of Public Private Partnership infrastructure projects has not
received public sector recognition because of the outcomes recorded over years. The
stakeholders involved in the renegotiation of the PPP road projects have adduced numerous
reasons. In some instances, the reason can also be the factor leading to the renegotiation of PFI
(DBFO) road projects. Thus, a number of factors inform the decision of the primary
stakeholders to renegotiate the contract. This paper, therefore, evaluates and assesses the
factors leading to the renegotiation of PFI (DBFO) road projects in the UK. Qualitative
interviews involving both public and private stakeholders were extensively adopted on five
PFI (DBFO) case study road projects in order to address the aim of this study. This serves to
complement the findings of the literature with respect to the factors leading to the
renegotiation of PPP road projects. The findings of this research reveal the respective factors
leading to the renegotiations of PFI (DBFO) road projects in the UK. However, the prominent
factors are a change in scope of the works necessitating works removal and an addition of
assets, change in standards and obsolete specification occasioned by the long duration of the
PFI road project concession among others.
Keywords: Renegotiation, Factors, Private Finance Initiative (PFI), Design-Build-Finance-
Operate and Road Projects.
1. INTRODUCTION
Governments of countries both developed and developing countries have been known to
adopt PPP as a procurement method for the delivery of infrastructure projects including
roads. This is due to the perceived merits of PPP over other modes of delivery of
infrastructure projects. However, despite the many merits of PPP, several challenges have
been found to militate against the benefits obtainable from the adoption of this
procurement method among which are issues surrounding the renegotiation of contracts in
PPP concessions, especially in the road sector. Hence, this paper critically reviews
renegotiation of PPP in the road sector by identifying and assessing the factors leading to
the renegotiation of PFI (DBFO) road projects in the UK from the experiences of five case
study projects.
2. RESEARCH METHODOLOGY
This research adopts both secondary and primary sources of data collection as methodology
adopted for the research. Related renegotiation literature was reviewed and serves as an
extension to the initial study of Fatokun et al., (2016), which identifies and categorise the
factors influencing the renegotiation of PPP road projects in their respective order of

99
literature prominence. Few kinds of literature attest to renegotiation experiences in the
context of the UK (Makovsek et al., 2014). This paper, therefore, evaluates and assess
through an extensive review of the literature and an empirical study of 5 PFI (DBFO) road
projects the respective factors leading to the renegotiation of UK PFI (DBFO) road projects.
Nine respondents provide answers to the well-designed interview questions targeted at
eliciting information on the reasons and factors leading to PFI road projects renegotiation.
Therefore, the interviews questions are administered on both private and public sector
stakeholders involved in the PFI (DBFO) road projects. The reason for this is the preliminary
studies conducted, which reveal that both private and public sector are privy to the
renegotiation information and are parties to the PFI road projects renegotiation process. The
findings based on the Nvivo analysis of the renegotiation reasons are listed in accordance
with the decreasing order of significance and prominence as shown in the succeeding sections
of this paper.
3. LITERATURE REVIEW
3.1 Criticisms of Private Finance Initiative in Infrastructure Projects Delivery
The PFI has been criticised because of its inability to deliver VfM for the public sector. This
criticism has led the UK government to introduce a refined and advanced form of private
financing known as PF2. Ballati & Douglass (2013) and HM Treasury (2012) identify the
numerous weaknesses of the projects delivered through PFI procurements, which led to the
introduction of PF2 as follows:
The implementation process of projects is slow with the consequential impact of huge
financial costs to the public sector evidenced in reduced value for the taxpayer and for
example a high payment for the government in the case of shadow toll roads.
Lack of transparency of the process particularly in the estimation future liabilities and
investor returns.
Inflexibilities of the PFI contracts, though it has its attendant merits and difficulties in
making contract alterations during the operational period.
Requirements for the payment of higher risk premium by the public sector due to the
high level of risk transferred to the private sector.
High worry by public sector stakeholders on nature and true value for money on the
projects based on the high perception of the gain attributable to the equity investors
and concessionaire over the life cycle of the projects.
Based on all the enumerated points coupled with the impact of the renegotiation as identified
by numerous literature, the use of PFI in the delivery of infrastructure projects has witnessed
unsuitability of its application in the delivery of the objectives of the government in
infrastructure projects procurements including roads (HM Treasury 2012). Value for money
has been identified as a procurement issue in various policy documents and literature. Indeed,
several other kinds of literature have identified other issues limiting the prosperity and
advancement of the PFI. These issues are related to incomplete contracting, project
abandonment, cost and time overrun, and renegotiation (Guasch et al., 2014; Nikolaidis, &
Roumboutsos, 2013).
One of these factors is the renegotiation of PPP contracts. Renegotiation is considered
important and major because of the high incidences witnessed over years especially in the

100
road sector of Latin American countries, Spain and Portugal etc. These high incidences have
had enormous implication VfM at the respective implementation point of infrastructure
projects particularly water and road sectors (Guasch et al., 2014). However, in the context of
the UK, there will be a level of significant implication on the transport sector since the sector
attracts 26.40% share of UK total infrastructure projects (IFSL, 2009). Hence, the motive of
the renegotiation in the context of DBFO road projects, which constitute larger percentages of
financial outlay in the UK PFI allocation and delivery (Akintoye, 2009).
3.2 Concept of Contract Renegotiation in PPP Road Projects
A greater percentage of literature bordering on renegotiation in PPP infrastructure projects
identifies various definitions of renegotiations. Notable among these definitions of PPP
contract renegotiations are those provided by recent PPP renegotiation studies (Guasch et al.,
2014; Sarmento, 2014). A change in the original contractual terms and conditions between
the public partner and private party under a mechanism defined in the contract can be referred
to as renegotiation (Guasch et al., 2014). A renegotiation could also be agreed in a concession
contract when there is a significant and major change or amendment of the original contract.
(Nikolaidis & Roumboutsos, 2013). These infer that renegotiation of PPP road projects is
usually premised on certain changes some of which usually leads to the amendments of the
terms of the original contracts.
Contract renegotiation in PPP infrastructure projects is requested at the instance of one or
both of the main parties to the DBFO road projects i.e. the public client and the
concessionaire or SPV. However, the literature confirms that most PPP renegotiations
especially in the water and transport sector are mostly initiated by the private enterprise and
are particularly premised on certain cogent reasons and factors (Xiong and Zhang, 2014). The
factors necessitating renegotiations are best known to the private sector of PPP road projects
and include among other things the followings discussed in the succeeding sections.
3.3 Theoretical Perspectives of the Reasons for the Renegotiation of PPP Road Projects
Therefore, there are several motives or reasons for the renegotiation of PPP projects
(particularly roads) as identified by notable academic literature. Though certain factors drive
renegotiation, there are, however, reasons why stakeholders may want to renegotiate a
concession contract. Nikolaidis & Roumboutsos (2013) state that there are cases of transport
PPPs contract incompleteness, which arises as a result of misallocation of traffic revenue,
contractual risks over the period of concession with the resultant effects of PPP contract
renegotiations. Thus, misallocation of traffic revenue and contractual risks, which may not be
foreseen at the time of forming the contract are reasons for PPP contract renegotiations.
Furthermore, certain reasons are identified from recent studies among which are: traffic
overestimation; the inflexibility of the contract, which have the tendency of constraining the
ability of the private sector to manage project risks: construction preference of the private
sector rather than operation responsibilities and the dislike of voters with regards to toll
charges (Acerete et al. 2010). The private sector intent and motive in initiating infrastructure
projects with the sole aim of gaining maximum profit has been identified as one of the
reasons for contract incompletion as well as the failure or bankruptcy of the project (Bi &
Wang, 2011). This shows that poor estimation of traffic (over or under traffic estimation),

101
poor contract design, construction risks, inadequate or poor project planning, inordinate
contract preference and profit maximisation motive by the private sector, project bankruptcy
and dislike of toll charges by users are factors leading to the renegotiation of PPP
infrastructure contracts.
Further studies conducted also reveal that traffic and revenue risks are a source of PPP
contract renegotiations (Nikolaidis & Roumboutsos, 2013) while Ho (2006) aggressive
bidding may be encouraged by the government when there is the willingness to renegotiate
the PPP contract. Fig 1 support's this discuss and shows a clear picture of the process
framework of PPP interaction dynamics between the public and private sectors as well as its
effects on the outcomes of a PPP project, namely, social gains, transaction costs, and returns
from the profit pool of the investment. The interaction dynamics logically shows the
connection between the respective objectives of both partners in the PPP with the outcomes
of the renegotiation.
Fig 1: The Process Framework of PPP Interaction Dynamics
Source: Ho & Tsui (2009)
The summary of fig 1 is that the respective transaction costs sources can impact the
respective objectives of the partners through any of the PPP interaction dynamics. As
indicated in the factors leading to renegotiation of PPP road project, transaction cost ranked
highest, which can either have consequential effect on social gains by the public sector or the
value of the profit pool by the private sector. However, in most renegotiation cases, the public
sector benefits have been found to be negatively impacted.
Government’s Objective:
to maximize social net gains
Project Characteristics
&Institutional Environment Promoter’s Objective: to
maximize the value of profit
pool
Value of Profit Pool
Developing Decisions:
1. Concession negotiation
2. Equity investments
3. Contract undertaking
4. Management efforts
Transaction Cost Sources:1, Principal - principal problem.
2, Hold up problem. 3, Soft budget constraints
Policies and Decisions:
1. Governance design.
2. Procurement
process.
3. Government
supports.
Public Private
Interaction Dynamics:
1. Opportunism
2. Screening
3. Signalling
Social Gains Transaction Costs

102
Trebilcock &Rosenstock (2015) also classified the reasons for renegotiation into four
categories: the tendency of the private party to lower tender cost during the bidding stage of
competitive tendering, opportunistic behaviour, and lower demand on the road network and
unexpected changes on the project. The changes in the project environment could be related
to economic, environmental, political etc., which could have an effect on the outcome of the
projects social gains (Fatokun et al, 2016). Because of these changes amongst others, the
private sector players have generally argued that the behaviours of the private party within
the project environment have resulted in making PPP road projects commercially unviable.
Further reasons for the renegotiations of the DBFO roads are the defective design of the
contract, government failure in honouring contractual clauses and ineffective regulations.
Conclusively, opportunistic behaviour by private players, increase in tariffs, loss of sanctity
of contracts, undermining of competitive bidding principles and reduction in the general
welfare of the people due to increase in costs of goods and services are some of the major
concerns of PPP renegotiations Trebilcock and Rosenstock (2015). Governments also use
bilateral renegotiation processes as a means to grant unfair benefits to private players at the
cost of the welfare of the public or for political gains. Therefore, both the private operator and
the government can use renegotiations as a means to gain unappropriated or unfair means.
Thus, government opportunistic behaviour can manifest in terms of increase in infrastructure
spending on the ground of paying adequate attention to public welfare, which according to
(Engel et al., 2006) increases the government's popularity among the electorate and by
extension, its chances for a re-election.
In addition, governments also use renegotiations overspend and exceed the provisions of the
budget. However, this action has been contested based on the non-achievement of value for
money for the public organisation, (Guasch et al., 2014; Adair et al., 2011, Engel et al.,
2006). Thus, from the foregoing arguments, it could be revealed that renegotiations could
also be as a result of government's opportunism in contrast with previous submissions that
private parties' opportunism drives renegotiation of PPP road projects. Table 1 shows the
literature evidence of the reasons for PPP road projects renegotiation.
Table 1: Literature Perspectives on the Factors Leading to the Renegotiation of PPP Road
Projects S/N Reasons for the Renegotiation of
PPP Road Projects
Pu
bli
cati
on
/S
ou
rce
Ho
(2
006
)
Gu
asc
h e
t a
l. (
201
4)
Xio
ng
an
d Z
ha
ng (
201
4)
Gif
ford
et
al.
, 20
14
Cru
z&
M
arq
ues
(201
3a
;2013
b)
Men
eze
s a
nd
Rya
n (
2013
)
Bi
an
d W
an
g,
(20
11
)
Mo
nte
cin
o &
Saa
ved
ra(2
01
1)
Baeza
& V
ass
all
o (
201
0)
Ch
an
a
nd
Levit
t (2
00
9)
Beck
ers
et
al.
(201
0)
En
gel
et
al.
(20
09
)
Zh
an
g (
200
1)
Ho
an
d L
iu (
2004
)
Sa
rm
en
to (
20
14
)
Nu
mb
er o
f C
ita
tio
ns
Ra
nk
ing o
f C
ita
tio
ns
1 High transaction costs ⱱ ⱱ ⱱ ⱱ ⱱ 5 1
2 Significant and unfavourable change in
conditions e.g. project cost and market
demand
ⱱ ⱱ ⱱ ⱱ 4 2
3 Consideration of high service charge to the
users
ⱱ ⱱ ⱱ 3 3
4 Opportunistic bidding ⱱ ⱱ ⱱ 3 3
4 Incomplete contracts & obsolescing
bargain
ⱱ ⱱ ⱱ 3 3
5 Departure of contract from expected
outcomes
ⱱ ⱱ ⱱ 3 3

103
6 Inordinate profit maximisation by the SPV ⱱ ⱱ 2 7
7 Problem of information asymmetry or
inadequate awareness of project scope
ⱱ ⱱ 2 7
8 Corrective motive in consideration of
business reputation
ⱱ ⱱ 2 7
9 Bankruptcy of Special Purpose Vehicle ⱱ 1 10
10 Time overrun as a result of delays ⱱ 1 10
11 Cost overrun e.g. (construction cost) ⱱ 1 10
12 Lack or inadequate compliance with
agreed terms
ⱱ 1 10
13 Departure from contract terms due to the
existence of transaction costs etc.
ⱱ 1 10
14 Operational and major cause (e.g. force
majeure)
ⱱ 1 10
Total Number of Citations 3 2 1 2 2 3 1 2 2 2 1 1 1 3 7 33
As shown in Table 1, several reasons motivate the primary and main stakeholders to request
for renegotiation of PPP road projects. Ho (2006) substantiates these by stating as follows "In
PPP, financial renegotiation may happen when project cost, market demand, or other market
conditions become significantly unfavourable”. Hence, contract incompletion could
necessitate renegotiation because of strategic and non-strategic factors (Gifford et al., 2014).
These factors considered strategic and non-strategic fall in the respective categories: design
and planning, technical, economic, regulatory, environmental, tendering and bidding,
administrative and managerial etc. The categorisation is, therefore, based on the renegotiation
experiences of Latin America, Greece, Portugal and Spain amongst few others (Fatokun et
al., 2016). However, in the context of the UK, the profound factors leading to PFI (DBFO)
road projects renegotiation fall under the technical and additional works categories, where
strategic actions become necessary during the implementation of the road projects. Hence,
these technical factors and others necessitating the renegotiation of UK PFI (DBFO) road
projects are fully discussed in the next section.
4. EMPIRICAL FINDINGS
4.1 Factors Leading to the Renegotiation of PFI (DBFO) Road Projects in the UK
Several factors have been identified as leading to the renegotiation of UK PFI (DBFO) road
projects. The findings of the study reveal that the renegotiation of PFI DBFO road projects is
based on a change in standards, changes in specification and additional works in their
respective decreasing order of significance. The additional works entail the removal and the
addition of roads infrastructure assets, which according to respondents XY1 is stated as
follows: "in order to comply with the contract; they will be renewing old technology that
didn't suit our needs. So, we decided to take it out" Hence, certain assets have to be removed
on this project thereby necessitating renegotiation.
Further findings reveal that renegotiations experienced on the case study projects are based
on the changes in standards of works, changes in specifications, additional works, which
entails the removal, and the addition of roads infrastructure assets and change in scope of
works. Therefore, the renegotiation is due to changes in the standards and specification of
works and assets. The essence is to keep up with the current and best standards occasioned by
the obsoleteness of the specified standards because of the long duration of the concession
contract. Hence, renegotiation should provide VfM benefits to all the stakeholders especially
the public who have been found to be on the losing end in most renegotiation experience.
respondents XY2 substantiate these by stating that all changes on the PFI road project should
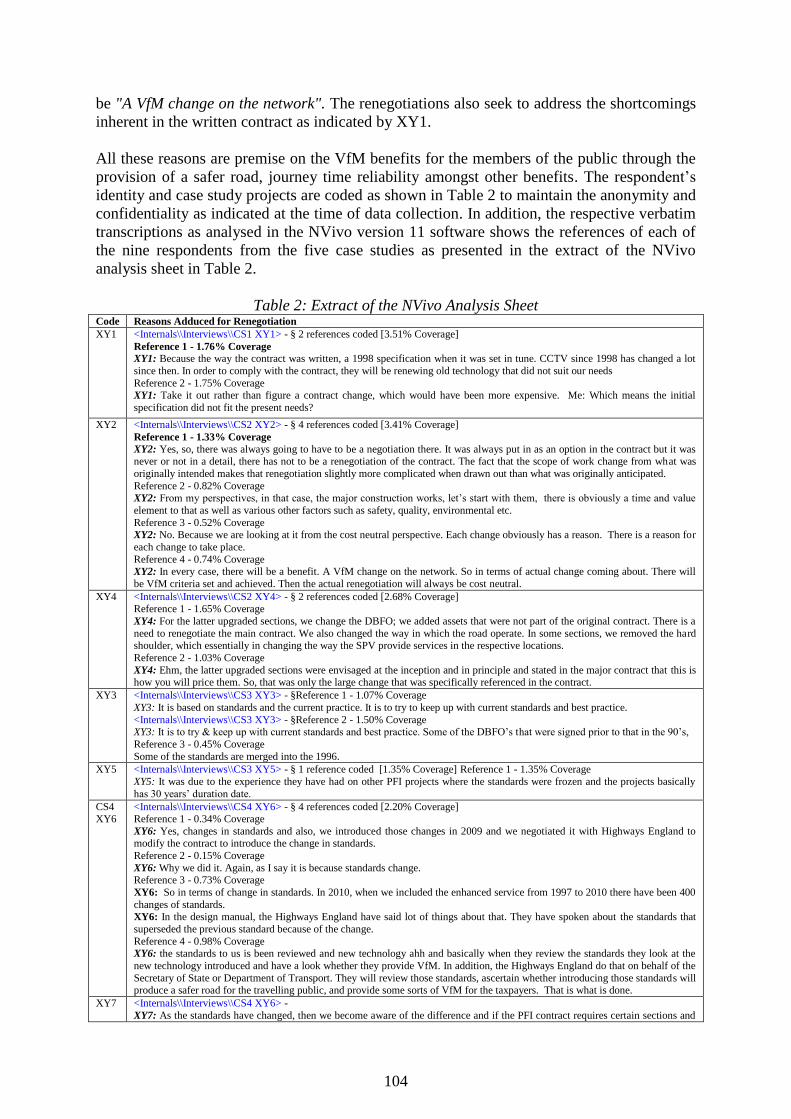
104
be "A VfM change on the network". The renegotiations also seek to address the shortcomings
inherent in the written contract as indicated by XY1.
All these reasons are premise on the VfM benefits for the members of the public through the
provision of a safer road, journey time reliability amongst other benefits. The respondent’s
identity and case study projects are coded as shown in Table 2 to maintain the anonymity and
confidentiality as indicated at the time of data collection. In addition, the respective verbatim
transcriptions as analysed in the NVivo version 11 software shows the references of each of
the nine respondents from the five case studies as presented in the extract of the NVivo
analysis sheet in Table 2.
Table 2: Extract of the NVivo Analysis Sheet Code Reasons Adduced for Renegotiation
XY1 <Internals\\Interviews\\CS1 XY1> - § 2 references coded [3.51% Coverage]
Reference 1 - 1.76% Coverage
XY1: Because the way the contract was written, a 1998 specification when it was set in tune. CCTV since 1998 has changed a lot
since then. In order to comply with the contract, they will be renewing old technology that did not suit our needs
Reference 2 - 1.75% Coverage XY1: Take it out rather than figure a contract change, which would have been more expensive. Me: Which means the initial
specification did not fit the present needs?
XY2 <Internals\\Interviews\\CS2 XY2> - § 4 references coded [3.41% Coverage]
Reference 1 - 1.33% Coverage
XY2: Yes, so, there was always going to have to be a negotiation there. It was always put in as an option in the contract but it was never or not in a detail, there has not to be a renegotiation of the contract. The fact that the scope of work change from what was
originally intended makes that renegotiation slightly more complicated when drawn out than what was originally anticipated.
Reference 2 - 0.82% Coverage
XY2: From my perspectives, in that case, the major construction works, let’s start with them, there is obviously a time and value
element to that as well as various other factors such as safety, quality, environmental etc.
Reference 3 - 0.52% Coverage XY2: No. Because we are looking at it from the cost neutral perspective. Each change obviously has a reason. There is a reason for
each change to take place.
Reference 4 - 0.74% Coverage XY2: In every case, there will be a benefit. A VfM change on the network. So in terms of actual change coming about. There will
be VfM criteria set and achieved. Then the actual renegotiation will always be cost neutral.
XY4 <Internals\\Interviews\\CS2 XY4> - § 2 references coded [2.68% Coverage] Reference 1 - 1.65% Coverage
XY4: For the latter upgraded sections, we change the DBFO; we added assets that were not part of the original contract. There is a
need to renegotiate the main contract. We also changed the way in which the road operate. In some sections, we removed the hard shoulder, which essentially in changing the way the SPV provide services in the respective locations.
Reference 2 - 1.03% Coverage
XY4: Ehm, the latter upgraded sections were envisaged at the inception and in principle and stated in the major contract that this is how you will price them. So, that was only the large change that was specifically referenced in the contract.
XY3 <Internals\\Interviews\\CS3 XY3> - §Reference 1 - 1.07% Coverage
XY3: It is based on standards and the current practice. It is to try to keep up with current standards and best practice.
<Internals\\Interviews\\CS3 XY3> - §Reference 2 - 1.50% Coverage XY3: It is to try & keep up with current standards and best practice. Some of the DBFO’s that were signed prior to that in the 90’s,
Reference 3 - 0.45% Coverage
Some of the standards are merged into the 1996.
XY5 <Internals\\Interviews\\CS3 XY5> - § 1 reference coded [1.35% Coverage] Reference 1 - 1.35% Coverage
XY5: It was due to the experience they have had on other PFI projects where the standards were frozen and the projects basically
has 30 years’ duration date.
CS4 XY6
<Internals\\Interviews\\CS4 XY6> - § 4 references coded [2.20% Coverage] Reference 1 - 0.34% Coverage
XY6: Yes, changes in standards and also, we introduced those changes in 2009 and we negotiated it with Highways England to modify the contract to introduce the change in standards.
Reference 2 - 0.15% Coverage
XY6: Why we did it. Again, as I say it is because standards change. Reference 3 - 0.73% Coverage
XY6: So in terms of change in standards. In 2010, when we included the enhanced service from 1997 to 2010 there have been 400
changes of standards. XY6: In the design manual, the Highways England have said lot of things about that. They have spoken about the standards that
superseded the previous standard because of the change.
Reference 4 - 0.98% Coverage XY6: the standards to us is been reviewed and new technology ahh and basically when they review the standards they look at the
new technology introduced and have a look whether they provide VfM. In addition, the Highways England do that on behalf of the
Secretary of State or Department of Transport. They will review those standards, ascertain whether introducing those standards will produce a safer road for the travelling public, and provide some sorts of VfM for the taxpayers. That is what is done.
XY7 <Internals\\Interviews\\CS4 XY6> -
XY7: As the standards have changed, then we become aware of the difference and if the PFI contract requires certain sections and

105
element needs to be maintained. Then that will be when we will try to take the opportunity to look at the idea of funding the
difference. Therefore, it is within the maintenance regime. XY7: Because the new standards are trying to make the road more consistent with the standards that are operating on the rest of the
strategic road network.
XY8
<Internals\\Interviews\\CS5 XY8> - § 1 reference coded [0.40% Coverage]
Reference 1 - 0.40% Coverage XY8: The contract is under code and agreement with Transport Scotland and that affected the scope of the works and obligation.
XY9 <Internals\\Interviews\\CS5 XY9> - § 2 references coded [0.70% Coverage]
Reference 1 - 0.14% Coverage XY9: I will say that they are nearly always political.
Reference 2 - 0.56% Coverage
XY9: Occasionally, we see a need to vary a specification or introduce a change in material and we the request as a company variation but it still has to be signed off by the Scottish minister. They still have to accept it.
Hint on Case Study Respondents:
XY1: Respondent one on Case study one (CS1)
XY2: Respondent two on Case study two (CS2)
XY3: Respondent three on Case study three (CS3)
XY4: Respondent four on Case study two (CS2)
XY5: Respondent five on Case study three (CS3)
XY6: Respondent six on Case study four (CS4)
XY7: Respondent seven on Case study four (CS4)
XY8: Respondent eight on Case study five (CS5)
XY9: Respondent nine on Case study five (CS5)
Summarily, the factors leading to the renegotiation of the PFI (DBFO) road projects in their
decreasing order of significance are:
Changes in standards of works.
Changes in specifications.
The addition of road assets.
Change in scope of works.
Response to provisions of the original contract.
Need to ensure a safer road for travelling public.
Changes in technology.
Change in pricing and service.
To provide VfM benefits for the public.
Changes to the legislation and regulation.
Adverse weather season e.g. winter months.
Political reason to meet constituency demands.
Poorly written contracts.
Previous experience of other DBFO road projects.
4.2 Cross Analysis of the UK Findings and Cross Countries Literature Findings Factors
Leading to the Renegotiation of PPP Road Projects
The identification of the respective perspectives of the literature on the factors leading to the
renegotiation of PPP road projects based on the experience of other countries provides a basis
for a cross comparison with the findings of the empirical study conducted in the UK. As
enumerated in the preceding section, the detail and main factors identified by the nine

106
respondents from the five case studies at their respective significant level are shown in
comparison with the findings of the literature in Table 3.
Table 3: Comparative perspectives of the Leading Renegotiation Factors Literature Perspective Empirical Study Perspective
S/N Reasons for the Renegotiation of PPP Road
Projects
No. Rank Reasons Leading to the Renegotiation
of UK PFI (DBFO) Road Projects
No. Rank
1 High transaction costs 5 1 Changes in standards of works 7 1
2 Significant and unfavourable change in
conditions e.g. project cost and market
demand
4 2 Changes in specifications
4 2
3 Consideration of high service charge to the
users
3 3 Addition of road assets 4 2
4 Opportunistic bidding 3 3 Change in scope of works 3 4
5 Incomplete contracts & obsolescing bargain 3 3 Response to provisions of the original contract
3 4
6 Departure of contract from expected outcomes 2 6 Need to ensure a safer road for travelling
public
2 6
7 Inordinate profit maximisation by the SPV 2 6 Changes in technology 2 6
8 Problem of information asymmetry or inadequate awareness of project scope
2 6 Change in pricing and service 2 6
9 Corrective motive in consideration of business
reputation
2 6 To provide VfM benefits for the public 2 6
10 Bankruptcy of Special Purpose Vehicle 1 10 Changes to the legislation and regulation 1 10
11 Time overrun as a result of delays 1 10 Adverse weather season e.g. winter
months
1 10
12 Cost overrun e.g. (construction cost) 1 10 Political reason to meet constituency demands
1 10
13 Lack or inadequate compliance with agreed
terms
1 10 Poorly written contracts 1 10
14 Departure from contract terms due to the existence of transaction costs etc.
1 10 Previous experience of other DBFO road projects
1 10
15 Operational and major cause (e.g. force
majeure)
1 10
The findings of Table 2 shows that there is the comparable difference between the
perspective of the literature and the findings of the empirical study. There is evidence of high
transaction costs and significant changes in project costs leading to increasing user charges
and high payment by the public client in the case of shadow and toll roads respectively. Other
paramount reasons from the literature necessitating the renegotiation of PPP road projects are
opportunistic bidding on the part of the concessionaire, contract incompleteness, departure
from the expected contract outcomes, which may be due to the high transaction cost ranked
highest etc.
These findings, which is based on other countries, differ considerably from the findings of the
UK as most of the renegotiations experienced on the case study projects witnessed
considerable changes, which borders on standards, the scope of works, specification,
technology etc. Additional works at the construction and operational stages of the PFI
(DBFO) road projects are also renegotiation-leading factors amongst others. Other reasons,
which are considered main and positive that informs the decision of the public and private
stakeholders to renegotiate the contract are the response to the provisions of the original
contract, need to ensure a safer road for travelling public and to provide VfM benefits for the
public etc.
5. CONCLUSION AND RECOMMENDATIONS
Certain issues have plagued the PFI as a method of procurement in the UK, which have
necessitated government to make a paradigm shift to private finance 2 (PF2). One of the
107
issues is the non-achievement of VfM for the public sector as a result of renegotiation of
infrastructure projects e.g. PFI road project. Though, the credibility of PPP renegotiation has
been questioned across Latin American countries versed in the adoption of PPP for the
delivery of road projects, Portugal, Spain and others. However, in the context of the UK, the
reverse is the case as most of the responses reveal the achievement of VfM in PFI (DBFO)
road project. Based on this finding, the emerging challenge, therefore, is to provide an answer
to why some PPP road project renegotiations are not achieving VfM for the public sector.
The results of the literature and empirical study on factors leading to the renegotiation of UK
PFI (DBFO) road projects renegotiations reveals that there are different reasons why the
respective contracts experienced renegotiations.
From the literature perspectives, renegotiations are premised on design and planning errors,
defective regulation, opportunistic behaviours of the contracting parties, poor administration
and management skills e.g. error in tender evaluation and management of the implementation
process amongst others. However, the empirical perspective based on the findings of the
study of the DBFO road projects in the UK reveal contrasting position premised on the fact
that few of this reasons necessitate the renegotiation experienced on the case study projects.
Thus, one can conclude that the factors leading to the renegotiation of PPP road projects or in
other words, the reasons why the main stakeholders renegotiate the contract have an impact
on the outcome achieved in terms of VfM criteria established for the contract. Based on this
conclusion, the following recommendations become necessary:
There should be a definition at the start of the contract the factors, which should lead
to renegotiation and the factors, which should not lead to renegotiation of PPP road
projects
Renegotiation should only be requested when it is highly reasonable that that value
for money will be achieved.
There should be justifiable reasons, which is proved and tested beyond the reasonable
doubt and agrees with the contract provisions.
The changes proposed to the contract must be agreed by both parties to be value for
money change at the point of the renegotiation and must benefit all stakeholders
especially the road users and the public sector.
6. REFERENCE
Acerete, J. B., Shaoul, J., Stafford, A., & Stapleton, P. (2010) The cost of using private finance for roads in
Spain and the UK. Australian Journal of Public Administration, 69(1), 48-60.
Akintoye, A. (2009) Public Private Partnerships for physical infrastructure in developing countries. In: Akintoye
A. & Beck M, 1st Ed. “policy, finance and management for PPPs”. West Sussex, UK. Blackwell
Publishing Ltd.
Ballati, D., & Robinson, R. (2014). Public-Private Partnerships: Lessons Learned and Predictions for the Future.
Constr. Law., 34, 27.
Ballati, D.S. and Douglass, S. (2013) Public-Private Partnerships: successes, failures and plans for the future.
Law Business Research Ltd 1998-2015. www.google.co.uk.
Baeza, M. D. L. Á., & Vassallo, J. M. (2010). Private concession contracts for toll roads in Spain: analysis and
recommendations. Public Money & Management, 30(5), 299-304.
Beckers, T., Gehrt, J., & Klatt, J. P. (2010) Renegotiation design for long-term contracts the case of public-
private partnerships. WIP-Working Paper No. 2010-01. Downloaded from www.googlescholar.co.uk on 12-
12-14.
Bi, X., & Wang, H. (2011, September). The control of moral hazard in PPP project renegotiation. In Industrial
Engineering and Engineering Management (IE&EM), 2011 IEEE 18Th International Conference on (pp.
232-236). IEEE.

108
De Brux, J. (2010). The dark and bright sides of renegotiation: An application to transport concession contracts.
Utilities Policy, 18(2), 77-85.
Chan, H., Levitt, R. L., & Garvin, M. J. (2010). Collective effect of strategic, cultural and institutional factors on
concession renegotiations. Proceedings Editors.
Cruz, C., O. and Marques, R., C. (2013a). Endogenous determinants for renegotiating concessions: evidence
from local infrastructure. Local Government Studies, 39(3), 352-374.
Cruz, C., O., and Marques, R., C. (2013b). Exogenous determinants for renegotiating public infrastructure
concessions: evidence from Portugal. Journal of Construction Engineering and Management, 139(9), 1082-
1090.
Domingues, S., and Zlatkovic, D. (2014). Renegotiating PPP Contracts: Reinforcing the ‘P' in Partnership.
Transport Reviews, (ahead-of-print), 1-22.
Estache, A., Guasch, J. L., Iimi, A., & Trujillo, L. (2009). Multidimensionality and renegotiation: evidence from
transport-sector public-private-partnership transactions in Latin America. Review of Industrial
Organization, 35(1-2), 41-71.
Engel, E., Fischer, R., and Galetovic, A. (2014). Renegotiation in Public-Private Partnerships: Theory and
Evidence. Discussion Paper No 2014-17. Prepared for the Roundtable: Public Private Partnerships for
Transport Infrastructure: Renegotiations, how to approach them and economic outcomes 27 - 28 October
2014, George Mason University, Washington D.C., USA
Engel, E., Fischer, R., and Galetovic, A. (2009). Soft budgets and renegotiations in public-private partnerships
(No. w15300). National Bureau of Economic Research. www.googlescholar.co.uk.
Fatokun, A., Akintoye, A., Liyanage, C. (2016). Factors Influencing the Renegotiation of Public- Private
Partnership Road Projects. In the Proceedings: CIB World Building Congress in Tampere, Finland, 30th
May to 5th June 2016.
Gifford, J., Bolanos, L., and Daito, N. (2014). Renegotiation of Transportation Public-Private Partnerships: The
US Experience. Discussion Paper No 2014-16. Prepared for the Roundtable: Public Private Partnerships for
Transport Infrastructure: Renegotiations, how to approach them and economic outcomes 27 - 28 October
2014, George Mason University, Washington D.C., USA.
Guasch, J. L., and Straub, S. (2009). Corruption and concession renegotiations: Evidence from the water and
transport sectors in Latin America. Utilities Policy, 17(2), 185-190.
Ho, S. P. (2006). Model for financial renegotiation in public-private partnership projects and its policy
implications: game theoretic view. Journal of Construction Engineering and Management, 132(7), 678-688.
Ho, S. P., & Liu, L. Y. (2004). Analytical model for analysing construction claims and opportunistic bidding.
Journal of construction engineering and management, 130(1), 94-104.
IFSL. 2009, PFI in the UK & PPP in Europe. International Financial Services London (IFSL).
Makovsek, D., Hasselgren, B., and Perkins, S. (2014) Renegotiations, how to approach them and economic
outcomes. Discussion Paper No. 2014-25. Summary and Conclusions of the Roundtable with the same title
(27-28 October 2014, Washington D.C.).
Medda, F. R., Carbonaro, G., and Davis, S. L. (2013) Public private partnerships in transportation: Some
insights from the European experience. IATSS Research, 36(2) 83–87.
Menezes, F. and Ryan, M., 2015. Default and Renegotiation in Public‐Private Partnership Auctions. Journal of
Public Economic Theory, 17(1), pp. 49-77.
Montecinos, J. and Saavedra, E. (2011) Renegotiation of Concession Contracts: Empirical Evidence for Public
Transport Infrastructure in Peru. Downloaded from www.googlescholar.co.uk on 12-12-14.
Nikolaidis, N., and Roumboutsos, A. (2013) A PPP renegotiation framework: a road concession in Greece. Built
Environment Project and Asset Management, 3(2), 264-278.
Sarmento, J. M. (2014) Public Private Partnerships. PhD thesis submitted to the School of Economics and
Management. Tilburg University.
Treasury, H. M. (2012). UK private finance initiative projects: summary data as at March 2012. Online im
Internet: www. gov.uk
Trebilcock, M., & Rosenstock, M. (2015). Infrastructure public-private partnerships in the developing world:
Lessons from recent experience. The Journal of Development Studies, 51, 335–354.
Xiong, W., & Zhang, X. (2014). Concession Renegotiation Models for Projects Developed through Public-
Private Partnerships. Journal of Construction Engineering and Management, 140(5).pp. (4008-1) - (4008-9).

109
DESIGN AND URBAN DEVELOPMENT

110
ID 020
SAUDI HOUSING POLICIES AND PROGRAMS: A REVIEW OF THE
PAST AND PRESENT IN LIGHT OF THE 2030 VISION
M. Alhajri, C. Trillo and D. Baldry
School of the Built Environment, University of Salford, Salford, M5 4WT, UK
Email: [email protected]
Abstract:Saudi Arabia has experienced a high population growth with a high urbanization
rate that has reached 80% resulting in an upsurge in the demand for housing and sharp
increases in land prices and construction costs, particularly in urban areas. Saudi Arabia has
introduced policies and programs to meet housing needs. This paper aims to discuss housing
policies and program in Saudi Arabia as presented in the literature and published government
reports before and within Five Year Development Plan until the present to have a
comprehensive understanding of the housing sector in Saudi Arabia. Additionally, the paper
will draw some conclusions and make some recommendations to meet the Saudi Vision 2030
concerning the needs in the housing sector.
Keywords: Housing Policies and Programs, Kingdom of Saudi Arabia, Saudi Vision 2030.
1. INTRODUCTION
Saudi Arabia consists of thirteen regions with a total area of 2,250,000 square kilometres. In
the late 1940s the process of urbanization in Saudi Arabia started with the commercial
production of oil (Al-Hathloul & Edadan, 1991). One of the major results of the oil discovery
has been a massive increase in population especially in urban areas, which is reflected by the
combined effect of a natural increase, a larger foreign work force, and migration from rural to
urban areas in search of employment opportunities and improved living standards (Huang,
1985). Population growth is one of the essential factors affecting the housing need. Saudi
Arabia has one of the highest birth rates in the region and its population has massively
increased, rising from 7.01 million in 1974 to 22.67 million in 2004. In 2009, the population
was 25.37 million, and in 2016 it was 31,742,308 people (Central Department of Statistics
and Demographics, 2016). The population growth and size has implications on policy making
to strengthen the public utility and service provision (Abdul Salam, Elsegaey, Khraif, & Al-
Mutairi, 2014). Since the foundation of the Kingdom of Saudi Arabia in 1932, the
government has implemented several housing programs and policies to ensure housing
delivery. The main goal of the Government Housing Policy is to provide citizens with safe,
and suitable accommodations (Al-Otaibi, 2006). This paper aims to discuss housing policies
and programs in Saudi Arabia as presented in the literature and published government reports
before and within Five Year Development Plan until the present in order to have a
comprehensive understanding of the housing sector in Saudi Arabia. Additionally, the paper
will draw some conclusions and make some recommendations to meet the Saudi Vision 2030
concerning the needs in the housing sector.
111
2. BEFORE THE FIVE-YEAR DEVELOPMENT PLANS 1932-1970
In 1932, King Abdulaziz unified the country as a new state. This new nation had no
infrastructure or technology and its industrial base was non-existent. It also had no modern
social, medical or educational institutions. There were shanty settlements in the central and
eastern regions of the country and the economic base was different from one region to
another depending on their location. The discovery of oil and the resulting production
operations led to a change in the basis of the nation’s economy. Many activities and services
related to oil production were imported to the country through the east and west coasts: this
was a new challenge and led to economic development, with an economic change from
agriculture and nomads to an oil-based industrial nation. The first oil community was built in
Dhahran in 1938, and subsequently Ras-Tanura became an oil industrial operation city. the
urbanization rate had reached 10%. Like the trading route before oil production in the
Arabian Peninsula, the construction of the 1200km TAPLINE (Transit –Arabian Pipeline)
from Qaysomah in the eastern province of Saudi Arabia to the Sidon Port in Lebanon was the
reason for new settlements in the country along this pipeline and near the oil pumping
stations, and each of these settlements was self-sufficient (Al-Mubarak, 1999).
2.1 Housing Ownership Programs
The first housing program was introduced by Aramco (Saudi Oil Company) with the
cooperation of the Saudi government in order to obtain and develop urban settlements and
provide accommodation for Saudi employees working for the oil industry in 1953. The
government granted lands and the company provided the Saudis with interest-free loans. The
program granted a five-year rent plan for contractors, which aimed to encourage local
contractors to build housing units in order to increase the supply of housing in the region. The
requirement for these loans was to be an employee in the company for a minimum of four
years and to continue working for Aramco until the loan was paid back. The candidate
received the loan at different stages of the construction period (Tunclap and Al-Ibrahim,
1990). This was the first housing program in the country.
2.2 Al-Malaz and Al-Nassaryia Projects
Al-Malaz Project, was the first housing project by the Saudi government ousing covered 500
acres, with 750 villas and three apartment buildings with 180 flats, as well as all required
facilities and services, including public gardens, a race track, a football field, a public library
and a public zoo, all of which were introduced to the city for the first time. Al-Malaz Project
introduced new types of housing to the central region for the first time. Also, Al-Nassaryia
Project developed a royal residential complex containing villas and residential buildings (Al-
Hathloual, 1981). In addition, the government hired foreign expatriates to design this housing
project and the villas and apartments were sold to the government employees on a long-term
basis (Al-Mayouf and Al-Khayyal, 2011).
2.3 Land Grants
The founder of Saudi Arabia, King Abdulaziz, took settlement policies to the Bedouin and
Nomads by settling them to control the country. They settled on land granted by the

112
government in small villages in rural areas. In 1954, the Ministry of Municipalities and Rural
Affairs took the responsibility for developing land and authorized local municipalities in
urban areas to grant free land to Saudi citizens. This policy granted a free residential land plot
for every eligible citizen in his area of residence in a planned neighbourhood, whether a city
or town municipality (Al-Mayouf & Alkayyal, 2011).
3. FIVE-YEAR DEVELOPMENT PLANS
A Five-Year Development Plan is a short-term comprehensive plan applied, and monitored
by the Ministry of Planning and Economy to achieve the development in all parts of the
country. It aimed to transform rural areas into urban and industrial societies by developing
both the human resources and the physical environment (Al-But’Hie and Saleh, 2002). In
addition, one aspect of the government concentration on the housing sector over the past
decades was giving housing provision the utmost importance in five-year Development Plans.
According to Al-Otaibi (2006), “It is useful to consider the implementation performance of
the housing program through the Saudi Five-year development plan” (p5). Figure 1 represent
key event that have influenced housing development in Saudi Arabia.

113
Figure 1: Key Events that Have Influenced Housing Development in Saudi Arabia
3.1 First Five Year Development Plan (1970-1975)
Urban development in Saudi Arabia began with the start of the five-year development plan in
1970. The Ministry of Municipal and Rural Affairs (MOMRA) carried out regional studies in
five different regions to establish a physical plan. This was the first major effort at a national
level to address local planning. In addition, for the housing sector, the aim was to upgrade the
housing conditions of all urban and rural settlements in the kingdom by conduct a
comprehensive housing inventory. This inventory helped establish an agency to fund
housing, to obtain a model design for residential neighbourhoods, and to create a
comprehensive housing program. During this period, 75,000 housing units were built, but the
actual need - according to the first development plan - was 154,000 housing units.
(Bahammam, 2002). Furthermore, at the end of the first development plan, the government
established the Real Estate Development Fund (REDF), created to contribute to the
establishment of modern housing and housing complexes in different parts of the country
Pre- National Unification Period National unification Period
Majority of Village Founded Settlement Policies
First Oil Community
First Master Plan
TIPELINE New Settlement
Ministry of Public works and Housing Real Estate Development Fund
Comprehensive Regional Development Plan
First Five Year Development Plan
National Spatial Strategy
Ministry of Public works and Housing cancelled
Housing Authority
Establishment of Ministry Of Housing
Saudi Vision 2030
1900 1902
1913
1940
1947
1950
1970
Al-Malaz and Al-Nassaryia Projects
1976
1985
1995
2000
2005
2010
2015
Aramco Housing Ownership Program
First Physical Plan

114
(REDF, 2017). This was the first step to encourage individual citizens by providing funds,
and it led to the construction sector being activated. On the other hand, when the Government
Staff Housing Program started, many government agencies provided accommodation for
some or all of their employees by developing their own local housing communities, which
provided all necessary services and infrastructure for their residents (Bahammam, 2002).
3.2 The Second Five Year Development Plan (1975-1980)
The government also established housing programs in order to design and build housing for
middle and low-income people, to identify eligible citizens, to collect payments from the
beneficiaries over the long term (25 years), and to perform maintenance. In addition, there
was a rush housing project by the public sector in Eastern and Western regions of the
country. In the same year, MOMRA conducted seven master-plan projects in different parts
of the country, which included the following cities: Jeddah, Riyadh, Dammam, Madinah,
Abha, Jizan, and Taif (Al-Hathloul & Edadan, 1991). Furthermore, the main goals of the
housing sector were to provide families with comfortable housing units that were appropriate
for their income, to increase the supply of housing, to develop housing with regular urban
forms, and to develop different financial legislative agencies to support housing development.
There was a need for 329,000 units in different regions of the country during this period,
where the public sector achieved 102% of the goal. The target of the second development
plan was to build 52,500 units and the achievement was 53,600 units, while the private sector
achieved 123% of its target. 122,100 units were needed and 150,000 were built (Second Five
Year Development Plan, 1975). Therefore, the successful provision of the target number of
new housing units can be attributed to three factors: the starter fund from the REDF in 1976
to provide public housing by the government, the provision of staff housing and the
construction boom in the country during this period.
3.3 The Third Five Year Development Plan (1980-1985)
The housing need for this period was 730,000 housing units, including homes for new
families and replacement housing for families who lived in poor housing conditions, or
demolished and burned housing units. More than a quarter of families obtained modern
housing units during this period. Also, housing projects from the Second Five Year
Development Plan were continued, providing 15,853 housing units. New housing projects
provided citizens with 10,000 units, as well as providing 14,800 land lots with connected
infrastructure in fifteen different locations across the country (Bahammam, 2002). In
addition, the Ministry of Housing and Public Work established three housing projects in the
three major cities: Riyadh, Jeddah, and Dammam. In total, the three projects provided homes
for more than 27,799 people. Furthermore, during this period a 1984 decree - issued by the
council of ministers -encompassed the urban growth boundary of Saudi towns and cities for
the next 20 years (Al-Hathloul & Mughal, 2004).
3.4 The Fourth Five Year Development Plan (1985-1990)
The government reviewed the housing policies and funding regulation from the REDF. By
the end of this period, there were 871,700 housing units. 172,607 were built during the fourth
development plan. The target was 285,000 housing units. This period came before the budget
115
deficit caused by the Gulf War in 1990, which led to a slowdown in development during the
1990s (Al-Mayouf & Al-Khayyal, 2011).
3.5 The Fifth Five Year Development Plan (1990-1995)
The following policies were established during the fifth development plan. Firstly, to review
policies in the different government agencies related to the housing sector. Secondly, to limit
the construction of housing from different government agencies. Thirdly, to develop
applicable tools to enhance the housing conditions for low income people. Fourthly, to
review the REDF regulations. Fifthly, to establish a national building code. Sixthly, to
encourage the private sector to fund housing projects with cooperation from the REDF.
Seventhly, to conduct an inventory of poor-condition housing.
Furthermore, the government established the National Spatial Strategy to achieve equality of
development, based on the needs of the population of each region. At the end of the fifth
development plan, there were 2,850,000 housing units. The private sector built 2,604,430
units, accounting for 91% of the existing units, and 20.9% of these units were funded by the
REDF (Fifth Five Year Development plan, 1990).
3.6 The Sixth Five Year Development Plan (1995-2000)
The estimated housing demand during the sixth development plan was for the private sector
to provide between 500,000 and 600,000 housing units, in cooperation with the REDF. The
aim was to increase the level of home-ownership with the encouragement of the private
sector. A total of 283,300 housing units were provided during this period. The total number
of housing units at the end of this plan was 3,120,000, 92% of which were built by the private
sector and 573,000 funded by the REDF. The public sector only built 8% of the total housing
units constructed in the country during this period. There was a clear gap between the number
of housing units and the population growth rate, which reflected the housing need (Al-
Mayouf & Al-Khayyal, 2011).
3.7 The Seventh Five Year Development Plan (2000-2005)
The total housing demand during this five-year period was 800,000 housing units, and the
goals of the housing plan were to have a national long-term housing strategy, to increase the
supply of residential land lots with necessary infrastructures and services, and to reduce
spending on planning, construction, and maintenance. In addition, it aimed to provide tools
for the private sector to provide funds and to establish comprehensive sustainable housing
projects. The total number of housing units built in the seventh development plan period was
300,000. Home ownership fell from 60% during the seventh development plan to 55%. In
addition, there was a shortfall of 270,000 houses behind the target of the housing sector in the
seventh development plan (Seventh Five Year Development Plan, 2000). During this period,
the Ministry of Public Works and Housing was closed in 2003. This had built more than
25,000 housing units in the main cities, and it had been responsible for housing construction
for Saudi citizens since its establishment in 1975, and aimed to fulfil housing demand
(Sidawi, 2009).

116
3.8 The Eighth Five Year Development Plan (2005-2010)
The total number of housing units needed during this period was 1,000,000. It was also
necessary to develop 280,000,000 square metres of land in different parts of the country as
residential land lots. During the eighth development period, the goals were to provide
housing units for every family that did not have one, and to increase the housing ownership
rate. In order to achieve these goals, the following polices were established: to increase
housing for low income people, to have different types of housing funds, to reduce the cost of
construction and maintenance, to ensure that housing programs cover all parts of the country
especially small towns, to enhance residential land management, to encourage the
intervention of the private sector, to review housing codes and expand housing charity
projects, to develop national housing strategies, to develop and implement a Saudi housing
code, to prepare housing studies, and to conduct research and inventories, in addition to
setting up a housing database. In 2008 the government established the General Housing
Authority (GHA), which took over responsibility for all housing affairs from different
government agencies (Al-Mayouf and Al-Khayyal, 2011).
3.9 The Ninth Five Year Development Plan (2010-2015)
The goals of the ninth development plan was to complete and start to implement a
comprehensive housing strategy, to reduce and eliminate the widening gap between demand
and supply of housing, to achieve intensive development and improvement of the housing
sector, to develop and organize funding and lump sums, to develop regulations for renting
rights for owners and renters, and to set up regulations to encourage private sector
intervention in housing projects and programs. In addition, the plan for this period was to
provide 1,000,000 housing units in different parts of the country and the aim was to enable
the housing sector to provide comfortable residential units for the different classes of society
in all regions (Ninth Five Year Development Plan, 2010).
3.10 The Tenth Five Year Development Plan (2015-2020)
This period aims to implement Housing National Strategy which aim to diversify the
financial resources of REDF, to enhance housing found and mortgage, to implement
regulation which guarantor the rights of tenants and landlord, and to increase private sector
participation. Furthermore, the plan for this period is to build 1,250,000 housing units (Tenth
Five Year Development Plan, 2010).
In 2016, to meet housing needs and challenges that the housing sector faced, The Ministry of
Housing applied several programmes as following (Ministry of Housing, 2016):
The Alaradi Albida Program aims to increase the supply of developed land, to
provide residential land with suitable prices, and to bring equality in the residential
market.
The Wafi program aims to encourage private developers by selling housing units at
an earlier stage after the design or during construction, and the Ministry of Housing
will be the guarantor.

117
The Masarat Tamalk is a comprehensive program to study the beneficiaries’
housing needs to provide them with suitable housing based on his/her social and
financial situation.
The Etihad Almolak Program aims to regulate the relationship between owners and
occupants in the joint ownership of housing units.
The Eajjar Program aims to develop the real estate market though providing a
solution that is integrated between the landowner, the tenant, and the real estate agent
with unified rental contracts and to provide electronic services via the Ministry of
Housing system.
Etmam is a centre that provides all the services related to private developers. It
provides all the data and requirements needed by private real estate developers in
order to speed up the process that they are required to follow to conform to
government requirements.
4. SAUDI VISION 2030
In 2016, The Saudi Arabian Government announced the new Saudi Arabia’s Vision 2030,
which is going to be implemented as a roadmap for economic and developmental action in
the country. In its aim to grant the Kingdom a leading position in all fields, Saudi Arabia’s
Vision 2030 seeks to identify the general directions, policies, goals, and objectives of the
Kingdom. Some ministries, institutions, and government entities underwent a restructuring
process to align themselves to the requirements of this phase. In order to enhance the level
and quality of services provided to beneficiaries; and achieve a prosperous future and
sustainable development (Saudi Vision 2030, 2016). Saudi Government will seek to increase
private sector contribution by encouraging investments, both local and international, in
healthcare, municipal services, housing, finance, energy and so forth. According to the Saudi
Vision 2030, even though 47% of Saudi families already own their homes, the aim will be to
increase this rate by five percentage points by 2020. This would be a substantial achievement
given the high increase in the number of new entrants to the housing market. The government
plan to meet this target by introducing a number of laws and regulations; encouraging the
private sector to build houses; and providing funding, mortgage solutions and ownership
schemes that meet the needs of Saudi citizens (28). For the housing sector, the new vision is
to establish and develop programs to encourage partnership between the private and public
sectors in organizing, planning and monitoring housing for the different levels of the society
with a reasonable quality and price (Ministry of Housing, 2016). Therefore, the new strategy
is to transfer to public private partnership (PPP) in housing delivery
5. PUBLIC PRIVATE PARTNERSHIP (PPP)
The idea of Public Private Partnerships PPPs has been around since the seventies. There is no
simple agreed-upon definition of the term PPP, which covers several models of operation
including DBFO - design, build, finance and operate; BOOT - build, own, operate and
transfer; and BOT - build, operate and transfer. Public private partnership (PPP) has been
defined as “a partnership for construction, operation and maintenance, and service delivery of
public projects by the private sector” (Chowdhury, Chen, & Tiong, 2011). PPP are now
written into legislation in many countries like UK, USA, France, Italy, and The Netherlands
(Bovaird, 2004). The change in the regulation of providing and maintaining public

118
infrastructure and facilities is now known as the New Public Governance (NPG)
(Caperchione, Demirag, & Grossi, 2017). There are two key drivers in most countries for
public private partnership: the activation of private sector funding for public service and the
utilization of the expertise from the private company and their capital for massive investment.
Because of the success it has had, public private partnership is celebrated as a viable
alternative and strategy for creating and delivering public services to cities in the developing
world (Miraftab, 2004). In addition, “governments around the world are turning to PPPs as
one possible financing option for large scale investments in the provision of affordable
housing and other basic infrastructure assets.” (UN-HABITAT, 2011).
In Saudi Arabia, the concept of partnerships with the private sector stated in official Saudi
government documents from the late 1970s but there were no regulations or policies
developed to until 2002 which was comprehensive framework to regulate the involvement of
the private sector in the provision of water and electricity. Furthermore, study by Biygautane
2017 shows that there are seven major PPPs infrastructure projects in Saudi Arabia two of
them were to build airports and other projects where in power and water planets. For
example, in 2009 Prince Mohammad bin Abdulaziz International Airport, in Medinah was
built under a PPP agreement. Therefore, in Saudi Arabia from the two pilgrim airports and,
several independent water and power plants, PPPs have not been used in other high-profile
infrastructure projects. Unlike Western countries, where PPP have been used occurs across a
wide range of projects (Biygautane, 2017).
In 2016 the Ministry of Housing defined PPP as a long contract relationship between the
public and private sectors to get the benefit of experience resources. The assets of both
sectors will provide a service, and the risk is shared based on the partnership contract. In
addition, the aim of obtaining PPP in the housing sector is to increase the supply of the
affordable housing, reduce the cost, and motivate the private sector to develop new housing
within a shorter time.
6. CONCLUSIONS
The series of five-year development plans was the government’s main instrument to steer the
development of housing in Saudi Arabia. Housing units were provided by both the
government and the private sector, with the support of the REDF. It is clear that at the end of
the second development plan the number of housing units built met the target. This was also
true of the third development plan. After the fourth development plan, the number of housing
units lagged behind the target of planned housing delivery, and the present tenth development
plan aims to achieve 85,6% of the total housing demand. Therefore, there has been a rapid
increase in housing demand, reaching 154% since the first development plan, and the rapid
growth in population did not coincide with the production of an adequate number of housing
units.
The REDF is the main source of funding for housing in Saudi Arabia, and is considered the
backbone of the country’s housing and real estate financial allocation. Furthermore,
1,026,083 housing units have been founded by the REDF. In addition, there has been a rapid
increase in the number of applicants and the waiting list has now reached a wait of more than
15 years.
The intervention of the Saudi government in the housing sector has gone through various
stages and formed different government policies. Different government ministries and

119
agencies, several of which have been cancelled or replaced by others, have applied these
policies. At the beginning of this development, during the 1970s, the responsibility was held
by the Ministry of Finance, and later by the Ministry of Housing and Public Works, as well as
the Ministry of Social Affairs for housing for low-income households. In 2003, the Ministry
of Housing and Public Works was closed. Later, in 2008, the government established the
General Authority for Housing, which became the Ministry of Housing in 2010.
The government commitment to delivering housing units has been clear since the first
development plan between 1970-1975, where the Saudi Government played the role of the
founder, developer, and contractor in delivering housing. Since 1990, the number of housing
units needed has sharply increased with every government’s five-year development plan. The
Ministry of Housing (2016) announced that in 2020 the total number of 1,250,000 housing
would need to be built, to meet the housing demand. Therefore, to meet this demand the new
government strategy is to shift from the role of provider to enabler and give the role of
housing delivery to the private sector. It has become clear that the government alone cannot
provide adequate housing and meet the housing need due to a lack of investment and a
decrease in the housing budget (Salama & Alshuwaikhat, 2006). The government’s new
strategies to meet the housing need gives the private sector a greater role though PPP.
However, the legal and regulatory framework for PPP is absent in Saudi Arabia (Biygautane,
Hodge, & Gerber, 2016). In conclusion, to meet housing need with the new Saudi vision
2030, the government needs to create a supportive legal framework of PPP.
7. REFERENCES
Abdul Salam, A., Elsegaey, I., Khraif, R., & Al-Mutairi, A. 2014. Population distribution and household
conditions in Saudi Arabia: reflections from the 2010 Census. SpringerPlus, 3(1), 1-13. doi:10.1186/2193-
1801-3-530
Al-But’hie, I.M. and Saleh, M.A.E., 2002. Urban and industrial development planning as an approach for
Saudi Arabia: the case study of Jubail and Yanbu. Habitat International, 26(1), pp.1-20.
Al-Hathloul, S., & Mughal, M. A. 2004. Urban growth management-the Saudi experience. Habitat
International, 28(4), 609-623.
Al-Hathloul, S, 1981. Tradition, continuity and change in the physical environment: The Arab-Muslim
city (Doctoral dissertation, Massachusetts Institute of Technology).
Al-Hathloul, S. and Edadan, N., 1993. Evolution of settlement pattern in Saudi Arabia: A historical
analysis. Habitat International, 17(4), pp.31-46
Al Hathloul, S. and Edadan, N., 1991. The distribution and growth of urban settlements in Saudi
Arabia. GeoJournal, 23(3), pp.269-281.
Al-Mayouf, A., & Al-Khayyal, A. 2011. Provision of Public Housing in Saudi Arabia: Past, Current and
Future Trends. Population, 2004, 2007.
Al-Mubarak, F. A. 1999. Oil, urban development and planning in the eastern province of Saudi Arabia: the case
of the Arab American oil company in the 1930's-1970's. Journal of King Saud University.
Al-Otaibi, A. 2006. The Aspiration for Housing in Jeddah œ Saudi Arabia. Editorial Team, 4.
Bahammam, A. 2002. Housing in Saudi Arabia: Twenty Years of Accomplishments. King Saud University.
Biygautane, M. 2017. Infrastructure Public–Private Partnerships in Kuwait, Saudi Arabia, and Qatar. Public
Works Management & Policy, 22(2), 85-118. doi:10.1177/1087724X16671719
Biygautane, M., Hodge, G. and Gerber, P., 2016. The Prospect of Infrastructure Public‐Private Partnerships in
Kuwait, Saudi Arabia, and Qatar: Transforming Challenges into Opportunities. Thunderbird International
Business Review.
Bovaird, T. 2004. Public-Private Partnerships: From Contested Concepts to Prevalent Practice. International
Review of Administrative Sciences, 70(2), 199-215. doi:10.1177/0020852304044250
Caperchione, E., Demirag, I. and Grossi, G., 2017, March. Public sector reforms and Public Private
Partnerships: Overview and research agenda. In Accounting Forum. Elsevier.
Central Department of Statistics and Demographics, 2016.Kingdom of Saudi Arabia.

120
Chowdhury, A. N., Chen, P.-H., & Tiong, R. L. K. 2011. Analysing the structure of public-private partnership
projects using network theory. Construction Management & Economics, 29(3), 247-260.
doi:10.1080/01446193.2010.537354
Huang, E. T.-Y. 1985. Residential real estate development in Saudi Arabia. Journal of Urban Planning and
Development, 111(1), 25-33. doi:10.1061/(ASCE)0733-9488(1985)111:1(25)
Kingdom of Saudi Arabia’s Vision 2030. 2016. Retrieved from http://vision2030.gov.sa/en
Miraftab, F. 2004. Public-private partnerships: The Trojan horse of neoliberal development?, Journal of
Planning Education and Research, 24(1), 89-101.
Real Estate Development Found. 2017. Riyadh. Saudi Arabia.
Salama, A. M., & Alshuwaikhat, H. (2006). A trans-disciplinary approach for a comprehensive understanding
of sustainable affordable housing. Global Built Environment Review, 5(3), 35-50.
Sidawi, B. 2009. Hindrances to the financing of affordable housing in Kingdom of Saudi Arabia. Emir. J. Eng.
Res, 14, 73-82.
Ministry of Economy & Planning. 1970. First Development Plan 1970–75. Riyadh, Saudi Arabia.
Ministry of Economy & Planning. 1975. Second Development Plan 1975–80. Riyadh, Saudi Arabia.
Ministry of Economy & Planning. 1980. Third Development Plan 1980–85. Riyadh, Saudi Arabia.
Ministry of Economy & Planning. 1985. Fourth Development Plan 1985–90. Riyadh, Saudi Arabia.
Ministry of Economy & Planning. 1990. Fifth Development Plan 1990–95. Riyadh, Saudi Arabia.
Ministry of Economy & Planning. 1995. Sixth Development Plan 1995–2000. Riyadh, Saudi Arabia.
Ministry of Economy & Planning. 2000. Seventh Development Plan 2000–2004. Riyadh, Saudi Arabia.
Ministry of Economy & Planning. 2005. Eighth Development Plan 2005–2009. Riyadh, Saudi Arabia.
Ministry of Economy & Planning. 2010. Ninth Development Plan 2005–2009. Riyadh, Saudi Arabia.
Ministry of Economy & Planning .2015. Tenth Development Plan 2005–2009. Riyadh, Saudi Arabia.
Ministry of Housing. 2016. Riyadh, Saudi Arabia. Retervied From: https://housing.sa/en
Tuncalp, S., & Al-Ibrahim, A. 1990. Housing finance in Saudi Arabia?, Habitat International, 14(1), 111-121.
doi:10.1016/0197-3975(90)90019-W
UN-HABITAT. (2011). Public Private Partnership for Housing and Urban Development. Retrieved from:
https://unhabitat.org/public-private-partnership-in-housing-and-urban-development/

121
ID 052
CRITERIA FOR PUBLIC SCHOOL CONSTRUCTION IN POLLUTED
ENVIRONMENT: A CASE OF THE NIGER DELTA AREA OF
NIGERIA
U. J. Ogbonda and Y. Ji
School of the Built Environment, University of Salford, Salford, M5 4WT, UK
Email: [email protected]
Abstract: The inhalation of poor indoor air due to infiltration of polluted outdoor air and its
correlation to the health of schoolchildren and their academic performance has led to different
guidelines and specifications considered as means to provide clean indoor air into the
classroom for schoolchildren who spend 80% of their active times in schools. Yet this has not
in any way been considered in the Niger Delta (ND) area of Nigeria where open air burning of
gas emitting more than 200 anthropogenic substances into the environment is an everyday
occurrence. The aim of this paper is to attempt to address environmental issues through the
design of a performance specification that can be used to achieve clean indoor air based on
developed standards and experts views centred on immediate environmental considerations for
schools in polluted areas of Nigeria. Adopting a design science methodology and using open-
ended self-administered questionnaire technique, this paper finds that immediate environment
specific condition is significant for clean indoor air. Analysis showed that rather than rely on
the Nigerian Building Code or the internationally acclaimed air limits recommended globally,
the immediate environment should be considered in the selection criteria of some chemical
substances due to activities carried out in the Niger Delta. Environment specific criteria that
will enhance the choice of material, design and construction method used for school
construction were therefore recommended.
Keywords:Air Pollution, Environment Specific Criteria, Niger Delta, School Building and
Schoolchildren.
1. INTRODUCTION/ BACKGROUND
Most developed countries have regulations and guidelines for schools to follow in achieving
clean air quality in schools. For instance, in the USA, the Clean Air Act (EPA, 2013)
prescribes a management framework for indoor air that helps schools achieve good indoor air
quality for the comfort of students and staff. The European Union (EU) has also implemented
different indoor quality strategies to help in reducing health risk and provide comfort for the
school environment (EFA, 2001). The London Sustainable Exchange (LSX, 2013) made
specific provisions in their school curriculum where citizen science is taught in schools and
out of school lessons are held in other to educate students, teachers, support staff and
maintenance teams on the need for a clean environment. Recommended ventilation systems
including both naturally by open window ventilation systems and mechanically by any device
that will allow clean air into buildings with minimal energy have been stated (Bakó-Biró,
Clements-Croome, Kochhar, Awbi, & Williams, 2012; Gao, Wargocki, & Wang, 2014).
ASHRAE (2007) recommended an acceptable ventilation rate of 6.7 to 7.4 l/s – person. Other
national guidelines specify other ventilation rates for classrooms. For example, the
Portuguese Standard prescribes a rate of 8.3 l/s (Conceição & Lúcio, 2006), while Kim et al.
(2005) reported that Swedish standards require 8 l/s per person.

122
In spite of the foregoing, the Nigerian Building Codes do not provide any standard or
guidelines on indoor air quality (IAQ) for schools as section 6:2:4:1 of the Code provides that
a minimum openable area shall be 4% of the floor area ventilated. This is complicated by
section 6:2:5:1 which provides that it should conform to the specification as prescribed in the
schedule by the manufacturers (FGN, 2006). Similarly, environmental guidelines as
promulgated by the Nigerian Government Departments such as Federal the Ministry of
Environment, Federal Environmental Protection Agency and others did not include any
indoor air quality standards (FEPA, 1999; NESREA, 2010). As opined by Ladan (2013);
Weli and Adekunle (2014), indoor air pollution is not yet a priority for the Nigerian
Government. This is in spite of the preponderance of air pollution related illnesses ravaging
the areas where gases are flared constantly in the ND. Similarly, ESCAP (2012) observed that
developing nations are yet to embrace the updating of building codes as used in developed
nations, by integrating environmental sustainability and specification details.
Therefore, proposing a performance specification as a reference document requires a
methodological process that will provide the opportunity for systematic interaction of built
environment professionals to aid the design of specification for the ND.
2. LITERATURE
The Oxford Dictionary (2008) defines air quality as the degree to which the air in a particular
place is pollution-free. Air quality deteriorates mostly due to industrialisation; population
increase, traffic and energy use as stated by Zhao et al. (2012), while EPA (2011) sums it up
as the decrease in air quality because of pollution. According to the Tenth Report of the
Royal Commission on Environmental Pollution, "Air pollution is the introduction by man
into the environment of substances or energy liable to cause a hazard to human health, harm
to living resources and ecological systems, damage to structure or amenity or interference
with legitimate use of the environment." (P3 RCEP, 1984, p. 3). World Health Organisation
(WHO, 2014) defined air pollution as the contamination of the indoor or outdoor
environment by any chemical, physical or biological agent that modifies the natural
characteristics of the atmosphere.
Outdoor and indoor pollution cause respiratory and other diseases, which can be fatal (WHO,
2014). A chemical, physical or biological agent that modifies atmospheric composition
resulting in air pollution could either be natural or man-made (anthropogenic) (Jacobson,
2002). Although several definitions have been outlined above, Daly and Zannetti (2007)
opined "One could claim that air pollution started when humans began burning fuels. In
other words, all man-made (anthropogenic) emissions into the air can be called air pollution,
because they alter the chemical composition of the natural atmosphere" Daly and Zannetti
(2007, p. 2). Based on the description above, possible deterioration effect of air quality
would be said to result from the impact of gas flare causing air pollution.
Nigeria has thirty six states, with Abuja as the capital, of which nine constitute the ND
situated at the zenith of the Gulf of Guinea on the west coast of Africa and on the Nigerian
South – South geopolitical zone (NDDC, 2006) as designated on the map in different colours
(figure 1). These 9 states namely; Abia, Akwa Ibom, Bayelsa, Cross River, Delta, Edo, Imo,
Ondo and Rivers as designated, spread across 185 local government areas.

123
Figure 1: Map of Nigeria showing the ND in coloured patches
Source: NDDC (2006)
Figure 1 represents the map of Nigeria with the 9 states in the ND denoted in other multiple
colours. It is densely populated poor area representing 12% of Nigeria’s total surface area of
112,110 square kilometres with an average population density of 265 inhabitants per square
kilometre.
There are over 18 multinational oil companies which are involved in oil and gas exploration
and production in the ND (Poindexter, 2008). Nigeria has a gas reserve of over 110 trillion
standard cubic feet (ft3), about ten times its crude oil reserves. In 1989, 617 billion ft3 of
associated gas was flared, releasing 30 million tons of CO, at the end of 1999. Cumulative
gas production in Nigeria amounted to ca. 27,795.22 barrels per standard cubic feet (Bscf) of
which ca. 23,005.35 Bscf was flared representing 82.8% of the net gas produced
(Malumfashi, 2007; Nwanya, 2011). These flared gases are mostly carbon black coloured as
represented in figure 2. Accordingly, Nwanya (2011) affirmed that in ND about 2.5 billion
cubic feet of gases are flared per day and has an estimated 106 trillion m3 of proven natural
gas. However, the amount of flared gases could be higher than what is been estimated as
observed by the Nigerian National Petroleum Cooperation (NNPC) in their 2014 reports
(NNPC, 2014). This is because a significant number of oil companies exploring oil and
flaring gases do not provide figures for the amount of flares thereby reducing the total
amount of flares in the ND
Figure 2: A Typical Gas Flaring Effect
Source: limits (2013)

124
Figure 2 shows a carbon content of a typical flaring in the ND. The chemical composition of
the exhaust of gas flares which impacts on air quality and subsequent health impact includes
Volatile organic compounds (VOCs) and hydrocarbons (containing methane, ethane, propane
and butane, ethylene, butylenes) (Kindzierski, 1999). Due to the adverse health impact of air
pollution, the Department of Environment Food and Rural Affairs (Defra) in 2013 listed
different pollutants harmful to the health of people as shown in table 1;
Table: 1: Gas Flare and Health Effect Implications
Source: Defra (2013)
Pollutant Health effects at very high levels
Nitrogen Dioxide,
Sulphur Dioxide,
Ozone
These gases irritate the airways of the lungs, increasing the
symptoms of those suffering from lung diseases.
Particles Fine particles can be carried deep into the lungs where they can
cause inflammation and a worsening of heart and lung diseases
Carbon Monoxide This gas prevents the uptake of oxygen by the blood. This can
lead to a significant reduction in the supply of oxygen to the
heart, particularly in people suffering from heart disease
The health impact of these pollutants as summarised in table 1cannot be over emphasised yet
they are the major chemical substances emitted from gas flaring in the Nigeria Delta where
building is within 3 to 10km away from the flare site. Although research has shown that the
intensity of these chemicals is between 0 – 3.5km from the flare sites, its effect goes beyond
the estimated distance (Sonibare & Ede, 2009). The adverse health effect of these gases as
emitted from flaring sites have also been affirmed by Ovuakporaye, Aloamaka, Ojieh, Ejebe,
and Mordi (2012) in their research, provided empirical evidence showing that there are
differences in matched values of (p<0.05) significance. Their findings showed that residents
in the gas flaring areas had reduced peak expiratory flow as the rate compared to children
from the non-gas environment. Therefore, if this summation is true, what are the likely health
implications of poor indoor air quality?
3. METHODOLOGY
In other to investigate a problem and proffer a solution, the investigator needs to adopt a
methodology that will help achieve its aim. Therefore interacting with professionals
practising through a methodical process in the study area is crucial where there is no
documented evidence. According to Hevner (2007), design science (DS) is the process of
organising, defining and solving problems systematically reaching that goal. It is the
scientific study and creation of artefacts as they are developed and used by people with the
goal of solving practical problems (Johannesson and Perjons, 2012). This method proffers
solution for a recognised problem and represents its solution in a practical environment.
DS provides answers to design questions with the aim of designing to sustainability standards
through a multidisciplinary integration and methods used for actualisation (Cross, 2006;
Reich, 2013). Again, providing solutions to environmental issues and as opined by Ilstedt
and Wangel (2013), there is good potential for using design science to explore and propose
changes at larger scales, for developing prototypes on the basis of lifestyles rather than
basing the speculation on technologies only. Accordingly, Simon (1996) noted that DS is

125
about how things have to be in order to fit certain design standards for efficiency. It is like
envisioning the world where though the environment might be polluted adaptable measure
could provide livable conditions. Adequate facilities are put in place so that the adverse
effects do not have any economic, financial and environmental effects on people.
However, it is not another research strategy but a method, which uses a holistic approach to
problem-solving in order to achieve a specific goal by means of a creation of an artefact
(Johannesson and Perjons, 2012). Moreover, its uniqueness is its ability to create and
implement a solution that is able to influence or modify a particular occurrence. Furthermore,
(Van Aken, 2005), submitted that the core mission of DS is to develop knowledge that can be
used by professionals. Also, Ogbonda and Bichard (2017) noted that the adoption of DS
provides rigours and systematic process of valid information in a study where documented
evidence is scarcely evident.
Therefore, due to the complex nature of the built environment and the over-dependence of the
construction industry in Nigeria on the importation of building materials, geographically
based specification will help with material selection, design and constructions. Using this
method, this study recommends criteria that form specification requirements significant to
building in the ND.
To ascertain the level of impact of gas flare on pupils, it is pertinent to get professional
opinions of experts in the built environment, practising in the area using an open-ended
questionnaire technique, which was carried out in an iterative system. This iterative system
was conducted in different periods first in 2014 between the months of April to July and in
2015 between the months of January to February. One hundred and Twenty (120) open-ended
questionnaires were sent out to the built environment professionals out of which, one hundred
and three (103) questionnaires were returned. Professionals were asked to indicate on a Likert
Scale, the impact of gas flare on air quality, the performance of children, and impact of
Nigerian Building Code when designing schools.
4. RESULTS AND DISCUSSION
Table 2 shows the various responses, confirming that air around Gas Flare areas in the ND
adversely impacts on health, and performance of pupils. Likewise, the Nigerian Building
Code supposedly the tool guide for construction has a very low impact as responses showed
its low impact on school design.
Table 2: Impact of Gas Flare
Source: Field Survey 1 Very
low
Impact
2 Low
Impact
3 Moderate
Impact
4 High
Impact
5 Very High
Impact
Gas Flare Impact on Air
Quality
2% 5% 20% 49% 24%
Impact of Gas Flare on Pupils’
Performance
6% 11% 28% 35% 20%
Health Impact Associated with
Gas Flare
5% 6% 21% 45% 23%
Impact of Nigerian Building
Code on school Design
48% 25% 20% 7% 0%

126
From table 2, the responses show that GF has a significant impact on the factors posed in the
question. Based on the analysis, 2% showed very low impact, 5% low impact while 20%
indicated moderate impact with 49% showing high impact and 24% very high impact. This is
almost the same with the impact of GF on the performance of schoolchildren and health
impact as respondents indicated that GF has significant impacts on the factors. However, this
was different with the impact of the NBC on school design. Here respondents noted that the
NBC does not play any significant role in the design of school buildings as 48% indicated a
very low impact, 25% low impact, 20% moderate impact, 7% high impact and 0% very high
impact. Therefore, from the analysis, it is pertinent that the activities carried out in the ND
area cause pollution which affects the health of the children. Thus, the prescriptive
specification system of the NBC provides professionals with justification due to the
limitations and rigidity. This makes it a necessity for environment specific requirements that
will allow professionals achieve clean indoor air in school buildings.
Further to the statistical analysis conducted, respondents were also asked to elaborate on their
options ticked due to the open-ended nature of the designed questionnaire. Figure 3
summarises comments made by respondents confirming the results of the analysis carried out
above.
Figure 3: Gas Flare and Its Impact
Source: Field Survey
•Gas flare has high impact on air quality
•“Nobody ever talks about air quality standards or whether the air around where schools are sited is of good quality”
•“It is a shame that professionals here in Nigeria do not talk about indoor air quality as nobody measures it also. As an architect who has practiced for over 30 years, I have never seen air quality measured or considered during construction but I think it is a very serious aspects of construction that has to be looked at if and when constructing around the gas flaring areas”
Gas flare Impact on Air Quality
•The performance of children academically is affected by poor air due to gas flaring noting that if the internal area used for learning is uncomfortable due to heat gains and noise from the furance then therer will be restlessness and schildren are not able to concentrate of assimulate enough that would help them academically
Impact of Gas Flare on the Performance of Children
•There are so many health impacts associated with gas flaring such as headache, cold even cancerous dieseases Health Impacts Associated
with Gas Flaring
•Lack of its Awareness, Inadequate Provisions, Lack of Current Regulations, No unified Calibration with Imported Materials and No Assessment Panel
•“Most building materials used in construction in the Niger Delta area is not manufactured locally neither do the sellers of such materials aware of what NBC is and where they can access it from making developers rely heavily words of dealers of building material and country tag on them. If the NBC is update, it should generally merge its code with that of the developed world and besides building materials dealers are in the business to make money hence imports materials that increases their profit margin since there is no unified calibration anyway”
Impact of Nigerian Building Code on School Design
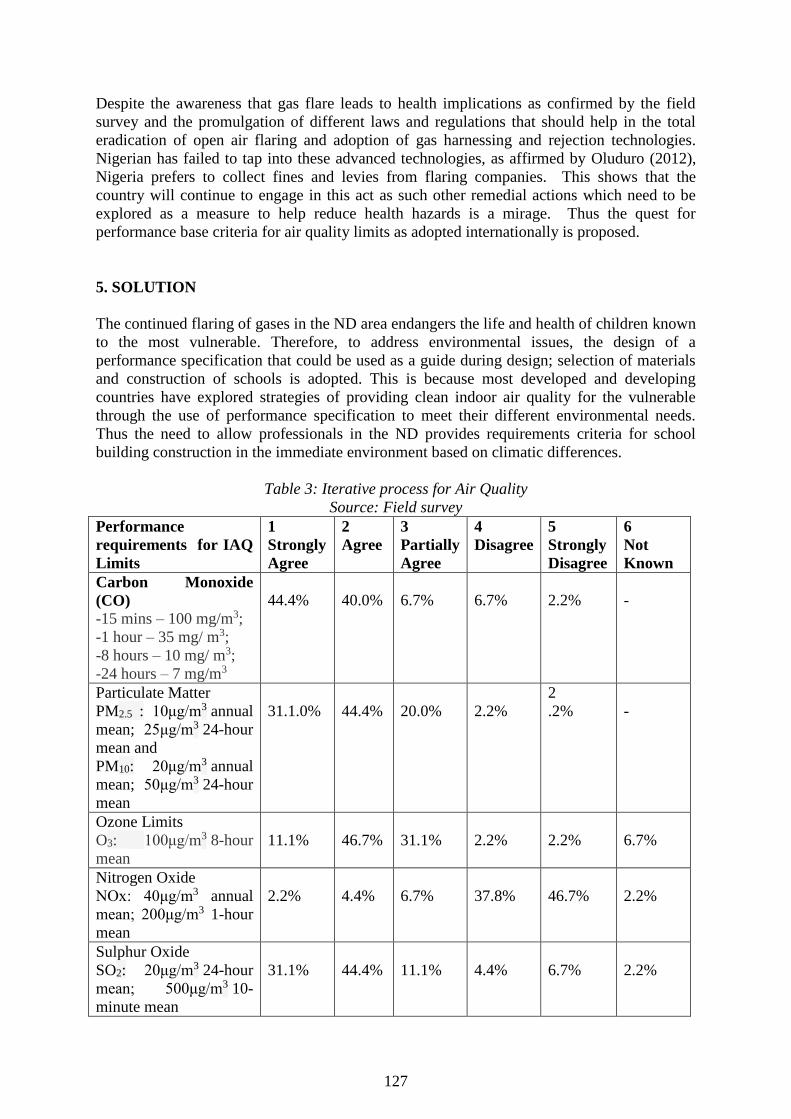
127
Despite the awareness that gas flare leads to health implications as confirmed by the field
survey and the promulgation of different laws and regulations that should help in the total
eradication of open air flaring and adoption of gas harnessing and rejection technologies.
Nigerian has failed to tap into these advanced technologies, as affirmed by Oluduro (2012),
Nigeria prefers to collect fines and levies from flaring companies. This shows that the
country will continue to engage in this act as such other remedial actions which need to be
explored as a measure to help reduce health hazards is a mirage. Thus the quest for
performance base criteria for air quality limits as adopted internationally is proposed.
5. SOLUTION
The continued flaring of gases in the ND area endangers the life and health of children known
to the most vulnerable. Therefore, to address environmental issues, the design of a
performance specification that could be used as a guide during design; selection of materials
and construction of schools is adopted. This is because most developed and developing
countries have explored strategies of providing clean indoor air quality for the vulnerable
through the use of performance specification to meet their different environmental needs.
Thus the need to allow professionals in the ND provides requirements criteria for school
building construction in the immediate environment based on climatic differences.
Table 3: Iterative process for Air Quality
Source: Field survey
Performance
requirements for IAQ
Limits
1
Strongly
Agree
2
Agree
3
Partially
Agree
4
Disagree
5
Strongly
Disagree
6
Not
Known
Carbon Monoxide
(CO)
-15 mins – 100 mg/m3;
-1 hour – 35 mg/ m3;
-8 hours – 10 mg/ m3;
-24 hours – 7 mg/m3
44.4%
40.0%
6.7%
6.7%
2.2%
-
Particulate Matter
PM2.5 : 10μg/m3 annual
mean; 25μg/m3 24-hour
mean and
PM10: 20μg/m3 annual
mean; 50μg/m3 24-hour
mean
31.1.0%
44.4%
20.0%
2.2%
2
.2%
-
Ozone Limits
O3: 100μg/m3 8-hour
mean
11.1%
46.7%
31.1%
2.2%
2.2%
6.7%
Nitrogen Oxide
NOx: 40μg/m3 annual
mean; 200μg/m3 1-hour
mean
2.2%
4.4%
6.7%
37.8%
46.7%
2.2%
Sulphur Oxide
SO2: 20μg/m3 24-hour
mean; 500μg/m3 10-
minute mean
31.1%
44.4%
11.1%
4.4%
6.7%
2.2%

128
Benzene
1μg/m3 and 1 ng/m3
(one Nanogram per
millilitre)
51.1%
40.0%
4.4%
2.2%
2.2%
-
Polycyclic Aromatic
Hydrocarbon (PAHs)
53.3%
37.8%
4.4%
4.4%
-
-
Table 3 shows analysis from an iteration process of chemical substances and limits adopted
during the study. Centred on the analysis, responses showed significant positive responses
from the limits provided in the table. Here the percentage of responses for CO showed
minimum responses of 0% for not known and maximum response of 44.4% for strongly
agrees. Similarly, PM had a minimum response of 0% for not known, a maximum of 31.1%
of strongly agree and 44.4% of agree. O3 had a minimum percentage of 6.7% of not known
and 2.2% strongly disagree with a maximum of 11.1% strongly agree and 46.7% agree.
Contrarily, NOx had a maximum percentage of 46.7% of strongly disagree and 2.2% not
known. However, SO2 showed from analysis a minimum of 6.7% strongly disagree, 2.2%
not known with a maximum percentage of 31.1% strongly agree, and 44.4% agree. Similarly,
Benzene’s minimum response showed 2.2% strongly agree and 0% not known. PAHs
indicated the lowest minimum responses for not known and strongly disagree as it showed
0% respectively and had 53.3% strongly agree and 37.8% agree.
Therefore, having analysed information as provided by respondents, it was clear that although
most developed and developing world adopts all limits provided. Professionals in the ND
disagreed with nitrogen oxides and requested that leads as chemical substances should be
added to the requirements provide based on the discussions below;
5.1 NITROGEN OXIDES NOX
Constituting part of the substances that are emitted from GF, NOx impact negatively on air
quality and are detrimental to the environment where ever they can be found. It is the sum of
Nitrogen oxide (NO), Nitrogen dioxide (NO2), and the reaction between nitrogen, oxygen and
hydrocarbons result in the formulation of NOx. Its impact on the immediate surroundings of
the GF sites of the ND was investigated in this study details of which were captured earlier.
Assessing its effects on the environment, the majority of the respondents noted that the
annual mean should be less than that specified in the designed PS and should reflect limits
provided by the Environmental Guidelines and Standards for the Petroleum Industry in
Nigeria (EGASPIN). According to them, serious deliberations have been ongoing on the
limits as provided in the FEPA standards. These standards are known to lack improvements
and hence fail to be representative of the ongoing trend in the developed world as a means of
reducing GF effects. As described in table 1 and figure 3 the symptoms of bronchitis in
asthmatic children increase in association with long-term exposure to NOx.
Furthermore, they are known to cause eye, nose and throat irritation, shortness of breath, and
increased risks of respiratory infections. Its health implications can be enormous with as little
as 30 minutes’ exposure, hence implying a rather horrific impact on inhabitants of these GF
vicinities. Thus the limits were refined to meet the EGASPIN guideline of NOx:
40μg/m3 annual mean; 75-113μg/m3 1-hour mean as compared to NOx: 40μg/m3 annual
mean; 200μg/m3 1-hour mean.

129
5.2 Lead (Pb)
During the demonstration exercise, respondents noted that the designed PS was void of lead
(Pb), which has greatly influenced the quality of air around Nigeria’s Delta region. The
experts, in reference to works done by (Ekpo et al. 2013; Ede and Edokpa 2015) noted that
industries, together with regular petroleum exploration and exploitation, release trace metals
into the atmosphere. This, therefore, steered the addition of Pb into the designed
specification. However, there was a disparity in the choice of the limit to adopt. While some
of the professionals had a choice of the WHO annual limit of 0.5μg/m3, others settled for a
0.25μg/m3 based on UK limits. Their decision was based on information such as the
inhalation of lead (Pb) resulting in health risks like cognitive deficits, negative behavioural
patterns (hyper activity/restlessness) and flu-like symptoms that include anorexia, vomiting
and lethargy mostly in children. These health issues impact on their academic performance
and number of out of school cases (Quillen (1993). According to WHO (2016), it is a
cumulative toxicant that affects multiple body systems, including the neurologic,
hematologic, gastrointestinal, cardiovascular, and renal systems. Children are particularly
vulnerable to the neurotoxic effects of lead, and even relatively low levels of exposure can
cause serious health issues and in some cases irreversible neurological damage.
Based on the advantages permitted by open-ended questionnaire, suggestions and comments
made by respondents lead to the refinement and re-administration of the questionnaire as
clearly allowed by the adopted DS method. This provides its effectiveness and validity for
research purposes. Based on their comments information requested was added in the new
requirement and analysis from table 4 shows the opinions of respondents.
Table 4 Analysis for the final Iteration on IAQ
Source: Field Survey
Performance
Requirements
1
Strongly
Agree
2
Agree
3
Partially
Agree
4
Disagree
5
Strongly
Disagree
6
Not
Known
NOx: 40μg/m3 annual
mean; 200μg/m3 1-hour
mean
2.2% 4.4% 6.7% 37.8% 46.7% 2.2%
NOx: 40μg/m3 annual
mean; 75-113μg/m3 1-hour
mean
28.9% 44.4% 22.2% 2.2% 2.2% -
Lead (PB)
Annual limit
0.5μg/m3 (WHO)
31.1%
53.3%
6.7%
2.2%
6.7%
-
Lead (Pb)
Annual limit
0.25μg/m3 (UK)
35.6% 55.6% 6.7% 2.2% - -
From table 4, the study only re-administered questions relating to requirements that did not
meet respondent’s criteria in satisfying clean air achievability in the ND. Therefore, it is
evident that respondents were aware of theses limits as indicated in the analysis and
comments provided.

130
Following analysis of responses for NOx, the result showed that respondents strongly agreed
at 28.9%, agreed at 44.4%, partially agreed at 22.2%, disagree and strongly disagree having
2.2% each, and 0% not known. This is clearly different from responses in the iteration as
illustrated in table 3 Wherefore NOx analysis showed 37.8% of the responses disagree and
46.7% strongly disagree.
Similarly, Lead (Pb) which was added during the second stage of the iterative process was
returned to respondents to provide their opinion on a Likert scale just as in the case of the
other substances. However, respondents indicated two different air limits from WHO and
UK guidelines. These limits were represented in the open- ended questionnaire and analysis
from the responses showed the ensuing results: For the WHO guideline, 31.1%, 53.3% and
6.7% represented strongly agree, agree and partially agree respectively while on the
contrary, 2.2%, 6.7% and 0% opted for the strongly disagree, disagree and not known options
to 0.5μg/m3 respectively. On the other hand, the UK guideline and limit for Pb showed that
35.6% strongly agreed, 55.6% agreed and 6.7% partially agreed, while 2.2% disagreed with
none neither strongly disagreeing nor indicating not known to the annual limit of 0.25μg/m3
as specified. Subsequently, the designed PS was adjusted to include Pb with an annual limit
of 0.25μg/m3.
Therefore, these responses form a valid and complete adjustment to the criteria significant for
clean indoor air in the ND area of Nigeria. Thus, confirming respondents’ comments that
show reasons for disagreeing with the PR as discussed in the solution section. No additional
information was provided requiring refinement and adjustments for immediate environmental
criteria forming a complete process for the IAQ.
6. CONCLUSIONS
This paper has argued that design of specification is presumably the idea guiding the design
and construction of schools in the polluted areas of Nigeria. The continued reliance on
outdated building codes and regulation as obtained in Nigeria will leave a lasting impact on
the health of pupils seen as the future leaders of tomorrow. The continued inhalation of poor
ambient air will lead to adverse health conditions that will hamper the health and academic
performance of schoolchildren. The study has shown that performance specification will
provide a geographically relevant and suitable strategy and climate-fit blueprint for
construction in an area prone to environmental hazards. Thus, it is important that designing
with performance specification rather than the National Building Code will provide the
needed requirement to satisfy local criteria. It is submitted that if design and construction of
schools are part of the responsibility of the government and a way of meeting the millennium
development goal then the quality of air inhaled by children who spend most of their time in
schools should be paramount in the design of schools in the ND.
7. REFERENCES
ASHRAE. (2007). Standard 62.1. Atlanta The American Society of Heating, Refrigeration and Air-Conditioning
Engineers
Atuma, M. I., & Ojeh, V. N. (2013). Effect of Gas Flaring on Soil and Cassava Productivity in Ebedei, Ukwuani
Local Government Area, Delta State, Nigeria. Journal of Environmental Protection, 4(10).
Bakó-Biró, Z., Clements-Croome, D., Kochhar, N., Awbi, H., & Williams, M. (2012). Ventilation rates in
schools and pupils’ performance. Building and Environment, 48, 215-223.

131
Conceição, E., & Lúcio, M. (2006). Air quality inside a school building: air exchange monitoring, evolution of
carbon dioxide and assessment of ventilation strategies. International journal of ventilation, 5(2), 259-270.
Cross, N. (2006). Designerly ways of knowing: Springer.
Daly, A., & Zannetti, P. (2007). An introduction to air pollution–Definitions, classifications, and history.
Ambient air pollution. P. Zannetti, D. Al-Ajmi and S. Al-Rashied, The Arab School for Science and
Technology and The EnviroComp Institute, 1-14.
EFA, E. F. o. A. (2001). The Right to Breathe Healthy Indoor Air in Schools. Retrieved from Helsinki, Finland:
Ekpoh, I. J., & Obia, A. E. (2010). The role of gas flaring in the rapid corrosion of zinc roofs in the Niger Delta
Region of Nigeria. The Environmentalist, 30(4), 347-352.
ESCAP, U. N. E. a. S. C. f. A. a. t. P. U. (2012). Integrating Environmental Sustainability and Disaster
Resilience in Building Codes. (13: 978-92-1-120649-4). Bangkok 10200, Thailand.
FEPA, F. E. P. A. (1991). GUIDELINES AND STANDARDS FOR INDUSTRIAL EFFLUENT, GASEOUS
EMISSIONS AND NOISE LIMITATIONS. Nigeria: FEPA.
FEPA, F. E. P. A. (1999). Review of the National Policy on Environment. Abuja
FGN, F. R. o. N. (2006). National Building Code ENVIRONMENTAL AND GENERAL BUILDING
REQUIREMENTS.
Gao, J., Wargocki, P., & Wang, Y. (2014). Ventilation system type, classroom environmental quality and pupils'
perceptions and symptoms. Building and Environment, 75, 46-57.
Hevner, A. R. (2007). A three cycle view of design science research. Scandinavian journal of information
systems, 19(2), 4.
Hubka, V., & Ernst Eder, W. (1987). A scientific approach to engineering design. Design studies, 8(3), 123-137.
Ilstedt, S., & Wangel, J. (2013). Designing sustainable futures. Nordes, 1(5).
Johannesson, P., & Perjons, E. (2012). A design science primer. Unpublished Manuscript, February, 25.
Kim, J.-L., Elfman, L., Mi, Y., Johansson, M., Smedje, G., & Norbäck, D. (2005). Current asthma and
respiratory symptoms among pupils in relation to dietary factors and allergens in the school environment.
Indoor air, 15(3), 170-182.
Kindzierski, W. B. (1999). Importance of human environmental exposure to hazardous air pollutants from gas
flares. Environmental Reviews, 8(1), 41-62.
Ladan, S. I. (2013). Examining Air Pollution and Control Measures in Urban Centers of Nigeria. International
Journal of Environmental Engineering and Management, Volume 4.
limits, C. (2013). REDUCING AN IMPORTANT GAS FLARE IN NIGERIA. Retrieved from
http://www.carbonlimits.no/
LSX, L. S. E. (2013). Cleaner Air 4 Primary Schools Toolkit. Retrieved from
http://www.lsx.org.uk/whatwedo/CleanAir4Schools_page3504.aspx
Malumfashi, G. I. (2007). Phase-out of gas flaring in Nigeria by 2008: The prospects of a multi-win project.
Petroleum training journal, 1(1).
NDDC, N. D. D. C. (2006). THE REGIONAL DEVELOPMENT MASTER PLAN. Retrieved from Nigeria:
http://www.nddc.gov.ng/NDRMP%20Chapter%201.pdf
NESREA, N. E. S. a. E. A. (2010). National Policy on Environment. Retrieved from
http://www.nesrea.gov.ng/policy
NNPC, N. N. P. C. (2014). 2014 Annual Statistical2014 Statistical Bulletin. Retrieved from Nigeria:
http://www.nnpcgroup.com/PublicRelations/OilandGasStatistics/AnnualStatisticsBulletin.aspx
Nwanya, S. C. (2011). Climate change and energy implications of gas flaring for Nigeria. International Journal
of Low Carbon Technologies, 6(3), 193-199.
Obia, A. E., Okon, H. E., Ekum, S. A., Eyo-Ita, E. E., & Ekpeni, E. A. (2011). The Influence of Gas Flare
Particulates and Rainfall on the Corrosion of Galvanized Steel Roofs in the Niger Delta, Nigeria. Journal of
Environmental Protection, 2(10).
Odu, C. (1994). Gas Flare Emissions and their Effects on the Acidity of Rainwater in the Ebocha area. A Paper
presented in the Department of Agronomy University of Ibadan, Nigeria, 10p.
Ogbonda, U. J. E., Bichard (2017). EXAMINING THE STATE OF PUBLIC SCHOOLS IN THE GAS
FLARING AREAS OF NIGERIA. ASIAN JOURNAL OF SCIENCE AND TECHNOLOGY, 08( 04), 4574-
4579.
Olowoporoku, A., Longhurst, J., Barnes, J., & Edokpayi, C. (2011). Towards a new framework for air quality
management in Nigeria. Air Pollution XIX, 147, 1.
Oluduro, O. (2012). Oil exploration and ecological damage: the compensation policy in Nigeria. Canadian
Journal of Development Studies/Revue canadienne d'études du développement, 33(2), 164-179.
Ovuakporaye, S., Aloamaka, C., Ojieh, A., Ejebe, D., & Mordi, J. (2012). Effects of gas flaring on lung function
among residents of ib Gas flaring community in Delta State, Nigeria. Res. J. Env. Earth Sci, 4(5), 525-528.
Poindexter, P., Meraz, Sharon, & Weiss, Amy Schmitz. (2008). Women, Men, and News: Divided and
Disconnected in the News Media Landscape: Taylor & Francis Group, New York: Routledge.

132
Quillen, T. (1993). ...about lead poisoning. Nursing, 23(8), 26.
RCEP, R. c. o. e. p. (1984). Tenth Report: TACKLING POLLUTION-EXPERIENCE AND PROSPECTS.
Retrieved from London:
Reich, Y. (2013). Designing science. Research in Engineering Design, 24(3), 215-218.
Simon, H. A. (1996). The sciences of the artificial: MIT press.
Sonibare, J. A., & Ede, P. N. (2009). Potential impacts of integrated oil and gas plant on ambient air quality.
Energy & Environment, 20(3), 331-344.
Van Aken, J. E. (2005). Valid knowledge for the professional design of large and complex design processes.
Design Studies, 26(4), 379-404.
Weli, V. E., & Adekunle, O. (2014). Air Quality in the Vicinity of a Landfill Site in Rumuolumeni, Port
Harcourt, Nigeria. Journal of Environment and Earth Science, 4(10), 1-9.

133
ID 053
STRATEGY OF DEVELOPING A DIGITAL TOOL FOR
COLLABORATIVE CONCEPT DESIGN
T. Jaraskumjonkul and M. Shelbourn
School of the Built Environment, University of Salford, Salford, M5 4WT, UK
Email: [email protected]
Abstract: A digital tool for collaborative concept design is in process of development and
implemented with design science research which is adjusted by using prototyping model for
developing a digital prototype in a part of design and development. Prototyping model is the
appropriate methodology due to small-scale development approach but lacks a phase for
developing ideas for user interface and interaction. This gap can be filled by integrating a
concept design phase supporting design in terms of user interface and interaction enhanced by
creative and critical thinking before system design phase. The approach needs to elucidate and
propose how to implement design of the prototype for achieving evaluation and usage of users
in context. Design is discussed including constituent components so that designers or
developers will understand and apply in problem solving aspect of concept design. In addition,
it can be supported by tools of creative and critical thinking to generate appropriate solutions
either. Thus, this paper aims to propose framing strategy of design and development for
designer or developer to develop the digital prototype with the prototyping software
development by understanding and analysing definition of design, concept design, and creative
thinking, then, integrating these into the modified model.
Keywords: prototyping, concept design, design, creative and critical thinking
1. INTRODUCTION
Concept design stage is significant with original problems which can be solved and provide
an opportunity for collaborative working in real time. A digital tool for collaborative concept
design is in the process of development through the methodology of design science research.
The research methodology consists of explicating the problem, defining requirements,
designing, development, demonstration, and evaluation of an artifact which will need to be
adjusted as part of design and development of a digital prototype. In software development,
there are many types of approaches and an appropriate model will be selected and integrated
into the research methodology. The selected approach identified is the prototyping model
which will be considered, modified and applied for use in this research. Because it is suitable
for developing a small scale of a digital prototype and only one or few developers in the
development process. Therefore, the model will be modified by adding the concept design
phase before the design phase for supporting the development of abstract ideas to concrete
ideas for the design in terms of user interface and interaction.
2. GAP OF KNOWLEDGE
This paper identifies the knowledge gap as follows:
1. How to modify the prototyping model approach for developing a digital
prototype for collaborative concept design?

134
2. What is concept design and what elements are concerned in design thinking?
3. How can concept design be supported by creative and critical thinking?
3. PROTOTYPING MODEL OF SOFTWARE DEVELOPMENT
Software Development Life Cycle (SDLC) follows important phases that are vital for
developers such as planning, analysis, design, implementation and testing. Models of
software development have been developed since 1970 such as waterfall, incremental, spiral,
V-model, agile, and rapid prototyping (Balaji and Murugaiyan, 2012). These methodologies
include complex phases “...based on iterative and incremental development…” and involved
developers emphasizing management of documents and collaborative process within the team
or across teams using such as waterfall, incremental, spiral, and V-model with the exception
of prototyping. The prototyping model is more appropriate for developing a digital prototype
due to the small-scale approach, which allows breaking the project into many segments, more
ease-of-change including iterative modification during the process (Davis, 1992, and Centers
for Medicare and Medicaid Services, 2008). As shown in Figure 1, the prototyping process
starts with requirement, followed by system design, code and unit test, integration test, and
software system test with each of these phases providing iterative loops. After software
system testing of the final product, the prototype will be released to users and then problems
or requirements can be reported to the developer. Some researchers have advised that
prototyping can build the basis which can be converted into the final product in an entire
software design process (McPhee, 1996).
Figure 1: Prototyping model development (modified)
(Source: Devis ,1992)
Regarding with the prototyping model (see Figure 1), the requirement phase is the conclusion
of user needs including identification of explicit problems, system specification and other
requirements which the information of requirements is analysed to break into segments of a
complex project, define interface, or build data schema in phases of system design. When
segments of project are delivered within other phases, each segment can be built code and
unit tested and, then, these segments will be checked for errors at integration test. After these
segments are checked in the integration test, a final product, which is united with these
135
segments, will be tested in the final phase of software system test. At each phase it is possible
to move backwards to the previous phase to improve problems that appear at a particular
phase allowing any problem/s to be solved at the source.
User interface and interactive design are as significant as efficiency of the system design is.
User interface and interaction will affect with users in terms of use and may present problems
for users after releasing into the user’s context. Lawson (2009) and many researchers pointed
out the existing problem of digital tools in the United Kingdom (UK) Architecture
Engineering and Construction (AEC) project in terms of complex user interface and
interaction. Although the part of software design specifies “design”, it is also a way for
analysis and solving problems in the system (Waldo, 2006) and it is more scientific. Thus,
this is reason that a concept design phase should be integrated into the prototyping model
(Figure 1) to enhance the creative part of the approach in terms of integrating user interface
design into the process to enable balance between design of the system and usage of user.
4. MODIFYING THE PROTOTYPING MODEL APPROACH FOR DEVELOPING A
DIGITAL PROTOTYPE
Concept design can assist to develop ideas of user interface and interaction from
understanding and analysing definition of design and concept design and including creative
and critical thinking. The user interface and interaction design can be encouraged through
creative and critical thinking in concept design. This leads to the proposal to develop a
strategy for modifying the prototyping model (Figure 1) for developing a digital prototype for
collaborative design.
4.1 Understanding design and concept design
A clear understanding of design and concept design is explored to appreciate components of
design and function of concept design and justifying integrating concept design phase in the
prototyping model approach.
“Design” was analysed and developed by Ralph and Wand (2009) from interdisciplinary
fields of engineering, architecture, design, and science of design between 1964 and 2007 due
to a lack of an exact definition. They proposed a conceptual model of “Design” with five
components being critical such as goals, environment or context, requirement or needs,
primitive or sub-ideas, and constraints which can become design problems in the design
process.

136
Figure 2: Meaning of Design
(Source: Paul Ralph and Yair Wand (2009), p.108-109)
Silk, Daly, Jablokow, Yilmaz, and Berg(2014) and Laseau(2000) also found that well-
formed design problems include at least three components which are goals, environment, and
requirement summarised as follows:
a. a brief context or environment about for whom and for what purpose
a solution is needed b. a statement of the need that specifies the functional requirements and
constraints on acceptable solutions c. a description of the goal, including the general instructions and criteria
to use in evaluating ideas
Activity in the design process is described as negotiation between problem and solution from
reflecting on each through analysis, synthesis, and evaluation (Lawson, 2006). Thus,
“Design” has been defined as consisting of a goal or including sub ideas, requirements, and
environment under constraints, is the creation of a design which problem and solution
reflected by each other are intensively driven by analysis, synthesis, and evaluation.
According to the definition of “Concept” by Margolis and Stephen (2011), “Concept” is an
abstraction or abstract object being referent of something whether it is an existing object in
the real world or an idea. The concept is beneficial to solve problems from ignoring the
details and incidentals assisting to avoid fixation on gathering ideas leading to ‘the crux task’
(Chueng-Nainby, 2010). Asimow (1962) supports the idea of “design” as process and its
characteristic which is defined as the abstract-to-concrete progress of the creative concept
(Asimow, 1962 cited by Chueng-Nainby, 2010). An abstraction process is initiated by
perception of need, intentions, and ideas relevant with a thinking process distanced from
ideas of the object and whereby concrete details are left vague or undefined to use in a
simplified way. Thus, “Concept design”, can be defined as a process of developing design
ideas from abstract to concrete idea by ignoring concrete details.
Thus, elements of user interface and interaction can be designed by transforming ideas from
abstract to concrete ideas assisting designers to gradually develop abstract ideas rather than
trying to design from concrete elements. In addition, five components are goals, environment
or context, requirement or needs, primitive or sub-ideas, and constraints or at least three main
component; context, needs, goal are important for design thinking in concept design.

137
However, there are other tools for assisting in dealing with design problems which are
creative and critical thinking.
4.2 Creative and Critical thinking
Creative and critical thinking are significant in design and especially plays a role in concept
design and design thinking. Creativity masters a process of making or producing for idea
generation and criticality is a process of assessing or rational decision making (Paul & Elder,
2004). Critical and creative thinking are actions of mind which need knowledge as natural
source and skill to deal with process in mind. These actions involved with solving problem
which are intensively driven by analysis, synthesis, and evaluation (Lawson, 2006) (See
Figure 3). Creative and critical thinking will be analysed and explained to propose ways it
can assist concept design and design thinking.
Figure 3: Lawson’s solving problem (Modified)
(Source: Lawson, 2006)
Enhancing design with the critical thinking
Critical thinking directly relates to logic, analysis, and judgment for evaluating information
involving background, experience and knowledge (Oxman-Michelli, 1992). It is a linear
dimension in mind activity (F. Sofo, Colapinto, M. Sofo, & Ammirato, 2013) which starts
with analysing information and, then, the analysed information is evaluated from reasoning
and deciding (Paul & Elder, 2004). An external representation or diagram can assist to deal
with analysis and evaluation. The diagram/s are generally made of symbols and are abstract,
they do not have a scale and do not relate to pictorial representations (Parthenios, 2005).
In terms of user interface and interaction with a prototype, the system and user requirements
should be analysed to produce logical activities and involve data types which will interact
between user's activities and the system. All logical activities and data types can be arranged
and gathered in the same groups of the problem or task and, then, externalized into vague
diagrams and texts to leave the designer’s mind free to produce ideas or solutions of the user
interface and interaction. Significantly, each vague diagram will become the explicit idea
which is a crucial resource for building several creative ideas. The advantage of a diagram is
it can encourage creative thinking for design exploration.
Generating ideas with creative thinking
Creative thinking is regarded as thinking that is imaginative and spontaneous, original and
intuitive as when you think creatively, you produce something novel (Oxman-Michelli,
1992). It is an activity of the mind which explores resource or knowledge to generate and

138
select appropriate solutions for problems (Okpara, 2007). In addition, it is non-linear
dimension and more complex for exploring and building or synthesising novel ideas. Ellis
Paul Torrance proposed four components for assisting design exploration and solution
generation (Alvino,1990 Cited by Cotton, 1991) that are:
1) FLUENCY - generating many ideas.
2) FLEXIBILITY - shifting perspective easily.
3) ORIGINALITY - conceiving of something new.
4) ELABORATION - building, modifying, or detailing on other ideas.
According to Ellis Paul Torrance’s components, solutions or novel ideas can be generated
from applying the four components. The two components; fluency and elaboration, become
the main components to generate design ideas concerning the design components; goals,
needs, and context and these ideas can be also modified for generating other new ideas.
Originality is the criteria for consideration in terms of creativity of new design ideas which
must be novel, feasible, and appropriate. Finally, flexibility is design exploration which can
enhance the generation of new design ideas.
Problem tasks gathered from logical activity and data types can be supported from creative
thinking in terms of diagrams. These diagrams will be continuously developed to be used at
concept design parts of user interface and interaction and which can be enhanced using Ellis
Paul Torrance’s components. Abstract design ideas of user interface and interaction can also
be developed by these diagrams. Background knowledge of programming skills becomes
important to assist a developer or designer to evaluate the feasibility of these creative design
ideas. A novel digital prototype can be created and accepted if it is a new design idea that can
be developed on the system.
Thus, creative and critical thinking can be used to create design ideas in the concept design or
design process. Design problems can use creative and critical thinking to assist in solving
these problems by developing a diagram incorporating and using Ellis Paul Torrance’s
components (See Figure 4).
Figure 4: Creative and critical thinking in solving problem of design
(Source: Jaraskumjonkuk, 2017)
In addition, the diagram will be used for analysis and evaluation of critical thinking to
construct ideas or solutions and a tool for solving problem in design and create alternative
designs (see Figure 5).

139
Figure 5: Tool for solving problem in design
(Source: Jaraskumjonkul, 2017)
4.3 Strategy for modifying the prototyping model (modified) for a digital prototype
Regarding the prototyping model development (modified) approach illustrated in Figure 1, it
can be modified to allow the integration of the concept design phase between requirement
and system design phases shown in Figure 6 below. It is argued that the phase of concept
design and creative and critical thinking can assist the transformation of abstract ideas to
concrete idea. All phases are connected with the knowledge part which is important to enable
retrieval of knowledge and experience or learn new technology and/or some issues to solve
problems in the process.
Figure 6: Modifying of Prototyping Approach
(Source: Jaraskumjonkul, 2017, Adapted from Davis)
The Modified Model of Prototyping Approach above includes the following phases:
1) Requirement phase is state of gathering information which identifies explicit
problems, needs of user and system, environment of system.
2) Concept design phase provides opportunity of developing user interface and
interaction in which the intuition of user will be crucial criteria. In addition, abstract

140
idea of the system will be designed along with design ideas from user interface and
interaction.
3) System design is the phase of solving problems in terms of the system. This will
involve object oriented design, algorithm design, database or data persistence
design. The abstract ideas from the early phase will be developed into concrete ideas
and applied into the system design.
4) Code and Unit test phase is a stage of code programming practice and test. Each
object and algorithm part will be written and tested to identify errors and solve these
problems.
5) Integration test phase is prepared to test when parts of the project system are united.
All variables and procedures are involved and communication between these parts
tested and checked for errors.
6) Software system test is the phase of testing the entire system process.
5. CONCLUSION
This paper presents the prototyping model approach which is integrated the tool for design
thinking. It can be summarized that:
● The meaning of design comprises five components consisting of goals,
requirements, context, constraints, and sub ideas. At least three components;
goals, requirement, and context, are crucial for designing.
● The prototyping approach is modified for developing a digital prototype by
inserting the concept design between the requirement and software design
phases.
● The concept design phase is an initial process of developing concrete ideas
from abstract ideas by ignoring concrete details. User interface and interaction
should be designed by considering goals, needs, environment, sub ideas, and
constraints and including user criteria in terms of limitations and activities in
the concept design phase so that both of them can be delivered to system
design.
● Solving problems in the design process can also be supported by creative and
critical thinking using both diagrams (See Figure 4, 5, and 6) and Ellis Paul
Torrance’s approach.
6. REFERENCE:
Balaji, S., & Murugaiyan, M. S. (2012). Waterfall vs. V-Model vs. Agile: A comparative study on SDLC.
International Journal of Information Technology and Business Management, 2(1), 26-30.Carr, M., &
Verner, J. (1997). Prototyping and software development approaches. Department of Information Systems,
City University of Hong Kong, Hong Kong.
Centers for Medicare and Medicaid Services. (2008). Selecting a development approach. Office of
InformationServices, 3(4), 5.
Chueng-Nainby, P. (2010). Where is the Conceptual Design Stage?. ShangHai, 159.Cotton, K. (1991).
Teaching thinking skills (pp. 1-19). Northwest Regional Educational Laboratory, School Improvement
Program.
Davis, A. M. (1992). Operational prototyping: A new development approach. IEEE software, 9(5), 70-78.
Lawson, B. (2006). How designers think: the design process demystified. Routledge.
Laseau, P. (2001). Graphic thinking for architects & designers. John Wiley & Sons.
McPhee, K. (1996). Design theory and software design.

141
Margolis, E.,& Stephen, L. (2011), "Concepts", The Stanford Encyclopedia of Philosophy (Spring 2014
Edition), Edward N. Zalta (ed.), Retrieved 21 December 2015, from http://plato.stanford.edu/archives/spr2014/entries/concepts/#ConMenRep
Okpara, F. O. (2007). The value of creativity and innovation in entrepreneurship. Journal of Asia
Entrepreneurship and Sustainability, 3(2), 1.Oxman-Michelli, W. (1992). Critical thinking as creativity.
Inquiry: Critical Thinking Across the Disciplines, 9(3), 1-1.
Paul, R., & Elder, L. (2004). Critical and creative thinking. Dillon Beach, CA: The Foundation for Critical
Thinking.
Ralph, P., & Wand, Y. (2009). A proposal for a formal definition of the design concept. In Design requirements
engineering: A ten-year perspective (pp. 103-136). Springer Berlin Heidelberg.
Silk, E. M., Daly, S. R., Jablokow, K., Yilmaz, S., & Berg, M. N. (2014). The design problem framework:
Using Adaption-Innovation Theory to construct design problem statements. Proc. of ASEE 2014 Annual
Conference, Indianapolis, IN.
Sofo, F., Colapinto, C., Sofo, M., & Ammirato, S. (2013). Critical thinking and intellectual style. In
AdaptiveDecision Making and Intellectual Styles (pp. 35-54). Springer New York.Waldo, J. (2006,
October). On system design. In ACM SIGPLAN Notices (Vol. 41, No. 10, pp. 467-480). ACM.

142
ID 084
MICRO TO MACRO; UTILIZATION OF THE ARCHITECTURAL
DRESS FOR THE FLOW OF URBAN SPACES
P. Liyanage and S. Hettiarachchi
Department of Integrated Design, University of Moratuwa, Moratuwa, Sri Lanka
Email: [email protected]
Abstract: The progression of the relationship between body and objects of our daily life,
including the dress, can be identified in four stages. The naked body, dressing on the body,
attachments to the body and extensions to the body. The dress can be recognized as an
attachment. Four methods of attaching the dress to the body can be identified and three of
them progresses from the interior; the body, to the exterior; the surroundings, in accordance
with the process of experiencing a dress. Currently spaces in urban areas are a result of in
between spaces that are a resultant of individually architected structures. While the climate of
the equatorial region and the socio-economic arena of developing countries, by nature brings
people, especially of the lower income classes, to the outer urban spaces that occurs
incidentally without proper designing due to current practices of architecture and urban
planning. Inspired by the aged relationship between the dress and architecture, the research
considers the possibility of developing a theoretical framework by converting the relationship
between body and dress-as-attachment to design better flowing, human centred urban spaces.
The research was funded by the Senate Research Committee of the University of Moratuwa
under the grant no SRC/ST/2016/26.
Keywords: Architectural Dress, Body and Dress, Inductive Approach, Spaces-in-between,
Urban Spaces.
1. INTRODUCTION
The comparison of the relationship between dressing and architecture has been existent for
centuries, dating back to the time of Vitruvius (1st cent. BC) (Quinn, 2003). Mainly this has
been in the perspectives of understanding shelter on the body as dress and architecture as
extended shelter. Especially when historically considering, period fashion depicts a high
degree of inspiration taken from architecture (Quinn, 2003). And in recent years the
resemblance of garment construction techniques in architecture is very significant. Methods
of architecting such as folding, draping, pleating, pinning and darting are instances of direct
inspiration of methods of construction of the dress in architecting. Through the traditional
dressing methods of South Asia and Far-East Asia and later fashion revolutions of visionaries
such as Issey Miyake, Rei Kawakubo, etc. the dress has been developed in such a manner that
it is constructed in accordance with the way the wearer experience the dress; from the interior
to the exterior. And in this method the spaces in between are also designed as opposed to
being a mere resultant when creating the exterior. While the dressing and architecture have
been sharing their methods of visual construction the research problem was found in the gap
of questioning whether the conceptual approaches of dressing can be burrowed for
architecture. Therefore, the research investigates the problem of, how and in what ways can
methods of dressing can fund the better flow of urban spaces? Liyanage & Hettiarachchi
(2016) identifies four methods of attaching a dress to the body. Section 5. Structure of the
dress explores these ideas the hypothesis was created to investigate possibilities that when
urban spaces follow the methods of attaching the dress to the body it can better suit the

143
behavioural patterns and needs especially of people requiring better designed, better
functioning urban spaces. This takes into consideration the climatic conditions of the urban
area, the socio-economic structure and so on.
2. KEY TERMS IN USAGE
The Dress – For the past few centuries the dress has been recognized as sociological
parameter than an isolated object depicting material details of the period. Since then the dress
has been considered as “…a subject that is simultaneously economic, aesthetic, social and
psychological” (Haye & Wilson, 1999). While the need of the dress has been questioned
widely, whether it is in the aspect of shelter/protection, adornment/ornamentation or modesty,
what must ultimately be considered is that under any circumstance the dress has been
covering or providing means to the body so that the individual may express and align oneself
with “… an organized, formal, normative system that is recognized by the society” (Barthes,
2013). The research recognizes the term dress as an embodiment of an individual’s identity
which has been materialized through contemporary social, cultural, political and economic
traits.
Spaces in between – The research recognizes two types of spaces in between; in architecture/
built environment and in dressing. Spaces in between in a built environment or largely, in a
city, are its roads, alleyways and left-over spaces from one building to another. This concept
is further discussed in section 4.2 Understanding spaces in between. In dressing, the term can
be recognized between the bare minimum of upon-the-body to a maximum of infinitely
extended boundary.
Urban fabric – The urban fabric in the holistic city itself. “The city is after all, so much more
than a material artefact. It is economic processes, social relations, psychological states,
cultural milieu and so on” (Hillier, 1989). The urban fabric also allows its users to create a
“place-identity”, associating attributes of place to personal identity (Hull, et al., 1994).
Therefore, the research uses the term urban fabric to discuss the city with its materials such as
buildings, roads, alleyways and its contemporary social, political, cultural and economic
phenomenon that is embodied in the weave of the city.
3. METHODS AND METHODOLOGY
In a quest to solve the above-mentioned research problem data of both dressing and
architecture in urban spaces was required. The initial stage of the research was to solidify the
recognizable relationship between dressing and architecture. This required to find patterns in
dressing and architecture in isolation and finding connections between the two areas to be
considered as a singular entity suitable for study. Finally, a modular framework was realized
in which previously categorized modes of the recognizing a connection between body and
dress was converted as problem solving methods for urban spaces. Figure 1 summarises the
methodology.
Thomas (2006) explains the suitability of the inductive approach to guide a research of this
nature. He claims that shown by Corbin & Strauss (1998) the inductive method is suitable for
the condensation of an expansive collection of raw data into a summary. Furthermore, the
inductive approach encourages clear links allowing transparent and understandable

144
representation of processed data and the allowance of justifiability of the findings in par with
the research objectives. It also allows the development of a model or theory that is based on
an underlying structure of experience-processes that are evident in the text data (Thomas,
2006).
Secondary to the identification of the appropriateness of the inductive approach the suitability
of the grounded method for research progression was understood as shown in Table 1.
Table 3: Grounded method as evident in the research
Characteristic (Corbin &
Strauss, 1990) As expressed in the research
Concepts are the basic units
of analysis
While the data itself was conceptual representations of
occurrences, data was categorised according to the
methods of conversion from concept to product both in
dress and architecture.
Categories must be
developed and related
The refining of categories helped to understand the
distinction between visual/ conceptual similarities and
differences.
Sampling in grounded
theory proceeds on
theoretical grounds
The research was designed upon the hypothesis that
approaches in dressing can allow a more holistic urban
fabric as opposed to isolated buildings in a city. Therefore,
ideas of construct in architecture and dress was developed
separately.
Analysis makes use of
constant comparisons
The separately gathered data was continuously cross
examined so that the developed ideas are further
Connections between body and dress
Transference of patterns into
modular framework Gap in practice for
Research Problem
Instead of progressing from the
understanding of contextual forces to built
structure, only mere resultant flows are
genrated around structures
Spaces in between body and dressBetween structures
Body
Dress
Dressing Architecture
Land usage and contextual sturctural
progressions
Contextual Forces
(Topography, Demography, etc.)
Structure
Figure 1: Summary of research methodology identification

145
constructed in a manner allowing the necessary conjunction
of dress and architecture in the conclusion.
Process must be built into
the theory
The theories that were built had the flexibility of adapting in
accordance with novel findings. Therefore, the structure
was created upon the findings while adjusting as required
by interpretation of gathered data.
The research conducted through the inductive approach and the grounded method to solve the
prior mentioned research problem concluded the following.
Identified types of spaces between and lost space in an urban environment can be subjected
to a better flow prior to construction as well as post construction, as existing areas which
requires development of spaces between. Unplanned settlement progression can be recovered
through design solutions which considers unprecedented chronological development and
solves it by the means of layering in dress. Ad-hoc rear space encroachment can be guided
towards a sensible progression through addition of elements. Lost spaces in cities such as the
immediate ground next to high rise buildings or car parks later subjected to abandonment can
be utilized positively by existing structures adding the volume of lost space unto them. The
following sections will systematically realize these findings.
4. THE FABRIC OF URBANITY AND THE SPACES IN BETWEEN
In the search for a definition of urbanity, what primarily becomes evident is the almost
incomprehensible amount of definitions. In the field of urban design, it be an environment
that provides a high density of variety, accessibility, legibility, robustness, identity,
cleanliness, biotic support and aesthetic richness. Furthermore, it also considers about public
spaces, although due to the minimal extent of the sample it cannot be considered holistic
(Grounlund, 2007). Coming on to cities of the third world countries of the East, sometimes
these definitions found in the West, the developed countries becomes irrelevant. This section
will explore the notions of city and urbanity and aim to realize a fabric, an idea about
urbanity which is cohesive and woven. Following the ‘spaces’ of this fabric is understood, in
aspects of the inception of spaces, its uses and its utility value when compared with the
previously understood definition of urbanity.
4.1 Definitions of City
To understand the nature of urban spaces it is important to understand what a city is. The
attempt to define a city is complex in nature. This is due to the complexities that arises when
trying to encapsulate intertwined bonds between the economics, culture, and politics of a city.
In a developing country such as Sri Lanka, in which the governmental understanding of
development is defined through mega-structures the social structure undergoes a segregation
even of a physical nature. While the upper-income level is entertained the lower-income level
is pushed into a chaotic disruption. Deciphering of a more poetic expression of the city by
Ralph Waldo Emerson (as depicted by (Clapp, 2014)) explains this phenomenon, where the
people of the city become unaware of each other levels, mostly upper levels of the lower
levels due defined structures of segregated welcomes. “Cities force growth and make men
talkative and entertaining but they make men artificial”.

146
According to the identification by Alexander (1964) (as said by (Broadbent, 1990)) the
physical growth of the city has two manners. To grow with time, without a plan according to
the desires, choices made by individuals of localities. “Sri Lanka’s economic geography is
characterized by concentration of economic production: its “urban footprint” is low in
density, with sprawl and ribbon development along the main roads and coastal belt.” (UN
Habitat; The World Bank, 2012). The other method discusses the planning of a city according
to a planner’s sense of space and order. The failure of present urban design occurs at this
level. The usual process treats buildings as isolated objects on landscape and not as a part of a
larger fabric. Decisions about growth patterns are made from two-dimensional land-use
plans, without considering the three-dimensional relationships between buildings and spaces
and without a real understand of human behaviour. The urban landscape cannot be analysed
entirely by means of rationality. It is ever transforming and overlapping, creating new layers
and new dimension ever so frequently. Contextual forces of this nature require more
complex ways of understanding and reinforcing its physical structure.
As an example, Colombo; the capital of Sri Lanka, a colonial settlement has now been
inundated by waves of distressed migration and Kandy; a city in the central hills of the
Island, a structured traditional city is flooded by unchecked urban growth and incoherent built
form. Figure 2 and 3 of Colombo and Kandy expresses this situation. This has produced
strange and yet familiar images which have been slowly weaving themselves into the existing
urban fabric and producing fragmented, random illegible urban structures. Further in these
contexts, architecture is not considered by planners as an instrument in structuring the urban
landscape, resulting in our cities being visually and perceptually chaotic.
Figure 2: Colombo, from highly dense nodes to spreading as ribbon settlements

147
Figure 3: Kandy, from planned inner city to unplanned ribbon settlements
4.2 Understanding Spaces in Between
The research recognizes the space externally and geometrically bounded by a variety of
elevations of built structures that form an edge can be called the space between buildings.
This external space is unobstructed space for movement in the open air with public, semi-
public and private zones.
• Squares – A non-linear, centralised and discontinuous open space. These forms the nodal
points of the city.
• Streets – A linear, open-to-sky, continuous linking element bounded either on one side or
both sides by continuous facades or by a series of buildings which may be having gaps in
between. The layout of streets is a merely a framework, the character of the streets is
generated by the people’s contribution towards it.
• Sidewalks and pavements – Space between the road and the building edge or the fence
which is for the pedestrians is considered as sidewalks and pavements. In third world cities
are mostly dominated by poor urban dwellers, who share and use it as a multipurpose
space predominantly for living and trade.
• Courtyard – A centralised and discontinued open space in a building complex or a group
of buildings arranged around it. The scale makes the courtyard (; smaller in size) differ
from the square.
• Rear space – Space in between the rear edge of the building and the rear boundary is called
as rear space.
Spaces in between which can facilitate public interaction in a city when not used becomes a
“lost space”, an anti-space. Lost space can be defined as the left over unstructured space
between buildings or the undesirable urban areas that are making no positive contribution to
the surrounding of the users (Trancik, 1986).
The importance of outer spaces becomes integral to the lifestyle of countries of the equatorial
region due to prevailing weather conditions throughout the year. Rain is seasonal and other
days are mostly sunny. In this the gathering in outer urban areas, especially by the lower-
income class is very high. Existing practices of urban planning ignores these behavioral
patterns and forces this population into high rise buildings which entirely disrupts the
lifestyles which are heavily dependent on above said types of spaces.

148
5. THE STRUCTURE OF THE DRESS
We first shaped our societies and allowed our cultures to grow and now our societies shape us
(How Art Made the World; More Human Than Human, 2005). Our societies are our creation
through millennia. While geographically the nature of societal and cultural values varies, a
common norm to all is ‘dressing’ (Entswitle, 2000). Dressing in this isn’t merely limited to
clothing, but includes tattooing, body painting and even physical body modifications. All
form of dressing brings meaning to the naked human body. While covering the body for
protection; as shelter and covering the body for modesty; to cover our nakedness are
prominent factors of dressing, expressing identity, social standing expressed by dressing is
also an important implication of the dress which is common to all societies and cultures.
Figure 4 shows the understanding of the relationship between body and dress within the
research scope. Dressing on the body, such as previously mentioned tattooing or body
painting, dress as body attachment, such as our day to day wearable clothes and dress as a
body extension, such as products we use to help us achieve our daily tasks. The connection
between the dress and the body is mostly observable in the second category of dress as
attachment. Therefore, the research uses previously gathered analysis and synthesis to which
resulted in four different methods of connection for body and dress as attachment.
Figure 4: Categorization and segmentation of the relationship between body & dress, based on
(Liyange & Hettiarachchi, 2016)
Naked Body
Body + Layering Body + Elements Body + Volume
Dressing on the
Body
Dress as Body
Attachment
Progression of
attachment from
interior to exterior
Pre-defined attachment
on the body
i.e. Body + Structure;Crinolines, Crosets etc.
Dress as Body
Extensions
Body + Dress

149
Body + Layers – Layers of material can be constructed from the interior to the exterior. The
traditional South Asian Sari creates freedom of movement, a variety of draping methods from
the same sized fabric and adheres even to drastic body size changes of the wearer. (Figure 4:
Layers, Source: Banrjee & Miller, 2004 edited)
Body + Elements – An individual element can be repeated to create a continuous fabric of its
own or to bring attention to special details i.e. using the boundary of a hollow element to
bring attention to what is in middle of it. (Figure 4: Elements, Source: Student design project,
Dept. Of Integrated Design, University of Moratuwa)
Body + Volume – While the original form is disfigured, more space can be acquired through
the materialistic means. (Figure 4: Volume, Source: 1997 Collection, Rei Kawakubo,
http://www.vogue.com/fashion-shows/spring-1997-ready-to-wear/comme-des-garcons/)
6. CONCLUSION
Layering, addition of repetitive unit elements, engulfed space as volume to structures of the
urban space can be considered as means that connect the people of the city through activity to
the urban fabric. Spaces in between and lost spaces of the city can be utilized to give meaning
to dispersed and chaotic urban activity.
Formal and informal activities of cities can be funded by the means of adding structural
elements, on or above the ground level, solving unnecessary chaos especially created by
activities such as pavement hawking. These additions should be considerate of the income
level of the user groups and prevent alienation. If not, micro-economies will be disrupted
creating unprecedented chaos through attempts of development.
Public activity that is already occurring can benefit from the addition of subtle layers of
physical construction that will not hinder existing practices. Addition as layers is important
for forced physical elements without considering adaptation time of the users may disrupt the
rhythm of social patterns.
Lost spaces of the city can be better utilized through the means of being consumed by
existing structures or any other recognizable nodes, resulting to deform the structure in a
positive manner.
7. REFERENCES
Barthes, R., 2013. The Language of Fashion. London: Bloomsbury Revelations.
Broadbent, G., 1990. Emergingconcpets in urban space design. London: E & FN Spon.
Clapp, J. A., 2014. The city; a dictionary of quotable thoughts on cities and urban life. 2nd ed. New Jersey:
Transaction Publishers.
Entswitle, J., 2000. Fashion and the Fleshy Body: Dress as Embodied Practice. Fashion Theory, IV(3), pp. 323-
347.
Grounlund, B., 2007. Some Notions on Urbanity. Istanbul, International Space Syntax Symposium.
Haye, A. D. L. & Wilson, E. eds., 1999. Defining Dress: Dress as Object, Meaning and Identity. Manchester:
Manchester University Press.
Hillier, B., 1989. The Architecture of Urban Object. Ekistics, pp. 5-22.
How Art Made the World; More Human Than Human. 2005. [Film] Directed by Nick Murphy. UK: BBC.

150
Hull, R. B., Lam, M. & Vigo, G., 1994. Place Identity; Symbols of Self in the Urban Fabric. Ladscape and
Urban Planning, Issue 28, pp. 109-120.
Lauer, R. H., 1976. Defining Societal Problems: Public and Professional. Social Problems, XXIV(1), pp. 122-
130.
Liyanage, P, 1996. ‘Towards regenration of public activity in the space between buildings’. M.Sc (Architecture)
and RIBA part II, University of Moratuwa, Moratuwa.
Liyange, P. & Hettiarachchi, S., 2016. Forming the Negative; Architecting the Space in Between. Moratuwa,
Faculty of Architecture Research Unit, University of Moratuwa, pp. 398-412.
Quinn, B., 2003. The Fashion of Architecture. Oxford: Berg.
Thomas, D. R., 2006. A General Approach for Analysing Qualitative Evaluation Data. American Journal of
Evaluation, III(27), pp. 237-246.
Trancik, R., 1986. Finding Lost Space; Theories of Urban Design. New York: Van Nostrand Reinhold
Company.
UN Habitat; The World Bank, 2012. Turning Sri Lanka's urban vision into policy and action. Colombo: The
world bank colombo office.

151
ID 116
TOWARDS SOCIO-CULTURAL SUSTAINABILITY IN DESERT
DWELLING DESIGN IN SOUTHWEST LIBYA
A. Elhassi and H. Elkadi
School of Built Environment, University of Salford, Salford, M5 4WT, UK
Email: [email protected]
Abstract: Southwest Libya is one of the most important desert regions in Libya, with its
significant historical oases and towns. This region is characterised by its unique design of
vernacular dwellings, with a rich architectural heritage and a remarkable convergence of
cultures. The nature of these dwellings is founded on a harmonious blend between architecture
and people, which has formed its architectural identity over centuries (Eltrapolsi, 2016).
However, in recent decades, the vernacular architecture of desert dwellings is no longer able to
keep up with contemporary lifestyles of different generations (Bilghit, 2007). The vernacular
architecture of desert dwellings and the architectural landscape in southwest Libya face several
serious challenges. These challenges include rapid changes in the way contemporary dwellings
are built, and incorporating modern trends for desert dwellings. Such trends have led to
transformative patterns in socio-cultural life that have distorted the architectural landscape of
the region (Shawesh, 1996; Almansuri, 2008). The region has experienced problems with
dwelling design in terms of a lack of compatibility of those dwellings with the socio-cultural
needs of locals, including a lack of harmony with the architectural identity and patterns of
contemporary life and the distortion of the architectural landscape of historical towns. This
condition is worsened by the fact that the current desert dwellings are, nevertheless, still
designed and implemented by the same trends, causing problems in meeting the requirements
of the socio-cultural sustainability needs of locals (Bilghit, 2007; Azlitni, 2009). This paper
highlights the absence of socio-cultural sustainability considerations by examining the levels
of satisfaction with both vernacular and contemporary desert dwelling design in southwest
Libya in three selected historical towns: Ghadames, Sabha, and Ghat. The aim is to increase
residents’ satisfaction, among different generations, with the design of their dwellings
regarding the fulfilment of their social and cultural needs. A particular focus is on the views of
the new generations on architectural identity and the contemporary lifestyle. From the
findings, this paper synthesises a set of guidelines for sustainable dwelling design based on an
integration of the lessons learned, the features of vernacular architecture, and the advantages
of contemporary desert dwellings in terms of socio-cultural sustainability.
Keywords: Southwest Libya, Socio-Cultural Sustainability, Satisfaction level.
1. INTRODUCTION
Nowadays, the design of sustainable dwellings is one of the most important issues in many
developing societies, such as Arab countries, especially in light of the political and economic
volatility in these countries. The theme of sustainable dwelling design has come to the
attention of architectural researchers in order to meet the future needs of the population in a
sustainable manner (Hoseini et al., 2011).
The surrounding environment, in forms such as natural, climatic, economic, and socio-
cultural, affects several important aspects of dwelling design and urban environment for the
population (Mohamed et al., 2012). However, it is influenced by changes in contemporary
developments and by both modern technology and economic growth. In this context,
sustainable dwelling design employs modern technology along with compatibility with the

152
environment in order to produce a design that both ensures comfort and improves the quality
of life and well-being of its users (Hoseini et al., 2013).
According to Ahmed (2011), improving the quality and safety of human life is linked to
interaction with the natural environment, the economy, and socio-cultural features. However,
socio-cultural features are particularly important for dwelling design, especially features such
as social values and cultural heritage that are inherited by different generations (Grant, 2006);
socio-cultural features are perhaps the least explored within the prevailing development
literature (Al-Jamea, 2014).
The various human societies often carry different traditions and customs without any logical
explanation, and ultimately constitute the cultural heritage values of that society (Malkawi et
al., 2003; Altman et al., 1980). The adoption of sustainability rules and strategies has become
vital in housing design and residential environments (Almansuri, et al., 2009).
Rapoport (1969) has drawn attention to the fact that the three foundations of sustainable
architecture are social, economic, and environmental aspects. Sustainable dwellings are
devoted to the principles of environmental protection and enhance the quality of life
(Faulconbridge, 2013). Socio-cultural feature experiments are often associated with
measuring the level of satisfaction of a population (Makinde, 2015).
As Rapoport (1969) has indicated, a society considers a dwelling as not just a place to live,
but also a place for social and cultural interactions. Rapoport (1980) also points out that
uneven socio-cultural features should be equally important to dwelling design. The success of
a sustainable dwelling needs to balance the environmental, economic, and socio-cultural
aspects of building sustainable dwellings (Alwaer et al., 2010). According to Connelly
(2007), economic development, social justice, and environmental protection are among the
most important priorities of sustainable housing projects. Meanwhile, in some of the literature
and previous studies in the context of dwellings, the importance of socio-cultural features,
such religious, emotional, and heritage values, has been ignored (Kaklauskas, 2015).
Sustainable dwellings are devoted to the principles of protecting the residential environment
and enhancing the quality of life of the population, since these aspects are often linked to
residents' satisfaction with the design of their dwelling (Makinde, 2015). The current
situation in many historic towns in southwest Libya, which inherited centuries-old values and
experiences that are threatened by new actors changing their built environment, is that the
rapid entry of the contemporary trends of design by government institutions, designers, and
the impact of contemporary international architecture trends that came with foreign
companies have contributed significantly to changes in the architectural environment. That
has led to a disconnect in the relationship between the people and their vernacular built
environment. This is in addition to the question of whether these contemporary trends in
dwelling design can meet the cultural needs of the desert society.
Most of the previous research on towns in the region focused on environmental and climatic
aspects and ignored the aspects of socio-cultural sustainability, despite its importance and
need, especially as the problem continues to worsen. Nevertheless, Abufayed, et al. (2005)
highlighted some aspects of environmental sustainability in the vernacular architecture of
Ghadames, and Aburounia (2007) dealt with some of the trends in environmental and social
sustainability in specific housing projects in Tripoli. Therefore, there is a deep lack of socio-
cultural sustainability in the literature in this area. The need arises for a new design that

153
creates a balance between the contemporary needs of the population, especially the new
generations, and the protection of heritage and cultural identity. The current contemporary
desert dwelling designs that have failed to meet the socio-cultural needs of the population and
that have contributed greatly to the distortion the architectural landscape of these historical
towns should be reconsidered.
In light of this, it should be taken into account that the essence of a sustainable dwelling is to
be appreciated in the context of human housing, and sustainable dwellings contribute to
raising the standard of quality of life, preserve the residential environment, and enhance
socio-cultural features. This should be achieved through an appropriate dwelling design that
should not be based solely on emotional discourse but on a real relationship between
dwellings and socio-cultural features. In this sense, the purpose of this paper is firstly to
formulate a set of guidelines for the integration of the socio-cultural architectural features of
vernacular and contemporary desert dwellings for sustainable desert dwelling design in
southwest Libya. It also aims to highlight the absence of socio-cultural sustainability
considerations in the design of current contemporary desert dwellings in southwest Libya in
three selected historical towns (Ghadames, Sabha, and Ghat) by measuring the satisfaction
levels of different generations of the population regarding both vernacular and contemporary
desert dwelling design. Particular scrutiny will be given to the views of the new generations
on the architectural identity and contemporary lifestyle. Secondly, the paper aims to
formulate a set of guidelines for sustainable desert dwelling design based on the integration
of the lessons learned from the features of vernacular architecture and the advantages of
contemporary desert dwellings in terms of socio-cultural sustainability that could help
increase the satisfaction of the population, achieve more socially and culturally sustainable
design, and help to create balance in these historic towns.
2. SUSTAINABLE ARCHITECTURE AND SOCIO-CULTURAL SUSTAINABILITY
2.1 Sustainable Architecture
The WHO describes dwellings as a private environmental domain that gives the residents the
physical structure of a dwelling with different facilities, services, and supplies, and all that is
necessary to ensure their health, comfort, and mental wellbeing and their social prosperity.
Sustainable development of cities considers dwellings to be very important (Shehab et al.,
2016). Environmental efficiency at present requires further improvements and investments to
develop sustainable dwellings to make access to sustainable dwelling available for all strata
of society according to their social, cultural values, and economic potential (Varol et al.,
2011).
Although the built environment meets a basic need for human beings and is a cornerstone of
development and sustenance, it is also part of the impediment to sustainable development at
present because of its current unsustainable activities (Brandon and Lombardi, 2011). The
continued application of traditional concepts of sustainable development leads to
fragmentation of the natural and social environment that is the basis of the welfare of
societies (Akotia, 2014).
The emergence of sustainable architecture coincided almost perfectly with the development
and spread of sustainable development concepts (Cofaigh et al., 1996; Almansuri, 2008).
According to the definition of McDonough (2000), sustainable building design is a concept
that reflects the sense of the environment and is compatible with the evolving environmental

154
system. Roaf et al. (2005) point out that environmental dwellings are strongly related to the
locations in which they are built and environmental conditions, such as climatic, natural, and
social. Therefore, sustainable architecture is architecture that meets the needs of the
population and is largely compatible with its surroundings and limits the negative effects on
the environment. It also adopts a consensual approach to resource consumption (Almansuri,
2008).
Sustainability deals in the long term with the relationship between humans and the natural
environment (Almansuri, 2008). The essence of architectural sustainability is defined as an
integrated approach to dealing with the environmental, economic, social, and cultural aspects
of the design and construction of housing and buildings. The sustainable environment of any
residential area is understood by looking at the diverse local features of that region as
environmental and economic factors and understanding its socio-cultural features (Ghaffarian
et al., 2011). Therefore, the fundamental implicit criterion for sustainable architecture is to
understand the local features of the surrounding environment (Guedes et al., 2009).
Sustainable architecture aims to achieve a responsive architecture that is compatible with the
environment and represents an ethical, social, and even political commitment. It is, therefore,
an integrated system that seeks to produce biological stability at the global level (Portcous,
2002). The work of Pourjafar et al. (2011) indicates that the efforts to achieve this
compatibility and sustainability of responsive architecture have intensified in the last decades
of the last century through a variety of different interpretations, most of which are based on
environmental awareness and concepts of environmental sustainability. In fact, there was no
comprehensive context for the concept of environmental awareness. However, there were
various efforts to improve the built environment. An example of this is the appearance of the
term "green architecture", which was used in the context of eco-friendly architecture, that is,
architecture that is suitable for the natural aspects of the environment and that has sufficient
facilities to achieve good efficiency and provide the necessary conditions that ensure the
comfort and well-being of users, such as the appropriate internal environment, by different
relationships with nature (Pourjafar et al., 2011). Therefore, the concept of sustainable
architecture is linked to the protection of the environment, especially from the adverse
environmental impacts of industrial waste from construction and architecture. This coincides
with the aggravation of the impact of environmental problems on the health and lives of
people. Sustainable architecture also focuses on the role of architecture in reducing the
problems of environmental pollution (Izadpanahi and Elkadi, 2013). The development of
sustainable architecture leads to a reduction in energy consumption, rational use of natural
resources, harmony between the environment and people, and helps to improve the quality of
life (John et al., 2005).
Sustainability is as old a principle as architecture. However, environmental and ethical
constructs are the foundation of modern sustainable architecture. Through working a
sustainable and stable society, a sustainable society is an important continuum for
sustainability. Stability can be achieved through seamless coordination of the chain of
sustainability. In order to achieve stable architecture, objectivity and authenticity must be
followed, because sustainability is biased towards the moral realm as part of the local culture
and values. However, change in lifestyle and attention to the local environment has become
important, and has been created on the basis of knowledge, science, and techniques that
achieve specific environmental objectives (Pourjafar et al., 2011).
155
There is a scientific basis for sustainable architectural design that derives its strength from
conscience and morals. The principle of sustainable design is based on three pillars: human
design, resource abundance, and a determination to preserve the rights of future generations.
It is implemented in a manner that includes the design, implementation, operation, and
maintenance, and on the basis of recycling and the use of available architectural resources.
Therefore, specialists, professionals, and architects should take steps to implement this
framework rather than any other solution (Pourjafar, et al., 2011).
According to Varol et al. (2011), the primary purpose of housing is to meet the initial needs
of the population. In the context of sustainable development, it is not enough to ensure that all
needs are met; the environmental aspects must be considered comprehensively to cover all
aspects. Sustainable housing development can thus be defined as housing development that
meets the needs of housing and the demands of the current generation without compromising
the ability of future generations to meet their needs and demands.
In other words, a sustainable dwelling is not solely intended to meet the needs of the present
population. It seeks to ensure that future generations will be able to meet their needs.
Nevertheless, sustainable dwellings are defined environmentally. Some studies have focused
on the socio-cultural aspects of dwellings, and most of them emphasized its importance for
the design and planning of dwellings (Al-Jamea, 2014, Connelly, 2007). Hence, dwellings
not only involve the requirements of the population, but also include the development of
critical socio-cultural features, and thus sustainable dwellings seek to integrate social,
cultural, and environmental features together to achieve sustainable design (Varol et al.,
2011).
2.2 Socio-Cultural Sustainability
Dwellings play an important role in various aspects of sustainable development as one of the
most important constituents of the built environment (Amato, 2006). According to Reffat
(2004), sustainable dwellings include interrelated environmental, economic, and socio-
cultural aspects. Sustainable development is an integrated vision to create a balance between
ecological needs and people's needs to provide a prosperous and equitable quality of life (Al-
Jamea, 2014). Furthermore, Reffat stressed that dwelling sustainability is a multi-faceted
issue not only concerned with housing, but with the environmental characteristics of the
location, including climatic conditions, geographical location, economic potential, and human
and socio-cultural values (Reffat, 2004; Al-Jamea, 2014).
Local social considerations are often shaped by cultural characteristics such as customs,
beliefs, attitudes, and philosophies that are inherited via different generations (Chiu, 2002,
Shehab et al., 2016). These traditions can be considered as motivations that drive community
members as part of their culture and patterns of social behaviour. Thus, traditions can be
described as informal rules. Physical products, such as components of technology, and other
non-material products, such as customs, traditions, and others, are all born of human culture.
It is therefore important to understand the interactive relationship between social aspects,
culture, and population (Chiu, 2002; Shehab et al., 2016).
Socio-cultural features are important factors in shaping an environment. Altman (1980)
mentioned that there are four different characteristics that connect man, environment, and
culture. It is classified according to Altman as first, the cultural background of beliefs,

156
customs, traditions, and social behaviour; second, knowledge and its association with the
behaviour of the group; third, how these beliefs are inherited among the different generations;
and finally, the current culture of the society reflecting its features in the architecture of
dwellings or other buildings (Shehab et al., 2016).
In the same context, Rapoport (1980) similarly describes the different aspects of the
relationship between man, the environment, and culture, where he first described culture on
the basis that it represents a lifestyle for a group of people. Secondly, he argued that culture is
in fact symbolic meanings and a system of cognitive framework; and thirdly, he pointed out
that culture is a manifestation of the adaptation of a society to the resources available in the
environment. Furthermore, culture is also classified as a set of expressions of behaviour, a
process that moves from abstract to concrete (Shehab et al., 2016).
As a result of continuous changes and the evolution of the concept of culture, it has not yet
been defined accurately (Elkadi, 2008). Eliot has described it as a group of activities carried
out by people, and although this description is reasonable to some extent (Howells 2003), it
has encountered criticism in terms of the principles of the definition of the people, and also,
this definition does not refer to the dimensions of morality, religion, and politics (Elkadi,
2008).
The sustainability of socio-cultural architecture is linked to the preservation of the cultural
heritage of the population. The adaptation of people to the nature of their place of residence
and modern technological developments reflect the physical framework of a dwelling. The
physical framework is therefore part of cultural expression. The interior design of the spaces
in the dwelling is the outcome of the interactions of the socio-cultural features of customs and
traditions, and so forth. In contrast, the exterior design of the house is a result of the
availability of certain types of building material, the climatic conditions surrounding the
dwelling, the individual capabilities of the owners of the dwelling, and the aesthetic style
prevailing in the community at the time (Chiu, 2004).
In the same context, Chiu points out that meeting people's needs is the primary concern of the
sustainable development of housing, and not only to preserve the resources of the
surrounding environment. However, the main concern for sustainable housing should not be
to meet basic needs, but rather to improve the internal and external conditions of the living
environment (Chiu, 2004). As Ahmed (2013) indicated, most of the needs of the population
are changeable and can be developed; thus, the design of a dwelling should be adaptable. It is
therefore important to envisage adaptation as one of the essential elements of socio-cultural
compatibility.
In addition, Chiu also indicated that there are wide overlaps between cultural and social
sustainability, where many elements and attributes are linked and are sometimes difficult to
separate. Furthermore, cultural and social sustainability can be different at a given time, and
there are features that are difficult to measure, such as social considerations and inter-social
relations that vary from place to place. On the other hand, cultural dimensions such as art,
music, literature, and even religion are perhaps more tangible. (Chiu, 2004).
In general, the concept of dwelling design in terms of socio-cultural sustainability is a
dwelling design that meets the social and cultural needs of the population and also preserves
the right of future generations to use the environment. However, these needs vary from one
society to another and cannot be uniform at a global level. Therefore, the best way to achieve

157
the aim of socio-cultural sustainability is to investigate the needs of society and find
appropriate solutions for dwelling design in that society (Chiu, 2004; Al-Jamea, 2014).
There is a limited amount of literature regarding the socio-cultural sustainability of dwellings,
especially desert dwellings, according to literary reviews and similar earlier studies in some
desert areas, such as the Arabian Gulf region (Mahgoub, 1997; Asfour, et al., 1998; Ahmed,
K.G, 2011; Al-Jamea, 2014; Shehab et al., 2016). This is partly due to the specificity of the
Saharan community in southwest Libya; there are some limited studies that have touched on
the Ghadames Oasis that refer to some social and cultural factors (Bilghit, 2007). This study
proposed four basic features: privacy, safety and security, shape and design, and social and
religious considerations, each of which generates a set of sub-items with which to measure
the levels of satisfaction of different generations of the population regarding both vernacular
and contemporary desert dwelling design. It added three main features: architectural identity,
cultural heritage, and contemporary lifestyle, with another set of sub-items. The socio-
cultural dimension of sustainability is primarily related to people and their quality of their
lifestyle that protects the "cultural identity" of the community, which provides stability and
meets the moral and material needs of the population. A sustainable society seeks to motivate
the members of the society to enjoy safety and equity for all persons (Al-Zubaidi, 2007;
Rogers et al., 2012). These two features are reserved for the youth, because older age groups
perhaps are more in touch with their cultural and architectural identity. This highlights the
problem of changing the identity of young people, and also shows that young people face
rapid changes and developments in their contemporary lifestyle, which contributes
significantly to the disintegration of cultural identity and weakens the sense of national
identity, which is an important basis for people's civilization and their history (Al-Eid, 2014).
These last couple of features have a greater correlation with this younger age groups in
creating a balance between the requirements of the modern lifestyle and the cultural identity
of young people and preserving the cultural heritage and architectural identity of the historic
towns of southwest Libya.
3. RELATED LITERATURE REVIEW
There is a clear lack of studies on architecture and the design of dwellings related to socio-
cultural sustainability in Libya, especially in desert areas. However, most of the relevant
studies in Arab countries are about similar desert areas in the Arabian Gulf region. One of the
earliest studies on social and cultural sustainability in the region was a study presented by
Yasser Mahgoub (1997) called "Sustainable Architecture in the United Arab Emirates",
which concluded that there are many lessons to be learnt from vernacular architecture. The
study included three aspects of sustainability; environmental, economic, and socio-cultural
sustainability. The main features of socio-cultural sustainability according to this study were
summarized as privacy, desires, identity, religion, family, and community lifestyle. Another
study, ''Sustainability crisis in the Arab world'' (Asfour, et al., 1998), pointed out that one of
the most important factors in the crisis is the international architecture trends that have
affected the environment and local culture and have led to a loss of self-identity. Al-Zubaidi,
in her study on "The sustainability potential of traditional architecture in the UAE" (2007),
presented criteria for design guidelines for housing sustainability adaptation in UAE and
stressed the preservation of the environment and traditional architecture in UAE. In his study
"Evaluation of social and cultural sustainability in typical public house models in Al Ain,
UAE" (2011), Ahmed examined in particular the Sheikh Zayed Housing Program in Al Ain
and concluded with the proposal of eight guidelines for housing design aimed at achieving

158
cultural and social sustainability in that region. May Al-Jamea in 2014 conducted a study on
social and cultural sustainability of contemporary housing design in Saudi Arabia, a desert
region that is somewhat similar to the desert in southwest Libya. The study discussed the
absence of social and cultural sustainability in housing design and established guidelines to
address this issue. Finally, the research of Shehab et al., "The influences of socio-cultural
values on sustainable housing design: evidences among Arab countries" (2016) analysed the
impact of socio-cultural values in the design of sustainable housing, and was conducted on
Arab students in Malaysia. It explained the importance of social and cultural values in the
development of sustainable housing design.
4. A BRIEF BACKGROUND ON SOUTHWEST LIBYA
The desert in southwest Libya is part of the Sahara Desert in Northern Africa. The vast
Sahara Desert stretches from the west bank of the river Nile and extends to the outskirts of
the coastal cities in the south of Morocco and Mauritania. It represents large parts of the
territory of the Maghreb (Figure 1).
The Sahara Desert has an exceptionally dry nature and has the typical natural features and
topography of a desert, including the specific characteristics of the desert in the south of
Libya, as presented below. The study area under investigation, as shown in Figure 1.2, is
located between 9° and 19° East, 23° and 31.5° North (Atlas of Libya, 1978).
Figure 1: The location of the Sahara Desert Figure 2: The study area, southwest Libya
Source: Adapted from Atlas of Libya
Figure 2 illustrates the study area, which is shown in yellow, and the three historical desert
towns (Ghadames, Sabha, and Ghat), which were selected on the basis of specific criteria as
samples for this study, in order to generalise the results to each region in southwest Libya.
According to the geographical location, the desert in south Libya is considered a dividing
barrier between the areas of middle Africa and its coastal areas in the North. The southern
parts of Libya have directly been influenced by the region's historical events in ancient times,
which have been important for trade, particularly for sub-Saharan countries in Africa (El-
Tantawi, 2005). This represent the emergence of urban settlements in the desert. In addition
to these, the south of Libya has a strategic location, forming a link between the east and
western parts of the Arab world. It represents the convergence of Arabic, local, Islamic, and
African cultures. These cultures and civilizations meet and blend in this region (Al-Maazi,
2003).

159
5. RESEARCH METHODOLOGY
The research uses triangulation or mixed-method approaches, using both quantitative and
qualitative data collection and analysis. The questionnaires used in a quantitative method, and
the sample survey involves 311 respondents from different generations, most of them young,
from the population of the three selected historical towns in southwest Libya. These
questionnaires gave an understanding of the respondents' perception of the socio-cultural
sustainability of both the vernacular and contemporary desert dwellings and their levels of
satisfaction about these two types of dwelling, and their desires and opinions in relation to
sustainable dwelling design in the future. Quantitative data was analysed using the SPSS
program (using the Wilcoxon test) and descriptive statistics such as frequencies and
percentages. The qualitative method contained semi-structured interviews involving 20
professionals that were analysed using content analysis. Additionally, data was obtained from
photographs, the maps of some vernacular dwellings, and documents such as government
reports, historical documents. The findings of the research were based on a summary of the
mixed analysis from the quantitative and qualitative methods.
6. SOCIO-CULTURAL FEATURES OF THE DESIGN OF VERNACULAR DESERT
DWELLINGS IN SOUTHWEST LIBYA
According to Salama (2002), sustainable design is can reuse some of the features and values
of vernacular architecture. Many experts agreed that the architecture of vernacular dwellings
is more efficient in terms of sustainability than contemporary dwellings (Susilawati & Al-
Surf, 2011).
The evolution of features of vernacular architecture in southwest Libya is evident in
vernacular societies in their principles and way of life. Where the surrounding environment
was the source of living, the local population used the principle of sustainability in their
everyday life. They lived, cultivated, ate, and built sustainably. Interaction with the local
environment and utilizing natural resources were part of their survival on Earth. As Fethy
(1973) has indicated, architecture is a natural product of the everyday life of the society that
produced it.
The vernacular architecture of desert dwellings is a natural product of the interaction between
environmental factors (site, geography, topography, and climate) and socio-cultural features
(religion, traditions, norms, and cultural background). The socio-cultural features of the
vernacular desert dwellings in southwest Libya as a man-made product is not only about the
installation of dwellings; it is a view of life from locals, builders, and professionals. It
expresses the society and culture of the previous generations (Al-Maazi, 2003). Therefore, it
represents the experience of multiple generations over the years, uniting the concepts of
existence and life. According to data analysis and the discussion with specialists, there were
several points that have been derived from vernacular desert dwellings, through the
exploration of views about socio-cultural sustainability of vernacular architecture for the
design of desert dwellings, that can support the integration of sustainable socio-cultural
features into guidelines for new desert dwelling design. Most of these points are summarised
here.
The first point regards the design of the main entrances of desert dwellings. They do not
directly reveal the inside the dwelling (living space is often on the first floor, or the entrance

160
opens on the storage away from the living space) for enhanced separation of public and
private space within the dwellings and to conserve and respect the local customs, traditions,
and cultural heritage of the population in southwest Libya (see Figure 3).
The second point is related to the distribution of desert dwellings in vernacular oases and
towns in southwest Libya. They have followed certain techniques to maintain privacy, such
as using roofs as a sleeping place for the family in the summertime, and the morphology of
vernacular desert dwellings, particularly dwellings that face each other, have been developed
to maintain the privacy of family space. There is usually an inner courtyard and roof with
walls of differing height, and the majority of the living space is on the upper floors, build
around the courtyard. The existence of a central space in desert dwellings, such as an inner
courtyard, provides an area that encourages social interaction between family members, and it
can also be a gathering place for women at events involving neighbours and relatives (Al-
Maazi, 2003).
The existence of an outdoor central space can provide a sitting area, which are called
"mastaba", encouraging social contact with the members of the community, such as those in
Ghadames.
The morphology of vernacular desert dwellings and the compact urban fabric provide a
private indoor environment that reinforces security and safety, especially for the children in
each neighbourhood. In addition to this, there are other examples that enhance the security
and safety through the compact architectural compositions of vernacular architecture, such as
the presence of gates and narrow entrances in residential neighbourhoods. Furthermore,
people prefer their dwellings to be near their relatives in the same neighbourhood (see Figure
4).
Other points are that the similarities of the shapes, sizes, and colours of vernacular desert
dwellings, as well as the suitability of those dwellings with human scale and compatibility
with the surrounding environment at oases, conferred a sense of place, identity, comfort, and
tranquillity for locals.

161
Figure 3: Plans of vernacular desert dwellings without an inner courtyard, Ghadames
Figure 4: The morphology of vernacular dwellings

162
Figure 5: Corridors for women Figure 6: Interior decoration
Source: The researcher, field work, 2015
It is useful to look at techniques of vernacular architecture that promote socio-cultural
sustainability. For example, the existence of upper corridors for women on the roofs of
dwellings in the traditional town of Ghadames provides privacy and supports social contact
among neighbours away from prying eyes (see Figure 5). Building materials of vernacular
dwellings are obtained from the same environment, thus, the materials used were sustainable,
renewable, and compatible with the nature of the place and man. Furthermore, interior
design, decoration, colours, and the distribution of spaces in vernacular dwellings came from
cultural heritage and values, customs, and traditions of locals, which have led to boosting the
cultural and architectural identity of vernacular dwellings in southwest Libya. All the
previous vernacular designs and techniques support achieving a socio-cultural sustainability
in external and internal desert dwelling design (see Figure 6).
In summary, most of arguments supported efficiency to create a sustainable framework
between vernacular architecture and new desert dwellings design in terms of socio-cultural
sustainability. However, it is important to take the lessons of the past and evolve a new
design of dwellings that will be more humanised, and more with environmentally friendly.
7. THE IMPACT OF THE CONTEMPORARY ARCHITECTURAL TRENDS OF
FOREIGN COMPANIES ON THE ARCHITECTURAL ENVIRONMENT IN
SOUTHWEST LIBYA
During the transition period of the 1970s and 1980s, Libya went through rapid economic,
social, and political change. These changes had broad repercussions, which came and went at
great speed. The discovery of oil in Libya greatly influenced housing designs, as a result of
the economic growth. At the same time, there was a need to fill the large housing shortage in
some desert towns and remote oases. For economic and political reasons, the state at that time
implemented a set of contracts that allowed the entry of some foreign companies, which used
modern methods and trends in the design of housing that were previously unknown in the
region and ignored the socio-cultural features and architectural identity of those towns. This
led to profound changes in the desert society, as well as changes in the general shape of the
urban fabric of historic towns. Therefore, architects from foreign lands such as the UK,
Finland, Japan, Korea, and India designed most of the structures in the Libyan desert. The
contributions of local Libyan architects remained unnoticed. Thus, local architecture did not

163
have any opportunity for development. This resulted in a lack of architectural identity in
Libya in comparison with other states, especially in Arab areas (Shawesh, 1996; Amer, 2007;
Almansori, 2008).
These changes affected different aspects of local life, which is reflected in the cultural
transformation of the Libyan desert society. An expression of the changes can, for instance,
be seen in the emerging model of life, and this in turn triggers the inflow of fundamental
changes into the existing residential environment. The trends usually follow the international
style or echo it in the particular way it is perceived. This is the case for both individual
houses and larger urban complexes.
The proportion of the total Libyan population in urban cities has increased from 25% in 1951
to 69% in 2003, registering a rise of 88% (NCID, 2003). The level of urbanization in Libya at
that time was one of the highest in Arabic countries (Abubrig, 2013).
Southwest Libya has witnessed an increased demand for new buildings and infrastructure
projects. This demand is elevated in the central towns such as Sabha, Hoon, and Ghadames
due to the impact of the intensive urbanization process. This process was rampant in the mid-
1990s and the beginning of the 2000s, up to 2005 (Bilghit, 2007). Also, necessary changes
have occurred in construction housing projects and the physical built environment, which still
use the same international design methods without regard for the cultural and social
background of the region, which has exacerbated the problem. In conclusion, the urbanisation
of international design methods has become one of the most significant driving forces of the
change in social housing design in the Libyan desert, which has influenced housing design in
terms of socio-cultural sustainability and has distorted the architectural landscape of historic
towns.
8. A SUMMARY OF THE SET OF GUIDELINES FOR SOCIO-CULTURAL
SUSTAINABILITY THAT SHOULD BE IMPLEMENTED IN THE DESIGN OF
CONTEMPORARY DESERT DWELLINGS IN SOUTHWEST LIBYA
According to the research findings, a set of guidelines was formulated to implement a
sustainable desert dwelling design in southwest Libya. The following is a summary of these
guidelines and recommendations.
The design should adhere to the visual privacy of the various spaces in the dwelling (common
public space, private public space, private space such as bedrooms, etc.). Audio privacy
should be provided through the distribution of spaces and the use of building materials to
assist in acoustic insulation. The appropriate number and size of openings that conforms with
the principle of maintaining visual privacy with neighbours and the street should be taken
into account when designing the dwelling. This can be done by carefully placing windows
and using the appropriate type of material. Social customs and traditions should be taken into
account when designing the organization of interior spaces, such as the size of rooms and the
locations of bathrooms and kitchens. Also, the design should maintain the privacy of
insulation in bedrooms, especially for children, and provide appropriate places for them to
sleep and conduct their activities in their rooms.
The aspects of security and safety should be considered in dwelling design, such as ensuring
the quality of the materials used to make doors and windows, the types of locks used in the
buildings, and the use of modern technologies such as electronic doors and magnetic locks.

164
The height of the walls surrounding the dwelling or residential neighbourhood should also be
considered. Dwellings should be distributed in an appropriate manner to protect the entrances
to and exits from the neighbourhood to ensure the safety of the population, especially
children. Clear foundations for safety should be established in the design of dwellings to
ensure the safety of the population, such as emergency exits in cases of fire and accidents,
and the installation of early warning systems for family safety. The necessary measures
should be taken to protect against crime and theft by concentrating on the entrances and exits
of the dwelling, as well as using the method of social distribution of housing according to the
practice of families and tribes in southwest Libya to alleviate problems of tribal or family
origin.
Dwellings should be a suitable size for the average number of family members in southwest
Libya so that there is no need for expansion, which could affect the facades of dwellings and
therefore affect the general architectural landscape of the town.
The dwelling should be located near to public service buildings such schools, clinics, and
markets for easy mobility, especially for women, the elderly, and children. And rely on
pedestrian and sub-traffic as far as possible away from the main roads to promote social
sustainability.
The doors and windows of the dwellings should be almost the same design and size and
manufactured from high-quality materials to ensure a clean and safe internal environment,
devoid of environmental pollution and unwanted air currents.
The external facades of the dwellings should be made from high-quality materials to ensure
resistance to the harsh external factors in the desert in order to reduce the need for continuous
maintenance, as well as to reflect the forms, colours, and local character of the architectural
identity of the historic towns.
The design of the dwellings should promote family relations and social and cultural activity
by providing suitable spaces for family gatherings that create a warm atmosphere.
Additionally, space should be provided for children to play in and experience their childhood.
Each dwelling should contain appropriate facilities and services that satisfy each member of
family. Furthermore, the dwellings should be designed and distributed in a manner that
creates spaces and internal gardens to provide suitable places for different social activities to
strengthen social ties among the population, in addition to facilitating access to religious
places, especially for the elderly.
The interior and exterior design of the dwelling should reflect the cultural identity of the
desert society in southwest Libya through the reuse of some vernacular architectural elements
in the facades in a contemporary manner, with modern techniques and careful replication.
Therefore, the exteriors of dwellings will appear to be similar in terms of form, which will
enhance the sense of identity for population of the built environment.
It is important that sustainable design is in line with the architectural style of the historic
towns in southwest Libya in order to preserve this architectural heritage, but in a
contemporary fashion so it conforms to contemporary lifestyles and does not conflict with the
wishes of new generations. This can be achieved through a number of measures, including
the education and training of young people, such as new generations of architects and
planners, and showing them the importance of preserving the architectural and cultural

165
heritage of the region, which is part of their cultural heritage and identity. The new design
should achieve a reasonable balance between the preservation of cultural heritage, customs,
traditions, and the right of new generations to keep up with the contemporary lifestyle in a
manner that does not remove their cultural identity, and enhances their sense of identity and
self-expression.
The dwelling design should provide a healthy internal environment, provide good ventilation
and lighting, and be well protected from harsh desert conditions. It should also consume
energy sustainably through economical technologies. Its spaces should be flexible enough to
keep up with contemporary socio-cultural developments and to be able to adapt to any
changes that may be needed by the population in the future, such as expanding or narrowing
some spaces and keeping up with modern technology during daily activities.
To produce a sustainable design that succeeds in meeting the population's needs and achieves
a good level of satisfaction, it is important to involve the population, especially young people,
throughout the design process in order to take advantage of their ideas and share their views.
9. CONCLUSIONS
According to the review of the literature on socio-cultural needs, this paper attempts to
highlight the absence of the implementation of socio-cultural sustainability in desert
dwellings in southwest Libya. However, the conclusion of this paper is to formulate and
summarise of a set of guidelines for sustainable socio-cultural features for desert dwelling
design that can help increase residents' satisfaction with the design of dwellings that fulfil
their socio-cultural needs throughout different generations. The paper will contribute to
filling the gap in sustainability development in the dwellings sector in the Libyan desert in
general and in socio-cultural sustainability specifically.
The principles that must be implemented in the design of contemporary desert dwellings to
move towards socio-cultural sustainability are privacy, safety and security, shape and design,
and social and religious considerations. This paper develops these measures by addressing
cultural heritage and architectural identity, and contemporary lifestyle, as two separate
features according to the findings of recent research that focuses on young people's opinions,
These important concepts should aid in the production of a desert dwelling design in
southwest Libya that can serve all the socio-cultural needs of the people.
10. REFERENCES
Abdelsalam, T. and Rihan, G.M., 2013. The impact of sustainability trends on housing design identity of Arab
cities. HBRC Journal, 9(2), pp.159-172.
Abubrig, A.I., 2013. Towards a Holistic Islamic Urbanism: Planning for Tripoli in the New Libya (Doctoral
dissertation, University of Leicester).
Abufayed, A., Rghei, A. and Aboufayed, A., 2005. Urban planning and architecture of the historic city of
Ghadames, Libya: lessons from the past for cities of the future. WIT Transactions on The Built
Environment, 83.
Aburounia, H.M., 2007. The internal layout design of social housing in Tripoli Libya: A cultural value
perspective (Doctoral dissertation, The University of Salford).
Al-Jamea, M., 2014. Towards social and cultural sustainability in the designs of contemporary Saudi houses. Int
J Sustain Hum Dev, 2(1), pp.35-43.

166
Almansuri A. Dowdle D. Curwell S. 2008. The Effects of Passive Design and Renewable Energy in Producing
Raw Energy Efficiency Architecture and Special Identity (Case Study Libyan Desert Zone Ghadames).
University of Salford. UK
Alwaer, H. and Clements-Croome, D.J., 2010. Key performance indicators (KPIs) and priority setting in using
the multi-attribute approach for assessing sustainable intelligent buildings. Building and Environment,
45(4), pp.799-807.
Ahmed, K.G., 2011. Evaluation Of Social And Cultural Sustainability In Typical Public House Models In Al
Ain, Uae. International Journal of Sustainable Development and Planning, 6(1), pp.49-80.
Al-Eid. W,. 2014. The cultural dimension of globalization and its impact on the cultural identity of Arab youth,
University of Al-Bashir Ibrahimi - Bordj Bou Arreridj, Algeria. Journal sciences of humanity, social 2(6) ,
pp.9-26. jilrc-magazines.com [email protected]
Akotia, J.K., 2014. A framework for social and economic sustainability benefits evaluation of sustainable
regeneration projects in the UK (Doctoral dissertation, University of Salford).
Al Surf, M., Susilawati, C. and Trigunarsyah, B., 2012. Analyzing the literature for the link between the
conservative Islamic culture of Saudi Arabia and the design of sustainable housing. In Proceedings of 2nd
International Conference Socio-Political and Technological Dimensions of Climate Change (pp. 3-16).
University Putra Malaysia Press.
Al-Maazi, M.,(2003) The civilizations of the desert, the first part the population of Fezzan, the geographical
study, Art printing press, Cairo, Egypt.
Altman, I. and Chemers, M.M., 1980. Cultural aspects of environment-behavior relationships. Handbook of
cross-cultural psychology, 5, pp.355-395.
Al-Zubaidi, M.S.S., 2007. The sustainability potential of traditional architecture in the Arab world-with
reference to domestic buildings in the UAE (Doctoral dissertation, University of Huddersfield).
Amer, A.A., 2007. Comparison study of traditional and contemporary housing design with reference to Tripoli,
Libya (Doctoral dissertation, University of Salford, UK).
Ani, A., Mohamed, N. and Abdul Rahman, N., 2012. Socio-cultural influences in the composition of traditional
Malay house compounds in rural Melaka. ALAM CIPTA, International Journal on Sustainable Tropical
Design Research & Practice, 5(1), pp.63-78.
Asfour, Khalid, (1998 B), Architecture Discourse in the Arab World, Sustainable Architecture and Construction
for the Middle East Conference, conference booklet, March 30-31, 1998, Abu Dhabi, UAE.
Azlitni, B., 2009. The Libyan architectural features between traditional and modernization. International Journal
for Housing Science & Its Applications, 33(3).
Bilghit, E.A., 2007. A comparative study of Libyan public housing (Doctoral dissertation, The University of
Salford).
Brandon, P.S. and Lombardi, P. 2011. Evaluating sustainable development: in the Built Environment, 2nd ed,
Wiley and Sons Ltd Publication, UK.
Chiu, R.L., 2004. Socio-cultural sustainability of housing: a conceptual exploration. Housing, Theory and
Society, 21(2), pp.65-76.
Chiu, R. L. 2002. Social equity in housing in the Hong Kong special administrative region: A social
sustainability perspective. Sustainable development, 10(3), 155-162.
Connelly, S., 2007. Mapping sustainable development as a contested concept. Local Environment, 12(3),
pp.259-278.
El Fortea, S., 1989. An Investigation of Appropriateness Relative to Indigenous and Modern Housing in Libya.
(Doctoral dissertation, Heriot-Watt University Edinburgh College of Art, UK).
Elkadi, H., 2008. Cultural Built Heritage A Support for a Shared Identity in Northern Ireland. Fondazione Eni
Enrico Mattei Corso Magenta, 63, 20123 Milano (I), web site: www.feem.it, e-mail:
El-Tantawi, 2005 El-Tantawi, A.M., 2005. Climate change in Libya and desertification of Jifara Plain. PhD
Diss., University of Johannes Gutenberg, Mainz, Germany.
Eltrapolsi, A., 2016. The Efficient Strategy of Passive Cooling Design in Desert Housing: A Case Study in
Ghadames, Libya (Doctoral dissertation, University of Sheffield).
Faulconbridge, J., 2013. Mobile ‘green’ design knowledge: institutions, bricolage and the relational production
of embedded sustainable building designs. Transactions of the Institute of British Geographers, 38(2),
pp.339-353.
Fathy, H. 1973. Architecture for poor. An experiment in rural Eygpt. The University of Chicago Press, Chicago,
USA.
Ghaffarian Hoseini, A., Ibrahim, R., Baharuddin, M.N. and Ghaffarian Hoseini, A., 2011. Creating green
culturally responsive intelligent buildings: Socio-cultural and environmental influences. Intelligent
Buildings International, 3(1), pp.5-23.

167
Ghaffarian Hoseini, A., Dahlan, N.D., Berardi, U., Ghaffarian Hoseini, A. and Makaremi, N., 2013. The essence
of future smart houses: From embedding ICT to adapting to sustainability principles. Renewable and
Sustainable Energy Reviews, 24, pp.593-607.
Ghaffarian Hoseini, A., Berardi, U., Dahlan, N.D. and GhaffarianHoseini, A., 2014. What can we learn from
Malay vernacular houses?. Sustainable Cities and Society, 13, pp.157-170.
Grant, J., 2006. Planning the good community: new urbanism in theory and practice (Vol. 9). Taylor & Francis.
Guedes, M.C., Pinheiro, M. and Alves, L.M., 2009. Sustainable architecture and urban design in Portugal: An
overview. Renewable energy, 34(9), pp.1999-2006.
Izadpanahi, P. and Elkadi, H., 2013, January. Impact of sustainable school design on primary school children's
environmental attitude and behavior. In 2013 NAAEE Conference Proceedings (pp. 1-17). NAAEE.
Kaklauskas, A., 2015. Passive House model for quantitative and qualitative analyses and its intelligent system.
In Biometric and Intelligent Decision Making Support (pp. 87-112). Springer International Publishing.
Malkawi, F.K. and al-Qudah, I., 2003. The house as an expression of social worlds: Irbid's elite and their
architecture. Journal of Housing and the Built Environment, 18(1), pp.25-48.
Makinde, O.O., 2015. Influences of socio-cultural experiences on residents’ satisfaction in Ikorodu low-cost
housing estate, Lagos state. Environment, Development and Sustainability, 17(1), pp.173-198.
Mahgoub, Yasser .1997., Sustainable Architecture in the United Arab Emirates: Past and
Present, CAA-IIA International Conference On Urbanism & Housing, GOA, India.
Mohammad, F. and Amato, A., 2006. Public housing and social sustainability indicators: HK-BEAM as a case
study. In Proceedings of the annual research conference of the Royal Institute of Chartered Surveyors,
London.
Pourjafar, M.M.R. and Mofidi, M.S.M., 211. Sustainable Architecture, Conception to Realization. SASTech
conference, May 12-17, 2011. Iran University Of Scince and Technology.
Rapoport, A. 1969. House Form and Culture. Englewood Cliffs, N.J.: Prentice-hall, Inc
Rapoport, A., 1980. Cross-cultural aspects of environmental design. In Environment and culture (pp. 7-46).
Springer US.
Reffat, R.M., 2004. Sustainable Development of Buildings and Environment. In Proceedings of 2nd
International Conference on Development and Environment, Assiut University, Egypt.
Rogers, D.S., Duraiappah, A.K., Antons, D.C., Munoz, P., Bai, X., Fragkias, M. and Gutscher, H., 2012. A
vision for human well-being: transition to social sustainability. Current Opinion in Environmental
Sustainability, 4(1), pp.61-73.
Salama A. M., 2002. Sustainability/Trans-disciplinarity: A concern for people and environments between
confusing terminology and outdated approaches Bulletin of IAPS (The International Association of People-
Environment Studies). Volume I, No 20.
Shawesh, A.M., 1996. Housing design and socio-cultural values in Libya: an investigation of traditional and
contemporary housing (Doctoral dissertation, University of Newcastle, UK)
Shehab, A.M. and Kandar, M.Z., 2016. The influences of socio-cultural values on sustainable housing desgin:
evidences among arab countries. Faculty of Built Environment, Universiti Teknologi Malaysia Skudai
Johor, Malaysia . Sci. Int.(Lahore),28(2),1703-1710
Susilawati C., and Al-Surf, M. A., 2011. Challenges facing sustainable housing in Saudi Arabia: A current study
showing the level of public awareness. Queensland University of Technology. In: The 17th Pacific Rim
Real Estate Society Conference, Bond University, Gold Coast.
Varol, C., Ercoskun, O.Y. and Gurer, N., 2011. Local participatory mechanisms and collective actions for
sustainable urban development in Turkey. Habitat International, 35(1), pp.9-16.

168
ID 119
CHANGES IN ARCHITECTURAL DESIGN PROCESS IN THE
DIGITAL AGE: RECENT PHENOMENA AND FUTURE POTENTIAL
OF COMPUTATIONAL DESIGN
A. Haidar, J. Underwood and P. Coates
School of the Built Environment, University of Salford, Salford, M5 4WT, UK
Email: [email protected]
Abstract: The rapid evolution of digital technologies applied in the current architectural
practice is resulting in radical changes in the way designers create, communicate and interact.
Design processes are becoming more complex, which is resulting in the emergence of new
roles in design teams, and a growing need for more collaborative and interdisciplinary
environments. Furthermore, new modelling techniques are evolving that are shifting the focus
from the modelling of the building form to the modelling of its behaviour and structural and
environmental performance. The adaptability of those modelling techniques is enabling the
creation of a digital narrative fit for purpose in which a design team can adapt tools and
processes to fit the specific needs of the project at hand. In general, a wide range of novel
design approaches and methodologies are currently being developed in the architectural
practice. Those approaches are growing in a radical manner whereby no mature theory has yet
been provided, despite intensive publication. Through a case study research methodology, the
paper explores some of these cutting-edge design methodologies in order to link them to the
existing theory. Two semi-structured interviews were conducted with practitioners from the
architectural and software development practice. The analysis of the data was linked to the
existing computational design theory, and based on this link, the paper explores the real
impact of digital technologies on the architectural design process, together with how such
digital technologies can be utilised to develop innovative strategies in architectural practice.
Keywords: Architectural Design Process, Collaboration, Computational/Digital Design,
Design Theory, Interdisciplinarity.
1. INTRODUCTION
The impact of digital technologies on architectural practice started to crystallise in the 1980’s
as CAD (Computer-Aided Design) was adopted by a wide range of practices over the world
(Penttilä, 2006). At that time, CAD proved its efficiency in project delivery due to its ability
in speeding up replications within the design process (Holzer, 2015). In the 1990’s, CAD
started to be an inevitable design tool in the majority of architectural practices, where the
focus was on using CAD to produce digital documentation for design instead of the
traditional paper-based drawings (Penttilä, 2006). Within the same decade, CAD applications
continued to evolve, and hence, started to enable high quality visualisation, which dominated
the propagation of computational skills within the practice (Bernal, Haymaker, & Eastman,
2015). Later, CAD and 3D modelling programs, together with the rapid prototyping and
physical modelling tools, started to grow and evolve very quickly; thus, these digital tools
have started to influence the core of the design process in its early stages. As a result, it could
be argued that the design first concept can be born from the nature of the digital resource. In
such a situation, it is important to identify the true potential of digital technologies and their
implicit impact on the creation and production of design artefacts. To achieve this
identification, the paper classifies the recent computational design phenomena in the current
169
architectural practice, and then later explores how those new digital design methodologies
can make sense within the real practice.
2. RECENT PHENOMENA IN ARCHITECTURAL DESIGN PROCESS
2.1 Complexity
Digitally-driven design processes are characterised mainly by a high level of complexity
(Mitchell, 2005). This complexity is reflected in the relationships between designers, tools,
knowledge, information and other actors in a project team (Kocaturk, 2013; Oxman, 2006;
Thomsen, Tamke, Gengnagel, Faircloth, & Scheurer, 2015). As a result, the focus in the
design process has shifted to some extent towards managing this complexity (Whitehead, de
Kestelier, Gallou, & Kocatürk, 2011), and has provoked an indispensable need for
standardisation to reduce this complexity Mueller (2011). In this regard, Oxman (2006, p.
240) states that an intensive nomenclature is emerging to help in identifying names for the
“sub-tasks” and “sub-phases” within a design process, which, in turn, helps in crystallising
the increasingly complex processes of design. Thus, the traditional representation of design as
a “staged, linear/cyclical process” is being replaced by another one, which is more
“particularised taxonomically” (Oxman, 2006). Therefore, it could be argued that this
complexity in digital design is resulting in changing the structure of the design process,
through changing the sequence of its stages and by adding more sub-stages.
2.2 Emergence of New Roles
In order to tackle the increasing complexity in computational design, new roles within
architectural teams are emerging, such as software developers, parametric designers,
geometry specialists, sustainability specialists, and data scientists (Ceccato, 2010; De
Kestelier, 2013; Hesselgren & Medjdoub, 2010; Katz, 2010; Whitehead et al., 2011).
Furthermore, many architectural practices have already started to adopt BIM (Building
Information Modelling) technology where the radical increase in the information content is
challenging the capacity of a project architect who needs to deal with this enormous flow of
information (Holzer, 2015). Such a situation has redefined the role of a project architect, and
has resulted in a growing need for specialists in information management, data integration,
and interdisciplinary coordination in order to enhance efficiency in BIM workflows (Holzer,
2015). This wide variety of roles and areas of specialisation within the architectural practice
has, in some cases, exceeded the field of the built environment. For instance, most of the
design teams at Zaha Hadid Architects (ZHA) are provided with software developers
(Ceccato, 2010), while Foster + Partners have their in-house research group, in addition to
artists, mathematicians and an aerospace engineer that work within their design teams (De
Kestelier, 2013; Foster+Partners, 2013).
2.3 Collaboration and Interdisciplinarity
Four decades ago, Jones (1969) was urging designers to enhance transparency in the design
process in order to allow contributions beyond designer’s own expertise and knowledge.
Currently, the nature of digital tools applied in design practice is resulting in increasing
transparency in design processes by shifting some aspects of the design process “from
implicit to explicit” (Oxman, 2006). In this regard, Thomsen et al. (2015) argue that these

170
interdisciplinary environments help architects to learn from neighbouring fields, and to
inspire ideas and technologies rather than reinventing the wheel. Kolarevic (2004) claims that
digital technologies are enabling a “seamless collaborative process” by integrating design,
constructional, analytical, and other processes, which results in “a digital continuum from
design to production”. For her part, Kocaturk (2013) describes collaboration within socio-
technical environments as the main engine for innovation in architectural practice. In general,
it could be argued that enhancing collaboration and interdisciplinarity is becoming inevitable
in the current architectural practice in order to tackle increasing complexity and the
multiplicity of roles by sharing information, ideas, and techniques throughout the different
stages of the design process.
2.4 Adaptability
Traditionally, architectural designers used to develop design solutions by using specific tools.
The new digital technologies applied in the design practice are enabling designers to adapt
the tools they are using to be ‘fit for purpose’. From a practical perspective, Whitehead et al.
(2011) claim that the technologies used in the design process should be customisable based
on the specific needs of each individual project, and should be developed by the design team
in parallel with the development of the design itself. From a theoretical perspective, Oxman
(2006) states that these digital tools and techniques applied in current practice are resulting in
“a paradigm shift in the design process from form to formation”; as they enable designers to
interact with the very process by providing the capability of adapting and reforming the tools
within the design process. Mueller (2011) describes this phenomenon as a new level added to
the design process, in which a designer needs to design the building one level, and on a
different level, design the tools that will be utilised to design the building.
2.5 New Dimensions in Design Modelling
A variety of modelling techniques are enabled by different digital tools, which can be utilised
to create different sorts of models; such as physical model, BIM model, parametric model,
script, and sketch (Kocaturk & Kiviniemi, 2013). While each of these models represents a
specific degree of abstraction, each model is being produced for a specific purpose such as
analytical, geometrical, visual, contextual or environmental models (Kocaturk & Kiviniemi,
2013; Whitehead et al., 2011). The function of modelling in the design process, according to
Whitehead et al. (2011, p. 240), is to manage “change propagation” in the design process,
which can be captured in a model-driven process by creating a “federation of models”, and
then exploring mechanisms to link these models and allowing them to work together in an
integrated way. In this light, Thomsen et al. (2015) argue that the current digital technologies
allow not only modelling the building form, but also modelling the behaviour of a building in
order that a model can show how the building will look like and also how it will perform.
This multiplicity of models can result in more mature decisions as it facilitates referencing
and data exchange between different modelling processes and provide feedback for designers
(Whitehead et al., 2011, p. 240). In this regard, Kocaturk and Kiviniemi (2013) argue that
these various modelling techniques have the potential of shifting the focus in the design
process from providing drawings to providing ‘intelligent models’ from which different
drawings can be extracted. From a different perspective, Thomsen et al. (2015) state that this
phenomenon is starting to challenge the traditional hierarchical organisation of design fields
by enabling new design-based information modelling, which is starting to focus on

171
investigating inter-scalar interdependencies within the design process. Hence, all the
information from different scales and levels; from Micro level to meso level through to macro
level, are integrated into one single platform and are represented in one single model
(DeLanda, 2016). Thus, it could be argued that the advances in digital technologies are
resulting in adding new dimensions to design modelling, and are enabling a variety of
approaches in a design process, such as relying on ‘federated models’ or integrating processes
into ‘one single model’. Therefore, those rapidly evolving modelling techniques are gradually
becoming an integral part of the design process.
2.6 Increasing Role of Research within Architectural Practice
Due to the rapid growth of tools and methods currently applied in the design process, some
design practices are provided with research teams that help in developing tools, methods and
experiences. For instance, ‘Foster + Partners’ is provided with the SMG (Specialist
Modelling Group) that carry out project-driven research and development (Whitehead et al.,
2011). According to Hugh Whitehead (the head of SMG), the tools developed within the
design process of a specific project are being re-customised and re-used for other projects.
Likewise, ZHA (Zaha Hadid Architects) provides its design teams with a variety of in-house
online media and data-bases to capture constructional and architectural knowledge such as
“descriptive techniques and parametric scripts”. This knowledge is recorded using different
digital repositories to help in developing a sustainable and growing knowledge base that can
be used to transfer experiences from one project to another (Ceccato, 2010). On its part, SOM
(Skidmore, Owings & Merrill) relied on intensive research in developing its own software in
order to enable the modelling, analysis and documentation of large and complex projects
(Katz, 2010). On the other hand, Lars Hesselgren (Director of PLP Group), who also has a
similar research group, argues that the role of this group may differ based on the nature of
each individual project, and the stage in which the research group engages; however, he states
that such an engagement may slow down the design process due to the different criteria used
to drive the practice and the research (Hesselgren & Medjdoub, 2010). Such examples
represent highly innovative strategies in the architectural design process in which tools and
processes are being digitally documented to inform future design projects. It is essential to
rearticulate those strategies within an efficient theoretical context in order to identify their
potential in developing novel design methods.
2.7 Increasing Role of Information
In response to the growing need for more collaborative environments and more means for
coordinating different design and construction platforms, new technologies are widely
available to facilitate and automate the flow of information within the design process. This
increasing need for information has resulted in the emergence of BIM, which relates to “the
concept of relating data to geometrical objects that form a digital representation of building
component assemblies” (Holzer, 2015, p. 67). BIM can enable higher building quality and an
effective and high level of collaboration between participants from different disciplines as it
allows the creation of an accurate 3D model that contains both geometrical and non-
geometrical information, as a result, an automated and direct extraction of 2D drawings at
any time can be achieved, together with automatic corrections when a part is modified,
synchronisation of design and constructional information, earlier cost estimations with
acceptable accuracy, earlier determination of potential errors and energy analysis and

172
evaluation (Eastman, Eastman, Teicholz, & Sacks, 2011; Eynon, 2016; Garber, 2014). From
a theoretical perspective, Oxman (2006) describes information in computational design as a
“new material” for designer, while Kolarevic (2004) states that this seamless flow of
information in computational design is blurring lines between design and construction
processes and is resulting in digital continuum from design to production. Thomsen et al.
(2015) state that BIM is shifting the focus from a 3-dimensional geometric extension to an n-
dimensional field of divergent, heterogeneous and conflicting information, which in turn, can
trigger significant changes in the way architects work, particularly, where the parsing,
analysis and calculation of information become an integral part of the design representation.
2.8 Influence of Disciplines Beyond the Building Industry: Topology and Non-Euclidean
Geometry
New terms from industrial design, informatics, topology, film making, and biology have
started to invade the discourse of contemporary architecture, such as; algorithms, NURBS,
curviliniarity, hyper-surfaces, kinematics, bio-morphic, and genetics. According to Kolarevic
(2004), design and production of curvilinear forms was broadly used in other industries some
time before they were adopted into architectural practice. For instance, Frank Gehry produced
the doubly-curved skin of the Walt Disney Concert Hall in which he utilised CATIA
(Computer Aided Three-dimensional Interactive Application), which had been used in
aeronautical design for 20 years (Glymph, 2003; Kolarevic, 2004; Lawson, 2011). Similarly,
in shipbuilding and automotive design, the reliance on drawings was abandoned in favour of
centralised 3D-models some time before similar methods were adopted in architecture. In
addition, architects have started to adopt CAD/CAM systems which were developed for
product industry, and some software applications from film industry (Kolarevic, 2004).
One of the main consequences of this phenomenon in computational design is the emergence
of topological, non-Euclidean geometry, whereby architects tend to provide habitats similar
to those of nature (Bhooshan, 2016). For this purpose, some architects have started to
“manifest norms of beauty” by migrating from Euclidean spaces and Cartesian grids towards
double-curved, complex and interactive geometry (Kolarevic, 2004). Many historical
attempts of embedding such geometry into architectural forms failed due to the lack of
representational technologies of their times (Moneo, 2001). Currently, those attempts are
effectively enabled due to the availability of affordable constructional technologies together
with highly-advanced software applications (Oxman, 2006). The results of this phenomenon
are vast; theoretically, Kolarevic (2004) argues that these “blobby”, “formless” and “fluid”
shapes are shifting the focus from “spatial distinctions” to “spatial relations”, while Oxman
(2006, p. 252) claims that topological design is “characterising the first formal statement in
new design philosophy” by providing a new kind of formal complexity, and departing from
the “topological determinism” of traditional design. Practically, despite the lack of aesthetic
theory to support curviliniarity in architecture as Kolarevic (2004) complains, this
phenomenon can be exemplified by many existing buildings such as ‘Kustaus Graz’ by Peter
Cook (CRAB, 2003), ‘Web-of-North-Holland’ by Sander Boer and Kas Oosterhuis
(Kocatürk, 2006; Oosterhuis & Boer, 2004) or ‘BMW’s exhibition pavilion at the IAA ’99 by
Bernhard Franken and ABB Architekten (Franken, 2003).
In relation to the research topic, this phenomenon has an impact on the architectural design
process, as designing such forms requires incorporating highly-advanced mathematics into
the design process in order to analyse and generate highly-complex and doubly-curved
173
surfaces. In other words, this kind of design requires new sorts of knowledge and experiences
that were not highly related to conventional design processes. This is reflected in the current
practice, as some practices have started to integrate aerospace engineers, mathematicians, and
specialist from other disciplines within their design teams.
2.9 Changes in design thinking and culture
The new digital tools and methods currently applied in design have influenced the core of the
design process. Some authors describe this influence as a shift in the culture of designing and
design thinking (Kolarevic, 2004; Oxman, 2006), while others tend not to exaggerate in
describing this influence (Lawson, 2011; Whitehead et al., 2011). According to (Oxman,
2006), this cultural shift is reflected in the centrality of digital tools, and the adaptability and
“non-determinism” of the design process. Kolarevic (2004) argues that the new digital
processes are ignoring traditional styles in design and concentrating more on processes driven
by automated and responsive form generation. A potential evidence of this cultural shift can
be traced in Hesselgren’s description of the role of computational and parametric group in his
practice as “extending computational design beyond the sphere of geometry” (Hesselgren &
Medjdoub, 2010, p. 247). In general, the computational approaches applied in the current
architectural practice are re-addressing the entire cycle of the design process including the
generation, evaluation and optimisation of design alternatives as stated by (Bernal et al.,
2015) who recognise three levels of the impact of computational methods on each design
stage. Those levels range from assisting, to automating, to finally augmenting the actions
undertaken within the design process. Fürnkranz J and Hüllermeier E. (2010) in Holzer
(2015) argue that these computational methods are not only optional methods awaiting
effective inclusion within the design process, but that they are silently being the norm.
3. RESEARCH METHODOLOGY
The epistemological position of this research leans towards interpretivism; the research tends
to identify the impact of digital technologies on the architectural design process and the way
in which different digital tools, techniques and methods, applied in the current design
practice, are reshaping the designer’s thinking process. Thus, the research is seeking
knowledge that is going to be interpreted from people’s subjective perspectives and opinions
(architectural design practitioners), in addition to the social context of this knowledge within
the current architectural practice. Besides, the ontological assumptions that will lead this
research lean towards subjectivism in that the research is not looking for a single reality. In
fact, this reality (the true potential) seems subjective and can be different from one design
practice to another, as each practice has its own methods, techniques and approaches in
employing digital technologies in their work. Furthermore, within the same practice, the
potential of digital technologies can be different from one architectural project to another. In
fact, in the realm of architectural design, each project has its own nature, and may require
different kind of information, and perhaps, unique methods and approaches.
The purpose of this research is mainly explanatory as it focuses on determining the
relationship between two main variables; the digital technologies and the architectural design
process. This relationship is caused by the rapid evolution of digital technologies, which is
resulting in a radical change in the methods and techniques applied in the current
architectural practice. In addition, the architectural design process is a variable that contains

174
two ‘sub-variables’ that are the current design practice and the computational design theory.
In this regard, the research investigates how the adoption of digital technologies in the current
practice is rising the need to revise the design theory.
The previous section investigates the impact of digital technologies in architectural design
process by classifying the recent phenomena in digitally-driven design processes. Within this
section, the paper explores those phenomena within the real practice in order to identify the
theoretical context of these phenomena, and how this identification can lead to the
development of innovative strategies in computational design; hence, a case study research
strategy was adopted where the two cases represent two firms from totally different nature,
however, both of the firms have proved efficiency and success in utilising and developing
computational design methods within real projects. A semi-structured interview was
conducted for each case. Both participants are architects.
3.1 Case Study 1: Computational Design in a Large-Scale Architectural Firm
This case study relates to one of the leading architectural firms in the UK whose work relies
on a highly collaborative environment and interdisciplinary teams. They are currently in
charge of a variety of design and construction projects in the UK and worldwide. The
participant is an architectural assistant that is currently working at the practice.
Teams, Technologies and Tools: The firm is divided into teams and sub-teams which have
specialists from a wide range of disciplines. This includes architects, structural engineers,
artists, geometry specialists, aerospace engineers, environmental engineers, programmers,
and model makers. The participant states that this interdisciplinary environment has a
significant impact on their work as a designer. In their previous work experience, they used to
spend most of the time struggling with different tasks to the extent that they barely found
time for design. In their current work, they have different specialists that can help in the
multiplicity and the complexity of the design tools and processes, which enables them to
focus more on their creative work. The firm has almost all the relevant software applications
to match the different needs, specialisations and cultures within the teams. The teams are also
supported by open source for training and skill development. In addition, the 3D printer is
essential and it is used in the various stages of the design process for several purposes.
Processes and workflows: During the ideation and conceptualisation stages of the design
process, the software applications are not used to generate and communicate design ideas.
Instead, they rely on freehand sketches and rough models. Besides, the BIM specialists and
parametric modellers do not intervene until the concept design is achieved. At the end of the
conceptual design stage, the design team provides a model to be approved, and this is when
the BIM specialists start to develop their own model, based on the conceptual model, and
then, they start to integrate into the design team in order to guide the team throughout the rest
of the design process. The BIM team normally provide a Revit model as, in most of the
projects, the Revit model is part of the agreement with the client which might rely on this
BIM model for the facility management during the operational phase of the building
lifecycle. According to the participant, relying on methods developed from previous projects
does not seem to be part of the culture of the firm. Instead, they believe that designers should
be creative in every single project and to rethink the design solutions from scratch for every
problem, rather than having something ready to use. They state that it is just the experience

175
and knowledge that an architect gains from a project that could be taken forward and fed into
subsequent projects.
Adaptation of Tools: The company is provided with a whole team of software developers,
programmers and scripting specialists which support the different teams including the design
team in developing software applications to match the specific requirements of each project.
When it comes to complex and large scale projects, the software developers work with the
design team side-by-side throughout the design process to manage the tools, in order to
reduce complexity by making applications more efficient, and fit for the project purposes.
According to the participant, the development of tools normally takes place within the project
context. Moreover, due to the wide range of software applications and other digital
technologies used in the firm, the software development team are in charge of continuously
enhancing the interoperability between different technologies used in order to provide the
seamless flow of data and other information across different applications. In this regard, the
participant insures that they did not experience any interoperability issue throughout their
two-year experience in the firm.
Collaboration: The way in which the design team collaborate with other project
stakeholders, and the type of shared material may differ based on the design stage and based
on the other participants involved in the project. For instance, at the early stages of design,
they collaborate mainly through meetings and discussions, while during the later stages, the
design team start sharing drawings and models with other disciplines, such as the structural
engineering team. In some projects, the design team interact with external teams specialised
in providing intelligent models. In this case, the design team sends the design model to the
external team, who updates the model and provides feedback. The design team respond to the
feedback and send the modified model again, and the loop continues until the model is
approved by all parts.
3.2 Case Study 2: Collaboration and Interoperability in Practice
This case study relates to a software development firm located in USA. The participant is an
architect holding the position of the head of the application engineering team. The firm is an
interdisciplinary firm which consists mainly of a mix of experienced software developers and
building professionals. They are in charge of developing an online platform, which is a data-
rich, collaborative platform for teams of architects and engineers working together in
building projects. The platform contains a wide range of simple and lightweight software
applications dedicated to enhancing interoperability between popular software applications
used in the current architectural practice and building industry.
Teams, Technologies and Tools: The firm is divided into departments and teams, such as
the design department, the business development team, and the product development team. In
addition, there are teams for geometry, infrastructure, and data management. The firm
develops its software mainly on top of popular software applications, such as Revit,
Grasshopper, Excel, AutoCAD, and 3DS Max. For instance, the platform contains plug-ins
that are dedicated for interoperability. These applications enable direct and real-time data
transfer between MS Excel and Rhino-Grasshopper, between Revit and Grasshopper, and
from Revit to Excel. The platform also includes a wide range of bespoke applications; some
of them contain just few commands, or even one single command so that the data can be
generalised into a simple, light-weight format that could seamlessly be transferred across

176
different project platforms. The online platform does not have a central database as they do
not aggregate data. Rather, they link their users to existing databases. For instance, the
platform has an application that enables designers to access project site maps to then select a
region that contains the building site and its surrounding. The application automatically
generates a 3D model of the surrounding buildings with their real heights. To do this, the
platform does not contain any maps or information about the height of each building, but
rather, it links users to OpenStreetMap website that contains this sort of information. This
same application can also automatically achieve the topographical survey of the site by
linking users to the NASA website that contains the contour lines of most parts of the USA.
Processes and Workflows: The application engineering team interfaces with professionals
from the AEC industry in order to identify potential opportunities where the firm can assist.
In addition, the team leader interacts with their teammates as well as with other teams and
departments within the firm in order to expose the information that their team generates, and
expose it to the necessary members. This working process allows the firm to maintain
continuous improvement and development of its tools in order to respond to the rapidly
evolving industry. From the user perspective, the online platform allows users to export any
sort of data or shape into a cloud-based environment that contains the main files so that
multiple users can exchange data and geometry by a click of button. They normalise data into
simple and lightweight elements, send it over to the platform and then other participants in
the project team can recall the necessary data from the platform without the need to upload,
send and then download the whole blocks of data as described in the previous case. This
novel strategy of data sharing increases effectivity and efficiency in working processes as it
can significantly minimise the waste of time by enabling users to get only the necessary data
in the desired way and time. It also allows participants to minimise both the large file storage
and complexity in working processes, which are resulted from the saving of different versions
of the same file on different platforms.
Collaboration and Interdisciplinarity: The firm is a highly collaborative and
interdisciplinary work environment. In fact, collaboration is an essential part of their culture,
and enhancing collaboration in the AEC industry is in the core of their role. The different
members at the firm interact intensively with one another. In addition, they support
interdisciplinary teams in the building industry with developing new collaboration methods in
their practice. This collaboration is supported on different levels. At the enterprise level, they
provide a cloud-based system and tools that allow different participants in a building project
to share data and transfer different sorts of information seamlessly. At a wider level, they
make their design tools available online for the users themselves to develop their own tools
collaboratively on top of the existing applications, which appears to be collaboration on a
global level. Furthermore, the firm tends to be highly collaborative with other software
developers. For instance, they have an open line of communication with large software
vendors, such as Autodesk and McNeels, whereby they continually talk about opportunities
where they can collaborate.
Future and Ambitions: Flux believes that their teams are not just providing intelligent tools
for practitioners to utilise, but rather, are changing the way buildings and cities are being
designed and constructed. In this regard, Carlile (2014) (a software developer at the firm)
provides a series of inspirations for the development of architectural design methods. She
argues that architects should learn from the way ‘mother nature’ generates trees from a seed.
Hence, they should start thinking of developing building seeds, rather than repeating the same
process again and again for every single project. She also urges architects and builders to

177
learn from the software industry, where the applications are shared for different participants
to build their tools on top of the existing applications, rather than starting to develop a
separate application from scratch.
4. DISCUSSION
Based on links between analyses of the computational design theory and the computational
design methodologies applied in the current practice, this section will link the theory and
practice to identify the potential impact of computational design, and how this link can help
in developing innovative and more effective digitally-based strategies in architectural
practice.
4.1 Enhancing Collaboration on Different Levels
Collaboration is inevitable when highly-advanced digital technologies are utilised due to the
increasing complexity of these technologies and the need for various areas of specialisation to
manage this complexity. According to the practitioners, collaboration in architectural design
process has proved a high level of efficiency in tackling design problems, and in coordinating
different experiences involved in the design process. The case studies reveal several levels of
collaboration. At the enterprise level, different members and different teams rely on digital
tools to share ideas and information from the earliest stages of the design process, and
continuously throughout the whole project within interdisciplinary teams. In addition, the
case studies reveal potential collaboration at a global level, where some practices make their
tools and processes available online for users to benefit from, and to build on top of the
existing tools, and hence contribute to the evolution of those tools and processes. In between
those two levels, there could be collaboration at the organisational level whereby
organisations, such as RIBA (Royal Institute of British Architects) or AIA (American
Institute of Architects), provide updated standards and regulations, and create database and
digital libraries of data for all practices to benefit from. Hence, developing strategies for
collaboration at all its levels should be one of the main priorities on any practice that focuses
on technology and development.
4.2 Paradigm Shift in Design Processes
Belshaw (2012) provides an interesting comparison between the rendering of images in the
past and in the present, in order to explain how processes are approached in the recent digital
age. Traditionally, a rendering program produces the image in a linear sequence by starting
from the upper line of pixels at the top of the image down to the bottom. In this case, the
designer might spend significant time watching the top part of the image which is often just a
sky. In such a situation, any mistake that might be found in the rendered scene will only be
explored very late when the rendering is almost finished. This can be cumbersome and
extremely time consuming. However, in the recent versions of the same programs, the render
starts by showing the whole image from the beginning, but in a low resolution and with fewer
pixels, and as the render progresses, the image starts to get clearer by gradually increasing
pixels. This has a great potential as it allows designers to capture any mistake very early
within the render time, as this scenario enables designer to view the end result from the first
stage. It is this comparison that can perfectly illustrate the paradigm shift in computational

178
design processes. In the conventional design process, the end results of the design are seen
very late in the process, as designer used to communicate with structural engineers and other
participants in a project very late in the design process when the design is well developed and
close to completion. In this case, any problems found or any changes required might be very
expensive and time consuming (Mueller, 2011; Turrin et al., 2011). The new modelling
techniques are allowing the integration of several kinds of performative criteria into the
conceptual design stage, so that any problem can be tackled much earlier in the process.
4.3 Complexity vs Simplicity (Simplexity)
The concept of complexity within computational design processes is tricky to a certain level.
Many authors argue that digital technologies are resulting in increasing complexity in design
(Kocaturk, 2013; Kolarevic, 2004; Oxman, 2006; Whitehead et al., 2011). In fact, the
opposite can be true in certain situations. For instance, parametric design allows exploring a
variety of design possibilities simply by manipulating parameters or moving sliders. It can
also provide automated structural analysis and optimisation. Similarly, BIM allows a
seamless flow of information and automatic update for associated items. These examples
show how some activities within the design process can be simplified when technology is
adopted. However, there are still some aspects in the design process that seem to become
more complicated such as the coordination of different design and engineering platforms. In
general, as the participant in the second case argues, complexity is a matter of understanding;
things remain complex until we understand them and when we understand them, they become
simple. Therefore, a design practice should develop strategies in order to explore different
aspects of complexity and increasing the level understanding for the new methods and tools.
This will allow the evaluation of the missing skillsets for training, which is similar to the
strategy that the architectural firm in the first case is adopting. Furthermore, as complexity is
about understanding, there should be a change in the architectural programs at universities in
order to improve the understanding of the different features of computational design. Thus,
enhancing collaboration with academic organisations is a highly effective strategy to reduce
complexity in design processes.
4.4 Inspiring Processes from Nature
The new digital technologies have enabled architects to go beyond Cartesian grids and
Euclidian spaces (Kolarevic, 2004) by developing habitats similar to those of nature
(Bhooshan, 2016). However, the processes undertaken in designing such habitats have no
relation to nature. Later in time, new ideas started to emerge that discuss the possibility of
developing design processes that are similar to the natural processes of generating and
growing forms. In other words, the focus is shifting from simulating natural forms, to
simulating the natural formation processes. In this regard, the term ‘building seed’ is
suggested where designers tend to develop building seeds that can be planted to grow
different buildings, rather than repeating the same design process for every single building
(Carlile, 2014; Mueller, 2011). Hence, the ‘building seed’ concept proffers a great potential
in architectural design as it can enhance sustainability in design process, and it is quite useful
for any architectural practice to orientate their research to allow the development of ‘building
seeds’ so that in an architectural practice, there could be a library of seeds which can be
developed either by independent research based on design experiments and software
development, or through the accumulation of experiences and knowledge acquired from

179
different projects. The seed itself can continue to be developed over time so that, at the end,
we might end up having a super seed that can grow into any sort of building. In general,
observing nature, and learning from the way it generates forms and systems is a great
potential in developing new forms and new processes in design, especially when we already
have a variety of tools at hand that can support such kind of tendency, such as parametric
modelling and scripting.
4.5 Research and Development
Due to the increasing complexity and rapid evolution of digital technologies applied in
design, the design process should be accompanied with research and knowledge acquisition
strategies. Case 1 reveals how some architectural firms rely on research in developing their
designs tools, and methods, and how research can be conducted either independently or
within a design project. On the other hand, in case 2, the concept of designing building seeds
rather than single building was discussed, and the idea of creating a library of seeds to be
used in different projects was suggested. This idea can make more sense if the library is
shared online and open to the public. Therefore, instead of developing the library based on a
handful of members in the internal teams, a much wider range of participants from all over
the world would continuously contribute to the development of the building seeds; hence,
they might come up with smarter and more efficient seeds. Such an innovative strategy is not
new, as similar strategies can be found in the web industry, especially after the emergence of
web 2.0, which allows users themselves to upload their material and create the content of the
website themselves (Barnes & Tynan, 2007; Thomson, nd). This sort of interactivity on an
extremely wide range of communities has resulted in a radical grow of different websites,
such as Wikipedia, YouTube, and Twitter. Similar strategies can be seen in the current
software industry, as most of the design-related software providers make their tools available
for other programmers and software developers, such as the firm in Case 2, to develop their
tools, applications and plug-ins based on existing applications. This is resulting, as discussed
in Case 2, in developing highly effective collaborative design methods that can save time and
effort allowing designers to focus on their creative work, rather than managing complexity in
the design process. In this context, architectural practitioners should consider adopting a
similar strategy if they wish to have similar results. They need to inspire ideas, processes and
developmental strategies from other disciplines, and try to adapt them to their profession.
5. CONCLUSION
The paper has shown the impact and potential of digital technologies in developing
innovative strategies in architectural practice, such as enhancing collaboration and
interdisciplinarity on several levels, observing nature and learn from its processes, focussing
on research, and inspiring developmental ideas from the web and software industry.
However, the aspects discussed in this paper do not seem to be representing clear cultural
shifts in architectural design process. In fact, the rapid evolution of digital technologies
applied in architectural practice have enabled the development of novel design approaches
that take full advantage from those digital technologies, such as the processes driven by
parametrics, genetics, algorithms and scripting. These approaches are beyond the scope of
this research, and they need to be discussed in further research if we are to identify the
cultural shifts in the design process. This paper has set the foundation for such research,
which can rely on the outcomes of this paper in identifying how those novel design

180
approaches can enhance collaboration, interdisciplinarity and automation in architectural
design process, and hence, resulting in paradigm shifts in the architectural design process and
new models in design thinking.
6. REFERENCES
Bernal, M., Haymaker, J. R., & Eastman, C. (2015). On the role of computational support for designers in
action. Design Studies, 41, 163-182.
Bhooshan, S. (2016). Upgrading Computational Design. Architectural Design, 86(2), 44-53.
Carlile, J. (Writer). (2014). KeenCon 2014: Using Data to Improve the Built Environment.
Ceccato, C. (2010). Rapid practice expansion through strategic design computation. In T. Kocaturk & B.
Medjdoub (Eds.), Distributed Intelligence in Design (pp. 201). Chichester, West Sussex: Wiley-Blackwell.
CRAB. (2003). Kusthaus Graz. Retrieved from http://www.crab-studio.com/kunsthaus.html
De Kestelier, X. (2013). Recent Developments at Foster+ Partners' Specialist Modelling Group. Architectural
Design, 83(2), 22-27.
DeLanda, M. (2016). Parametrising the Social. Architectural Design, 86(2), 124-127.
Eastman, C., Eastman, C. M., Teicholz, P., & Sacks, R. (2011). BIM handbook: A guide to building information
modeling for owners, managers, designers, engineers and contractors: John Wiley & Sons.
Eynon, J. (2016). Construction Manager's BIM Handbook: John Wiley & Sons.
Foster+Partners. (2013). Foster + Partners. Retrieved from
www.youtube.com/user/FOSTERANDPARTNERS1
Franken, B. (2003). Real as data. Architecture in the digital age-design and manufacturing, Spon Press, New
York and London, 122-138.
Garber, R. (2014). BIM Design: Realising the Creative Potential of Building Information Modelling: John
Wiley & Sons.
Glymph, J. (2003). Evolution of the digital design process. Architecture in the Digital Age: Design and
Manufacturing. Op. cit, 102-120.
Hesselgren, L., & Medjdoub, B. (2010). Interview with Lars Hesselgren, Director PLP Research. In T. Kocaturk
& B. Medjdoub (Eds.), Distributed Intelligence In Design (pp. 247). Chichester, West Sussex: Wiley-
Blackwell.
Holzer, D. (2015). BIM and Parametric Design in Academia and Practice: The Changing Context of Knowledge
Acquisition and Application in the Digital Age. International Journal of Architectural Computing, 13(1),
65-82.
Jones. (1969). The state of the art in design methods. Design Methods in Architecture. London: Lund
Humphries.
Katz, N. (2010). Algorithmic modelling, parametric thinking. In T. Kocaturk & B. Medjdoub (Eds.), Distributed
Intelligence In Design (pp. 213). Chichester, West Sussex: Wiley-Blackwell.
Kocaturk, T. (2013). Emerging Socio-Technical Networks of Innovation in Architectural Practice. International
Journal of Architectural Computing, 11(1), 21-36.
Kocatürk, T. (2006). Modelling collaborative knowledge in digital free-form design: TU Delft, Delft University
of Technology.
Kocaturk, T., & Kiviniemi, A. (2013). Challenges of Integrating BIM in Architectural Education.
Kolarevic, B. (2004). Architecture in the digital age: design and manufacturing: Taylor & Francis.
Lawson. (2011). Of Sails and Sieves and Sticky Tape. In T. Kocaturk & B. Medjdoub (Eds.), Distributed
Intelligence In Design (pp. 1-15). Chichester, West Sussex: Wiley-Blackwell.
Mitchell, W. J. (2005). Constructing complexity Computer aided architectural design futures 2005 (pp. 41-50):
Springer.
Moneo, R. (2001). The Thing Called Architecture. Anything. New York: Anyone Corporation, 120-123.
Mueller, V. (2011). Distributed Perspectives for Intelligent Conceptual Design. In T. Kocaturk & B. Medjdoub
(Eds.), Distributed Intelligence in Design (pp. 16-26). Chichester, West Sussex: Wiley-Blackwell.
Oosterhuis, K., & Boer, S. (2004). Architectural parametric design and mass customization. Paper presented at
the 5th European Conference on Product and Process Modelling in the Building and Construction Industry-
ECPPM.
Oxman, R. (2006). Theory and design in the first digital age. Design Studies, 27(3), 229-265.
doi:http://dx.doi.org/10.1016/j.destud.2005.11.002
Penttilä, H. (2006). Describing the changes in architectural information technology to understand design
complexity and free-form architectural expression: ITcon.

181
Thomsen, M. R., Tamke, M., Gengnagel, C., Faircloth, B., & Scheurer, F. (2015). Modelling Behaviour: Design
Modelling Symposium 2015: Springer.
Whitehead, H., de Kestelier, X., Gallou, I., & Kocatürk, T. (2011). Interview with the Specialist Modelling
Group (SMG)-The Dynamic Coordination of Distributed Intelligence at Foster and Partners. In T. Kocaturk
& B. Medjdoub (Eds.), Distributed Intelligence In Design. Chichester, West Sussex: Wiley-Blackwell.

182
ID 129
MANAGING CHALLENGES TO LOCAL CULTURE IN
CONSTRUCTION: PRESERVING ARCHITECTURAL IDENTITY IN
THE CITY OF BASRA
H. Samir1, C. Trillo1 and A. Toriello2
1School of the Built Environment, University of Salford, Salford, M5 4WT, UK 2 Ministry of Cultural Heritage and Activities, Italy "La Sapienza" University of Rome, Italy
Email: [email protected]
Abstract: Preserving Cultural Heritage as a tangible expression of the collective memory of
society is paramount to ensure the continuity of local culture in the field of construction and
more in generally to preserve its identity. Unfortunately, over the past decades, the Iraqi-built
environment, and especially the traditional architectural heritage, has been deeply affected by
three wars, which challenged the cultural memory of the people and of the younger
generations in particular. This research considers Basra as a pilot case study to investigate the
features of the Iraqi architecture. Drawing from the selected case study, the findings from the
paper are that Basra is losing its local architectural identity due to a variety of factors. As such,
the aim of this research is to develop a guideline framework to steer the preservation of the
city’s identity, complementing this conservationist approach with a more constructivist-
oriented perspective by assessing how the local population currently value its tangible cultural
heritage and by recommending how a framework may be operationalised within the socio-
cultural context.
Keywords: Cultural Heritage, Basra, Iraqi Traditional Architecture, Guideline Framework.
1. INTRODUCTION
One of the main cultural instruments to understand the progress from the past to the future is
architecture, which is regarded as an educational instrument apt to improve the knowledge of
people in regard to the heritage within their environment (Abel, 2000). There is no doubt that
cultural heritage can be considered as the richest source for identity. According to one of its
definitions, heritage represents all the styles and traditions transmitted over time from the old
to the young generations and hence reflecting their collective identity. Losing the historical
monuments will result in a disconnection between the future generations and their history
because the lack of knowledge of their cultural heritage would lead to a weakening of their
identity. Since identity is a phenomenon, architecture is part of this phenomenon, therefore
any transformation undergone by buildings and places will undoubtedly have an impact on
the local identity (Abel, 2000).
Iraq can be regarded as one of the main centres in the world for archaeology: it has around
7000 archaeological sites according to the 'Guide to Archaeological Sites' issued by the Iraqi
government in 1970 (Fethi, 1977). It has a long history that extends back to Antiquity,
therefore it owns an extremely rich cultural heritage. It was the cradle of many civilisations of
ancient Mesopotamia such as the Sumerian, the Assyrian, the Babylonian, the Akkadian and
the Abbasid. Accordingly, the monuments of these ancient civilisations can still clearly be
seen all over Iraq. Some of these sites and monuments are within the urban areas, thus facing
serious dangers concerning the development processes of these areas along with other threats
such as wars and neglect (Fethi, 2007). Moreover, the use of bricks made of clay rather than

183
stone, due to the rarity of the latter in the Mesopotamian area, is another threat to the
preservation of its architectural heritage, given the more perishable nature of such material.
The historic cities regard as the most prominent monuments which still extant and reflect the
traditional heritage, in particular, the traditional neighbourhoods, which are the cores of the
present cities. However, rapid development poses a serious threat to these cores because of
the growth of the commercial areas within them, occurring to the detriment of the residential
areas. Many of these heritage areas and neighbourhoods still represent the core of the main
cities of Iraq such as Baghdad, Mosul, Kirkuk, Najaf, Arbil, Karbala, Samarra and Basra as
well, to the extent that many people still live within these historical areas (Polservice, 1972).
2. HISTORICAL BACKGROUND OF BASRA
The city of Basra has a long history that can be traced back to the time of the illustrious
Babylonian king Nebuchadnezzar (605 – 562 B.C.), as ruins were found of a city named
“Tridon”, located to the south of the town of Al Zubair - in the present metropolitan area of
Basra - and dating back to his rule. (Al-Muzaffar, 1988). More than a thousand years later, in
635 A.D., the Muslims founded Basra, which was, therefore, the first Islamic city established
by Muslim Arabs outside the Arabian Peninsula. The city has gone through several stages
since its foundation (Bazi, 1989).
In the first stage, Basra was an outpost where soldiers would spend the winter or retreat after
the fighting, hence a military encampment made of tents rather than a city with proper
buildings. In the second stage, a mosque, a principality house, a prison and houses for the
soldiers were built by using the reeds available in the area. Later on, a large fire swept
through the settlement and destroyed it. In the third stage, starting from circa 635 – 637 A.D.,
the structures of the religious, administrative and civic buildings began to change thanks to
the adoption of materials such as wood, clay and mud. The mosque and the principality house
were entirely rebuilt with them (Al-Ali, 1988).
The next important stage is the Ottoman occupation, that started in 1534 A.D., and can be
subdivided into two periods: the first, which lasted until 1859 A.D. and was characterised by
disorders, excessively centralised control of the land and its use and by the incompetence of
the rulers; the second, coinciding with the office of the Wali of Baghdad, Midhat Pasha,
which was, on the contrary, devoid of conflicts and instability. In this period, plots of the land
of the emirate of Basra were made available to the population for the purpose of construction,
so that the city was brought to a new life. Due to organisational purposes, a municipality
office was established in addition to the security office, which encouraged people to
immigrate to Basra. During the British occupation, the Wilayah of Basra divided it in three
“Liwas” (that is “banners”, a type of administrative division): Al Mintifig, Al Amar, and Al
Basra (Darraji, 1989). Basra is the only maritime port in Iraq. It is also regarded as an
important industrial centre of nationwide relevance, and it is of no less importance in
agriculture, due to the presence of many palm trees in its area. It is also rich in minerals, as its
subsoil contains the largest deposits and wells of oil in Iraqi (Alwan, 1999). In fact, its
reserves of oil and natural gas are the largest in the world.

184
2.1 The Architectural Identity of the City of Basra
The city of Basra has a long history rich in culture and an identity clearly distinct from that of
the other Iraqi cities so that it has often been defined the most beautiful city of Iraq (Al-
Samarrai, 2002). Basra used to be the jewel of the Arab Gulf, where trade brought wealth and
wellbeing. It was a city of poets and intellectuals, who mingled with foreigners and traders. It
had many beautiful buildings and was traversed by many canals, a very specific feature of
Basra, to the extent that it was dubbed the “Venice of the East” (Alwan, 1999), Figure (1).
Many factors have influenced the architectural identity of the city of Basra such as history,
topography, climate and traditions. The characteristics of the Arabic Islamic city have
obviously played a key role in the formation of the city’s identity. Basra owned a unique
feature that distinguished it from the other Iraqi cities due to its strategic location on the
Arabian Gulf, which gave it the opportunity to cross-pollinate with other civilizations by
means of the contacts allowed by trade (Al-Ali, 1988).
Figure 1 The city of Basra “Venice of the East”
The city was characterised by its natural sources and its unique topography, represented by a
grid of canals and, in its environs, a wide marsh in the north, the desert in the east, date palm
forests, covering large areas in the south, and the river, the “Shatt al Arab”, to the west
(Musabeh, 1990). This topographical diversity had a huge impact on the formation of the
city’s architectural identity.
Basra had a unique traditional urban fabric, which consisted of clusters of adjacent houses
oriented towards their interior courtyards, resulting in an organic layout of winding, narrow
alleys which formed according to the location of the houses and the relationships between
them, aimed at providing solutions for the climate and other social requirements of the local
society (Jaber, 1996). This fabric was characterized by marvellous architectural elements,
which constituted the city’s unique and valuable heritage (Al-Ali, 1988). The cultural aspects
of Basra’s community have played a significant role in the formulation of the characteristics
of the city, and this was clearly reflected on its productions, including the city’s architecture
and planning (Bazi, 1989). The formation process of the city has been determined by many
factors such as the building materials, Islamic philosophy, and the Arabic lifestyle, which

185
entails specific habits, traditions and ethics. The varied demographic composition of Basra
and the connections with other civilisations due to its nature of trading port led the city to
develop a uniqueness, albeit now lost, still largely present in the memory of its residents (Al-
Muzaffar, 1988).
The planning of the city of Basra was the first experience of urban planning in the Early
Islamic Age. The location of the mosque was in the centre of the city with the house of the
governor and the treasury house, then the market was built around the mosque, and in
direction of the mosque all the streets and alleys were oriented (Al-Ali, 1988). Basra’s city
centre consisted of two areas until 1935: the Ashar area, which was characterised by the
linear central pattern and grid plan fabric, and the area of old Basra, whose organic urban
fabric was characterised by the radial central pattern (Al-Samurai, 2002). The urban fabric of
Basra’s city centre, between 1935 and 1962, extended eastwards, in the direction of the Shatt
al Arab, northwards in the direction of the al Maaqal area, southwards in the direction of the
Abu al Khasib, and westwards in the direction of the old city of Basra. A second expansion
took place between 1962 and 1987, and was interrupted to the north by the Garmat Ali River,
to the south by al Sarraji River and the palm forests in Abu al Khasib, to the east by the strip
along the Shatt al-Arab, and to the west by the Shatt al-Basra (Alwan, 1999).
2.2 The Crisis of Basra’s Identity
Iraqi cities, in general, and the city of Basra, in particular, have not received enough attention
in the studies that discuss identity and architecture. However, Basra and many Iraqi cities
have undergone a significant social, economic, political and cultural change, which caused a
dramatic urban transformation within the local urban built environment (Al-Ali, 1988). The
modernisation the affected the city has not taken into account the local conditions such as
traditions, habits, the climate and the characteristics of the place: the history of the city has
been ignored. Furthermore, the wars that took place in Iraq in 1980 - 1988, 1991 and 2003,
can be seen as the definitive historical moments that changed the city of Basra from a
cultural, social and also architectural point of view. All the aforementioned factors have led
to the loss of the identity of the city (Samir, 2015). Basra was under the attack of the bombs
and the grenades for much of the 1980-1988 war and then again in 1991 and in 2003. Its
unique architecture has disappeared slowly since, as the old buildings have deteriorated due
to the lack of the necessary maintenance, as in Figure (2). The absence of awareness from the
local population has contributed to a transformation of the local identity, which took place
unconsciously within the society and resulted in an extensive modification of the local built
environment of the city of Basra.

186
Figure 2 The destruction of Basra’s heritage.
Many external and internal factors have threatened the identity of Basra on many occasions
during the twentieth century, transforming, distorting or obliterating it. The external factors
are those pertaining the Ottoman occupation and the ensuing British colonisation, the
modernity movement and finally the globalisation. The internal factors are mainly the
policies of the previous governments and the three great wars of the last decades which
affected negatively the society of the city and its demography. Most of the architectural
landmarks of the city have disappeared as a result of the destructions occurred during the
wars or due to the neglect and lack of maintenance that the city suffered during the time of
the UN sanctions against Iraq, from 1990 to 2003.
The worst happened after 2003, with the arrival to Basra of foreign investment companies
that implemented several kinds of projects in several fields. As to architecture, the designs of
the project of these companies were foreign and alien, because they were carried out
according to their cultural background. They, thus, ignored the history and the identity of the
city, nor did they take into account the culture, traditions and values of Basra's society. They
were far from the city soul, and represent a significant risk which could threaten both the
architectural and, more in general, the cultural identity of the city (Samir, 2015).
3. MODERNITY IN IRAQ
Modernity is the period of the new. It is what gives the present the specific quality that makes
it different from the past and points the way toward the future (Berman 1994). Modernity
could be described as a break with the traditions and a refusal of the legacy of the past. It
looks like a selection process of foreign elements and concepts imported from different
environments. According to Habermas, Modernity is a phenomenon that entails different
forms with multiple meanings which aim at discovering a new world (Afaya, 1998).
In relation to architecture, the term “modernism” refers to a "new" work which distorts the
relations and rules that connected to traditional knowledge (Stern, 2009). According to
Berman (1994), modernity is a discontinuation or modification of the past, a mode of power

187
through new forms of self-consciousness of the human. For Ibeling (1998), the aim of the
new modernity is to use programmes to construct buildings without any consideration for the
context, either the time or the place, and to create a comfortable environment by only using
technology, refusing any aspect of the cultural background. The ideology of modernity deems
as no longer effective the concept of neighbourhood as a coherent relationship between
residents and between families, since the hierarchy of the spaces within the neighbourhood
was broken as soon as the pattern of rigid boundaries, inherent in the gridline plan, was
adopted in the contemporary design of the neighbourhood (Abd-Elmonem, 2011).
According to Al-Wardi (1988), the impact of modernity in Iraq can clearly be seen in the
change of the society’s structure, as the social interaction between neighbours and friends
have decreased, most of the extended families have become nuclear families and, more in
general, the family size has reduced. The social interaction between people has dramatically
changed, the relationships between people have become limited because of the disappearance
of the social spaces that served for this purpose (AL-Mullah, 1988).
The modernisation of Iraq took place starting from the early twentieth century with a large
expansion of the cities, mainly the three major ones: Baghdad, Mosul and Basra. In parallel
with this expansion, these cities were affected by formal transformation as well. Al-
(Sultany,1982). Consequently, there were three different architectural styles for each city: the
traditional style, in the old centre of the city; the colonial style, in the area surrounding it; a
modern style, in the more recently built areas (Al-Rahmani, 1986). All the development
processes of Iraqi cities have been implemented by foreign architects, despite the presence of
many qualified Iraqi architects (Bernhardsson, 2005).
The main features of the traditional style are the narrow and winding paths, the courtyard
houses, the ornamented façades, and the common use of the local materials and the
volumetric homogeneity of the clusters of buildings, which have only one or two floors. On
the contrary, the colonial style introduced during the British invasion of Iraq at the end of the
First World War is characterised by straight and relatively wide roads, external columns on
the façades, construction of a roof cover over existing internal courtyards, houses with a front
garden, and other buildings with several storeys. The impact of western culture is very clear
in the modern style, which is characterised by detached or semi-detached houses, wide
streets, and disappearance of the courtyards, use of unfamiliar materials and a general lack of
volumetric homogeneity due to the different heights of the buildings (Al-Sultany, 1985).
4. THE METHODOLOGY
Since the paper focuses on the identity of traditional architecture in Iraq, in general, and in
Basra, in particular, the research methodology of the paper adopted a case study, Basra,
selected as a pilot study. A mix-method approach was followed in this study in order to
identify the main features of the city’s identity and understand the threats posed to its
continuity. The research strategies include a semi-structured interview which has been
conducted with professionals, in addition to a questionnaire survey with householders within
three neighbourhoods.
The three neighbourhoods chosen are; old Basra, Ashar and Al-Jazair. The selection of these
neighbourhoods was carried out according to an architectural pattern for each of them. Each
neighbourhood has an own architectural style which distinguishes it from the others because
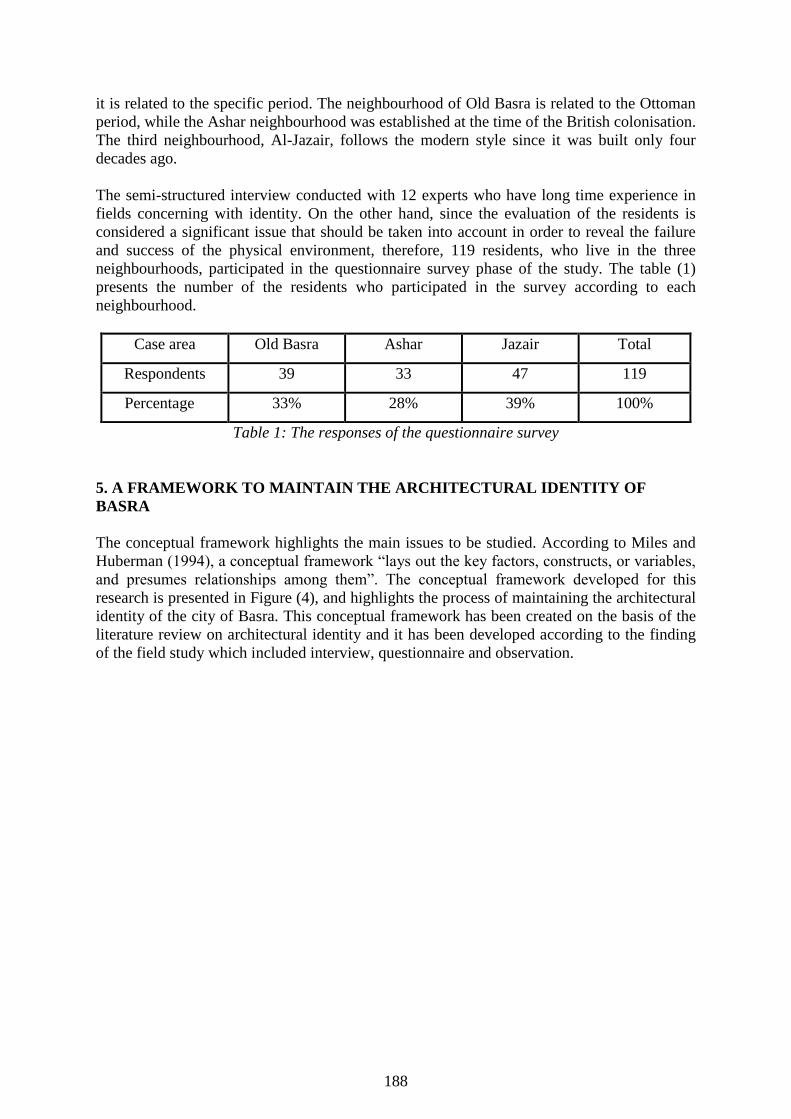
188
it is related to the specific period. The neighbourhood of Old Basra is related to the Ottoman
period, while the Ashar neighbourhood was established at the time of the British colonisation.
The third neighbourhood, Al-Jazair, follows the modern style since it was built only four
decades ago.
The semi-structured interview conducted with 12 experts who have long time experience in
fields concerning with identity. On the other hand, since the evaluation of the residents is
considered a significant issue that should be taken into account in order to reveal the failure
and success of the physical environment, therefore, 119 residents, who live in the three
neighbourhoods, participated in the questionnaire survey phase of the study. The table (1)
presents the number of the residents who participated in the survey according to each
neighbourhood.
Case area Old Basra Ashar Jazair Total
Respondents 39 33 47 119
Percentage 33% 28% 39% 100%
Table 1: The responses of the questionnaire survey
5. A FRAMEWORK TO MAINTAIN THE ARCHITECTURAL IDENTITY OF
BASRA
The conceptual framework highlights the main issues to be studied. According to Miles and
Huberman (1994), a conceptual framework “lays out the key factors, constructs, or variables,
and presumes relationships among them”. The conceptual framework developed for this
research is presented in Figure (4), and highlights the process of maintaining the architectural
identity of the city of Basra. This conceptual framework has been created on the basis of the
literature review on architectural identity and it has been developed according to the finding
of the field study which included interview, questionnaire and observation.

189
Figure (3) The main dimensions and factors that influenced the Basra City Identity
5.1 The First Stage
The first stage was developed through the review of the literature and involves the
identification of the main dimensions that had an influence on the formation process of the
architectural identity of the city of Basra, as well as its impacts on the transformation process
of the identity which has occurred and is still occurring in the city's architecture. The six
dimensions identified are; social, environmental, economic, political, cultural and religious.
Each of these dimensions involves several factors, as clarified in Figure (3).
Simulation
Simulating the traditional architecture through imitating the heritage and historical elements
and forms via copying or metaphorisation, in order to root these components and their
meanings into the collective memory of the local society.
Location
Social
Environmental
Privacy Safety Interaction Familiarity
Climate Material
s
Orientation
Laws &
Legislation
Plans
Belonging
Resistance
Technology
Awareness
Investment
Unity
Architectural identity
Diversity
Development Reference
Dominanc
e
Occupation

190
Abstraction
It could be achieved by abstracting historical and heritage elements or concepts and
transforming them into modern forms, by focusing on these components’ outline, as they are
able to express traditional meanings in order to link the society with its past and authenticity.
Generation
It could be achieved by considering the heritage as the main source of the architectural
identity, thus generating new elements and forms from it. Therefore, this will result in a
harmony between the modern and the traditional buildings.
In regard to modernisation, there is a necessity of adopting appropriate instruments to guide
architects and urban planners to create a modern architecture style. The research suggests
three instruments, such as; Filtration, Adaptability, and Interpretation.
5.2 The Second Stage
The second stage is based on the responses from the interviewees and the householders: to
achieve the aim of the study, the conceptual framework focuses on two main issues: firstly,
on how traditional identity can enable modernisation, secondly, on how to deal with
modernisation considering the preservation of the traditional identity.
Regarding traditional architecture, in order to maintain the local identity, which is reflected
via the traditional architecture, a set of instruments should be taken into consideration by the
architects when they design new buildings, as follows.
Filtration
It can be achieved through the process of filtration of the global architectural products by
classifying them and choosing appropriate architectural elements, forms, relations and
materials on the basis of their suitability for the local environment, according to the social
culture and the climate of Basra.
Adaptability
It can be achieved by adopting but also modifying the appropriate elements of global
architecture so as to render them closer to concepts that are already familiar with the local
environment, as they already exist in the collective memory of the residents.
Interpretation
It can be achieved by reinterpreting a number of modern architectural forms and elements by
giving to them new meanings tied to those rooted in the collective memory in order to render
them familiar to the local people.

191
5.3 The Third Stage
This stage is related to the results expected from the conceptual framework. The adoption of
instruments relating to modernisation will lead to the creation of a new architectural product
within a traditional form, which could preserve the local identity in the memory of the
residents. On the other hand, the adoption of instruments that derived from heritage and
history will lead to revive the traditional architectural product, although in a modern form so
as to enable modernisation.
On the basis of the approach outlined above, the expected final result of this conceptual
framework will be a modern local identity, harmonious with the new era but still rooted in the
past, as clarified in Figure (4).

192
Figure 4. The conceptual framework
Adaptability
Filtration
Interpretation
Simulation
Generating
Abstraction
Modernity to maintain traditional
identity
Traditional identity to
enable modernity
Social
Environmental
Economical
Political
Instruments to apply in
identity formation
process
Expected design output
Modern design in
traditional form maintain
identity
Traditional design in
modern
Form enabling modernization
Modern local identity
Religion
Cultural

193
6. CONCLUSION
The paper has offered a critical evaluation of the impact of modern and global architecture on
the architectural identity of the city of Basra. Undoubtedly, cultural heritage can be regarded
as one of the main sources for identity and its continuity. Iraq has a large number of
archaeological sites, which have led it to qualify as a centre of worldwide importance.
However, this heritage has suffered from decay and losses due to several factors such as wars
and neglect. In fact, the rapidity of the development and modernisation processes of the city
of Basra, especially after the three wars, posed a significant threat to the traditional areas of
the city and led to the loss of Basra’s identity.
The paper showed the significantly negative effect of the three wars of the past four decades
on the identity of the city of Basra, both architecturally and demographically. The
investigation of the three neighbourhoods that have been selected as case studies, was
dedicated to the impact of the modern and western architectural style on the Basra society.
The results finding indicates that there is a need to develop a framework to guide the
professionals to deal with both the traditional and the modern architectural styles, which
currently conflict within the urban landscape of the city.
The framework proposed in this study focused on the main factors that influenced the identity
formation process. Thus, it determined six main factors which are: society, environment,
politics, culture, economics and religion. In addition, it suggested a number of mechanisms
that can be used by professionals to lead traditional and modern architectural styles to
approach each other.
6. REFERENCES
Abd-elmonem, M. G. (2011). Understanding Everyday Homes of Urban Communities: The Case of Local
Streets (Hawari) of Old Cairo. Journal of Civil Engineering and Architecture, ISSN 1934-7359, USA, Vol.
5, No.11, (Serial nr. 48): 996-1010.
Abel, C. (2000). Architecture & Identity: responses to cultural and technological change. New York: Routledge.
Afaya, M. (1998). Controversial between Modernity and Communication. 2nd Edn, African East, Morocco, pp:
121.Affairs house, Baghdad, 1988.
Al-Ali, K, (1988), visual influences for architectural axes, applied model of the city of Basra, a special issue of
second engineering conference Iraqi, Ministry of Higher Education and Scientific Research, Journal of
Engineering and Technology, published by the University of Technology, Baghdad, Iraq.
AL-Mullah, Huwaish & Nouri, Aqil (1988), modern architecture in Iraq, Public Cultural
Al-Muzaffar, Abdul-Mahdi Selim. (1988). Modern Planning Practices for Urban Planning in Basra, Basra
Cultural Encyclopaedia, Basra University Press.
Al-Rahmani, S. F. (1986). Principle for urban renewal in Iraq: a study to develop town planning principles for
the renewal of the Iraqi cities with particular reference to Baghdad central area (Doctoral dissertation, PhD
Thesis, University of Manchester).
Al-Samarrai, A. W. (2002), "heritage architecture in Basra (destroy and revival), “Journal of Afaq Arabia,
issued by House of Cultural Affairs, Ministry of Culture and Information, Baghdad, Iraq, No. (3-4).
Al-Sultany, K (1982), “Architecture in Iraq between the Two World Wars, 1920-1940,” Ur:
Al-Sultany, K (1985), (modern architecture in Iraq), Journal of Arab horizons ,No (9).
Alwan, Mohammed Aziz. (1999). Architecture in Basra and its relation to the environment, Afaq Arabia, issued
by the General House of Cultural Issues - Ministry of Culture, Baghdad.
Al-Wardi, A. (1988). Social Glimpses in Modern Iraqi History, Beirut: Dar Ar-Rashed.
Bazi, H. (1989), reconstruction of the city of Basra, Basra folklore, cultural House, the Ministry of Culture and
Information, the Republic of Iraq, quarterly edition, No.3.
Berman, a (1994). The Configuration of Modernism. In: Preface to Modernism, Berman, A. (Ed.). University of
Illions Press, USA. ISBN: 0252021037, pp: 3-27.

194
Bernhardsson, M. T. (2005). Reclaiming a Plundered Past: Archaeology and Nation Building in Modern Iraq.
University of Texas Press.
Darraji, S (1989), fortifications of Basra city at Ottoman era, centre of revival of Arab heritage, Baghdad
University.
Fethi, I (2007), The Destruction of Arab Cultural Heritage submitted to the Conference on the Middle East, Aix-
en-Provence, France, 14-218.6.2005. Proceeding published in 2007, S.N. Librairie Orientaliste Paul
Geuthner, Paris, pp.155-167.
Fethi, I. (1977). Urban conservation in Iraq: the case for protecting the cultural heritage of Iraq with special
reference to Baghdad including a comprehensive inventory of its areas and buildings of historic or
architectural interest, PhD, Thesis, Vol. 1, The University of Sheffield, UK.
Ibelings, H. (1998). Super modernism: Architecture in the Age of Globalization. 1st Edn. NAI Publishers, USA.
ISBN: 9056620746, pp: 144.International Magazine of Arab Culture, 2-3.
Miles, M & Huberman, a (1994). Qualitative data analysis: An expanded source book (2nd edition).
Musabeh, Z, K. (1990). The rivers of Basra and its impact on urban architectural components of the city,
Engineering College, University of Technology.
Polservice, (1972). Comprehensive Development Plan for Baghdad 2000, Warsaw.
Samir, H. and Arayici, Y. (2015). The Influence of modern architecture in transforming Iraqi city identity.
Stern, R. (2009). The Doubles of Post-Modern. In: Architecture on the Edge of Postmodernism: Collected Essay
1964-1988, Stern, R.M.A. and C. Davidson (Eds.). Yale University Press, Yale, ISBN: 13: 9780300153972,
pp: 1-216.

195
ICT, TECHNOLOGY AND ENGINEERING

196
ID 037
EFFICIENT RE-DESIGN OF CONTINUOUS CONCRETE-STEEL
COMPOSITE BEAMS
M. Al-Shuwaili, A. Palmeri and M. Lombardo
School of Civil and Building Engineering, Loughborough University, Leicestershire, LE11 3TU, UK
Email: [email protected]
Abstract: Continuous steel-concrete composite beams are widely used in the construction
industry. The concrete slab is typically attached to an I steel girder by means of welded headed
studs, which however are susceptible to several problems and need special considerations at
hogging bending regions. In this paper, an efficient re-design for the steel I-shaped girders is
proposed. The width of the upper flange is reduced while the depth of the web is increased
which maintaining the same area of steel. The elongated web has perforations along its length
and penetrates the slab in such a way that allows the concrete to form concrete dowels and
thus achieve the required bond. A numerical study based on the plastic analysis of the
composite section is used to quantify the change in the bending capacity due to the proposed
type of connection, considering both cases of sagging and hogging moments. The results of a
comparative analysis between the proposed re-design and examples of designs taken from the
literature are also presented. The study demonstrates an increased moment capacity in both
sagging and hogging regions for the composite beams, with the possibility of fabricating more
efficient cross sections based on the actual bending moment diagram.
Keywords: composite beams, continuous beams, hogging moment, plastic design, sagging
moment.
1. INTRODUCTION
The combination of steel girders and concrete slab works very well in simply supported
composite beams (sagging moment) because concrete is efficient in compression and steel in
tension. Both concrete compressive strength and steel tensile strength, along with the
geometry of the composite cross section, determine the ultimate sagging moment capacity of
the beams. Compared to simply supported beams, continuous composite beams have been
used widely in multi-storey buildings and long-span bridges, owing to several advantages
such as reduced deflections and higher span to depth ratio (Liang, 2015). At internal supports
of continuous composite beams, however, the steel girders are under compression while the
concrete slab is under tension, causing a cracked section which does not contribute to the
ultimate hogging moment capacity. In addition, shear connectors embedded in cracked
concrete are susceptible to larger deformations due to the reduced strength and stiffness of
materials. For these reasons, the efficient design of continuous composite beams is more
challenging and different considerations in design are required (Vasdravellis et al., 2012).
1.1 Shortcomings of headed studs
The majority of composite beams use headed studs to achieve the bond needed for the
composite action between steel and concrete. However, researchers have identified several
issues associated with the use of headed studs (Rodrigues & Laím, 2014), such as the relative
vertical movement (slip). The latter increases the deflection, makes beams more vulnerable

197
against fatigue problems and reduces the composite action. Furthermore, in the design of
composite continuous beams in hogging regions, codes permit only complete bond between
steel and concrete (Liang, 2015). The connection through the web is sufficient to provide the
complete composite action between concrete and steel (Klaiber et al., 2000).
1.2 The Role of the Upper Flange
The area of upper flange is a considerable percentage of the total area of the steel girder cross
section. Many researchers have discussed the function of the upper flange and its negligible
contribution to the beam moment capacity (Knowles, 1973, Oehlers & Bradford, 1995 and
Klaiber et al., 2000). According to Oehlers & Bradford (1995), an efficient design should
remove the upper flange. Moreover, the upper flange typically does not reach the steel yield
point and this might affect the plastic moment calculation that assumes the entire section is
under yield. In this respect, the inverted T section is more efficient as the yielded area
actually about the whole cross section, which matches the design assumption (Rauscher &
Hegger, 2008). Error! Reference source not found. shows the difference in yield strain
etween the two cross sections.
1.3 Connection through the web
Knowles (1973) - among others - indicated that it is possible to use the web as an efficient
shear connector instead the upper flange. Numerous connection methods have exploited this
concept to achieve the bond between steel and concrete. Roberts & Heywood (1994), Klaiber
et al. (2000), Jurkiewiez & Hottier (2005), Li & Li (2009), Lorenc, et al.,(2010), Seidl et al.
(2013) and Remennikov & Roche (2014) presented various developments utilising the web
for connection, all enjoying insignificant slip between steel and concrete (see Error!
eference source not found.).
Figure 5: The difference in yield strain distribution (Rauscher & Hegger, 2008)

198
To the best of the authors’ knowledge, detailed studies are not available to highlight the
relationship between the bending moment type (sagging or hogging), neutral axis position
and depth of encasement in these connectors. Furthermore, design rules to fabricate
continuous beams according to the bending moment diagram are also not available. This
research presents a detailed re-design to the traditional I steel section based on analytical
investigations that allows achieving the bond by encasing part of the steel girder into the
concrete slab. Eliminating the welded connection devices is attractive, as it can reduce the
fabrications cost and accelerate the pace of construction.
2. PLASTIC ANALYSIS OF COMPOSITE BEAM
2.1 Assumptions
The plastic analysis of steel-concrete composite sections assumes that the stresses are
rectangular blocks. These stresses reach a constant value, i.e. the material strength, in both
tension and compression at the ultimate moment capacity. The plastic neutral axis (PNA)
divides the composite section into equal parts, experiencing equivalent forces (in tension and
compression). These forces, which are located at centroid of each stress block, represent the
product of the relevant area and the material strength. The moment capacity is calculated
directly from the summation of the moments of these forces about any reference point (Mohd
Yassin & Nethercot, 2007). Error! Reference source not found. shows the stress blocks and
heir equivalent forces for a composite beam where the PNA cross either the slab or the web,
while Cc and Ts, for instance, represent the steel and concrete equivalent forces, respectively,
when the composite beam is subjected to a sagging moment and the PNA crosses the
concrete slab. The calculations of the plastic capacity under both sagging and hogging
moments are presented in Appendix A.
2.2 PNA position
Geometry and material strength not only determine the composite beams moment resistance,
but also the position of the neutral axis. If the beam is subjected to a hogging moment, the
PNA usually crosses the web, because the concrete slab is cracked and therefore offers a little
resistance; whereas, the PNA crosses the concrete slab in the presence of sagging moment
(Oehlers & Bradford, 1995).
2.3 The calculation of moment capacity
Figure 2: Connection through the web presented by (a) Jurkiewiez & Hottier
(2005), (b) Lorenc, et al., (2010) and (c) Remennikov & Roche (2014)

199
The calculation of the sagging moment depends only on the steel beam and the concrete slab,
whose reinforcement is neglected. As the PNA normally crosses the slab, the whole steel
beam is under tension while the slab above the PNA is under compression. Error! Reference
ource not found. (a) shows (Cc) and (Ts) which are the resultant forces into concrete and
steel respectively. Thus, the internal equilibrium means the moment capacity is equal to (Cc)
or (Ts) times their lever arm (see Error! Reference source not found.(a)). In hogging
oment regions, the concrete slab is cracked due to tensile stresses, so that it is reasonable to
assume that the concrete (Cc) is equal to zero. As a result, the PNA crosses the web. The
internal equilibrium of equivalent forces depends only on the slab reinforcement and the steel
beam (see Error! Reference source not found.(b)). All these details and the equations of the
lastic moment capacity in case of hogging and sagging moments are illustrated thoroughly in
Appendix A
3. RE-DESIGN CONCEPTS AND METHODOLOGY OF INVESTIGATIONS
The method of the re-design consists of two fundamental concepts: firstly, examining
different geometries for the beam cross section that have the same cross sectional area of
traditional (I) steel beam cross section and provides the required bond between the slab and
steel. Secondly, calculating the plastic moment capacity of these composite beams and
compare it with the moment capacity of the traditional (I) composite beam.
3.1 Re-design of beam cross section
To eliminate any welded shear connectors and achieve a more efficient bond between slab
and girders for composite continuous beams, the beam cross section is re-designed to encase
the top part of the steel beam in the concrete slab. Three major considerations underpin this
proposal, namely re-designing the upper flange, using reinforced concrete dowels and
exploiting deep connectors.
Re-designed upper flange
Figure 6: The stresses blocks, PNA and the equivalent forces in the plastic
design under (a) sagging moments (b) hogging moments
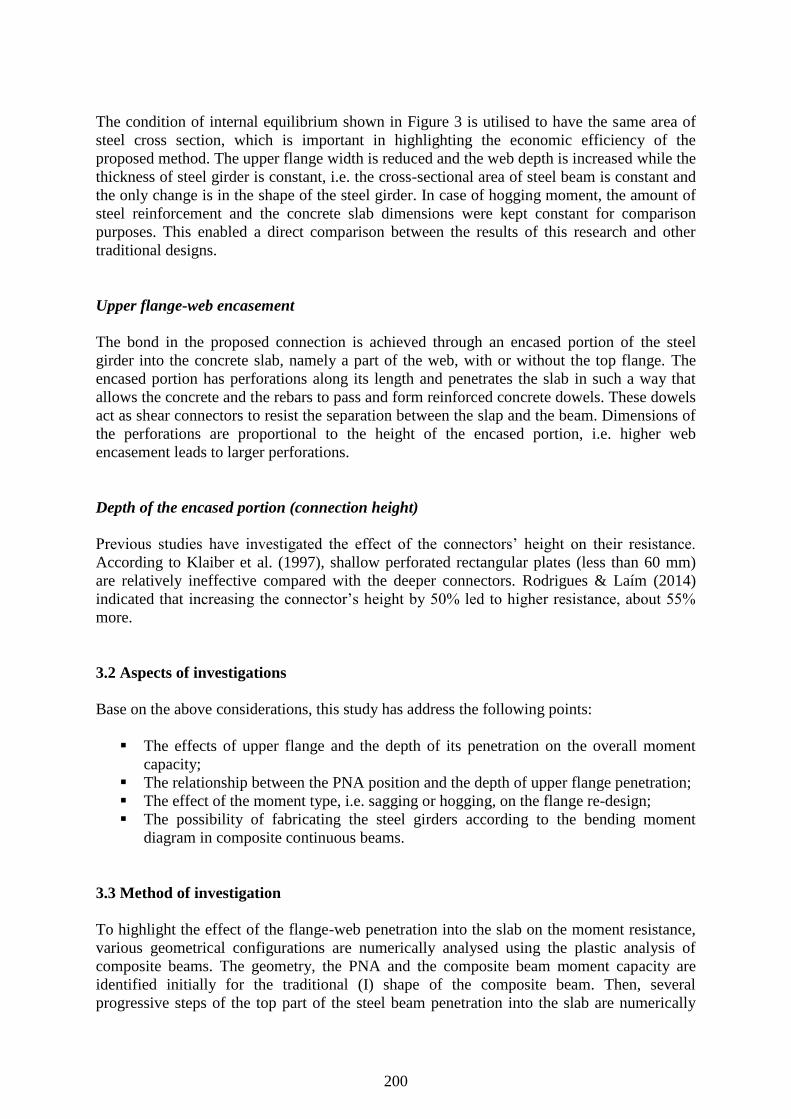
200
The condition of internal equilibrium shown in Figure 3 is utilised to have the same area of
steel cross section, which is important in highlighting the economic efficiency of the
proposed method. The upper flange width is reduced and the web depth is increased while the
thickness of steel girder is constant, i.e. the cross-sectional area of steel beam is constant and
the only change is in the shape of the steel girder. In case of hogging moment, the amount of
steel reinforcement and the concrete slab dimensions were kept constant for comparison
purposes. This enabled a direct comparison between the results of this research and other
traditional designs.
Upper flange-web encasement
The bond in the proposed connection is achieved through an encased portion of the steel
girder into the concrete slab, namely a part of the web, with or without the top flange. The
encased portion has perforations along its length and penetrates the slab in such a way that
allows the concrete and the rebars to pass and form reinforced concrete dowels. These dowels
act as shear connectors to resist the separation between the slap and the beam. Dimensions of
the perforations are proportional to the height of the encased portion, i.e. higher web
encasement leads to larger perforations.
Depth of the encased portion (connection height)
Previous studies have investigated the effect of the connectors’ height on their resistance.
According to Klaiber et al. (1997), shallow perforated rectangular plates (less than 60 mm)
are relatively ineffective compared with the deeper connectors. Rodrigues & Laím (2014)
indicated that increasing the connector’s height by 50% led to higher resistance, about 55%
more.
3.2 Aspects of investigations
Base on the above considerations, this study has address the following points:
The effects of upper flange and the depth of its penetration on the overall moment
capacity;
The relationship between the PNA position and the depth of upper flange penetration;
The effect of the moment type, i.e. sagging or hogging, on the flange re-design;
The possibility of fabricating the steel girders according to the bending moment
diagram in composite continuous beams.
3.3 Method of investigation
To highlight the effect of the flange-web penetration into the slab on the moment resistance,
various geometrical configurations are numerically analysed using the plastic analysis of
composite beams. The geometry, the PNA and the composite beam moment capacity are
identified initially for the traditional (I) shape of the composite beam. Then, several
progressive steps of the top part of the steel beam penetration into the slab are numerically

201
investigated. Each step of web penetration produces a different shape, i.e. a new geometry, of
the composite beam (see Figures 5,7 and 8). The numerical analysis of the resulting cross
section consists of: the web penetration magnitude; the new flanged width and its percentage
of change; checking the PNA position; the resulting moment resistance and compare it to
those of the traditional (I) composite beam before the penetration. The process is carried out
for each design proposal, i.e. at every step of web penetration into the slab (see Tables 1, 2
and 3). An Excel spreadsheet was utilised to conduct the numerical analysis.
3.4 Re-designed composite beams
Two composite beams under sagging and hogging moments were investigated to find the
ultimate moment capacity of the re-designed cross section. The investigated designs are taken
from the work by Garcia & Daniels (1971) and Caprani (2008) and have been selected for
different reasons.
Firstly, Garcia & Daniels (1971) studied the composite beams under pure hogging moment
while Caprani (2008) designed the beam under pure sagging moment. Secondly, the
dimensions of steel beams and concrete slabs are different in the two beams; nevertheless, the
moment capacity of the two beams is nearly the same (3% difference in total). This similarity
in the moment capacity provided the opportunity for a clear comparison between the effects
of web penetration on the sagging and hogging bending moments.
4. ANALYTICAL INVESTIGATION
4.1 Hogging moment capacity of the re-designed beam
The beam shown in Error! Reference source not found.(a), which was tested by Garcia &
aniels (1971), consists of a reinforced concrete slab 1,524 mm (60 inches) wide and 152.4
mm (6 inches) thick, connected to a W21X62 rolled steel beam through headed studs. The top
reinforcement steel of the slab was 1,612 mm2 (2.5 in2) and the bottom reinforcement was
645 mm2 (1 in2). The ultimate moment resistance calculated by researchers was 776.544
kN m. To check the validity of the calculations, it was found that the proposed model is in
excellent agreement with value of the plastic moment provided in reference paper, within a
0.05% difference. Error! Reference source not found.(a) shows the original configuration
f the composite beam. The calculated ultimate plastic moment is 776.544 kN m and the
Figure 7: Cross sections of the composite beams from (a) Garcia & Daniels
(1971) and (b) Caprani (2008)

202
neutral axis position is 281.2 mm from the top edge of the slab. In the intermediate
configuration, Error! Reference source not found.(b), the moment capacity increases by
.52% and the new flange width is 150.8 mm. With a web penetration of 139.7 mm (see
Error! Reference source not found.(c)), the increase in the moment capacity and the new
lange width are 10.33% and 101.6 mm respectively.
Error! Reference source not found. lists the penetration depth, the changes in upper flange
idth, and the increase in the moment capacity of the beam.
Error! Reference source not found. shows that the beam moment capacity increases
radually and steadily with the depth of penetration, from 776 kN m up to 861 kN m,
corresponding to an additional 11%. The PNA location was fixed at 281.2 mm from the top
edge of the slab so that the redistribution of the steel area from the top flange to the web
maintains the equilibrium condition. The flange width at the maximum amount of penetration
depth was about half the original one with no penetration.
Figure 8: Web penetration into the concrete slab for a hogging moment
Table 4: The increase in the moment capacity according to the flange-web penetration Web's
penetration
into the slab
PNA location New
flangewidth
Reduction in
flange width
Moment
capacity
(mm) (mm) (mm) (mm) (kN m)
Original beam 0 281.2 209.73 - 100.0% 776 0
Design 1 25.4 281.2 190.10 19.63 90.6% 795 2.46%
Design 2 50.8 281.2 170.47 39.25 81.3% 812 4.60%
Design 3 76.2 281.2 150.85 58.88 71.9% 827 6.52%
Design 4 101.6 281.2 131.22 78.51 62.6% 840 8.21%
Design 5 127 281.2 111.59 98.14 53.2% 851 9.68%
Design 6 152.4 281.2 91.97 117.76 43.8% 861 10.92%
% ( new
flange/ old
flange)
% of
Increse in
moment
capacity
Design
number
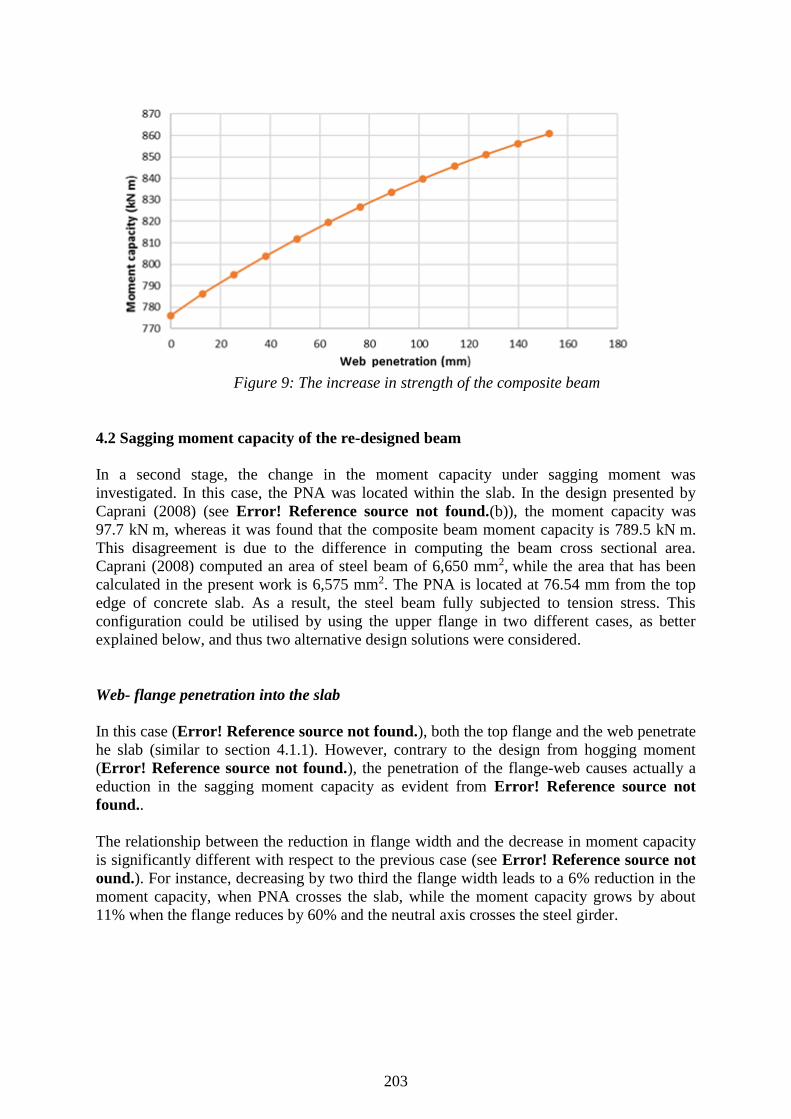
203
4.2 Sagging moment capacity of the re-designed beam
In a second stage, the change in the moment capacity under sagging moment was
investigated. In this case, the PNA was located within the slab. In the design presented by
Caprani (2008) (see Error! Reference source not found.(b)), the moment capacity was
97.7 kN m, whereas it was found that the composite beam moment capacity is 789.5 kN m.
This disagreement is due to the difference in computing the beam cross sectional area.
Caprani (2008) computed an area of steel beam of 6,650 mm2, while the area that has been
calculated in the present work is 6,575 mm2. The PNA is located at 76.54 mm from the top
edge of concrete slab. As a result, the steel beam fully subjected to tension stress. This
configuration could be utilised by using the upper flange in two different cases, as better
explained below, and thus two alternative design solutions were considered.
Web- flange penetration into the slab
In this case (Error! Reference source not found.), both the top flange and the web penetrate
he slab (similar to section 4.1.1). However, contrary to the design from hogging moment
(Error! Reference source not found.), the penetration of the flange-web causes actually a
eduction in the sagging moment capacity as evident from Error! Reference source not
found..
The relationship between the reduction in flange width and the decrease in moment capacity
is significantly different with respect to the previous case (see Error! Reference source not
ound.). For instance, decreasing by two third the flange width leads to a 6% reduction in the
moment capacity, when PNA crosses the slab, while the moment capacity grows by about
11% when the flange reduces by 60% and the neutral axis crosses the steel girder.
Figure 9: The increase in strength of the composite beam

204
The explanation for this difference is that the PNA location in the first example divides the
steel girder into two parts (compression and tension), whereas in the second case the entire
steel girder is subjected to tension. The penetration was stopped at depth of 178mm from the
bottom edge of the slab to maintain the equilibrium state. The results show that the moment
capacity of the re-designed composite section strongly depends on the PNA location
Web-only penetration into the slab
Since this research attempts to present a practical, highly competitive solution, the economy
of the new design is of great importance. Thus, a new solution has been analysed for the
upper flange. Because the web penetration is essential to achieve the bond, the redundant
steel area from the top flange has been added to the bottom flange.
This modification maintains both the total area of steel beam and the PNA location (see
Error! Reference source not found.). As a result, a considerable increase in the moment
apacity has been observed. The first step of calculation was hypothetical; by assuming the
web extending is zero. This was to illustrate the maximum realistic capacity that is virtually
possible in the limiting case where the amount of penetration is zero, which resulted in an
extra 26% of moment capacity.
Figure 10: web-flange penetration into the slab
Table 5: The decrease in moment capacity according to the flange-web penetration
Penetration Web length Flange width Moment capacity
(mm) (mm) (mm) ( kN-m)
Basic design 0 428 152.4 804 0%
Design 1 50 478 117.54 783 -2.59%
Design 2 100 528 82.68 767 -4.53%
Design 3 150 578 47.81 757 -5.81%
Design 4 178 628 28.07 753 -6.25%
Design
number
% of decrease in
moment capacity
Figure 11: web penetration into the slab and deploying the top flange

205
This obviously reduces with the penetration of the web into the slab. Error! Reference
ource not found. shows the details of the penetration, the web length, the added width to the
lower flange and the resulting moment capacity.
It is important to find the minimum depth of the web penetration into the slab that is required to
achieve the bond between the slab and the girder because further penetration leads to less
increase in moment capacity, i.e. indirect proportion between the depth of the web penetration
and the resulting sagging moment (see Error! Reference source not found.). This is opposite
o the hogging moment, the larger the web penetration into the slab, in which the larger the
moment capacity, i.e. direct proportion between the web penetration and the resulting
hogging moment (see Error! Reference source not found.).
Error! Reference source not found. shows a direct comparison between the two re-
esigned composite beams. Both have the same steel area, the same PNA position and the
same resultant forces (Cc and Ts); nevertheless, there is a clear difference in moment capacity.
The typical depth of rectangular perforated plates (perfobond), which have been used by the
researchers in the past, is about 100mm. This makes the moment capacity of an inverted T
section higher by nearly 125 kN m with respect to the original I shape of the beam. In
general, for the design under sagging moments and PNA crossing the concrete slab, the
inverted T section is more efficient.
Figure 12: Comparison between the two re-design solutions under the sagging moment
Table 6: The increase in moment capacity according to the flange-web penetration
Penetration Web
length
Added flange
width
Moment
capacity
(mm) (mm) (mm) ( kN-m)
Hypothetical design 0 428 152.4 1009 26
Design 1 50 478 117.54 959 19
Design 2 100 528 82.68 903 12
Design 3 150 578 47.81 843 5
Design 4 178 628 28.07 806 0
% of increase in
moment capacity
Design
number

206
4.3 The implementation of the proposed method in continuous beam design
The results of the analytical investigation presented in the previous sections can be used to
suggest an innovative and highly efficient method for fabricating composite continuous
beams. In this content, I steel girders are traditionally one of the most widely used forms in
bridge constructions. The intermediate supports slab (subjected to hogging moment) are
generally more critical than the mid-span regions (subjected to sagging moment)
(Vasdravellis et al., 2012). One of the solutions is to encase the beam at the internal support
within concrete (see Error! Reference source not found.). However, this structural form
ight be associated with increase in cost and time.
In the proposed methods (see Error! Reference source not found.), the beam could be
abricated according to the moment distribution and magnitude of the bending moment
diagram. Since the PNA position in the hogging region is typically within the web, two
options were considered to fabricate composite beams based on the PNA position in the
sagging regions. If the latter crosses the slab, then the fabrication could be done according
Error! Reference source not found.(a). In this case, the web depth extends along the slab in
ogging regions only while in the sagging regions the perforated web is simply needed to
achieve the connection between the steel and concrete. In the second case, when PNA crosses
the web in sagging regions, the web extends along the slab along the whole beam Error!
eference source not found.(b).
Figure 10: I-girders strengthened by reinforced concrete at the intermediate supports (a)
Nakamura, et al. (2002), (b) Lachal, et al., (2011) and (c) Somja, et al.(2012)
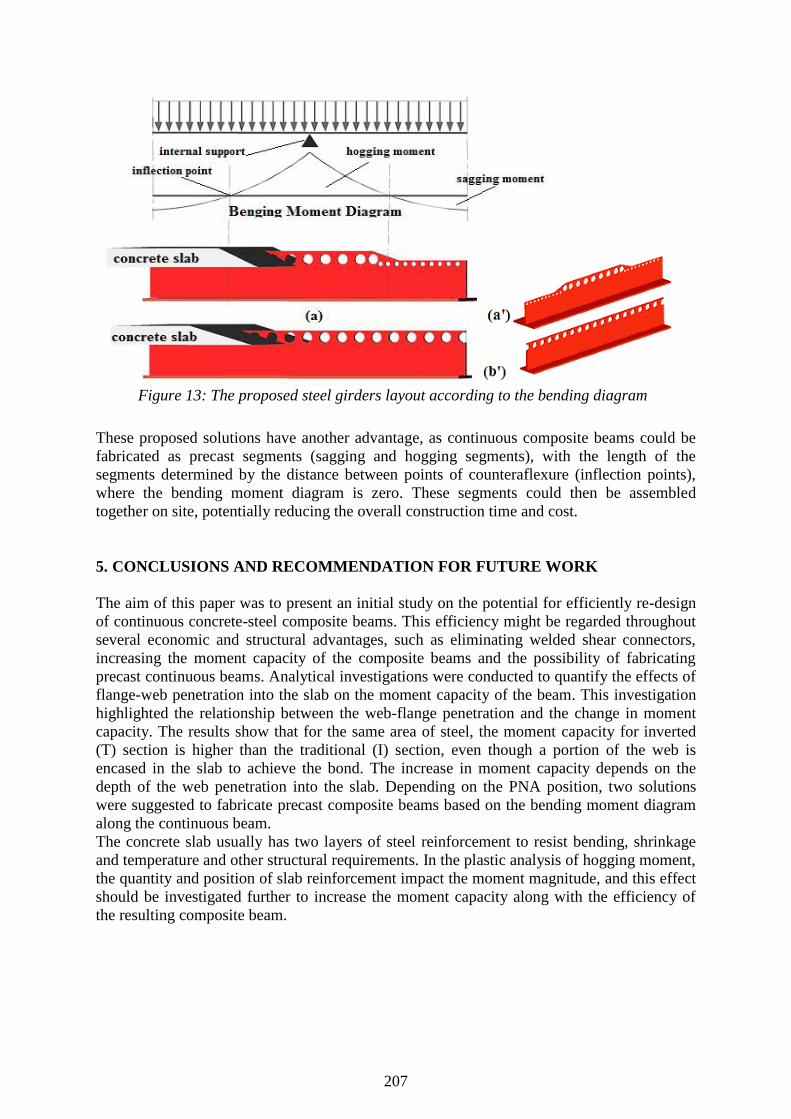
207
These proposed solutions have another advantage, as continuous composite beams could be
fabricated as precast segments (sagging and hogging segments), with the length of the
segments determined by the distance between points of counteraflexure (inflection points),
where the bending moment diagram is zero. These segments could then be assembled
together on site, potentially reducing the overall construction time and cost.
5. CONCLUSIONS AND RECOMMENDATION FOR FUTURE WORK
The aim of this paper was to present an initial study on the potential for efficiently re-design
of continuous concrete-steel composite beams. This efficiency might be regarded throughout
several economic and structural advantages, such as eliminating welded shear connectors,
increasing the moment capacity of the composite beams and the possibility of fabricating
precast continuous beams. Analytical investigations were conducted to quantify the effects of
flange-web penetration into the slab on the moment capacity of the beam. This investigation
highlighted the relationship between the web-flange penetration and the change in moment
capacity. The results show that for the same area of steel, the moment capacity for inverted
(T) section is higher than the traditional (I) section, even though a portion of the web is
encased in the slab to achieve the bond. The increase in moment capacity depends on the
depth of the web penetration into the slab. Depending on the PNA position, two solutions
were suggested to fabricate precast composite beams based on the bending moment diagram
along the continuous beam.
The concrete slab usually has two layers of steel reinforcement to resist bending, shrinkage
and temperature and other structural requirements. In the plastic analysis of hogging moment,
the quantity and position of slab reinforcement impact the moment magnitude, and this effect
should be investigated further to increase the moment capacity along with the efficiency of
the resulting composite beam.
Figure 13: The proposed steel girders layout according to the bending diagram

208
6. ACKNOWLEDGEMENTS
The first author would like to gratefully acknowledged his sponsors, the Iraqi Ministry of
Higher Education and Scientific Research and the University of Kufa, for their financial
support in his Ph.D. studies at Loughborough University.
7. REFERENCES
Caprani, C., 2008. Composite Construction and Design. In: s.l.:s.n., pp. 1-23.
Garcia , I. & Daniels, J. H., 1971. Tests of composite beams under negative moment, Pennsylvania: Fritz
Engineering Laboratory,Lehigh University .
Jurkiewiez, B. & Hottier, J. M., 2005. Static behaviour of a steel–concrete composite beam with an innovative
horizontal connection. ournal of Constructional Steel Research, Volume 61, p. ournal of Constructional
Steel Research.
Klaiber, F., Wipf, T., Reid, J. & Peterso, M., 1997. Investigation of Two Bridge Alternatives for Low Volume
Roads, Concept 2: Beam-in-Slab Bridge, Ames, Iowa: Iowa Department of Transportation Project HR-382,
ISU-ERI-Ames 97405, Iowa State University.
Klaiber, F. W. & Wipf, T. J., 2000a. An Alternate Shear Connector for Composite action. s.l., In Mid-Continent
Transportation Symposium Proceedings, pp. 115-120.
Knowles, P. R., 1973. Composite steel and concrete construction. Guildford: University of Surrey.
Lachal, A., Hechler, O., Kaing, S. S. & Aribert, J.-M., 2011. Experimental Investigations of the Shear
Connection Behaviour in Joints of Composite Bridges. s.l., ResearchGate, pp. 741-453.
Liang, Q. Q., 2015. Analysis and Design of Steel and composite structures. 1ST ed. s.l.:CRC Press.
Li, G. Q. & Li, X. H., 2009a. Study on a novel steel concrete composite beam. Hong Kong, China, The Hong
Kong Institute of Steel Construction, pp. 243-251.
Lorenc, W., Kubica, E. & Kozuch, M., 2010. Testing procedures in evaluation of resistance of innovative shear
connection with composite dowels. ARCHIVES OF CIVIL AND MECHANICAL ENGINEERING, 10(3).
Mirza, O. & Uy, B., 2010. Effects of the combination of axial and shear loading on the behaviour of headed stud
steel anchors. Engineering Structures , Volume 32, pp. 93-105.
Mohd Yassin, A. Y. & Nethercot, D. A., 2007. Cross-sectional properties of complex composite beams.
Engineering Structures, Volume 29, pp. 195-212.
Oehlers, D. J. & Bradford, M. A., 1995. Composite steel and concrete structural members—Fundamental
behaviour. 1st ed. ed. s.l.:Elsevier Science Ltd.
Oguejiofor, E. & Hosain, M., 1994. A parametric study of perfobond rib shear connector. Canadian J. Civil
Eng., Volume 21, pp. 614-625.
Rauscher, S. & Hegger, J., 2008. Modern composite structures made of high performance materials. Devil's
Thumb Ranch, Tabernash, In Proceedings of the 2008 Composite Construction and in Steel and Concrete
Conference VI.
Remennikov, A. & Roche, M., 2014. New composite construction of hybrid beams combining steel inverted T-
section and RC flange. Auckland, New Zealand , Australasian Structural Engineering Conference (ASEC
2014).
Roberts , W. & Heywood, R., 1994. Development and Testing of a New Shear Connector for Steel Concrete
Composite Bridges. Halifax, Novia Scotia, Canada, s.n., pp. 137-145.
Rodrigues, J. & Laím, L., 2014. Experimental investigation on the structural response of T , T-block and T-
Perfobond shear connectors at elevated temperatures. Engineering Structures journal, Volume 75, p. 299–
314
Seidl, G. et al., 2013. Prefabricated enduring composite beams based on innovative shear transmission (Preco-
Beam), European Commission: Directorate-General for Research and Innovation Directorate G —
Industrial Technologies Unit G.5 — Research Fund for Coal and Steel.
Somja, H., Serey, K. & Lachal, A., 2012. New beam-to-beam joint with concrete embedding for composite
bridges Experimental study and element modelling. Journal of Constructional Steel Research, Volume 77,
pp. 210-222.
Vasdravellis, G., Uy, B., Tan, E. L. & KirklanD, B., 2012. Behaviour and design of composite beams subjected
to negative bending and compression. Journal of Constructional Steel Research, Volume 79, pp. 34-47.
8. APPENDIX A
Sagging moment resistance

209
The sagging moment resistance (Mus) can be calculated as
Mus = Cc*L= Ts*L ,
where:
Cc = 0.85 fck . hc . bf and Ts = 0.95 fy . As
in which bf is the concrete flange width ; hc is the depth of the neutral axis ; fck is the cylindrical compressive
strength of concrete; fy and As are the yield stress for the steel beam and its area of cross section respectively
(see Error! Reference source not found. (a)).
Hogging moment resistance
The hogging moment resistance (Muh) is given by:
Muh = Tts + Tbs + Ttf + Twt
Where :
Tts = Ast . fyr. Lst ;
Tbs = Asb . fyr. Lsb ;
Ttf = Atf . fy. Ltf ;
Twt = Atw . fy .Ltw
Muh the hogging moment resistance; fyr is the yield stress of steel reinforcement; Ast is the area of top steel
reinforcement; Lst is its the lever arm; Asb is the area of lower layer of steel and Lsb its lever arm; Ts and Ls are
the force in the steel girder subjected to tension and its lever arm, respectively; CAS equivalent force in the steel
girder under compression. Ttf and Twt are the components of the upper part of the steel beam (under tension
stress) moment resistance; Atf and Atw are the area of the upper part of the steel beam; Ltf and Ltw are the lever
arms for the upper part of the steel beam (see Error! Reference source not found. (b)).

210
ID 077
FACTORS IMPACTING BUILDING INFORMATION MODELLING
(BIM) IMPLEMENTATION IN COST MONITORING AND CONTROL
K. Sunil, C. Pathirage and J. Underwood
School of the Built Environment, University of Salford, Salford, M5 4WT, UK
Email: [email protected]
Abstract: A vast majority of the construction projects suffer from cost and budget overruns
and construction organisations continue to incur losses, reduction in profit and many of them
often become heavily debt ridden and eventually go out of business. Therefore, drastic
improvements are required in the current practice. BIM integration can bring the much needed
improvement in the area of cost monitoring and control practice. There have been progressive
developments in terms of BIM-enabled tools, costing techniques and standards that are
becoming mature, but there has not been considerable change in the actual practice. Therefore,
it is crucial to identify the most important factors affecting the BIM implementation cost
monitoring and control in organisations in the UK in order to develop a practically feasible
BIM implementation strategy. For this purpose the study uses the existing literature and
empirical qualitative data collected through interviews from carefully selected practitioners
from a large construction organisation in the UK and quantitative data collected through
survey. This paper is focused on the identifying the key issues affecting BIM implementation
in cost monitoring and control practice. Research findings indicate that there are a number of
factors related to people, process, information and technology that influence their decision to
implement BIM. These factors have been segregated as drivers and barriers for BIM
implementation.
Keywords: BIM, cost control, cost management, cost monitoring, quantity surveying.
1. INTRODUCTION
The UK construction industry and the practitioners have failed to learn lessons from the past
mistakes and wasted improvement opportunities. The prominent industry reports such as
Simon’s Report 1944, Latham’s Report 1994, Egan’s Reports 1998 and 2002 and
Wolstenholme’s 2009 have highlighted the problematic issues in construction industry
practices and emphasised on the significant need for improvements (Egan, 1998, 2002;
Hillebrandt, 2003; Latham, 1994; Wolstenholme et al., 2009). One of the most important
project processes; the cost management is also significantly ineffective (Hanid, Siriwardena,
& Koskela, 2011). Majority of construction projects suffer from cost and budget overruns and
as a result the contractors and construction organisations continue to incur losses and going
out of business (Cheng, 2014; Mahamid, 2012; Schleifer, Sullivan, & Murdough, 2014).
Although there has been an increased use of computing and information technology but the
overall improvement in the process and its effectiveness has been insufficient (Olatunji,
2011; Yusuf, Mohamed, Yusof, & Misnan, 2012).
Despite the improved awareness of BIM and software developments it has not yet been taken
up in practice. Cost management professionals in particular have been considerably reluctant
and slow to adopt BIM (NBS, 2014; Wu, Wood, Ginige, & Jong, 2014a, 2014b). Most of the
developments have taken place the pre-construction phase and only a few of the research
studies have been found to be focused on the construction phase. Their scope include

211
technology and process integration with planning and construction through BIM such as
Elbeltagi et al. (2014), Willems & Vanhoucke (2015) and Zhao & Wang (2014). Dodge Data
& Analytics (2015) has reported that there hasn’t been significant development in this area in
relation with implementing BIM. Considering the poor state of BIM implementation in cost
monitoring and control there is a crucial need for identification of key factor responsible for
this resistance or reluctance in order to overcome the barriers and challenge for improving the
performance of the cost monitoring and control practice and its smooth transformation into a
BIM-based process.
This paper is focused on the highlighting the key factors and issues impacting the BIM
implementation in area of cost monitoring and control in construction phase through review
of literature and preliminary findings from the thematic content analysis of the empirical data
collected through in-depth interviews from the practitioners in a large construction
organisation in the UK. This exercise will help in identification of most important factors due
to which the sample contracting organisation “ORG-1” is struggling to adopt BIM. This will
provide an insight of the practical challenges due to which BIM has not been adopted in
practice and what are the most important drivers for cost mangers. The first part comprises a
brief literature review, the adopted research methodology for the research is discussed in the
second part and the third part focuses on the analysis and presentation of data followed by a
discussion on the findings and conclusion.
2. COST MONITORING AND CONTROL IN CONSTRUCTION
Cost monitoring and control during construction phase is a critical process for keeping the
project cost within the predefined budget (Ashworth, 2010; Hanid et al., 2011). It involves
regular conduct cost analysis, progress monitoring, reporting, interim estimating and
valuations (Ashworth, 2010; Elbeltagi et al., 2014; Kern & Formoso, 2004; Pilcher, 1994).
These operations enable cost managers to overcome budgetary/ cost shortfalls by making
recommendations for adjustments in design, programme, construction methods, materials
costs, payments, finances, stakeholder relationships, cost variances and changes in design or
construction etc. It is a highly complicated mechanism involving management of a high
number of work packages and costs accounts resulting from material, labour, plant,
consultancies and other expenditures and also claiming payments from client and maintaining
a reconciled record (Ashworth, 2010; Hanid et al., 2011). The cost managers have to maintain
a critical balance during the whole process to ensure fulfilling the demands of both parties;
the client and the contractor and the stakeholders (Al-Jibouri, 2003; Ashworth, 2010; Hanid,
Koskela, & Siriwardena, 2010; Hanid et al., 2011; Jackson, 2002; Potts, 2008). The best
possible value delivered for the money spent by the client and securing a decent profit for the
contractor accordingly.
3. ISSUES AND CHALLENGES IN COST MONITORING AND CONTROL
A number issues and challenges exist in the practice related to knowledge, costing techniques
being used, collaboration and coordination, quality of available data, communication and the
technology being used (Cândido, Heineck, & Neto, 2014; Jaya, Pathirage, & Sutrisna, 2010;
Sunil, Pathirage, & Underwood, 2015; Willems & Vanhoucke, 2015). There have been
efforts for improving the costing practice from the RICS and academia such as introduction
of new rules of measurement (NRM), partnering and collaborative working and advanced

212
costing techniques etc. But the practice has inefficient and ineffective and involves
substantial amount of manual working and isolated processing (Olatunji, 2011; Smith, 2014;
Yusuf et al., 2012). The project information and data are manually processed through paper-
based documentation, spreadsheets and estimating software (Cho, Russell, & Choi, 2013;
Zhao & Wang, 2014). Ideally the cost managers should monitor costs as they take shape, but
in reality it is a retrospective process as cost managers assess and report the costs incurred in
the past month (Ollmann, 2015). Therefore they are unable to take the control action in time
to prevent any loss. It can be said they that in true sense they do not monitor the cost to
control it, instead they manage it by keeping the overall cost within the budget. Also, the
widespread culture of working to approximate cost also impacts the practice in addition to the
other constraints which allows the cost managers not to be precise. All of these issues
contribute in shaping the practice and determining the acceptable results.
The need for an integrated cost management system/ process has been recognized in order to
improve the practice (Ballard, 2010; Isidore & Back, 2002; Jaya et al., 2010; Kulmala,
Paranko, & Uusi-Rauva, 2002; Rasdorf & Abudayyeh, 1991; Turkan, Bosché, Haas, & Haas,
2012). They have highlighted the need for integration of cost management with other project
processes for improved cost control along the project progress through collaborative working,
inclusive decision making, and using advance costing techniques, IT system and streamlined
project information flow.
4. BIM IMPLEMENTATION IN COST MONITORING AND CONTROL
BIM holds significant potential for resolving issues affecting the cost management such as
non-collaborative and isolated operations, system incompatibilities, poor communication,
low-tech and overwhelmingly manual documentation and processing etc. (Olatunji, Sher, &
Gu, 2010; Popov, Juocevicius, Migilinskas, Ustinovichius, & Mikalauskas, 2010).
Thurairajah & Goucher (2013) further state that cost managers can coordinate with project
team and benefit from the readily available data and detailed information in the BIM model
and from its technological, processing and information support.
Most of the BIM related developments are in the pre-construction area of cost management
such as BIM enabled estimating and measurement tools etc. (Raphael & Priyanka, 2014;
Thurairajah & Goucher, 2013; Wu et al., 2014a, 2014b). Only few research studies have been
focused on the role of BIM in cost management during construction phase such as Elbeltagi
et al. (2014), Willems & Vanhoucke (2015) and Zhao & Wang (2014). These studies are
focused on highlighting the areas for improvement, development of software tool and
integration of cost management with planning and construction processes respectively. BIM
enabled QS tools are available in the UK market for cost monitoring, control and reporting
such as Vico Office. But Dodge Data & Analytics (2015) has reported that it is fairly new
area for BIM implementation and there has not been significant development in in this area.
NBS BIM Survey 2016 has indicated that a high number of organisations have attained BIM
maturity Level-2 (NBS, 2016). But the majority of the respondents of the survey were from
the architectural background. Only 3% of the respondents were Quantity Surveyors.
Therefore this proposition does not effectively imply to the QS firms or departments. Also
the government mandate does not require using 5D cost management (Thurairajah &
Goucher, 2013). Therefore, it is crucial to identify the key factors that impact the BIM
implementation in cost monitoring and control practice/ cost management/ quantity surveying
departments of the contracting organisations as they are the main players during construction.

213
5. RESEARCH METHODOLOGY
This research paper is part of the PhD research study that has adopted mixed methods
research strategy involving multiple case study methodology and survey research
methodology. Multiple case study method is aimed at conducting cross case analysis of
multiple cases to identify the critical factors affecting BIM implementation. Multiple cases
study also improves the validity and generalisability of the research findings as the data is
collected from multiple sources (Saunders, Lewis, & Thornhill, 2012; Yin, 2014). Purposive
sampling has been used to select three case study organisations which are large contracting
organisations from the UK, depending upon the extent of BIM deployment in quantity
surveying/ cost monitoring and control. Semi-structured interviews have been used to collect
qualitative data from people in the cases study organisations. In-depth interviews allow the
participants to express their views in depth (Saunders et al., 2012). The interview format has
been designed to capture participant’s opinion about the BIM implementation in the cost
monitoring and control and the associated factors. The qualitative data has been analysed
though thematic content analysis. It is “a set of procedures for collecting and organizing non-
structured information into a standardized format, which facilitates making inferences about
the characteristics and meanings of written or recorded material” (Kulatunga, Amaratunga, &
Haigh, 2007, p. 501). For categorisation pre-defined themes; people, process, information
and technology that have been identified from the literature are used but there is flexibility in
the approach to add any further emergent theme. The survey collects quantitative data from
the practitioners across the country to investigate wider trend of the critical factors the using
descriptive analysis and factors will be ranked using factor analysis. The survey results are
intended to improve the validity and generalisation of the qualitative research findings.
As the research is currently in progress, the preliminary findings from the first case study are
presented in this paper highlighting the most important factors affecting the BIM
implementation in the cost monitoring and control. A large contracting organisation “ORG-1”
from UK has been selected for collecting the empirical data. ORG-1 does not use BIM for the
project cost management which makes it ideal for investigating the actual facts due to which
they have not adopted BIM. Five people from this organisation have been interviewed; two
from the strategic level and three from the operational level in the cost management process
for investigating both strategic and operational constraints.
6. FACTORS AFFECTING BIM ADOPTION
Research studies conducted during past 5 to 6 years have highlighted a number of potential
factors that impact BIM implementation such as Ibrahim, Kado, & Bala (2014), Balfour
Beatty (2015), Eastman et al. (2011), Hosseini, Azari, Tivendale, & Chileshe (2015), Kehily
(2016), Shang & Shen (2014), Smith (2014), Stanley & Thurnell (2014) and Turner,
Edwards, Curran, & Guillemet (2015). These factors include; drivers, barriers, challenges and
other issues that are associated to people, process, information and technology in the practice.
The designers and constructors have embraced and made progress in implementation but cost
management/ quantity surveying discipline is lagging behind (Dodge Data & Analytics,
2015; Wu et al., 2014a). Therefore, it is essential to investigate this area to determine the
most important factors responsible for this. The interviewees were asked to express their
opinion about these factors such as the relevance of the factor, how it impacts, underlying
causes and the practical implications. These factors are divided into two groups for analysis
act as ‘Drivers’ that organisations and professionals find most attractive in terms of BIM’s

214
impact in improving the practice and ‘Barriers’ that prevent/ make BIM implementation
difficult. The case study findings are presented in the following sections.
6.1. Drivers Associated with People
Cost managers form the people component of the cost monitoring and control practice as they
perform core QS tasks in cost monitoring and control practice. BIM implementation in this
area will directly impact the people. Following are the most important drivers associated with
people that have been identified from the analysis of ORG-1 organisation.
Role of Cost Manager
All of the respondents agree that BIM implementation will considerably enhance the
traditional role of the QS through highly advanced technology and integrated process. It has
been found that QSs role is confined to commercial management and mostly operate in
isolation. They work in a constrained environment because of poor information availability,
manual nature of processing and basic technology etc. and do not actively seek opportunities
for cost savings and do not monitor the cost performance. It has been found that although the
QSs and the management are satisfied with their current role, they expect that with BIM their
role will be enhanced and can become more effective. The QSs are mostly busy and do not
have time to look at other aspects of the project where greater benefits can be achieved. The
QSs and management both feel that BIM would be beneficial if it can improve the cost
control and ability to monitor leading to better performance and profit. Moreover, QS can
actively participate with project team and through BIM support they can give faster cost
feedback on alternative design, programme and materials. This enhancement in the QS role is
seen as an important driver for BIM adoption.
Decision Making Support
Decision making is the main task of cost managers as they always have to assess the cost
performance and make judgements and adjustments. Cost manager’s decisions directly
impact the commercial performance of the project and organisation’s profitability. It has been
found that the experience is considered to be the major competency factor for better decision
making. But the BIM co-ordinator is confident that BIM significantly help cost managers’
decision making. Although the QSs lack the detailed BIM knowledge but the model
visualisation feature due to the multiple angle 3D viewing and model fly through is seen as a
major factor that can play vital role in improving their decision making such as specific
requirements and buildability issues leading to better cost certainty. It can also help in easing
the time, labour and cost pressure. Other, important contributing factors are availability of
right detail of detailed information and ability to integrate cost managers in the project team
for inclusive and collaborative. BIM support for better informed decisions is a driver that is
considered vital by the management and the surveyors..

215
Collaborative Working
It has been found that the QSs mostly work in isolation as they are not actively involved with
the project team for example with designers, site management and planners etc. But they
acknowledge the fact that cost monitoring and control is not solely the responsibility of the
QS but in fact it is a team process. It has been found that QSs believe that site managers are
also responsible for controlling cost because they oversee the works on site but QSs don’t
collaborate with them. As a result they are mostly unaware of the project development/
progress and are unable to provide immediate cost feedback. Moreover, they do not take
control action unless there is a considerable problem and they have to conduct meetings and
site visits to assess the situation and obtain information. However, the QSs emphasised on the
need for improving collaborative working with other disciplines to provide quicker cost
feedback and proactive identification of design and planning issues and variations can be
better planned.
Although the QSs lacked in-depth BIM knowledge, the management however has been found
keen about the BIM’s capability to connect the project team members through its centralised
platform as it can improve the required collaboration for improving the cost monitoring and
control. Through BIM, QSs can closely work with subcontractors, suppliers and the client’s
team such as clients QS. BIM allows sharing information, communication and model/ project
updates across the project team. It enables team to collectively deal with problems such as
construction and cost issues and assess alternatives in more efficient and effective manner. It
has been found that BIM can help in changing the traditional professional and cultural
barriers in the construction industry including the QS professionals.
Support for QS Tasks
Although the QSs and the management emphasised that the current methodologies of cost
management and the QS tasks and activities are satisfactory. They have been found to be
confident about the accuracy of the CVRs, cost data, reporting and processing. It has been
found that QSs in ORG-1 are responsible for a number of tasks during construction phase
such as cost control, cost and value reconciliation, measurements and take offs, variations
management, procurement, subcontractor and supplier accounts and corrective action for
financial adjustments. Most of these tasks and processes are manual and time consuming.
Moreover, at peak times the QS can be involved in up to three live projects and mostly work
under time and work overload pressure. As a result they do not regularly monitor the costs or
seek availing cost saving or value enhancing opportunities.
Through analysis it has been found that the QSs are keen about the automated features of
BIM and the BIM enabled QS tools. They specifically emphasised on visualisation and clash
detection as they have witnessed their benefits. They repeatedly mentioned that BIM can be
useful if it can help them saving time and speed up their routine tasks such as quantification
and updated information provision. They named some of the important benefits; detection of
design, construction and programme issues and check and the manage subcontractor’s work.
From QSs perspective, the support for QS tasks and duties is an important factor for them to
consider using BIM.

216
6.2. Drivers Associated with Process
BIM implementation will affect the process of cost monitoring and control. The most
important process related drivers that have been found through analysing the ORG-1 are
presented below.
Integration and Coordination
The QSs emphasised that cost management has to coordinate with the on-site construction
progress in order to be able to monitor project cost performance and this coordination can be
reached by integration of cost management and construction schedule. Lack of integrated
processes and coordination has been highlighted by the QS professionals in ORG-1. It has
been found that the quantity surveying, design, and construction processes operate in
isolation. QSs are often not aware of the extent of development of design or construction on
site and variation instructions. They cannot attend all meetings to coordinate with team. As a
result they cannot properly conduct cost management. They rely mainly on the monthly CVR
for analysing the performance of past month and that takes over a week. The QSs have to
manually enter and process data into Excel and then produce cost reports from it manually.
Due to the practical inability they don’t monitor the project cost performance.
There is acceptance that the integration of cost, schedule and on-site construction progress is
important for enabling cost monitoring. In their opinion BIM can play an important role in
linking design, cost and schedule data. The QSs believe that through BIM the project team
can be linked together and the process can be integrated with each other that can enable them
to coordinate with the design and construction teams and the cost management can
potentially become in-line with the development on site. Also the changes in in design or
programme can be captured and cost data can be updated accordingly. They believe that the
combined processing will ultimately help in improving the cost monitoring and control
practice. Without BIM support they do not have enough resources to monitor project cost
regularly. Therefore, the capability of BIM to integrated processed and improve coordination
is seen as an important driver to improve the process.
Standardisation and streamlining
Another important factor that can act as a driver for BIM implementation in ORG-1 is
standardization and streamlining the cost monitoring and control process. It has been found
through the analysis that in ORG-1 organisation and project the non-standardised processes,
methods and documentation are important issues. Due to using different methods and formats
QSs often fail to understand the data and information and they have to spend extra time and
effort to work with it. Also it creates cost uncertainty because people use different formulas
and techniques and present information in various structures. Also, it has been found that in
most cases the required level of detail is not provided which leads to queries, delays and
uncertainty. Due to these issues the process cannot be streamlined.
It has been found that in the management and the QSs opinion BIM can definitely help in
improving the standardisation and streamlining the process through the information standards
and protocols. They emphasised that use of standardised medium, structure and file format is
a very important aspect of working in BIM environment. From cost management perspective,
as they use input from internal and external project team members it a key driver. The QSs

217
can avoid delays due to duplications and repetitions, direct access to the model and required
data and use of dedicated QS software tools.
6.3. Drivers Associated with Information
Information is the core component of the BIM projects, the drivers associated with the
information that have emerged from the analysis of the in-depth interviews with the
practitioners are presented below.
Information Availability and Sharing
All of the participants concur that BIM has a significant potential in eradicating the chronic
issue of lack of data and information availability for cost monitoring and control purpose. It
has been found that most errors and delays occur due to the missing or incomplete
information. The QSs emphasised that with BIM they will be able to obtain majority of the
information with right level of detail at all relevant projects stages that can improve the speed
and quality of their work. During construction phase if all people enter the correct
information into the BIM model, QSs will be in better position than today in monitoring the
cost expenditure. Also in case of a variation or problem they will be able to quickly assess the
cost impact and produce proposals for the client’s approval. They will be able to share the
material specifications with the suppliers in quick manner to check and cross-check prices
and generate subcontract packages with greater accuracy. Similarly, information sharing is
also an important aspect as the QSs can easily send and receive information through
centralised platform.
Quality of Data
It has been found that the QSs have serious concerns about the quality of information and
data in the current practice. The problems are often caused due to use of verbal and hand
written notes. Also the structure and vocabulary used by various people in the project are not
uniform which creates problems for QSs and they have to chase people for right
interpretation. This creates additional work and leads to delay and errors.
The improvement in quality of data is seen as an important factor by the QSs in relation with
BIM adaptation. Some of the benefits they want to achieve through this decreasing the
workload, delay and accuracy. It has been found that it is due the fast paced nature of the
project construction and involvement of high number of people and activities in construction
phase.
Information Format
It has emerged from the analysis that people in the UK construction always prefer their own
preferred manner in which the structure the information and documentation. Also various
isolated software system are in use that have file format and compatibility issues. Due to
these issues often time and resources are wasted along with valuable data and sometimes QSs
prefer printed information that they can manually enter into their spreadsheets.

218
Ability of BIM to standardise the information structure and support for a wide range of file
formats has been mentioned as an important aspect that can improve the cost management
process. It has been found that improved system compatibility can support the cost mangers
to conduct cost monitoring and control activities.
6.4. Drivers Associated with Technology
From the analysis it has emerged that QSs and the management of ORG-1 possess limited
BIM knowledge in relation with cost management. The main source of their BIM technology
knowledge has been acquired from introductory demonstrations. The important drivers
associated with BIM technology from their perspective are presented below.
Visualisation
The QSs and management concur that the detailed 3D model visualisation feature of BIM can
be very useful for the cost managers and the key benefits they aspire are better understanding
of the design and features of the building and visual clash detection analysis. The QSs
consider the ability to compare the physically built assets to the model during construction
phase as very important development as they can verify the construction and identify issues
easily. Moreover, they also highlighted the importance of embedded cost data for checking
and verification. From cost monitoring and control perspective it has been stated that 5D BIM
can enable the QS to assess the project cost performance during construction which was
previously not feasible in the traditional settings. Also the visualisation can significantly
support the valuation process from completed and pending works.
Automation
The management have been found to be keen about the automation of the time consuming
tasks such as measurements, quantity take offs, clash detection etc. Whereas, the QSs are
more interested in documentation, checks and reviews, report generation and access to data.
The QSs repeatedly mentioned that due the work overload and fast paced nature of the
construction projects, they often leave the crucial checks and analysis. They desire if the BIM
can support them in measurements, quantity take offs and data collection, they can use that
valuable time in detailed assessments to improve project cost certainty and performance.
Although the QSs seek speeding up their working through BIM, they emphasised on the
importance of QS’s role in supervising and controlling the process for accuracy and right
detail because they assert that all cost items cannot be modelled. However, the automated
features are seen as major technological developments that can improve the cost management
during construction phase.
6.5. Barriers for BIM Implementation
Although there are a number of drivers highlighted by the practitioners in ORG-1 but still the
BIM has not been taken in the QS department of the organisation. Therefore the thematic

219
analysis was conducted to identify the barriers that have prevented the BIM implementation.
The main barriers that have been identified from the data analysis are presented below.
Resistance to Change
It has emerged from the analysis that there is resistance to BIM implementation in the QS
department in the ORG-1. The senior management indicated that they are satisfied with
current cost monitoring and control practice in the organisation and do not view BIM to add
significant value. It has been attributed to the lack of BIM knowledge and advanced stage of
career as the older people in the company are suspicious about the achievable benefits. The
more experienced people prefer their existing methods and tend to resist the BIM
implementation. Moreover, it has been found that QSs use different methods and tools and
there is a strong culture in the industry to defend your preferences and challenge others. As a
result it there is certain level of resistance to change from their preferred methodology as
each of them used different method for his calculation but remained assertive about its
accuracy.
Fear
It has been found that there is a significant element of fear and uncertainty in relation with
BIM adoption which is rooted in the low level of BIM knowledge. Although people tend to
project lack of confidence in the accuracy and effectiveness of BIM based cost management
but the actually there are other factor involved such as job security, uncertainty, decrease in
wages etc. Also people in construction industry have low level of trust and they do not feel
comfortability in sharing information due to reservation about security of their commercial
interests. It has also emerged the people are unaware of the BIM standards that define the
roles and responsibilities such as PAS 1192-5:2015 and BS 1192-4:2014 etc. As their BIM
knowledge is at low/ basic level in the QS department, people have a lot concerns about the
legal and contractual implication related to BIM implementation in a project. For instance
one of the primary concerns is about the ownership of the data, and responsibility in case of
issues in the model. One of the QSs raised concern that BIM model is open to human errors
because people can make changes.
Knowledge and Competency
Lack of BIM knowledge and competency is one of the major barriers for BIM adoption in the
cost monitoring and control practice. It has been found that QS professionals use generic
tools and techniques for cost management. The QS department as a whole suffers from severe
lack of advance digital IT skills vital for BIM adoption. In addition, it has been found that the
senior management expect people to develop these skills at the university but the reality they
lack core QS competencies which put the organisation under pressure to train the QSs first
for quantity surveying first. Moreover, the organisation has already once failed to implement
a popular BIM enabled cost management software package due to the lack of competency.

220
Cost Manager’s Workload
From analysis it has been found that the cost managers are extremely busy as they are over
occupied with a high number of important tasks and duties as discussed earlier under high
time pressure. Upon investigation it has emerged that due to the high volume of workload,
tight deadlines in the fast paced construction business it is not feasible for the QSs to dedicate
time for learning and developing BIM competency. It has been found that the QSs prefer to
get on with the jobs first so that the organisation can continue its business.
Leadership
ORG-1 is capable of delivering Leve-2 BIM projects as the design department is BIM enable.
The design department adopted BIM because of a strong leader who had previous knowledge
and experience but had dedication and ability to with stand management and staff pressure.
Whereas the QS department suffers from leadership crisis and as a result has not made
progress with BIM adoption. However, there is expectation that recent change in the
management can provide support and add a new member of team who can lead and mentor
the QS department to become BIM capable.
Organisational Structure
The organisational structure plays a vital role in implementing new technology in the ORG-1.
Head office governs the regional offices and the new technology is first trialled at the head
office and then passed on to the regional offices. If something is being trailed at the head
office, the regional offices cannot run its trail. It has emerged this policy has proven
counterproductive in relation with implementing BIM in cost management department. Upon
direction from the head office, the regional office started the implementation of BIM capable
software demonstrations and training sessions to the QSs. But the head office postponed it for
another year. As a result many people have lost interest and a lot of time, planning, and
money has gone wasted. It has been found that people feel that as teams have different
strengths and level of understanding, if something suits them they should be able to use it and
then they can share the knowledge across the organisation.
Training & Learning
It has been found that the staff training and skill development in ORG-1 acts as a barrier for
BIM implementation. The trainings programmes are focused on attaining professional
accreditations and health and safety. There is no emphasis of developing new skills such as
BIM competency. It has also emerged that most of the trainings are funded by the industry
grants and are focused on Health & Safety and similar areas which do not contribute to
improving the business, making it lean and more profitable. The QSs also revealed that the
previous BIM trainings were not adequate and the knowledge was being force fed in short
time. It is unrealistic to expect the professionals to be able to adopt new techniques and
technologies after few hours of trainings.

221
Strategy & Investment
From the analysis it has emerged that ORG-1 does not have a robust BIM implementation
strategy. At the regional office level there is no active programme for implementing BIM in
the QS department. The head office allocates the budget for these purposes but due to the past
experience of failed implementation now the people in regional office are reluctant to make
such commitment. Also, in tight economic situation it is difficult for the organisation to take
the QS off the project and get them trained up for BIM.
In addition to this the IT strategy and investment are not aligned. The organisation sometimes
arranges training sessions but that is not backed up by providing the software to the QSs and
gradually they forget everything leant. Also the upgrading of the hardware is not satisfactory
as QS have systems which are not capable of opening BIM model which puts them off and
they cannot get involved in BIM project. The company has to adjust its BIM strategy if it is
to succeed with BIM implementation.
Quality of data & information
One of the main barriers for implementing BIM in cost monitoring and control practice is the
inadequate quality of data and information. It has been found that the management and QSs
are concerned about the reliability of the BIM model information. Although it is a
collaborative exercise and users can highlight the issues and notify the author but QSs feel
that it increases their workload significantly if they have to verify the whole model. Similarly
if extracted information has an issue, they have to re-check all of it and they suggest it is
easier for them to create it by themselves. This uncertainty and lack of trust is an important
barrier to overcome because otherwise it is difficult to convince them to use BIM.
Interoperability & Compatibility
The major technological barrier that has been found for the analysis is the issue of
interoperability and compatibility. The senior management suggest that with rapid
development in the area of BIM, new tools are emerging and it is becoming increasingly
difficult for them to choose a specific one. As a large contractor in the UK they are struggling
to find appropriate BIM capable cost management software package. Because there is a
considerable investment required for acquisition of software and hardware, implementation
and training.
Senior management has been particularly found concerned about the file format issues. It has
been suggested that as there are various BIM software packages in the market; it is difficult
for them to assess what type of file formats they may be working with in the future projects,
what software the client’s architect will be using and will there be any file compatibility
issues.
7. CONCLUSION
Due to inadequate cost monitoring and control, construction projects exceed the budgeted
costs and the main contractors continue to incur losses. There have been attempts to improve

222
the cost monitoring and control but those attempts have not been successful. It is suggested
that BIM implementation can resolve the issues in the practice. The BIM enable QS software
tools are available in the UK market but still in practice BIM has not been taken up by the
practitioners. It is suggested that the QS professionals resist the change due to uncertainty,
insecurity and lack of BIM competency. Also the construction companies are not adopting
BIM due to the high cost of acquisition and implementation. A case study organization
“ORG-1” has been investigated with aim of identifying the most important factors impacting
BIM implementation in its cost monitoring and control. A number of factors have been
identified and have been categorised as drivers and barriers.
The management and QSs identified that the most important drivers associated with people
are enhanced role of cost manager, decision making support, collaborative working, and
support for QS tasks. The most important drivers related to cost monitoring and control
process include integration and coordination, standardisation and streamlining of the process.
Information availability, sharing, quality of data and information format are considered most
prominent information associated drivers. In relation with BIM technology QSs it has been
found that visualisation and automation are most important drivers. Moreover, the most
important factors acting as barrier for BIM implementation are resistance to change, fear of
unknown and uncertainty, lack of BIM knowledge and competency, extensive workload, lack
of leadership, organisational structure, training, organisational strategy and investment,
inadequate quality of data and information, interoperability and software compatibility issues.
From their perspective BIM has to provide the above mentioned benefits and identified
barriers have to be alleviated in order to implement BIM in ORG-1 QS department.
Although the literature suggests a large number of drivers and barriers but this research has
revealed that people in each organisation have their own opinion about BIM based on their
specific needs, organisational structure, BIM knowledge, competency and experience. In
ORG-1 the people lacked in-depth BIM knowledge and understanding and the senior
management using inadequate training methods for developing BIM competency. There is
also impression that the top management is not keen to implement BIM in the QS department
and there is serious lack of BIM enthusiast leadership capable of leading and mentoring the
team. As the research is currently in progress the next step is to investigate another
organisation for further identification of factors impacting BIM implementation.
8. REFERENCES
Abubakar, M., Ibrahim, Y. M., Kado, D., & Bala, K. (2014). Contractors' Perception of the Factors Affecting
Building Information Modelling (BIM) Adoption in the Nigerian Construction Industry. Computing in Civil
and Building Engineering (2014), 167-178. doi:doi:10.1061/9780784413616.022
Al-Jibouri, S. H. (2003). Monitoring systems and their effectiveness for project cost control in construction.
International Journal of Project Management, 21(2), 145-154. doi:http://dx.doi.org/10.1016/S0263-
7863(02)00010-8
Ashworth, A. (2010). Cost Studies of Buildings (5th ed.). Harlow: Prentice Hall.
Balfour Beatty. (2015). BIM Realising the benefits. Retrieved from
http://www.balfourbeattycsuk.com/media/197352/BIM-Realising-the-benefits.pdf
Ballard, G. (2010). Target Value Design and Integrated Project Delivery. In. Liecestershire: The University of
Loughborough, [Presentation].
Cheng, Y.-M. (2014). An exploration into cost-influencing factors on construction projects. International
Journal of Project Management, 32(5), 850-860. doi:http://doi.org/10.1016/j.ijproman.2013.10.003
Cho, D., Russell, J. S., & Choi, J. (2013). Database Framework for Cost, Schedule, and Performance Data
Integration Journal of Computing in Civil Engineering, 27(6), 719–731.
223
Cândido, L. F., Heineck, L. F. M., & Neto, J. d. P. B. (2014). Critical Analysis on Earned Value Management
(EVM) Technique in Building Construction. Paper presented at the 22nd Annual Conference of the
International Group for Lean Construction, Oslo, Norway. http://iglc.net/Papers/Details/998
Dodge Data & Analytics. (2015). Measuring the Imapact of BIM on Complex Buildings SmartMarket Report.
In. Bedford, MA.
Eastman, C., Teicholz, P., Sacks, R., & Liston, K. (2011). BIM handbook : a guide to building information
modeling for owners, managers, designers, engineers and contractors (2nd ed.). Hoboken: John Wiley &
Sons, Inc.
Egan, S. J. (1998). Rethinking Construction: The Report of the Construction Task Force. UK: Department of
Environment, Transport and Regions.
Egan, S. J. (2002). Accelerating Change: A report by the Strategic Forum for Construction Chaired by Sir John
Egan. London: Rethinking Construction.
Elbeltagi, E., Hosny, O., Dawood, M., & Elhakeem, A. (2014). BIM-Based Cost Estimation/ Monitoring For
Building Construction. International Journal of Engineering Research and Applications, 4(7(Version 4)),
56-66.
Hanid, M., Koskela, L., & Siriwardena, M. (2010). Traditional Cost Management vs. Lean Cost Management.
Paper presented at the 18th CIB World Building Congress, Salford.
Hanid, M., Siriwardena, M., & Koskela, L. (2011). What are the big issues in cost management? Paper
presented at the 19th Annual Conference of the International Group for Lean Construction, Lima, Peru.
Hillebrandt, P. (2003). Placing and Management of Building Contracts: The Simon Committee Report (1944).
In M. Murray & D. Langford (Eds.), Construction Reports 1944–98. Oxford, UK: Blackwell Science Ltd.
Hosseini, M. R., Azari, E., Tivendale, L., & Chileshe, N. (2015). Barriers to Adoption of Building Information
Modeling (BIM) in Iran: Preliminary Results. Paper presented at the The 6th International Conference on
Engineering, Project, and Production Management (EPPM2015), Gold Coast, Australia.
Isidore, L. J., & Back, W. E. (2002). Multiple Simulation Analysis for Probabilistic Cost and Schedule
Integration. Journal of Construction Engineering and Management, 128(3), 211-219.
Jackson, S. (2002). Project cost overruns and risk management. Paper presented at the 18th Annual ARCOM
Conference, Glasgow.
Jaya, N. M., Pathirage, C. P., & Sutrisna, M. (2010). An application of the activity-based costing for the
management of project overheads to increase profit during the construction stage. Paper presented at the
SPARC 2010 Conference, Mary Seacole, the University of Salford, United Kingdom.
Kehily, D. (2016). Leveraging building information modelling to address the barriers that prevent the
widespread adoption of life cycle costing by quantity surveyors. (PhD Thesis), University of Salford,
Salford, UK. Retrieved from http://usir.salford.ac.uk/38129/
Kern, A. P., & Formoso, C. T. (2004). Guidelines for Improving Cost Management in Fast-Complex and
Uncertain Construction Projects. Paper presented at the IGLC-12, Copenhagen.
http://iglc.net/conferences/2004/ConfrencePapers/PCCM/Kern%20Formoso_Guidelines%20for%20Improv
ing%20Cost%20Management%20in%20Fast-
Complex%20and%20Uncertain%20Construction%20Projects.pdf
Kulatunga, U., Amaratunga, D., & Haigh, R. (2007). Structuring the unstructured data: the use of content
analysis. Paper presented at the 7th International Postgraduate Conference in the Built and Human
Environment, Salford Quays.
Kulmala, H. I., Paranko, J., & Uusi-Rauva, E. (2002). The role of cost management in network relationships.
International Journal of Production Economics, 79(1), 33-43.
Latham, M. (1994). Constructing the Team. London: H.M.S.O. Retrieved from
http://www.cewales.org.uk/cew/wp-content/uploads/Constructing-the-team-The-Latham-Report.pdf.
Mahamid, I. (2012). Factors affecting contractor's business failure: contractors' perspectivenull. Engineering,
Construction and Architectural Management, 19(3), 269-285. doi:10.1108/09699981211219607
NBS. (2014). National BIM Report 2014. Retrieved from London: http://www.thenbs.com/pdfs/NBS-National-
BIM-Report-2014.pdf
NBS. (2016). National BIM Report 2016. Retrieved from London:
Olatunji, O. A. (2011). Modelling organizations’ structural adjustment to BIM adoption: a pilot study on
estimating organizations. Journal of Information Technology in Construction, 16, 653-668.
Olatunji, O. A., Sher, W., & Gu, N. (2010). BUILDING INFORMATION MODELING AND QUANTITY
SURVEYING PRACTICE. Emirates Journal for Engineering Research, 15(1), 67 - 70.
Ollmann, T. (2015). Project Controls: Integrating Cost and Schedule. Retrieved from www.bakertilly.com:
http://www.bakertilly.com/uploads/project-controls-integrating-cost-and-schedule.pdf
Pilcher, R. (1994). Project cost control in construction (2nd ed.). Oxford: Blackwell Scientific Publications.

224
Popov, V., Juocevicius, V., Migilinskas, D., Ustinovichius, L., & Mikalauskas, S. (2010). The use of a virtual
building design and construction model for developing an effective project concept in 5D environment.
Automation in Construction, 19(3), 357-367. doi:http://dx.doi.org/10.1016/j.autcon.2009.12.005
Potts, K. (2008). Construction Cost Management: Learning from Case Studies. In.
Raphael, V., & Priyanka, J. (2014). Role of Building Information Modelling (BIM) in Quantity Surveying
Practice. International Journal of Civil Engineering and Technology, 5(12), 194-200.
Rasdorf, W. J., & Abudayyeh, O. Y. (1991). Cost‐ and Schedule‐Control Integration: Issues and Needs. Journal
of Construction Engineering and Management, 117(3), 486–502.
Saunders, M. N. K., Lewis, P., & Thornhill, A. (2012). Research Methods for Business Students (6th ed.).
Harlow: Pearson.
Schleifer, T. C., Sullivan, K. T., & Murdough, J. M. (2014). Managing the profitable construction business : the
contractor's guide to success and survival strategies. Hoboken, New Jersey: John Wiley & Sons Inc.
Shang, Z., & Shen, Z. (2014). Critical Success Factors (CSFs) of BIM Implementation for Collaboration based
on System Analysis. Paper presented at the Computing in Civil and Building Engineering (2014), Orlando,
Florida.
Smith, P. (2014). BIM & the 5D Project Cost Manager. Procedia - Social and Behavioral Sciences, 119(0), 475-
484. doi:http://dx.doi.org/10.1016/j.sbspro.2014.03.053
Stanley, R., & Thurnell, D. (2014). The Benefits of, and Barriers to, Implementation of 5D BIM for Quantity
Surveying in New Zealand. Australasian Journal of Construction Economics and Building, 14(1), 105-117.
Sunil, K., Pathirage, C., & Underwood, J. (2015). The Importance of Integrating Cost Management with
Building Information Modeling (BIM). Paper presented at the 12th International Post-Graduate Research
Conference, Salford, UK.
Thurairajah, N., & Goucher, D. (2013). Advantages and Challenges of Using BIM: a Cost Consultant’s
Perspective. Paper presented at the 49th ASC Annual International Conference.
Turkan, Y., Bosché, F., Haas, C., & Haas, R. (2012). Toward Automated Earned Value Tracking Using 3D
Imaging Tools. Journal of Construction Engineering and Management, 139(4), 423-433.
doi:10.1061/(ASCE)CO.1943-7862.0000629
Turner, A., Edwards, J., Curran, P., & Guillemet, A. (2015) Quantity Surveying and BIM: What are the benefits
and challenges. Henry Riley BIM Webinar in Conjunction with Building Magazine Quantity Surveying and
BIM.
Willems, L. L., & Vanhoucke, M. (2015). Classification of articles and journals on project control and earned
value management. International Journal of Project Management, 33(7), 1610-1634.
doi:http://dx.doi.org/10.1016/j.ijproman.2015.06.003
Wolstenholme, A., Austin, S. A., Bairstow, M., Blumenthal, A., Lorimer, J., Mcguckin, S., . . . Guthrie, W.
(2009). Never Waste a Good Crisis: A Review of Progress Since Rethinking Construction and Thoughts for
Our Future. Retrieved from London:
Wu, S., Wood, G., Ginige, K., & Jong, S. W. (2014a). A technical review of BIM based cost estimating in UK
quantity surveying practice, standards and tools. ITcon, 19, 534-562.
Wu, S., Wood, G., Ginige, K., & Jong, S. W. (2014b). How Can BIM support the New Rules of Measurement
(NRM1)? . London, UK: RICS Retrieved from http://www.rics.org/uk/knowledge/research/research-
reports/how-does-bim-support-nrm1/.
Yin, R. K. (2014). Case Study Research: Design and Methods (5 ed.). London: Sage Publishing Ltd.
Yusuf, G. A., Mohamed, S. F., Yusof, Z. M., & Misnan, M. S. (2012). Framework for Enhancing Cost
Management of Building Services. Procedia - Social and Behavioral Sciences, 65, 697-703.
doi:http://dx.doi.org/10.1016/j.sbspro.2012.11.186
Zhao, P., & Wang, C. (2014). A Comparison of Using Traditional Cost Estimating Software and BIM for
Construction Cost Control. In ICCREM 2014 (pp. 256-264): American Society of Civil Engineers.

225
ID 099
DEVELOPMENT OF A BIM AND BARCODE BASED MATERIAL
MANAGEMENT SYSTEM FOR CURTAIN WALL INDUSTRY
Q. You1, G. Wedawatta1, N. Xu2 and N. Xu2
1 School of Engineering and Applied Sciences, Aston University,Aston Triangle,Birmingham B4 7ET,UK 2 China Smart Construction Group Co., Ltd., Nanhai Ecool, 518067,China
Email: [email protected]
Abstract: The construction industry is slower to adopt new technologies than other industries.
Traditional construction industry material management system involves tedious paperwork,
frequent phone calls and challenging coordination, posing many difficulties for the project
management. Recent development in the use of information and communication technologies
in the Architecture, Engineering and Construction (AEC), namely the building information
modeling (BIM), promises to introduce major changes in visualization, coordination and
planning processes of the engineering projects.
The impact of the building’s curtain wall has become increasingly more important when
determining the operational and economic performance of construction projects. And as a
recognized discipline of the construction industry, curtain wall design, and fabrication and
installation process involves numerous stakeholders including designers, contractors,
purchasing staff, suppliers, distributors, and on-site installers.
It is believed that the material tracking system, when integrated with BIM, can successfully
address the major problems of the curtain wall industry. In this paper, the authors analyzed the
current practice of material management in the curtain wall industry and proposed a BIM and
barcode integrated material management system, which aims to provide a BIM based material
management framework from the design phase to the construction phase, streamlining
material management process and promoting collaborative working processes in the curtain
wall industry.
Keywords: Curtain wall, BIM, Material Management, Barcode, China.
1. INTRODUCTION
Construction is the process of physically erecting the project and putting construction
equipment, materials, supplies, supervision, and management necessary to accomplish the
work (Clough and Sears 2000).Due to the complex and dynamic nature of the construction
industry, construction material management faces many challenges from material planning,
ordering, receiving and storing, handling and distribution, site usage and monitoring
(Johnston and Brennan 1996).
Construction materials contribute 50-60% of the total project costs and material’s tracking
and locating is important to ensure that materials are available at the right time, in the right
place and at the quantity required(Song and Haas and Caldas 2006). Because large amounts
of materials and components are involved in the construction projects,tracking of materials
and components in a construction project is not an easy task(Kasim et al. 2012).
Traditional construction material management processes in the construction industry still rely
on manual data and paper lists to control large amounts of engineered components which not

226
only negatively affects construction performance but also has an additional negative effect on
worker's efficiency and contributes to schedule and project delays (Kasim et al. 2012).
Issues regarding the tracking of construction materials on-site have received a great concern
in the construction industry (Kasim et al. 2012). With the ability to automating and
integrating some of the predefined tasks common to most projects, information technologies
have the potential to significantly simplify the effort of responding to the complexity and
demands that the construction industry are facing. Industry practitioners have also identified
that current material tracking field practices could be improved if aided by new information
technology devices(Liwan and Kasim and Zainal 2013).
A Building Information Model (BIM) is a data-rich, object-oriented, intelligent and
parametric digital representation of the facility, from which views and data appropriate to
various users’ needs can be extracted and analysed to generate information that can be used
to make decisions and to improve the process of delivering the facility (AGC, 2005). The
main characteristics of BIM include 3D CAD-based presentations and easy updating and
transfer of information in the BIM environment(Ho, Tserng and Jan, 2017). BIM has a
positive impact of material deliveries,which helps project stakeholders understand the
project, reduce uncertainty and improve predictability of the project(Ocheoha and Moselhi
2013).
Although one assumes these advantages, how BIM can be used from the design phase to the
construction phase in an integrated manner to improve material management has not been
fully understood.
The objective of this research is to fill this gap by analysing the practices of material
managment and proposing a BIM based material management framework for a recognized
construction industry discipline:curtainwall industry, aiming to improve low efficiency in the
traditional material information extraction and facilitate the information sharing and
communication among dispersed projected related parties. The proposed framework consists
of three parts :
1.Web based project management system for process management.
2. BIM software plug-in for quantity take-off and BOM generation.
3.A mobile app for on site material management.
2. RESEARCH METHOD
In order to identify the current practices of material management in the curtain wall industry
and the ways of improving them, questionnaire survey and literature reviews were the
methodologies conducted to achieve more valid and reliable findings. Questionnaire survey
and interviews were carried out among three curtain wall companies in China. A BIM and
barcode based material management system is presented based on the survey conclusions.
227
3. LITERATURE REVIEW
3.1 Material Management
Construction material management is critical for project success in the construction industry
(Carlos et al.2015).Each construction project is the development of a single one-of-a-kind
product which requires the joint efforts of different parties (Yeo and Ning 2002) .Owners,
contractors, subcontractors, and suppliers collaborate for a definite period of time to deliver
the project to the client (Carlos et al. 2015).
Another characteristics of construction material management is that construction materials
are less homogeneous, less standardized, and more numerous than those of manufacturing
industry and the characteristics of demand are different (Ibn-Homaid 2002).
Moreover, due to the dynamic nature of construction material management, many problems
are created due to the lack of an integrated material management approach among different
material management phases(Ren and Anumba and Tah 2010).Many contractors suffer
losses in productivity resulting from insufficient material management which eventually
affect a contractor's profit margin(Thomas and Sanvido 1989).
Problems identified from the literature regarding material management systems used by
contractors include:
1. Material shortage and wastage due to inefficient management techniques;
2. Lack of material procurement collaboration system among different parties;
3. Lack of effective on-site material control techniques.
3.2 BIM and material management
BIM is a powerful tool to support life cycle integration and the information contained in the
BIM-based design model can be shared directly among different parties which can reduce the
heavy human workload and manual errors in traditional work(Aguiar and Grilo 2015).
The benefits of BIM based material management are the accurate and automatic quantity
take-off and BOM generation, improvements in quality and waste reduction, visualization
and productivity improvements, as well as improved communication and collaboration, and
field co-ordination problems during deliveries(Ocheoha and Moselhi 2013).
An accurate quantity take-off is the start of a precise material management
process.Traditional quantity take-offs generated from 2D drawings are based on the
experience and assumptions of the engineers. The results can be overestimated and
underestimated and may contain errors and omissions. BIM can increase the accuracy in the
quantity take-off and allow precise future prediction of the construction costs(Choi, H. Kim
& I. Kim, 2014).
Radio Frequency Identification(RFID)tags can help support the tracking of component
delivery and installation onsite and BIM components that included references to RFID tags
can automatically update with links to field scanning devices and provided the contactors
with instant feedback of material status (Eastman et al., 2008).

228
4. SURVEY OF CURRENT MATERIAL MANAGEMENT PRACTICES IN THE
CURTAIN WALL INDUSTRY IN CHINA
4.1 Curtain Wall Introduction
By definition, “curtain wall “is a light secondary rigid framing system filled or covered with a
lightweight cladding(Karol 2008).Key requirements of the curtain wall are to provide air
integrity in the cladding system, adequate wind, thermal and seismic response in addition to
provide light transmittance to the interior space(Dudley 2017).Curtain walls are classified by
their method of fabrication and installation in two categories: stick built system and unitized
system (Dudley 2017).Unitized curtain wall systems are comprised of large units that are
assembled and glazed in the factory. They are then shipped to the job site and erected on the
building façade. Stick systems consist of the curtain wall frames and panels that are installed
and connected piece by piece. Curtain wall material lists include panels, framing,
connections, accessories and preembedded pieces(see Table 1).Table 1lists most common
curtain wall materials.
Table 1: Curtain wall material list
Material
classification Panels Frames Connections Accessories Preembedded pieces
Material list
glass steel steel weathering glue steel
clay board aluminum aluminum angle
code structural adhesive cast iron
aluminum veneer
stainless steel cable stainless steel screws foam rods
stone stainless steel rod bolt tape
aluminum-
plastic
rubber gasket
4.2 Survey of the current material management practice in the curtain wall industry
The questionnaire and interview methods were used in the survey and four curtain wall firms
were selected from 2016 China’s top 50 curtain wall companies list. After the analysis of the
response from the survey, one company was interviewed to achieve the detailed workflow of
the current curtain wall material management practice.
The questionnaire was divided into the following sections:
1.Orgnization background
In this section ,factual information such as the value of the projects and the types of the
contracts was requested.
2.Current material management practice
This section was designed to enable the author to identify the current material management
practice adopted by the companies and the inherent problems of traditional method.
3.Application of BIM
The purpose of this section was to collect information on BIM maturity levels in different
companies.
4.Opinion of the BIM based material management system

229
This section asked for the companies suggestions to the BIM based material management
system.
4.3 Survey results
Current contract type and material management practice
In the survey, it is concluded that most curtain wall projects in China adopt the design build
method which means the owner contracts with a single entity to provide both the design and
construction of the building. All of the stakeholders have the same goal of developing a
curtain wall system that meets the requirements and fulfilling the owner’s and architect’s
vision for the building.
When adopting the design build method, curtain wall design and engineering is a
collaborative effort among the curtain wall designer, project manager, procurement manager,
processing plant worker and on-site material administrator. The process can be divided into
the following phases(see Table2): Bidding and schematic design phase, project start-up
phase, design development and construction document phase, construction preparation phase,
engineering design and material preparation phase, material procurement phase,
transportation phase, material receiving phase and construction phase.
In the traditional method, the curtain wall designer will calculate Bill of Materials (BOM)
from 2D CAD drawings. The correctness of BOM relies on both the accuracy and level of
detail of drawings and it is difficult to check if there are omissions or mi-calculations from
2D drawings with the increasing complexity of the project. The BOM is then exchanged by
each agent for printing and recreating, which frequently results in critical errors that could
affect project cost and schedule. Besides that, some information ends up being unavailable to
parties who need access to them for the decision making process and the data is difficult to be
traced and accessed in the future. The current practice of material management is basic and
depended on paperwork and subjective decisions which contributed to late ordering and
delivery of key materials and high wastage.
Table 2: Material management process in curtain wall industry
Designer Project Manager Procurement
Manager
Processing
Plant
Material
Administrator
A.Bidding and Conceptual
Design Phase
Conceptual
design
Construction organization
planning
Project Start-up Phase
Contract
management
design task
issued and
construction
tasks issued
C. Design Development,
Construction Documents
Phase
D. Construction Preparation
Phase
Prepare project plans,
refine material preparation
plan and send it to the
designer. Review the
designer's BOM list and
send it to the procurement
manager

230
Engineering Design and
Material Preparation Phase
Refine the
design based
on material
preparation
plan and send
BOM list for
project
manager to
review
Receive
BOM list
Material Procurement and
Preparation Phase
Purchase
material
Material
processing
G.Material Transportation
Phase
H.Material Receiving and
Construction Phase Curtain wall construction
Receive
material
Suggestions to the BIM based material management system
The following summarizes the suggestions to the system by the respondents:
1. A systematic approach for project related parties to understand when and where the
materials are need and instant material information sharing scheme.
2. A systematic classification system of the curtain wall materials.
3. Improvement of BIM software functions for automatic generation of BOM lists.
4. Automatic onsite material inventory management using IOT technology.
5. A historical database as reference for future projects.
5. THE PROPOSED BIM AND BARCODE BASED MATERIAL MANAGEMENT
SYSTEM
5.1 BIM and Barcode Based Material Management System Framework
Information technologies can benefit the industry by automating and integrating some of its
predefined task functions common to most projects. The American Institute of Architects has
defined BIM as "a model-based technology linked with a database of project information”.
Considering this issues, the author proposes an innovative approach that uses BIM and
barcode to support material management process in the curtain wall industry which integrates
and streamlines material management processes throughout the project process. The shifts
from traditional paper based to the information based environment could strengthen the
automation of material management tasks and supports more accurate decisions and strategic
approaches.
The proposed system is comprised of three parts: web based project management system for
process management (see Fig1), BIM software plug-in for BOM generation (see Fig2)and a
mobile app(see Fig3) for onsite material management. The proposed system allows the
designer to initiate an automatic BOM takeoff (see Fig4)process using a BIM software plug
in and strengthen instant information sharing among project related parties. The automating
material tracking approach could have eventually provided a permanent and updated record
of the received materials as they arrive onto the site, releasing material manager from
inventorying activities. Fig5 shows the BIM based material management process.

231
Figure 1: Web based project management system
Figure2: BIM software Revit Plug in
Figure 3:Material management app

232
Figure 4:Automated generated BOM(connections)
Figure 5:BIM based material management process
5.2 LOD of BIM Models
BIM models can be developed with the progress of a project. In different procurement
phases, the model content may be different. The American Institute of Architects
(AIA)published Document E202 in 2008 describes 5 levels of development (LOD) and model
content requirements(see Table 2).For BIM model to be used for BOM generation in the
system, LOD 300 should be respected and the information attached to the BIM model should
correspond to a certain format predetermined. Fig 6 and Fig 7 are examples of LOD 300 BIM
models.

233
Table 3:Level of development and model requirements of AIA Document E202-2008
LOD MODEL CONTENT REQUIREMENT
100 height,volume, location, and orientation may be modeled in three
dimensions or represented by other data.
200 Model Elements are modeled as generalized systems or assemblies
with approximate quantities, size, shape, location, and orientation.
300
Model Elements are modeled as specific assemblies accurate in terms
of quantity,size,shape,location and orientation.Non-geometric
information may also be attached to Model Elements.
400
Model Elements are modeled as specific assemblies that are accurate
in terms of size,shape,location,quantity and orientation with complete
fabrication,assembly and detailing information
500 Model Elements are modeled as constructed assemblies actual and
accurate in terms of size, shape, location, quantity, and orientation.
Figure 6: Unitized panel LOD 300 model
Figure 7:Alumnimum frame LOD 300 model
5.3 Curtain Wall Material Classification System
To meet the need for exchanging the information of the BIM models with different
partners,the organizing of the system in a systematic way is critical for data
management(Howard, 2001).Despite the fact that there has been various classification

234
systems developed by several countries and institutions over fifty years such as Uniclass in
the UK, and OmniClass in North America (Ekholm & Haggstrom, 2011),these systems are
not specific enough for material management in curtain wall industry.For the information
flow of the system,a classification system for curtain wall material management was
developed which consists of four parts:company code,project code,delivery area code and
material type code.The material type code is classified according to the typical unitized
curtain wall materials:frames,panels.connections and accessories,preembedded pieces. Fig 8
shows an example of a type of aluminum frame described with the classification system.
CSC;;PJ2014001;;N0001;;A001-120-01A-XH
Figure 8: Example of the curtain wall material classification system
6. CONCLUSIONS
This study proposed an innovative approach of automating the material management process
for curtain wall industry to improve information management and stimulate collaboration.
For this purpose, the author first analyzed the current material management practice in the
curtain wall industry and proposed a BIM and barcode based material management system
prototype was proposed.
This BIM and barcode based material management system may reduce the time and effort
variables related with material management activities as BIM model will serve as a unique
repository of all this information used by various agents involved in the material
management process, enhancing the integrity and reliability of information used and
diminishing the errors due to information operation. This approach requires a deep
understanding about how to create the curtain wall BIM models, set up modeling
configurations, and how to classify the information included in the models using predefined
properties. This is particularly important as information flow across different agents and the
effort also requires standard business documents among various agents.
In the next stages of the research process, the author will apply the system in a pilot test and
quantify the benefits of the system.
REFERENCES
Aguiar Costa, A. &Grilo, A. (2015). BIM-Based E-Procurement: An Innovative Approach to Construction E-
Procurement. Retrieved from https://www.hindawi.com/journals/tswj/2013/170498/
Associated General Contractors of America(2005).The Contractor’s Guide to BIM, 1st ed. AGC Research
Foundation, Las Vegas, NV.
Carlos H. C., Cindy L. M., Pedro M. R.,Laure N., Daniel M. V.(2015).Materials Management Practices in the
Construction Industry .Practice Periodical on Structural Design and Construction , Vol 20, No 3. Retrieved
from : http://dx.doi.org/10.1061/(ASCE)SC.1943-5576.0000238#sthash.EsFaTQsZ.dpuf
Material type code
Delivery area code
Project code
Company code

235
Choi, J., Kim, H., & Kim, I. (2014). Open BIM-based quantity takeoff system for schematic estimation of
building frame in early design stage. Retrieved from
http://www.sciencedirect.com/science/article/pii/S22884300 14000037
Clough,R.H.,Sears,G.A. & Sears,S.K.(2000)Construction Project Management.John Wiley&Sons;USA.
Eastman, C; Teicholz, P.; Sacks, R; and Liston, K. (2008). BIM Handbook: A Guide to Building Information
Modeling for Owners, Managers, Designers, Engineers and Contractors, John Wiley and Sons, NY, 2008.
Ekholm, A., & Häggström, L.(2011). Building classification for BIM – Reconsidering the framework.
Proceedings of the CIB W078-W102: 2011 Joint International Conference. Sophia Antipolis, France; 26-28
October. Retrieved from http://2011-cibw078-w102.cstb.fr/papers/Paper-20.pdf
Ho, S., Tserng, H. & Jan, S. (2017). Enhancing Knowledge Sharing Management Using BIM Technology in
Construction.Retreived from https://www.hindawi.com/journals/tswj/2013/170498/
Howard, R. (2001). Classification of building information- European and IT systems. In B. F. Coetzee G (Ed.),
Proceedings of IT in construction in Africa. Mpumalunga, South Africa; 30 May - 1 June. Retrieved from
ITC Digital Library: http://itc.scix.net/data/works/att/w78-2001-12.content.pdf
I.A. Ocheoha, O. Moselhi(2013). Impact of Building Information Modeling on Just-In-Time material
Delivery.Proceedings of the 30th ISARC, Montréal, Canada) Pages 793-801
Johnston, R. B., Brennan, M., 1996, ‘Planning or Organising: the Implications of Theories of Activity for
Management of operations’, International Journal of Management Science, Vol. 24, No. 4, pp. 367-384.
Karol K.(2008).Review of curtain walls,focusing on design problems and solutions.Retreived from
https://c.ymcdn.com/sites/www.nibs.org/resource/resmgr/BEST/BEST2_008_EE4-1.pdf
Kasim, N. et al.,(2012). Improving on -site materials tracking for inventory management in construction
projects., Proceedings of International Conference of Technology Management,Business and
Entrepreneurship 2012, pp.2008–2013.
Liwan, S.R., Kasim, N. & Zainal, R., Materials Tracking Practices for Inventory Management in Construction
Projects.Retreived from http://eprints.uthm.edu.my/5779/1/2._Siti_Radziah_Liwan.pdf
Song, J., Haas, C.T. & Caldas, C.H., (2006). Tracking the Location of Materials on Construction Job Sites. ,
Journal of Construction Engineering and Management (September), pp.911–918.
Thomas, H.R and Sanvido, V.E, and Sanders, S.R.(1989).Impact of Material Management on Productivity,
A.S.CE Journal of Construction Engineering & Management, Vol.l 15, NO.3.743
Yeo, K. T., & Ning, J. H.(2002). “Integrating supply chain and critical chain concepts in engineer–procure–
construct (EPC) projects.” Int. J. Project Manage., 20(4), 253–262.
236
ID 100
BIOMECHANICAL TESTING OF ERGONOMIC INTERVENTIONS
FOR REBAR TYING
W. Umer, H. Li, G.P. Szeto and A.Y. Wong
Department of Building and Real Estate, The Hong Kong Polytechnic University, Hung Hom, Kowloon, Hong
Kong SAR
Email: [email protected]
Abstract: Work-related musculoskeletal disorders (MSDs) are one of the major barriers to
achieve occupational safety and health in the construction industry. Despite the omnipresence
of MSDs, construction/project managers and policy makers are not well aware of
biomechanical and physiological demands of the various construction tasks. By
comprehending the demands of these construction tasks, managers can play a vital role by
introducing ergonomic interventions. This paper presents the same concept when applied to
manual rebar tying. To alleviate risk factors of MSDs in rebar tying, four potential ergonomic
interventions are identified to be tested biomechanically. Out of total four interventions, first
one is coined by the authors whereas the other three are identified from the literature. An
experimental protocol is developed and tested (with authors-coined intervention) on
inexperience rebar workers in a simulated environment and results are reported. The results
indicate considerable efficacy against risk factors with authors-coined intervention. In the next
phase, the protocol will be tested on actual rebar workers along with testing of other
interventions. This could help in the quantitative biomechanical evaluation of ergonomic
interventions for manual rebar tying and choosing the best one based on the evidence.
Keywords: biomechanical evaluation, construction ergonomics, ergonomic interventions,
occupational safety and health, rebar tying.
1. INTRODUCTION
Among the various occupational safety and health issues in the construction industry,
musculoskeletal disorders (MSDs) are one of the most prevalent predicament (Boschman et
al. 2012; Inyang et al. 2012). These MSDs affects the construction industry negatively in a
number of ways including absenteeism from work, compensation costs, increase in training
and recruitment expenditure and delays in the work schedule(Lehtola et al. 2008; Rinder et al.
2008; Inyang et al. 2012). During 2012 in the US construction industry, 33% of all work
absenteeism was because of MSDs (BLS 2013). Likewise, in Canada, the proportion of lost
time claims because of MSDs was 42% in the year 2008 (ACSA 2009). Similarly, MSDs are
a serious threat to occupational health in Germany and UK (Arndt et al. 2005; Stocks et al.
2011).
In order to mitigate the MSDs, it is important to identify the risk factors contributing to
MSDs. Among various ergonomic risk factors, repetitive work tasks, forceful movements,
prolonged work duration and awkward postures are quite common in the construction
industry (Forde and Buchholz 2004; Haslam et al. 2005; Umer et al. 2017). In management
perspective, it is often said that if it cannot be measured, it cannot be managed (Cioffi 2006).
Previously, the ergonomic techniques utilised to identify the MSDs` risk factors mostly relied
on observational techniques (Umer et al. 2017) and did not quantify the risk factors (Marras
et al. 2010) which are necessary for appropriate evaluation (Spielholz et al. 2001). Authors`

237
previous research study presents how various biomechanical and physiological measurements
can be used to quantify the potential risk factors of MSDs among rebar workers, which could
help in proposing appropriate ergonomic interventions (Umer et al. 2017). This study
presents an experimental protocol to evaluate various alternatives which have a potential to
alleviate the respective risk factors of MSDs for rebar tying.
2. LITERATURE REVIEW
Four major MSDs risk factors` identification methods which have been used in the
construction industry include self-reporting, observational methods, computer vision and
direct-sensor based measurement methods. Self-reporting method make use of self-perceived
risk factors by the construction workers (Holmstrom et al. 1992; Latza et al. 2000;
Ekpenyong and Inyang 2014). Such data is either collected using reporting questionnaires or
interviews. Since the results are subjective and qualitative in nature, the underlying
biomechanical risk factors may remain hidden in such methods.
Observational methods are used by the experienced observers, who make use of work-
sampling technique to record different awkward postures, other risk factors and the respective
time proportion by the construction workers during work shifts (Li and Lee 1999;
Hajaghazadeh et al. 2012; Lee and Han 2013). The use of such observational methods is non-
invasive in nature, does not impede the actual construction work and also does not require
specific tools. However, such methods cannot precisely quantify the risk factors and are
heavily dependent on the observer`s experience and subjective judgement.
Recently, computer vision based methods to identify the ergonomic risk factors have been
quite popular (Han et al. 2013; Han and Lee 2013; Seo et al. 2014). Despite many advantages
of such methods such as remote monitoring of the construction workers without hindering
their work, there are some limitations too. Such limitations include the need for direct line of
sight and appropriate brightness for proper functioning and detection of the postures of the
workers (Chen et al. 2014).
In addition to the other methods, direct-sensor based methods have also been deployed for
identifying ergonomic risk factors, though their usage had been limited to laboratory studies
only. Examples include fusion of physiological monitoring and localization data of the
construction workers (Cheng et al. 2013), monitoring of angles of the body-joints (Alwasel et
al. 2013) and risk of falling among construction workers using motion sensors attached to
them (Jebelli et al. 2012). Although these methods have helped in identifying the risk factors,
monitoring of muscle activity and precise body joint movement could enhance the process.
3. BIOMECHANICAL EVALUATION OF MANUAL REBAR TYING
Among various construction trades, rebar workers are much prone to MSDs (Albers and
Hudock 2007). To identify possible risk factors of lower back disorders while manual rebar
tying, initially a laboratory biomechanical study was conducted (Umer et al. 2017). While
simulated rebar tying, muscle activity of the trunk and neck muscles was monitored using
wireless surface electromyography and trunk motion was precisely studied using IMU based
wireless motion sensors. The study revealed multiple biomechanical risk factors involved in
rebar tying in three postures investigated namely squatting, stooping and one-legged
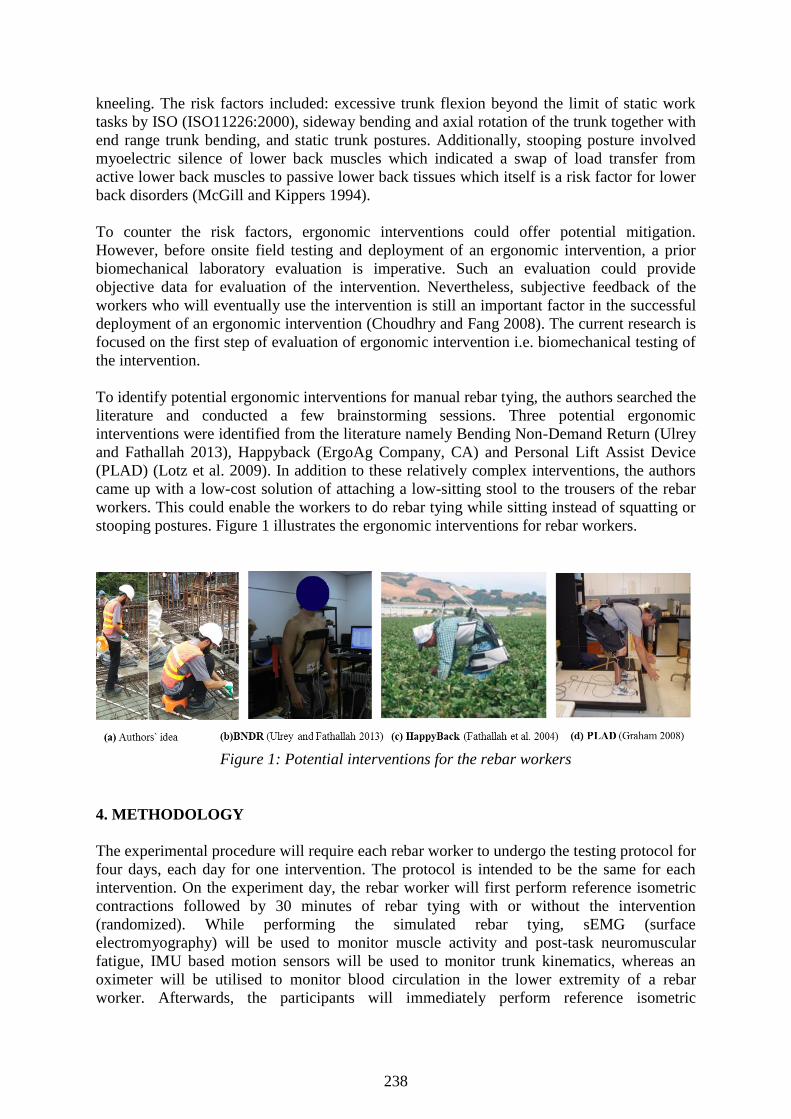
238
kneeling. The risk factors included: excessive trunk flexion beyond the limit of static work
tasks by ISO (ISO11226:2000), sideway bending and axial rotation of the trunk together with
end range trunk bending, and static trunk postures. Additionally, stooping posture involved
myoelectric silence of lower back muscles which indicated a swap of load transfer from
active lower back muscles to passive lower back tissues which itself is a risk factor for lower
back disorders (McGill and Kippers 1994).
To counter the risk factors, ergonomic interventions could offer potential mitigation.
However, before onsite field testing and deployment of an ergonomic intervention, a prior
biomechanical laboratory evaluation is imperative. Such an evaluation could provide
objective data for evaluation of the intervention. Nevertheless, subjective feedback of the
workers who will eventually use the intervention is still an important factor in the successful
deployment of an ergonomic intervention (Choudhry and Fang 2008). The current research is
focused on the first step of evaluation of ergonomic intervention i.e. biomechanical testing of
the intervention.
To identify potential ergonomic interventions for manual rebar tying, the authors searched the
literature and conducted a few brainstorming sessions. Three potential ergonomic
interventions were identified from the literature namely Bending Non-Demand Return (Ulrey
and Fathallah 2013), Happyback (ErgoAg Company, CA) and Personal Lift Assist Device
(PLAD) (Lotz et al. 2009). In addition to these relatively complex interventions, the authors
came up with a low-cost solution of attaching a low-sitting stool to the trousers of the rebar
workers. This could enable the workers to do rebar tying while sitting instead of squatting or
stooping postures. Figure 1 illustrates the ergonomic interventions for rebar workers.
Figure 1: Potential interventions for the rebar workers
4. METHODOLOGY
The experimental procedure will require each rebar worker to undergo the testing protocol for
four days, each day for one intervention. The protocol is intended to be the same for each
intervention. On the experiment day, the rebar worker will first perform reference isometric
contractions followed by 30 minutes of rebar tying with or without the intervention
(randomized). While performing the simulated rebar tying, sEMG (surface
electromyography) will be used to monitor muscle activity and post-task neuromuscular
fatigue, IMU based motion sensors will be used to monitor trunk kinematics, whereas an
oximeter will be utilised to monitor blood circulation in the lower extremity of a rebar
worker. Afterwards, the participants will immediately perform reference isometric

239
contractions as performed before rebar tying. Then, a rest of 30 minutes will be provided and
the same procedure will be repeated with the untested rebar tying method (with or without an
intervention). This procedure will be followed so that a rebar worker completes 4-day testing
protocol within a single week.
Rebar tying will be performed on a laboratory simulation setup of 1.2m by 1.2m plastic pipes
separated by 0.2m c/c (Umer et al. 2017), as depicted in Figure 2. The rebar workers will use
pigtail tool and spool wires for rebar tying.
Figure 2: Laboratory rebar tying setup
4.1 sEMG Measurement
A 16-channel wireless bipolar surface electromyography system (TeleMyo, Noraxon) will be
used to monitor muscle activity of the lower back, quadriceps and calf muscles. Lower back
muscles will include multifidus and lumbar erector spinae, quadricep muscles will include
rectus femoris whereas gastrocnemius lateratis and medialis will be monitored as calf
muscles.
Post-task neuromuscular fatigue of the aforementioned muscles will be assessed by
comparing the median frequency of the sEMG signals during the reference isometric
contractions performed before and just after rebar tying. The decrease in median frequency is
considered as an objective indication of neuromuscular fatigue (Potvin and Norman 1993).
Reference isometric contractions for each muscle will be consisting of three 5-second
contractions separated by five seconds. Firstly, contractions will be performed for the lower
back muscles as standardized by Coorevits et al (2008). Then quadricep specific contractions
will be performed as suggested by Pincivero et al (2000) followed by contractions of calf
muscles as recommended by Kasahara et al (2007).
4.2 Trunk Kinematics
For quantification of precise trunk flexion angles, movement of the upper back and lower
back will be tracked by placing three IMU based wireless motion sensors (MyoMotion,
Noraxon) placed at spinal levels of T4, T12, and S1. The data will be captured throughout the
rebar tying task at the frequency of 100Hz. Erect standing posture prior to rebar tying will be
calibrated as zero-degree flexion whereas subsequent forward bending will be considered as
positive flexion.
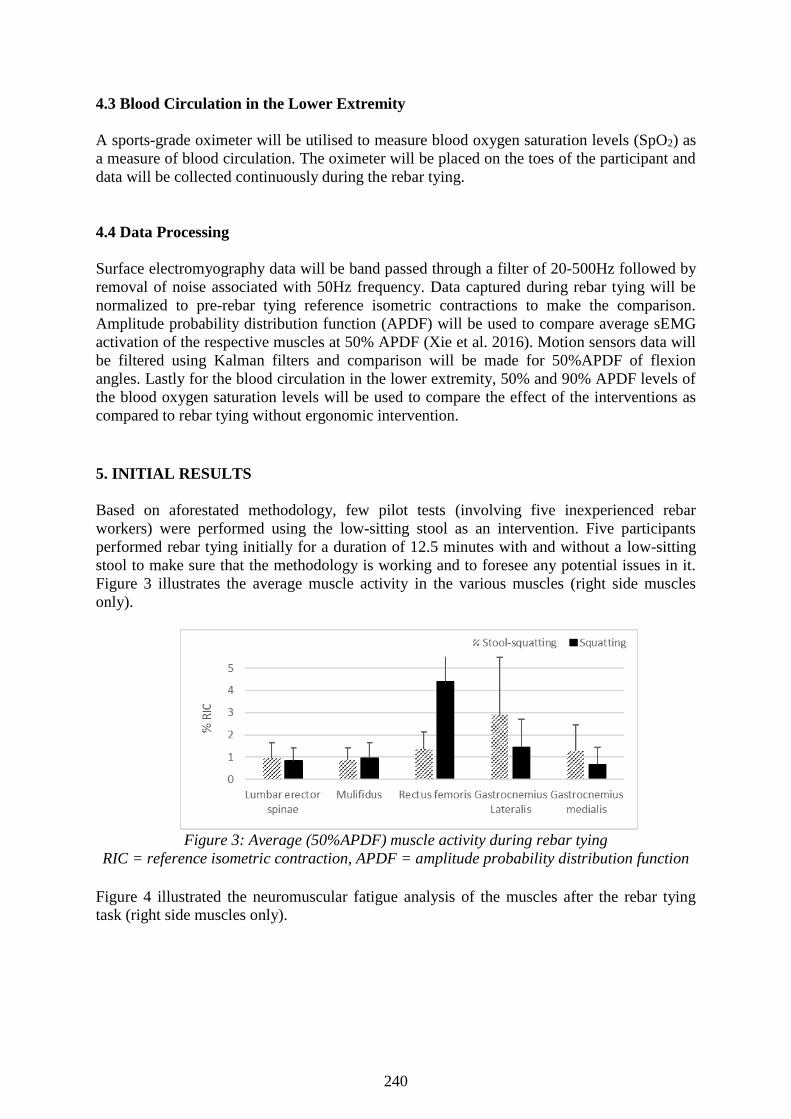
240
4.3 Blood Circulation in the Lower Extremity
A sports-grade oximeter will be utilised to measure blood oxygen saturation levels (SpO2) as
a measure of blood circulation. The oximeter will be placed on the toes of the participant and
data will be collected continuously during the rebar tying.
4.4 Data Processing
Surface electromyography data will be band passed through a filter of 20-500Hz followed by
removal of noise associated with 50Hz frequency. Data captured during rebar tying will be
normalized to pre-rebar tying reference isometric contractions to make the comparison.
Amplitude probability distribution function (APDF) will be used to compare average sEMG
activation of the respective muscles at 50% APDF (Xie et al. 2016). Motion sensors data will
be filtered using Kalman filters and comparison will be made for 50%APDF of flexion
angles. Lastly for the blood circulation in the lower extremity, 50% and 90% APDF levels of
the blood oxygen saturation levels will be used to compare the effect of the interventions as
compared to rebar tying without ergonomic intervention.
5. INITIAL RESULTS
Based on aforestated methodology, few pilot tests (involving five inexperienced rebar
workers) were performed using the low-sitting stool as an intervention. Five participants
performed rebar tying initially for a duration of 12.5 minutes with and without a low-sitting
stool to make sure that the methodology is working and to foresee any potential issues in it.
Figure 3 illustrates the average muscle activity in the various muscles (right side muscles
only).
Figure 3: Average (50%APDF) muscle activity during rebar tying
RIC = reference isometric contraction, APDF = amplitude probability distribution function
Figure 4 illustrated the neuromuscular fatigue analysis of the muscles after the rebar tying
task (right side muscles only).

241
Figure 4: Muscle fatigue analysis using median frequency of sEMG during RICs
RIC = reference isometric contraction, MF = median frequency
Figure 5 depicts the variation in trunk angles in two different rebar tying technique i.e. with
stool and without the stool.
Figure 5: Trunk flexion angles during rebar tying
Figure 6 shows the variation in SpO2 levels between the two rebar tying techniques.
Figure 6: SpO2 levels during rebar tying
APDF = amplitude probability distribution function
242
6. DISCUSSION
The initial experiments have revealed that the methodology is viable to biomechanically
evaluate various interventions among rebar workers. Because of the small sample size
involved in the initial experiments, any statistical test is not conducted. It is hoped that with
an increased sample size in actual experimentations, statistical differentiation among various
parameters will be there for distinct interventions. Nevertheless, some trends can be still seen
in these initial experiments.
Muscle activity for various muscles has been noticed to be of lower magnitude i.e. less than
5% of reference isometric contraction during rebar tying with or without low-sitting stool.
This indicates that while squatting or stool-squatting does not require a large activity by the
respective muscles. This notion is also supported by median frequency analysis which reveals
no substantial decrease i.e. absence of neuromuscular fatigue post rebar tying. However, the
use of stool seems to be beneficial in decreasing the flexion angles for both upper and lower
back. Similarly, stool-sitting rebar tying has shown to be enhancing the blood circulation in
the lower extremity as compared to rebar tying in squatting posture.
Although subjective measurements of perceived discomfort/pain were not measured in the
pilot tests, the participants reported severe discomfort after rebar tying in squatting posture.
This could be related to blood circulation in the lower extremity. It is known that poor
circulation is linked to poor muscle oxygenation which in return could cause muscle fatigue
and pain. Conversely, stool-squatting enhanced the blood circulation and the participants did
not complain of any discomfort. This suggests including measurement of perceived
discomfort scores too in such evaluation of ergonomic testing. Overall, stool-squatting seems
to be helpful in relieving the postural loads and seems to be a better alternative to rebar tying
in squatting posture.
7. CONCLUSIONS
MSDs are extensively prevalent in the construction industry. To alleviate the problem, there
is a need for a systematic approach to cater these issues. Biomechanical evaluations and
subsequent effective ergonomic interventions could potentially help in mitigating the wide
prevalence of MSDs in the construction industry. Based on the identical strategy, the authors
have previously biomechanically evaluated the risk factors of MSDs in the manual rebar
tying. Now a framework is presented, showcasing the probable ergonomic interventions that
could minimize or eliminate the risk factors of MSDs and a biomechanical scheme to
evaluate these interventions. The initial results have shown that scheme is workable. Future
experiments with a larger pool of actual rebar workers and involving all identified
interventions would better highlight statistical-biomechanical advantages and disadvantages
of various proposed interventions.
8. REFERENCES ACSA 2009, Lost-time claims, disabling injury claims and claim rates—2004 to 2008, Available at:
http://employment.alberta.ca/ documents/WHS/WHS-PUB-2009-data-analysis.pdf.
Albers, J.T. & Hudock, S.D., 2007. Biomechanical assessment of three rebar tying techniques. International
journal of occupational safety and ergonomics : JOSE, 13(3), pp.279–289.
Alwasel, A. et al., 2013. A human body posture sensor for monitoring and diagnosing msd risk factors. In
Proceedings of the 30th ISARC, 11-15 August 2013 Montréal, Canada. pp. 531–539.

243
Anon, Happyback.
Arndt, V. et al., 2005. Construction work and risk of occupational disability: a ten year follow up of 14474 male
workers. Occupational and Environmental Medicine, 62(8), pp.559–567.
Boschman, J.S. et al., 2012. Musculoskeletal disorders among construction workers: a one-year follow-up study.
BMC Musculoskeletal Disorders, 13(1).
BLS 2013, Bureau of Labor Statistics, Nonfatal occupational injuries and illnesses requiring days away from
work, 2012.
Chen, J., Ahn, C.R. & Han, S., 2014. Detecting the hazards of lifting and carrying in construction through a
coupled 3D sensing and IMUs sensing system. In Computing in Civil and Building Engineering. pp. 1110–
1117.
Cheng, T. et al., 2013. Data fusion of real-time location sensing and physiological status monitoring for
ergonomics analysis of construction workers. Journal Of Computing In Civil Engineering, (JUNE), pp.320–
335.
Choudhry, R.M. & Fang, D., 2008. Why operatives engage in unsafe work behavior: Investigating factors on
construction sites. Safety Science, 46(4), pp.566–584.
Cioffi, D.F., 2006. Designing project management: A scientific notation and an improved formalism for earned
value calculations. International Journal of Project Management, 24(2), pp.136–144.
Coorevits, P. et al., 2008. Assessment of the validity of the Biering-Sorensen test for measuring back muscle
fatigue based on EMG median frequency characteristics of back and hip muscles. Journal of
Electromyography and Kinesiology, 18, pp.997–1005.
Ekpenyong, C.E. & Inyang, U.C., 2014. Associations between worker characteristics, workplace factors, and
work-related musculoskeletal disorders: A cross-sectional study of male construction workers in Nigeria.
International Journal of Occupational Safety and Ergonomics, 20(3), pp.447–462.
Forde, M.S. & Buchholz, B., 2004. Task content and physical ergonomic risk factors in construction ironwork.
International Journal of Industrial Ergonomics, 34(4), pp.319–333.
Hajaghazadeh, M. et al., 2012. An ergonomic study in building demolition: Assessment of musculoskeletal
disorders risk factors by PATH method. International Journal of Environmental Health Engineering, 1(43),
pp.1–5.
Han, S. & Lee, S., 2013. A vision-based motion capture and recognition framework for behavior-based safety
management. Automation in Construction, 35, pp.131–141.
Han, S., Lee, S. & Peña-mora, F., 2013. Vision-Based Detection of Unsafe Actions of a Construction Worker :
Case Study of Ladder Climbing. Journal Of Computing In Civil Engineering, 27, pp.635–644.
Haslam, R.A. et al., 2005. Contributing factors in construction accidents. Applied Ergonomics, 36(4), pp.401–
415.
Holmstrom, E.., Lindell, J. & Moritz, U., 1992. Low back and neck/shoulder pain in construction workers:
occupational workload and pscychosocial risk factors. Spine, 17(6), pp.663–671.
Inyang, N. et al., 2012. Ergonomic analysis and the need for its integration for planning and assessing
construction tasks. Journal of Construction Engineering and Management, 138(December), pp.1370–1376.
Jebelli, H., Ahn, C.R. & Stentz, T.L., 2012. Comprehensive fall-risk assessment of construction workers using
inertial measurement units : validation of the gait-stability metric to assess the fall risk of iron workers.
Journal of Computing in Civil Engineering.
Kasahara, S., Ebata, J. & Takahashi, M., 2007. Analysis of the repeated one-leg heel-rise test of ankle plantar
flexors in manual muscle testing. Journal of Physical Therapy Science, 19, pp.251–256.
Latza, U. et al., 2000. Cohort study of occupational risk factors of low back pain in construction workers.
Occupational and Environmental Medicine, pp.28–34.
Lee, T.-H. & Han, C.-S., 2013. Analysis of working postures at a construction site using the OWAS method.
International Journal of Occupational Safety and Ergonomics, 19(2), pp.245–250.
Lehtola, M.M. et al., 2008. The effectiveness of interventions for preventing injuries in the construction
industry, A Systematic Review. american journal of preventive medicine, 35(1), pp.77–85.
Li, K.W. & Lee, C., 1999. Postural analysis of four jobs on two building construction sites : an experience of
using the OWAS method in Taiwan. Journal of Occupational Health, pp.183–190.
Lotz, C.A. et al., 2009. The effect of an on-body personal lift assist device (PLAD) on fatigue during a repetitive
lifting task. Journal of Electromyography and Kinesiology, 19, pp.331–340.
Marras, W.S. et al., 2010. Quantitative dynamic measures of physical exposure predict low back functional
impairment. Spine, 35(8), pp.914–923.
McGill, S.M. & Kippers, V., 1994. Transfer of loads between lumbar tissues during the flexion-relaxation
phenomenon. Spine, 19(19), pp.2190–2196.
Pincivero, D.M. et al., 2000. Quadriceps-hamstring EMG activity during functional, closed kinetic chain
exercise to fatigue. European Journal of Applied Physiology, 81, pp.504–509.

244
Potvin, J.R. & Norman, R.W., 1993. Quantification of erector spinae muscle fatigue during prolonged, dynamic
lifting tasks. European Journal of Applied Physiology and Occupational Physiology, 67, pp.554–562.
Rinder, M.M. et al., 2008. Interventions in the Construction Industry : A systematic review and critical
appraisal. Human Factors and Ergonomics in Manufacturing, 18(2), pp.212–229.
Seo, J. et al., 2014. Motion data-driven biomechanical analysis during construction tasks on sites. Journal of
Computing in Civil Engineering.
Spielholz, P. et al., 2001. Comparison of self-report, video observation and direct measurement methods for
upper extremity musculoskeletal disorder physical risk factors. Ergonomics, 44(6), pp.588–613.
Stocks, S.J. et al., 2011. Occupation and work-related ill-health in UK construction workers. Occupational
Medicine, 61, pp.407–415.
Ulrey, B.L. & Fathallah, F.A., 2013. Effect of a personal weight transfer device on muscle activities and joint
flexions in the stooped posture. Journal of Electromyography and Kinesiology, 23(1), pp.195–205.
Umer, W. et al., 2017a. Identification of Biomechanical Risk Factors for the Development of Lower-Back
Disorders during Manual Rebar Tying. Construction Engineering and Management, 143(1).
Xie, Y. et al., 2015. A comparison of muscle activity in using touchscreen smartphone among young people
with and without chronic neck–shoulder pain. Ergonomics, 28, pp.1–12.

245
ID 111
BUILDING INFORMATION MODELLING (BIM) EDUCATIONAL FRAMEWORK FOR
THE QUANTITY SURVEYING STUDENTS: SRI LANKAN PERSPECTIVE
A. Rathnayake, U. Kulatunga and P. Coates
School of the Built Environment, University of Salford, Salford, M5 4WT, UK
Email: [email protected]
Abstract: Building Information Modelling (BIM) still not implemented within the Sri Lankan
construction industry. Hence recent years the wave of BIM has been hitting the shores of the
Sri Lankan construction industry. Never-theless, the Conventional practice of quantity
surveyors (QS) undermines the effectiveness and efficiency of quantity surveying profession.
The QS profession adheres to the 5th dimension of BIM, which invariably trans-lates to the
context of costing, offering the capability to generate quantity take-off, counts, and
measurement directly from a model. BIM digitalized data lead to accurate automated
estimation which reduces variability in cost estimation. However, several barriers hinder the
usage and acceptance of BIM into QS practice. From the academic point of view, requirements
to meet this paradigm shift to BIM requires an enhancement to the exist-ing set of skills and
knowledge available in Sri Lankan institutions of higher learning. Nevertheless, most of the
BIM adopted countries adopted BIM through nationally developed strategies and frameworks.
This paper describes the educational framework, to integrate BIM with quantity surveying
education with a prime focus on the QS scope of work. The primary aim of the framework lies
in integrating BIM with quantity surveying higher education by equipping QS graduates with
the necessary BIM skills in project delivery.
Keywords: Building Information Modelling, Education, Framework, Quantity Surveying, Sri
Lanka.
1.0 INTRODUCTION
It is important to complete a construction project within predetermined parameters of time, cost and quality for a
successful outcome. Cost is one of the critical success factor and prominent parameter among time, cost and
quality. Therefore, managing construction cost within client’s budget is one of the challenging roles in
construction project life cycle (Azar et al 2008). Quantity Surveyor (QS) is an expert in the art of costing a
building at all its stages who offer expert advice on construction costs (Kulasekara, Jayasena, & Ranadewa,
2013). Table (1) highlights the areas of QS involvement during the construction lifecycle of a project both pre-
and-post construction.
Table 1: Stages of QS involvement in construction (Olatunji et al., 2010; Fung et al., 2014)
Pre-Construction Stage Post-Construction Stage
Preliminary estimates and feasibility studies General contractual advice
Cost plans and schedules Assessing interim payments
Bills of quantities preparation
Evaluating variation
Procurement and tendering procedures
Preparing finance statements
Evaluation of tenders Settling final account
Alternative dispute resolution
However, it is noticeable in Sri Lankan Quantity Surveyors still following the old-fashioned
practice which involves dull and time-consuming wastages (Kulasekara et al; 2013, De Silva

246
et al; 2014, Amaratunga et al; 2006, Dissanayake et al; 2015). Even though there are
developed technologies available to make life easier, Quantity Surveyors still using Excel
spreadsheets, 2D CAD and departmental silos (Ingram, 2015). According to the result of a
recent survey conducted by the (Abeywardhana, 2016), Microsoft Excel, AutoCAD,
Autodesk quantity takes off, build soft takeoff 2 are the most popular software tools among
Sri Lankan quantity surveyors. Adoption of traditional methods prone to human errors,
wastages, and less efficient work. Therefore, there's a need of adopting modern technology
into Sri Lankan quantity surveying firms to eliminate these fundamental challenges from the
construction process.
According to Farida and Iman (2001), Abdullah and Haroon (2006), Ching and Sia (2013),
Building information modeling
CAD
Master Bill
BUildsoft global estimating system
RIPAC estimating system
Quality service management system (QSM) and
CATO
are the specialized software for quantity surveying practice.
Even though CAD is the most popular and widely used tools to address issues in on-site or
off-site, according to EIU (2015), BIM has identified as true industry game changer. "BIM
has brought huge benefits to the construction industry, being able to visualize things from a
2D drawing in three dimensions gives us the ability to avoid design conflicts before
construction even starts" (Halvorson, 2015). Nevertheless, BIM is relatively a new
"BUZZWORD" for the Sri Lankan construction industry (Jayasena and Weddikkara 2012).
Hence, BIM is more likely to become an industry standard for project design and also a
fundamental tool in project procurement in near future (Jayasena et al 202, 2013). However,
BIM currently not practicing among the Sri Lankan quantity surveyors.
Therefore, a systematic approach is required to identify the key components that require for
implementing BIM (Jayasena et al, 2013). Education is one of the key requirement to adopt
BIM into Sri Lankan context. There is a great opportunity for educators to train quantity
surveying undergraduates, in the use of BIM and the concepts of quantity surveying, before
they learn about the “old ways” of working in the industry. These new QS graduates are
likely to have a profound effect on the industry and to lead the charge in adopting BIM and
developing innovative approaches to working practices (Macdonald & Mills, 2011).
Nevertheless, Sri Lankan higher education still fails to integrate BIM with the existing
quantity surveying curriculum. However, most of the developed countries have adopted BIM
through nationally developed strategies and frameworks (Rogers et al, 2015).
These frameworks may not be readily adaptable for the Sri Lankan context due to
considerable levels of industry and technological maturities. Jayasena et al, (2013) also,
emphasized that a proper technological framework for BIM adoption will be a key
requirement. Therefore, the aim of this paper is to develop a BIM adoption educational
framework to integrate BIM with exsiting quantity surveying education curriculum for the
Sri Lankan quantity surveying students. The structure of the paper are as follows,
Conventional QS practice
BIM Competencies for Quantity Surveyors
Challenges to implementing BIM in Sri Lankan context
247
Existing frameworks in BIM education
Methodology and Data Analysis
Framework and discussion
1.1 Conventional Quantity Surveying practice
Most of the project information comes in the form of 2D drawings prepared by architects
(Kelleher, 2016). These drawings consist of objects created with lines, arcs, and circles which
define it’s all set of properties such as length, width, material, weight (Jayasena et al, 2013).
Even though these lines, arcs, and circles are sources of information they are not linked with
the object for which they display information for. Also, changing the properties (lines, arcs,
and circles) of the object requires and information updating accompanying it.
Notwithstanding this results risk of double checking and updating of the same object
represented on several different elevations such as plans, sections, and elevations (Crotty,
2012). Repeated information and missing elements in incomplete design drawings result in
misinterpretation (Crotty, 2012).
Quantity surveyor’s role based on these 2D drawings mainly in taking off quantities and
preparation of BOQ. The accuracy of the work depends on complete drawings with good
quality information provided by the design team (Pittard & sell, 2016). Hence, most of the
drawings come with multiple errors as mentioned above. It will undermine the accuracy of
the quantity surveyor’s role by creating following factors,
Errors associated with moving data between files
Risk of double counting
Risk of missing elements
Multiple 2D drawings themselves are likely to contain many errors compounding the
problem further.
Incomplete drawings increase the complexity of the drawing causes quantity surveyor’s role
to become inefficient and timely process (Crotty, 2012). Most of the problems occur when
documents passed between different members of the project team. Misinterpretation,
misalignments, and assumptions all result in an inaccurate and inefficient process, which
undermines the accuracy of quantity surveyor’s role (Crotty, 2012). Eastman, et al., (2011)
also notes the cost and delays that are associated with a paper transaction within the Quantity
surveying process. However, Dada & Jagboro, (2012), stated that "Quantity Surveying
profession is constantly confronted with challenges and opportunities in new markets" due to
increased demand for modern technological concepts and rapid changing construction
environment. With that, in most of the countries quantity surveying profession going through
a transforming period (Cartlidge, 2006).
1.2 BIM Competencies for Quantity Surveyors
Building information modelling (BIM) is capable of handling and providing better solutions
for most of the challenges in the construction world. “Building Information Modelling (BIM)
is a digital representation of physical and functional characteristics of a building creating a
shared knowledge resource for information about it forming a reliable basis for decisions
during its life cycle, from earliest conception to demolition” (Snook, 2011). As an emerging
enabling technology, Building Information Modelling (BIM), is widely promoted in the UK,
USA, Ireland, Canada (Zhou et al, 2012). For Quantity Surveyors BIM provides many
advantages into their daily business on following areas (RICS (2011).

248
1.1.1 Preliminary cost estimates
Traditional QS's practice at this stage prone to errors as well as being time-consuming due to
complexities in 2D drawings (Jayasena et al, 2013). BIM models offer accurate cost estimates
by enabling more accurate quantity to take off at an early stage of the design process (Boom,
2009). Moreover, BIM assists QS's through various tasks like cost effects of additions and
modifications to avoid cost and time overruns (Zhou et al 2012). Compensation can increase
by reducing the time for detail estimate if BIM model shared with the contractor (Colleen,
2009).
1.2.2 5D Cost planning
Cost planning provides a basis for cost control (Hua, 2010), by predicting contract sum by
providing cost targets to different parts of the building. This ensures that the client receives
expected project outcomes from inception to execution of the project (Brandtman, 2013).
Nevertheless, BIM provides facilities for QS to do cost plan automatically through the
building elements rather doing it manually.
1.2.3 Cost Estimating
Whatmore (2012), highlighted "one of the key benefits of BIM is that it allows our Quantity
surveyors to focus more on other value-adding services for their projects-rather than spending
up to 80% of their time measuring quantities”. Unlike 2D drawings, BIM models integrated
with cost information from an estimation database which reduces the errors and omissions
(Jayasena et al, 2013). Therefore, it can reduce the time for quantity take off by allocating
more time to other activities such as assemblies, generating pricing and factoring risks
(Autodesk, 2013). However, BIM models can provide alternative cost information to the
client throughout the project lifecycle. In terms of life cycle costing BIM offers an
opportunity for QS's to provide further data to the client (Saint, 2012).
1.2.4 Preparing Bills of Quantities
4D modelling capabilities of BIM is now liable for executing most of the traditional QSs
functions automatically (Jayasena et al, 2013). It allows computerizing the measurements of
quantities from construction drawings. This provides QS to have quantities and specified
materials in electronic format. BOQ can be generated automatically with the utilization of
correctly configured BIM models (BIM outsourcing, 2013).
Apart from above-mentioned points, BIM provides high-quality information at the bidding
stage to by enabling more accurate bids (AIA, 2008 & Graham, 2010). 3D BIM enables
accuracy and transparent cost control with quality information management throughout the
project lifecycle (Green, 2008). Therefore, following reasons evaluated the importance of
adopting BIM into the QS profession,
30% of projects do not meet original program or budget
92% of clients said that designer’s drawings are typically not sufficient for
construction
37% of materials used in construction become waste
10% of the cost of a project is typically due to change orders
38% of carbon emissions are from buildings not cars (Thomas, 2010).

249
Moreover, BIM is considered as highly significant to the future development of construction
information technologies and to the construction industry (Azhar and Brown, 2009).
Therefore, BIM-based project delivery will be highly benefitted for the future of Quantity
Surveyors.
1.3 Challenges to implementing BIM in Sri Lankan context
BIM is relatively a new buzzword, for the Sri Lankan construction industry (Weddikkara).
According to a recent study conducted by Nagalingam, Jayasena and Ranadewa (2013) have
found that the BIM still not adopted into Sri Lankan Quantity surveying industry. Several
barriers undermine the adoption of BIM into QS practice described in the literature. Eastman
et al (2011) posited that the barriers to BIM adoption fall into two categories: process barriers
to the business including legal and organizational issues that prevent the adoption; and
technology barriers related to readiness and implementation. A recent survey conducted UK
reported the lack of education and training is one of the primary barriers to adopting BIM into
quantity surveying firms (Abubakar et al). Similarly, another survey by RICS (2011) revealed
the following as the potential barriers to BIM adoption amongst quantity surveyors, lack of
clients demand for BIM in their projects, lack of standards to guide implementation, lack of
government lead/direction, lack of IT infrastructure, lack of new or amended conditions of
contract; and lack of education and training (BCIS, 2011).
To implement BIM among Sri Lankan quantity surveyors skilled graduates required for the
employment. The McGraw-Hill report (2009) opined that BIM inclusion into education
pedagogy is crucial in preparing skilled graduates for employment in the industry. However,
due to absence of BIM in Sri Lankan education curriculum, inadequate time and resource
deployment to develop curriculum, lack of available BIM reference materials, inadequate
skills on software, reluctance by students and faculty on the need to transform in line with
advancement in technology-based curriculum (Sabongi and Arch, 2009; Clevenger et al.
2010; Enegbuma et al., 2010; Sylvester and Dietrich, 2010) and limited occurrence of
research into BIM potentials in the QS profession (Mitchell, 2012; Perera et al., 2011; Fung
et al., 2014) have undermine the use of BIM
within the industry.
1.4 Existing frameworks in BIM education
An established BIM education framework will
guide to incorporate BIM into AEC industry
(Macdonald and Mills, 2011). Moreover, IMAC
BIM education framework developed by
Macdonald in 2012, help teachers to alter their
existing education curriculum to improve BIM
education among AEC students (Macdonald
2012). The framework consists of four stages
such as Illustration, Manipulation, Application
and Collaboration. As proposed by Bloom et al.
(1956), all the stages merged with three
different taxonomy such as cognitive, affective
and psychomotor and Krathwohl et al. (1964),
which extended the classification to include
Figure 14: IMAC BIM Education Framework
Australia (Macdonald, 2012)

250
changes in interest, attitude, and values. The full IMAC education model is illustrated in
figure 1.
BIM Academic Forum (BAF) the UK, have also published BIM learning outcome framework
(HEA, 2013), by highlighting desired to learn outcomes on BIM; industry to push for student
employability with BIM competence; framework for learning and; the need to keep pace with
the development of BIM (Ali et al 2016). The learning outcomes of the framework being
established considering the need to improve the skills of staffs to support the delivery of the
desired learning outcomes on BIM; industry to push for student employability with BIM
competence; a framework for learning and; the need to keep pace with the development of
BIM. The learning outcomes of the following framework are divided as follows,
level 4 (year one of undergraduate study) - Where students will be introduced to
context and background of the industry professions and how collaboration within the
BIM technology works
Level 5 (year 2 of undergraduate study) - entails developing the knowledge and
understanding of BIM as a business driver for collaborative works which affects the
whole life cycle cost of projects.
Level 6 (year 3 and potentially after a year out in industry) - focuses on building
competence and knowledge around people, systems, and process (HEA, 2013).
Figure 15: Initial UK BIM Learning Outcome Framework (HEA, 2013)

251
Colorado State University (CSU) deployed BIM framework into two stages such as
introductory BIM software course and integrating BIM with stand-alone modules like
sustainable
design and construction, pre-construction, cost estimating, scheduling, contracts, and material
and methods (Ali et al, 2016). The framework illustrates the need for teaching BIM with
fundamental construction concepts for its best-practice. BIM implementation can be done
into following three processes such as single course module (Hu, 2007; Nielsen et al., 2009),
interdisciplinary (Hedges et al., 2008; Plume and Mitchell, 2007) and distance collaboration
(Hedges et al., 2008; Dilg, 2008), (Barison and Santos, 2010a).
2.0 METHODOLOGY
The findings of this paper were represented through the process of critical literature review
and a questionnaire. The first step of the study involved the gathering of more insight into
educational research and framework across the globe. An extensive literature review was
carried out to derive the objectives, medium, and learning outcome to be adopted in the BIM
education framework for quantity surveying students (Creswell, 2012). The second step was
conducted to gather required data to established framework. Findings were collected through
a questionnaire survey among 25 participants. This number consists of quantity surveyors and
academic professionals. Construction professionals consist with trainee quantity surveyors
and professional quantity surveyors who are having more that 10 years of industry
experiences in quantity surveying profession. Most of the respondents were registered
members of the IQSSL (Institute of quantity surveyors’ Sri Lanka).
The questionnaire was designed into 5 stages namely
1. To identify the level of academic qualifications of construction professionals
2. To identify the fundamental deficiencies in Sri Lankan quantity surveying practice
3. Capabilities of BIM
4. Barriers to implementing BIM
5. How to integrate BIM into current Sri Lankan education curriculum
To identify and ascertain the factors which can make a significant impact on the current QS
practice, Relative Importance Index (RII) was employed. (MS Excel was used to analyse the
quantitative data collected in this study).
The following formula was used for the calculation of the Relative Importance Index (RII),
RII= (0≤RII≤1)
A ∗ N
Formulae 01: RII formulae
W - Weighting is given to each statement by the respondents and ranges from 1 to 5.

252
A - Highest response integer (5).
N - Total number of respondents.
The sample population for the questionnaire survey was selected to cover overall quantity
surveying practitioners in various sectors such as trainee QSs, lectures, senior QSs and
chartered QSs in Sri Lanka.
3.0 DATA ANALYSIS AND RESULTS
According to the collected data 55% of assistant quantity surveyors, 4% of charted quantity
surveyors, 15% of senior quantity surveyors, 20% of trainee quantity surveyors and 6% of
academic professionals were involved for the questionnaire surveyor of this study. Out of
them, the majority of the respondents have obtained a Higher National Diploma (HND)
which is 42% as their academic qualifications. Apart from that 2% obtained MSc, 30% were
BSc and 26% of them were diploma holders. This result reveals that the diploma and BSc
level is the most fundamental education level for Sri Lankan quantity surveyors.
Table 2: Significant issues in conventional QS practice
Factors 1 2 3 4 5 6 7 W RII Rank
Measurements 0 0 0 0 0 0 8 56 1.000 1
Draughtsmanship 0 0 0 0 0 2 6 54 0.964 2
Cost planning 0 0 0 0 0 3 5 53 0.946 3
Estimation 0 0 0 0 0 4 4 52 0.929 4
Poor communication and conflicts 0 0 0 0 0 5 3 51 0.771 5
As shown in Table (2) the questionnaire survey demonstrated that the “Measurements” is the
most significant issue that has been faced by the Sri Lankan construction sector due to
deficiencies of the conventional methods being used in the current Sri Lankan Quantity
surveying practice. Apart from that, it is being identified that traditional practice of
Draughtsmanship, Cost Planning, Estimation and Poor communication and conflicts are also
undermining the accuracy of quantity surveying profession. Hence, "Poor communication
and conflicts" was considered as an insignificant issue, because its RII value ranked below
the average of RII value (RII 0.922). Even though the literature review this study
anticipated that the most of Sri Lankan QSs were not aware of BIM; the majority of
respondents (64%) stated that they were aware of BIM and its potentials and the percentage
of respondents who do not aware about BIM can be identified as 36%. Results demonstrate
that most of the present QSs are aware of BIM and its potentials than past years.
Table 3: Barriers to implementing BIM
FACTORS 1 2 3 4 5 6 7 W RII Rank
Unawareness of benefits that the adoption of
BIM can bring to the organization 0 0 0 0 0 2 6 54 0.964 1
High costs of software/hardware upgrades 0 0 0 0 0 3 5 53 0.946 2

253
Lack of experience and knowledge 0 0 0 0 1 2 5 52 0.929 3
High cost for training existing staff 0 0 0 0 0 5 3 51 0.911 4
Lack of client demand 0 0 0 0 1 4 3 50 0.893 5
Lack of BIM specialists in the region 0 0 0 0 3 3 2 47 0.839 6
According to the results shown in Table (3) High cost for training to existing staff, Lack of
BIM specialists in the region, Unawareness of benefits that the adoption of BIM can bring to
the organization, Lack of experience and knowledge and Lack of client demand are the
significant identified barriers for the adoption of BIM applications to the Quantity surveying
practice in Sri Lanka.
Table 4: Solutions to Overcome BIM implementation within the education sector
Factors 1 2 3 4 5 6 7 W RII Rank
Conducting Seminars, workshops and
short courses
0 0 0 0 0 2 6 54 0.964 1
BIM is required to be added as a
mandatory module to the Quantity
Surveying Education
0 0 0 0 0 4 4 52 0.929 2
Recognize the benefits and importance
of using BIM
0 0 0 1 3 4 51 0.911 3
According to the results shown in Table (4) majority of the interviewees highlighted that the
“Conducting seminars, workshops and short courses” as the most significant strategy required
to be undertaken in order to promote the adoption of BIM applications. In addition, "BIM is
required to be added as a mandatory module to the Quantity Surveying Education" and
"Recognize the benefits and importance of using BIM" were ranked by them for the second
and third places with RII of 0.929 and 0.911 respectively.
4.0 FRAMEWORK AND DISCUSSION
The FW were developed based on the findings of the literature review and the questionnaire
surveyor conducted among the Sri Lankan quantity surveyors and the professionals related to
education. The analysis of BIM education framework leads to the divisions of quantity
surveying into four objectives namely Draughtsmanship, Cost planning, Measurements, and
Estimating. These stages were decided based on the responses received for the questionnaire
survey mentioned above. The results of the questionnaire survey demonstrated that the most
common education level is degree and diploma among Sri Lankan quantity surveyors,
therefore this framework limited to the Sri Lankan undergraduate quantity surveying
students. Hence, the framework does not dictate in which academic year each stage should be
introduced. Students from the different education disciplines study courses of varying lengths
and some skills are introduced earlier in some courses than others. For example, diploma
could be finished within two years whereas degree gets four years of time.
In order to achieve in-depth knowledge about BIM models, Draughtsman courses will be
further enhanced to include awareness of BIM, use of BIM software as a basic tool for design
3D models and digital databases. The developed framework is outlined in the table (5). Cost
planning principles will be integrated with 4D costs and scheduling and the use of appropriate

254
BIM software for cost planning will improve the level of quantity surveying students
understanding of BIM for effective cost planning. Measurements will be integrated with 4D
and 5D BIM applications, Quantity takes off and spreadsheet software and Computerize
measurements.
Table 5: Developed framework to incorporate BIM with quantity surveying education
To overcome deficiencies in traditional methods of measurements the framework considered
the need to upgrade quantity surveying student’s skills in Microsoft Excel from the basic
knowledge to a more advanced use of the software. The task of quantification and automatic
take-off from BIM models is improved through upgrading the skills through BIM
interoperable software. Also by computerizing measurements will limit the use of paper
works which is prone to errors. Estimating will be integrated with Quantity extraction from
3D models, 5D lifecycle costing analysis and BOQ preparation with 3D views.
Apart from adding BIM as a mandatory module to the quantity surveying education
curriculum, conducting seminars, workshops and short courses were also major suggestions
by the respondents. Therefore, considering the results of the questionnaire survey to provide
OBJECT OUTCOME
Target Disciplines
Illustrat
ion
Manipula
tion
Applicat
ion
Collabor
ation
BIM awareness
Draughtsmanship
2D design
Basic 3D models
Digital databases
BIM awareness
Cost planning
Fundamental principles of cost
planning
4D cost and scheduling
Integration of 4D with appropriate
software
Application of appropriate software
BIM awareness
Measurements Quantity take off and spread sheet
software
Integration of 4D and 5D
Computerize measurements
Estimating
BIM awareness
Quantity extraction from 3D
models
5D lifecycle costing analysis
BOQ preparation with 3D views

255
suitable delivery methods to achieve deeper levels of learning as students’ progress through
their education four target disciplines were added to the developed framework.
4.1 Illustration Stage (Knowledge/Comprehension and Receiving/Responding) -
This is an introductory stage. Building Information Models are used to illustrate key concepts
to students and students will typically be taught in their separate disciplines at this stage. For
example, how BIM enhance to improve Draughtsmanship.
4.2 Manipulation Stage (Comprehension/Application and Responding/Valuing)
At this stage, students start to interact with and manipulate existing models themselves. They
will be required to make simple changes and/or create basic elements within the models in
relation to their disciplines.
4.3 Application Stage (Application/Analysis and Valuing/Organising)
At this stage, students have acquired basic theoretical knowledge in their disciplines and are
starting to apply this knowledge to solve discipline-related problems. For example, to develop
cost plans using 4D BIM.
4.4 Collaboration Stage (Synthesis/Evaluation and Characterising)
At this stage students required to have proper training for the taught modules so far. This will
provide students to deal with real-life situations such as Quantity extraction from 3D models
in a live project. This will also improve the group and team work.
However, as shown in framework depending on the learning outcome appropriate target
discipline will be varied.
5.0 CONCLUSIONS
This paper developed a framework to incorporate BIM with Sri Lankan quantity surveying
education curricula with the necessary knowledge and practical skills to mitigate identified
deficiencies in conventional quantity surveying practice via literature review and
questionnaire survey. Also, this framework will aid to meet the industry demand for BIM
competent graduates. The framework compromised with four objects of Draughtsmanship,
Cost planning, Measurements and Estimating. These objects were linked with various
learning outcomes. The framework further demonstrates the suitable delivery methods via
four target disciplines of illustration, manipulation, application and collaboration. The
framework emphasized the importance of integrating BIM with quantity surveying degree
programs and delivery methods for suggested modules. Nevertheless, the success of the
framework depends upon the commitment and willingness to overcome the resistance to
change by higher education institution both private and public sector. The framework also
recommended an increase in the awareness of BIM in institutions of higher learning, an
organization of BIM design competitions and initiating BIM software proficiency training in
line with quantity surveying. Future research could be directed towards curriculum

256
development, assessing perception of students and lecturers and extension of a framework for
higher graduate courses.
6.0 REFERENCES
Abeywardhana, R. (2016). QUANTITY SURVEYING PRACTICE WITH THE ADOPTION OF BIM
APPLICATIONS IN SRI LANKA. Sheffield Hallam University, Built environment. Sheffield: Sheffield
Hallam University.
Azhar, S., 2011. ‘Building information modeling (BIM): Trends, Benefits, risks, and challenges for the AEC
industry', Leadership and Management in Engineering, vol. 11, issue 3, pages 241-252
BCIS, “RICS 2011 Building Information Modelling Survey Report,” 2011.
Boon, J. (2009). preparing for the BIM revolution. 13th Pacific Association for the quantity surveyors congress.
Malaysia: ISM.
Clevenger, C., Ozbek, M., Glick, S. and Porter, D. (2010). Integrating BIM into Construction Management
Education. EcoBuild Conference Proceedings, EcoBuild 2010 BIM Academic Forum, Washington D.C.
Colleen, K. (2009). Preliminary cost estimation. Retrieved from
http://bimex.wikispaces.com/preliminary+cost+estimation
Creswell, J. W. (2012). Educational Research: Planning, Conducting and Evaluating Quantitative and
Qualitative Research 4th Ed. Pearson Education Inc. Boston.
De Silva, N., Rajakaruna, R., & Bandara, K. T. (2014). Challenges faced by the construction industry in Sri.
Colombo: University of Moratuwa.
Eastman, C., Teicholz, P., Sacks, R. & Liston, K., 2011. 2nd edition, BIM Handbook - A Guide to Building
Information Modelling for Owners, Managers, Designers, Engineers and Contractors. New Jersey: John
Wiley & Sons.
Fung, W. P., Salleh, H. and Rahim, F. A. M. (2014). The capability of Building Information Modeling
Application in Quantity Surveying Practice. Journal of Surveying, Construction, and Property (JSCP), 5(1):
1-13.
Halvorson, C. (2015). Rethinking productivity across the construction challenge: the challenge of change.
London: The Economist Intelligence unit Ltd.
Hua, G. B. (2010). Designing green to a whole life cost plan through adopting the standard. Singapore.
Ingram.K. (2015, 9 24). Digitizing the construction industry is bigger than BIM. Retrieved from Mirror
business:file:///Users/anushkarathnayake/Dropbox/Digitizing%20the%20construction%20industry%20is%2
0bigger%20than%20BIM%20%20Daily%20Mirror%20%20Sri%20Lanka%20Latest%20Breaking%20N.w
ebarchive
Jayasena, S., & Wedikkara, C. (2012). Building Information Modelling for Sri Lankan Construction Industry.
World Construction Conference 2012 – Global Challenges in Construction Industry (pp. 196-201).
Colombo: Ceylon Institute of Builders - Sri Lanka.
Kelleher, A. (2016). The effects that building information modeling may have on the role of quantity surveyors.
Institute of Technology, Sligo.
Kulasekara, G., Jayasena, H. S., & Ranadewa, K. T. (2013). Comparative effectiveness of quantity surveying in
a building information modeling implementation. Colombo: The second world construction symposium.
McGraw-Hill Construction SmartMarket Report. (2009). The Business Value of BIM: Getting Building
Information Modeling to the Bottom Line.
Nagalingam, G., Jayasena, H. S. and Ranadewa, K. (2013). Building Information Modelling and Future
Quantity Surveyor's Practice in Sri Lankan Construction Industry. Paper Presented at The Second World
Construction Symposium 2013: Socio-Economic Sustainability in Construction, 14-15 June 2013,
Colombo, Sri Lanka.
Olatunji, O. A., Sher, W. and Gu, N. (2010). Building Information Modeling and Quantity Surveying Practice.
Emirates Journal for Engineering Research, 15 (1), 67-70.
Pittard, S. & Sell, P., edition, BIM and Quantity Surveying, Oxon: Routledge.
Thomas, K. (2010). Innovation and growth team report. UK: Northumbria University.
Whatmore, L. (2012). Adding value. RICS construction journal: The BIM edition, 19.

257
ID 122
A BIM MATURITY-KPI ASSESSMENT: LITERATURE REVIEW
A. Aboumoemen, and J. Underwood
School of the Built Environment, University of Salford, Salford, M5 4WT, UK
Email: [email protected]
Abstract: Building Information Modelling (BIM) maturity was addressed as a measurement
process and set of progressions on capabilities and performance in relation to BIM
implementation. Key Performance Indicators (KPI) presents a set of improvement targets that
aims to deliver overall improvements within the UK construction industry. Literature on
combined approach (BIM and KPIs) existed that addressed possible links of BIM
implementation on primarily used KPIs across construction projects through assessing project
performance. This paper presented the literature on existing BIM maturity levels and Key
Performance Indicators; and both attempted together. An absence of delivering a standardised
set of KPIs to be linked with the BIM maturity to extract benefits that could impact on overall
performance of the industry existed. Therefore, this research aimed to combine different BIM
maturity levels that existed in different places by delivering a standardised set of BIM maturity
elements, and integrated KPIs developed through providing a standardised set of KPIs that
assessed capabilities and impacts on construction performances. Strengths and weaknesses for
the presented BIM maturities / KPIs / BIM-KPIs were outlined, and as a result; a conceptual
framework for Level 2 BIM maturity-KPI assessment that shall link them both together was
proposed.
Keywords: BIM, KPI, Maturity Assessment, Project Performance, UK Construction Industry.
1. INTRODUCTION
Building Information Modelling (BIM) has been approached in various ways from academic
publications, and governmental bodies. They all agreed that technological applications are
essential drivers being operated within BIM. However, the UK industry has defined BIM as a
modelling process to be facilitated for a building life-cycle through human interactions. The
UK government imposed a mandate to their governmental projects across the UK to
implement Level 2 BIM by 2016. Level 2 BIM has been defined by: “A series of domain and
collaborative federated models” (BIM Task Group, 2013). The mandate was implied because
recent published construction strategy report by the UK Government aims to cut off public
sector assets cost to 20% by 2016 (HM government, 2012). Figure 1 demonstrates a sample
of the UK Level 2 BIM Guides and Processes used for their Level 2 approach (NBS, 2015).

258
Figure 1: Level 2 BIM Guides and Processes (Source: NBS, 2015)
The BIM maturity was introduced as a measurement process with a set of progressions on
capabilities and performance in relation to BIM implementation based on levels of
accomplishment. It has been defined by: “the extent to which a specific process is explicitly
defined, managed, measured, controlled, and effective” (Paulk, Curtis, Chrissis, and Weber,
1994). After identifying the main purpose of BIM and its application across the UK, BIM
maturity models has emerged from various studies by different authors across the globe.
There are a set of BIM maturity assessments that have been conducted. The main purpose of
BIM maturities is to measure effectiveness of BIM capabilities and adoptions across the
construction industry, which may reflect on the UK governmental mandate and examine
success of BIM projects across the UK (Aboumoemen, 2016).
BIM Maturity assessments has delivered various benefits and its importance has been
examined across the UK, and therefore the Key Performance Indicators (KPIs) shall be
presented in a similar direction to outline its benefits. Target improvements were proposed
which resulted in emergence of KPIs that aimed to deliver overall improvements within the
UK construction industry (Wolstenholme, 2009). Project performance measures were
specified on Cost, Time, and Quality, but other measures were introduced, such as safety and
performance that differed from one study to another. They shall help recognise impacts that
could occur on overall performance of projects and organisations through the usage of KPIs.
An approach has existed in combining both parameters BIM and KPIs through outlining how
they can operate together within construction organisations. A few set of publications have
been published that addresses possible links of BIM implementation on primarily used KPIs
across construction projects through assessing project performance.
1.1 Research Methodology
The literature review aimed to identify various sources including journal articles, books,
reports, and websites that investigated the usage of BIM maturity assessments, KPIs and both
combined together in the construction industry, For this research, an extensive literature
review was conducted that included the keywords of BIM maturity assessments, KPIs, and
BIM KPIs using search engines of Google Scholar, Scopus, etc.... Literature that contained
information regarding the stated keywords were included and classified into categories to
meet the research needs. As a result, 25 publications on BIM maturity assessments were

259
acknowledged, a selection of 20 KPI publications relevant to the research were outlined, and
finally 16 previous attempts of linking BIM and KPIs together were identified. For this paper,
a summary of the strengths and weaknesses for the presented categories on BIM maturities,
KPIs, BIM / KPIs will be presented, and will propose a conceptual framework for Level 2
BIM maturity-KPI assessment that combines all the existing literature together.
2. BIM MATURITY ASSESSMENTS
BIM maturity presents a measurement process being introduced as a set of progressions on
capabilities and performance in relation to BIM implementation based on levels of
accomplishment (Paulk et al., 2004). The assessments are based on a 5 level maturity to
assess BIM capabilities and measure their adoption and effectiveness across the industry
(Aboumoemen, 2016). A set of assessments were developed by industry practitioners and
academics to evaluate BIM within the Architecture, Engineering, and Construction (AEC)
industry (Giel & Issa, 2014). Based on an analysis conducted on BIM maturity, 7 categories
were established. They are: 1) Scoring criteria percentage on a model with possible
certification; since the scoring criteria with certification could help identify where the models
are in relation to BIM adoption (NIBS, 2007; Indiana University, 2009; Du, Liu, & Issa,
2014; Alaghbandrad et al., 2015), 2) Maturity model on levels 1-5; where maturity models
are based on 5 levels known as: a) Initial, b) defined, c) Managed, d) Integrated, and e)
Optimised, driven from the Capability Maturity Model and assess BIM maturity (Succar,
2009; CIC, 2013; ARUP, 2014; Succar & Kassem, 2015), 3) Assessment framework; to
outline requirements of BIM maturity through provision of an assessment framework (Bew &
Richards, 2008; Gao, 2011; Manzione et al., 2011; Mom, & Hsieh, 2012; Shin, Choi, & Kim,
2015; Aboumoemen, 2016), 4) Scoring criteria percentages for projects; to identify where
projects are in relation to adopting BIM through delivery of a project’s scoring criteria (Vico.
2011; bimSCORE. 2013; Kam et.al., 2013; BIMexcellence. 2016; Liang et al., 2016), 5) BIM
competencies and capability assessment (self); to assess individuals competencies and
capability within organisations through a self-assessment tool (CPI. 2011;
BIMTASKFORCE. 2013; Giel & Issa, 2014), 6) BIM Functional model (tool); to deliver
BIM progression on models through BIM functional model (Berlo et al., 2012; Chen, Dib, &
Cox, 2014; Lee, Yu, & Jeong, 2015), and 7) Assessment method (other); Other methods that
were used and could be considered to assess BIM (Cerovsek, 2011; Won & Lee, 2014).
Based on a review of the presented categories, a summary of the overall strengths and
weaknesses, and a highlighted set of selected categories are available in Figure (2). The
literature on BIM maturity has demonstrated 1) A certified percentage scoring criteria on
models with the ability to deliver impacts on the projects and organisations operating BIM, 2)
Models through the 5 maturity level to assess projects and deliver a comprehended model, 3)
Various types of framework that delivered a set of BIM guidelines and standards to be
reflected upon, 4) Project’s percentage scoring criteria that examined delivery of BIM across
a set of models provided for the targeted projects, 5) BIM capabilities and competencies self-
assessments to be examined and completed by individuals to demonstrate where they
currently stand, 6) Maturity related models leading to BIM function model (tool) to examine
how is BIM being operated within organisations, and 7) Alternative assessment methods that
were considered to assess BIM implementation across projects and organisations. Yet, a set
of distinctions existed such as: 1) BIM being approached as a software for the certified
scoring criteria that doesn’t follow the BIM maturity concept, 2) 5 Levels of maturity being
demonstrated differently from one place to another, resulting in absence of standardisation

260
for BIM maturity, 3) Frameworks being regarded as conceptual and not examined enough
across projects and organisations, 4) BIM maturity criteria not followed in the scoring criteria
for projects assessments, causing a delivery of a meaningless percentages that doesn’t
comprehend the maturity criteria, 5) Various BIM elements are assessed by different
individuals, resulting in no consideration of BIM maturity approach, 6) Various BIM
functional models being proposed and not validated widely across the industry, resulting in
lack of standardisation for the presented functional models to follow a BIM maturity criteria
and invalidated functional models’ delivery across projects, and 7) Alternative assessment
methods being unrelated to BIM maturity and relying on individual perceptions on BIM.
Figure 2: BIM maturity assessments strengths and weaknesses
3. KPI ASSESSMENTS
BIM is about assessing capabilities, and construction performance measurements is done
through Key Performance Indicators (KPIs), so in order to outline its potential benefits, then
it will be necessary to provide a linkage between BIM maturities and KPIs to demonstrate
KPIs progressions. KPIs are measures of a process that is critical to the success of an
organisation, and there are a number of performance measures that define the success of a
project or organisation (Constructing Excellence, 2004). Having conducted an analysis on the
existing KPIs assessments, they have been classified into 9 categories. They are: 1) Listed set
of KPIs; since those studies included a listed set of KPIs recognised to support project and
organisations (Chan, & Chan, 2004; Swan & Kyng, 2004; BRE. 2016), 2) Framework
attempt; where a framework approach existed to outline KPIs distribution in these studies
(Toor, & Ogunlana, 2010; Takim & Akintoye, 2002), 3) European Foundation for Quality
Management (EFQM) excellence model; EFQM excellence model used as a continuous
improvement strategy that consists of: Cause and effect relationships between what their
organisation does on 2 Criteria's: 1) Enablers with its 5 areas of: a) Leadership; b) Strategy;
c) People; d) Partnerships; e) Processes and products, and 2) Results with its 4 areas of a)
People, b) Customer, c) Society, d) Business it achieves (Beatham et al., 2004; Bassioni,
Price, & Hassan, 2004), 4) Balanced Scorecard; Balanced Scorecard presented and used to
measure goals which is: A scorecard that included 4 perspectives known as: a) Financial, b)
Customer, c) Internal Business, and d) Innovation and learning (Luu et al., 2008), 5) Relative
Important Index (RII); Relative Importance Index presented as a method that indicates the
importance of parameters which is: a mathematical formula aimed to identify the importance
of used KPIs through a numerical ranking procedure that will be correlate amongst others
(Yeung et al., 2013), 6) Rating criteria; Rating Criteria that ranks the most used parameters in
projects which is: a Criteria to rate the KPIs used in the study to outline their importance (Ali,
Al-Sulaihi, & Al-Gahtani, 2013), 7) Questionnaires or surveys with the use of Likert scale;
Likert scale used in questionnaires to collect data on KPIs from, which is: a scale that uses a

261
rating scale of 3 and above through delivered questions which expects participants to answer
them according to the questions by selecting the necessary ratings (Cox, Issa, & Ahrens,
2003; Ramırez, Alarcon, & Knights, 2004; Vukomanović, Radujković, & Nahod, M. 2010;
Alkilani, et al., 2015; Sibiya, Aigbavboa, & Thwala, 2015), 8) Other; to include other
methods to outline KPIs than those being presented (Bassioni, Price, & Hassan, 2005;
Scottish Government. 2012; NWCH. 2015), and 9) All (except Other and Likert Scale); since
it included a set of methods being used to outline the KPIs (Cha and Kim, 2011). A set of
KPIs were identified by industry practitioners and academics to evaluate KPI performance
and implementation within the AEC industry. The performance measures and KPIs of project
performance and success were generalised on Cost, Time, and Quality aspects; however,
other assessment aspects have been introduced differently; such as Safety and Performance
that varied from one place to another. The KPIs aim to deliver overall improvements within
the UK construction industry. (Wolstenholme, 2009).
After reviewing the KPIs, 9 were extracted that are believed to reflect on the suggested BIM-
KPI framework. Cost, Time and Quality were considered as Primary KPIs since they
demonstrate the basis of measuring key performance indicators in any project or organisation
and form the essentials of KPIs that are available in all previous studies and across the
industry. Safety, Satisfaction, Performance, Profitability, Productivity and Sustainability are
regarded as Secondary KPIs since their representation varied from one study to another,
which could present a start of standardising the existing KPIs, and additional KPIs have
existed that were classified as others. The relationship between the number of appearance and
the percentages in the 20 selected publications on KPIs are presented in Figure (3).
Figure 3: KPIs emerging from the literature
Figure (4) presents a summary of the overall strengths and weaknesses, and a selected set of
categories are highlighted. Having reviewed the presented categories, the highlighted
categories are based on their existing features; such as the usage of a balanced scorecard,
Relative importance index, and Likert scale that presents the KPIs requirements to consider
for the BIM-KPI assessment discussed earlier. The literature on KPIs has delivered 1) A
listed set of KPIs required, which were examined across projects and organisational levels, 2)
Concepts such as (IEDF0 diagram) used in frameworks to evaluate projects performance, 3)
EFQM model and balanced scorecard as a benchmarking system and integrated together to
assess KPIs in organisational level, 4) RII and rating criteria as methods to rank the KPIs and
define their importance to measure their performance on projects, 5) Usage of a Likert scale
through questionnaires to evaluate importance, and usage of KPIs across projects, and 6)
Methods such as (SMART) to examine provision of KPIs and combined methods of (listed

262
set of KPIs and RII) to verify importance of KPIs being used. However, a set of variances
existed such as: 1) Delivering different sets of KPIs according to each study’s requirements,
resulting in absence of a standardised set of KPIs used, 2) Various frameworks used to
examine KPIs, therefore absence of a standardised framework to be used in projects, 3) Not
understanding the usage of KPIs through the EFQM model, resulting in lack of understanding
and misinterpretations to the KPIs, 4) Non comprehensive performance measurement tool
existed as a result of the provided balanced scorecard that was not validated, 5) Measures are
not well defined through the RII method, causing a variance of KPIs delivery across projects,
6) KPIs are ranked randomly without having a basis of rating them, resulting in the KPIs not
reflecting necessary on projects, and 7) Multiple methods not examined amongst project
lifecycle, resulting in absence of strong relationship between various methods together.
Figure 4: KPIs assessments strengths and weaknesses
4. BIM-KPI ASSESSMENTS
A limited number of publications were available that collected possible relationships between
BIM maturity and KPIs across construction projects (Smits, Buiten and Hartmann, 2016).
This implies that there has been a failed attempt to link BIM maturity and KPIs together to
realise the benefits that could be extracted. Having conducted an analysis on the existing
combined BIM/KPI assessments, 6 categories form the essentials of the BIM/KPI
combination in previous studies. They are: 1) Assessment Framework; since an assessment
framework have existed to combine BIM and KPIs together (Mom & Hsieh, 2012;
Aboumoemen, 2016), 2) KPIs impact on BIM implementation; where the impacts of KPIs on
the implementation of BIM existed and varied from one study to another (Coates et al., 2010;
Manzione, et al., 2011; Sarkar, Raghavendra, & Ruparelia, 2015), 3) Assessment method;
Balanced scorecard being presented and used to be compared together (Park et al., 2013;
Won & Lee, 2016), 4) BIM implementation within Organisations; to outline the impacts of
BIM with construction industries / firms / organisations (Barlish & Sullivan, 2012; Sun &
Zhou, 2010; Poirier, Staub-French, & Forgues, 2015; Shin, Choi, & Kim, 2015), 5) BIM
impact on construction projects (KPIs); to demonstrate the effect of BIM on KPIs and
construction projects performance (Suermann, & Issa, 2007; Hassan, 2012; Eadie, et al.,
2013; Smits et al., 2016), and 6) Assessment tool; since an assessment tool was presented to
demonstrate the relationships of BIM and KPIs together. (Sebastian & Berlo, 2010).

263
Following a review of the presented categories, the highlighted categories are believed to
have a direct link with the development of a BIM-KPIs suggested assessment. A set of
variations existed; starting from 1) Delivering different sets of BIM and KPIs specific to each
study’s requirement, resulting in provision of various frameworks that operates in certain
studies and are not generalised, 2) BIM being approached in various ways, causing absence
of standardised set of BIM elements being delivered and KPIs to then be used, 3) Diversity of
methods being used to integrate BIM and KPIs together, which resulted in absence of a
standardised method to be used for their integration across organisations, 4) Variation of BIM
and KPIs set of numbers and implementation across projects and organisations, causing an
absence of standardised set of BIM and KPIs elements being used, and 5) KPIs treated as a
set of questions to meet BIM requirements of a certain study, and as a result, delivering a
different approach of KPIs. The literature on BIM/KPI has presented: 1) A review of the BIM
and KPIs, which resulted in delivering a framework that reflects on combination of both
together, 2) Delivered BIM as a main driver and through the help of data collection tools, has
presented reflection of KPIs on the BIM implementation within the industry, 3) Offered a set
of methods, (i.e. balanced scorecard) to signify how can BIM and KPIs be integrated
together, 4) KPIs as the main use in construction projects and organisations and how will
BIM be integrated with KPIs, and 5) Proposed a tool that combines BIM and KPIs together
through delivering a set of questions related to KPIs to meet BIM needs. The BIM-KPIs set
of strengths and weaknesses, and highlighted set of categories are available in Figure (5).
Figure 5: BIM-KPIs assessments strengths and weaknesses
5. A LEVEL 2 BIM MATURITY-KPI ASSESSMENT CONCEPTUAL FRAMEWORK
Having visited the previous publications on BIM, KPIs, and combined BIM / KPI; a proposed
assessment that combines them all together is available in Figure (6). The framework
presented addresses strengths that existed in previous studies; such as the delivery of a set of
progressions for BIM, and an initial set of KPIs that presents benchmarks on measuring the
performance of projects and organisations within the industry, which could be used to link
BIM and KPIs together and begin to populate the suggested assessment.
The approach to the framework:
Following a review and analysis presented in the literature, the framework has been
distributed into 3 stages: 1) Level 2 BIM and KPIs begin the framework’s 1st stage since it
requires to identify essence of both elements and begins to deliver an aligned standardised set
of elements to understand how they shall be related together, 2) Level 2 BIM and KPIs
assessment is then introduced to establish relationships and how assessments are expected to
occur on both elements to deliver a standardised set of assessments to be considered, and 3)

264
Benefits of aligned BIM and KPIs and their relationship assessment shall be presented to
demonstrate benefits expected to emerge from the combination of both elements together,
and how to assess strengths of the elements’ relationships presented previously through
correlating them together. A detailed analysis of the framework shall be presented separately.
1st stage= Level 2 BIM and KPIs:
A preliminary list of BIM and KPIs separately are provided in the assessment’s 1st stage,
where some were presented in Figures (1 and 3). The links conducted in the framework’s 1st
stage shall help bridge the missing combination of previous given Level 2 BIM and KPI
parameters that has not existed previously, and thus allows recognising how both parameters
could be linked together in the framework’s early stages. Furthermore, shall deliver a set of
KPIs and Level 2 BIM elements to be assessed together and display their possible
relationships (i.e. the KPI [Cost], and its relationship with some Level 2 BIM elements
[Collaboration]). This allows to recognise how both elements could be linked together in the
early stages. The stage has been identified as “The What” since it aims to outline what are the
expected standardised elements to emerge that shall meet the UK governmental mandate on
Level 2 BIM.
2nd stage= Level 2 BIM and KPIs assessment:
The relationship assessments of Level 2 BIM and KPI elements together is available in this
stage. The proposed assessment methods in the 2nd stage shall support in realising strengths
of the potential link that both elements will have, based on the assessment performed on
them. This stage has been signified as “The How” since it aims to assess relationships of
Level 2 BIM and KPI elements together to see the possible strengths of these relationships,
and how are level 2 BIM elements being acknowledged in projects and organisations within
the industry. This stage delivers strengths that existed in the previous literature; such as the
impacts of Level 2 BIM and KPIs together and levels of maturity assessment, which could
help recognise how they shall be assessed and what current positions does the UK industry
stand to meet their Level 2 BIM mandate. The Strength of relationships between BIM and
KPIs shall help visualise how they are related together, and what could be necessary actions
required to be taken to strengthen the relationship or to maintain them. Some of the presented
studies followed a 5 level maturity assessment, but other studies follows a 3 level maturity.
The reason for considering a 3 level maturity in this framework is to deliver necessary
distinction between each level since 5 levels have delivered a similar relationship between
levels (i.e. levels 2 and 4 being close to levels 1, 3, and 5). The assessment in this stage shall
help deliver a standardised set of assessment for both elements that will avoid unnecessary
distinctions of multiple assessments existing. Furthermore, delivery of the standardised
assessment method to depend and rely on shall elude existence of multiple assessments that
could cause potential misunderstanding, and thus allows results to be validated across the
industry. Moreover, this assessment method will be able to measure performance of projects
and organisations, and neglect variations of the inability for both elements to be assessed.
3rd and final stage= Benefits of aligned BIM & KPIs, and their relationship assessment:
This stage shall be examined to see what benefits will be expected to emerge from the
previous assessment, which defines “The Why” level and how will the Level 2 BIM and KPI
elements correlate together, known as “The Evidence” level. The benefits will be aligned
with the maturity assessment conducted to see how improvements have occurred within the
265
industry and actions may be proposed to enhance weak relationships that may have existed.
Previous studies on BIM maturity and KPIs presented methods of assessing both elements
through correlations and multiple regressions, which demonstrates a potential strength
existing in this stage and could help signify strengths of relationships between them.
Extracted benefits shall be vital in realising importance of the previous assessment, where it
shall offer benefits that is expected to occur on the previous stages. Furthermore, a delivered
standardised assessment method for both elements together will exist in this stage that will
evade the excessive set of assessments conducted before, which did not deliver the necessary
relationships required. Finally, will present a standardised set of elements to be correlated and
avoid variances of elements that may be included and allow a higher validity of results within
the industry.
Problem identification, presented framework’s justification, and expected contribution:
Finally, there has been an absence of a rigorous relation between Level 2 BIM maturities and
KPIs, lack of understanding of what both are exists, and how they operate within construction
organisations separately, which resulted in a failed attempt to link them together. This
framework aims to combine different BIM maturity levels that existed in different places
through delivering a standardised set of Level 2 BIM maturity elements. It will integrate KPIs
developed through providing a standardised set of KPIs, in order to assess capabilities and
impacts on construction projects and organisational performances. This will be used to
develop a suggested Level 2 BIM Maturity-KPI assessment framework for assessing BIM
level 2 adoptions in line with the UK construction strategy, to test and examine its
practicability within the UK. As a result, the aim of the presented framework is to measure
the performance and demonstrate how benefits extracted from Level 2 BIM maturity could
have an overall impact on construction performance through linking the KPIs with BIM
together. The framework intends to introduce a new method of standardised Level 2 BIM
maturity approach along with a generalised KPI to be considered within the UK.

Figure 6: A Level 2 BIM Maturity-KPI assessment conceptual framework

267
6. CONCLUSION
From the previous discussion, it can be concluded that BIM maturity assessments, KPIs, and
combined BIM-KPIs available in literature could be used in the UK. However, a set of
adjustments must be attempted in order to deliver a standardised set of KPIs to be linked with
the BIM maturity to extract benefits that could impact on the industry’s overall performance.
This is due to lack of understanding on what BIM and KPIs are and how they operate within
construction organisations separately, which resulted in a failed attempt to link them both.
BIM was presented in several ways but has led to slow uptake and low awareness to UK
disciplines, and thus BIM maturities are developed to assess capabilities and measure their
adoption. This shall help extract benefits that could be realised from usage of BIM maturity
across organisations; however, those benefits could be meaningless. As a result, KPIs are
presented through project and organisational types along with different accomplishment
levels, where KPIs could be used to link them with BIM maturities; in order to demonstrate
benefits that could be extracted from usage of BIM maturities amongst UK disciplines. An
approach has existed to combine BIM and KPIs together and how both shall deliver direct
impacts to the industry. Although the potential strength that could exist through linking both
elements, however; a limited set of publications has addressed such possible links. Since
these publications have failed to deliver an approach on both parameters working together, it
has been encountered as an existing knowledge gap and weakness resulting in a total absence
of such link, and therefore how both parameters could work together shall be acknowledged.
Lack of understanding of what BIM and KPIs are exists, and how are both being operated
within construction organisations separately resulted in a failed attempt to link them both
together to realise the benefits that could exist. As a result, an assessment for Level 2 BIM-
KPIs has been suggested. This assessment shall be easy to understand relationships between
BIM maturities and KPIs. The proposed assessment is available to all potential users to use in
the present time, since it is expected to test and validate it amongst the UK construction
industry, but it is expected to address the suitable users required to attempt the framework as
the study continues and based on the UK construction industry requirements (i.e. Clients).
7. REFERENCES
Aboumoemen, A. (2016). A BIM Maturity / KPI assessment model in support of the UK BIM level 2
construction strategy adoption for the UK. (MSc dissertation, The University of Salford).
Alaghbandrad, A., April, A., Forgues, D., & Leonard, M. (2015). BIM maturity assessment and certification in
construction project team selection. The Canadian Society for Civil Engineering 5th International/11th
Construction Specialty Conference, University of British Columbia, Canada. doi: 10.14288/1.0076339
Ali, H., Al-Sulaihi, I., & Al-Gahtani, K. (2013). Indicators for measuring performance of building construction
companies in kingdom of Saudi Arabia. Journal of King Saud University - Engineering Sciences, 25(2),
125–134. doi:10.1016/j.jksues.2012.03.002
Alkilani, S., Jupp, J., Kamardeen, I., and Sawhney, A. (2015). Key performance indicators for construction
contractors in developing countries: a case study of Jordan.
ARUP. (2014). BIM Maturity Measure. Retrieved 7th March, 2017, from:
[http://www.arup.com/news/2015_03_march/10_march_bim_maturity_measure_model_launch]
Barlish, K., & Sullivan, K. (2012). How to measure the benefits of BIM — A case study approach. Automation
in Construction, 24, 149–159. doi:10.1016/j.autcon.2012.02.008
Bassioni, H. A., Price, A. D., & Hassan, T. M. (2004). Performance measurement in construction. Journal of
management in engineering, 20(2), 42-50. doi: 10.1061/(ASCE)0742-597X(2004)20:2(42), 42-50.
Beatham, S., Anumba, C., Thorpe, T., & Hedges, I. (2004). KPIs: A critical appraisal of their use in
construction. Benchmarking: An International Journal, 11(1), 93–117. doi:10.1108/14635770410520320
Berlo, L. V., Dijkmans, T., Hendriks, H., Spekkink, D., & Pel, W. (2012). BIM QuickScan: benchmark of BIM
performance in the Netherlands. Proceedings of the 29th International Conference. Beirut, Lebanon: CIB.

268
Bew, M., and Richards, M. (2008). BIM maturity model, Royal Institute of British Architects (RIBA)
Publishing, London.
BIMexcellence. (2016). BIMe Excellence Individual Discovery. Retrieved 7th March, 2017, from:
[http://bimexcellence.com/assess/campaign/default/]
bimSCORE. (2013). Strategic Building Innovation •bimSCORE, Retrieved 7th March, 2017, from:
[https://www.sbi.international/index.php/welcome]
BIMTASKFORCE. (2013). Welcome to your BIM Capability Compass and Upskilling toolkit. Retrieved 13th
November, 2016, from: [http://bim.knowledgesmart.net/BIM/Default.aspx]
BRE. (2016). Key performance indicators (KPI's) for the construction industry. Retrieved 7th March, 2017,
from: [https://www.bre.co.uk/page.jsp?id=1478]
Building Information Modelling (BIM) Task Group. (2013). Frequently asked questions, what is Building
Information Modelling (BIM)? Retrieved 7th March, 2017, from: [http://www.bimtaskgroup.org/bim-faqs/]
Cerovsek, T. (2011). A review and outlook for a “building information model” (BIM): A multi-standpoint
framework for technological development. Advanced Engineering Informatics, 25(2), 224–244.
doi:10.1016/j.aei.2010.06.003
Chan, A. P., & Chan, A. P. (2004). Key performance indicators for measuring construction success.
Benchmarking: An International Journal, 11(2), 203–221. doi:10.1108/14635770410532624
Chen, Y., Dib, H., & F. Cox, R. (2014). A measurement model of building information modelling maturity.
Construction Innovation, 14(2), 186–209. doi:10.1108/ci-11-2012-0060
CIC, (2013). BIM Planning Guide for Facility Owners. Version 2.0. Retrieved 7th March, 2017,
from:[http://bim.psu.edu/resources/owner/bim_planning_guide_for_facility_owners-version_2.0.pdf]
Coates, P., Arayici, Y., Koskela, K., Kagioglou, M., Usher, C., & O'Reilly, K. (2010). The key performance
indicators of the BIM implementation process.
Cox, R. F., Issa, R. R., & Ahrens, D. (2003). Management's perception of key performance indicators for
construction. Journal of construction engineering and management, 129(2), 142-151.
CPI. (2011). CPIx-BIM Assessment Form. Retrieved 7th March, 2017, from: [http://www.cpic.org.uk/wp-
content/uploads/2013/06/cpix_-_bim_assessment_form_ver_1.0.pdf]
Du, J., Liu, R., & Issa, R. R. (2014). BIM cloud score: benchmarking BIM performance. Journal of Construction
Engineering and Management, 140(11). doi:10.1061/(asce)co.1943-7862.0000891
Eadie, R., Browne, M., Odeyinka, H., McKeown, C., & McNiff, S. (2013). BIM implementation throughout the
UK construction project lifecycle: An analysis. Automation in Construction, 36, 145–151.
doi:10.1016/j.autcon.2013.09.001
Gao, J. (2011). A Characterization Framework to Document and Compare BIM Implementations on
Construction Projects (Doctoral dissertation, Stanford University).
Giel, B., & Issa, R. R. A. (2014). Framework for evaluating the BIM competencies of building owners. Issa,
RR, & Flood. I.(Eds.) Computing in Civil and Building Engineering, Edition, 1(3), 552-559. doi:
10.1061/9780784413616.069
Hassan, A. (2012). Implementation Of Building Information Modelling (BIM): Practices And Barriers In
Construction Industry In GCC. (Doctoral dissertation, Heriot-watt University).
HM Government (2012). Industrial strategy: government and industry in partnership: Building Information
Modelling. Retrieved 7th March, 2017, from:
[https://www.gov.uk/government/uploads/system/uploads/attachment_data/file/34710/12-1327-building-
information-modelling.pdf.]
Indiana University. (2009). BIM Design & Construction Requirements. Indiana University, US. Retrieved 7th
March, 2017, from:
[http://www.indiana.edu/~uao/docs/standards/IU%20BIM%20Rollout%20Presentation%209-10-2009.pdf]
Issa, R. R., & Suermann, P. (2009). Evaluating industry perceptions of building information modeling (BIM)
impact on construction. Journal of Information in Technology and Construction, 14, 574-594.
Kam, C., Senaratna, D., Xiao, Y. & McKinney, B. (2013). The VDC Scorecard: Evaluation of AEC. Projects
and Industry Trends.
Lee, S., Yu, J., & Jeong, D. (2015). BIM acceptance model in construction organizations. Journal of
Management in Engineering, 31(3). doi: 10.1061/(ASCE)ME.1943-5479.0000252, 04014048 Liang, C., Lu, W., Rowlinson, S., & Zhang, X. (2016). Development of a Multifunctional BIM Maturity Model.
Journal of Construction Engineering and Management. doi: 10.1061/(ASCE)CO.1943-7862.0001186,
06016003.
Luu, T. V., Kim, S. Y., Cao, H. L., & Park, Y. M. (2008). Performance measurement of construction firms in
developing countries. Construction Management and Economics, 26(4), 373-386. doi:
10.1080/01446190801918706
269
Manzione, L., Wyse, M., Sacks, R., Van Berlo, L., & Melhado, S. B. (2011). Key performance indicators to
analyze and improve management of information flow in the BIM design process. In CIB W78-W102 2011:
International Conference, France.
Mom, M., & Hsieh, S. H. (2012). Toward performance assessment of BIM technology implementation. In 14th
International Conference on Computing in Civil and Building Engineering.
NIBS (2007). United States National Building Information Modelling Standards Version 1 – Part 1: Overview,
principles and Methodologies. National Institute of Building Sciences, Washington, DC.
NBS (2015). The level 2-BIM Package. NBS BIM toolkit, UK Government BIM Task Group, UK. Retrieved
7th March, 2017, from: [https://toolkit.thenbs.com/articles/the-level-2-bim-package]
NWCH. (2015). Key Performance Indicators. North West Construction Hub KPI handover and interim reports,
North West, UK.
Park, C., Ahn, J., Lee, D., Cha, Y., & Chin, S. (2013). Key Performance Indicator on Benefits of BSC-based
BIM and Validation Methods. Proceedings of the 30th ISARC, Montreal, Canada
Paulk, M. C., Weber, C., Curtis, B., & Chrisses, M. B. (1994). The Capability Maturity Model: Guidelines for
Improving the Software Process. 1995. Addisot Wesley. doi:10.1109/52.219617
Poirier, E., Staub-French, S., & Forgues, D. (2015). Assessing the performance of the BIM implementation
process within a small specialty contracting enterprise. Canadian Journal of Civil Engineering, 42(10): 766-
778. doi: 10.1139/cjce-2014-0484
Ramırez, R., Alarcon, L., & Knights, P. (2004). Benchmarking system for evaluating management practices in
the construction industry. Journal of Management in Engineering, 20(3), 110-117. doi:
10.1061/(ASCE)0742-597X(2004)20:3(110) Sarkar, D., Raghavendra, H. B., & Ruparelia, M. (2015). Role of Key Performance Indicators for evaluating the
usage of BIM as tool for Facility Management of Construction Projects. International Journal of Civil and
Structural Engineering, 5(4), 370.
Scottish Government. (2012). Development of Key Performance Indicators to support the Building Standards
Verification System. Retrieved 7th March, 2017, from: [http://www.gov.scot/Topics/Built-
Environment/Building/Building-standards/publications/pubresearch/researchgeneral/resgenverif] Shin, J., Choi, J., & Kim, I. (2015). A Study on BIM Performance Assessment Framework for Architecture
Firm. Advanced Science and Technology Letters, 120.
Sibiya, M., Aigbavboa, C., & Thwala, W. (2015). Construction Projects’ Key Performance Indicators: A Case
of the South African Construction Industry. In ICCREM 2015 (pp. 954-960). doi:
10.1061/9780784479377.111
Smits, W., van Buiten, M., & Hartmann, T. (2016). Yield-to-BIM: impacts of BIM maturity on project
performance. Building Research & Information. doi: 10.1080/09613218.2016.1190579
Succar, B. (2009). Building information modelling framework: a research and delivery foundation for industry
stakeholders. Automation in Construction, 18(3), 357–375. doi:10.1016/j.autcon.2008.10.003
Succar, B., Kassem, M. (2015). Macro-BIM adoption: Conceptual structures. Automation in Construction;
57:64-79. doi: 10.1016/j.autcon.2015.04.018 Suermann, P. C., & Issa, R. R. A. (2007). BIM effects on construction Key Performance Indicators (KPI)
survey. Journal of Building Information Modeling, 1(1), 26-27. Sun, W. Z., & Zhou, G. Q. (2010). KPIs: Analyzing the impact of Building Information Modeling on
construction industry in China. In Industrial Engineering and Engineering Management (IE&EM), 2010
IEEE 17Th International Conference on (pp. 354-356). IEEE. doi: 10.1109/ICIEEM.2010.5646595
Swan, W., & Kyng, E. (2004). An introduction to key performance indicators. Center for Construction
Innovation.–2004.
Takim, R., & Akintoye, A. (2002). Performance indicators for successful construction project performance. In
18th Annual ARCOM Conference, Vol. 2, pp. 545-555.
Toor, S., and Ogunlana, S. O. (2010). Beyond the ‘iron triangle’: Stakeholder perception of key performance
indicators (KPIs) for large-scale public sector development projects. International journal of project
management, 28(3), 228-236. doi:10.1016/j.ijproman.2009.05.005
Vico. (2011). Calculating Your BIM Score. 7th March, 2017, from:
[http://www.vicosoftware.com/resources/calculating-bim-score]
Vukomanović, M., Radujković, M., & Nahod, M. (2010). Leading, lagging and perceptive performance
measures in the construction industry. Organization, Technology & Management in Construction: An
International Journal, 2(1), 103-111.
Wolstenholme, A. (2009) Never Waste a Good Crisis: A Review of progress since rethinking construction and
thought for our Future, London: Constructing Excellence.
Won, J., & Lee, G. (2014). Goal-driven method for sustainable evaluation of BIM project success level. eWork
and eBusiness in Architecture, Engineering and Construction: ECPPM 2014, 33.

270
Yeung, J. F., Chan, A. P., Chan, D. W., Chiang, Y. H., & Yang, H. (2013). Developing a benchmarking model
for construction projects in Hong Kong. Journal of construction engineering and management, 139(6), 705-
716. doi:10.1061/(asce)co.1943-7862.0000622

271
ID 128
LIBYAN HIDDEN GEMS: VERNACULAR ARCHITECTURE ON THE
NAFUSA MOUNTAINS
M. Milod1 and .C. Trillo2
1 School of the Built Environment, University of Salford, UK
2College of Engineering, School of the Architecture, Libya University, Libya
Abstract : Vernacular Architecture (VA) is an essential driver of cultural identity and plays a
major role in ensuring the preservation of local identity and cultural values. Sometimes, but
not always, VA is protected by law as heritage architecture and framed within clear
conservation policies. The Libyan area of the Nafusa Mountains Region (NMR) is rich in
history and traditional architectures, veritable hidden gems not yet well known. However, due
to the lack of specific conservation strategies, VA has been overlooked and neglected by both
institutions and local communities, and its unique historical and cultural value abandoned to
decay. This paper draws from a broader research aimed at raising awareness and promoting
necessary measures for preserving VA in the NMR and its unique architectural and historical
heritage. Since no comprehensive study exists on the typical and specific architectural features
related to the VA in the NMR, the first step of this study has been to explore and document, by
complementing a systematic review of the literature on the NMR with field work and direct
survey, selected examples of VA in a single case, the Yifran municipality. Building on these
primary data, a taxonomy of the VA typologies has been firstly developed and then related to
the main characteristics of the different typologies. This paper presents preliminary findings
from this stage, providing readers with an initial understanding of the physical elements
characterising the uniqueness of the VA in the NMR.
Keywords: Vernacular Architecture, Heritage Architecture, Nafusa Mountains, Libyan
Region.
1. INTRODUCTION
The Vernacular Architecture (VA) is an indigenous building style using traditional methods
of construction and local materials and ornament especially as distinguished from academic
or historical architectural styles. The term “vernacular” acquires different meanings and
implications depending on the context (Oliver 2006). This term has been used, among others,
by architects, historians, archaeologists and folklorists (Brunskill 2006). Vernacular
Architecture (VA) has been defined as the architectural relationship among people with
respect to the use of traditional resources. Sometimes described as “popular” (Rapport 1969)
or “spontaneous”, this architecture is seldom the work of a specialist. The “Architecture
without architects” (Rudofsky 1964) is produced without an intermediary. VA is increasingly
becoming a subject of major interest not only amongst architecture theorists, but also
designers and technologists all over the world. VA is an essential driver of cultural identity
and plays a major role in ensuring the preservation of local identity and cultural values.
Sometimes, but not always, VA is protected by law as heritage architecture and framed
within clear conservation policies.
It is worth noting here that VA is increasingly becoming a subject of major interest not only
to architecture theorists, but also to designers and technologists all over the world. For
example, Filippi (2006) defined it as the architectural relationship among people with respect

272
to the use of traditional resources. Filippi (2006) observes also that VA is an essential
component of cultural heritage, a repository of a tradition of integration of different cultures.
Thus, VA can work to preserve and to protect a sense of traditional community identity.
Recently, it is notable that VA has been declining, not only because of new materials and the
shortage of local components; it is also affected by the breakdown of the traditional
professions in construction, which were family based architecture (Atroshenko, 1991; Oliver,
2003). In general, the literature picture has focused on Sustainability of cultural heritage as a
critical in the core of human culture and to future generations (Oliver, 2003; Sheibani, 2008;
Deslagen, 2009). For example, in the Libyan area of the Nafusa Mountains Region (NMR),
due to the lack of specific conservation strategies, VA has been overlooked by both
institutions and local communities, and its unique historical and cultural value abandoned to
neglect. More in general, in Libya, ineffective state strategies and local management are
currently hindering the implementation of conservation policies. This paper draws from a
wider study, which aims at supporting the preservation of vernacular dwellings in the NMR.
The ancient settlement of the Yifran municipality is considered one of the most important
municipalities in NMR and therefore has been selected as case study. This paper presents
some preliminary findings from an extensive fieldwork and direct survey conducted in the
Yifran municipality, with the aim of starting to document the main characteristics of the
different typologies of VA in the NMR region. In so doing, it fills a gap in the current
knowledge of the VA in Libya, since no comprehensive study exists on the typical and
specific architectural features related to the VA in the NMR. Further studies will develop a
more comprehensive framework for the preservation of VA in the NMR.
2. LIBYAN VERNACULAR ARCHITECTURE
Libyan traditional architecture differs according to the diverse cultures of the regions. Factors
influencing the different architectural traditions are related to religion, to the geographical
context (desert, mountainous and Mediterranean / coastal) and to the type and origin of the
people (Berber - Amazigh and Bedouin cultures and a mix of more than one of these
cultures). Figure 1 shows different types of Vernacular Dwellings (VDs) according to
different main geographical context. The suggested taxonomy has been developed drawing
from the literature review, allowing to identify four main typologies (e.g. underground, multi-
story, courtyard and non – courtyard dwellings), the first three located in the mountainous
regions. Figure 2 shows their geographical distribution in the country.
Figure 1: VD types in Libya. Source: author

273
Figure 2: Sites of Libyan VD types Source: author
The coastal zone is located on the Northern border of Libya along the Mediterranean Sea and
it extends from Egypt, in the East, to Tunisia, in the West. A part of the North African coast,
it mainly consists of fertile agricultural flat land. On the coastal strip, there are some
commercial towns such as Tripoli, Misurata, Alzawia, Khoms and Benghazi. The most
common type of traditional house in this zone is the courtyard house. Elwefati (2007)
indicated that the consideration of climate, customs and traditions were major factors in
shaping this type (See Figure 3).
Figure 3: Scheme and courtyard houses of the old city of Tripoli. Source: Urban Planning
Tripoli
The desert zone in Libya forms a major part of the Sahara Desert. In the Southern part of the
country, it extends from the edge of the coastal strip along the Mediterranean Sea and North
mountains, the Nafusa Mountains to the West and Jable El-Akhdar to the East. Generally, the
houses in this region are either courtyard dwellings or covered dwellings (non-courtyard
dwellings) (See Figure 4).

274
Figure 4: Courtyard dwellings and non-courtyard dwelling in desert region (Author’s
photos)
Finally, Libya consists of two mountainous areas, one of them being the Mountains of
Nafusa, located in the North-Western region of Libya extending from Tunisia, in the West, to
Khoms, in the East. This is an irregular hilly expanse rising in some places to 900m from the
sea level. The houses in the mountain area have rural characteristics and appearance and are
arranged in a compact grouping (Figure 5), which means that relatives usually live together,
or live as close neighbors. The case study of the NMR falls in this area, thus, the three main
typologies, as shown in figure 1, are the underground, the courtyard and the multi- story
dwellings. As shown in figure 2, the Yifran municipality (North West in the map) includes
examples from the three main typologies.
Figure 5: The compact grouping of under and above ground VD in NMR (author’s photos)
3. VERNACULAR DWELLINGS IN THE YIFRAN MUNICIPALITY
The research strategy focuses on a single case study, the VD of ancient settlements of Yifran
municipality in NMR, this latter being situated in the North-Western part of Libya, South of
the Tripoli region and close to the Tunisian frontier (Figure 6).
Figure 6: The plan and some sites of VA in ancient settlements of Yifran in NMR
(Author’s photomontage)

275
The focus of this study is the VD in the municipality of Yifran. As anticipated in the previous
section, Yifran is representative of all the main typologies of VD in the NMR, thus, if offered
the opportunity to select samples for direct survey covering the three typologies. In the next
sub- sections, each typology will be discussed by referring to 3 actual examples, which were
selected following a preliminary survey because they showed all the typical characters of the
given typology (figure 7). They have been surveyed over a several weeks fieldwork
encompassing photographic survey, direct measurements, visual survey complemented by
annotations on structural and technological details. The analysis of the data was conducted
with a comparative approach and allowed depicting in a systematic manner the different
features characterizing the VA in the three typologies of VD. It is anticipated that VA is here
featured by three main criteria: flexibility, adaptability to the climate conditions and re-usable
building materials.
Figure 7: The survey projections of some sites of VA in ancient settlements of Yifran in NMR.
Source: Department of urban planning, NMR
3.1 Vernacular underground dwelling
The vernacular underground dwellings (VUD) or troglodyte houses in the ancient settlements
of Yifran are very simple in design and most of them were built around a century ago. They
are created by digging a huge cube in the clayey ground, which forms the VUD (Table 1).
Each troglodyte house hosts related families. In general, the VUD in the ancient settlements
of Yifran are distinguished by a minimum use of construction materials, since the only ones
used are in the entrance area. Troglodyte houses do not depend on any built structural
element. Hence, in fact there are no built walls in the rooms, although, in some troglodyte
houses a wall is sculptured, whereas the room is dug, to divide the room into two parts.
As it is seen from table 1, the house under study was built at least two centuries ago and is
classified as medium in size with its total floor area is about 100sqm and 4 floors. Normally,
this type of house consisted of 6 or 4 rooms with a variety of floor areas, some very small and

276
some very large. There are no standards or specifications of the room areas from one house to
another; the areas depend on the needs of the house owner. All the houses are separated from
each other by thick party walls. This system makes the houses attached one to another for
increased support and provides isolation from the outdoor climate. Windows are rare in
number or do not exist at all in most houses, nor in most cases are there windows overlooking
the street.
Table 1: various features of the VUD (Source: author’s elaboration on primary data)
Arc
hit
ectu
re d
raw
ing
s
Dwelling Type Location Date of construction
Vernacular Underground Ancient settlements NMR 700 years
Plan Sections & Elevations Images
ItemNo:1
Features Description
01 Layout
a) Underground dwelling Dimensions vary from 8m to10m deep and 9m by 10m width.
All the rooms open into the courtyard.
b) Rooms Dug deep with a nearly trapezoidal shape. The shortest dimension is in the entrance area, about 1.5m to 2m wide. It then
gets wider towards the inside, where it reaches a width of about 5m to 7m.
Curtains or fabric stretched between walls used to divide rooms into two areas,
the sleeping area, at the rear of the room, and the living area.
c) Fenestration No frontal windows. Dimensions of the doors of approximately 75cm×175cm.
The main entrance door is wide enough to provide access to the cattle of the
residents when necessary.
02 Structure
a) Walls Entrance of bearing walls, about 50cm to 70cm thick and 2.5m to 3.5m high.
b) Roof decks The ceiling height is about 2.0m to 2.5m at its highest point, and it is shaped as
a barrel vault.
c) Staircase Located at the entrance, with landing about 1.5m to 2.0m deep, and leads to the courtyard inside the house.
The area of the hallway depends on the presence of cattle.
03 Construction Materials
a) Hard limestone Used to construct the bearing walls and foundations of the entrance.
b) Rubble stone Also for the walls of the entrance.
c) Wood Olive tree branches were used to construct the ceiling of the entrance and the
staircase.

277
3.2 Vernacular courtyard dwelling
The vernacular courtyard dwelling (VCD) is the second typology considered in this study.
The dwelling selected for survey is located at the edge of the mountain. It was built at least a
century ago and can be classified as medium in size; total floor area is about 250sqm, and
having all modern utilities. The courtyard provides air circulation to the interior. The modest
depth of the rooms with their tall widows and high ceilings, allows natural sunlight to
penetrate all of them. The structural system of VCD depends on connected load bearing walls
for the whole cluster; it provides more strength and support to all the courtyard dwellings that
were built next to each other. In some VCD in ancient settlements, iron-rods between the
walls are used to increase the rigidity of the structure. The extensive deterioration seen
throughout the ancient settlements was also observed in vicinity of the case study house,
where most buildings were in a dilapidated condition while some had nearly collapsed. Some
owners of these houses had carried out extensive repair work. Contemporary building
materials and structural elements were also used to repair the dwelling, such as concrete
d) Small stones To construct the roof placed over the branches.
e) Clayey soil and lime Used as mortar and plastering of the walls and roof, and also used in decoration
work in the rooms.
04 Utilities and Services
a) Electricity Installed recently
b) Gas Not existing
c) Plumbing Simple toilets partly exist outside the house, at the surface level; and inside as a
small cave about 1.5sqm to 2.5smq accessible from the courtyard.
No water supply in the house and the water is carried from a well outside at
some distance from the house.
d) Sewage System Not existing
e) Light Natural through courtyard by the doors
f) Ventilation Natural through courtyard by the doors
05 Auxiliary spaces Small caves “niche” about 2sqm exist inside some rooms and used as sleeping
area for children or storages.
Other auxiliary spaces of about 2sqm are placed between the rooms, without
shutters at the entrances; these spaces are used as kitchens, toilets and/or
storage.
Small storage areas placed above the rooms about 2m over the ground level of
the courtyard to store grain
Sp
ati
al
An
aly
sis
Zoning Analysis Inside-Outside Relation Built up/ Open

278
blocks, cement plaster and pre-cast concrete tie beams to keep the walls together and to
prevent the house from collapsing, as shown in Table 2.
Table 2: various features of the VCD (Source: author’s elaboration on primary data)
Arch
itec
ture
dra
win
gs
Dwelling. Type Location Date of construction
Vernacular Courtyard Ancient settlements NMR
Plan Sections & Elevations Images
Item NO;2
Features Description
01 Layout
a) Courtyard Semi-square in shape dimensions about 6.5m×5m. Most windows overlook the courtyard, and all
the rooms are accessible from it.
b) Rooms Roughly rectangular, not governed by a strict geometric grid.
Longer side overlooking courtyard, Dimensions range from 2.5m to 4m wide and 3m to 9m long.
c) Fenestration Windows are classified as medium size, being about 80cm to 1m wide and about 1.6m high.
Door dimensions of approximately 1m by 2.2m.
02 Structure
a) Walls Internal walls thickness varies from 25cm to 35cm. External ones about 50cm to 60cm.
b) Roof decks Ceilings are quite high at about 4 m.
03 Construction Materials
a) Limestone Blocks of sizes 80cm × 40cm × 45cm, used for foundations and walls.
b) Sandstone For construction of roofs and foundations and walls same dimensions as for limestone.
c) Timber Wood from palm and olive trees were used for ceiling joists, beams and joinery work.
04 Utilities and Services
a) Electricity Installed in the last four decades.
b) Gas Provided by buying gas bottles recently
c) Plumbing Upgraded later in the 1980s.
d) Sewage System Upgraded later in the 1980s and connected to the nearest city sewage system network.
e) Light Natural through courtyard
f) Ventilation Natural, through courtyard
S p at
ia l A n al
ys is Zoning analysis Inside-outside relation Built up/ open

279
3.3 Vernacular multi-STORy dwelling
The vernacular multi-story dwelling (VMD) is the third and last typology considered in this
study. The house selected for survey was built at least two centuries ago and it is classified as
medium in size: its total floor area is about 100sqm and has 4 floors. Same as most VD in
NMR, the house consisted of 6 or 4 rooms with a variety of floor areas, some very small and
some very big. There are no standards or specifications of the room areas from one house to
another; the areas depend on the needs of the house owner. Each house is separated from
another by thick party walls. This system makes the houses attached to each other for
increased support, and provides isolation from the outdoor climate. In some houses, the stone
bearing walls can extend to the first floor only, depending on the financial capabilities of the
owner, and proximity of the house to the quarry. Windows are rare in number or do not exist
at all in most of the houses, there are small and high windows overlooking the street in most
of them.
The various features of the house are tabulated in Table 3.
Table 3: various features of the VMD (Source: author’s elaboration on primary data)
Arch
itec
ture
dra
win
gs
Dwelling Type Location Date of construction
Vernacular Multi-story NMR- Ancient settlements
Plan Sections & Elevations Images
ItemNo:3 Features Description
01 Layout
a) Rooms Sizes range between (1.4m by 2.6m to 1.8m by 6.2m).
The largest room which is the central hall is two floors high; measuring
4.7m×4.0m.

280
b) Fenestration Doors of the house are quite small, about 0.8m by 1.7m.
Windows are few and exist in many shapes, such as a rectangular opening with
15cm×25cm, and a triangle shape with 20cm×20cm×75cm, there is no glass or
shutters for the small openings.
Windows are generally located on the upper floors but in this house, they were
located on the third floor at level 4.75m.
The important opening of the house is the largest one, positioned on the ceiling of
the living area; it is about 1m×1m and it is the only source of light.
Small openings overlooking the living area about 25cm×25cm exist in the rooms.
02 Structural
a) Walls These walls are built on top of strip foundations; the minimum height of
foundation is about 60cm to 80cm above the ground level.
The thickness of the external and internal walls is nearly the same in many
houses; about 40m to 60cm.
b) Roof decks Ceiling height differs from one room to another; the living area can be two floors
high up to 5m, while the bedrooms are 1.8m high and storage rooms can be as
low as 1.6m.
03 Construction Materials
a) Hard stone Sawwan, as called locally, for foundations.
b) Natural Stones For constructing wall, about 40cm×30cm×10cm in dimensions, the sizes are
almost standard.
c) Timber Palm wood and olive trunks for ceilings, beams for the fenestration system.
d) Filler materials Used as fillers for ceilings such as small stones, mud, and lime.
04 Utilities and Services
a) Electricity Installed in the last three decades
b) Gas Not existing
c) Plumbing A simple toilet room is available, without any water supply, located at half way
up from the ground floor and accessible from the landing; the room's dimensions
were about 0.7m×1.9m wide and 2m high. (Figure 7.102)
A modern plumbing system was added recently within the last five or seven
years, located at the ground floor, with limited facilities.
d) Sewage System The commode is just a hole in the ground connected by a channel to a sump pit,
which is like a small closet opened from the street, of dimensions about 0.7m
wide 1.5m high that is filled with sand to absorbs the organic waste.
Septic tanks are used here.
e) Light Natural through the top opening by reflecting light through the rooms
f) Ventilation Natural through the top opening to all rooms.
Zoning analysis Inside-Outside relation Built up/ Open
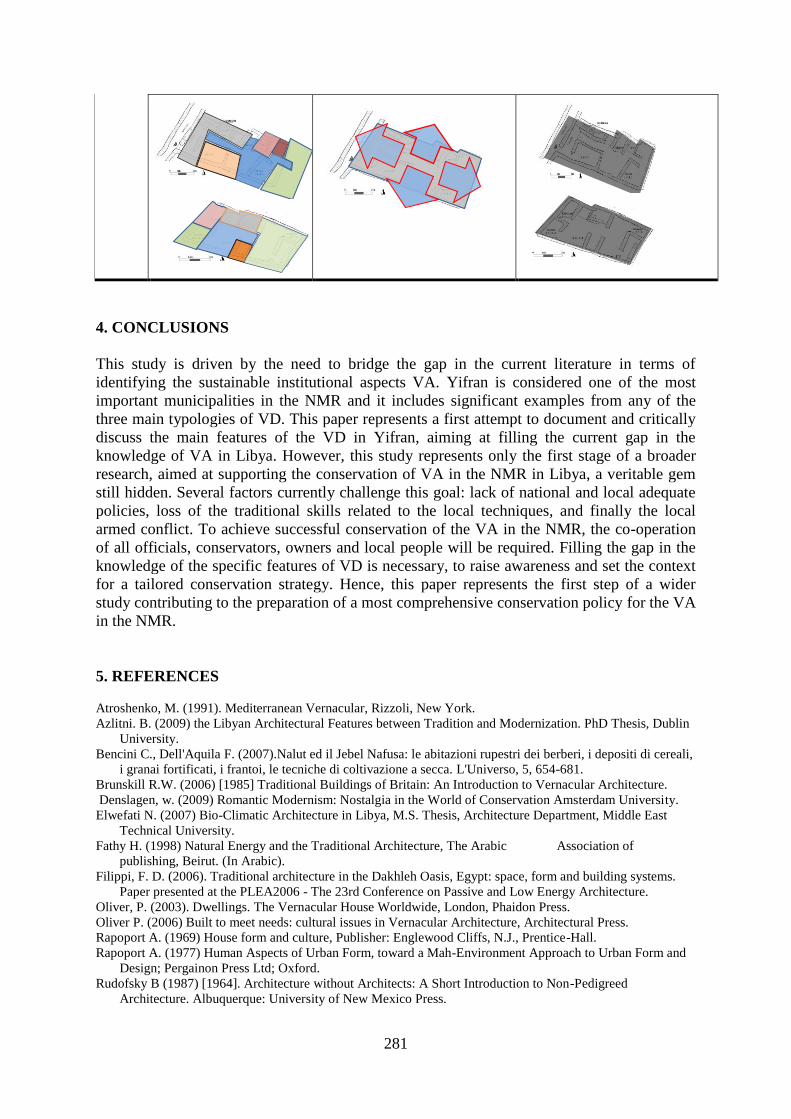
281
4. CONCLUSIONS
This study is driven by the need to bridge the gap in the current literature in terms of
identifying the sustainable institutional aspects VA. Yifran is considered one of the most
important municipalities in the NMR and it includes significant examples from any of the
three main typologies of VD. This paper represents a first attempt to document and critically
discuss the main features of the VD in Yifran, aiming at filling the current gap in the
knowledge of VA in Libya. However, this study represents only the first stage of a broader
research, aimed at supporting the conservation of VA in the NMR in Libya, a veritable gem
still hidden. Several factors currently challenge this goal: lack of national and local adequate
policies, loss of the traditional skills related to the local techniques, and finally the local
armed conflict. To achieve successful conservation of the VA in the NMR, the co-operation
of all officials, conservators, owners and local people will be required. Filling the gap in the
knowledge of the specific features of VD is necessary, to raise awareness and set the context
for a tailored conservation strategy. Hence, this paper represents the first step of a wider
study contributing to the preparation of a most comprehensive conservation policy for the VA
in the NMR.
5. REFERENCES
Atroshenko, M. (1991). Mediterranean Vernacular, Rizzoli, New York.
Azlitni. B. (2009) the Libyan Architectural Features between Tradition and Modernization. PhD Thesis, Dublin
University.
Bencini C., Dell'Aquila F. (2007).Nalut ed il Jebel Nafusa: le abitazioni rupestri dei berberi, i depositi di cereali,
i granai fortificati, i frantoi, le tecniche di coltivazione a secca. L'Universo, 5, 654-681.
Brunskill R.W. (2006) [1985] Traditional Buildings of Britain: An Introduction to Vernacular Architecture.
Denslagen, w. (2009) Romantic Modernism: Nostalgia in the World of Conservation Amsterdam University.
Elwefati N. (2007) Bio-Climatic Architecture in Libya, M.S. Thesis, Architecture Department, Middle East
Technical University.
Fathy H. (1998) Natural Energy and the Traditional Architecture, The Arabic Association of
publishing, Beirut. (In Arabic).
Filippi, F. D. (2006). Traditional architecture in the Dakhleh Oasis, Egypt: space, form and building systems.
Paper presented at the PLEA2006 - The 23rd Conference on Passive and Low Energy Architecture.
Oliver, P. (2003). Dwellings. The Vernacular House Worldwide, London, Phaidon Press.
Oliver P. (2006) Built to meet needs: cultural issues in Vernacular Architecture, Architectural Press.
Rapoport A. (1969) House form and culture, Publisher: Englewood Cliffs, N.J., Prentice-Hall.
Rapoport A. (1977) Human Aspects of Urban Form, toward a Mah-Environment Approach to Urban Form and
Design; Pergainon Press Ltd; Oxford.
Rudofsky B (1987) [1964]. Architecture without Architects: A Short Introduction to Non-Pedigreed
Architecture. Albuquerque: University of New Mexico Press.

282
Sheibani G. N. (2008) How to attract foreign direct investment to invest in housing in Libya. PhD Thesis,
Salford University.
Warfalli M. (1981) Some Islamic monuments in Jabal Nafusa. London University Press.

283
ID 142
A CRITICAL REVIEW OF THE PERCEPTION, AWARENESS AND
IMPLEMENTATION OF THE LEVEL 2 BUILDING INFORMATION
MODELLING (BIM) REQUIREMENTS BY THE UK AEC INDUSTRY
B. Parllaku and J. Underwood
School of the Built Environment, University of Salford, Salford, M5 4WT, UK
Email: [email protected]
Abstract: In May 2011, the UK Government announced a serious commitment through its
Construction Strategy, to transforming the UK construction industry, in a bid to increase
productivity and reduce lifecycle costs on centrally public procured project. On 16th April
2016 the UK Government mandated that any construction suppliers wishing to tender for
central government construction projects must be operating at Level 2 Building Information
Modelling (BIM) maturity. However, since the launch of the UK Government Construction
Strategy, and a year on from the official mandate, while some organisations have embraced
this new way of working and are clear of what Level 2 BIM entails, others remain somewhat
confused and lack an understanding of what is required of them complying with the mandate.
Moreover, there has been a raft of industry surveys, year-on-year, from various institutions,
organisations, bodies, etc. along with trade journal articles, academic papers, and other
literature, all reporting on the adoption of BIM in the UK AEC sector. This paper aims to
provide a critical review of the key literature to explore the perception, industry awareness,
and level of implementation of the Level 2 BIM requirements a year on from the official
mandate.
Keywords: UK AEC Industry, Building Information Modelling, Level 2 BIM Requirements,
Perception, Awareness, Implementation
1. INTRODUCTION
The UK construction industry has been a consistent poor performer compared to other
industries over many decades. A series of reports such as Bossom (1934), Simons (1944),
Banwell (1967), Latham (1994), Egan (1998), Wolstenholme (2009), and the more recent
Farmer (2016) have continually criticised the nature of the industry; describing it as
“fragmented” and “incapable of delivering value for its customers”. The concern was so great
that the government set up the Construction Task Force, Chaired by Sir John Egan, which
resulted in the publication of the ‘Rethinking Construction’ report. Within this report, Egan
called for better ‘integrated processes and teams’. Some 12 years on from the Rethinking
Construction report, Wolstenholme (2009) suggested that the industry had made some
improvements. However, the Government Construction Strategy report Cabinet Office (2011)
concluded that the industry continues not to provide value for public sector construction and
called for greater collaboration through Building Information Modelling (BIM) and higher
levels of standardisation. Furthermore, the recent industry report ‘The Farmer Review of the
UK Construction Labour Model’ (Farmer, 2016) once again echoes similar issues regarding
the nature of the UK AEC industry.
BIM is an approach that has evolved over the last 30-40 years in response to improving the
low productivity, inefficiencies, adversarial nature, etc. through a change of culture to the
traditional nature of the construction industry. Moreover, while numerous definitions exist, in
essence BIM is recognised as not just being about technology, but also process and people in

284
relation to generating and managing digital information about a built environment asset
during its whole life (Eastman et al., 2011; Lee, Sacks, & Eastman, 2006). From April 2016,
through its Construction Strategy, the UK Government mandated Level 2 BIM as a minimum
requirement for construction suppliers tendering for centrally government procured projects
in a bid to increase productivity, communication, reduce cost by 20%, and delivery value
(NBS, 2014). The UK Government BIM Task Group (2011) define BIM as “… other than a
digital-tool set you do not actually use BIM, it is way of working, it is what you do,
information modelling and management in a team environment which facilitates
collaborative working and shared understanding”. In addition, the UK Government BIM
Task Group has defined BIM in terms of a number of 'levels of maturity' in relation to
progressively moving the construction industry to ‘full’ collaborative working; within a range
from 0 to 3 (Figure 1). Starting at Level 0, this describes unmanaged CAD (Computer Aided
Design), whereby there is no collaboration and only 2D CAD drafting is utilised, mainly for
Production Information. Level 1 represents managed CAD in 2D or 3D to BS1192:2007, with
the electronic sharing of data being carried out through a common data environment (CDE);
however models are not shared between project team members. Level 2 is distinguished by
collaborative working and involves the development of built environment asset information
in a collaborative 3D environment with data attached, but created in separate discipline
models. Level 3 (Digital Built Britain) (DBB, 2014) is currently perceived as the ‘holy grail’
and a real game changer in representing ‘full’ collaboration between all disciplines whereby
all parties can access and modify a single, shared project model, through a centralised
repository (i.e. ‘Open BIM’); removing the final layer of risk for conflicting information
(BSI, 2017; NBS, 2014). Moreover, the life-cycle management of the built environment is
enabled through digital procurement based on a data-driven approach, which not only
embraces the capital delivery and operational management of assets, but extends to
performance management across assets, sectors, society/ies, etc.
Figure 1: BIM maturity level definition (BSI, 2017)
Although there are numerous studies justifying the benefits of the adoption of Level 2 BIM in
the UK (BSI, 2016; Payneni, 2016), research carried out by the Chartered Institute of
Buildings (CIOB) (2016), National Building Specification (NBS) (2016), and BRE (2015)
suggest that the Architecture, Engineering, and Construction (AEC) industry is somewhat

285
confused as to what the Level 2 BIM requirements are together with having differing
perceptions of them, which in turn, leads to differing levels of implementation. Furthermore,
there has been a raft of industry surveys, year-on-year, from various institutions,
organisations, bodies, etc. along with trade journal articles, academic papers, and other
literature, all reporting on the adoption of BIM in the UK industry. This paper aims to
provide a review of these reports in order to explore the perception, awareness and
implementation of the Level 2 BIM requirements by the UK AEC industry. In addition, the
vast majority of the literature relating to BIM is primarily focused around the technological
aspects, rather than the people aspects. Such shortcoming is also highlighted by Deutsch
(2011) whereby he describes this as ‘people problems’. This paper therefore also seeks to
address this research deficiency around the Level 2 BIM requirements that currently exists.
Finally, this paper aims to answers why the differing interpretations exist and provide a more
balanced overview.
2. LEVEL 2 BIM: THE REQUIREMENTS
The AEC industry has faced huge challenges with respect to fragmentation and the CAD
system inefficiencies. Although there is evidence from surveys carried out by National
Building Specification (NBS), which suggests that things have improved, there are still
misunderstandings and differing interpretations of BIM and its different levels of
implementations.
To be deemed BIM-compliant, the AEC industry has adopted the ‘BIM Levels’ concept in a
bid to take the industry from the drawing board to the digital age, which according to
National Building Specifications (2014), this is now the accepted term to define the criteria of
the requirements. The BIM Industry Working Group (2011) suggests that by defining levels it
“enables concise descriptions and understanding of the processes and takes some of the
ambiguity out of the word BIM”. This also corresponds to the GCS (2011) report, which
argues that “distinct and recognisable milestones being defined within the BIM process, in
the form of ‘levels’ providing clarity and transparency to the supply-chain and enable the
client to understand precisely what is offered by the supply-chain”. Most of the literature and
research is in complete agreement that BIM level definition is a positive step towards a
structured ‘learning’ progression and understanding of the level of experience of the
construction clients and their supply chain currently possesses.
Although everyone understands the UK Government’s BIM levels of maturity definitions that
range from 0 to 3, as set out by the UK Government BIM Task Group (2011) (Figure 1),
debate exists in relation to the specific meaning of each level, particularly Level 2 due to this
level being the first mandatory BIM requirement from 2016 (NBS 2014 and Turpin 2016). In
the BIM Task Group (2011) report, ‘the body set up by the government to be at the forefront
and oversee the implementation of Level 2 BIM’, the Level 2 requirements is defined as “a
series of domain specific models with the provision of a single environment to store shared
data and information”.
However, this definition is somewhat imprecise and lacks detail. Fortuitously, the NBS BIM
surveys that have been carried out from 2011, and following its publishing of the 2014 report,
continues further by defining the requirements of Level 2 BIM in more detail. It prescribes
that “Level 2 BIM requires stakeholders to use their own 3D CAD models, but not
necessarily working on a single, shared model; with the collaboration coming in the form of

286
the information exchanged between different parties through a common file format”. Payneni
(2016, p 29) also agrees to an extent, but expands further, stating that “Level 2 BIM
adaptation requires the stakeholders to consider issues beyond 3D modelling and have
procedures in place for collaboration and communication”. Therefore, it is evident that the
Level 2 BIM requirements are defined and interpreted differently by various organisations
and therefore, it follows, that there is still ambiguity about the Level 2 requirements
definition, mainly in part according to Paul Oakley (2015) (a director at BRE), due to the
overabundance of definitions of the Level 2 BIM requirements and the lack of a single source
in order to ascertain those requirements. Therefore, this is somewhat ironic considering the
BIM fundamental principal of information being delivered from a single source. Despite the
above mentioned pitfalls, the best single source of information delivery regarding the Level 2
BIM requirements, according to BRE (2016), is PAS1192-2:2013, PAS1192-3:2014 and PAS
1192-5:2015; which defines the requirements as “a development of information models that
reference, federate or exchange information with other models within a common data
environment such as Industry Foundation Class (ICF) or Construction Operations Building
Information Exchange (COBie)”. Additionally, this definition recommends that the
technology used by each stakeholder must be capable to export to IFC or COBie file formats.
The former being “a standard data format facilitating interoperability between different
software systems”, while the latter is “a spreadsheet data format for the publication of a
subset of building model information” (RICS, 2014). The adaptation of this definition is
paramount as it stirs the focus of the review presented in the paper.
3. RESEARCH METHODOLOGY
The scope and focus of the exploratory study presented is on establishing an understanding of
the holistic perception, awareness and implementation of the Level 2 BIM requirements by
the UK AEC industry through a critical analysis of the vast governmental, industry and
academic literature published to date, since the launch of the UK Government Construction
Strategy and Level 2 BIM mandate. Therefore, the approach adopted to conduct this research
is secondary data analysis, based on both qualitative and quantitative form due to the nature
of the various sources. This approach is best defined by Glaser (1963) as “the study of
specific problems through analysis of existing data, which were originally collected for
another purpose”. Furthermore, Naoum (2013) describes this method as a “very useful
comparative tool for existing and new data to examine differences, patterns or trends”. The
selected data has been sourced from a wide range of key sources, including official
governmental statistics and industry and academic reports, journal and conference papers,
trade journal articles, etc. (Figure 2).

287
Figure 2: Secondary data analysis approach (Naoum, 2013)
4. ANALYSIS AND FINDINGS
4.1 Perception of Level 2 BIM
According to the Oxford Dictionary (2017), ‘perception’ is “the way in which something is
regarded, understood, or interpreted” and as Turpin (2016) illustrates in his piece in ‘BIM
Plus journal’, when things are open to interpretation it leads to differing opinions and
ambiguity. Eastman et al. (2011, pp. 19-26) argues that the backbone of any technology or
process implementation relies on the perception of people and unless BIM is clearly defined
from a single source, then it is left open to interpretation, leading to differing levels of
adaptation; which, correlates to Enegbuma et al. (2015) findings that “there is a significant
relationship between process perception and Level 2 BIM adoption”. Furthermore, Graham
(2017) argues that the confusion over the Governments 2016 Level 2 BIM mandate has led
businesses to lie about their BIM maturity level due to the ‘adopt or die’ nature of the
mandate, and also argues that the confusion over the requirements has led to businesses being
BIMwashed; a term used by the AEC industry to describe the misconceptions of Level 2 BIM
requirements and the organisations that are trying to BIMwash businesses on the basis of
‘compliance’ with the mandate (BIM Plus, 2017). It is clear that since the launch of the UK
governments construction strategy, back in May 2011, there has been a considerable amount
of confusion over what the requirements entail. However, the governments launch of the BIM
Task Force in 2016 has improved the perception of Level 2 requirements through a series of
documents, which, according to Simpson and Underwood (2016) are the “eight pillars of
BIM”. These documents include PAS 1192-2:2013, PAS 1192- 3:2014, BS 1192-4:2014,
PAS 1192-5:2015, Digital Plan of Works (dPOW), CIC BIM Protocol, Classification
(Uniclass 2015) and Government Soft Landings (GSL).
Every year since the 2011 government construction strategy report, a plethora of studies and
annual surveys have been carried out by such industry bodies and organisations such as the
Chartered Institute Of Building (CIOB), National Building Specifications (NBS),
Construction Manager in partnership with BIM Plus, Pinsent Masons, to determine the level
of BIM maturity in the UK AEC industry and in particular, the perception of the Level 2 BIM
requirements. However, the data from 2011-2014 does not include Level 2 BIM specific
questions and is BIM generalised in the survey questions. The NBS (2017) has carried out
surveys with around 1000 respondents each year from 2010-2016, and they show that the use
of BIM has increased from 3% in 2011 to 54% in 2016. Furthermore, from the 50% using

288
BIM in 2015 and the 54% using BIM in 2016, 18%-28% believe that BIM is about software
and 11%-15% believe it to be a 3D CAD synonym. Moreover, from 2014-2016 the NBS
included a question about “trust in what they hear about BIM”; to which, the answer was that
27%-29% of the 3000 respondents over that three year period did not trust what they had
heard about BIM.
The perception of Level 2 specific data from the NBS survey shows that in 2014; 51% of the
61% using BIM were claiming to be at Level 2 BIM, which grew to 59% from the 50% using
BIM in 2015, and is currently at 65% of the 54% using BIM in 2016. However, these figures
are somewhat contradictory, as in the same surveys, 64% are not clear about what they have
to do in order to meet the 2016 government mandate, and only 10% believe they are ready to
meet the mandate. Moreover, this is also reflected in the Pinsent Masons (2015) survey,
where 72% of the 600 respondents believe the industry will fail to meet the mandate due to a
lack of understanding of the requirements. The Civil Engineering Contractors Association
(CECA) (2015) survey echoes those findings and finds that only 26% of organisations
expected to meet the mandate. The gap in perception against the realities and possibilities is
highlighted further by the NBS (2016) and CIOB (2016) surveys showing that 77% (NBS)
and 58% (CIOB) of the respondents are not using COBie; while 65% of the 54% using BIM
in 2016 claim to be working at Level 2 maturity. This according to Boutle (2017) underlines
the communication challenge the AEC industry faces within itself, the supply chain, and its
clients. More concerning, the BIM+/CM (2017) and CIOB (2016) surveys report that clients
have a far worse perception of BIM and the Level 2 requirements, as put simply by Guthrie in
Chevin (2017), who stated that “Clients still do not understand what they are asking for or
what BIM is. The majority do not have any idea and basically see BIM as a cost”. The survey
also reports that the number of clients making Level 2 BIM a requirement on their projects
has fallen from 25% to 20%. This decrease, according to Francis Ho in Chevin (2017), can in
some way be attributed to Brexit as it has “robbed a bit of the momentum from BIM”.
4.2 Awareness of Level 2 BIM
The Oxford Dictionary (2017) defines ‘awareness’ as “having knowledge or perception of a
situation or fact”. It is clear to see that the UK BIM Task Group, since it was established in
2011, has according to Ravenscroft (2016), been successful with defining and increasing
awareness of Level 2 BIM within government departments. However, the government has
stated that the responsibility of moving Level 2 BIM from mobilisation to ‘business as usual’
should be with the industry and as such, the cross industry UK BIM Alliance was formed in
2016 to drive Level 2 BIM adaptation and increase awareness across all sectors of the AEC
industry; not just for centrally procured public sector projects (UK BIM Alliance, 2016).
According to a report published by the UK BIM Alliance (2016), knowledge and awareness
of Level 2 BIM is growing, but it is inconsistent and in some cases, diverging. This was
confirmed by their survey, whereby awareness factors such as guidance, publicity, and access
to good speakers were amongst those cited as some of the main challenges to Level 2
adaptation. Moreover, these findings are also mirrored in the CIOB (2016) survey, which
highlighted that 70% of the respondents acquired Level 2 BIM information from colleagues
with a further 60% from colleagues outside their organisations. This, according to Kemp in
Ravenscroft (2016) points towards a lack of a ‘single source information’ and recommends
that the 50 organisations that currently make up the alliance should increase awareness
through clear guidance that is easily understandable, obtainable and spoken with the same

289
powerful voice. Moreover, according to the Chartered Association of Building Engineers
(CABE) (2015) survey of 1200 respondents, an overwhelming 96% replied that there is a
need for greater awareness and training in BIM in order to achieve the mandate.
The NBS surveys carried out from 2011-2016 (NBS, 2016) suggest that awareness of BIM in
general has increased from 58% to 96%, and in that same period the awareness of different
BIM levels has improved from 51% to 77%. In contrast, the same survey shows that in that
same period, the use of IFC and COBie; the file format that is independent of software
vendors and supports collaboration and is a key requirement of Level 2 BIM, has only
increased from 39% to 63% (IFC), and 15% to 27% (COBie). This, according to NBS (2016)
is due to a “lack of awareness and skills across the board as people do not know what to do
with a COBie spreadsheet and most clients (even government departments) are barely up to
speed with CAD drawings let alone COBie”. The survey findings echo Mallesen in Dunton
(2016) school of thought, suggesting that the construction industry is ‘Level 2 BIM positive’,
but not ‘Level 2 BIM aware’. All the evidence for this, Hunt (2015) believes, points towards
a “disproportionate amount of awareness being given on the use of BIM software alone with
too little invested in the collaborative working and common working practices that truly lie at
the heart of a BIM-based approach to project delivery”. Furthermore, according to Boutle
(2017), the level of knowledge is even worse down the supply chain, where a good
proportion still struggle with BIM Level 1 (BS1192: 2007). Furthermore, the figures from the
CABE (2015) survey further support this claim as they found that 71% of the non-
manufacturing respondents believe that suppliers are not engaging quickly enough to provide
Level 2 BIM collaboration. Moreover, this also corresponds to the NBS (2016) BIM report
stating that “all the evidence points towards the people are using standards, but fewer use the
range of standards than have adopted BIM”.
4.3 Implementation of Level 2 BIM
The UK Governments 2016 mandate has been brought in with the objective to take the AEC
industry towards a more productive, less wasteful and fragmented direction, and according to
Davidson (2014), Level 2 BIM implementation will go a huge way into achieving the
governments objective, but also represents a stepping stone for a more data driven, digital and
a smarter industry with dynamic collaboration at the heart of it. Although, there is an
abundance of literature and industry agreement as to the benefits of Level 2 BIM
implementation (Ghaffarianhoseini et al 2016, Johnston Partnership 2017, NBS 2017, and
Payneni 2016), there is also evidence that suggests there is a long way to go before the
industry can claim to have met the mandate, pointing to a lack of understanding of Level 2
defining standards (NBS 2016, UK Construction Week 2015, Blackman 2015, Schouten
2015, CIOB 2016, and Simpson and Underwood 2016). The NBS (2016) BIM report in
particular, suggests that Level 2 BIM implementation has increased to 65% amongst the 54%
that were using BIM overall. However, the report also suggests that faith in BIM is not being
matched by progress, which according to Boutle (2017), is due to the lack of interest from
small companies in relation to the cost implication of BIM. Furthermore, Schouten (2015),
Blackman (2015), Eadie et al. (2015) and Robson (2014) concur with Boutle, and also
stipulate further that the implementation of Level 2 BIM is being held back somewhat by
subcontractors and the supply chain, which they cite that “Level 2 adoption is primarily client
driven and is not necessarily being used to improve internal workflows and efficiencies by
harnessing technology and process”. In contrast, Chevin (2017) expresses some scepticism as
to whether low implementation is limited to the supply chain; arguing that the client, be it

290
from central government departments or the private sector are not making Level 2 BIM a
mandatory requirement on their projects. To this end, the Construction Manager and BIM
Plus (2017) survey confirms that Level 2 BIM progress is unlikely to be client driven, and the
results from its 392 respondents show that only 38% of the central government departments
make Level 2 BIM mandatory on all projects, while 23% do not make it a requirement at all.
Furthermore, only 11% of the private sector demanded Level 2 BIM on all projects, with
50% not at all. Shepherd (2015) and Boutle (2017) are in agreement that part of the reason for
the lack of client enthusiasm towards Level 2 implementation is that “often BIM costs more
in the capital phase, rather than delivering savings via efficiencies gained therein, perhaps
putting clients off to the initial investment to realise lifecycle benefits”. However, Shepherd
(2015, p 9) suggests the industry is seeing some signs of improvement through increased
affinity of BIM strategy with client strategy.
One of the main benefits of Level 2 BIM is collaboration through an open common project
file sharing format such as IFC or COBie and understanding of whole-life performance of
buildings. However, NBS (2016) reports that the industry is barely scratching the surface.
Regarding the uptake of IFC and COBie, the NBS survey notes that 63% of organisations
polled said they were using IFC and just 27% were using COBie; an increase of 9% (IFC)
and (COBie) from the 2015 NBS survey. Although a good annual increase for both, COBie is
much less used, which according to NBS (2015) is perhaps due to that the “whole Excel sheet
concept contradicts the fundamental principle of a common data environment”. However, the
NBS (2016) report and Eadie et al. (2015) presents a different view, and note that from the
small number who use COBie, two thirds find it useful and concludes that “the slow rate of
adoption may be as a result of BIM models being restricted to the design stage as opposed to
the whole life of the building”.
In contrast, Ghaffarianhoseini et al. (2016) and IStructE (2016) present a valid point and
instead, point to a lack of skills, cyber security and legal concerns over the ownership of
data/design, and liability when something goes wrong as the reasons for the slow uptake of
Level 2 BIM. Utiome (2010) and Enegbuma et al. (2015) present a different view, arguing
that cultural change is a huge factor in the implementation of any new system of working,
especially in the AEC industry, which has always been resistant to change of its organisation
structure.
Another school of thought is presented by Simpson and Underwood (2016), which points to a
lack of use and understanding of PAS 1192-2 (the standard that defines Level 2 BIM Capex
delivery). To this end, the results of the Institution of Civil Engineers (ICE) (2016) survey
suggests that although the industry is showing good progress in its Level 2 BIM
implementation, for most large companies, unfortunately there is continued resistance from
people to review the BS/PAS 1192 family of documents and continued confusion around the
acronyms associated with them. The ICE findings are further supported by the NBS (2016)
and CIOB (2016) reports, which report that 71% (NBS) and 52% (CIOB) of the respective
respondents have never used PAS 1192-2 and also report a similar high non-use of the other
pillars that define Level 2 BIM, e.g. PAS 1192- 3:2014, BS 1192-4:2014, PAS 1192-5:2015,
CIC BIM Protocol, Digital Plan of Works (dPOW), (Uniclass 2015), Government Soft
Landings (GSL).
291
4.4 A year on from the UK Government Level 2 BIM mandate
Just over a year since the UK Government’s April 2016 mandate, surveys carried out by the
Construction Manager and BIM plus (2017), IStructE (2016) and ICE (2016) report that there
has been progress in experiencing of all eight pillars of Level 2 BIM. Furthermore, according
to the CM BIM Plus (2017) survey, the number of respondents using Level 2 BIM on ten or
more of their projects has almost doubled from 10% to 18%. Interestingly, the surveys also
report that awareness of Level 2 BIM has increased from their respective surveys carried out
in 2016. However, the IStructE survey reports that 40% of the smaller practices and 60% of
the sole practitioners do not see BIM as relevant to their business. These statistics reflect
Dainty et al. (2017) view, which suggests that political reform agendas centred on BIM may
actually be “disenfranchising small firms that are unable (or unwilling) to engage with them”.
Furthermore, the IStructE report also suggests that not enough directors or principal staff are
being trained in BIM; reporting that 50% of those being trained are graduates, while only 9%
are senior staff. The chairman of ICE, David Shields, commenting on the report, recommends
that more management are required to be trained in order to be at the forefront and act as
BIM champions, as the current levels of training according to him may be compounding the
problem of cultural change. To this end, Oliver (2017) suggests “the reality is that embracing
BIM and reaping these benefits remains a cultural not technology challenge”, and as
technology develops further, managing people, process and cultural change will be the main
challenge. Bew (2017), Head of the Digital Built Britain Strategy, agrees to an extent, but
also points to the fact that “the UK has the biggest cohort of skilled data-aware engineers,
designers and suppliers, which places the UK at the front of the queue to capitalise on the
next stage”. Although smaller practices, training and cultural change are clearly factors
restraining Level 2 BIM uptake, a lack of clients enforcing the mandate is also identified by
the CM BIM Plus survey, which reports that only 38% of central government departments
respondents currently make Level 2 BIM mandatory on all projects, while that figure is much
lower at 11% in the private sector. A further reason for the low mandate implementation
figures may be due ‘weak government messaging’ such as seen in the recently released
Housing White Paper, which did not contain a single mention of BIM/Digital Construction
(Ruddle in BIM Plus, 2017).
5. DISCUSSION AND CONCLUSIONS
The findings presented show that the definition of the Level 2 BIM requirements is open to
interpretation, based on the different circumstances in which they are applied, be it from
organisations or even individual users. While there is industry wide understanding of the
different levels of BIM, the literature is split on the exact definition of the Level 2 BIM
requirements. However, although different views on what defines Level 2 requirements are
presented in the literature, a common aspect to these views emerge, which states that Level 2
BIM facilitates collaboration. Therefore, if the varying definitions are to be adopted then the
argument will be ongoing. On the other hand, if the holistic definition based on the common
aspect of those differing definitions is to be adopted, then on that basis, collaboration is the
common ground that the differing interpretations of Level 2 BIM agree upon. Thus, going
forward, industry or individuals should undertake a level of research when seeking the
definition of Level 2 BIM; while always following the official Level 2 BIM defining
BS/PAS1192 standards.

292
In addition, the paper aimed to explore the perception of Level 2 BIM among the UK AEC
industry. On the one hand, literature argues that the differing perceptions emanate from the
approach in which Level 2 BIM is put to use in different organisations. However, on the
other, literature suggests that perceptions also vary from team to team, and shows that
perceptions of the design team vary from those of the client, the contractor, and those of the
supply chain. It is hard to gauge an exact measurement of the statistics on perceptions of
Level 2 BIM overall, as they vary in numbers and participant types from survey to survey.
However, a holistic picture of the surveys studied emerges, showing that there is a clear
disparity between the number of firms saying they have achieved Level 2 BIM maturity and
the number claiming to use IFCs and COBie information sharing and the Level 2 BIM
defined by PAS1192-2:2013. Therefore, the findings presented indicate that the actual
number of organisations that have reached Level 2 maturity is much lower than that to which
they perceive themselves to be at. Design teams should engage more with clients in particular
to make clear the advantages of Level 2 BIM as a cost reducing process over the lifecycle of
the project, as they are the group with the perception of Level 2 BIM as a mere cost, rather
than adding value.
Moreover, another aim was to explore the level of awareness of the Level 2 BIM
requirements within the UK AEC industry. It would appear that overall they agree that the
awareness of BIM has increased dramatically from 58% in 2011 to 96% in 2017. Moreover,
the literature also mirrors the survey findings and suggests that the awareness of Level 2 BIM
is diverging due to a lack of access to information from a single source; also highlighting that
there has been an unequal amount of awareness given about the technology side of Level 2
BIM and not enough on collaborative working aspect. The surveys also point to a lack of
awareness of the eight pillars of Level 2 BIM, which is reflected in the in the low percentages
of organisations claiming to be aware of what they are. The UK BIM Alliance together with
educational institutes should increase awareness of collaborative working and the eight pillars
of Level 2 BIM, through a single point of information and using a common language to
reduce confusion and ambiguity. Finally, this paper has also explored the implementation of
Level 2 BIM within the UK AEC industry. The literature and surveys are in agreement that
this has slowly increased among all users, but more so with the large organisations. However,
they disagree on the current barriers of Level 2 BIM uptake. On the one hand, literature
alludes to small organisations being the reason for the low uptake, while on the other, it is
suggested that it is due to the supply chain. The statistics of the surveys, however, point
towards a lack of mandate enforcement from the central government departments and a lack
of use of the BS/PAS 1192 suite of standards as the reasons for the slow implementation of
Level 2 BIM. Furthermore, since the mandate came into force, the literature and surveys
report that the supply chain and small organisations have no interest in adopting Level 2
BIM. The findings of this paper conclude that Level 2 BIM is slowly being implemented,
however, it is being used as a mere bit-part tool instead of a whole lifecycle process. This
trend has also continued after the mandate has come into force, indicating that enthusiasm is
not matched by the uptake of Level 2 BIM. The UK BIM Alliance should increase awareness
further among clients and the supply chain in order to reveal the true benefits of BIM as a
process, not a mere tool for a certain stage of the design, construction or maintenance phase,
but across the whole life. Furthermore, the UK Government should also be relentless in its
continuation of delivering a strong message that BIM/Digital Construction is the future of
transforming the UK AEC industry.

293
6. REFERENCES
Alan Johnston Partnership. (2017). What is Level 2 BIM?. Retrieved on 26 April 2017, from:
http://www.ajpstructeng.com/bim/level-2-bim/.
Banwell, H (1967). The placing and management of contracts. London: HMSO.
Beaumont, W. & Underwood, J. (2015). Data Management for Integrated Supply Chains in Construction,
Supply Chain Management and Logistics in Construction, (Ed.) Greger Lundesjö, Kogan Page.
Bew, M. (2017). A year after the BIM mandate. Retrieved on 28 April 2017, from: http://www.building.co.uk/a-
year-after-the-bim-mandate/5087084.article.
Blackman, D. (2015). BIM survey results: Levelling off?. Retrieved on 25 April 2017, from:
http://www.building.co.uk/bim-survey-results-levelling-off?/5074872.article.
Bossom, A.C. (1934). Building to the skies: the romance of the skyscraper. The Studio, limited.
Boutle, A. (2017). UK BIM adoption: reality is difficult to fathom. Retrieved on 24 April 2017, from:
http://www.bimplus.co.uk/people/uk-bim-adopt7ion-rea6lity-diffic8ult-fathom/.
BRE. (2016). Level 2 Requirements . Retrieved on 24 April 2017, from:
http://www.bre.co.uk/page.jsp?id=3447.
British Standards Institution. (2017). About Level 2. Retrieved on 25 April 2017, from: http://bim-
level2.org/en/about/.
BSI. (2016). New BIM Level 2 Website Launches. Retrieved on 28 April 2017, from:
https://www.bsigroup.com/en-GB/about-bsi/media-centre/pressreleases/2016/april/New-BIM-Level-2-
website-launches/.
Chartered Association of Building Engineers. (2015). Industry Falling Short of Mandatory BIM Target, Says
UK Construction Week . Retrieved on 21 April 2017, from:https://www.cbuilde.com/news/industry-falling-
short-mandatory-bim-target/.
Chevin, D. (2017). Clients still not buying into BIM, reveals survey. Retrieved on 23 April 2017, from:
http://www.bimplus.co.uk/news/clie6nts-still-n7ot-buyin8g-bim-reveals-cm-survey/.
CIBSE. (2015). CIBSE survey shows faith in BIM is not matched by progress. Retrieved on 22 April 2017,
from: http://www.bimplus.co.uk/news/cibse-sur3vey-shows-faith-bim-match5ed-pro5gress/.
Government Construction Client Group. (2011). Building Information Modelling (BIM) Working Party.
Retrieved on 30 April 2017, from: http://www.bimtaskgroup.org/wp-content/uploads/2012/03/BIS-BIM-
strategy-Report.pdf.
Dainty, A., Leiringer, R., Fernie, S, Harty, C. (2017). BIM and the small construction firm: a critical
perspective. Building Research & Information . 0 (1), 1-14 .
DBB (2014) Digital Built Britain: Level 3 Building Information Modelling – Strategic Plan, HMSO, London
Deutsch, R. (2011). BIM and Integrated Design. New Jersey: John Wiley & Sons Ltd.
Dunton, J. (2016). Survey shows profession uncertain over new BIM rules . Retrieved on 26 April 2017, from:
https://www.architectsjournal.co.uk/news/survey-shows-profession-uncertain-over-new-bim-
rules/10004804.article.
Eadie, R., Browne, M., Odeyinka, H., McKeown, C. & McNiff, S. (2015) A survey of current status of and
perceived changes required for BIM adoption in the UK, Built Environment Project and Asset
Management, 5(1), 4-21.
Eastman, C., Teicholz, P., Sacks, R. & Liston, K (2011). BIM Handbook; A guide to building information
modeling. 2nd Ed. New Jersey: John Wiley & Sons.
Egan, J. (1998). Rethinking Construction. London: Department of the Environment, Transport and the Regions.
Enegbuma, WI., Aliagha GU & Ali, KN. (2015). Effects of perceptions on BIM adoption in Malaysian
construction industry. Journal of Technology. 77 (15), 69-75.
Farmer, M. (2016) The Farmer Review of the UK Construction Labour Model. Construction Leadership
Council.
Ghaffarianhoseinia, A., Tookey J., Ghaffarianhoseinia, A., Naismith, N., Azhar, S., Efimova, O. & Raahemifar,
K. (2016). Building Information Modelling (BIM) uptake: Clear benefits, understanding its implementation,
risks and challenges. Renewable and Sustainable Energy Reviews. 75(1), 1046-1053.
Glaser, B.G. (1963). Retreading research materials: the use of secondary analysis by the independent researcher,
The American Behavioural Scientist, 6 (10), 11–14.
Hunt, S. (2015). Steven Hunt: No-one is ready” for 2016 BIM Level 2 mandate. Retrieved on 23 April 2017,
from: http://bimcrunch.com/2015/08/steven-hunt-no-one-is-ready-for-2016-bim-level-2-mandate/.
Enegbuma, W. I., Aliagha, G. U., & Ali, K. N. (2015). Effects of perceptions on BIM adoption in Malaysian
construction industry. Journal of Technology, 77(15), 69-75.
Institution of Civil Engineers. (2016). BIM Heat Map report 2016. Retrieved on 19 April 2017, from:
https://www.ice.org.uk/disciplines-and-resources/best-practice/bim-heat-map-report-2016.

294
Institution of Structural Engineers. (2016). Institution of Structural Engineers BIM Survey 2016: a positive
outlook. Retrieved on 24 April 2017, from: https://www.istructe.org/news-articles/2016/institution-
news/institution-of-structural-engineers-bim-survey-2011.
Latham, M. (1994). Constructing the Team. London: HMSO.
National Building Specification. (2015). NBS National BIM Report 2015 . Retrieved on 21 April 2017, from:
https://www.thenbs.com/knowledge/nbs-national-bim-report-2015.
National Building Specification. (2014). The top five barriers to BIM implementation . Retrieved on 22 April
2017, from: https://www.thenbs.com/knowledge/the-top-five-barriers-to-bim-implementation.
National Building Specification. (2014). BIM levels explained. Retrieved on 22 April 2017, from:
https://www.thenbs.com/knowledge/bim-levels-explained.
National Building Specification. (2013). NBS International BIM Report 2013. Retrieved on 19 April 2017,
from: https://www.thenbs.com/knowledge/nbs-international-bim-report-2013.
National Building Specification. (2012). NBS National BIM Report 2012. Retrieved on 21 April 2017, from:
https://www.thenbs.com/knowledge/nbs-national-bim-report-2012.
National Building Specification. (2011). NBS National BIM Report 2011 . Retrieved on 19 April 2017, from:
https://www.thenbs.com/knowledge/nbs-national-bim-report-201
National Building Specification. (2015). NBS National BIM Report 2015 . Retrieved on 22 April 2017, from:
https://www.thenbs.com/knowledge/nbs-national-bim-report-2015.
National Building Specification. (2016). National BIM Report 2016. Retrieved on 28 April 2017, from:
https://www.thenbs.com/knowledge/national-bim-report-2016.
Naoum, S. (2013). Dissertation Research & Writing for Construction Students. 3rd Ed. Oxon: Routledge.
Oliver, A. (2017). BIM mandate one year on – no bolt-on optional tool but a fundamental plank in our digitally-
led future. Retrieved on 28 April 2017, from: http://geobusinessshow.com/geobuzz/bim-mandate-one-year-
no-bolt-optional-tool-fundamental-plank-digitally-led-future/.
Oxford Dictionary. (2017). Perception. Retrieved on 25 April 2017, from:
https://en.oxforddictionaries.com/definition/perception.
Oxford Dictionary. (2017). Awareness. Retrieved on 26 April 2017, from:
https://en.oxforddictionaries.com/definition/awareness.
Payneni, K. (2016). BIM Specifics: An illustrative guide to implementing Building Information Modelling.
CreateSpace Independent Publishing Platform..
Ravenscroft, T. (2016). UK BIM Alliance established to drive implementation of BIM Level 2. Retrieved on 20
April 2017, from: http://www.bimplus.co.uk/news/uk-bim-alli2ance-establi4shed-implementa5tion/.
RIBA. (2016). BIM Mandate Arrives, But Is The Industry Ready. Retrieved on 30 April 2017,
from:https://www.architecture.com/RIBA/Contactus/NewsAndPress/Membernews/PracticeNews/2016/Apri
l%202016/07April2016/BIMmandatearrives,butisindustryready.aspx
RICS. (2014). What is BIM?. Retrieved on 23 April 2017, from:
http://www.rics.org/uk/knowledge/glossary/bim-intro/.
Robson, A., Boyd, D. & Thurairajah, N. (2014). UK Construction Supply Chain Attitudes to BIM. In 50th ASC
Annual International Conference Proceeding. March, Birmingham, UK.
Ruddle, J. (2017). Round table asks: what happened to the BIM bang?. Retrieved on 28 April 2017, from:
http://www.bimplus.co.uk/news/roun6d-table-a5sks-w8hat-happened-bim-bang/.
Schouten, C. (2015). Third of contractors and consultants feel lack of subbie understanding holds back BIM
development. Retrieved on 27 April 2017, from:
https://www.constructionnews.co.uk/companies/financial/bim-level-2-held-back-by-lack-of-subcontractor-
understanding/8682639.article.
Shephard, D. (2016). BIM Management Handbook. Newcastly upon Tyne: RIBA Enterprises Ltd.
Simon, Sir Ernest. The placing and management of building contracts: report of the Central Council for Works
and Buildings. HM Stationery Office, 1944.
Simpson, M. & Underwood J. (2016). Level 2 BIM is just the beginning. Retrieved on 22 April 2017, from:
https://www.pbctoday.co.uk/news/bim-news/level-2-bim-just-beginning/26137.
Turpin, M. (2016). It’s time to forget BIM Level 2. Retrieved on 15 April 2017, from:
http://www.bimplus.co.uk/people/its-ti8me-for5get-bi4m-level-2/.
Utiome, E. (2010) An exploration of the extent, use and success in the application of Building Information
Modelling (BIM) in the UK construction industry. Masters by Research thesis, The Robert Gordon
University. 15-53.
UK BIM Alliance. (2016). “BIM in the UK: Past, Present & Future.”. Retrieved on 25 April 2017, from:
http://www.ukbimalliance.org/media/1050/ukbima_bimreview_past_present_future_20161019-1.pdf.
Visqueen. (2015). Construction industry ‘falling short’ of mandatory BIM target. Retrieved on 28 April 2017,
from:http://blog.visqueenbuilding.co.uk/construction-industry-falling-short-of-mandatory-bim-target/.
Wolstenholme, A. (2009). Never Waste a Good Crisis. London: Constructing Excellence.

295
ID 143
CLOUD COMPUTING FOR DISASTER RESPONSE MANAGEMENT
STEMMING FROM TERRORISM IN IRAQ
H. Al-Dahash1, S. Al-Shammari2, U. Kulatunga1 and M Hardman3
1 School of the Built Environment, University of Salford, Salford M5 4WT, UK 2 Computer Engineering Department, College of Engineering, Al-Nahrain University, Baghdad, P. O. Box
47077, Iraq 3 Salford Languages, University of Salford, Salford M5 4WT, UK
Email: [email protected]
Abstract: Effective response to disasters requires assessing information prior to, during, and
after potentially catastrophic events, as well as initiating activities that will lessen their impact
upon society. The post-war transitions in Iraq have affected the institutional capacities of the
state to respond in an efficient manner. Although the draft National Disaster Risk Reduction
Law acknowledges the importance of information and knowledge management, it fails to
provide a framework for establishing a dedicated information system. Due to the importance
of an effective and efficient disaster management information system, this should be linked to
local authorities, local early warning systems, and the media, to ensure effective use of disaster
risk information for public awareness. The fact that disaster management data is often
complex, large, and from different organisations, this requires a fast, scalable and accessible
system to manage the complexity of the collected data. As cloud computing is considered a
technology for providing synchronous, on-line information management with accessibility of
data regardless of the storage resources’ location, this paper highlights the advantages of using
cloud computing in managing information and communication in disaster response
management, with particular reference to terrorism in the context of Iraq. The paper
contributes to the existing knowledge on disaster response management, a field of study that is
still largely under explored in the context of the Middle East, and in the context of terrorism
more specifically, by reviewing its literature, through a systematic review methodology. This
paper will focus, therefore, on the use of cloud computing as a solution to information sharing
and communication, during the immediate response to a terrorist attack, due to the advantages
of cloud computing in this context, in terms of data availability, reliability, IT and cost
reduction.
Keywords: Cloud Computing, Communication, Disaster Response Management, Information
System, Terrorism.
1. INTRODUCTION
In light of increasingly frequent and catastrophic attacks, particularly terrorist attacks, on
public and private infrastructure, in Middle Eastern countries such as Iraq, disaster response
management is becoming an increasingly important research topic (Hale, Dulek, & Hale,
2005). According to recent literature, the ‘response’ stage of the disaster management cycle is
arguably the most critical, the other two stages (prevention and recovery) are not at the point
of crisis and therefore there is time for thought and planning. Response is the point when
decisions are made that may save lives and contain the attack in terms of impact (Hale et al.,
2005). The unique environment present during disaster response (immediate risk of
significant loss, time pressure, and stress) requires research effort in order to save lives and
property (Hale et al., 2005). Terrorist attacks can cause high-rise building collapses, major
nuclear facility malfunctions, and catastrophic damage to infrastructure, and these pose an

296
ever-present challenge to public emergency services (Meissner, Luckenbach, Risse, Kirste, &
Kirchner, 2002).
Terrorist attacks often occur without warning, in order to have the most serious impact on
lives and property, therefore, there is no time for long negotiations or prearrangements for
different stakeholders, such as public and non-profit organisations. Since these organisations
might have little experience in disaster response management activities, under extreme
circumstances, different problems can emerge from a fragmented performance, including a
lack of coordination, inadequate information exchange, and lack of trust (Comfort, 2007;
Nolte & Boenigk, 2013). Appropriate communication decisions within the response stage
could, therefore, effectively improve the disaster response by limiting or reducing the impact
of the attack. Ultimately, this could save lives and property (Hale et al., 2005).
Achieving coordinated action among several stakeholders depends fundamentally on their
access to timely, valid information and their ability to conduct immediate information
searches (Comfort, 2002). Pathirage, Amaratunga, and Haigh (2007) asserted that the
integration and coordination of resources during the exchange of critical disaster information
and knowledge can influence stakeholders’ actions, thus enhancing the effectiveness of the
response.
The UNISDR and UNOCHA (2008) explained that assistance during a disaster is provided
from a wide range of potential stakeholders, such as the military, NGOs, utility companies
and private sector entities, and skilful coordination among them is critical to avoid confusion
and to facilitate an effective response. The Emergency Operations Centre, for instance, is
essential to ensure a clear central focal point and location for coordination. In Iraq, Humayun
and Al-Abyadh (2014) identified that there are a number of stakeholders involved during
disaster response, namely, the General Directorate of Civil Defence, the Health Department,
NGOs, and the Iraqi Red Crescent Society, but at the same time, there is no national platform
to organise the efforts of multiple institutions at all tiers of government. Although the draft
National Disaster Risk Reduction Law acknowledges the importance of information and
knowledge management, it fails to provide a framework for establishing a dedicated
information system (Humayun & Al-Abyadh, 2014).
The main challenge after an attack is timely delivery of information and communication for
first responders and disaster management workers (Manoj & Baker, 2007). The sharing of
information is crucial, yet can also be problematic, since people may have difficulty deciding
whom to trust in that moment of disaster (Manoj & Baker, 2007). In order to effectively
address the problems in the aftermath of an attack, the optimal provision of information
concerning the situation is an essential prerequisite (Meissner et al., 2002). Situational
awareness, in terms of understanding the unpredictable circumstances in a terrorist attack, is
critical to an effective response. Disaster responders require timely delivery of accurate data
in order to make the best decisions at that moment (George et al., 2010). As with all aspects
of organisations, government and industry, responders to disasters and other emergency
services are almost always reliant on information and communication technology. Yet, in the
immediate aftermath of an attack, communication is often limited because infrastructure can
be destroyed or the attack may have happened at a place where there was no infrastructure,
(Midkiff & Bostian, 2002) Another possibility, in Iraq, is that the authorities sometimes cut
the communications technology in the interests of safety and risk reduction of further attacks.
For example, terrorists often use mobile technology to detonate devices, so to avoid this
potential risk, mobile communications are often cut for a period of time.

297
Cloud computing is considered the best information technology for managing the complex
and dynamic nature of disaster environments (Habiba & Akhter, 2013). Establishing such
communication structures prior to the attack can save valuable time and ensure that key
government agencies and other stakeholders are empowered to coordinate the disaster
response in an effective manner (GSMA, 2012).
This paper aims to highlight the importance of cloud computing in managing information and
communication in disaster response management, with particular reference to terrorism in the
Iraqi context. Moreover, cloud computing infrastructure could significantly increase the
efficiency and effectiveness of disaster response management, by facilitating the sharing of
appropriate information and communication between different agencies participating in the
response to terrorist incidents. This would provide the opportunity to have an integrated
response management information system, this system would therefore link the different
agencies together. The use of cloud computing would help to expedite the sharing of
information in the crucial minutes following an attack, and hence the overall management
response time. However, it is a requirement that the data from different agencies is kept up-
to-date and available on time to the authorised agencies at the point of need. As a result, this
would provide integration of early warning systems with public alerts, and also enable a
timely evacuation of the victims through such a disaster response information system, for the
different cities in Iraq.
The new technology era and the tendency to use cloud technology in managing different
aspects of life has highlighted a need for a solution to bridge the gap in the current disaster
response system.
2. BACKGROUND
2.1 Disaster Response Management in Iraq
The government of Iraq has traditionally responded in a reactive manner to disasters
associated with flooding, earthquakes, drought, conflict and industrial accidents (Humayun &
Al-Abyadh, 2014). Similarly, Goodyear (2009), also found that historically, there has been a
reactive response to crisis incidents in Iraq, whereas a more proactive approach, in terms of
planning for potential disaster incidents, by demonstrating a political will to adopt and then
adapt proactive mechanisms, would be beneficial. This could be done, for example, by
developing a strategic and sustainable all-risk disaster management structure, at the central,
provincial/regional and community levels, interlinked with the national development plan. It
is widely acknowledged that many essential services are needed to manage hazards, reduce
risks and respond to disasters. Unfortunately, in Iraq, because of the war and post-war
conflicts, such services have been crippled (Humayun & Al-Abyadh, 2014). In addition to
that, the post-war transitions in Iraq have affected the institutional capacities of the state to
respond in an efficient manner. Furthermore, it appears that the lack of a national platform to
organise the efforts of multiple institutions at all tiers of government have serious limitations
for the current institutional and legislative systems for Disaster Risk Reduction (Humayun &
Al-Abyadh, 2014). The impact of war in Iraq has therefore had significant consequences and
this has been compounded by the natural disasters caused by climate change (Goodyear,
2009), therefore it is necessary to have an integrated solution to the problems facing disaster
responders.

298
Responses to catastrophic incidents rely on the assets and manpower of the central and
provincial government and with support from non-governmental agencies and international
donors (Goodyear, 2009). Most of the limited disaster response capacity of the Government
of Iraq lies in the General Directorate of Civil Defence of the Ministry of Interior and the
General Directorate of Public Health and Primary Health Care. In order to respond to
disasters, ad-hoc support to the Government of Iraq is provided by the International
Committee of the Red Cross, the United Nations, and national/international non-
governmental agencies (Goodyear, 2009).
An alarming increase in the frequency of terrorism occurrences has been seen in recent
decades. For instance, terrorist attacks in Baghdad have significantly increased since mid-
August 2009, following the withdrawal of the Multi-National Forces-Iraq troops (Goodyear,
2009). Violence in Iraq has also become normalised, ranging from the Iraqi and US military
assaults and sectarian militias, the threat of suicide bombings, to violent street crime (Wong,
al-Saiedi, & Silva, 2005). According to the Statistic Department (2016), more than 270,000
terrorist incidents took place in Iraq between 2009 and mid-2016. Iraq has experienced
considerable internal conflict, causing the well-being of the population to be damaged, with
the internal displacement of over 2 million people (Goodyear, 2009). To lessen the threat of
violence and terrorism, at the Central Government level, several institutions have been
created to respond to disaster incidents. These are coordinated and led by the National
Operations Centre, (NOC), which was established to present the Office of the Prime Minister
with information pertaining to risk levels regarding acts of terrorism (Goodyear, 2009). The
Crisis Action Cell, which was formed in November 2006, was a group made up of the
National Security Advisor, Ministers of Defence and Interior and the Prime Minister’s Chief
of Staff. This was a national-level crisis management team tasked by the National Security
Council and the Prime Minister, with the authority to lead and manage all the line Ministries.
However, the Crisis Action Cell does not seem to still be in effect (Goodyear, 2009).
At the provincial or regional level, in 2006, the Prime Minister and the Governors established
the Governorate Emergency Cells (GECs) as new structures. GECs were established in nine
of the 18 governorates in Iraq: Missan, Kerbala, Wassit, ThiQar, Erbil, Sulaymaniah, Dahuk,
and Babylon. Each GEC, chaired by the Governor of the region, operates a response function
with members of the local branches of line ministries addressing local crises in accordance
with their respective aptitudes and resources. Goodyear (2009) points out that some of the
GECs have begun to develop their own emergency preparedness strategies to respond to
localized crises.
The involvement of communities in the design and implementation of activities helps to
ensure that they are well aware of the actual vulnerabilities and needs of the affected people
(UNISDR & UNOCHA, 2008). Early warning and information systems are key tools for
mitigating disaster impacts, but in addition, there is also a need for information systems to
support longer-term risk assessment and monitoring, focusing on vulnerability as well as
hazards, as a basis for disaster risk reduction initiatives within a development framework
(Goodyear, 2009). People must be properly informed of the risks they face as well as what
they can do to reduce the risks, making decisions based on reliable disaster risk information
from hazard mapping and vulnerability assessment (Goodyear, 2009).

299
2.2 Cloud Computing
The term ‘cloud computing’ refers to providing services by supplying IT resources (such as
storage, computing, and networking) on the internet (Sarna, 2010). Cloud services and
resources are used in a pay as you go way, so that cloud users can use the service without the
need to install the cloud applications on their machines (Vaquero, Rodero-Merino, Caceres,
& Lindner, 2008). This introduces many advantages to cloud users, in terms of reducing the
infrastructure resource cost and improving the process of developing these applications,
which is achieved by saving the need for IT maintenance, which is managed by the cloud
providers. The use of the cloud provides an elasticity feature through extending the used
resources in the providers’ servers, the cloud user is not responsible for managing the
resources for data storage. Cloud computing is based on the virtualization technique, which
insulates the cloud software from the underlying hardware resources. This isolation ensures
the availability of data in case of infrastructure destruction (Rittinghouse & Ransome, 2016).
Three main services are defined in cloud computing; these services are: Infrastructure as a
Service (IaaS): which represents the computing and storage resources used in the cloud;
Platform as a Service (PaaS), which is used by the application providers to develop their
applications; and Software as a Service (SaaS), which introduces the cloud applications used
by the users through a web browser without the need to install these services (Mell & Grance,
2011).
3. LITERATURE REVIEW
The importance of sharing knowledge and ensuring availability and reliability of disaster
information was discussed by (Pathirage et al., 2007). The authors highlighted the need to
share knowledge in disaster management (natural and manmade), and mentioned that disaster
knowledge and practitioners are still in the individual domain and that coordination is
required among the different groups. This could help in preparedness and mitigate the effect
of disaster, in addition to providing better warnings.
A study presented by Alazawi, Altowaijri, Mehmood, and Abdljabar (2011), suggested the
use of cloud computing for developing a vehicular disaster emergency response system,
focusing on the transportation system using Vehicular Ad hoc Network (VANET). This was
considered by gathering the data from different sources and providing it to the people in
vehicles and other actors in the system. Although the study considered Al-Ramadi city in
Iraq, the research was dedicated to the transportation system only, overlooking managing the
data among the different government’s response management agencies.
The study presented by Hitachi (Ogasawara, Tanimoto, Imaichi, & Yoshimoto, 2014)
proposed a solution for disaster response and prevention based on the information collected
from ‘Social Network Services’ (SNS) such as Twitter and blogs, sensors and field reports.
However, the authors discussed the importance of including the SNS data in decision making,
but they mentioned the possibility of including false reports and rumours. In contrast, the
proposed solution in this paper would take data from authorised agencies and this would
ensure the reliability of the collected data.
The need for using cloud computing as a solution in disaster management has been discussed
by several researchers, although not in the context of Iraq. Velev and Zlateva (2011)

300
discussed the main principles of cloud computing and the need for considering it in a disaster
response management system. The authors mentioned the advantage of cloud computing in
reducing the cost of recovering the data after the disaster, as an internet connection is enough
to connect to the cloud servers. This study has been extended by Velev and Zlateva (2012) to
discuss the importance and feasibility of considering the cloud as a solution in emergency
systems of disaster management, and highlighted the need for a backup system to manage the
disaster information. The author argued the need for a platform to facilitate the information
sharing and collaboration among the central and local governments, organizations and
companies.
The use of cloud computing for managing natural disasters was first introduced by Habiba
and Akhter (2013). The authors argued that cloud computing is the best solution for
managing disaster situations because of its capabilities of managing the significant amount of
complex disaster data. They proposed a management system using web Amazon (web
services). Again, this research was solely focused on natural disaster management and
overlooked the effect of manmade disasters.
Zong, Li, Yang, He, and Velev (2016) proposed using cloud computing for managing natural
disasters in China. Although the authors discussed natural disasters, in doing so they
overlooked discussing manmade disaster and, particularly, terrorism. They also discussed the
fact that the telephones are overloaded in disaster periods, where the use of the cloud could
help to improve the disaster emergency management by providing real-time data. They
concluded that cloud computing is considered a mature solution for disaster management.
The study presented by Zou (2017) discussed the use of cloud computing to manage the data
collected from the various sensors for disaster monitoring. The authors mentioned the need
for a fast and automatic solution for disaster management, and proposed the collection of data
from various spatial sensors before extracting the required data using cloud computing.
4. GAPS AND CHALLENGES 4.1 Information
Effective directing of resources, when responding to terrorist incidents, requires assessing
information prior to, during, and after such events. According to Ren, Kiesler, and Fussell
(2008), due to sparse empirical studies in the area of sharing and coordinating information,
little is known about the challenges and obstacles when it comes to sharing and coordinating
information effectively. It is widely believed that effective response to both natural and man-
made disasters requires assessing information prior to, during, and after potentially
catastrophic events, as well as initiating activities that will lessen their impact upon society
(Belardo, Karwan, & Wallace, 1984). Moreover, to create and orchestrate an effective
disaster response and recovery effort, obtaining accurate information about the extent,
impact, and scope of the disaster is critical (Madry, 2015). Goodyear (2009) supports this
view, stating that information plays an extremely important role in effective disaster
reduction and response. Because information quality and quantity is highly unpredictable, it
is considered one of the challenges facing institutional systems that are in charge of managing
disaster response (Baker & Refsgaard, 2007). According to Sinclair, Doyle, Johnston, and
Paton (2012), poor decisions lead to poor disaster management, therefore, more information
and practice are desired and needed by local government organisations. George et al. (2010)
noted that to respond effectively to disaster, situational awareness in a disaster is critical, as

301
timely delivery of high volumes of accurate data is required by disaster responders to make
correct decisions. Accordingly, Ogasawara et al. (2014) stress that, in the case of large, wide-
area disasters, gaps in available information probably lead to the problem of delayed decision
making. Such an information vacuum in the immediate aftermath of a disaster can cause fatal
delays in decisions for the most urgent lifesaving response activities. Sinclair et al. (2012)
added another challenge to this context, which is a lack of awareness of the existence of
information about decision making or lack of understanding of its relevance to disaster
management from some disaster managers. Therefore, according to Goodyear (2009) due to
the importance of efficient disaster risk management information systems, such systems
should be effectively linked to local authorities, local early warning systems, and the media to
ensure effective use of disaster risk information for public awareness and education, among
others. In Iraq, although the draft National Disaster Risk Reduction Law acknowledges the
importance of information and knowledge management, it fails to provide a framework for
establishing a dedicated information system (Humayun & Al-Abyadh, 2014).
Further, because the complex, dynamic and unpredictable nature of the environment in which
many groups of professionals need to collaborate, sharing and coordinating information is
very difficult for such groups, and due to collective decision-making, actions are negatively
influenced by poor information sharing and coordination during inter-agency disaster
response. Therefore, a lack of coordination might lead to a number of possible failures, for
example, counter-productive ordering of sequential relief processes, delayed evacuations, and
inappropriate allocations of first responder resources, which often result in disaster growth
and even higher numbers of causalities (Bharosa, Lee, & Janssen, 2010). Ferdinand, O’Brien,
O’Keefe, and Jayawickrama (2012) support this view, stating that poor information sharing
meant there were cases of duplication of activities leading to community division and conflict
of interests. Moreover, Bharosa et al. (2010) noted that although the people are aware of the
need for information sharing and coordination, they find themselves challenged by a lack of
information and system quality. Comfort et al. (2003, 2004) stated that different phases of
disaster response require different types of information and management skills. They also
presented the common assumption in disaster management, that “a lack of information is the
basic factor in limiting the efficiency of response among organisations”. Further, the
efficiency of response actions can be enhanced by accessing core information, as well as
coordination throughout the network of responding organisations, which can be increased
because cooperation without information is not adequate to raise response effectiveness
(Comfort, Ko, & Zagorecki, 2004). Handmer and Parker (1991) added that effective
information flow can partially help to overcome a high degree of fragmentation in disaster
and hazard management, despite the limited exchange of information in some cases
(Handmer & Parker, 1991). Not only that, Comfort (2002) argued that to achieve coordinated
action among different groups of people, timely, valid information should be accessed. In
addition, they should be able to conduct information absorption search, exchange, search, and
adaptation. Accordingly, Madry (2015) stressed that the heart of the disaster response effort
is represented by the key information that is accurately updated in a timely way.
4.2 Communication
According to Jones and George (2003, p. 11), “Leadership depends on the use of power,
influence, vision, persuasion, and communication skills to coordinate the behaviours of
individuals and groups so that their activities and efforts are in harmony”. In larger disasters,
disaster responders face a huge challenge, which is a lack of communications infrastructure.

302
Not only that, degraded communications also have a large impact on response, in addition to
escalating demands of victims which exhausts the remaining capacity (George et al., 2010).
Comfort et al. (2004) stress that if the telephone lines are damaged, communication fails. In
addition, communications will be overloaded by an unexpected increase in the number of
connections resulting from many people simultaneously switching their communication
means from land telephone lines to wireless or cellular, which in turn, makes mobile phones
not work. During the 2005 Katrina flood, failures in communication were considered one of
the shortcomings in the federal emergency response (Baker & Refsgaard, 2007). However,
Banipal (2006) found that the inter-operability issue was a major operational problem
experienced during hurricane Katrina. Because the existing system was not scalable enough
to support hundreds of additional users, the out of state volunteers were unable to use it. In
agreement, Manoj and Baker (2007), stress that the primary challenge of communication
break-down was highlighted by disasters such as the 9/11 terrorist attacks and Hurricane
Katrina. A problem frequently cited by responders is the lack of radio interoperability.
Further, Comfort (2007) stress that the capacity for coordination, among multiple actors,
depends on effective communication. Comfort (2007) stated that “if the communication
processes do not elicit sufficient shared understanding among the parties to align their
priorities for action, the likelihood of achieving a common action framework among multiple
actors will be seriously diminished”. Manoj and Baker (2007) noted that the lack of radio
interoperability is a primary challenge in responding to both natural and man-made disasters,
as different response actors communicate with radios set to orthogonal frequencies. This
makes inter-agency communications very difficult. Consequently, when more local, state, and
federal agencies become involved, the problem is compounded. Therefore, Smith (2011)
found that communication is needed to establish collaborative organisation, particularly
within network-type organisations. Smith (2011) also found that communicating with the
community affected by the disaster is important, in terms of transparency regarding response
operations. Further, according to GSMA (2012), in countries that have highly centralised or
authoritarian regimes, coordination between mobile network operators and governments can
be difficult in times of disasters. Consequently, to manage the disaster response processes
effectively and efficiently, the support of ICT is considered a desirable feature (Saeed, 2012).
In addition to that, integration of early warning systems with public alerts, evacuation and
disaster response systems across sectors is vital for disaster management (Goodyear, 2009).
5. THE USE OF CLOUD COMPUTING IN MANAGING THE IMMEDIATE
RESPONSE IN IRAQ
Due to the lack of connection and collaboration between the different response agencies in
Iraq, there are currently some shortfalls in the efficiency and effectiveness of the response.
Therefore, it is important to find a way to overcome these challenges. The use of cloud
computing is widely used in everyday activities, such as checking emails, social networks,
and using Google Apps. In other words, the emergency responders would need a mobile
device (like PDAs and mobile phones) and an internet connection to access or update the data
in the cloud servers. This would reduce the need for using personal computers, which are
difficult to access at the time of disaster. The potential solution lies, therefore, in using cloud
computing in the specific context of disaster response management in Iraq. Figure 1
illustrates the main steps of the management process. This includes gathering the disaster data
from the different response agencies and saving it in the cloud. The gathered data can be used
for making decisions about managing the response process and evacuating the victims from

303
the scene of the disaster. This also can be used for issuing warning alerts and notifications to
the correspondent actors, in addition to the public.
Figure 1 Using Cloud Computing in Disaster Response Management
The disaster management architecture is composed of three main layers as depicted in Figure
2. These layers are:
Cloud Application (SaaS): A user friendly interface allows the agencies to update the
disaster dataset without the need to use complicated applications. This layer provides
a web application with a GUI interface, authorized access is considered to ensure the
reliability of the data. This layer is used for gathering the data.
Management layer: The layer used to process and analyse the collected data by the
user interface (cloud application layer). This layer informs decision making about the
groups (agencies, companies) to be alerted in a disaster. The decision made can be
used for activating the warning alerts and notifications to the response organizations
and the people in the disaster affected area.
Cloud Infrastructure: This layer represents the cloud hardware resources and database
storage used to store the collected data.
3-Issue
warning
messages
1-Update the
disaster data and
save it in the cloud
2-Process the data
by the management
layer
Disaster response agencies
Cloud Computing
Database
Disaster
warning
alert

304
Figure 2 System Architecture
The use of cloud computing provides the following benefits to the context of disaster
response management in Iraq.
1- Connecting the different disaster response agencies together would help to keep the
agencies’ information up-to-date about the damage in the infrastructure, buildings,
roads and the number of victims. This would be achieved through real time
collaboration to avoid the actions overlapping. In addition, it would help to accelerate
the disaster response management process by creating a network connection among
the response agencies, thus increasing the ability to share accurate data about the
disaster. This could be synchronized across multiple agencies, regardless of location
and devices used. This would therefore be a platform for managing communications
and collaborations between the different disaster response agencies and managing the
collected data.
2- Ensuring the availability of the data even in the case that the infrastructure resources
had been destroyed, since the data is saved on the cloud servers. For example, the data
would be available even though a local government department or response agency
had been attacked. Although the disaster could cause a temporary disconnection from
the internet, the data would be saved in the cloud, unlike the data saved on local
infrastructure, which could be destroyed, as discussed by Zong et al. (2016).
3- Reducing the cost of saving the data, through reducing the need for extra resources to
manage data storage. In other words, the different response agencies would not need
to keep the data in their own servers, but in the cloud servers.
4- Accessing the data in any situation using mobile devices. This means that the disaster
information saved in the cloud can be accessed at any time and retrieved quickly in
case of a disaster.
5- Increasing the scalability of the used hardware resources. This is due to the scalability
and flexibility features of cloud computing, which allow the scalability of the
underlying resources, when handling large amounts of data or increasing the number
of companies / agencies, which presents an efficiency cost saving.
6. CONCLUSION
This paper contributes to the existing knowledge on disaster response management, a field of
study that is still largely underexplored, especially in the context of the Middle East and in
the context of terrorism more specifically. A systematic review of the existing, pertinent
literature has been examined in this paper. The need for a structured, collaborative and
Cloud Infrastructure
Management Layer
Cloud Application Layer
GUI interface Authorization
Data processing Decision making
Storage Computation
Data gathering

305
strategic approach to information sharing and formulation of disaster management capacities,
in terms of preparedness, mitigation, early warning, relief, rehabilitation and recovery actions
at the provincial and district level, is essential in providing a reliable communication system
during a terrorist attack.
In practice, results of this research may be used to enhance the effectiveness of disaster
response communication through expediting the process of response. The ultimate end may
prove to be not just improved communication within the response stage of the disaster, but
also a reduction of the damage from the disaster. The proposed solution presented here is to
use cloud computing to aid in the management of disaster response management and provides
a mechanism for knowledge sharing, through managing collaboration among the different
response agencies. The use of cloud computing provides advantages, in terms of managing
the complexity of the disaster data and ensuring data availability, reliability, and cost
reductions. This guarantees real-time collaboration among the response agencies and hence a
fast response and automatic disaster data management, and, as a result, could potentially save
lives.
7. ACKNOWLEDGMENTS
This research would not have been possible without the assistance of the Iraqi Ministry of
Higher Education, who supported this work. The authors also acknowledge the financial
support received from the Centre for Disaster Resilience, University of Salford for the
publication of this paper.
8. REFERENCES
Alazawi, Z., Altowaijri, S., Mehmood, R., & Abdljabar, M. B. (2011). Intelligent disaster management system
based on cloud-enabled vehicular networks. In 11th International Conference on ITS Telecommunications
(ITST), 23 Aug - 25 Aug 2011, Park Inn Pulkovskaya St. Petersburg, Russia. (pp. 361-368).
Baker, D., & Refsgaard, K. (2007). Institutional development and scale matching in disaster response
management. Ecological Economics, 63(2), 331-343.
Banipal, K. (2006). Strategic approach to disaster management: lessons learned from Hurricane Katrina.
Disaster Prevention and Management, 15(3), 484-494.
Belardo, S., Karwan, K. R., & Wallace, W. A. (1984). Managing the response to disasters using
microcomputers. Interfaces, 14(2), 29-39.
Bharosa, N., Lee, J., & Janssen, M. (2010). Challenges and obstacles in sharing and coordinating information
during multi-agency disaster response: Propositions from field exercises. Information Systems Frontiers,
12(1), 49-65.
Comfort, L. K. (2002). Managing intergovernmental responses to terrorism and other extreme events. Publius:
The Journal of Federalism, 32(4), 29-50.
Comfort, L. K. (2007). Crisis management in hindsight: Cognition, communication, coordination, and control.
Public Administration Review, 67(Special Issue), 189-197.
Comfort, L. K., Ko, K., & Zagorecki, A. (2004). Coordination in rapidly evolving disaster response systems the
role of information. American Behavioral Scientist, 48(3), 295-313.
Ferdinand, I., O’Brien, G., O’Keefe, P., & Jayawickrama, J. (2012). The Double Bind of Poverty and
Community Disaster Risk Reduction: A Case Study from the Caribbean. International Journal of Disaster
Risk Reduction, 2, 84-94.
George, S. M., Zhou, W., Chenji, H., Won, M., Lee, Y. O., Pazarloglou, A., . . . Barooah, P. (2010).
DistressNet: a wireless ad hoc and sensor network architecture for situation management in disaster
response. IEEE Communications Magazine, 48(3), 128-136.
Goodyear, E. J. (2009). The State of Disaster Risk Reduction In Iraq (pp. 94): UNDP/OCHA.
GSMA. (2012). Disaster Response: Guidelines for Establishing Effective Collaboration between Mobile
Network Operators and Government Agencies. UK: GSMA.

306
Habiba, M., & Akhter, S. (2013). A Cloud Based Natural Disaster Management System. In The 8th
International Conference on Grid and Pervasive Computing, GPC, 9th-11th May 2013, Daegu, Korea. (pp.
152-161).
Hale, J. E., Dulek, R. E., & Hale, D. P. (2005). Crisis Response Communication Challenges Building Theory
From Qualitative Data. Journal of Business Communication, 42(2), 112-134.
Handmer, J., & Parker, D. (1991). British disaster planning and management: An initial assessment. Disasters,
15(4), 303-317.
Humayun, S., & Al-Abyadh, I. R. (2014). Iraq: Country Case Study Report - How Law and Regulation Support
Disaster Risk Reduction United Nations Development Programme (pp. 40): International Federation of Red
Cross and Red Crescent Societies (IFRC).
Jones, G. R., & George, J. M. (2003). Contemporary Management (3rd Ed.). New York: McGraw-Hill/Irwin
Madry, S. (2015). Space Systems for Disaster Warning, Response, and Recovery. New York: Springer.
Manoj, B. S., & Baker, A. H. (2007). Communication challenges in emergency response. Communications of
the ACM, 50(3), 51-53.
Meissner, A., Luckenbach, T., Risse, T., Kirste, T., & Kirchner, H. (2002). Design Challenges for an Integrated
Disaster Management Communication and Information System. In First IEEE Workshop on Disaster
Recovery Networks (DIREN 2002), June 24, 2002, New York City, co-located with IEEE INFOCOM 2002.,
New York City.
Mell, P., & Grance, T. (2011). The NIST definition of cloud computing. NIST Special Publication 800-145.
Nolte, I. M., & Boenigk, S. (2013). A study of ad hoc network performance in disaster response. Nonprofit and
Voluntary Sector Quarterly, 42(1), 148-173
Ogasawara, J., Tanimoto, K., Imaichi, O., & Yoshimoto, M. (2014). Disaster prevention and response support
solutions. Hitachi Review, 63(5), 236-243.
Pathirage, C. P., Amaratunga, R. D. G., & Haigh, R. P. (2007). Knowledge sharing in disaster management
strategies: Sri Lankan post-tsunami context. In CIB World Building Congress: Construction for
Development, 14-17 May 2007, Cape Town International Conference Centre. (pp. 2981-2993).
Ren, Y., Kiesler, S., & Fussell, S. R. (2008). Multiple group coordination in complex and dynamic task
environments: Interruptions, coping mechanisms, and technology recommendations. Journal of
Management Information Systems, 25(1), 105-130.
Rittinghouse, J. W., & Ransome, J. F. (2016). Cloud computing: implementation, management, and security.
New York, USA: CRC press.
Saeed, M. R. (2012). A System for Disaster Response Process Management. (MSc), KTH Information and
Communication Technology. Retrieved from http://www.diva-
portal.org/smash/get/diva2:504617/FULLTEXT01.pdf
Sarna, D. E. (2010). Implementing and developing cloud computing applications. New York, USA: CRC Press.
Sinclair, H., Doyle, E. E., Johnston, D. M., & Paton, D. (2012). Decision-making training in local government
emergency management. International Journal of Emergency Services, 1(2), 159-174.
Smith, D. M. (2011). A study of command and control of multi-agency disaster response operations. (PhD
Thesis), University of Phoenix, Phoenix, AZ.
Statistic Department. (2016). Internal Statistic, Unpublished Manuscript. Iraqi Ministry of Interior. Baghdad,
Iraq.
UNISDR, & UNOCHA. (2008). Disaster preparedness for effective response: guidance and indicator package
for implementing priority five of the Hyogo Framework: Hyogo Framework for Action 2005-2015: Building
the resilience of nations and communities to disasters. New York: United Nations.
Vaquero, L. M., Rodero-Merino, L., Caceres, J., & Lindner, M. (2008). A break in the clouds: towards a cloud
definition. ACM SIGCOMM Computer Communication Review, 39(1), 50-55.
Velev, D., & Zlateva, P. (2011). Principles of cloud computing application in emergency management. IPEDR,
IACSIT Press, Singapore, 25(In Proceedings of 2011 International Conference on E-business, Management
and Economics), 119-123.
Velev, D., & Zlateva, P. (2012). A feasibility analysis of emergency management with cloud computing
integration. International Journal of Innovation, Management and Technology, 3(2), 188-193.
Wong, E., al-Saiedi, A. R., & Silva, J. (2005, 27 November). Shiite Cleric Wields Violence and Popularity to
Increase Power in Iraq, The New York Times.
Zong, X., Li, Q., Yang, Z., He, K., & Velev, D. (2016). Comprehensive Management Platform of Natural
Disasters Based on Cloud Computing. International Journal of Machine Learning and Computing, 6(3),
179-183.
Zou, Q. (2017). Research on cloud computing for disaster monitoring using massive remote sensing data. In 2nd
International Conference on Cloud Computing and Big Data Analysis (ICCCBDA), 28th-30th April, 2017
Chengdu, China. (pp. 29-33).

307
PEOPLE, SKILLS AND EDUCATION

308
ID 005
POSITIONING COST OVERRUN RESEARCH IN THE
PHILOSOPHICAL DEBATE: A CASE FOR CRITICAL REALISM
A. Amadi1 and T. Omotayo2
1School of the Built Environment, University of Salford, Salford M5 4WT, UK 2 Robert Gordon University, UK
Email: [email protected]
Abstract: Construction management research, as a form of social research is confronted with
the fundamental paradigmic dilemma of determining a core philosophical orientation, to be
considered adequate and best suited to enquiry about construction phenomena. The
underpinning argument being that, the differences in world views, will yield marked
differences in the type of knowledge generated. An empirical profiling of cost overrun
research reveals the predominance of mono-method studies based on questionnaire survey
methods, correlative analysis and archival data modelling techniques, all of which are
underlain by positivism. Such positivist philosophies, although methodologically valid, cannot
adequately explain and provide in-depth understanding of the contextual drivers in
construction organisations, that trigger the more tangible technical constructs, leading to the
phenomena of cost growth in projects. Joining in the chorus call for methodological pluralism
in construction industry research, this study makes a case for critical realism specifically in the
context of cost overrun research.
Keywords: Cost Overrun, Critical Realism, Methods, Research Philosophy.
1. INTRODUCTION
Construction management research, as a form of social research is confronted with the
fundamental issue of determining a core philosophical orientation, to be considered as
adequate and best suited to enquiry about construction phenomena (Dainty, 2008; Fellows
and Lui, 2015). Dainty (2008) stated that construction management, as an emergent field of
research, is yet to have a recognised methodological orientation, characteristic of other more
established domains, and therefore builds on the traditional philosophical assumptions of
related natural and social science research. The term “Methodological pluralism”, was thus
used to describe the use of multiplicity of philosophies and methods, compatible with the
study of construction phenomena (Dainty, 2008). The underpinning argument being that, the
differences in world views, will yield marked differences in the type of knowledge generated.
As Bryman’s (1988:34) espouses “different research paradigms will inevitably result in the
generation of different kinds of knowledge about the industry and its organizations”.
2. AIM OF THE RESEARCH
This study narrows down the philosophical argument in construction management to within
the specific domain of cost overrun research, with a view to systematically articulate the
shortcomings in the methodological/philosophical tradition embraced by previous studies.

309
3. LITERATURE REVIEW
The cost performance of construction projects is often identified as a fundamental measure of
success for project sponsors. Yet against this, a large number of construction projects
documented in the public domain, have been censured for notoriously running over their
original budget estimate. Cost overrun in construction projects remains a topical issue, with
the media, technical press, and scholarly literature, rife with publications analysing cost
overrun trends, identifying their primary causes, and offering broader explanations for this
pervasive trend. This section reviews the nomenclature of the empirical literature on the
problem of cost overruns in construction projects.
Studies Analysing Structured Responses
An analysis of the literature on cost overruns reveal a predominant leaning towards the use of
survey researches, mostly based on analysis of questionnaire surveys which sample the
opinions of construction professionals. See for example Mansfield et al., 1994; Chang 2002;
Aibinu and Odeyinka, 2006; Kaliba, et al., 2008; Memon et al., 2011; Ubani, 2015. These
studies often generate a long list of factors, which are sometimes subsequently ranked.
Aibinu and Odeyinka, (2006) identified 44 factors, prioritising the 39 factors on a ranked
profile, as a source of useful information for construction industry stakeholders, in curbing
delays and cost overruns. Some authors including Cantarelli et al. (2010); Allahahium and
Lui (2011) and Brunes and Lind, (2014) have taken the evidence one step further, by seeking
to categorize and classify the myriad of causative variables identified, into a typology of
causes, on the grounds that generating a long list of factors, without tracing their fundamental
defining characteristics, was insufficient. For example, Allahahium and Liu (2011), analysed
90 causes of cost overruns, identifying five major triggers for cost overruns including: (1)
Market volatility principally due to micro and macro-economic variations; (2)
novelty/unpredictable events such as unexpected ground conditions; (3) estimate distortion;
(4) time pressures and finally (5) project complexity.
The methodology of listing factors, ranking, and categorizing causative variables, based on
impersonal questionnaire surveys, which is the most rudimental and simplistic approach to
explaining cost overruns, appears to have flooded the literature. Although this adds to the
body of scholarly literature on cost overruns, and are methodologically valid, the researchers
believe that these forms of empirical analysis cannot be used as a basis for inferring specific
cause-effect relationship. With Ahiagu Dugbai et al. (2014:868), describing the bulk of cost
overrun research, as replicative, stating:
“It is argued that questionnaires alone may not be suitable for investigating complex
and systemic problems like cost overrun on construction projects… It is no surprise
that the same factors seem to come top of the list most of the time ...”.
This characteristic feature of questionnaire based studies, limits the usefulness of the output
of such research, in generating context specific explanations that can be relied on in practice.
However, a scant number of studies based on questionnaire surveys, are methodologically
more robust (Memon and Rahman, 2013; Sharma and Goyal, 2014). These studies have gone
a step further to develop explanatory relationships amongst the identified costoverrun factors.
For instance, Memon and Rahman (2013) investigated the effect of cost overrun factors based

310
on survey responses of client, contractor, and consultant representative involved in handling
small scale projects in Malaysia. A total of 54 survey responses were analysed using the
Partial Least Square Structural Equation Modelling, a form of factor analysis, to model the
relationship amongst various factors. The outcome of the analysis revealed latent factors
which triggered the highest variance: contractor’s site management related factors, had the
most significant effect on small scale projects. Whereas Sharma and Goyal (2014) developed
a fuzzy logic model for assessing cost overrun, based on a preliminary questionnaire survey,
conducted to judge the level of importance of the identified factors. A fuzzy logic model was
then developed, and used in mapping out decision trees on an input and output basis,
complemented by graphical representation of the variation induced by different combination
of cost overrun factors, to understand their combined effect. Sharma and Goyal (2014) fuzzy
model showed that the largest hypothetical variation in cost overrun will be largely due to
inadequate planning and scheduling, followed by variation due to short bid preparation time
and experience of contractor.
However, a discernible shortcoming of the models developed by both Memon and Rahman
(2013) and Sharma and Goyal (2014) is that the data used in their analysis was not sourced in
relation to specific projects or based of any form of project information. These studies relied
solely on the general opinions of construction professionals, to infer abstract statistical
inferences about the generality of factors that lead to cost overruns. It is thus probable that
these models can explain the relationships amongst the cost overrun factors, but may have
little explanatory power to account for recorded cost overruns on a project specific basis. This
can be rationalised in lieu of the fact that technically projects are unique, which is in stark
contrast to the underlying assumptions of the findings of these studies. Furthermore, matters
of sensitive dependence arise, in the generalisability of the study by Memon and Rahman
(2013) with respect to small scale projects in Malaysia, as the study assumes that projects of a
similar size will experience similar issues.
Studies Advancing Spurious Correlations
In addition to the afore mentioned groups of cost overrun studies, few others provide and
analyse cost overrun data, to test specific project variables in accounting for the trend in the
data, as explanations for the cost overruns. Typically, Hinze and Gregory (1991), empirically
tested for the effects of project size, location and complexity on the level of cost overruns
experienced on projects executed by the Washington State Department of Transport.
Flyvbjerg et al. (2002, 2004), conducted a similar study, from a sample of 254 transportation
infrastructure projects drawn from countries in different regions, mostly located in the
northern hemisphere. Akoa (2011) conducted a similar study on highway projects in
Cameroun. These studies concluded that the bigger sizes and complexity of infrastructure
projects are correspondingly reflected in the increased levels of cost overrun. Hinze and
Gregory (1991), further inferred, that the simultaneous nature of projects execution by
highway agencies, invariably implied lesser amounts of pre-and post-contract engineering
hours available to each, thus accounting for the higher levels of cost overruns often induced
in highway projects. Additional engineering, was thus stated as requisite, to overcome risks
occasioned by the complex and simultaneous nature of highway project execution, which
often creates a propensity for such projects to run over budget. Whereas, Flyvbjerg et al.
(2004), asserted that the average length of implementation phase of transportation projects
significantly impacted on the level of cost overruns recorded. This was inferred based on an
analysis of cost overruns experienced on bridges, tunnels, and roads, which showed that cost

311
overruns varied in relation to project duration. Bridges and tunnels, with average duration of
6.6 years recorded higher cost overruns than rail and road projects with an average duration
of 6.3 and 4.3 years. Flyvbjerg et al. (2004:15) thus concluded, sluggish planning and
implementation of transportation projects had direct financial repercussions, stating:
“Sluggishness may, quite simply, be extremely expensive”.
However, other studies, such as those by Odeck (2004) in Norway, revealed that larger cost
overruns were experienced in smaller projects. Morris (1990) also arrived at a similar
conclusion, as Odeck (2004), for 290 Indian projects analysed. Yet, contrary to the findings
of these studies, both Love (2002) and Love et al. (2013) revealed that cost overruns do not
vary by project type or size. The conflicting results, from various studies, further reinforces
the discernible shortcoming of these studies, that conclusive inference is mostly drawn based
on exploratory statistical analysis. Typically, the use of correlation analysis, which by virtue
of reporting significant association between bivariate groups of variables, cannot be used to
conclusively infer causality. These studies thus assume that the dependent variable (Cost
overrun) changes solely because the independent variables (project size, project type
complexity etc., change). Citing the popularly used phrase in statistics: ‘Correlation does not
necessarily imply causation’.
Studies Analysing Causation Based on Project Data
Quantitative analytical techniques, which analyse cause-effect relationships, are generally
grouped as Mathematical models (An et al., 2007). Models are reductions of reality
replicating an intricate system using variables within those systems (Ahiagu Dugbai, et al.,
2014). Mathematical models have however been scantly used in the literature to infer
causality in relation to project cost overruns. The techniques which have being used to
analyse cost overrun in a limited number of older and more contemporary studies include:
Linear modelling techniques such as regression modelling, Networking and data mining
techniques such as Artificial Neural Networks, Heuristics based models such as Case Based
Reasoning /Reference Class Forecasting, Stochastic techniques such as Monte-Carlo
simulations; and Logic based methods such as Binary Logistic modelling and Fuzzy Logic
(Love 2002; Trost and Oberlender 2003; Attala and Hegazy 2003; Ahiagu Dugbai et al.,
2014; Lee and Kim 2015 and El-Kholy 2015):
Typically, older studies such as Trost and Oberlender (2003) as well as Attala and Hegazy
(2003) have used linear modelling techniques, based on regression analysis, to analyse cause-
effect relationships in explaining recorded cost overruns in projects, and further tested the
validity of these models with respect to their use in decision making for future projects, at
specified levels of confidence. A more recent study by El-Kholy (2015) generated a
regression based model, while comparing its predictive capacity to a Case Based Reasoning
(CBR) model for similar data sets derived from 30 projects. The outcome of the study
showed that the regression modelling had higher levels of accuracy to predict potential cost
overrun in projects. El-Kholy (2015) further applied a CBR model to predict the likely cost
overrun given the degree of similarity of the project characteristics. El-Kholy (2015) used this
method to analyse cost overrun factors, whose presence as part of a future project, is
indicative of a potential to result in a similar degree of cost overrun, useful in reference class
forecasting and decision making to minimise cost overruns for future projects. Ahiagu
Dugbai et al. (2014) used data mining techniques based on artificial neural networks, to
analyse the complexity of non-linear interactions amongst quantitative project variables such

312
as compensation events, project duration, as well as qualitative information on tendering
method, location, project type, fluctuation measure and project’s delivery partner. Lee and
Kim (2015) used monte-carlo simulations to analyse the statistical distribution of change
orders issued during the construction period, which lead to significant cost overruns. Love et
al. (2013) developed a probabilistic Log-Logistic distribution of cost overruns for 49 road
projects (new roads including upgrades and elevated highways) in relation to rework
occasioned by errors and omissions in contract documentation, leading to cost overruns.
Although this class of technical studies on cost overruns which rely on modelling to
understand cause-effect relationship, have a robust and methodologically valid underpinning,
rooted in the specifics of project data, with a direct applicability useful in monitoring and
reassessing future projects, there is a discernible lack of context.
A Case for Critical Realism
It is often argued that the selection of a research philosophy by the research community is
mostly an intuitive decision, often in line with the researcher’s ontological and
epistemological stance and preference, which may not necessarily ensure the rigor and
robustness of the research effort (Holden and Lynch, 2004). This argument clearly reflects a
discernible shortcoming in the bulk of cost overrun research, which is the sole reliance of
positivists philosophy to provide explanation for the poor financial performance of
construction projects. This trend equally reflects the bigger picture in construction
management research, which has been shown to exhibit a continuing adherence to positivism
(Dainty, 2009). Such methods strip the context narrative, which is necessary to elucidate the
role of social action from the standpoint of project actors. This is despite the wide array of
research philosophies which can be compatible with the study of construction phenomena, by
virtue of being technical as well as social constructs. As Dainty (2009:6) asserts:
“Researchers use the real-world context of the construction industry as sites for
developing research questions ... It could be reasonably expected that their
methodological positions and the methods adopted may have broadened and
diversified to reflect the multiple traditions from which it draws upon.
It is thus the researchers’ conviction that methodological pluralism, applied to cost overrun
research, would yield less artificialized and more methodologically valid explanations for
cost overruns, which describe context and show causality. Using a practical analogy Mingers
(1997:9), illustrated the need for methodological adventure:
“Adopting a particular paradigm is like viewing the world through a particular
instrument such as a telescope, an X-ray machine, or an electron microscope. Each
reveal certain aspects but is completely blind to other... Thus, in adopting only one
paradigm one is inevitably gaining only a limited view of a particular intervention or
research situation … it is always wise to utilize a variety of approaches”.
Various opinions have thus been expressed on the criteria for choosing a research philosophy
(Grix, (2001; Holden and Lynch, 2004; Rooke and Kaguoglo; 2007; Gajendran, 2011).
Holden and Lynch (2004) argued: “Research should not be methodologically led, rather that
methodological choice should be consequential to the research philosophical stance and the
social science phenomenon to be investigated. Yet, Grix (2001:23) asserts “methods

313
themselves should be seen as free from ontological and epistemological assumptions, and the
choice of which to use should be guided by the research questions”. Some other researchers,
for example Panas and Pantouvakis (2010:77), have predicated the selection of an appropriate
methodology, by identifying those typically deployed in similar studies, with the ultimate
objective of “Preserving research validity and establishing of a seamless methodology that
could be repeatedly applied”.
The researchers build on the argument of Holden and lynch (2004), and are of the view that
the most appropriate philosophical orientation for cost overrun research should be objectively
defined, devoid of personal or discipline based paradigmic preferences, in relation to their
merits for achieving the research aims and objectives. The researchers, believe stereotyping
or basing methodological decisions, on existing philosophical traditions or trends in previous
studies, would amount to methodological stagnation, which will ultimately stifle innovation
and creativity in research. Rooke and Kagioglou (2007), further reinforce the researchers’
stance by asserting that a fundamental requirement in research is its ‘Unique Adequacy’.
Unique Adequacy, a criterion for adjudging reliability and validity in qualitative research,
means that: “the methods of analysis used to report, should be derived from that setting. The
implication of this logic for cost overrun research and academic enquiry in the construction
industry is that the method of analysis should not necessarily be determined a priori, being
‘transplanted in-situ’ from similar studies in the knowledge domain, but should rather
emerge from the peculiarities of the problem and context under investigation.
In view of the significant gap in the cost overrun literature, the study posits that critical
realism presents itself as a valid philosophical position, relevant to carry out rigorous and
methodologically robust research on construction phenomena, which can withstand the
critique plaguing the use of mono methods in construction management research. This is
considering that construction phenomena, are social constructs, which can be also objectively
studied. In conducting cost overrun research, the researchers thus adopt the philosophical
stance of the critical realist, via the retention of ontological positivism, which rejects the view
of multiple realities, with epistemological interpretivism/constructivism, which acknowledges
the role that values and societal ideology play in the derivation of empirical knowledge.
However, in advocating for critical realism, the researchers are not unaware of its criticism,
mostly accused of being ‘logically contradictory’ (Nune, 2013). From the physical and social
sciences, proponents and advocates of the critical realist philosophy have erected categorical
philosophical defences in readiness for such criticism, (Frazer and Lacey, 1993; Campbell,
2002). To the constructivists, such justification was provided by Frazer and Lacey
(1993:182): “Even if one is a realist at the ontological level, one could be an epistemological
interpretivist . . . our knowledge of the real world is inevitably interpretive and provisional
rather than straightforwardly representational”. Critical realism was thus further conceived
by Lawson (2003) as a methodologically valid lens for the social sciences, on the issues of
ontology, as it relates to the nature of the study phenomena (sensory abstractions or
real/tangible?). To the positivist, it was contended: “all scientists are epistemological
constructivists and relativists in the construction of scientific knowledge” (Campbell, 2002:
29). More specifically in the engineering sciences, Panas, and Pantouvakis (2010) noted that
quantitative experimental frameworks and models require scientific data, which are primarily
sought through human subjects, who are inherently subjective in their representations.
Philosophical flexibility in cost overrun research is thus warranted. Ontologically the reality
of cost overruns is a tangible construct that can be measured precisely. However,

314
epistemologically, factors leading to cost growth, has a wide range of differing explanatory
perspectives, and has being established in the literature to be closely linked to subjectivity of
project players in organisations. To understand the phenomena of cost growth therefore
requires that an interpretivist epistemology is necessary, while retaining the singular ontology
of the reality of cost overruns in highway projects, typical of critical realism (Figure 1).
Ontology
Singular (Reality of Cost overruns) Multiple
Value free Value laden
Figure 1: Philosophical Position of the Critical Realist in Cost Overrun Research
The philosophical appropriateness of relying more heavily on the interpretative world view as
opposed to the positivist view at an epistemological level, is defined by the need to gain
knowledge on the propagation of cost overruns through human subjects, who are the
executors of projects, as well as the need to factor in the organisational dynamics surrounding
construction projects.
The ability of the critical realist to infer causality within a predominantly interpretative
epistemology, further defines its appropriateness to provide contextual explanations for the
propagation of cost overruns in projects, which is fundamentally driven by actions/inactions
of the human actors in construction organisations. According to Huberman and Miles
(1985:21), critical realism is an “an approach designed to yield verifiable knowledge of
human group life and human conduct”. This is predicated on the critical realist assumption
that there are ‘reasonably stable law-like links of causality’ amongst social constructs,
whereby human actors in social and historical setting have always exhibited ‘sequences and
regularities that link phenomena together’ (Miles and Huberman,1994:429). This unique
feature of critical realism, its terms its ability to retain objectivity, while incorporating
multiple perspectives derived from the interpretative understanding of the human factors in
organisational practice, that drive the more technical concerns, is thus a core requirement,
necessary to infer causality in cost overrun research.
4. CONCLUSION
The study has examined the methodological and philosophical leaning of cost overrun
research, highlighting the predominance of mono-method studies, which are mostly based on
questionnaire survey methods, correlative analysis and archival data modelling techniques, all
of which are underlain by positivism. The study argues that such positivist philosophies,
although methodologically valid, cannot adequately explain and provide in-depth
understanding of the contextual drivers in construction organisations, that trigger the more
tangible technical constructs, leading to the phenomena of cost growth in projects. The study
thus advocates for critical realism, which affords the use of multi-methodologies, and as well
as maintain both objective and subjective realities of the constructs associated with a cost
RESEARCH PHILOSOPHY
POSITIVISM
INTERPRETIVISM
Epistemology (How to understand)
Critical Realism
Axiolo
gy
Value Laden

315
overruns in projects. The study posits that critical realism lends itself as potential lenses to
study construction phenomena.
REFERENCES
Ahiaga-Dagbui , D. D and S.D. (2014). Rethinking construction cost overruns: cognition, learning and
estimation. Journal of Financial Management of Property and Construction, 19(1), 38 – 54
Aibinu, A.A. and Odeyinka, A. (2006). Construction delays and their causative factors in Nigeria. Journal of
Construction Engineering Management, ASCE, (132) 7, 667-677
Akoa, B.B. (2011). Cost Overruns and Time Delays in Highway and Bridge Projects - Experiences from
Cameroon. An unpublished Master’s thesis submitted to Michigan State University
Allahaim, F. D and Liu, L. (2013). Understanding Major Causes Cost Overrun for Infrastructure Projects; A
Typology Approach. Annual Conference of the Australasian Universities Building Educators Association
(AUBEA)The University of New South Wales, Australia
An, S., Kim, G, and Kang, K. (2007). A case-based reasoning cost estimating model using experience by
analytic hierarchy process. Journal of Building and Environment. 42(7), 2573–2579.
Attala, M., and Hegazy, T. (2003). Predicting Cost Deviation in Reconstruction Projects: Artificial Neural
Networks Versus Regression. Journal of Construction Engineering and Management, 129 (4), 405-411.
Brunes, F and Lind, H. (2014). Explaining cost overruns in infrastructural projects: A new framework with
applications to Sweden. Working Paper 01 Section for Building and Real Estate Economics, School of
Architecture and the Built Environment, Royal Institute of Technology.
Bryman, A. (1988). Research Methods and Organization Studies. Contemporary Social Research. Uwin Hyman
Ltd
Campbell, R. (2002). A Hundred Years of Phenomenology: Perspectives on a philosophical tradition, Ashgate
Publishing Ltd, England, 73-87.
Cantarelli, C.C., Flyvbjerg, B., Molin, E.J.E and Van Wee, B. (2010). Cost Overruns in Large-scale
Transportation Infrastructure Projects: Explanations and Their Theoretical Embeddedness. EJTIR 10(1),
March, 5-18.
Chang, A. Shing-Tao. (2002). ‘Reasons for cost and schedule increase for engineering design projects’. Journal
of Management Engineering, ASCE, 18(1), 29-36.
Dainty, A.R.J. (2008) Methodological pluralism in construction management research. In Advanced methods in
the Built Environment, A. Knight and L. Ruddock Eds, West Sussex, Wiley-Blackwell: 75-84
El-Kholy, A. M. (2015). Predicting Cost Overrun in Construction Projects. International Journal of
Construction Engineering and Management. 4(4), 95-105.
Fellows, R. F. and Liu, A. (2015). Research Methods for Construction, 4th Edition. Wiley.
Flyvbjerg, B., Skamris Holm, M.K. and Buhl, S.L. (2002). ‘Underestimating cost in public works. Error or
Lie?’, Journal of the American Planning Association, 68(3), 279–295.
Flyvbjerg, B., Skamris Holm, M.K., and Buhl, S.L. (2004). ‘What Causes Cost Overrun in Transport. Fourth
Transportation Specialty Conference of the Canadian Society for Civil Engineering Montréal, Québec,
Canada
Frazer, E and Lacey, N. (1993). The Politics of Community: A Feminist Critique of the Liberal-Communitarian
Debate. The Cambridge Law Journal, 53(3), 619-621.
Gajendran, T. (2011). Investigating informality in construction: philosophy, paradigm and practice’,
Australasian Journal of Construction Economics and Building, 11 (2), 84-98.
Grix, J. (2001). Demystifying Postgraduate Research: University of Birmingham Press, Birmingham.
Hinze, J and Gregory, S. (1991). Analysis of WSDOT Construction Cost Overruns. United States Department of
Transportation, Federal Highway Administration. Report No. WA-RD 218.1.
Holden, M.T and Lynch, P. (2004). Choosing the Appropriate Methodology: Understanding Research.
Marketing Review. 4(4), 397- 406.
Huberman, A. M and Miles, M.B. (1985). Assessing Local Causality in qualitative research. In D.N. Berg and
K.K. Smith Eds. Exploring Clinical Methods for Social Research. pp 351-381. New York: Sage.
Kaliba, C., Muya, M. and Mumba, K. (2008). Cost escalation and schedule delays in road construction in
Zambia. International Journal of Project Management, 27(5), 522-531.
Lawson, C. (2003). Critical Issues in 'Economics as Realist Social Theory'. Critical Realism in Economics:
Discussion and Debate. S. Fleetwood, ed. London and NY, Routledge: 209-258.
Lee, K and Kim, K. (2015). Collar Option Model for Managing the Cost Overrun Caused by Change Orders.
[online]. Available at www.mdpi.com/journal/sustainability accessed 13/01/2016.

316
Love P. E. D. (2002). Influence of Project Type and Procurement Method on Rework Costs in Building
Construction Projects. Journal of Construction Engineering and Management,128(1),18-29.
Love P. E. D. (2013). Determining the Probability of Cost Overruns in Australian Construction and Engineering
Projects. Journal of Construction Engineering and Management 139(3):321-330
Mansfield, N.R., Ugwu, O.O. and Doranl, T. (1994). Causes of delay and cost overruns in Nigerian construction
projects. International Journal of Project Management, 12(4), 254-260.
Memon, A. H and Rahman, I. A. (2013). Analysis of Cost Overrun Factors for Small Scale Construction
Projects in Malaysia Using PLS-SEM Method. Modern Applied Science; 7(8), 74-88.
Memon, A., Abdul Rahman, I., and Abdul Aziz, A. (2011), Preliminary Study on Causative Factors Leading to
construction Cost Overrun. International journal of Sustainable Construction Engineering and Technology,
2 (1), 57-71.
Miles, M.B and Huberman, M. A (1994). Qualitative Data Analysis: A Methods Sourcebook. SAGE
Mingers, J. (1997). Multi-paradigm methodology, in Mingers, J. and Gill, A. (eds) Multimethodology: The
Theory and Practice of Combining Management Science Methodologies, Wiley, Chichester, 1–20.
Morris, S. (1990). “Cost and Time Overruns in Public Sector Projects”. Economic and Political Weekly, 47,154
to 168. Indian Institute of Management, Ahmedabad
Nune, I. (2013). Critical Realist Activity Theory: An Engagement with Critical Realism and Cultural-historical
Activity Theory. Routledge
Odeck, J. (2004). “Cost overruns in road construction: What are their sizes and determinants?” Journal of
Transport Policy (11)43–53.
Panas, A. and Pantouvakis, J. P. (2010). Evaluating Research Methodology in Construction Productivity
Studies. The Built & Human Environment Review, 3(1), 63-85.
Rooke, J. and Kagioglou, M. (2007). 'Criteria for evaluating research: the unique adequacy requirement of
methods'. Construction Management and Economics, 25(9):979-987.
Sharma, S and Goyal, P, D. (2014). Cost Overrun Assessment Model in Fuzzy Environment. American Journal
of Engineering Research, 3(7), 44-53.
Trost, S., M., and Oberlender, G., D. (2003). Predicting the Accuracy of Early Cost Estimates Using Factor
Analysis and multivariate Regression. Journal of construction Engineering and Management, 129 (2), 198-
204.
Ubani, E.C. (2015). Analysis of Factors Responsible for Project Cost Underestimation in Nigeria. International
Journal of Economics, Commerce and Management. 3(2), 1-12.

317
ID 023
UTILIZING INNOVATION POTENTIALS ON CAMPUS OUTDOORS:
FOR THE DEVELOPMENT OF THE UNIVERSITY OF SALFORD
M. Gabr, H. Elkadi and S. Biscaya
School of the Built Environment, University of Salford, Salford, M5 4WT, UK
Email: [email protected]
Abstract: This paper illustrates how design links to the dynamics of the use of campus
outdoor spaces can influence students’ motivation and creativity. It investigated aspects of
possible development that balance today’s market realities with facilitating tomorrow’s
innovative experiences of different students and the desired diverse student-community-
university interaction. The study presents innovative yet practical ideas prioritizing the
greatest impacts of the campus outdoor design intentions on students’ behavioural reactions,
inspired from the campus planning and environments literature along with a tour of campus
masterplans supporting these descriptive analyses. With a particular focus on the design of the
University of Salford, UK; this study provoked integrated and reliable recommendations to
overcoming the lack of vertical walls (incorporating arts and visual-related implications) and
shaded areas in the case study location in order to encompass and enhance various cooperative
student activities at different times. The study contributes to encourage learning and discovery,
gaining the benefits of engaging students in university campuses, and dramatic increase in
student numbers and overall satisfaction in the challenges of maintaining the student-
community attachment in today’s universities.
Keywords: Informal Learning Spaces, Campus Open/Public Space Design, Outdoor Design
Impacts, Campuses as Nodes of Innovation.
1. BACKGROUND
As capital and people are more mobile than ever, the quality of a place plays a much larger
role in today’s innovative transformations than in recent years. Universities nowadays are
small cities, in terms of their large size, population, and the various complex activities taking
place in campuses. Crossing roads of academics, social activities, and community culture, the
campus outdoor physical environment is an important deciding factor for students to retain
their learning interests/abilities and attract positive reactions for university challenges and
beyond. Campus masterplan therefore, are regularly updated to tackle significant
opportunities or challenges in response to ever-increasing pressures and changing needs, thus
compete new image/heart for the student, university and city. This paper focus towards the
impacts and practicalities of renovating open spaces for more inspirational campus through
exploring suggestive ideas and experimental results for the potentials of dominant outdoor
students' inspirations (e.g. (Eberhard and Patoine 2004). It reviews relevant literature in
campus outdoor planning development combined with the performance context for student
on-campus experience, especially around the ideas of place-based outdoor learning commons.
Although the results of this study are based on a university context, they are expected to
contribute to developing methods to study how to enhance people experience when
perceiving and using outdoor/public spaces. The main ongoing research question is: Which
improvements of new campus planning development are of the most importance to engaging
students in sharing and contributing their ideas, for regenerating brighter communities and
cities?

318
By revealing how student perceive and use campus outdoor spaces, this paper aims to
appraise more creative links between space and its occupation for supporting and enhancing
innovative activities, in a way that help evaluate how positive campus planners have
responded to supporting informal learning open spaces. Assessing the outdoor physical
design for 21st century learning involves cross-examining typologies of:
Introducing how students outdoor activities - applying, reflecting, engaging and sharing
experiences - are realized in creative manner [Sec2: patterns of outdoor space use].
Posing urban/landscape qualities from unique campus masterplans - spaces like
productive and rain gardens, welcoming paths/links to surrounding structures,
biodiversity corridors, etc. - that best yield motivation to innovation [sec3].
Bridging aspects of crossed design values of student-environment intersections by
remarking the physical features - that either supporting or declining students’ creativity -
related to the use of space at the University of Salford (hereafter referred to as UOS)
[Sec4].
1.1 Rational for the Study: Campus Outdoor is as Important as Indoor
University campuses socialize its activities within campus and with communities and notably
undergoing an exciting transformation from formal to informal spaces. Arguably, the
development of informal campus open spaces, natural and built, is integral to learning and
discovery (Hanan 2013, Ibrahim and Fadzil 2013) and improves overall student satisfaction
with formal pedagogical approaches and environments (Douglas, McClelland et al. 2008,
Hopkinson, Hughes et al. 2008, McFarland, Waliczek et al. 2008, Salama 2008). While the
physical character and quality of a campus is defined by both its buildings and its open space,
it is the open space which has the greatest potential for enriching the individual and socio-
cultural wellbeing and stimulating the places of a community’s collective life (Morris 2003).
Besides being healthy and appealing, innovative campus spaces are distinguished by a
concentration of talent, where talent is defined as a combination of knowledge, creativity, and
entrepreneurship (Curvelo Magdaniel 2016). Innovative, welcoming quality places retain and
attract skilled and talented students who in turn generate experiences of planned and chance
innovation, and enrich a sense of community (see (Curvelo Magdaniel 2016, Rissola, HervÃ
et al. 2017)). Students also choose to live and stakeholder invest in places that offer
community amenities, social and professional networks, resources and opportunities. As
campus planners prioritize projects, and to think differently about the ways students create,
plan, and experience urban life; massive future investment must be assessed to efficiently
value which improvements are of the most significance to students creativity and would yield
the highest student satisfaction (e.g. (Tepper 2004, Boys 2010). Comprised of streets,
walkways, greens, courts, plazas, gardens and playfields, campus outdoor planning aims to
design more spaces for discovery and collaboration where integrating diverse elements
together in a coherent way.
1.2 Methodology & Conceptual Framework
In order to support both the creation of a place-based campus outdoor space plan and the
search for related innovative outdoor activities, a comprehensive literature of existing support

319
for urban green space was deemed and analysed properly. Meaning that it investigates the
student behaviours associated with or anticipated at an innovative setting; the physical
parameters of that setting; and whether positively or mutually influence innovation.
Considering of the multidisciplinary nature of the campus outdoor factors encouraging or
hindering students’ creativity, the literature review consisted of three phases:
A systematic search is made from social and educational perspective, revising models of
outdoor activities and related informal learning styles. Related databases are AEI
Database of Research on International Education, Australian Education Index, British
Education Index, Conference Papers Index, Current Educational Research in the UK,
ESRC Society Today, ERIC, Index to Theses, International Bibliography of the Social
Sciences (IBSS), JSTOR, UK Official Publications (UKOP), UK Education Database,
ZETOC.
Then, a broad set of campus outdoor planning (exemplar masterplans) is retrieved.
Related databases are Design and Applied Arts Index, UCLA Space Inventory System,
ScienceDirect, Scopus, EBSCO, SocINDEX and ABI/INFORM (ProQuest) databases.
They facilitate in-depth investigation and looking at the outdoor corporate campus: siting,
planning and the relationship between campus and community; providing access to nature
for employee health and wellbeing key landscape considerations; and finally promoting
innovation, collaboration and connectivity.
After conceptualizing the drivers of innovative campus outdoors, an advance search query
turned to phenomenological analysis of human environment interaction (design intentions
and the resulted experience or reactions) with focus on the University of Salford. Today,
the UOS, with over 20,000 students, 900 faculty members, and around 2,500 employees
enrolled at 7 schools in 60 acres (24 hectares), has remarkable ongoing developments
grown to serve the needs of industry, commerce and education (Douglas, McClelland et
al. 2008). UOS has a prized location with high profile assets offering room to grow at a
time when Manchester is increasingly constrained. Equal promises, Salford city is an area
that is expressively changing in the near future. Over the next 20 years, the Greater
Manchester Forecasting Model suggests Salford will report the strongest employment and
GVA growth rates in Greater Manchester. A review of the baseline information, site
appraisal, review of current and proposed campus planning (campus outdoor-specific
innovative plan) is conducted with a proper understanding of the design principles and
parameters.
Following these phases, final database is composed of about 90 papers published in
international journals, books, proceedings or research studies; then entered and classified in
an EndNote database. Areas where the literature in the database seemed inadequate were
identified, and further searching was undertaken, either to obtain further supporting evidences
or to show gabs/lacks. The study strive to be a source of new ideas on how campus outdoors
can succeed as nodes of innovation, leisure and community actions, and fitted place-driven
urban landscapes. Findings contribute towards ranking some factors that constitute the
various outdoor space settings as most meaningful and beneficial to users, university, and the
city.

320
2. STUDENT EXPERIENCE: OUTDOOR BEHAVIOURS/PRACTICES
Recognizing college campus landscapes as vital learning spaces will utilise the holistic
potential of college campuses as attentional resources. Social areas and outdoor learning
commons, including nature trails and ecological study areas, lend more opportunities for
community interaction and social encounters that foster a sense of belonging. Such
meaningful spaces go beyond advertising the aesthetic value of the campus open spaces for
student recruitment purposes to recognizing the entire campus landscape as a learning space
and advertising its educational value – that is more than just its visual appearance. Hence, this
section introduces the outdoor needs and activities that if creatively considered in the design
process will promote well balanced and connected networks of open spaces with a deeper
awareness to the environment and community.
2.1 Creative Interactive Planning Process
Masterplans that bring forward student experiences and patterns of use for the public realm
approach are more likely to facilitate on campus innovation. Open spaces, as active part of
the campus, are sometimes described and designed as “rooms.” The type, frequency, duration
of activities, and the arrangements are dependent on the physical characteristics of these focal
points, which may serve to encourage or hinder communication and innovation. The study is
boosting the role of ‘innovative’ planning process in understanding students’
needs/experiences by mapping their movement and usage, thus prioritize and encompass
related features.
2.2 Patterns of Outdoor Space Use
User experience is a term used to describe the overall student’s interaction and satisfaction a
user has when using a space (Temple, Callender et al. 2014). It is the characterization of what
a user feels while using any space. In a market where students are recognised as customers,
universities have to implement strategies to maintain and enhance their competitiveness.
They need to develop a competitive advantage based on a set of unique characteristics.
Furthermore, universities need to communicate these characteristics in an effective and
consistent way to all of the relevant satisfactory students’ needs and experiences. In addition
to attending lectures, working in labs, and participating in other formal educational activities,
experience outside of the classroom, including social gatherings and co-curricular programs,
enhances personal development and helps facilitate meaningful connections with faculty,
peers, and the university. Varied involvement opportunities and motivating factors stimulate
students for example to form relationships within the external space and contribute to the
quality of student life as well as creating a connection to the campus. Such bonds lead to a
strong campus community. However, wide ranges of out-of-class environments, which foster
learning experiences, can be utilized to maximize this end (see informal science-learning
environments such as science museums, zoos and outdoor settings, science youth programs,
science media) (Hofstein and Rosenfeld 1996). Some of which design parameters are
discussed below.
An appreciation of student’s needs is one key social dimension which raises important issues
concerned with people’s values and choices of urban development interventions in a society

321
(Carmona 2010). Designers within the built environment should cater for those needs in order
to ensure a built environment that fulfils users’ needs and aspirations. According to Maslow’s
pyramid of human needs (McLeod 2007):
1. Physiological needs including food, warmth and survival;
2. Safety and security needs;
3. Affiliation needs of belonging and acceptance;
4. Esteem need by feeling valued by others through a person’s education/status/ownership;
5. Self-actualisation needs through artistic expression and fulfilment.
Next to fulfilling those needs or “human factors” - the social, cultural and ideological
dimensions of the human being - it is essential to achieve innovative perception of a place, or
place meaning for linking human needs and reacts (his natural, psychological and
sociological composition) with the spatial environmental elements. However, designers and
planners face many challenges while trying to respond to and link the varying needs of
different individuals/groups to a space. In practice, it is difficult to respond appropriately to
students’ motivational experiences and preferred modes of interaction/instruction (Hofstein
and Rosenfeld 1996). Abu-Ghazzeh proved that place meaning can be conveniently thought
of involving three major research areas: knowledge about the place’s objective attributes,
knowledge about its affective quality, and knowledge about the behaviours that occur there.
Environmental psychologists have investigated the knowledge of objective attributes and
affective quality of spaces in more detail than knowledge of behaviour-space associations
(Russell and Ward 1982). Analytic techniques have been widely used in many studies of such
spaces as a means of obtaining responses from the public regarding design preferences for the
site under study. Many studies have described a behavioural approach to environmental
design (e.g., (Appleyard 1973, Balling and Falk 1982, Abu-Ghazzeh 1999). A search for
published literature on how campus open spaces are used has revealed that such literature
either is devoted to technical innovations and issues of form (e.g. Schemertz, 1972) or
concentrates on the explanation of fiscal issues, education policy, and large-scale planning.
There is a paucity of research about how individuals use the outdoor environment in campus
settings. The use of patterns facilitates the re-use of techniques wherever a similar problem
recurs. This spark a major focus on regenerating and boosting inward investment into the
university campus with wider benefits for the community, city and beyond. In practice,
patterns may be applied in combination to create different kinds of space with different
effects on behaviour.
2.3 Transforming Outdoor Practices within Students & Community
(Strange and Banning 2001) formalized a set of four guiding categories forming the basis that
identifies, classifies and provides provision for transformation of students learning and
experiences from indoor/formal spaces into outdoor/informal spaces. Enhanced experiences
related to student achievement/outcomes summarized in table (1).
Table 7: Outdoor student activities/experience (summary by author)
Student experience associated with preferred spaces and predicted outcomes
A.
Applying
B.
Engaging
C.
Reflecting
D.
Sharing

322
Physical / Spatial
Ecological &
Therapeutic /
Environment
Social & Recreational
Educational / Academic
Individual
adaptation-use of
space.
Fit between indoor
and outdoor.
Spatial perception.
Legibility-
wayfinding (new
user ability to
scan/perceive the
context (Strange and
Banning 2001))
Creativity and
critical thinking.
Environmental
awareness.
Student comfort
and wellbeing.
Student ownership.
Student given
choices.
Build competency.
Personality/identity
Social interaction (creating
social bonds, group experience).
Engagement (students feel
connected, advisory programs,
peer mentoring-counselling,
community service).
Social & behaviour activities,
skills (variety, independence,
confidence, self-esteem,
personal/social effectiveness,
communication, group cohesion
& teamwork (Dillon, Rickinson
et al. 2006).
Contribution (enrichment of the
learning experience).
Involvement (the desire to be involved
or the amount of time & energy
students devote to these activities).
Curiosity (more about their interests).
Challenge (complexity of a topic).
Compliance (to meet another’s
expectation, to do what one is told).
Recognition (to be publicly
acknowledged) & Competition;
Cooperative learning.
3. CASE ANALYSIS AND MEASURES FROM A SERIES OF CAMPUS
ASTERPLAN: IMPERICAL STUDIES
Campus planning are not formed for infrastructure foundations only, but also further
supporting and satisfying students experience that make up the student community. This
section is a summary of recognised aspects of innovative parts of campus that encourage
students to mix, play, meet, sit, relax, read, and manners of extra-curricular activities
that activate public spaces. Literature is centred on interaction, collaboration, physical
movement and social engagement as primary elements of the students learning and discovery
experiences (Marcus 2003, Stanton 2005). Those values are reinforced by many studies
(Strange and Banning 2001, Bender and Parman 2005, Kenney, Dumont et al. 2005,
Gutierrez 2013) who maintain that learning is a campus lifelong activity rather than just
limited by closed instructional spaces.
3.1 Types “Context” & Typologies “Content” of the Campus Exterior Space
Outdoor space types on campus vary from broad to narrow, complex to simple, and openness
to closeness. Designing outdoor spaces in universities may also vary according to their shapes
and sizes, their location in relation to buildings and the whole campus, the designated space
functions/activities, and the activities of the surrounding spaces. Besides, climatic elements
are considered one of the key determinants in the design of the urban spaces. (Dober 1992)
described three types of styles for campus design: (a) monoform (one unifying style per full
campus or sector of campus, such as Collegiate Gothic, or Georgian), (b) metamorphic
(disparate styles united by one or more unifying characteristic), and (c) mosaic (no unifying
characteristics) as options for campus design.
According to (Schmertz 1972), a typical campus outdoor space type with components and
parameters is classified in table (2). This classification differs from study to another, for
example, some studies classified outdoor academic spaces as formal (outdoor portion of a
central plaza, transportation hub, outdoor amphitheatres, campus commons); and informal
meeting spaces (seating walls, picnic tables, overhangs, small greens, or other spaces not

323
specifically built for masses, yet (Dober 1992) did not suggest the separation of formal from
informal meeting spaces.
Table 8: Components of the basic campus space: type, size, uses and features (summary by
author)
Space type Components Parameters
Co
mm
on
tu
rfs Green areas Provide a healthy breath and enhances student life
Main courts & plazas For students to socialize and interact, connects to various
buildings/spaces. Important component to place making
Campus entrances Welcoming gateways to campus, inwards-towards views
Aca
dem
ic
spa
ces
Adjacent to specific buildings
including the front entrance space,
front yard, backyard, and
secondary/service entrance
Technology, ecosystems (e.g. birds, fishes, etc.), zonings,
Microclimate (shading & seating), barriers from noise,
winds and severe weather conditions.
Sp
ort
s
spa
ces
Recreational fields, open courts and
sports facilities provided on campus
(or with a close direct access from
campus)
Open lawns to accommodate wide range of field games,
large and high canopy trees as edges to provide shade for
spectators and to help screen prevailing winds.
Cir
cula
tion
Roads, pathways and parking areas Friendly walkable corridors and walkways (Dober 1992,
Amsden 2005); Safety and stability of walkways; can be
critical for effective circulation on campus, ring roads
(separate campus from outside).
3.2 Design Indicators for Campus Outdoor Innovation
Interaction: Social interactions include conversation, reflection, debate, discussion and
group working. They are proved to provide an influential role on students’ learning
experiences, in which students share knowledge or gain new information (Acker and Miller
2005, Kolb and Kolb 2005). The existence of shared public spaces like cafeterias, dining
halls or student union on a campus increases the interaction between students, and take part in
a group activity planned beforehand. He designed indicators like general layout, site
selection, size, sub-spaces etc. that affects the way of interaction between students on any
informal learning space.
Collaboration: Collaborative team work as alternative informal study areas has a triggering
affect on motivation, diversity, and observe and absorb new attitudes, behaviours or
knowledge through members of the group (Harrop and Turpin 2013).
Social Engagement: According to (Jamieson 2003), student commons, green spaces and
other hospitality areas are needed to enhance social engagement on a campus, with feeling
more pleasured and comfortable (Marcus and Francis 1998).
Multiple Experiences: According to (Jamieson 2003), increasing possibility for diverse
campus experiences to cross paths and connections is viewed via spaces which are ‘softer,
less rigid, and where the character of the space is formed by the ‘shape and identity of the
relationships created within it’.

324
Sense of Campus: (Halpenny 2006) calls ‘sense of place’ as a personal phenomenon, having
as much to do with individual’s own experiences and cognitions as with the physical
environment. He defines campus as “a tapestry of sensory, cognitive, and intellectual
practices that are meaningful in and of themselves, and that can profoundly reinforce one
another.
3.3 Experience-Led’ Landscapes for Innovative Design of Space
This part exposes various innovative ideas in masterplans that developed landscapes as and
where necessary in response to changing circumstances.
Lessons from the University of Manchester: The Graphene Engineering Innovation Centre
(GEIC) development, which will re-invigorate Brunswick Park, part of the University’s
North Campus, will include a Pocket Park and a new landscaping scheme promoting
biodiversity and improving access. Diana Hampson, Director of Estates and Facilities, said:”
The University is transforming the campus through its £1 billion Campus Masterplan and that
includes a commitment to environmental sustainability by improving our green spaces and
public realm. These proposals form a centrepiece of our vision and will create a heart of the
University campus for staff, students, visitors and the local community to enjoy.”
Lessons from Art-based Activities: There has been growing recognition of creativity as a
means of addressing issues such as social exclusion, urban regeneration and community
development (Carey and Sutton 2004, Nordh, Hartig et al. 2009). Recently, US artist and
urban planner Candy Chang’s interactive experiments in public places have been receiving
attention for their unorthodox methods of engagement that combine installation art with
social activism, enabling people to engage with their public spaces so their opinions are
heard. Chang theorises that one of the best ways to shape public space is in the space itself.
She achieves this through the installation of blackboards, vinyl stickers and posters in high
traffic areas of the chosen site, enabling communication of ideas on site and in real time. She
uses ‘fill-in the blank’ questions to provide a mirror for the community to reflect on a site
(Chang 2013).
Lessons from University “Educational Campus”: Classifying various landscape zones and
identify a portfolio of prioritized themes that neighbourhood might want to visit and students
would be proud off. Envisioning and overlapping networks of those compelling zones/hubs
and offering generic space types, will positively influence the power of planning for
interaction. Such classifications are:
Learning Landscape: manifesting the curriculum activities via workshops, outdoor class, art &
meeting places;
Ecological Landscape: as in forests and wetlands;
Productive Landscape: seen in growing spaces and green roofs;
Social and Cultural Landscape: used for public events such as concerts, markets, sporting and
large-scale events;
Entertaining Landscape: as parks and pools with fountains, green spaces, public art, relaxation and
play, and healthcare activities;
Entrepreneurial Landscape: connecting students to innovation & investment (Incubator units,
Business forest);
Commercial Landscape: such as museum, retail and office accommodation.

325
Figure 16: (1) Lessons from the University of Manchester, (2) art-based activities “Before I
Die” by Chang (3) Outdoor Commons at Marysville Getchell “Learning Retreat”: Elevated
boardwalk floats and serving as a social and learning focal point, connecting with the
Community Commons. (4) The buildings and spaces in the University of Exeter Forum are
related closely to the campus topography. (5) Teesside University (the curve). (6) CBE space
at the Loughborough University. (7) & (8) Exemplar outdoor learning environment.
Lessons from UCD strategic campus planning: Another innovative concept that emerged
in 2005 for a new university campus and was subsequently integrated into the strategic
programme Campus of International Excellence by the Spanish Ministry of Education in
2009. It aimed to reflect a modernized process to quality and be dedicated to the intellectual,
psychological and social development of its students. It is a pragmatic place-based approach
326
within universities focusing on policy, philosophical, sociological, practical and recreational
aspects, which all promote to the student entire satisfaction.
Parallel views, such as the Outdoor Learning Commons, Small Learning Communities,
and Media Centre, have raised to support flexible spaces as a part of the campus landscape
and community focusing entirely on student potential and learning for learning to take place
everywhere. The design patterns would be such: Transparency, welcoming entry, Student
display space, science labs/parks, art labs, life skills areas, outdoor physical fitness, dispersed
technology, Indoor-Outdoor connection, campfire space, watering hole space, cave space, full
spectrum lighting, accessibility & connectivity within campus and to the community,
flexible/all-in-one space.
4. ASPECTS OF STUDENT-SPACE INTERSECTIONS: THE CASE OF UOS
This section provides practical guides through relating the previous sections (3 & 4) in to the
UOS. Resulted design impacts has its own components and parameters used in specific space
type and typology, as represented in the literature on outdoor campus spaces – for valuing
positive urban space that suits the purpose for which it is designed, whilst meeting users’
needs.
4.1 UOS Context: Contextual Enabling Factors
The UOS (Fig1), originally the Salford Technical Institute opened in 1896 and then a college
of Advanced Technology in 1956, has gained university status into Higher Education in
1967.

327
Figure 17: UOS land ownership (www.salford.ac.uk/about-us/our-developing-campus)
4.2 Opportunities, Constraints and Problem Areas: Campus Physical Features Related
to Use of the Space
Conserving and enhancing the natural environment and social sustainability both approached
through examination where appropriate of the social value of natural capital elements such as
the utilizing biodiversity assets in Peel Park, and the creation of living campus for blue and
green infrastructure. Identifying the value of social infrastructure such as green spaces: cycle
racks, leisure facilities and community spaces to aid financial modelling and decision
making. The Quays Strategic Framework vision for the area: “the UK’s smartest place to
invest, innovate, create, and produce, in an environment where people work, live, learn and
relax”. In addition, the regeneration of Pendleton to the west of the masterplan area will
generate a further push factor. These latest facts and proposals build on the early successes
driven by the Central Salford Strategic Regeneration Framework, which helped to kick-start
change for the University planning.
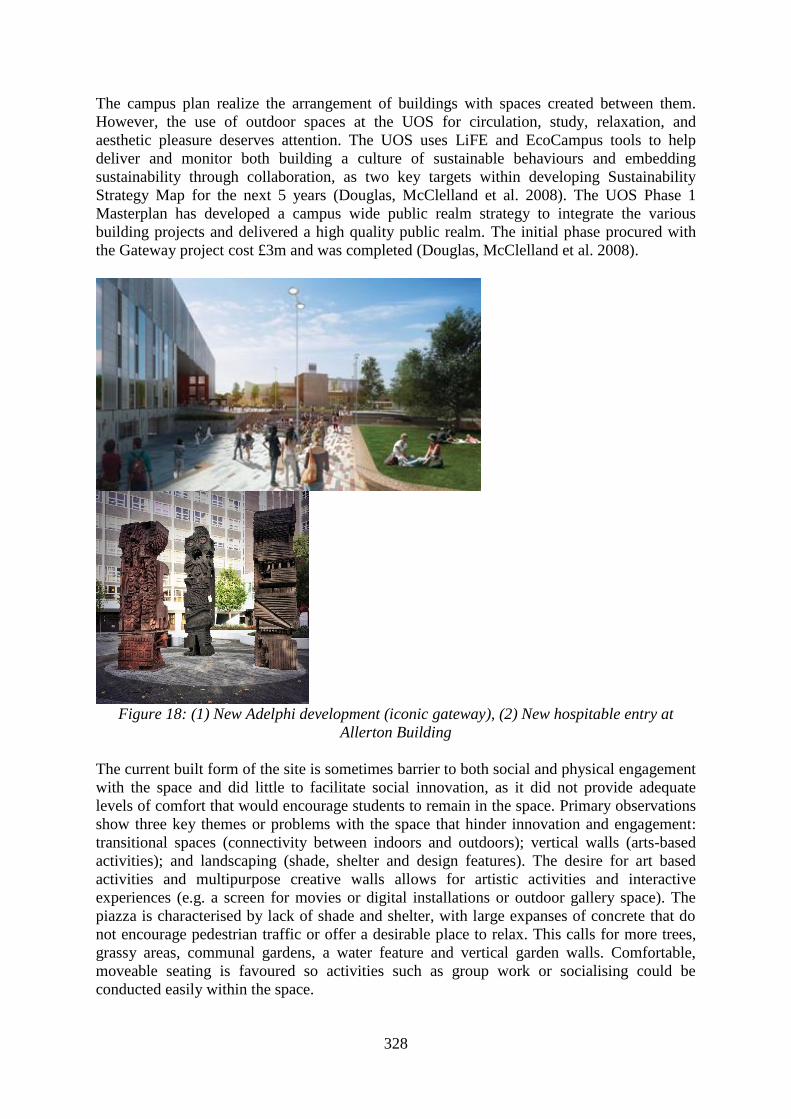
328
The campus plan realize the arrangement of buildings with spaces created between them.
However, the use of outdoor spaces at the UOS for circulation, study, relaxation, and
aesthetic pleasure deserves attention. The UOS uses LiFE and EcoCampus tools to help
deliver and monitor both building a culture of sustainable behaviours and embedding
sustainability through collaboration, as two key targets within developing Sustainability
Strategy Map for the next 5 years (Douglas, McClelland et al. 2008). The UOS Phase 1
Masterplan has developed a campus wide public realm strategy to integrate the various
building projects and delivered a high quality public realm. The initial phase procured with
the Gateway project cost £3m and was completed (Douglas, McClelland et al. 2008).
Figure 18: (1) New Adelphi development (iconic gateway), (2) New hospitable entry at
Allerton Building
The current built form of the site is sometimes barrier to both social and physical engagement
with the space and did little to facilitate social innovation, as it did not provide adequate
levels of comfort that would encourage students to remain in the space. Primary observations
show three key themes or problems with the space that hinder innovation and engagement:
transitional spaces (connectivity between indoors and outdoors); vertical walls (arts-based
activities); and landscaping (shade, shelter and design features). The desire for art based
activities and multipurpose creative walls allows for artistic activities and interactive
experiences (e.g. a screen for movies or digital installations or outdoor gallery space). The
piazza is characterised by lack of shade and shelter, with large expanses of concrete that do
not encourage pedestrian traffic or offer a desirable place to relax. This calls for more trees,
grassy areas, communal gardens, a water feature and vertical garden walls. Comfortable,
moveable seating is favoured so activities such as group work or socialising could be
conducted easily within the space.

329
4.3 Campus-Wide Choices/Directives: Campus transformations for Innovative Students
Micro-climate conditions strongly influence how people experience a space and
uncomfortable conditions can distress people and stop them using an area (Nikolopoulou and
Steemers 2003). The findings from basic observations propose that spatial developments
should be examined holistically on the three experience layers: visual, physical, and social,
through impacts on most affected levels of satisfactions. Based on the findings, types can be
identified and distinguished mainly in terms of collaborating with different partners and
supporting a spatial transformation of the university. Suggested options which could enhance
the identity and attachment to place included the addition of a water feature in the central
piazza area, vertical green walls, increasing trees and shading elements, and providing
comfortable, natural, meeting places for students to study in groups. By incorporating
suggested features such as lightweight, moveable, comfortable seating; and strategic use of
shade cloth or wind breaks, the area could be reclaimed as a comfortable, natural setting that
is a pleasant environment for social interaction and building connections to community. This
will encourage places that are diverse, interesting, active, and offer a mix of activities that
will facilitate the chance of spontaneous interactions between people, and contribute to place
identity, attachment and sense of community.
5. CONCLUSIONS: TOWARDS COMPETITIVE CAMPUS LANDSCAPE
TRANSFORMATIONS
The paper highlights critical areas where attention is needed in order to improve innovative
performance of landscape design and students' experience (practice & perception) with open
spaces in UK University campuses. Considering that student experience is not about just
equipping students with an academic qualification and a path to employment, although it is
important, the paper seeks social development where external events and exhibitions could be
located, transforming the functional into social, communal and recreational. The study
demonstrated that the campuses used could elicit rich environment input for consideration
and provide evidence to initiate change based on a host of student and place-based ideas. For
linking students needs with innovative design solutions within Higher Education campuses,
this study highlighted innovative lessons from both theoretical and efficient masterplan
visions to adapt for encouraging and engaging sustainable student practices out and between
academic buildings at UOS campus. This ranges from high-level visions of influencing wider
social or community behaviours, to very specific techniques applied to influence particular
behaviours in a particular context. To this end, the following recommendations are
concluded:
Innovative Planning/Design process: Fostering a highly collaborative design process with students
through honest listening, approachability, and open-mindedness to discuss potentials of fostering
activity, connectivity and creativity. Planning considering co-creative design processes blend
seamlessly buildings with the creation of green, interactive, collaborating spaces and encouraging
more people (not just students) to visit and revel in the campus. In the case of UOS, traditional
campus planning and design with little student engagement resulted in a central area of campus
being under-utilised and even inhospitable (now under development).
Green innovation: Recognising of the role of landscaping and greenery in reinforcing student-
derived themes and providing well-being, attachment and social interaction and engagement in a
raining university. People want to gather, socialise, study and be creative in a comfortable and

330
inviting space that offers shelter and shade from the elements, places to sit, eat and drink, and a
space in which to enjoy cultural and artistic activities.
Innovative Connectivity: Adding interest and activity along main green multi-purpose spine/s that
accommodate, energise and inspire students and community in a vibrant, engaging, and fitting
environment (e.g. enhancing with trees, placing wayfinding signs at intersections, adding curves
to capture architectural views and installing a bike path): A powerful, welcoming space that also
connects the university and city. “The best learning-research outcomes are achieved when a
diverse range of environments are offered, this will be a quality space which will blur the
traditional boundaries between places to socialise” (Michael Ahern, Chief Operating Officer,
UCLan, 2017).
Investment and Innovation: The type, location and aesthetic appearance as well as size of main
activity areas are the most predominant factors that determined satisfaction and indeed the
performance of the buildings in meeting users' needs and aspirations.
Innovative activities: accommodate wellbeing, outdoor entertainment activities - arts and
gathering areas- for improving human-space connection on campus and; such as gym, running
paths, bee keeping, kitchen garden, pop up coffee shop, farm, roof terrace, etc. - encourage and
enhance the student experience spending time while in higher education.
It is difficult to sum up an ideal, multi-dimensional space setting for innovative student
experience, yet, the paper represented a scientific way of approaching the design of campus
outdoor spaces for exceeding student’s expectation and stimulating people’s creativity. The
findings are scientifically reliable derived from literature review combined with basic
observations at UOS. However, so as to broaden the impacts and deepen the practicality of
innovation-led designs; further field work with the participation of larger respondent groups in
various settings should be carried out, in further case studies according to their typologies.
6. REFERENCES
Abu-Ghazzeh, T. M. (1999). "Communicating behavioral research to campus design factors affecting the
perception and use of outdoor spaces at the University of Jordan." Environment and behavior 31(6): 764-
804.
Acker, S. R. and M. D. Miller (2005). "Campus learning spaces: Investing in how students learn." Educause
Center for Applied Research Bulletin 2005(8): 1.
Amsden, D. J. (2005). "Using Behavioral Research to Assist in the Redesign of University Plazas." Planning for
Higher Education 33(2): 31-38.
Appleyard, D. (1973). "ENVIRONMENTAL PLANNING AND SOCIAL SCIENCE: STRATEGIES FOR
ENVIRONMENTAL DECISION-MAKING."
Balling, J. D. and J. H. Falk (1982). "Development of visual preference for natural environments." Environment
and behavior 14(1): 5-28.
Bender, R. and J. Parman (2005). "New Campuses for New Communities: The University and Exurbia
[Research and Debate]." Places 17(1).
Boys, J. (2010). Towards creative learning spaces: Re-thinking the architecture of post-compulsory education,
Routledge.
Carey, P. and S. Sutton (2004). "Community development through participatory arts: Lessons learned from a
community arts and regeneration project in South Liverpool." Community Development Journal 39(2): 123-
134.
Carmona, M. (2010). Public places, urban spaces: the dimensions of urban design, Routledge.
Curvelo Magdaniel, F. (2016). "Technology campuses and cities: A study on the relation between innovation
and the built environment at the urban area level."
Dillon, J., et al. (2006). "The value of outdoor learning: evidence from research in the UK and elsewhere."
School science review 87(320): 107.
Dober, R. P. (1992). Campus design, Wiley.
Douglas, J., et al. (2008). "The development of a conceptual model of student satisfaction with their experience
in higher education." Quality Assurance in Education 16(1): 19-35.

331
Eberhard, J. and B. Patoine (2004). "Architecture with the Brain in Mind." Cerebrum 6(2): 71-84.
Gutierrez, J. (2013). "Restorative campus landscapes: fostering education through restoration."
Halpenny, E. A. (2006). "Environmental behaviour, place attachment and park visitation: A case study of
visitors to Point Pelee National Park."
Hanan, H. (2013). "Open space as meaningful place for students in ITB campus." Procedia-Social and
Behavioral Sciences 85: 308-317.
Harrop, D. and B. Turpin (2013). "A study exploring learners' informal learning space behaviors, attitudes, and
preferences." New Review of Academic Librarianship 19(1): 58-77.
Hofstein, A. and S. Rosenfeld (1996). "Bridging the gap between formal and informal science learning."
Hopkinson, P., et al. (2008). "Sustainable graduates: linking formal, informal and campus curricula to embed
education for sustainable development in the student learning experience." Environmental Education
Research 14(4): 435-454.
Ibrahim, N. and N. H. Fadzil (2013). "Informal setting for learning on campus: Usage and preference."
Procedia-Social and Behavioral Sciences 105: 344-351.
Jamieson, P. (2003). "Designing more effective on‐campus teaching and learning spaces: A role for academic
developers." International Journal for Academic Development 8(1-2): 119-133.
Kenney, D. R., et al. (2005). Mission and place: Strengthening learning and community through campus design,
Greenwood Publishing Group.
Kolb, A. Y. and D. A. Kolb (2005). "Learning styles and learning spaces: Enhancing experiential learning in
higher education." Academy of management learning & education 4(2): 193-212.
Marcus, C. C. (2003). "Shared Outdoor Space and Community Life [Research and Debate]." Places 15(2).
Marcus, C. C. and C. Francis (1998). "People places." Design Guidelines for Urban Open Space.
McFarland, A., et al. (2008). "The relationship between student use of campus green spaces and perceptions of
quality of life." HortTechnology 18(2): 232-238.
McLeod, S. (2007). "Maslow's hierarchy of needs."Available from internet: http://www.
simplypsychology.org/maslow. html.
Morris, N. (2003). "Health, well-being and open space." Edinburgh: Edinburgh College of Art and Heriot-Watt
University.
Nordh, H., et al. (2009). "Components of small urban parks that predict the possibility for restoration." Urban
forestry & urban greening 8(4): 225-235.
Rissola, G., et al. (2017). Place-Based Innovation Ecosystems: Espoo Innovation Garden and Aalto University
(Finland), Joint Research Centre (Seville site).
Russell, J. A. and L. M. Ward (1982). "Environmental psychology." Annual review of psychology 33(1): 651-
689.
Salama, A. M. (2008). "When good design intentions do not meet users expectations: Exploring Qatar
University campus outdoor spaces." Archnet-IJAR, International Journal of Architectural Research 2(2):
57-77.
Schmertz, M. F. (1972). Campus planning and design, McGraw-Hill Companies.
Stanton, B. H. (2005). "Cognitive Standards and the Sense of Campus [Research and Debate]." Places 17(1).
Strange, C. C. and J. H. Banning (2001). Education by Design: Creating Campus Learning Environments That
Work. The Jossey-Bass Higher and Adult Education Series, ERIC.
Temple, P., et al. (2014). "Managing the student experience in a shifting higher education landscape." The
Higher Education Academy.
Tepper, S. J. (2004). "The creative campus: Who's no. 1." Chronicle of Higher Education 51(6): B6.

332
ID 039
BUSINESS INTELLIGENCE AND CULTURAL CHANGE IN SOCIAL
HOUSING
C. Duvier and C. Oltean-Dumbrava
Faculty of Engineering and Informatics, University of Bradford, Bradford, BD7 1DP
Email: [email protected]
Abstract: Social housing is looking towards business intelligence to help with handling and
analysing the vast amounts of data collected. This paper presents a qualitative case study
carried out at a social housing provider, trying to implement a business intelligence system in
order to work more effectively and efficiently. The process is outlined in five steps, together
with lessons learned, such as the importance of good leadership and communication.
Recommendations include following a detailed step by step process and implementing a data
governance framework. This work is potentially useful for other organisations interested in
business intelligence systems, especially regarding factors influencing willingness to adopt
and willingness to change. Future work will need to incorporate other provider’s experiences,
as well as continue to follow the path to completion, as this paper only outlines the initial steps
towards implementing a business intelligence strategy.
Keywords: social housing, business intelligence, data warehouse, cultural change
1. INTRODUCTION
The regulation of social housing in the UK has recently changed towards tighter control of
providers’ adherence to financial viability and governance, for example through “maintaining
a thorough, accurate and up to date record of their assets and liabilities and particularly those
liabilities that may have recourse to social housing assets.” (p. 2, HCA, 2015). Non-
adherence to the regulations will result in being downgraded and is therefore taken very
seriously by providers.
1.1 Social housing data not collected to standard.
A challenge that many social housing providers currently face is finding a way to effectively
handle data within the organisation (Leach 2016) once processes to identify and collect data
are defined.
One way to deal with data issues is to implement a business intelligence system. Business
intelligence can be understood as a “process composed of methods that organizations use to
develop useful information, or intelligence, that can help organizations survive and thrive in
the global economy” (p. 121, Jourdan, Rainer, & Marshall, 2008), with the goal of predicting
behaviour of people or products.

333
1.2 Business Intelligence as a possible solution
Business intelligence (BI) is a broad field, encompassing areas such as data warehousing,
data mining, data modelling, decision modelling and decision-making, artificial intelligence
and various project management areas such as customer relationship management (CRM)
(Jourdan et al. 2008). Arnott and Pervan (2014) define BI as “large-scale systems that use
data and analytics to support decision making at all levels of an organization. BI systems are
often based on a data warehouse or data mart.” (p.275). They categorise BI as belonging to
the branches of executive management systems and data warehousing within the field of
decision support systems, and as related to the very modern term business analytics. BI has
received increasing research attention in recent years, but adoption in practice is low (Skyrius
et al. 2016). The right implementation of a business intelligence strategy is crucial to the
success of the project. BI projects are complex, require time, appropriate infrastructure and
resources, and cannot be implemented quickly (Yeoh & Koronios 2010). Critical success
factors for a BI system (BIS) include committed management support and sponsorship, a
clear vision and well-established business case, business-centric championship and balanced
team composition, business-driven and iterative development approach, user-oriented change
management, business-driven, scalable and flexible technical framework, and sustainable
data quality and integrity (Yeoh & Koronios 2010). Marinela (2008) argues that the following
need to be considered: “[W]ho needs BI, which information is needed, when do users
need the information, where must the solution be implemented, why is information
important, how may BI represent value-added” (p. 105). Such challenges are complex
projects themselves; for example data quality alone is considered imperative to a BI project,
and has itself received considerable research attention. Yoon et al. (2014) further found that
adoption of a BI project depends on four factors: motivation, situational constraints,
technology, and social influence. Person-centered factors, such as commitment, support,
management sponsorship, and a focus on the business case are strongly related to the success
of a BI project, whereas a purely technology-focused approach is likely to lead to failure
(Yeoh & Popovič 2016). Ideally, a BI project will target critical success factors in the
following order: organisational factors first, then process, and lastly technological success
factors.
Overall, organisational factors, especially human factors, are now considered most important
for the success or failure of a BI project. In 2008, Gartner highlighted nine common mistakes
that lead to failed BI projects: (1) Building a system without explaining its value to the
organization. (2) Data analyses processes are not transparent or fact based, and can lead to
barriers in terms of internal politics and cultural change. (3) Data quality is not seen as
important, but firms do need an automated control process to block low quality data entering
the BI system. (4) Firms choose the standard company vendor without shopping around,
which can lead to loss of vital BI functions other vendors might offer. (5) BI is seen as a
discrete and fixed project, whereas in reality it is a moving target that needs constant changes.
(6) BI efforts are outsourced with the hope to get a better product at lower cost, but building
skills within the company is very important. (7) Companies demand dashboards as part of the
BI strategy early on, without realising that dashboards are silo-specific and often not founded
on corporate objectives. (8) BI is supposed to create a single version of the truth, but within
the organization, departments and people do not agree on fundamental definitions for terms.
Departments need to work together cross-departmentally and agree on standards such as data
definitions and performance metrics. (9) The lack of a BI strategy, or a poorly developed or
implemented one, is seen as the biggest flaw. A good strategy should be developed as part of
the IT team and across the organization (Anon 2008). As Watson et al. (2002) state: “change

334
and the truly momentous benefits are far more likely when the vision comes from the
business side of the house rather than the IS side.” (p. 501).
Data warehousing represents one area within business intelligence, where data across an
organisation is stored in a single place. This facilitates decision making and when monitored,
can lead to high data quality, and most importantly, large revenue (Watson et al. 2002). Data
warehousing can provide “a single version of the truth” (p. 435, Watson, Fuller, &
Ariyachandra, 2004). The Housing and Development Board (HDB) in Singapore
implemented a data warehouse to move data from over 120 databases into a single system
(Ang & Teo 2000). Throughout this process, seven management issues were identified: (1)
Identifying the process, (2) Choosing development options, (3) Adopting incremental change
approach, (4) Overcoming resistance, (5) Choosing project leader, (6) Providing formal,
systematic training, (7) Scalability and data warehouse maintenance – the data warehouse
needs to be flexible to changing demands and increases in data volume. It also needs
continuous excellent maintenance, which is crucial to its ongoing success.
This paper will outline the case study of a social housing provider in the UK that is
implementing a business intelligence project. This is an ongoing project, as the above section
has highlighted. Initial efforts, together with the methodology applied, will be discussed, as
well as lessons learned up to this point in the project.
1.4 Study – Initial steps and problem identification
In the following section the approach taken by a social housing provider towards business
intelligence is outlined. The provider is considered one of the larger social housing providers
in the UK, with over 20,000 properties. The organisation employs more than 800 staff and is
managed by eight different boards. The executive management team consists of the CEO and
three Assistant Executives.
Social housing in general faces upcoming challenges in the years ahead due to changes to the
welfare reform. From 2016 onwards, all rents are reduced by 1% for the next 4 years
(Department for Communities and Local Government n.d.). This will lead to financial losses
of over £2.3 billion for the entire sector (Adam et al. 2015). Welfare reform changes are also
likely to lead to less financial solvency for tenants not currently in work or disabled.
2. METHOD
In the following section, the five steps implemented towards the business intelligence
strategy in the organisation are outlined. A parallel process was adopted, meaning that steps
were implemented alongside each other. The illustration below shows the process, with a
detailed description following in the text after.

335
2.1 Implementation of Strategic Team responsible for finding out the business needs for
each department
This team consists of five members from the neighbourhoods and asset management branches
of the organisation. The team agreed on the following strategy:
Identify strategic business needs at higher management level,
Identify business needs at middle management level,
Identify business needs at the operational level.
Members of the team identified the strategic needs, which include, for example, knowledge
of past, present, and future income and costs for each asset, reasons why customers terminate
a tenancy, or the energy efficiency of installed heating systems. Each member then scheduled
meetings across the organisation to establish the middle management and operational needs
regarding data in terms of business intelligence. Six meetings have been held to date,
including members of the income team, neighbourhoods, and three sets of meetings with
different areas in asset management. More meetings are scheduled to take place in the near
future with departments such as finance, estate services, technical services, and new builds
(see Figure 1 for an organogram of the organisational structure). Participant numbers ranged
from three to ten depending on the size of the team. Asset management meetings had the
highest number of participants. Each meeting lasted between 1.5 and 4 hours. Apart from job-
specific business needs, the meetings were useful in terms of identifying overarching issues
experienced through a lack of business intelligence within the organisation.
General needs targeted by business intelligence project:
Better communication between departments
Fewer systems, less spread of information
Easy access to information, and access to information from other departments
Clear business goals
Clear responsibilities for tasks and data, including ownership of data
Greater effectiveness in every-day tasks
Create strategic BI
team
Problem identification
with data and its
management
Executive buy-in
Data Quality Check
Create ICT BI Team to
build data warehouse

336
Figure 19. Organisational structure of the social housing provider
2.2 Identify problems with data and its management across the organisation
Several events were held across the organisation within the past year which gathered useful
information for the BI project, although these events were not specifically targeted to find out
business intelligence needs, rather, they focused on staff feedback on general business
practices. The events all identified one underlying problem: Too many systems are used for
different areas of the organisation, resulting in a lack of communication between systems and
people. From these meetings, and the business needs meetings conducted by the Strategic
Team, several different issues are identified with the way data are stored, as seen in Figure 2:
Figure 20. The main issues with data at the social housing provider
Silos: Data are stored in systems, spreadsheets, or paper files that only specific
departments or people have access to. This creates issues for data sharing and cross-
Chief Executive
Assistant Executive - Finance
Legal and Governance
Finance
HR
Performance Management
Assistant Executive - Neighbourhoods
Income Team
Neighbourhood Teams
Intensive Housing Management
Customer Service Centre
Assistant Executive - Asset
Management
Repairs - Day to day and planned
Voids repairs
Logistics
Technical Services
New builds
Estate Services
Data issues
Silos
Rigidity Duplication
Invalid field entry

337
departmental comparisons of data. Data systems do not talk to each other, data first
need to be converted into a comparable format, which is a lengthy process.
Rigidity: Externally managed systems do not offer the option to add new fields,
which limits the amount of data that can be collected.
Duplication: Data for a specific field, for example, telephone number of a customer,
is collected in different systems, like repairs and income. Since systems are siloed,
some departments have more up to date information than others, which creates
difficulties.
Invalid field entry: Some data fields are overwritten with invalid data. For example,
built date has the original value in one system, but another system is overwritten with
the date for renovations.
2.3 Executive Management Team: on the importance of business intelligence
Several meetings were held with the executive management team (EMT) on business
intelligence over the last year. Initial meetings outlined problems identified with data, as
outlined above. Subsequent meetings concentrated on the outcomes of a BI system, in
particular its abilities to manage data and provide predictive analyses on future performance
and behaviour. The EMT supports the effort to create a BI system and has provided resources
within the ICT department to develop a data warehouse.
2.4 Data Quality: initial data quality check
Data quality is recognised as being an issue across the organisation. Rudimentary data checks
were carried out through most departments, but so far, the organisation lacks a coherent
strategy to deal with data quality issues, and criteria to assess data with. However, since this
was an initial check, once data are ready to be integrated into a new data warehouse, a more
scientific approach to the data quality check is recommended, following recommendations
from the literature (Pipino et al. 2002; Redman 2012; Strong et al. 1997). Some of the most
common data quality criteria include accuracy, completeness, consistency, and timeliness
(Batini et al. 2009). Both the criteria that will be assessed, as well as measurement
approaches, such as ratio, minimum or maximum calculations, will need to be considered.
Root causes of poor data quality also need to be identified (Batini et al. 2009).
2.5 Resources creation within ICT to build a business intelligence system
The ICT department has a designated team working on business intelligence. This team’s
responsibilities lie with creating a data warehouse from data the Strategic Team selects. The
ICT BI team removes itself from the task of selecting data needed for the project, and this is a
recommended strategy within the data governance literature (Wende 2007). The architecture
of the BI system needs to sit within ICT, but ICT will have little knowledge of the
organisational requirements regarding what kind of data is needed, how it needs to be
collected, and frequency of recording data. Therefore, the Strategic Team decided to feed
data needed to the ICT BI team, who then implement the architecture of the system.
In the first instance, data related to asset income and costs will be implemented in the data
warehouse. This aligns with the approach taken by the HDB, where an incremental approach

338
to implementing the BI strategy is recommended. The ICT BI team is in the process of
checking data according to three criteria:
Existing data and easy to get
Existing data but difficult to get
Non-existing data, therefore very difficult to get.
3. RESULTS WITH RECOMMENDATIONS
In the following section, lessons learned and recommendations for improvement will be
outlined. The social housing provider followed a relatively intuitive approach to business
intelligence, which lead to a pathway different to what is recommended. The
recommendations are split in two sections, with the first discussing the use of a path with step
by step processes, and the second section recommending the implementation of a data
governance framework. First, issues identified are outlined. These include communication,
establishing clear leadership roles, common goals and achievements, data quality, and
resources.
3.1. Issues identified with current business processes
Common goals and achievements: Overall, the BI Strategy Team agree on the common goal
to make better decisions as a business. However, disagreements arise concerning
achievements of the project, especially regarding front end applications. The ICT BI Team is
currently researching available front end tools, which will have to be aligned with business
needs, as well as organisational capabilities to train users in using these tools.
Communication: Communication between the team members and across the organisation
needs to be guided by the common goals and achievements. A communications plan needs to
be established regarding communicating the projects across the wider organisation. This will
help in establishing awareness of the project and will also facilitate training and development
later on in the process.
Clear leadership roles: At this point, there is no clear leadership role driving the project,
mainly due to the fact that members of the Strategic Team carry out the BI project alongside
their normal job roles. Therefore, willingness to take on more responsibility is low. The next
issue, resources, touches on this point as well.
Resources: Resources allocated to the overall BI project are relatively small. The ICT BI
team consists of two full time members and one part time member. However, creating the
data warehouse is not their only responsibility, as these members also work on a range of
other projects. The Strategic Team is working on the BI project alongside their regular work
load. The organisation would greatly benefit from recruiting new talent and creating positions
whose sole responsibility lies with helping move the BI project forward.
Data Quality: Although every member of the Strategic and ICT team acknowledges issues
with data across the organisation, a strategy how to deal with low quality data, or even
missing data, is currently not in place.
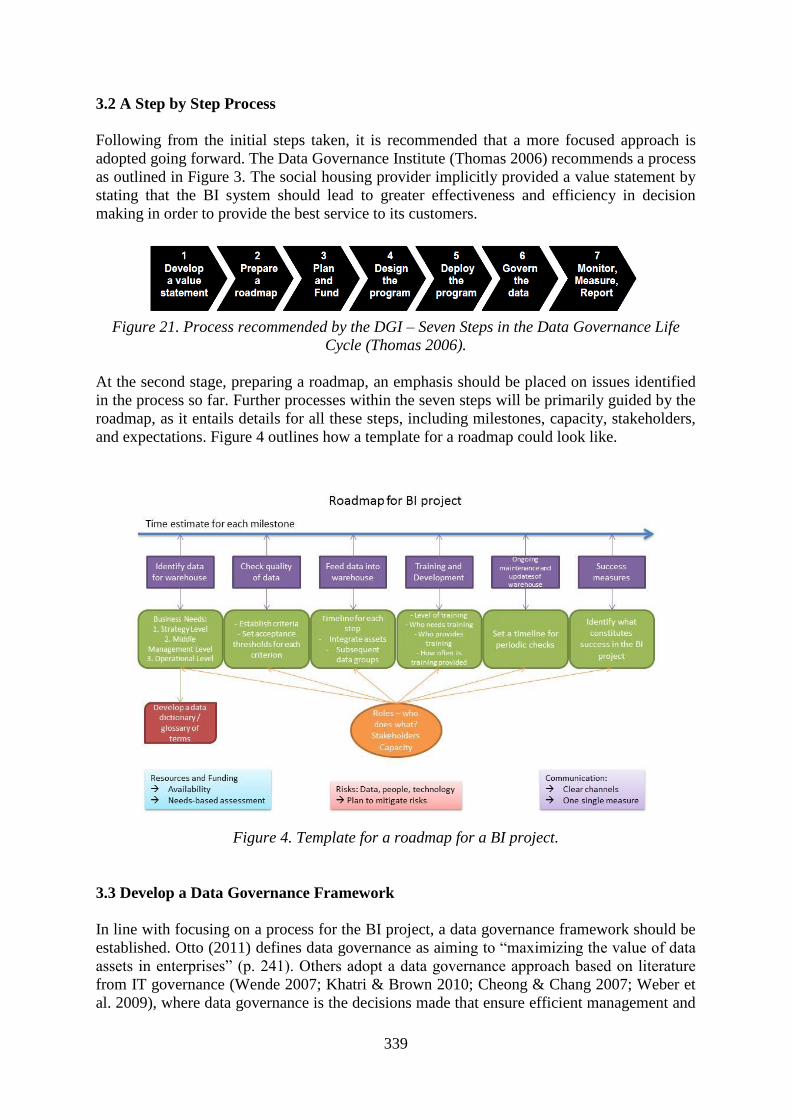
339
3.2 A Step by Step Process
Following from the initial steps taken, it is recommended that a more focused approach is
adopted going forward. The Data Governance Institute (Thomas 2006) recommends a process
as outlined in Figure 3. The social housing provider implicitly provided a value statement by
stating that the BI system should lead to greater effectiveness and efficiency in decision
making in order to provide the best service to its customers.
Figure 21. Process recommended by the DGI – Seven Steps in the Data Governance Life
Cycle (Thomas 2006).
At the second stage, preparing a roadmap, an emphasis should be placed on issues identified
in the process so far. Further processes within the seven steps will be primarily guided by the
roadmap, as it entails details for all these steps, including milestones, capacity, stakeholders,
and expectations. Figure 4 outlines how a template for a roadmap could look like.
Figure 4. Template for a roadmap for a BI project.
3.3 Develop a Data Governance Framework
In line with focusing on a process for the BI project, a data governance framework should be
established. Otto (2011) defines data governance as aiming to “maximizing the value of data
assets in enterprises” (p. 241). Others adopt a data governance approach based on literature
from IT governance (Wende 2007; Khatri & Brown 2010; Cheong & Chang 2007; Weber et
al. 2009), where data governance is the decisions made that ensure efficient management and

340
use of IT and who is making the decisions. The Data Management Association (DAMA) sees
data governance as the central knowledge domain connecting all other data management
domains (Anon n.d.), and defines data governance as “the exercise of authority, control, and
shared decision making (planning, monitoring and enforcement) over the management of data
assets”, p. 11, (Ladley 2012) and Ladley’s own definition is “the organization and
implementation of policies, procedures, structure, roles, and responsibilities which outline
and enforce rules of engagement, decision rights, and accountabilities for the effective
management of information assets.” p. 11, Ladley 2012). According to the Data Governance
Institute, a data governance framework outlines decision rights and responsibilities for data-
related processes, and would incorporate the ten aspects outlined in Figure 5 (Thomas 2006).
In this paper, data governance is defined as guiding strategies and principles that define data
at all levels (entry, management, analysis) to maximise business efficiency and effectiveness.
Figure 5. Ten steps in data governance, adapted from the DGI (Thomas, 2006).
4. DISCUSSION
Implementing a business intelligence system in any organisation is a challenge, but public
organisations seem to pose a particular challenge. A possible explanation for many of the
issues encountered might be due to the highly bureaucratic nature and hierarchical processes
in place in public organisations, which define its organisational culture (Parker & Bradley
2000). This makes innovation difficult, and a BI project is very innovative. Ang and Teo
(2000) outlined that many issues they faced at the HDB, another public organisation, were
due to the company culture regarding lack of willingness of data sharing and data protection
practices by individuals.
In order to achieve change in organisational culture, Liebowitz (2006) suggests to match the
approach to the current culture for quick wins, and as people embrace the changes and
individual learning starts, collective learning and transformation should slowly follow. Schein
(2010) argues that ways to change a culture include sub diversity within a company,
introducing outsiders with new assumptions, or implementing new technology, but also adds
that these processes might be slow or not even possible. He further purports that leaders play
a large role in creating an organisation’s culture.
Mission and Vision
Goals, governance metrics, success measures, and
funding strategies
Data rules and definitions
Decision rights Accountabilities
Controls
Data stakeholders
Data governance office
Data stewards
Proactive, reactive, and ongoing data
governance processes
Rules and
Rules of
Engagement
People and
Organisational
Bodies
Processes

341
A further aspect to changing an organisation’s culture is training, and leading by example.
Schraeder et al. (2005) outline a case study in which they show that leading by example and
sustained training brought positive change to a university’s unpopular and low performing
department. Training is a necessary feature of a BI project, but poses challenges due to the
nature of BI systems (BIS), which are long-term and benefits are indirect benefits. User
acceptance of BIS might be therefore be low (Grublješič & Jaklič 2014), but training could
provide a mechanism to increase acceptance and adoption.
5. CONCLUSION
The business intelligence strategy is an ongoing effort within the organisation. The steps
taken so far highlight issues both with the data itself, but also management issues around
data. While it is very early in the process, it became clear that for this housing provider,
dealing with the people aspects of a BI implementation will have to be the main focus. The
next steps should concentrate on establishing a clear framework within which to operate in
terms of responsibilities and data quality assurance, and to start thinking about training and
development of staff in order to make the most use of the BI system, and to increase
acceptance and understanding of the system.
A further aim of this project is to provide a framework that other organisations can use in
their implementation of a business intelligence system. Future work should therefore focus on
the creation of a single framework that links the individual pieces highlighted in this paper.
Lessons learned from other providers, as well as a strong foundation in the academic
literature, are recommended steps as well.
6. REFERENCES
Adam, S. et al., 2015. Social Rent Policy: Choices and Trade-Offs, Available at:
http://www.ifs.org.uk/uploads/publications/comms/R108.pdf.
Ang, J. & Teo, T.S.., 2000. Management issues in data warehousing: insights from the Housing and
Development Board. Decision Support Systems, 29(1), pp.11–20.
Anon, Body of Knowledge | Dama. Available at: https://www.dama.org/content/body-knowledge [Accessed
April 5, 2017].
Anon, 2008. Gartner Reveals Nine Fatal Flaws in Business Intelligence Implementations. Gartner. Available at:
http://www.gartner.com/newsroom/id/774912 [Accessed April 3, 2017].
Arnott, D. & Pervan, G., 2014. A critical analysis of decision support systems research revisited: The rise of
design science. Journal of Information Technology, 29(4), pp.269–293. Available at:
http://dx.doi.org/10.1057/jit.2014.16.
Batini, C. et al., 2009. Methodologies for data quality assessment and improvement. ACM Comput. Surv., 41(3),
pp.1–52. Available at:
http://portal.acm.org/citation.cfm?id=1541883%5Cnhttp://portal.acm.org/ft%5C%5C_gateway.cfm?id=154
1883%5C%5C&type=pdf%5C%5C&coll=GUIDE%5C%5C&dl=GUIDE%5C%5C&CFID=81677606%5C
%5C&CFTOKEN=65528592.
Cheong, L. & Chang, V., 2007. The Need for Data Governance: A Case Study. ACIS 2007 Proceedings,
(March). Available at: http://aisel.aisnet.org/acis2007/100.
Department for Communities and Local Government, Welfare Reform and Work Act 2016 - social rent
reduction - GOV.UK. Available at: https://www.gov.uk/guidance/welfare-reform-and-work-act-2016-
social-rent-reduction [Accessed March 16, 2017].
Grublješič, T. & Jaklič, J., 2014. Three Dimensions of Business Intelligence Systems Use Behavior.
International Journal of Enterprise Information Systems, 10(3), pp.62–76. Available at:
http://www.scopus.com/inward/record.url?eid=2-s2.0-84919418183&partnerID=tZOtx3y1.
HCA, 2015. Governance and Financial Viability Standard

342
Jourdan, Z., Rainer, R. kell. & Marshall, T., 2008. Business intelligence: an analysis of the literature. IEEE
Engineering Management Review, 36(3), pp.29–29. Available at:
http://ieeexplore.ieee.org/document/4648888/ [Accessed March 3, 2017].
Khatri, V. & Brown, C. V., 2010. Designing data governance. Communications of the ACM, 53(1), p.148.
Available at: http://portal.acm.org/citation.cfm?doid=1629175.1629210 [Accessed April 3, 2017].
Ladley, J., 2012. Data governance : how to design, deploy and sustain an effective data governance program,
Morgan Kaufmann.
Leach, M., 2016. The problem with housing and data | HACT. HACT. Available at:
http://www.hact.org.uk/blog/2016/07/11/problem-housing-and-data [Accessed March 3, 2017].
Liebowitz, J., 2006. Strategic intelligence : business intelligence, competitive intelligence, and knowledge
management, Auerbach Publications. Available at:
https://books.google.co.uk/books?hl=en&lr=&id=sCY5TkmLDT0C&oi=fnd&pg=PP1&dq=leadership+in+
business+intelligence+projects&ots=Ijn_VK4h7G&sig=dc92lEmDmMkQk5t-
58HgbVGjV6g#v=onepage&q=leadership in business intelligence projects&f=false [Accessed April 5,
2017].
Marinela, M., 2008. Strategy for Selecting a Business Intelligence Solution. Revista Informatica Economică nr,
1(45), pp.103–109.
Otto, B., 2011. Data governance. Business and Information Systems Engineering, 3(4), pp.241–244.
Parker, R. & Bradley, L., 2000. Organisational culture in the public sector: evidence from six organisations.
Jornal of Public Sector Management, 13(2), pp.125–141.
Pipino, L.L., Lee, Y.W. & Wang, R.Y., 2002. Data quality assessment. Communications of the ACM, 45(4),
p.211. Available at: http://portal.acm.org/citation.cfm?doid=505999.506010.
Redman, T.C., 2012. Data Quality Management Past, Present, and Future: Towards a Management System for
Data. In Handbook of Data Quality. Berlin, Heidelberg: Springer Berlin Heidelberg, pp. 15–40. Available
at: http://link.springer.com/10.1007/978-3-642-36257-6_2 [Accessed April 3, 2017].
Schein, E.H., 2010. Organizational culture and leadership, Jossey-Bass.
Schraeder, M., Tears, R.S. & Jordan, M.H., 2005. Organizational culture in public sector organizations:
Promoting change through training and leading by example. Leadership & Organization Development
Journal, 26(6), pp.492–502.
Skyrius, R. et al., 2016. Factors Driving Business Intelligence Culture. Issues in Informing Science and
Information Technology, 13, pp.171–186.
Strong, D.M., Lee, Y.W. & Wang, R.Y., 1997. Data Quality in Context. Communications of the ACM, 40(5),
pp.103–110.
Thomas, G., 2006. The DGI data governance framework. The Data Governance Institute, Orlando, FL (USA),
p.20. Available at:
http://scholar.google.com/scholar?hl=en&btnG=Search&q=intitle:The+DGI+Data+Governance+Framewor
k#0.
Watson, H.J., Fuller, C. & Ariyachandra, T., 2004. Data warehouse governance: Best practices at Blue Cross
and Blue Shield of North Carolina. Decision Support Systems, 38(3), pp.435–450.
Watson, H.J., Goodhue, D.L. & Wixom, B.H., 2002. The benefits of data warehousing: Why some organizations
realize exceptional payoffs. Information and Management, 39(6), pp.491–502.
Weber, K., Otto, B. & Osterle, H., 2009. One Size Does Not Fit All — A Contingency Approach to Data
Governance. ACM Journal of Data and Information Quality, 1(1), p.4:1-4:27. Available at:
http://dl.acm.org/citation.cfm?id=1515696.
Wende, K., 2007. A model for data governance–Organising accountabilities for data quality management. 18th
Australasian Conference on Information Systems, pp.417–425. Available at:
http://www.alexandria.unisg.ch/export/DL/Kristin_Wende/204799.pdf.
Yeoh, W. & Koronios, A., 2010. Business Intelligence Systems University of South Australia. Journal of
computer information systems, 50(3), pp.23–32.
Yeoh, W. & Popovič, A., 2016. Extending the Understanding of Critical Success Factors for Implementing
Business Intelligence Systems. Journal of the Association for Information Science and Technology, 67(1),
pp.134–147.
Yoon, T.E., Ghosh, B. & Jeong, B.K., 2014. User acceptance of business intelligence (BI) application:
Technology, individual difference, social influence, and situational constraints. In Proceedings of the
Annual Hawaii International Conference on System Sciences. pp. 3758–3766.

343
ID 051
A THEORETICAL MODEL FOR BUILT ENVIRONMENT
PRACTITIONER RESEARCH AT DOCTORAL LEVEL
J. Balogun and A. Higham
School of the Built Environment, University of Salford, Salford, M5 4WT, UK
Email: [email protected]
Abstract: The delivery and achievement of practice-based doctorates, particularly in built
environment, are seen as problematic due to the differences in process between practice-based
doctorates and academic doctorates. Underlying this assumption may be the reconciliation of
tacit knowing with explicit externalisation of knowledge and the concern about the rigour of
the process for the acceptability of knowledge from practice-based doctorates as valid
knowledge. Using a combination of theory and literature, a conceptual model for the execution
of a practice-based doctoral qualification is proposed. The aim of this paper is to conceptualise
a model to harmonise all strategic components of a practice doctoral process towards
demonstrating the rigour and robustness of the process and the validity of knowledge created
using the platform of the DBEnv. This paper argues that although the process of practice-
based doctorates such as the DBEnv is different from that of the PhD, it is as rigorous.
Knowledge generated therein, having fulfilled the requirements of the Framework for Higher
Education Qualifications, do qualify as valid knowledge. Consequently a new conceptual
framework is proposed which may assist the practice-based doctoral researcher through the
research process.
Keywords: Conceptual Framework, Explicit Knowledge, Professional Doctorate, Practice-
Based Research, Tacit Knowledge, DBEnv.
1. INTRODUCTION
The concept of practitioner research has opened a fracture in academe between academic
purists and applied scholars, with the former seeing such research as different from the
robustly theoretical doctoral research. However, academics such as Gray (1996) have been
unequivocal in their defence of practice led research. In her seminal work on inquiry through
practice, Gray (1996:3) defines practice-led research as, “research which is initiated in
practice, where questions, problems, challenges are identified and formed by the needs of
practice and practitioners”. Although her perspective is grounded in the arts and offered
through the lens of an art practitioner, she nevertheless robustly argues that the research
strategy and methodology adopted for any research should be those, which are familiar to
practitioners and thus grounded in their practice. On the same note, writers like Winter et al
(2000) see practice-based doctorates as problematic due to the seeming differences between
its process and that of academic doctorates, which are often seen by the custodians of the
academe as the route that grants membership to the fabled ‘club’.
The academe has developed its research ethos over centuries wherein research is defined as
“a systematic enquiry whose goal is communicable knowledge” (Archer, 1995:6). The
seeming problem in the definition, for it to fit practice-based research, appears to be the need
for it to be seen as an enquiry and consequently a research. Archer (1995) posits that while
the act of a practice may be seen as a goal directed to providing communicable knowledge, it
needs to be about an enquiry and must follow an agreed systematic procedure for it to be

344
classified as research. In the words of Archer (1995:11), “all studies about practice, if they
are to be recognised as research studies, must employ the methods, and accord with the
principles, of the class to which they happen to belong”.
In a way, there seems to be a synergy between the views of Gray (1996) and those offered by
Archer (1995). However, researchers in practice, unlike those in the academe, are left with
inadequate support in the form of process frameworks to guide practice research process even
though Nelson (2013:48) suggests “it is no longer tenable to take the methodologies of the
sciences as the gold standard of knowledge, instead we find ourselves in a situation in which
different approaches to knowing have different criteria for what is to count as true or valid”.
It was therefore resolved as part of this work to propose a framework for practice-based
research in the built environment through a review of existing models, theories and concepts
and viewed from the lens of a practitioner-researcher at the doctoral level. Support for this
endeavour is found in the work of Winter et al (2000) who demonstrate such application in a
research setting and Mills (1959:196) who opines that, “you must learn to use your life
experiences in your intellectual work: continually to examine and interpret it”. A way to use
ones life experiences may be by reporting it directly from the horse’s mouth but Mann (2014)
advises on the need to be provisional by anchoring ones position with the views of others
because research is always “an act in progress”.
Nelson (2013:53) of course argues that language “is not a neutral medium but a structuring
agent in the perception of reality”. In consideration of Nelson’s (2013) position, perhaps it
may be better, even at the risk of a fierce frown from academic researchers, to infer that
reporting in the first person is likely to reduce the layers of interpretation and therefore
blesses the prying eyes of the practitioner-researcher with the gift of experiencing reality
directly. Bakan (1969) cited in Mann (2014) infers that any gap between phenomenon and
data, which requires interpretation, is susceptible to error. Hence, by closing the gap between
phenomenon and data, practice-based researchers are reducing errors in research. Using the
first person, Mann (2014) offers that the practitioner is the instrument and that “the measure
of the world and the position taken on it cannot be truer than the instrument”. However, due
to the disjointedness of research in the real world, Mann (2014) equally advises being
provisional by “waxing slow of wit” and by “raising the impact of your message, by lowering
the volume of your voice”. This approach will enable a practitioner-researcher to develop the
capacity to reconcile contradictions, as there will be many of such along the research process.
2. LITERATURE REVIEW
2.1 Knowledge Generation in Practice
Research philosophy encapsulates the way a researcher views the world. It therefore
predicates on what reality is, otherwise referred to as ontology; how to acquire the knowledge
of reality, otherwise referred to as epistemology and how distanced the researcher is from the
views expressed in the research, otherwise referred to as axiology (Sanders et al., 2007; Miles
and Huberman, 1994). While Lennon and Whitford (1994:2) opine that, “genuine knowledge
does not reflect the subject who produced it”, Winter et al. (2000: 28) counter by espousing
that, “a claim to practice-based knowledge is an obvious example of a claim to knowledge
which is context-bound, and in which the subjectivity of the producer of the knowledge
cannot be eliminated”. The latter appears to be the intention of Mann (2014) when he refers

345
to the practitioner-researcher as the instrument that measures phenomenon and that the results
cannot be better than the instrument.
The challenges of practice-based research in the opinion of San Miguel and Nelson (2007)
are the difficulties of using theory to contextualise phenomenon, framing the practice
problem as a research problem and incorporating the researcher’s professional knowledge.
Mann (2014) subsequently classifies those challenges into the problems of engaging the
research in ones own voice; doing the research within the academe and dealing with the
plurality of the social nature of research. After all, the academic research process hardly
recognises the researcher’s voice but in practice, a professional does have a voice surely. A
voice that is reinforced by their tacit knowledge of their discipline gathered from years of
practice and often validated by their professional standing and qualifications. A perspective
that has been uniformly accepted in English Law through the operation of expert witness
testimony. There is therefore the challenge of trying to sound authentic by being quietly self-
evident (Mann, 2014). Secondly, research requires academic legitimacy. And like Mann
(2014) posits, research is like a football game with rules. To play football, you have to play
by the rules.
Practitioner researchers therefore need to convince the academe “how they know what they
know” (Mann, 2014). Finally, practice-based doctorate needs to harmonise issues in the form
of an extended essay by noting the differences and similarities between one thing and the
other. It has to be explicit in the criteria that inform its choices. Why this and not that? Why
interviewing A and not B? Decision parameters must be clear and explicit. Therefore, the
practitioner-researcher’s ultimate challenge is therefore how to bring out the tacit knowledge
and make it explicit in what Mann (1998:viii) calls “externalize tacit knowing”. Various
models like the experiential learning model (Kolb, 1976; Nonaka and Takeuchi, 2005) are
available as frameworks to bring out tacit knowledge.
2.2 Framework for Higher Education Qualifications
Externalising the tacit knowing appears to be a major way through which what is known
could be subjected to the peer review mechanism and subsequently admitted as knowledge
within or into the academe. In research at doctoral level, such knowledge needs to be
appraised using the generic qualification and level descriptors identified in the Framework
for Higher Education Qualifications in England, Wales and Northern Ireland (QAA, 2008)
in the sub-section of the guidance entitled Key Requirements for Level 8 Awards. This
guidance advises that doctoral degrees are awarded to those candidates who have satisfied the
four basic requirements of the Framework for Higher Education Qualifications at level 8.
In the first requirement, a candidate must demonstrate having undergone training resulting in
a systematic acquisition and understanding of existing knowledge within a specific discipline
or practice. The understanding of what constitutes an academic discipline here is considered
within the context of the arguments of Jantsch (1972), Biglan (1973) and Chynoweth (2009)
to the effect that the built environment, due to the heterogeneous nature of its structure, could
not be referred to as an academic discipline but an academic interdisciplinary with Design,
Technology, Management, Law and, Economics as the key knowledge areas. It therefore
means that to fulfil the first requirement for the award of a Doctorate in Built Environment
(DBEnv), the candidate might have systematically acquired and understood the body of

346
knowledge in those five knowledge areas as it relates to the built environment. The entry
qualification and the taught element of the doctorate in built environment appear to meet this.
For the second requirement for the award of a doctorate of the built environment, the
candidate must demonstrate attainment of a detailed understanding of the research methods
and techniques applicable in the built environment interdisciplinary. There are a plethora of
research methods and techniques within the built environment interdisciplinary but they
could be broadly classified into: quantitative, qualitative and mixed methods. Dainty (2008:8)
states the dangers of relying exclusively on research approaches that are based on a single
paradigm and then argues for “methodological pluralism”. However, Fellows (2010:11)
argues that the future has ample accommodation for “stochastic perspectives” and the
consideration of complexity in future methods. This requirement appears to be met by the
taught element of the doctorate in built environment.
The third requirement for the award of a doctorate in built environment relates to the
candidate’s ability to conceptualise, design and implement a research project for the
generation of new knowledge and the ability to change such research concept and design as
situation demands. The cognitive requirements of being able to conceptualise a research is
very critical. Research is becoming a very elitist word because it conveys the use of
considered and thoughtful intelligence in the recognition and analysis of problems and
seeking ways of engaging phenomena (Drake & Heath, 2011) and consequently creating new
knowledge or advancing existing ones. Doing this requires a whole lot of hard toolkits (Lee,
2009) and most importantly the soft skills of personal management, project management,
time management, commitment and inquisitiveness. Both the taught element and the process
of the doctorate in built environment appear to meet this requirement.
The final requirement for the award of a doctorate in built environment according to QAA
(2008) is “the creation of new knowledge or the advancement of existing knowledge through
original research or advanced scholarship of a quality that has met peer review standard and
that merits publication”. In summary, QAA (2008) sees the creation of new knowledge as the
end of the process and also as a product of the process. However Drake & Heath (2011)
propose a radical view of the creation of new knowledge and opine that research does engage
with new knowledge at every stage from initial conceptualisation of the problem, through the
research design phase and to the final implementation phase of the research. This means that
new knowledge therefore is part of the process at every point in time. Similarly, in their
seminal text, Phillips and Pugh (2010) extended the work of Francis (1976) to identify fifteen
potential ways for a doctoral student to make a valid contribution to knowledge that is worthy
of a doctorate. However, neither Philips and Pugh (2010) nor Drake & Heath (2011) indicate
whether the new knowledge created at every stage of the process could merit publication or
not. There lies the catch as it could be argued that the new knowledge proposed by QAA
should be quantified or validated through the peer review mechanism and through publication
or more realistically determined by the examiners during the viva voce.
2.3 The Concept of Psychological Contract
Working on the problems of recruitment, Kotter (1973) proposes a solution through the
concept of psychological contract, which seeks to harmonise the implicit understanding of the
expectations of both parties. This ensures that the implicit expectations of the employee are in
line with that of the employer. Kotter (1973:92) defines a psychological contract as, “an

347
implicit contract between an individual and his organisation which specifies what each
expects to give and receive from each other in their relationship”. This concept can be
borrowed from human resource management for application in the understanding of the
implicit relationship between the university and the doctoral researcher.
There is an existing formal contract, learning agreement, between the university and the
research candidate; but more than the formal contract, the understanding of the
informal/implicit contract by the candidate and the university could be more critical in
determining the success of that relationship or the successful execution of a research and the
award of a doctorate. This understanding relies significantly on harmonising the deep-seated
implicit or hidden assumptions of one party with the other. Central to the concept of
psychological contract is the matching process (Kotter, 1973), which enables a compromise
to be reached between these two and sometimes opposing implicit assumptions of both
parties. These assumptions from both parties would need to be matched so that a compromise
could be reached in conflicting areas.
2.4 Expectancy Theory
Vroom (1964) proposes the expectancy theory, which submits that the behaviour of an
individual on an issue is not based on clear objective reality but on the individual’s
perception of reality. This perception of reality is formed from the context, worldview and
expectations of individuals according to Balogun (2001). Therefore, the expectancy theory
submits to the socio-constructivist school of thought that reality is socially constructed. In a
way, it appears that the expectancy theory complements the concept of psychological
contracts in determining what informs the decision and action of individuals when faced with
a situation of bargaining with other parties in which implicit expectation can significantly
influence the outcome.
From the context of the practice-based research candidates, these expectations have to be
properly managed in a way that can make the implicit assumption to be explicit and open for
discussion and negotiation. In addition to the submission in psychological contracts to the
extent that the process should be managed through purposeful discussion between the
candidate and the supervisor, the use of experiential learning model (Kolb, 1976; Mann,
1998) appears to have the capability of adequately managing the process.
2.5 Experiential Learning Model
Kolb (1984) offers the experiential learning model that could help managers and practitioners
learn and generate valid knowledge in practice as shown in Figure 1. A key feature of the
experiential learning model is reflection, which is the art of looking back at a previous
occurrence, drawing up inferences and bringing such inferences to bear on a present situation
or scenario in an iterative manner. The cardinal points of the experiential learning model are:
concrete experience, reflective observation, abstract conceptualisation and active
experimentation. From concrete experience of phenomenon, necessary data are collected
through reflective observation. These data are subsequently reinforced with abstract and
existing concepts and theories before finally embedding change in active experimentation.
Adapting the experiential learning model of Kolb (1984), Mann (2011) demonstrates that the
reflective practitioner oscillates between the two realms of professional practice and

348
academic practice in an iterative way (see Figure 2) of trying to make explicit the tacit
knowledge of practice. This is applied as the core of the proposed theoretical model. Hence,
just like the academic researcher, the practitioner researcher utilises theory in its research but
unlike the academic researcher that starts with theory, practice based researcher starts with a
problem in practice but utilises theory in shaping the problem and in collecting data on the
phenomenon.
Figure 1: Experiential Learning Model (Kolb, 1984)
Figure 2: Reflection and the Practitioner Researcher (Mann, 2011, Nonaka & Takeuchi,
2005)
2.6 Summary
The professional doctorate process is essentially the management of relationships between
the candidate and the university partly as explicitly expressed in the learning agreement but
more importantly as latently expressed in the form of implicit assumptions and expectations
TACIT DIRECTLY
IMMERSION
(1) PUSH
PAUSE
BUY IN
IMPLEMENTATION
COACHING
MENTORING
(4)
REFLECTION
ASSESSING
FEEDBACK
(2)
MONITORING
ABSTRACT
SYNTHESIS MEANING
CONNECTIONS
(3)
EXPLICIT

349
of both parties. For the success of the process, there may be need to use time-tested concept
of psychological contract (Kotter, 1973) combined with the expectancy theory (Vroom, 1964)
to harmonise these expectations and manage them. Literature has shown that knowledge
generated in practice is context-bound (Winter et al., 2000; Gray, 1996) and better expressed
by the insider, the practitioner, through processes that he/she is familiar with (Gray, 1996;
Mills, 1959). Since the practitioner is the instrument, the measure of the phenomenon and the
knowledge it provides cannot be truer than the instrument (Mann, 2014). However, practice-
based knowledge suffers from the problem of explicit externalisation (Mann, 2014) to make it
acceptable to the academe through the fulfilment of the requirements of the Framework for
Higher Education Qualifications (QAA, 2008) and that of viva voce. Using the experiential
learning model (Kolb, 1984; Mann, 2011) appears to have the capacity of providing the
rigorous process that the practitioner requires in externalising tacit knowledge (Polanyi,
1966).
3. RESEARCH METHODOLOGY
This is a concept paper developed to propose a framework for practice-based research in the
built environment. It therefore reviews relevant literature, concepts and models and
synthesises these with the intention of trying to resolve, through a model, the key problems of
practice-based research viz., harmonising implicit assumptions and expectations,
externalising tacit knowledge and achieving rigour in the research process.
However, should this research be taken further in the future to test and validate the model, it
would surely benefit from a methodology that is familiar with the practice process like auto-
ethnography (Wall, 2006) to be carried out by a researcher who has experienced the
professional doctoral process. Auto-ethnography is about telling one’s story in one’s own
voice and Wall (2006:9) recognises “the voice of the insider being truer than that of the
outsider”. Auto-ethnography which tells personal stories and relate it to the cultural is
founded on postmodern ideas and “exposes the flaws in our traditional reliance on neutrality
and objectivity…. we cannot separate ourselves from what we do” (Wall, 2006:9).
4. MODEL DEVELOPMENT
4.1 Emergence of the Framework
The conceptual framework to guide practice-based research in the built environment could be
seen as eclectic; combining ideas from a plethora of disciplines with individual paradigms,
approaches and methods but with a unified or collective focus towards a common goal of
understanding and responding to the phenomenon. The different concepts or theories
advanced hitherto provide the building blocks for the theoretical model for practitioner
doctoral research in the built environment while the production of knowledge from practice
that is acceptable to the academy must consider the key parameters espoused. Such
knowledge must come through an established epistemological foundation of whether
knowledge is external to the researcher or if the researcher has a role to play in its creation
(Knight and Turnbull, 2008).
The framework in this paper assumes the research philosophy of idealism, interpretivism and
value-laden. Nevertheless, meeting the four basic requirements of the Framework for Higher
Education Qualifications at level 8 is required as the objective consideration opined by Mann

350
(2014) to the effect that when one is on academic turf, academic rules must be obeyed for
research to achieve legitimacy. However, objective requirements alone may not ensure a
successful research, as tacit knowing may be more critical to success particularly within the
knowledge base that is predominantly soft and applied, within the purview of the expectancy
model and the context of the opinion of Polanyi (1966) to the effect that we actually know
much more than we can express.
The process of doctoral research in the built environment is simply the management of
expectations towards successful outcomes. Expectations can be explicit or implicit (Kotter,
1973; Armstrong, 2006). How the individual behaves therefore depends on what the
individual expects from reality (Vroom, 1964). Since expectation is mostly tacit and hidden
within the subconscious, it could therefore pose great challenge to externalise and understand
it (Mann, 1998). The relationship between the university and the doctoral student is also a
contractual one with two types of contractual arrangements. There is the formal written
contract as detailed in the learning agreement and the university code of practice for research
degrees (University of Salford, 2015) and there is the unwritten psychological contract, which
resides in the minds of both parties (Kotter, 1973; Armstrong, 2006).
The framework therefore emerges from the need to use literature to harmonise the implicit
assumptions and expectations of both the doctoral candidate and the university so that they
can be on the same pedestal. Literature provides for this through the concept of psychological
contract (Kotter, 1973) and expectancy theory (Vroom, 1964). Secondly and based on the
research philosophy of idealism, interpretivism and value-laden, it is necessary to develop a
system that can externalise the tacit knowledge from practice. Literature equally provides for
this through experiential learning model (Kolb, 1984; Mann, 2011).
4.2 The 5-Level Conceptual Framework
As shown in Figure 3, both the learning agreement and the implicit assumptions produce
expectations for both parties as shown at Level 1 of the model. Level 1 is therefore based on
the identification of all the expectations and sending them for rationalisation and
harmonisation in the matching process unit. Most of the discussions here are done between
the candidate and the supervisor who represents the university. It is therefore important for
the candidate to be comfortable with the supervisor particularly in relation to the area of
research interest of the supervisor and the availability of the supervisor to give appropriate
guidance and direction when needed.
Level 2 of the model is about problem engagement and the support system that is available to
the professional doctoral candidate. The experiential learning model (Kolb, 1984; Mann,
1998; Nonaka & Takeuchi, 2005) has been used here as the framework for engaging with the
problem and obtaining meaning which provide learning and knowledge because the research
in context is a practitioner research. In engaging the problem, the candidate must first
understand the phenomenon by establishing the main focus and consequently try to step
outside the problem in order to have an objective reflection of it. This is the movement from
the tacit to the explicit environment of problem resolution. A robust problem resolution or
practitioner research methodology involves the continuous movements between the tacit and
explicit environments in an iterative way of combining tacit knowledge base with the explicit
framework of objective reality (Mann, 1998 & 2011).

351
Data of the phenomenon could be generated from personal experience through reflection or
the experiences of other people though interviews. This stage should be closely linked with
appropriate theories to reinforce abstract connections with the data and the problem in
context. The conversion between the data collection stage and the conceptual framework
stage is referred to by Nonaka & Takeuchi (2005) as explicit to explicit conversion. Having
collected the relevant data and considered the relevant connections or concepts and axiomatic
within the explicit environment, the application of the results of the analysis is achieved by
moving into the tacit environment again in a repetitive cycle. The key component at this level
is the iterative movement between the familiar domain of practice and the alien terrain of
academia (Mann, 2011). The result of the iterative process is then sent into the central
matching process. However, during the period of problem engagement, the candidate is
availed with the university support system including among others, supervision, communities
of practice (cohort, etc.), library, workshop and conferences. There is need for constant
interaction between the support system and the experiential learning model to ensure
efficiency and effectiveness. In fact, the operations of the experiential learning model are
shaped by the quality of the support system that is provided. These processes are not
sequential or linear but iterative.
Level 3 is the matching process or the central processing unit that takes expectations from the
parties, results from the problem engagement, and results from the support system. Added to
these are policies, procedures, agreements, payment systems, academic culture, assignments,
research proposal, interim assessment, internal evaluation and viva voce. They are all
matched together to produce outcomes. During the matching process, some items are sent
back either to problem engagement or support system for refinement or further processing.
Although the matching process is shown as a single item at Level 3, there are however mini
matching processes on-going at Levels 1 and 2 and these mini cycles help to refine most of
the decisions that finally feed into the big matching process at Level 3. At Level 4, outcomes
have emerged from the process. This is the time for stocktaking where parties compare the
outcomes with their initial expectations. Of course some planned expectations may not be
realized while some unplanned expectations may be realized depending on the matching
process. Finally at Level 5, the DBEnv is awarded. It should be noted however that this
model could be applied to any professional or practice-based doctorate.
5. CONCLUSION
Through established literature, theories and concepts, a theoretical model is proposed. This
conceptual paper argues that although the methodology of practice-based doctorates like
DBEnv is different from the PhD, it is as rigorous. Knowledge generated in practice-based
research, having fulfilled the requirements of the Framework for Higher Education
Qualifications, do qualify as valid knowledge. This theoretical model could therefore assist
the practice-based researchers in their research engagements. This has been demonstrated
through the instrumentality of the academy - the doctoral process. With this model, it is more
likely that the perception chasm between the two sides of the divide would be significantly
resolved. All research uses language to express its process and the research outcome.
However, since language is now seen not as a neutral and objective medium of expression in
the perception of reality, the claim of objectivity in academic research process may not be
absolute after all. This model may enable academic researchers to show more understanding
and consideration in their objections to the contextual subjectivity of practice-based research.
Those in academia are more likely to be convinced not only of the rigour and robustness of

352
the processes of practice-based research, but of the validity of knowledge generated from
practice. However, it is now very clear that in order to be classified as research, knowledge in
practice may have to be about a systematic enquiry such as that which the proposed model in
this paper offers.
Figure 3: A 5–Level Theoretical Model for Practitioner Doctoral Research In Built
Environment After (Vroom, 1964; Kotter, 1973; Armstrong, 2006; Kolb, 1984; Mann, 1998
& 2011; & Nonaka & Takeuchi, 2005)
University Expectations
Produce more
Doctorates
Get more research
fund.
Be recognized
worldwide
Tuition for salaries
Doctoral Student Expectations
Get a Doctorate
Produce breakthrough
Research
Be noticed worldwide
Prove that I can do it
Supervised by the best in
the field
Publish in peer reviewed
journals
Matching Process
Policies
Standards
Procedures
Agreements
Payment Systems
Academic Culture
Assignments
Research Proposal
Interim Assessment
Internal Evaluation
University
Outcomes
Doctoral Student
Outcomes
Doctorate in Built
Environment Awarded
1
4 2
3
D
.
B
.
A
.
C
.
KEY FOR LEVEL 2
A. Phenomenon
B. Collecting Data
C. Develop Concepts
and axiomatics
D. Application
1. Supervision
2. Communities of
Practice (cohort etc)
3. Library
4. Workshops and
Conferences
Level 1.
Level
2.
Level 3.
Level 4.
Level 5.

353
The proposed model is further likely to improve the perception by the academy, of
professional doctorates and academic PhDs as equal in status even though different in
contexts. Those in practice are likely to be buoyed and encouraged in conducting more
research at the workplace thereby improving industrial processes and industrial products.
With the funding from industry, it is not unlikely that increasing joint platforms for
collaborations on future research engagements between practice-based and academic
researchers would be developed. Since it is now established that practitioners know more
than they could express, industries may consequently step up funding for practice-led
research and there seems to be no current signs that this lifeline to practice-based research
funding may wane in the future. However, further research is necessary to test this model
through the whole professional doctorate process using auto-ethnography.
6. REFERENCES
Archer, B. (1995). The Nature of Research. Co-design Interdisciplinary Journal of Design. January 1995, pp. 6-
13
Armstrong, M. (2006). A handbook of Human Resource Management Practice (10th Ed.). London: Kogan Page
Ltd
Bakan, D. (1969). On Method: Towards a Reconstruction of Psychological Investigation. San Francisco: Jossey-
Bass Publisher
Balogun, J. O. (2001). Competitive Procurement Strategy under a Partnering Culture. An unpublished MBA
Dissertation, Department of Construction Management and Engineering, University of Reading, England.
Biglan, A. (1973). The Characteristics of Subject Matters in Different Academic Areas. Journal of Applied
Psychology. Vol. 57, No 3, pp. 195-203.
Chynoweth, P. (2009). The Built Environment Interdiscipline: A theoretical Model for Decision Makers in
Research and Teaching. Structural Survey. Vol. 27, Issue 4, pp. 301-310
Dainty, A. (2008). Methodological Pluralism in Construction Management Research. In: A. Knight & L.
Ruddock (Eds.), Advanced Research Methods in the Built Environment. (pp. 1-13). Chichester: John Wiley.
Drake, P. & Heath, L. (2011). Practitioner Research at Doctoral Level: Developing Coherent Research
Methodologies. London: Routledge.
Fellows, R. (2010). Editorial – New Research Paradigms in the Built Environment. Construction Inovation. Vol.
10, No. 1, pp. 5-13.
Francis, J. R. D. (1976). Supervision and examination of higher degree students. Bulletin of the University of
London. Vol. 31, pp. 3-6
Gray, C. (1996). Inquiry Through Practice: Developing Appropriate Research Strategies. Retrieved 22
September 2014 from http://carolegray.net/Papers%20PDFs/ngnm.pdf
Jantsch, E. (1972) Towards Interdisciplinarity and Transdisciplinarity in Education and Innovation. In: Apostel,
L., Berger, G., Briggs, A. & Michaud, G. (Eds.) Interdisciplinarity: Problems of Teaching and Research in
Universities, 7-12 September 1970, University of Nice. Centre for Research and Innovation, OECD, pp. 97-
121.
Knight, A. & Turnbull, N. (2008). Epistemology. In A. Knight & L. Ruddock (Eds.), Advanced Research
Methods in the Built Environment. (pp.64-73). Chichester: John Wiley.
Kolb, D. (1976). Management and the Learning Process. California Management Review, Vol. 18, No. 3, pp.
21-31.
Kolb, D. (1984). Experiential Learning as the Science of Learning and Development. Englewood Cliffs, NJ:
Prentice Hall.
Kotter, J. (1973). The Psychological Contract: Managing the Joining-Up Process. California Management
Review, Vol 15, No 3, pp. 90-99.
Lee, N. (2009). Achieving your Professional Doctorate. Maidenhead: Open University Press
Lennon, K. and Whitford, M. (Eds) (1994). Knowing the difference: Feminist perspective in epistemology.
London: Routledge.
Mann, P. (1998). Trust to your Tacit Knowledge. Times Higher Education Supplement Research, Vol. 7.
Mann, P. (2011). Reflection and the Practitioner Researcher. Professional doctorate workshop, School of Built
Environment, University of Salford, UK.
Mann, P. (2014). Professional doctorate keynote address. Retrieved 16 March 2017 from
https://www.youtube.com/watch?v=OOXIbhc_vT4

354
Miles, M. B. and Huberman, A. M. (1994). Qualitative Data Analysis: An expanded sourcebook (2nd edition).
Thousand Oaks: SAGE Publications Inc.
Mills, C. W. (1959). On Intellectual Craftsmanship, Appendix to the Sociological Imagination. Oxford: Oxford
University Press. Retrieved 22 September 2013 from
http://archivingthecity.files.wordpress.com/2011/01/mills_on_intellctual_craftmanship.pdf
Nelson, R. (2013). Practice as Research in the Arts. Basingstoke: Palgrave Macmillan
Nonaka, I. & Takeuchi, H. (2005). The Knowledge Creating Company. New York: OUP.
Philips, E and Pugh, D.S. (2010) How to get a PhD. A handbook for students and their supervisors. Berkshire:
McGraw Hill and Open University Press.
Polanyi, M. (1966). The Tacit Dimension, Reprinted, Gloucester, Mass: Peter Smith.
QAA (2008). The framework for higher education qualifications in England, Wales and Northern Island,
August 2008, Quality Assurance Agency for Higher Education, pp. 23-24.
Saunders, M., Lewis, P. and Thornhill, A. (2007). Research Methods for Business Students, 5th ed., Essex:
Pearson Education Limited
San Miguel, C. and Nelson, C. D. (2007). Key writing challenges of practice-based doctorates. Journal of
English for Academic Purposes. Vol. 6, pp. 71-86.
University of Salford. (2015). Code of Practice for the conduct of postgraduate research degree programmes
(2014-2015)
Vroom, V. H. (1964). Work and Motivation. New York: Wiley
Wall, S. (2006). An Autoethnograpy on Learning about Autoethnography. International Journal of Qualitative
Methods. Vol. 5, Issue 2, pp. 1-12.
Winter, R., Griffiths, M and Green, K. (2000). The Academic Qualities of Practice: What are the Criteria for
Practice-Based PhDs? Studies in Higher Education. Vol. 25, Issue 1, pp. 25-37.

355
ID 083
ENHANCING NURSE LEADERSHIP THROUGH RESEARCH,
EDUCATION AND TRAINING
T. Adunola, A. Marshal-Ponting and A. Fleming
School of the Built Environment, University of Salford, Salford, M5 4WT, UK
Email: [email protected]
Abstract: This paper aims to highlight the need for research, education and training as a
means of enhancing nurse leadership. Nursing, just as many other aspects of the National
Health Services (NHS) in United Kingdom (UK), has been in the public eyes in the recent
times. The public image of nursing is always under scrutiny, because nursing can be perceived
as ‘the face’ of the health system.
This article traces a brief history of nursing and nursing leadership in order to gain an insight
into how research, training and education had helped nursing and its leadership in the past and
highlight the role that research, training and education can play in shaping the immediate
future and beyond, of nursing and its leadership, in UK.
This paper argues for a unified training route for all nurses in UK. It also contends that degree
education is most helpful in preparing the twenty first century nurses for the medical and
technological advancements. This article argues for the upgrading of nursing education as a
means of boosting its professional image as well as enhancing its research capabilities. The
second point addressed in this article is the public image of nursing-which, in a way, is
exogenous; as, this stems from inadequate hospital resources which has led to high burn-out
among nurses in the UK and, which consequently is affecting the quality of care given by the
nurses and midwives in UK. This is a serious factor that is also affecting public perception of
nursing. The methodology adopted in this report is a review of relevant literature.
Keywords: Education, Leadership, Nursing, Research, Training.
1. A BRIEF HISTORY OF NURSING IN UK
Nursing, in UK, started a long time ago (Kozier et al, 2008). Prior to the Crimea war with
Russia in 1854, there was no formal school of nursing established in UK. Although there
were the sisterhoods- such as The Church of England’s St John’s House sisterhood; and, the
All Saints’ sisterhood.. These sisterhoods trained the probationers (nurses in training) (Black,
2005). Florence Nightingale was a British woman who trained as a nurse in Germany. Upon
her return to the UK, she established the first formal School of Nursing at St Thomas’
Hospital in London in 1860 (Dingwall et al, 1991, Baly, 1986), specifically to train nurses.
Prior to that time, many people performed similar and different roles, who were referred to as
nurses, in hospitals and health care services centres. Most of them had little or no training,
compared to a modern day nurse (Dingwall et al, 1991). ). Many people (especially women)
performed many ‘nursing’ duties in different establishments. Many had learned to do their
work through experience, thus training, experience and standards differed widely (Dingwall
et al, 1991). In the middle ages, when voluntary hospitals such as St Batholomew’s (1123)
and St Thomas hospitals (1207) were founded, they were mainly run by monks and nuns
(Helmstadter & Godden, 2011), hence, the name ‘Sister’ for a senior female nurse is still used
today.

356
The important role played by Florence Nightingale during the Crimea war, especially, in
reducing mortality rate among the wounded soldiers by fifty percent (although that claim is
challenged by some critics, see especially Dingwall et al, 1991), highlighted the valuable
contribution that nurses can make to the lives of the soldiers and the war effort (Baly, 1986).
The struggle for a national registration for nurses took a long time (Thomas & Richardson,
2016)-having started in 1858 after the doctors had gained registration and lasted until 1919
when the bill was passed (Thomas & Richardson, 2016; Abel-Smith, 1960. By 1858, after the
medical profession had gained registration status, opinions were being voiced by others for a
similar status for nursing. Prominent among the voices was the Nursing Record (later
renamed British Journal of Nursing). However, the nursing organisation was plagued by
internal disagreement. The Matrons Committee was in favour of registration, but disagreed
on the length of training. The Hospitals Association over-ruled the Matrons Committee and
established a non-statutory voluntary register of nurses in 1887. This led to a division among
the Matrons Committee. Surprisingly, Florence Nightingale was neutral, because she was
opposed to any form of registration. Ethel Gordon Fenwick and her group continued to argue
for registration of nurses, their effort led to the formation of British Nursing Association in
1887 (Thomas & Richardson, 2016).
However, the British parliament did not take any action about the registration of nurses until
1919. Public opinion was changing in favour of nurses registration, especially because of the
great contributions nurses had been making towards war efforts (Abel-Smith, 1960); coupled
with the influence of Princess Helena and Queen Alexandra, who became presidents of
military nurses association. A private members bill raised by a backbencher, Major Richard
Barnett, was passed in December 1919. The bill was for the establishment of a regulatory
body for nurses as well as registration for nurses in England/Wales; Scotland and Northern
Ireland (Abel-Smith, 1960).
Ethel Gordon Fenwick (often referred to professionally as Mrs Bedford Fenwick) was the
first nurse to be registered in the UK, in 1923. Although, New Zealand had begun registration
of nurses in 1902, and so, Ellen Dougherty of New Zealand was the first nurse to be
registered in the whole world.
Worthy of note are the roles played by some other people such as Princess Helena (the
daughter of Queen Victoria), and her sister-in-law, Princess Alexandra who became the
Queen after the death of Queen Victoria in1901. Helena had a very strong interest in nursing
and she became president of the British Nursing Association, the position which was later
occupied by the new Queen Alexandra. Helena was a strong supporter of nursing (Dingwall,
1991).
Before discussing nurse leadership, it is necessary to briefly describe or define leadership.
Defining leadership is not a very easy task. However, literature is full of many definitions,
that Bass (1990, p11) said ‘There are almost as many different definitions of leadership as
there are persons who have attempted to define the concept’. But, simply put leadership
exists where there is someone or group of people who are leading one or a group of persons.
In other words, there must be a leader and at least a follower (Bass. 1990).
Leadership is very similar in many organizations, including the NHS. The NHS recognizes
the importance of leadership and has taken some bold steps in its leadership development
initiative. In 2010, it launched Leadership Council and at local levels Strategic Health
Authorities, in order to meet the challenges it faces as a result of economic constraints and
increasing demands (Storey, 2010).

357
2. NURSE LEADERSHIP PRE NINETEENTH CENTURY ERA
Nursing training was carried out by each institution according to their own needs. Prior to the
establishment of the school of nursing by Florence Nightingale in 1860, there was nursing
training provided especially by the voluntary organizations such as St Batholomew’s which
was run by monks and nuns and other groups such as the sisterhoods.
To fully understand the social history of nursing in the UK (a fuller account of which can be
found in Dingwall et al, 1991, Abel-Smith, 1960), it is important to understand that the
British aristocratic and class system, is directly intertwined with nursing leadership in the
UK. It is not expedient to delve into such details here. However, it will suffice to mention that
prior to the nineteenth century, sisters were people of nobler birth or class whereas, nurses
were people of lower classes (Black, 2005; Dingwall et al, 1991). The sisters trained nurses.
Nurses got paid for their work, whereas sisters (who were of a higher class) worked as
volunteers and philanthropists (Dingwall et al, 1991; Abel-Smith, 1960).
In the nineteenth century, a number of factors affected nursing and nursing leadership. The
practice of medicine started changing due to a number of reasons. Doctors’ needs were
changing as a result of doctors now specialising, so the type of nurses they required had to
change. Doctors began to have a say in what training the nurses they needed should have
(Glasgow, 2016; Dingwall et al, 1991). Doctors began to get more and more involved in the
recruitment of the nurses they wanted, rather than allowing the matrons or the sisters to
dictate the nurses the doctors had. The advances of science and technology also imposed new
and different needs on the type of nurses required (Glasgow, 2016).
Other factors such as the political and social reforms, especially, The Poor Law, began to
affect the socio-cultural status of nursing and its leadership. Prior to the establishment of the
National Health Services (NHS), many poor people could not afford doctors’ and hospitals’
fees, so, many people depended on the philanthropic goodwill of the rich. The Poor Law
introduced the provision of asylums for the sick and disabled people. These asylums were
overcrowded and in poor conditions and run by nurses. Many social reformers were critical
of the state and the conditions in such institutions (Abel-Smith, 1960).
Other remote factor that affected the state of nursing in the UK was the French revolution.
The French revolution led to the nationalisation of private hospitals, which meant large
numbers of people were admitted to the newly nationalised hospitals. Unfortunately, there
were no adequate provisions of doctors and other hospital workers as well as medications.
These shortages led to mass death of people. But it brought an unexpected advantage in that
doctors now had many corpses to use for their studies (Cunningham, 2002). Thus, the French
revolution had a good side effect on doctors and the practice of medicine in the United
Kingdom. Many doctors from the UK went to Paris to learn new practice of medicine from
the experience and knowledge gained from dead bodies. Obviously, this had an impact on
nursing and its leadership in the UK, as well.
3. NURSING LEADERSHIP BEFORE THE INTRODUCTION OF THE NHS
Prior to the second half of the nineteenth century, nurse leadership was mainly provided by
the sisters (Wildman et al, 2009). For example, The Saint John’s House Sisterhood, founded
in 1848, was given responsibility for managing the nursing duties at St Thomas’ Hospital in

358
1856 and Charing Cross Hospital in 1866. Similarly, All Saints’ Sisterhood was employed to
run the nursing services at the University College Hospital in 1862 (Helmstadter, 1994).
Although, there were matrons in hospitals, most of them tended to be confined to purely
administrative and house duties rather than clinical roles (Wildman et al, 2009). Nevertheless,
some were actually former nurses who had risen to the position of a matron and so were able
to perform clinical supervisory roles.
The Nightingale model of hospital manager was that each hospital should have a senior
female person (Matron) in charge of the nurses. It is believed that Nightingale sought to take
control of nurses out of the hands of the doctors and place it in the hands of the matrons
(Helmstadter, 2008). The proposition did not go well everywhere, especially with the doctors
(Abel-Smith, 1960). But, despite the initial objections, however, by the end of the nineteenth
century, the matron had become a very important figure in hospitals in the UK (Wildman et
al, 2009).
4. NURSING LEADERSHIP AFTER THE INTRODUCTION OF THE NHS
The NHS, which promises health for all from cradle to grave, free at the point and time of
need, has been a huge success (Thomas & Richardson, 2016; Klein, 1998). The philanthropic
approach to nursing training and provision of nursing services had gone. Doctors had started
to get involved in determining what type of nurses they needed and the type of training they
required of them. In addition, some were directly involved in the recruitment and selection of
nurses. This might be seen as an erosion of the powers of the sisters and matrons.
Perhaps, the greatest change to nursing and its leadership came about after the Griffiths’
Report of 1983 (Griffiths, 1983). There have been many proposals by the Conservative as
well as New Labour Government (of Tony Blair/Gordon Brown, 1997-2010) since then. Two
of the changes that have been introduced: are the Clinical Governance and the creation of The
Modern Matrons post.
5. CLINICAL GOVERNANCE & MODERN MATRON
Clinical governance, which was introduced in 1998 (Department of Health 1998, Harvey,
1998) is a new way of working that affects all nurses working in any healthcare setting,
especially the NHS. The government has defined clinical governance as a framework through
which NHS organisations are accountable for continuously improving the quality of their
services and safeguarding standards of care, by creating an environment in which excellence
in clinical care will flourish (Harvey 1998). The activities that highlight it are clinical audit,
risk management, evidence-based practice, user involvement, clinical supervision, clinical
leadership, continuing professional education, management of inadequate performance,
reflective practice, team building and peer review (Valentine and Smith 2000, Harvey, 1998).
At the heart of Clinical Governance are the Senior Nurses or Nurse Managers, who are
charged with the responsibility of making it work in their wards.
The Modern Matron was re-instituted in 2000, according to the government’s White Paper,
NHS Plan (DOH 2000). The White Paper described the creation of the post of a Modern
Matron, a person with strong clinical leadership with clear authority at ward level (Hewison,
2001). The remit of her power and work was reiterated in April 2001 (NHS Executive, 2001).

359
It was envisaged that by the year 2004, there would up to 2000 such officers (Hewison,
2001). According to the government, this development was prompted by public demand
arising from the public consultation the government had carried out. That gives a brief history
of nursing in the UK
6. NURSING LEADERSHIP AND NURSING RESEARCH, EDUCATION AND
TRAINING IN THE UK
Since the 1980s, following the Griffith’s Report of 1983, the importance of nursing
leadership within the NHS was highly emphasized (Storey, 2016; DOH, 2000), especially by
that statement in the report ‘if Florence Nightingale was here, she will ask for the nurse
managers’ (Griffiths, 1983). The most recent and perhaps the most important change to
nursing leadership is Clinical Governance, as briefly mentioned above.
Nurses and their leaders are directly charged with providing care, improving the quality of
that care as well as safeguarding the standards of care. Because of these changes, ‘nursing is
professionalising fast’ (Moiden, 2002, p24), especially with all nursing training now
transferred to the Universities. Many roles and positions have been created over the last
sixteen years or so, that have enhanced the political, academic, executive and clinical status,
and hence, the professional status of nurses. By 2004, over 1000 nurse consultants were to be
appointed by the NHS to work alongside hospital doctors to draw up referral and clinical
protocols (Moiden, 2002). There are many academic nurses as well nurse professors in the
universities now. Some nurses now occupy executive and political positions, all of which
have helped both the professionalization and the professional status of nurses.
However, nursing research in England and the UK as a whole is still very much in its infancy
and a number of reasons can be advanced for this. According to Gill (2004), some of the
reasons are: lack of adequate research-active staff, nursing research lacks purely dedicated
funding within the academic institutions, there is a lack of, or a poorly developed culture of
research among the nurses academic staff, as well as a competing demand on nurse academic
staff.
Prior to Edinburgh University starting degree courses, nursing training was mainly confined
to the hospitals. It was only in the 1970s that University of Manchester appointed the first
professor of nursing in the UK. It is therefore not surprising that the Nursing Departments of
most Universities in the UK have not done very well in the 5-yearly Research Assessment
Exercise (RAE) of UK universities (Gill, 2004). The RAE has now been replaced by another
body called the Research Excellence Framework (REF). Their most recent assessment took
place in 2014.
In order for nursing research to develop and mature, a number of issues have to be addressed,
as a matter of urgency. From the ongoing discussion, it is very clear that nursing in England
and the UK has come a long way. However, much more still needs to be done to enhance the
professional image of nursing and for nursing to be able to hold its head up high in academic
circles. Two of the issues that need to be addressed will be identified here, with suggestions
on what could be done.
First, is the educational standard of those to be admitted to the register of nurses and
midwives, and, linked to that is the research development among nurse practitioners.

360
(i) It is gratifying to note that nursing training in England is now (from 2013) through
a degree route. It is suggested that those who pass through the degree route are
more likely to be given basic training on how to carry out research. And the
tendency would be that some of them might be interested in taking up
postgraduate studies in their profession. (Reference is made to England here as
there are variations in training routes in the other home nations of UK- Northern
Ireland, Wales and Scotland)
It is also suggested that the academic standards of those to be admitted to nursing training in
the universities need to be raised to be at par with other university courses. The current five
GCSEs will not help the image of nursing. It has been suggested that Oxford and Cambridge
do not engage in nursing training for this reason. Black (2005) is of the opinion that improved
nursing leadership and opportunities can be enhanced through education and training.
In this highly complex and advanced technologies, only highly educated and intelligent
nurses will be able to cope with the healthcare demands and practice of medicine in the
twenty first century.
Australia now requires a bachelor's degree for nursing registration. Some countries in Europe
such as Norway and Spain only admit those with degrees into the nursing profession (Aiken
et al, 2014). Scotland and Wales are also moving towards making a Bachelor’s degree the
minimum entry qualification to the profession (Shields & Watson, 2007). In the USA, about
80% of the nurses there have a minimum of Bachelor’s degree, compared with 28% in
England (Aiken et al 2014). In fact, most states in the USA will only allow those with a
degree on their register (Shields & Watson, 2007).
The above issue is well summarised by Shields & Watson (2007, p72) who said that most of
the submissions to two of the British Journals of Nursing are from overseas. A similar point
was also voiced by the Higher Education Policy Institute.
(ii) The second area which Nurses leadership need to address is the public image of
nursing (see Thomas & Richardson, 2016; Gillett, 2012). Thomas & Richardson
(2016) and Gillett (2012) have synthesized relevant newspaper articles over a
couple of decades highlighting public perceptions of nursing as portrayed by the
newspapers, most of which were negative. They, however, defended nursing and
highlighted the good and positive works being done by nurses all over the UK.
Aiken and her colleagues (Aiken et al, 2014) have also addressed this issue
brilliantly. Aiken et al (2014), in a comparative study of 12 European countries
found that nurses in England are not uncaring as portrayed by the media and the
public, rather, they are unable to adequately fulfil their nursing role due to lack of
resources. They identify burn-out among nurses in England to be one of the worst
among the 12 countries studied. Their findings also reported that inadequate
resources is affecting nurses in the performance of their duties effectively.
It is to be noted however, that recent reports about the impact of the Modern Matrons give a
favourable outlook of the importance of this post, especially from the patients’ perspective.
More needs to be done, though, as White (2012) puts it, nurse managers and directors need to
develop their political and lobbying skills in order to enhance their status in the corridors of

361
power and influence strategic national decisions that will affect their profession and their
staff (Gillett, 2012). That will also affect and influence public perception of nurses and the
important contribution they are making to the health of the population.
In this time of financial crisis and cutbacks, the nurses and their managers are between the
‘devil and a hard rock’ in terms of discharging their duties of care effectively. Thus, it will
take higher and better negotiating skills of the nurse managers and directors to be able to
influence strategic decisions that will affect nursing and the care they provide, which
ultimately will lead to a better public image of nurses and midwives.
7. CONCLUSION.
This brief analysis gives a hint of the problems facing nursing in the twenty first century UK
and what nursing needs to do to enhance its leadership. Nursing is a noble profession and the
face of any health care system. It thus behoves both the practitioners and the end-users of
nursing service, that is, the public, including the media to help in maintaining and enhancing
the image of nursing (Gillett, 2012). Some writers have suggested that medicine without
nursing is not feasible (Shields & Watson, 2007; Black, 2005).
8. REFERENCES
Abel-Smith, B (1960) A history of the nursing profession. Heinemann Educational Books Ltd, London
Aiken, L; Rafferty, A. M; Sermeus, W (2014) Caring nurses hit by a quality storm: Low investment and
excessive workloads, not uncaring attitudes, are damaging the image of NHS trusts. Nursing Standard,
Vol.28(35), pp.22-25
Baly, M (1986) Florence Nightingale and the nursing legacy. Croom Helm Ltd, Kent
Black N. (2005) Rise and demise of the hospital: a reappraisal. BMJ ;331:1394–6
Cunningham, A.; Williams, P (2002) The laboratory revolution in medicine: Cambridge University Press
Department of Health (1998) First Class Service, Quality in the New NHS, London, The Stationery office
Department of Health (2000) The NHS Plan: A Plan for Investment, a Plan for Reform. The Stationery Office,
London.
Department of Health (2001) Implementing the NHS Plan: Modern Matrons. Health Service Circular.
2001/2010. DoH, London.
Dingwall, R., Rafferty, A. M., & Webster, C (1991) An introduction to the social history of nursing. Routledge,
London
Gill, P (2004), British Journal of Nursing, Vol 13, No 14
Gillett, K (2012) A critical discourse analysis of British national newspaper representations of the academic
level of nurse education: too clever for own good? Nursing Inquiry, vol 19, 4, p 297-307
Griffiths, E. R (1983) http://www.nhshistory.net/griffiths.html (accessed 29/12/2016).
Harvey, G (1998) Improving patient care: Getting to grips with Clinical Governance. RCN Magazine, Autumn
8-9
Helmstadter, C (2008) Authority and leadership: the evolution of nursing management in 19th century teaching
hospitals Journal of Nursing Management, Vol.16(1), pp.4-13
Helmstadter, C. & Godden, J.(2011) (eds) Nursing before Nightingale (1815-1899)
Hewison A. (2001) The Modern Matron: reborn or recycled. Journal of Nursing Management 9, 187–189
Kozier, B (2008) Fundamentals of nursing: concepts, process and practice (2nd ed). Harlow, Pearson, UK
Moiden, N (2002) Evolution of leadership in nursing. Nursing management, Vol.9(7), pp.20-25
Shields, G. and Watson, R. (2007) The demise of nursing in the United Kingdom: a warning for medicine.
Journal of the Royal Society of Medicine, 100 (2007), pp. 70–74
Storey, J (2010) (eds) Current issues in leadership theories
Thomas, G & Richardson, E (2016) Memories of Nursing: a timeline of the profession. British Journal of
Nursing, vol 25, issue 19.
University of Glasgow (2016) A History of Nursing. http://tinyurl.com/mvns5pu (accessed 17 April 2017)
Valentine, F. & Smith, F (2000) Clinical Governance in acute children services. Nursing Management, 7, 3, 8-
11

362
White, J (2012) Reflections on strategic nurse leadership. Journal of Nursing Management, Volume 20, Issue 7,
pages 835–837
Wildman, S, & Hewison, A (2009) Rediscovering a history of nursing Management: From Nightingale to the
modern matron International Journal of Nursing Studies, 9, Vol.46(12), pp.1650-1661

363
ID 087
A COMPARISON OF UK AND CHINESE HEALTH AND SAFETY
CULTURE IN CONSTRUCTION
M. Liu and P. Farrell
School of Engineering, University of Bolton, Deane Road, Bolton. BL3 5AB, UK
Email: [email protected]
Abstract: Whilst the UK has far too many accidents, fatalities and injuries in construction, its
record is arguably as good as, or better than most other countries in the world. There are many
examples of best practice in flagship projects, and there is a commitment to share this best
practice throughout the industry. Statistics from the UK Health and Safety Executive have
shown a reduction in accident data over the last decade. However, there remains much more
work to be done. In 2015/16, there were 45 UK deaths in construction; it is doubtful that such
a high figure would be tolerated in more sophisticated industries such as nuclear or aerospace.
Reliable accident data in China is somewhat harder to establish, however it can be ascertained
that there are more incidents per head of population than in the UK. In year 2000, there were
1,180 employee deaths in China; in 2011, this had reduced to 989 deaths. The Chinese
economy, including its construction sector, continues to grow at rates far higher than in
western countries. It is important that whilst China’s construction industry grows, it
simultaneously adopts as far as is possible, international best practice in health and safety.
This research is founded on a literature review to compare accident data between the UK and
China, supported by interviews with Chinese practitioners working in the UK. Differences
between regulation and marketing of the industries are explored. This is the first exploratory
paper in a full-time PhD.
Keywords: China, Culture, Health, Safety.
1. INTRODUCTION
As China has developed its primary economic model over the last 20 years, and as its
industry has updated itself, there has been substantial economic and social reforms. Much
more attention has been devoted to health and safety. Health and safety management is
becoming more embedded as a kernel in public and academic research. Under these new
circumstances, the government collaborates more closely with industry and research
institutions, and interaction is promoted; meanwhile, new application of technology and
creativity is being applied and there is evidence of greater political leadership by the
government in this field. It is a fundamental premise of conventional welfare economics for
public policy makers, that public decisions should, as far as possible, reflect the preferences
of those who will be affected by them. However, both technical and artificially induced
mistakes still occur in projects, especially, in the field of safety management and accident
prevention. In comparison, there is evidence that the UK is leading international efforts in
health and safety management, especially, in the areas of company and management culture
(Swuste, P. et al., 2012). At present, many domestic construction safety regulators exist in
China and cross-functional performance reduces regulatory efficiency significantly because
of the lack of necessary mutual checks and balances between institutions (Wang, at al., 2016).
The UK’s Health and Safety Executive (HSE) implementation of the Construction Design
and Management Regulations (CDM, 1994), and subsequent revisions, illustrates it has
encouraged the ‘the integration of health and safety into project management’ (HSE, 2004).

364
Although, health and safety issues still present significant challenges to UK companies, many
of these challenges are being addressed with the benefit government support.
This paper will give an overall review and analysis of Health and Safety management with
comparison between China and UK, under the three following subject areas:
Current status and background
Health and safety management system
Policy and culture
2. CURRENT STATUS AND BACKGROUND
2.1 The Background to Construction in China and the UK
Figure 1 illustrates growth in the Chinese construction market over the five-year period
2010/15. Chinese construction enterprises have grown from 80,000 to 100,000 between 2010
and 2015. In the same period, the number of all employers increased from 120,000 to
150,000 and the data of all new housing have grown from £10,000BN to £20,000BN.
Between 1980 and 2015, Chinese construction enterprises have grown from 6,604 to 80,991;
a growth rate of 1226%, and the number of employees increased from 6.48 million to 50.93
million; growth of 786%. Construction industry output value has increased in the same period
from 28BN Yuan (circa £12.4BN), to 18,075 billion Yuan (£1,829BN), a growth rate of
14831% (National Bureau of Statistics of the People's Republic of China Yearbook, NBPRC,
2016).
Figure 2 shows that the UK construction industry has also developed rapidly in the recent
years, though some would argue not rapidly enough. The data of all new housing have grown
from £20.05BN to £29BN between 2010 and 2015. In the same period, the data of
infrastructure have grown from £11BN to £21BN. From the 1950s to the 2000s, the number
of people working in UK construction increased 20% to 1.3 million. Two main factors can
offer explanations for the increase: one is welfare and the living environment, and the other is
economic plural conditions. Welfare and favourable living environments in developed
countries attract an enormous number of skilled migrants. Also, liberal economic conditions
are favourable to those job seekers from different countries. In the past 15 years, the UK
construction industry also showed a gradual upward trend; the output value of the
construction industry has an average annual growth rate of about 2% (Office for National
Statistics, ONS, 2016).

365
Figure 1: Chinese construction marketing growth 2010/15. Source: National Bureau of
Statistics of China, NBS 2016.
Figure 2: Components of all new work, seasonally adjusted chained volume measure £
million. Source: Construction: Output & Employment - Office for National Statistics, ONS,
2016

366
2.2 Current Status
The salient discrepancy between China and UK construction industries lies in their political
systems and methods used to lead innovation, which leads to different attitudes towards
health and safety. China has undergone progressive development and improvement in
standardising processes in construction health and safety. Throughout its history, China has
had relatively long processes to develop projects from inception to completion. In
comparison, construction safety and health in Britain has been driven by a modernised
civilisation, and avoids for example social problems that can be caused by long working
hours for construction workers. Trade unions in the UK have played a significant role in
promoting health and safety, and the Health and Safety at Work Act (H&SWA, 1974)
became a watershed in establishing safer places of work. The present study discusses the
differences between China and Britain in terms of the construction management, and strength
of health and safety culture on construction projects.
3. HEALTH AND SAFETY MANAGEMENT SYSTEMS
3.1 Health and Safety Management Systems in China
The Chinese government manages safety and health by appointing a series of government
agencies, as illustrated in Figure 3. It is through government units and the establishment of
the corresponding industry rules, that health and safety is managed. Among them, the
uppermost institutions are State Administration Work Safety of China (SAWS) and State
Administration of Coal Mine Safety (SACMS) under which there are many local subordinate
organisations. The functions of local organisations are to ensure industry approaches to safety
are compliant with legislation and regulation, to report accidents, and maintain employee
rights (Prevention and Control of Occupational Diseases Department, PCOD, 2014)
Alongside local organisations, SAWS also have support organisations such as the China
Academy of Safety Sciences and Technology (CASST) and the State Occupational Safety
and Health Association (SOSHA). The roles of these branch organisations include:
technological support to SAWS, promoting the development of safety science and
technology, health and safety education and trade, and providing services to enterprises
related to safety technology, and information management.
CASST is a research institute covering the areas of major accident prevention, major hazard
identification, assessment and monitoring, risk assessment and management, building major
accident and emergency systems and emergency planning, developing safety and hygiene
engineering technology, work safety inspection and management systems, and basic theory of
work safety and work safety economics (The People’s Republic of China on Workers Safety,
2014).

367
Figure 3: China’s regulatory system of occupational health and safety. Source: Regulatory
system reform of occupational health and safety in China, China safety, 2015.
3.2 Health and Safety Management Systems in the UK
Figure 4 illustrates how management processes are implemented in the UK to ensure
compliance with Health and Safety Executive (HSE) requirements and the Construction
Design and Management Regulations (CDM, 2015). CDM is intended to ‘encourage the
integration of health and safety into project management’.
The UK concentrates it efforts in three areas, to include compliance with rule of law, industry
general guidelines, and specialist expertise. The UK aims to reduce as much as possible risks
to health and safety in construction due to the omission or lack of construction technology
management best practices. Great care is taken in the assessment of occupational hazards, as
well as the assurance of occupational health and safety in the workplace. It has been
estimated that one third of occupational deaths or injuries in the UK occurs on construction
sites. Internationally, many more violations of health and safety regulations take place in the
construction sector than in other industries (Naujalis, 2009; Mitropoulos and Memarian,

368
2012). There is extensive scientific research and many legal instruments that have
concentrated on solutions to health and safety at work problems. Mitropoulos and Memarian
(2012) emphasised the key role group work plays in preventing accidents and injuries to
construction workers. Jacinto and Silva’s study (2010) analysed different types of
occupational accidents and put forward strategies for improving safety. Sustained
commitment to robust systems of management of construction health and safety, plays a vital
role in reducing the number of accidents, and it is important to continually raise the
awareness of practitioners, tradespeople, employers, designers, contractors and others in the
supply chain.
Figure 4: HSE management how to work in UK, source: University of Nottingham (UoN,
2017)
4. POLICY AND CULTURE
Political institutions in China and the UK are different, and it follows that development of
policy and engrained cultures are similarly radically unalike. UK policy can be affected by
market economies. To a certain extent, there are strict requirements in ensuring there is
compliance with cost and budget targets. UK health and safety management systems take
cognisance of government policy and the views of trade unions. However, the Chinese
government is still gradually introducing different management patterns within the
framework of economic reform that is being implemented. Government is the main body
that’s generates guidance and exercises control of policy.
Clear management objectives are put forward in the UK by the Health and Safety Executive
(HSE). Policy emphasises the protection of people, ensuring health, safety and welfare of

369
occupational workers, and protecting public health and safety that may be affected by
production. In contrast, the goal of Chinese laws and regulations are difficult to define and
are very vague. Health and safety laws and regulations in construction are imperfect. For
example, "safety production law" merely aims to strengthen supervision and administration
of production safety, prevent and reduce production safety accidents, ensure the security of
people's lives and property, and promote economic development (Chinese Centre for Disease
Control and Prevention, ChinaCDC, 2017). Included in construction laws and other relevant
regulations, are evasive requirements that contractors should pay for and take responsibility
for the health, safety and environment on projects. Also, government implementation of
policy is not well grounded in research that is relevant and applicable to construction
projects. Construction needs to meet the interests and expectations of project stakeholders
and the requirements of society, and respect its social, humanitarian and historical
responsibilities. Health and safety management objectives require that construction should
adapt to social developments and should contribute to improving the ecological environment
and saving energy. But on many large projects in China, implementation of scientific
research and feasibility studies are often hampered by burdensome administrative procedures,
which leads to situations where forecast costs are too high and short cuts are taken that
consume excessive natural and social resources and cause irreversible damage to the urban
ecology and landscape. In health and safety management systems, the UK government
mainly plays a surveillance role and has oversight through the HSE and its legal frameworks.
The UK attaches significant importance to statistical monitoring of performance, and key
performance indicators. Large fines are imposed on companies and custodial sentences
imposed on persons responsible for health and safety breaches, particularly where accidents
or incidents occur. The UK will also punish employers who do not maintain standards, and
restrict the ability of directors to practice. However, the monitoring and implementation of
health and safety law in China is arguably ambiguous and not robust. Companies and
individuals who are non-compliant with health and safety procedures are often not held to
account. Knowing this, companies take inappropriate risks and accidents occur. Liu and
Cheng (2014) argue that power and responsibility between government departments are
chaotic, which brings about mis-alignment between power and responsibility. A phenomenon
of administration not according to the law appears to exist, and there is often inappropriate
administrative intervention and inspection instead of concentration on best practice in
construction management.
5. RESEARCH METHODOLOGY
To support data gained from the literature, interviews were held with 15 Chinese practitioners
working in the UK construction industry; their job roles included technical project managers,
construction managers, a project director, and a professional translator / archivist. Two
practitioners were based in London and the other thirteen in north-west England, all on major
projects with large Chinese contractors. The sample selection was one of convenience, since
the lead author was able to get easy access. Care was taken to comply with ethical protocols.
The interviews were conducted in Chinese, with field notes taken. Translation into English
was subsequently undertaken to support sorting of data for interpretation. Seven of the
practitioners had a bachelor’s degree or above, whilst the other eight also have post-graduate
qualifications.
Participants stated Chinese companies are keen to ensure they comply with UK legislation,
and respect the work of trade unions. In comparison to China, where they may be a short-

370
comings in safety management, that is not the case in the UK. Whilst working in the UK,
Chinese companies ensure they record carefully operational data regarding all relevant
business practices, including health and safety; perhaps that is not always the case in China?
It was noted that in some Chinese companies in the UK, operatives work undesirably long
hours each day, though that is more common in China. Operatives in China want to work
long hours to maximise their income, and this is supported by employers who seek to
complete projects as quickly as possible. Productivity is lower than it should be in the UK,
since Chinese construction management teams need to spend time learning UK systems and
regulations; consequently, delays can occur. It was recognized that UK construction uses a
higher proportion of prefabricated techniques than appears to be the case in China, but that
the UK appears to suffer more problems associated with weather conditions. Anecdotally,
participants reported that operatives in China have a higher age profile. It may often be the
case that in China, operatives need temporary overnight accommodation on site.
6. CONCLUSIONS
In general, the UK's building safety and health management system is fundamentally
different to that of China. UK development is supported by technology and awareness of
progress is sensitive to timely improvement. There are substantial opportunities for Chinese
health and safety in construction to improve, and this can be supported by comparing
processes with international best standards, including those in the UK.
Traditional Chinese thoughts and cultures need to change. Relevant laws and regulations
should be up-dated to ensure there is clarity about the responsibilities of employers, designers
and contractors, and ensure there is full consideration about the influence of health and safety
on employees, members of the public and the environment. All participants in construction
need to be involved in HSE management, from inception through to demolition and recycle.
The Chinese government should implement fully its current laws and regulations for
developing health and safety management systems, and spare no efforts to monitor and
manage market practices which fall short of acceptable standards.
To achieve full control and to identify dangers, including those that arise from environmental
failures, the Chinese government should promote scientific and management research, and
ensure early warning management systems are used to identify dangerous situations. There
seems to be inadequate implementation of economic and financial tools to improve the level
of health and safety compliance. Insurance systems do not provide sufficiently well for those
who suffer occupational injuries, and fines issued to companies that fail to comply with
legislation do not seem to act as a deterrent to unsafe practice. There appears to be many
instances of best practice law and policy formulation, from which Chinese government can
learn from the UK. China ought to take active measures to impose sanctions on those
responsible for accidents, and to ensure there is appropriate compensation through insurance
schemes for victims and their families. Sanctions should include criminal proceedings. The
market will decide that those companies with good accident records will benefit though lower
insurance premiums.
Chinese companies do not seem to invest sufficiently in health and safety education and
training, and to the extent that some training is provided, it is not wide spread and the quality
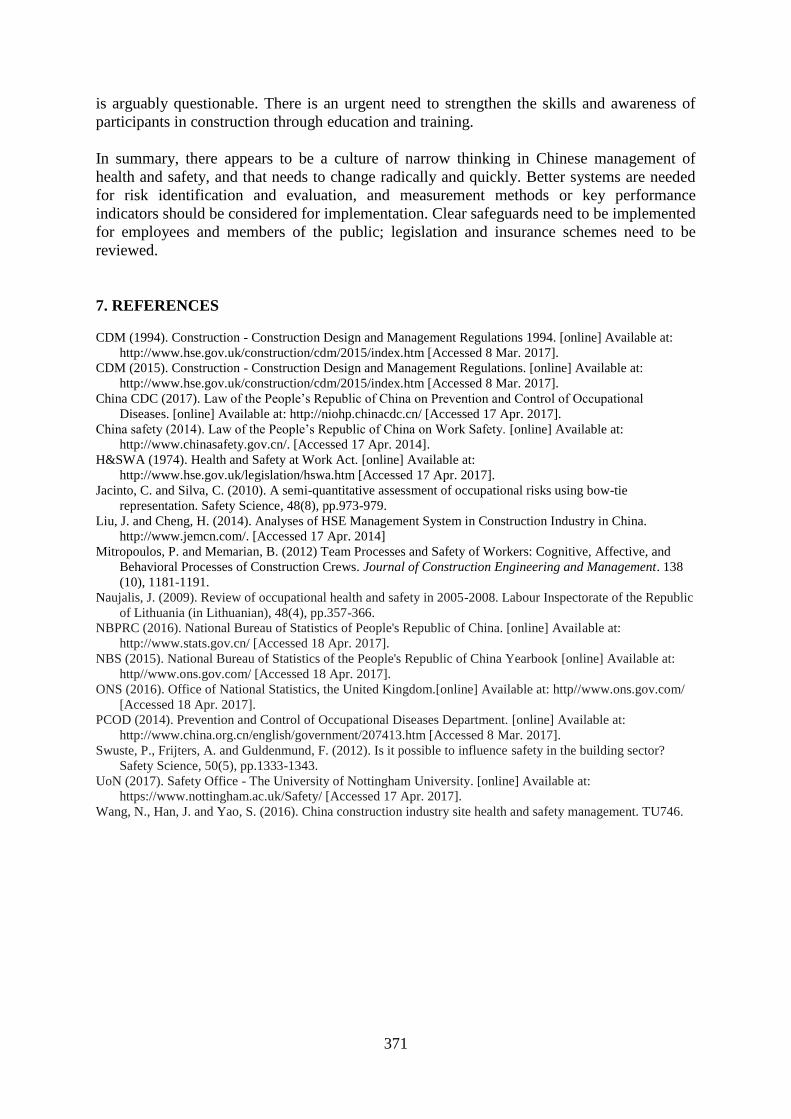
371
is arguably questionable. There is an urgent need to strengthen the skills and awareness of
participants in construction through education and training.
In summary, there appears to be a culture of narrow thinking in Chinese management of
health and safety, and that needs to change radically and quickly. Better systems are needed
for risk identification and evaluation, and measurement methods or key performance
indicators should be considered for implementation. Clear safeguards need to be implemented
for employees and members of the public; legislation and insurance schemes need to be
reviewed.
7. REFERENCES
CDM (1994). Construction - Construction Design and Management Regulations 1994. [online] Available at:
http://www.hse.gov.uk/construction/cdm/2015/index.htm [Accessed 8 Mar. 2017].
CDM (2015). Construction - Construction Design and Management Regulations. [online] Available at:
http://www.hse.gov.uk/construction/cdm/2015/index.htm [Accessed 8 Mar. 2017].
China CDC (2017). Law of the People’s Republic of China on Prevention and Control of Occupational
Diseases. [online] Available at: http://niohp.chinacdc.cn/ [Accessed 17 Apr. 2017].
China safety (2014). Law of the People’s Republic of China on Work Safety. [online] Available at:
http://www.chinasafety.gov.cn/. [Accessed 17 Apr. 2014].
H&SWA (1974). Health and Safety at Work Act. [online] Available at:
http://www.hse.gov.uk/legislation/hswa.htm [Accessed 17 Apr. 2017].
Jacinto, C. and Silva, C. (2010). A semi-quantitative assessment of occupational risks using bow-tie
representation. Safety Science, 48(8), pp.973-979.
Liu, J. and Cheng, H. (2014). Analyses of HSE Management System in Construction Industry in China.
http://www.jemcn.com/. [Accessed 17 Apr. 2014]
Mitropoulos, P. and Memarian, B. (2012) Team Processes and Safety of Workers: Cognitive, Affective, and
Behavioral Processes of Construction Crews. Journal of Construction Engineering and Management. 138
(10), 1181-1191.
Naujalis, J. (2009). Review of occupational health and safety in 2005-2008. Labour Inspectorate of the Republic
of Lithuania (in Lithuanian), 48(4), pp.357-366.
NBPRC (2016). National Bureau of Statistics of People's Republic of China. [online] Available at:
http://www.stats.gov.cn/ [Accessed 18 Apr. 2017].
NBS (2015). National Bureau of Statistics of the People's Republic of China Yearbook [online] Available at:
http//www.ons.gov.com/ [Accessed 18 Apr. 2017].
ONS (2016). Office of National Statistics, the United Kingdom.[online] Available at: http//www.ons.gov.com/
[Accessed 18 Apr. 2017].
PCOD (2014). Prevention and Control of Occupational Diseases Department. [online] Available at:
http://www.china.org.cn/english/government/207413.htm [Accessed 8 Mar. 2017].
Swuste, P., Frijters, A. and Guldenmund, F. (2012). Is it possible to influence safety in the building sector?
Safety Science, 50(5), pp.1333-1343.
UoN (2017). Safety Office - The University of Nottingham University. [online] Available at:
https://www.nottingham.ac.uk/Safety/ [Accessed 17 Apr. 2017].
Wang, N., Han, J. and Yao, S. (2016). China construction industry site health and safety management. TU746.
372
ID 107
TECHNICAL AND VOCATIONAL SKILLS GAP IN THE NIGERIAN
CONSTRUCTION INDUSTRY: A LITERATURE REVIEW
A. O. Olusola, J. Lamond and P. Manu
Department of Architecture and Built Environment, University of the West of England, BS 16 1QY, United
Kingdom.
Emails: [email protected]
Abstract: Nigeria requires its efficient and capable skilled workforce to manage the
construction industry. The workforce comprises the engineers, technicians and the craftsmen
from Nigerian universities, polytechnics and technical colleges. The importance of the skilled
workforce cannot be overemphasized as it contributes immensely to the social and economic
development of the country and its contribution to the national gross profit. The aim of this
study is to examine the issue of technical and vocational skills gap within the Nigerian
construction industry through a critique of literature relating to construction skills and
education. The review reveals that the potential factors contributing to the technical and
vocational (T&V) skills gap in the Nigerian construction industry include: outdated
educational facilities; inadequate educational materials, tools and equipment among others.
Drawing on this insight, the study concludes that further research is needed to empirically
diagnose the skills gap in the construction industry.
Keywords: Nigerian construction industry, skills, technical and vocational education.
1. INTRODUCTION
Nigeria is a resource rich and fast growing economy with large demand for built facilities.
Therefore the country requires a highly skilled, capable, strong and efficient workforce to
manage the construction industry. The skilled workforce that should form the backbone of the
construction industry is comprised of engineers, technicians and craft-workers. The
importance of the skilled workforce cannot be over-emphasized as a skilled workforce in the
construction industry contributes immensely to the social and economic development of a
country (Ogwo and Oranu, 2006; Megudu et al., 2011). Technical and Vocational
Educational Training (TVET) has been identified by the Federal government of Nigeria as a
significant tool that can help improve the lack of technical knowhow in the Nigerian
construction industry. This is due to the important contributory aspect of education that could
contribute to social and economic development through the output of its category of its
products in ensuring adequate supply of a skilled labour force. According to Ogwo and
Oranu, (2006), TVET is a branch of education offered presently in Nigeria education system.
It was created to provide opportunities for students, particularly those who have a tendency to
tilt towards studying science and technology programmes, to train to meet the manpower
needs of industry (FRN, 2007).
However, despite the high demand for skilled workers, it has been observed that technical
college graduates suffer high unemployment due to their failure to possess the required and
appropriate skills needed for employment in the industries (Ogwo and Oranu, 2006).
Employers from the construction industry in Nigeria have complained that TVE graduates do
not possess the required and adequate skills for employment and that they lack confidence in
carrying out their duties and responsibilities (Oni, 2007). Oni (2007) has attributed this to the

373
fact that the educational facilities available in technical colleges are outdated while modern
ones are lacking and that formal training programmes have been inappropriate in content and
inadequate in quality. This is in line with observation by Abdel-wahab et al.(2008),that the
prevalent lack of skills affects productivity.
Furthermore, it has been observed that the level of technological advancement has increased
in the area of tools and equipment used by the construction industry thereby calling for the
industry workforce to update their skills to meet the current skills required globally
(Crosthwaite, 2000). In more technical areas, equipment is becoming ever more sophisticated
thereby necessitating training in the use of tools and equipments. The technological
advancement equally calls for up skilling and multi skilling in every area of construction
techniques (Crosthwaite, 2000). Nigeria lags behind in updating its curriculum to suit these
new industry need in terms of skill acquisition. Although skill acquisition programme is
organized with the intention of improving the performance of the skilled work force but it has
never yielded a positive result (Olaitan et al., 1996 quoted in Oketch, 2007). Crosthwaite
(2000) has stressed the benefits of investing in the construction skilled workforce by training
them to adapt to new technology and construction techniques in other to bridge the skills gap
that is prevalent.
1.1 Skill and Skills gap in the construction industry
Construction skills and training needs are ever changing with the introduction of new
business processes, different forms of organizing production and technical innovation which
require the construction workforce to be more highly skilled in their various areas of
expertise (Spenner, 1983; Mackenzie et al., 2000; Forde and MacKenzie, 2004). Any
definition of skill according to labour scholars must consist of task complexity or variety and
worker autonomy (Spenner, 1983; Olaitan et al., 2006). It is equally an ability to perform a
productive task at a certain level of competence. Where a skill is associated with a particular
task, a person who does not possess such a skill is unlikely to be able to carry out this task or
will be less productive than somebody who possesses the skill. Skills are often associated
with qualifications (Mawer& Jackson, 2005) and acquisition through formal education and
training which is adequate in quality and quantity. Vocational technical education according
to UNESCO, (1997) is “those aspects of the educational process involving, in addition to
general education, the study of technologies and related sciences and the acquisition of
practical skills, attitudes, understanding and knowledge relating to occupation in various
sectors of economic and social life.” However, it is important to note that TVET is not only
about knowing how to do things but also understanding why things are done in a particular
way(Oketch, 2007).TVET is different from just teaching domain specific skills but includes
general skills and hands on practices which make it different from other forms of training.
The employers in the construction industry are looking for the skilled workforce with right
employability skills (Crowson et al., 2000) and qualities so as to contribute to the
development and success of the industry. Skills identified by the construction industry to be
of importance include, academic or cognitive skills, generic skills, technical or vocational
skills and work related attitudes or soft skills (Stasz, 2001).
Academic or Cognitive Skills: These are basic academic skills needed to support learning in
different disciplines such as English, mathematics, science and so on. These subjects are
learned in school and it should be able to be transferable to applications where needed, they
are assessed by the use of standardized test.

374
Generic Skills: These are combination of skills that deals with problem solving,
communications, or team work they are equally transferable across work settings. Generic
skills have meaning in different work context. (Stasz, 2001).
Technical Skills: These are specific skills for use in an occupation and which include
references to academic skills (e.g., Physics needed by Electricians) or having knowledge
about tools equipment’s and facilities (e.g., operation of a switch gear). They are always
coded in job description and they are measured using the standardized assessment.
Soft- Skills::There is no specific definition to it as there is no way to conceptualize it. It
could be referred to such construct as motivation and dispositions. It could be accessed
through self-report questionnaires but are equally judged through personal impression.
Besides these skills, construction graduates are required to have three essential attributes
(Love et al., 2001; Ogwo and Oranu 2006). First, they are to have practical experience so that
they are thoroughly familiar with the workings and intricacies of the industry. Secondly they
are to be familiar with tools and techniques for planning, and then have the personality and
insight that will enable them to work harmoniously with other people, often under very
strained and trying periods. Graduates must know and acknowledge the reality that they
cannot achieve everything on their own efforts alone. Additionally, they thus, need to be able
to work with and through people to perform their duties. The construction skill workers are
required and supposed to possess particular range of skills to include personal, business,
technical operational levels and employability skills meant to assist in their daily activities at
work(Oranu&Ogwo 2006; Stasz, 2001).
Employability skills: These are skills necessary for getting on, keeping and being successful
in one’s job. These are the skills used in making critical decisions and attitudes that enable
employees to get along with their colleagues, solve problems, develop respect and ultimately
become strong representative of an organization. These skills are usually lacking in graduates
that are just out of school and even those already in employment. Other skills needed for
employability includes: Interpersonal skills, critical thinking skills, communication skills,
management skills among others. Graduates are expected to be active and able to solve
problems in a distinctive way these are the abilities that employers look for when recruiting
technical college graduates (Cranmer, 2006). In general, employers look for graduates with
communication skills, empathy, motivation, decision making abilities, planning abilities and
improvisation abilities (Bagshaw, 1996).
The sudden shift in skill requirements in the modern economy has significant implication for
education and training. This is partly due to widespread agreement that more education and
training is good for the modern economy. The main question for policy makers is how to
change the education and training system to meet these demands most efficiently (Green,
1999) to prevent skills gap.
Most of the developed and developing countries have being experiencing skills gap as
perceived by the employers (CIOB, 2009). Skill gap in industry are identified as lack of
qualified trained persons from the perspective of the employer. They could be due to
inadequacy in general education levels or due to inadequacy of technical skills.
Skill gap according to (ASTD, 2012) is “the significant gap between organisation current
capabilities and the skills it needs to achieve its goals”. It is the point at which an organisation

375
can no longer execute its strategies, fulfil its mission, grow, or change because it cannot fill
critical jobs with employees who have the right knowledge, skills and abilities. This existence
of a skills gap is said to be an indicator of negligence in area of education and training
(Chan& Dainty 2007; Gann & Senker, 1998). The relevant curricula and the mode of
teaching should be critically looked into in order to correct the abnormalities there-in.
Manson et al. (2009) conclude that, based on employers feedback from the construction
industry, skills gap are prominent within the following skills, generic skills , numeracy,
literacy, personal skills, IT skills and vocational and job specific skills. These skills are
required for employment. General education comprising the generic skills has been
embedded into the curriculum of TVET both in the developed and developing countries in
order to serve as bases for training. The in-ability of technical college students in Nigeria in
area of science, technology, engineering and maths (STEM) which are coined under general
education in the school curriculum (FRN, 2004), has been a major problem. The in-ability of
students to comprehend and apply those subjects has created a skills gap among the
workforce.
1.2 Evidence of Skills gap in Nigeria
Studies in various developed as well as developing countries have shown that a skills gap
exists or is prevalent among the skilled workforce in the construction industry (Dainty et al.,
2004; Manson et al., 2002; UNESCO, 2012). A chronic misalignment of the education
system to the needs of the labour market is a global problem, UNESCO (2012) reported that
there is skills gap throughout the world. The skills gap crisis in the construction industry is
not peculiar to Nigeria, Hass et al.,( 2001) record that USA is facing a long term labour
shortage and skills gap. Mackenzie et al., (2000) Dainty et al.(2005) and Agapiou et
al.,(1995) each reported on the skills shortage and skills gap in the UK.
In Nigeria, the skills gap in relation to skilled workforce in construction industry is under
explored in research. Employers realised that there are also areas of skill deficiencies within
the skilled workforce. These deficiencies are at various levels, though more so in the craft
workers. Various reports and headlines have indicated the existence of skills gap and poor
quality of craft workers in the Nigerian construction industry (Obiegbu, 2002; Olaitan et al.,
2006).
Previous research by Udofia, (2012) Ogwo and Oranu (2006) Okejiri, (2011) reveal
evidences of skills gap in Nigeria that include the following: industry comments on lack of
skills; importation of expatriates; and unemployment of technical graduates. These are
discussed in further detail below
Insufficient skill: The construction industry in Nigeria has complained about the graduates of
technical college who are the major skilled workforce of the industry not possessing the
adequate practical and technical skills needed for employment (Awe, 2010; Ogwo and Oranu,
2006). The inadequate training received from the school and obsolete equipment has
contributed to skills gap.
Importation of expatriates: Lack of insufficient skill on the part of the workforce in the
Nigerian construction industry has prompted the Federal government of Nigeria to import
expatriates from the developed countries to come and assist in construction works (The

376
Nigerian Punch, 2006). Such activity suggests that the local workforce is not competent
enough to handle such big projects due to insufficient skill (Okejiri, 2011).
While the Nigerian government has made concerted efforts to enhance the quality of
vocational technical education to prevent the existence of skills gap (FRN, 2007; Oni, 2007),
educators, and the construction industry have agreed that a skills gap exists between the
knowledge acquired and skills needed by the industries (Udofia, 2012; Ogwo and Oranu
2006; Okejiri, 2011).This skills gap therefore creates unemployment for technical college
graduates.
Unemployment: Despite the large number of graduates of technical colleges in Nigeria and
the availability of the construction work they remain unemployed due to the fact that they are
found incompetent (Obiegbu, 2002; Olaitan et al., 2006).The graduates of technical colleges
in Nigeria are found roaming about the street, mainly because the training acquired do not
match the industry requirement. There are mismatches between skills developed by present
public policies and those required to support structural change and employment in the labour
market (Awe, 2007; Olaitan et al., 2006). According to Olaitan et al., (2006) technical college
graduates are found deficient in practical and technical skills, while Awe, (2007), Udofia,(
2012) reported that the graduates lack employability skills and also they are deficient in
technical skills.
1.3 Factors causing Skills gap
Previous research by Obiegbu, (2002),Olaitan et al., (2006) and others reveal a number of
factors that combine to induce construction skills gap to include: demand for multi-skill
approach, demand for new skills, lack of educational training, rapid change in technology and
inappropriate skills and inadequate training. These are discussed below.
Demand for multi-skill approach: The single skill approach is common in Nigeria, where
workers master one specific craft trade, is said to be becoming increasingly inappropriate and
has given rise to industry fragmentation (Arhani et al., 2003). It is also among the factors said
to be causing skills gap. Conversely, multi skilling where a worker is able to perform several
trades, and up skilling is presently adopted and adapted into the curriculum content during
training programmes in the developed countries. Both approaches have their strength and
weaknesses. Investigations in this area are still sparse in Nigeria (Obiegbu, 2002; Olaitan et
al., 2006; Murray et al., 2002).
However skilled workforce in any construction trade arguably need to be multi-skilled to
enable them to deal with the variety of equipments in use in construction industry (Ness,
2009).
Demand for new skills: Due to advancement in Science and technology the level of skill
required by the industry is increasing thereby calling for new skills and, skills development is
required of the skilled workforce (Mackenzie et al., 2000; Cordery, 2007). Introduction of
new technology has greatly affected the performance of the craft workers due to the out of
date training they had previously acquired coupled with a sizeable number of generic
technologies that are affecting the type and number of construction skills required as
previously mentioned.
Lack of Educational Training: The lack of educational training programmes that are
appropriate in curriculum content and adequate in quality facilities meant for training

377
(Oketch, 2007; Awe, 2007; Olaitan et al., 2006) has contributed greatly to skills gap in
Nigeria. Inappropriate skills and inadequate training from non-experts to the craft trainees
(Oketch, 2007; Olaitan et al., 2006) has contributed greatly to skills gap challenges in the
construction industry. In that vein Awe (2007) and Steedman (1996) referred to it as
negligence in area of education and training.
In general, the quality and training of technical education in imparting skill acquisition is low,
with undue emphasis on theory and certification rather than on practical skills acquisition.
Most technical education departments in Nigeria do not have a well- structured and equipped
laboratories for training. The existing laboratories are out of date and even stocked with
grossly inadequate tools and equipment’s for training (Awe, 2007).
Changes in the nature of work due to technological innovation have created demands for new
skills, and education and training policies to enhance skill development (Awe, 2007; Oketch,
2007; Mackenzie et al., 2000; Forde & Mackenzie, 2004).
Rapid change in technology: The industry all over the globe is experiencing rapid changes
in technology. The reason is not far-fetched because of the computer age which has made it
compulsory for the industry to meet changing situations. Despite this change most industries
and schools in Nigeria are yet to adapt to this trend and make it available for training. This
however, has great constraints and influence on the workforce (Ede, 2010; Femi, 2014). This
calls for demand of new skills in the craft workforce.
Inappropriate skills and inadequate training: The lack of inadequate training and transfer
of inappropriate skill has contributed to part of causes of skills gap, coupled with textbooks
that are out of date which the instructors use in transferring and imparting negative training to
students (Udofia et al., 2012)
2. IMPLICATIONS FOR FURTHER RESEARCH TO UNDERSTAND THE SKILLS
GAP IN THE NIGERIAN CONSTRUCTION INDUSTRY
The review of the literature has shown the potential factor contributing to the technical and
vocational (T&V) skills gap in the Nigerian construction industry. Based on this insight the
implications for further research are considered in this section.
Presently, in the Nigerian construction sector, the issue of skills gap among the craft workers
are increasingly becoming common and this can be linked to the need to meet the huge
housing and infrastructure deficits within the country (Awe 2007; Awe et al., 2010; Ayedun
et al., 2011).
It is thus important that for the local Nigerian context, further research work is undertaken to
elicit other skills gap issues that are not apparent in the extant literature and also to devise
commensurate adequate measures towards the development of a more holistic skills gap
guidance.
The further research work is expected to be addressed by five main steps as part of an on-
going PhD study:
1 To develop a framework for the measurement of skills gap in industry.

378
A framework that would enable a thorough diagnosis of the prevailing skills gaps within the
Nigeria construction sector would be developed through a critical analyses of approached that
have been used within the extant literature for skills gap assessment.
2 To design a framework to access the curriculum of TVE with a view to map the curriculum
with the gap.
Based on the literature review the framework will be designed to examine areas of skill need
in the industry. A framework showing the details of the skills to be learnt according to the
curriculum specified for the craft men will be critically assessed to see whether the
curriculum of TVE constitute the skills needed by the industry.
3. To collect and analyse data.
Data would be collected through survey research administering questionnaire technique on
the respondent, and focus group interview with the stakeholders and other respondents.
Analysis will be carried out via SPSS software version 24 analytical tool and qualitative
approach to understand the intervention needed to address the skills gap. To understand the
nature of the collected, several descriptive statistics including distributions, measures of
central tendency such as means, medians and modes, and measures of dispersion such as
standard deviation will be employed. The focus group interview will be analysed using
thematic content analysis. The analysis will follow the five main steps as designed by
(Creswell, 2009). 1) Transcribing of the audio discussion (i.e verbatim transcription), 2)
Organising and preparing the transcripts 3), Iterative re-reading of the transcripts, 4) Coding
of the transcripts; and 5) Generating themes and sub themes.
4 To validate findings
The result from this research will be validated from stakeholder’s perspectives. The
stakeholders would evaluate the utility and sustainability of both the measuring and mapping
framework to ascertain that the findings truly represent the phenomenon claiming to measure
and map out in the research. The extent to which the research findings and hence the insight
given by the recommended frameworks can be trusted however relies on the process of
validation process that will be undertaking in respect of this research. The research will
under-go both internal and external validity. The four questions relating to four areas of
validity will be addressed as these are 1) Are the constructs valid? 2) Are the statistical
conclusions valid? 3) Does the research demonstrate internal validity? 4) Does the research
demonstrate external validity?
5 Finally conclusions and recommendations will be drawn to address the important gaps
within the technical grades in the construction industry.
8. CONCLUSIONS
The literature has revealed that Vocational and technical education needs to be subjected to
change and reform of its curriculum in order to improve the performance of its graduates.
Recent reports show low levels of training among craft workers in the Nigerian construction
sector, and a decline in construction training relative to developed countries.

379
There are reports of skills gaps across the different categories of skills this leads to
unemployed technical graduates as well as unfilled skilled positions. Although the specifics
of the skills gap have not yet been fully explored, some factors such as inadequacy of the
curriculum and facilities in the education sector could be at play.
Therefore the skills gap needs to be examined in the light of TVET curriculum and
training.There is the need to understand both the nature and extent/size of the skills gap in
different categories of trades in order to design better training and programs. Further research
intended to address this need has been proposed and the key steps involved also outlined.
9. REFERENCES
Abdel-Wahab, M. S., Dainty, A. R., Ison, S. G., Bowen, P., & Hazlehurst, G. (2008).Trends of skills and
productivity in the UK construction industry. Engineering, Construction and Architectural Management,
15(4), 372-382.
Abdullah, S., Zaharim, A., Harris, S. M., Omar, M. Z., Basri, H., & MOHAMED, N. (2007). Engineering
education: using technical attributes to analyse the employers’ expectation of future engineering graduates
in Malaysia. Education, 39, 9-2.
Agapiou, A., Price, A. D., &Mccaffer, R. (1995). Planning future construction skill requirements: understanding
labour resource issues. Construction Management and Economics, 13(2), 149-161.
Akintoye, A. S. (1998). Delivery of postgraduate programmes in construction management in the UK: An
industrial perspective. Building Education and Research, E & F Spon, London, 90-99.
Akintoye, I. R. (2006).Enhancing the performance of the informal sector for the economic development of
Nigeria: A case study of Lagos State. International journal of social sciences, 5(1), 100-112.
Arhani, S., Clarke, L., &Michielsens, E. (2003).The state of construction training and employment in the local
economy of Jersey.Local Economy, 18(3), 196-207.
ASTD (2012) Bridging the skills gaps, report by the American society for training and development. US
Awe, E. M. (2007) Repositioning Technical Education to meet Skilled/Semi Skilled Manpower need. Paper
presented at NARD 4th annual National Conference held at University of Port Harcourt (UNIPORT), 15-
19TH August
Awe, E. M., Stephenson, P., & Griffith, A. (2010, May).Impact of Vocational Training on Skilled Labour
shortage within the Nigerian Construction Sector. In W089-Special Track 18th CIB World Building
Congress May 2010 Salford, United Kingdom (p. 252).
Ayedun, C. A., Durodola, O. D., &Akinjare, O. A. (2011).An empirical ascertainment of the causes of building
failure and collapse in Nigeria. Mediterranean Journal of Social Sciences, 3(1), 313-322.
Bagshaw, M. (1996). Creating employability: how can training and development square the circle between
individual and corporate interest?. Industrial and Commercial Training, 28(1), 16-18.
Bokinni, S. A. (2005). Skills Acquisition and Development for Craftsmen and Artisans. The Professional
Builder, Journal of the Nigerian Institute of Building (NIOB), 12(1), 100-111.
Cappelli, P. (1992). Is the" Skills Gap" Really about Attitudes? EQW Working Papers.
Chan, P. W., & Dainty, A. R. (2007).Resolving the UK construction skills crisis: a critical perspective on the
research and policy agenda. Construction management and economics, 25(4), 375-386.
CIOB (2009) Skill shortages in the UK construction industry.
Cranmer, S. (2006). Enhancing graduate employability: best intentions and mixed outcomes. Studies in Higher
Education, 31(2), 169-184.
Crosthwaite, D. (2000). The global construction market: a cross-sectional analysis. Construction Management &
Economics, 18(5), 619-627.
Crowson, R. L., Wong, K. K., &Aypay, A. (2000). The quiet reform in American education: Policy issues and
conceptual challenges in the school-to-work transition. Educational Policy, 14(2), 241-258.
Dainty, A. R., Ison, S. G., & Root, D. S. (2007). Bridging the skills gap: a regionally driven strategy for
resolving the construction labour market crisis. Engineering, construction and architectural management,
11(4), 275-283.
Dainty, A. R., Ison, S. G., & Root, D. S. (2004). Bridging the skills gap: a regionally driven strategy for
resolving the construction labour market crisis. Engineering, construction and architectural management,
11(4), 275-283.
Dainty, A. R., Ison, S. G., & Briscoe, G. H. (2005). The construction labour market skills crisis: the perspective
of small–medium‐sized firms. Construction management and economics, 23(4), 387-398.

380
Dacre Pool, L., & Sewell, P. (2007). The key to employability: developing a practical model of graduate
employability. Education+ Training, 49(4), 277-289.
Davis, H., &Csete, J. (1998).Matching employer and graduate competency and skills expectations: Construction
and real estate professional degrees .Building Education and Research, E & F Spon, London, 126-135.
Ede, A. N. (2013). Building Collapse in Nigeria: the Trend of Casualties the Last Decade (2000-2010).
International Journal of Civil & Environmental Engineering, 10(6).
Esmi, R., &Ennals, R. (2009). Knowledge management in construction companies in the UK. AI & society,
24(2), 197-203.
Federal Republic of Nigeria (2004) National Policy on Education. Education Research and development
Council Press.
Federal Republic of Nigeria (2007) National Policy on Education. Education Research and development
Council Press.
Femi, O. T. (2014). Building construction technician training: It‟ s relevance to modern construction industry in
Nigeria. International journal of technology enhancements and emerging engineering research, 2(3), 58-68.
Forde, C., &MacKenzie, R. (2004).Cementing skills: training and labour use in UK construction. Human
resource management journal, 14(3), 74-88.
Gann, D., &Senker, P. (1998).Construction skills training for the next millennium Construction Management &
Economics, 16(5), 569-580.
Green, A. (1999) Core skills, participation and progression in post-compulsory education
and training in England and France. Comparative Education (1), 49–67.
Haas, C. T., Rodriguez, A. M., Glover, R., &Goodrum, P. M. (2001).Implementing a multiskilled workforce.
Construction Management & Economics, 19(6), 633-641.
Jagger, N., & Connor, H. (1998).Employers’ and recent postgraduates’ views of the personal skills requirement
of engineering postgraduates .Civil and Structural Engineering Education in the 21st Century, 2, 423-434.
Love, P. E., Haynes, N. S., &Irani, Z. (2001).Construction managers' expectations and observations of
graduates. Journal of Managerial Psychology, 16(8), 579-593.
Mackenzie, S., Kilpatrick, A. R., &Akintoye, A. (2000).UK construction skills shortage response strategies and
an analysis of industry perceptions. Construction Management & Economics, 18(7), 853-862.
Mason, G., Williams, G., & Cranmer, S. (2002). Employability skills initiatives in higher education: what
effects do they have on graduate labour market outcomes? Education Economics, 17(1), 1-30.
Mawer, G., & Jackson, E. (2005). Training of Existing Workers: Issues, Incentives and Models. Support
Document. National Centre for Vocational Education Research (NCVER).
Medugu, N. I., Majid, M. R., Bustani, S. A., Bala, K., Abdullahi, U., &Mbamali, I. (2011). Craft Skills
Availability in the Nigerian Construction Industry: Perception of Contractors and Consultants. IUP Journal
of Infrastructure, 9(3), 63.
Meng, X. (2012).The effect of relationship management on project performance in construction. International
journal of project management, 30(2), 188-198.
Murray, M., Langford, D., & Fisher, S. (2002). Dirty construction workers: who you looking at buddy?.
Proceedings of CIB W65, 1309-1320.
Ness, K. (2009, September). Not just about bricks: the invisible building worker. In 25th Annual ARCOM
Conference (pp. 7-9).
Obiegbu, M. E. (2002). Training and Retraining of Craftsmen for Nigerian Construction Industry: The
Millennium Challenge. The Professional Builder, Journal of the Nigerian Institute of Building, 10(2), 57-
62.
Ogwo, B. A., &Oranu, R. N. (2006). Methodology in formal and non-formal technical/vocational
education.Nsukka: University of Nigeria Press Ltd.
Okejiri, E. C. (2011) Strengthening Technology Transfer Capabilities in the Construction Sector in Nigeria.
Paper presented at a two day National Workshop. Sept21-22 2011. Westtown Hotel Ikeja Lagos Nigeria
Oketch, M. O. (2007). To vocationalise or not to vocationalise? Perspectives on current trends and issues in
technical and vocational education and training (TVET) in Africa. International Journal of Educational
Development, 27(2), 220-234
Femi, O. T. (2014). Building construction technician training: It‟ s relevance to modern construction industry in
Nigeria. International journal of technology enhancements and emerging engineering research, 2(3), 58-68.
.Olaitan, SO, Nwachukwu, CE, Igbo, CA, Onyemachi, GA, Ekong, AO (2006).Curriculum Development and
Management Vocational Technical Education, Onitsha, Cape, Publishers International Limited.
Oni, C. S. (2007). Globalization and Its Implications for Vocational Education in Nigeria. Essays in Education,
21(1), 30-34
Stasz, C. (2001). Assessing skills for work: two perspectives. Oxford economic papers, 53(3), 385-405.
Steedman, H. (1996, May). The German Berufsabschluss qualification: what do German apprentices learn?.
University of Westminster Workshop Skills and the Construction Process.

381
Spenner, K. I. (1983). Deciphering Prometheus: Temporal change in the skill level of work. American
Sociological Review, 824-837.
The Nigerian Punch (2006) Global demand for skilled workers and the search for greener pasture. 27th march,
p.7
Udofia, A. E., Ekpo, A. B., Nsa, E. O., &Akpan, E. O. (2012). Instructional variables and students’ acquisition
of employable skills in vocational education in Nigerian technical colleges. Scholarly Journal of Education,
1(2), 13-19.
UNESCO (1997) The Agenda for the future, Fifth International Conference on Adult Education 14-18 July,
Hamburg.
382
ID 121
EDUCATION MISMATCH OF UNIVERSITY GRADUATES WITH
LABOUR MARKET REQUIREMENT IN LIBYA CONSTRUCTION
SECTOR
A. Osman and D. Baldry
School of the Built Environment, University of Salford, Salford, M5 4WT, UK
Email: [email protected]
Abstract: The consideration of the investment of human capital is the most important issue in
many different countries especially in developing countries which have high and medium
income, for example, Libya. Investment in education is one of the components that lead to
creating a strong environment business as it produces highly qualified graduates to enter the
labour market. However, the graduates may be facing education mismatch for the types of
employment that they gain. The aim of this research is to study impacts of education
mismatch in the Libyan labour market and identify if there is match or mismatch between
educations level with labour market required. Moreover, provide an initial estimate of Libya’s
labour market. This research will identify the determinants of education mismatch for
graduates in Libya and the effect on the performance of their job and the performance of the
organisations. This research will also investigate the effect of education mismatch on the job
satisfaction, particularly in the construction sector in Libya. The sample will be about
construction engineering graduates from different Universities in Libya, whereas the data used
for this paper is the published data from Bureau of Statistics and Census, General information
authority in Libya. This paper will discuss the lessons that can be learnt from the measurement
of education mismatch of graduates from construction engineering in developing countries
recently or currently to overcome challenges of the labour market.
Keywords: Human Capital, Labour Market, Education Mismatch, Construction Sector, Libya.
1. INTRODUCTION
Investment in education, particularly higher education, has been observed as dynamic for
improving an individual's productivity and employability (Becker, 1975). This, in turn, will
raise individual income and social status (Teichler, 2002). The perceived benefits of higher
education have convinced many students in Libya to pursue their studies beyond the
secondary school level, leading to a growing request for tertiary education. The challenge for
different countries is to ensure this educational investment remains a dynamic and not
disruptive force by matching the individual’s job with their educational level.
Understanding the relationship between education and labour markets is significant not only
to graduates but also to educators, economists, and policymakers. There is no doubt that the
quality of education and the number of years of education has a great impact on the future
career of a person. The risk of being unemployed or even employed in a job that does not
match one's education, especially after long years of education, has both negative economic
and social consequences on graduates and their societies.
Matching between an individual’s employment and his/her education is important to realise
the human capital stock of the workforce in the most efficient way. The existence of
education-occupation mismatches has negative effects on the economy (McGuinness, 2006).

383
On the institution level, Tsang (1987) studied the effect of educational mismatch on labour
productivity and found that overeducated employees have negative effects on output. On the
individual level, overeducated employees are not utilising their full investment in human
capital and researchers have found that they tend to receive lower returns compared to those
who are sufficiently matched (Hartog, 2000).
The meaning of education mismatch refers to whether the individual has a level of education
that is above or below the required level of education to proceed in a certain career
(Hartog, 2000). Freeman (1976), in his book “the Overeducated American”, was the first to
discuss the educational mismatch phenomenon. This book concluded that the decline of
returns to education among new entrants to the labour market is due to the fact that the supply
of graduates is higher than the demand for them in the labour market.
Currently, there exists a substantial number of researchers that explore the returns on
educational mismatch. Most of these researchers, however, focus on developed countries.
Few researchers have explored this field in developing countries, such as the research done
by Quinn & Rubb (2004) on Mexico and Abbas (2008) on Pakistan.
This research will seek to ascertain the educational mismatch among Libyan graduates in the
construction sector. The research will investigate its determinants, and its potential effects on
the individual wages, job satisfaction, and job-search behaviour. The data for the research
will be collected by using a questionnaire, which will be completed by the University
graduates who have been employed in the construction sector between 3-5 years after
graduation. Hence, the research will contribute to the existing literature by providing
empirical evidence on the incidence, determinants, and the effects of a mismatch in the
supply of University Graduates with labour market requirements in the construction sector in
Libya.
Figure 1 shows University graduates destination after graduation. They might face four
possible options, which are: they will get a job that matched with their qualifications or
mismatched or they will be unemployed or they may seek employment overseas.
Figure 1: University Graduates Employment Destination
un
iver
sity
gra
du
ates Matched graduate
employment
Mismatched graduateemployment
Unemployedgraduates
Employment overseas

384
2. RESEARCH BACKGROUND AND MOTIVATION
There was growth in the number of higher education organisations in Libya from two in 1975
to 76 universities and technical and vocational organisations by the year 2015 (Libyan
Organization of Policies & Strategies, 2016). As a result, the number of students and
graduates has increased too. Based on the data from Ministry of Higher Education of Libya
(2016), the number of graduates from Libyan universities increased from 36,855 during the
academic year 2009-2010 to 48,095 during the academic year 2014-2015. Also, 45% of the
labour force are from higher Education Level in Libya (World Bank, 2015).
Potentially outdated curricula and a lack of coordination between educational organisations
and the requirements of the labour market are liable to lead to a sense of frustration among
graduates at mismatched educational outcomes which could create a sense of resignation or
cynicism and have a damaging effect on economic and social cohesion. However, it is
unclear if such a highly educated workforce is required in Libya. This might put some
graduates in a position. Where they might have an educational mismatch for their job. A
study by World Bank (2015) argued that the average educational achievement of the
workforce has increased, there is a suggestion that the occupational structure of the labour
market does not have the capacity to absorb the increased number of educated workers into
traditional graduate occupations. These arguments suggested that the expansion of the supply
highly skilled workers, given the slower growth of demand for the same, might potentially
impact unfavourably on the individual as well as the economy, at least in the short run
(Duncan & Hoffman, 1981). Moreover, the detrimental effects of educational mismatch have
the potential to persist even in the long run (Hartog, 2000).
Based on the above, university graduates in Libya might be not matched with labour market
requirements. Studies in different countries have indicated that there is an impact on wages
when there is a mismatch with Labour market. Many graduates are employed in jobs for
which a degree is not required, and in which the skills they learned in higher education are
not being fully used. The challenges facing the labour market in Libya is the lack of
coordination between educational organisations output and the requirements of the labour
market (World Bank 2015).
3. SCOPE OF THE RESEARCH
This paper will focus on the educational mismatch of the University Graduates with Labour
Market Requirement in Construction Sector in Libya. The former is defined as an employee
who has attended a level of education that is higher than what is required for the position he
or she occupies (McGuinness, 2006). The latter describes the extent to which employees are
not able to utilise all their skills and knowledge in their current occupation and where they
have more skills than is required for their current position (Mavromaras, McGuinness, & Fok,
2009). The limited literature has documented the incidence of educational mismatch in North
Africa countries such as Libya (Bedir 2014; Nadia 2014; Angel-Urdinola & Semlali 2010).
A large number of studies on educational mismatch has focused on developed countries and
in particular the UK, U.S., Australia, the Netherlands, and Spain (McGuinness, 2006). Apart
from Quinn & Rubb (2006) who focus on Mexico, there is a scarcity of literature
investigating this issue from the perspective of developing countries. The reviews of the
mismatch literature by Hartog (2000), Sloane (2003), McGuiness (2006) and Leuven &
Oosterbeek (2011) make very little or no mention of matching in low or middle-income

385
labour markets. The main explanation revolves around the paucity of data in developing
countries.
The scope of this study addresses Libya as a developing country with median income, to
investigate the determinants and causes of educational mismatch of university graduates
outcomes in the labour market. This research will concentrate on graduates from universities
in Libya, who have worked in the construction sector recently between 3-5 years after their
graduation, which is the years between 2011-2015, because of changes in the labour market
and the structure of the economy in general, particularly in sectors with a high job-creating
potential in Libya, such as construction. (Abuhadra & Ajaali, 2014).
4. AIM, OBJECTIVES
4.1 Aim
The aim of this research is to investigate the incidence and the effects of educational
mismatch of the university graduates in Libyan construction labour market.
The Libyan construction sector contributes 5.2 per cent of the Libyan Gross Domestic
Product (GDP), and it employs around 3.2 per cent of the total workforce. However, in spite
of the huge investments in construction activities over the past four decades, the Libyan
construction industry is an under-researched and underdeveloped area.
4.2 Objectives
To ascertain the level of Education of graduates from universities who recently or are
currently working in the construction sector.
To establish the nature and the determinants of Educational mismatch of graduates.
To examine the effects of Education mismatch on individuals income, career prospects,
workplace satisfaction and behaviour.
5. LITERATURE REVIEW
5.1 Definition of Educational Mismatch
Educational Mismatch describes the condition where a graduate is vocationally or
academically overeducated or undereducated to perform what the job requires (Sicherman,
1991). There are two fundamental types of education-related job mismatches; horizontal
mismatch and vertical mismatch. A horizontal mismatch refers to a situation where the scope
of a graduate’s degree study is unsuitable for the job position even though the qualification
level is suitable (Robst, 2008). On the other hand, a vertical mismatch occurs when the
required level of education for a specific job is different from the actual level of education of
the worker (Bejaković & Mrnjavac, 2014).

386
5.2 Measurements of Educational Mismatch
Educational Mismatch is measured by comparing a person's current education with the
required education for a specific role. Whereas measuring current educational attainment is
relatively simple, obtaining information on the required education level is more difficult
(Dolton & Silles, 2008). There are three approaches where can be used to measure the
required education which are subjective, objective and statistical methods.
Subjective method [SM], is defined as the Employee’s Self-assessment [EA]. It is based on
employee's own valuation of the level of education required to perform their job (Hartog,
2000). It is, therefore, considered extremely subjective as it depends on the employees’
perceptions. This method has been used by Duncan & Hoffman (1981) and Sicherman (1991)
and more, see table (2). In this approach, employees are asked about their perception of the
required level to do their work and then the difference between their current level of
education and the required level which will locate whether the employee is over/under-
educated. Many studies based on this method have used different questions to inquire about
employees’ views. For instance, Duncan & Hoffman (1981) asked the following question:
how much formal education is required to get a job like yours?. Another study by Alba-
Ramirez (1993) asked this question: what kind of education does a person need in order to
perform your job? By looking to these two questions, one can conclude that the first question
focuses on recruitment standards while the second question focuses on the requirements for
career performance. This means that the same person can give different answers to different
questions which make the use of this method questionable at times, which is the negative
aspect of this model. The positive aspect of this method is that it provides up to date
information about current education requirements. A respondent will be classified as over-
educated if his/her real education is greater than that required education for the career.
Undereducated employees are defined as having education level less than their work
requirement. As a result, a well-matched employee is defined as someone whose employment
level requirement is in line with his/her education level background (Zakariya, 2013).
Objective method [OM], it is defined as the job analysis [JA] method. It uses the
information given by professional analysts related to the qualifications required for a career
[external assessment measure]. Probably, the most famous source of such information is the
Dictionary of Occupational Titles [DOT] in the US and the Standard Occupational
Classification System in the UK. It is used to measure educational mismatch by comparing
current education with the model requirements for a given career. If a person’s current level
of education is higher than what is determined by an occupational job analysis for a given
job, then he/she is considered as over-educated. However, if the level of education are lower
than what the work requires, then the employee is considered under-educated. One of the
criticisms of this model is that having the same job title does not necessarily mean that
employees are doing the same tasks and they may even require a different group of
experiences and different level of education (McGuinness & Bennett, 2007).
Realised Matches method [RM], is defined as the statistical method and can be estimated
using two approaches the mean and the mode. The mean approach is the required amount of
education for an employee as concluded from the mean years of completed studying of all
employees occupancy within the same career (Verdugo & Verdugo, 1988). Employees are
then classified as over-educated or under-educated if their educational level holding is more
than one standard deviation above or below their careers mean educational level. Those
employees with a number of years of education, which is classified within one plus or less

387
standard deviation of the mean, are deemed to be well matched (Zakariya, 2012). The mode
approach was used by Cohn & Khan (1995) and Kiker et al (1997). who used the mode of the
level of schooling instead of the mean. It also does not consider standard deviations.
Employees who are above the mode value are considered over-educated while those below
the mode value are considered under-educated they equal the mode value, then they are well
matched. This method considers the current educational level of employees in any career as
determined by hiring standards and labour market conditions rather than the job requirements
itself (Hartog, 2000).
5.3 Empirical Evidence of Educational Mismatch
Table: 2 Empirical Evidence of educational mismatch
Developed
countries
US
Duncan & Hoffman
(1981)
Subjective
Rumberger
(1987)
Subjective
Verdugo &Verdugo
(1989)
Objective
UK Groot & Brink (1997)
3 different models
Alpin, Shackleton
& Walsh (1998)
Objective &
Subjective
Dolton & Vignoles
(2000)
Subjective
Portugal
Kiker, Santos & De Oliveira, (1997)
3 different models
Canada Vahey (2000)
Subjective
Australia Voon & Miller (2005)
Realised matching method (statistical method)
Poland Kiersztyn (2013)
Objective
Less
developed
countries
Mexico Quinn & Rubb (2006)
Realised matching method (statistical method)
Pakistan Abbas (2008)
Realised matching method (statistical method)
Tunisia Nadia Zrelli Ben Hamida (2014)
Subjective
Egypt Nada Bedir (2014)
Realised matching method (statistical method)
6. METHODOLOGY
The literature applies three different approaches to explain educational mismatch: Worker’s
Self-assessment [WA], job analysis [JA] and Realised matches method [RM]. This study will
use evidence from Libya, in which will be using the approach of self-assessment [WA] of
graduates employees. Since this approach is intended to understand and measure the
occurrence of the phenomenon of educational mismatch and its effects on career progression.

388
This research will use a quantitative method. “Quantitative research is Explaining phenomena
by collecting numerical data that are analysed using mathematically based methods in
particular statistics” (Muijs 2004, p3). Quantitative research is particularly suited to discover
the state of something, also to explain phenomena.
The secondary data collection will largely focus on the datasets of the graduates, who are
working in construction sector recently or currently in Libya, a country in which the state
controls such sectors as the ministry of higher education, the ministry of labour and bureau of
statistics & census in Libya.
The primary data collection would be via questionnaire. All of the respondents will be
contacted through their organisations to obtain their approval to participate in the study. Once
they agreed, the questionnaires will be sent to their contact addresses.
After the process of data collection and statistical analysis, the impact of educational
mismatch on individual wages will be estimated by using econometrics model.
The research will depend on official data from the office of the information and
documentation at the Ministry of Higher Education and the Ministry of Labour and data from
the official organisations in Libya such as the (General Information Authority) and (Bureau
of Statistics and Census) to determine the numbers and information about the graduates who
recently worked in construction sector.
Stratified Random Sample is applied in this research to different faculties graduates in
different universities in Libya. It will be useful if the researcher wishes to be able to make
generalisations because it seeks representation of the wider population (Cohen et al. 2005).
The graduates will be requested to complete an online questionnaire by sending the link to
their contact addresses. Some hard copy questionnaires will be distributed to those who can
not fill the questionnaire online.
The survey will present a rich source of information regarding Libyan university graduates
and link their experience in the labour market. In particular, the survey will contain relevant
data about the individual graduates personal, employment and education characteristics,
marital status and other socioeconomic indicators, which are all are important determinants of
labour market outcomes As these factors are potentially strong predictors of an individual’s
participation, attachment, and performance in the labour market, priority should be given to
the careful and considered procurement of this information.
Although sampling methods in the social and behavioural sciences are often separated into
two groups [probability, purposive], there are actually four broad types as shown in
Figure[2].
Probability sampling methods are primarily used in quantitative research. Tashakkori &
Teddlie stated that ‘‘selecting a relatively large number of units from a population, or from
specific subgroups [strata] of a population, in a random manner where the probability of
inclusion for every member of the population is determinable’’ (Tashakkori & Teddlie
2003,p713). Probability samples aim to reach representativeness, which is the degree to
which the sample accurately represents the whole population.

389
7. CONTRIBUTION TO KNOWLEDGE
This research will highlight the phenomenon of the lack of coordination between higher
education outcomes and the requirements of the labour market which results in mismatches in
the level of education and skilled with the labour market requirements. This research will
seek to clarify empirical evidence to know the causes of this phenomenon in Libya as a
developing country and to reach solutions that help decision-makers at the state level and
educational organisations in Libya to reduce the size of the gap. The research will seek to
determine the effects of this phenomenon on career prospects and job satisfaction for
individuals.
8. CONCLUSIONS
The paper theoretically investigated the determinants and how to measure of the education
mismatch phenomenon, using the self-assessment of graduates, who recently working in
Construction Sector to determine the education mismatch with labour market requirements.
In addition, it is possible to estimate the impact of this phenomenon on wages and job
performance.
9. REFERENCE
Abuhadra, D. S., & Ajaali, T. T. (2014). Labour market and employment policy in Libya.
Alba-Ramirez, A. (1993). Mismatch in the Spanish Labor Market Overeducation? The Journal of Human
Resources, 28(2), 259–278.
Angel-Urdinola, D. F., & Semlali, A. (2010). Labor Markets and School-to-Work Transition in Egypt:
Diagnostics, Constraints, and Policy Framework. World Bank.
Becker, G. S. (1975). Human Capital: A Theoretical and Empirical Analysis, with Special Reference to
Education, Second Edition.
Bedir, N. (2014). The Impact of Over-education and Under-education on Earnings: Egypt in a Post-
Revolutionary Era.
Bejaković, P., & Mrnjavac, Ž. (2014). Skill Mismatches and Anticipation of the Future Labour Market Need:
Case of Croatia. Zagreb International Review of Economics & Business, 17(1), 47–68.
Cohn, E., & Khan, S. P. (1995). The wage effects of overschooling revisited. Labour Economics, 2(1), 67–76.
Dolton, P. J., & Silles, M. A. (2008). The effects of over-education on earnings in the graduate labour market.
Economics of Education Review, 27, 125–139.
Duncan, G. J., & Hoffman, S. D. (1981). The incidence and wage effects of overeducation. Economics of
Education Review.
Hartog, J. (2000). Over-education and earnings: Where are we, where should we go? Economics of Education
Review, 19, 131–147.
Kiker, B. F., Santost, M. C., & Oliveira, M. M. De. (1997). Overeducation and Undereducation: Evidence for
Portugal. Economics of Education Review, 16(2), 111–125.
Leuven, E., & Oosterbeek, H. (2011). Overeducation and mismatch in the labour market. In Handbook of the
Economics of Education (4th ed., pp. 283–326).
Libyan Organization Of Policies & Strategies. (2016). The reality of higher education in Libya. Libyan
Organization of Policies & Strategies.
Mavromaras, K., McGuinness, S., & Fok, Y. K. (2009). Assessing the Incidence and Wage Effects of
Overskilling in the Australian Labour Market. The Economic Record, 85(2), 60–72.
McGuinness, S. (2006). Overeducation In The Labour Market. Journal of Economic Surveys, 20(3), 387–418.
McGuinness, S., & Bennett, J. (2007). Overeducation in the graduate labour market: A quantile regression
approach. Economics of Education Review, 26, 521–531.
Muijs, D. (2004). Doing Quantitative Research in Education with SPSS.

390
Nadia, Z. B. H. (2014). Is the Over-education a Temporary Phenomenon? Case of Tunisian Higher Education
Graduates. Research in Applied Economics, 6(2).
Quinn, M. A., & Rubb, S. (2006). Mexico’s labor market: The importance of education-occupation matching on
wages and productivity in developing countries. Economics of Education Review, 25(1), 147–156.
Robst, J. (2008). Overeducation and College Major: Expanding the Definition Of Mismatch Between Schooling
And Jobs. The Manchester School, 76(4), 349–368.
Sicherman, N. (1991). “Overeducation” in the Labor Market. Journal of Labor Economics, 9(2), 101–122.
Sloane, P. J. (2003). Much ado about nothing? What does the overeducation literature really tell us? In
Overeducation in Europe (pp. 11–45).
Teichler, U. (2002). Graduate employment and work in Europe: Diverse situations and common perceptions.
Tertiary Education and Management, 8(3), 199–216.
The Ministry of Higher Education-Libya. (2016). The Ministry of Higher Education data. URL
http://highereducation.gov.ly access date 30/04/2017
Tsang, M. C. (1987). The impact of underutilization of education on productivity: A case study of the U.S. Bell
companies. Economics of Education Review, 6(3), 239–254.
Verdugo, R. R., & Verdugo, N. T. (1988). Overeducation and the Earnings of Black, Hispanic, and White Male
Workers. Sociological Perspectives, 31(2), 190–212.
World Bank Group. (2015). Labor Market Dynamics in Libya.
Zakariya, Z. (2012). Overeducation And Overskilling In Malaysia.
Zakariya, Z. bin. (2013). Returns to Education : What Does Over-education Play ? Prosiding Perkem Viii, 1(8),
266–278.

391
ID 134
THE IMPACT OF NATIONAL CULTURE ON DISPUTE
RESOLUTION: A LITERATURE REVIEW IN THE CONTEXT OF
STATUTORY ADJUDICATION IN THE CONSTRUCTION INDUSTRY
F. Aminuddin and P. Chynoweth
School of the Built Environment, University of Salford, Salford, M5 4WT, UK
Email: [email protected]
Abstract: The role of culture is important in shaping conflict management and dispute
resolution. As a result, a core question for the field of dispute resolution is the degree to which
the cultural values of people within a particular society lead certain forms of dispute resolution
to be more or less effective than others. The current study posits that for imported foreign
legislation to be effectively exercised in a different local setting, local culture and the variety
of conflict management styles ordinarily used within the receiving society need to be taken
into account. This paper explores the complex and multidimensional question of how national
culture affects dispute resolution styles from the unique perspective of statutory adjudication
within the construction industry. Hence, the paper presents initial work, in a research project
using a Malaysian case study to assess the viability of implementing a western-style statutory
adjudication regime in an Asian construction industry setting. It reviews key literature in
relevant fields to assist in the development of a theoretical framework to guide the study’s
ensuing empirical investigations into the question of why parties in the Malaysian construction
industry might choose to employ adjudication to resolve their dispute.
Keywords: Adjudication, conflict management, dispute resolution, national culture
1. INTRODUCTION
In an ideal world, there would be no conflicts and disputes in a perfect construction project.
There would be perfect communication, perfect mutual understanding and perfect harmony
between individuals engaged in the project decision-making process (Cheung, 2014).
Nevertheless, in reality, these factors are susceptible to disagreement and differing interests
that, unless managed and resolved, will escalate into disputes. The severity of this
phenomenon has the potential to turn an otherwise a successful project into an unsuccessful
one. Construction activity is a complicated process involving many disciplines with a diverse
set of skills (Kangari, 1995) where by its very nature, problems are bound to arise in the
undertaking such a complex tasks due to widely differing values and goals among project
participants. There is a pressing demand for an initiative to sustain and maintain the
industry’s positive and impressing growth. Devastating scenes such as late and non-payment
were widely recognised as a rampant, common and boundless problem in the construction
industry and persisted in one project after another regardless of whether it is a public or
private contract (Danuri et al., 2006).
The Malaysian Government has long recognized problems facing parties to construction
contracts in securing regular and timely payment that impacts cash flow project
implementation. In ensuring the impressive growth of the industry, Malaysia has extended its
purview to look to the Western world in order to seek better ways to tackle the default system
of dispute resolution for payment problems within the construction industry that were not
working well. According to the Construction Industry and Development Board (CIDB),

392
under those circumstances, the landscape of the Malaysian construction industry does need
altering for the better. Hence, CIDB has been mandated to shoulder the task in drafting
Malaysia’s own legislation of the Construction Industry Payment and Adjudication Act
(CIPAA) development.
The Malaysian Government has long recognised problems facing parties to construction
contracts in securing regular and timely payment that impacts cash flow project
implementation. In ensuring the impressive growth of the industry, Malaysia has extended its
purview to look to the Western world to seek better ways to tackle the default system of
dispute resolution for payment problems within the construction industry that were not
working well. According to the Construction Industry and Development Board (CIDB),
under those circumstances, the landscape of the Malaysian construction industry does need
altering for the better. Hence, CIDB has been mandated to shoulder the task in drafting
Malaysia’s own legislation of the Construction Industry Payment and Adjudication Act
(CIPAA) development.
The paper outlines an early work of a research project of a single case study of the Malaysian
adjudication regime to assess the viability of the implementation of a western-style statutory
regime in an Asian construction industry setting. It sets to review some of the key literature in
the fields of national culture, dispute resolution, and conflict management style to develop a
theoretical framework that will guide the study’s to pursue an empirical investigation on the
issue of employment of adjudication as a method to resolve payment dispute
2. NATIONAL CULTURE
In the past, there was a strong belief that human nature was universal. However, it has been
claimed that globalisation has led to an increased emphasis on cultural diversity and its
influences on personal, social and organisational practice in many ways (Kaushal and
Kwantes, 2006). Globalization is argued led to Westernization of people in Eastern cultures
that drive homogenization (Laugani, 2006). Stiglitz (2002) opines that in the long-run,
globalisation and homogenization will have a devastating effect on developing countries and
it will result in the erosion of their cultural traditions.
Culture as a concept is complicated to define. Authors who have written on this topic in some
ways deal with the definition of culture differently. Hofstede (1984) defines culture as the
collective mental programming of the people in an environment. Culture is not a
characteristic of individuals, but it encompasses many people who were conditioned by the
same education and life experience. Hence, in more practical terms, culture refers to the
collective mental programming that the people of a group, tribe, a geographical region, or
even a nation have in common, and the programming is different from one to another.
The concept of national culture has suffered from vagueness, and there has been little
consensus on what represents the national culture. Since culture is an intangible concept, a
growing stream of cross-culture research described the necessity to develop a means of
making it more concrete. Thus, scholars identified and categorised culture in the form of a
structure called culture dimensions. We can use these categories to differentiate one culture
from another. The term national culture dimensions have been originally defined as
categories that organise data culturally (Hoft, 2003). It has been used to map culture
differences regarding values and practices embraced by an organisation (Ankrah and

393
Langford, 2005; Liu et al., 2006). The notion of national culture dimensions originated in
cross-cultural communication research done by Hall et al. in the 1950s. Since then, a number
of models and dimensions of national culture have been established.
Figure 1: Five core levels of culture
Source: Hawkins, P. (1997). Book Review: Organizational Culture: Sailing Between
Evangelism and Complexity. Human Relations, 50(4), 417-440. p. 7.
The reorientation of culture by Avruch (1998) supports the view that individuals embody
multiple cultures that are always in the case of psychology and socially distributed. Thus, the
study proposes that defining certain culture dimension does not mean every individual who
falls in the same groupings of a nation has the same dimensions. As depicted in Figure 1, the
argument advanced here addresses the motivational roots of behaviours that are grounded in
individuals’ unconscious desires to create an environment which can be regarded as
meaningful.
The score obtained by Malaysia on each dimension of Hofstede’s national culture values out
of 120 scores is discussed in this paragraph. Malaysia scores very high on power distance
dimension (100 scores), meaning that the society accepts a hierarchical order in which
everybody has a place, and it needs no further justification, and the ideal boss is a kind
autocrat. Challenges to leadership are not well-received. With a score 26, Malaysia is a very
collectivistic society. Loyalty in a collectivist culture is vital and overrides most other societal
rules and regulations. Such a society fosters strong relationships where everyone takes
responsibility for fellow members of their group. Although scoring 50, Malaysia still can be
considered a masculine society which is a success-driven society. Conflicts are resolved by
fighting them out. Malaysia scores 36 in uncertainty avoidance dimension and thus, has a low
preference for avoiding uncertainty. Low uncertainty avoidance index societies maintain a
more relaxed attitude in which practice counts more than principles and deviance from the

394
norm is more easily tolerated. Rules should be no more than are necessary and if they are
ambiguous and do not work, they should be abolished or changed.
Hofstede’s dimensional model of national cultures values has been applied to various areas of
differences of the concepts of self, personality and identity, which in turn explain variations
in conflict resolution strategy. The increasing amount of study in industry-specific and
culture-specific themes indicates the importance of understanding culture in ADR arena.
However, there is an extreme dearth of literature sources on the discussion of the Hofstede’s
national culture theory within the context of the relations between the Malaysian national
culture and conflict resolution. Attempts have been made to predict what conflict
management styles suit a certain culture of society. For example, collectivism/individualism
has been vastly utilised by researchers in explaining differences in the interpersonal
behaviour in conflict management field. Summarizing the findings from the literature, it is
found that individualist society tends to adopt more confrontational nature in resolving
disputes while collectivism society tends to adopt a less confrontational method in resolving
disputes.
An inference suggested from these findings is that, since Malaysia, according to Hofstede’s
dimensional model of national culture, is a very collectivistic country, a less confrontational
method of dispute resolution is viewed as the most appropriate way that best suited with the
culture the Malaysian of society.
Although the above submission may be true, the study opines that Hofstede’s theory of
national culture should not be taken lightly to fit in whatever form of cultural labelling
without taking account many other “situational” factors associating to the decision to adopt
certain conflict styles. Thus, this study seeks to explore what the real truth is surrounding the
rapidly changing of the Malaysian dispute resolution landscape in the construction industry.
To achieve this, the study chooses to see from the perspective of conflict goals of the
disputants to help for a better understanding on how national culture characterises a particular
society’s conflict management styles.
3. THE EFFECTS OF NATIONAL CULTURE ON THE CHOICE OF CONFLICT
MANAGEMENT STYLES
In recent years, there has been recognition of the relationship between conflict management
styles with national culture. A substantial body of literature which relate national culture
issues to the construction industry, especially in the field of construction management, has
recognised the need to have a full appreciation of the influences that national culture has on
their functioning in conflict management and dispute resolution measures are to be effective
and worthwhile. Previous studies also demonstrated the influence of national culture on
conflict management and dispute behaviours (Swierczek, 1994; Morris et al., 1998; Tsai and
Chi, 2009; Gad and Shane, 2011). The studies found significant contrasting patterns that have
been observed repeatedly of how international construction professionals behave differently
in their styles of managing conflicts and resolving disputes.
Hence, conflict management and dispute resolution processes are greatly influenced by
cultural characteristics. As a matter of fact, disputes and conflicts which occur within the
framework of a culture’s institutions need that particular culture to provide a clear context of
what dispute resolution methods (Tsai and Chi, 2009) best suit their way of life. The
395
consequences of the three central cultural ingredients – beliefs, values and norms influence
the members of the community to behave and act in ways considered acceptable by other
members of the group (Rashid and Ho, 2003) but may be unsuitable and unacceptable to
members of a different group.
4. WESTERN VERSUS EASTERN CULTURE IN CONFLICT MANAGEMENT AND
DISPUTE RESOLUTION
Many studies have investigated so-called “East-West differences” by comparing construction
professionals from the United Kingdom and the United States of America to a matched group
in an Asian society (Morris et al., 1998). The study by Chan and Tse (2003) yields some
interesting key observations about the issue of cultural clashes between the Western and
Eastern styles of tackling disputes in international construction projects. The interpretation of
the study shows that there was a stronger indication that the Asians prefer informal methods
for resolving contract disputes in international projects in comparison with the Westerners.
Importantly, the study provides a good indication that cultural clash is one of the most crucial
factors contributing to disputes in international projects.
Hofstede indicated that collectivism/individualism was the major construct between the
Eastern and Western societies. In general, Asian people measure high on collectivism as they
emphasise cooperation, interdependence, and harmony (Johnny et al., 2010). They are more
concerned with the consequences of their behaviours on their in-group members and are more
likely to sacrifices personal interest for the attainment of collective interest (Hofstede, 1984;
and Chan and Goto, 2003). Contrast with individualism; the culture characteristic are in
which they have a higher sense of personal identity, striving to be one’s true self, have an
internal locus of control and principled moral reasoning (Waterman, 1984). As a result, there
are fundamental differences between a society’s cultural background that determine their
perception and reaction to dispute, as well as the coping mechanism employed by project
parties in a construction contract. Conflict management styles considered as adversarial in
non-western societies may not perceive similarly in western societies and vice versa.
Management of conflict and dispute resolution between two cultures can also differ.
In their study investigating how ethnic differences between the Korean and American
employee, Lee and Rogan (1991) found that in organisational conflict management
behaviours, Koreans are extensive user of solution-oriented strategies, while Americans
prefer to use either confrontational and control strategies in dealing with organisational
conflicts. Moreover, findings also indicate that Koreans are more sensitive in exercising
power when facing conflicts with subordinates in the organisation.
In a different study, Morris et al., (1998) found that a problem in joint ventures between U.S.
and Asian firms is that cultural differences impede the smooth resolution of conflicts between
managers. In a survey of young managers in the U.S, China, Philippines, and India, they
found support for two hypotheses about cultural difference in conflict management style and
cultural values that account for these differences. First, Chinese managers rely more on an
avoiding style because of their relatively high value on conformity and tradition. U.S.
managers rely more on a competing style because of their relatively high value on individual
achievement.

396
Interestingly, Cai and Fink (2002) in a more latest study investigating the fundamental beliefs
regarding cross-cultural differences in conflict styles consisted of graduate students from 31
different countries residing in the U.S. found that assumptions regarding the relationship of
culture to conflict style preferences may not be true. Individualists do not differ from
collectivists in their preferences for the dominating style. This finding strengthens the study’s
verdict that the interpretation of conflict styles across culture is more complex than we
believed.
5. SECURITY OF PAYMENT REGIME AND ADJUDICATION ACT
Considering payment disputes in construction are rampant and often complex, industry
players and professional bodies recognised the necessity for the matter to resolve promptly.
Numbers of developed Western countries have adopted a sort of industry-specific legislation
with the aim to resolve cash flow related problems and improve the efficiency of dispute
resolution within the construction industry. Such legislation was considered necessary to
protect the parties who are susceptible to cash flow related problems especially the
contractors, subcontractors, consultants, and suppliers who are normally payees in the
industry (Munaaim, 2012. Industry-specific security of payment legislation reportedly has
improved payment practice has therefore been introduced to increasing numbers of countries
(Gould & Linneman, 2008; Brand & Davenport, 2012; Teo, 2008).
The legislation provides new statutory rights to payment, added to existing contractual rights,
together with a mechanism to determine some or all of the rights of parties to construction
contracts via adjudication (Munaaim, 2010). Available and linked to the security of payment
regime are further remedies for the unpaid party to employ the adjudication procedure if the
payment provisions stipulated in the contract are not complied with, or the options to resolve
the payment dispute in an adjudication to obtain a decision of that are not available.
The UK became the first country in the world to enact this kind of legislation under the
Housing Grants, Construction and Regeneration Act (HGCRA) 1996. It is one of the most
important pieces of legislation that the construction industry has ever been obliged to
understand. The introduction of adjudication is a revolutionary step taken to introduce a
mandatory regime, which, with some categories of exceptions, will apply to all construction
contracts. Adjudication was enacted as a medium of improving payment practice in the UK.
It is a statutory right that can be enforced unilaterally at any time during construction contract
and provides a quick resolution and an inexpensive alternative compared to arbitration and
litigation.
Construction adjudication produces a decision that is temporarily binding until disputes are
resolved, and the decisions are overturned by arbitration, litigation, or agreement. Not long
after the “success” of adjudication in the UK (Gaitskell, 2007), some Western countries such
as Australia, New Zealand and soon, Ireland, have introduced and enforced a similar kind of
jurisdiction.
Now with the globalisation as the background, Western civilisation especially the Anglo-
Saxons, holding the influential position, is spreading its influence in every part of the world,
including South East Asia. The pace of implementing adjudication is growing substantially.
In this way, there is a common platform for the discussion in South Asian countries to adopt
397
the same idea of introducing a quick and rough justice for payment problem in their
construction industry.
6. STATUTORY ADJUDICATION: THE MALAYSIAN CONSTRUCTION
INDUSTRY ADJUDICATION AND PAYMENT ACT (CIPAA) 2012
As discussed earlier, the payment scenario in Malaysia is no different. An empirical
investigation conducted by the Masters Builders Association Malaysia (MBAM) with the
CIDB and the University Malaya (UM) in 2006 on payment problems shows that payment
delays and payment defaults are serious. It also extends the findings to predict an estimate of
delayed and non-payment amounts based on a sample of industry players on the amount of
unpaid work from the year 2000 and 2006. Roughly, the projected estimated figures are
billions of Ringgit. The survey has confirmed the harsh reality of payment default to be a
major problem and to be the biggest barrier from improvement and changes to a
modernization of the industry (Ameer Ali, 2006 and Fong, 2007).
With the aim to improve payment practice and dispute resolution in Malaysia, the
Construction Industry Payment and Adjudication Act 2012 (CIPAA) has officially come into
operation. The Kuala Lumpur Regional Centre for Arbitration (KLRCA) has been named as
the authorized nominating body to perform various functions including appointing,
administrative and training authority for statutory adjudication under CIPAA (Rajoo, 2014).
The relatively new Malaysia adjudication legislation has unique features that claimed to have
taken into account cultural differences as well as different construction industry customs and
practices (Lawless, 2012). By looking at the law itself, the aim of CIPAA is described as:
An Act to facilitate regular and timely payment, to provide a mechanism for speedy
dispute resolution through adjudication, to provide remedies for recover of payment
in the construction industry and to provide for connected and incidental matters.
KLRCA defines adjudication as a summary procedure of legislative intervention for dispute
resolution under a construction contract. It allows the party who is owed monies (“the
claimant”) under a construction contract to have the disputes resolved with the non-paying
party (“the respondent”) in a quick and cheap manner. Disputes which are referred to
adjudication under the CIPAA relate to payment for work done and services rendered under
the express terms of a construction contract. Adjudication is a mandatory statutory process
that does not require an agreement between the parties of the contract and it prevails over any
contractual agreement to the contrary between the parties.
7. THE MALAYSIAN CULTURE AND CONFLICT RESOLUTION
Malaysia is a plural, but largely segregated society and its shareholding structure reflect this
feature. An examination as to cultural preferences of dispute resolution should take this into
account. Scholars have made some generalisations as to conflict mediation in Eastern
societies, but no specific studies have been made about stakeholders’ dispute in resolution in
Malaysian companies (Augsburger, 1992; Lederach, 1995 and Karim, 1990). However, Wall
and Callister (1999) indicate the plausibility that ‘the Chinese would be more receptive to
assertive mediation’ while the Malays ‘would be more comfortable with an informal
listening, opinion gathering and discussion approach’.

398
It was also said that the Chinese have a general aversion towards the judicial system a forum
for dispute settlement, which is historical baggage from the period they were discouraged
from seeking settlement by way of litigation. Therefore, the existing social institution played
a far more active role to help resolve disputes (Goh, 2016). Hooker (2002) noted that in pre-
independent Malaya, no commercial disputes were ever brought to the colonial courts for
adjudication based on Chinese customs. Culture and history may well be the cause of this,
even today, from the frequency of shareholders’ litigation, it would appear that there is still
an aversion towards the formal judicial system to solve disputes.
The above submission seems to suggest that in resolving a dispute, the Malaysian society
tends to incline towards amicable settlement via negotiation and mediation. However,
following the rapid change of construction dispute landscape and increasing complexity of
construction projects in a developing country like Malaysia, to what extent this practice is
applicable to the local construction industry?
8. THE INFLUENCE OF NATIONAL CULTURE ON THE INTRODUCTION AND
THE IMPLEMENTATION OF STATUTORY ADJUDICATION IN MALAYSIA: A
RESEARCH PROPOSAL
Following the well-publicised concerns that no assumption is made that the Western model is
generalizable to all cultures, coupled with the topical phenomenon that; (1) Malaysia is a
newcomer, being the second country in Asia after Singapore to enforce statutory adjudication
at its national level; (2) the distinct feature of adjudication practice that requires the parties to
be competitive and confrontational in nature that may go against the custom values of the
Malaysian; and (3) adjudication, like litigation and arbitration provides a win-lose, rough
justice solution that potentially may tarnish a harmony working environment between the
construction parties of the Malaysian community; there is an emergence of an apparent
questions of cultural “suitability” and “acceptability” of adjudication under CIPAA, being
another form of dispute resolution mechanism drawn from foreign management system into
domestic settings. Is the adjudication system, largely developed in Western culture,
applicable elsewhere?
Having arrived at the research problem through the literature, informal consensus was
obtained by the practitioners of adjudication in the Malaysian construction industry to
determine whether these experts had noticed the influence of national culture characteristics
on the implementation of adjudication, if so, whether national culture was perceived to be
problematic in the implementing a successful adjudication system in Malaysia.
It was also loosely evident that some adjudicators have less confidence that adjudication will
achieve the same level of satisfaction as practised in the UK. The submission is based on the
opinion that adjudication may help to boost the payment default issue in the industry but it
may go against the custom of the local industry players. Some claim that payment culture in
the Malaysian construction industry experiences no significant changes after the introduction
of CIPAA. In Malaysia, the Act is relatively new, but if observed from the cultural
perspective, a sound scientific analysis is worth to be placed on the national cultural
characteristic issue to the implementation of adjudication in Malaysia.
It is further claimed that Malaysian working culture is much different from that Western
societies. This is because, looking at the social scenario, due to the shared working-values of

399
the Malaysians, the industry is autonomously run and where decisions of the people in the
industry are dictated by political and social influences. Hence, if adjudication is to be totally
implemented in Malaysia, a further closer look must be placed upon the local custom of the
industry. CIPAA must not be a copy or a duplicate of a system from the Western
jurisdictions.
The body of literature hints that the construction industry tends to overlook the potentials of
human-related “soft” factors or behavioural aspects of the conflict management in improving
dispute resolution processes. For example, York’s (1996) model helped the construction
stakeholders to select the best resolution strategy based on predominantly “hard” factors that
are mainly concerns with time cost, degree of control by parties and flexibility. Brown and
Marriott (1999) found that, amongst others, factors such as confidentiality, remedies,
enforceability, degree of formality and type of contract are the key selection factors adopted
for mapping a dispute resolution method. However, David (1998) and Cheung and Suen
(2001) recognized the importance of human nature in dispute resolution, expanded the
selection factors by adding factors like cultural factors, preservation of business relationships
and relationships between parties as the project key success factor.
Malaysia’s exposure to Western ways has resulted in adopting western management and
technology. Mendoza (1991) points out that: “When we in Asia adopted Western
management technology, we swallowed it, whole hog. We bought it lock, stock and barrel, its
principles, its legal under-pinning, its underlying assumptions; no exceptions, no returns no
refunds. We have spent the last four decades trying to fit into the well-rounded Asian souls
and sensibilities into the square hole of the Western mind. And it has been a clumsy fit”.
These are some of the many views suggesting that Malaysia may faces difficulties with the
adoption of foreign practices; to a certain extent they seem to be unsuitable to the local
environments. At the same time, these also reflect the need to engineer its own practices. One
of the basic challenges in a developing country face is to find and identify those parts of their
own tradition, history and culture that can be used as management building blocks.
Familiarization with foreign legal systems increases opportunities to borrow ideas from them.
However, what is the likelihood of viability of applying these ideas and what will be the
social cost? The very core issue addressed in this paper is the degree to which cultural values
shape the viability of dispute resolution mechanism in construction industry. Using this
scholarship, this study argues that cultural differences present formidable barriers that should
not be ignored in analysing emulation of legislation.
9. CONCLUSION
This paper has noted that the literature clearly suggests that cultural factors are significant
dominant of the viability of particular dispute resolution methods. Specifically, it shows that
culture is not a character of individuals, but rather a character of a group of people that
subject to the same experience in an environment. Cultural variables can predict some aspect
of conflict resolution practices. It is found that confrontational methods were more preferable
by individualist society compared to collective society that may choose a less controlling
method in resolving dispute. Hence, conflict management styles are greatly influenced by
cultural characteristic.

400
The paper has described the conflict resolution strategy from national culture perspective
base by reference to the Hofstede’s theory of national culture which incorporates especially
from individualism/collectivism theme. It has demonstrated how this knowledge base
incorporates a number of areas of differences of the concepts of self, personality and identity
which in turn indicate the importance of culture-specific themes in understanding the viability
of an ADR within a specific country.
According to this view the recent introduction of the western-style statutory adjudication
regime in Malaysia might be considered to be a poor cultural fit. This provides the inspiration
for the current study which will explore the complexity of the relationship between national
culture, conflict management styles and the dispute resolution processes. A theoretical
framework will be developed for the study based on the dimensions of national cultural
variations reviewed here as well as further theoretical work which has also been undertaken
on styles of conflict management.
The study will then apply this understanding to the empirical world to investigate the
appropriateness for the implementation of adjudication as a mechanism for construction
dispute resolution in the context of the Malaysian culture and to understand why Malaysian
construction players, contrary to collectivistic practice, choose to employ a confrontational
mechanism like adjudication to resolve their dispute.
10. REFERENCES
Augsburger, D. W. (1992). Conflict mediation across cultures: Pathways and patterns. Westminster John Knox
Press.
Ankrah, N. A., & Langford, D. A. (2005). Architects and contractors: a comparative study of organizational
cultures. Construction Management and Economics, 23(6), 595-607.
Ameer Ali, N. A. N. (2006). A “Construction Industry Payment and Adjudication Act”: Reducing Payment-
Default and Increasing Dispute Resolution Efficiency in Construction”.
Avruch, K. (1998). Culture and conflict resolution (Vol. 31). US Institute of Peace Press.
Brand, M. C., & Davenport, P. (2012). Adjudication in Australia: An Analysis of the Amendments Introduced
by the Building and Construction Industry Security of Payment Amendment Act 2010 (NSW). International
Journal of Law in the Built Environment, 4(3), 189-202.
Brown, H. J., & Marriott, A. L. (1999). ADR principles and practice (p. 12). London: Sweet & Maxwell.
Cai, D., & Fink, E. (2002). Conflict style differences between individualists and collectivists. Communication
Monographs, 69(1), 67-87.
Chan, D.K.-S., and Goto, S.G. (2003), “Conflict resolution in the culturally diverse workplace: Some data from
Hong Kong employees”, Applied Psychology: An International Review, 52(3), 441-460.
Chan, E. H., & Tse, R. Y. (2003). Cultural considerations in international construction contracts. Journal of
construction engineering and management, 129(4), 375-381.
Cheung, S. O. (2014). Dispute Avoidance Through Equitable Risk Allocation. In Construction Dispute Research
(pp. 99-109). Springer International Publishing.
Cheung, S. O., & Suen, H. C. (2002). A multi-attribute utility model for dispute resolution strategy selection.
Construction Management & Economics, 20(7), 557-568.
Danuri, M. M., Munaaim, M. C., Rahman, H. A., & Hanid, M. (2006, November). Late and non-payment issues
in the Malaysian Construction Industry-Contractor's perspective. In International Conference on
Construction, Culture, Innovation and Management (CCIM).
Fong, L. C. (2007). The Malaysian Construction Industry – The Present Dilemmas of the Unpaid Contractors.
International Forum Construction Industry Payment Act and Adjudication. Kuala Lumpur: CIDB and ISM
Gad, G. M., & Shane, J. S. (2012). A Delphi study on the effects of culture on the choice of dispute resolution
methods in international construction contracts. In Construction Research Congress 2012: Construction
Challenges in a Flat World (pp. 1-10).
Gaitskell, R. (2007). International statutory adjudication: Its development and impact. Construction
Management and Economics, 25(7), 777-784.
Goh, B. C. (2016). Law without lawyers, justice without courts: On traditional Chinese mediation. Routledge.

401
Gould, N., & Linneman, C. (2008). Ten years on: Review of adjudication in the United Kingdom. Journal of
Professional Issues in Engineering Education and Practice, 134(3), 298-301.
Hawkins, P. (1997). Book Review: Organizational Culture: Sailing Between Evangelism and Complexity.
Human Relations, 50(4), 417-440.
Hofstede, G. (1984). Culture's consequences: International differences in work-related values (Vol. 5). Sage.
Hoft, N. L. (2003). Communicating the risks of natural hazards: The world-at-large is at stake. Global
documentation: Case studies in international technical communication. Boston: Allyn and Bacon.
Wong, J., Teo, M., & Cheung, Y. K. F., (2010) Cultural determinants of stress in the construction industry. In:
Proceedings of 2010 International Conference On Construction & Real Estate Management, 1‐3 December
2010, Royal on the Park Hotel, Brisbane,Queensland.
Kangari, R. (1995). Risk management perceptions and trends of US construction. Journal of Construction
Engineering and Management, 121(4), 422-429.
Karim, W. J. B. (1990). Emotions of Culture a Malay Perspective.
Kaushal, R., & Kwantes, C. T. (2006). The role of culture and personality in choice of conflict management
strategy. International Journal of Intercultural Relations, 30(5), 579-603.
Lederach, J. P. (1995). Preparing for peace: Conflict transformation across cultures. Syracuse University Press.
Mendoza, G. A. (1991). Management, the Asian way. Asian Institute of Management.
Morris, M. W., Williams, K. Y., Leung, K., Larrick, R., Mendoza, M. T., Bhatnagar, D. & Hu, J. C. (1998).
Conflict management style: Accounting for cross-national differences. Journal of international business
studies, 29(4), 729-747.
Munaaim, M. C. (2010, July). Key features of an effective adjudication regime. In Australian Universities
Building Education Association (AUBEA) Conference (pp. 14-16).
Rashid, M. Z. A., & Ho, J. A. (2003). Perceptions of business ethics in a multicultural community: The case of
Malaysia. Journal of Business Ethics, 43(1-2), 75-87.
Rajoo, S. (2014). The Construction Industry Payment and Adjudication Act 2012 Comes into Operation. Press
Release of Kuala Lumpur Regional Centre for Arbitration. 15 April 2014.
Stiglitz, J. E. (2004). The roaring nineties: a new history of the world's most prosperous decade. WW Norton &
Company.
Swierczek, F. W. (1994). Culture and conflict in joint ventures in Asia. International Journal of Project
Management, 12(1), 39-47.
Teo, P. J. (2008). Adjudication: Singapore Perspective. Journal of Professional Issues in Engineering Education
and Practice, 134(2), 224-230.
Trompenaars, F., & Hampden-Turner, C. (2011). Riding the waves of culture: Understanding diversity in global
business. Nicholas Brealey Publishing.
Tsai, J. S., & Chi, C. S. (2009). Influences of Chinese cultural orientations and conflict management styles on
construction dispute resolving strategies. Journal of Construction Engineering and management, 135(10),
955-964.
Wall Jr, J. A., & Callister, R. R. (1999). Malaysian community mediation. Journal of Conflict Resolution, 43(3),
343-365.
Waterman, A.S. (1984), The psychology of individualism, New York: Praeger.
York, S. D. (1996). Practical ADR. FT Law & Tax.

402
PROPERTY AND PROJECT MANAGEMENT

403
ID 004
THE NOMENCLATURE OF GEOTECHNICAL ERROR TRAPS AS A
THEORETICAL FRAMEWORK FOR ASSESSING FINANCIAL RISK
IN TRANSPORTATION INFRASTRUCTURE PROJECTS
A. Amadi1 and T. Omotayo2
1School of the Built Environment, University of Salford, Salford M5 4WT, UK 2 Robert Gordon University, UK
Email: [email protected]
Abstract: Engineering and re-engineering issues related to ground conditions, have being
consistently discussed in the technical press, as the cause of significant cost and time overruns
in highway projects located in different parts of the world. The literature continues to report
statistics of widely publicized projects which have significantly exceeded their initial budget
due to geotechnical uncertainties. Despite these widely-publicized case histories, there is a
discernible gap in the scholarly literature on studies that have analyzed in-depth, the
fundamental geotechnical drivers in practice, which represent the underlying error traps
creating a propensity for highway projects to run over budget. In view of the calls for
construction industry researchers to shape tomorrow’s built environment, this study analyses
and synthesizes the nomenclature of geotechnical error traps, as a theoretical framework for
assessing financial risk due to inadequate geotechnical risk containment. The study findings
reveal arguments and widely contested issues in geotechnical practice, which to various
degrees, can have significant financial impact on project completion cost in highway projects.
This study thus provides clients for road projects (highway agencies), who constitute the
primary target audience, with the necessary theoretical perspective necessary to understand the
various trajectory through which geotechnical risk can trigger inefficiency and wastage of
financial resources on transportation infrastructure projects.
Keywords: Cost Overruns, Error Traps, Geotechnical, Risk.
1. INTRODUCTION
Ground conditions have been repeatedly asserted to account for a huge percentage of the
technical risk posed to highway development, due to its complex interfaces with the design
and construction of transportation projects. Several publications (Peacock, and Whyte, 1992;
Alhalaby and Whyte, 1994; Whitman, 2000; Clayton, 2001; Venmans, 2006) have identified
ground conditions, and the relatively high level of uncertainty associated with it, as one of the
most fundamental technical explanation of cost overruns in highway projects. Engineering and
re-engineering issues related to ground conditions have being consistently discussed in the
technical press, as the cause of significant overruns in highway projects located in different
parts of the world, with huge economic implications (NEDO, 1983, 1988; NAO, 1994; ICE,
2001; Alavi and Tavares, 2009; DETR, 2014).
In 1990, an analysis of 67 highways contracts in the UK, revealed average cost overrun value
of 28%, 17 of which showed 44% cost increases due to earthworks and unforeseen ground
conditions (ICE,1991). The National Audit Office (1994) also reported 210 cases of
premature failures, worth about £260 million, due to inadequate ground investigations. The
National Audit Office (2001) further revealed that 70% of public sector projects experienced
delays, with 73% over budget, in the face of dwindling investment in ground investigations.
404
The New Civil Engineer (2011), reported an audit of geotechnical failures, in the
Netherlands, which were estimated as costing between 5% and 13% of annual expenditure
(€70bn/£61b).
Significant cost overruns of up to £516 million were revealed by, the Department of the
Environment, Transport and the Regions (DETR, 2014), in the seven largest road projects
executed, due to unforeseen ground conditions, accounting for a 63% increase above
budgeted funds. Of the seven projects, the M60 Manchester ring road incurred the highest
cost overrun of £184 million, because unforeseen ground conditions amounting from delays
of 35 to 46 weeks, and claims worth £30 million. Five of the schemes included within the
DETR analysis were also revealed to be between one to five years behind schedule.
The Hallandsås Tunnel Project, Sweden, designed for the construction of two 8.6 km long
railway tunnels at an initial budgeted cost of £440 million in 1992, escalated to £840 million
in 2008, due to unforeseen ground and water conditions (Creedy, 2006). The project was
abandoned at 3 km (30%) completion in 1995, resumed in 1996, discontinued in 1997, and
resumed in 2004, after seven years. Work progress in as at 2009, was measured to at 59%
completion, with final completion in 2015, as reported in the technical press (IRJ, 2015).
Also, the critical factor cited as responsible for the controversial £900m cost overrun reported
in the Big Dig, United States Boston Artery project, were technical issues due to unforeseen
ground conditions compounded by high water table two to three meters below the surface
which was discovered during construction (Creedy, 2006).
As noted from the different popularly cited statistics and case histories, ground conditions
constitute a major risk factor that can ultimately determine the successful performance of a
contract. The study thus explores the nature of geotechnical risk factors at the pre-contract
phase of highway projects, leading to cost overruns at the post contract phase. As Sower
(1993:238) asserts: “Ground-related problems often originate in an earlier phase than the
phase in which they occur…out of 500 failures evaluated, 58% originated in design, and
manifested in construction”. The study thus provides a kaleidoscopic view of the various
routes to managing risks due to the ground, at the preconstruction phases of highway projects,
and how a lack thereof, can culminate to determine the trend of high cost overruns in
highway projects.
2. CONCEPTUAL FRAMEWORK
Love et al. (2012) suggests the unintentional triggering of ‘Latent Pathogens’, which lay
dormant in the complex interactive processes of infrastructure projects, counterfactually
trigger cost overruns. Pathogens as defined by the authors represent “the latent conditions
that lay dormant within a system until an error comes to light” (Love et al., 2012:3). Such
pathogens may thus be considered part and parcel of the everyday functioning in an
organization, because they have been in existence over a considerable period. But such
practices negate or significantly deviate from best practice, setting off an additive chain of
concomitant errors which creates significant ‘error traps’ leading to cost overruns. Morris
(1990:154) was of the view that inadequate technical preparation at the front-end of projects
often characterised publicly funded projects and accounted for budget overruns in
infrastructure projects, stating: “… Appraisal … is very often is devoid of meaning when the
emphasis is only on the form of the project proposal rather than on its content. While,

405
Johansson (2015) was of the view that managing multidimensional uncertainties within
limited time, and cost constraints often trigger cost overruns in infrastructure projects.
Although these narratives provide theoretical platforms for understanding financial risk due
to shortcomings in organizational practices in infrastructure projects, they are not specific to
geotechnical risks in highway projects. As the ICE (2001) underscores, irrespective of
projects details, ground condition is a factor to be contended with in highway projects, due to
the more complex interfaces of transportation projects with the ground. The objective of this
study therefore is to analyze the chain of concomitant geotechnical error traps that can
counterfactually culminate in significant cost overruns in highway projects.
Figure 1:Conceptual Approach to the Study
Following the conceptual framework in Figure 1, the study examines the dictates of
geotechnical best practice in the distinct project phases, as a basis to synthesize a theoretical
framework for assessing financial risk due to geotechnical uncertainties in highway projects.
3. METHOD OF STUDY
The study reviews the relevant literature related to cost overruns in highway projects,
triggered due to mismanaged geotechnical risks. This is with a view to deduce shortcomings
which can portend error traps in the practices of highway organisations. The study explicitly
illuminates geotechnical best practices at the: conceptual costing phase; design preparation
phase; as well as at the contractual phase during bidding, tender documentation, and
contractor selection. The study deduces gaps in knowledge, suspected as prevailing in the
professional practices of highway agencies, by critically analysing current arguments and
divergence between industry practices, as a basis of synthesizing a theoretical perspective for
evaluating financial risk triggered by geotechnical uncertainties. Due to the practice based
nature of the research, related articles from the technical press evident in publications by
international professional bodies, recognised standards of best practice, research institutes
and highway agencies are used to support the bulk of scholarly literature.
4. GEOTECHNICAL ERROR TRAPS IN PROJECT PHASES
4.1 Geotechnical Error Traps at the Conceptual Estimate Phase
A conceptual estimate is an estimate prepared at the phase of highway development, whereby
only a general idea exists about what the project will entail (Lowe et al., 2006). Various
terminologies have been used to label this estimate in a project. Typically, such terms as
GEOTECHNIC
AL ERROR
TRAPS
Lack of Geotechnical
Best Practice
Geotechnical
Uncertainties
High Financial Risk COST OVERRUNS

406
‘early stage estimates’, ‘initial estimates’, ‘top-down estimates’, ‘preliminary estimates’ and
‘investment estimates’ are used in the literature to label this point of initial arbitrariness in
project details and definition (Chou, 2005: Tan and Wakmasha, 2010; Asmar et al., 2011).
Despite these different terminologies, the initial point of estimation, for any project is the
planning stage, during which a business case is identified, and investment decision-to-build,
must be made.
It has been opined that highway projects have historically experienced significant cost
overruns, often rooted at the point of the decision-to-build (Cantarelli et al., 2010). To
circumvent the occurrence of cost overruns, the estimating methodology used to project
budgetary outlay at the conceptual phase, will need to yield estimates that closely
approximate final costs (Tan and Wakmasha, 2010). The current practices of highway
agencies, reveal varied methodologies of approximating conceptual estimates (Chou, 2005;
Alavi and Tavares, 2009). Different agencies have used differing approaches at the
preliminary phase to project budget estimates (Alavi and Tavares, 2009: 10). The literature
however shows a predominance of methods, conventionally associated with the early stage
estimation practices of highway agencies (Chou, 2005). From the analysis of the costing
practices of several highway agencies, the author revealed a commonality of conceptual
costing practices based on historical cost/mile averages. Also apparent is the fact that none of
the methodologies can be identified as having any form of systematic geotechnical input, as
unique characteristics such as potential variability in ground conditions are not accounted for
(Romero and Stolz, 2009). With a high element of subjectivity required on the part of
estimators in deducing to the level of ground similarity with past project. As Turouchy et al.
(2001) expounded, these methods often based on cost per-mile tables, usually have
adjustment made for project specific incidentals, using informal engineering judgment.
Methods based on the estimation of "rough" quantities for all major items, basically apply the
generic LWD (length, width, depth) method which involves estimating pavement volume,
and then adding costs for other items. The LWD method however does not accommodate the
possible variability in cross sectional details along the proposed route, with lump sum
contingency allocations used to cover for geotechnical uncertainties. It can thus be discerned
that the technique of ‘lane mile extrapolation’ typically used by most highway agencies, may
not necessarily account for the true conditions of site.
Although, it may be argued that no certainty can be achieved in predicting ground conditions
for highway projects, at the conceptual phase, Turouchy et al. (2001) however reported that a
fair attempt to account for ground conditions was observed in the Tennessee Department of
Transport, (TnDOT). The TnDOT undergo a more rigorous process, where cost estimates are
developed after carrying out comprehensive desk studies, supplemented with the use of aerial
photography and topographic sheets, with further preliminary site reconnaissance. This is
reproduced in a CAD drawing system scaled plan sheet, where a rough layout of the road is
produced, based on which the road centre line is drawn to envision the typical section for
subsequent detailed measurement to generate quantities for 20 major cost items. Turouchy et
al. (2001) further reported that most of the DOTs surveyed revealed that the pavement cost,
represented the most difficult cost item to estimate and often accounted for the largest
deviations from detailed design estimate and final cost. This contrast with few states DOTs
such as Tennessee that dedicate a relatively large amount of financial and human resources to
preliminary engineering, and have very low deviations from their initial cost estimates.
Despite this technical shortcoming noted, as the literature continues to report, several
highway agencies deploying qualitative methods of conceptual estimating due to the speed

407
and ease of its applicability (Chou, 2010). Romero and Stolz (2009:186) thus assert that this
practice, evident within highway agencies, will amount to producing no more than just a
guestimate, stating:
“Reliance on historical cost per mile data are not well suited for feasibility studies,
because not only do construction costs vary widely because of subsurface,
geographic, and other project-specific parameters, but also because such
construction costs are not generally available in cost databases… This could result in
significant budgetary shortfalls as projects progress through the developmental
phases of planning and design to construction”.
4.2 Geotechnical Error Traps at the Detailed Design Estimate Phase
Detailed estimates are prepared at later stages of projects, often before the contractual phase,
when all project details and cost data previously not adequately defined at the conceptual
stage are available. Turouchy et al. (2001) opined that each successive phase of the project
life cycle is more influential as the focus narrows on the amount each project will cost with a
corresponding reduction in contingency allowance. Schexnayder et al. (2003) thus stated that
subsequent estimates are made throughout project design as continuing checks on cost
expectations, and the confidence intervals decline to where the final definitive estimate is
expected to be very close (plus or minus 5 per cent) to actual project costs and that the
estimates are symmetrically distributed around the actual costs.
Detailed design estimates are typically prepared by breaking down work into the lowest level
of detail, (Level 4 Rate Build-up of the WBS) that comprehensively captures all cost
components, before a contract is awarded and construction commences (DOE, 2011)).
Detailed design estimates ideally should cater for all major cost contributors and financial
risk factors in the project (GAO, 2009). It is thus a basic underlying assumption that the cost
estimate prepared by clients at the detailed design phase is an accurate predictor for future
costs of a project, having taking into consideration, condition of the ground at the proposed
site. It is therefore logical that at this point of detailed estimating, that the cost implication of
ground related risk in projects, recognized by the institution of Civil Engineers (1991), to be a
major cost driver in transportation projects, has been adequately established. Consequently, it
can be deduced that defining the geotechnical properties of the ground, in sufficient detail
and accuracy, is of vital importance in the preparation of detailed design estimates, as
unanticipated poor sub-grade can undermine the overall financial performance of a highway
project.
Accordingly, a site investigation should attempt to foresee and provide against technical and
financial difficulties that may arise during construction because of ground and/or other local
conditions (Ashton, 1997). A site investigation as stipulated by best practice should consist of
three stages, namely a desk study, a preliminary reconnaissance and a site exploration. Bell
(2007:231) stated that a desk study is undertaken to make an initial assessment of the ground
and to identify, if possible, any potential geotechnical problems. The preliminary
reconnaissance involves a walk over the site and its surrounds based on visual inspection.
This is because geotechnical uncertainty is always high before a comprehensive site
investigation is completed (Ashton and Gidado, 2001). The aim of a detailed ground
exploration is to try to determine and thereby understand the nature of the ground conditions
on site and those of its surroundings (Clayton et al., 1996).

408
The ICE (1999) thus emphasized that a desk study and preliminary reconnaissance should not
be regarded as an alternative to detailed ground exploration. Clayton et al. (1995:38)
contradicts this stance by opining that:
“The desk study and walk-over survey are the two essential components of ground
investigations. Other parts (such as boring, drilling, and testing) may sometimes be
omitted, but these parts of site investigation must always be carried out”.
These contradictory stances in the literature may thus imply that the phase of detailed ground
investigation may be overlooked, leading to monumental cost-overruns that could have being
prevented (Institution of Civil Engineers, 1999). As the literature shows, expenditure on
ground investigation is often accorded a low priority (ICE, 1991; Paul et al., 2002; Albatal et
al., 2010). Typically, several authors including Clayton, 2001; Paul et al., 2002 and Albatal
et al., 2010 have noted that the cost of site investigations in relation to the total project cost is
small. Typical values of 0.20 to 1.50 per cent of total project cost were revealed by Albatal et
al. (2010). Clayton (2001) found a direct positive relationship between expenditure on site
investigations and the level of cost overruns experienced in projects. As Cathie (2000:1)
asserts: “Spending money on geotechnical investigations and engineering is like a good
insurance policy”.
4.3 Geotechnical Error Traps at the Tendering Phase
The contractual provision made for the allocation of geotechnical risk, is the key feature of
highway contracts around which hinges the magnitude of risks borne by both parties to a
contract (Moleenar et al., 2006). This is because, the tender price forwarded by contractors in
bidding for highway contracts, is fundamentally determined by the level of ‘knowns’ about a
project (Moleenar et al., 2006). The literature establishes the importance of making fully
known, the level and types of risks associated with any project, so that inconsistencies in
computing tender figures do not arise (DRMB, 2006; Moleenar et al., 2006). As Moleenar et
al. (2006:31) asserts:
“The contract is a vehicle for risk allocation ... it defines the roles and responsibilities
for risks. Risk allocation in any contract affects cost, time, quality, and the potential
for disputes, delays, and claims.
Moleenar et al. (2006) further argued that clients, are in the best position to assume
responsibility for ground related risks, as indicated in Table 1.
Table 1: Risk Allocation Matrix for Highway Projects
(Source: Moleenar et al., 2006) Risk Party recommended to assume risk Medium of Risk Management
Site access Owner Advanced Planning
Methods of construction Contractor Specific Contract Clause
Site conditions Owner Geotechnical Investigation Reports;
Contract Clauses.
Weather/Acts of God Shared (Owner assumes delay risk;
contractor assumes financial risk).
Contract Clause

409
As Table 1 shows Ground Investigation Reports and the various contractual clauses, serve as
risk allocation measures. The inclusion of a ‘Ground Investigation Report, and a ‘Differing
Site Conditions (DSC) clause’, implies that, in the event of encountering a subsurface
condition different from that which was indicated, the owner bears the additional cost for
executing the work under such conditions (O’ Toole, 2006). The efficacy of these measures
serve to optimally allocate geotechnical risk and therefore avoid costly disputes.
The literature however indicates a divergence between industry practices, as some highway
agencies try to transfer the risk associated with the ground conditions to contractors in their
misguided notion of ensuring certainty of final outturn cost (Chan and Au, 2007). Contractors
thus must rely on guesswork to project estimates, which are forwarded in bids, risking
potentially undetected ground conditions. Several authors (Tah et al., 1994) thus advocate for
the optimal allocation of geotechnical risks in traditionally procured contracts, as this a major
factor which is considered by contractors in setting price margins. As Romero and Stolz
(2009:8) opines: “The types of risk allocation measures, or the lack thereof, have a profound
influence on a contractor’s decision whether to bid for a project and the amount of
contingency placed in a bid for risk”.
Where ground investigation reports and DSC clauses are included, the literature evidences a
significant reduction in the level of bids received (O’ Toole, 2006; Romero and Stolz, 2009;
Wong, 2012). This reduction in the level of bids received by clients, was attributed to the
reduction in the level of risk borne by the contractors relating to ground conditions, and
therefore the level of contingency that is included in the bids tendered. Geddes (1985:2)
remarking on this stated that:
“Although including ground investigation reports, and as such adding a differing
site condition clause to a construction contract, introduces some uncertainty for an
owner regarding the ultimate cost of a project. This uncertainty, however, may be
offset by lower bids from contractors who will not have to account for unknown
conditions by including contingencies in their bids”.
A note of caution is, however, sounded by O’ Toole (2006), who raises valid concerns about
the accuracy and representativeness of ground investigation reports, suggesting that where
incomplete or inaccurate reports are used as a basis of financial and risk assessments by
contractors, the client faces significant financial risk due to contractual change events
resulting from report inaccuracies. Supporting this view, Wong (2010) identified two
common arguments often raised by contractors when faced with the unforeseen ground
conditions during the progress of works. Firstly, whether a ground investigation report was
included as part of the contract documentation, and secondly whether the report provided,
was truly representative of the physical conditions of site.
In the event that a ground investigation report was included as part of the contract, and was
subsequently found not to be representative of the ground conditions experienced during
construction, this can provide sufficient basis for claims and variations to arise in a contract.
Thus, case law related to construction projects, is rife with cases where the core argument
revolves around the issue of non-representative ground investigation reports. For example,
the landmark case of E. H. Morrill Co. versus. State of California, is both a classic example
of one such dispute, and the underpinning case law used by contractors wishing to challenge
the employer’s ground investigation report. The client in this case had tried to avoid the
liability for unknown or unforeseen site conditions by incorporating ‘Disclaimers and

410
Exculpatory Clauses’, which as the literature shows, do not often hold up to detailed legal
scrutiny in the final judgement (O’Toole, 2006). Clients would thus only have to resort to the
use of DSC clauses, which would mean paying for those conditions that could not have been
revealed in detailed investigations, archetypally expressed in the form of ‘Unforeseen Ground
Conditions’ or a type-1 DSC (ICE, 1991).
Different internationally recognised standard forms of contracts and regulations have various
adaptations of a DSC clause: The ICE form of engineering contracts; The FIDIC Red and
Yellow Books, The American Federal Acquisition Regulations. Even the most recent, newly
released version of the Engineers’ Joint Contract Documents Committee contracts prepared
as a joint document between The American Council of Engineering Companies (ACEC), The
National Society of Professional Engineers (NSPE) and The American Society of Civil
Engineers Institute (ASCE), contains adaptations of the differing site condition clause. The 7th
Edition of the ICE Standard Form of Engineering Contract: Clauses 11 and 12, later replaced
by the suite of New Engineering Contract (NEC) forms, focuses on the theme of managing
ground risks. The ICE Form of contract was intended to rationally share the risk on ground
conditions between the employer and the contractor, as a basis of fostering adequate
management of ground risks in engineering and construction contracts (Wong, 2012). The
FIDIC Red Book (1999) focuses on client designed projects, while the FIDIC Yellow Book
(1999) focuses on contractor designed projects. Clause Clause 4.10 -12, of the FIDIC Red
Book, centers on three main themes: Information on sub-surface conditions and inspection of
site; Interpretation by the contractor; and physical conditions revealed during contract
execution (Wong 2012).
However, some other forms of contracts used in different countries adopt common law
position. Typical wordings contained in JCT forms of contract used by the Nigerian Federal
Government, states:
“…the Contractor shall be deemed to have visited the site and satisfied himself that
he has allowed in his price for everything necessary for the completion of the Works”.
Similarly, Clause 13(1) of the Hong Kong Government General Conditions of Contract
(GCC) for civil engineering or building works states:
“The Contractor shall be deemed to have examined and inspected the Site and its
surroundings and to have satisfied himself, before submitting his Tender... as regards
the nature of the ground and sub-soil, the form and nature of the Site... the nature of
the work and materials necessary for the execution of the Works… and generally to
have obtained his own information on all matters affecting his Tender and the
execution of the Works.”
Others, even within the jurisdiction of the countries which adopt the requirement of differing
Site Condition clauses, have resorted to including ‘Site Inspection Clauses’ stipulating that
contractors carry out all requisite inspections. Remarking on this scenario, as a financial
gamble by clients, Chan and Au (2007:3) opined that:
“The owner risks tragedy, first, from cost-cutting measures the contractor will take if
it hits unforeseen conditions, and then, from fighting contractor claims and picking up
the pieces if the contractor abandons the project or goes bankrupt”.

411
Lack of geotechnical risk allocation measures by highway agencies in contract
documentation, during bid solicitation therefore constitutes significant financial risks in
highway projects, which often plays out to trigger cost overruns.
4.4 Geotechnical Error Traps at Contractor Selection Phase
A key underlying feature, implicit in the successful execution of a highway contract, is the
efficiency of the contractor. The selection of a contractor has thus been emphasized in the
literature (Holt et al., 1995; Crowley and Hancher, 1995), as a risk variable to which utmost
consideration should be given during the procurement phase, as it has significant connotation
to undermine meeting project performance objectives of cost, quality and time. Holt et al.
(1995) thus distinguished between the lowest initial bid and the most competitive/viable price
for a project under an existing investment climate. This is against the misguided notion of
clients often opting to award contracts on a lowest bidder basis, at the risk of incurring huge
cost overruns due to contractor’s incompetence (Crowley and Hancher, 1995). The need for
an informed unbiased appraisal of contractors’ technical capabilities relative to bid price has
thus resulted in the development of multi-parameter quantitative models for contractor
selection (Gransberg and Gad, 2014). The authors asserted that comprehensive quantitative
approaches to contractor selection require the assignment of relative weighting of critical
geotechnical factors, aggregated in deciding on the winning bid. Gransberg and Gad
(2014:967) further stated:
Gransberg and Gad (2014) further explained that in the United States, during this phase, the
inclusion criteria of the project RFQ or RFP, is however established based on state laws or
published DB procurement guides of the highway agency, and not just on a project specific
basis. The findings of Gransberg and Gad (2014) study revealed the various approaches
adopted by US highway agencies, in DB projects. These are shown in Table 2.
Table 2: Geotechnical Approaches in DB Contractor Selection
Source: Gransberg and Gad (2014) Highway Agency Approach
Minnesota DOT Higher scoring weights
Bonus scoring for exceeding minimum requirements;
UDOT Heavier emphasis on the technical aspects via a 50/50 cost/technical
weighting.
Delaware Submission of a narrative outlining
the various geotechnical risks and proposed method of construction
Maine DOT Superior scores in geotechnical category
Minnesota 5-year warranty for geotechnical failure on a pass/fail basis
Florida 20 points awarded for quality of design and ground Investigations plan and
minimization of design changes
As can be discerned from the various methods adopted by highway agencies, geotechnical
input is ensured either based on the weightings or extra scores in the technical proposal,
Minimal geotechnical requirements relative to other factors may however be necessitated
under routine construction work in better ground conditions, with higher requirements in
more complex projects or in adverse difficult ground conditions. Subjectivity in the process
of contractor selection is therefore eliminated by the explicitness of the procedure. Lack of a
comprehensive qualitative/quantitative mechanism deployed to ensure that geotechnical
requirements are incorporated into contractor selection decision, therefore represents another

412
potential geotechnical error trap at the contractual phase of highway projects, which can
trigger calamitous financial consequences on projects.
5. DISCUSSION
The study has revealed various error traps through which geotechnical risk manifests at the
conceptual, detailed design, and contractual phases of transportation projects.
Figure 2: Theoretical Framework for Assessing Financial Risks due to Geotechnical
Uncertainties
As Figure 2 illustrates, there are still ongoing divergence in the practices of highway
organisations, relating to:
The methodologies deployed for conceptual cost estimating, to enable the use of more
deterministic costing methods that better reflect heterogenous ground conditions;
The adequacy of ground investigations carried out with calls for sufficient expenditure
to be devoted to carrying out more rigorous preliminary exploration.
whether there is need to incorporate Ground Investigation Reports (GIR) and by
implication Differing Site Condition (DSC) clauses in engineering contracts, as a
mechanism of geotechnical risk containment;
The incorporation of comprehensive multi-dimensional algorithm during contractor
selection, that incorporates specifically tailored geotechnical factor weightings
These gaps in practice identified can therefore serve as a logical theoretical perspective, for
assessing financial risk due to ground conditions in highway projects.
6. CONCLUSION
This study has shown how widely contested issues in geotechnical practice, implying poor
financial risk containment may still currently be on going to various degrees on highway

413
organizations, and can have significant financial impact on project completion cost. The
dynamics of geotechnical risk aversion has thus been shown to have important implications
for the accuracy of the project’s final outturn cost. This study has provided clients for road
projects (highway agencies), and who therefore constitute the primary target audience, with
the necessary theoretical perspective necessary to understand the various trajectory through
which geotechnical risk can trigger inefficiency and wastage of financial resources on
transportation infrastructure projects.
7. REFERENCE
Alavi, S.A. and Tavares, P.E. (2009). Highway project cost estimating and management. The State of Montana
Department of Transportation. Final Report Albatal et al., 2010).
Alhalaby, N.M.H. and Whyte, I. L. (1994) The impact of ground risks in construction on project finance. Risk
and reliability in ground engineering: ICE. Thomas Telford, 54-67.
Ashton, P. (1997). A definitive framework model for effective site and ground investigative procedure.
Unpublished MSc. Dissertation, University of Brighton.
Ashton, P and Gidado, K (2001) Risk associated with inadequate site investigation procedures under design and
build procurement systems. In: Akintoye, A (Ed.), 17th Annual ARCOM Conference 2001, University of
Salford, 1, 961-9
Asmar, S.M., Mounir, El Awad, S., Hanna, F., Gary C, and Whited, M. (2011). New approach to developing
conceptual cost estimates for highway projects. ASCE.
Bell, F. G. (2007). Engineering Geology (2nd Ed). Oxford, UK: Elsevier Ltd.
Cantarelli, C.C., Flyvbjerg, B., Molin, E.J.E and Van Wee, B. (2010). Cost Overruns in Large-scale
Transportation Infrastructure Projects: Explanations and Their Theoretical Embeddedness. EJTIR 10(1),
March, 5-18.
Cathie (2000). Evaluating the cost-effectiveness of Ground investigations. Site Investigation and Geotechnics,
SUT, London, 77-91.
Chan, E. H. W. and Au, M. C. Y. (2007). Building contractors‟ behavioural pattern in pricing weather risks.
International Journal of Project Management, 25(6), 615-626.
Chou, J. (2005). Item-level quantity-based preliminary cost estimating system for Highway. Unpublished
Doctoral dissertation presented the University of Texas at Austin
Chou, J. (2010). Cost simulation in an item-based project involving construction engineering and management.
International Journal of Project Management 29 (11) 706–717.
Clayton, C.R.I., Matthew, M.C and Simon, N.E. (1996). Site investigation. Blackwell Science, Oxford
Clayton, C.R.I. (1995). Site Investigation. Granada. London.
Clayton, C.R.I. (2001). Managing geotechnical risk: Time for a Change. Proceedings ICE. Geotechnical
Engineering. Paper 149. 3-11 Thomas Telford.
Creedy. G.D. (2006). Risk Factors leading to cost overruns in the delivery of highway construction projects. An
unpublished PHD thesis submitted to the Queensland University of Technology.
Crowley, L and Hancher, D. (1995). Risk assessment of competitive procurement. Journal of Construction
Engineering and Management, 121, 241–248.
Department of the Environment, Transport and the Regions. (2014). Cost Overruns in Highway projects
[online]. Available at <nationalarchives.gov.uk> accessed 13/06/15
Department of Energy. (2011). cost estimating Guide 413.3B, Program and Project Management for the
Acquisition of Capital Assets, U.S. Department of Energy Washington, D.C.
Design Manual for Roads and Bridges. (2008.) Managing geotechnical risk. Vol 4(1) Part 2 hd 22/08
Government Accountability Office. (2009). Cost Estimating and Assessment Guide, GAO-09-3SP. Washington,
D.C.
Gransberg, D.D and Gad, G.M. (2014). Geotechnical Requirements in Design-Build Selection Process.
Transportation Research Board (TRB) Annual Meeting, Washington,
Holt, G.D., Olomolaiye, P.O. and Harris, F.C. (1995). A review of contractor selection practice in the U.K.
construction industry. Building and Environment, 30(4), 553–61.
Institution of Civil Engineers. (1991). Inadequate site investigation. A report by the Ground Board. Thomas
Telford.
Institution of Civil Engineers. (2001). Managing geotechnical risk: improving productivity in UK building and
construction, Thomas Telford.

414
Institution of Civil Engineers. (1999). Inadequate site and ground investigations leading to construction delays
and additional costs. Thomas Telford.
Love, P.E.D., Edwards, D.J, and Irani, Z. (2012) Moving Beyond Optimism Bias and Strategic
Misrepresentation: An Explanation for Social Infrastructure Overruns. IEEE Transactions on Engineering
Management 59(4):560-571
Mansfield, N.R., Ugwu, O.O. and Doranl, T. (1994). Causes of delay and cost overruns in Nigerian construction
projects. International Journal of Project Management, 12(4), 254-260.
Molenaar, K.R., Diekmann, K.E. and Ashley, D.B. (2006). A Guide to Risk Assessment and Allocation. for
Highway Construction Management, Report # FHWA-PL-06-032,
National Audit Office (1994). Getting Value for Money from Construction Projects through Design. London
National Audit Office. (2001). Getting Value for Money from Construction Projects. London.
National Economic Development Office. (1983). Faster Building for Industry. London: HMSO. National
Economic Development Office.
National Economic Development Office. (1988). Faster building for commerce. NEDO, London.
New Civil Engineer. (2011). Ground Rules [online]. Available at <https://www.newcivilengineer.com/>
accessed 20/03/2016.
O’Toole, D. (2006). Differing Site conditions - who bears the risk? Technical Report retrieved from
Paul, T., Chow, F. and Kjekstad, O. (2002). “Hidden Aspects of urban planning surface and underground
development”, Thomas Telford Publishing, London.
Peacock, W. S. and Whyte, I. L. (1992). Site Investigation and Risk Analysis. Paper presented at The Institution
of Civil Engineers Symposium, (May), 74-81.
Romero, V. S. and J. M. Stolz, (2009). Cost Estimating for Underground Transit: Too Dangerous to
“Guesstimate”. San Francisco, CA
Schexnayder, C.J., Weber, L.S and Fiori, C. (2003) Project Cost Estimating: A Synthesis of Highway Practice.
American Association of State Highway and Transportation Officials (AASHTO)
Sowers, G. (1993). "Human Factors in Civil and Geotechnical Engineering Failures. Journal of Geotechnical.
Engineering, 2, 238-256.
Tah, J.H.M., Thorpe, A. and McCaffer, R. (1994) A survey of indirect cost estimating in practice. Construction
Management and Economics, 12(31), 31-36.
Tan, F and Makwasha T. (2010). ‘Best practice’ cost estimation in land transport infrastructure projects.
Australasian Transport Research Forum Proceedings Canberra, Australia.
Turochy, R. E., Lester A. H., Lacy, L. A. and Robert S. D. (2001). Highway project cost estimating methods
used in the planning stage. Technical Report. Transportation Research Council.
Venmans A.A.M. (2006). Integral design of motorways on soft soil on the basis of whole life costs. Proceedings
of the 16th ICSMGE, Osaka. Balkema, Rotterdam.
Whitman, R.V. (2000). “Evaluating calculated risk in geotechnical engineering”, ASCE, 11(2) 14-18.
Wong, J. (2012). What lies Beneath? An Over View of Claims relating to unforeseen Ground Conditions.
Institute of Civil Engineers.

415
ID 009
EXAMINING AND MAPPING THE BIDDING PROCESS OF IRAQI
QUASI-GOVERNMENTAL CONSTRUCTION COMPANIES
T. Al-Obaidi and A. Higham
School of the Built Environment, University of Salford, Salford, M5 4WT, UK
Email: [email protected]
Abstract: Business Processes (BP) have been recognised by business leaders and academics
as the core of organisations. Thus, organisations, in order to survive and succeed in a turbulent
competitive business environment, are required to focus mainly on improving their business
processes. Business process management (BPM) is a comprehensive and wide used approach
to increase BP's principles into an organisation. With the aim to improve the overall
performance of Iraqi Quasi Governmental Construction Companies (IQGCCs) by employing
the BPM approach. This research, particularly, focuses on examining and mapping the current
bidding practice within three of Iraqi QGCCs. Required data were collected by conducting
semi-structured interviews with engineers, and managers from different organisational levels
and supported by focus groups to validate the mapped process. The research highlighted a
number of challenges facing the current bidding process resulting mainly from limited
authority provided to the regional level and the functional hierarchy management system
adopted by these companies. As a result, more studies to streamline and improve the current
bidding process's efficiency are extremely needed.
Keywords: bidding, business process, IraqiQGCC, process mapping.
1. INTRODUCTION
Rising the globalisation, liberalisation of international trade and rapid technological
development over the last two decades have put the business environment under fast dynamic
change (Shtub and Karni, 2010). The question of how some organisations have managed to
survive and grow under such environment, has attracted wide interest amongst management
practitioners and researchers. Seminal researchers such as Porter (1985), Hammer and
Champy (1993) and Harmon (2003) argue organisations can survive, succeed and enhance
their overall performance through focusing on improving their business processes (BP).
In the same vein, the Iraqi business environment, after the 2003 conflict have been subject to
profound change influenced by the radical changes to Iraq’s political, and economic systems.
These changes have put Iraqi Quasi Governmental Construction Companies (IQGCCs) into
direct competition with the private sector. Ending the monopoly IQGCCs had over most
publicly funded construction contracts, an arrangement that lasted for decades and prevented
these businesses adopting the free market models seen in other quasi governmental bodies in
other countries such as the UK. Consequently IQGCCs have struggled to both win contracts
and generate profit in this competitive market. Resulting in wide criticism of these companies
inability to improve their poor performance, low productivity and high level of inefficiency
(Filaih, 2013). As a result change is urgently needed to enhance the competitiveness and
profitability of these organisations. Such improvements, Brocke and Rosemann (2015)
espouse can be achieved by implementing Business Process Management (BPM) to enhance
and improve the internal processes and therefore the business efficiency. Nevertheless, a
prerequisite for performing any dramatic performance improvement using BPM, is to have a
416
clear understanding of the organisation's core business processes, however, very little is
known about how these IQGCC organisations operate, there are no existing process maps or
indeed directives on how processes such be undertaken.
Forming part of a wider doctoral research study seeking to develop a transformational
organisational framework to improve the performance of IQGCCs funded by the Iraqi
government, the research reported in this paper resolved to establish how IQGCC business
operate by examining and mapping the current "as-is" processes (Weske, 2012) adopted
during the bidding phase of the project lifecycle assuming a traditional procurement model
(the dominant form of procurement in Iraq).
The research concluded that the current bidding process faces numerous challenges related
mainly to two factors: authority and management. As a result, the authors conclude that there
is an urgent need for more research aimed at assisting the Iraqi government and the IQGCCs
to improve their efficiencies, process and ultimately their overall performance and
competitiveness.
2. LITRATURE REVIEW
2.1 Business Process (BP) Definition and Elements
The word ‘process’ is still ambiguous, and might be interpreted as different things by
different people based on the field, market, and function in which they are working for
(Palmberg, 2009). Consequently, different definitions have originated from different areas of
study. Yet most of these definition compose rather similar concepts and elements to describe
business processes which Looy et al. (2011) opines could be summarised into seven
elements: The span of time and space; having a purpose or value for customers; inputs and
outputs; a group of clearly defined and interrelated activities; horizontal or cross functional;
using resources; and repeatability (Hammer and Champy, 1993; Palmberg, 2009; Looy et al.,
2011). Such elements give a business process the transformative feature proposed in the
seminal work of Michael Porter (1985). Porter advanced the theory that an organisation has a
chain of activities that add value to an input (raw material) in order to transform it into an
output (product) that meets the needs of their customers. Anything not directly adding value
in this process can therefore be eliminated, reduced or outsourced to reduce cost. In fact, the
transformative view tends to deal with tangible things such as those found in the
manufacturing and construction sectors. This view of looking at business process has been
successfully applied in manufacturing field and was advocated in Egan’s (1998) seminal
review of UK construction to improve its performance (Cooper et al., 2005).
2.2 The Importance of Business Process
Adopting a business process prospective has become a mandatory requirement for any
organisation striving to excel (Looy et al., 2011). Baloh et al. (2008) considers focusing on
BP as a best practice management paradigm correlated to organisational performance results.
Empirical studies have demonstrated the strategic value of adopting a process based model
within organisations to enhance efficiency and competitiveness. Lockamy and McCormack
(2004) identified that companies which establish strong guidance for their business processes
typically reach higher levels of performance and provide an enhanced work environment with
higher levels of cooperation and less conflict. Similarly Kohlbacher (2010) uncovered that
BP is positively associated with customer satisfaction, product quality, delivery and time-to-

417
market speed. Leading Bronzo et al., (2013) to stress that concentrating on improving BP can
significantly enhance value creation and drive a company to both higher performance and a
more sustainable competitive advantage.
Several approaches have been suggested to implement BP principles, these include: Total
Quality Management (TQM), Business Process Reengineering (BPR), Six Sigma, and
Continuous Process Improvement (Armistead and Machine, 1997) and Business Process
Management (BPM). However, Rohloff (2009) opines that of these approaches, BPM is the
most comprehensive, well-known, and widely used.
2.3 Business Process Management (BPM)
BPM is defined by Brocke and Rosemann (2015, p ix) as "A comprehensive consolidation of
disciplines sharing the belief that a process-centred approach leads to substantial
improvements in both performance and compliance of a system". BPM incorporates many
aspects of other approaches, such as TQM, BPR, and lean six sigma (Rohloff, 2009). It is a
collection of principles, methods, and techniques to analyse, redesign, implementation, and
monitor BP through a reputable life cycle (Dumas et al., 2013).
BPM enables the BP to be streamlined, and redundancies to be eliminated through managing
it on an ongoing and continuous improving basis. Rather than as the one-off radical change
proposed by other techniques such as BPR (Armistead and Machin, 1997). Moreover, BPM is
based on the principle of building on and transferring for what already existed and not
starting from scratch again as proposed by BPR. Hence BPM presents an organisation with
significantly less risk, and more importantly less up front expenditure (Krafzig et al., 2005;
Swetaanand, 2011). The other benefits of implementing BPM, identified by Bai and Sarkis
(2013) include the ability to accelerate organisational processes, reduce resource
requirements, and boost productivity and efficiency, whilst enhancing competitive advantage.
Yet, O’Reilly and Tushman (2016) claim that adopting a stringent system of BPM can harm a
firm business since such system would limit innovations to only incremental. Resulting in
undermining the firm ability to produce radical innovation during periods of rapid change.
Although the aforementioned downside of BPM, which is seen as an implementation issue,
the wide benefits that can be obtained by employing BPM have been attractive many
organisations worldwide to implement this approach to enhance their organisational
performance (Tang et al., 2013). Add to that, the construction industry, as a whole, is
characterised by the lack of innovation in comparison to other industries such as
manufacturing and software (Koskela and Vrijhoef 2000; Taylor and Levitt 2005; Wang and
Du, 2015). Therefore, such disadvantage in BPM may not significantly impact on
construction companies that employ this approach. As a result of the literature review, it was
determined that the implementation of BPM underpinned by the theoretical framework
developed by Porter (1985) will provide a suitable basis from which the researchers can
develop a transformational framework for IQGCCs to enhance their competitiveness.
2.4 Documentation and Mapping "As Is" Business Processes
Process mapping is a simple tool used to facilitate understanding the activities and tasks
involved in a business process by means of displaying these activities, their inputs,

418
sequences, performers and related outputs in a visual format (Stolzer et al., 2011). It can be
considered as the most significant activity in the process analysis and evaluation. According
to Lee et al. (2007) construction organisations may seek to document and map existing
processes in order to improve their business process performance in a dynamic market.
Enabling construction companies to concentrate on value creation, waste elimination and
improved efficiency.
Several techniques have been developed to facilitate mapping processes and structuring the
information including: Business Process Model and Notation (BPMN), Data Flow Diagram
(DFD), and Integration DEFintion Modelling (IDEF). Selecting the most appropriate
technique is mainly dependent on the purpose of modelling, system being modelled, modeller
experience, availability of supporting software, and time constraint (Aguilar-Saven, 2004).
Koskela (1995) argues that modelling tools used to model a construction process should be:
1) Breadth enough to cover a wide range of various processes and their interaction, and 2)
Depth enough to include all important basic constructs, such as process flows, inputs and
outputs, participants, etc. Simultaneously, they should also be easy to use and understandable
by all people engaged in designing and implementing processes (Sweet and Schneier, 2013).
Indeed, the key purpose of mapping the current operational processes of IQGCCs is to
capture (as-is) processes and identify their main problematic points with the aim of refining
them. IDEFØ is one of the most widespread use techniques in practice to describe (as-is)
processes with the purpose of developing revised (to-be) processes (Aguilar-Saven, 2004). It
is characterised by being well structured and quite easy to use and understandable by
stakeholders in comparison to other mapping techniques such as BPMN. Moreover, IDEFØ is
a widely accepted and used technique in modelling the construction processes (Koskela,
1995; Cooper et al., 2005). According to Kagioglou et al. (2000) this technique used in
developing the Generic Design and Construction Process Protocol (GDCPP). Yong-qiang et
al. (2008) also used it to develop an integrated information management system for
construction projects. Ekung et al. (2014) also employed it to map the operational processes
of heave engineering projects in Najeria. Additionally, the researcher experience to deal with
IDEFØ and the software programme that supports it, is much better than dealing with other
modelling tools. Accordingly, the IDEF0 process modelling technique has been selected as a
key tool to map "as-is" operational processes of IQGCCs.
IDEFØ models are built on a basic idea of hierarchically structured analysis and designed to
support decomposition feature. A typical diagram of IDEFØ consists of a number of boxes
surrounded by arrows. Each box has a name and represent a function which can be an
activity, process, action or transformation. While, arrows represent the inputs, outputs,
control and mechanism of the process (Aouad et al., 2013; Oakland, 2014). Figure 1 below
illustrations a typical function in the IDEFØ diagram.
Process or Activity
Policy and strategy External constraints
Machinery and technoiogy People
Controls
Mechanisms
or resources
Data, information
and knowledge
Products or services
Outputs
Data, information
and knowledge
Material
Inputs
Figure 1: IDEFØ model language (Oakland, 2014)

419
3. RESEARCH METHODOLOGY
This research focuses upon examining and mapping the current bidding process adopted by
IQGCCs under the traditional procurement. Three Iraqi QGCCs were sought to be involved
in this research as case studies. All the selected companies are owned by the Iraqi Ministry of
Construction and Housing and considered as large companies. With a headquartered
established in the Iraq’s capital (Baghdad), each of these companies runs construction
projects across the country through a number of regional offices distributed in several
provinces. Table 1 below provides some details concerning these companies.
Table 1: Case studies details
Company
Name
Company
specialization
Number of
employees
Number of
regional offices Company’s status
C1 Roads & Bridges 2042 10 Money-losing company
C2 Multidisciplinary
Engineering 2218 13 Money-losing company
C3 Building & Bridges 1306 9 Money-losing company
The research started by carrying out an extensive literature review with the aim of
establishing a better understanding regarding the best practice bidding process adopted
worldwide. As a result, best practice bidding process map has been generated to be a
benchmark to facilitate mapping and analysing the "as is" bidding process implemented by
IQGCCs. Then, six to eight semi-structured interviews, from different organisational level,
were conducted within each case study. In total, the number of personnel interviewed was
nineteen. All the respondents were engineers, engaged directly or indirectly in the bidding
process and each possessing in excess of ten years with his/her company. The interviews
were conducted in Arabic, on face to face basis, and in the respondents’ offices. Each
interview lasted around one hour and all the responses were recorded and then transcribed
within two to three days of the interview before starting the initial mapping. During the initial
mapping, there were numerous instances in which the researcher had to further clarify and
discuss with the interviewees regarding specific issues popped to the surface while mapping.
As a result, a bidding process map was generated for each case study by using IDEF0
technique. Thereafter, a focus group was conducted within each case study to validate and
ensure that the process was correctly mapped and reflecting the company practice. Each focus
group involved five participants of the population of engineers who had previously
interviewed. Based on the views generated through the focus group, a number of amendments
were conducted to produce the final map. Accordingly, three maps for the bidding process
have been generated. However, the comparison among them has shown that all companies
adopt almost the same processes. For this reason, in addition to the space constraints to
describe all the cases here, one case has been elected as an example representing all the three
cases.
4. FINDINGS FROM THE PILOT CASE STUDY
4.1 Company Background
The company under study is a general construction company established in the late 1970’s
with a capital of $ 1,205,286. The company's business operation covers a wide scope of
projects, including designing and/or constructing housing complexes; bridges and roads;
water treatment and sewage plants; electrical power towers and stations. The company total

420
number of employees is 2218, with 97.7% of them are permanent official governmental
employees.
The company's organisational structure, illustrated in figure 2, shows how the company is
designed based on a traditional hierarchical structure, in which the works are divided on
different departments and sub-departments (divisions) within the company.
Board of
Directors
GM. Deputy
General Manager
Human Right
Legal Dep.
GM. Secretary
Office
Board of Director
Secretary
Relations &
Information
Quality
Management
Contracting Dev
Projects Dep.HR. Dep. Audit Dep.
Financial &
Commercial
Dep.
Technical Dep.Production
Dep.
Consulting
Bureau
Planning &
Follow up Dep.
Accounts
Planning
13
Geographical
Regional
Offices
Employees
Affairs
Engineering
Services
Planning Div
Resources
Div
Follow up &
Statistics
Div
Architectural
Engineering
Div.
Civil
Engineering
Div.
Engineering
Services Div.
Roads &
Geographical
Information
System
Technical
Engineering
Drawing Div.
Planning
Div.
Technical
Workshops
Div.
Production
Div
Machinery
Div
Maintenance
Div
Transportation
Div
Foundation
& Piles Div
Occupational &
Environmental
Safety Div
Electromecha-
nical Div.
Estimating
Div.
Computers
Div.
Financial
Accounts
Div.
Records &
Follow up
Div.
Warehouse
Div.
Salaries
Div.
Costs &
Assets Div
Warehouse
Accounts
Div.
Contractors
& Projects
Accounts
Div.
Lawsuits
Div
Properties
Div.
Employmen
t Div
Employees
Affairs Div
Retirement
Div.
Training &
Developing
Div.
Planning of
Manpower
Div.
Data &
Personnel
Documents
Div
General
Services
Div.
Internal
Auditing
Div.
inventory
control Div
Ministry
Figure 2: Organisational structure
The company also runs thirteen regional offices spread over various provinces and directly
linked to the projects department in the corporate headquarters, to execute the company's
projects each according to its respective geographic area. Each office is headed by a regional
manager and divided into functions which typically include: planning and follow up;
estimating; administration; engineering; warehouse and accounting.
Over the last decade, the company has completed nearly 200 projects with a total value of
$650 million. Reviewing the financial statements, however, reveals that the company has lost
up to $20 million. Moreover, it has been noted that most of the company's projects are not
completed within the stipulated contractual durations. As a result, it is common for the value
of Liquidated damage to equal or even exceed the upper limit allowed for damages, which is
usually 10% of the contract value.
4.2 Company's Core Business Processes
Figure 3 illustrates the four main components of the operational process adopted by the
company for projects procured using a traditional contract. A1 - Bidding Process, the scope
of this research, is typically triggered by the company need for additional work and receiving
or observing an advertisement for expressions of interest. The Bidding process, ends when
the firm submitting the bid package to a client. However, in order to develop a

421
comprehensive understanding of current bid practice, it was important to capture the various
sub-processes involved in the company's bidding process, the stakeholders responsible for
performing those processes, the main inputs and outputs, information required, and finally to
identify who is responsible for making the final decision to bid and when. Consequently,
another level of decomposition of the bidding process is necessarily required. Figure 4 shows
the decomposition of process A1 into 10 sub-processes A1-1 to A1-10.
A1
Bidding Process
A2
Pre-Construction
Planning
A3
Construction
A4
Clouseout
Client's advertisement
for a tender
Tender Documents
and Drawings
Completed Project,
Request for Preliminary
handover
Tender Documents
Project Pre-construction
Plan
Letter of Acceptance,
Assigned Contract
& Project Documents
Certificate of
Completion
In house Guidelines,
Statutory Control,
Requirements,
Prevailing Conditions
Experience (Know How)
& Finance
Research Scope
Bid Package
Figure 3: IDEF0 Level 1 the company operational process
A1-1
Initial Project
Evaluation
A1-2
Site Visit
A1-3
Optain the General
Manager Approval of
the Project
A1-4
Buy & Collect
Tender
Documents
Regional
Manager or
Pricing Div.
Manager
Area
Managing
Director
Regional
Manager &
an
Engineer
Area
Managing
Director
General
Manager
An
Authorised
Employee
An advertisement
for a tenders
Initial acceptance, team
and date to visit the site
Site visit
report
An approval of buying the tender
documents and proceeding
with the bidding process
Tender Documents
A1-5
Check & Review
Tender
Documents
Regional
Estimator
Regional
Manager
List of Queries & Question
A1-6
Attend the Tender
Clarification Meeting
A1-7
Initial Pricing
Regional
Estimator
Regional
Manager
Regional
Estimator
A1-8
Check and Approval of
Tender Prices
A1-9
Prepare the Bid
Documents
A1-10
Submit Priced Tender
With all Required
Documents
Tender Requirements
Bid Documents
Chief
Estimator &
Estimating
Staff
General
Manager
An Employee
in the
Estimating
Div.
A Draft of Priced Bill of Quantity,
Expected Project duration
Answers Do not Affect the
Duration and Amount of Work Tender Package
An
Authorised
Employee
A Final Priced Tender
In house Guidelines
Statutory Control
Requirements and
Prevailing Conditions
Buying & Collect
Tender Documents
Tender
Submission
Quantities of Materials, Labour, Equipment
and Durations Needed to Perform Each Work Item
Regional
Manager
Answers Affect the Duration
and Amount of Work
Figure 4: IDEF0 Level 2 the company bidding sub-processes

422
5. CHALLENGES TO THE BIDDING PROCESSES
In order to streamline the whole bidding process and bring it in line with the best practice
benchmark, The Code of Estimating Practice (CIOB) (2009), the barriers and problematic
points needed to be identified and solutions proposed. Several challenges associated with the
current bidding practice have been identified as highlighted below.
5.1 Inefficient mechanism in developing bid/ no bid decision
During the A1-3 process a decision is made by the GM whether to bid for the project, and
therefore to purchase the contract documents or not. This decision is similar to the bid/no bid
decision in the best practice guidance. However, it is generally based on information derived
from the advertisement for a tender and a subsequent site visit. However, such limited
information is seldom enough to develop an accurate decision. The organisation really needs
to evaluate the risks and opportunities embedded in the tender documents, such as: terms and
conditions of the contract; details and complexity of the work; the tender documentation
quality etc. The Code of Estimating Practice (CIOB, 2009) emphasises that the decision to
bid or not should be made based on an appropriate risk analysis report, and the standpoints of
other senior management members, this is currently no been implemented by IQGCCs.
Accordingly, it could be argued that the absence of an appropriate risk analysis report is
negatively affecting decision making by allowing more room for the GM to fully evaluate the
risk and opportunity profile of the project.
At the root of this problem are two fundamental issued with the operation of the IQGCCs:
Firstly, the lack of authority given to the regional managers, which does not allow them to
buy tender documents without obtaining the GM's approval, despite the minimal outlay
compared to the costs of developing the bid. As the regional manager espoused: "we are not
authorised to pay the tender fees and charges without getting the general manager's
acceptance of payment” (Regional Manager). Restricting the permission to buy the tender
documents to the GM, is clearly not adding value to the process. Rather, it can be time and
cost consuming. Given written approval is usually needed, which is then issued to the
organisations accountant who subsequently issues a cheque for the purchase of the tender
document. Obtaining this approval generally takes between two and four working days and
needs an authorised employee to both deliver the formal written request and bring the
acceptance back.
Secondly: the excessive auditing and inspection actions, imposed by different internal and
external governmental bodies, such as: Internal Auditing; Inspector General Office; and
Commission of Integrity, usually prevent the estimating team from stopping the bidding
operation after paying for the tender documents no matter how bad the risk profile for the
project. Therefore, it seems to be a hard gate in this stage. This problem is reported by one of
the firm’s estimators who stated “After buying the contract documents, we have to proceed
with the tender process and submit our bid package, otherwise, we might be questioned by
the internal auditing in the company and/or the inspector general office in the ministry"
(Estimator).

423
5.2 Exaggerated administrative procedures, red tape, and departmentalization.
The exaggerated administrative procedures and red tape exercised by all the company
departments, including the finance department is another problem hinders the company’s bid
business operations. Leading an engineer to argue “Although, we have obtained an approval
of buying a tender for over a week, we are still waiting the financial department to sending us
the tender fees... fatal routine as well as, unawareness some of financial department staff of
the importance of such issues are always the main reasons for this delay” (Engineer). This
viewpoint identifies another important problem, the staff’s lack of understanding. From the
interviews it appears those employed by the company do not understand the core business
process and its importance to the success of the organisation. This is due to the company'
structure, which is based on hierarchy and traditional functions. Which ultimately prevents
employees seeing and understanding how the organisation operates beyond the boundaries of
their department.
5.3 Workflow bottleneck, task duplication and work quality
As illustrated in figure 4 before submission all tenders must pass through the process A1-8 in
order to check the accuracy of pricing and its computation. This process is executed by the
estimating division in the headquarters. Reviewing the records of organisation revealed the
company submitted 1,144 tenders between January 2008 and December 2013. Suggesting the
company, on average, submitted 1 tender every 1.2 working days. Considering the high
number of tenders that needed to be checked and amended by one division, whose personnel
also undertook other duties such as checking and reviewing the feasibility study plans for
awarded projects; opened and analysed in-house submitted tenders, attended tender
committees was an impossible task. Added to this the need to avoid both mistakes and delays
whilst completing the manually suggests some inaccurate or incorrect tenders were likely
submitted to clients. This issue was raised during several interviews, this quote for the
Deputy Regional Manager provides a useful summary of the main argument: “Sometimes
certain mistakes could occur in pricing, but as you may know, due to the excessive workload
and time constraint on estimating division some of them might not be caught. I do remember
this happened with two of our projects” (DRM). In the same context, one of the project
managers interviews, suggested that by having this robust validation process, estimators,
under pressure to bid for high volumes of work would be less meticulous when developing
their estimates as they knew the work will be checked and amended later before being
ratified. “Sometimes, I say to Mr. X, please just finish this report slapdash and send it, it will
be reviewed and checked further by the corporate staff, and if they have any problem, they
will contact us” (Project Manager).
As a result, the process A1-8 duplicates earlier work and creates a bottleneck in the bidding
process that leads to reduced quality and efficiency. Moreover, it was noted that there is no a
clear mechanism in place to decide on the desired mark-up and settle the final bid price. Most
of the interviewees explained that the mark-up is semi fixed for all projects and is equivalent
to 20% of forecast project cost. Whilst, the GM's final approval of tender price is just a
routine procedure to satisfy the GM himself and to formalize the tender."We usually add 20%
of the project cost as a mark-up. This ratio is recommended by our Ministry" (Bid Manager).
Of more concern is that a senior manager within the organisation clearly did not understand
the organisations estimating process or mark up on the base forecasted cost, opining that “the

424
final tender price is usually determined by the estimating division, whereas the GM's role is
just to ratify on that price" (Senior Manager).
6. DISCUSSION
It is clear based on what has been discussed in the preceding section that the most challenges
and problematic points facing the bidding process adopted by IQGCCs relate to two main
factors: Management system employed and Authority distribution in the organisation. These
factors are generally interrelated and collectively influence the efficiency and quality of the
process.
Management: mapping the current practice of IQGCCs revealed that these companies are
operated through a traditional functional management system dominated by hierarchy,
centralised control, and bureaucracy. Adopting such approach has helped develop a fertile
environment that brought about notable delays, increase in the business cost, and reduction of
quality. That was particularly because the current adopted management approach worked on
dividing the various bidding process activities horizontally on several functional units, and
vertically on different management layers. Where, each unit executed its respective tasks and
sent it to the next one. Every unit is responsible only for its own task, whereas in this picture
the responsible and accountable for the entire process is absent. Accordingly, the cohesion,
coordination and integration of work, whether between the regional offices and the corporate
departments/ divisions, or among the different departments/division themselves was inferior,
and always governed by formal and statutory procedures. This is aligned with the view of
Sungau et al. (2013), who report that a traditional functional approach may facilitate the local
optimisation, but it often leads to negatively affect the overall performance. Because each
functional unit in the organisation develops its own objectives and means of performing its
businesses, regardless the overall organisational goals and objectives. Thus, different goals,
interests and background of the people of these functional units usually creates barriers
between them, which lead to problems in communication and inefficient coordination in
handovers between functions (Shtub and Karni, 2010). They prevent employees in the
different departments from viewing their firm’s common processes and understanding their
roles within those processes and how they are associated in achieving the company objectives
(Skrinjar et al., 2010).
It is also argued that companies with a corporate staff have a tendency towards auditing more
than supporting the business units, ending with unnecessary bureaucracy, barring decision
making and increasing cost (Pigorini et al., 2006). This has been empirically proven by the
findings of this research, where it found that the, exaggerated auditing and inspection actions
imposed from the corporates staff and other governmental bodies, have been one of the major
obstacles to the work efficiency of IQGCCs. These auditing actions together with the
excessive administrative procedures advocated by the traditional management system helped
to create a working environment dominated by bureaucracy, administrative routine, red tape,
and inflexibility.
Authority: analysis of the current bidding practice revealed that IQGCCs are managed by a
very centralised control system where the General Managers have the ultimate sanctioning
and veto powers on almost all the decisions. As illustrated in figure 4, two out of ten key
steps within the bidding process were found have to be ratified and approved by the GM
before allowing them to proceed further. That was usually carried out through signing up the

425
relevant formal letters. Considering the organisational hierarchy, obtaining an approval, such
as buying a tender document, was required to verify its related request at each management
level, till it reaches to the highest one represented by the GM. This has led to generating
workflow bottlenecks, duplication of tasks, time delay, reduction the quality of work, and
increasing the costs and mistakes. According to Graetz and Smith, (2009) centralised
bureaucratic system has become an old and unable to cope with the challenges and continues
changes in the new business environment, as those facing IQGCCs nowadays. This view is
further supported by Banner and Gagné (1995) who assert that the slow-moving traditional
bureaucratic system is seemingly more outdated than ever before. Since, by the time a major
decision goes all the way up through several management layers in the hierarchy for the
review and implementation, the organisation can be too late in response to major
environmental changes. In this context, a study conducted by Wang and Du (2015) uncovered
that construction contracting companies can only achieve the best performance when the
appropriate balance in authority distribution between the various management layers. Yet,
shifting the powers to low-level managers should be combined by providing them with
sufficient information and knowledge that enabling them of making their decisions
efficiently.
Based on what is discussed here, it is very clear that there is a need for improvement the
current bidding process adopted by IQGCCs in order to enhance their performance.
7. CONCLUSIONS
The study has produced a visual map of the current bidding practice adopted by Iraqi Quasi
Government Construction Companies (IQGCCs) that clearly shows how the current bidding
process flows, its main activities, people involved in carrying out those activities, and the key
decisions and gates. The research has also identified a number of challenges and problematic
points which have adversely affected the efficient functioning and quality of tender
operations. Inefficient mechanisms in developing the key decisions, exaggerated
administrative procedures and red tape, in addition to the workflow bottleneck and task
duplication are the main challenges that facing IQGCCs in their bidding process. These
problems were generally related to two main factors, namely: Authority; and Management. It
has been noted, that in spite of the major part of the bidding process was performed at the
regional level, yet they do not have enough authority required to streamline their work. All
the authorities are held by the senior management level, whilst the final say and approval
regarding most issues are always grasped by the General Managers. Managing the companies
on a functional hierarchical structure base, from the other side, also led to reduce the
efficiency of the process through creating a working environment dominated by bureaucracy,
administrative routine, and inflexibility. As a result, further research on how to streamline
and refine the current bidding is required in order to enhance the organisational competitive
advantage and overall performance.
8. REFERENCES
Aguilar-Saven, R. S. (2004). Business process modelling: Review and framework. International Journal of
production economics, 90(2), 129-149.
Aouad, G., Wu, S., Lee, A., & Onyenobi, T. (2013). Computer aided design guide for architecture, engineering
and construction. London: Spon Press.

426
Armistead, C., & Machin, S. (1997). Implications of business process management for operations management.
International Journal of Operations & Production Management, 17(9), 886 - 898.
Bai, & Sarkis (2013). A grey-based DEMATEL model for evaluating business process management critical
success factors. International Journal of Production Economics, 146, 281-292.
Baloh, P., Uthicke, K., & Moon, G. (2008). A business process-oriented method of KM solution design: A case
study of Samsung Electronics. International Journal of Information Management, 28(5), 433–437.
Banner, D., & Gagné, T. (1995). Designing effective organizations: Traditional and transformational views.
California: Sage.
Brocke, J., & Rosemann, M. (2014). Handbook on business process management 1: Introduction, methods, and
information systems. (2nd. Ed.). New York: Springer Science.
Bronzo, M., Resende, P., Oliveirac, M., McCormack, K., Sousa, P., & Ferreira, R. (2013). Improving
performance aligning business analytics with process orientation. International Journal of Information
Management, 33, 300–307.
CIOP (2009). Code of Estimating Practice. (7th. Ed.). Oxford: Wily-Blackwell.
Cooper, R., Aouad, G., Lee, A., Wu, S., Fleming, A., & Kagioglou, A. (2005). Process management in design
and construction. Oxford: Wiley-Blackwell.
Davenport, H. (1993). Process innovation: Reengineering work through information technology. Boston MA:
Harvard Business School Press.
Dumas, M., La Rosa, M., Mendling, J., & Reijers, H. A. (2013). Fundamentals of business process
management. New York: Springer Heidelberg.
Filaih, A. (2013, 26 July). Why the efficiency of projects that are carried out in Iraq today is decreased? Radio
of Iraq Hurr. Retrieved from http://www.iraqhurr.org/content/article/25060931.html
Graetz, F. & Smith A. (2009). Duality theory and organizing forms in change management. Journal of Change
Management 9(1), 9–25.
Hammer, M., & Champy, J. (1993). Reengineering the corporation: A manifesto for business revolution. New
York: Harper Business.
Harmon, P. (2003). Business process change: a manager’s guide to improving, redesigning, and automating
processes. San Francisco: Morgan Kaufmann.
Kagioglou, M., Cooper, R., Aouad, G., & Sexton, M. (2000). Rethinking construction: the generic design and
construction process protocol. Engineering construction and architectural management, 7(2), 141-153.
Kohlbacher, M. (2010). The effects of process orientation: a literature review. Business Process Management
Journal, 16(1), 135 - 152.
Koskela, L. (1995). On foundations of construction process modelling. In CIB Workshop on Computers and
Information in Construction. Stanford, California.
Koskela, L., & Vrijhoef, R. (2000). The prevalent theory of construction is a hindrance for innovation. In IGLC
Conference, Brighton, UK, 17-19 July, 11.
Krafzig, D., Banke, K., & Slama, D. (2005). Enterprise SOA service- oriented architecture: best practices.
USA: Prentice Hall Professional.
Lockamy, A., & McCormack, K. (2004). The development of a supply chain management process maturity
model using the concepts of business process orientation. Supply Chain Management: An International
Journal, 9 (4), 272–278.
Looy, A., Backer, M., & Poels, G. (2011). Defining business process maturity. A journey towards excellence.
Total Quality Management, 22(11), 1119-1137.
O’Reilly III, C. A., & Tushman, M. L. (2016). Lead and disrupt: How to solve the innovator's dilemma.
California: Stanford University Press.
Oakland, J. (2014). Total quality management and operational excellence: Text with cases. (4th Ed.). New York:
Routledge.
Palmberg, K. (2009). Exploring process management: Are there any widespread models and definitions? The
TQM Journal, 21(2), 203–215.
Pigorini, P., Couto, V., Fleichman, A., & Gondim, E. (2009). Reshaping your company business model:
Building for the future during the downturn. Retrieved from
https://www.strategyand.pwc.com/media/file/Reshaping-your-company-business-model.pdf.
Porter, E. (1985). Competitive advantage: Creating and sustaining superior performance. New York: The Free
Press.
Rohloff, M. (2009). Case study and maturity model for business process management implementation. In
Business Process Management (pp. 128-142). Springer Berlin Heidelberg.
Shtub, A., & Karni, R. (2010). ERP: the dynamics of supply chain and process management. (2nd. Ed.). New
York: Springer Science & Business Media.
Skrinjar, R., Bosilj Vuksic, V., & Indihar-Stemberger, M. (2010). Adoption of business process orientation
practices: Slovenian and Croatian survey. Business System Research, 1(1-2), 5-19.

427
Stolzer, A., Halford, C., & Goglia, J. (2011). Implement safety management systems in aviation. England:
Ashgate Publishing Limited.
Sungau, J., Ndunguru, P., and Kimeme,J. (2013). Business process re-engineering: the technique to improve
delivering speed of service industry in Tanzania. Independent Journal of Management & production
(IJM&P), 4(1), 208-227.
Sweet, J., & Schneier, M. M. (2013). Legal aspects of architecture, engineering and the construction process.
(9th Ed.). Stamford: Cengage Learning.
Swetaanand (2011). Business process management Vs business process reengineering. Retrieved on 5th of
September 2015 from http://bpmgeek.com/blog/business-process-management-vs-business-process-
reengineering.
Tang, J., Pee, L., & Iijima, J. (2013). Investigating the effects of business process orientation on organizational
innovation performance. Information & Management, 50 (2013) 650–660.
Taylor, J. & Levitt, R. (2005). Modeling Systemic innovation in design and construction networks, CIFE
Technical Report 163. Retrieved from
https://pdfs.semanticscholar.org/9a9a/efcacd6b74c0eccb8468083ca3eefcffdbc7.pdf.
Wang, Q., & Du, J. (2015). A scenario simulation study of decentralization on architecture, engineering and
construction companies. In Proceedings of the 2015 Winter Simulation Conference (pp. 3257-3268). IEEE
Press.
Weske, M. (2012). Business process management: Concepts, languages, architectures. (2nd. Ed.). New York:
Springer.
Yong-qiang, C., Jia, H., & Peng, M. (2008).The development of the lifecycle function model by IDEF0 for
Construction Projects. Paper presented at WiCOM 4th International Conference on Wireless
Communications, Networking and Mobile Computing, IEEE, 1-4.

428
ID 017
THREE PERSPECTIVES OF PUBLIC SECTOR CONSTRUCTION
PROJECT CULTURE: AN EXPLORATORY CASE STUDY IN SRI
LANKA
A. Samaraweera1 , S, Senaratne2 and Y.G. Sandanayake1
1 Department of Building Economics, University of Moratuwa, Moratuwa, 10400, Sri Lanka 2 School of Computing, Engineering, and Mathematics, Western Sydney University, Australia
Email: [email protected]
Abstract: Among different cultural manifestations, basic assumptions better explain a cultural
context. Further, more insight into the basic assumptions of cultural context could be reached
through a single study including the three perspectives of culture such as; integration,
differentiation and fragmentation, which is not popular in construction research arena. Thus,
the aim of this study is to explore the project culture in public sector construction context
using underlying basic assumptions of the project participants. The aim was approached
through an exploratory single case study of a public sector building construction project,
procured in traditional procurement method. Data was collected through nine semi-structured
interviews, observations of two progress review meetings and a documentary survey. Findings
include elaboration of the underlying basic assumptions of the construction project culture in
three perspectives of culture. Integration perspective revealed the basic assumptions
collectively held by project participants such as: client being the most powerful team member
carrying uncertain decisions; rare appreciations among members; rewarding for conformance
to the contract, and contractor lacking trust on client and contractor. Differentiation
perspective revealed existence of strong sub-cultural groups as contractor, consultant and
client. Sub-cultural basic assumptions included; contractor being profit motive, consultant
favouring the client beyond the required impartial role and client assuming a dominant role
within the team. Fragmentation perspective revealed several ambiguous situations going
against the integrated and differentiated basic assumptions.
Keywords: Basic assumptions, Construction project culture, Differentiation, Fragmentation,
Integration.
1. BACKGROUND
‘Culture’ is defined as a set of learned customs, values, attitudes and meanings that are
‘shared’ by the members of a group and hence, culture is often one of the primary ways to
differentiate one group from another (Duarte and Snyder, 1999). Similarly, Hofstede (1980)
too interprets culture as a shared phenomenon among the human group, but culture is
manifested as mere values. Among different popular attempts, many researchers interpret
construction project culture too from the shared point of view (see Zuo, 2008; Thomas et al.,
2002; Ankrah et al.,2009). Zuo (2008) elaborates that project culture in relational type of
contracts are of integrative, cooperative, goal-oriented, people-oriented and flexible type of a
shared culture. The theoretical framework brought in by Kumaraswamy et al. (2002) is
popular for elaborating construction project culture with a differentiated perspective;
highlighting the existence of sub-cultural groups in a construction project context.
Nonetheless, Martin (2004) disagrees with the definition of culture as a “shared”
phenomenon among the members of the organisation. As Martin (2004) argues, all of these
cultural manifestations are interpreted, evaluated, and enacted in varying ways because

429
cultural members have differing interests, experiences, responsibilities and values. Thus,
Martin (2002) describes that culture consists of the patterns of meanings that link the cultural
manifestations together, sometimes in harmony (integrated perspective), sometimes in bitter
conflicts between groups (differentiated perspective), and sometimes in webs of ambiguity,
paradox, and contradiction (fragmented perspective). For these reasons, it is much too simple
to define culture in unifying, harmonious terms, for example, in terms of values that are
espoused by management and apparently shared by most employees. However, Gajendran et
al. (2012) state that no popular study found in extant literature of construction research arena,
trying to understand culture with a fragmentation perspective of Martin (2004), but such a
research would be a worthy attempt to explore deep into the construction project culture.
Cicmil and Gaggiotti (2014) state that project culture is overlooked as a slippery concept
since it is really a context dependent, social relational practices. Schein (2009) too agrees
with a shared culture, but argues that it is the underlying basic assumptions among all the
cultural manifestations that demonstrate the real essence of culture. Duarte and Snyder (1999)
view culture as hidden 'scripts' that people use to guide their behaviours, where these scripts
are created by repeated interactions between members of the group that create them.
Overtime, they become second nature and serve as shortcuts for guiding actions and making
decisions. These hidden scripts have a similar meaning to the basic assumptions of Schein
(2009). In addition, Hofstede (1980) also refers these underlying assumptions as ‘taken for
granted values’. Thus, this research aims to explore patterns of underlying basic assumptions
of the construction project culture in Sri Lanka using the three perspectives (integration,
differentiation, fragmentation) of culture.
2. THREE PERSPECTIVES IN CULTURAL ANALYSIS
Martin (2002) conceptualises culture from three different perspectives; integration,
differentiation, and fragmentation. These perspectives are complementary, in that each allows
the researcher to investigate the blind spots inherent in the others (Kappos and Rivard, 2007).
Integration refers to interpretations that lead to consensus across the whole group. No
ambiguity exists in interpretations of the manifestations by any member and interpretations
are clear to all members (Martin 2002). Thomas et al. (2002) point out that ‘clan type’ of a
shared project culture brings in better quality outcomes in a construction project and ‘market
type’ of a shared project culture brings in weaker quality outcomes. Richter and Koch (2004)
carried out a case study related to a Danish manufacturing company to understand the safety
culture. They made conclusions that integration of safety cultural aspects were relatively
weaker compared to differentiation and fragmentation. They identified three strong sub-
cultures, which they named as; ‘Production’, ‘Welfare’ and ‘Mater’ and observed integrated
safety cultural beliefs among some sub-cultures; such as non-acceptance of safety related
risks was common for ‘Welfare’ and ‘Mater’ sub-cultures. Case studies of three retailing
organisations done by Harris and Ogbonna (1998) found that each of Martin’s (2002) three
perspectives corresponded to different hierarchical positions. Accordingly, head office
personnel revealed that they tended to adopt an integration perspective on organisational
culture, i.e. culture was viewed in terms of consensus and consistency and cultural deviation
was considered unwelcome.
Differentiation does not assume a shared culture. This perspective assumes that consensus
on cultural manifestations exist only at sub-cultural level. According to this perspective,

430
ambiguities are identified among the sub-cultures, which help defining the group boundaries
between the sub-cultures. (Martin 2002). The case study of three retailing organisations by
Harris and Ogbonna (1998) revealed that store managers commonly adopted a differentiation
perspective on organisational culture, i.e. store managers viewed culture as dichotomous,
inconsistent and characterised by subcultural consensus. Kumaraswamy et al. (2002) have
attempted to define construction project culture by looking at the impacts from different sub-
cultures. They identified ‘organisational’, ‘professional’, ‘operational’ and ‘individualistic’
sub-cultures as the principal elements that come together to evolve the culture within a
construction project. Ankrah and Langford (2005) and Rameezdeen and Gunarathna (2003)
bring in empirical evidences for existence of strong sub-cultures as contractor and consultant
in construction project context. Further, Zuo (2008) highlights the impact of client as a
dominant member in a construction project cultural context.
Fragmentation assumes that ambiguous interpretations of manifestations by members in a
cultural context are inevitable. Both integration and fragmentation perspectives try to
minimize the experience of ambiguity. These ambiguous interpretations should not be
ignored or attributed to differences between sub-cultural groups. Ambiguous interpretations
of manifestations bring in paradoxical or ironic actions and reactions. Such interpretations do
not suggest any clear cultural or sub-cultural boundaries and produce a fragmented view of
the manifestations. Thus, the members of an organisation interpret the manifestations in a
number of different ways, without demonstrating any consensus, consistency, or clarity
(Martin 2002). Richter and Koch (2004) describe that such ambiguities in a cultural context
can be found in terms of ambiguities of: intentions, understandings, history and organisation.
The case study of three retailing organisations by Harris and Ogbonna (1998) described that
shop floor workers exhibited a fragmented organisational culture, where the views of shop
floor workers tended to focus on the ambiguity, fluidity and complexity of organisational
culture. Gajendran et al. (2012) describe that construction project organisations are
paradoxical and contradictory, generating ambiguity and leading to conflicts by nature. Thus,
eliminating the study of fragmentation in a construction project cultural study could be
misleading the real picture of culture.
In overall, Martin (2004) suggests that using all three perspectives together in one study
brings valuable insights of the cultural context and avoid the theoretical blind spots of single-
perspective. Elaborating on a framework for understanding cultural philosophical positions
for analysing construction project culture, Gajendran et al. (2012) indicate the importance of
following a construction project cultural research as a hybrid function/non-functional cultural
analysis, which includes three cultural perspective of integration, differentiation and
fragmentation.
In addition, there are number of empirical evidence for cultural differences between public
and sectors. Nutt (2005) explains that the main reason for such cultural differences between
private and public resides with the purpose or objective of organisation. According to Nutt’s
(2005) explanations, objective of private sector is to create wealth for shareholders, while
public sector intends to provide a service to fulfil a public need. Harrison and Baird (2015)
carried out a research on identifying the organisational culture of public sector organisations
in Australia. They conclude that local councils in Australia have matched the private sector
organisations but, government departments and agencies are lagging behind private sector in
terms of the cultural factors such as; outcome orientation and innovation. Therefore, there is a
need to explore patterns of underlying basic assumptions of the public sector construction

431
project culture in Sri Lanka; using the three perspectives (integration, differentiation and
fragmentation) of culture.
In view of the facts cited above, a research framework could be brought in for studying the
construction project culture using the three perspectives in cultural analysis (see Figure 1).
Accordingly, within a construction project cultural context, integration perspective includes
the cultural manifestations agreed by all the members of the construction project team.
Further, differentiation perspective is valid for manifestations agreed within a given sub-
cultural territory. A construction project can be consisted of client, contractor and consultant
sub-cultures. Moreover, fragmentation perspective is valid for the contrasting cultural
manifestations without indicating clear consensus on intentions, understandings, history and
organisation within the total project cultural territory.
Figure 1 – Three-Perspectives of Construction Project Culture
3. METAPHORIC ANALYSIS OF CULTURE
Underlying assumptions or otherwise called ‘taken for granted values’ are considered as the
core of the culture or the essence of the culture (Schein, 1984). Schein (1983, 1984) explains
basic assumptions as mostly unconscious and are taught to new members as a reality and as
the correct way to view things. Kluckhohn and Strodtbeck (1961) advise that basic
assumptions of an individual or a group do not comprise an exhaustive list. They suggest six
basic types of problems to be solved by every society, which give rise to the basic
assumptions. These include the followings:
(1) What is the nature of human beings: are they good, evil or neutral?
(2) What is our relationship to nature: are we subjugated to nature, in harmony with
nature, or do we have mastery over it?
432
(3) What is our relationship to other human beings: is it lineal (ordered position within
groups), collateral (primacy given to goals and welfare of groups), or individualistic
(primacy given to the individual)?
(4) What is our primary mode of activity (motive for behaving): is our basic orientation
one of being-in-becoming, doing or reflecting?
(5) How do we view time: do we focus on the past, present, or future?
(6) How do we think about space: is it public, private, or mixed?
Schein (1983, 2009) and Hills (2002) too add some more such problems to be solved by the
individuals in a cultural context, which give rise to basic assumptions as follows:
(7) What is the correct way for humans to behave (the nature of human activity): is it
being dominant/pro-active, harmonizing, passive/fatalistic?
(8) How do we define what is true and what is not true (the nature of reality and truth): by
pragmatic test, reliance on wisdom, or social consensus?
(9) Is the group best off if it is highly diverse or if it is highly homogeneous?
(homogeneity vs. diversity)
(10) Should individuals in a group be encouraged to innovate or conform? (homogeneity
vs. diversity)
(11) Do we tend to believe in fate/god or not? (unknowable and uncontrollable)
(12) How should society distribute roles, power and responsibility between the genders:
only to male, females, or both? (gender)
Elaborating the importance of studying the underlying basic assumptions of a cultural
context, Hills (2002) describes how a Native American small tribe survived by understanding
the basic assumption of the culture of majority. This is because, basic assumptions unveiled
the differences between the cultural groups on how they perceived the nature of human
nature, human activities, human relationships, nature of reality and truth and so on.
Accordingly, behaviours and values of each cultural group would depend on the same. Such
knowledge is helpful for creating win-win situations during negotiations as each party
understand each other. In addition, Schein (1983, 1984) explains how the knowledge on basic
assumptions could be used during change initiatives within an organisation. Hence, it is
apparent that understanding culture through underlying assumptions rather than elaborating
merely through artefacts, behavioural features and values give valuable insights into the
culture. An attempt to understand such basic assumptions of a construction project could
bring in advantages during change initiatives and negotiations with external parties.
Moreover, Schein (1984) explains that patterns of basic assumptions of organisational culture
are realised through the attempt of the group of people in coping with the problems of
internal integration (those that deal with the group’s ability to function as a group) and
external adaptation. (those that deal with the group’s basic survival). Problems of external
adaptation and survival include; Strategy, Goals, Means of accomplishing goals, Measuring
performance and Corrections. Problems of internal integration include; Language,
Boundaries, Power and status, Intimacy, Rewards and Punishments and Ideology (Schein,
1983). Ankrah et al. (2009) explain that ‘projects’ hold characteristics similar to
‘organisations’ but, one-off nature of projects become the significant difference. Thus, it can
be argued that the project culture is also emerged in the attempt to survive from the
aforementioned internal integration and external adaptation problems. To unveil the
underlying basic assumptions, it is necessary to go down the list of issues (internal integration
and external adaptation problems) and ask how the group views itself in relation to each of

433
them: what is the core mission, goals, the ways to accomplish those goals, the measurement
systems and procedures used, the way actions are remedied, particular jargons and meaning
systems, the authority system, peer system, reward system, and ideology (Schein, 1983).
Such an effort gives rise to the deeper level of assumptions, which ties together the various
solutions to the various problems as indicated by, Kluckhohn and Strodtbeck (1961), Schein
(1983, 2009) and Hills (2002) in the list previously discussed.
4. METHODOLOGY
The best choice of a research philosophy depends on the type of research question the
researcher tries to find answers to (Saunders et al., 2009). The research question of this study
is; “How do patterns of underlying basic assumptions of a public sector construction project
exist?” Considering the research question to be answered, ‘Interpretivism’ (Creswell, 2009) is
selected as the research philosophy. This research question is more in line with the belief that
culture is the forms and practices of unconscious processes of construction project team
members. This is because, patterns of basic assumptions are unconscious or psychological
processes of human mind. Thus, this research tends to consider culture as a root metaphor
with ‘ontological assumption’ (Creswell, 2009) that reality as a social construction.
Therefore, subjective qualitative means of knowledge creating is expected with thick
descriptions with the ‘axiology’ (Saunders et al., 2009) of more value input from researcher
on the research process. This leads to the ‘epistemology’ (Saunders et al., 2009) of
understanding how the social reality about project culture is being created.
According to Yin (2009), ‘how’ type of research questions support case study research
strategies. Thus, considering the depth of analysis required and the requirement of
contemporary data and events to be analysed, exploratory case study was selected as the
research strategy. Single case study was chosen because the intention of the study was to
develop propositions on basic assumptions of construction projects for further analysis. Thus,
research would be extended by further replications in two more cases in future. In addition,
the study was limited to a public sector construction project. Accordingly, a single case of a
public sector building construction project (Project XYZ) in Sri Lanka, operated under the
traditional procurement with measure and pay contract was chosen. ‘Construction project
culture’ was the unit of analysis. Project team consisted of a powerful ministry in Sri Lanka
as the client, a local semi-government consultancy firm and a local private contractor.
Data collection was done by conducting nine semi-structured interviews, observation of two
progress review meetings and a documentary survey with two additional meeting minutes,
which were not observed, construction contract document and consultancy agreement. Panel
of interview consisted of three members from the Client’s representatives [Deputy Director
(Corporate Management), Technical Officer (Maintenance), Procurement Assistant], three
members from Consultant’s representatives (Project Manager, Project Architect, Project
Quantity Surveyor) and three members from Contractor’s representatives (Construction
Manager, Site Engineer, Project Quantity Surveyor). The interview guideline and the meeting
observation guideline were consisted of questions related to internal integration and external
adaptation problems as discussed in Section 3 to capture the basic assumptions of the project
team in indirect terms. Data analysis was done by using code based content analysis.
434
5. CASE STUDY FINDINGS
Project XYZ was a building construction project to extend the existing ministry headquarters
at city centre of Colombo. The construction contract sum of the project was Sri Lankan
Rupees 1.13 Billion and 65% of the physical construction work was over by the time the case
study was conducted. Integrated, differentiated and fragmented perspectives of the basic
assumptions of the construction project culture in Project XYZ are presented within this
section. The identified basic assumptions are grouped as per the various problems (The
nature of human nature, The organisation’s relationship to its environment, The nature of
human relationship, Motive for behaving, The nature of time, The nature of space, The nature
of human activity, The nature of reality and truth, Homogeneity vs. diversity, Unknowable
and uncontrollable, Gender) indicated by Kluckhohn and Strodtbeck (1961), Schein (1983,
2009) and Hills (2002).
5.1 Integration Perspective of Basic Assumptions of Construction Project Culture
Integration perspective holds basic assumptions with a collective consensus across the project
team consisting of Client, Consultant and Contractor. Such basic assumptions of Project XYZ
included: Client was the most powerful member in the project team (The nature of human
relationships); Contractor only believed formal instructions in black and white (The nature of
human nature); decisions made by the public sector clients were uncertain (Unknowable and
uncontrollable); not innovation, only conformance was practiced in public sector
construction projects (Homogeneity vs. diversity); rare appreciations and constant
highlighting of mistakes and punishments were available in construction projects (The nature
of human nature). Thus, all members of Project XYZ assumed that they were in a cultural
environment built upon Client’s autocracy, lack of trust among members and minimal mutual
appreciations. Further, they believed a working environment full of uncertainties thus, tried to
conform to the contract to reduce risks.
In addition, there were basic assumptions, where consensus on those basic assumptions were
available only among pairs of sub-cultural groups of Contractor, Consultant and Client.
Contractor and Client both assumed that a strong project management was essential for
project success (The nature of human nature) and continuing relationships was not a concern
in a construction project (The nature of time). Consultant and Client together assumed that
effectiveness and efficiency in communication resulted in, how much the red tape for fast
communication was overcome within the process (The nature of human relationships); Client
believed that continuous pressing could motivate the consultant and contractor (The nature of
human nature); all genders were treated equally in construction projects (Gender), Contractor
attempted to pass all responsibilities and blames to the consultant (The nature of human
activity), Consultant held an importance in the project team as the technical advisor to the
Client (The nature of human relationships), Client should be allowed to initiate variations
(Motive for behaving). Further, Contractor and Consultant both assumed that Contractor tried
to deliver the required quality in the project (Motive for behaving).
5.2 Differentiation Perspective of Construction Project Culture
Differentiation perspective identifies the existence of sub-cultural groups within the cultural
context. Clear evidence for professional sub-cultural existence including; contractor’s sub-

435
culture, consultant’s sub-culture and client’s sub-culture was available within the Project
XYZ. According to the differentiated basic assumptions, Contractor lacked trust on other
members of the team and basically profit motive. Consultant gave an attempt to win the client
as they valued the long-term relationship with the client expecting to gain Client’s future
projects. Client attempted to keep a proper control of project team members and portrayed as
an aggressive member and very demanding.
Many conflicting behaviours, thoughts and intentions between the sub-cultural groups in
Project XYZ could be better explained using the basic assumptions identified in Table 1. For
example, Consultant complained over contractor’s behaviour of targeting for additional
claims in most situations. As indicated by the differentiated basic assumptions, Contractor’s
financial profitability was of an utmost importance to the contracting organisation. Thus, they
believed that they should carry out any task within Project XYZ, if they were entitled for a
payment only. Thus, being vigilant over any possible claim was natural for the Contractor.
However, Consultant identified this as a disturbing behaviour giving a negative effect over
trust for team work within Project XYZ. Thus, Consultant had tried their best to avoid any
additional claims for the Contractor. Another example was; Contractor had a complaint that
Consultant tended to favour the Client. They further complained that Consultant used to have
tough control cost, deducting amounts in interim payment application to win the Client. This
situation could be explained using the differentiated basic assumptions indicated in Table 1.
Table 1: Differentiated Basic Assumptions (DBA) of Contractor, Consultant and Client
Contractor’s DBA Consultant’s DBA Client’s DBA
a) The nature of human relationships
1. Consultant tried to win the
client
2. Teamwork history was
beneficial for project success
1. Client depended on the
consultant as the technical
advisor
2. Perfect performance of
individual roles would bring
project success
3. Parallel project works at
organisation hindered
attending to all demands of
a specific project
4. Client was the most
important member in the
team
5. Effectiveness and
efficiency in
communication resulted in,
how much the red tape for
fast communication was
overcome within the
process
1. Contractor and consultant
always tried to defend
themselves by passing
responsibilities to each
other
2. Consultant was the most
important member in the
team
3. Effectiveness and
efficiency in
communication resulted in,
how much the red tape for
fast communication was
overcome within the
process
4. Consultant had the
legitimate control of the
project, but never used
b) The nature of human nature

436
3. A strong impartial project
manager was essential to
drive the project
4. Consultants were
impractical in their decisions
5. Consultants were careless
and lacked integration
among designers
6. Having a tough control
on project cost induced the
client’s faith on consultant
7. Contractor targeted for
additional claims in every
situation
8. Client believed that
continuous pressing could
motivate the consultant and
contractor
5. The most effective way
to get work done was
through continuous
monitoring and frequent
pressurising
6. A strong project
management was essential
for project success
c) The nature of human activity
6. The correct way of
behaving was being reactive,
not proactive
9. Contractor attempted to
pass all responsibilities and
blames to the consultant
10. The control in a
construction project was the
contract
7. Consultant was
responsible for quality of
the project
d) The nature of time
7. Continuing relationships
with client or consultant
were not essential, only
professional working
relationships were adequate
11. Continuing relationship
was very much important
with the client, but not with
contractor
8. Continuing relationships
with contractor or
consultant was not essential
9. Client was liable to make
timely payments to the
Contractor
e) The organisation's relationship to its environment
8. Contractor should always
be ready to have ultimate
justice through Adjudication
or Arbitration
12.This client was a special
client to the consultancy
organisation
10. Variations were not an
issue, as long as project had
enough funding
f) The nature of reality and truth
09. Experience and level of
authority were critical in
decision making in
construction
10. Understanding the
construction sequence was
critical for project success
11. Cause and effect
governed every aspect in
project context
13. Difficult to convince the
practical aspects of
construction to the client
14. Client mainly tracked
performance of the
consultant through the open
discussion at the progress
review meeting
g) Homogeneity vs. diversity
11. Consultant and
Contractor were bound to
deliver what was agreed in
the contract under any
circumstances
h) Motive for behaving

437
12. Continuous improvement
was a necessity
13. Profit making was the
ultimate objective of the
contractor
14. As finance was the
ultimate concern, contractual
entitlement for a payment
was essential to carry out
any work
15. Delivery of expected
project quality was an
organisational concern
15. As client being the end
user, satisfying the client’s
requirements should be a
priority
16. Contractor tried to
deliver the quality as
expected by the consultant
12. A construction project
would never be a priority of
a client’s day-to-day work
13. Client learnt within the
project life cycle, therefore
should be allowed to initiate
variations accordingly
i) Gender
16. Females lacked
practicality in work
17. All genders were treated
equally
14. The ideal was to have a
balance in genders
j) Unknowable and uncontrollable
17. Ultimate responsibility of
time, cost and quality of the
project resided with the
contractor
18. Contract was the biggest
control and up-holder of
justice in a construction
project
As indicated in Table 1, Consultant had the basic assumption that they had to have a
continuing relationship with the Client to obtain potential future projects. In addition, this
Client was a powerful government ministry in Sri Lanka, thus, treating them well was an
organisational concern for the Consultant. Thus, Consultant had found means of winning the
faith and trust of Client by having a proper control on cost of the Project XYZ.
5.3 Fragmented Perspective of Construction Project Culture of Project XYZ
Fragmented perspective revealed the ambiguities and paradoxes in basic assumptions. There
were three such major fragmentations in the basic assumptions of the project team members
which are described as follows:
a) Client was not much pleased with the Consultant’s performance, nor valued long term
relationships with the Consultant, but ultimately nominated the same Consultant for their
upcoming project. Client complained that all delays occurred in Project XYZ was due to lack
of a strong leadership and control by the Consultant and openly criticised the Project
Manager. The sub-cultural assumptions of the Client included; “Consultant had the legitimate
control of the project but never used” and “a strong project management was essential for
project success”. Further, Client firmly held the assumption that “continuing relationships
with contractor and consultant was not an essential”. More importantly, Client directly
expressed the dissatisfactions to the Consultant and complained the higher authority levels of
the Consultant in case of any underperformance. However, still Client wished to have the
same Consultant for their upcoming project. The justification given by the Assistant Director

438
(Premises) was that this Consultant was known to them and more comfortable to work with
them, but other members had no proper justification. As Consultant of Project XYZ was a
semi-government organisation, there was no any hidden special benefit available for the
Client’s representatives for appointing the same Consultant or it was not a decision taken due
to any influence of the higher authorities of the Client and there were some other government
consultants readily available in the market for hiring for this project.
b) Consultant was very strict on monitoring, whether the Contractor was going inline with the
contract and was strict on payments to the Contractor, but at the same time expected
Contractor to work informally beyond the Contract. Strict basic assumptions of the
Consultant included; “control in a construction project was the contract”, “having a tough
control on project cost induced the client’s faith on consultant” and “perfect performance of
individual roles would bring project success”. Having such grounds, Consultant also held the
contradictory assumption that “effectiveness and efficiency in communication resulted in,
how much the red tape for fast communication was overcome within the process” and
complained that Contractor believing only in formal written methods of communication as
hindering the project progress. The project was lagging behind due to concurrent reasons of
Client, Contractor and Consultant. Yet, Consultant had massive complaints that Contractor
did not take necessary initiatives for acceleration such as; increasing the number of labourers,
working both day and night shifts, working at least with 50% of workers during New Year
Festive season. However, working night shifts was not stated within the contract and there
were legal restrictions to work during night by local authorities due to possible disturbances
to the dwellers around the area of construction. Further, when the Consultant was questioned
on whether they were ready to pay any additional costs such as overtime for workers who
worked night shifts, they refused such payments, indicating acceleration was required due to
Contractor’s own faults and Client was not entitled to pay any extra to the agreed contract
sum. Whenever the Contractor put forward any additional claim, Consultant had looked down
on it, holding the basic assumption that; “Contractor targeted for additional claims in every
situation” and indicated it as a disturbing behaviour requiring the Consultant to be careful all
the time to avoid such claims. Thus, Consultant requiring the Contractor to be less formal and
treating them formally by themselves was ambiguous within the project culture.
c) Another fragmented behaviour was that Client aggressively demanded partial completion
of the building on time, but awarded extension of time gradually, whenever Contractor failed
to achieve the time target. Client strongly held the assumption that “Consultant and
Contractor were bound to deliver what was agreed in the contract under any circumstances”
and “Client was the most powerful member in the project team”. By the time the case study
was carried out, the project was still lagging behind time even after extending the date of
completion for two times. Before awarding the second extension, Client had refused the
second request for extension and demanded to handover the building. Chairman of the
Contractor’s organisation was summoned to the Client’s office and complained about this and
strongly indicated that they were expecting to blacklist the Contractor if failed to achieve the
time target given. This was because, this Client was one of the powerful ministries in Sri
Lanka. Further, Client had organised an opening ceremony believing that Contractor would
hand over the building accordingly. However, Contractor had failed to do a partial
completion and that had resulted in a huge disappointment of the Client. However, this issue
had ended up awarding second extension of time and no Liquidated Damages were claimed
from the Contractor. Nevertheless, Contractor was on the verge of failing to achieve the third
extension of time as well. Client and Consultant both complained that the reasons for the
third delay were solely due to Contractor’s lapses such as; problems in material procurement

439
and labour scarcity, which was accepted by the Contractor too. Contractor had made some
initiatives such as; installing temporary ceiling and glasses for windows until the materials
got imported as per the exact specifications. Client’s representatives mentioned that they
would definitely refuse the third request for extension of time and claim Liquidated Damages
from that point onwards. However, Consultant did not believe that Client would claim
Liquidated Damages as usual. Consultant declared that the reason for this careless behaviour
of Contractor was due to the lenient nature of the Client, where Client did not stick to the
words on their power and punishments and Contractor had the habit of feeling complacent
over the project matters. Project Manager had some presumption that Client became
demanding when the higher authorities of Client organisation started pressurising the Client’s
representatives only.
6. CONCLUSIONS
This research was an attempt to explore the patterns of underlying basic assumptions of the
public sector construction project culture using a hybrid of integration, differentiation and
fragmentation perspectives of culture. Integration perspective identified that all project team
members collectively assumed client as the most powerful member in the project team,
whose decisions could be uncertain at times. Further, all members assumed that contractor
lacked trust on other two sub-cultural groups (client, consultant) requiring formal instructions
in black and white. They believed that conformance to the contract was rewarding and
appreciations were very rare among members.
Differentiation perspective identified that there were strong professional sub-cultures existed
as client, contractor and consultant. Differentiated basic assumptions identified for each sub-
cultural group (contractor-consultant-client) are given in Table 1. Accordingly, contractor
lacked trust on consultant and client, operated with profit motive and believed that practical
working experience as essential for working for a construction project. Consultant was
looking more into pleasing and fulfilling the client’s requirements and valued maintaining a
long term relationship with the client with the objective of receiving new projects from them.
Client demonstrated an autocratic behaviour and assumed that project team should be under
their proper control. These differentiated basic assumptions could be used to better explain
several conflicting cognitions among the client, contractor and consultant.
The fragmentation perspective of public sector project culture of the selected case
demonstrated three notable ambiguous, blind spots in cultural context, which couldnot be
properly explained. The first ambiguity included; the Clients behaviour of nominating the
same Consultant for their upcoming project even though Client was not satisfied with the
performance of the Consultant or not valued maintaining a continuous, long term relationship
with the Consultant. Second ambiguity included; the Consultant requiring the Contractor to
be informal in their behaviour, considering such behaviour could be more effective and
efficient, but at the same time treating the Contractor in a very formal and strict manner
following the contract terms. Third ambiguity included; Client aggressively demanding on
timely partial completions of the project by the Contractor but, when the Contractor failed to
achieve the given targets, Client seemed to be accepting the Contractor’s mistakes and
treating very leniently.
Thus, describing the project culture only with the integration and differentiation perspectives
by avoiding those ambiguities would have been misleading. This was because, culture did not

440
consist merely with commonly agreed manifestations at all times. Rather, portion of project
culture consisted of a constant flux of commonly agreeing and disagreeing on certain
manifestations. The output of this research would be useful for construction project
participants to understand the cognitions behind the behaviours of public sector construction
project team members. Further research includes, replication of these findings in some more
similar cases for strong confirmation of the findings.
7. ACKNOWLEDGEMENT
The authors wish to thank the Association of Commonwealth Universities, United Kingdom
for providing financial support to participate and present this paper in 13th International
Postgraduate Research Conference of University of Salford, Manchester, United Kingdom.
8. REFERENCES
Ankrah, N. A. and Langford, D. A., 2005, Architects and contractors: A comparative study of organisational
cultures, Construction Management and Economics, 23(5), 595-607.
Ankrah, N. A., Proverbs, D. and Debrah, Y., 2009, Factors influencing the culture of a construction project
organisation, Engineering, Construction and Architectural Management, 16(1), 26-47.
Cicmil, S. and Gaggiotti, H., 2014, The 'slippery' concept of 'culture' in projects: Towards alternative theoretical
possibilities embedded in project practice, The Engineering Project Organisation Journal, 4(2-3), 134-146.
Creswell, J. W., 2009, Research design: Qualitative, quantitative and mixed method approaches, 3rd ed., Sage
publications, California.
Duarte, D.L. and Snyder, N.D., 1999, Mastering virtual teams: strategies, tools, and techniques that succeed, 1st
ed., Jossey-Bass, San Francisco.
Gajendran, T., Brewer, G., Dainty, A. and Runeson, G., 2012, A conceptual approach to studying the
organisational culture of construction projects, Australasian Journal of Construction Economics and
Building, 12 (2), 1-26.
Harris, L.C. and Ogbonna, E., 1998, A three-perspective approach to understanding culture in retail
organisations, Personnel Review, 27(2), 104 – 123.
Harrison, G.L. and Baird, K.M., 2015, The organisational culture of public sector organisations in Australia.
Australian Journal of Management, 40(4), 613-629.
Hills, M. D., 2002, Kluckhohn and Strodtbeck's values orientation theory. Online Readings in Psychology and
Culture, 4(4).
Hofstede, G., 1980, Culture’s consequences: International differences in work-related values, Sage
Publications, California.
Kappos, A. and Rivard, S., 2007, Review: cultural interpretations from multiple perspectives: a three-
perspective theory of culture, information systems and the development and use processes, HEC Montréal,
1-57.
Kluckhohn, F. R. and Strodtbeck, F. L., 1961, Variations in value orientations, Row, Peterson, Evanston, IL.
Kumaraswamy, M., Rowlinson, S., Rahman, M. and Phua, F., 2002, Strategies for triggering the required
‘cultural revolution’ in the construction industry, In: Fellows, R. F. and Seymour, D. E., Proceedings of CIB
TG-23—Perspective on Culture in Construction, CIB Publication 275, 268-285 September 2002, CIB
General Secretariat, The Netherlands.
Martin, J., 2002, Organisational Culture: Mapping the terrain, Sage, Newbury Park, CA.
Martin, J., 2004, Organisational culture, Research Paper Series, Stanford, Research Paper No 1847.
Nutt, P.C., 2006, Comparing public and private sector decision-making practices, Journal of Public
Administration Research and Theory, 16(2), 289-318.
Rameezdeen, R. and Gunarathna, N., 2003, Organisational culture in construction: An employee perspective,
The Australian Journal of Construction Economics and Building, 3(1).
Richter, A. and Koch, A., 2004, Integration, differentiation and ambiguity in safety cultures, Safety Science, 42,
703-722.
Schein, E. H., 1983, The role of the founder in creating the organisational culture, Organisational Dynamics,
13-28.

441
Saunders, M., Philip, M. and Thornhill, L.A. 2009, Research methods for business students, 5th ed., Pearson
Education Limited, Essex.
Schein, E. H., 1984, Coming to a new awareness of organisational culture, Sloan Management Review, 25 (2),
3-16.
Schein, E. H., 2009, The corporate culture survival guide, Jossey-Bass, California.
Thomas, R., Marossezeky, M., Karim, K., Davis, S. and McGeorge, D., 2002, The importance of project culture
in achieving quality outcomes in construction, In: Proceedings of 10th Annual Conference of the
International Group of Lean Construction, 1-13 6-8 August, Gramado, Brazil.
Zuo, J., 2008, Project culture in the Australian construction industry: lessons for China, Thesis (PhD),
University of South Australia, Australia.
Yin, R. K., 2009, Case study research-design and methods, 4th ed., Sage Publications, New York.

442
ID 018
A THEORETICAL TRANSFORMATIONAL ORGANISATIONAL
FRAMEWORK TO IMPROVE IRAQI QUASI-GOVENMENTAL
CONSTRUCTION COMPANIES’ PERFORMANCE
T. Al-Obaidi and A. Higham
School of the Built Environment, University of Salford, Salford, M5 4WT, UK
Email: [email protected]
Abstract: Over the last decade, Iraqi Quasi-Governmental Construction Companies
(IQGCCs) have faced wide criticism due to their poor performance, low productivity and
inability to generate profits. An earlier study conducted by the researcher has pinpointed a
number of deficiencies in the current practices of these companies, resulting mainly from
adopting a traditional management system dominated by hierarchical structures, centralised
controls, and high levels of bureaucracy. Yet, both theoretical and empirical studies reveal that
organisations can survive, succeed and enhance their overall performance through focusing on
improving their business processes (BPs). This paper aims to synthesise a theoretical
transformational organisational framework to address the challenges emanating from current
practice within IQGCCs with the view of determining a step change improvement that could
ultimately enhance their bottom line performance. Consequently the work proposes a
theoretical framework that acts as a roadmap to streamline and implement continuous
improvement within Iraqi QGCCs core business processes. The paper concludes by proposing
further data collection to validate of the framework proposed in the context of IQGCCs.
Keywords: Business process, Construction companies, IQGCCs’ Performance, Framework.
1. INTRODUCTION
Following the US led invasion in 2003, Iraq has been subject to radical change, especially, in
its political and economic systems. This change has directly impacted upon the Iraqi business
environment in general and Iraqi Quasi-Governmental Construction Companies (IQGCCs) in
particular. Where, after decades of domination over most publicly funded construction
contracts, these companies face fierce competition from in excess of 3,500 local and
international private firms. As a result, IQGCCs have subsequently struggled to both win
contracts and generate profit (Wing, 2009). Consequently the majority have incurred
substantial financial losses becoming unsustainable burdens on the national budget (IPMO,
2015). This along with concern about the ongoing inability of these companies to improve
their poor performance, low productivity and high levels of inefficiency has resulted in calls
for the Iraqi government to radically reform or even close these loss-making businesses
(Shikhely, 2007; IPMO, 2015).
Seminal researchers, including Porter (1985), McCormack (2007), and more recently Trkman
et al. (2015) espouse that in today’s turbulent and competitive business environment focusing
on improving business process (BP) remains the most appropriate means by which
organisations can survive, succeed and ultimately enhance their performance and competitive
advantage. Egan (1998) in his report Rethinking Construction advocates adopting just such an
approach as a route to improving low productivity, profitability, and quality within the UK
construction industry. Consequently several plans and models such as RIBA plan of work,
OGC gateway process, and the more academically robust Generic Design and Construction

443
Process Protocol have been proposed to streamline and improve the process of construction.
Yet, most of these initiatives have been designed with a focus on the project rather than the
businesses involved, as a result a strong emphasis is placed on the enhancement of the project
processes typically from the client’s prospective or that of their professional team. As a result
insufficient attention is placed on how the business processes (BPs) of the main contractor
engaged under traditional procurement. Especially in a way that would allow the main
contractor to positively contribute to formalising and developing approaches used to execute
their projects (Serpell and Diaz, 2016). More over, the process frameworks identified above
has been typically developed from the prospective of western developed nations, as such
developing; post-conflict nations such as Iraq have been dis-regarded. It was therefore
resolved to look at the applicability of these process frameworks in one such post-conflict
country.
Forming part of an on-going doctoral study, aiming to develop a conceptual framework for
the enhancement of business processes within existing IQGCCs in order to trigger a step
change improvement in their performance. The first phase of this research revealed a number
of challenges exist within the core BPs of these companies that prevent them from operating
efficiently. Qualitative analysis revealed four fundamental factors that need to be overcome if
performance is to be enhanced, these included: 1) government regulations imposed by
government on IQGCCs; 2) management system adopted by these companies; 3) authority
distribution; and finally 4) communication system. Consequently the research presented in
this paper then from the second phase of the doctoral study proposes a transformational
organisational framework that addresses the challenges existing in the IQGCCs current
practices by providing a formal structure and systematic process through which these project
delivery can be enhanced and business processes refined.
2. BACKGROUND ON BUSINESS PROCESS VIEW
2.1 Business Process BP
Existing literature includes a myriad of different definitions for a BP, yet when distilled to
their principal features the majority of these definitions include the same series of key
elements. As summarised by Palmberg (2009) and illustrated in figure 1, these include: an
input (need), a horizontal sequence of repeatable activities, the resources needed by the
production process and ultimately an output (result). These features are further encapsulated
in Looy’s et al. (2011:1124) definition of a business process, namely as a: "repeatable set of
coherent activities, triggered by a business event and performed by people and / or machines,
within or among organisations, for jointly realising business goals and in favour of internal
and / or external customers".
Figure (1), Business process components (Palmberg, 2009, p. 207)

444
The rapid development of information technology over the last two decades along with the
liberalisation of international trade have led to flare up the global competition and diverse
customer needs (Ivanko, 2013). Seminal researchers, such as Porter (1985), Hammer and
Champy (1993), Mc Cormach (2007), and Trkman et al. (2015) contend that organisations
can survive, succeed and ultimately enhance their performance and competitive advantage if
they are willing to focus on improving their BPs. Focusing on the BP means viewing and
managing an organisation as a combination of highly integrated processes not as a collective
of functional areas (Hammer and Stanton, 1999) and being oriented towards processes,
customers and outcomes as opposed to hierarchies (McCormack, 2007). This way of thinking
of an organisation has been described by McCormack and Johnson (2001) as Business
Process Orientation or BPO.
2.2 Business Process Orientation (BPO)
McCormack and Johnson (2001) define BPO as “the level at which an organisation pays
attention to its relevant (core) processes” (end-to-end view across the borders of
departments, organisations, countries, etc.)”. As such BPO explores how an organisation
activities, jobs, structure, measures, rewards and resources augment around the horizontal
sequence of processes that sit at the organisations core in a way that enhances overall
performance whilst also ensuring value is provided to their customers. Baloh et al. (2008) and
Skrinjar et al. (2008) consider focusing on BP as a best practice management paradigm
correlated to organisational performance results. Bronzo et al. (2013) also concur suggesting
the implementation of BPO can have a significant role in value creation and in improving
companies’ performance. However, Kohlbacher (2009) advocates a wider range of potential
benefits can be associated with the implementation of BPO including: enhancements to
customer satisfaction, product quality, delivery and time-to-market speed. Reviewing the
literature reveals a consensus amongst researchers regarding the main dimensions of a
business process oriented organisation, as identified by McCormack (2007) and reinforced in
the later work of Skrinjar et al. (2010), these principle features include:
1) A process view of the business thorough documentation and understanding from top
to bottom and beginning to end of a process exists in the organisation;
2) Process jobs which pertain to define the tasks and roles required to operate and
perform processes;
3) Structures that match these processes;
4) Management and measurement systems that direct and assess these processes;
5) Customer focused, empowerment and continuous improvement oriented values and
beliefs (culture) that are embodied in all components.
2.3 Business Process in Construction
Despite the construction industry recognising the value of improving and optimising its
processes as early as the 1970s, yet the real awareness of the importance of applying the
process concepts in the industry has significantly increased after the mid of the 1990s
(Alshawi, 2007). Accordingly a number of models and plans have been launched to improve
the process of construction. The RIBA plan of work (RIBA, 1973), FIDIC tender procedure
(FIDIC, 1994), Generic Design and Construction Process Protocol (GDCPP) (Kagioglou et
al., 1998), Framework for construction procurement (OGC, 2003), and Integrated Project

445
Delivery (AIA, 2007) are amongst the initiatives that have advocated in a way or another the
process view with the aim of adding value to the customer, improving productivity, reducing
defects and increasing profitability in construction. Therefore, most of these models have
been developed mainly to improve the construction project processes through providing
systematic ways and guidelines that enable the various parties involved in the projects to
work in a more collaborated and integrated environment. Moreover, they have generally been
designed from the client or architect perspective. While little attention has been paid to study
or indeed improve the structure of BPs adopted by construction companies related to the
delivery of their projects (Serpell and Diaz, 2016). Moreover, although this global orientation
attempts to adopt the BP principles in the construction industry, the Iraqi context has yet to be
appraised in this body of international literature. An exploratory study conducted by the
researcher, however, revealed that IQGCCs have continued to adopt traditional operating
systems with a hierarchical structure and very centralised control. A system that, Graetz and
Smith, (2009) profess, has become out-dated and is now unable to cope with the challenges
of the new business environment created as a result of neo-liberal, capitalist business
structures adopted by IQGCCs international competitors. Accordingly, in order to survive
and succeed, IQGCCs must now move away from the traditional functional model towards
business process orientation, which can be seen as the most appropriate way to improve their
performance and competitive advantage in the new post-conflict Iraqi as the economy is
diversified and re-focused towards neo-liberalist ideals of competition and less government
control (Steger and Roy, 2010). Yet, the lack of a framework or a systematic way for
managing and continuously improving the BP in full, at the core of these companies means
such change is hard to achieve in practice. Finnemore et al. (2000) assert that without a
standard process model, companies would not be able to repeat or coordinate benefits and
measure their performance over time. In the same vein, the senior manager of an Iraqi
QGCCs interviewed by the researcher argued that the absence of a clear systematic strategy
or roadmap driven by senior management can subsequently lead to a situation whereby each
individual project is managed solely on the experience and skill of the project manager.
Accordingly, there seems to be an urgent necessity to develop a transformational
organisational framework, employing BP principles, that will both address the challenges
inherent within current practices of IQGCCs and whilst also ensuring they make a step
change improvement in their performance. Moreover, the developed framework would
provide the IQGCCs managements a roadmap to streamline and continuous improve their
companies core business processes through suggesting tools to enhance their cross functional
integration, decision-making, the quality of processes leading to improve outputs, and
instilling knowledge based practices that capture and share lessons learnt across the
organisation.
3. RESEARCH METHODOLOGY
To handle the challenges besetting the IQGCCs business processes, the researcher first
needed to appraise the current processes operating at the core of IQGCCs to identify the main
challenges faced by the government when seeking to transform practice. Accordingly, a
comprehensive literature review was conducted through employing SOLAR Library Search,
a facility offered by the University of Salford to search and access the resources available in
both print and electronic form, to determine the most effective solutions. Other database
search engines, namely Scopus and Google Scholar were also used. Keywords such as
“business process elements”, “business process orientation”, “best practice in construction”,

446
“business process in construction”, etc. were used in searching required resources. Academic
papers (journal and conference), books, official reports, and doctoral theses with these
specific keywords in their title and abstract were briefly reviewed to identify the most related
ones to be studied in depth. As a result, a number of solutions to address the challenges in the
IQGCCs’ core business process were identified and synthesised together to form the
proposed theoretical framework presented in this paper.
4. SOLUTIONS PROPOSED TO ADDRESS THE CHALLENGES OF IQGCCS'
CURRENT PRACTICE
Four interrelated factors have been identified as the main causes for the most problems in the
IQGCCs’ current practice. This section discusses how applying the business process
orientation elements would help in overcoming most of these challenges by remedying their
key causes.
4.1 Government Regulations
Since the government regulations in Iraq are generally formulated and adjusted at a very high
ministerial echelon and national level, namely the Council of Ministers and Parliament.
Accordingly, this factor can only be solved through recommendations and orders from the
government itself. However, for the purpose of this research, it has been assumed that
IQGCCs are profit-seeking entities, managed independently and not subject to the current
governmental regulations and/or political interfere in their commercial operations or strategic
planning.
4.2 Management
Multidisciplinary team versus functional departmentalization
A BP prospective is a managerial approach that views an organisation as a combination of
integrated processes rather than a collection of functional areas. It concentrates on integrating
and streamlining different functional expertise in the process with the aim of creating and
delivering a product or service that has the best value to customers (Tang et al., 2013). Thus,
one of the essential anticipated results of adopting the BP view is the reinforcement of cross-
functional integration. Cross-functional integration, as described by Troy et al. (2008), is the
degree of interaction, communication, information sharing, and coordination across
departmental boundaries. Turkulainen and Ketokivi (2012) profess that cross functional
integration fosters employees to obtain a comprehensive overview of BPs and promotes
organisations on reducing the functional sub-optimisation that is inherited in the traditional
system. In organisations with a high level of cross-functional integration, the employees'
activities are generally driven by the customers' needs and the organisation-wide values,
rather than being directed by narrow departmental objectives or cost minimization (Johnson
and McCormack, 2011; Tang et al., 2013).
However, Willaert et al. (2007) argue that cross-functional integration endeavours are
essential to be constituted in official functional areas. Similarly Johnson and McCormack
(2011) argue levels of success are dependent on the extent to which the organisation is
horizontal and vertical integrated. In fact, companies may need to replace their traditional
structures with a process-based and value aligned structure that focuses on the delivery of
447
business efficiency and lean production if they are to continue to be successful in their target
market. In other words, they should find a way to combine the specialisation and expertise of
a functional structure with the adaptability and responsiveness of a process-based structure
(Neubauer, 2009; Skrinjar and Trkman, 2013). Whilst such an endeavour can usually be
achieved through multidisciplinary or task-focused teams, these teams need to work on
asynchrony of processes crossing the functional silo boundaries and ending with the customer
(Willaert et al., 2007; Skrinjar and Trkman, 2013). This is in line with arguments expressed
Johnson and McCormack (2011) and Tang et al. (2013) who both empirically evidenced that
assigning stakeholders from different departments to a single team with a common goal and a
series of supporting objectives will lead to increased cross-functional integration and thus
eliminate the sequence of tasks with hand-overs between the various functions. Thereby
reducing conflict between internal stakeholders while also enhancing organizational
performance.
Documenting and redesign the organisation’s business processes
Developing a good level of cross-functional integration requires every individual in the
company has a clear view of the firm’s common processes and a precise understanding of
their own role in the processes and how that integrates into the bigger organisational picture
(Skrinjar et al., 2010). This, unfortunately, does not seem the case in IQGCCs. Solving such
issues could be achieved by increasing the process view in organisations. Yet, this
necessitates them producing a good and thorough organisational process map that clearly
documents the organisation’s BPs. Thus enabling all employees to understand the reality of
their company's business whilst also encouraging every employee to identify potential
problem points that need to be remedied (McCormack, 2007). Such a management approach
allows and even encourages employees to look beyond their own tasks and the boundaries of
their departments to consider any deficiencies and bottlenecks in the whole business process.
Willaert et al. (2007) further stress that good process documentation becomes the basis for
process performance measurement, analysis and improvement. Moreover, Tang et al. (2013)
argue that the process view offers internal stakeholders with different expertise, a common
language and a solid platform to cooperate and interact with each other under the same goal
and objectives. It visually shows them the role of each stakeholder in the BP and how they
work together to produce a final product or service (Bernstein and Singh, 2006).
Process owner
The most important advantage, which IQGCCs can gain from adopting the process focus as
an alternative to the hierarchy, is the emphasis placed on assigning responsibility in a non-
hierarchical manner (Campos and de Almeida, 2015). Under the process structure every BP
has to have a process owner who takes overall responsibility for the horizontal overview of
the assigned process from end to end (Kohlbacher and Reijers, 2013). In other words, the
process owner is primarily accountable for the results of the process, which can have a direct
effect on the customer. Their main role is to thereby ensure that all activities and tasks within
the process are performed as planned. Furthermore, the process owner has additional
responsibility for designing and continuously improving the assigned processes, measuring
their performance and ensuring that all processes are running smoothly and effectively
(Campos and de Almeida, 2015). Willaert et al. (2007) further suggest that the role of the
process owner can be assigned to anyone within the organisational hierarchy, thus it does not

448
necessarily lead to the emergence of new managerial functions. Willaert et al. (2007) espouse
that in some organisations it is common practice for certain employees to occupy multiple
managerial roles. In this context, a senior manager, for example, could be both the manager
of a certain functional area and the manager of an end-to-end process.
Stage gate and phase review
In order to improve the decision-making process and the overall organisational performance,
it is proposed that the stage-gate processes proposed by Cooper (1994) be adopted for the
final proposed transformational organisational framework. Cooper in his third generation
process, noted that there is a necessity for “conditional-go” decisions at phase gates to
provide and create aspects of concurrency among the various people involved in the process.
Thus, such gates can be seen as decision points involving a collection of predefined standards
or deliverables that must be or should be met by the process at certain points in time in order
to proceed to the next stage of development. In other words, the gates represent quality
control checkpoints and are typically controlled by senior managers and members of the task-
focused team, who collectively have responsibility for allocating the resources needed to
complete the processes identified (Cooper et al., 2005). Moreover, the stage gates, or as often
called phase review process provide the management with an effective means to record and
update the organisations experiences throughout the core BP, and thus using such information
later as lessons learnt to improve both the subsequent phases and the future projects
(Kagioglou et al., 1999; Wu et al., 2001).
4.3 Authority
An important aim of process thinking is to streamline the business process and accelerate
decision-making process through eliminating non-value added activities and unnecessary
bureaucratic procedures. Yet, this requires the organisation breaks down the hierarchical and
central control system and to redesign employees’ job roles around the organisation’s core
BPs. Therefore, process jobs, which refers to the extent to which personnel's work is
structured around the BPs that produce the final products or services, are deemed to be an
essential element in conceptualising the BPO (Tang et al., 2013). Johnson and McCormack
(2011) argue that with process jobs, horizontal or process oriented authority is also enabled.
According to them such level of authority is extremely important when looking to improve
organisational performance, since this approach would extend across existing functional
boundaries to guide and encourage personnel to work together towards common goals and
objectives. McCormack (2007) also explains that in high-level business process maturity
organisations, personnel usually work as process owners or in process teams. They have full
responsibility and accountability for performing and improving the BPs related to creating
products or delivering services adding value for the customer (Tang et al., 2013). This
concept, as Holt et al. (2000) express, leads to the autonomous mechanism of empowerment
that gives employees greater freedom to manage their business processes in a way that creates
self-responsibility and promotes self-efficacy. Researchers from different sectors including
the construction industry emphasise the importance of the empowerment in providing a
sustainable competitive advantage and improving the overall organisational performance
(Meyerson, 2012, Kariuki and Murimi, 2015), reducing conflict and ambiguity in employees’
role and improving their performance and job satisfaction (Yang and Choi, 2009; Rajalingam
and Jauhar, 2015).

449
4.4 Communication
Analysis of IQGCCs current practices revealed that one of the key contributors to both delay
and increasing costs are failings in the communication systems adopted. The exploratory
work revealed these processes are manually driven and paper based. Nevertheless, resolving
the problems associated with the communication system through the introduction of an
information communication technology driven system (ICT) is likely to significantly enhance
efficiency across the organisation. Establishing, for instance, a central database, that links the
company's headquarters, regional offices and projects together and is accessible by key
internal stakeholders can substantially accelerate communications, improve their quality and
importantly reduce the organisations' costs by providing a quick, reliable and robust
communication process (Alshawi, 2007). Additional, Information Technology (IT) also offers
effective tools for storing and maintaining data in an organised and efficient way. Reports
and other relevant documents developed throughout the execution of the BPs can be stored in
an electronic database to be examined and presented in different views.
5. THE PROPOSED THEORETICAL FRAMEWORK
Cooper (1994:3) considers having a “formal blueprint, roadmap, template or thought process
for driving a new product from the idea stage to market launch and beyond” as a
fundamental element to succeed every company. Without developing a formal structure and
systematic way for delivering new projects, companies can easily slip from their desirable
result, by forgetting or neglecting stages in the process. Similarly, Lee (1998) advocates the
most successful organisations are those that have adopted a generic process and developed
and adapted it to fit their needs and continue to amend it to meet the needs of each individual
project. Consequently, there is an utmost necessity to synthesise a framework that brings
together all the proposed solutions and presents them in a visualised manner.
As a result the proposed theoretical framework has been synthesised through a
comprehensive review of literature related to both business processes, best practice guidance
for the management of large construction companies and the body of literature related to
project delivery processes for both traditionally procured civil engineering and construction
projects. Moreover, the Generic Design and Construction Process Protocol (GDCPP)
launched by the University of Salford, has been employed as the key initial notion for
development this framework. Whereby the Y-axis is used to represent the main drivers and
controllers of the core business process, whilst the X-axis represents the time scales or stages
that the core business process goes through:
5.1 Assumptions underpinning the theoretical framework
The framework has been developed for large contracting, construction companies that have
repetitive construction works under the traditional procurement form, namely the “design-
bid- build contract” and “unit price” agreement. Under such contracted form, the winner
contractor is responsible for executing the project within its agreed costs, timeframe, and
quality. Since this contracting form is the dominant form of procurement in Iraq.
450
5.2 Elements of the proposed theoretical framework
The proposed theoretical transformational framework is comprised of the following key
elements as depicted in Figure 2.
1) Project phases and stages
The framework has been divided horizontally into four main phases, namely: bidding;
pre-construction planning; construction; and closeout and termination. These phases have
been defined to represent the different time segments of a construction company’s core
business process. However, in order to provide a better management of the business
processes, each phase has further been split into a number of stages as shown in figure 2.
2) Process
Processes depicted in the framework represent the high-level or generic processes. Each
process comprises a set of activities executed co-ordinately by a multidisciplinary team
with the aim of generating information and/or producing deliverables for other processes.
3) Internal stakeholders The framework has been designed to comprise the key stakeholders that they are directly
involved in undertaking the core business process. Stakeholders would be grouped under
various functional areas according to their specialties. The functional areas are proposed
to be mainly allocated at the regional level to conduct specific activities and to be source
of specialists and centres for training. Yet, every project based on its size, type, and
complexity may have one or more stakeholders from each of these functional areas,
which together perform the project management team that is directly linked to the project
manager. The framework has also been designed to show who should be engaged in
executing the processes and when. This would ensure achieving the concept of the right
people having the right information at the right time. Moreover, it would also facilitate
identifying the roles, responsibilities, accountabilities, experiences and efforts required of
the various employees involved in conducting the different processes and what kinds of
training they need in order to ensure undertaking the processes in an effective and
efficient way. It is important to mention here, that these functional areas are not
necessarily to be departments per se, but rather every individual department can be
formed of one or more of these functional areas.

451
Construction Closeout & termination
Project Manager Project Manager
Regional
Manager
Project
Manager
De
cisi
on
Ma
ker/
Ga
tes
Co
ntr
olle
rs
Mobilisation Deliver to site Commence work on siteGet opportunity Work up bid Tender review and submission Post-tender negotiation Post awarding review
Project Manager
Bid
Ma
na
ge
r
Initial
project
evaluation
Review &
examine
tender
documents
Carryout
risk
analysis
Prepare
tender
programme
Establish
a bid team
Check &
review
tender
documents
Visit the
worksite
Propose
alternative
design
Check & analyse the
received quotation
Prepare
method
statement &
pre-tender
programme
Prepare the construction cost
estimate Produce
the
estimating
reports
Settle final
bid price
Prepare bid
documents
Document &
submit priced
tender
package
Adjudication
meeting /
Mark-up
value
Pla
nn
er
Co
ntr
act
s
Ma
na
ge
rB
uye
rD
esi
gn
er
Co
mm
erc
ial
Dispatch
quotes &
quotations
Buy & collect
tender
documents
Contract
review &
negotiation
Le
ga
l
Chief estimatorProcess
OwnerChief estimator Chief estimator Chief estimator Project Manager
Tender
performance
review
Meet the
client &
site
possession
Project Manager
Produce
method
statements
& master
programme
Develop
staffing
plan
He
alth
&
safe
ty
Review &
consider
any errors
Review the
contract
documents
& site visit
Revise and
update risk
management
plan
Fin
an
ce
Produce
health &
safety plan
Review &
update
procurement
plan
Check &
submit the
required
contract
documents
& securities
Check &
submit the
required
contract
documents
& securities
Organise
project
worksite
Place
purchasing
orders & deliver
to the worksite
Execute construction activities
Update project execution plan
Kickoff meeting
Reallocate &
terminate
construction
team &
resources
Pro
ject
Ma
na
ge
r
Undertake
post project
review &
analysis
Fe
ed
ba
ck to o
the
r pro
jects
Bidding Process
Project Level
Pre-Construction Planning
Regional Level
Copy Center Copy Center
Stage
Review
Report
Copy Center
Stage
Review
Report
Copy Center
Stage
Review
Report
Copy Center
Stage
Review
Report
Copy Center
Stage
Review
Report
Copy Center
Stage
Review
Report
Copy Center
Stage
Review
Report
Stage
Review
Report
IT
Channel
Ha
rd G
ate
Ha
rd G
ate
Ha
rd G
ate
So
ft G
ate
Ha
rd G
ate
So
ft G
ate
So
ft G
ate
So
ft G
ate
Data &
lessons from
and into other
projects
Area Managing
Director
CEO
Regional Chief
Estimator
Bid/no
bid
Pro
ject
En
gin
ee
r
Site
Su
pe
rvis
or
Pla
nn
er
Bu
yer
Acc
ou
nta
nt
Ta
sk T
ea
ms
Hold
handover
meeting
Hold
handover
meeting
Hold
handover
meeting
Review the
contract
documents
Acquire
construction
team
Acquire
construction
team
Manage health & safety
Manage health & safety
Operational test and
maintenance
Finalise
as-built
plan
Reallocate &
terminate
construction
team &
resources
Manage procurement process
Manage procurement process
Re
gio
na
l Le
vel
Pro
ject
Le
vel
Establish
Project
Management
Team
Establish
Project
Management
Team
Confirm the
project
budget and
cost
systems
Confirm the
project
budget and
cost
systems
Produce
health &
safety plan
Plan the
project’s
site
layout
Plan the
project’s
site
layout
Plan the
project’s
site
layout
Clarification
meeting
Construction
starting meeting
Package
completion review
Tender final
review
Monitor & control performance
Phases & StagesKey Gates
Controllers
Pro
ce
ss
Ow
ne
rS
tak
eh
old
ers
Processes
Stage Gate
Stage Review
Report
IT Channel & Feedback
Figure 2: The proposed transformational organisational framework

452
4) Process owner
Two process owners have been identified and proposed to take the overall responsibility
for managing and improving the core business processes, namely the regional chief
estimator and project manager. The regional chief estimator is responsible and
accountable for the whole bidding process. Whereas the project manager would take
responsibility for managing the remaining phases within the core business process.
5) Stage gate and phase review
Each stage of the theoretical framework combines a number of the processes that should
or must be performed. A stage gate acts as a quality control checkpoint at the end of each
stage where preceding activities and expected deliverables are reviewed before a decision
is made to proceed with the subsequent stage. The framework has two patterns of gates,
specifically, “soft” gates and “hard” gates. A soft gate authorises conditioning proceeding
to the next stage without having to complete all the activities of the prior stage. Thereby,
it reduces the waiting time by giving the flexibility to the process to flow into next stage,
while at the same time providing an efficient tool to identify and note the activities that
are not completed in time. Whereas, with the hard gate proceeding to the following stage
cannot be authorised unless all of the prior stage’s activities have been completed.
6) Gage controllers
In order to enhance the reliability and quality assurance of the decisions made at each
stage gate, it has been proposed that the reviewing of the processes’ outputs at the end of
each stage should be conducted through formal meetings. Such meetings can involve
senior managers and employees from various functional areas.
7) Stage review report
Following to the phase review meeting, a stage report should be produced. This report
generally comprises the main deliverables of work assessed, any decisions have been
made, and the compilation of all related information and documents generated by the
stakeholders throughout that stage.
8) IT channel and feedback
Stage review reports produced throughout the process have been offered to be stored and
maintained in an electronic database. This would facilitate recording, updating, accessing
and using information and data generated during execution the business process later as
lessons learnt to improve both the existing processes in any stage of the project and future
projects. In other words, the feedback allows the continued improving process through
reapplying the successful experiences in the future practices and avoid unsuccessful ones,
so the continued improvement of the process can be ensured.
6. CONCLUSION
In today’s turbulent business environment organisations worldwide have reached a
conclusion that adopting business process view is the most appropriate way to survive and
succeed. Yet, despite the radical changes occurred in the Iraqi construction business
environment, an exploratory study has revealed that IQGCCs have continued to adopt
traditional, hierarchical management processes that are unable to cope with the new business
environment’s requirements. Accordingly, in order to survive and improve their performance,
IQGCCs need to move away from traditional management systems towards a business
process view designed to enhance value generated activities using multi-disciplinary teams
453
that cut across the organisation. However, the literature review revealed that most of the
business process initiatives in the construction industry have focused on improving the
construction project processes, often from the prospective of the client and their team of
professional consultants. With little attention paid to the business or indeed project processes
adopted by construction companies contracted to construct these projects. Through
employing the business process principles and identified best practice revealed through an
exhaustive literature review, this paper has identified a number of effective solutions to
address the challenges identified in the current practices of IQGCCs. Moreover, the research
presented in this paper proposes a theoretical transformational organisational framework that
brings together all the proposed solutions to form a roadmap for making a step change
improvement in IQGCCs performance. However, since the proposed framework is mainly
based on the international literature and experiences of companies worldwide, applying the
theoretical framework in its current form to IQGCCs is unlikely to be successfully. As a
result the researchers have proposed a further phase of primary data collection to culturally
embed the best practice framework into the Iraqi construction process using a series of expert
interviews and focus groups with professionals working in the country for both IQGCCs and
other private construction companies.
7. REFERENCES
AIA. (2007). Integrated project delivery (IPD): A guide. The American Institute of Architects. Retrieved from
http://www.aia.org/groups/aia/documents/pdf/aiab083423.pdf
Alshawi, M. (2007). Rethinking IT in construction and engineering: Organisational readiness. London: Taylor
& Francis.
Baloh, P., Uthicke, K., & Moon, G. (2008). A business process-oriented method of KM solution design: A case
study of Samsung Electronics. International Journal of Information Management, 28(5), 433–437.
Bernstein, B., & Singh, P. (2006). An integrated innovation process model based on practices of Australian
biotechnology firms. Technovation, 26(5), 561-572.
Bronzo M., Resendeb, P., Oliveirac, M., McCormackd, K., Sousab, P. & Ferreirab, R. (2013). Improving
performance aligning business analytics with process orientation. International Journal of Information
Management, 33, 300– 307.
Campos, A., & de Almeida, A. (2015). A multicriteria decision model for classifying management processes. In
Decision Models in Engineering and Management (pp. 109-125). Springer International Publishing.
Cooper, R. G. (1994). Third‐generation new product processes. Journal of product innovation management,
11(1), 3-14.
Cooper, R., Aouad, G., Lee, A., Wu, S., Fleming, A., & Kagioglou, A. (2005). Process management in design
and construction. Oxford: Wiley-Blackwell.
Egan, J. (1998) Rethinking construction. Department of the Environment, Transport and the Regions.
F.I.D.I.C. (1994). Tendering procedure. (2nd Ed.). Lausanne: FIDIC.
Finnemore, M., Sarshar, M., & Haigh, R. (2000, February). Case studies in construction process improvement.
In Proceedings of the ARCOM Construction Process Workshop (Vol. 16).
Graetz, F. & Smith A. (2009). Duality theory and organizing forms in change management. Journal of Change
Management 9(1), 9–25.
Hammer, M. & Champy, J. (1993). Reengineering the corporation: A manifesto for business revolution. New
York, NY: HarperBusiness.
Hammer, M., & Stanton, S. (1999). How process enterprises really work. Harvard business review, 77, 108-
120.
Holt, G., Love, P., & Jawahar, L. (2000). Employee empowerment in construction: An implementation model
for process improvement. Team Performance Management: An International Journal, 6(3/4), 47-51.
IPMO (2015). Reconstruction of Iraqi state-owned enterprises: the reality... vision toward reforming. Iraqi
Prime Minister Office.
Ivanko, S. (2013). Modern theory of organisation. Retrieved from
http://blog.ub.ac.id/cikida/files/2014/12/Book-of-ModernTheory-of-organization1.pdf
Johnson, W., & McCormack, K. (2011). Business process integration and supply chain networks. International
Business & Economics Research Journal (IBER), 1(12), 79-84.

454
Kagioglou, M. Cooper, R. & Aouad, G. (1999). Re-engineering the UK construction industry: The process
protocol. Second International Conference on Construction Process Re-Engineering-CPR99. Retrieved
from http://www.processprotocol.com/pdf/cpr99.pdf
Kagioglou, M., Cooper, R., Aouad, G., Hinks, J., Sexton, M., and Sheath, D. (1998). A Generic Guide to the
Design and Construction Process Protocol Final Report: University of Salford, UK.
Kariuki, A., & Murimi, C. (2015). Employee empowerment and organization performance of Tata Chemicals
Magadi Ltd, Kenya. European Journal of Business and Management, 7(8), 190-200.
Kohlbacher M., & Reijers H., (2013). The effects of process-oriented organizational design on firm
performance. Business Process Management Journal, 19 (2), 245 – 262.
Kohlbacher, M. (2009). The Effects of Process Orientation on Customer Satisfaction, Product Quality and
Time-Based Performance. Paper presented at the International Conference of the Strategic Management
Society, Washington DC, October 11–14, Conference. Retrieved from http://dc.strategicmanagement.net.
Lee, A. (1998). A Study of process management. Retrieved from
http://citeseerx.ist.psu.edu/viewdoc/download?doi=10.1.1.500.1105&rep=rep1&type=pdf.
Looy, A., De Backera, M., & Poelsb, X. (2011). Defining business process maturity. A journey towards
excellence. Total Quality Management, 22(11), 1119–1137
Mc Cormack, K. (2007). Introduction to the theory of business process orientation. Business process maturity.
Theory and application, 1-18.
Mc Cormack, K. P., & Johnson, W. C. (2001). Business process orientation: gaining the e-business competitive
advantage. London: CRC Press.
Meyerson, G., & Dewettinck, B. (2012). Effect of Empowerment on Employees Performance. Advanced
Research in Economic and Management Sciences, 2, 40-46.
Neubauer, T. (2009). An empirical study about the status of business process management. Business Process
Management Journal, 15(2), 166–183.
OGC (2003). Achieving excellence in construction: procurement guide 3: project procurement lifecycle: the
integrated process. London: Office of the Government Commerce.
Palmberg, K. (2009). Exploring process management: Are there any widespread models and definitions? The
TQM Journal, 21(2), 203–215.
Porter, M. (1985). Competitive advantage: Creating & sustaining superior performance. New York: The Free
Press.
Rajalingam, Y., & Jauhar, J. (2015). A Study on the impact of empowerment on employee performance: The
mediating role of appraisal. International Journal of Liberal Arts and Social Science, 3(1), 92-104.
RIBA (1973). Architectural practice and management. London, Royal Institute of British Architects.
Serpell, A., & Díaz, J. I. (2016). Linking central business processes of construction companies with the
performance of construction operations: A Preliminary Exploration. Procedia Engineering, 164, 376-382.
Shikhely, B. (2007). Control planning of time, cost and quality for fast track projects. Iraqi Journal of Civil
Engineering, (7), 99-119.
Skrinjar, R., &Trkman, P. (2013). Increasing process orientation with business process management: Critical
practices. International Journal of Information Management, 33(1), 48-60.
Skrinjar, R., Bosilj Vuksic, V., & Indihar-Stemberger, M. (2010). Adoption of business process orientation
practices: Slovenian and Croatian survey. Business System Research, 1(1-2), 5-19.
Skrinjar, R., Bosilj-Vuksi, V. & Indihar-Stemberger, M. (2008). The impact of business process orientation on
financial and non-financial performance. Business Process Management Journal, 14(5), 738 – 754.
Stegar, M.B. and Roy, R.K. Neolibralism: A very short introduction. Oxford: Oxford University Press.
Tang, J., Pee, L., & Iijima, J., (2013). Investigating the effects of business process orientation on organizational
innovation performance, Information & Management 50 (2013) 650–660.
Trkman, P., & McCormack, K. (2010). Estimating the benefits and risks of implementing e-procurement. IEEE
Transactions on Engineering Management, 57(2), 338–349.
Trkman, P., Mertens, W., Viaene, S., & Gemmel, P. (2015). From business process management to customer
process management. Business process management journal, 21(2), 250-266.
Troy, L., Hirunyawipada, T., & Paswan, A. (2008). Cross functional integration and new product success: an
empirical investigation of the findings. Journal of Marketing, 72 (6), 132–146.
Turkulainen, V., & Ketokivi, M. (2012). Cross-functional integration and performance: what are the real
benefits? International Journal of Operations & Production Management, 32 (4), 447–467.
Willaert, P., Bergh, J., Willems, J., and Deschoolmeester, D. (2007). The process-oriented organisation: a
holistic view developing a framework for business process orientation maturity. Business process
management, 47(14), 1-15.
Wing, J. (2009). Mission on Iraq: Life in Iraq before and after the invasion. Retrieved on 6th May 2016 from
http://musingsoniraq.blogspot.co.uk/2009/08/life-in-iraq-before-and-after-invasion.html

455
Wu, S., Fleming, A., Aouad, G., & Cooper, R. (2001). The development of the process protocol mapping
methodology and tool. International Postgraduate Research in the Built and Human Environment.
Yang, S. B., & Ok Choi, S. (2009). Employee empowerment and team performance: Autonomy, responsibility,
information, and creativity. Team Performance Management: An International Journal, 15(5/6), 289-301.

456
ID 024
THE USE OF OFFSITE CONSTRUCTION METHOD TO
RECONSTRUCT IRAQ
N. Seffar and C. Abbott
School of the Built Environment, University of Salford, Salford M5 4WT, UK
Email: [email protected]
Abstract: As a sustainable construction method, offsite construction is increasingly being
adopted worldwide to improve productivity and to lessen the adverse environmental and social
effects that result from traditional construction activities. OSC is no longer a new method and
is adopted worldwide. Nevertheless, in some countries, such as Iraq, the adoption remains
slow. While, there is a lack of knowledge and slow adoption of OSC in Iraq, simultaneously
there is a vital need to rehabilitate the country after the many disasters it has faced. To identify
the factors affecting the uptake of OSC, this paper reviews the advantages and disadvantages
of using the OSC, such as economic, environmental and social. The advantages of using OSC
such as reduced construction time and increased products’ quality have the potential to be
valuable to the Iraqi construction industry in addressing the housing shortage and the
infrastructure deficiency problems. Furthermore, the construction industry in Iraq faces a
problem of increasing waste materials. When using OSC this problem can be minimized as the
products of OSC are prefabricated in the factory. Therefore, this paper firstly considers the
benefits and drawbacks of OSC in general to assess how these characteristics align with the
context of Iraq.
Keywords: Offsite Construction, Sustainable, Traditional Construction.
1. INTRODUCTION
The rapid growth of technologies affects different sectors of life. One sector is the
construction industry, in which modern technology is expected to have an influence on its
performance in the future. In addition, the global need for accelerating construction projects
while maintaining reasonable cost and good quality has led to the emergence of new methods
of construction. OSC is considered one of the new technologies emerging in the construction
field. OSC is defined as “the manufacture and pre-assembly of building components,
elements or modules before installation into their final locations” (Goodier & Gibb, 2007).
Much has been written about the advantages of off-site construction in terms of quality, time
and lower cost, which in turns can be a fundamental solution for the growing demand for
buildings. However, its adoption still differs from country to country. Goulding and Arif
(2013) stated that the uptake and implementation of off-site manufacturing varies from
country to country. They stated that some markets of developed countries such as the UK,
Japan and Australia continued to demonstrate a steady growth in the use of off-site
construction. However, in some developed countries the use of such method of construction
can be low.
The challenges of increasing the uptake off-site construction in different countries are
somewhat similar although it subject to context specific priorities (Goulding & Arif, 2013).
For example, in some developed countries, the two main factors affecting off-site
manufacturing are the cost of a skilled workforce and environmental issues; while in some

457
developing countries like Iraq, safety issues and cultural resistance can be the main reasons
for slow of adoption of this type of construction. Iraq is in a post war situation and has a
significant need for reconstruction. In particular, housing rehabilitant is required. Therefore,
the off-site construction method can be a tangible solution for meeting the need for new
buildings and housing in Iraq.
2. THE NEED FOR THIS RESEARCH
Iraq faced a serious of disasters from the period 1980-2016. Each disaster had a severe
impact on this country and led to a later disaster. The nature of the current situation shows
challenges, because the responses are weak and begin to diminish quickly or crash because of
renewed, fork and breeding resulting there from past disasters. The period (2014-2016)
showed the entry of ISIS to Iraq and the financial problems as a result of corruption, bribery,
theft and deterioration of oil prices (the Iraqi economy is highly depending on oil revenues).
These problems led to a halt of most construction projects in the country (AL-Azawi, 2015;
Al-Kafaji & Salman, 2015; Al-Shaekli, 2016; Mahdi, 2015)
Residential needs are increasing and the gap between housing supply and demand is
widening. Despite attempts to reduce the crisis, there are no signs of solving it. Instead its
complexity is increasing (Al-Zubaedi, Al-Marsomi, & Katham, 2015). The problem has been
further complicated due to overcrowding and the inability to supply the required housing
from the government and the private sector. An additional problem is the high housing cost in
comparison with lower income (Al-Zubaedi et al., 2015).
Therefore, the need to conduct this research is essential and fundamental in order to assist the
government in its attempt to reconstruction of the country following the many disasters that
have occurred by using new methods of construction. Moreover, the research will possibly
support the efforts and plans being established by the Ministry of Housing & Reconstruction
and may meet their objectives and principles in solving the housing shortage. Furthermore,
the researcher believes that there is an importance need to highlight the use of off-site
construction in Iraq, as this can open new perspectives towards this type of construction as
there is knowledge gap about this type of construction. It can also achieve fruitful objectives
in reducing some construction problems in Iraq like waste materials and delay of projects
problem by using this type of construction as this type of construction has the advantages of
saving time of overall project and reducing waste materials as its prefabricated. This is can be
a great support to the Iraqi government in facing the challenges of construction industry in
this country.
3. OVERVIEW OF OFFSITE CONSTRUCTION IN IRAQ
During the mid-seventies to mid-eighties of the last century, Iraq’s government made great
strides in the direction of introducing and adopting structural techniques and different
methods of construction that helped to speed up the construction process in and minimize the
housing shortage problems. However, the experience of such adoption of new construction
methods in Iraq showed fluctuation in production and so there was a gap between what was
required and what was produced (Abod, Hussain, & khafaji, 2011)

458
Abod et al. (2011) ascertained that there is a need to rehabilitate the prefabrication industry
and the use of modern techniques of this type of construction to keep up with technological
developments in the construction field. This is particularly necessary in order to develop
residential buildings to limit the crises of supply as traditional construction is unable to
implement the necessary construction in such a short time. There are few research studies that
have highlighted the current status of pre-fabricated construction in Iraq. For example,
Mohee (2011) affirmed the presence of a knowledge gap towards off-site construction in
Iraq.
Moreover, Afif (2013) believed that pre-fabrication companies are rare in Iraq despite the
fact that in 2013 the Iraqi Ministry of Housing and Construction declared that the pre-
fabricated system would be the main construction system in Iraq. Furthermore, a recent study
by Abbood, Al-Obaidi, Awang, and Rahman (2015) stated that off-site construction in Iraq is
rare. He also cited that there is a lack of knowledge in many aspects of prefabricated
construction, especially in its application. This thinking agrees with Mohee and Affef
researchers’ declaration.
In general, there is poor management of construction projects with regard to following,
monitoring and adjusting the quality of the products. This leads to problems and
deficiencies, which accrue on the products after implementation (Al-Ajeeli & Mehdi, 2015)
The problem of inadequate management of construction projects had an impact on the
fluctuation of the production of prefabricated buildings in Iraq. Abod et al. (2011) stated that
the lack of quality of building products was the main reason for the rejection of a large
number of them, thus increasing the cost of production and reducing the production
performance economically. This gives a clear overview of available literature on the slow
uptake of prefabricated construction in Iraq.
4. LITERATURE REVIEW
4.1 Off-site construction (OSC) and related terms
Off-site construction is he manufacture and pre-assembly of building components, elements
or modules before installation into their final locations (Goodier & Gibb, 2007). For
consultants, the definition of off-site construction is that products, either from a catalogue or
bespoke, are manufactured in a controlled factory environment and assembled on site. From
a contractor's point of view, this type of construction is a construction process, where the
products are fabricated in a factory or somewhere near to the site and then installed there
after being transported.
There are different terms for off-site construction in the literature. Off-site construction, off-
site manufacturing, manufactured construction and modern methods of construction are some
common terms that have been used interchangeably in the literature to describe pre-fabricated
construction; the commitment is to move some of the construction effort into the controlled
environment of a manufacturing facility (Goulding, Rahimian, Arif, & Sharp, 2012). It is
important to know the differences between modern methods of construction and OSC. The
OSC is a sub-set of modern methods of construction. Therefore, most off-site construction
can fall under MMC but not all MMC can be considered off-site.

459
4.2 Types of off-site construction
The classification of the construction industry for OSC technologies is based on the degree of
innovation in the process, products, construction materials and system (E. Elnaas, 2014). Two
production sites are involved when using off-site construction technologies. There are off-site
factory and on-site (Mostafa, Chileshe, & Zuo, 2014). Factory assembly offers advantages
for manufacturing of complex components or highly repetitive building elements, which
means that off-site is not restricted to the prefabrication of volumetric or big building
elements. (Hall, 2010)
Various authors (Alistair Gibb & Pendlebury, 2006; Goodier & Gibb, 2007; Jonsson &
Rudberg, 2014; Mostafa et al., 2014) classified OSC into the following types: -
Non-OSM construction methods
These methods are known as innovative construction methods. They use conventional
components in an innovative way along with on-site techniques (Ross, Cartwright, &
Novakovic, 2006). This type of off-site is intended to encompass schemes utilising
innovative building techniques and structural systems that cannot be placed in the category of
off-site manufacture. Some examples of this type are Thin Joint Masonry and Blocks Tunnel
Form (Alistair Gibb & Pendlebury, 2006). The main characteristic of this type is innovation
through the use of a construction method that is familiar in other sectors but new to house
building, or through combining the traditional components in innovative ways (Alistair Gibb
& Pendlebury, 2006; Rohani, Fan, & Yu, 2013).
Component manufacture and sub-assembly
This falls short of being categorised as systemic OSC but utilises factory manufactured
innovative sub-assemblies or components. This category refers to relatively small items such
as light fittings, windows, door furniture and trusses (Alistair Gibb & Pendlebury, 2006).
The sub-assemblies and components are always produced off-site (Mostafa et al., 2014).
Non-volumetric buildings
No usable space is enclosed by these pre-assembly units (Alistair Gibb, 1999). Some
examples for this type of OSC are pre-cast concrete bridge sections, structural steel work,
timber trusses, pipework …etc (Alistair Gibb & Isack, 2003).
Volumetric buildings
Volumetric buildings Alistair Gibb (1999) are produced by a type of off-site construction that
includes units providing usable space. These units’ form parts of a building but do not form a
whole building. Very little work is needed to complete these units on-site because they are
almost completed in the factory and ready for transportation and installation on site.
Volumetric buildings involve 3D modules and commonly refer to pods that are pre-

460
assembled (Ross et al., 2006). Volumetric buildings design to be easily dis-assembled, moved
and repositioned (Hall, 2010)
Some examples of volumetric building are toilets, rooms, bathrooms, and plant rooms
(Alistair Gibb & Isack, 2003).
Modular buildings
This type of construction produces pre-assembled volumetric units, which form a whole or
part of a building, including the envelope and structure (Alistair Gibb, 1999; Mostafa et al.,
2014). Most work on the units is done off-site. However, some work may be completed on
site, such as finishing the operation and assembly of the modules. There is also a possibility
of assembling fully fitted out modules before transportation to the site (E. Elnaas, 2014).
Examples include prison cell units, hotel/motel rooms and restaurant facilities.
4.3 Advantages and disadvantages of off-site construction
Many research studies, several seminars and conferences have highlighted the theme of
sustainable construction to increase the developers' awareness of the importance of
sustainability (Abidin, 2010). According to Chen, Okudan, and Riley (2010), there is a
growing concern about sustainable development and sustainable construction. Therefore, the
researcher categorises the advantages and disadvantages of using OSC according to
sustainability aspects, which are economic, social and environmental. It is worth mentioning
that (E. Elnaas, 2014), (Jaillon & Poon, 2008) and (Wasket, 2001) also categorise the benefits
and drawbacks of OSC using sustainability considerations.
Advantages of OSC
The advantages of OSC will be categorises according to sustainability aspects, which as
follows: -
Economic benefits
Alistair Gibb and Isack (2003) found that the main benefits of off-site construction are
improvements in quality and reductions in time and cost. Moreover, Venables, Barlow, and
Gann (2004) concluded that a reduction in on-site assembly time is one of the main benefits
that make off-site construction superior to traditional methods. They also found that quality
of production and finish is the single most significant benefit of off-site construction over on-
site construction methods. The uptake of OSC has the potential to reduce on-site overall life-
cycle costs, improve quality, decrease construction defects, and minimise construction time
(Goodier & Gibb, 2007). According to (Jaillon & Poon, 2008), in the traditional method of
construction, the output quality is highly dependent on the workmanship of construction
labourers and the supervision team. In contrast, the use of off-site technologies in
construction develops quality and offers more rigorous quality control, thus minimising
defects and increasing the durability of components. Other OSC benefits include reduced
and more predictable production time, as well as lower and more predictable cost and
improved quality of the end product or facility(Larsson, Eriksson, Olofsson, & Simonsson,
2014).

461
Social benefits
Compared to traditional construction methods, off-site construction can offer several social
benefits by providing better working conditions which lead to improved health and safety of
workers. In addition, OSC offers better staff training. Since many workers involved in the
factory live locally, this gives them a better chance to sustain their jobs. (Ross, 2002)
These arguments are also supported by Jaillon and Poon (2008) who state that improved
safety control at the factory, in which working from height is avoided, leads to better working
conditions. Therefore, worker’s safety, as well as reduced ill health and accidents are social
benefits of using OSC instead of on-site construction.
Environmental benefits
The use of off-site construction methods can contribute to materials conservation and waste
reduction, since the waste generated from off-site construction is easier to re-use and to
recycle (Jaillon & Poon, 2008). Moreover, Mtech Consult and Yorkon (2008) have stated that
improved design of OSC can decrease waste of materials by nearly 50% and reduce on-site
waste by up to 90%, particularly with the use of volumetric construction. The research also
indicated that OSC can limit waste to less than 1.8% of the materials’ total weight, with less
than 0.6% of waste materials sent to landfill.
Regarding air pollution, Jaillon and Poon (2008), indicated that pollution that occurs during
the manufacturing process is easier to control in a factory environment than pollution that is
caused on-site. Moreover, OSC reduces the time spent in working on-site; this means that the
impact of construction sites on the local environment is reduced and fewer hours are spent
under extreme weather (Wasket, 2001)
A recent study by Gunawardena, Ngo, Mendis, Aye, and Crawford (2014) has found that
OSC construction has proven to be more environmentally friendly than traditional
construction because it requires minimum access roads. Prefabricated units can be shipped or
transported on trucks and placed on-site using mobile cranes and less work will be required
for installation on-site. Therefore, less pollution is generated by off-site construction.
Aye, Ngo, Crawford, Gammampila, and Mendis (2012) found that there is a significant
potential for the re-use of materials in a pre-fabricated steel building and this lead to about
81% of the embodied energy in an original steel pre-fabricated building being saved.
Disadvantages of using OSC
The disadvantages of using OSC can be summarised according to the three parameters of
economic, social and environmental impacts as follows:
Economic issues
1) Cost
Realised as an expensive construction method when compared with conventional
methods of construction, due to vertical transportation on site, setting up fabrication
yards and transportation, labour training and jointing joints problems.

462
long-distance transport for large and heavy loads can be considered costly and
difficult when the site is narrow or when there is traffic congestion.
Limited or expensive available skilled on-site labour.
Higher initial cost and capital cost.
High cost of carriage.
(N. Blismas & Wakefield, 2007; Chiang, Chan, & Lok, 2006; H. Elnaas, Gidado, & Philip,
2014; Pan, Gibb, & Dainty, 2007).
2) Time
Longer “lead-in time” is specifically needed in pre-planning and design (N. Blismas &
Wakefield, 2007). According to Goodier and Gibb (2007); Vernikos, Goodier, Broyd,
Robery, and Gibb (2014) all contractors claimed that long ‘lead-in time’ is the greatest
disadvantage and barrier for off-site construction and if not managed well, the choice of OSC
could add costs to the project and delay its beginning. It was commented that in order to
reduce the lead in time, cost integration is needed from the start of the design (Goodier &
Gibb, 2007; Vernikos et al., 2014). Vernikos et al. (2014)stated that building information
modelling enables lead-in times to be managed more efficiently. The other disadvantage of
using the OSC is inability to freeze design earlier.(N. G. Blismas, Pendlebury, Gibb, &
Pasquire, 2005; Pan et al., 2007)
1) Limited capacity of suppliers and OSM’ plants to enhance OSM efficiency.
2) Lack of off-site inspection expertise
3) The expertise of designers and constructors in the marketplace of OSM and its processes
are limited.
4) Interface problems on site between manufactures and builders can lead to problems if
they are not well managed.
5) A problem can occur when future maintenance is needed for manufactured housing.
(N. Blismas & Wakefield, 2007; N. G. Blismas et al., 2005; E. Elnaas, 2014; Venables et al.,
2004)
Environmental issues
Increasing pollution, especially CO2 emissions, if the manufacturing factory is located a
long distance from the site. There are some difficulties in transporting large, heavy
components, especially for long distance transport. The environmental impact of the
transport phase depends on the distance from the point of manufacture to the point of
assembly, as pre-fabrication factories located at longer distances from the site have a
higher environmental impact in the transport phase than non-prefabrication methods.
Increasing energy consumption and surrounding impact when using heavy machinery on-
site for installation of units.
Hard to control the manoeuvre of large components and products with strict site location.
(N. Blismas & Wakefield, 2007; N. G. Blismas et al., 2005; E. Elnaas, 2014; Jaillon &
Poon, 2008; Pacheco-Torgal, Cabeza, Labrincha, & de Magalhaes, 2014).

463
Social issues
Lack of understanding of OSM in local authorities and lack of support from the
government.
Possible increase of accidents. Despite the potential benefits of modular/prefabricated
building construction in terms of safety, this construction strategy can be challenging and
risky in some cases, for example, during moving and installation of massive components,
especially in high-rise buildings. Hoisting, moving, and installation of heavy and large
components in this sector are complicated and dangerous.
Lack of codes and standards to cover lender's requirements & warranties.
It appears non-cost effective when compared with traditional methods. (Unaffordable)
Lack of skills among labour for installation and maintenance issues.
There is an absence of media incentives to improve perception.
OSC is still not well accepted among most of society, largely due to the legacy of its
misuse and poor clients’ perceptions due to past product deficiencies.
(N. Blismas & Wakefield, 2007; N. G. Blismas et al., 2005; E. Elnaas, 2014; Khalfan &
Maqsood, 2014; Mirhadi Fard, Terouhid, Kibert, & Hakim, 2015; Zhai, Reed, & Mills, 2014;
Zhang & Skitmore, 2012)
5. CONCLUSION
Iraq faced many disasters which led to many problems including the destroying of
infrastructure and a sever housing shortage. Therefore, this paper introduced the offsite
construction as a solution to help reconstruct the country. However, there is a knowledge gap
and slow adoption of offsite construction in context of Iraq. Hence, there is a need to
understand the drivers and challenges of using this type of construction in order to enhance
the use of it.
Firstly, the paper clarified the definition for OSM, types and methods in relation to its use in
construction. These are some terms that used in the literature review in worldwide like OSM,
OSC, MMC and prefabricated construction. This paper indicated the advantages and
disadvantages of using OSM regarding sustainability issues which are economic, social and
environmental.
The main economic benefits of using OSC is increased quality of products and reduction in
time of construction. Also, the main advantage is better working condition. In addition, the
environment benefits are materials conservation and waste reduction, since the waste
generated from off-site construction is easier to re-use and to recycle. Moreover, reduce
pollution is generated by using OSC. However, the economic disadvantages of using offsite
construction are mainly higher capital cost, longer lead in time and fewer offsite factories and
few designers and constructors’ experts of OSC. The environment drawbacks can be
increased pollution if a long distance involves in transporting the products.

464
Furthermore, regarding social disadvantages of OSC there is absence of codes and slandered
regarding this type of construction; workers’ shortage skills. The general attitudes of people
towards offsite construction is poor quality due to past deficiencies.
Secondly, the paper provided an overview of offsite construction in Iraq which showed a
slow growth on it is adoption.
The next step will be assessing the barriers and drivers in worldwide through the literature
review and depending on literature review a questionnaire will be built to examine the
barriers and drivers in Iraq. Then, factors affecting the use of offsite construction in Iraq will
be identified. Finally, a roadmap will be developed in order to encourage the use of offsite
construction in Iraq to support the government efforts in reconstructing the country.
6. REFERENCES
Abbood, A. W., Al-Obaidi, K. M., Awang, H., & Rahman, A. M. A. (2015). Achieving energy efficiency
through industrialized building system for residential buildings in Iraq. International Journal of Sustainable
Built Environment, 4(1), 78-90.
Abidin, N. Z. (2010). Investigating the awareness and application of sustainable construction concept by
Malaysian developers. Habitat International, 34(4), 421-426.
Abod, A. A., Hussain, A. M., & khafaji, A. M. A.-. (2011). Building performance a study for evaluate
prefabricated residational buildings performance. The Iraqi Journal of Architecture 7(22-23-24), 255-277.
Afif, B. (2013, ). Ministry of housing employ the prefabricated building system to solve the housing crisis.
Retrieved from http://www.iraqhurr.org/a/25165777.html
Al-Ajeeli, h. K. b., & Mehdi, H. A.-s. (2015). Performance improvement of the implementation of concrete
structures in the construction sector In Iraq using the modern management technique “Six Sigma” Journal
of Engineering, 21(1), 13-29.
AL-Azawi, A. (2015). Financial crisis in Iraq stopped six thousand project. Retrieved from
https://www.alaraby.co.uk/economy/2015/8/22/
Al-Kafaji, H., & Salman, D. (2015). Tumbling oil prices .. the reality of Iraq's budget puts on soft ground.
Retrieved from http://www.alsumaria.tv/news/144367/
Al-Shaekli, S. (2016). Municipalities: Iraq needs international investment. Retrieved from
http://www.alsabaah.iq/ArticleShow.aspx?ID=116302
Al-Zubaedi, H. L., Al-Marsomi, M. H., & Katham, K. A. (2015). Housing and Human Security in Iraq. AL
GHAREE for Economics and Administration Sciences, 11(34), 77-100.
Aye, L., Ngo, T., Crawford, R., Gammampila, R., & Mendis, P. (2012). Life cycle greenhouse gas emissions
and energy analysis of prefabricated reusable building modules. Energy and Buildings, 47, 159-168.
Blismas, N., & Wakefield, R. (2007). Drivers constraints and the future of off-site manufacture in Australia.
Construction Innovation Special Edition 2008.
Blismas, N. G., Pendlebury, M., Gibb, A., & Pasquire, C. (2005). Constraints to the use of off-site production on
construction projects. Architectural engineering and design management, 1(3), 153-162.
Chen, Y., Okudan, G. E., & Riley, D. R. (2010). Sustainable performance criteria for construction method
selection in concrete buildings. Automation in construction, 19(2), 235-244.
Chiang, Y.-H., Chan, E. H.-W., & Lok, L. K.-L. (2006). Prefabrication and barriers to entry—a case study of
public housing and institutional buildings in Hong Kong. Habitat International, 30(3), 482-499.
Elnaas, E. (2014). The decision to use Off-Site Manufacturing (OSM) systems for house building projects in the
UK. University of Brighton.
Elnaas, H., Gidado, K., & Philip, A. (2014). Factors and drivers effecting the decision of using off-site
manufacturing (OSM) systems in house building industry. Journal of Engineering, Project, and Production
Management, 4(1), 51.
Gibb, A. (1999). Off-site Fabrication: Prefabrication, Pre-assembly and Modularisation: John Wiley & Sons.
Gibb, A., & Isack, F. (2003). Re-engineering through pre-assembly: client expectations and drivers. Building
Research & Information, 31(2), 146-160.
Gibb, A., & Pendlebury, M. (2006). Glossary of Terms. Buildoffsite.
Goodier, C., & Gibb, A. (2007). Future opportunities for offsite in the UK. Construction Management and
Economics, 25(6), 585-595.

465
Goulding, J., & Arif, M. (2013). Offsite Production and Manufacturing-Research Roadmap Report: CIB.
Goulding, J., Rahimian, F. P., Arif, M., & Sharp, M. (2012). Offsite construction: strategic priorities for shaping
the future research agenda. Journal of Architectoni. ca, 1(1), 62-73. doi:10.5618/arch.2012.v1.n1.7
Gunawardena, T., Ngo, T., Mendis, P., Aye, L., & Crawford, R. (2014). Time-Efficient Post-Disaster Housing
Reconstruction with Prefabricated Modular Structures. Open House International Journal–Special issue on
Post-disaster Housing Reconstruction.
Hall, M. R. (2010). Materials for Energy Efficiency and Thermal Comfort in Buildings. Cambridge,UK:
Woodhead Publishing Limited
Jaillon, L., & Poon, C.-S. (2008). Sustainable construction aspects of using prefabrication in dense urban
environment: a Hong Kong case study. Construction Management and Economics, 26(9), 953-966.
Jonsson, H., & Rudberg, M. (2014). Classification of production systems for industrialized building: a
production strategy perspective. Construction Management and Economics, 32(1-2), 53-69.
Khalfan, M., & Maqsood, T. (2014). Current State of Off-Site Manufacturing in Australian and Chinese
Residential Construction. Journal of Construction Engineering, 2014.
Larsson, J., Eriksson, P. E., Olofsson, T., & Simonsson, P. (2014). Industrialized construction in the Swedish
infrastructure sector: core elements and barriers. Construction Management and Economics, 32(1-2), 83-96.
Mahdi, A. (2015). Recession in Iraq contributes to the decline in property prices. Retrieved from
http://www.alhayat.com/Articles/8524842/
Mirhadi Fard, M., Terouhid, S. A., Kibert, C. J., & Hakim, H. (2015). Safety concerns related to
modular/prefabricated building construction. International journal of injury control and safety promotion,
1-14.
Mohee, M. (2011). Study of Efficiency Performance of the precast Building Practical Research on Civil Eng.
Dept. building - University of Tikrit. DIYALA JOURNAL OF ENGINEERING SCIENCES, 4(2), 1-22.
Mostafa, S., Chileshe, N., & Zuo, J. (2014). A synergistic supply chain enhancing offsite manufacturing uptake
in Australian house building. Association of Researchers for Construction Man.
Mtech Consult, L., & Yorkon, L. (2008). Waste Reduction Potential of Offsite Volumetric Construction (WAS
003-003: Offsite Construction Case Study).
Pacheco-Torgal, F., Cabeza, L. F., Labrincha, J., & de Magalhaes, A. G. (2014). Eco-efficient Construction and
Building Materials: Life Cycle Assessment (LCA), Eco-Labelling and Case Studies: Elsevier Science.
Pan, W., Gibb, A. G., & Dainty, A. R. (2007). Perspectives of UK housebuilders on the use of offsite modern
methods of construction. Construction Management and Economics, 25(2), 183-194.
Rohani, M., Fan, M., & Yu, C. (2013). Advanced visualization and simulation techniques for modern
construction management. Journal of Indoor and Built Environment., .
Ross, K. (2002). Non-traditional Housing in the UK: A Brief Review: Council of Mortgage Lenders.
Ross, K., Cartwright, P., & Novakovic, O. (2006). A Guide to Modern Methods of Construction. The BRE
Housing Innovation Centre Published by IHS BRE Press on behalf of NHBC Foundation.
Venables, T., Barlow, J., & Gann, D. (2004). Manufacturing excellence: UK capacity in offsite manufacturing:
Innovation Studies Centre.
Vernikos, V. K., Goodier, C. I., Broyd, T. W., Robery, P. C., & Gibb, A. G. (2014). Building information
modelling and its effect on off-site construction in UK civil engineering.
Wasket, P. (2001). DTI Construction Industry Directorate Project Report: Current Practice and Potential Uses of
Préfabrication: Watford.
Zhai, X., Reed, R., & Mills, A. (2014). Factors impeding the offsite production of housing construction in
China: an investigation of current practice. Construction Management and Economics, 32(1-2), 40-52.
Zhang, X., & Skitmore, M. (2012). Industrialized housing in China: a coin with two sides. International Journal
of Strategic Property Management, 16(2), 143-157.

466
ID 034
EVALUATING DISASTER RESPONSE MANAGEMENT STEMMING
FROM WAR OPERATIONS AND TERRORISM IN IRAQ: A
METHODOLOGICAL APPROACH
H. Al-Dahash and U. Kulatunga
School of the Built Environment, University of Salford, Salford, M5 4WT, UK
Email: [email protected]
Abstract: Iraq is exposed to numerous types of natural and man-made disasters. Because of
economic sanctions, conflict, and war over the last few decades, the people of Iraq have
suffered the consequences of economic stagnation and reduced access to essential services.
One of the essential services that is crippled by war and post-war conflicts is disaster response
management. As the institutional capacities to respond in an efficient manner were affected by
the post war transitions, this paper is based on an ongoing PhD research, which aims to
evaluate disaster response management stemming from war operations and terrorism in Iraq,
as a method of enhancing disaster response management in Iraq. This paper will focus,
particularly, on the methodological design of the above study and it will also elaborate on the
philosophical stance taken and methodologies assumed to achieve the above aim.
Keywords: Disaster Response Management, Research Methodology, Terrorism, War
Operations.
1. INTRODUCTION
Recent decades have seen significant increases in the number, complexity and scope of
disasters and incidents (Alexander, 2005). A key feature of contemporary understandings of
disaster management is that they aim to assure prompt and appropriate assistance to victims
of disaster, avoid the potential losses from hazards, reduce vulnerability, and achieve rapid
and effective recovery (Bang, 2012). Therefore, disaster management is considered one of the
modern humanities and its importance has increased significantly in the present climate of
increased terrorist incidents. Furthermore, it is considered a vital field that needs to be
prioritized in order to reduce the impact on human lives, property damage and national
economies (Al-Dahash, Kulatunga, & Amaratunga, 2014). Interestingly, Baharin,
Shibghatullah, and Othman (2009) saw the response phase not as one of the main phases of
the Disaster Management life cycle but as one of the critical phases in the Disaster
Management life cycle. This might be due to the deviant and chaotic behaviour during the
immediate response in a disaster (Fischer III, 1998a, 1998b), or due to the very altruistic
nature of the behavioural response (Fischer, 2005). Madry (2015) noted that response is
influenced by different factors, including the level of development, local culture, historical
context, and the national readiness to respond. An efficient response to a disaster plays an
important role in reducing its impact on affected victims (Muaafa, Concho, & Ramirez-
Marquez, 2014).
According to Al-Dahash, Kulatunga, and Al-Dehesh (2015), Iraq has experienced various
disasters, both natural and manmade. Within the context of manmade disaster, war and post-
war conflicts have crippled many essential services needed to manage hazards, reduce risks,
and respond to disasters. This has impacted on the response phase. Goodyear (2009) shows

467
that comprehensive and coordinated disaster management is lacking in Iraq, which includes a
risk analysis based on an examination of hazards, vulnerabilities, capacities of populations’
local community, and the first responders charged to assist at the time of the emergency.
Further, with an extensive list of human-made hazards to address, Iraq is ill equipped at this
time to encounter all these challenges without external support. As a result, the need for
stronger infrastructural and technical capabilities within the Government of Iraq and other
disaster risk reduction stakeholders is imperative to plan for effective response to potential
disasters in the future. Based on international best practice, an efficient and effective response
to disasters needs a national perspective. Yet a coordinating body to ensure an integrated
response is lacking among the multiple agencies working on Disaster Risk Reduction (DRR)
in Iraq. This could contribute to a fragmented response capacity (Humayun & Al-Abyadh,
2014).
This paper highlights the methodological design and discusses the rationale and justifications
for the design of the study. The structure of the paper is as follows: Firstly, it describes the
research methodology strategy, secondly, the research methodology choices are discussed,
and thirdly, the research methodology techniques are explained. Finally, the data analysis
process is discussed and conclusions drawn.
2. RESEARCH METHODOLOGICAL DESIGN
It is widely agreed that a research methodology should be prepared prior to conducting any
research. According to Blessing and Chakrabarti (2009, p. vii) a design research methodology
“should help identify research areas and projects, and in selecting suitable research methods
to address the issues”. Blessing and Chakrabarti (2009, p. 9) also defined design research
methodology as “an approach and a set of supporting methods and guidelines to be used as a
framework for doing design research”. Despite the risk and uncertainty in the research
process, the possibilities of any failure could be minimised through using appropriate
research design and by forecasting and identifying pitfalls and problems that the researcher
might come across. Further, the overall research strategy will be identified through
examining the philosophical aspects of the research by using research design. Accordingly,
many frameworks can be identified within the literature on methodological aspects of
conducting research. Among those is the ‘nested’ model which gained popularity among
researchers, introduced by Kagioglou et al. (1998) and the ‘research onion’ model by
Saunders, Lewis, and Thornhill (2016). While the nested model includes three elements to
establish the research methodology, including research philosophy, research approach and
research techniques, the onion model involves six steps: research philosophy, research
approach, research strategies, research choices, data collection methods and timescale. It is
recognised that one of the important features of the nested model is that it is a simple way to
understand the research methodology components, whereas, the research onion consists of
more layers and provides the researcher with clear guidelines of how to design the research
appropriately through a series of logical reasoning and decision-making steps. Both the
nested model and the onion model are connected in three major areas, namely, research
philosophy, research approach and research technique. The onion model was used in this
paper to ensure academic rigor in the process of the research design.

468
2.1 Research Philosophy
Saunders et al. (2016) expressed the philosophy of research as an overarching term that
relates to the development of knowledge and the nature of that knowledge. Easterby-Smith,
Thorpe, and Jackson (2008) noted that having an understanding of philosophical issues is
very important for at least three reasons:
To clarify research design
To recognise which design is most appropriate
To identify, and even create, a design that may be outside the researcher’s past
experience.
Most literature classified research philosophy into three main perspectives, namely, ontology
“the assumption that the researcher makes about the nature of reality”, epistemology “a
general set of assumptions about the best ways of inquiring into the nature of the world or in
other words, an assumption about how researchers acquire and accept knowledge about the
world” and axiology “assumptions about the nature of values the researcher places on the
study” (Creswell, 2009; Saunders et al., 2016).
Within the context of an ontological position, there are two aspects; objectivism and
subjectivism. This research seeks to evaluate and explore the current disaster response
management system in Iraq. Furthermore, due to the involvement of different experts in this
process and the fact that their “subjective” perceptions and decisions collectively “socially
construct” what is seen as the response to disaster “phenomena”, the research falls mainly
within the ontological stance on the subjectivism continuum.
Epistemological stance, on the other hand is divided, by Saunders et al. (2016), into
positivism and interpretivism. The authors in this paper, adopted an interpretivistic
epistemological position in order to gain an in-depth understanding of social reality through
studying peoples’ attitudes and behaviours when responding to disaster events.
Figure 1 Philosophical Stance Pertaining to the Study
With regard to axiology, the main emphasis in this philosophical branch is whether research
assumptions are made in a value-laden or value-free environment (Collins & Hussey, 2009).
As this research is of an exploratory nature and the interpretation of interviewees (experts)
forms a major component of understanding the reality, combined with the expertise of the
Ontological assumptions
Realism Idealism
Epistemological assumptions
Positivism Interpretivist
Axiological assumptions
Value free Value laden

469
researcher in this particular field, it is value-laden, since value is added from both parties.
Hence, a social constructionist approach is adopted. The philosophical stance pertaining to
this paper is illustrated in Figure 1.
2.2 Research Approach
As reported by Saunders et al. (2016), whilst the research approach relates to theory
development, the selected approach will enable the researcher to answer the research
questions and meet the objectives of the study. A research approach consists of three types;
deductive, inductive, and abductive. The researcher, in the deductive approach, develops a
hypothesis or several hypotheses. Hypotheses are normally expressed in operational terms to
explain the relationship between variables. The hypotheses are tested prior to examining the
specific outcomes and, if necessary, the theory will be modified according to the findings.
Conversely, in the inductive approach, there is no development of the theory prior to data
collection. Researchers, in following an interpretive approach, start with the evidence and
then build up a theory based upon it. Within the inductive approach, according to Pathirage,
Amaratunga, and Haigh (2008), the theory would follow the data rather than vice versa as
with deduction. The third approach is the combination of deduction and induction which is
called an abductive approach (Saunders et al. (2016).
In this research, the authors used secondary data to review the significance of disaster
management and deduce principles in building appropriate data collection tools. As such, the
data collected are partly theory loaded. In addition, this research attempted to build a theory
on improving disaster response management in Iraq. Therefore, this research used a
combination of deductive and inductive approaches.
2.3 Research Strategy
Many strategies used in business and management to collect real data can be adopted by the
researcher. For any study, an appropriate research strategy choice is based on the research
questions, objectives, the amount of time, the extent of existing knowledge and other
resources available, as well as the philosophical underpinnings (Saunders et al., 2016).
Accordingly, research strategies commonly employed by researchers are an experiment,
survey, case study, action research and ethnography (Easterby-Smith et al., 2008; Remenyi,
1998; Saunders et al., 2016). Yin (2014), on the other hand, included five major ways of
undertaking social science research, namely, experiment, survey, archival analysis, history
and case study, of which, the selection is based on the type of research question posed, the
extent of control an investigator has over actual behavioural events and the degree of focus
on contemporary (as opposed to historical) events. Yin (2014) did not include action research
and ethnography in his division of research strategies. In fact, each strategy can be used for
all three research purposes; exploratory, descriptive and explanatory. However, the most
important issue is whether the selected strategy will enable the researcher to answer the
research questions and meet the objectives of the study (Saunders et al., 2016).
Because the philosophical stance of this research leans towards an interpretivistic and
subjective approach, the use of experiments and surveys are inappropriate. Experiments are
mostly conducted in a laboratory setting under controlled environments where the context
and the phenomena are separated (Yin, 2014). Experiments allow identification of casual

470
relationships through observing the effect of the dependent variable by controlling the
independent variable. Likewise, with experiments, surveys are also related to the deductive
approach (Saunders et al., 2016). A collection of large amounts of data is facilitated by
surveys in an economical way.
As this research falls within the interpretivism and subjectivism stance, and to answer the
research questions and meet the objectives of the study, the authors examined three different
strategies: action research, ethnography, and the case study approach.
Firstly, an action research strategy is an iterative process involving researchers and
practitioners acting together on a particular cycle of activities. Such a strategy is unique in the
way it associates to research and practice (Avison, Lau, Myers, & Nielsen, 1999). This
process forms a continuing action of planning, diagnosing, taking action and evaluating.
Involving employees (as research objects) throughout the research process is very important
to implement changes they have helped to create (Saunders et al., 2016). Despite providing
an in-depth understanding of a specific phenomenon, this strategy is inappropriate to achieve
research objectives due to the lack of the required access to perform the intervention in the
Iraqi disaster response management system.
Saunders et al. (2016), stated that an ethnography strategy is one which “is very time
consuming and takes place over an extended time period as the researcher needs to immerse
herself or himself in the social world being researched as completely as possible”. Therefore,
the second point is that because of the aforementioned factors, it was not practically possible
for the authors to immerse themselves deeply into the actual environment. The ethnography
strategy was, therefore, not suitable for this study.
Since the other possibilities were not appropriate for this paper, a case study strategy was
adopted. Because of the open-ended inquiry used in case studies, it is suitable for building
theory and generating hypotheses (Amaratunga, Baldry, Sarshar, & Newton, 2002). Further,
due to the exploratory nature of the research, this paper collected data as part of a case study,
as this was the most appropriate strategy for answering the research questions and verifying
the research findings. A case study has been defined by Yin (2014, p. 18) as an “empirical
inquiry that investigates a contemporary phenomenon within its real-life context, especially
when the boundaries between phenomenon and context are not clearly evident”. Both ‘what’
type of exploratory questions and ‘why’ type explanatory research is covered by this
approach. He added, that in the natural setting, such an approach can assist researchers to
investigate the phenomenon. Denscombe (2010) declared that by using a case study,
researchers can examine the studied phenomena or the real-life situation. Moreover, it allows
them to gain an in-depth picture of the relationships and processes within the phenomenon.
The case study approach, as a result, is more common in qualitative studies when compared
with quantitative studies. Miles and Huberman (1994), in contrast, noted that the
combinations of both quantitative (questionnaires) and qualitative (interviews and
documents) data can be conducted in case studies to accomplish different aims and to serve
different purposes. Yin (2014, p. 11) also supports this argument, he contends that “ the case
study’s unique strength is its ability to deal with a full variety of evidence: documents,
artefacts, interviews, questionnaires and observations”. Therefore, the case study research
strategy is capable of adopting different data collection methods and is usually used when it
is required to obtain in-depth knowledge about a particular phenomenon.
To sum up, the research under consideration does not intend to change or influence the
attitudes or procedures of the environment or the participants, as it does in action research.

471
Nor does it intend to study physiology or behavioural patterns of the participants as in the
case of ethnographical approaches. So the case study approach was suitable for this research
to explore the current practices related to disaster response management in Iraq.
2.4 Case Study Design
An exploration of the current practices related to disaster response management was required.
Different views of individuals will be identified regarding the criteria of best practice disaster
response management, challenges, strengths, and weaknesses facing disaster response
process managers in different administrative functions. Therefore, this research requires a
strategy which gathers experts’ opinions and in-depth analysis. An in-depth analysis of the
phenomenon under consideration is possible by case study (Gerring, 2007). Moreover, the
views of the “actors” of the case under consideration could be incorporated by carrying out
case study research (Zonabend, 1992). Further, according to the definition of a case study,
stated by Collis and Hussey (2013), it is “a methodology that is used to explore a single
phenomenon in a natural setting using a variety of methods to obtain in-depth knowledge”. It
is therefore normally used when obtaining in-depth knowledge on a particular phenomenon
and is useful to accommodate different research techniques. Both qualitative and quantitative
data also can be accommodated in case study research (Gerring, 2007; Yin, 2014). Although
case study research presents many advantages to a research study as mentioned above, it is
often criticised for bias, lack of rigour, use of incomplete evidence, and for being expensive
and time-consuming (Remenyi, 1998; Yin, 2014). So far, it can be argued that, despite the
fact that a case study can take time and can be expensive, the time and budget could be
minimised by using careful design. Likewise, many drawbacks can be compensated by
having a number of advantages. A variety of evidence is embraced by case study research,
such as that obtained from interviews, observation, and document reviews (Saunders et al.,
2016; Yin, 2014). The richness of the collected data will be increased while creating the
prospects for data triangulation.
Accordingly, the case study approach appears to be the most suitable method for this study,
which cater for ‘What’ and ‘How’ type research questions about a contemporary set of
events, without differentiating between phenomena and context, where the researcher tends
not to interfere with what is being studied.
Yin (2014) suggested four choices to design a case study, namely, a single case study
(holistic), a single case study (embedded), a multiple case (holistic), and multiple case
(embedded). Such choices depend on the number of cases; single (one case) or multiple
(more than one case) and the number of units of analysis, holistic (one unit of analysis) or
embedded (more than one unit of analysis). According to Yin (2014), “a single case study
approach is suitable when investigating critical, unusual, common, revelatory or longitudinal
case”. A critical case is used when it challenges, confirms or extends a theory while the
unusual case represents a rare situation. Conversely, a common case captures a typical or a
representative project or case. Therefore, studying one case is adequate to get an
understanding about the other cases. A revelatory case can be applied to study a phenomenon
which was inaccessible previously. The phenomenon, as a longitudinal case, will be studied
over a long period of time.
The research under consideration fell under the critical case because the General Directorate
of Civil Defence is the main administrative body when responding to disaster (Humayun &

472
Al-Abyadh, 2014), especially when the situation was triggered by war operations and
terrorism in Iraq. There are a number of stakeholders involved during the disaster response
stage, namely, the General Directorate of Civil Defence, the Health Department, NGOs, and
the Iraqi Red Crescent Society. The General Directorate of Civil Defence (working under the
Federal Ministry of Interior) can rightly be termed as the focal response agency (Humayun &
Al-Abyadh, 2014) and it is the main administrative directorate during the disaster response
stage. Consequently, based on the critical view of experts involved in the disaster response
activity, the extracted concepts were assessed. As a result, a valid theory which contributes to
knowledge was developed after revising the extracted concepts. Hence, in accordance with
Yin’s rationale for doing a single case study design and the nature of the research objects, the
opportunity to get better research outcomes was acquired in this paper because a single case
study approach was adopted.
Regarding the unit of analysis, Miles and Huberman (1994, p. 25) stated that the unit of
analysis of a study is a “phenomenon of some sort occurring in a bounded context”. Based on
Collis and Hussey (2013) it is the focal point where the research problem, phenomena and the
variables refer to and about which the data is collected and analysed. Due to its importance,
Miles and Huberman (1994) considered the unit of analysis as the “heart” of the research.
According to Yin (2014), there is a relation between the chosen unit of analysis and the
research objectives. The unit of analysis might help in shaping the scope of data collection in
the later phase. In this paper, the unit of analysis was disaster response management.
Based on Yin (2014) opinion, a single case study has two variants, a holistic design and
embedded design. Because the General Directorate of Civil Defence has the same
administrative system in all its branches or subunits distributed in all Iraqi provinces, the
research boundary takes the General Directorate of Civil Defence as a case study boundary,
and this paper therefore focuses on the single (holistic) unit of analysis, being “disaster
response management”.
2.5 Research Choices
There are two main categories for research choices according to Saunders et al., (2016), the
mono method and the multiple method. The mono method points to using a single data
collection technique and its corresponding data analysis procedures, whereas multiple
methods are where more than one data collection technique and analysis procedure is used to
answer the research questions of a study. In addition, multiple methods have been divided
into mixed-method and multi-method studies. Mixed-methods is defined as using both
qualitative and quantitative data collection techniques and analysing procedures in one
research design. Meanwhile, multi-methods is defined as using more than one method, either
qualitative or quantitative, in a single study and analysing them in accordance with their
relevant procedures (Saunders et al., 2016). Figure shows the two main categories for
research choices.
In social science, Bryman (2012) and Creswell (2009) argued that a researcher can adopt
either objectivist or constructionist ontological positions or either interpretivist or positivist
epistemological positions. In other words, qualitative or quantitative data or both have been
involved in research choices. Saunders et al. (2016) indicate that individual quantitative and
qualitative techniques and procedures do not exist in isolation. According to Creswell (2009)
and Onwuegbuzie and Teddlie (2003), there are critical issues for both quantitative and

473
qualitative research that might cause biases, if used in isolation. Therefore, in order to reduce
the current gaps in each approach, the combination of both approaches in one main mixed
approach was considered as beneficial. As a result, the validity of the findings was enhanced.
Bryman (2012) noted that in the mixed research approach positive benefits can be brought by
using different methods to collect data since the weaknesses of any one method can be
‘offset’ by the strengths of another method.
Figure 2: Research Choices (Saunders et al., 2016, p. 152)
Accordingly, more than one data collection technique and analysis procedure was used in this
paper. The mixed-methods research choice was most suitable for this paper in order to
address the research question. As a result of the complexity of disaster response processes
and to understand the real situation of the phenomenon, one single technique would not have
been adequate. A better understanding of the phenomenon was therefore obtained from
mixed-methods and thus both qualitative and quantitative approaches were applied. The
findings of one method were used to clarify the results created by the other.
2.6 Research Techniques
Data collection and their analysis procedures are related to research techniques. Walliman
(2006, p. 50) defines data as “the essential raw materials of any kind of research. They are the
means by which we can understand events and conditions in the world around us”. The type
of data collected can fall into two categories: primary data and secondary data (Saunders et
al., 2016; Walliman, 2006). When the data is collected from a researcher’s own study, it is
called primary data, while secondary data is the data obtained from existing sources in the
pertinent literature. Walliman (2006) argues that although data can be collected from virtually
everywhere, it requires a plan of action that uses and identifies the most appropriate and
effective methods of data collection. Accordingly, the next section will elaborate on data
collection techniques adopted in this paper.

474
Data Collection Techniques
Various data collection techniques can be employed during a case study research strategy and
that is considered one of the main advantages of it. Six sources of evidence can be obtained
by a case study strategy, namely, documents, archival records, interviews, direct observation,
participant observation and physical artefacts (Dooley, 2002; Yin, 2014), by using multiple
sources of evidence, it makes the study more robust. Thus, an investigator can address a
broader range of behavioural, historical and attitudinal issues, which lead to the development
of a converging line of inquiry and a more accurate and convincing conclusion (Yin, 2014).
Using multiple sources of evidence also encourages creating a case study database as well as
maintaining a chain of evidence.
In agreement with the aforementioned argument, making records of all relevant evidence and
creating a database may help the researcher to meet the study purposes. Such purposes can be
obtained further by using a combination of both qualitative and quantitative research i.e.
mixed methods research. Moreover, by triangulating the methods as such, a personal
understanding of the phenomenon will be enhanced. In this paper, a general picture of the
current situation regarding Iraqi disaster response management was gained by using a
quantitative method. This provided the answer to the research question “What is the status of
disaster response management in Iraq?” In addition, in order to get a fuller picture, an in-
depth understanding of the quantitative results was obtained by exploring experts’
perspectives using the qualitative method of interviews. In order to triangulate, some
significant and related documents were analysed to help build a more in-depth understanding,
and further support the findings that were derived from questionnaires and interviews.
A wealth of information was therefore obtained from both primary and secondary data. In
this paper, the resources of secondary data were articles, books, past theses, archival records,
legislations, and relevant websites, while primary data were collected through questionnaires,
interviews, and documents.
Apropos the questionnaire, an intensive investigation of the literature has been conducted to
find the criteria of best practice disaster response management in order to formulate the
design of the questionnaire. The questionnaire was therefore designed in accordance with the
management stages of disaster management (planning, organising, directing, and controlling)
and these were translated into the Arabic language. By conducting the questionnaire survey
within the case study, the difference between the levels of importance and implementation of
various factors related to the different stages of disaster response management was
investigated. By using Likert scale questions, the opinion and behavioural variables can be
captured. Five scales of “importance” (unimportant, of little importance, moderately
important, important, and very important) were represented by the scale to capture the level
of importance. Further, a different five scales of “frequency” (never, rarely, sometimes, very
often, and always) were used to capture the level of implementation. In addition, a column
for “no opinion N/O” was added for both the scales. This addition is important as it
minimises the tendency for giving an inaccurate answer when the respondents lack
knowledge or opinion for a specific question (Kulatunga, 2008). In order to deal with the
missing data, the “no opinion N/O” option, as Saunders et al. (2016) argue, a special code can
be assigned and acknowledged by statistical analysis software. For example, 999 cannot be
assigned, it would automatically be removed (Wilson, 2013). Therefore, subsequent analyses
can exclude such missing data when necessary (Kulatunga, 2008; Saunders et al., 2016;

475
Wilson, 2013). Error! Reference source not found. represents the values designated for the
ikert scale.
The questionnaires were distributed to the staff who were executives responsible for disaster
response in the Iraqi General Directorate of Civil Defence. The respondents to the
questionnaire were of Captain military rank and above. 53 questionnaire surveys were
conducted. All the respondents, for both the questionnaire and the interview, were selected
based on the experts’ rank, knowledge, experience, and involvement with disaster response
teams. The questionnaire was designed to identify the best practice and any gaps in every
stage of disaster response management in Iraq. The extent of such gaps acts as a good
indicator of the weaknesses and the best practice highlights the strengths of current disaster
response management.
Table 1 Values Designated for the Likert Scale
Scale for
importance
Unimportant Of little
importance
Moderately
important
Important Very
important
No
opinion
N/O
Scale for
implementation
Never Rarely Sometimes Very
often
Always No
opinion
N/O
Value 1 2 3 4 5 999
Regarding the interviews, Amaratunga et al. (2002) stated that this tool is deemed to be
favourable in different research areas when in-depth data is required. It is widely considered
as one of the common sources of evidence for case studies, as it generates data which is
meaningful, through the possibility of probing questions. The authors were able to clarify any
unclear answers (Kumar, 2011) and access sensitive information which might not have been
achievable through other means. Further, because this research contains an in-depth study on
the current practices related to disaster response management, a semi-structured interview
gave flexibility in responses from various viewpoints with the consistency coming from
similar themes. The interview was designed and translated to elicit the weaknesses and the
strengths of the disaster response management and the recommendations to enhance the
current disaster response practices. 28 intensive semi-structured interviews were conducted
with Lieutenant Colonel military rank and above. The following are examples of the types of
questions that the semi-structured interviews included:
Planning stage
• What are the weaknesses of disaster response at planning stage?
• Why do you think proper planning is needed for disaster response?
• Who are the stakeholders involved?
• What are the strengths of disaster response at planning stage?
• How can we further improve the disaster response at planning stage?
With respect to archival records and documents, this type of data were collected to enhance
the reliability and triangulate the research questionnaire and interview data. According to
Saunders et al. (2016) and Yin (2014), a collection of archival and current documents as
empirical research field data is acknowledged as being important.

476
In this paper, the archival records and documents that were analysed were identified and
provided by the interviewees. Documents such as studies, reports, statistics, follow-up, and
legislation were gathered from the IGDCD and other organisations related to disaster
response, such as the Iraqi Ministry of Health.
To sum up, by triangulating such techniques, rich and meaningful sets of data have been
obtained for analysis, contributing to a more robust study.
3. CONCLUSION
This paper adopted a single holistic case study approach, maintained with the triangulated
methods of data collection (questionnaires, semi-structured interviews and document
analyses) to explore the current practices related to disaster response management in Iraq. By
using a combination of both qualitative and quantitative research i.e. mixed methods
research, sets of rich and robust data, including weaknesses, strengths, and recommendations
to enhance the current disaster response practices were obtained. Such sets of data were
useful to fulfil the authors’ information needs towards meeting the aim and the objectives,
and answering the research questions in an on-going PhD study. It can be concluded that the
use of case study research, combined with triangulated data collection tools and content
analysis, facilitated a meaningful in-depth study, which had high reliability and validity, to
explore the current response practices within disaster management in Iraq.
4. ACKNOWLEDGMENTS
The authors would like to acknowledge the Iraqi Ministry of Higher Education, who
supported this work. In addition, the financial support received from the Centre for Disaster
Resilience, University of Salford, enabled the publication of this paper. Special thanks to
Maggie Hardman, of the University of Salford, who supported the English language
development.
5. REFERENCES
Al-Dahash, H., Kulatunga, U., & Al-Dehesh, A. (2015). Disaster Response Management Stemming From War
Operation and Terrorism in Iraq. In 12th International Post-Graduate Research Conference, 10-12 June
2015, MediaCity, UK. (pp. 432-444).
Al-Dahash, H., Kulatunga, U., & Amaratunga, D. (2014). Evaluation of the System of Disaster Management
Resulting from War Operations and Terrorism in Iraq. In 4th International Conference on Building
Resilience, Incorporating the 3rd Annual Conference of the ANDROID Disaster Resilience Network, 8th –
11th September 2014, Salford Quays, United Kingdom. (pp. 900-907).
Alexander, D. (2005). Towards the development of a standard in emergency planning. Disaster Prevention and
Management: An International Journal, 14(2), 158-175.
Amaratunga, D., Baldry, D., Sarshar, M., & Newton, R. (2002). Quantitative and qualitative research in the built
environment: application of “mixed” research approach. Work study, 51(1), 17-31.
Avison, D. E., Lau, F., Myers, M. D., & Nielsen, P. A. (1999). Action research. Communications of the ACM,
42(1), 94-97.
Baharin, S. S. K., Shibghatullah, A. S., & Othman, Z. (2009). Disaster Management in Malaysia: An
Application Framework of Integrated Routing Application for Emergency Response Management System.
In N. S. Herman, S. M. Shamsuddin & A. Abraham (Eds.),International Conference of Soft Computing and
Pattern Recognition. SOCPAR'09. 4-7 December 2009, Melaka, Malaysia (pp. 716-719).

477
Bang, H. N. (2012). Disaster management in Cameroon: the Lake Nyos disaster experience. Disaster Prevention
and Management, 21(4), 489-506.
Blessing, L. T., & Chakrabarti, A. (2009). DRM, a design research methodology. London: Springer.
Collis, J., & Hussey, R. (2013). Business Research: A Practical Guide for Undergraduate and Postgraduate
Students. New York: Palgrave Macmillan.
Creswell, J. W. (2009). Research Design: Qualitative, Quantitative, and Mixed Methods Approaches (3rd ed.).
London: Sage.
Denscombe, M. (2010). The Good Research Guide: For Small-Scale Social Research Projects: For small-scale
social research projects. Maidenhead: McGraw-Hill International.
Dooley, L. M. (2002). Case Study Research and Theory Building. Advances in developing human resources,
4(3), 335-354. doi: 10.1177/1523422302043007
Easterby-Smith, M., Thorpe, R., & Jackson, P. (2008). Management Research: Theory and Practice (3rd ed.).
London: Sage.
Fischer, H. W. (2005). The Danger in Over-Reacting to Terrorism: Has the US Embarked upon a Road that
Should Have Remained Less Traveled? Disaster Prevention and Management, 14(5), 657-665.
Gerring, J. (2007). Case study research: principles and practices. New Yourk, USA: Cambridge University
Press.
Goodyear, E. J. (2009). The State of Disaster Risk Reduction In Iraq (pp. 94): UNDP/OCHA.
Humayun, S., & Al-Abyadh, I. R. (2014). Iraq: Country Case Study Report - How Law and Regulation Support
Disaster Risk Reduction United Nations Development Programme (pp. 40): International Federation of Red
Cross and Red Crescent Societies (IFRC).
Kulatunga, U. (2008). Influence of Performance Measurement Towards Construction Research and
Development. (PhD Thesis), The University of Salford, Salford, UK.
Madry, S. (2015). Space Systems for Disaster Warning, Response, and Recovery. New York: Springer.
Miles, M. B., & Huberman, A. M. (1994). Qualitative data analysis : an expanded sourcebook (2nd ed.).
London: SAGE.
Muaafa, M., Concho, A. L., & Ramirez-Marquez, J. (2014). Emergency Resource Allocation for Disaster
Response: An Evolutionary Approach. SSRN, 2848892.
https://papers.ssrn.com/sol3/papers.cfm?abstract_id=2848892
Onwuegbuzie, A. J., & Teddlie, C. (2003). A framework for analyzing data in mixed methods research.
Thousand Oaks, California, USA: Sage.
Pathirage, C., Amaratunga, R., & Haigh, R. (2008). The role of philosophical context in the development of
research methodology and theory. The Built and Human Environment Review, 1(1), 1-10.
Remenyi, D. (1998). Doing research in business and management: an introduction to process and method.
London: Sage.
Saunders, M., Lewis, P., & Thornhill, A. (2016). Research methods for business students (7th ed.): New York:
Pearson Education.
Walliman, N. (2006). Social Research Methods. London: SAGE Publications Ltd.
Wilson, C. (2013). Credible Checklists and Quality Questionnaires: A User-Centered Design Method.
Burlington: Elsevier Science.
Yin, R. K. (2014). Case study research: Design and methods. London: Sage.
Zonabend, F. (1992). The monograph in European ethnology. Current Sociology, 40(1), 49-54.

478
ID 038
THE NEED FOR THE RECONSTRUCTION OF AFFORDABLE
HOUSING FOR THE INTERNALLY DISPLACED PEOPLE DUE TO
CONFLICT IN NIGERIA: A LITERATURE REVIEW
Y.A. Abdu and C.P.Pathirage
School of the Built Environment, University of Salford, Salford, M5 4WT, UK
Email: [email protected]
Abstract: Over the years, Nigeria has witnessed its share of conflicts as a result of tribal,
political and religious differences. All these conflicts become pale in comparison to the
destruction caused by Boko Haram Islamic extremist group. As a result of several attacks
carried out by the group, more than five million people have been displaced. Internally
displaced people are group of people who lost their shelter and livelihood due to conflict. The
internally displaced people in Nigeria are faced with different problems ranging from lack of
clean water, food, medicine, clothes among others, but the biggest challenge these people are
facing presently is lack of housing. The aim of this paper is to examine the need for the
provision of affordable housing to the internally displaced people in Maiduguri, Nigeria. The
critical literature review on the need for the provision of affordable housing to the internally
displaced people shows that one million houses belonging to the IDPs have been destroyed by
the Boko Haran terrorist in Borno State, Nigeria. The vast majority of IDPs are presently
domiciled in makeshift camps spread across the country. Most of these camps are breeding
grounds for inhumane and undignified conditions which in turn give rise to a multitude of
appalling factors ranging from lack of the bare social amenities needed to survive to rape and
death from exposure and malnutrition. Lack of adequate housing has exposed the IDPs
especially women and children to all sorts of environmental and manmade dangers. Provision
of housing to this group of people will play a significant role in their rehabilitation by
improving their living condition.
Keywords: Affordable Housing, Boko Haram, Conflict, Internally displaced people, Post-
conflict reconstruction.
1. INTRODUCTION
The danger attach to violent conflict, terrorism and war at different levels ranging from intra-
individual violent conflict self-harming to general inter-group violent conflict in the process
of capturing political, economic or social power is consider by World Health Organisation as
the greatest challenge ever the entire world will face in this era (Senevirantne et al, 2014).
Post-conflict reconstruction is like any other concept, there is no single acceptable definition
regarding post-conflict reconstruction. Post-conflict reconstruction is an activity carried out
by the government in collaboration with non-governmental organisations, stakeholders, civil
societies after a natural or manmade disaster to rebuild the damage areas for achieving
sustainable peace and development (Hongguang and Zhengai, 2015). Post-conflict
reconstruction also includes some aspects such as social and economic development, security,
political leadership, gender, and justice. The intensity of the consequences of violent conflict
can be noticed based on some statistical analysis.
According to Secretariat (2015) 191 million people have died as a result of political conflict
and war in the 20th century, and at the end of the century additional 4 million people lost their
lives due to armed conflict. However, after the Second World War, over 189 violent conflicts

479
took place and presently every part of the world has experienced or is witnessing violent
conflicts or armed conflicts. In 2008, 28 conflicts took place in 24 different countries around
the world, and it is estimated that more than 1000 people will be dying each year because of
conflict. This analysis did not include Africa and Asia being considered as the most violent
affected regions with almost 80% out of the world armed conflicts.
In addition, the violent conflicts such as political conflict, terrorism, a war that took place
across the world have left many governments with the task of rebuilding the post-conflict
communities like Afghanistan, Iraq, Ivory Coast, and Nigeria. Recently post-conflict
reconstruction has developed and become an important approach with a special history
(Amaratunga et al, 2010). The objective of post-conflict reconstruction go beyond providing
humanitarian aid and include achieving international stability, regional agenda, security and
building a sustainable democracy. The aim of this paper is to examine the need for the
reconstruction of affordable housing for the internally displaced people due to conflict in
Nigeria. A critical literature review was conducted to explain the need for the reconstruction
of affordable houses for the internally displaced people due to conflict in Nigeria. The paper
is set out as follows. The paper discusses the concept of post-conflict reconstruction, disaster
and its management, affordable housing in general, nature of the Boko Haram conflict,
impact of the conflict on housing demand in Nigeria and the need for the reconstruction of
affordable housing for the internally displaced people due to conflict in Nigeria.
2. DISASTERS AND ITS MANAGEMENT
The natural and manmade disaster has caused a lot of damage to the entire world. The
significant impact of the disaster on the built environment and societies have been noticed by
the entire world in the past decade, due to the increase in the destruction of human, built and
natural environment. According to Forcael et al. (2014) there are about 373 natural disasters
that took place which caused the death of 296,000 people and directly or indirectly affected
208 million others and believe to have cost 110 million dollars. The concept of disaster has
been defined in different ways by different authors and disaster management practitioners.
Smith et al. (2014) defined disaster as a social phenomenon that occurs unexpected and
societies suffer a lot due to the level of destruction of lives and properties. In a situation
where hazard turns to active reality and cause damage to the human and natural environment,
that automatically becomes a disaster. Amaratunga et al. (2011) argued that, though the
origin and the causes of disasters vary, the impacts of disasters on communities remain the
same which include loss of life, destruction of the economy, social institutions and livelihood
among others. There are two types of disasters namely natural and manmade disasters and
these disasters have caused a lot of damage to every part of the world.
Natural Disaster; this is a major disaster that occurs naturally which cause human and
environmental destruction. A natural disaster can take different forms such as earthquake,
flood, storms, volcanic eruption, tsunami and other geological disasters (Kruger et al, 2015).
The nature of the consequences of the above-mentioned disasters depends on the resilience of
the communities or their ability to recover from the damage caused by these disasters. The
impact of different disasters on societies and the built environment is one of the major
challenges global communities are facing presently.
Manmade Disaster; when talking about disaster it is necessary to also talk about human
suffering; manmade disasters are quite different from natural disasters and these disasters can

480
come in different forms such as conflict, war, terrorism, diseases, geological disasters,
financial crisis, unfavorable economic and social policies can also form an important part of
the disaster. These disasters are responsible for causing a lot of suffering specifically among
the vulnerable groups most especially women and children, poor and older people. The
definition of disaster has continued to expand and presently it has included manmade
disasters. The level of destruction caused by natural disaster across the world is so broad, but
the impact of manmade disasters on societies and built environment is much broader.
According to Secretariat (2015) millions of people were displaced recently from different
locations out of 59 conflicts and it was estimated that over 1.4 million children were killed
during the conflict.
Conflict can occur when there is a clash of political, social, economic interest between
individuals, group or communities or because of religious differences. Crossman (2014) sees
conflict as an irreconcilable discussion that takes place between individual, group or
community in the process of pursuing some certain goals by preventing other community,
groups or individuals from pursuing the same goals and achieving them. Bhavnani (2006)
further explain that conflict is part of society and has significant influence over the evolution
of society. However, Billon and Waizenegger (2007) adds that conflict is part of society and
it causes societal disorder and integration. Alexander (2013) argued that researches
conducted within disaster management have concentrated more on areas such as disaster
impact, disaster risk reduction, post-disaster recovery, and reconstruction instead of focusing
on the consequences emanating from manmade disaster.
There are different phases through which disaster can be managed or control. Disaster
management cycle is an important instrument mainly use for controlling disaster and its
consequences. Caymaz et al. (2013) divide disaster management cycle into four different
phases, which include preparedness, emergency response, relief, mitigation, recovery, and
reconstruction. However, Smith et al. (2014) further divides disaster management into two
different parts. Preparedness, Mitigation and risk assessment as pre-disaster protection and
relief, rehabilitation and reconstruction as post-disaster recoveries. Therefore, in order to
minimize the impact of the disaster and to be disaster resilient, there is a need to concentrate
on all the disaster management activities. Pre-disaster protection encompasses different
activities such as risk assessment, for example, identifying and understanding the degree at
which the society are vulnerable to disaster. The preparedness stage reflects on how ready the
society is to respond to disaster when it occurs in terms of short term and long term.
Post-disaster recovery involves different activities that are carried out in stages immediately
after a disaster. The rescue operation will be the first activity; follow by the provision of
relief materials to the victims such as food, medicine, water and other means of livelihood to
avoid further threat to the life of the victims. The next activity is the rehabilitation which
commences normally in a few days after the rescue operation to bring normalcy within the
community affected (Smith, 2013), and the extent of the rehabilitation will depends on the
impact of the disaster. The final activity will be the reconstruction project; this is a long-term
activity which is carried out by the government in collaboration with donor agencies to
rebuild the structures affected by the disaster. Reconstruction is a process of rebuilding the
area damaged by the natural or manmade disaster to achieve sustainable peace and
development. Figure 1 shows disaster management cycle by Kawata (2001).

481
Figure 1: Disaster management cycle (Source: Kawata, 2001)
According to Lin et al. (2007) providing humanitarian assistance or intervention during or
after a disaster and providing means of livelihood is part of the relief activities. The most
significant aspect of relief activities is the provision of temporary camps until when
affordable housing is provided for the displaced people (Lloyd-Jones and Kalra, 2010).
Reconstruction of housing for the victims of natural or manmade disaster is one of the most
important aspects of post-disaster reconstruction (Pheng and Chuan, 2006). This paper
focused on the need for the reconstruction of affordable housing for the internally displaced
people due to conflict in Nigeria.
2.1 Post-Conflict Reconstruction
Post-conflict reconstruction play significant role towards moving away from a conflict
situation to a peace situation within the affected community through rebuilding the
socioeconomic activities of the affected community. Considering the nature of the violent
conflict, the end of hostilities does not in any way indicate the actual transition is achieved,
but it does signify a significant point in this regard. Post-conflict reconstruction does not only
mean reconstruction of the affected physical infrastructure or rebuilding the stable
socioeconomic activities that exist before the conflict (Hongguang and Zhengai, 2015).
Conflict if last for so long has the potential of transforming society and for the society
affected to return to its normal state may take time. What is important is the reconstruction of
enabling an environment for a healthy, functioning peaceful society. The role played by non-
governmental organisations including World Bank is to support the process, but not to
implement it. After the Second World War, an international organisation such as United
Nations, World Bank, International Monetary Fund and Non-governmental organisations
have played a significant role by providing a lot of resources for post-conflict reconstruction
(Yilmaz, 2009). The post-war reconstruction of Germany and Japan set an example of the

482
importance of post-conflict reconstruction and nation-building in some countries like El-
salvador (1991), Cambodia (1993) and Gaza in (2009). Recently post-conflict reconstruction
has developed and become an outstanding approach with a special history. The objectives of
post-conflict reconstruction have gone beyond providing humanitarian aid and comprise the
introduction of regional agenda, international stability, security and democracy building.
The literature reviewed in the past on post-conflict reconstruction and nation building has
resulted to some conclusions. The first conclusion is that there is a lack of enough theory on
post-conflict reconstruction. Certainly, the post-conflict reconstruction carried out in Iraq in
the last few years, and the assessment conducted by the Inspector General of the
Reconstruction (SIGIR) which was titled the Hard Lessons concludes that post-conflict
reconstruction is a difficult project. In the past United States was found in post-conflict
reconstruction efforts which the country did not expect (Kamps et al, 2009). The assessment
also traced the existence of post-conflict reconstruction gap or gaps between the number of
post-conflict reconstruction projects to be carried out and the number of projects that were
successfully completed.
3. AFFORDABLE HOUSING
The concept of affordable housing is multi-dimensional and complex but can be generally
defined in economic terms. Asfour (2017) sees housing as one of the basic needs of every
human being and having access to quality and affordable housing play a crucial role in
individual lives. Housing has a great impact on the socio-economic advancement of a country
as well as contributes to the growth, stability and health conditions of a society, which can
lead to the development of a society. However, (Woo and Mangin, 2009) defined affordable
housing as a house that a certain family can acquire within a long period without pressure,
which sometimes can take up to 25 to 30 years. (Gopalan and Venkataraman, 2015) further
explained that the period can be determined by the family purchasing power and the financial
assistance or support the family might receive in the process as loans, subsidies or credits.
The issue of affordable housing is a global phenomenon as many governments around the
world have made efforts and still making effort to tackle the challenges of providing
adequate, affordable and quality housing to their citizens in the last few decades. Housing is
among the major components for sustainable growth and development of a society (Nubi and
Oyalowo, 2010). However, (Keiner, 2005) further explain sustainable development from a
general perspective and classified it into three interactive concepts which include social,
economic and the environment.
4. METHODOLOGY
Research methodology is an organised way or framework through which a research is carried
out (Remenyi and Williams, 1998). It also explained the best approach to a problem that can
be put into practice during the process of conducting a research. The aim of this paper is to
examine the need for the reconstruction of affordable housing for the internally displaced
people in Maiduguri due to Boko Haram conflict in Nigeria. This paper is purely based on
literature review, which includes journals, previous research, articles and other theories
related to the area of the study. The literature will be the only source of data gathering in this
research and discuss what the researcher gathered from the literature. However, different

483
studies were reviewed and critically analysed. The aim is to examine the effect of the Boko
Haram conflict on the housing demand in Nigeria to identify and understand the need for the
reconstruction of affordable housing for the internally displaced people in Maiduguri due to
Boko Haram conflict in Nigeria. Therefore, the researcher reviewed the nature of the conflict,
the effect of the conflict on housing demand in Nigeria and the need for the reconstruction of
affordable housing for the internally displaced people in Maiduguri due to Boko Haram
conflict in Nigeria.
5. NATURE OF THE BOKO HARAM CONFLICT IN NIGERIA
Nigeria is divided into three regions the Northern region which is predominantly Hausas
practicing Islam, the western region which is predominantly Yoruba’s with majority
practicing Christianity (Bliesemann, 2014) and few practicing Islam while the Southern
region is predominantly Igbos and other tribes practicing Christianity. Northern Nigeria is
made up of 19 states out of 36 states in Nigeria. Northern Nigeria is the original home of the
Boko Haram terrorist and home to over 120 million northerners with 95% all Muslims.
(Adesoji, 2010) believe the issue of radical Islamism is not a new phenomenon in the
northern Nigeria considering the violent crisis that took place between Islamic group called
Maitatsine and Nigerian police force in Kano in 1980 and Maiduguri in 1982. In 2002 an
Islamic group called Boko Haram emerged in the North-Eastern part of Nigeria.
The word Boko Haram is a combination of words derived from Hausa Word Book, which
means (Book), and Haram is an Arabic word, which means impermissible (Forbidden).
Combined Boko Haram means Western education is forbidden. Mohammed Yusuf formed
Boko Haram in 2002 with aim of practicing Islamic teachings and later the group try to
influence Borno state government to introduce Islamic legal system (sharia) in Borno State
(El-Bushra et al, 2014). Yusuf builds a big Islamic center in Maiduguri that comprises
Mosque and Quranic School where a lot of the poor Muslim families across the North and
neighboring countries of Chad and Cameroon enrolled their children to learn Arabic.
The group succeeded in recruiting more than 270,000 members across Nigeria, Chad, and
Cameroon. The members of the group are retired Bankers, University lecturers, Politicians,
Unemployed graduates, Migrants and Drug addicts. In 2009, the mosque where the group
observes their prayers was searched by the combined team of military and police, guns,
ammunitions and other materials the group used in making explosives were recovered and
seized by the security officers ( Agbiboa, 2013). However, as a result of the operation, the
group mobilised their members and stage a violent attack against security agencies, which
caused the deaths of many security officers and civilians. However, during the operation, the
leader of the group Yusuf together with over 800 members was captured and killed by the
police.
5.1 Impact of the Boko Haram Conflict on Housing in Nigeria
The nature of the consequences caused by conflict is so enormous, but it all depends on how
the communities affected react to the damage caused by the disaster. Lipsky (2007) believe
people leave in conflict, which is not by mistake, but because of human nature, as people try
to control one another. However, man overview could not end the search on why violent
conflict occurs in the society. Therefore, the need to understand the causes of a conflict

484
became the basis for developing effective conflict management mechanism. In the past,
Nigeria has experienced different violent conflicts caused by different religious groups, but
the violent caused by the Boko Haram group is quite different (Ahokegh, 2012). For
example, the violent conflict that erupted in Jos that caused the death of many people took
place only in Plateau State and the Niger Delta conflict was within the creeks of Rivers State.
The group carried out several bombs and snip attacks that caused the death of thousands of
people from all parts of Nigeria. The number of people dying increased every day which
shows how strong and sophisticated the group is in terms arms (Agbiboa, 2013). The human
right organisation stated that more than 3500 people were killed from 2009 to 2012 because
of Boko Haram violent attacks (Onuoha, 2012). In April 2013, more than 186 people were
killed after a crossfire confrontation between the group and joint task force, which thus Baga
town in Maiduguri was burnt completely. During the attack 2,128 houses, 40 cars and other
structures were destroyed. The post-conflict assessment carried out in accordance with
standard practice which is verified through satellite images (Shettima, 2016), and physical
analysis by the Borno State government recently shows that one million houses were
destroyed by the Boko Haram terrorist across the 27 local government areas in Borno State,
since emergence of the group in 2009. This has drastically increased the demand for housing
in Nigeria particularly in Borno State considering the number of houses destroyed by the
terrorist group from 2009 to date.
6. THE NEED FOR THE RECONSTRUCTION OF AFFORDABLE HOUSING FOR
THE INTERNALLY DISPLACED PEOPLE DUE TO CONFLICT IN NIGERIA
The concept of internal displacement due to natural or manmade disasters and violation of
human rights is an old phenomenon. In 1990 United Nation started giving serious attention to
internally displaced people and in 1998 the United Nation Commission on Human rights
came up with a guiding policy with regards to internal displacement (Adewale, 2016).
Though, the commission grants non-governmental organisations (NGOs), stakeholders and
other corporate bodies the permission to assist internally displaced people. However, the
commission places the responsibility of internally displaced people (IDPs) rehabilitation,
reconstruction, and settlement on government. Internally displaced people are victims of
natural disasters or due to a humanitarian crisis. Kalin (2008) sees internally displaced people
(IDPs) as individuals, group of people who are forced to leave their original homes as a result
of natural or manmade disasters.
Nigeria has experience different crisis since independence and this is due to ethnic and
religious differences which make it very difficult for the people to live in peace and harmony
(Bassey and Dokubo, 2011). These crises were caused by different militia groups since when
the country returned to democracy in the third republic. The names of these groups are as
scary as their set objectives. For example, the Maitatsine, the Odudua People`s Congress
(OPC), the Egbesu Boys of Africa Congress (EBAC), the Movement for the Actualisation of
the Sovereign State of Biafra (MASSOB). The conflict caused by these groups pale in
comparison to the violent conflict caused by Boko Haram in terms of destruction of human,
built and natural environment. The terrorist group have carried out different attacks from
2009 to 2016 which caused the deaths of thousands of people and caused internal
displacement of millions of people across Nigeria. On 27 of July 2009 the group carried out
an attack on the police headquarters and police mobile college and other structures in
Maiduguri. The group manage to get access into police mobile college and destroyed over 9

485
houses and killed many police officers. During the attack, which lasted for five days several
churches, mosques and other police stations in Lamisula and Gambori Gala in Maiduguri
were also attack (Onuoha, 2012). After the attack, over 3500 people were confirmed
displaced, 1264 children became orphans and over 392 women also became widows.
However, 28 police officers, five prisoners and many soldiers were killed. Among the
properties destroyed includes 48 buildings, three schools several churches, mosques and court
buildings among others (please refer to Table 1).
Table 1: Damages in Maiduguri (source: Onuoha, 2012)
displaced people 3500 people
Orphans 1264 children
Widows 392 Women widows
police officers 28 police officers died
prisoners 5 prisoners died
soldiers Many soldiers killed
buildings affected 48 buildings destroyed
schools affected 3 schools destroyed
In Nigeria, presently there are more than five million people that are displaced as a result of
several attacks carried out by Boko Haram terrorist across the country. The internally
displaced people in Nigeria are faced with different kinds of challenges that include lack of
clean water, medicine, food, clothes, security among others, but the biggest challenge these
people are facing is a lack of reasonable housing. The way in which these people are living in
various camps within Nigeria are raising a serious concern about the level of attention these
people are receiving from the government agencies responsible for their rehabilitation
(Shettima, 2016). The Majority of the camps are breeding places for inhumane and
undignified conditions which in return provide a platform where some appalling factors such
as lack of bare social amenities to survive rape and death from exposure and malnutrition.
Lack of adequate housing has exposed these people most especially the women and children
to all sort of environmental and manmade dangers. Therefore, provision of housing to this
group of people will improve their living condition and play a significant role towards their
rehabilitation back to the society.
7. CONCLUSIONS
This study has examined the need for the reconstruction of affordable housing for the
internally displaced people in Maiduguri due to Boko Haram conflict in Nigeria. The
researcher finds out that, post-conflict reconstruction is an important aspect towards
achieving sustainable peace and development. The objectives of post-conflict reconstruction
presently are beyond providing humanitarian aid, but also include achieving international
stability, security, and democracy building. Therefore, the internally displaced people in
Nigeria will continue to be exposed to all sort of environmental and manmade disasters until
the government provides affordable housing to this group of people. However, it is expected
the findings from this research will provide insight to the Nigerian government on the need
for the provision of affordable housing to the internally displaced people in Maiduguri due to
Boko Haram conflict in Nigeria.

486
8. REFERENCES
Adesoji, A. (2010). The Boko Haram Uprising and Islamic Revivalism in Nigeria/Die Boko-Haram-Unruhen
und die Wiederbelebung des Islam in Nigeria. Africa Spectrum, 95-108.
Adewale, S. (2016). Internally displaced persons and the challenges of survival in Abuja. African Security
Review, 25(2), 176-192.
Agbiboa, D. (2013). The ongoing campaign of terror in Nigeria: Boko Haram versus the state. Stability:
International Journal of Security and Development, 2(3).
Agbiboa, D. (2013). Sacrilege of the sacred: Boko Haram and the politics of unreason. Retrieved August, 26,
2013.
Ahokegh, A. (2012). Boko Haram: A 21st century challenge in Nigeria. European Scientific Journal, 8(21).
Alexander, D. E. (2013). Resilience and disaster risk reduction: an etymological journey. Natural Hazards and
Earth System Sciences, 13(11), 2707-2716.
Amaratunga, R., Siriwardena, M., Malalgoda, C., Pathirage, C., & Thayaparan, M. (2011). Lifelong learning
needs for disaster management education in the built environment.
Asfour, O. S. (2017). The role of land planning policies in supporting housing affordability: The case of the
Gaza Strip. Land Use Policy, 62, 40-48.
Bassey, C. O., & Dokubo, C. Q. (2011). Defence Policy of Nigeria: Capability and Context: A Reader:
AuthorHouse.
Billon, P. L., & Waizenegger, A. (2007). Peace in the wake of disaster? Secessionist conflicts and the 2004
Indian Ocean tsunami. Transactions of the Institute of British Geographers, 32(3), 411-427.
Bliesemann de Guevara, B. (2014). On methodology and myths: exploring the International Crisis Group’s
organisational culture. Third World Quarterly, 35(4), 616-633.
Caymaz, E., Akyon, F. V., & Erenel, F. (2013). A model proposal for efficient disaster management: the
Turkish sample. Procedia-Social and Behavioral Sciences, 99, 609-618.
Crossman, A. (2014). Conflict theory.
El-Bushra, J., Ladbury, S., & Ukiwo, U. (2014). From Design to Implementation: Addressing the Causes of
Violent Conflict in Nigeria. Stability: International Journal of Security and Development, 3(1).
Forcael, E., González, V., Orozco, F., Vargas, S., Pantoja, A., & Moscoso, P. (2014). Ant colony optimization
model for tsunamis evacuation routes. Computer‐Aided Civil and Infrastructure Engineering, 29(10), 723-
737.
Gopalan, K., & Venkataraman, M. (2015). Affordable housing: Policy and practice in India. IIMB Management
Review, 27(2), 129-140.
Hongguang, L., & Zhengai, L. (2015). A study on the internal generation mechanism of the post-disaster
reconstruction1. Ecological Risks and Disasters-New Experiences in China and Europe, 24.
Kalin, W. (2008). Guiding principles on internal displacement. Stud. Transnat'l Legal Pol'y, 38, 1.
Kamps, J., Geva, S., Peters, C., Sakai, T., Trotman, A., & Voorhees, E. (2009). Report on the SIGIR 2009
workshop on the future of IR evaluation. Paper presented at the ACM SIGIR Forum.
Keiner, M. (2005). History, definition (s) and models of sustainable development. Retrieved from
Krüger, F., Bankoff, G., Cannon, T., Orlowski, B., & Schipper, E. L. F. (2015). Cultures and disasters:
understanding cultural framings in disaster risk reduction: Routledge.
Lin Moe, T., Gehbauer, F., Senitz, S., & Mueller, M. (2007). Balanced scorecard for natural disaster
management projects. Disaster Prevention and Management: An International Journal, 16(5), 785-806.
Lipsky, D. B. (2007). Conflict resolution and the transformation of the social contract.
Lloyd-Jones, T., & Kalra, R. (2010). The built environment professions in disaster risk reduction and response.
RICS, ICE, RIBA, RTPI.
Marshall, K. (2008). The World Bank: From reconstruction to development to equity: Routledge.
Nubi, T., & Oyalowo, B. (2010). Housing finance between social needs and economic realities: The dilemma of
policy transfer under neo-liberalism. Paper presented at the Comparative housing research: approaches and
policy challenges in a new international era, Delft, The Netherlands, March 24-25, 2010.
Onuoha, F. C. (2012). Boko Haram: Nigeria’s Extremist Islamic Sect. Al Jazeera Centre for Studies, 29(2), 1-6.
Ophiyandri, T., Amaratunga, R., & Pathirage, C. (2010). Community based post disaster housing reconstruction:
Indonesian perspective.
Pheng, L. S., & Chuan, Q. T. (2006). Environmental factors and work performance of project managers in the
construction industry. International Journal of Project Management, 24(1), 24-37.
Remenyi, D., & Williams, B. (1998). Doing research in business and management: an introduction to process
and method: Sage.
Schmid, A. P. (2011). The definition of terrorism: Routledge Handbooks Online.

487
Secretariat, G. D. (2015). Global Burden of Armed Violence 2015: Every Body Counts: Cambridge University
Press.
Seneviratne, K., Baldry, D., & Pathirage, C. (2010). Disaster knowledge factors in managing disasters
successfully. International Journal of Strategic Property Management, 14(4), 376-390.
Shettima, A. G. (2016). SEEDS of Famine: The Boko Haram Insurgency and Agricultural Production in North-
Eastern Nigeria. Paper presented at the Third ISA Forum of Sociology (July 10-14, 2016).
Smith, K. (2013). Environmental hazards: assessing risk and reducing disaster: Routledge.
Smith, L. E., Bernal, D. R., Schwartz, B. S., Whitt, C. L., Christman, S. T., Donnelly, S., . . . Kish, J. (2014).
Coping with vicarious trauma in the aftermath of a natural disaster. Journal of Multicultural Counseling
and Development, 42(1), 2-12.
Stone, M. E. (2006). What is housing affordability? The case for the residual income approach. Housing policy
debate, 17(1), 151-184.
UNICEF., Children, U. N. O. o. t. S. R. o. t. S.-G. f., & Conflict, A. (2009). Machel study 10-year strategic
review: Children and conflict in a changing world: UNICEF.
Woo, R., & Mangin, J. (2009). What Is Affordable Housing. NYC Edition. Brooklyn, NY, USA: The Center for
Urban Pedagogy. I am grateful to prof. Tom Angotti for his supervision during my period in NYC, and to
prof. Sandro Balducci and dr. Francesca Santaniello for guiding me in the conception, development, and
writing of this paper.
Yilmaz, M. E. (2009). Peace‐Building in War‐Torn Societies. Peace Review, 21(2), 238-248.

488
ID 045
KEYS ELEMENTS OF EFFICIENCY OF LAND TENURE SECURITY
AND PROPERTY’ RIGHTS
L. Al-Ossmi 1, M. Hammad2, D. Baldry1, H. Al-Mimar3 and A. Al-Janabi3
1 School of the Built Environment, University of Salford, Salford, M5 4WT, UK 2College of Engineering, School of the Architecture, Libya University, Libya
3 Al-Israa University College, Baghdad, Iraq
Email: [email protected]
Abstract: This paper explored in detail the administrative performance of the Land Tenure
Administration (LTA) and the Land Tenure Security (LTS) regarding to the Iraqi land users’
views. The aim of this paper is to explore the obtained results from the quantitative data that
were considered in a case study, by analysing the quantitative data collected from the
questionnaire survey applied in the Al-Nassiriya city in Iraq. To achieve this, a survey was
undertaken targeted at land users in the case study sample within 3 settlements in Al-Nassiriya
city. The data comes from 293 participants. The paper’ findings help to highlight the critical
factors that contribute to the LTA implementation and to assess their current level of success
in Iraqi case. The gathered data also helped identify the current barriers preventing end-users
to successfully implement the development of LTA in their current experience in term of
tenure rights. Evidences showed that the Iraqi LTA system carries out further steps to enhance
and respond to the emergency needs during this period, but problems are directly linked to the
authority’ weakness, the current sphere of interim conflicts, and a wide set of complex
emergencies after the collapse of regime in2003. The outcomes of this study indicated that the
Iraqi LTA is qualified and stemmed from the Iraqi rooted legislations within long periods to
develop their strategies in ILAs, which helped its resistance against the critical situation, and it
has a further authenticated mechanism to provide solutions against the insecurity of tenures.
Keywords: Land Tenure, Land Administration, Tenure Security, Property Rights, Iraq.
1. INTRODUCTION
It has suggested that ‘Tenure’ is a matter of possession awareness; it can be held by
individuals or groups and under various forms in order to secure the users’ rights (Payne,
2012; USAID, 2005). Also, a useful summary of the land tenure is provided by UN-Habitat
(2005) that observed that it as an issue of varying elements created to manage land right
within the registry titles within the institutional authorities. In practical terms, land tenure is
the relationship, whether legally or customarily defined, among people as individuals or
groups, with respect to land (UN-Habitat, 2012). In general, the Land Tenure Administration
(LTA) is not a new discipline (see UN-Habitat, 2003: FAO, 2012). Noticeably, reviewing the
literature shows that the governance of tenure is a crucial element in determining tenure
policies and how peoples use and benefit from tenure rights officially, thus LTA is an
effective way of enhancing the people rights in lands. In general the empirical studies
stressed that policies of LTA need to be related to the legislative capability, community
relationships and the stakeholder’s satisfaction regarded the land tenure administration
(Davis, 2004; Sinha, 2002: UN-Habitat, 2006; Hamid, 2007; FAO, 2012). According to
USAID (2010) land tenure policy is the tool employed by governments to outline a set of
goals, and measures aimed at meeting objectives related to land administration structures. In
addition, tenure security is linked with the users’ right which is closely relevant to a state’s
ability to manage a protection to the rights through legal declarations and plans of action

489
(UN-Habitat, 2012: Sietchiping, 2012).Thus, the instable tenure’ governance is the essential
way in which tenure problems are raised, as it may lead to bureaucratic inactivity and
corruption situation in LAS procedures since tenure policies can be affected directly by the
quality and governance efficiency.
In relation to Iraqi judicial regulations, the Iraqi Land Authorities (ILAs) have showed many
inadequate administrative problems (USAID, 2005; Shaikley, 2013). A significant number of
which are a result of social and political conflicts and complex legal institutional policies (Al-
Rashid, 2005; UN-Habitat, 2012; Shaikley, 2013). In general, the post-war environment,
inter-communal violence and continue instable periods have a significant role in the Iraqi
land administration and therefore it needs to be well-documented. With this in mind, the
paper has focused on the sustainable institutional aspects of the tenure administration as the
principal mechanism through which tenure security can be sought. As result of this, the
absence of an ability to address the more fundamental supply rights of land and property,
inappropriate regulatory frameworks, conflicting policies (weak governance), disagreeing
ideologies, and weakness of local administrative mechanisms; all will lead to a lack of tenure
security.
The study urges that the effective management and monitoring of LTA can help the national
development and build of a strong plan within the ILA in order to improve its efficiency. This
motivation can be used as a powerful tool to help ILA to reach reasonable LTA solutions in
relation to land tenure security. To achieve this, a survey was undertaken targeted at land
users in the case study samples in Al-Nassiriya city. The data came from 293 questionnaires
samples which were returned after distribution of 384 questionnaires was made. This research
has been motivated by the continued impact of instable and insecurity situation in Iraq. Also,
the paper aimed to identify the impact level of the current insecurity situation and the
weakness of the government's role on the tenure security, and this can be done through
interviewing samples of people as an end-users of LTA and the current policies associated
with the ILAs, at the local level (in the case study of Al-Nassiriya city). The case study’s
experience in the LTA will provide the opportunity to identify current levels of satisfaction
and as well as the administrative problems which can be directly linked to the future
development in the Iraqi urban areas.
1.2 The study design
This study is driven by the need to bridge the gap in the current literature in terms of
identifying the sustainable institutional aspects of the land administration system under the
current situation in Iraq as the principal mechanism through which LTA can be sought. It has
been motivated by the continued impact of instable and insecurity situation in Iraq. As the
critical situations of post-war, economic crisis and terrorism waves in Iraq are now heading
towards leading the country to a develop an urgent national policy, there is also a need to put
forward a strategic approach that helps the ILA policy to build an efficiency implementation
of LTA and ensuring the users’ satisfaction in Iraq to achieve better practices. While post-war
environments and inter-communal violence impacts continue to occur in the country, the
research provided the opportunity to identify current problems of LTA, which can be directly
linked to these factors of the current insecurity situation in the Iraqi urban areas. The paper
aimed to identify the impact level of the current insecurity situation and the weakness of the
government's role on the tenure security and end-users’ rights, and this can be done through
interviewing samples of people as an end-users as beneficiaries of LTA and the current

490
policies of tenures associated with the role of the Iraqi Land Authorities (ILAs) at the Iraqi
local level (in the case study of Al-Nassiriya city). The case study’s experience in this paper
used to provide the opportunity to identify current levels of the end-users satisfaction and as
well as the administrative problems, which can be directly linked to the future development
in the Iraqi urban areas. In this connection, this paper built on the obtained key themes of the
research, which are shown as follow: 1) the role of ILAs strategies for meeting the LTA and
the end-users’ rights. 2) The factors affecting the Success/failure of LTA, and for obtaining
LTS. 3) The perception of future success. In general, these themes were constructed in order
to answer the survey questions, which are listed as follow: 1) What are the main factors
affecting the efficiency of LTA, and how do these factors affect the current LTA in ILAs
strategy? 2) How effective is the implementation of LTA in ILAs strategy, and does it meet the
end-users’ rights?.
The selected samples
The selected sample of the questionnaire and a key issue in choosing were identified. The
sample comprised 384 people (end-users) of 3 different Neighbourhoods in Al-Nassiriya city
in Iraq. It was targeted to secure responses from a wide variety of land user’s respondents
with real experience of land tenure and security of tenure rights. The sample was constructed
by asking individuals who experienced LTA and have current level of security of land
tenures rights in these3different Neighbourhoods. The nominated neighbourhoods are these
were established during the Baath’s period such as Al-Seef neighbourhood (the oldest
neighbourhood in the AlNassiriya city), and Al-Salihiya neighbourhood, also one
neighbourhood (AL-Eskan neighbourhood) was selected as a presentative simple of current
situation after the collapse of the Iraqi regime in 2003. The survey was distributed to 384 land
users of different age, gender and qualifications in nominated neighbourhoods inside the Al-
Nassiriya city.
Of these copies despatched to the selected sample, only 293 were returned, thereby giving a
response rate of 86 %. As such, a very good response rate was achieved under the unstable
and insecurity situations. Table 1 gives detailed of the sample. It is noted form table 1 that the
sample included 293 people (86%) in 3 neighbourhoods. Table 1 gives detailed of the
sample.
Table 1: Samples of the questionnaire respondents
Neighbourhood
names
(a)Municipal
No.
(b)Units
No.
(c)Population Sample
size Obtained
response
(d) Percentage
Al-Seef 106 87 21392 100 98 33.43
Al-Salihiya 138 448 26035 100 100 34.13
Al-Eskan 406 1264 12048 184 95 32.44
Total - 1799 59475 384 293 100.00
a. Gatherings squatter camp in the residential neighbourhood (Municipality of Al-Nassiriya city, 2015).
b. Number of squatters units in the neighbourhood (The Iraqi Central Bureau of Statistics, 2015:p.70).
c. Estimation of population of neighbourhoods (Municipality of Al-Nassiriya city, 2015).
d. The percentage of the returned samples from these distributed in each neighbourhood.

491
The total response from these nominated neighbourhoods was higher in these couple
neighbourhoods that were established and inhibited before the collapse of Iraqi regime in
2003 (AlSeef and Al-Salihiya) than that one which was established and inhibited after,
because this neighbourhood (Al-Eskan) was influenced with illegal occupancies and most of
its land users had lived in semi-slums settlements and the researcher had to rely upon the
directors and policemen to visit and contact them to request their participations. In general,
the samples used in the survey were drawn from shelters unit’s users, only families were
selected and the head of the family was surveyed. Before carrying out questionnaires in these
3 neighbourhoods, letters were despatched to these selected samples in which the research
was introduced, its goal explained and permission for its execution asked. In this research, the
Cronbach’s alpha was used to measure the internal consistency of the questionnaire. In this
context, the Cronbach’s alpha for this questionnaire was found (0.771443) which is in the
acceptable range, thus implying that the results obtained from the questionnaire are
repeatable, trustable and reliable to an acceptable level. All the participants are doing so
completely voluntarily and may choose to withdraw at any time. Also, potential participants
were asked whether they were willing to participate in this survey. In addition to a participant
invitation letter to invite participants to contribute in this survey which confirm that his/her
response to this survey, or any individual question on the survey, is completely voluntary and
that his/her identities or personal details will not be disclosed to others, except for research
purposes, and any data used in the report will not be linked to any respondents. For safety
reasons no surveys in semi-slum zones were performed under the police supervision. Also,
Data were collected in Jan. 2016 for Al-Seef neighbourhood, and Al-Salihiya neighbourhood,
and later for AL-Eskan neighbourhood. Figure 1 graphically illustrates the study areas, in
which the data was distributed and collection in Al-Nassiriya city, Iraq.
Figure 1: The study nominated areas and data collection sites in Al-Nassiriya city in Iraq.
(Collected from Google maps)

492
2. PROFILE OF THE NEIGHBOURHOODS
Questionnaires were either taken face to face in the participant’s shelter or by sending the
copies and waiting to receiving them after two days according to the favourite of the
participant; many copes were unanswered and needed to be resent to the participants
particularly in AL-Eskan neighbourhood. The first neighbourhood is Al-Seef which is located
in the older portion of the city was built mainly from sun-dried brick and I-shape steel ceiling
frame for traditional Courtyard Housings (UN-Habitat, 2010a), new portions of the city are
comprised mostly of concrete block or brick buildings. Recently, the city is consisting of 26
neighbourhoods with the University site. Al-Seef neighbourhood is the oldest neighbourhood
in the Al-Nassiriya city. This neighbourhood is also located in the southern central portion of
Nassiriya; it is a part of the largely residential Al-Jazeera section of the city north of the
Euphrates River, and lies on the north bank of the river itself (Figure 2). Al-Salihiya is the
second sample which is located in the northeast of Al-Nassiriya city, adjacent to part of Al-
Seef’s northern border. This neighbourhood is a part of the largely residential Al-Jazeera
section of the city, and north of the Euphrates river. According to the Al-Nassiriya city
municipality, Al-Salihiya was established in the 1960s, when the government distributed
plots to people primarily for residential use, and in the 1980s, homes were also distributed to
families of war casualties, military members, and teachers under the Baath’s regime (Figure
3). Al-Eskan is located towards the south eastern edge of Al-Nassiriya; it is part of the largely
industrial Al-Shamiya section of the city south of the Euphrates River, and lies close to the
south bank of the river. In other parts of this area, empty government land has given way to
squatters and informally constructed dwellings, within informal housing zones, where vacant
plots have been occupied illegally. Many parts of this area are in severe need of improved
basic infrastructure (Figure 3).
Figure 2: The Al-Seef Neighbourhood in Al-Nassiriya City (Google earth map, 2016).

493
Figure 3: The Al-Salihiya Neighbourhood in Al-Nassiriya City (Google earth map, 2016).
Figure 4: The Al-Askan Neighbourhood in Al-Nassiriya City (Google earth map, 2016).
As mentioned in table1, the paper objectives are achieved by presenting the data collected
through the questionnaire process. To achieve this aim, the questionnaire consisted of the
following sections:
Section I :The Role of ILAs Strategies in Meeting the LTA
This section asked for responses of participants regarding the role of ILAs programmes in
meeting the LTA and securing the end-users rights and then opinions regarding suitability of
current aspect of LTA and Conventional procedures in the current mechanism allow land
users to obtain these rights, and then the end-user’s satisfaction level regarding the applying
of LTA implementation from ILAs policies.
Section II: The Factors Affecting the Success/Failure of LTA
Participants were asked to identify the main factors influencing the success/failure, and how
do they influence the LTA regarding the security of the end-users rights. Therefore,
Participants were asked to evaluate the existing impact of the Iraqi social and political

494
conflicts period after the events in 2003, and how the existing administration of LTA is
influenced (success/failure) as a result of the Iraqi situation.
Section III :Indicators for Success/ Failure
This section explored the opinions of end-users regarding the land authorities’ awareness of
these factors that enable /hinder the applying of LTA implementations, and what was the
current level of its success in ground. This section investigated participants’ responses
concerning their legal awareness about their permissible rights and responsibilities under the
current situation influence or in the ILAs performance.
2.1 The data analysis
The following statistical tests were used conducted where appropriate:
a. Analyses of attributes: in this paper, Participants’ backgrounds were grouped into
two categories which were analysed in percentages and summary of frequency. This
helped to explore the response sample in relation to their gender, age, current position
and level of education.
b. Analysis of responses: some of data collected from participants’ responses was
ranked within 1 to 3 categories, and the percentages of frequency in each of these
neighbourhoods were calculated and tabulated. Also, other data was collected from
multiple-choice questions.
c. Mean Scores: This technique was used to investigate the factors influencing the
development of LTA and the level of satisfaction.
d. Cross Tabulation: This technique was used to determine relationships between one
variable or more and other. For example the cross tabulation between the type of
documents and type of tenures and the cross tabulation between neighbourhood and
respondents’ satisfaction.
e. Chi-Square Test: In this research, it was need to determine the significant difference
in views between the three groups of participants (in each of these neighbourhoods)
for all values of P≤ 0.05 in most of the satisfaction level. This indicates that the
average scores are a fair representation of the population’s opinions irrespective of the
type of participants.
The rest of this section provides summary of the results generated from these investigations:
A. Role of ILAs strategies in meeting the LTA in line with the end-user’s views:
This section includes questions which are associated to the main factors influencing the
success/failure, and how do they influence the LTA regarding the security of the end-users
rights. Participants were asked to identify their views about these factors and how they found
them in ground. Also, Participants were asked to evaluate the existing impact of the Iraqi
social and political conflicts period after the events in 2003, and how the existing
administration of LTA is influenced (Success/Failure) as a result of the Iraqi situation. It aims
to explore and provide an insight of end-users in regards to the current factors influencing the

495
development of LTA in term of LTS in Iraq. Table 2 reveals that the responses of participants
which were expressed as percentages and mean scores of the main factors/ barriers connected
with the development of LTA in term of LAS aspects. These indicate agreement among the
respondents on the presence of all the listed factors. The majority of the responses of
participants showed the highest agreement with all listed factors, who completely agreed that
political and government situation’s factor was the main barrier effect on having an effective
LTA and giving average score of 3.22 ,and Social and cultural factors were the second main
factor in average score of 2.71. Results also revealed a similar of agreement for other factors
facing the end-users of land in Iraq, which indicated Religious rules factors (Islamic sharia)
and Economic and financial related factors, giving average scores of 2.66 and 2.25
respectively.
a) The political and security issues factor
These key or core Constraints results in table 2 could be associated to the administrative
deficiencies. The reasons for these deficiencies might be because of the critical unstable and
insecurity situations in Iraq and then the current leak of presence of land authorities in taking
its role in LTA and the securing the end-users’ tenure rights. It is interesting to note that the
results reveal that most participants gave a high score to Deficiency of laws management and
monitoring setting, Misdirected policy and poor executions and Lost indigenous /minority
rights, giving average scores of 3.41. Besides this, from the perspectives of respondents,
between (69%) and (68%) gave equal scores of (3.4) to four of this factor’ barriers, these
being: Deficiency of laws management and monitoring setting, Misdirected policy and poor
executions, Informal or illegal occupation situations and Lost indigenous /minority rights.
On the other hand, a minority of the respondents gave a low score to Significant
misunderstanding about how to reform local regulations with modern categories and Data on
land ownership usually is incomplete, and out of date, giving an average score of 1.93 and
2.90.
b) Social and cultural factors
Participants’ responses were expressed as percentage and mean scores of their views of
which barriers influence regarding the factor of Social and cultural issues, the obtained
results were presented in Table 2. From table 3, it is seen that 82 % and 76% of respondents
strongly agreed that there are Difficulties of Women’ rights with Social and traditional
conceptions and Islamic sharia’ rules clashes with modern categories were the main barriers
regarding the factor of the Social and cultural issues. Both these barriers achieved average
score of 4.11 and 3.80. Furthermore, more than half of the total responses (69% and 64%)
agreed that Tribal, ethnic regulations clashes with modern categories and Difficulties of
indigenous /minority rights. Both these barriers achieved average scores of 3.46 and 3.21.
Findings in table 19 also show a similar trend of agreement for the other challenges which the
respondents that they face, the minority of the respondents (43%) gave a low score to the
barriers of Livelihoods deprivation between rural and urban areas, Difficulties of dealing with
the complexity of land modern regulations and Economic and financial problems, giving
average scores of 1.71 and 2.97. In general, the results show that the participants agreed on
the presence of all the listed challenges. The majority give the highest agreement in relation
to women’s rights and these difficulties with the social traditional/ Islamic religious
conceptions.

496
c) The Economic and financial related factor.
This section explores the respondents view related to challenges in terms of the economic and
financial factor. Table 2 reveals the responses expresses as percentages and mean scores of
the main challenges/barriers in this respect. In general, the results indicate that the
participants agreed on the presence of all the listed challenges. It is seen that the majority of
respondents (between 87% and 72%) strongly agreed that Weakness of the families’ incomes
and Housing deprivation, Deteriorated housing conditions, the capital stock of housing is
continuing to decline as a result, giving the highest scores of 4.35 and 4.33. Findings also
show a similar trend of agreement for the other two barriers including Absence of formal
housing finance and Deficiency of land availability. Both these barriers achieved average
score of 3.68 and 3.60. Likewise, between the range of 68% and 61% of participants shows
either strong agreement or agreement with the barriers that they face related to obtaining their
rights, such as Deficiency of co-operations in land authorities’ policies, the refugee’s dispute
and relocation problems and Livelihoods deprivation. These challenges generated average
scores of 3.41 and 3.04. On the other hand, it can be seen that the good rate of the
respondents (57%) gave a low score to the challenge of Informal or illegal occupation
situations and Declining infrastructure service levels and inadequate maintenance, giving an
average score of 2.87 and 2.56.
Table 2: Percentage Frequency of Mean scores of participants about their view of which
barriers regarding the LTA issues factor
Factor
Barriers *Response Average
scores
out of 5 Completely Agree Moderately Disagree Strongly
disagree
1- Authority’
gaps and
Security
issues.
Weakness of the
governance.
283 10
0 0 0
3.82
98% 2%
Deficiency of laws
management and
monitoring setting.
200
89
4
0 0
3.41
68% 30% 2%
The refugee’s dispute
and relocation
problems.
211
82
0 0 0
3.60
72% 28%
Misdirected policy
and poor executions.
78
200
15
0 0
3.41
26% 68% 4%
Transparency level;
Bureaucratic
corruption.
273
20
0 0 0
3.65
93% 7%
Informal or illegal
occupation situations.
90
203
0 0 0 3.46
31% 69%

497
Significant
misunderstanding
about how to reform
local regulations with
modern categories.
88
113
92
0 0
1.93
30% 39% 31%
Data on land
ownership usually is
incomplete, and out of
date.
123
170
0 0 0
2.90
42% 58%
Lost indigenous
/minority rights.
88 200 5 0 0
3.41
30% 68% 2%
*From the total of participants (293) in each factor, responses were listed in according to the total number and
the total percentage.
Table 2: (Continued)
Factor
Barriers
*Responses Average
scores
out of 5 Completely Agree Moderately Disagree Strongly disagree
2- The Social and cultural issues:
a) Social and traditional
conceptions;
b) Wars/ post war
sphere, Civil violent,
conflict/Post-conflict
instability;
c) Tribal/ethnic
clashes/conflict rights;
d) Religious rules
factors (Islamic
sharia);
e) Economic and financial related
factors.
Tribal, ethnic
regulations clashes
with modern
categories of laws.
203
90
0 0 0
3.46
69% 31%
Islamic Sharia’
rules clashes with
modern categories.
67
223
3
0 0
3.80
23% 76% 1%
Difficulties of
Women’ rights
with Social and
traditional
conceptions.
241
52
0 0 0
4.11
82% 18%
Difficulties of
Women’ rights
with Islamic
sharia’ rules.
81
188
24
0 0
3.21
27% 64% 9%
Difficulties of
indigenous
/minority rights.
88
200
5
0 0
3.41
30% 68% 2%
• Difficulties of
dealing with the
complexity of land 67
99
127
0 0
2.17

498
modern
regulations. 23% 34% 43%
Livelihoods
deprivation
between rural and
urban areas.
74
119
100
0 0
1.71
25% 40% 35%
Economic and
financial problems. 174
119
0 0 0
2.97
59% 41%
*From the total of participants (293) in each factor, responses were listed in according to the total number and
total percentage.
Table 2: (Continued)
Factors
Barriers *Responses Average
scores
out of 5
Completely Agree Moderately Disagree Strongly
disagree
3- The
Economic
and
financial
related
factor.
Weakness of the
individual/ families’
incomes.
254 20 19 0 0
4.33
87% 7% 6%
Absence/ lack of
recognised housing
finance.
211
78
4
0 0 3.60 72% 27% 1%
Deficiency of land
availability. 216 75 2
0 0 3.68
74% 25.6% 0.4%
Declining
infrastructure service
levels and inadequate
maintenance.
168
110
15
0 0 2.87
57% 37% 6%
Housing deprivation,
Deteriorated housing
conditions, the capital
stock of housing is
continuing to decline as
a result.
255
38
0 0 0
4.35
87% 13%
Deficiency of co-
operations in land
authorities’ policies.
94
199
0 0 0 3.39 32% 68%
The refugee’s dispute
and relocation
problems.
178
113
2
0 0 3.04 61% 38.6% 0.4%
Informal or illegal
occupation situations.
134 150 9 0 0 2.56
46% 51% 3%
Livelihoods deprivation. 88 200 5 0 0 3.41
30% 68% 2%
*From the total of participants (293) in each factor, responses were listed in according to the total number and total
percentage.

499
Likewise, between the range of 68% and 61% of participants shows either strong agreement
or agreement with the barriers that they face related to obtaining their rights, such as
Deficiency of co-operations in land authorities’ policies, the refugee’s dispute and relocation
problems and Livelihoods deprivation. These challenges generated average scores of (3.41
and 3.04). On the other hand, it can be seen that the good rate of the respondents (57%) gave
a low score to the challenge of Informal or illegal occupation situations and Declining
infrastructure service levels and inadequate maintenance, giving an average score of (2.87
and 2.56). The Chi Square Test in Table 3 shows the significance of the distribution of rating
scale responses by main factors and these related barriers, revealing no significant difference
in opinion between the participants’ responses for all values of P ≤ .05 in all factors and most
of these barriers. These results indicate that all respondents encounter all the factors and their
listed barriers relating to LTA and then end-users’ rights.
Table 3: Chi Square Test (χ² test): Level of significance between end-users’ responses by
main factors and these related barriers influencing LTA in term of LTS (using GPower
3.1.9.2 statistical programme). Factors Barriers Value of
χ² test
Significance
(p value)
1- Authority gaps and Security issues.
Weakness of the governance.
9.717 0.044
Deficiency of laws management and monitoring setting. 9.517 0.045
The refugee’s dispute and relocation problems.
9.610 0.043
Misdirected policy and poor executions.
9.517 0.045
Transparency level; Bureaucratic corruption.
9.634 0.044
Informal or illegal occupation situations.
9.542 0.044
Significant misunderstanding about how to reform
local regulations with modern categories. 8.784 0.046
Data on land ownership usually is incomplete, and out
of date.
9.269 0.045
Lost indigenous /minority rights.
9.896
0.032
2- Social and cultural issues
Tribal, ethnic regulations clashes with modern
categories. 9.542 0.044
Islamic sharia’ rules clashes with modern categories. 9.708
0.044
Difficulties of Women’ rights with Social and
traditional conceptions. 9.859 0.043
Difficulties of Women’ rights with Islamic sharia’ rules. 9.420 0.044
Difficulties of indigenous /minority rights. 9.517 0.044
Difficulties of dealing with the complexity of land
modern regulations. 8.915 0.045
Livelihoods deprivation between rural and urban
areas. 8.692 0.046
Economic and financial problems. 9.303 0.045
3- Economic and financial
Weakness of the families’ incomes.
9.966 0.043
Absence of formal housing finance. 9.610 0.044
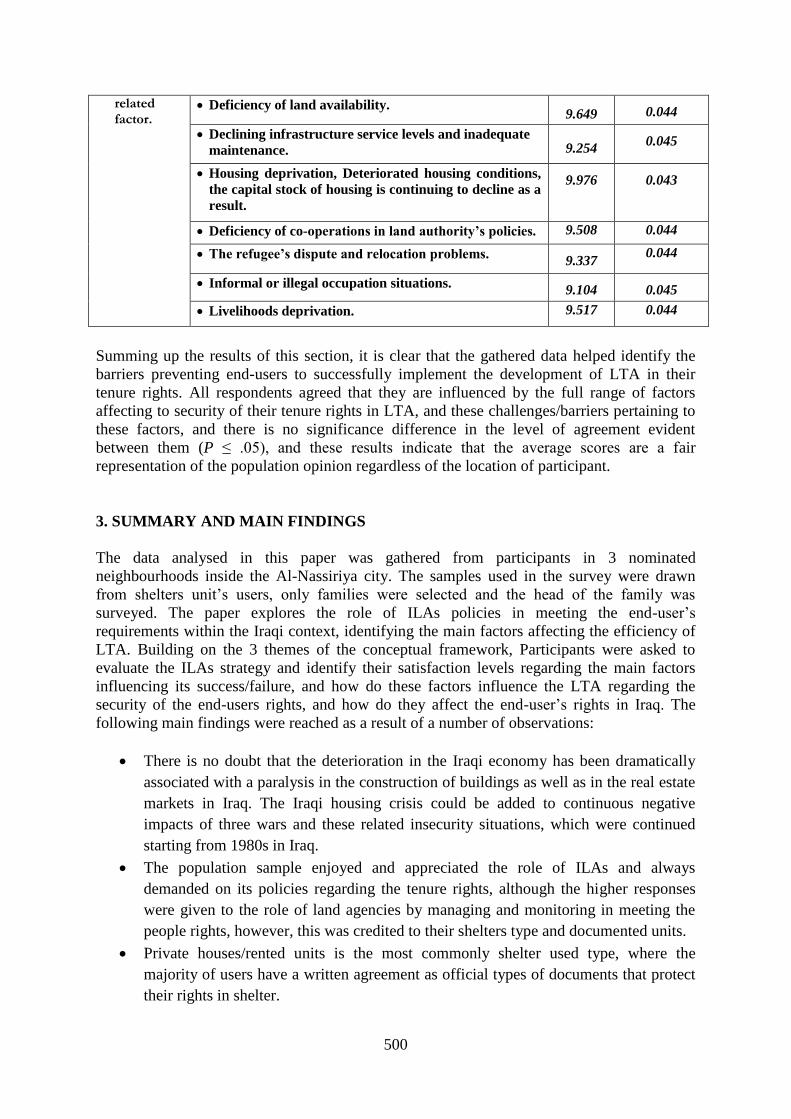
500
related factor.
Deficiency of land availability. 9.649 0.044
Declining infrastructure service levels and inadequate
maintenance. 9.254 0.045
Housing deprivation, Deteriorated housing conditions,
the capital stock of housing is continuing to decline as a
result.
9.976 0.043
Deficiency of co-operations in land authority’s policies. 9.508 0.044
The refugee’s dispute and relocation problems. 9.337
0.044
Informal or illegal occupation situations. 9.104 0.045
Livelihoods deprivation. 9.517 0.044
Summing up the results of this section, it is clear that the gathered data helped identify the
barriers preventing end-users to successfully implement the development of LTA in their
tenure rights. All respondents agreed that they are influenced by the full range of factors
affecting to security of their tenure rights in LTA, and these challenges/barriers pertaining to
these factors, and there is no significance difference in the level of agreement evident
between them (P ≤ .05), and these results indicate that the average scores are a fair
representation of the population opinion regardless of the location of participant.
3. SUMMARY AND MAIN FINDINGS
The data analysed in this paper was gathered from participants in 3 nominated
neighbourhoods inside the Al-Nassiriya city. The samples used in the survey were drawn
from shelters unit’s users, only families were selected and the head of the family was
surveyed. The paper explores the role of ILAs policies in meeting the end-user’s
requirements within the Iraqi context, identifying the main factors affecting the efficiency of
LTA. Building on the 3 themes of the conceptual framework, Participants were asked to
evaluate the ILAs strategy and identify their satisfaction levels regarding the main factors
influencing its success/failure, and how do these factors influence the LTA regarding the
security of the end-users rights, and how do they affect the end-user’s rights in Iraq. The
following main findings were reached as a result of a number of observations:
There is no doubt that the deterioration in the Iraqi economy has been dramatically
associated with a paralysis in the construction of buildings as well as in the real estate
markets in Iraq. The Iraqi housing crisis could be added to continuous negative
impacts of three wars and these related insecurity situations, which were continued
starting from 1980s in Iraq.
The population sample enjoyed and appreciated the role of ILAs and always
demanded on its policies regarding the tenure rights, although the higher responses
were given to the role of land agencies by managing and monitoring in meeting the
people rights, however, this was credited to their shelters type and documented units.
Private houses/rented units is the most commonly shelter used type, where the
majority of users have a written agreement as official types of documents that protect
their rights in shelter.

501
Samples’ responses to the administrative deficiencies such as the lands availability
and complexity and the routine of procedures were generally higher. However, these
results are contracted with the opinions expressed in the interviews with TSMs in
ILAs which showed that the majority of them believed that their agencies policies
were met the Iraqi end-user’s ambitions.
Findings also show a similar trend of agreement for the other challenges which the
respondents that they face, the minority of the respondents gave a low score to the
barriers of Livelihoods deprivation between rural and urban areas, Difficulties of
dealing with the complexity of land modern regulations and Economic and financial
problems. In general, the results show that the participants agreed on the presence of
all the listed challenges. Majority give the highest agreement in relation to women’s
rights and these difficulties with the social traditional/Islamic religious conceptions.
The majority of respondents strongly agreed that Weakness of the families’ incomes
and Housing deprivation, Deteriorated housing conditions, the capital stock of
housing is continuing to decline as a result, giving the highest scores.
Findings also show a similar trend of agreement for the other two barriers including
Absence of formal housing finance and Deficiency of land availability.
The gathered data helped identify the barriers preventing end-users to successfully
implement the development of LTA in their tenure rights. All respondents agreed that
they are influenced by the full range of factors affecting to security of their tenure
rights in LTA, and these challenges/barriers pertaining to these factors.
To determine which of the reasons they thought was being used in previous period.
These given responses show that is most commonly the main reasons was linked to
the efficiency of administrative role such as Efficiency of employees and Financial
supports. These obtained results can be explained by the administrative agencies
associated with LTA and then reflect the satisfaction level. The results also show that
the role of ILAs in ‘planning’ and ‘monitoring’ is dependent on the participants’ rate
with regards to dissatisfaction reasons.
For a closer examination of the step (s) required to advance the adopted System in
current authorities, the frequency distribution of scores given by participants are
summarised to determine which of the administrative steps is being required in end-
user’s views to advance the adopted System. These given responses show that
Modifying and development the administrative issues are most commonly required to
advance the adopted system which can be explained by the cost associated with
administrative efficiency.
These key or core Constraints results could be associated to the administrative
deficiencies. The reasons for these deficiencies might be because of the critical
unstable and insecurity situations in Iraq and then the current leak of presence of
land authorities in taking its role in LTA and the securing the end-users’ tenure
rights.
It is interesting to note that the results reveal that most participants gave a high score
to Deficiency of laws management and monitoring setting, Misdirected policy and
poor executions and Lost indigenous /minority rights to four of this factor’ barriers,

502
these being: Deficiency of laws management and monitoring setting, Misdirected
policy and poor executions, Informal or illegal occupation situations and Lost
indigenous /minority rights. On the other hand, a minority of the respondents gave a
low score to Significant misunderstanding about how to reform local regulations with
modern categories and Data on land ownership usually is incomplete, and out of
date.
Similar responses strongly agreed that there are Difficulties of Women’ rights with
Social and traditional conceptions and Islamic sharia’ rules clashes with modern
categories were the main barriers regarding the factor of the Social and cultural
issues. Furthermore, more than half of the total responses agreed that Tribal, ethnic
regulations clashes with modern categories and Difficulties of indigenous /minority
rights. Both these barriers were generally higher.
4. CONCLUSIONS
This study is driven by the need to bridge the gap in the current literature in terms of
identifying the sustainable institutional aspects of the land administration system under the
current situation in Iraq as the principal mechanism through which LTA aspects can be
sought. It is clear that the gathered data helped identify the barriers preventing end-users to
successfully implement the development of LTA in their tenure rights. In fact, the current
influence of informal occupancy and illegal activities still need more innovation from ILAs
strategy to ensure more effective security of tenures.
The main point is that ILAs were attempting to develop their current strategy with the private
sector as an essential outcome of LTA in ILAs programmes, which agreed with the literature
evidences, it must be taken into account that the current impact of the instability of system in
Iraq has influenced gradually the ILAs performance and then its efficiency in implementation
of LAS and LTA aspects regarding the end-users’ rights. From the quantitative data, there is
a positive view from the decision-makers (TSMs) apposite to negative views from the
majority of end-users. The important point is that the current system is built on a rock-hard
legislative base from the social/ cultural and religious forms that helped it to resist the current
impacts.
However, outcomes of this study indicated that the LTA applying aspects are influenced by a
set of critical factors which have impacted on both the productivity of the institutional aspects
of LAS and on stakeholder’s satisfaction with the existing system performance in Iraq.
Nevertheless, there is a highest level of agreement with all investigated factors, that the Iraqi
existing system is still offering significant levels of the management and monitoring support.
Concerns were; however, shed a light on the vast influence of the current unstable situation
and its negative interventions, confirming that the quality situation affects the quality of LTA
directly or indirectly in response to the end-users’ needs.
5. ACKNOWLEDGMENT
Grateful acknowledgment is made to the following sources for helping to produce material in
this paper: Professor David Baldry for his supportive time and academic help. Also, thanks

503
go to Iraqi urban executive councils, and the Al-Nassiriya city’s district councils for giving
their support time and precious data. I am thankful to all those who have contributed in one
way or the other to this research study in Iraq and the UK.
6. REFERENCES
Al Rashid,Y. (2005). The Role of the Baathist State in the Land Reforms and Co-operative Development in
Iraq’s Agriculture 1958-1970. Lessons for those attempting political and economic reform in the emerging
Iraq. International journal of co-operative management, IJCM Vol. 2 No. 1, August 2005, p.9-20.
Davis, M. (2004). Planet of Slums: Urban Involution and the Informal Proletariat. New Left Review, 26: 5–34.
Available at: www.newleftreview.net/NLR26001.shtml
FAO (2012).Voluntary Guidelines on the Responsible governance of Tenure of Land, Fisheries and Forests in
the Context of National Food Security. Rome. Available at:
http://www.faw.org/nr/tenure/voluntary-guidlines/en/
Hamid, M. (2007). Citizen Participation in Informal Settlements; Potentials & Obstacles–The Case of Iran,
Shiraz, Saadi Community. World Academy of Science, Engineering and Technology International Journal
of Social, Human Science and Engineering Vol: 1 No: 4, 2007.
Iraqi Ministry of Justice (2016). Ministry of Justice website:
http://www.moj.gov.iq/#
Iraqi Ministry of Planning (2016). Iraqi Ministry of Planning Website:
http://www.mop.gov.iq/mop/index.jsp?&lng=en
Madhat al-Mahmood (2014) .The Judiciary in Iraq: The Path to an Independent Judiciary and Modern Court
System. iUniverse ILL Bloomington, IN, ISBN:1491731141, 9781491731147.
Payne, G. and Durand-Lasserve, A.( 2012). “Holding On: Security of Tenure - Types, Policies, Practices and
Challenges”. Research Paper prepared for the Special Rapporteur on adequate housing as a component of
the right to an adequate standard of living, and on the right to non-discrimination in this context, Raquel
Rolnik, to inform her Study on Security of Tenure. Special Rapporteur on 22-23 October 2012. Available
at:
http://www.ohchr.org/Documents/Issues/Housing/SecurityTenure/Payne-Durand-Lasserve-
BackgroundPaper-JAN2013.pdf
Royston, L., Kihato, C. (2012). One step at a time: linking the tenure security continuum concept to the findings
of Urban Land Mark‘s operation of the market study in Maputo‘. Urban Land Mark.
Shaikley, L. (2013). IRAQ'S HOUSING CRISIS: UPGRADING SETTLEMENTS FOR IDPS (INTERNALLY
DISPLACED PERSONS). A Thesis Submitted to the Department of Architecture on May 23rd, 2013 in
partial fulfilment of the requirements for the Degree of Master of Science in Architecture Studies. archwm
of technology jun 2 71 f 03 LIBRARIES. Available online from:
http://dspace.mit.edu/handle/1721.1/82280
Sietchiping, R., Aubrey, D., Bazoğlu, N., Augustinus, C., Mboup, G. (2012). Monitoring tenure security within
the continuum of land rights: methods and practices. UN-Habitat. Paper prepared for presentation at the-
Annual World Bank Conference on Land and Poverty- Washington DC, April 23-26, 2012.
http://www.landandpoverty.com/agenda/pdfs/paper/sietchiping_full_paper.pdf
Spencer, C. (2015). U.S. Conflicts in the 21st Century: Afghanistan War, Iraq War, and the War on Terror [3
volumes]: Afghanistan War, Iraq War, and the War on Terror. ISBN 9781440838798
USAID (2005). Land Registration and Property Rights in Iraq, Iraqi Local Governance Program. RTI
International / Research Triangle Park, NC 27709-2194, January 2005. EDG-C-00-03-00010-00. Available
online from:
http://humanitarianlibrary.org/sites/default/files/2013/05/PNADE241.pdf
UN-Habitat (2003). Handbook on best practices, security of tenure and access to land, implementation of the
habitat agenda. Land and Tenure Section, Shelter Branch Shelter and Sustainable Human Settlement
Development Division,Nairobi,2003.HS/588/99E, ISBN 92-1-131446-1.
UN-Habitat (2010a). Background Paper for Rapid Land Tenure Assessment in Arbil, Hilla, Baghdad and
Nassiriya. UN-Habitat Office, Iraq. Amman.
UN-Habitat (2010b). Iraq national housing policy’. Republic of Iraq, ministry of construction and housing.
Prepared Report with the support of United Nations human settlements programme. October 2010.
UN-Habitat (2011).’ Monitoring Security of Tenure in Cities: People, Land and Policies’. HS Number:
HS/130/11E, ISBN Number (Volume): 978-92-1-132415-0.
UN-Habitat (2012a). Evaluation of the UN-Habitat Urban Programme in Iraq 2004-2012, Evaluation Report
3/2012. HS Number: 049/13E, ISBN Series Number: 978-92-1-132028-2, ISBN: 978-92-1-132582-9.

504
ID 048
STAKEHOLDERS RESPONSIBILITIES’ FOR TIME OVERRUN RISKS
OF HIGHWAY PROJECTS IN TERRORISM AFFECTED AREAS
I. Zafar1, G. Shen1, S. Ahmed2 and T. Yousaf2
1 Department of Building and Real Estate, The Hong Kong Polytechnic University, Hong Kong 2 Department of Construction Engineering & Management (Risalpur Campus), National University of Science
& Technology, Pakistan
Email: [email protected]
Abstract: Around 124 countries worldwide are facing the menace of terrorism, and
underdeveloped regions are believed to be the nourishing grounds for it. However, execution
of development works in these regions are found as the key to controlling and eliminating this
hazard. Highways are the symbol of prosperity and progression, and they supplement further
development hence their timely completion is essential. Besides the severity of the risks
associated with the region affected by terrorism, it has also been found that the responsibilities
of these risks are not clear among the stakeholders, creating confusion for their mitigation,
causing extra delay. Hence, there is a requirement to establish the responsibilities among
stakeholders for the risks associated with such regions in the execution of the road projects,
which is the focus of this research study. Pakistan has been taken as a case study for this
research, being one of the most terrorism affected countries worldwide. The study is
conducted through questionnaire survey based on 19 time overrun risk factors obtained
through literature review and expert interviews. The responsibilities were delineated in four
groups which include client, consultant, shared and those which can not be identified. The
results revealed that 96% of the responsibilities of risks causing delay could be established
among the stakeholders. Whereas, contractors have to shoulder maximum projects’ risks. The
results of this study can be used as a guideline for other such terrorism affected areas around
the world.
Keywords: Highways, Risk, Stakeholder’s Responsibilities, Time Overrun, Terrorism.
1. INTRODUCTION
Since 9/11, the world has experienced the menace of terrorism more closely and even after
the lapse of several years this problem is still incorrigible. The population deprived of basic
human facilities living in these regions are found to be an easy target for the terrorists to use
them as their agents and facilitators in trade of trivial benefits. However, it has been realized
that development work in these areas can bring dividends in term of controlling and
eliminating this plague (Zafar et al., 2016). The road network is believed to bring prosperity
in the region and opens the prospects for further progression. Its construction in the terrorism-
affected area is a challenging task as it faces a delay in its scheduled completion time due to
various risks associated with the dynamics of the area. These delays result into cost
overburden on clients and contractors leading to various conflicts complementing further
delay. Besides the severity of the risks associated with the region causing schedule overrun,
it has also been found that the responsibilities of these risks are not clear among the
stakeholders which at time create confusion for its mitigation thus adding further delay to the
project. Any previous research study on the subject lacks in delineating these responsibilities
among the stakeholders. Hence, to bridge this gap, a need arises to ascertain risks
responsibilities associated with the terrorism affected regions among various stakeholders.
Therefore, the main objectives of this research study are: -

505
a. To establish risk responsibilities among the stakeholders involved in the construction of the
highway projects.
b. To suggest suitable measures to meet these responsibilities.
As per the statistics from Global Terrorism Index (GTI-2016), almost 124 countries are
facing the menace of terrorism worldwide, and Pakistan ranked fourth among these affected
countries. Furthermore, PIPS (2014) establishes Federally Administered Tribal Area (FATA)
as the top terrorist affected area within Pakistan. Hence, Pakistan (FATA) has been taken as a
case study for this research work.
2. LITERATURE REVIEW
Ahmed et al. (2003) described schedule overrun as a universal phenomenon complemented
by the cost overrun in the construction projects. Delay beside affecting negatively to the
project progress also put stakeholders into conflicts resulting into litigation (Mahamid et
al.,2012). The importance and necessity of completing projects within time have been
understood and acknowledged by all stakeholders. However, these projects are seldom
completed as per schedule. The percentage projects delay ranges in various countries viz-a-
viz these ranking as per Global Terrorism Index (GTI - 2016) is shown in Table -1 and trends
are presented in figure -1 for comparison.
Table 1: Time overrun (%age) in various countries in highway projects
Figure 1: Time overrun Vs GTI ranking
Countries
Time Overrun above
schedule planned
time (%age)
Global Terrorism
Index (GTI) 2016 Authors / Publication Year
Nigeria 188% 3 Omoregie & Radford (2006)
India 55% 8 Doloi et al. (2012)
Philippines 50% 12 Matthews (2016), CoST (2011)
Tanzania 110% 49 Matthews (2016), CoST (2011)
Ethiopia 130 % 54 Matthews (2016), CoST (2011)
Jordan 82% 58 Al-Momani (2000), Battaineh (1999)
Malaysia 49% 61 Ibrahim et al. (2010)
Bosnia 51% 62 Žujo, Car-Pušić et al. (2010)
Ghana 70% 106 Frimpong, Oluwoye & Crawford (2003)

506
The comparison of the trend line in figure 1 revealed that the country high (ascending order)
in GTI index (2016) are experiencing more time overrun or schedule delays in completion of
the construction projects. Whereas, with the increase in GTI Index (descending order) the
time overrun effect is reduced. Furthermore, the rise in time overrun trendline at the mid of
graph demonstrated that the developing countries although experiencing lower influence of
terrorism but have poor economic and political conditions still confront delay completion of
the projects. Hence a country with poor economic and political condition augmented by the
menace of terrorism may experience the worst effect of delays in construction projects.
An exhaustive study on the topic revealed that till date no explicit research attempted in
identifying the time overrun risk factors for highway construction projects of terrorism
affected regions. Hence, the literature was further explored while focussing on developing
countries with similar social, political and construction environment, as of understudy area
i.e. FATA. The intention was to obtain critical time overrun risks of highway projects in
particular and other construction projects in general, and then sieve them through expert
opinions for further research.
Sujka and Jacob (2013) in their study to identify the causes of the project delays in the Niger
Delta Region found thirty-eight (38) factors including improper planning, inappropriate
design, delay or non-payment of the completed work, inappropriate construction methods
used by contractor resulting in rework, unskilled manpower resulting in low productivity,
non-availability/inadequate equipment, lack of reward and punishment in contract as a result
of poor contract management, extreme weather conditions, interference by the political leader
for their vested interest and lack of local community support. The study conducted by Kaliba
et al. (2009) on highway projects of Zambia for identification of cost and time overrun
factors were design changes, delay in progress payments by owner, delay in material
procurement, non-availability of skilled staff, non-availability of the equipment, construction
errors, poor coordination and weak management on site as the main reasons for road projects
delay. The responsibility of each factor was also stated in terms of major stakeholders i.e.
client, consultant, and the contractor.
The prime factors influencing time overruns as concluded by Sambasivan (2007) in a study
conducted in Malaysia was improper planning, poor contractor experience and financial
health, and delayed payment of completed works. Sweis et al., (2007) explained major
reasons for scheduled delays in Jordan as poor planning and scheduling, the presence of un-
skilled labors and a shortage of technical specialists with the contractor. In Saudi Arabia,
delay in payments for completed work, poor planning, lack of skilled labor and poor
workmanship resulting in frequent re-work and low productivity were prime reasons for
project delays (Assaf et al., 1995 and Assaf, 2006).
Choudary et al., (2012) conducted a comprehensive research to establish the major factor
causing time and cost escalation of highway projects in Pakistan. He found a strong linkage
between delay and budget overrun by identifying the factors like delay in progress payment
to the contractor, conditions under force majeure including extreme weather conditions and
law & order situation, Contractor’s incompetence and incapacity to complete the project,
difficulty in land acquisition and resettlement and ineffective planning and scheduling.
Apolot et al., (2011) identified 22 factors responsible for cost and time overrun in his study in
Uganda. These were rework due to poor workmanship and wrong use of construction
methods, inappropriate and unskilled workforce, delayed payment to the contractor and

507
subcontractors, severe weather, inadequate and inefficient equipment, tools and plant,
discrepancy/deficiency in contract documents, contractor’s workload capacity and political
insecurity and instability in the area of work. Afshari et al., (2010) ranked inability to select a
suitable contractor as the prime reason for time overrun in the construction projects. Olajide
Timothy Ibironke et al., (2013) highlighted the prominent factors causing non-excusable
delays in Nigeria construction projects as shortage of construction material and skilled labor
resulting in reduced labor productivity, lack of desired plant & equipment and their frequent
breakdown, delay in payment to contractor, improper planning and scheduling , inaccurate
site investigation and survey, poor design, weather conditions and conflict, war and public
enemies in the area demanding additional security requirements.
Ameh and Osegbo (2011) found inadequate planning of project, temporary stoppages or
suspension due to adverse weather condition and local community issues, political instability
and change in government policies as time overrun factors along with contributing factors of
low productivity further enhancing the gravity of the issue i.e. use of wrong construction
method, lack of skills from the labor, unfriendly working atmosphere, extreme weather
conditions and political insecurity. Non-availability of the desired plant and equipment, its
frequent breakdown, and maintenance problem due to non-availability of mechanics was
ranked among five top most factors causing a delay in the projects (Aibinu and Odeyinka,
2006). Assaf & Al-Hejji (2006) in their research for identifying majors reasons for delays in
construction project of Saudi Arabia concluded that delay in payment of completed work by
the owner, lack of incentives to contractor for early finishing the project, rework due to error
in construction, ineffective planning and scheduling, improper construction method used by
contractor, inadequate contractors work, shortage of construction materials, shortage of
machinery and its frequent breakdown, shortage of labor and non-availability of qualified
workforce, low productivity level of labors, absence of utilities on site and effect of social
and cultural influences were among the leading factors for causing time delay.
3. RESEARCH METHODOLOGY
The risk factors affecting time overrun in terrorism affected area were furnished through
exhaustive literature review complimented by expert’s interviews. Due to lack of explicit
literature on highways construction in terrorism affected areas, expert interviews were found
significantly important. Eleven experts (clients-2, consultants-3 and contractors-6) from
industry were selected based on their minimum working experience of seven years in
highway projects in FATA. Inferred from the literature review and structured interviews a
questionnaire was developed with 19 risk factors specific to FATA only and validated
through a pilot study. Moreover, to mark the responsibility of schedule delay risks in
highway projects, the respondents were required to choose between various stakeholders
groups in the questionnaire. The groups included; Group -1; client & consultants (joint),
Group-2; contractors, Group 3; Shared (i.e. group 1 and 2) and Group 4; un-determined
responsibilities. Consultants mostly work for clients only, hence they were grouped together
with client in group-1 for this study. Total 103 questionnaires were distributed among
respondents which include contractors (sub-contractors, suppliers, project managers, site
engineers and site supervisors), consultants (design engineer/architects), and clients
(federal/provincial government, FATA Secretariat), 72 received back, and after scrutiny only
63 were found valid for the research. In the survey, the respondents were required to choose
between four groups for each identified risk. The percentage responsibility for each of the

508
risk was calculated using the formula given below (Shahid, 2012), whereas social network
analysis was done using UCINET software:
𝑷𝒆𝒓𝒄𝒆𝒏𝒕𝒂𝒈𝒆 𝑹𝒆𝒔𝒑𝒐𝒏𝒔𝒊𝒃𝒊𝒍𝒊𝒕𝒚(%) =𝑹
𝑵𝒙𝟏𝟎𝟎
Where:-
𝑅 : Total number of the respondents selecting the responsibility among four
groups
𝑁 : Total number of respondents
The factor scoring more than 50% in any category assumed to be the ultimate responsibility
of that specific category.
4. RESULTS AND DISCUSSIONS
4.1 Overall responsibility of time overrun risks
The overall results of time overrun responsibility in percentage are summarized in Table 2.
Table 2: Summary – Responsibility of time overrun risks
Risk
Code Risk
Risk Responsibility (%)
Cli
ent
/
Co
nsu
lta
nt
Co
ntr
act
or
Sh
are
d
Ca
nn
ot
be
Est
ab
lish
ed
Result
(Group-1) (Group-2) (Group-3) (Group-4)
T1 Unrealistic planning & scheduling due to
hostile environment 5% 67% 28% 0% G-2
T2 Poor designing due to insufficient data
collection & survey 100% 0% 0% 0% *G-1
T3 Difficulty in land acquisition 83% 0% 17% 0% G-1
T4 Forced selection of contractor due to tribal
compulsions 25% 0% 0% 75% G-4
T5 Contractor’s capacity to undertake work 8% 78% 14% 0% G-2
T6 Delay due to incompetent contractors
using inadequate construction methods 4% 90% 6% 0% G-2
T7 Delay due to non-availability/shortage of
construction material 11% 60% 29% 0% G-2
T8 Non-availability of desired plant &
equipment 3% 67% 30% 0% G-2
T9 Non-availability of local mechanics for
repair/maintenance of plant & equipment 0% 71% 29% 0% G-2
T10 Low productivity due to unskilled
workforce 5% 62% 33% 0% G-2
T11 Absence of utilities on site 7% 10% 83% 0% G-3
T12 Suspension of work due to
insecurity/terrorist threat 25% 5% 70% 0% G-3
T13 Rework due to poor construction 3% 89% 8% 0% G-2
T14 Rework due to terrorism acts 13% 17% 70% 0% G-3
T15 Delayed payments for completed work 81% 3% 16% 0% G-1
T16 Lack of local community support 11% 6% 78% 5% G-3
T17 Interference by political leaders due to
vested interests 65% 16% 19% 0% G-1
T18 Force Majeure (i.e. Extreme weather
conditions, Flashfloods, earthquake etc.) 59% 8% 33% 0% G-1
T19 Lack of reward & punishment in contract 76% 3% 21% 0% G-1

509
terms & Conditions
Summary 31% 34% 31% 4%
* G-1 referred as Group-1
Figure 2: Responsibility distribution trend
The results (Table 2) reveals that 96% of the time overrun risk responsibilities could be
delineated among first three groups. The inclination of the trend line (figure -2) towards first
three groups explains that the responsibility of the time overrun risks has to be shouldered by
these stakeholders, either independently or jointly. Moreover, the results further reveal that
the contractors (group-2) bear the maximum risks as they are executing the project on
ground. Only the responsibility of one risk out of 19 could not be established among any of
the major stakeholders.
To further clarify the situation, social network analysis software named UCINET version
6.628 was used. The social network analysis explains dyadic attributes (Borgatti & Everett,
1997), hence make it easier to understand the complex relationships. The results obtained
through netdraw (UCINET) is shown in figure 3: -
Figure 3: Social network analysis for risk responsibilities
In figure -3, all groups and risk factors have been differentiated by various shapes called
nodes. The risks are woven together to each group through arrow lines emanating from each

510
risk node showing the weight or strength towards the group nodes. The strength has been
defined between 0 to 1. The concentration of group 1 to 3 on the right side of the figure
further augment the results explained in figure-2. It describes that the responsibilities of
identified risks in the study are exceedingly pronounced among clients and contractors.
Furthermore, the closeness of group 2 and 3 shows that besides contractors well-defined risk
responsibilities (group-2) the weight of shared responsibility has more inclination towards
contractors. This situation further augments the fact that contractors is more vulnerable to
risks and has to shoulder a major portion of the responsibilities, this warrant proactive
mitigation plan and if necessary adding financial effect to the project cost. Figure 3 also
highlights some risks giving 100% weight to one group e.g.T-2 (poor designing due to
insufficient data collection and survey). Moreover, the presence of group 4 on the extreme
left and connected through few risk lines clarifies that ambiguity in terms of risks
responsibility does not exist and major stakeholders cannot use it as an excuse. Zou et al.
(2006) and Saaidin et al. (2017) in their study in Australia and Malaysia respectively obtained
similar results. They ascribed construction risks among stakeholders in order of priority as
contractors, clients and designers. Moreover, While comparing their result with the finding of
the current study, it can be opined that regardless of any working environment and
conditions; contractors remains the most vulnerable stakeholder in any construction project.
Hence, they need to follow pro-active approach to mitigate these risk right at the beginning of
the project.
The top construction risks identified in various studies conducted worldwide in regions with
low or no threat of terrorism are improper planning of the projects (Sambasival 2007, Ameh
and Osegbo 2011, Sujka and Jacob 2013), design changes (Kaliba et al, 2009), delay in
progress payment (Assaf & Al-Hejj 2006, Chouadary et al 2012), rework due to poor
workmanship (Apolot et al, 2011) and shortage of construction material (Ameh & Osegbo
2011). Although, the current study also ascertained these risks for schedule delays but their
significance and severity are found to be distinctive for terrorism affected areas. Hence, their
mitigation approach needs to be variant then the normal. Therefore, it is envisaged that
seemingly same risks for peaceful and terrorism affected regions cannot be mitigated with the
same technique.
4.2 Group -1: Client/Consultant’s responsibility for time overrun risks
Figure 4 elaborates the delay risk responsibilities of the client and consultant together. The
depth of the arrow line from each risk node provides significance of that risk towards the
group. The figure also illustrates the distribution of the same risk among other groups, which
indicate that group 3 and group 2 have a certain link in order of priority. To further explain
the results, it has been found that respondents have given 100 % responsibility for the delay
due to inaccurate design to the consultants (see figure 4). The major reason for the inaccurate
design is weak field survey due to security threats which can be overcome by the use of
modern survey technologies. Furthermore, 83% respondents feel that owner is responsible for
schedule overrun due to non-availability of land in time. The client fully cognizant of this
risk has to negotiate proactively with the regional leaders for ensuring timely availability of
the land. It’s a fact that the contractors looses their interest in the project if the payments for
completed work are not given in time. Hence 81% feels that owner and consultant are
responsible for the delay caused due to this factor. Similarly, 76% agree on the fact that the
client and consultant are responsible for the delay in work due to the absence of any reward
for early completion of work and penalty for delaying the work in the contract agreement.
The incentive in terms of the further award of work can be useful to motivate contractors for

511
timely completion of work. 59% respondents believed that high influence of the political
leader in the area forces the client to bear the loss of time due to their interference in the
project progress for their personal/political gains.
Figure 4: Client/Consultant’s responsibility of time overrun risks
4.3 Group -2: Contractor’s responsibility for time overrun risks
As contractors execute work on the ground and are closely netted with various other sub-
stakeholders like sub-contractors, suppliers, fabricators, labors and public, etc. hence the
probability of risk associated with them is also large. The results of this study indicate that
responsibility for most of the risks is associated with contractors. Hence they need to
understand and respond appropriately to mitigate them. Figure 5 shows the relationship of the
associated delay risks to contractors along with the strength and their weights. It further
elaborates comparative association of the risks with other groups besides group-2. In the
survey, 90% respondents believed that contractors are mainly responsible for delay due to
their incapacity to undertake the large-scale construction work, rework due to poor workmen
ship and use of poor construction methods. However, it is believed that this shortcoming can
be improved by hiring skilled manpower while offering extra financial incentives. In
addition, delays due to the suspension of work mainly due to non-availability of construction
material, plant & equipment, and their repair & maintenance facilities can be effectively
controlled by detailed initial planning and preparation of risk mitigation plan. Respondents
also highlighted low productivity due to unskilled workmen ship need to be controlled and
improved by the contractor. These can be amicably improved by grouping unskilled with
skilled manpower and motivating them to learn through on job training practice. 67%
respondents think that lack of detailed survey due to hostile security situation leads to the
unrealistic planning of the project by the contractors which usually surfeit the completion
time of the project. It is believed that the risks identification and their mitigation plan can
improve the situation.

512
Figure 5: Contractor’s responsibility for time overrun risks
4.4 Group -3: Shared responsibility for time overrun risks
Risks which cannot be completely assigned to either client or contractor are placed in group-
3 i.e. shared responsibility. In this group, client and contractor together bear the risk
consequences, hence must plan its mitigation in consultation with each other. The network in
figure 6 reveals closeness between group 2 and 3. Hence this inclination towards contractors
(group-2) necessitates them to shoulder their responsibility actively. This analysis can also
help the contractors to accept the risks and include additional financial effect (if any) in
project cost for its mitigation. The results further highlight that most respondents believed
that delay caused due to unavailability of the necessary services at the site, rework and
suspension of work due to terrorist attack/threat and absence of the support from the local
community are to be shared by owner and contractor equally. As neither client nor contractor
has control of such risks, hence they must share the burden of additional cost due to this
delay. Moreover, proactive negotiations with local leaders and execution of quick impact
projects for the locals can bring dividends in mitigating these risks.
Figure 6: Shared – responsibility for time overrun risks
4.5 Group -4: Undetermined responsibility for time overrun risks
As per the local tribe traditions, customs and rules; only local contractors be employed on the
project to be executed in their area. No foreign contractor (national or international) is
permitted to enter and execute work in their area. Hence, a large group of respondents (75%)
believed that responsibility for the delay caused due to the employment of incompetent and

513
inexperienced contractor on the project could not be given to client or contractor. However,
the network analysis (figure 7) shows a little inclination of responsibility towards the client. It
is important to note that this risk is more pronounced in FATA (Pakistan) and Afghanistan,
(as both enjoys common culture). However, the client needs to take an extra leap and hold an
exhaustive meeting with the regional leaders to convince them on employing experienced
contractors for producing high-quality work, ultimately benefiting them.
Figure-7: Undetermined responsibility of time overrun risks
5. CONCLUSIONS
This study was conducted to establish the responsibility of time overrun risks among various
stakeholders working on highway construction in terrorism affected areas worldwide. As per
global terrorism index (GTI, 2016), Pakistan (FATA) rank fourth among terrorism affected
countries in the world, hence was selected as a research area. Most construction projects
(particularly highways) have experienced schedule delays resulting in additional financial
burden and loss of expected social benefits of these projects. Likewise, besides several
reasons for the delay, it has been found that these projects experience further lag due to
unclear risks responsibility among stakeholders. This ambiguity in responsibilities create
conflicts among stakeholders requiring extra time in their resolution. Hence, this study
attempted to educe the risk responsibilities among major stakeholders i.e. clients, consultants,
and contractors. Four groups were made, which included clients and consultants (Group-1),
contractors (Group-2), shared responsibility between Group 1&2 (Group-3) and risks whose
responsibility could not be specified to above three groups (Group-4). This study found that
96% of the responsibilities could be established among first three groups whereas only 4 %
cannot be assigned to anyone being beyond anyone’s control. It is further added that
contractors are found more exposed to risks as they are working in the field and dealing with
several sub-stakeholders like sub-contractors, labors, suppliers, local population, etc.
Moreover, the risks which cannot be designated to any stakeholder either alone or jointly may
be taken over by the clients. The clarity in the risk responsibilities will allow all the
stakeholders to effectively control and mitigate the project risk through risk mitigation plan.
Thus, reducing the chances of conflicts among stakeholders ensuring improved efficiency
and schedule completion of the project. This study has established risk responsibilities among
stakeholders for time overrun in terrorism affected area in FATA, Pakistan; the same results
can be used for other regions/countries with slight modifications specific to that region.

514
6. ACKNOWLEDGMENT
The work described in this paper was supported by a grant from the Research Grants Council
of the Hong Kong Special Administrative Region, China (PF14-16079).
7. REFERENCES
Afshari, H., Khosravi, S., Ghorbanali, A., Borzabadi, M. and Valipour, M., 2010, December. Identification of
causes of non-excusable delays of construction projects. In International Conference on E-Business
Management and Economics (Vol. 42).
Ahmed, S.M., Azhar, S., Kappagntula, P. and Gollapudil, D., 2003, April. Delays in construction: a brief study
of the Florida construction industry. In Proceedings of the 39th Annual ASC Conference, Clemson
University, Clemson, SC (pp. 257-66).
Aibinu, A.A. and Odeyinka, H.A., 2006. Construction delays and their causative factors in Nigeria. Journal of
construction engineering and management, 132(7), pp.667-677.
Al-Momani, A.H., 2000. Construction delay: a quantitative analysis. International journal of project
management, 18(1), pp.51-59..
Ameh, O.J. and Osegbo, E.E., 2011. Study of the relationship between time overrun and productivity on
construction sites. International Journal of Construction Supply Chain Management, 1(1), pp.56-67..
Apolot, R.E., 2011. Investigation of the causes of delay and cost overrun in construction projects in Uganda’s
public sector (Doctoral Dissertation, Makerere University).
Assaf, S.A. and Al-Hejji, S., 2006. Causes of delay in large construction projects. International journal of
project management, 24(4), pp.349-357.
A Assaf, S.A., Al-Khalil, M. and Al-Hazmi, M., 1995. Causes of delay in large building construction
projects. Journal of management in engineering, 11(2), pp.45-50.
Borgatti, S. P., & Everett, M. G. (1997). Network analysis of 2-mode data. Social networks, 19(3), 243-269.
Battaineh, H. (1999). Information system of progress evaluation of public projects in Jordan (Doctoral
dissertation, Master thesis, Civil Engineering Dept., Jordan Univ. of Science and Technology, Irbid,
Jordan).
Chouhadary, M.R., Nasir, A.R. and Gabriel, H.M., 2012. Cost and time overruns in highway projects in
Pakistan. In Journal of Pakistan Engineering Congress.
CoST, (2011). Construction Sector Transparency Initiative. Briefing Note 5
http://www.constructiontransparency.org/documentdownload.axd?documentresourceid=50 (Accessed:
May 2017).
Doloi, H., Sawhney, A., Iyer, K. C., & Rentala, S. (2012). Analysing factors affecting delays in Indian
construction projects. International Journal of Project Management, 30(4), 479-489
GTI (2016) Global Terrorism Index.,
http://reliefweb.int/sites/reliefweb.int/files/resources/Global%20Terrorism%20Index%202016_0.pdf
(Accessed: February 2017)
Ibironke, O.T., Oladinrin, T.O., Adeniyi, O. and Eboreime, I.V., 2013. Analysis of non-excusable delay factors
influencing contractors' performance in Lagos state, Nigeria. Journal of Construction in Developing
Countries, 18(1), pp.53-72.
Ibrahim, A. R. B., Roy, M. H., Ahmed, Z., & Imtiaz, G., 2010. An investigation of the status of the Malaysian
construction industry. Benchmarking: An International Journal, 17(2), 294-308.
Kaliba, C., Muya, M. and Mumba, K., 2009. Cost escalation and schedule delays in road construction projects in
Zambia. International Journal of Project Management, 27(5), pp.522-531.
Mahamid, I., Bruland, A. and Dmaidi, N., 2011. Causes of delay in road construction projects. Journal of
Management in Engineering, 28(3), pp.300-310.
Mahamid, I. (2011) ‘Risk Matrix for Factors Affecting Time Delay in Road Construction Projects: Owners’
Perspective’, Engineering, Construction and Architectural Management, 8 (6), 609 – 617
Matthews, P, (2016). This is why construction is so corrupt. (World Economic Forum).
https://www.weforum.org/agenda/2016/02/why-is-the-construction-industry-so-corrupt-and-what-can-we-
do-about-it/ (Accessed: May 2017).
Omoregie, A. and Radford, D., 2006, April. Infrastructure delays and cost escalation: Causes and effects in
Nigeria. In Proceeding of Sixth International postgraduate research conference (pp. 79-93).
PIPS, (2015). Pakistan security report 2014. Pak Institute of Peace Studies
http://pakpips.com/securityreport.php (Accessed: November 2016)

515
Saaidin, S., Endut, I. R., Samah, S. A. A., & Ridzuan, A. R. M. (2017). Stakeholder’s Perspective on Risks
Allocation in Design and Build Projects in Malaysia. In MATEC Web of Conferences (Vol. 103, p. 03009).
EDP Sciences.
Sambasivan, M. and Soon, Y.W., 2007. Causes and effects of delays in Malaysian construction
industry. International Journal of project management, 25(5), pp.517-526.
Shahid, I., 2012. The Risk Management building construction project of Pakistan, Master dissertation, National
University of Science and Technology, Pakistan.
Sweis, G., Sweis, R., Hammad, A.A. and Shboul, A., 2008. Delays in construction projects: The case of
Jordan. International Journal of Project Management, 26(6), pp.665-674.
Zafar, I., Yousaf, T. and Ahmed, S., 2016. Evaluation of risk factors causing cost overrun in road projects in
terrorism affected areas Pakistan–a case study. KSCE Journal of Civil Engineering, 20(5), pp.1613-1620.
Zou, P. X., Zhang, G., & Wang, J. Y. (2006, January). Identifying key risks in construction projects: life cycle
and stakeholder perspectives. In Pacific Rim Real Estate Society Conference.
Žujo, V., Car-Pušić, D. and Brkan-Vejzović, A., 2010. Contracted price overrun as contracted construction time
overrun function. Tehnički vjesnik: znanstveno-stručni časopis tehničkih fakulteta Sveučilišta u
Osijeku, 17(1), pp.23-29.

516
ID 059
PERFORMANCE MEASUREMENTAND MANAGEMENT IN
CONSTRUCTION: A CONCEPTUAL FRAMEWORK
S. Sonson, U. Kulatunga and C. Pathirage
School of the Built Environment, University of Salford, Salford, M5 4WT, UK
Email: [email protected]
Abstract: The dynamic and competitive business environment has motivated and compelled
construction firms to implement contemporary performance measurement and management
(PMM) systems and frameworks to generate more comprehensive information on their
performance. The aim of this research is to develop a conceptual framework to better measure
and evaluate the performance of construction firms. The methodology of this research is based
on a comprehensive literature review of PMM in general, and in construction. This research
discusses performance measurement concepts, key PMM frameworks in general use and in
construction, and also presents the salient components of the proposed conceptual framework.
The research findings reveals the relevance of PMM to the construction industry and show
seven generic perspectives that can cover all facets of construction firms’ performance. The
critical success factors and related key performance measures that reflect the circumstances of
construction firms and the industry were also identified for the framework. This research
contributes to the body of knowledge in the area of PMM by proposing a conceptual
framework, and developing an understanding of the need for PMM in construction. This
research is part of ongoing research study being undertaken in Saint Lucia on PMM in
construction.
Key words: critical success factors, construction firm, conceptual framework, performance
measurement and management, performance measures.
1. INTRODUCTION/BACKGROUND
Business organisations in both developed and developing countries are operating in a rapidly
changing and highly competitive business environment which impacts on their strategies and
performance measurement and measurement (PMM) systems/frameworks. Changing
customer demands and advances in technologies are some of the most important
environmental factors in recent years that have impacted on effectiveness of the PMM within
business organisations (Yadav-Sushil and Sagar, 2015). These environmental factors have
caused business organisations to constantly modify or revise their strategies and PMM
systems/frameworks in order to reflect the changing circumstances (Munir and Baird, 2016;
Pekkola et al., 2016). Over the past three decades, the evolution of the business environment
has triggered a PM revolution (Neely, 1999), which has led to a change in three foci as
follows: (1) a shift in focus from traditional PM systems/frameworks relying solely on
financial measures to contemporary performance measurement and management (CPMM)
systems/frameworks using both financial and non-financial measures to assessing business
performance (Behery et al., 2014); (2) a shift in focus from merely measurement and control
towards performance measurement and management for measuring and managing business
performance (Yadav-Sushil and Sagar, 2013); and (3) a move from merely concentrating on
the interest of shareholders to focusing on the interest all stakeholders (Yadav, Sushil and
Sagar, 2013). Consequently, numerous CPMM systems/frameworks such as the Balanced
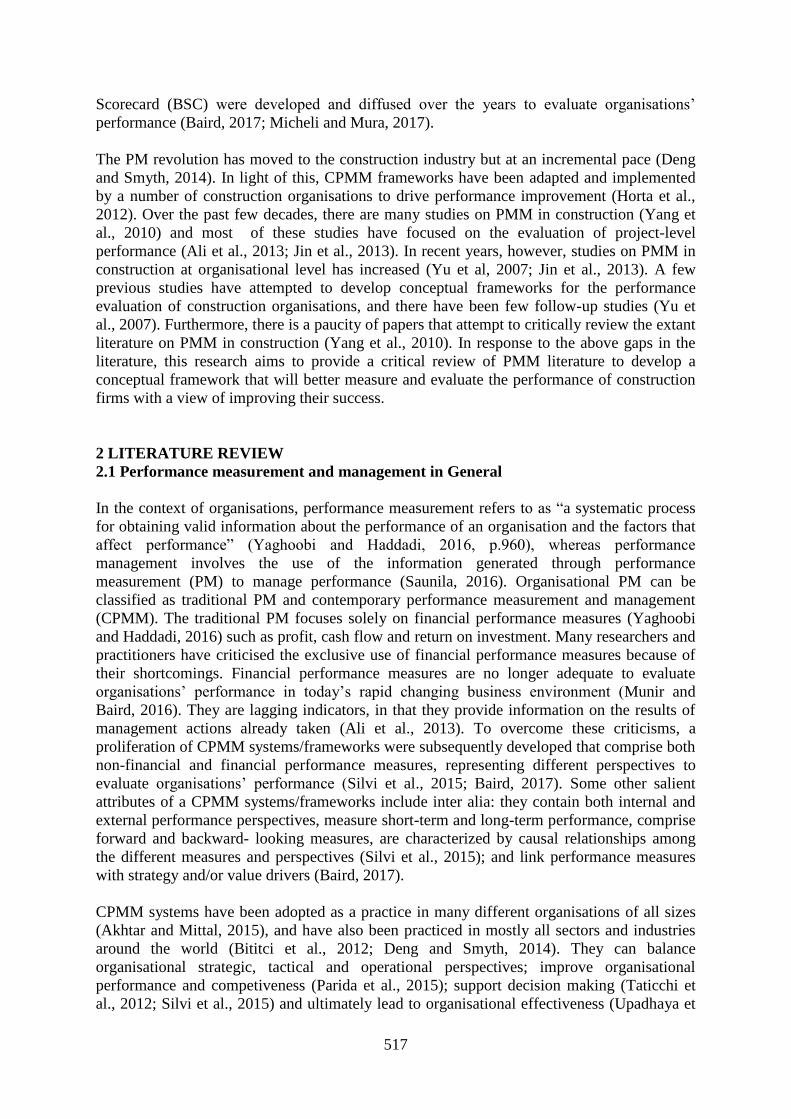
517
Scorecard (BSC) were developed and diffused over the years to evaluate organisations’
performance (Baird, 2017; Micheli and Mura, 2017).
The PM revolution has moved to the construction industry but at an incremental pace (Deng
and Smyth, 2014). In light of this, CPMM frameworks have been adapted and implemented
by a number of construction organisations to drive performance improvement (Horta et al.,
2012). Over the past few decades, there are many studies on PMM in construction (Yang et
al., 2010) and most of these studies have focused on the evaluation of project-level
performance (Ali et al., 2013; Jin et al., 2013). In recent years, however, studies on PMM in
construction at organisational level has increased (Yu et al, 2007; Jin et al., 2013). A few
previous studies have attempted to develop conceptual frameworks for the performance
evaluation of construction organisations, and there have been few follow-up studies (Yu et
al., 2007). Furthermore, there is a paucity of papers that attempt to critically review the extant
literature on PMM in construction (Yang et al., 2010). In response to the above gaps in the
literature, this research aims to provide a critical review of PMM literature to develop a
conceptual framework that will better measure and evaluate the performance of construction
firms with a view of improving their success.
2 LITERATURE REVIEW
2.1 Performance measurement and management in General
In the context of organisations, performance measurement refers to as “a systematic process
for obtaining valid information about the performance of an organisation and the factors that
affect performance” (Yaghoobi and Haddadi, 2016, p.960), whereas performance
management involves the use of the information generated through performance
measurement (PM) to manage performance (Saunila, 2016). Organisational PM can be
classified as traditional PM and contemporary performance measurement and management
(CPMM). The traditional PM focuses solely on financial performance measures (Yaghoobi
and Haddadi, 2016) such as profit, cash flow and return on investment. Many researchers and
practitioners have criticised the exclusive use of financial performance measures because of
their shortcomings. Financial performance measures are no longer adequate to evaluate
organisations’ performance in today’s rapid changing business environment (Munir and
Baird, 2016). They are lagging indicators, in that they provide information on the results of
management actions already taken (Ali et al., 2013). To overcome these criticisms, a
proliferation of CPMM systems/frameworks were subsequently developed that comprise both
non-financial and financial performance measures, representing different perspectives to
evaluate organisations’ performance (Silvi et al., 2015; Baird, 2017). Some other salient
attributes of a CPMM systems/frameworks include inter alia: they contain both internal and
external performance perspectives, measure short-term and long-term performance, comprise
forward and backward- looking measures, are characterized by causal relationships among
the different measures and perspectives (Silvi et al., 2015); and link performance measures
with strategy and/or value drivers (Baird, 2017).
CPMM systems have been adopted as a practice in many different organisations of all sizes
(Akhtar and Mittal, 2015), and have also been practiced in mostly all sectors and industries
around the world (Bititci et al., 2012; Deng and Smyth, 2014). They can balance
organisational strategic, tactical and operational perspectives; improve organisational
performance and competiveness (Parida et al., 2015); support decision making (Taticchi et
al., 2012; Silvi et al., 2015) and ultimately lead to organisational effectiveness (Upadhaya et

518
al., 2014). CPMM systems play an integral part in all the fundamental components of
management practice including strategic management (Jin et al., 2013), for example by
facilitating the execution of strategy (Niven, 2014; Micheli and Mura, 2017); performance
management (Bititci et al., 2012), for instance by influencing people’s behaviour (Yuliansyah
et al., 2017); and risk management for example by identifying and managing key risk factors
in an organisation (Moullin, 2017).
2.2 CPMM frameworks
The literature identifies various key CPMM frameworks that can be adopted by business
organisations (Baird, 2017). The life cycle stages of a new PMM system/framework entails
design, implementation, and use and review (Gutierrez et al., 2015). Some well-known
CPMM frameworks include but are not limited to the Balanced scorecard (Kaplan and
Norton, 1992), Results and Determinants Framework (Fitzgerald et al 1991), Performance
Pyramid (Lynch and Cross, 1991), Performance Prism (Neely et al., 2001); EFQM business
excellence model (EFQM, 2017). Folan and Browne (2005) differentiate between structural
and procedural frameworks. The BSC, which is a structural framework, is now discussed
below.
The BSC has evolved over time (Sigalas 2015), and is the most widely used, universally
accepted PMM framework (Lueg, 2015). Typically, it contains performance measures from
four distinct perspectives, namely, financial, customer, internal business process, and learning
and growth to evaluate an entity’s performance (Sigalas, 2015; Baird, 2017). The BSC can
help organisations to link and align financial and non-financial performance measures with
their strategy (Behery et al., 2014), and thereby monitor their performance in line with their
strategy and vision (Mehralian et al., 2017). Business organisations can use the BSC to
translate their strategic objectives into a coherent set of performance measures and targets
(Moullin, 2017). It enables organisations to link together their performance measures across
the different perspectives through strategy maps, which reflect the cause-and-effect
relationships with the view of meeting their strategic goals (Francioli and Cinquini, 2014;
Perkins et al., 2014). It can also be deployed for organisational decision making (Hoque,
2014), and for management and organisational change (Pimentel and Major, 2014). Lueg
(2015, p.35) suggests that the BSC provides organisations a comprehensive view of their
business model, and helps managers focus on what really matters to the organisations’
business model by using a set of suitable measures.
Despite its popularity and usefulness, the BSC, however, has some limitations that should be
noted if it is to be effectively implemented within organisations. The BSC is claimed to be
mainly a top-down performance management approach (Nørreklit et al., 2012), which limits
the contribution and evolvement of employee in strategy. Some authors (Nørreklit et al.,
2012; Francioli and Cinquini, 2014) argue that the cause-effect relationship between and
within BSC perspectives is overly simplistic, ambiguous, dangerous and are not well
understood, and consequently will mislead management. Also, the four perspectives of the
BSC could ignore some critical stakeholders and aspects of the organisation and its value
chain (Barnabè, 2011), and are based on impressions rather than reasoning (Nørreklit et al.,
2012).

519
2.3 Performance measurement and management (PMM) in construction
Overview of PMM in construction
PMM in the context of construction is typically centred at three different levels, namely:
project, organisation and industry levels (Elyamany et al., 2007; Chan, 2009; Deng et al.,
2012). Previous studies on PMM in construction have focused on evaluating project
performance (Lin and Shen, 2007; Ali et al., 2012). In the last few decades, however, PMM
in construction at the organisation level has received growing attention in the literature (Ali et
al., 2012; Jin et al., 2013). More specifically, there has been a plethora of studies conducted
in construction (e.g. El-Mashaleh et al., 2007; Yu et al., 2007; Bassioni et al., 2008; Luu et
al., 2008; Jin et al., 2013; and among others) that examine the importance of PMM, and the
application of CPMM frameworks to construction organisations in order to measure,
evaluate and manage their performance.
The need for PMM in construction
There is growing recognition of the need for CPMM systems/frameworks within construction
organisations to provide information to meet their strategies and objectives. They can deploy
CPMM frameworks to achieve continuous improvement (Meng and Minogue, 2011; Halman
and Voordijk, 2012), including project management improvement (Haponava and Al-Jibouri,
2012) and improvement in their competitiveness (Oyewobi et al., 2015). According to Yu et
al. (2007), construction organisations can adopt CPMM systems for evaluating management
performance, managing human resources, and formulating corporate strategy (p.131).
Effective CPMM frameworks enable construction firms develop strategies to improve their
competitiveness, support their decision making process, to perform benchmarking (Ali et al.,
2013; Ercan and Koksal, 2016); to achieve profitability and sustainable growth (Horta et al.,
2013); and to capture the interests of all their key stakeholders (Cheng et al., 2014).
Furthermore, CPMM frameworks can improve the budgeting process for construction
projects and organisations (de Azevedo et al., 2013), and can support and improve
collaborative design in construction (Ren et al., 2013).
PMM frameworks in construction
The three main CPMM frameworks that have been proposed, adapted and applied in
construction to measure project, organisational and industrial performance are the balanced
scorecard (BSC) model, key performance indicators (KPIs) model, and European Foundation
for Quality Management (EFQM) excellence model (Yang et al., 2010; Meng and Minogue,
2011; Oyewobi et al., 2015. In addition to EFQM model, the Malcolm Baldrige National
Quality Award (MBNQA) is another business excellence model, which is based on the seven
criteria (i.e. leadership, strategy, customers, measurement, analysis, and knowledge
management; workforce; operations; and results), that has been widely applied in
construction in the USA and many other countries to evaluate performance (Oyewobi et al.,
2015; NIST, 2017).
Yu et al. (2007) propose the adoption of the original BSC to evaluate the performance of
construction companies and Chan (2009) considers and applies the original BSC to evaluate
the performance of the construction industry. Jin et al. (2013) and Halman and Voordijk
(2012) propose the use of a modified BSC for performance evaluation of organisations.

520
Following the Egan's (1998) Rethinking Construction Report, Constructing Excellence plays
a central role in the UK construction industry PMM by continually developing and annually
publishing the main sets of industry Key Performance Indicators (KPIs) covering the three
aspects of sustainability – economic, social and environment performance of firms and
projects (Constructing Excellence, 2016). Examples of economic KPIs include client
satisfaction, contractor satisfaction, and productivity; social (people) KPIs include staff
turnover rate, sickness absence, and training; and environment KPIs include energy use,
mains water use, and waste (Constructing Excellence, 2016). The KPIs allow firms to
measure and benchmark their performance as well as their project performance (Constructing
Excellence, 2009; Haponava and Al-Jibouri, 2012).
Meanwhile, the EFQM Excellence Model can be used for “enabling an organisation to gain a
holistic overview of their current level of excellence and prioritise their improvement efforts
to maximise their impact” (EFQM, 2017, p.7). This Model uses nine criteria of performance.
Five of these criteria are ‘enablers’ which measure what an organisation does and how it does
it, and four criteria are ‘results’ measuring what an organisation achieves (EFQM, 2017).
Leadership, people, strategy, partnerships and resources, and processes, products and services
are the five ‘enablers’ criteria; while people results, customers results, society results and
business results are four ‘results’ criteria of the Model (EFQM, 2017). An EFQM based
model was proposed by Mohamed and Chinda (2011), and Shanmugapriya and Subramanian
(2016) to evaluate the safety practices and safety performance improvement in construction
organisations.
3 RESEARCH METHODOLOGY
The aim of this research, which is part of a larger research, is to develop a conceptual
framework for evaluating the performance of construction firms. A comprehensive literature
review was conducted to investigate PMM in general and in construction to inform the
development of the conceptual framework. This research articulates and discusses the key
components of the framework including the perspectives, critical success factors and
performance measures that are applicable to construction organisations. Construction firms
were selection in this research because they play a pivotal role in the national and global
economy. Bassioni et al. (2004) refer to construction firms as “firms that undertake
construction of civil or building facilities and can include a design function” (p.42). In this
research, construction firms are entities that undertake the construction of civil and/or
building works, and construction related services. The literature review provides information
on well-established CPMM frameworks such as the BSC that are used to measure and
evaluate the performance of organisations, in particular construction organisations. The
proposed conceptual framework is based on BSC because it is found to improve
organisational performance and climate (Molina et al., 2016) and it is the most widely used
and diffused PMM framework (Lueg, 2015), which is now discussed below.
4 DEVELOPMENT A CONCEPTUAL FRAMEWORK
The proposed conceptual framework in this research is shown in figure 1. CPMM
frameworks such as the BSC should help organisations capture the interests of their key
stakeholders. Accordingly, the proposed conceptual framework considers the needs of
shareholders as well as other relevant stakeholders in the construction industry such as
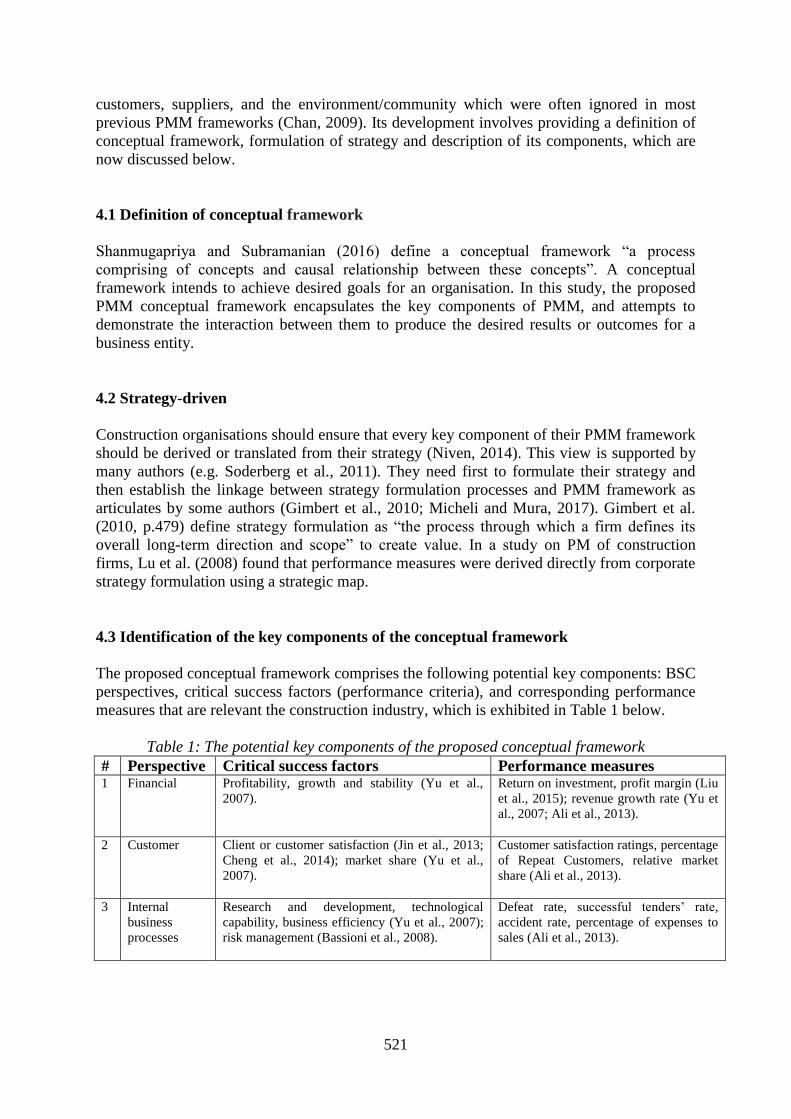
521
customers, suppliers, and the environment/community which were often ignored in most
previous PMM frameworks (Chan, 2009). Its development involves providing a definition of
conceptual framework, formulation of strategy and description of its components, which are
now discussed below.
4.1 Definition of conceptual framework
Shanmugapriya and Subramanian (2016) define a conceptual framework “a process
comprising of concepts and causal relationship between these concepts”. A conceptual
framework intends to achieve desired goals for an organisation. In this study, the proposed
PMM conceptual framework encapsulates the key components of PMM, and attempts to
demonstrate the interaction between them to produce the desired results or outcomes for a
business entity.
4.2 Strategy-driven
Construction organisations should ensure that every key component of their PMM framework
should be derived or translated from their strategy (Niven, 2014). This view is supported by
many authors (e.g. Soderberg et al., 2011). They need first to formulate their strategy and
then establish the linkage between strategy formulation processes and PMM framework as
articulates by some authors (Gimbert et al., 2010; Micheli and Mura, 2017). Gimbert et al.
(2010, p.479) define strategy formulation as “the process through which a firm defines its
overall long-term direction and scope” to create value. In a study on PM of construction
firms, Lu et al. (2008) found that performance measures were derived directly from corporate
strategy formulation using a strategic map.
4.3 Identification of the key components of the conceptual framework
The proposed conceptual framework comprises the following potential key components: BSC
perspectives, critical success factors (performance criteria), and corresponding performance
measures that are relevant the construction industry, which is exhibited in Table 1 below.
Table 1: The potential key components of the proposed conceptual framework
# Perspective Critical success factors Performance measures 1 Financial Profitability, growth and stability (Yu et al.,
2007).
Return on investment, profit margin (Liu
et al., 2015); revenue growth rate (Yu et
al., 2007; Ali et al., 2013).
2 Customer
Client or customer satisfaction (Jin et al., 2013;
Cheng et al., 2014); market share (Yu et al.,
2007).
Customer satisfaction ratings, percentage
of Repeat Customers, relative market
share (Ali et al., 2013).
3
Internal
business
processes
Research and development, technological
capability, business efficiency (Yu et al., 2007);
risk management (Bassioni et al., 2008).
Defeat rate, successful tenders’ rate,
accident rate, percentage of expenses to
sales (Ali et al., 2013).

522
4
Learning and
growth
Organisational competency (Yu et al., 2007);
employee development, and technology
competency (Luu et al., 2008).
Employee productivity (Yu et al., 2007);
Employee satisfaction survey (Jin et al.,
2013); investment in IT for construction
(Luu et al., 2008).
5 Supplier Supplier management (Bassioni et al., 2008).
Materials return rate, supplier on-time
delivery, quality of purchased goods
(Halman and Voordijk, 2012).
6 Project
Project management (Cserháti and Szabó, 2014).
Safety, cost, time, quality, client’s
satisfaction (Yeung et al., 2013).
7 Environment
& community
Sustainability (Jin et al., 2013).
Energy and water consumption; waste
and scrap level, contribution to the
community (Parmenter, 2015).
The following sub-sections describe the key components of the proposed conceptual
framework.
Step 1: identification of perspectives
It is imperative for construction organisations to identify their performance perspectives that
represent a comprehensive coverage of all pertinent aspects of their business model. Some
authors have proposed the use of the original perspectives of BSC to evaluate the
performance of construction organisations (Yu et al., 2007). However, Lueg (2015) suggests
that the original BSC ignores developments in the industry-specific, social and natural
environments (p.37). Accordingly, some other authors have added relevant perspectives to
the original perspectives of the BSC to evaluate the performance of construction
organisations (Jin et al., 2013; Ali et al., 2013) or have replace existing perspectives of
original BSC with new ones (Ozorhon et al., 2011). The conceptual framework proposed in
this research includes three additional performance perspectives to the four original
perspectives of the BSC namely project perspective (Kagioglou et al. 2001); supplier
perspective (Kagioglou et al. 2001); and environment & community perspective (Parmenter,
2015; Björklund and Forslund, 2013) to reflect the distinct characteristics of the construction
industry. The proposed conceptual framework therefore attempts to include the triple bottom
line aspects of sustainability, namely economic, social and environmental performance
(Yadav-Sushil and Sagar, 2013). The seven potential interrelated performance perspectives
are now briefly discussed.
(1) Financial perspective: The financial perspective focuses on providing more value to the
shareholders of construction organisations in terms of improvements in the bottom line
results (Chan, 2009). Construction organisations can use this perspective to demonstrate their
financial accountability and stewardship through the production and validation of financial
statements.
(2) Customer perspective: PMM in construction is usually client-driven. Therefore the
customer perspective is critical for construction organisations to assess their customers’
requirements (Oyewobi et al., 2015) and hence increase customer value, which can lead to
close customer relationships and high-quality in their operations (Jin et al., 2013).

523
(3) Internal business processes: This perspective requires construction organisations to
place emphasis on integrating and improving the internal efficiency of their business
processes to achieve excellence (Ali et al., 2013; Jin et al., 2013).
(4) Learning and Growth: This perspective requires construction organisations to invest in
their human resources development, their competency, and informatization (Yu et al., 2007),
in order to manage their business and improve their performance and ability to adapt to
change (Perkins et al., 2014).
(5) Project perspective: The construction industry is mainly project based (Ozorhon et al.,
2011; Keung and Shen, 2013). Therefore, this perspective requires construction organisations
to drive focus on evaluating the successfully achievement of project performance. Project
performance is the realization of predefined project objectives (Ozorhon et al., 2011) and
hence project success.
(6) Supplier perspective: The supplier perspective requires construction organisations to
evaluate and monitor suppliers’ performance in term of service quality and speed of service
delivery, flexibility, and the relationships and partnerships with them.
(7) Environment & Community perspective: The importance of environmental and
community perspective and its corresponding measures within CPMM frameworks is
growing (Björklund and Forslund, 2013) in order to manage the environmental impact on
organisational activities. These authors further suggest that an improvement in
community/environmental performance will increase the focus on customers and suppliers,
and it is an important source of competitive advantage for organisations.
Step 2: identification of CSFs and performance measures
Some construction researchers (Kulatunga et al., 2011; Cheng et al., 2014) have underscored
the importance of identifying organisational critical success factors (CSFs) that are aligned
with each perspective within the CPMM framework. CSFs are a number of important factors
on which organisations should direct and concentrate their limited resources in order to
achieve success (Yong and Mustaffa, 2013). Construction organisations also need to identify
an appropriate set of performance measures and associated targets for each of the identified
CSFs (Toor and Ogunlana, 2010; Parmenter, 2015) to monitor the achievement of their
mission, strategy, goals and objectives. The proposed conceptual framework uses both
financial and non-financial measures of performance to reflect the holistic coverage of an
organisation’s business model.
Step 3: definition of a framework review procedure
A PMM framework should also include a procedure for review or assessment (Taticchi et al.,
2012). The review process should be conducted to ensure that its relevance to organisational
strategy and the business environment, for continuous improvement and for questioning
strategic assumptions and actions, and hence could improve its effectiveness (Gutierrez et al.,
2015). Moreover, the results of the review process can be used to refine the key components
of, or the entire PMM framework (Gutierrez et al., 2015) to meet key stakeholders’
expectations.

524
Step 4: diagrammatical representation of the conceptual framework
Figure 1 exhibits the initial conceptual PMM framework for evaluating the performance of
construction firms. This initial proposed conceptual framework, called the Holistic Business
Scorecard (HBS), focuses on specifying the key components required for evaluating the
performance of construction organisations, which are also link to strategy formulation. It
includes a component to perform review procedures that will ensure its relevance to strategy
and the changing business environment as suggested by Gutierrez et al. (2015). It is
important to note that the presented conceptual BSC framework is developed only from the
literature. Primary data are currently being collected from a questionnaire survey amongst
industry practitioners, and detailed case studies including semi-structured interviews with
practitioners within case study firms in Saint Lucia to empirically test and further develop the
conceptual framework. Furthermore, the proposed BSC conceptual framework will be
validated with some semi-structured interviews with practitioners in the construction
industry. Consequently, the conceptual framework will undergo revisions or refinements after
gathering and analysing the data from the empirical investigation stage of the research. The
conceptual BSC framework will provide a structured way for construction firms to better
measure and evaluate their performance, and assess the contribution of key stakeholders.
Consistent with prior studies (Ali et al., 2013; Ercan and Koksal, 2016), the conceptual
framework can facilitate benchmarking of performance within each construction
organisation, and among the organisations in the construction industry. Furthermore, it has
the potential to be tailored to different organisational needs and contexts.
Holistic Business Scorecard (HBS)
Strategy formulation: Organisational vision & mission; goals and objectives; strategies & policies
Performance perspective Critical Success
Factors
Performance
measures Financial perspective
Customer perspective
Internal business process perspective
Learning & growth perspective
Supplier perspective
Project perspective
Environment & community perspective
Ongoing& periodic Review
Data/information and analysis
Figure 1: Proposed conception framework
5. CONCLUSION
This research comprehensively reviews the current literature on performance measurement
and management (PMM) in general and in construction. In particular, this research presents
an understanding of the need for PMM in construction, and concludes that the major PMM
frameworks adopted in construction for evaluating performance include BSC, KPI, EFQM
excellence model, and MBNQA. By using the BSC, in particular, construction firms can
achieve performance improvement, determine and successfully execute their strategies, and

525
compare their performance to others in the industry by using benchmarking. In this research,
a PMM framework based on the theoretical underpinnings of the BSC has been
conceptualized for construction firms to better measure and evaluate their performance.
Using the literature review, seven perspectives with associated critical success factors and
performance measures that are applicable to the construction industry are identified for the
proposed conceptual framework. In particular, the identified core components of the
proposed BSC framework are capable of capturing the performance of the key business areas
of construction firms. Ongoing research is currently being undertaken in the construction
industry in Saint Lucia to empirically test the proposed BSC conceptual framework using
questionnaire surveys and case studies, and then validate it with some semi-structured
interviews. Finally, the findings from this research provide preliminary insight on the
development and synthesis process of the conceptual BSC framework for the performance
evaluation of construction firms.
6. REFRENCES
Akhtar, M. and Mittal, R.K. (2015), Implementation issues and their impact on strategic performance
management system effectiveness – an empirical study of Indian oil industry, Measuring Business
Excellence, 19(2), 71 – 82.
Almahmoud, E.S., Doloi, H.K. and Panuwatwanich, K. (2012), Linking project health to project performance
indicators: multiple case studies of construction projects in Saudi Arabia, International Journal of Project
Management, 30(3), 296-307.
Baird, K. (2017), The effectiveness of strategic performance measurement systems, International Journal of
Productivity & Performance Management, 66(1), 3-21.
Barnabè, F. (2011), A system dynamics‐based Balanced Scorecard to support strategic decision making:
Insights from a case study, International Journal of Productivity & Performance Management, 60(5), 446-
473.
Bassioni, H.A., Price, A.D.F., and Hassan, T.M. (2004), Performance measurement in construction, Journal of
Management in Engineering, 20(2), 42–50.
Bassioni, H.A., Hassan, T.M., and Price, A.D.F. (2008), Evaluation and analysis of criteria and sub-criteria of a
construction excellence model, Engineering, Construction & Architectural Management, 15(1), 21– 41.
Behery, M., Jabeen, F. and Parakandi, M. (2014), Adopting a contemporary performance management system,
International Journal of Productivity & Performance Management, 63(1), 22 – 43.
Bititci, U., Garengo, P., Dörfler, V. and Sai Nudurupati, S. (2012), Performance Measurement: Challenges for
Tomorrow, International Journal of Management Reviews, 14(3), 305–327.
Björklund, M. and Forslund, H. (2013), The purpose and focus of environmental performance measurement
systems in logistics, International Journal of Productivity & Performance Management, 62(3), 230 – 249.
Chan, T.K. (2009), Measuring performance of the Malaysian construction industry, Construction Management
& Economics, 27(12), 1231-1244.
Cheng, L., Wen, D and Hong-Chang Jiang, H. (2014), The performance excellence model in construction
enterprises: an application study with modelling and analysis, Construction Management & Economics,
32(11), 1078-1092.
Constructing Excellence (2009), Constructing Excellence in partnership with Department of Business Enterprise
and Regulatory Reform, UK Industry Performance Report 2009. London. Retrieved on May 18, 2007, from
http://constructingexcellence.org.uk/wp-content/uploads/2014/10/Industry_Performance_Report_2009.pdf
Constructing Excellence (2016), Constructing Excellence in partnership with Department for Business,
Innovation and Skills, Glenigan, and CITB, UK Industry Performance Report 2016, London. Retrieved on
May 18, 2017, from http://constructingexcellence.org.uk/kpi-reports/
Cserháti, G. and Szabó, L. (2014), The relationship between success criteria and success factors in
organisational event projects, International Journal of Project Management, 32(4), 613–624.
Deng, F., Smyth H.J. and Anvuur A.M. (2012), A critical review of PMS in construction: Towards a research
agenda, Paper presented in the 28th Annual ARCOM Conference, Association of Researchers in
Construction Management, 3-5 September 2012, Edinburgh, UK, , 807-816.
Deng, F. and Smyth, H. (2014), Nature of Firm Performance in Construction, Journal of Construction
Engineering & Management, 140(2), 04013040-14.

526
European Foundation for Quality Management [EFQM] (2017), An overview of the EFQM excellence model,
Brussels: EFQM. Retrieved on May 18, 2017 from http://www.efqm.org
Egan, J. (1998), Rethinking construction: Construction Task Force report for Department of the Environment,
Transport and the Regions, London: Her Majesty’s Stationery Office.
El-Mashaleh, M.S., Minchin, R.E. Jr., and O’Brien, W. J. (2007), Management of construction firm
performance using benchmarking, Journal of Management in Engineering, 23(1), 10–17.
Elyamany, A., Basha, I. and Zayed, T. (2007), Performance Evaluating Model for Construction Companies:
Egyptian Case Study, Journal of Construction Engineering & Management, 133(8), 574-581.
Ercan, T. and Koksal, A. (2016), Competitive Strategic Performance Benchmarking (CSPB) Model for
International Construction Companies, KSCE Journal of Civil Engineering, 20(5), 1657-1668.
Fitzgerald, L., Johnson, R., Brignall, S., Silvestro, R. and Vos, C. (1991), Performance Measurement in Service
Businesses, London: The Chartered Institute of Management Accountants.
Folan, P. and Browne, J. (2005), A review of performance measurement: Towards performance management,
Computers in Industry, 56(7), 663–680.
Francioli, F. and Cinquini, L. (2014), Exploring the blurred nature of strategic linkages across the BSC: The
relevance of “loose” causal relationships, Journal of Accounting & Organizational Change, 10(4), 486-515.
Gimbert, X., Bisbe, J. and Mendoza, X. (2010), The role of performance measurement systems in strategy
formulation processes, Long Range Planning, 43(4), 477-497.
Gutierrez, D.M., Scavarda, L.F., Fiorencio, L. and Martins, R.A. (2015). Evolution of the performance
measurement system in the Logistics Department of a broadcasting company: An action research,
International Journal of Production Economics, 160, 1–12.
Halman, J.I.M and Voordijk, J.T. (2012), Balanced Framework for Measuring Performance of Supply Chains in
House Building, Journal of Construction Engineering & Management, 138(12), 1444-1450.
Haponava, T. and Al-Jibouri, S. (2012), Proposed System for Measuring Project Performance Using Process-
Based Key Performance Indicators, Journal of Management in Engineering, 28(2), 140-149.
Hoque, Z. (2014), 20 years of studies on the balanced scorecard: Trends, accomplishments, gaps and
opportunities for future research, The British Accounting Review, 46(1), 33-59.
Horta, I., Camanho, A. & Moreira da Costa, J. (2012), Performance assessment of construction companies: A
study of factors promoting financial soundness and innovation in the industry, International Journal of
Production Economics, 137(1), 84–93.
Horta, I.M., Camanho, A.S., Johnes, J. and Johnes, G. (2013), Performance trends in the construction industry
worldwide: an overview of the turn of the century, Journal of Productivity Analysis, 39(1), 89–99
Jin, Z., Deng, F., Li, H. and Skitmore, M. (2013), Practical Framework for Measuring Performance of
International Construction Firms, Journal of Construction Engineering & Management, 139(9), 1154-1167.
Kagioglou, M., Cooper, R. and Aouad, G. (2001), Performance management in construction: a conceptual
model, Construction Management and Economics, 19(1), 85-95.
Kaplan, R.S. and D.P. Norton (1992), The Balanced Scorecard: Measures that Drive Performance, Harvard
Business Review, and (January-February), 71-79.
Keung, C.C.W. and Shen, L. (2013), Measuring the Networking Performance for Contractors in Practicing
Construction Management, Journal of Management in Engineering, 29(4), 400-406.
Kulatunga, U., Amaratunga, D. and Haigh, R. (2011), Structured approach to measure performance in
construction research and development: Performance measurement system development, International
Journal of Productivity & Performance Management, 60(3), 289 – 310.
Lin, G. and Shen, Q. (2007), Measuring the Performance of Value Management Studies in Construction:
Critical Review, Journal of Management in Engineering, 23(1), 2-9.
Lueg, R. (2015), Strategy maps: the essential link between the balanced scorecard and action, Journal of
Business Strategy, 36(2), 34 – 40.
Luu, T., Kim, S., Cao, H. and Park, Y. (2008), Performance measurement of construction firms in developing
countries, Construction Management & Economics, 26(4), 373-386.
Lynch, R.L., & Cross, K.F. (1991), Measure Up! Yardsticks for Continuous Improvement, Oxford: Basil
Blackwell.
Mehralian, G., Nazari, J. A., Nooriparto, G. and Rasekh, H. R. (2017), TQM and organizational performance
using the balanced scorecard approach, International Journal of Productivity & Performance Management,
66(1), 111-125.
Meng, X. and Minogue, M. (2011), Performance measurement models in facility management: a comparative
study, Facilities, 29(11/12), 472-484.
Micheli, P. and Mura, M. (2017), Executing strategy through comprehensive performance measurement
systems, International Journal of Operations & Production Management, 37(4), 423-443.
Mohamed, S. and Chinda, T. (2011), System dynamics modelling of construction safety culture, Engineering,
Construction & Architectural Management, 18(3), 266 – 281.

527
Molina, M.Á.C., Florencio, B. P., González, J.M.H. & González, J.L.G. (2016), Implementing the balanced
scorecard: its effect on the job environment, Total Quality Management & Business Excellence, 27(1-2),
81-96.
Moullin, M. (2017), Improving and evaluating performance with the Public Sector Scorecard, International
Journal of Productivity & Performance Management, 66(4), 442-458.
Munir, R. and Baird, K. (2016), Influence of institutional pressures on performance measurement systems,
Journal of Accounting & Organizational Change, 12(2), 106 – 128.
National Institute of Standards & Technology (NIST, 2017), Baldrige Excellence Builder: Key questions for
improving your organization’s performance, Retrieved on July 14, 2017, from www.nist.gov/baldrige
Neely, A. (1999), The Performance Measurement Revolution: Why Now and What Next?, International
Journal of Operations & Production Management, 19(2), 205–228.
Neely, A., Adams, C., and Crowe, P. (2001), The performance prism in practice. Measuring Business
Excellence, 5(2), 6-12.
Niven, P.R. (2014), Balanced Scorecard Evolution: A Dynamic Approach to Strategy Execution, New Jersey:
John Wiley & Sons, Inc.
Nørreklit, H., Nørreklit, L., Mitchell, F and Bjørnenak, T. (2012), The rise of the balanced scorecard! Relevance
regained?, Journal of Accounting & Organizational Change, 8(4), 490-510.
Oyewobi, L.O., Windapo, A.O. and Rotimi, J.O.B. (2015), Measuring strategic performance in construction
companies: a proposed integrated model, Journal of Facilities Management, 13(2), 109 – 132.
Ozorhon, B., Arditi, D., Dikmen, I., and Birgonul, M. T. (2011), Toward a Multidimensional Performance
Measure for International Joint Ventures in Construction, Journal of Construction Engineering &
Management, 137(6), 403-411.
Parida, A., Kumar, U., Galar, D. and Stenström, C. (2015), Performance measurement and management for
maintenance: a literature review, Journal of Quality in Maintenance Engineering, 21(1), 2 – 33.
Parmenter, D. (2015), Key Performance Indicators Developing, Implementing, and Using Winning KPIs (3th
Ed.), New Jersey: John Wiley & Sons.
Pekkola, S., Saunila, M. and Rantanen, H. (2016), Performance measurement system implementation in a
turbulent operating environment, International Journal of Productivity & Performance Management, 65(7),
947-958. Perkins, M., Grey, A. and Remmers, H. (2014), What do we really mean by “Balanced Scorecard”?,
International Journal of Productivity & Performance Management, 63(2), 148 – 169.
Pimentel, L. and Major, M. J. (2014), Quality management and a balanced scorecard as supporting frameworks
for a new management model and organisational change, Total Quality Management & Business
Excellence, 25, 7-8.
Ren, Z., Anumba, C.J. and Yang, F. (2013), Development of CDPM matrix for the measurement of
collaborative design performance in construction, Automation in Construction, 32, 14 – 23.
Saunila, M. (2016), Performance measurement approach for innovation capability in SMEs. International
Journal of Productivity & Performance Management, 65(2), 162-176.
Shanmugapriya, S. and Subramanian, K. (2016), Developing a PLS Path Model to Investigate the Factors
Influencing Safety Performance Improvement in Construction Organizations, KSCE Journal of Civil
Engineering, 20(4),1138-1150.
Sigalas, C. (2015), Empirical investigation of balanced scorecard’s theoretical underpinnings, Journal of
Accounting & Organizational Change, 11(4), 546 – 572.
Silvi, R., Bartolini, M., Raffoni, A. Visani, F. (2015), The practice of strategic performance measurement
systems, International Journal of Productivity & Performance Management, 64(2), 194 – 227.
Soderberg, M., Kalagnanam, S., Sheehan, N.T. and Vaidyanathan, G. (2011), When is a balanced scorecard a
balanced scorecard?, International Journal of Productivity & Performance Management, 60(7), 688-708.
Taticchi, P., Balachandran, K. and Tonelli, F. (2012), Performance measurement and management systems:
state of the art, guidelines for design and challenges, Measuring Business Excellence, 16(2), 41- 54.
Toor, S.R. and Ogunlana, S.O. (2010), Beyond the ‘iron triangle’: Stakeholders perception of key performance
indicators (KPIs) for large-scale public sector development projects, International Journal of Project
Management, 28(3), 228-236.
Upadhaya, B. Munir, R. and Blount, Y. (2014), Association between performance measurement systems and
organisational effectiveness, International Journal of Operations & Production Management, 34(7), 853 –
875.
Yadav- Sushil, N. and Sagar, M. (2013), Performance measurement and management frameworks, Business
Process Management Journal, 19(6), 947 – 971.
Yadav-Sushil, N. and Sagar, M. (2015), Modeling strategic performance management of automobile
manufacturing enterprises, Journal of Modelling in Management, 10(2), 198 – 225.

528
Yaghoobi, T. and Haddadi, F. (2016), Organizational performance measurement by a framework integrating
BSC and AHP, International Journal of Productivity & Performance Management, 65(7), 959-976.
Yang, H., Yeung, J.F.Y., Chan, A.P.C., Chiang, Y.H. and Chan, D.W.M. (2010), A critical review of
performance measurement in construction. Journal of Facilities Management, 8(4), 269-284.
Yeung, J. F.Y., Chan, A. P. C., Chan, D. W.M., Chiang, Y. H. and Yang, H. (2013), Developing a
Benchmarking Model for Construction Projects in Hong Kong, Journal of Construction Engineering &
Management, 139(6), 705-716.
Yong, Y.C. and Mustaffa, N.E. (2013), Critical success factors for Malaysian construction projects: an empirical
assessment, Construction Management & Economics, 31(9), 959-978.
Yu, I., Kim, K., Jung, Y., and Chin, S. (2007), Comparable performance measurement system for construction
companies, Journal of Management in Engineering, 23(3), 131–139.
Yuliansyah, Y., Gurd, B. and Mohamed, N. (2017), The significant of business strategy in improving
organizational performance, Humanomics, 33(1), 56-74.

529
ID 060
ASSESSING THE SAFETY CLIMATE IN GHANA’S UPSTREAM OIL
AND GAS SECTOR
F. Horbah, C. Pathirage and U. Kulatunga
School of the Built Environment, University of Salford, Salford, M5 4WT, UK
Email: [email protected]
Abstract: Oil and Gas industry reported that the industry has highly hazardous environments,
with multiple technological, human and environmental challenges which have potentially
severe consequences to workers’ lives, asserts loss, environmental pollutions and disruption of
security of energy supply. The use of safety climate measures to assess safety performance in
an organisation is considered as a proactive or predictive approach to safety management.
There are insufficient empirical studies on the establishment of current safety performance in
Ghana’s upstream oil and gas operations. This paper seeks to assess the current safety climate
predictive influences on major accident risks in Ghana’s upstream oil and gas sector. Safety
climate survey questionnaires made up of 60 items in 14 constructs were used to assess the
current employees’ safety perceptions. 212 responses from upstream oil and gas workers were
received and analyzed. The results show that safety priority and supportive environment were
found to have high predictive influence on major accident risks. In addition, safety
supervision, management of change, equipment maintenance and management commitment
indicate predictive influence on major accident risks. The findings of this study provide
valuable guidance for researchers and industrial practioners to identify mechanisms by which
they can improve existing safety at the work environment.
Keywords: safety climate, safety indicator, safety management, safety performance, upstream
oil and gas operations.
1. INTRODUCTION
There have been many researches indicating an increasing trend of industrial work- related
injuries, fatalities and asserts losses at the various workplaces in Ghana (e.g. Ayarkwa et al.,
2010; Norman et al., 2015; Bayire, 2016). The economic cost of industrial accidents in the
country is estimated to be $16 million annually (Norman et al. 2015). Ghana’s oil and gas
industry is one of these industries recently experiencing work-related fatalities, injuries and
asserts loss (Ocloo, 2017; Tetteh, 2017). Studies (e.g. Amorin 2013; Hystad et al. 2014) have
found that workers in this safety critical industry operate in highly hazardous environments,
with multiple technological, human and environmental challenges which have potential
severe consequences to workers’ lives, asserts loss and environmental pollutions.
Safety climate is the shared perceptions of the employees on safety policies, procedures and
practices at the work environment (Zohar, 2003; Brondino et al., 2012). Safety climate has
been found as a robust predictor of organisational safety performance (Cooper & Phillips,
2004; Andreas et al., 2016; Griffin & Curcuruto, 2016; Huang et al. 2017). However, there
are limited studies that have investigated the relationship between safety climate and major
accident in the oil and gas industry. Existing studies are characterised with poor investigation
of such relationship. There is confusion between the terms ‘conditions’ and ‘causes’ of
accident in the literature. It can be argued that safety climate best measures conditions
(indirect indicators) contributing to accidents and not causes (direct indicators) of accident.

530
Safety climate serves as a leading indicator for major accident risk. There are limited
empirical studies on prevailing conditions that could contribute to major accident risks in
Ghana’s upstream oil and gas sector.
The purpose of this paper is to assess the current safety climate constructs that could predict
major accidents risks in Ghana’s upstream oil and gas sector. Ghana’s upstream oil and gas
sector (exploration and production sector) strategically contributes to the country’s energy
needs and assert of high value to its local economy. There is the need to know and understand
the prevailing human and organisational conditions that could provide ‘early warning’ of
potential safety system failures in the industry. Exposing these conditions would help
managers to put corrective measures in place to avoid possible future major incidents in the
Ghana oil and gas industry. Overall, this study contributes to the development of safety
climate as a leading major accident risk indicator.
The paper is organised as follows: the next section reviews safety climate as a leading major
safety indicator; the third section presents the methodology of the study, the fourth section
presents the results and analysis of the study, and finally concludes in the fifth section.
2. SAFETY CLIMATE AND MAJOR ACCIDENTS IN THE OIL AND GAS
INDUSTRY
Most major accident investigative reports in the oil and gas industry (e.g. Cullen, 1990;
Baker, 2007; CSB, 2014) and scientific studies on analysis of hydrocarbon leaks (e.g. Sklet,
2006; 2010; Vinnem et al, 2007a; Okstad et al. 2009; Haugen et al, 2010) have indicated that
human and organisational factors are the main important causal factors. Various studies have
established that culture is the main driver and predictor of shaping organisational safety
performance (Flin et al., 2000). However, given the conceptual challenges of measuring
safety culture (Guldenmund, 2000; 2007; Glenton & Stantan, 2000), most studies have used
the term safety climate to describe the tangible outputs or indicators of an organization’s
safety culture. Safety climate’ has been established in the literature as an indicator that
predicts organisational safety performance. However, many of the existing safety climate
assessment relating to the high-risk industries focus on personal safety indicators which have
limited scope to capture proactive indicators of major accident risk factors.
2.1 Organizational Climate
Organisational climate is defined as the workers’ perception of work environment events and
the expectations that the organisation has of workplace behaviour, attitudes, and norms
(Ostroff et al., 2003). According to Schneider (1990), organisation climate is made up of
shared perceptions among employees regarding the procedures, practices and the kind of
behaviour that is rewarded and supported relating to the specific environment in question.
From these definitions, the key attribute of organisational climate is the shared employees’
perceptions regarding the work environment. Zohar (2000) argues that this attribute emerges
as a group-level property which actually develops from individual members’ experiences and
perceptions of the work environment and progressively become socially shared. According to
Schneider (1975), organisational climate arises through individual perceptions of order in the
workplace and also through the creation of new order by inferring from what is perceived. It
is a multidimensional construct that is made up of individual evaluation of the work

531
environment. Organisational climate provides the context in which specific individual
evaluation of the value of safety are made (Neal et al., 2000). This implies that organisational
climate can predict specific safety climate.
2.2 Safety Climate
The original paper defines safety climate as “shared employee perceptions about the relative
importance of safe conduct in their occupational behavior” (Zohar, 1980: p.96). Other
researchers view it as a specific facet of social climate in organizations regarding perceptions
of the priority of policies, procedures and practices relating to safety (Flin et al., 2000; Zohar,
2000; Zohar and Luria, 2005). Payne et al. (2010) defines policies as “the organizational
goals and means for goal attainment, while procedures provide tactical guidelines for actions
relating to these goals”. And practices refer to the “implementation of policies and
procedures by managers within each workgroup” (p.806). From these definitions of safety
climate, the term safety climate is identified as mainly social consensual or shared social
cognition.
The number of scientific studies on safety climate has been progressing over the last 30
years. In recent times, safety climate is found as a robust indicator of both subjective and
objective organisational safety performance (Bosak et al. 2013; Andreas et al., 2016; Huang
et al., 2017). There have been much focus on methodological issues rather than its theoretical
or conceptual issues (see e.g. Høivik et al. 2009; Bosak et al., 2013; Mihajlovic, 2013; Dahl
& Olsen, 2013; Hystad et al., 2014; Rémi et al., 2015; Kvalheim & Dahl, 2016; Bayire,
2016). However, there are conceptual ambiguities in the safety climate literature which need
to be clarified. As evident in several previous studies (see e.g. Cox & Cheyne, 2000; Flin et
al., 2000; Glendon & Stanton, 2000; Glendon, 2008), many variables are commonly found in
both organisational safety climate and culture measurements. From the literature, there is no
real consensus on how to describe the climate or culture of an organisation.
In the literature, few attempts have been made to differentiate between culture and climate.
Culture reflects belief or value, while climate relates to perception or attitude (Guldenmund,
2000, 2007). safety climate is described as a “snapshots” of safety culture at a specific time
(Flin et al., 2000). According to Andreas et al. (2016), climate emanates from psychometric
tradition, while culture originates from sociological and anthropological tradition. These
differences as found in the literature only point to the methodological relationship between
the two concepts rather than the theoretical aspects. However, given the limited theoretical
underpinnings on the discrimination of safety climate and safety culture, scientific efforts are
required to conceptually establish the clarities of the two concepts.
Zohar (2010) identified relative priorities as one of the key attributes of safety climate that
emerging studies on methodological issues should take into consideration. Zohar argues that
operationalisation of safety climate should focus on the nature of relationship between
policies, procedures and practices in relation to safety which must take into consideration
rules and procedures associated with safety competing with other operational demands. It is
found in extant safety climate literature focusing on the oil and gas industry (see e.g. Mearns
et al., 1997; Fleming, 2001; Mearns et al., 2001; Mearns et al., 2003; Bayire, 2016) that
climate perception variables hardly relate to the nature of relationship between the relative
priorities among the dimensions rather than considering the individual variables in isolation.
Retrospectively, reports on causes of major disasters in the oil and gas industry indicate that

532
pressure for increasing production competes with ensuring safe operations (e.g. BP Texas
Explosion in 2005 (Baker, 2007); Deepwater horizon disaster in 2011 (DHSG, 2011). One
must compare an immediate profit gain to an accident resulting to concurrently loss in
production, lives, environmental pollution and the potential impact on the organisation’s
reputation. It makes economic sense to sacrifice the immediate economic gain for safety.
Emerging studies need to consider construction of safety climate variables from the
perspective of how management choose between production/cost demands and that of the
organisational safety policies, procedures and practices requirements. This is because in a
practical sense, a high safety climate perception score favouring management’s relative
choice for production/cost as against compliance of safety rules and procedures could suggest
a weak indicator for safety performance. The main challenges in safety research is to find the
factors and process that influences safety climate. There have not been much studies on
safety climate as a leading indicator for major accident risks.
2.4 Safety Climate as a Leading Major Accident Risk Indicator
To avoid accidents from occurring, one important strategy is to be incessantly vigilant
through the use of indicators (Øien et al., 2011). Safety indicators are developed to mainly
monitor the level of safety in a system, to motivate action, and to provide the necessary
information for decision-makers about where and how to act (Skogdalen et al., 2011). In the
oil and gas industry, the common safety indicators traditionally used may include: Fatal
accident rate, Lost time injury frequency, and Total recordable injury rate and supplemented
by hydrocarbon release statistical information (IOGP, 2015; Tamim et al., 2017).
Occupational accidents descriptively are summarized as trips, slips and falls (Skogdalen et
al., 2011), whilst major accidents are “adverse events such as major leaks/releases, fires,
explosions or loss of structural integrity, leading to multiple deaths and/or major damage to
the environment or property” (Amyotte et al., 2016, p.1). There are common characteristics
associated with major accident cases: they have relatively low frequencies but extremely
severe consequences (Amyotte et al., 2016); their occurrences were not due to unknown
physical or chemical process hazards but in all cases the hazards were known for long time;
why they continue to occur are mainly characterised by management quality, organizational
and human factors (Knegtering & Pasman, 2009); they are caused by multiplicity of flaws,
lacks and deficiencies (Reason, 1990). The controversial issues characterizing safety
indicators measurement involve whether managing indicators for preventing occupational
accidents the same way as managing indicators for major accidents, and should safety
indicators be measured retrospectively or predictively?
At least experience of past major accidents in the oil and gas industry (e.g. Shell’s chemical
Company Plant Explosion in Texas in 1997, BP Texas City refinery disaster in 2005 and
Deepwater Horizon accident in 2010) have indubitably shown that the long assumption of
occupational accidents indicators as relevant indicators for major hazard risk is misleading
(Baker, 2007; Skogdalen et al., 2011). Lagging safety indicators are reactive indicators for
measuring potential contributing factors of accidents which uses retrospective analysis.
Leading safety indicators are predictive indicators measuring potential contributing factors
which involve active monitoring to achieve organisational safety outcomes. Many studies
measure safety climate as a lagging indicator to assess workers’ perception of the history of
safety within the organisation. The reason is that retrospective designs are easier to conduct
simply because of availability of previous event data (Payne et al., 2010). However, there is
the need to proactively monitor potential factors that contribute to the emergence of major

533
accident than to wait for accident to occur and before beginning to investigate its causal
factors (direct indicators). Given the apparent significance of leading indicators, there has
been very little development of academic research focusing on leading indicators. Some
studies (see e.g Antonsen, 2009; Kvalheim et al., 2016) have criticized the inability of safety
climate scores to predict major accidents. However, the link between safety climate
indicators and major accidents have been poorly investigated in the literature.
Antonsen (2009) investigated the relationship between safety climate and major accident by
comparing safety climate results and findings from an accident inquiry in a specific
installation. The results of the safety climate scores (the pre-incident survey) indicate that
“the culture of the company in question was “a culture of compliance and learning, sensitive
of the risks involved and highly oriented towards safety” (p.247). The results obtained from
the inquiry after the accident show an inverse assocation with the safety climate scores. In a
similar study, Kvalheim et al.( 2016) investigated the ability of safety climate measurements
to assess the risk of major accident in the Norwegian offshore oil and gas operations. The
study was conducted in three installations and the results were inclusive. In installtion A and
C, positive safety climate scores were interpretated as acceptable and which did not attract
further attention from the management for corrective measures. In installtion B, the results
show a negative develeopment which could suggest that the safety conditions were
deteriorating. The results of these studies were methodologically challenged. The studies only
focused on few cases under one construct of safety climate. However, if more cases were
investigated with more constructs the results could have been signifficantly different.
Contrarily, in the work of Payne et al. (2010), which investigeted the lagging and leading
effects of safety climate assessment on the major acident risk resultantly gave a different
perspective. The results indicated that safety climate perceptions (good routine housekeeping,
the prevention of backlogs, and prompt correction of health and safety issues) were important
predictors of major accident in a chemical process industry. Morever, in the works of
Vinnem et al. (2010) and Kongsvik et al. (2011) on hydrocarbon leaks analysis, safety
climate results were found to be a leading indicator for major accident risks. One could draw
support from the ‘Swiss cheese model’ of accident causation (Reason, 1990), ‘failed
defences’ is the most promising for effective prevention of organisational accident. The
gaps in the defences emerge from active failures (ie. those unsafe acts such as error and /or
procedural violations) and latent conditions (e.g. high workload, time pressure, inadequate
skills, experience and poor equipment etc.). These latent conditions mostly exist within the
defences for a long period and may be exposed by systems auditing or occurrence of
incidents (Reason, 1990; 2016). Some studies have developed safety climate variables by
capturing those elements of active failures and latent conditions to measure organisational
safety performance (see e.g. Mearns et al., 1997; Fleming, 2001; Mearns et al., 2001; Mearns
et al., 2003; Bayire, 2016). Safety climate perception reflects a distal antecedent of safety
behaviour which is mediated by the more proximal drivers of safety performance (Zohar,
2010). By implication, safety climate can be used as a proactive measure to identify the
organisational latent conditions of major accidents and also prevent organisational
shortcomings from becoming the root cause of future accidents. Having established the
measures about the failed defences, one could provide possible predictive indicators of the
likehood of accidents. Again, what is more important is to develop safety climate scales that
are valid and reliable to measure predictive conditions of major accident risks.

534
2.5 Dimensionality of Safety Climate
As a result of the multi-dimensional nature of safety climate, there is no universal accepted
dimensions to measure it. In many review studies (see e.g. Guldenmund, 2000, 2007; Gao et
al., 2016), the emphasis is placed on the validity of the constructs and its robust prediction of
an organisational safety climate. On the development of safety climate constructs, the
relatiuonship between occupational accidents and major accidents variables have not received
much attention in the literature. The conditions that predict occupational accidents and major
accidents are not the same because there are different nature of hazards emergence.
Table 1 presents constructs found in the literature which are relevant in influencing major
accident risks in the uptream oil and gas indutry. In most major accident cases, most studies
have found these constructs as imporant indicators contributing to major accidents in high-
risk industries: However, ‘causes’ and ‘conditions’ of major accidents have not been
clarified in the literature. Safety climate is considered as a distal antecedent of organisational
safety outcome. This paper holds the view that safety climate dimensions are more skewed to
reflect conditions that potentially contribute to predicting major accidents at the work
environment.
Table 1: Safety Climate Dimensions for Major Accidents Risks Constructs Literature Source
Safety policies Payne et al., 2010; Baker, 2007
Safety priority Zohar, 1980; Kvalheim et al., 2016; Høivik et al. 2013
Safety training Hopkins, 2000; Baker, 2007; CSB, 2014; Høivik et al. 2013; Kvalheim
et al., 2016; Yuang, et al., 2017
Management commitment Zohar, 1980; Vinodkumar & Bhasi, 2010; Kines, et al., 2011
Safety rules & procedures Vinodkumar & Bhasi, 2010; Hopkins, 2011; Neal et al., 2000
Management of change Baker, 2007; Sklet et al., 2010
Safety communication Sklet et al., 2010; Kines, et al., 2011; Skogdalen & Vinnem, 2012
Equipment maintenance Payne et al., 2010; Baker, 2007
Safety involvement Høivik et al. 2013; Kvalheim et al., 2016
Safety supervision Baker, 2007; Bhasi, 2010; Kvalheim et al., 2016
Supportive environment Baker, 2007; Payne et al., 2010
Safety empowerement Shannon et al., 1997; Baker, 2007; Kines et al., 2011; Wurzelbacher &
Jin, 2011
Safety motivation Vinodkumar & Bhasi, 2010; Kvalheim et al., 2016; Høivik
et al. 2013
Safety behaviour Bayire, 2016; Huang et al., 2017
3. METHODOLOGY
3.1 Sample and Procedures
The sample was drawn from a full time workforce in the Ghanaian upstream oil and gas
sector from five companies. The survey questionnaires were distributed to 250 employees
which eventually had a response rate of 84.8% (N = 212). Table 2 summarises the
demographic details of the participants used for the study. 72.1% of the participants were
male, while 27.8% were female. The mean age range of the sample was 3.0 (30-39 years).
The job functioning category of the workers include: engineering professionals
maintenance/craft technicians, operators, full time HSE employees, operation management,
contractors and maintenance management. More than half (50.5%) of the participants had
Bachelor degree qualification. In terms of area of operation, 65.6% of the participants work
in offshore, while 30.7% work in onshore. 57.1% of the participants were reported to have

535
experienced occupational accidents/injuries at their respective work environment, whiles
36% had no accident/injuries experience.
Table 2: Demographic Information of the Participants Variable Frequency (N=212) Percentage (100%)
Gender
Male 153 72.1
Female 59 27.8
Age
Under 25 5 2.4
25 - 29 53 25
30 – 39 94 44.3
40 – 49 56 26.4
50 or above 4 1.9
Job functioning Category
Engineering professionals 90 42.5
Maintenance/craft technicians 41 19.3
Operators 10 4.7
Full time HSE employees 16 7.6
Operation management 26 12.3
Contractors 7 3.3
Maintenance Management 22 10.4
Education qualification
SSCE 5 2.5
Diploma 24 11.3
Bachelor Degree 107 50.5
Master Degree 70 33
Doctoral Degree 6 2.8
Area of operation
Offshore 139 65.6
Onshore 65 30.7
Experience of occupational accidents/injuries
Yes 121 57.1
No 78 36.8
The selected organisations were contacted through a letter seeking approval for this study to
be undertaken. The survey questionnaires including the participant information sheet and
informed consent forms all in envelops were presented to the companies’ reception desks
after approval had been granted for this study. Participation in the study was made voluntary
and respondents could discontinue his participation without giving reasons. The returned
questionnaired were sealed. It takes 20-30 minutes to complete the questions. Safety climate
was measured at two hierarchical levels of the organizations: work group level and top
management level. In the oil and gas industry, operations are assigned to work groups that is
led by supervisors. Scientific research indicates that a comprehensive safety climate
investigation should capture both employees’ perceptions of his/her immediate supervisor
(group level) and their perception of top management (organizational level) relating to safety
(Brondino et al. 2012; Haung et al., 2017). This would help to identify the issues that affect
safety management in the upstream sector from the employees’ perspective.
3.2 Survey Instrument
The research was designed to assess the workers’ safety climate in Ghana’s upstream oil and
gas sector and this was initially measured by using a 82-item safety climate scale. The
instrument was made up of 4 sections: ‘demographic information’, “occupational accidents

536
and near-misses”, “workers’ perception about safety”, and “workers’ experiences of major
hazards”. The instrument contains I4 constructs developed from the literature (e.g. Zohar,
1980; Baker, 2007; Vinodkumar & Bhasi, 2010; Kines et al., 2011). The prepared survey
questionnaires were pilotted with 50 sample size. 11 items were deleted mainly because they
were repeated and some items were positively reworded.
The final questionnaires comprised 60 items in 14 constructs: safety policies (2-items), safety
priority (2-items), safety training (4-items), safety rules and procedures (2-items),
management commitment (3-items), equipment maintenance (3-items), safety
communication (2-items), supportive environment (3-items), safety involvement (4-items),
safety empowerement (6-items), management of change (3-items), safety supervision (4-
items) safety motivation (3-items), and safety behaviour (2-items). It scores a 5-point likert
type scale from strongly disagree to strongly agree on “workers’ perception about safety”;
and from very unsafe to very safe on “workers’ experiences of major hazards”. The scale had
a high level of internal consistency, as determined by a Cronbach’s alpha of .834.
3.3 Data Analysis
The IBM SPSS v23 software was used to perform the statistical analysis required for the
study. Descriptive statistics and pearson correlation were conducted for the studied constructs
to establish some pattern of associations among them. Given the large number of variables
under studied, factor analysis was computed to identify the latent coonstructs. The data were
subjected to principal component factoring and orthogonal Varimax rotation. The analysis
indicates that Kaiser-Meyer-Olkin (KMO) Measure of Adequacy was .709 suggesting that
the data were appropriate for this analysis (Kaiser, 1974). Bartlett’s Test of Sphericity was
significant at [x2 =1005.969, p<.000] indicating that there exist correlation among the safety
climate scales. Multiple regression analysis was computed to determine stronger causal
inferences from the observed relationships among the constructs. The five factors (F1, F2, F3,
F4, F5) were constituted as the independable variables and the dependable variable is the
major accident risks.
4. RESULTS
The results of the statistical analysis and pearson correlation among the constructs have been
presented in table 3. The high mean scores were found in the following constructs: supportive
environment (M =4.32; S.D. =.432), safety priority (M=4.19; S.D. = .44), safety policies (M=
4.09; S.D. = .37), equipment maintenance (M = 4.09; S.D. = .34), and safety behaviour (M =
4.04; S.D. = 1.21). It was found that there were negative correlations among most of the
safety climate constructs. Workers’ perceptions of feeling “unsafe” for major accidents risks
were found negatively correlated with these safety climate constructs: safety policies (r = -
.18, p<0.5), safety training (r = -.04, p<0.5), management commitment (r = -.09, p<.05),
equipment maintenance (r = -.15, p<.05), safety communication (r = -.07, p<0.5), safety
motivation (r = -.01, p<.01), and safety behaviour (r = -.03, p<0.1).

537
Table 3: Descriptive Statistics and Correlations M S.D. 1 2 3 4 5 6 7 8 9 10 11 12 13 14 15
1. SP 4.09 .37
2. PR 4.19 .44 -.19**
3. TR 1.95 .60 -.17* .15*
4. RP 1.88 .32 -.59** -.04 -.04
5. MC 2.64 1.00 -.27** .04 .10 -.25**
6. EM 4.06 .34 .07 -.18** .12 -.14* .28**
7. CM 3.16 1.29 .04 -.05 -.01 -.16* . 19** .20
8. SE 4.32 .42 -.34** .18** -.11 .06 -.20 -.13 -.07
9. IN 2.47 .96 .11 .01 -.03 -.11 .31** .22** .16* -.09
10. EP 2.64 1.00 .30** .27** .00 -.28** .54** .10 .21** -.15* .45**
11. MG 2.75 1.15 .23** -.02 .06 -.24** .51** .08 .21** -.20** .42** 78**
12. SV 2.87 1.10 .24** -.03 -.00 -.25** .39** .09 .24** -.13 .41** .72** .82**
13. MO 3.62 1.06 .26** -.01 -.08 -.20** .22** .04 .10 .01 .25** .32** .31** .53**
14. BE 4.04 1.21 .04 .04 -.06 -22** -.31** .01 .05 .10 -.20** -.31** -.31** -.28** -.10
15. HAZ 1.7 .60 -.18* .07 -.04 .17* -.09 -.15* -.07 .14* .12 .13 .17* .10 -.01 -.03 N = 212, ••. p< 0.01. •. P< 0.05.
Abbreviation of safety climate constructs: SP=Safety Policies; PR=Safety Priority; TR=Safety Training;
RP=Safety Rules & Procedures; MC=Management Commitment; EM=Equipment Maintenance; CM=Safety
Communication; SE=Supportive Environment; IN=Safety Involvement; EP=Safety Empowerement;
MG=Management of Change; SV=Safety Supervision; MO=Safety Motivation; BE=Safety Behaviour. HAZ =
Major accident risks.
The results for the factor analysis were presented in table 4 which show the factor score
coefficients, the rotated factor loading and the communality coefficients. The analysis shows
that 5 factors have Eigen values greater than 1 (Kaiser, 1974) with communality coefficient
(h2) score above 50%. Factor 1 (F1) has the following constructs: Safety supervision,
Management of change, Safety empowerement, and Management commitment. Factor 2 (F2)
has Safety policies, Safety rules and procedures, and Safety behaviour. Factor 3 (F3)
comprises Safety priority and Supportive Environment. Factor 4 (F4) comprises Equipment
maintenance and Safety communication. Factor 5 (F5) has Safety training and Safety priority.
These five factors (F1, F2, F3, F4, & F5) as independable variables were selected for the
multiple regression analysis to determine which factor has more predictive influence on
major accident risks.
Table 4: Results of Factor Analysis Factor Score Coefficients Rotated FactorLoading (f) Communalities (h2=100%)
F1 F2 F3 F4 F5 F1 F2 F3 F4 F5 Communality
SP -.014 .408 -.282 -.165 -.118 .730 .829
PR .068 .128 .375 -.196 .475 .531 .584 .706
TR -.037 .009 -.094 .061 .653 .812 .687
RP .025 -.513 -.029 -.009 -.150 -.849 .788
MC .133 .009 -.138 .074 .215 .601 .561
EM -.078 -.040 -.112 .599 .068 .780 .679
CM .011 .002 .185 .525 -.057 .667 .520
SE .043 -.035 .564 .069 -.095 .773 .633
IN .162 -.112 .086 .204 -.074 .441
EP .246 -.008 .007 -.049 .021 .862 .767
MG .254 -.033 -.010 -.064 .038 .876 .790
SV .261 -.002 .098 -.036 -.082 .876 .793
MO .157 .150 .236 -.030 -.206 .488
BE -.185 .373 .247 .198 -.029 .536 .572
Multiple regression analysis was used to test which factors have more predictive influence on
major accident risks. As the results are presented in table 5, it is found that the model was
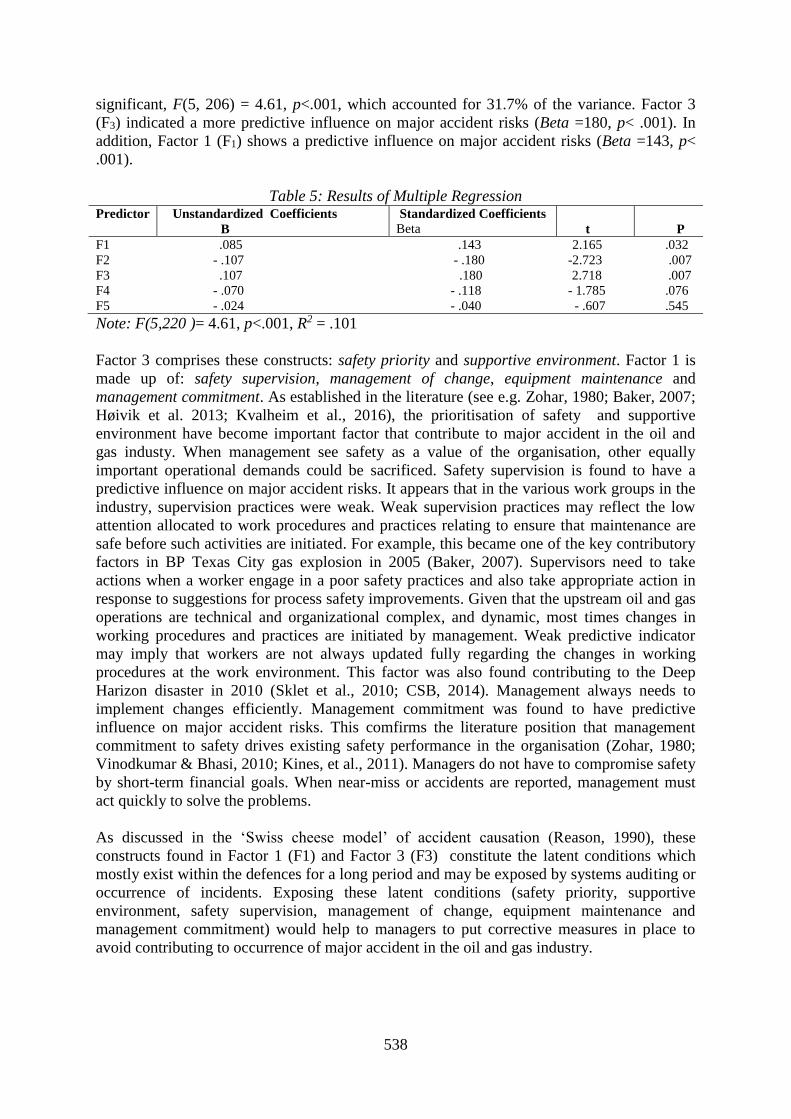
538
significant, F(5, 206) = 4.61, p<.001, which accounted for 31.7% of the variance. Factor 3
(F3) indicated a more predictive influence on major accident risks (Beta =180, p< .001). In
addition, Factor 1 (F1) shows a predictive influence on major accident risks (Beta =143, p<
.001).
Table 5: Results of Multiple Regression Predictor Unstandardized Coefficients
B
Standardized Coefficients
Beta
t
P
F1 .085 .143 2.165 .032
F2 - .107 - .180 -2.723 .007
F3 .107 .180 2.718 .007
F4 - .070 - .118 - 1.785 .076
F5 - .024 - .040 - .607 .545
Note: F(5,220 )= 4.61, p<.001, R2 = .101
Factor 3 comprises these constructs: safety priority and supportive environment. Factor 1 is
made up of: safety supervision, management of change, equipment maintenance and
management commitment. As established in the literature (see e.g. Zohar, 1980; Baker, 2007;
Høivik et al. 2013; Kvalheim et al., 2016), the prioritisation of safety and supportive
environment have become important factor that contribute to major accident in the oil and
gas industy. When management see safety as a value of the organisation, other equally
important operational demands could be sacrificed. Safety supervision is found to have a
predictive influence on major accident risks. It appears that in the various work groups in the
industry, supervision practices were weak. Weak supervision practices may reflect the low
attention allocated to work procedures and practices relating to ensure that maintenance are
safe before such activities are initiated. For example, this became one of the key contributory
factors in BP Texas City gas explosion in 2005 (Baker, 2007). Supervisors need to take
actions when a worker engage in a poor safety practices and also take appropriate action in
response to suggestions for process safety improvements. Given that the upstream oil and gas
operations are technical and organizational complex, and dynamic, most times changes in
working procedures and practices are initiated by management. Weak predictive indicator
may imply that workers are not always updated fully regarding the changes in working
procedures at the work environment. This factor was also found contributing to the Deep
Harizon disaster in 2010 (Sklet et al., 2010; CSB, 2014). Management always needs to
implement changes efficiently. Management commitment was found to have predictive
influence on major accident risks. This comfirms the literature position that management
commitment to safety drives existing safety performance in the organisation (Zohar, 1980;
Vinodkumar & Bhasi, 2010; Kines, et al., 2011). Managers do not have to compromise safety
by short-term financial goals. When nearmiss or accidents are reported, management must
act quickly to solve the problems.
As discussed in the ‘Swiss cheese model’ of accident causation (Reason, 1990), these
constructs found in Factor 1 (F1) and Factor 3 (F3) constitute the latent conditions which
mostly exist within the defences for a long period and may be exposed by systems auditing or
occurrence of incidents. Exposing these latent conditions (safety priority, supportive
environment, safety supervision, management of change, equipment maintenance and
management commitment) would help to managers to put corrective measures in place to
avoid contributing to occurrence of major accident in the oil and gas industry.

539
5. CONCLUSION
The study was designed to assess the current safety climate predictive influences on major
accidents risks in Ghana’s upstream oil and gas sector. Many workers have experienced
occupational accidents or injuries at the work environment. Safety climate is found to be a
leading indicator to major accident risks. The relationship between safety climate
measurement and major accident risks have not received adequated research attention to
clarify the discrimination between what constitutes ‘condition’ or ‘cause’ of accident
causation. The results of the study indicate that safety climate measures were predictive
indicators for major accident risks in the oil and gas industry. Safety priority and supportive
environment was found to have high predictive influence on major accident risks. In addition,
safety supervision, management of change, equipment maintenance and management
commitment indicate predictive influence on major accident risks.
It suggests that managers need to allocate more attention on the realignment of the
organisational safety priority and improve on the existing culture of supportive environment.
There is also the need to improve on supervision practices, effective implementation of
working procedures and facilities changes especially on the perspective of workers’updates,
improvement on equipment maintenance and management commitment to safety in the work
environmkent. The findings of this study provides valuable guidance for researchers and
industrial practioners to identify mechanisms by which they can improve existing safety
performance at the work environment.
This study was only limited to identifying those latent conditions that have predictive
influences on major accidents risks in Ghana’s upstream oil and gas industry. The
antecedents of these facrtors were not explored. Futher research needs to focus on
investigating the antecedents of those established predictive constructs by using using
qualitative approachs. This would form part of the researcher’s current research project.
6. REFERENCES
Amorin, R. & Broni-Bediako, E., 2013. Major Challenges in Ghana ’ s Oil and Gas Discovery : Is Ghana
Ready ?, 3(1), pp.21–25.
Amyotte, P.R. et al., 2016. Why major accidents are still occurring? Current Opinion in Chemical Engineering,
14, pp.1–8.
Andreas, S., Antonsen, S. & Haugen, S., 2016. Safety climate as an indicator for major accident risk : Can we
use safety climate as an indicator on the plant level? International Journal of Disaster Risk Reduction, 18,
pp.23–31.
Bayire, F.A., 2016. The influence of safety climate and organisational learning on employees’ safety risk
behaviour at the Jubilee Oil Fields. University of Ghana.
Bitsani, E., 2013. Theoretical approaches to the organizational culture and the organizational climate :
Exploratory research examples and best policies in health care services. , 1(4), pp.48–58.
Bosak, J., Coetsee, W.J. & Cullinane, S., 2013. Safety climate dimensions as predictors for risk behavior.
Accident Analysis and Prevention, 55, pp.256–264.
Brondino, M., Silva, S.A. & Pasini, M., 2012. Multilevel approach to organizational and group safety climate
and safety performance : Co-workers as the missing link. Safety Science, 50(9), pp.1847–1856.
Dahl, Ø. & Olsen, E., 2013. Safety compliance on offshore platforms : A multi-sample survey on the role of
perceived leadership involvement and work climate. Safety Science, 54, pp.17–26.
DHSG, 2011. Final Report on the Investigation of the Macondo Well Blowout Deepwater Horizon Study Group,
Available at: http://ccrm.berkeley.edu/pdfs_papers/bea_pdfs/DHSGFinalReport-March2011-tag.pdf.
Høivik, D. et al., 2013. What is most important for safety climate : The company belonging or the local working
environment ? – A study from the ... Safety Science, 47(10), pp.1324–1331.

540
Høivik, D. et al., 2009. What is most important for safety climate : The company belonging or the local working
environment ? – A study from the Norwegian offshore industry. Safety Science, 47(10), pp.1324–1331.
Hopkins, A., 2000. Lesson from Longford: Esso gas plant explosion. Sydney: CCH Australia Ltd.
Huang, Y.H. et al., 2017. Safety Climate: How can you measure it and why does it matter? Professional Safety,
(January 2017), pp.28–35.
Hystad, S.W., Bartone, P.T. & Eid, J., 2014. Positive organizational behavior and safety in the offshore oil
industry: Exploring the determinants of positive safety climate. The journal of positive psychology, 9(1),
pp.42–53.
Kaiser, H.F., 1974. An index of factorial simplicity. Psychometrika, 39, pp.31-36
Kines, P., Lappalainen, J., Mikkkelsen, K.L., Olsen, E., et al., 2011. Nordic safety cliamte questionnaire
(NOSACQ-50): A new tool for diagnosing occupational safety climate. International Journal of Industrial
Ergonomics, 41, pp.634-646.
Kvalheim, S.A. & Dahl, Ø., 2016. Safety compliance and safety climate : A repeated cross-sectional study in the
oil and gas industry. Journal of Safety Research, 59, pp.33–41.
Mihajlovic, I., 2013. Developing a Questionnaire for Measuring Safety Climate in the Workplace in Serbia. ,
19(4), pp.631–645.
Norman, I.D. et al., 2015. Review of Catastrophic Fires and Risk Communication, Ghana. Advances in Applied
Sociology, 5, pp.167–177.
Øien, K., Utne, I.B. & Herrera, I.A., 2011. Building Safety indicators : Part 1 – Theoretical foundation. , 49,
pp.148–161.
Rémi, D., Ngueutsa, R. & Mbaye, S., 2015. Safety climate , perceived risk , and involvement in safety
management q. Safety Science, 77, pp.72–79. Available at: http://dx.doi.org/10.1016/j.ssci.2015.03.009.
Shannon, H.S, Mayer, J. & Haines, T., 1997. Overviewof the relationship between organisation and workplace
factors and injury rates. Safety Science, 26(1), pp.201-2017.
Shea, T., De Cieri, H., Donohue, R., Cooper, B. & Sheehan, C., 2016. Leading indicators of occupational health
and safety: An employee and workplace level validation study. Safety Science, 85, pp. 293-304
Sklet, S. et al., 2010. Monitoring of Human and Organizational Factors Influencing the Risk of Major
Accidents. SPE International, (SPE 126530), pp.1–8.
Skogdalen, J.E., Utne, I.B. & Vinnem, J.E., 2011. Developing safety indicators for preventing offshore oil and
gas deepwater drilling blowouts. , 49, pp.1187–1199.
SPE, 2015. An Analysis of Global Safety Trends in the Oil and Gas Industry - Impacts. Society of Petroleum
Engineers International, (SPE-176502-MS), pp.1–18.
Tamim, N. et al., 2017. A framework for developing leading indicators for offshore drillwell blowout incidents
ଝ. Process Safety and Environmental Protection, 106, pp.256–262.
Ocloo, D. R., 2017. Explosion at TOR, Graphic Online, Accessed on 15th March 2017 at:
(http://www.graphic.com.gh/news/general-news/explosion-at-tor.html).
Øien, K., Utne, I. B., & Herrera, I. A. (2011). Building Safety indicators : Part 1 – Theoretical foundation.
Reliability Engineering and System Safety, 49, 148–161.
Tamim, N., Laboureur, D. M., Mentzer, R. A., Rashid, A., Mannan, M. S., Texas, A., & Station, C., 2017. A
framework for developing leading indicators for offshore drillwell blowout incidents. Process Safety and
Environmental Protection, 106, pp.256–262.
Tetteh, D., 2017. Fire guts Finesse Oil yard …12 fuel tankers burnt, The Ghanaian times, Accessed on 15th
March 2017 at: http://www.ghanaiantimes.com.gh/fire-guts-finesse-oil-yard-12-fuel-tankers-burnt/).
Vinnem, J.E., Hestad, J.A., Kvaløy, J.T., et al., 2010. Analysis of root causes of major hazard precursors
(hydrocarbon leaks) in the Norwegian offshore petroleum industry. Reliability Engineering Systems Safety.
95 (11) pp.1142–1153.
Vinnem, J.E., Seljelid, J., Haugen, S., and Husebø, T., 2007a. Analysis of Hydrocarbon Leaks on Offshore
Installations, ESREL, Stavanger.
Vinodkumar, M.N. & Bhasi, M., 2010. Safety management practices and safety behaviour: assessing the
mediating role of safety knowledge and motivation. Accident Analysis and Prevention, 42, pp.2082-2093.
Visser, J., 1994. Managing safety in the oil industry–the way ahead. Paper presented at the 14th World
Petroleum Congress.
Wurzelbacher, S. & Jin, Y., 2011. A framework for evaluating OSH program effectiveness using leading and
trailing metrics. Journal of Safety Research, 42, pp.199–207.
Zohar, D., 1980. Safety climate in industrial organizations: theoretical and applied implications. Journal of
Applied Psychology, 65, pp.96–102.
Zohar, D., 2011. Safety climate: conceptual and measurement issues. In. Quick, J. C & Tetrick, L. E. (eds.),
Handbook of occupational health psychology, 2nd ed. (pp. 141–164). Washington, DC: American
Psychological Association.

541
Zohar, D., & Luria, G., 2005. A multilevel model of safety climate: cross-level relationships between
organization and group-level climates. Journal of Applied Psychology, 90, pp.616–628.

542
ID 064
DEVELOPMENT OF A FRAMEWORK TO IMPROVE MATERIALS
MANAGEMENT ON LIBYAN CONSTRUCTION PROJECTS
N. Maauf and R. Gameson
School of the Built Environment, University of Salford, Salford, M5 4WT, UK
Email: [email protected]
Abstract: Poor materials management on construction sites is one of the key factors of delay
in construction projects in Libya, involving poor handling of materials and Waste Materials
(WM). Further challenges to managing materials on construction sites include materials,
labour, machinery and the project’s environment. The aim of this research is therefore to
develop a framework for materials management on Libyan construction sites. The objective of
this paper is to investigate and analyse problems pertaining to inappropriate application of
materials management. This paper reports on the early stages of the research, and presents a
critical review of the literature on materials management in order to identify the key factors in
construction projects and thereby develop a theoretical framework. The study also explores the
potential role of supply chain management and lean construction methodologies in relation to
materials management in recovering from delay and reducing WM. The research to date
concludes that human error and unskilled labourers have an impact on the use and application
of materials in construction activities and management. It also highlights the need to further
investigate the most advanced solutions to the management of materials in order to solve the
delay problem. The theoretical framework presented will be tested empirically, and then
validated at a subsequent stage of the research.
Keywords: Construction Projects, Lean Construction, Libya, Materials Management, Supply
Chain Management.
1. INTRODUCTION
Construction projects play a significant role in the Libyan economy, retaining and creating
jobs and wealth for the country. They represent an important business that contributes 5.2%
of the national Gross Domestic Product (GDP) ( (Fathi et al. 2016; Omran, 2015). However,
construction projects in Libya face several problems that prevent achievement of their goals,
including materials, labour, machinery and the market. Although over the last two decades
Libyan researchers have focused on the causes of delay in construction projects, they have
ignored the role of materials management to overcome these problems, through coordination,
planning and monitoring to control quality and optimise the use of materials. The three
determinants are time, cost and quality. To ensure that materials management results in
improvement of the construction project and control of the site, it should be linmked to
specific roles in order to provide materials at the right time and reduce the waste of materials,
for example, by the use of supply chain management and lean construction. Koskela (2000)
identified that supply chain management (SCM) has four roles in construction sites in
Finland: 1. feasible action to improve construction supply chains; 2. improve supply chains;
3. transfer activities from the site to the supply chain; and 4. integrate the site and the supply
chain. On the other hand, James et al. (1990) identified that lean construction is a useful
technology to manage and improve the construction process, and therefore deliver the needs
of the customer. This study critically reviews the role of materials management on site to
reduce the delay in building projects in the Libyan construction sector.

543
2. BACKGROUND
According to the Libya General Council for Planning (GCP) (2002), construction projects
began under trying circumstances and then entered into a process of evolution after oil was
discovered in 1951. Construction projects were dependent on oil income. Over the last four
decades, the public construction sector in Libya has improved, becoming an important
business that contributes 5.2% of national GDP. (Omran and Abdulrahim, 2015; Fathi et al.
2016) agreed and pointed out that, given the availability of raw materials, Libya has the
largest cement factories in North Africa, located in Derna in the east of the country, as well as
factories in Tripoli, Benghazi and Sabha, and an iron and steel factory in Misrata. Handfield
et al. (2005) stated that the primary objective of materials management in construction
projects is to reduce time. Murali and Yau (2007) agreed and added that any delay will
increase cost, reducing the feasibility of the project and failing to contribute to the
development of society. However, Libyan researchers have conducted several studies during
the last a few years, although most discussed delays in construction without recommending
the need for materials management (Shebob et al., 2012; Abdullah et al., 2002; Abdelnaser et
al., 2005). The exception is Mustafa (2009), who identified that most of the delay factors are
related to materials management because it has an important role in saving time and reducing
costs, while retaining quality. One of the difficulties faced by construction projects in Libya
is that they largely depend on foreign experts. Currently, the projects need improvement and
development in order to meet the national housing supply and infrastructure needs: new
homes, airports, ports, railways and roads. Hotels, office buildings and resorts are also
required to meet the needs of potential tourism (Mostafa, 2009; Shebob et al. 2012).
3. MATERIALS MANAGEMENT: AN OVERVIEW
Materials management is the process which links supplies and organisations to obtain a
standard of service ensuring that the right materials are available on the construction site at
the right time and at the lowest cost (Safa, 2014). Madhavi et al. (2008) identified materials
management as a process of planning, implementing and controlling the right source of
equipment with specific quality at the right place and time for an optimised cost-construction
process. Agapiou et al. (1998) added that successful materials management and reduction of
the project cost involves three critical phases: purchasing, storing and using. Ayegba (2013)
examined materials management as applied to building construction sites in Niger state,
focusing on the methods of procurement and the factors affecting management of the
construction site and suggesting measures for effective materials management. This
researcher also highlighted delays in the supply of materials, unskilled supervision, poor site
security, weather and other natural occurrences, alterations of designs, theft, over-ordering of
materials and vandalism, leading to the wastage of materials on building construction sites in
Malaysia. However, Abdul-Rahman et al. (2006) identified shortage of materials as an
important factor in Libyan construction projects.
Hannure and Kulkarni (2014) observed that materials management is a scientific technique
concerned with preparing, organising and control of the flow of materials from their initial
purchase to the end. They recommend carrying out materials management to minimise
wastage and damage of the material, and to overcome shortages, the lack of storage space,
and delays in supply. In Libya, Amar et al. (2015) observed that building materials in
construction projects have to be managed; be suitable for the project, the cheapest for a given
quality, and delivered on time.

544
In Afghanistan, Ghulam and Kassim (2012) identified the high price of materials, fluctuation
in availability and estimation of quantity as major problems in construction projects, leading
to cost overrun. In Libya, Shebob et al. (2011) identified the most critical delay factors in
construction projects as delays in materials delivery and increased cost of materials.
Furthermore, materials management in Libya is required to control the waste of material on
site Bennett et al. (2011).
Abdelnaser (2012) concluded that in Libya a good material management could safely impact
on labour productivity. For instance, work time can become no productivity or idle time due
to lack or shortage of equipment and tools on the right place at the right time. Also, double
handling due to the distance of storage can affect the availability of materials. Materials
quality and availability, therefore, can impact critically on the project success. As for labour-
and productivity-related factors, a United Nations report (1995) stated that two broad sets of
factors affect the site worker productivity requirement: organisational continuity and
execution continuity. Abdulbagei et al. (2012) and Kumar (2000) agreed that materials
management is essential to manage productivity and cost efficiency because it contributes the
major portion of expenses in construction projects. Moreover, can reduce total project cost
and complete the project on time by controlling procurement, carrying value.
3.1. Materials Handling
Inappropriate handling of materials on site is a significant issue that badly affects the
performance of construction projects (Kasim et al., 2008) and can hamper project
achievement (Ogun, 1996). Shebob et al. (2012) identified significant issues which affect the
management of materials activities, such as restricted storage areas, site logistics in relation
to materials handling and delivery, and also arranging and posting of materials on the
building site.
Previous studies have discussed further issues of materials management, such as unsuitable
storage (Canter, 1993; Agapiou et al., 1998); difficulties of transportation, and untimely
delivery of materials (Zakeri et al., 1996); non-compliance with specifications (Dey, 2001);
late delivery (Aibinu and Odeyinka, 2006); and lack of materials (Abdul-Rahman et al.,
2006). However, Akbar et al. (2013) stated that there are many types of approach to
addressing materials management problems, including proper planning of materials, and the
concept of Just-In-Time (JIT).
3.2. Waste of Materials
Waste materials is one of the serious problems in construction projects; it leads to difference
between the estimated and actual consumption of individual items (Kambiz et al., 2016;
Gulghane and Khandve, 2015). Kulatunga et al. (2006) identified that by implementing waste
materials practices, construction projects improve and achieve economic, quality and
sustainability goals. Vivan et al., 2007) and Lingard et al. (1997) have argued that by
implementing waste materials practices, contractors can reduce the cost of construction
projects. Construction waste materials planning also helps to achieve benefits such as cost
reduction in purchasing materials (Nilupa et al., 2015; Guthrie, 1998; Jaillon et al., 2009).
However, Formoso et al. (1999) and Mohammed and Anumba (2006) explained that waste of
materials is a loss that creates various costs but does not add any worth to production. On the

545
other hand, Abuzaid and Balmoor (2013) conducted study in Libya and focused on materials
for construction. They identified that sources, transport and storage of materials are the key
issues impact and lead to waste.
4. SUPPLY CHAIN MANAGEMENT (SCM)
Supply chain management is a tool used to describe the relationship between companies
which convert a series of required materials or services into the final product for the customer
(Koskela, 2000). Christopher (1992, p.26) identified the supply chain as a “network of
organisations that are involved, through upstream and downstream linkages, in the different
processes and activities that produce value in the form of products and services in the hands
of the ultimate customer”. In construction projects, Subramani and Tamizhanban (2016)
suggest that the main contractor, designer, surveyor and subcontractor are all part of a supply
chain (see Figure 1).
The Five Parts of Supply Chain Management in Construction
Figure.1 Five Parts of Supply Chain Management in Construction (Subramani and
Tamizhanban, 2016)
Within the chain, each company has a client to provide services; however, incorporated
supply chain management aims to work wholly in the interests of the project client
(Construction Excellence, 2004). There is a relationship between the main contractor’s
position, and the activities and errands leading to the preparation of the SCM in construction
on site, including clients and the design team. Activities and errands in the delivery of
construction suppliers, sub-contractors, and professional contractors in relation to the main
contractor also need consideration (Saad et al., 1999; Akintoye et al., 2000; Kaschola, 2000).
This means that there is a relationship between the delay of construction projects and the
supply chain. Moreover, the process of reducing the real cost and removing waste from
projects is one of the benefits of the supply chain in construction. Vrijhoef and Koskela
(2000) have identified four roles of the supply chain management (SCM) in construction (see
figure 2).
SCM
Client
Main Contractor
DesignerSuerveyor
Subcontractor or
Supplier

546
Figure2. Four Roles of Supply Chain Management (SCM) in Construction.
Source: Vrijhoef and Koskela (2000: 7)
Role 1: Improving the interface between site activities and the supply chain.
In the field of construction logistics, the supply chain management (SCM) has the clearest
roles related to co-operation between suppliers and contractors in order to improve materials.
(Asplundh and Danielson, 1991; Wegelius - Lehtonen and Pahkala, 1998, cited in Koskela
2000). However, traditional treatment of construction and handling of materials has
concentrated on site activities. On the other hand, (Salah, 2014) highlighted that the weak
connection between suppliers and contractors is a key problem in Libya and leads to non-
delivery of materials at the specified time.
Role 2: Improving the supply chain.
This is the main aim for the development of particular supply chains, such as prefabricated
concrete elements or elevators (Koskela, 2000; Laitinen, 1993). It necessitates analysis of
cost and time to identify specific improvement for the development of a supply chain, and
when the supply chain is developed, a comparison should be made between transportation
and production costs in order to achieve global improvement because productivity and supply
chain performance may decrease when changing site ability conditions (Al-hajj. 2011).
Role 3: Transferring activities from the site to the supply chain.
(Oyedele et al. 2013) conducted a study in the UK and pointed out in order to provide JIT
production in the construction there is the need for supply chain management. Therefore, the
focus should be on redesigning the supply chain by transferring onsite activities to off site.

547
Industrialisation materials, especially prefabrication, can be observed as a structural means
for eliminating on-site activities from the total production chain (Warszaswki, 1990). Thus,
the earlier, and still actual initiatives towards industrialisation of construction must also be
seen as a form of SCM concentrating on the design of the supply chain (Sarja, 1998).
Role 4: Integration of site and supply chain.
(Van Randen, 1990) presented a number of suggestions for management of a supply chain
such as open building to enable users to defer decisions regarding the interior of the building.
The idea is to structure the site work as successive realisations of autonomous sequences (this
resembles group technology as developed in manufacturing). On the other hand, (Koskela,
2000) explaining the relationship between supply chain and lean construction and stated that
lean construction improves the downstream of supply chain onsite projects; moreover, open
building aims to optimise the quality of the built environment, by improving the relationship
between the customer and the building industry. Meanwhile, the aim of Lean Construction is
to optimise building and construction. Both of them have the benefit of improving supply
chain onsite projects.
On the other hand, Saad and Jones (1999) recommended the need to improve SCM
downstream because it is the weaker link in construction. Erik et al. (2010) conducted a
study to improve the supply chain in construction and concluded that in order to improve
downstream, there is a need to apply lean thinking to construction. This means
improving activity on the construction site by defining units of production, and using
tools such as visual control of processes. Design teams work exclusively on one design
from beginning to end, supporting sub-contractors in developing tools for improving
processes (Kaschola, 2000; Lean Construction – Construction Excellence, 2004).
5. LEAN CONSTRUCTION (LC)
Hoop and Spearman (1996) identified that lean construction aims to achieve the objective of
the project and meet customer requirements using fewer resources. Koskela et al. (2002)
identified it is a system to minimise waste of materials, time and effort to generate the
maximum possible amount of value. Womack and Jones (2003) defined lean construction as
a philosophy that depends on the notion of lean manufacturing, concerning control and
improving the construction process to meet the customer’s needs on time.
Howell (2001) stated that the construction sector is often described as one with many
problems including lack of efficiency. and recommended using the lean construction concept
as a solution. Murman et al. (2002) added that the principles of lean construction include
waste minimisation. Lean construction concepts have recently received attention as a modern
way to improve performance and labour productivity (Abdel-Razek et al., 2007; Koskela,
1992; Lean Construction - Construction Excellence 2004). Abdelhamid and Salem (2005)
presented five principles of lean production in the construction sector: "1. reduce variability;
2. reduce cycle times; 3. minimise the number of steps, parts and linkages; 4. focus control on
the complete process; and 5- balance flow improvement with conversion improvement,
benchmarking, increased output flexibility and improved process transparency".

548
6. THEORETICAL FRAMEWORK
The literature review shows that many studies have been conducted in different countries.
The researches studies focus on factors related to materials management that lead to the delay
of construction projects (see table1).
Table 1: Factors Affecting Construction Projects Countries
Factors
Su
liv
an a
nd
Har
ris
UK
19
86
Od
eh 2
002
In J
ord
an
M
alay
sia
Sam
bas
ivan
20
07
Ay
egb
a
Nig
er 2
01
3
Ow
ola
bi
et a
l,
Nig
eria
201
4
Ph
u a
nd
Ch
o
Bu
rma
201
4
Han
nu
re
Ind
ia 2
01
4
Ng
wu
et
al,
Nig
eria
201
5
Contractor experience
Labour productivity
Improper planning
Unqualified subcontractor
Control cost
Labour cost
Plan management
Poor site management
Poor control of materials wastage
Problems with the subcontractor
Labour supply
Material shortage
The lack of storage space
Delay in material supply
Inadequate supervision
Poor site security
Weather and other natural occurrences
Alterations of designs
Over ordering of materials
The above table indicates delaying factors in different countries around the world. In the UK.
Sulivan and Harris, (1986) highlighted failure to choose the best supplier in the large
construction projects was the key issue, and an alternative was not found. Clearly, materials
management was not considered. In Niger Ayegba (2013) confirmed that delays in materials
supply, weak supervision skills, poor security on site and the weather were the biggest
problems in the construction projects, which shows a lack of materials management. In
Malaysia there were different problems; the supply of labour, subcontractor issues and
improper contractor planning were the major causes of delay, which also means that
materials management was not applied. On the other hand, in Jorden, contractors experience,
labour productivity, improper planning and unqualified subcontractors were the most serious
issues. Another study conducted in Nigeria (2014) highlighted poor site management as a key
issue. However, in Nigeria (Ngwu et al., 2015) added that poor control of waste materials,
materials shortages, the lake of storage space and delays in material supply were also
problematic. In Burma (2014) there was poor control of materials wastages. In considering
the state of construction projects in Libya the literature review showed that Libyan
researchers had explained the reasons for delay; however, construction projects in Libya still
suffer from the risk of delay. For example, Shebob (2012) listed several reasons for delay in
construction projects in Libya including contractor experience, labour productivity, improper
planning, unqualified subcontractors and poor site management. Also, Abuzaid and Balmoor
(2014) listed several problems related to construction and building materials in Libya and
indicated that problems with sources, transport and storage had an impact on the Libyan

549
national economy and environment. The present research will develop a framework for
improving materials management and discuss the factors causing delay that related to
materials management. Thus, poor materials management appears to be the main problem
affecting construction projects in terms of poor planning, uneducated subcontractor, labour
costs, incentive schemes and productivity, plant management and control cost and time and
cost overruns. Handling and waste of materials also key factors. To control the wastage of
materials, this study reveals the need to apply chain management (SCM) to reducing waste by
improving the links between the main contractor, subcontractors/suppliers, designer and
surveyor. It also shows that applying LP to improve SCM downstream in construction sites
will support the designer and subcontractor and improve the processes which lead to the
reduction or removal of waste (see table 2).
Table 2 MM, LP and SCM Processes on the Construction Site Input Process Output
• Contractors unskilled
• Subcontractors/supplier
• Designer
• Surveyor
• Activities
• Unskilled supervision
• Poor materials handling
• Lack of storage
• Waste of materials
• shortage of materials
• improper planning
• Poor site security
• Labour productivity
Supply Chain Management
(SCM)
Lean Construction (LC)
Materials Management (MM)
Zero Waste
Reduced Cost
Time Saved
Table 2 illustrates the role of Materials Management (MM), Supply Chain Management
(SCM) and Lean Construction (LC) in the on-site operation of the construction project. The
table consists of three columns: input, process and output. SCM has an important role in
construction, linking the designer, surveyor, main contractor, client and
subcontractor/supplier. LC thinking ensures that the SCM downstream has improves. The
role of MM is to improve labour productivity, avoid shortage of materials and storage space,
prevent damage to materials and implement appropriate planning. The result of the process is
zero waste, reduced cost and time saved.
7. CONCLUSION
This paper presents a critical literature review of materials management in construction
projects. Moreover, it identified factors affecting in construction projects and causing delay.
for instance, subcontractor/suppler, labour, shortage of materials, lack of store, materials
handling and waste of materials (WM). It shows the need to apply lean construction (LP) and
supply chain (SCM) to improve activities in construction projects and support
subcontractors/suppliers, the designer and the main contractor: the five parts of SCM. LP
improves downstream SCM. The study focuses on handling materials and waste materials as
key factors affecting construction projects and causing delay; it develops a framework to

550
explain the roles of LC, SCM and MM processes on construction sites. Also this paper
highlighted the relation between LP, SCM and material management on site.
8. REFERENCES
Ayegba, C, (2013). An Assessment of Material Management on Building Construction Site.
Civil and Environmental Research, ISSN, 3(5). 2224-5790. Arnold, J.T., Chapman, S.N & Clive, L.M., (2001). Introduction to materials management.
Buys, F. (2015). Five Causes of Project Delay and Cost Overrun, and their Mitigation Measures.
https://www.linkedin.com/pulse/five-causes-project-delay-cost-overrun-mitigation-measures-buys
C. Ngwu, K. C. Okolie& Dr. J. U. Ezeokonkwo, (2015). Effects of Materials Management
on Building Productivity in SE Nigeria. PM World Journal, www.pmworldjournal.net,
IV(VII). 1-10.
Gulghane, A.A. & Khandve, P.P, (2015). Management for Construction Materials and
Control of Construction Waste in Construction Industry: A Review. A. A. Gulghane et al.
Int. Journal of Engineering Research and Applications ISSN : 2248-9622, 5(4). 59-64.
Hendrickson, C & Au, T, (1989). Project management for construction: Fundamental
concepts for owners, engineers, architects, and builders. 1 ed. s.l.:Prentice Hall,ISBN-0-
13-731266-0.
Odeh, A.M. & Battaineh, H.T., (2002). Causes of construction delay: traditional contracts.
International journal of project management,, 20(1). 67-73.
Okorocha, K.A, (2013). Factors Affecting Effective Materials Management in Building
Construction Projects–A Case Study of Selected Building Sites, in Imo State, Nigeria.
International Journal of Management Sciences and Business Research, 2(4). 50-59. Omran, A., Abdulbagei, M.A. and Gebril, A.O. (2012). An evaluation of the critical success factors for
construction projects in Libya. International Journal of Economic Behavior, 2, 17-25.
Omran, A. and Abdulrahim, A., (2015). Barriers to prioritizing Lean construction in the Libyan construction
industry. Acta Technica Corviniensis-Bulletin of Engineering, 8(1), 53.
Owolabi, J.D., Amusan, L.M., Oloke, C.O., Olusanya, O., Tunji-Olayeni, P.F., Dele, O.,
Peter Joy, N. & Omuh, I.O,( 2014). Causes and effect of delay on project construction
delivery time. International Journal of Education and Research, 2(4). 197-208.
Phu, N.L. and Cho, A, (2014). Factors Affecting Material Management in Building
Construction Projects. International Journal of Scientific Engineering and Technology
Research , 03(10). 2133-2137. Remenyi, D. (2002). Research strategies-Beyond the Differences. Electronic Journal of Business Research
Methods.1(1).38-41.
Rumane, A., (2010). Quality management in construction projects. s.l.:CRC Press.
Said, H. & El-Rayes, K, (2011). Optimizing Material Procurement and Storage on
Construction Sites. Journal of Construction Engineering and Management, 137(6). 421-
431.
Sambasivan, M. & Soon, Y.W, (2007). Causes and effects of delays in Malaysian
construction industry. International Journal of project management,
www.elsevier.com/locate/ijproman, 25(5). 517-526.
Shebob, A., Dawood, N. & Shah, R.K, (2012). Development of a methodology for analysing
and quantifying the impact of delay factors affecting construction project. Journal of
Construction Engineering and Project Managemen, 2(3). 17-29.
Shenhar, A.J., Dvir, D., Levy, O & Maltz, A.C, (2001). Project success: a multidimensional
strategic concept. Long range planning, 34(6). 699-725.
Subramani, T & Tamizhanban, S, (2016). Supply Chain Management In Construction Site By
Using SPSS Software. International Journal of Emerging Trends & Technology in
Computer Science (IJETTCS), 5(3). 182-193.

551
Sullivan, A. & Harris, F.C, (1986). Delays on large construction projects. International
journal of operations & production management, 6(1). 25-33.
Udawatta, N., Zuo, J., Chiveralls, K. & Zillante, G, (2015). Improving waste management in
construction projects: an Australian study. Resources, Conservation and Recyclin. 73-83.
Vrijhoef, R & Koskela, L, (2000). The Four Roles of Supply Chain Managment in
Construction.. European of purchasing& supply Management, 6(3). 169-178.
Womack & Jones, (2010). Lean thinking: banish waste and create wealth in your
corporation. s.l.:Simon and Schuster.
Womack, J.P., Jones, D.T. & Roos, D, (1990). The Machine that Changed the World. s.l.:s.n.
Yang, J.B., Huang, K.M., Lee, C.H. & Chiu, C.T, (2013). Incorporating lost productivity
calculation into delay analysis for construction projects. KSCE Journal of Civil
Engineering, 18(2). 380-388.

552
ID 073
THE POTENTIAL OF BIM FOR STAKEHOLDER MANAGEMENT IN
INFRASTRUCTURE PROJECTS
S. Singh, E. Chinyio and S. Suresh
Faculty of Science and Engineering, University of Wolverhampton, Wulfruna Street, WV1 1LY, UK
Email: [email protected]
Abstract: This article which is based on a systematic and critical review of literature is part of
an on-going PhD study in which the capability of Building Information Modelling (BIM) to
manage stakeholders effectively is being explored. Numerous infrastructures have either failed
or ran out of budget and time due partly to ineffective stakeholder management. Indeed
stakeholder management is critically essential especially when the project is large and
complex. Meanwhile BIM is changing the traditional modus operandi of delivering
construction projects and is suitable for addressing the issues of sustainability, waste
management, 3d, clash detection and stakeholder management. The critical success factors
(CSFs) of using BIM to manage stakeholders have been established as: it facilitates and
expedites communication, collaboration and more reliable decision making. The key features
of stakeholder management were also analysed and mapped against these CSFs to identify
how they are interrelated. This mapping led to the development of a conceptual framework
which is presented. The findings show that BIM has got huge potential to assist in the
effective management of external and especially internal stakeholders. The findings can
greatly help project managers to manage stakeholders more effectively as part of their many
core responsibilities.
Keywords: BIM, collaboration, communication, project managers, stakeholder management.
1. INTRODUCTION
Infrastructure projects differ from other projects because they have high uncertainty, high
capital investment, high risks, high complexity, political sensitivity, complex procurement
arrangements, long durations, significant socio-economic impact and are linked to diverse
stakeholders directly or indirectly from planning till completion stage. As the size and/or
complexity of a construction project increases, the number of stakeholders’ increases and as
stakeholders are in vast numbers, so they have varying needs, demands, interests, rights,
backgrounds, power, among others (Baharuddin et al., 2016; Aapaoja et al., 2013; Giezen,
2012). Therefore, they have a very strong social attribute (Jia et al., 2011). Due to this they
usually face opposition from NGO’s, interested groups, community, among others, which can
lead to cost overruns, significant delays or sometimes even project fails to deliver the
expected value. There are numerous studies by various authors showing the essence of
stakeholder management such as by: Aaltonen et al., (2008), Schepper et al., (2014), El-
Gohary et al., (2006).
Missonier and Loufrani-Fedida (2014) postulated that projects fail due to ineffective social
interactions between the project stakeholders rather than due to lacking or ineffective project
management practises. Projects that actively engage with stakeholders are highly likely to
succeed. The main purpose to engage with stakeholders is to make them believe that their
needs and preferences would be incorporated in the project (Baharuddin et al., 2016). BIM
advocates stakeholder engagement and has the potential to increase social interactions by

553
facilitating and expediting communication, collaboration and decision making among project
stakeholders.
The next section will discuss BIM and stakeholder management. The sections after that will
consecutively cover methodology, framework, results and discussion, and conclusion.
2. CRITICAL LITERATURE REVIEW
2.1 Building Information Modelling (BIM)
The concept of BIM was developed in mid-1970s by Eastman and was called Building
Description Systems (Cao et al., 2015) and was originated at Georgia Institute of Technology
(Rokooei, 2015). The National Building Information Model Standard (NBIMS) defines BIM
as “Building Information Modelling (BIM) is a digital representation of physical and
functional characteristics of a facility creating a shared knowledge resource for information
about it forming a reliable basis for decisions during its life cycle, from earliest conception to
demolition”. This definition does not present an explicit relationship between BIM and
project stakeholder management because in the first instance it gives reflection of technical
aspect mainly. However, Succar (2009, p.357) defined BIM as “a set of interacting policies,
processes and technologies that generating a methodology to manage the essential building
design and project data in digital format throughout the building’s life-cycle”. This definition
promotes the holistic nature of BIM that also incorporates project management related tools
and processes in addition to the software’s that enables 3D modelling and input of
information. Therefore, from this perspective BIM is viewed as a tool for project
management (Bryde et al., 2013). Therefore, Succar’s (2009) definition is adopted as a basis
for this research.
BIM data incorporates geometry, spatial relationships, geographic information, quantities and
properties of building components, and can be used to elucidate the whole lifecycle of a
facility (Smith, 2013) whereas traditional CAD objects do not hold any metadata or very less
metadata (Succar, 2009). Throughout the project lifecycle BIM acts as an information
repository for all project stakeholder, hence it keeps on developing as the project progresses
(Sebastian, 2011).
2.1.1 Strengths of BIM
The various aspects in which BIM can be helpful in managing stakeholders are:
(1) Communication – the characteristic of a federated model to input, modify and analyse
data will enhance communication between different project participants and make them to
coordinate as well thus reducing the disputes between different project participants. BIM acts
as a repository of information and thus enables all stakeholders to assess the same version of
data which consequently reduces the risk of poor communication (Rokooei, 2015). It
facilitates communication among project participants relative to spatial, logistical, material,
performance specifications and requirements (Love et al., 2011). Moreover, as all the data is
in 3D, it facilitates the use of real-time visualisations as a tool to share information and
communicate ideas among different stakeholders (Johansson et al., 2015; Wong and Zhou,
2015) because 3D models are relatively easy to understand than 2D models where a person
has to analyse the drawing first and then to visualise what a structure would look like in 3D.

554
Communication is a key factor to develop mutual understanding about objectives of the
project among stakeholders (Fazli et al., 2014). To keep key stakeholders satisfied, it is must
to provide them with constant information about the project and decisions taken especially
the construction projects which have considerable impact on the public. Open and
trustworthy communication plays a key role in keeping media and affected stakeholders
satisfied (Manowong and Ogunlana, 2010). By good communication, different requirements
of stakeholders can be addressed. To satisfy stakeholders requirements communication is not
the only solution but it plays a key role in satisfying stakeholders (Khafaji et al., 2010).
(2) Collaboration and team building – BIM provides project managers opportunities to
improve and promote collaboration among stakeholders (Bryde et al., 2013) because different
models prepared by different parties are federated into one model, so all parties have to work
on one model simultaneously as a team (Rokooei, 2015). Moreover, it provides opportunities
to project participants to collaborate as well during the various stages of a facility’s lifecycle
by enabling them to create, amend, update, extract and reuse information throughout the
project lifecycle (Alreshidi et al., 2017; Getuli, 2016; Sebastian, 2011) which will reflect
their roles and support other’s roles. It provides time and place restriction-free collaborative
working platform (Sebastian, 2011). It promotes integrated project delivery (IPD) approach
which in itself promotes collaboration among project stakeholders (Eastman, 2011).
According to Liu et al., (2017) when designers and contractors collaborate intensely in the
environment of BIM, they openly share information which enables other project participants
to understand their expectations in a better way, helps to anticipate their actions and offers a
willingness to help them. Different project teams show a commitment to each other. This
eventually generates an atmosphere of trust and hence the trust between teams is enhanced.
Liu et al., (2017) investigated in their research that BIM made project stakeholders to meet
frequently which resulted in generating higher trustworthy environment and strengthening
their relationships. For instance, Azhar (2011) investigated in his research that in Savannah
State University (Georgia), stakeholders organised several collaborative sessions to discuss
three virtual models (made by using BIM tool) with client. This enhanced communication
and trust between them and facilitated quick decision making which eventually helped to
save $1,995,000 at the pre-design stage by helping to select most economical design.
(3) Facilitates decision making – BIM models are usually composed of objects rather than
geometries (such as line, surface etc.). Thus, whole model can be broken down into small and
distinct objects which facilitates to have a clear and defined scope of a project. This enables
to take better estimation and management decisions (Rokooei, 2015). Zhang and Hu (2011)
has discussed 4 levels of 4D in BIM which can help project managers in different aspects
such as: to find integrated solutions that includes process simulation, conflict analysis,
dynamic management, safety analysis. All this data can be linked to 5d to get cost estimation
(Smith, 2014). This will help project managers to analyse their decisions (Rokooei, 2015).
BIM holds a vast amount of electronic information related to a project as compared to 2D
drawings and specifications. As this is electronic information, it can be easily extracted
(partially or as a whole) and can be exchanged quickly, efficiently and can be reused as well.
This accumulated information can be helpful in making decisions (Porwal and Hewage,
2013). Moreover, BIM tools makes it easy to see the consequences of decisions taken which
eventually enables project managers to perform effectively (Fazli et al., 2014).
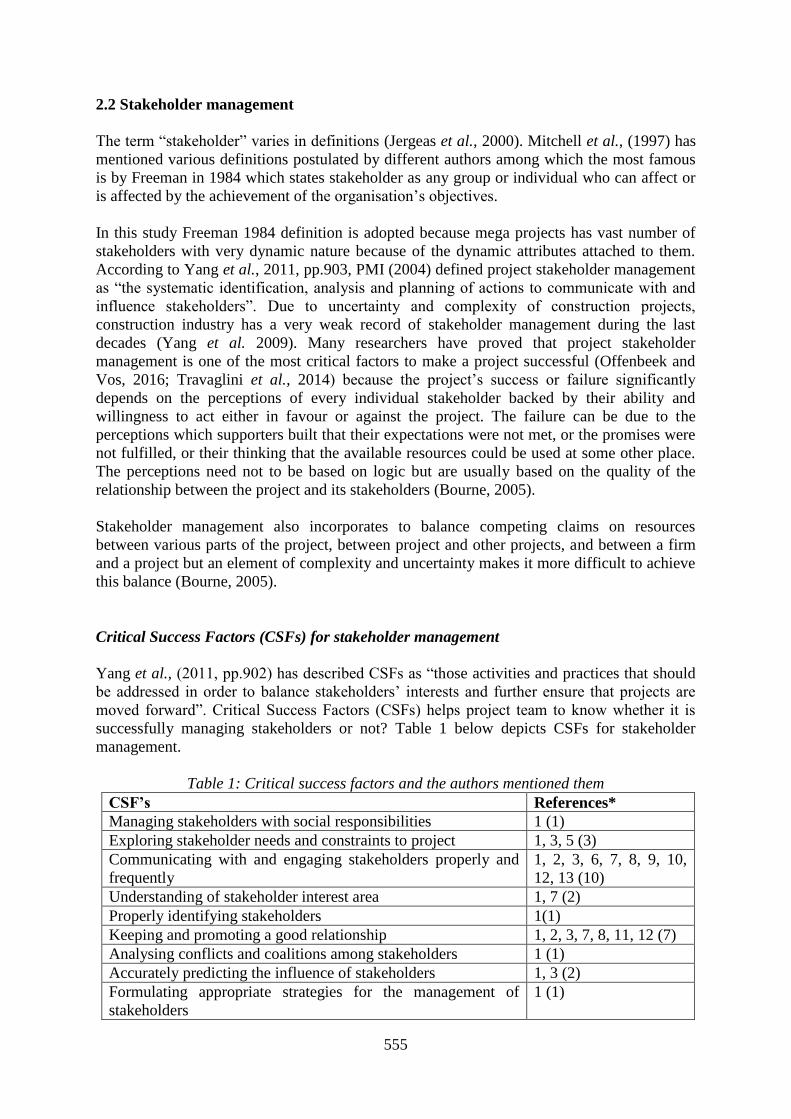
555
2.2 Stakeholder management
The term “stakeholder” varies in definitions (Jergeas et al., 2000). Mitchell et al., (1997) has
mentioned various definitions postulated by different authors among which the most famous
is by Freeman in 1984 which states stakeholder as any group or individual who can affect or
is affected by the achievement of the organisation’s objectives.
In this study Freeman 1984 definition is adopted because mega projects has vast number of
stakeholders with very dynamic nature because of the dynamic attributes attached to them.
According to Yang et al., 2011, pp.903, PMI (2004) defined project stakeholder management
as “the systematic identification, analysis and planning of actions to communicate with and
influence stakeholders”. Due to uncertainty and complexity of construction projects,
construction industry has a very weak record of stakeholder management during the last
decades (Yang et al. 2009). Many researchers have proved that project stakeholder
management is one of the most critical factors to make a project successful (Offenbeek and
Vos, 2016; Travaglini et al., 2014) because the project’s success or failure significantly
depends on the perceptions of every individual stakeholder backed by their ability and
willingness to act either in favour or against the project. The failure can be due to the
perceptions which supporters built that their expectations were not met, or the promises were
not fulfilled, or their thinking that the available resources could be used at some other place.
The perceptions need not to be based on logic but are usually based on the quality of the
relationship between the project and its stakeholders (Bourne, 2005).
Stakeholder management also incorporates to balance competing claims on resources
between various parts of the project, between project and other projects, and between a firm
and a project but an element of complexity and uncertainty makes it more difficult to achieve
this balance (Bourne, 2005).
Critical Success Factors (CSFs) for stakeholder management
Yang et al., (2011, pp.902) has described CSFs as “those activities and practices that should
be addressed in order to balance stakeholders’ interests and further ensure that projects are
moved forward”. Critical Success Factors (CSFs) helps project team to know whether it is
successfully managing stakeholders or not? Table 1 below depicts CSFs for stakeholder
management.
Table 1: Critical success factors and the authors mentioned them
CSF’s References*
Managing stakeholders with social responsibilities 1 (1)
Exploring stakeholder needs and constraints to project 1, 3, 5 (3)
Communicating with and engaging stakeholders properly and
frequently
1, 2, 3, 6, 7, 8, 9, 10,
12, 13 (10)
Understanding of stakeholder interest area 1, 7 (2)
Properly identifying stakeholders 1(1)
Keeping and promoting a good relationship 1, 2, 3, 7, 8, 11, 12 (7)
Analysing conflicts and coalitions among stakeholders 1 (1)
Accurately predicting the influence of stakeholders 1, 3 (2)
Formulating appropriate strategies for the management of
stakeholders
1 (1)

556
Assessing attributes of stakeholders 1 (1)
Effectively resolving conflicts among stakeholders 1, 7 (2)
Formulating a clear statement of project missions (common
goals, objectives and project priorities)
1, 2, 3, 4 (4)
Predicting stakeholder reactions to implementation of the
strategies
1 (1)
Analysing the changes in stakeholder influences and
relationships
1 (1)
Assessing stakeholder behaviour 1 (1)
Decisions taken without analysing consequences on
stakeholders
3 (1)
Build and maintain a base of trust 3, 7, 10, 14 (4)
Early involvement of key project participants 4, 12, 15, 16, 17 (5)
Proactive interaction with affected stakeholders to mitigate
potentially arising conflicts
3 (1)
*1 = Yang et al., (2009) 2 = Jergeas et al., (2000) 3 = Olander and Landin (2008) 4 =
Smith (2013) 5 = Bourne (2005) 6 = Bakens et al., (2005) 7 = Aaltonen et al., (2008) 8 =
Rowlinson and Cheung (2008) 9 = Bourne and Walker (2005) 10 = Hartman (2000) 11 =
Olander (2006) 12 = Yong and Mustaffa (2013) 13 = Khafaji et al., (2010) 14 =
Schepper et al., (2014) 15 = Erkul et al., (2016) 16 = El-Gohary, et al., (2006) 17 =
Missonier and Loufrani-Fedida (2014)
Table 1 shows that communication is the most important CSF for stakeholder management
(mentioned by 10 authors). This is followed by relationship management (7 authors) which is
further followed by early involvement of project stakeholders (5 authors) and by trust
building (4 authors) and setting common goals (4 authors).
This can be enhanced with the use of BIM. Prior to discussing about the conceptual
framework, the methodology is discussed.
3. METHODOLOGY
Literature was reviewed. Content analysis was adopted as a basis for the methodology
because it enables researchers to analyse vast amount of data in an organised manner. It is a
technique to compress many words into fewer content categories (Mok et al., 2015). NVivo
software was used to analyse the content and to code themes. The search engines used were
EBSCO host, Web of Science and Science Direct. Second approach to search articles was
also adopted to search as many articles as possible. In that approach, journals were searched
by their names in university’s e-journals database. Then for a particular journal it’s each
volume, and each issue of each volume was explored dating back to 2000. The journals
searched in this way were International Journal of Project management, Construction
Management and Economics, Journal of Civil Engineering and Management, Automation in
Construction. For example, in “Automation in Construction” there are 62 articles published
related to BIM from 2015-2017, 47 from 2013-2014, 8 in 2012, 10 in 2011, 11 in 2010, 4 in
2009 and almost negligible number from 2000 till 2008. This shows that research related to
BIM increased pace from 2013. One hundred eighty-six articles were read and summarized.
In this paper the articles which are cited are referenced only. The analysis of 186 articles
provided a comprehensive view about the research area and helped to set a base to identify
the relationship between the two main topics. The searching of articles and refining of

557
literature review will continue into the data collection and analysis stage. Table 2 shows the
frequency of articles citied from various journals. The contents teased out related to both
stakeholders and BIM are mentioned in Figure 1. The strengths of BIM were analysed from
and applied to effective stakeholder management.
Figure 1: The topics researched on stakeholder management and BIM and the relation they
have
Table 2: Number of articles cited in this paper
Publication source: Journals or conference paper Number of
articles cited
AACE International Transactions 1
Academy of Management Review 1
Automation in Construction 6
Building Research and Information 1
Construction Information Services 1
Construction Management and Economics 4
Engineering, Construction and Architectural Management 1
International Journal of Performance Management 1
International Journal of Project Management 12
Journal of Building Engineering 1
Journal of Civil Engineering and Management 1
Leadership & Management in Engineering 1
Management Decisions 1
Organisation, Technology and Management in Construction 1
PMI Research Conference (2000) 1
Procedia Engineering 2
Procedia Social and Behavioural Sciences 2
Procedia Technology 1
Proceedings of the CIB World Building Congress (2016) 1
Research in Engineering Design 1
4. CONCEPTUAL FRAMEWORK
The conceptual framework in Figure 2 illustrates how the strengths of BIM can assist in
effective stakeholder management whereas Figure 3 shows in detail the interrelationships
between various elements required for effective stakeholder management.
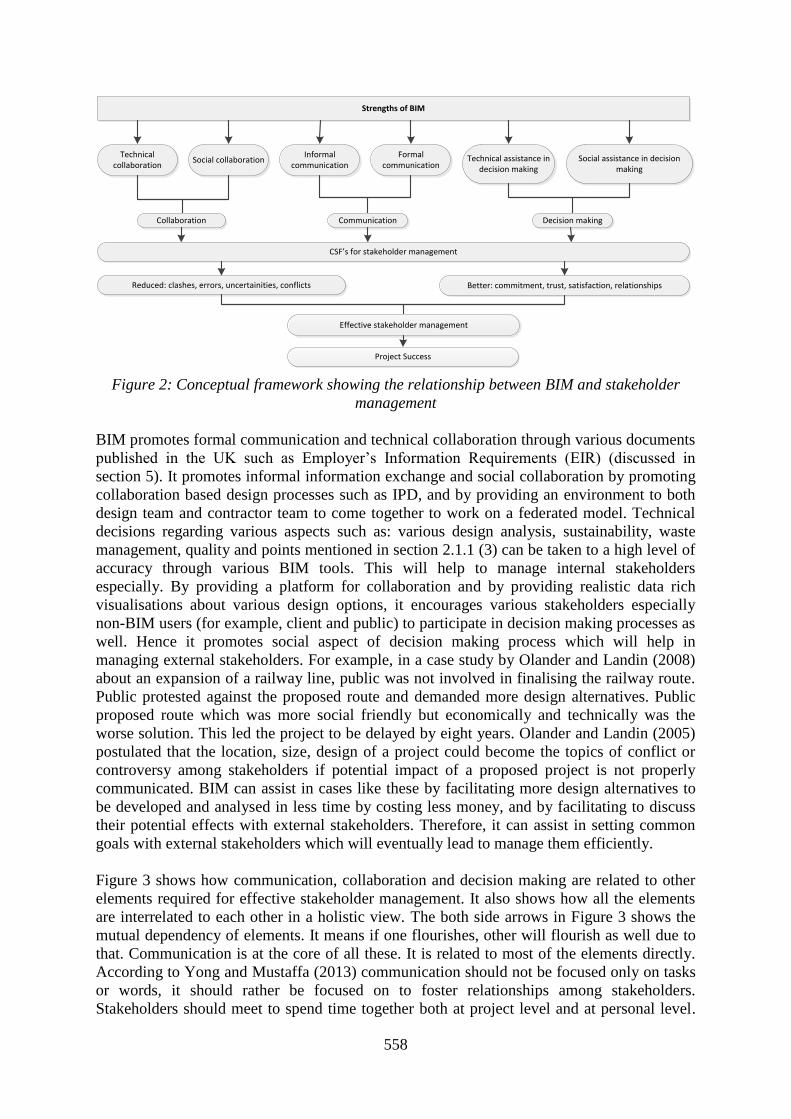
558
Strengths of BIM
Technical collaboration
Technical assistance in decision making
Social collaboration Social assistance in decision making
Formal communication
Informal communication
Collaboration Communication Decision making
CSF’s for stakeholder management
Reduced: clashes, errors, uncertainities, conflicts Better: commitment, trust, satisfaction, relationships
Effective stakeholder management
Project Success
Figure 2: Conceptual framework showing the relationship between BIM and stakeholder
management
BIM promotes formal communication and technical collaboration through various documents
published in the UK such as Employer’s Information Requirements (EIR) (discussed in
section 5). It promotes informal information exchange and social collaboration by promoting
collaboration based design processes such as IPD, and by providing an environment to both
design team and contractor team to come together to work on a federated model. Technical
decisions regarding various aspects such as: various design analysis, sustainability, waste
management, quality and points mentioned in section 2.1.1 (3) can be taken to a high level of
accuracy through various BIM tools. This will help to manage internal stakeholders
especially. By providing a platform for collaboration and by providing realistic data rich
visualisations about various design options, it encourages various stakeholders especially
non-BIM users (for example, client and public) to participate in decision making processes as
well. Hence it promotes social aspect of decision making process which will help in
managing external stakeholders. For example, in a case study by Olander and Landin (2008)
about an expansion of a railway line, public was not involved in finalising the railway route.
Public protested against the proposed route and demanded more design alternatives. Public
proposed route which was more social friendly but economically and technically was the
worse solution. This led the project to be delayed by eight years. Olander and Landin (2005)
postulated that the location, size, design of a project could become the topics of conflict or
controversy among stakeholders if potential impact of a proposed project is not properly
communicated. BIM can assist in cases like these by facilitating more design alternatives to
be developed and analysed in less time by costing less money, and by facilitating to discuss
their potential effects with external stakeholders. Therefore, it can assist in setting common
goals with external stakeholders which will eventually lead to manage them efficiently.
Figure 3 shows how communication, collaboration and decision making are related to other
elements required for effective stakeholder management. It also shows how all the elements
are interrelated to each other in a holistic view. The both side arrows in Figure 3 shows the
mutual dependency of elements. It means if one flourishes, other will flourish as well due to
that. Communication is at the core of all these. It is related to most of the elements directly.
According to Yong and Mustaffa (2013) communication should not be focused only on tasks
or words, it should rather be focused on to foster relationships among stakeholders.
Stakeholders should meet to spend time together both at project level and at personal level.

559
Effective communication is a critical tool to maintain existing relationships (Chinyio and
Akintoye, 2008; Khafaji et al., 2010).
Stakeholder engagement at an early stage can assist in tackling various CSF’s. For example,
it can help in exploring stakeholders’ needs and constraints to projects, can help in
understanding stakeholders’ interest area, can help in properly identifying them, can help in
analysing conflicts and coalitions among stakeholders, can help in assessing their attributes,
can help in effectively resolving their conflicts, can helps in setting common goals. As BIM
promotes collaboration and early stakeholder involvement, so these CSF’s can be indirectly
implemented with the help of BIM.
Explicitly, properly and mutually set common goals enhances commitment among
stakeholders because common goals ensure that stakeholders’ requirements are well
understood and satisfactorily fulfilled. Stakeholders who have good understanding of the
project objectives engage with project more closely (Manowong and Ogunlana, 2010).
Strong relationships with stakeholders are directly linked to the project success as these make
stakeholders to engage more closely and with more commitment (Khafaji et al., 2010;
Manowong and Ogunlana, 2010). Stakeholders’ relationships can contribute insight,
knowledge and support in refining project vision and objectives (Bourne, 2005).
Trust is a key element in any organisation dealing with communication (whether formal or
informal or regular project reports) in maintaining the relationships (Bourne, 2005). Hartman
(2000) postulated that trust increases effective communication, reinforces relationships,
improves team work. The project managers who are trusted by their teams, clients and
suppliers are more successful.
Figure 3: Interrelationship of various elements required for effective stakeholder
management

560
5. RESULTS AND DISCUSSION
As the purpose of BIM is the management of information, hence it places BIM strongly in a
category of project management (Travaglini et al., 2014). Succar (2009) has mentioned
various guides, reports and visions developed by different countries to facilitate the adoption
of BIM but he has not specified any documents and guides published in the UK. The reason
can be that these documents are published few years after his article was published. The
documents and guides published in the UK are PAS 1192-2:2013, PAS 1192-3:2014, PAS
1192-5:2015, CIC BIM Protocol, BIM Execution Plan (BEP), Employers Information
Requirements (EIR), among others. All these documents are interrelated and are required to
be followed on a BIM implemented project. Hence it can be inferenced from this that BIM is
more of a process than just 3d cad modelling for visualisation and clash detections otherwise
there was no need of these documents to be produced. Now processes are the core
responsibility of project managers to manage. So, it means project managers has to increase
their scope of knowledge to actually understand BIM processes by understanding all the
above-mentioned documents so that they can unleash the full potential of BIM to all fields
related to project management (including stakeholder management).
Employer’s Information Requirements (EIR) is a document which is designed to be included
in the tender documents for the procurement process of both design and constructor team. It a
key document with regards to communication information requirements and information
management requirements. It clearly divides its content into three parts: technical,
management and commercial. The “management” aspect demands the explicit description of
coordination and clash detection process, and collaboration process as well from the bidders.
Moreover, it demands the explicit explanation about standards to be used and roles and
responsibilities of each party (EIR Version 7 2013). This will make project stakeholders to
overcome the boundaries of procurement approaches (for example, traditional procurement
approach) and contractual barriers and make them to collaborate and coordinate with each
other. This is because Liu et al., (2017) investigated that legal and contractual issues often
become barriers for project stakeholders to work collaboratively. Furthermore, CIC BIM
Protocol (2013) sets the responsibility for employer to appoint an Information Manager who
will not have any duty related to the design of a project. Out of the four key responsibilities
stated in BIM Protocol (2013) for Information Manager, two are: managing the processes and
procedures for information exchange on projects, and implementation of the BIM Protocol.
This will help in taking better decisions by preventing information loss which usually occurs
while exchanging information between various stakeholders and misinterpretation of
information which often leads to communication problems. Moreover, traditional ways to
exchange information in isolated files were also responsible to miss many opportunities for
coordination. PAS 1192-2:2013 requires to answer the “Plain Language Questions” at each
stage with appropriate level of detail. Stage 0 and stage 1 have questions related to
stakeholder’s needs as well (PAS 1192:2-2013).
Several companies have developed different software and mobile applications to promote
collaboration between project participants. For example, BIM+ (Allplan A Nemetschek
Company, 2017), Sablono (Sablono, 2017), Clever (Clever, 2017), among others. Sablono is
specifically designed for project managers or project controllers to manage projects from
anywhere. This will help in tracking and analysing decisions taken. Clever facilitates
communication with non-BIM users or project stakeholders. No special hardware or software
is required by non-BIM users to access Clever.

561
Most of the literature has focused only on exploring the benefits of BIM related to: 3d, 4d,
5d, waste management (which is called lean construction), sustainability (which is called
Green BIM). There is paucity of research exploring the benefits of BIM related to stakeholder
management. The few researchers, namely, Bryde et al., (2013); Smith (2013); Rookie
(2015); Travaglini et al., (2014) and Fazli et al., (2014) have explored and specified the
benefits of BIM related to project management but they have not specified any tangible
benefits related to stakeholder management (as stakeholder management is also a part of the
role of project managers). However, it is acknowledged that those benefits will help project
managers to take better decisions so eventually they will help project managers to manage
internal stakeholders effectively but external stakeholders are still ignored and they can be the
most problematic on large infrastructure projects. This study has provided a view of an
unexplored aspect of BIM and has set a foundation to develop this view further.
6. CONCLUSION
This paper has focused on identifying critical success factors for stakeholder management.
Thereafter by correlating them with the essence of BIM to prepare a conceptual framework.
Findings show that communication, collaboration, trust, relationship management,
stakeholder engagement are all directly interrelated concepts. Developing and maintaining
trusty relationships is the key for managing stakeholders effectively. But communication and
collaboration are the basis of all aspects. So by increasing communication and collaboration
among project stakeholders, they can be managed effectively. Stakeholder engagement at the
early stage of a project is required to get information about their concerns, needs,
expectations, and to set common goals and increase satisfaction. Again to make stakeholder
engagement effective, it needs effective communication (which is planned, tailored, focused,
targeted and timely). The findings show that BIM promotes technical collaboration and
formal communication between stakeholders and project manager, and among stakeholders
themselves. It promotes social collaboration by promoting the use of the IPD approach which
in turn promotes informal communication. It further assists project managers in taking more
reliable decisions in real-time concerning various aspects which eventually assist them in
managing stakeholders as well among other aspects like time, cost and quality. BIM has a
huge potential to manage internal stakeholder effectively on large infrastructure projects by
mitigating clashes, errors and uncertainties. It provides a platform to manage external
stakeholders by promoting the IPD approach and by facilitating stakeholder engagement at
the early stage of a project. For future research data will be collected from industry (on BIM
implemented projects) to investigate how BIM had assisted in stakeholder management and
also to investigate the knowledge of project managers about the BIM implementing
processes.
7. REFERENCES
Aaltonen, K., Jaakko, K. and Tuomas, O. (2008) Stakeholder salience in global projects. International Journal
of Project Management. 26(509-516).
Aapaoja, A., Kinnunen, T. and Haapasalo, H. (2013) Stakeholder salience assessment for construction project
initiation. International Journal of Performance Measurement. 3(2).
Allplan A Nemetschek Company (2017) BIM+ [online]. [Accessed 12th April, 2012]. Available at:
https://www.allplan.com/it/bimplus.html
Alreshidi, E., Mourshed, M. and Rezgui, Y. (2017) Factors for effective BIM governance. Journal of Building
Engineering. 10, pp.89-101.

562
Azhar, S. (2011) Building Information Modeling (BIM): Trends, Benefits, Risks, and Challenges for the AEC
Industry. Leadership & Management in Engineering. 11(3), pp.241-252.
Baharuddin, H.E.A., Wilkinson, S. and Costello, S.B. (2016) Improving early stakeholder engagement process
for infrastructure projects. Proceedings of the CIB World Building Congress. 1, pp.262-273.
Bakens, W., Foliente, G. and Jasuja, M. (2005) Engaging stakeholders in performance based building: lessons
from the Performance-Based Building (PeBBu) Network. Building Research and Information. 33(2),
pp.149-158.
Bourne, L. (2005) Project Relationship Management and the Stakeholder CircleTM. PhD. Thesis, RMIT
University.
Bourne, L. and Walker, D.H.T. (2005) Visualising and mapping stakeholder influence. Management Decisions.
43(5), pp.649-660.
Bryde, D., Broquetas, M. and Volm, J.M. (2013) The project benefits of Building Information Modelling (BIM).
International Journal of Project Management. 31(7), pp.971-980.
Cao, D., Wang, G., Li, H., Skitmore, M., Huang, T. and Zhang, W. (2015) Practices and effectiveness of
building information modelling in construction projects in China. Automation in Construction. 49(A),
pp.113–122.
Chinyio, E.A. and Akintoye, A. (2008) Practical approaches for engaging stakeholders: Findings from the UK.
Construction Management and Economics. 26, pp.591-599.
CIC BIM Protocol (2013). [Accessed 12th April, 2017]. Available at: http://www.bimtaskgroup.org/wp-
content/uploads/2013/02/The-BIM-Protocol.pdf.
Clever (2017) The role of CL3VER in the Stakeholder management of BIM projects [online]. [Accessed 12th
April, 2017]. Available at: https://www.cl3ver.com/blog/the-role-of-cl3ver-in-the-stakeholder-
management-of-bim-projects/
Eastman, C., Teicholz, P., Sacks, R. and Liston, K. (2011) BIM Handbook: a guide to building information
modeling for owners, managers, designers, engineers, and contractors. 2nd ed. New Jersy: John Wiley &
Sons.
El-Gohary, N. M., Osma, H. and El-Diraby, T. E. (2006) Stakeholder management for public private
partnerships. International Journal of Project Management. 24, pp.595-604.
Employer’s Information Requirements (EIR Version 7 2013) [Accessed 12th April, 2017]. Available at:
http://www.bimtaskgroup.org/wp-content/uploads/2013/04/Employers-Information-Requirements-Core-
Content-and-Guidance.pdf
Erkul, M., Yitmen, I. and Celik, T. (2016) Stakeholder Engagement in Mega Transport Infrastructure Projects.
Procedia Engineering. 161, pp.704-710.
Fazli, A., Fathi, S., Enferadi, M.H., Fazli, M. and Fathi, B. (2014) Appraising effectiveness of Building
Information Management (BIM) in project management. Procedia Technology. 16, pp.1116-1125.
Getuli, V., Ventura, S.M., Capone, P. and Ciribini, A.L.C. (2016) A BIM-based Construction Supply Chain
Framework for Monitoring Progress and Coordination of Site Activities. Procedia Engineering. 164,
pp.542 – 549.
Giezen, M. (2012) Keeping it simple? A case study into the advantages and disadvantages of reducing
complexity in mega project planning. International Journal of Project Management. 30(7), pp.781-790.
Hartman, F. T. (2000). The role of TRUST in project management. Paper presented at PMI® Research
Conference 2000: Project Management Research at the Turn of the Millennium, Paris, France. Newtown
Square, PA: Project Management Institute. [Accessed 25th May, 2016]. Available at:
http://www.pmi.org/learning/library/role-trust-project-management-1095
Jergeas, G.F., Williamson, E., Skulmoski, G.J. and Thomas, J.L. (2000) Stakeholder management on
construction projects. AACE International Transactions. pp.1-5.
Jia, G., Yang, F., Wang, G., Hong, B. and You, R. (2011) A study of mega project from a perspective of social
conflict theory. International Journal of Project Management. 29(7), pp.817-827.
Johansson, M., Roupe, M. and Sijysema, P. (2015) Real-time visualisation of building information models
(BIM). Automation in Construction. 54, pp.69-82.
Khafaji, A.W., Oberhelman, D.R., Baum, W. and Koch, B. (2010) Communication in stakeholder management.
in Chinyio, E. and Olomolaiye, P. (eds) Construction Stakeholder Management. Chichester: Wiley-
Blackwell, pp.159-173.
Liu, Y., Nederveen, S.V. and Hertogh, M. (2017) Understanding effects of BIM on collaborative design and
construction: An empirical study in China. International Journal of Project Management. 35, pp.686-698.
Love, P.E.D., Edwards, D.J., Han, S., Goh, Y.M. (2011) Design error reduction: toward the effective utilization
of building information modeling. Research in Engineering Design. 22(3), pp.173-187.
Manowong, E. and Ogunlana, S. (2010) Strategies and Tactics for Managing Construction Stakeholders. in
Chinyio, E. and Olomolaiye, P. (eds) Construction Stakeholder Management. Chichester: Wiley-Blackwell,
pp.123-134.

563
Missonier, S. and Loufrani-Fedida, S. (2014) Stakeholder analysis and engagement in projects: From
stakeholder relational perspective to stakeholder relational ontology. International Journal of Project
Management. 32, pp.1108-1122.
Mitchell, R.K., Agle, B.R. and Wood, D.J. (1997) Towards a Theory of Stakeholder Identification and Salience:
Defining the Principle of Who and What Really Counts. Academy of Management Review, 22(4), pp.853-
886.
Mok, K.Y., Shen, G.Q. and Yang, J. (2015) Stakeholder management studies in mega construction projects. A
review and future directions. International Journal of Project Management. 33, pp.446-457.
National Building Information Model Standard (NBIMS) (2016) Frequently asked questions about the National
BIM Standard-United States™ [online]. [Accessed 23rd December, 2016]. Available at: <
https://www.nationalbimstandard.org/faqs#faq1>.
Offenbeek, M.A.G. and Vos, J.F.J. (2016) An integrative framework for managing project issues across
stakeholder groups. International Journal of Project Management. 34, pp.44-57.
Olander, S. (2006) External Stakeholder Analysis in Construction Project Management [Online]. Ph.D. Thesis,
University of Lund. [Accessed 20th April, 2016]. Available at:
http://citeseerx.ist.psu.edu/viewdoc/download?doi=10.1.1.452.728&rep=rep1&type=pdf
Olander, S. and Landin, A. (2005) Evaluation of stakeholders influence in the implementation of construction
projects. International Journal of Project Management. 23, pp.321-328.
Olander, S. and Landin, A. (2008) A comparative study of factors affecting the external stakeholder
management process. Construction Management and Economics. 26, pp.553-561.
PAS 1192-2:2013 [Accessed 12th April, 2017]. Available at: http://bim-level2.org/en/standards/
Porwal, A. and Hewage, K.N. (2013) Building Information Modeling (BIM) partnering framework for public
construction projects. Automation in Construction. 31, pp.204-214.
Rokooei, S. (2015) Building Information Modeling in Project Management: Necessities, Challenges and
Outcomes. Procedia - Social and Behavioral Sciences. 210, pp.87-95.
Rowlinson, S. and Cheung, Y. K. F. (2008) Stakeholder management through empowerment: modelling project
success. Construction Management and Economics. 26, pp.611-623.
Sablono (2017) Progress Monitoring for Construction Projects [online]. [Accessed 12 th April, 2017]. Available
at: https://www.sablono.com/en/the-platform/features/
Schepper, S.D., Dooms, M. and Haezendonck, E. (2014) Stakeholder dynamics and responsibilities in Public–
Private Partnerships: A mixed experience. International Journal of Project Management. 32, pp. 1210-
1222.
Sebastian, R. (2011) Changing roles of the clients, architects and contractors through BIM. Engineering,
Construction and Architectural Management. 18(2), pp.176-187.
Smith, M. (2013) BIM and Project Management. Construction Information Services.
Smith, P. (2014) BIM & the 5D Project Cost Manager. Procedia – Social and Behavioural Sciences. 119,
pp.475-484.
Succar, B. (2009) Building information modelling framework: A research and delivery foundation for industry
stakeholders. Automation in Construction. 18(3), pp.357-375.
Travaglini, A., Radujkovic, M. and Mancini, M. (2014) Building Information Modelling (BIM) and Project
Management: a Stakeholders Perspective. Organisation, Technology and Management in Construction.
6(2), pp.1058-1065.
Wong, J.K.W. and Zhou, J. (2015) Enhancing environmental sustainability over building life cycles through
green BIM: A review. Automation in Construction. 57, pp.156-165.
Yang, J., Shen, G.Q., Ho, M., Drew, D.S. and Chan, A.P.C. (2009) Exploring critical success factors for
stakeholder management in construction projects. Journal of Civil Engineering and Management. 15(4),
pp.337-348.
Yang, J., Shen, G.Q., Ho, M., Drew, D.S. and Xue, X. (2011) Stakeholder management in construction: An
empirical study to address research gaps in previous studies. International Journal of Project Management.
29, pp.900-910.
Yong, Y.C. and Mustaffa, N.E. (2013) Critical success factors for Malaysian construction projects: an empirical
assessment. Construction Management and Economics, 31(9), pp.959-978.
Zhang, J.P. and Hu, Z.Z. (2011) BIM- and 4D-based integrated solution of analysis and management for
conflicts and structural safety problems during construction: 1. Principles and methodologies. Automation
In Construction. 20, pp.155-166.

564
ID 085
THE EVOLUTION OF ETHICS IN THE IRISH REAL ESTATE
PROFESSION
L. Colley and L. Scott
School of Surveying & Construction Management, Dublin Institute of Technology, Ireland
Email: [email protected]
Abstract: Since the Economic Collapse of 2008 much discussion and analysis of the role of
ethics in the financial sector in Ireland has occurred. However little if any of this focus has
been on the real estate profession. The purpose of this paper is to examine how the Irish Real
Estate Profession deals with the issue of ethics. How has this relationship evolved over time?
Has the Irish political context influenced the approach to ethics on a societal level and has this
fed into the profession’s approach? The role of ethics education is also examined in current
Irish real estate qualifications, Property Services Regulatory Authority license requirements
and the various professional body membership requirements.
The first phase of this research project has addressed the underpinning and background
research literature on this topic. The evidence indicates that the Irish Real Estate Profession
relies on a self-regulation approach to ethics in line with global RICS Standards. The literature
review indicates that very little data exists on complaints and reprimands. Ethics forms a
tokenistic element of education for the profession and in continued professional development.
The issue of “whistle-blowers” is also a complex one in an Irish context and is currently being
debated at a national level.
Keywords: Education, Ethics, Ireland, Real Estate, Self-Regulation.
1. INTRODUCTION
This paper addresses the ethical evolution of the Irish real estate profession from 1900 to
2017 which forms part of the literature review phase of a funded Independent News & Media
PhD project on “Property Valuation Best Practice for Conflict of Interest Management: The
Irish Experience.
The discussion about the Irish economy and in particular the property market is often referred
to as a ‘National Obsession’ or a ‘National Past-time’. Following the global financial collapse
in 2008 and the resultant recession in Ireland, culminating in a bank bailout estimated to have
cost the State 60 billion euros, much public anger and recrimination was evident. The
establishment of the National Asset Management Agency (NAMA) to manage the now state
owned property packed loan books of financial institutions, the lack of public sought
accountability for the failings in regulation of the markets particularly financial and property
and the lack of the ‘Sacrificial lamb’ or ‘Scalp’ of individuals who had appeared to contribute
to the bubble, were particular bones of contention. (Hearne, 2015). Many of the individuals
now under scrutiny were professionals in trusted positions with long, well regarded careers
and questions were beginning to surface around accountability and ethical behaviour. (Cahill,
2014). However these were not new issues either nationally or internationally where a series
of global financial scandals had cast aspersions over the integrity of many professions “There
is certainly unease about professional ethics, not only by the professionals themselves, but by

565
the general public, who are the clients or consumers of professional services” (McDonnell,
2000, p.1).
A full scale investigation was ordered in February 2010 by the then Minister for Finance
Brian Lenihan TD into the performance of the Central Bank and Financial Regulator which
resulted in the establishment of the “Banking Inquiry” culminating in a report produced in
May of that year. One of the key findings was that “A rather defensive approach was
adopted to external critics or contrarians. For years many observers had raised some
concerns publicly or privately, albeit sometimes in coded form, about the sustainability of the
property boom, which was indeed dramatic by international standards.” (Governor of the
Central Bank, 2012, p.10). Focus continued around this time on the role of the perceived lack
of ethical behaviour by the financial institutions, politicians and key wealthy individuals. The
property industry itself, the role of property professionals during this time period, regulation
of the property industry and the quality and reliability of the services provided, largely
avoided scrutiny on a meaningful level.
A report published by The Central Bank of Ireland in December 2012 titled “Valuation
Processes in the Banking Crisis – Lessons Learned - Guiding the Future” did identify
potential issues within the property profession and recommend best practice for the credit
institutions going forward. Most notable was the issue of conflict of interest and it is stated
that “During the volume led transaction phase of the property development boom, certain
valuation practises were accepted by credit institutions that involved significant conflict of
interest.” (Central Bank of Ireland, 2012, p.11). This finding, however, did not lead to any
calls for a formal review of the role of the property profession in the collapse or indeed the
potential for need of reform going forward.
2. ETHICS & PROFESSIONAL STANDARDS
Very little research exists in regard to the real estate profession and ethics specifically and
this research explores the unknown territory to try to make sense of what has shaped the
profession today. It aims to chronologically explore and decipher the evolution of the
profession in the context of the country’s development.
Much research has been undertaken around the area of ethics, ethics in business, professional
standards and codes of ethics. (Hurley, 1996), (Kaler, 1999), (Wofford, 1999), (Wolverton,
1999) and (Plimmer & Sayce, 2003). There are many ethical theories or schools of thought
but at its most basic the word Ethics comes from the Greek word ethos, meaning ‘Character
or custom’. An individual’s ethical position on an issue will usually inform their view on the
rights and wrongs and dictate their response or behaviour i.e. ethical relativism. Most
individual’s assessment of the ethical issues are derived from their concept of ‘Norms’ i.e.
what is the usual acceptable response relative to their family, religion, political views etc. i.e.
their culture. ‘Culture’ is defined by Hofstede (1991) as the “collective programming of the
mind which distinguishes the members of one group or category of people from another”.
2.1 Professions
Professions comprise of many individuals and their individual “norms” and “customs”,
therefore, it is necessary to agree on a set of “norms” or standards for an array of issues

566
including ethics i.e. “ethical relativism”. “Professional ethics are important for establishing
the standard of behaviour expected of individual professionals.”(Dabson, Plimmer et al,
2007, p.9). Depending on the locality the professional body may be relied upon by
Government to control and monitor the profession or there may be additional laws which
supersede any professional dictate. Often it is noted that that where a legal framework exists
that the professional body’s standards “Are normally expected to be in excess of any legally
required standard and may be regarded as reflecting the culture of the group of individuals
to whom they are applied.” (Dabson, Plimmer et al, 2007, p.9). The importance of these
standards and their value to all stakeholders cannot be underestimated “It cannot be disputed
that principles and codes of practice are important, both for professionals, for their clients
and for the general public at large” (Plimmer & Sayce, 2003, p.3). Some are critical of the
role of ethical codes and the influence they have on the overall standard of professional
services. Deinhardt (1995) argues that ethical codes cannot and do not alter the ultimate
behaviour of a professional and that ultimately codes “promote unethical behaviour, because
the true aim of such codes is to serve the interests of those who write them”.
2.2. Codes of Ethics: Issues
An issue with standards or codes of ethics that are applied across a profession e.g. surveying,
accounting etc. is that the ‘Customs’ or ‘Norms’ may lead to some degree of variety in
interpretation and practical application. One way to deal with this issue is through active
governance where the aim of this governance is to ensure compliance by all members to the
codes of ethical conduct.
Another way to ensure appropriate application of ethical codes is through education. There is
debate over whether ethics can be taught with the resulting outcome being a more ethical
individual and the defence for a lack of focus on ethics education is the idea that an
individual’s behaviour is ingrained from their cultural experiences as discussed above. There
is research to confirm that ethics education is worthwhile in that “Students are receptive to
education programmes designed to develop moral judgement” (Harris, 1998) and that “It is
important to have a language of ethics that we can all understand and that is clinical and
non-evaluative” (McCoy, 2009).
2.3 Methodology
This work forms part of the literature review of an Independent News and Media PhD project
on “Property Valuation Best Practice for Conflict of Interest Management: The Irish
Experience. This paper was compiled by means of a literature review of all available
literature relevant to the aim of tracking the ethical evolution of the real estate profession in
Ireland.
3. ETHICAL EVOLUTION: THE IRISH REAL ESTATE PROFESSION
In considering the ethical evolution of the Irish real estate profession, it is necessary to
consider this in the context of political and economic developments across the same time
periods.

567
3.1 1900 to 1929
At the turn of the twentieth century, the Irish political landscape was a complex one. The
roots of which spread as far back as 1155 when John of Salisbury visited Pope Adrian IV at
Rome and got permission for Henry II to invade Ireland. At the turn of the twentieth century
the Irish desire for independence was reaching a crescendo with successive Home Rule Bills
being defeated in the House of Lords and recent establishment of the Gaelic League, the Irish
Socialist Republican Party and Cumann na nGaedheal (Ferriter, 2005). The unfulfilled desire
for independence had a profound effect on the Irish psyche not least in the attitude towards
those in positions of power resulting in an almost two-tier society, a ‘Them and us’ outlook.
(Inglis, 2014). Also, the perception that the continuation of English Rule was achieved
through corrupt means by patronage and bribery influenced the early decisions made by those
seeking independence, “Memories of the long-term implications of a disreputable political
system were the underlying motivation of the governments and civil servants of the early
1920s to prevent the perception of history repeating itself.” (Byrne, 2012, p.19).
Due to the influence of English Rule in Ireland, those who wished to conduct a property
related service had to obtain a “Licence” which was “Governed by a variety of Victorian
statutes dating from 1845, while the law relating to appraisers’ licences dates back to King
George III in 1806.” (Power, 1997, p.25). A licence was obtained by application to the
Courts and the payment of a monetary sum. There was no requirement to be educated or
experienced in the property industry or indeed to maintain any level of professional
standards. The situation was somewhat different within the United Kingdom where the
Institution of Surveyors was founded in 1868, incorporated by Royal Charter in 1881 and
renamed the Royal Institution of Chartered Surveyors at this time.
In 1922 the Irish State was founded. However, the terms upon which this was achieved was
the basis for a fundamental split within the Irish political system that led to a Civil War.
Despite this fact “The Governments of the early 1920s established, legitimised and
consolidated many of the institutions of government, which remain with us today.” (Byrne,
2012, p.25). From its very first days of business, corruption and ethical behaviour was a
significant issue debated in the newly formed Dáil Éireann. When calls arose for legislation
on the matter the Irish Taoiseach, Eamonn DeValera, stated “Ultimately of course, the
conduct of members will be determined by their own sense of what is fit and right and
proper.” (deValera, 1947).
1922 was also a significant year for the Irish Property Profession “As it was in 1922 that the
Irish Auctioneers’ and Estate Agents’ Association (IAA), subsequently to be renamed Irish
Auctioneers and Valuers Institute (IAVI), came into formal existence.” (Power, 1997, p.15).
The core aim of the IAVI was to obtain protection for the property industry through the
cessation of unqualified persons obtaining a licence. Eleven objectives were established for
the Association, none of which referred either expressly or by implication to ethical
behaviour of members. “By the end of 1929, it was considered that about three-quarters of
the practising auctioneers, valuers, house and estate agents in the Saorstat were now members
of the IAA.” (Power, 1997, p.22).

568
3.2 1930 to 1949
The 1930s saw many changes across both the political and economic landscape with the rise
of Fianna Fáil and their protectionist economic policies which were a significant change from
Cumann na nGaedheal’s liberalist ideals. Across this decade there were many political
scandals which at their core were based on the ethical stance of power holders and their
allocation of resources in line with the new protectionist outlook. “The establishment of the
Control of Manufacturing Acts 1932-34, initiated under Patrick McGilligan and enacted
under Seán Lemass, provided the Minister for Industry and Commerce with varying degrees
of latitude in the issuing of licences, shares, leases and export quota.” (Byrne, 2012, p.36).
Much was changing in Ireland in connection with the right to own and lease property under
various Land Acts. “Socially, the Land Acts had brought about dramatic social changes
throughout the country in previous decades, shifting economic power from the elite landlord
class to a wider and more prosperous property-owning democracy.” (Power, 1997, p.37)
The Landlord and Tenant Act 1931 while heavily criticised by some quarters for interpretive
issues is widely seen as “One of the most important legal reforms made by the legislature
since the setting up of the Irish Free State.” (Power, 1997, p.43). The main changes brought
about under the Act were rights to rights of renewal, rights to compensation for
improvements and the ability to create new building leases.
Within this climate of legislative control, the property industry was still seeking regulation
led by the IAVI. They were successful in getting their demands to Bill stage twice in the
early 1930s: Auctioneers, Valuers and Estate Agents Bill 1931 and 1933. Both Bills failed to
pass with the second attempt ending when “Minister for Finance Mr McEntee said that, while
the Government was not prepared to accept the provisions of the measure, it recognised that
certain steps should be taken against dishonest practitioners and accordingly, a bill was in
preparation which he believed would afford the public the necessary protection.” (Power,
2012, p.47).
Politically there were four tribunals over a twelve year period: The Wicklow Gold Inquiry
1935, The Great Southern Railways Tribunal 1943, The Ward Tribunal 1946 and The Locke
Tribunal 1947. The nuances of each obviously varies although at the heart of each was
corruption, relationships indicating conflict of interest and the new Irish State trying to figure
its ethical positioning on matters of professional conduct. While often the allegations initially
were politically timed and motivated against competitors, at the root was a Government
trying to confirm the boundaries within which acceptable behaviour occurred. “Debates on
conflicts of interest were not new, but the attention they received was. Questions on whether
the private life of a politician influenced their actions as a public representative were raised
in a sustained way.” (Byrne, 2012, p.62). Interestingly no legislative reform or guidelines
were produced as a result of these tribunals and these ethical debates would continue to be a
feature of Irish politics.
The Irish property industry was still seeking legislative control after their two failed attempts
early in the 1930s. They were finally successful to some degree with the Auctioneers &
House Agents Act 1947. However, the desire for control over those whom could obtain a
licence was not linked to educational and/or professional experience as desired. The Act’s
definition of a “Certificate of Qualification” does not refer to any form of academic
qualification or indeed previous professional experience, it refers to a process of notifying
both the public and the Gardaí of your intention to obtain a licence. The Act contained no

569
mention of required professional standards, monitoring of conduct or indeed penalties if
found to be failing in professional duties.
The IAA itself had introduced a new “Code of Conduct” just prior to the Act that included
“No member shall conduct himself either in his personal or professional capacity, in such a
manner as would be likely to prejudicially affect his own professional status, or injure the
reputation of the Association.” (Power, 1997, p.60). By the end of 1949 there were 580
members of the IAA who were bound to adhere to this rule, however, there was no
legislative control so self-regulation remained the only regulation of the Irish real estate
profession.
3.3 1950-1979
“By the middle of the 1950s a serious crisis of confidence developed, caused by widespread
anxiety that the performance of the economy was so poor the country was falling behind
Western European Standards, not only in productivity, but in the social benefits that
productivity might confer.” (Lyons, 1973). During this period there was a marked change in
Ireland’s demography with more people living in urban areas than in rural ones for the first
time since the formation of the State.
The 1950s marks a period of professional jostling as the industry tried to establish its
“ownership” of other functions such as rights to sell and value. The main adversary was the
Irish legal profession who had been providing these services to clients unofficially for some
time. “The matter of professional boundaries had, however, been causing friction for some
time.” (Power, 1997, p.90). The 1951 annual general meeting was asked by a member “if it
was professional and recognised by the Incorporated Law Society for Solicitors to act as
valuers”. (Power, 1997, p.90). The legal profession was not the only industry to receive
criticism for some practices.
The 1960s represented a period of awakening within the Irish economy and the property
industry was suitably influenced. “The blinds were let up, the windows were thrown open,
the doors were unlocked; and good, bad or indifferent, the modern world came in among us
at last”. (Tobin, 1984). The IAA joined the International Real Estate Federation (FIABCI)
and provided the National Chapter’s executive and coordinating functions. The modern
commercial property market effectively began with the introduction of the 1963 Planning
and Development Act where power to rezone agricultural land was ultimately left with
public officials. In short, the capacity to zone agricultural land incentivised property
speculation. “The potential for enormous financial profits created an added inducement for
corrupt transactions between developers and local officials and representatives.” (Byrne,
2012, p.70).
Despite the growth and changes over this period the property profession was still regulated
by the Auctioneers, Valuers and Estate Agents Act 1947 which was now significantly
insufficient when considered in line with the expansion of more sophisticated services being
provided by the industry. “It was no mere coincidence that 1964 marked a high point of the
IAA’s educational efforts with the establishment of a high-level structured course.” (Power,
1997, p.111). Membership of the IAA was now conditional on completion of this course or a
similarly recognised programme. The industry itself, through self-regulation, was trying to
increase the standards of services being provided to the public. Professional conduct did

570
form part of this educational programme but most certainly the focus was on valuations and
law.
The Government did produce a new Act in 1967, The Auctioneer and House Act. However,
there was no place for professional standards or penalties for poor behaviour instead it
increased the bond required to obtain a licence, the introduction of a client account, and an
additional requirement on the “Certificate of Qualification” to include certification of
compliance by an accountant. These additions were certainly aimed at narrowing those
eligible for a licence to provide property related services.
“From January 1, 1971, the IAA was renamed The Irish Auctioneers and Valuers Institute
(IAVI)” (Power, 1997, p.123). The Institute of Professional Auctioneers, Valuers and
Livestock Salesmen (IPAV) was also founded this year adding another dimension of self-
regulation to the profession.
In 1973 a review of the property industry was undertaken by the Revenue through the
National Prices Commission (NPC). Their aim was to examine auctioneering fee structures
and a consultant was duly appointed to carry out the review. “The NPC report was the most
comprehensive study of the profession yet completed, but was by its own admission flawed in
certain key aspects.” (Power, 1997, p.127). The main flaw related to the level of
engagement on the professional groups and the number of replies received by those
professionals surveyed weakened the value of the report findings. Again this review focused
purely on fees and no review was sought or carried out on professional standards and level
of services provided by the industry.
A new Act was enacted by the Government in 1973, The Auctioneers and House Agents Act
of 1973, however, this was not well received by the professional bodies such as the IAVI. In
their view the Act was “Introduced without prior consultation with the Institute – which
transferred the obligation to pay the auctioneer’s fees in the case of a sale of a property
from the purchaser to the vendor of the property by making void any contract for the
purchaser to pay such fees.” (Power, 1997, p.126). In 1977, the IAVI continued to improve
levels of professional regulation as they introduced a voluntary compensation fund for those
who may have been penalised by poor performance or negligence of a member.
3.4 1980-1999
“It was the best of times, it was the worst of times – the 1980s, when the property market
plumbed new lows before ultimately scaling fresh heights.” (Power, 1997, p.161).
There was no further State led regulation of the property industry but the IAVI continued to
develop their standing with a focus on education and communication with the public. “In
1985, the educational programme was transferred from the College of Commerce in
Rathmines to the College of Technology, Bolton Street, Dublin on a three year, whole-time
diploma basis. The opportunity was taken to suitably upgrade the programme at the time of
transfer. Auctioneering, valuation and estate agency courses were also commenced at both
Limerick and Galway Regional Technical Colleges and the University of Ulster at
Jordanstown.” (Power, 1997, p.168). The educational programmes focused on the
technicalities of valuations, law, building construction etc. and a small tokenistic element on
professional practice.

571
In 1983 the IAVI had a public case of misconduct relating to the avoidance of stamp duty
being facilitated by a member. Their response was significantly important as it was an
opportunity to reinforce their stance on misconduct to both the public and its members.
Following notification of the claim, the council accepted the resignation of the member in
question and placed a notice in the national daily newspapers to the effect on April 18th “It
is a matter of considerable regret that this default has arisen, particularly as there has been
no claim against a member of the Institute on grounds of dishonesty since 1959.” (Power,
1997, p.174). A strong response that highlighted the need for proper channels for the
regulation and governance of the industry.
Politically this was a dark period for allegations of corruption that went right to the most
senior offices of the State. “This period was distinct from previous scandals because it
marked the possibility of the gravest form of corruption, that of state capture within political
decision making.” (Byrne, 2012, p.103). “The Beef Tribunal Inquiry (1991-1994) was
perhaps the most extraordinary political episode in modern Irish history. For the first time
since the 1940s, the reciprocal relationship between politics and vested interests was placed
under intense political, public, judicial and media scrutiny. This was a period when
questions about political corruption, golden circles and the integrity of public officials were
raised in a meaningful way.” (Byrne, 2012, 107). Transparency and professional reputations
were the order of the day and the property industry was aware of these demands.
“In February 1996, the IAVI Practice Handbook was launched at the Merrion Square
headquarters by Minister for the Environment, Brendan Howlin. The publication of the
manual represents yet another significant landmark in the ongoing IAVI commitment to
improving auctioneering standards.” (Power, 1997, p.216). The goal of the Handbook was
to produce a transparent base for all aspects of services provided by its members. From an
ethical stand point, section 1 laid out the “Code of Conduct” for members which was
binding. Rule 4 stated “Members shall at all times make it their first duty to protect and
promote the legitimate and ethical interest of their clients to the utmost of their ability.”
Rule 14 stated “No member shall act for two parties in the same transaction without the full
knowledge and consent of both parties.” Rule 22 states “If, on a consideration of any matter
referred to it, the Disciplinary Committee decides that a member of the Institute has been
guilty of a breach of the rules of conduct the Committee may: Hold that a breach of the rules
has been committed but decide to take no further action.” Rule 27 states “The Institute shall
be entitled to publish in the “Property Valuer” journal of the Institute and in general the
press or any publications selected, notice of the expulsion or suspension or resignation of
any member.” This was a strong position taken by the IAVI, however, no examples of what
constituted acts that would place a member in breach were provided, no requirement to
publish numbers of complaints, outcomes etc. was included and ultimately these rules were
relevant to its members only.
A survey undertaken of Irish attitudes towards the real estate industry revealed a worrying
trend that 25% of respondents would not avail of services provided. Writing in a subsequent
issue of the IAVI journal, auctioneer John Harrington articulated the sentiments of many of
his colleagues on the key issue of standards. He acknowledged that greater professionalism,
coupled with high-end marketing and a good corporate image would go some way to
restoring the public confidence. In a bid to further regulate and legitimise the industry the
IAVI joined the European Property Agents Group, the European Secretariat for the Liberal
Professions and TEGOVOFA.

572
Moving towards the Millennium the Irish State still grappled with corruption in the form of
“political favouritism, tolerated conflicts of interest, tax evasion, fraudulent practices”
(Byrne, 2012, p.131) and Irish society was in an apathetic state on the trustworthiness of
“those in suits”.
3.5 1990-2010
The period of the late 1990s up to 2012 was again marked by three sizeable tribunals: The
McCracken Tribunal 1997, The Moriarty Tribunal 1997-2011 and the Flood/Mahon
Tribunal 1997 – 2012. Ethics, professional integrity and the boundaries of improper conduct
were at the heart of all three with the slight difference from previous periods being “For the
first time that unaccountable political decisions were not isolated incidents, as previous
episodes seemed to suggest. The various inquiries instead exposed how those at the highest
positions of power periodically abused their political discretion to benefit private interests.”
(Byrne, 2012, p.134). Public apathy continued as did a rising tide of frustration over the
benefit-cost outcome of these tribunals. However, as the economy had now entered the
period referred to as “The Celtic Tiger” the politicians were somewhat shielded by the
available Exchequer coffers for investment in services and infrastructure, that for the most
part grumblings were muted.
The property industry was gaining rapid pace along with the economy, the residential
markets in particular were experiencing high levels of activity with anecdotal evidence of
gazumping and poor agent practices. In July 2005 the report by the Auctioneering/Estate
Agency Group was published containing a list of recommendations to reform the Irish
property industry. The brief given to the Group by the then Minister for Justice, Equality and
Reform was “To carry out a review of all aspects of the auctioneering profession in Ireland
and equivalent services in appropriate comparable jurisdictions.” It is important to note that
this was produced by the Group focused on the residential market as they believed “It is in
this area that most problems are perceived to exist.” (Auctioneering/Estate Agency Review
Group, 2005, p.7) They noted the role of the professional bodies in providing governance
and guidance to the profession but expressed concern “That there is no appropriate system
to control entry to, or to set or maintain practice standards in this market.”
(Auctioneering/Estate Agency Review Group, 2005, p.7). The most significant
recommendation to come from the review was the establishment of an “Auctioneers and
Estate Agents Regulatory Authority in order to achieve uniformity and transparency in
licensing, regulation and information provision.” (Auctioneering/Estate Agency Review
Group, 2005, p7).
As a result of the review and after much delay caused by economic and political
developments, the Property Services (Regulation) Act was enacted in 2011. As a direct
result the Property Services Regulation Authority was established by Minister Shatter on the
3rd April 2012. “The main function of the Authority is to control and regulate Property
Services Providers (i.e. Auctioneers/Estate Agents, Letting Agents and Management Agents)
this includes the licensing of all such services providers, the establishment of a complaints
investigation and redress system for consumers, the setting and enforcement of standards in
the provision of property services, the administration of client accounts, the establishment
and maintenance of a compensation fund and the creation of three Public Registers.”
(PSRA, 2016). The three registers in question are the Residential Property Price Register,
Commercial Leases Register and the Register of Licensed Property Services Providers.

573
Criticism of the PSRA has been widespread largely focused on the lack of transparency and
slow processing times “The first thing to note about the PSRA is the lack of transparency on
its record to date.” (Leman, 2015). “The authority has also been provided with significant
powers to tackle improper conduct by estate agents. There have been unconfirmed reports of
action against some estate agents.” (Irish Times, 2014). Presently the PSRA has a section on
their website briefly detailing six cases involving “Convictions, Prosecutions, and Major
Sanctions” but no detail is included on the number of complaints received.
On 18th December 2012 the Central Bank of Ireland published “Valuation Processes in the
Banking Crisis-Lessons Learned – Guiding the Future” which was the second document
published after a commitment made by the Central Bank “To provide credit institutions with
details of lessons learned from the banking crisis, and to provide guidance on recommended
practice.” Of particular relevance to the property industry was the observation that “Many
best practice valuation standards have been overlooked, omitted and in some cases totally
disregarded during the property market boom.” This finding however did not lead to any
calls for a formal review of the role of the property profession in the collapse or indeed the
potential for need of reform going forward.
3.6 2010-2017
The Celtic Tiger continued and led Ireland into one of the biggest property bubbles in the
developed world’s history. Much analysis and conjecture continues on the causes of its
collapse, the choices made to avoid national bankruptcy and the austerity measures selected
but the impact on an ethical level are less considered. Certainly the financial industry and its
perceived lack of ethical practices: bonuses, selling products they knew to be high risk but
not marketing as such etc. has come under the most scrutiny but the role of property
professionals has not been analysed. Property was undoubtedly the key asset class involved
in the Irish financial collapse yet the industry has managed to escape any meaningful analysis
of ethical standards during the period.
Anecdotally due to the establishment of the PSRA, the role of the professional bodies was to
some extent less prevalent within the Irish property market. In April 2011, after a long
consultation and implementation process, the Society of Chartered Surveyors Ireland was
formed by a merger between the IAVI and the SCS. The new body states that “Working in
partnership with RICS, the pre-eminent Chartered professional body for the construction,
land and property sectors around the world, the Society and RICS act in the public interest:
setting and maintaining the highest standards of competence and integrity among the
profession; and providing impartial, authoritative advice on key issues for business, society
and governments worldwide.” (SCSI, 2017).
The SCSI Rules of Conduct include, in their Professional and Personal Standards section,
requirements for members to “at all times act with integrity and avoid conflicts of interest
and avoid any actions or situations that are inconsistent with its or their professional
obligations.” Failure to do so it is noted “May lead to action by the Director of Regulation
and Professional Conduct Committee under these Rules.” There is no readily available
information at present on the number of complaints received about members, numbers of
disciplinary proceedings and their outcomes.
574
The SCSI offer their own part time degree in partnership with Dublin Institute of Technology
and there are approximately twenty-two educational programmes at either undergraduate or
master’s level across the Republic that are accredited by the SCSI. In examining the
programme documents for each it is evident that little if any credits are linked directly to
Professional and Personal Standards and ethical conduct.
In March 2017 the RICS published the first edition Professional Statement “Conflict of
Interest” with rules coming into effect on 1st January 2018. Compliance with its contents is
mandatory for all members and it defines a conflict of interest in three contexts: a party
conflict, an own interest conflict and a confidential information conflict. Some activities are
banned outright, however, a sizeable amount of situations where conflict would arise are
permissible if “Informed Consent” is received prior to providing any services. There is no
additional monitoring of compliance detailed so breaches will either have to be reported to
the SCSI or may be captured through their risk assessment procedures.
Throughout the history of the State and right up to present day, the role of “whistle-blowers”
is a controversial one. Some argue this is linked to before the formation of the State, where
those in authority were seen as a “foreign entity” that were not be trusted and Irish people
deal with their own transgressions amongst themselves. “Attitudes towards informers have
traditionally been hostile and perceived as having traitorous qualities.” (Byrne, 2012,
p.134). While undoubtedly there has been progress around this issue, the recent “whistle-
blower” controversy in the Gardaí demonstrates that all may not be well. While an inquiry is
to determine the facts of the matter it is worth noting that “An investigation by Mr Justice
Kevin O’Higgins in 2016 found there had been a corporate closing of ranks, alteration to
the Pulse recording system and delays in producing documents concerning allegations made
by Sgt McCabe. The latest exercise, conducted by Mr Justice Iarfhlaith O’Neill, arose from
allegations by former head of the Garda Press Office Supt David Taylor that he had been
formally instructed to discredit Sgt McCabe” (Irish Times, 2017). While evidence of such
alleged mistreatment of an individual reporting misconduct at the highest levels of a national
institution like the Gardaí are in the public mind, is it reasonable to expect others to come
forward to report misconduct in their spheres of practice.
4. CONCLUSIONS
This exploration of the evolution highlights the emergence of the context of ethics in the
Irish property sector and points to many factors that have influenced and impacted it.
For much of the last nearly one hundred years the real estate profession in Ireland has been
purely self-regulated from a professional standards and ethical view point. Any legislation
referred to the procedure of obtaining a licence to practice and no monitoring of the industry
was deemed necessary. The IAVI, SCS (both merged to form the SCSI) and IPAV to
varying degrees provided the only monitoring of educational requirements of members,
rules of conduct and disciplinary proceedings for failure to comply. The PSRA was formed
in 2011 and after a slow start is providing some evidence of monitoring of professional
standards and ethical behaviour of licence holders however for an industry of its size and
relevance to national issues a much more active approach is required.

575
The PSRA does detail varying educational requirements to obtain licences, however, as
highlighted above the accredited programmes do not offer significant education in the area
of ethical issues.
In obtaining membership to the professional bodies all require evidence of knowledge of
their standards ethical conduct which are tested through a mix of interview and diaries of
professional practice. Once a member continued professional development is necessary
however there is no particular onus that any element of this must relate to professional
conduct.
As evidenced through the vast array of tribunals and political scandals over the history of the
State, individuals do report inappropriate conduct. However, it cannot be denied that due
perhaps to historical influences, those that do inform are not always received in a positive
manner. Bearing this in mind it is logical to argue that a more aggressive system of auditing
led by the PSRA is required as opposed to relying on a system of complaint and follow-up
as has been the main feature of Irish real estate profession regulation up until the last
number of years.
5. REFERENCES
Auctioneering and Estate Agency Review Group (2005) Report to the Minister for Justice, Equality and
Reform, Dublin.
Byrne, Elaine (2012) Political Corruption in Ireland 1922-2010: A Crooked Harp, Manchester University
Press, Manchester.
Dabson A, Plimmer F, Kenny S and Waters M (2007) Ethics for surveyors: What are the problems?
Proceedings of the FIG Working Week held at Hong Kong, China, 13-17 May 2007.
Deinhardt, J (1995) Rationality, ethical codes and an egalitarian justification of ethical expertise: Implication for
professions and organisations. Business Ethics Quarterly 5(3). 419-450.
Governor of the Central Bank (2010) The Irish Banking Crisis Regulatory and Financial Stability Policy 2003-
2008, Dublin.
Harris, H (1998) Making professional values and ethics a competitive resource, Proceedings of the Australasian
Chemical Engineering Conference held at Pt Douglas, Queensland, Australia, 28-30 September.
Hofstede, G (1991) Culture and Organisations: Software of the Mind, McGraw-Hill
Irish Times (2014) http://www.irishtimes.com/life-and-style/homes-and-property/still-no-transparency-in-the-
irish-property-market-1.1844914 [Accessed 14 September 2017]
Irish Times (2017) http://www.irishtimes.com/opinion/editorial/garda-whistleblowers-the-gravest-of-
allegations-1.2968540 [Accessed 17 September 2017]
Leman Solicitors (2015) https://leman.ie/has-the-property-services-regulatory-authority-regulated/ [Accessed 15
September 2017]
Lyons, F.S.L. (1973) Ireland Since the Famine, Fontana, London.
McDonnell, B (2000) Ethics and Excuses: The Crisis in Professional Responsibility, Quorum Books, Westport.
McCoy, B (2009) “How to be good”. RICS Business, April.
DeValera, Dáil Éireann, Powers and Privileges of the Oireachtas: Motion.104. (11 March 1947)
Power, Con (1997) Under the Hammer: Property in Ireland –A History of the Irish Auctioneers & Valuers
Institute, Oak Tree Press, Dublin.
Plimmer, F and Sayce, S (2003) Ethics and Professional Standards for Surveyors towards a Global Standard?
Proceedings of the FIG Working Week held at Paris, France, 13-17 April 2003.
Property Services Regulation Authority (2016) http://www.psr.ie/website/npsra/npsraweb.nsf/page/index-en
[Accessed 14 September 2017]
RICS (2017) http://www.rics.org/Global/Conflicts_of_interest_global_1st%20edition_PGguidance_2017.pdf
[Accessed 15 September 2017]
The Central Bank of Ireland (2012) Valuation Processes in the Banking Crisis – Lessons Learned – Guiding the
Future, Dublin.
The College of Estate Management (2010) Ethics issues in surveying firms – does size matter? 1st edition, The
College of Estate Management, RICS.
Tobin, F (1984) The Best of Decades: Ireland in the 1960s, Gill and Macmillan

576
ID 089
A PHENOMENOLOGICAL STUDY ON DECISION MAKING UNDER
UNCERTAINTY IN REAL ESTATE INVESTMENTS IN SUB-
SAHARAN AFRICA - A CRITICAL REVIEW OF LITERATURE
C. Nsibande and M. An
School of the Built Environment, University of Salford, Salford, M5 4WT, UK
Email: [email protected]
Abstract: Decision making under uncertainty can be traced back to the beginning of the 20th
century as defined by Von Neumann and Morgenstein in what was termed expected utility
theory. Kahneman and Tversky reinvented decision making theories and introduced prospect
theory. They later introduced cumulative prospect theory which has been the central theory for
studies and research in decision making under uncertainty. Kahneman and Tversky introduced
psychological approaches to decision making and introduced the concept of value function and
weighting function. Other important scholars include Cohen who focused on the psychological
aspects of decision making. Several other authors have completed research in behavioral
aspects of decision making including Slovic, Nocetti, Shefrin and Statman. The purpose of this
paper is to present a critical review of the literature published on decision making under
uncertainty, understand the gap and knowledge, and to develop new knowledge in decision
making under uncertainty for real estate investment decisions in Sub-Saharan Africa. The
relevance of the literature to the doctorate research was established through the extensive
discussion section of the paper.
Keywords: Biases, Decision making, Heuristics, Literature, Real estate.
1. INTRODUCTION
The aim of this paper is to review literature that is relevant to the doctorate research topic,
decision making under uncertainty in real estate investments in Sub-Saharan Africa. The
paper establishes from the literature that there is a gap in knowledge from the identified
practice problem, hence supporting the case that the research will lead to establishment of
new knowledge on the subject under investigation. The paper has sections on how the current
literature and current practice relate to the subject topic. The paper concludes with showing
how the research questions on the topic of real estate decisions under uncertainty for the
doctorate research were developed, linking the identified practice problem to the gap in
current knowledge.
Recent literature, notably Kahneman’s ground breaking research on decision making under
uncertainty (1979, 1992) shed light onto the possibilities of exploring the real estate
investment decision using psychological and behavioural science approaches. Further work
has been undertaken by Kahneman and Tversky (1992) on prospect theories with regard to
decision making process for management science. Cohen (1981) has also developed theory
on psychological aspects of decision making under uncertainty.
It is acknowledged that the real estate investment decision process has both an analytical
(technical rationality) stage as well as a behavioural (tactical) stage. The analytical stage
involves analysis of financial and economic data and is quantitative in nature. The
behavioural stage fills the gaps in the analytical phase and is subjective in nature, hence

577
qualitative. In every investment decision, both stages are undertaken and are an integral part
of the investment decision process. In cases of uncertainty, where limited information or
where data is unavailable, for concisely completing the quantitative analysis, the weight on
the decision process shifts towards the subjective behavioural stage. As portrayed by Blas
(2013) and Jerven (2013), economic data and market information is limited on the Sub-
Saharan Africa investment markets hence the importance of understanding the effects of
reliance on subjective qualitative processes for investment decision making.
2. AIM OF THE RESEARCH
The aim of doctorate research is to develop a method for practice on how rational real estate
investment decisions under uncertainty can be made. For the purposes of this paper, rational
refers to the process followed by investment decision makers that will maximise utility
(return) for the investments. The method should maximise utility or returns through a
structured, consistent and thorough process in decisions making.
The research problem came about in identifying a gap in methods, having to experience
discomfort in seeing decisions made at a point in time that cannot be verified until a later
date. Due to uncertainty, at the time of the decision process, investment decisions are not
verifiable. It is not possible to confirm if the correct decisions were made until a much later
time, during investment performance appraisal. Unfortunately, investment committees and
decision makers, make investment decisions under uncertainty due to the limited available
information, which in most cases is inadequate to make rational decisions. In addition, in the
Sub-Saharan market, there is a greater level of complexity (risk) due to uncertainty in
economic and political events. Under these uncertainties, the researcher has observed
investment decision makers making investment decisions and has questioned why and if
these decision makers were making rational investment decisions.
From the research title, the paper focuses on the literature around how real estate investors
make decisions, decision making processes by different professional investors (behaviour,
style and preference), heuristics and biases, decisions under uncertainty, studies on
behavioural finance in real estate investments, and how intuition and experience of
investment professionals influence the decision making process?
3. LITERATURE REVIEW
3.1. Current scholarship in decision making
Expected utility theory dominated the analysis of decision making under risk for most of the
early part of the 20th century. According to Keeny and Raifa (1976), expected utility was the
normative model of rational choice and was widely applied in decision making analysis.
According to Friedman and Savage (1948), expected utility theory was widely used as a
descriptive model for economic behaviour in decision making under risk. Further, Von
Neumann and Morgenstein (1944) observed that most reasonable people would wish to obey
the axioms of the theory.
Kahneman, Slovic and Tversky (1982) are perhaps the leading scholars on the subject of
modern decision making under uncertainty. Their book, “judgement under uncertainty –
heuristics and biases” gave a good background on the subject. The book outlined five

578
important biases and heuristics common in decision making, namely, representation,
causality and attribution, availability, covariation and control and overconfidence. The
representation heuristic refers to believing in the law of small numbers. Causality and
attribution heuristic refers to the popular induction that information is not necessarily
informative and people make judgements without taking into consideration all the
information. Availability heuristic is failure to make the correct judgement on frequency and
probability. Covariation and control heuristic refers to incorrect decisions when people are
faced with making a choice between data based assessment versus theory based assessment.
The illusion of control refers to the fact that people interpret results as they think they should
be, not necessarily correctly. Overconfidence heuristic refers to people relying more on their
own experience and rationality rather than on the information and facts.
In 1979, Kahneman and Tversky introduced a concept of prospect theory, which superseded
the classical theory of expected utility theory (EUT) of the 19th and 20th Centuries. Prospect
theory introduced the concept of the value function and the weighing function. The value
function takes into consideration the wealth of the person making the decision and introduces
the concept of relativity, that people’s “perceptual apparatus is attuned to the evaluation of
changes rather than to the evaluation of absolute magnitudes”. The weighting function is the
multiple of the decision weight which are “inferred from choices between prospects”,
subjective and not probabilities measures that the decision maker considers to be possible
outcomes in his interpretation.
Another article by Kahneman and Tversky (1992) on prospect theory introduces a newer
approach to decision making under uncertainty that employs cumulative rather than separable
decision weights and extends the prospect theory in several ways.
Maital (2004) summarizes nicely the salient points in Kahneman and Tversky prospect theory
and rationality. He states that there are two ways that people make judgements and decisions
under uncertainty, namely; mathematical and behavioural. This is the essence of the doctorate
research as the researcher seeks to capture the optimum process in making real estate
investment decisions under uncertainty, with focus on the behavioural aspects.
The literature review would be incomplete without citing the work of Jonathan Cohen,
another leading scholar in decision making under uncertainty. His work, from 1971 to 1981,
covers many different angles on the subject of decision making under risk. His work is
mostly on psychological aspects of the decision maker, including the “psychology of
prediction” (Cohen, 1979), “what has induction to do with causality?” (Cohen, 1980), and
“intuition, induction and the middle way” (Cohen, 1982). Cohen has also published reviews
of the book by Kahneman, Slovic and Tversky (1982).
Cohen (1981) identified four categories of psychological research in human rationality,
namely: conditions under which people suffer from genuine cognitive illusions;
circumstances in which people exhibit mathematical or scientific ignorance (intelligence or
education); a fallacy whereby people are applying the relevant normative criteria of human
irrationality in an appropriate way or where the normative criteria being applied are not the
appropriate ones.
579
3.2 Investment appraisal for capital projects and real estate investments
Investment appraisal that leads to investments in real estate follows capital projects appraisal
methods as developed by Sharpe (1964) capital asset pricing model for cases of risk (known
probability). The practice is based on the premise of discounting the projected cash flows by
a risk premium factor that is determined by the level of risk (known probability). Earlier
research on utility of choices involving risk was completed by Friedman and Savage (1948).
For cases of utility choices under uncertainty, elementary work has been concluded by
Merton (1969). The focus of the research is on the latter case, the case of uncertainty for
which the gap in practice and knowledge has been identified. The research approach is a
phenomenological study that focuses on the human experience, signifying the behavioural
aspects of decision making under uncertainty.
3.3. Scholars in behavioural finance and decision making
Other scholars of note to consider in decision making under uncertainty include Stracca
(2004) who identified anomalies in the behavioural finance literature with a focus on those
that might impact on market prices. Stracca grouped the anomalies into five distinct groups,
namely: decision heuristics; emotional and visceral factors; choice bracketing; unknown
preferences; and reference dependence. Stracca concluded that the “fertilization” of finance
and economics with psychological ideas had a huge potential and was gaining ground.
Supporting Stracca’s conclusion was Thaler’s prediction of the “end of behavioural finance”.
In his article, Thaler (1999) predicted that behavioural finance was becoming an integral part
of main stream financial analysis as in future will not be treated as a separate subject.
More recent articles by Shefrin and Statman (1994) entitled “Behavioral Capital Asset
Pricing Theory” and Shefrin and Statman (2000) entitled “Behavioral Portfolio Theory” also
support the idea that behavioural science is relevant to financial analysis. It is a growing trend
in financial analysis and several scholars are exploring the subject. The purpose of the
doctoral research is to investigate this phenomenon in real estate investment decision making
in Sub-Saharan Africa. The focus would be on the behavioural attributes of decision making
under uncertainty, investigating the impact of heuristics and biases during the decision
making process. The literature peaks on the article by Nocetti (2006) entitled “Markowitz
meets Kahneman: Portfolio selection under divided attention” where Nocetti brings along the
concept of scarcity of cognitive resources in play. The theory of cognitive resources focuses
on the influence of the leader's intelligence and experience on his or her reaction to stress.
The theory concluded that stress was the enemy of rationality. The leader's experience and
intelligence can lessen the influence of stress on his (or her) actions, that is, intelligence is the
main factor in low-stress situations, whilst experience counts for more during high-stress
moments.
4. DISCUSSION
The scholarship discussed above is from the main researchers in behavioural finance but
several other researchers have explored the field and then applied the concepts to particular
aspects of decision making research. The purpose of the doctorate research is to test the
theories developed by Kahneman, Tversky, Slovic, Nocetti, Shefrin and Statman, and then
further apply it to the specific filed of real estate investment decision making under

580
uncertainty. The purpose of the doctorate research is not to reinvest the wheel but to apply
and advance the concepts already developed by these scholars. The aim is to investigate if
there is evidence of behavioural analysis, that is, if the behavioural theory can be identified
and verified in real estate investments from which a method can be developed for investors to
follow in cases of uncertainty.
Several other scholars have followed similar research, notably, Gurevich, Kliger and Levy
(2009) where they have investigated “decision making under uncertainty – a field study of
cumulative prospect theory. On their research they tested the prospect theory developed by
Kahneman and Tversky (1979 and 1992) in the financial market, using US stock option
prices. They found that in the practical results in comparison to the laboratory results, the
estimated functions (value and weighting) were closer to linearity and the loss aversion was
less pronounced. Brendle (2006) looked at the power utility aspects of decision makers when
they selected portfolios under incomplete information. Brendle used a stochastic approach to
measure the impact of incomplete information and the power utility on the selection of the
optimal portfolio. Bosch-Domenech and Silvestre (2010) investigated averting risk in the
face of large losses in Bernoulli versus Tversky and Kahneman. In prospect theory, the thesis
is that people display risk attraction in high probability losses but in their investigation and
analysis Bosch-Domenech and Silvestre found that their subjects tended to avoid fair risks
($30 to $90), high-probability (80%) real loss, vindicating Bernoulli’s view that risk aversion
is the dominant attitude.
Other scholars including Bailey, Kumar and Ng (2011) examined the effect of behavioural
biases on the mutual fund choices of a large sample of US discount brokerage investors. They
found that behaviourally biased investors typically make poor decisions about fund style and
expenses resulting in poor performance. Kester, Hultink and Lauche (2009) identified three
genres of portfolio management decision making, namely: formative-reactive, intuitive, and
integrative. Each genre could be identified as a unique set of portfolio management practice.
Kester, et al found that firms employing an integrative approach toward portfolio decision
making were mostly likely to be successful in the long run compared with the others. Other
scholars who applied modern statistical decision theory were Mao and Sarndal (1966) who
reviewed Markowitz’ portfolio selection model in light of the newer theories in decision
making. Mao and Sarndal explored the subjective nature of investor’s estimates regarding
probability, which brings about the subject of heuristics and biases in decision making.
Another approach identified in the literature is the development of other models, building on
the existing theory on prospect theory as described by Edwards (1996) in “Prospect theory: A
literature review”. Edwards makes example of other scholars who have successfully
developed other models from prospect theory like Loomes and Sugden (1982). Other
researchers have developed variant models on prospect theory include Schmidt and Zank
(2009) who presented a paper that combines the loss attitude and linier utility by providing an
axiomatic analysis of cumulative prospect theory in the framework for decisions under
uncertainty. Schmidt and Zank (2008) also investigated risk aversion in cumulative prospect
theory. Their research found strong risk aversion implies a convex weighting function for
gains and a concave one for losses, bringing more light into Kahneman and Tversky (1992)
cumulative prospect theory.
Other researchers like Abdellaoui, Bleichrodt and Kammoun (2013) completed experimental
studies to determine if financial professionals behave according to prospect theory.

581
Ultimately, the purpose of the identified literature was to find gaps in current knowledge (that
supports the identified problem in practice) from which the doctorate research questions were
developed. The literature detected the tone and direction of arguments upon which new
knowledge will be developed. Without the relevant literature, the question of new knowledge
would not be answered. New knowledge builds upon existing knowledge identified in current
literature.
5. CONCLUSIONS
Decision making processes have been studied for generations beginning with expected utility
theory as described by Von Neumann and Morgenstein in 1944. Modern decision theories
have been developed in the 1960s and 1970s by Kahneman and Tversky (1979, 1992). The
work of Kahneman and Tversky is the central theory for the proposed doctorate research.
Further research completed by other scholars like Shefrin and Statman (1994, 2000), Stracca
(2004) supports the work of Kahnemen and Tversky and will also form the basis of the
theory for the proposed doctorate research. Thaler’s (1999) proposition that behavioural
finance was entering an era where it will be an integral part of main stream econometrics and
financial analysis is the premise for the doctorate investigation.
The objective of the doctorate research is to investigate the psychological and behavioural
aspects of decision making in real estate investments, taking into account that real estate
investment decisions are usually made under uncertainty.
Further, from the literature, the methodology for the doctorate research will follow the work
of Bailey, Kumar and Ng (2011), Bosch-Domenech. and Silvestre (2010), Brendle (2006),
Friedman and Savage (1948), and Gurevich, Kliger and Levy (2009).
From the literature discussed on this paper, it was clear that behavioural finance is an area of
research that is gaining momentum. The literature also showed that it has now become a
popular subject for research as it has had numerous papers published in the last fifty years.
There now seem to be consensus amongst several scholars in decision making, whether be in
finance, management or medicine, psychological analysis, that behavioural aspects are
critical.
More so, for professionals who rely to a great extent on experience and intuition for making
professional decisions, it becomes even more critical that the human and psychological
aspects of the processes are scrutinized. Even more so when you consider real estate
investment decisions in developing countries, in Sub-Saharan Africa to be precise, where
economic and markets’ information is scarce and often unreliable.
Another benefit of the literature review was presentation of methodology examples for topics
in decision making. Some of the papers reviewed provided practice based research and
outlined in detail the methodology for collection of data and its analysis. Other papers
presented techniques and approaches for the analysis of the data in decision making
experience and field studies. The methodology described in these papers was helpful in
developing the methodology for the doctorate research.
The identified literature provided a good platform for developing new ideas that could be
further developed into research questions and hypotheses. The literature reviewed also

582
supported the importance of the human and psychological aspects in investment decision
making.
6. REFERENCES
Abdellaoui, M., Bleichrodt, H. and Kammoun, H., 2013, Do financial professionals behave according to
prospect theory? An experimental study, Theory, 74, pp 411 - 429
Bailey, W., Kumar, A. and Ng, D., 2011, Beharioural biases of mutual fund investors, Journal of Financial
Economics, Vol 102, pp 1 – 27
Blas,J., 2013, Africa economic data: investors fear numbers fail to add up, Financial Times, October, viewed 30
Nov, 2013. https://www.ft.com/content/9b4343ec-34eb-11e3-a13a-00144feab7de
Bosch-Domenech, A. and Silvestre, J., 2010, Averting risk in the face of large losses: Bernoulli vs Tversky and
Kahneman, Economic letter, Vol 107, pp 180 – 182.
Brendle, S., 2006, Portfolio selection under incomplete information, Stochastic Processes and their
Applications, 116, pp 701 – 723
Cohen, L.J., 1979, On the psychology of prediction: Whose is the fallacy, Cognition, Vol 7, pp 385 – 407
Cohen, L.J., 1980, What has induction got to do with causality? In Applications of inductive logic, ed. L.J.
Cohen and M. Hesse, Oxford: Clarendon Press
Cohen, L.J., 1981, Can human irrationality be experimentally demonstrated? The Behavioural and Brain
Sciences, Vol 4, pp 317 - 370
Cohen, L.J., 1982, Intuition, Induction and the middle way, Monist 65, pt 3.
Edwards, K.D., 1996, Prospect theory: A literature review, International Review of Financial Analysis, Vol 5,
No. 1, pp 19 -38
Friedman, M and Savage, L.J., 1948, The Utility Analysis of Choices Involving Risks, Journal of Political
Economy, Vol 56, pp 279 – 304
Gurevich, G., Kliger, D. and Levy, O., 2009, Decision-making under uncertainty – A field study of cumulative
prospect theory, Journal of Banking and Finance, Vol 33, pp 1221 – 1229.
Jerven, M., 2013, Poor numbers: how we are mislead by African development statistics and what to do about it.
Ithaca: Cornell University Press.
Kahneman, D and Tversky, A., 1979, Prospect Theory: An Analysis of Decision Under Risk, Econonetrica, Vol
47, No. 2 (March), pp 263 – 292.
Kahneman, D and Tversky, A., 1992, Advances in Prospect Theory: Cumulative Representation of Uncertainty,
Journal of Risk and Uncertainty, Vol 5, pp 297 – 323.
Keeny, R.L. and Raiffa, H., 1971, Decisions with Multiple Objectives: Preferences and Value Tradeoffs, New
York: Wiley
Kester, L., Hultink, E.J. and Lauche, K., 2009, Porfolio decision-making genres: A case study, Journal of
Engineering and Technology Management, Vol 26, pp 327 - 341
Loomes, G and Sugden, R., 1982, Regret theory, an alternative theory of rational choice under uncertainty, The
Economic Journal, 92, pp 805 -824
Maital, S., 2004, Daniel Kahneman: on redefining rationality, Journal of Socio-Economics, Vol 33, pp 1 -14
Mao, J.C.T. and Sarndal, E., 1966, A decision theory approach to portfolio selection, Management Science, Vol.
12, No. 8, Series B (April), pp 323 – 333
Merton, R. C., 1969, Lifetime Portfolio Selection Under Uncertainty: The Continuous-time Case, The Review of
Economics and Statistics”, Vol 51, No. 3, August, pp 247 - 257
Nocetti, D., 2006, Markowitz meets Kahneman: Portfolio selection under divided attention, Finance Research
letter, Vol 3, pp 106 113.
Schmidt, U. and Zank, H., 2009, A simple model of cumulative prospect theory, Journal of Mathematical
Economics, 45, pp 308 – 319.
Schmidt, U. and Zank, H., 2008, Risk aversion in cumulative prospect theory, Management Science, Vol 54,
No. 1, January, pp 208 216
Sharpe, W.F., 1964, Capital Asset Prices: A Theory of Market Equilibrum under conditions of risk, The Journal
of Finance, Vol XiX, No. 3, September, pp 425 - 442
Shefrin, H. and Statman, M., 1994, Behavioral Capital Asset Pricing Theory, The Journal of Financial and
Quantitative Analysis, Vol 29, No3 (Sep.), pp 323 – 349.
Shefrin, H. and Statman, M., 2000, Behavioral Portfolio Theory, The Journal of Financial and Quantitative
Analysis, Vol 35, No2 (June), pp 127 – 151.
Stracca, L., 2004, Behavoural Finance and Asset Prices: Where do we stand? Journal of Economic Psychology,
Vol 25, pp 373 - 405

583
Thaler, R. H., 1999, The End of Behavioral Finance, Association of Investment Management and Research,
Nov/Dec, pp 12 – 17
Von Neumann, J., and Morgenstein, O., 1944, Theory of Games and Economic Behaviour. Princeton: Princeton
University Press
584
ID 104
HOW PROJECT MANAGEMENT OFFICE (PMO) CAN BE USED TO
IMPROVE BUSINESS PERFORMANCE AND CONSTRUCTION
PROJECT SUCCESS
A. Alqahtani and A. Higham
School of the Built Environment, University of Salford, Salford, M5 4WT, UK
Email: [email protected]
Abstract: The evolution of the construction industry and the increase of its complexity on
current projects, in accordance with the global economic crisis and concerns of repeating
unsuccessful experiments, have resulted in significant pressures on construction organisations
forcing them to establish new programmes and departments to identify their priorities and
achieving effective results. With every project, there is a competition with many different
factors and the importance of using project management (PM) practices is increasing
dramatically. This is one of the factors that has increased the pressure on construction firms to
engage in these practices properly. A large number of researchers and experts have found that
investing in Project Management Offices (PMOs) can lead to higher levels of project success
whilst also embedding strong and consistent project management practices, processes, and
procedures into the organisation. This study is provided to develop the concept of PM and the
application of best practice through the use of PMO. Approximately a number of 120
questionnaires have been distributed to the PM department of five large construction firms in
the KSA. The findings shown that 69% of respondents agreed that the PMO should be
responsible for implementing some important factors of projects. As a result, this paper is
concluded by identifying a number of PMO’s roles in the management of construction projects
to improve business performance and to increase the project success rate.
Keywords: project management office; project management; project manager; construction.
1. INTRODUCTION AND RESEARCH BACKGROUND
Due to the changes and challenges occurring in the past few years in the world of
construction, the use of different sources of technology in materials and devices, as well as
the need of companies to meet these challenges through the development process to maintain
the efficiency of the organisation. Researchers and organisations, such as Association of
Project Management APM (2006), Project Management Institute PMI (2009), and Tylor
(2011), have found that investing in Project Management Offices (PMOs) can lead
organisations to higher project success rates and drive strong and consistent project
management practices, processes, and procedures. The idea of PMO began to spread in the
1990s (Hurt and Thomas, 2009). The idea was developed in order to help organisations to
create modern methods of monitoring and following up on projects to ensure that they are
delivered on time either on or under budget. Construction firms are realising the increasing
benefits of using PMO to centrally manage, facilitate, and control the diverse range of
projects delivered by the organisation (Valle et al., 2008; Kerzener, 2009; Andrew, 2013).
This entails the uniform application of policies, processes, and procedures adopted by PMO.
It has a significant role for developing and establishing different PM practices (Sontosus,
2003; Almagrabi, 2012; Rouse, 2014). The involvement of PMOs in construction projects
may provide consultation services to promote better knowledge to be shared across the whole
organisation (Hobbs, 2007; Koskinen & Pihlanto, 2008).

585
1.1 The research problem:
The majority of government projects in the KSA are suffering from the problem of faltering
and abandoned projects (Magdad, 2011; Diry, 2011). Several government agencies spotted a
large number of faltering projects that have been diagnosed since the establishment of the
National Anti-Corruption Commission in 2011. Approximately 1526 of large government
projects were executed in different fields in the last five years and the number of projects that
not completed and abandoned was (672) with a percentage of 44 (NACC, 2016). However,
according to the statistics of the Ministry of Labour in Saudi Arabia (2011), approximately
75% of construction firms do not adhere to any specific programmes for implementation; this
is left to personal interpretations only.
1.2 Research questions
What is the importance of implementing PMOs for achieving administrative organisation and
increasing project success factors?
In order to fulfil the research questions, the objectives of the research are:
1. Developing the concept of PM and the application of best practice in construction
projects through the use of PMO.
2. Clarifying what are the important roles and success factors that can be achieved by
the PMO to improve business performance in the management of construction
projects.
1.3 The Rationale for the research:
The construction sector in the KSA are suffering from some difficulties and problems that
faced many organisations to not complete the execution of projects. This study is aiming to
make a positive impact in the management of construction projects. This can be done by
using the PMO to deal properly with these issues. However, regarding to Hobbs and Aubry
(2007) have been conducting a study on around 500 different organisations from around the
world about PMO’s function and finding almost 75 unique roles of using PMOs that have
been recognized. The result indicated that general PMO procedures and theories cannot be
applied to different type and size of organisation. Therefore, to emerge from this dilemma.
The discussion will be focused more on the important roles of PMO that can suites the
execution of projects. This study seeks to advance current knowledge by identifying the
effective roles of PMOs to increase the level of project success in the KSA construction
sector.
2. PMO
2.1 Definition and Nature of the PMO
The PMO has been defined as “a strategic, management orientated concept designed to
manage business processes orientated towards construction as it is not designed to manage
construction projects” (Obrochta et al., 2011:4). PMOs can also be define as a group of
experts or department that includes a number of people from different areas within an
organisation, tasked with applying best PM practice (PMI, 2012; Andrew, 2013; Rouse,

586
2014). Hobbs & Aubry (2007) develop this definition, noting the PMO often act a regional
office, coordinating multiple projects. Alternatively, the PMO can also fulfil the role of
acting as a centre of excellence supporting the implementation of best practice and
encouraging the sharing of knowledge across the organisation in an attempt to improve
performance (Hizamul, 2010; Alsadeq et al, 2011). However, the PMO can be a specialised
set of people who work with a group of projects to run and fill a number of functions and
roles to reflect on an organisation’s performance. The construction sector’s variety of
process, policies, and procedures, which will convince the PMO to work as coordination
centre to bridge the gap between projects that are currently being implemented with senior
management (Taylor, 2011; Almagrabi, 2012; Andrew, 2013).
2.2 What Is a PMO?
PMO is contributed to maintain a list of PM best practices and provide effective guidance for
instruments and expertise in PM. This can lead to the improvement of using a formalised PM
process (Hobbs and Aubry, 2007; Kendrick, 2009). The involvement of PMOs in
construction projects may provide consultation services to promote better knowledge to be
shared across the whole organisation (Hobbs, 2007; Koskinen & Pihlanto, 2008). PMO is, to
a large extent, about improving business performance. It should work as an agent for
spreading PM standards, practices, and culture throughout the organisation (Obrochta &
Finch, 2011; Dawson, 2012; Thiqah, 2013). PMO can increase the organisation’s maturity
level, project efficiency, and help in quantifying the impact on the project’s success
(Kendrick, 2009; ESI International, 2013). Generally, as discussed by Dawson et al., (2012)
there are some main goals of having PMOs as:
Standardization of project management methodology.
Alignment of projects with organisational strategies.
Provision for training, mentoring, and consultation.
Compilation of project performance metrics.
2.3 Why Is PMO Used?
There is no single answer to this question, but in many cases, PMOs can be used for anything
required by the organisation. Hobbs & Aubry (2007) defined some important tasks for PMOs,
firstly to coordinate multiple projects under the same company. Secondly, it acts as a centre
or mentors of a wide range of best PM practices. Lastly, aiming to improve business
performance by encouraging sharing effective knowledge across various projects. Kendrick
(2009) and Nehme (2014) summarised two significant factors as to why PMOs are required.
The first is to provide project manager (PMs) with a good administrative assistant to allow
them more time to focus on critical tasks by eliminating their minor responsibilities. The
second is to control and support one or more projects from the inception date to completion.
In particular, Tylore (2011) suggested that PMOs can be:
The community of PM-wide practices and methodologies.
Training, coaching, and certification.
The process of decision-making and the project-selection process.
The reporting system and management activities.
Supporting, mentoring, and following up on financial aspects.

587
However, the main role of PMO by today’s construction firms is to be the department that
provides the quickest response to project-related issues. Dawson (2012) and Rouse (2014)
discus the primary functions of PMOs; metrics for improving PM practices, providing a
source of guidance, and documentation for the process of implementing more projects within
the same organisation.
2.4 How Is PMO Used?
The majority of researchers, including Al-Nahj (2012), Daptiv (2013), Andrew (2013), and
Jordan (2015) assume the PMO’s core function can be divided into three operational
functions, including: supportive, controlling, and directive. Each function has its own strategy
and role in the delivery of the organisation’s output.
1. Supportive:
This level of PMO is mainly working to assist the PMs and various project teams by
benefitting from having in place some type of support forms, such as guidelines, templates,
knowledge, and PM best practices. This can be achieved by bridging the gap between
different projects and bringing them together as one project community. This is an important
model that should be used throughout the whole organisation to access these benefits:
Increasing the project success levels by supporting widely the existing projects.
Allowing the PMs and project teams to have in place some types of suitable PM
information.
Encouraging and empowering PMs and project teams to come up by ideas for solving
various project problems.
2. Controlling:
This level of PMO is appropriate when the organisation needs to have discipline and standard
formats across their existing project procedures, processes, activities, and methodologies. The
utilisation of this model should be available to the organisation for ensuring all standards and
methodologies are used across projects. This model should allow the organisation to achieve
these underneath goals:
Ensuring all standards and methodologies are used across projects.
Ensuring the new types of projects are executed under its estimated budget.
Spreading the regulatory compliance among different parties and projects.
3. Directive:
This level of PMO is empowering the office to have more directive roles. For instance, the
PMs will be assigned by the PMO leader and their project progress will be reported to PMO
in order to make some types of decisions. However, the majority of construction companies
begin with the supportive model, then over time, they move to control and directive models
regarding their levels of business needs. This should be used to gain the following factors:
Ensuring PM practices are applied across projects.
Reducing the overall costs and time by discussing the risks in early stages.

588
2.5 What Types of a PMO are Used in Construction Sector?
There are a wide range of types; each company needs to identify PMO types by evaluating
the organisation’s size and their number of projects. Almaghrabi (2011) and Godbole (2014)
describe the types of PMO that can be used in construction sector, as follows:
1. PMO in a Single Project:
This is intended to be a limited version, which means that this type is only provided to
manage one specific project and its job is almost done after the project is completed.
2. PMOs as a Portfolio Management Office:
Here, the responsibility is to support some PM practices and act as one small
department, but its job does not involve in managing projects.
3. PMOs as a Centralised Office:
As the organisation executes a number of projects, PMO will be located centrally across all
the organisational units and projects. This type has other sub-PMOs who report to the main
PMO; this can be seen if the organisation is implementing more than one project in different
regions.
3. THE APPLICATION OF PMO IN IMPROVING BUSINESS PERFORMANCE
AND CONSTRUCTION PROJECT SUCCESS
Nowadays, organisations are trying to find some modern methods to use in managing
business towards construction projects (Obrochta & Finch, 2011; Dawson, 2012;). As a result
of applying those types of methodologies, companies are becoming more successful in
achieving their desired goals. Similarly, PM intends to be more managerial; this has increased
the number of practices but needs some suitable tools to increase its importance and adoption
as a PMO. While this is the case, PMO can be defined as the real helm for various
organisations that pursue different types of management across projects (Keyedin, 2012).
PMOs can be an effective tool to deal with the major project factors such as; time, quality,
cost, customer satisfaction, and staff satisfaction. Equally important, PMOs need to show
their contributions to improving business performance. This paper discusses these ideas and
goes into more in-depth detail, as follows:
1. The existence of PMOs should be used in the clarity of the decision-making process
(Almaghrabi, 2011; ESI International, 2013; Godbole, 2014). This can benefit from
the availability of such techniques as regular reports; it monitors various project
statuses. In today’s work environment, there is a huge need for transparency in order
to make the right decision, PMOs increase the level of clarity needed to ensure the
efficiency of project work. PMOs nowadays are supporting the PMs by integrating in
most of the decisions. PMs must report to the PMO team; they cannot stand with
more responsibility (Hobbs, 2007).
2. PMOs can offer the more effective management of human resources, technical and
financial aspects, as well as the variety of resources that will be administrated and
coordinated by the office (Kendrick, 2009; Dawson, 2012; Alsahli, 2013; Amanah,
2013). However, managing resources can be a big challenge currently faced by most
organisations. The delivery of projects can be managed through the shortages or
conflicts of resources. PMOs in this regard are working to balance demand by

589
understanding the organisation’s resource capacity and applying each factor at the
right time. Effective utilisation of resources will no longer be a big obstacle, as the
PMO team should be ready to receive orders from different projects and then apply
their roles to deal with these orders in regard to the entire organisation's needs.
3. PMOs can serve the organisation by spreading the PM culture and knowledge
competencies, unifying, building, and confirming the quality of the implementation of
PM practices (Obrochta & Finch, 2011; Majmah, 2013; Godbole, 2014). It needs to
achieve a suitable balance in the process of choosing the right PM practices,
delivering company needs, and ensuring its implementation. The office should find
methods, standards, and procedures for improving the PM process. Nowadays,
companies are struggling to develop the PM methodologies and applying best
practices as there so many approaches that might work for them. Over time, PMOs
will become the source of knowledge for assisting various projects.
4. The presence of PMOs will achieve the necessary levels of support and provide
current project information available to senior management (NHS, 2008; Keyedin,
2012; Dawson, 2012; PMI, 2012). The process of providing accurate reports on a
regular basis will support the achievement of this factor. Reporting should become
one of the most crucial jobs that a PMO does in order to mentor and control their
various projects. PMO teams need to understand to whom they should be reporting
and prepare various types of reports such as using different forms and styles regarding
the different tasks. The support of senior management with regular and accurate
reports will increase the organisation’s ability to be more successful.
5. PMOs should be in place to minimise expenses, costs, time, and give initial warnings
in the event of risk issues or the rising levels of providing professional schedules
(Hobbs, 2007; Kendrick, 2009; Almaghrabi, 2011; Alnahj, 2012; Alsahli, 2013). This
will increase the accuracy of spending, return on investment, and save time overall.
By considering that the establishment of PMOs will cost money, for instance in hiring
staff, running the office, and maintaining its functions, one must also think about how
it makes a great deal of sense to have common methodologies, templates, and
processes as well as reducing the overall time and cost by monitoring all the projects
in their early stages.
6. PMOs might be the right tool to increase the performance of individuals as PMs and
levels of teamwork as well as increasing the ability of implementing future projects at
high levels of efficiency (Alnahj, 2012; PM Solutions, 2013; Majmah, 2013; Halwah,
2013). Construction firms are advising to benefit from the previous lessons learned; a
rehabilitation of competencies is required by the various departments by paying more
attention to KM (Hill, 2008; Julian et al, 2008; Villa, 2010; Mysliviec, 2013; Muller
et al, 2013; Shahram et al, 2014). The analysis of project indicators to measure the
performance can be a good way to ensure continuous improvement.
7. The availability of PMOs should provide more transparency and clarity to various
projects’ policies, standards and procedures (Hobbs, 2007; Dawson et al., 2012;
Keyedin, 2012). The process of creating an environment that is considered to be more
efficient to manage different projects should adopt some regularity options. However,
as there are so many various models of PMOs in place, there is a new trend of
beginning to take accountability of simplifying the wide KM approaches. These

590
growths of PMOs are being tasked to share and gained effective knowledge abilities
as a concept of increasing the importance of PMOs as a tool.
In brief, it can be claimed that PMO is the real thinker to bridge the gap between defining the
PM practices and implementing them within the organisation. Alternatively, PMO is the
reform of management issues and/or a real supporter of increased coordination and
communication among all parties and/or projects. These are clear indications that the
investment in this area will have a positive impact on the business’ performance. Table 1
summarises the application of PMO in improving business performance based on, but not
limited to, the previous literature:
Table 1: The application of PMOs in improving business performance (Alqahtani, 2016)
References Factors of PMOs in improving business
performance
(Godbole, 2014; ESI International,
2013; Almaghrabi, 2011; Kendrick,
2009; NHS, 2008)
The clarity of decision making process.
Godbole, 2014; Majmah, 2013;
Pwc, 2012; Kacst, 2012; Obrochta
& Finch, 2011; Rouse, 2011)
An effective tool to adopt PM practices.
(Alsahli, 2013; Amanah, 2013;
Dawson, 2012; Sheaff, 2011;
Kendrick, 2009; PM Solution,
2009)
Effective management of human resources,
technical and financial aspects.
(Shahram et al, 2014; Mysliviec,
2013; Muller et al, 2013; Villa,
2010; Hill, 2008; Julian et al, 2008;
Desouza et al, 2006)
The source of knowledge (center of
excellence)
(Scott, 2016; Keyedin, 2012;
Dawson, 2012; PMI, 2012;
Obrochta & Finch, 2011 Emcanat,
2011; NHS, 2008)
Support and providing current project
information (regular and accurate reports)
(Alsahli, 2013; TenStep, 2013;
Alnahj, 2012; PMI, 2012; Kacst,
2012; Sheaff, 2011; Almaghrabi,
2011; Kendrick, 2009; Hobbs,
2007)
Minimizing the expenses, costs, time, and
reducing risk factors.
(PM Solutions, 2013; Majmah,
2013; Halwah, 2013; Alnahj, 2012;
Obrochta, 2011; Visitacion, 2009)
Increasing the performance of individuals,
teamwork and the implementation of future
projects.
(Jordan, 2015; Dawson et al., 2012;
Keyedin, 2012; Pwc, 2012;
Emcanat, 2011; Hobbs, 2007)
More transparency and clarity to various
projects policies, standards and procedures.
4. RESEARCH METHOD
The data used for this study were collected by the questionnaire method as it gathers data,
when other types of methods might cause some issues such as: the questions type seems to be

591
sensitive or confidential to the respondents or they might need more time to consider their
answers (Muller et al, 2013; Shahram et al, 2014). The questionnaire method is usually cheap
as it is easy to access a large amount of data from different people. The analysing process in
using closed questions can be straightforward, which is considered in this study (Saunders et
al., 2009).
The sample was selected according to the National Anti-Corruption Commission (NACC,
2014), considering that there are around 400 large contracting or construction firms in the
KSA back to 2014. Since this is an official statistic from the KSA government, the population
size was 400. Approximately a number of 120 questionnaires have been distributed. The
response rate was 44%, which is equal to 53 that have been completed.
The sampling method used was random sample as it suits answering research question; What
is the importance of implementing PMOs for achieving administrative organisation and
increasing project success levels? The random sample was distributed equally to two groups
(Head Office group and Project Site group) and every individual in the population might be
selected. The electronic mail surveys were used as a method of collecting the survey data.
Individual participants had the chance to read, answer, and replay or send the completed
survey through the survey Monkey program. The analysis of the collected data has been
analysed statistically and statistics programmes (PSS) was considered to facilitate the
analysis method. However, statistical analysis was used in this research to illustrate the data
in a numerical value, which is computed from the sample to describe the mean and
makes interferences about the population.
The questionnaires were sent to a number of 120 people who work in the PM department of
five large construction firms in the KSA named as Ministry of foreign affairs, Jeddah
Municipality, Saudi Electricity Company, Saudi Telecom Company, and Alarrab contracting
company. The Experience of the participant in this research was selected based on two
criteria: First, People who work in the PMO or deal with the office as PMs for no less than
five years and have relevant information to the research. Second, People who are able,
accessible, and willing to give the level of information that is needed. However, their roles in
the project team and organisation it had to be within four areas; PMO leader, PMO
administration, PMs and head department, and operators whether engineers or staff.
The justification of using questionnaire method as it deals with questions such as; clarifying
what are the important roles and success factors that can be achieved by the PMO to improve
business performance in the management of construction projects. This method shall enable a
greater number of people to give their different viewpoints on the PMOs and how
participants in this survey understanding the role of the office.
5. RESULTS
Through asking respondents to evaluate the average performance of the project management
practice of the current or last project. There is a significant trend by people to dissatisfaction
with the performance of the PM practice that described in figure 1. For example; the risk
management and resource management were carrying the highest negative ratios of about
53% and 43%, respectively, were selected poor. There are a number of weakness with these
figures: Firstly, the loss of a lot of sources that are outside the project needs, or in many cases
there are no better places to store them. Secondly, if there are no exceptions of the risk

592
factors, it might be occurred suddenly, which requires paying a lot of money and time in
addressing them later on.
However, there is some sort of satisfaction with the performance of financial management
with approximately 29% that described as good. This can present the demand of government
to implement more projects and encouraging construction firms that there are no problems for
receiving payments. Otherwise, the rest of communication, knowledge, and delivery
management that ranges from poor to average. It is evident that there is a great need for the
majority of construction firms in the KSA to improve these practices via PMO office which
can help them to improve the overall business performance.
Figure 1: Evaluating the performance of the project management practices in the KSA
(Alqahtani, 2015)
Do not know (0-
20%)☹
Poor (20-
40%)☹
Average(40-60%)
Good (60-
80%)☺
Excellent(8
0-100%)☺
Communication Management 5% 34% 40% 18% 3%
Knowledge Management 2% 38% 36% 18% 6%
Change Management 7% 40% 37% 12% 5%
Resources Management 8% 43% 33% 10% 6%
Delivery Process 4% 35% 31% 22% 8%
Finance Management 2% 31% 26% 29% 13%
Risk Management 14% 53% 24% 3% 6%
0%
10%
20%
30%
40%
50%
60%
PER
CEN
TAG
ES
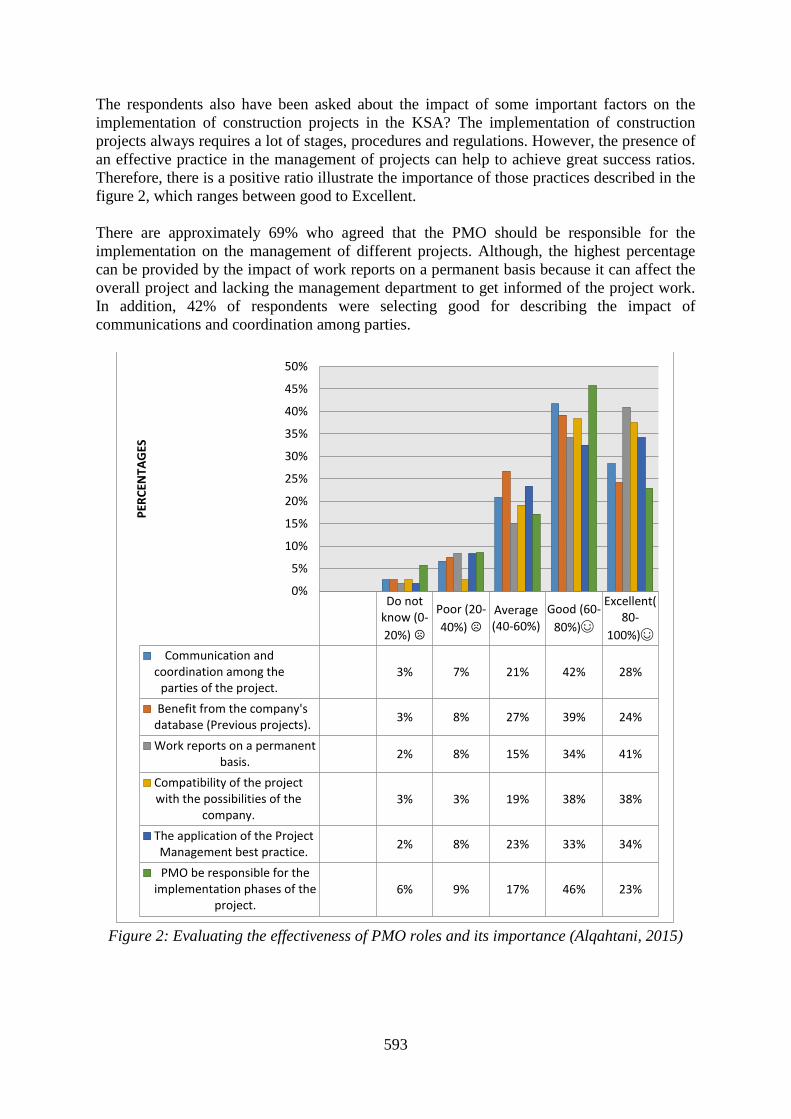
593
The respondents also have been asked about the impact of some important factors on the
implementation of construction projects in the KSA? The implementation of construction
projects always requires a lot of stages, procedures and regulations. However, the presence of
an effective practice in the management of projects can help to achieve great success ratios.
Therefore, there is a positive ratio illustrate the importance of those practices described in the
figure 2, which ranges between good to Excellent.
There are approximately 69% who agreed that the PMO should be responsible for the
implementation on the management of different projects. Although, the highest percentage
can be provided by the impact of work reports on a permanent basis because it can affect the
overall project and lacking the management department to get informed of the project work.
In addition, 42% of respondents were selecting good for describing the impact of
communications and coordination among parties.
Figure 2: Evaluating the effectiveness of PMO roles and its importance (Alqahtani, 2015)
Do not know (0-
20%)☹
Poor (20-
40%)☹
Average(40-60%)
Good (60-
80%)☺
Excellent(80-
100%)☺
Communication andcoordination among the
parties of the project.3% 7% 21% 42% 28%
Benefit from the company'sdatabase (Previous projects).
3% 8% 27% 39% 24%
Work reports on a permanentbasis.
2% 8% 15% 34% 41%
Compatibility of the projectwith the possibilities of the
company.3% 3% 19% 38% 38%
The application of the ProjectManagement best practice.
2% 8% 23% 33% 34%
PMO be responsible for theimplementation phases of the
project.6% 9% 17% 46% 23%
0%
5%
10%
15%
20%
25%
30%
35%
40%
45%
50%
PER
CEN
TAG
ES

594
6. DISCUSSION
The findings of this study can be based on the outcome of various literatures that discussed
the application of PMOs in improving business performance, which is summarised in table 1.
Additionally, the confirmation of research methods in section 5 that used to evaluate the
performance of PM practices in the KSA and the effectiveness of PMO roles and its
importance. One explanation is the questionnaires illustrated that the average performance of
dealing with PM practices are ranged between 20-40%, which is poor. However, this lack of
applying best practice of PM in the KSA can be reduced by the existence of PMOs, as it cans
play many roles in the management of construction projects and maximising the availability
of best PM practice. This challenged the research to conclude with 7 important roles that can
be adopted by the PMO office and answering the research question. These factors shall
contribute in the successes of construction project and the improvement of the overall
business performance; as illustrated in figure 3:
Figure 3: PMO’s roles in the management of construction projects (Alqahtani, 2016)
7. CONCLUSIONS
Project Management Office (PMO) is one of the most important phenomena that has spread
widely to provide basic organisational means to construction firms. However, the uncertainty
of its importance is still under debate by some researchers in this field or organisations in the
KSA construction market. Therefore, this paper is provided to develop the concept of PMOs
in terms of increasing the success factors that mainly contribute to it. However, the research
has focused widely on the importance of the office work to achieve best practice of PM and
to be the main coordinator to monitor the various stages toward project implementation.
Finally, this study has shown that the KSA construction firms, according to their current
complexity of managing construction projects do not mind supporting new approaches such
as PMO, but on the condition that these global practices should be more realistic to
implement.
PMO’s
Roles

595
8. REFERENCES
Al-Nahj (2012). “Project Management Office-PMO”. Al-Nahj for Information Technology, Riyadh. Available
at: WWW.ALNAHJ.COM assessed date: 15/02/2016.
Anantatmula, V (2012). Improving the Effectiveness of a PMO by Integrating Knowledge Management
Concepts. The George Washington University. The School of Business and Public Management.
Aubry, M., Hobbs, B, Thuillier. (2007): A new framework for understanding organizational project management
through the PMO. International Journal of Project Management. Vol. 25, No. 4, 328-336.
APM (2012) Association for Project Management Body of Knowledge. 5th edn. Buckinghamshire: APM.
Andrew, (2013). Measure the maturity level of your PMO. Available at: http://www.ensys.com.au/news/.
Accessed date: 11/03/2016.
ESI International. (2013). The 2012 Global State of the PMO. Sydney: ESI International.
Elizabeth, D and John, W. (2013) The role of project management offices (PMOs) in IS project success and
management satisfaction. Emerald Group Publishing Limited. Available at:
http://oro.open.ac.uk/33995/2/246D196E.pdf. Accessed date: 10-10-2016.
Egbu, C., Botterill, K., Bates, M (2001). The influence of knowledge management and intellectual capital on
organizational innovations. In: ARCOM Seventeenth Annual Conference, ARCOM, University of Salford,
Salford, vol. 2, pp. 547–555.
Godbole, S. (2014) PMO: Its Impact on Project Success and Measuring Its Performance. Purdue University.
Joint International Conference.
Jordan, A. (2015). The Next Generation PMO Leader. Available at:
http://www.projectmanagement.com/articles/296384/The-Next-Generation-PMO-Leader. (Accessed 18-04-
2016).
Kendrick, J. (2009). Measures and Metrics for PMO Success. Project Management Office Summit. Washington,
D.C.: P2C2 Group, Inc.
Nehme, M. (2014). Do You Need a Project Management Office (PMO)? (Online) Available at:
http://blog.softwareadvice.com/articles/project-management/do-you-need-a-pmo-0214/. (Accessed 26-09-
2016).
Obrochta, M., & Finch, C. (2011). Key Performance Indicators for the PMO: Metrics for Success. Retrieved
from http://www.pmhut.com/key-performance- indicators-for-the-pmo-metrics-for-success. Accessed date:
10-10-2016.
PMI, (2009). Project Management Office (PMO) fundamentals - Part I. Available at:
http://jensenpmp.blogspot.com/2009/09/project-management-institute-pmi-states.html accessed date:
24/01/2016.
PM Solutions. (2013). The State of The PMO 2012. Glen Mills: PM Solutions.
Rouse, M. (2011). Project Management Office (PMO). (Online) Available at:
http://searchcio.techtarget.com/definition/Project-Management-Office. (Accessed 24-12-2015).
Tylor, P. (2011) How to be A PMO leader. Leading successful PMO. Gower publishing routledge, London.
Villa, T (2010). Selling knowledge management to PMOs. PMI Global Congress Proceeding. Marseilles,
France.
Dawson, D., Ramos, C., Davidson, A., & Paterson, R. (2012). The Well-Structured Program Management
Office Keys to Managing IT Demand. Chicago and Dallas: Booz & Company, Inc.
Halawah, M. (2013). “The Role of PMO in different stages of the Project”. Available at: http://www.arab-
eng.org/vb/t40427.html accessed date: 28/01/2016.
Hizamul, R. (2010). Establishing A PMO more efficient and effective. Faculty of civil engineering technology
Malaysia.
Majmah, (2013). “Conference on the Establishment of the PMO”. Available at: a/arhttp://www.mu.edu.s/
accessed date: 20/02/2016.
Motawa, I & Anumba, C & Lee, S. (2007). “An integrated system for change management in construction”.
Automation in Construction, 16(3)368-377.
Mastering PM, (2012). Available at: http://www.mastering-project-management.com/support-
files/pmo_charter_template.pdf. Accessed date: 20/02/2016
NHS, (2008). A PRACTICAL GUIDE TO SETTING UP A PMO (WITH EXAMPLES). PORTFOLIO,
PROGRAMME & PROJECT MANAGEMENT OFFICES. Department of Health Informatics Directorate
Informatics Capability Development branch.
Obrochta, M., & Finch, C. (2011). Key Performance Indicators for the PMO: Metrics for Success. Retrieved
from http://www.pmhut.com/key-performance- indicators-for-the-pmo-metrics-for-success. Accessed date:
10-10-2016.
Practical PMO, (2011). PMO Tools Project Communications. Available at: http://www.practicalpmo.com/17-
pmo-tools-project-communication/ accessed date: 27/04/2016.

596
Stanleigh, M. (2006). Risk Management...the What, Why, and How. Available at: http://www.bia.ca/articles/rm-
risk-management.htm. Accessed date: 10/04/2016.
Salameh, H. (2014) “A Framework to Establish a Project Management Office”. European Journal of Business
and Management, Vol (6) pp. 2.
Thiqah (2013). “PMO Approach”. Available at:
http://www.thiqah.com/index.php?option=com_content&view=article&id=82:2009-02-17-20-29-
37&catid=60:support&Itemid=123 accessed date: 05/03/2016.

597
ID 106
HOW PROJECT MANAGEMENT OFFICE (PMO) CAN BE
ESTABLISHED IN THE SAUDI ARABIAN CONSTRUCTION
ORGANISATIONS
A. Alqahtani and A. Higham
School of the Built Environment, University of Salford, Salford, M5 4WT, UK
Email: [email protected]
Abstract: Current researchers into the project management offices (PMOs) has highlighted
the PMO’s functions as a knowledge brokers between project and top management and
between different projects under the same organisation. Nonetheless, current literature of
PMOs does not provide sufficient evidence to increase awareness of the Kingdom of Saudi
Arabian (KSA) construction firms to establish this office. These issues are investigated in this
paper through conducting a survey in five construction firms. The main contribution is insight
into highlighting the challenges and difficulties in the KSA construction market and how
PMOs can be proposed to overcome these factors. The methodology is used to evaluate
people’s knowledge of PMO and its importance to be established in the KSA as well as
evaluating some important elements of managing projects in the KSA to clarify and confirms
the needs behind establishing the office. Approximately a number of 120 questionnaires have
been distributed to the PM department of five large construction firms in the KSA. The
findings shown that 49% of PMs or who works in the management field consider their
knowledge of PMOs as poor. While 69% of participants agreed on the need of establishing
PMOs. As a result, this paper is concluded by proposing some steps and procedures to address
the establishment of PMO and to increase the awareness among firms about its importance.
Keywords: project management office; project management; project manager; construction.
1. INTRODUCTION AND RESEARCH BACKGROUND
Construction firms are realising the increasing benefits of using PMO to centrally manage,
facilitate, and control the diverse range of projects delivered by the organisation (Valle et al.,
2008; Kerzener, 2009; Andrew, 2013). Due to the changes and challenges occurring in the
past few years in the world of construction and the need of companies to meet these
challenges through the development process to maintain the efficiency of the organisation.
Researchers and organisations, such as Association of Project Management ‘APM’ (2006),
Project Management Institute ‘PMI’ (2009), and Tylor (2011), have found that investing in
Project Management Offices (PMOs) can lead organisations to higher project success rates
and drive strong and consistent project management practices, processes, and procedures.
The idea of PMO began to spread in the 1990s (Hurt and Thomas, 2009). The idea was
developed in order to help organisations to create modern methods of monitoring and
following up on projects to ensure that they are delivered on time either on or under budget.
However, before approaching PMO in KSA, organisations are advised to consider: First,
what is a PMO? PMO is contributed to maintain a list of PM best practices and provide
effective guidance for instruments and expertise in PM. This can lead to the improvement of
using a formalised PM process (Hobbs and Aubry, 2007; Kendrick, 2009). PMO is, to a large
extent, about improving business performance. It should work as an agent for spreading PM
standards, practices, and culture throughout the organisation (Obrochta & Finch, 2011;

598
Dawson, 2012; Thiqah, 2013). By recognising the reasons behind projects to not completed
and abandoned; PMO can increase the organisation’s maturity level, project efficiency, and
help in quantifying the impact on the project’s success (Kendrick, 2009; ESI International,
2013). The second, what does the PMO do? The main role of PMO in today’s construction
firms is to be the department that provides the quickest response to project-related issues.
Rouse (2014) assume the primary functions of PMOs: metrics for improving PM practices,
source of guidance, and documentation for the process of implementing more projects within
the same organisation.
1.1 The research problem:
The majority of government projects in the KSA are suffering from the problem of faltering
and abandoned projects (Magdad, 2011; Diry, 2011). Several government agencies spotted a
large number of faltering projects that have been diagnosed since the establishment of the
National Anti-Corruption Commission in 2011. Approximately 1526 of construction projects
were executed in different fields in the last five years back to 2016; and the number of
projects that not completed and abandoned were (672) around 44% (NACC, 2016). However,
according to the statistics of the Ministry of Labour in the KSA (2011), approximately 75%
of construction firms do not adhere to any specific programmes for the implementation
process; this is left to personal interpretations only.
1.2 Research questions
1. How can an organisation develop its own understanding of PMO’s approaches, roles,
functions, and retain them in the long-term?
2. What process do companies need to establish or evaluate unique PMOs?
In order to fulfil the research questions, the objectives of the research are:
3. Highlighting the reasons behind project to falter and abandoned and clarifying what
are the important roles and success factors that can be achieved by the PMO to face
these current challenges in the KSA’s construction sector.
4. Finding the basic principles for establishing PMOs and how to evaluate its
performance during the different phases of the project.
1.3 The Rationale for the research:
The construction sector in the KSA are suffering from some difficulties and problems that
faced many organisations to not complete and abandoned the execution of projects. This
study is proposed to make a huge difference in the management of construction projects. This
can be done by using the PMO to deal properly with these factors. However, regarding to
Hobbs and Aubry (2007) have been conducting a study on around 500 different organisations
from around the world about PMO’s function and finding almost 75 unique roles of using
PMOs that have been recognized. The result indicated that general PMO procedures and
theories cannot be applied to different type and size of organisation. Therefore, to emerge
from this dilemma. The paper will be focused more on the important roles of PMO that can
be linked directly with the factors that effect the execution of projects in KSA. This study

599
seeks to advance current knowledge by finding an effective and professional plan for the
establishment of PMOs to increase the level of success in the KSA construction sector. The
PMO can be used as one of the modern methods for creating new departments for PM or the
development of these sections in a place, which can be centrally located across various
projects to address and support their requirements and needs.
2. PMO AND ITS EXISTENCE IN THE KSA
Increasing the implementation of PMO has been highlighted in the KSA government’s
strategic plan ‘vision 2030’ which articulates a series of reforms for government. One of
which is the introduction of a national PMO, formed by the ministry of Economy and
planning in 2015 (Khatib, 2016; Bakkah, 2016; Fattah and Nereim, 2016). The national PMO
will be used to review government projects to ensure their efficient implementation,
consistent development by identifying needs and priorities as well as to apply the latest PM
approaches to public sector projects. The application of PMO in government entities in KSA
can already be seen in different sectors such as the Jeddah Municipality, Majamah
University, the national information centre, Ministry of Interior, and Ministry of Health
(Bakkah, 2016; Fatteh and Nereim, 2016).
2.1 The KSA Construction Sector
There has been great attention paid by the KSA’s government to executing a large number of
projects in the coming years in order to deal with the large increase in population, with an
estimated annual increase of 2.7 percent (Ccdos, 2013). The KSA construction market will
therefore become one of the largest emerging markets in the Middle East, considering that the
KSA government increased its spending to $385 billion for the next ten years (Khatib, 2016;
Bakkah, 2016).
In order to benefit from this, KSA construction firms are beginning to execute more than one
project at the same time. As a result, companies are engaging in more types of projects that
are not usual for their size, or they do not have enough professionals experienced in leading
their specific types of projects. Organisations are finding that PMO should be applied to meet
these challenges, in case its implementation was to be successfully defined (Alnahj, 2012;
Halawah, 2013).
2.2 The Reasons Behind Project to falter and abandoned in the KSA
The reasons for faltering and stalled projects in the KSA can vary. NACC (2016) identified
four major factors that causes delay and failure in many projects: lack of planning, lack of
visibility during the studies and design stage, deficiencies in study of the project’s nature, and
the lack of the existence of a project management office (PMO) in large companies.
Recently, it has been disclosed that the value of non-performing government projects is
estimated to be 100 billion Riyals (Alsahli, 2013).
Table 1 underneath indicates that several researchers have stated there are a lot of factors that
cause delays and increased project failure rate. Alnahj (2012) and Halawah (2013) largely
share the same concepts and focus clearly on the lack of coordination and communication

600
between all parties as well as investigating how to take advantage of past experiences
obtained by the company in the implementation of previous projects. In contrast, others focus
on the weakness of support from the top management and training programmes that were
supposedly established in many companies, according to their needs and requirements. Going
into more in-depth critique on the table 1 below, many have asked about the key aspects of
project failure. To access the appropriate answer, there are a number of strengths and
weaknesses of this argument; as follows:
Firstly, there is a failure to fully acknowledge the importance of having a good
communication system and knowledge sharing among projects (Emcanat, 2011; Halwah,
2013; Alsahli, 2013; Majmah, 2013). It would be effective for construction firms to connect
all projects as one whole unit and uniform the procedures, policies, and standards.
Secondly, all define the most serious limitation, which can easily increase the percentages of
project failures, as the lack of implementing PM practice (Thigah, 2012; Majmah, 2013). One
question that might need to be asked is how companies are making decisions and
implementing their projects.
Thirdly, evidence to support this can be found in the work of both Majmah (2013) and
Amanah (2013) who explained that the majority of the KSA’s organisations make decisions
individually. This would not be appropriate in situations where there are no qualified PMs
who can deal with all project aspects, as proved by Kacst (2012) and Alnahj (2012).
Fourthly, Thiqah (2012) and Halwah (2013) have challenged this on the ground that poor
coordination among various departments results in not taking advantage from previous
projects. Emcanat (2011) and Majmah (2013) have both criticized the lack of adequate
reporting systems in the current management of KSA’s projects. Espousing this presents
difficulties in practice. For example, how the senior management or PMs can follow up on all
project procedures?
As a result, this section was provided to make a comparison table between many
practitioners, researchers, and organisations in the KSA in terms of the reasons of
uncompleted and abandoned construction projects. This is can be shown in the following
table 1:

601
Table 1: Reasons behind project to falter or abandoned (Alqahtani, 2015)
HALAWAH
(2013)
EMCANAT
(2011)
MAJMAH
(2013)
KACST
(2012)
THIQAH
(2012)
AMANAH
(2013)
ALNAHJ
(2012)
ALSAHLI
(2013)
Magdad
(2011)
1 Poor coordination
Weakness of
rehabilitation and
training of
various factors
Lack of project
management culture
among workers
Lack of supervision
and audit process on
the project data
Not benefit from
the successful
experiences
Poor performance
in project
implementation
Lack of knowledge of
the necessary
resources properly
Focus on artwork
and construction
only
PM do not work as
desired
2
Modest
performance for
project managers
and teamwork
Lack of uniform
procedures for
project
management
Make decisions
individually
Failure to provide
project managers with
the required reports
Not to put specific
methods for PM
Insufficient
information
available about
the project
Failure to find
advanced methods in
project management
Lack of strategy
and clear
objectives
Weak reports system
for doing tasks
3 Loss of business
documentation
Lack of support
levels
Environment project
management is not
effective
Lack of training
project managers on
how to deal with the
management system
documentation
The selection of
projects to suit the
potential of the
company
Coordination
random and
unorganized
Non-management
mode for each
individual risk and
common to all
projects
The lack of
criteria and
indicators to
measure
Database seems to be
missing
4 The lack of reports
on a regular basis
and accurate
Regulatory
options do not
work properly
Lack of knowledge of
the key actions for
project management
The lack of updated
information on a
regular basis for
previous projects
Not to take
advantage from
project
management
practices
Poor
communication
and lack of
coordination of
activities
Lack of central
coordination to
manage
communications
across projects
Little attention in
the planning PMs are not qualified
5
Lack of knowledge
of the various
procedures of the
project
Knowledge
gained from
previous projects
missing
Lack of reporting and
not completed as
required
Do not put a specific
system for the
management of
rewards for workers
Repeat failure
with an inability
to avoid them
The absence of base
and supervisory
guidelines for project
managers
Lack of
transparency and
clear
Poor coordination
and communication
between all parties
6 Not to take
advantage from
previous projects
Slow in issuing
decisions
Weakness of oversight
of all schedules
Entry in some type of
projects outside their
possibilities
7 Increasing the size
and type of project
possibilities
Weak oversight of the
financial aspects of
the project budgets

602
3. HOW THE CONSTRUCTION FIRMS CAN SET UP THE PMOS IN THEIR
PROJECTS TO INCREASE PROJECT SUCCESS
Throughout the search on how to set up PMOs, it is noticeable that thousands of hits will
return. However, this paper is focused on the steps and procedures that can be worked to
address the defined issues in the previous table 1 rather than repeating some information
already available and it seems to be out of date. Table (2) summarise the international
literatures of PMO establishment; as it can be discussed on the following points:
Firstly, the full agreement by all that the first step of establishing PMO should be used to
identify and defied the PMOs tasks. To build a strong foundation for this concept, a full
knowledge of its objectives is needed to be provided. This paper cannot overlook this
important step and will place it as the basis for establishing this department.
Secondly, researchers as (Hizamul, 2010; ASPE, 2012; NHS, 2013) lacking the needs to fully
acknowledge the importance of involving both senior management and stakeholders. This
will result in increased pressure on PMs to highly benefits from the office and to gain the
necessary support at the right time. This research is assumed the involvement of senior
management as a second step for the PMOs to be successfully launched and achieved its
objectives.
Thirdly, PMI (2009) and ASPE (2012) and CIO (2012) believe that provides on-going
training and coaching program for PMs and staff will increase their interest and preparing the
required competencies for the office. This would be appropriate in situations where this
concept is prevalent. A good example can be the KSA where the PMOs try to appear on the
surface by many construction firms as it will be seen in the methodology section. This could
present some difficulties in practice.
Fourthly, some sources as the CIO (2012) fails to define the need for chosen suitable PMO’s
teams and to design efficiently its tools. This might provide some limitations with applying
this in practice. An alternative explanation might be seen by Wilkinson (2013) argue to
benefit from keeping monthly face-to-face meetings and regular reports. This can evaluate
from time to time the effectiveness of PMO and its worth.
Finally, a further major criticism of all viewpoints is that the process is always concluded by
identifying the importance of PMOs to be evaluated. At this stage organisation should use the
evaluation process as the final stage of establishing PMOs, which must be accompanied with
the presence of the office.
As a result, the following aspects can be summarised based on the previous discussion:
provide and identify PMO mission, objectives, involve stakeholders and senior management,
provide training and coaching programs to improve people skills, define and design PMO
process, teams, tools, provide meetings, reports, and evaluate and update PMO. Table 2
below, is provided to explain the various procedures and steps of establishing PMOs:
Table 2: Procedures and steps of Establishing PMO (Alqahtani, 2015)
PMI
(2009)
NHS
(2013)
CIO
(2012)
ASPE
(2012)
Wilkinson
(2013)
Hizamul
(2010)

603
1 Identify
the
orientatio
n of PMO
Identify
what
problems
to be
solved
Prepare the
company for
this new
department
Define the
mission-
strategy-
objectives
Define the
purpose of
establishing
PMO
Prepare a
strong
foundatio
n for
PMO
2 Provide
ongoing
training
Identify
PMO
vision
Identify the
PMO type
Provide PMO
to support
PM
methodology
Support by
senior
management
stakeholders
Identify
PMO
roles
3 Provide
PMO
process
help desk
Define the
objectives
Communicat
ion with
stakeholders
and senior
management
Provide
training &
coaching
Define the
PMO process
& tools
Design
PMO
teams
4 Provide
face-to-
face
meetings
Define how
PMO can
be
operated
Allow time
for getting
the result
Design the
PMO teams
& common
resources
Design the
PMO group
Identify
PMO
policy & methodology
5 Provide
communic
ation
Identify
teams &
tools
Evaluate &
communicate
early wins
Updates &
develop PMO
Communicati
on with all
parties
Provide
metrics
6 Change
PMO
tasks as
you go
Develop and
change
through time
Evaluate
PMO work
Keep monthly
face-to-face
meetings
7 Client
involveme
nt in each
step
Provide
training
packages
Keep regular
reports
8 Evaluate
PMO
work
Design
stages and
delivery
process
Evaluate the
PMO work
4. RESEARCH METHOD
The data used for this study were collected by the questionnaire method as it gathers data,
when other types of methods might cause some issues such as: the questions type seems to be
sensitive or confidential to the respondents or they might need more time to consider their
answers (Muller et al, 2013; Shahram et al, 2014). The questionnaire method is usually cheap
as it is easy to access a large amount of data from different people. The analysing process in
using closed questions can be straightforward, which is considered in this study (Saunders et
al., 2009).
The sample was selected according to the National Anti-Corruption Commission (NACC,
2014), considering that there are around 400 large contracting or construction firms in the
KSA back to 2014. Since this is an official statistic from the KSA government, the population
size was 400. Approximately a number of 120 questionnaires have been distributed. The
response rate was 44%, which is equal to 53 that have been completed.

604
The sampling method used was random sample method as it suits answering research
question; What process do companies need to establish or evaluate unique PMOs? The
random sample was distributed equally to two groups (Head Office group and Project Site
group) and every individual in the population might be selected. The electronic mail surveys
are used as a method of collecting the survey data. Individual participants had the chance to
read, answer, and replay or send the completed survey through the survey Monkey program.
The analysis of the collected data has been analysed statistically and statistics programmes
(PSS) was considered to facilitate the analysis method. However, statistical analysis was used
in this research to illustrate the data in a numerical value, which is computed from the sample
to describe the mean and makes interferences about the population.
The questionnaires were sent to a number of 120 people who work in the PM department of
five large construction firms in the KSA named as Ministry of foreign affairs, Jeddah
Municipality, Saudi Electricity Company, Saudi Telecom Company, and Alarrab contracting
company. The Experience of the participant in this research was selected based on two
criteria: First, People who work in the PMO or deal with the office as PMs for no less than
five years and have relevant information to the research. Second, People who are able,
accessible, and willing to give the level of information that is needed. However, their roles in
the project team and organisation it had to be within four areas; PMO leader, PMO
administration, PMs and head department, and operators whether engineers or staff.
The justification of using questionnaire method as it deals with questions such as
investigating the people’s knowledge of PMO and issues involving the usage of PMO to be
existed in the KSA construction sector. This method shall enable a greater number of people
to give their different viewpoints on the PMOs and how participants in this survey
understanding the role of the office.
5. RESULTS
Results presented undoubtedly that there is a significant lack of management attention to be
paid for the important elements of executing projects in the KSA. Evidence to support this
study can be found by evaluating five elements named as Time, Cost, Quality, and Customer
and Staff satisfaction. These elements were examined by evaluating the extent of people’s
satisfaction of their experiences in previously implemented projects. In particular, the factors
of Cost, Quality, and Time were evaluated with ranges from average to poor. This would not
be appropriate in situations where the project size is very large and has a significant impact
on large numbers of users. At this level PMOs can be provided to compete with those factors,
as well as coming up by some solutions to increase their productivities.
The results of quality evaluation were poor performance but that did not prevent a large
number of companies to increase their reputation and access to other projects with a
percentage of 36% evaluated by good. In other words, this can give clear evidence that there
is a boom in the construction sector in the KSA, which has increased significantly in line with
government objectives. However, the poor satisfaction from both customer (34%) and staff
(43%) can easily present people with a demand to change and accept new approaches to
improve their happiness. PMOs currently can be used to deliver the level of information that
the client needs and supporting staff to reduce the work pressure by distributing fair tasks.

605
Figure 1: Evaluating the project elements in the KSA (Alqahtani, 2015)
The percentages show that about 42 of respondents describing their knowledge of knowing
PMOs and understanding its roles as poor. While there are approximately 16% describing
their knowledge as good. It can be asserted that this approach is attended to be new and the
majority of people do not know significant detail about it. Figure 2 can illustrate the needs for
this study to focus on establishing the office rather than developing it. The concept of PMO
in the KSA seems to be not good enough while comparing with the evolution of this concept
in other countries around the world.
Figure 2: Evaluating People Knowledge of PMO (Alqahtani, 2015)
As the Project Management Office (PMO) approach is working to coordinate, support, and
providing the best practice of Project Management. The extent to see the importance of its
presence in the KSA have been evaluated through this survey. The result indicated, there is a
Do not know
(0-20%) ☹
Poor (20-
40%)☹
Average (40-60%)
Good (60-
80%)☺
Excellent(80
-100%)☺
Time 3% 27% 48% 13% 8%
Quality 3% 44% 30% 17% 6%
Cost 8% 23% 27% 20% 23%
Customer Satisfaction 4% 34% 33% 36% 11%
Staff Satisfaction 5% 43% 37% 37% 6%
0%
10%
20%
30%
40%
50%
60%P
ERC
ENTA
GES
0%
5%
10%
15%
20%
25%
30%
35%
40%
Do not know ☹ (0-20%)
Poor ☹ (20-40%) Average (40-60%) Good ☺ (60-80%) Excellent ☺ (80-100%)

606
good incentive for the concept of the PMO to be established in the KSA. A great number of
respondents (about 34% and 35%) agreed on the need for PMOs. While there are few
respondents (2% and 8%) who disagreed. Furthermore, there are 22% with a number of 26
out of 120 who believe that this concept is natural. It is possible that there are a number of
people who do not have enough information about this concept as confirmed on the previous
statistics.
Against this, it could be argued that some programmes to increase people’s awareness of
PMOs would be appropriate in cases where there are a number of people who do not
understand this approach and it might assist this approach as required. A serious problem
with this is, how do organisations establish a good environment for supporting new
approaches to adopt this concept. One question that might need to be asked is, which parties
should be responsible for supporting new ideas? And are they qualified enough? Those two
questions can be challenged this new department to obtain the suitable support.
Figure 3: The importance of PMOs presence in the KSA (Alqahtani, 2015)
6. DISCUSSION
Based on the questionnaires, the figures highlighted a serious weakness on how people
understand the PMOs approaches. Approximately 49% of respondents consider their
knowledge of PMOs as poor. The figures also indicate a great deal of respondent agreement
with the need of establishing PMOs with the percentages of 69%. In this case, the findings
from literature reviews and questionnaires were used to provide advice for construction firms
to establish the office to deal with the issues and challenges effect the execution of projects in
the KSA; Figure 4 can suggest some steps and procedures for establishing PMOs:
0% 5% 10% 15% 20% 25% 30% 35% 40%
Strongly Disagree ☹ (0-20%)
Disagree ☹ (20-40%)
Neutral (40-60%)
Agree ☺ (60-80%)
Strongly Agree ☺ (80-100%)

607
Figure 4: Steps and procedures of establishing PMOs (Alqahtani, 2015)
7. CONCLUSIONS
Project Management Office (PMO) is one of the most important phenomena that has spread
widely to provide basic organisational means to construction firms. However, the uncertainty
of its importance is still under debate by some researchers in this field or organisations in the
KSA. Therefore, this research aims to develop the concept of PMOs in terms of
understanding the reasons behind project to not completed and abandoned to allow the office
to address them and achieve the desired administrative balance as well as increasing the
success factors that mainly contribute to it. The research first discussed the reasons behind
projects to not completed and abandoned and then identifies the appropriate steps and
procedures for the establishment of PMO.
The findings confirmed the importance of creating this office to support senior management
in terms of connecting them with all projects and providing permanent reports of the work’s
achievement and progress. The paper also considered assisting the PMs in terms of linking
them heavily with other projects to enable the exchange of resources and expertise or
developing the managerial skills of staff by giving opportunity for the office to adopt new
courses and training programmes. Result shows the importance of the office work to achieve
best practice PM and to be the main coordinator to monitor the various stages of the
management of projects and to involve in its implementation. Finally, studies have shown
that the KSA construction firms, according to the respondent’s views and current complexity
of projects do not mind supporting new approaches such as PMO, but on the condition that
these global practices should be more realistic to be implemented in the KSA construction
sector.
8. REFERENCES Al-Nahj (2012). “Project Management Office-PMO”. Al-Nahj for Information Technology, Riyadh. Available at:
WWW.ALNAHJ.COM assessed date: 15/02/2016.
Aubry, M., Hobbs, B, Thuillier. (2007): A new framework for understanding organizational project management
through the PMO. International Journal of Project Management. Vol. 25, No. 4, 328-336.
Establishing
PMOs
In the KSA

608
APM (2012) Association for Project Management Body of Knowledge. 5th edn. Buckinghamshire: APM Publishing.
Andrew, (2013). Measure the maturity level of your PMO.
ESI International. (2013). The 2012 Global State of the PMO. Sydney: ESI International.
Elizabeth, D and John, W. (2013) The role of project management offices (PMOs) in IS project success and
management satisfaction. Emerald Group Publishing Limited.
Nehme, M. (2014). Do You Need a Project Management Office (PMO)? (Online) Available at:
http://blog.softwareadvice.com/articles/project-management/do-you-need-a-pmo-0214/. (Accessed 26-09-2016).
Obrochta, M., & Finch, C. (2011). Key Performance Indicators for the PMO: Metrics for Success. Retrieved from
http://www.pmhut.com/key-performance- indicators-for-the-pmo-metrics-for-success. Accessed date: 10-10-
2016.
PMI, (2009). Project Management Office (PMO) fundamentals - Part I. Available at:
http://jensenpmp.blogspot.com/2009/09/project-management-institute-pmi-states.html accessed date:
24/01/2016.
Rouse, M. (2011). Project Management Office (PMO). (Online) Available at:
http://searchcio.techtarget.com/definition/Project-Management-Office. (Accessed 24-12-2015).
Tylor, P. (2011) How to be A PMO leader. Leading successful PMO. Gower publishing routledge, London.
Villa, T (2010). Selling knowledge management to PMOs. PMI Global Congress Proceeding. Marseilles, France.
Dawson, D., Ramos, C., Davidson, A., & Paterson, R. (2012). The Well-Structured Program Management Office Keys
to Managing IT Demand. Chicago and Dallas: Booz & Company, Inc.
Halawah, M. (2013). “The Role of PMO in different stages of the Project”. Available at: http://www.arab-
eng.org/vb/t40427.html accessed date: 28/01/2016.
Hizamul, R. (2010). Establishing A PMO more efficient and effective. Faculty of civil engineering technology.
Majmah, (2013). “Conference on the Establishment of the PMO”. Available at: http://www.mu.edu.sa/ar/ accessed
date: 20/02/2016.
NHS, (2008). A PRACTICAL GUIDE TO SETTING UP A PMO (WITH EXAMPLES). Department of Health
Informatics Directorate Informatics Capability Development branch.
Obrochta, M., & Finch, C. (2011). Key Performance Indicators for the PMO: Metrics for Success. Retrieved from
http://www.pmhut.com/key-performance- indicators-for-the-pmo-metrics-for-success. Accessed date: 10-10-
2016.
Thiqah (2013). “PMO Approach”. Available at:
http://www.thiqah.com/index.php?option=com_content&view=article&id=82:2009-02-17-20-29-
37&catid=60:support&Itemid=123 accessed date: 05/03/2016.
Almaghraby, R. (2011) “How to establish a Project Management Office (PMO)”, PM world today, XIII (V), pp. 1-2.
Alsadeq, I. (2011). Establishing a Project Management Office (PMO) Using the Agile Approach. Originally published
as a part of 2011 PMI Global Congress Proceedings – Dublin, Ireland.
Alsahli, M. (2013). “Developing the concept of project management”. Construction and projects forum in Riyadh.
Central Department of Statistics & Information, (2013). Available at: http://www.cdsi.gov.sa accessed date:
03/10/2016.
Argaam, (2016) Saudi Arabia invites bids for national project management role. Saudi-based Argaam Investment.
APM (2006) Association for Project Management Body of Knowledge. 5th edn. Buckinghamshire: APM Publishing.
Daptiv, (2013). Top 10 PMO Worst Practices: Pitfalls to Avoid. Available at: http://blogs.daptiv.com/2012/04/the-
top-10-metrics-to-track-pmo-performance/. Accessed date; 18/03/2016.
Diry, A (2011) Discloses management and planning of construction projects. Arab British Academy for Higher
Education. Available at: http://www.abahe.co.uk/files/Arab%20Researchers/Arab%20Researchers-13-11-
2012/management-and-planning-of-construction-projects.pdf. Accessed date: 18-10-2016.
Emcanat (2011). “Towards Excellence in Project Management and Strategic Planning”. Available at:
http://areeha.info/index.php?lan=ZW4= accessed date: 12/03/2016
Fahy, M. (2016) Saudi Arabia’s new approach to avoid construction overruns and delays. Available online at:
http://www.constructionweekonline.com/article-36932-could-saudis-pmo-law-prevent-mega-project-delays/.
Accessed date: 05-10-2016.
Fattah, Z and Nereim, V. (2016) National Project Management Office. Bechtel Among Companies Said to Bid to
Manage Saudi Projects. Available online at: http://www.bloomberg.com/news/articles/2016-07-25/bechtel-
among-companies-said-to-bid-to-manage-saudi-projects. Accessed date: 07-10-2016.
King Abdul-Aziz City for Science and Technology (2012). “Project Management Office their Units and Function”.
Available at: http://www.kacst.edu.sa/ar/depts/ecpp/Pages/strac.aspx accessed date: 30/05/2016.
Khatib, H. (2016) Could Saudi's PMO law prevent mega project delays? ITP Business Publishing Ltd.
Magdad, T (2010) Project management projects. Arab British Academy for Higher Education. Available online at:
http://www.abahe.co.uk/Research-Papers/Small-Business-Administration-fundamentals-and-contemporary-
themes.pdf. Accessed date: 20-10-2016.

609
ID 114
CONSTRUCTION MANAGERS’ CULTURAL ORIENTATION IN
NIGERIA
K. Zakariyyah, J.O. Ameh and G.I. Idoro
University of Lagos, Nigeria
Email: [email protected]
Abstract: Clients’ tastes, innovation and changes in the construction sector demand prompt
and efficient means of executing project. In order to stay afloat, construction managers and
CEOs need to look inwards. The values and practices prevalent in an organisation, that is the
culture, has been researched into as as underlying factor of performance improvement. This
study therefore, investigates the practices (cultural orientation) that are prevalent among
construction managers and CEO in Nigeria. Using stratified sampling technique,
questionnaires were administered by personal contact among managers and CEOs in 113
constrcution firms in Lagos and Abuja. The questionnaires were analyzed using mean,
percentages, ANOVA and Kruskal Wallis test. The results show that there is a high level of
use of the cultural orientation presented. The most prevalent cultural orientation is conflicts
and dispute orientation, which is followed by client service orientation. The research also
revealed ownership structure, aside firm size and firm location as organisational characteristics
that have significant effect on the cultural orientation adopted. The study concludes that the 8
orientation (conflict and dispute; client service orientation, production orientation, task and
goal accomplishment, information communication technology, external, innovation and
knowledge management and workforce) are all important in a construction firm.
Recommendations were made on the need to acquire the necessary orientation and be able to
review and renew it for optimal project execution and best practice.
Keywords: Cultural-orientations, Firm Age, Firm Business-structure, Firm Location, Firm
Size.
1. BACKGROUND TO THE STUDY
Aside the contribution of the construction industry to nation’s economy and development, the
sector has a rippling effect on human development. Consequently, project and construction
organisations failure, are not only disruptive to the industry but also, have significant
multiplying negative effect on a nation’s image and economy (Zahidy, Noor & Shahryar,
2015). An atmosphere of uncertainties and unprecedented technological revolution in the
construction business and technical environment has reduced greatly the benefits to be
derived from the built environment. Different factors have been adduced to this challenge.
Prominent among which are performance problems, changes in organisational leadership and
unrealistic growth of construction organisations (The Census Bureau’s Business Dynamics
Statistics, 2011). Overcoming the challenges amidst the innumerable risks and uncertainties
is a major problem facing most countries, both developed and developing (Ofori, 2001). In
the Nigerian construction industry, performance improvement of the indigenous construction
firms has remained a lucid debate. Previous researchers have attempted to identify and
evaluate different factors that affect performance. Succcess factors that contribute to
construction project execution and organisational performance have been identified and
evaluated; Success criteria for performance have also been accessed and investigated.
Though, these attempts have given remarkable results, additional efforts are requested on
improving performance significantly (Zahidy, et al., 2015; Abiola‐Falemu,, Ogunsemi, &

610
Oyediran, 2010), Considering the uniqueness of the construction industry and the intrincacies
of how construction stakeholders are meld; criteria like personnel, skills and capabilities,
communication, relationship, decision-making, are ‘soft’ aspects relating to attitudes and
behaviours of participants. In the management and organisational behaviour literature, these
factors are captured under the ‘organisational culture’ construct (Ankrah, 2007).
Organisational culture is a system of meaning that members share; it distinguishes one
organisation from another. Organisational culture, affect performance through a complex
interplay of leadership style; business strategy; and organisational structure and process
(Lund, 2003; Yilmaz & Ergun, 2008; Wilder, van den Berg & Wireman, 2012). The
dominant culture expresses the core values shared by a majority of the organisation’s
members, while the cultural orientation depicts the percetption of the key organisational
members based on their experience, education and training.
Based on the importance of establishing competitive advantage and impacting on
performance, organisational culture has been recognized as an important factor in analyzing
organisations in various contexts (Dauber, Fink & Yolles, 2012). Success or failures of
organisations are linked to the culture it apprehends, its conflicts management style, and its
organisational effectiveness (Obinna & Farkas, 2011; Mariappanadar, 2005). This is
imperative since culture and subculture mould employees’ values which in turn influence
overall performance. Thus, Leaders and managers have thus been challenged to revolutionize
organisational culture to address challenges within the firm (Rose, Kumar & Abdullahl,
2008). Tran and Tian, (2013) reiterate the importance of organisational culture, structure and
strategy in construction businesses and firms’ success or failure. This study, therefore, is on
the identification of cultural orientation of construction managers in Nigeria. The study
identifies mangers/leaders cultural orientation and the effect of organisational characteristics
on cultural orientation of construction firms in Nigeria.
2. ORGANISATIONAL CULTURE AND PERFORMANCE
Culture is the aggregate of what a group sees as important. It is about the customs or beliefs
that hold a group together and also distinguish one group from another. Organisational
culture, is a “system of shared values and beliefs that interacts with any’s internal and a comp
external environment to produce behavioural norms.” Organisational culture affects project
performance in a number of ways. Organisational culture affect project head mission and
vision, which in turn influences the level of commitment of employees (Nongo. & Ikyanyon,
2012). In addition, organisational culture influences project planning and monitoring
processes which includes works breakdown structure and scheduling. Culture affects how
managers evaluate the performance of project teams, view projects’ outcomes and review
lessons learnt. In balancing project’s deliverables and stakeholders’ relationship, the need for
an understanding of culture and its relationshiop with projects is imperative. Leaders and
managers have thus been challenged to revolutionize organisational culture to address
challenges within the firm (Rose, Kumar & Abdullahl, 2008).
As a result of the fast and multi-faceted activities in construction, the ability to know the
necessary applications and develop strategies to meet the exigencies and be well equipped to
handle future challenges has been emphasized (Sexton & Barrett, 2003; 2004 ;Koota, 2003;
Tabassi, Abdul Rashid & Yusuf, 2012). Table 2.1 presents a chronological definition of
organisational culture

611
Table 2.1: Chronological Definitions of Culture Hofstede (1980) The collective programming of the mind that distinguishes the members of one
organization from another
Ouchi (1981) and
Pascale and Athos (1982
Culture is the philosophy that guides an organization’s policies towards
employees and/or customers
Sathe (1985) The set of important assumptions, often unstated, that members of a community
share in common.
Kottler and Heskett (1992) Values that are shared by the people in a group and that tend to persist over time
even when group membership changes as well as
behaviour patterns or style of an organization that new employees are
automatically encouraged to imbibe.
Spataro, (2005). How individuals behave, what people pay attention to, how they
respond to different situations, and how they socialize with new members and
exclude those who do not fit in.
Poškien (2006) The complex set of ideologies, traditions, commitments,
and values that are shared throughout the organization
and that influence how the organization conducts its whole performance
becoming a potential source of innovation, advancement and advantage.
Wagner & Hollenbeck
(2010)
An informal, shared way of perceiving life and membership in the
organization that binds members together and influences what they think about
themselves and their work.
2.1 Cultural Orientation and Dimensions
Construction project performance is defined by a number of interrelated factors. Some of
these factors include management’s strategic position, the project external environment,
interaction of project stakeholders, relationship with suppliers and sub-contractors, strength,
weakness, opportunities and threats within project organisation, characteristics of the
project, personalty of the stakeholders, effectiveness and completeness of project planning
processes prior to tendering and construction, site management operations, project health and
so on and so forth. (Giritli & Civan, 2008; Muller & Turner, 2007). The interplay among
these factors and project outcomes depend on the ability and orientation of the owner (s) as
well as that of the project manager. Cultural orientation is practices that are prevalent among
the managers or founders of construction firms. These are compiled from the literatures on
processes adopted by construction organisations. The artifact for cultural orientation, that is
managers’ or founders’ cultural orientation, is to be measured based on a checklist. These
include Production Orientation (PRO), Client Service Orientation (CSO), Workforce
Orientation (WKF), Innovation, Learning and Knowledge Management (ILKM), Information
and Communication Technology (ICT), Environmental/External Orientation (ENV), Task
and Goal Accomplishment (TAGA) and Conflict/Dispute Resolution (CDR).
Goal and task accomplishment is task-related. It is about employees’ degree of
commitment to the task or work to be executed as well as the decisions on what is right
(effectiveness). Factors such as planning, monitoring control, regulated working
environment, and project benchmarking are considered.
Production orientation entails management leadership style in organizing and controlling
the entire production process for maximum result. Issues relating to ethics, conformance,
communications, safety, waste minimization and proper coordination between the different
phases of construction are considered..

612
Environmental/ external orientation is about the external environments in which the
organisation operates as culture has been defined based on external adaptation and internal
coordination (Hofstede, 2001;Schein, 2004). Most of the uncertainties that an organisation
encounters is rooted in the business environment. Factors such as global economics, life style
changes, educational competencies, experience and skills of potential employees will affect
how an organisation operates. An organisation has to scan its environment either formally or
informally , in order to access and pick the relevant information and insight that will be
useful External orientation thus, focuses on how firms operate in an external environment in
relation with its clients/customers, markets and competitors. (Lemon & Sahota, 2004;
Wilderom et al, 2012)
Client service orientation One of the challenges to performance is lack of commitment to
quality improvement (Bello, Soyinghe & Akinwamide, 2012) Client orientation is needed in
order to examine an organisation’s dispensation towards achieving overall improvement to
achieve better results that often goes beyond the project completion stage. Under this
orientation, inclusion of clients’ objectives, clients’ satisfaction, emphasis on client’s interest
and quality assurance are looked into.
Innovation, Learning and Knowledge management is chosen because of its importance in
a project-based setting. Innovation is important in the rapidly changing environment.
Knowledge repository development and maintenance is important to any form of
organisation. Innovation, Learning and Knowledge Management are important in any rapidly
changing environment. Through managerial actions, the need for innovation will not only be
communicated, it will also be entrenched. Innovation, Learning and knowledge management
is chosen because of its importance in a project-based setting. Knowledge repository
development and maintenance is important to any form of organisation. Successful
innovation may depend on organisational cultural norms that groups develop and the extent
to which the group’s cultural orientation aligns with, and is supported by the organisation’s
overall orientation (Poškien, 2006; Wiewiora, Trigunarsyah,, Murphy. & Coffey, 2013). The
ability to accept changes, encourage innovative ideas for performance improvement and
sustainable competitive advantage as well as taking reasonable risks in response to changes in
the business environment cannot be overemphasized.
Information and communication technology: current knowledge on the status of
information technology in the industry is paramount, availability of relevant information on
materials, labour and technology cannot be undermined. Communication channels and media
that are unambiguous, enhance what is valued and leading to knowledge and strategies on
goal attainment is important in construction (Locke & Latham, 2002), availability of relevant
information on materials, labour and technology adoption, sophisticated tools for
computerization of office and site activities are reviewed
2.16 Conflicts and disputes resolution orientation: interaction, clearly defined and
allocated functions, building of relationships, appropriate means of documentation are
precursors to claims and conflicts management.
Workforce orientation :human resources has been identified as an important part of
organisational culture construct ( factors like commitment, training and development, rewards
and recognition, teamwork , etc have been researched into by Zain, Ishak and Ghani, (2009);
Hoegl, Parboteeah & Gemuenden, 2003;Ojo, (2010); Abiola-Falemu and Aje, (2013).
Team building and supportiveness, reward and punishment, training and workshop for
employees, employees’ participation are discussed under this orientation.

613
Conflicts and Disputes Resolution
Harmonious relationship, interaction, clearly defined and allocated functions, building of
relationships, means of conflicts resolution
In revealing organisational culture, it is important to delineate the perspective (the mindset or
belief influencing different forms of cultural studies) adopted by the researcher. In an
integrative culture-culture is shared across the entire fabric of the organisation. In these
circumstances, one can talk of cultural strength or a strong culture. When culture is shared by
a fragment of the units, that is differentiation and finally fragmentation, where culture may or
may not be shared at all. The key aspects that distinguish the three cultural perspectives
according to Martin (2002) are how culture is shared, how boundaries are conceived and how
ambiguity is associated in the fabric of the organisation.
2.2 Determinants of Culture
So many factors dictate the type of culture. Handy (1985) is of the opinion that
organisation’s history, ownership and size; technology of production; goals and objectives;
market; competitive scene; geographical and societal environment; and people are the factors
that influence organisational culture. Johnson and Scholes (1993) considered the way culture
drives organisational strategies, and emphasized that culture is influenced by external factors
such as values of the society and organized groups, and by internal factors. Barron, West and
Hannan (1994) argue that a strong positive correlation exists between the age, size and
culture of an organisation. Furthermore, some researchers argue that privatization leads to
significant changes in the culture of an organisation. Ang and Ofori (2001) believe that the
implementation of an organisation’s culture is influenced by the nature of the business
environment, type of company, and special character of company and employees
Culture is created within an organisation when the leaders endorse certain values, beliefs and
assumptions about the organisation (Kaiser, Hogan & Craig, 2008; Schein, 2010). In
summary, the beliefs and attitudes that are noticeable in a group result from a shared or
common environment, experience, stories, history, tradition etc, formed through association,
and interaction, or observation and communication over a period of time. As a result,
different cultures may develop as a result of different encounters. Organisational culture also
changes with size, goals and objectives and purposes as well as ownership structure
(Oluwattayo & Amole, 2012). Table 2.2 shows some of the determining factors for
organisational culture.
Table 2.2: Determinants of Organisational Culture Development Source: Adapted from Ankrah, (2007)
Hilderbrandt,
1991)
Johnson&
Scholes
1993
Handy,
(1985,
1993)
Dobson,et
al.,1993
Kaiser,Hoga
n, Craig,
2008
People *
The environment * *
Internal factors *
Size *
Age
History, crises and *

614
3. RESEARCH METHODOLOGY
The population for this study comprises registered construction firms listed on-line, for both
Lagos State and Abuja. The sampling frame comprises construction firms stratified based on
the 20 local government areas in Lagos State and the concentration of the construction firms
in the Central Business District (CBD), in the Federal Capital Territory, Abuja. This was
considered because most of the firms are skewed towards the Business District (CBD). The
first 12 local government areas and the listed firms in the CBD were selected. The sample
size was then calculated from these two lists with reference to Cochran, (1967) and Rose,
Sprinks and Canhoto (2015) formulae. The formulae are based on calculating sample size
from proportion and gave the construction firms as 113.
n = z2 x pq
d2
Managers gave responses to the questionnaires on cultural orientation. The level of use of
cultural orientation was assessed from 8 scales as follows: Production Orientation (PRO),
Client Service Orientation (CSO), Human Resource Management or Workforce Orientation
(WKF), Innovation, Learning and Knowledge Management (ILK), Conflicts and Disputes
Resolution (CDR), Task and Goal Accomplishment (TGA), Information and Communication
Technology (ICT) and External/Environmental Orientation (EVR) with 50 items that are self-
developed based on literature review. Respondents are scored on a Likert scale of 1-5 starting
from ‘1’ for no use to ‘5’ for very high use.
3.1 Respondents Profile
Table 4.1 shows the profile of the professionals that responded to the questionnaires.
Table 4..1: Respondents Profile Respondents’
background
Frequency Percentage Respondents’
background
Frequency Percentage
successes
Technology and
primary function
* *
Goals and
objectives
Structure and
strategy
*
Leaders and
ownership
* * *
Location *
Work group
Recruitment
policy
Macro culture/
societal value
*

615
Gender Marital Status
Male 101 83.5 Single 32 26.4
Female 20 16.5 Married 89 73.6
Total 121 100 Total 121 100
Educational
Qualification
Professional
Membership Cadre
HND 31 25.6 Graduate 36 29.8
B.Sc. 34 28.1 Corporate 66 54.5
M.Sc. 52 43.0 Fellow 19 15.7
Ph.D. 4 3.3 Total 121 100
Total 121 100
Professional
Affiliation
Years of Experience in
the Establishment
NIA 12 9.9 1-5 years 22 18.2
NSE 28 23.1 6-10 years 65 53.7
NIOB 52 43.0 11-20 years 27 22.3
NIQS 25 20.7 21 years and above 7 5.8
NIESV 4 3.3 Total 121 100
Total 121 100
Table 4.1 shows the respondents’ profile. Out of the 121 valid responses received from the
construction organisations, more than 100respondents (83%) are male while the remaining (7 %)
are female. Over 70% are married. These figures indicate that the majority of the respondents are
male and married. Hence, they are matured enough to address the questions that are put forward.
From the demographic data, at least a quarter (25%) of the respondents have Higher National
Diploma (HND), the percentages for Bachelor of Science (B.Sc.) , Masters Degree (M.Sc.) and
Doctorate degree are in varying proportions. Hence, the respondents are academically sound to
respond to the questionnaire. For professional affiliation, majority of the respondents (43%) have
the Nigerian Institute of Building (NIOB) membership card, while the remaining 57% are shared
among Engineers (23%), Architects (9.92%)., Quantity Surveyors (207%) and others (3.3%) .
At least, 25% belong to the Graduate membership cadre, while over 50% are corporate
members of their various professional bodies, Regarding the years of experience, more than
50% have worked for at least 6years. More than half of the respondents (59%) have major
involvement in the organisation’s development. This implies that a larger percentage of the
firms are matured enough to give insights into their organisational variables. In addition, over
50% of the respondents have high involvement in the management of the organisations.
3.2 Organisational Demographics
Table 4.2 depicts the organisational characteristics. In terms of duration of organisational
existence, most of the firms have been operating for over 5years, thus, they can be said to
possess the managerial resources and capabilities required for continuous existence and
growth. 40 (33%) firms are within the span of 6-10years. This group is taken as young firms
(YF). Another 33.9% is in the class of 11-20years. These are termed the intermediate firms
(IF). The third group which comprises 25firms (20%) is those that have spent over 21years in
existence. These are classified as old firms (OF) Majority of the organisations (72%) have
employee capability that is less than 50; while 27% have above 50 permanent staff. This is
an indication that three-quarter of the organisations surveyed belong to the small and medium
size band with the employees’ capacity of being less than 50. Over 45% of the organisations
undertake both building and civil engineering works. This might be necessitated by
‘survival of the fittest’ syndrome, whereby each firm looks for easiest means of susteinance.

616
For the estimated annual turnover, there are 16.5% with estimated annual turnover of N1M
to N10M, 50% is in the range of N11 to N50M, while 26% spans the N51- N199M band
with the remaining 7% having over N 200M. As regards the type of business undertaken,
Sole proprietorship takes 37%, Partnership, 30%, Public Limited Liability, 3 (9.1%) are
Corporations while 8 (24.2%) and 15 (45.5%) are Sole proprietorship and Private Limited
Liability 29.7%. . This is an indication of each firm being able to take decisions as a single
entity as over 60% are either Sole Proprietorship or Partnership.
On client types, most of the projects undertaken are for private owners. This should not have
been otherwise as most of the respondents are sole proprietors.
Table 4.2: Organisational Demographics Respondents’
background
Frequency Percentage Respondents’
background
Frequency Percentage
Number of
Employees
Business type
Less than 10 35 28.9 Sole proprietorship 45 37.2
11-49 53 43.8 Partnership 37 30.6
Above 50 33 27.3 Private Liability 36 29.7
Total 121 100 Corporation 3 2.5
Firm Age Total 121 100
1-5years 15 12.4 Client type
6-10 years (YF) 40 33.1 Private 39 40.7
11-20 years (IF) 41 33.9 Government 6 5.3
Above 21 years (OF) 25 20.7 Governmentand
Private
46 34.5
Total 121 100 Others 22 19.5
Location 22 19.5 Total 113 40.7
Lagos
Abuja 39 40.7
Total 113 40.7
3.3 Cultural Orientation
A mean score of above 3.00 for all the orientation shows that the level of use is high.
Conflict and Dispute Resolution (CDR) has the highest mean value of 4.18. This is followed
by Client Service Orientation (CSO) with a mean score of 4.03. Overall, the respondents
agreed on the relative importance of all the orientations with the least mean value of 3.5 for
Production Orientation (PRO) as indicated in Table 4.3
Table 4.3: Descriptive Statistics for Level of use of Cultural Orientation
Cultural Orientation Mean
Std.
Deviation Rank
Level
of Use
Conflicts and Disputes Resolution (CDR) 4.18 .63782 1 High use
Client Service Orientation (CSO) 4.03 .54096 2 High use
Task/Goal Accomplishment (TGA) 3.96 .68146 3 High use
External/Environmental Orientation (ENV) 3.83 .70987 4 High use
Innovation, Learning and Knowledge Mgt (ILKM) 3.82 .61289 5 High use
HRM/Workforce Orientation (WKF) 3.77 .71606 6 High use
Information and Communication Technology ICT) 3.72 .83693 7 High use
Production Orientation (PRO) 3.50 .44952 8 High use

617
N=121: 1.00-1.49 For 1(No-use); 1.50-2.49 For 2(low -use); 2.50-3.49 For 3(moderate -use);
3.50-4.49 For 4 (high -use) and 5.50- 5.00 for 5(very high-use)
3.4 Effect of Organisational Characteristics on Cultural Orientation of Construction
Firms
In order to determine the effect of organisational characteristics on the level of use of
cultural orientation among the construction professionals, three organisational characteristics
of firm age, firm size and firm location are selected. This is in accordance with other studies
that have been conducted on culture across industries .This is necessary so that inferences can
be drawn in relation to those previous studies (Noordin & Mohtar , 2014). However, to make
the study more construction-industry specific, business types and client types are added. The
means for the 8 scales of cultural orientation as shown in Table 4.4
Table 4.4: Effect of Organisational Characteristics on Cultural Orientation among
Construction firms. Firm Characteristics and Cultural Orientation
N PRO WKF CSO ILK ICT ENV TGA CDR
Firm Age
1- 5years 15 65.27 47.53 55.47 53.33 60.03 57.90 44.07 54.43
6-10years (YF) 40 49.48 54.71 56.10 52.91 56.08 56.71 59.82 62.26
11-20years (IF) 41 67.82 65.77 61.13 65.02 65.02 64.44 61.82 55.67
>20years (OF) 25 65.70 71.32 64.88 71.94 62.86 64.08 66.22 69.00
Total 121
Chi-Square 6.583 6.472 1.314 5.854 1.423 1.356 3.950 2.910
Df 3 3 3 3 3 3 3 3
Asymp. Sig. 0.086 0.091 0.726 0.119 0.700 0.716 0.267 0.406
Remarks NS NS NS NS NS NS NS NS
Firm Size
Small size 35 62.54 61.41 59.70 59.11 64.14 63.94 54.45 63.78
Medium size 53 66.12 68.71 62.26 65.69 67.82 64.25 67.30 60.71
Large size 33 51.14 48.18 54.65 55.47 46.71 52.67 53.82 56.79
Total 121
Chi-Square 3.834 7.030 .968 1.881 7.835 2.670 4.328 .703
df 2 2 2 2 2 2 2 2
Asymp. Sig. 0.147 0.030 0.616 0.390 0.020 0.263 0.115 0.703
Remarks NS SS NS NS SS NS NS NS
Firm Location
Lagos 85 52.84 55.80 53.41 55.56 54.69 55.21 57.36 57.43
Abuja 36 80.28 73.28 73.36 73.85 75.89 74.68 66.10 67.65
Total 121
Chi-Square 15.587 6.332 8.544 6.921 9.322 8.121 1.628 2.250
df 1 1 1 1 1 1 1 1
Asymp. Sig. 0.000 0.012 0.003 0.009 0.002 0.004 0.202 0.134
Remarks SS SS SS SS SS SS NS NS
Client Type
Private 46 43.50 46.38 42.10 42.80 41.86 42.35 45.90 44.78
Government 6 36.92 43.42 47.33 50.33 51.33 60.33 40.58 54.08
Individual &
Government 39 50.35 45.95 49.33 49.10 50.06 48.10 46.95 46.19
Total 91
Chi-Square 2.192 0.068 1.634 1.384 2.323 2.997 0.306 0.683
df 2 2 2 2 2 2 2 2
Asymp. Sig. 0.334 0.967 0.442 0.501 0.313 0.223 0.858 0.711
Remarks NS NS NS NS NS NS NS NS

618
Business owners
Sole proprietorship 45 64.20 63.21 59.50 57.49 56.93 61.53 58.36 61.59
Partnership 37 67.82 68.43 64.61 70.55 76.95 63.47 63.12 54.89
Private limitedL 32 50.77 49.28 54.85 54.94 49.75 55.83 58.39 65.55
Public limited L 4 33.00 40.25 32.13 29.63 36.75 33.38 24.50 33.25
Corporation 3 75.33 88.83 91.75 102.33 77.67 114.50 109.50 96.17
Total 121
Chi-Square 7.602 8.774 5.762 11.60 14.27 10.78 10.98 7.54
Df 4 4 4 4 4 4 4 4
Asymp. Sig. 0.107 0.067 0.218 0.021 0.006 0.029 0.027 0.11
Remarks NS SS NS SS SS SS SS NS
Table 4.4 depicts the effect of firm age, firm size, firm location, client type and firm business
structure on managers’/CEO on cultural orientation. Firm age has no effect on all the cultural
orientation. Firm size has effect on workforce and ICT at 95% level of confidence and on
production and task and goal accomplishment at 90% level of confidence. Firm location has
effect on all the orientations except on task and goal accomplishment and conflict and dispute
resolution. Client type has no effect. Business ownership has effect on workforce (WKF),
information and communication technology (ICT), innovation, learning and knowledge
management (ILKM) and task and goal accomplishment (TGA) at 95% confidence level
and on production (PRO) and conflict and dispute resolution (CDR) at 90% confidence level
Business ownership has no effect on client service orientation (CSO). Succinctly, firm age
and client type have no effect on cultural orientation of the firms surveyed. This was
confirmed by the Kruskal-Wallis test as indicated in Table 4.4
3.5 Hypothesis 1: There is no significant difference in the level of use of cultural orientation
among constructing firms in Nigeria.
H1 : There is no significant difference in the level of use ofcultural orientation among
constructing firms in Nigeria
Ho : There is a significant difference in the level of use of cultural orientation among
constructing firms in Nigeria
Accept/Reject Criterion
Accept H1 if p-value is greater than 0.05 (p > 0.05), otherwise accept H0
In order to test for a significant effect of firm age, firm size, firm location, client type and
business ownership structure on Cultural orientation among Constructing Firms, analysis of
variance, (ANOVA) was conducted to examine the significant effect of firm age, firm size,
location, client type and business ownership structure as depicted on Table 3.6 and 3.7
respectively.
Table 4.6: Effect of Firm Size, Age, Location, Client type and Business ownership structure
on Cultural Orientation among Construction Managers/CEOs
Sumof
Squares df
Mean
Square F Sig.
Remark
Firm Age Between Groups 40.673 3 13.558 .875 .456 Accept H1
Within Groups 1734.956 112 15.491
Total 1775.629 115
Firm Size Between Groups 90.603 2 45.302 3.038 .052 Reject H1
Within Groups 1685.026 113 14.912
Total 1775.629 115

619
Location Between Groups 148.048 1 148.048 10.370 .002 Reject H1
Within Groups 1627.581 114 14.277
Total 1775.629 115
Client Type Between Groups 2.501 3 .834 1.237 .300 Accept H1
Within Groups 73.484 109 .674
Total 75.984 112
Business Owen Between Groups 137.156 4 34.289 2.323 .061 Reject H1
Within Groups 1638.473 111 14.761
Total 1775.629 115
“A one-way between subjects ANOVA was conducted to test the effect of firm age, firm size
, location , client type and business ownership structure on Cultural Orientation among
Construction Managers/CEOs . Firm size, location and business-ownership structure are
significant. In terms of age, no significant difference was found among young, intermediate
and old firms for cultural orientation. This finding is in not in agreement with Organisational
life cycle theories in which it is proposed that more hierarchical and bureaucratic
organisations evolve as firms grow and age (Greiner, 1988). The effect of firm size is
supported by this study. This effect, however, is only partially significant. On location, the
results is in line with the literatures that location has a significant effect on culture. For
client type, no significant effect could be established. A significant effect of ownership
structure was evident on cultural orientation. This in support of leadership as a direction to
culture. This result implies that firm size, firm location and ownership structure have
significant effect on the use of a particular culture among the construction firms in the study
area. In summary, the null hypothesis, that there is no significant effect of organisational
characteristics on the use of cultural orientation among constructing firms is thus rejected.
4. DISCUSSION OF FINDINGS, SUMMARY AND CONCLUSION
Organisational culture is regarded as a driver of performance in a number of industries. This
paper investigated the level of use of cultural orientation of construction managers and the
effect of organisational characteristics on the orientation. The study reveals conflict and
dispute resolution and client service orientation as the cultural orientation with the highest
priority among the construction firms in the study area. Conflict and dispute orientation is
important in order to prevent any form of disruption to work processes. The significance of
the clients is stressed as construction organisations are challenged to meet clients’ need
(Sexton & Barret, 2003). Despite the number of researches that agreed on firm age and firm
size as determinants of culture, this study found that the age of the construction firms
surveyed did not have a significant effect on the orientation of the managers. This paper
shows that the orientation developed do not actually change as the firm becomes older. Firm
size has significant effect on workforce and ICT and moderate effect on production and task
and goal accomplishment. This implies that the workforce orientation, information and
communication technology, production and task/goal accomplishment alter as the firm size
chages. Firm location has effect on all the orientations except on task and goal
accomplishment and conflict and dispute resolution. This is reasonable, as the production
process must be planned and adhered to irrespective of the location of the project. Likewise,
dispute has to be minimsed for project objectives to be achieved. The characteristics of the
client do not affect the orientation of the managers. Business ownership has effect on
workforce (WKF), information and communication technology (ICT), innovation, learning
and knowledge management (ILKM), task and goal accomplishment (TGA), production
(PRO) and conflict and dispute resolution (CDR), except on client service orientation

620
(CSO). This result is in support of Cunha and Cooper (2002), Oluwatayo and Amole (2012)
that ownership influences the culture of organisations. Lack of a significant effect of
ownership on client service orientation reiterates that the quality of services rendered to the
client must not be watered down.
5. RECOMMENDATIONS
Construction managers need to develop the right orientation, improve on it and be conversant
with how it changes with project and organisational characteristics. This is needed to enhance
optimal production process.
6. REFERENCES
Abiola‐Falemu, J.O., Ogunsemi, D.R. & Oyediran, O.S. (2010), Assessment of Organisational Culture and
Innovation Practices of Construction Companies in Southwest Nigeria’, In CIB Task Group and Working
Commission, P. Barret et al., (ed) TG59 & W112-Special Track 18th CIB World Building Congress,
May 2010, Salford, United Kingdom, 218-33.
Abiola-Falemu, J.O. (2013) Organisational Culture, Job Satisfaction and Commitment of Lagos- based
Construction Workers, Journal of Business and Management, 13 (6), 108-120
Ang, Y.K. & Ofori, G. (2001). Chinese Culture and Successful Implementation of Partnering in Singapore’s
Construction Industry. Construction Management and Economics, 19. 619-632.
http://www.tandf.co.uk/journals. Accessed March, 2014.
Ankrah, N.A. (2007). An investigation into the impact of culture on construction project performance. A PhD
thesis submitted in partial fulfillment of the requirements of the University of Wolverhampton, UK
for the degree of Doctor of Philosophy
Bello, W.A., Soyingbe, A. A. & Akinwamide (2012). An assessment of the Implementation of
Quality Culture in Construction RICS COBRA, September, Las Vegas, Nevada USA.
Bodley, J. H. (2001) Anthropology and Contemporary Human Problems, Mayfield, Mountain View, CA
Cameron, K. S. & Quinn, R. E. (1999). Diagnosing and changing organizational culture. The Jossey-Bass
Business & Management Series.
Chandrasekar, K. (2011). Workplace Environment and Its Impact On Organisational Performance In Public
Sector Organisations International Journal of Enterprise Computing and Business Systems, 1(1), available
on line: http://www.ijecbs.com
Coffey, V. (2010). Understanding Organisational Culture in the Construction Industry. Spon
Press/Taylor & Francis, Abingdon, Oxon
Coffey, V., Willar, D, Trigunarsyah & Bambang (2011). Profiles of organizational
Culture in Indonesian construction companies. In: Sai ON Cheung (ED.). Proceedings of the Sixth International
Structural Engineering and Construction Conference (ISEC-6), ETH Zurich, Zurich.
Cunha, R. C. & Cooper, C. L. (2002). ‘Does privatization affect corporate culture and employee
wellbeing?" Journal of Managerial Psychology, 17 (1): 21-49.
Damanpour, F., 1991. Organizational innovation: a meta-analysis of effects of determinants
and moderators. Academy of Management Journal 34 (3) 555–590.
Dauber, D., Fink, G & Yolle, M (2012). A configuration model of organizational culture.
Assessed: May 17th from
http://sgo.sagepub/com/content/early/2012/03/21/2158244012441482.full-text.pdf.html.
DOI: 10.1177/2158244012441482
Deal, T. E., & Kennedy, A. A. (1982). Corporate Cultures: The Rites and Rituals of Corporate Life. Reading,
MA: Addison-Wesley.
Denison, D. R. & Mishra, A. K. (1995). Toward a theory of organizational culture and effectiveness.
Organization Science, 6(2) (3): 204.
Deshpande, R. & Farley, J.U. (2004) Organizational culture, market orientation, innovativeness, and
firm performance: an international research odyssey. International Journal of Research in Marketing,
21(3).
Detert, J. R., Schroeder, R. G. & Mauriel, J. J. ( 2000). A Framework for Linking Culture and Improvement
Initiatives in Organizations. Academy of Management Review, 25 (4): 850-863.

621
Enshassi, A., Mohamed, S. & Abushaban, S. (2009). Factors affecting the performance of construction projects
in the Gaza Strip. Journal of Civil Engineering and Management, 15(3): 269–280, ISSN 1392–3730 print /
ISSN 1822–3605. Available online: http:/www.jcem.vgtu.lt .DOI: 10.3846/1392-3730.2009.15.269-280
Fey, C. F., & Denison, D. R. (2010). Organizational Culture and Effectiveness: Can American. Theory Be
Applied in Russia? Accessed from Yahoo Search Engine at
http://www.denisonconsulting.com/Libraries/Resources/Fey-2003-American-Theory-
Russia.sflb.ashx
Gajendran, T, Brewer, G., Dainty, A. and Runeson, G. (2012) ‘A conceptual approach to
studying the organizational culture of construction projects’, Australasian Journal of Construction Economics
and Building, 12(2) 1-26
Giritli, H. & Civan, I., (2008). Personality study of construction professionals in the
Turkish construction industry. Journal of Construction Engineering and Management, 134 (8), 630–634
Greiner, L. E. (1998). Evolution and Revolution as Organizations Grow. Harvard Business Review,
May- June
Hampden-Turner, C. (1990) Creating Corporate Culture: From Discord to Harmony, Massachusetts-USA,
Addison-Wesley Publishing Company. from : righbaca.ru/qakiqeq.pdf,
shodhganga.inflibnet.ac.in/bitstream/10603/33366/17/17_bibliography.pdf.
Handy, C. (1993) Understanding Organizations, London-UK, Penguin Books Ltd, 4th Edition.
Handy, C.B. (1993). Understanding Organisation, Oxford University Press, New York
Handy, C. (1993) Understanding Organizations, London-UK, Penguin Books Ltd, 4th Edition.
Hatch, M. J. (1997) Organization theory. Modern, symbolic, and postmodern perspectives, 63– 100.
New York: Oxford University Press.
Hofstede, G. (2001). Cultures Consequences: Comparing Values, Behaviors, Institutions, and
Organizations, Across Nations. (2nd edition). Sage Publications, London.
Hofstede, G. (2011). Dimensionalising culture: The Hofstede model in context. Online reading in psychology
and culture, 2(1). Accessed at http://dx.doi.org/10.9707/2307-0919.1014.
Janićijević, N (2012).The Influence of Organizational Culture on Organizational Preferences towards the
Choice of Organizational Change Strategy. Economic Annals, LVII (193), 25. UDC: 3.33
ISSN: 0013-3264.Economic Annals, LVIII (198). UDC: 3.33 ISSN: 0013- 3264
Janićijević, D. (2013) . The mutual impact of organizational culture and structure. DOI:10.2298/EKA1398035J
Johnson, G & Scholes, K. (1999). Exploring Corporate Strategy. (5th ed). Prentice Hall.
Kagioglou, M., Cooper, R. & Aouad, G. (2001). Performance management in construction: A conceptual
framework. Construction Management and Economics, 19(1), 85–95.
Kaiser, R.B., Hogan, R. and Craig, S.B. (2008). Leadership and the fate of organizations. American
Psychologist, 63(2): 96–110 Journal of Construction in Developing Countries, 17(2) 1–21,
Koota, J. (2003), Market review and study of success characteristics in construction companies- Case:
United States, VTT Tiedolteita Research Notes 2195, ESPOO .
Lader, P. Lai, M.F. & Lee, G.G. (2007). Relationships of organizational culture toward knowledge
activities. Business Process Management Journal 13:2, 306–322.
Lemon, M & Sahota, P. S (2004). Organizational culture as a knowledge repository for increased innovative
capacity. Technovation, 24. 483-498.
Locke, E.A. & Latham, G.P. (2002). Building A Practically Useful Theory of Goal Setting and Task
Motivation: A 35 Year Odysse. American Psychologist, 57, 705-717
Lund, D.B. )2003 ,( Organisational culture and job satisfaction , Journal of Business & Industrial
Marketing, 18(3), 219-236.
Mariappanadar, S. (2005) “An Emic Approach to Understand Culturally Indigenous and Alien Human
Resource Management Practices in Global Companies”, Research and Practice in Human
Resource Management, .13( 2), 31-48.
Martin, J. (2002). Organizational Culture Mapping the Terrain. Sage Publications, Beverly Hills, CA.
Muller, R & Turner, R (2007). The Influence of Project Managers on Project Success Criteria and
Project Success by Type of Project. European Management Journal, 25 (4), 298– 309.
Nongo, E.S. & Ikyanyon, D. N. (2012). Influence of Corporate Culture On Employee Commitment to The
Organisation. International Journal of Business and Management, 7(22), 21-29.
http://dx.doi.org/10.5539/ijbm.v7n22p21
Noordin, F., Omar, S,, Sehan, S, & Idrus, S. (2010) . Organizational Climate and Its Influence On
Organizational Commitment, International Business & Economics Research Journal, 9(2)
Noordin , M. A. & Mohtar, S. (2014). Age: Does it Matter for Firms to Perform? International
Journal of Academic Research in Business and Social Sciences, 4(3),ISSN: 222
6990, 252-260
622
Noor , A. A. , Wan, I. A. , Shaladdin, M. & Aziz, A.( 2013).Operationalisation of Safety Culture to
Foster Safety and Health in the Malaysian Manufacturing Industries,Asian Social Science , 9 (7)
DOI: 10.5539/ass.v9n7p283.ISSN 1911-2017 E-ISSN 1911- 2025, 283-289.
https://www.researchgate.net/publication/289155585
Novana, M. & Ogunlana, S.O. (2004). Organizational Culture Profile of Construction Companies In
Thailand , Accessed on line from http://www.irbnet.de/daten/iconda/CIB4475.pdf and
http://www.civil.hku.hk/cicid/3_events/34/34_PowerPoint.pdf December, 2015.
O’Reilly, C. A. , Chatman, J. &. Caldwell, D.F. (1991) “People and organizational culture: a
profile comparison approach to assessing person-organization fit”. Academy of Management
Journal, 34(3), 487–516.
Obinna, A. K. & Farkas, M. F. (2011) “Cultural Conflict Management program for Firms and
Organizations”, International Journal of Business and Management Studies, 3(2),.
Ouchi, W.G. (1980). Market Bureaucracies and Class. Administrative Science Quaterly. 25(1)129- 141
Ofori, G. (2001). Challenges of Construction Industries in Developing Countries: Lessons from various
Countries. Assessed from www//http//-on January 7th, 2012.
Oluwatayo, A.A. & Amole, D (2012). Culture of Architectural Firms in Nigeria: An Exploratory Study.
Journal of Construction in Developing Countries, 17(2) 2012, 1–21.
O’Reilly, C. (1989). Corporations, Culture and Commitment: motivation and social control in
organizations. California Management Review, Summer.
Ouchi, W. G. (1981). Theory Z. Reading, MA: Addison-Wesley.
Peter, T. J., & R. H. Waterman. (1982) In Research of Excellence: Lessons from America‘s best- run
Companies. New York: Harper and Row,.
Paseale, R. T., & Athos, A. G. (1981). The art of Japanese management. New York: Simon & Schuster.
Peters, T. J., & Waterman, R. H., Jr. (1982). In search of excellence. New York: Harper & Row.
Quinn, R. E. & K. Cameron (1983) .Organizational life cycles and shifting criteria of effectiveness:
some
preliminary evidence. Management Science 29, 1, 33–51.
Quinn, R. E. & J. Rohrbaugh (1983) “A spatial model of effectiveness criteria: towards a competing values
approach to organizational analysis”. Management Science, 29 (3), 363–377
Rose, S., Spinks, N. & Canhoto, A.I. (2015). Management Research: Applying the Principles Formuulae
for
sample Size. Accessed on line.
Rose, R.C, Kumar, N. & Abdullah, H.(2008).Organizational Culture as a Root of Performance
Improvement: Research and Recommendations.Contemporary Management Research, 4 (1),43-
56,
Sathe, V. (1985), Culture and Related Corporate Realities. Homewood, IL: Irwin.
Schein, E. H. (1985). Organizational Culture and Leadership. San Francisco, CA: Jossey-Bass.
Schein, E. H. (1986). What you need to know about organizational culture. Training and Development
Journal, 40, 30-3.
Schein, E. H. (2004) Organizational culture and leadership. 3rd ed. San Francisco: Jossey-Bass a Wiley
Imprint.
Sexton, M.G. & Barrett, P.S. (2003). Appropriate innovation in small construction firms, Construction
Management and Economics, 21, 623–633.
Sexton, M.G. & Barrett, P.S (2004). The role of technology transfer in innovation within small construction
firms, Engineering, Construction and Architectural Management, 11(5), 342- 348.
Tabassi, A. A & Abu Bakar, A. H. (2009). Training, motivation, and performance: The case of Human
resource management in construction projects in Mashhad, Iran. International Journal
of Project Management, 27, 471–480
Tran, Q. & Tian, Y. (2013). Organizational Structure: Influencing Factors and Impact on a Firm . American
Journal of Industrial and Business Management, 3, 229-236
http://dx.doi.org/10.4236/ajibm.2013.32028 Tsui, A.S., Zhamg, Z.X., Wang, H., Xin, K.R., & Wu,
J.B.9 (2006). Unpacking therelationship between CEO leadership and organizational behaviour.
The Leadership Quarterly 17, 113-137.
Wiewiora, A., Trigunarsyah B., Murphy, G. & Coffey, V (2013). Organizational culture and
willingness to share knowledge: A competing values perspective in Australian context. International
Journal of Project Management xx (2013) xxx–xxx
Wilderom, C.P.M., van den Berg, P, T. & Wiersma, U.C. (2012). A longitudinal study of the effects of
charismatic leadership and organisational culture on objective and perceived corporate performance.
.The Leadership Quarterly, 23 (2012) 835–848

623
Yilmaz, C. & Ergun, E. (2008). Organizational culture and firm effectiveness: An examination of relative
effects of culture traits and the balanced culture hypothesis in an emerging
economy. Journal of World Business 43, 290-306.
Yusof, M.N. & Abu Bakar, A.H. (2012). Knowledge Management and Growth performance in construction
companies: a framework. Procedia – Social and Behavioral Sciences , 62, 128-134. doi:
10.1016/j.sbspro.2012.09.022School of Housing, Building
Zahidy, A., Noor, A. A., & Shahryar, S. (2015). Predictors for the Success and Survival of Entrepreneurs
in the Construction Industry. International Journal of Engineering Business Management, Received .DOI:
10.5772/60530, pp 1-11

624
ID 115
TOWARDS A STAKEHOLDER RELATIONSHIP MANAGEMENT
MODEL FOR CONSTRUCTION SMES IN BOTSWANA: AN
EXPLORATORY STUDY
M. Taimu, A. Ngowi and B. Awuzie
Central University of Technology, South Africa
Email: [email protected]
Abstract: The potential of Small Medium Enterprises (SMEs) to contribute to economic
growth has been elucidated in extant literature. Accordingly, successive governments have
sought to extend patronage to SMEs in various sectors to enable them to perform optimally
and contribute to economic growth. However, such patronage notwithstanding, longevity, low
value creation and profitability issues have continued to beleaguer these SMEs, hence
rendering them incapable of achieving the expected goals. Construction SMEs appear not to
fare better in this context as most of them have been unable to record significant growth,
especially in developing countries like Botswana. The inability of these SMEs to effectively
manage their relationships with other stakeholders in the industry has been cited as one of the
reasons for their poor performance. The aim of this qualitative study was to explore the
relevance of stakeholder relationship management (SRM) models for construction SMEs in
Botswana and to identify the key elements of such models. Data was obtained through a
juxtaposition of semi-structured interviews from SME project managers and review of relevant
documents. Interviewees were purposively selected and data was analysed using thematic
analysis. The results revealed that there is no theoretical and conceptual model relying on
Stakeholder Management (SM) and Customer Relationship Management (CRM).
Keywords: Botswana, Construction industry, Customer Relationship Management, SMEs,
Stakeholder Management.
1. INTRODUCTION
An SMEs competitive advantage essentially depends on stakeholder management with
particular focus on the Customer Relationship Management (CRM). The absence of a
structured approach for the management of project stakeholders by SME project managers
within the construction industry has posed a significant challenge to the attainment of project
success. This particularly so when the prevalence of SMEs within the industry is considered.
Therefore, it is expected that the study’s findings will contribute towards the amelioration of
this imbroglio by putting forward a proposed model for the attainment of successful
stakeholder management by SME project managers. The potential of Small to Medium
Enterprises (SMEs) to contribute to economic growth has been explicated in extant literature.
SMEs contribute to social, economic and industrial development given that they are
entrepreneurial outlets (Ssegawa-kaggwa, 2008). SMEs are also a vehicle towards creation of
competition and employment thus fostering economic growth and synergy with large
enterprises. Kirchoff (1991) affirms that economic growth is dominated by SMEs which are
characterized by innovative and high growth rates. Furthermore, OECD (2010) affirms global
trends towards the knowledge economy, open innovation, global connections and non-
technological innovation and the emergence of national and regional economic models and
new types of social innovation that have increased the importance of SMEs. According to
Ssegawa (1999) about 60.7% of the companies in the construction industry in Botswana are

625
small companies. While the construction industry in Botswana has been commended for
developing the infrastructural landscape of the country, recent reports indicate a sub-optimal
project delivery process (Ssegawa-Kaggwa et al. 2013). Ssegawa-Kaggwa et al. (2013)
further add that the attributes of cost, time and quality are often vague. Moreover,
construction projects in Botswana are riddled with cost and time overruns (Ssegawa-Kaggwa
et al., 2013). Generally, the industry is replete with abandoned and incomplete, delayed and
structurally defective construction projects which has led to unsatisfied clients
(Adekunle,Ajibola 2015). Effective practices in the management of construction project
stakeholders are indispensable to the success of projects. Concerns among stakeholders in
the supply and demand side of project delivery chain have led researchers like Rwelamila et
al., (1999); Ssegawa-Kaggwa et al., (2013); Palalani,(2000); Ssegawa, (2013) to investigate
root causes of poor delivery of public construction projects in Botswana. The deficiencies in
the construction industry in Botswana have been attributed to several factors; however,
inadequacy of human resources, lack of project management best practices and inability to
pay suppliers on time were cited as the leading causes of project delays (Ssegawa-Kaggwa et
al. 2013). In order for reformation to take place in the construction industry there is a need to
understand the flaws in the current project management theories and practices in place
regarding the management and engagement of project stakeholders.
Yang et al. (2009) report that a stakeholder management model in the construction industry
has not yet been fully developed. While scholars such as Littau et al. (2010), Rajablu (2014)
have further developed stakeholder management mechanisms, these models are in their
infancy stages and their efficacy is yet to be explored. A clear understanding of the project
stakeholder management process in SMEs projects in the construction industry is a
prerequisite to the development of a practicable mechanism for the successful management of
project stakeholders and higher success rate in project delivery in the construction industry.
This study thus seeks to understudy the SME aspect of the construction industry and to
elucidate the idiosyncrasies associated with relationship management skills of SME project
managers and how they play out within the wider stakeholder network. This is imperative
given that SMEs constitute a significant proportion of the entire construction sector.This
model would contribute to the reduction in the degree of project failures and abandonment
resulting from poor stakeholder management by SMEs within the construction domain.
2. CONCEPTUAL FRAMEWORK
The construction industry in Botswana has both internal stakeholders (Management,
employees) and external stakeholders (suppliers, competitors, financers, government). While
each of these different stakeholders have different interests, they intermingle throughout the
project life cycle to ensure project success. SMEs in Botswana work in alignment to the
homogeneous forces in the construction industry in general, thereby limiting them to
structure, strategies and practices in both Stakeholder Management (SM) and Customer
Relationship Management (CRM).
The institutional theory will be used as a framework to analyse Stakeholder Management
(SM) and Customer Relationship Management (CRM). Institutions lead to regularized or
homogeneous behaviour within a group, but institutions can often underline differences
across nations, as well as industries, firms, and individuals (Meyer, 2007). Scholarly work on
institutional persistence for example, Zucker (1977) indicates that participants then become

626
used to working in alignment with these institutional forces present in their home
environments and begin to take them for granted (Meyer, 2007). This then leads to the
development of internalized institutionalized practices that are difficult to change. The
external institutional environment in which organisations are embedded plays a critical role in
shaping organisational structures and practices (Ju & Rowlinson, 2013). Such structures and
practices include SRM and CRM in the construction industry. The line of research for
institutional theory was initiated by the introduction of the concept of institutional
entrepreneurship and has attracted a great deal of attention in recent years. Organizational
researchers are particularly attracted to the concept because of their Institutional Theory
interest in power and agency – the ability of organizations to strategically alter the
institutional context could undoubtedly be a source of power and superiority for organizations
(Lawrence, 2008).
This perspective suggest that practices and strategies for CRM and SRM in SMEs become
accustomed to the environment that the SMEs is operating in and these are inevitable. From
conception of the project to completion this behavior will be homogenous. Of significance
among the plethora of obstacles may be the lack of structured approach to the management of
external and internal stakeholders by these SMEs. Hence, this exploratory study seeks to
explore the possibility towards a stakeholder management model for SMEs in the
construction industry in Botswana. Exploring the current strategies and practices of CRM and
SRM will give some light to what is the norm in the industry. Based on this the project
managers in the construction industry may reflect on their policies and strategies and take
steps to ameliorate these practices. The research community may also look at the study and
further theorize strategies and practices of SRM and CRM.
3. LITERATURE REVIEW
3.1 Definition of SMEs in the Construction Industry of Botswana
In SMEs the importance of the owners and founders form the heart of the business. They play
an important role in stakeholder management as well as customer relationship management.
Continuity of the business will not be a guarantee if there are no strategies to ensure that the
business will survive after their exit. For purposes of this study the employment levels will be
used to classify the size of the SME. The SME that will be used will include the main
contractor and subcontractor in the built environment. The table below shows Botswana SME
thresholds
Table 1: Botswana SMEs thresholds
Source: Expert Group Meeting (2010)
Item Size category Employment
levels
Annual turnover
in Botswana Pula
In US$ dollar
(equivalent)
1 Micro-enterprise Less than 6
workers
Less than P60,000 US$ 10,000
2 Small enterprise Less than 25
workers
Between P60,000
and P1,500,000
Between US$
10,000 and
US$250,000
3 Medium enterprise Less than 100
workers
Between 1,500,000
and P5,000,000
Between US$
250,000 and US$
833,333.33

627
3.2 Stakeholder Management in the Construction SMEs
Buchholtz and Carroll (2008) define a stakeholder as an individual or a group that has one or
more of the various kinds of stakes in the organization while Freeman (1984) defined
stakeholders as the “ones who can affect or who is affected by the achievement of the firm’s
objectives. Stakeholders may be affected by the actions, decisions, policies, or practices of
the business firm, these stakeholders may also affect the organization in the same way
(Buchholtz and Carroll 2008). In support of the management of project stakeholders, Gareis
(2005) says that the ideal project oriented company has a specific management culture
expressed in the empowerment of employees, process orientation and teamwork, continuous
and discontinuous organizational change, customer orientation, and networking with clients
and suppliers. The project stakeholders all play a vital role throughout the whole process of
the projects and their management contributes to the success or failure of the project.
Chinyio and Olomolaiye (2010) point out that, in most construction projects, there will be
many stakeholders and their presence in itself is a potential conflict of interests. There is a
need to manage this diversity proactively to forestall conflicts and even disputes (Chinyio and
Olomolaiye, 2010).
(Karlsen, 2002) identifies the following as stakeholders; Financial institutions, End Users,
Competitors, Suppliers/ Contractors, controlling organisations, consultants/ advisers, third
parties, Labour Unions, insurance companies, line organization, public authorities,
press/media, clients/ customers. In Botswana, the construction industry consists of several
fragmented players who can be grouped into the four categories; suppliers i.e., those who
provide services or supply materials and components to a project; clients (public and
private); regulators (who regulate the project management process and the conduct of
suppliers); and facilitators (those who facilitate the delivery of projects in various ways, but
without having any contractual obligations on any aspect of the project) (Ssegawa-Kaggwa et
al , 2013). Stakeholder management is about creating the most positive environment in which
to develop a project (Vogwell, 2002). Successful project management is influenced by
stakeholders and their capacity to impact the project outcome (Bourne & Walker 2006). In
addition, Karlsen (2002) asserts that there is need to make more efforts towards developing
new insights in project stakeholder management as there is a lack of formal and systematic
project stakeholder management in most projects. Cleland, (1999) and Yang et al., (2009)
further emphasize that in order to achieve project objectives, it is necessary to develop an
effective framework to identify, clarify, manage, accommodate, and represent the often
competing interests of stakeholders. Yang et al. (2009) additionally points out the need to
develop a practical framework for managing Project Stakeholders in the construction
industry. This framework can be further used to highlight the critical success factors in the
management of the stakeholders who according to Verbeke & Tung (2013) forge enduring
and ongoing ties of strategic importance with the firm that can contribute to its competitive
advantage in the long term. These ties of strategic importance highlight the concept of
Customer Relationship Management in the success of project stakeholder management.
3.3 Customer Relationship Management
The concept of Customer Relationship Management (CRM) is defined by Mohamad et al
(2007) as a managerial strategy that helps firms to manage all information related to their
customers through the utilization of information technology tools and techniques with the

628
purpose of satisfying customer needs as well as to create a long term and communally
beneficial relationship. This implies that the definitive goal of CRM can be viewed as a
means to help SMEs turn into customer-centric organizations that conduct business processes
with the focus being on customers’ satisfaction. The antecedents of CRM are encompassed
in the following concepts; technological CRM Resources, relationship marketing, knowledge
management, key customer focus and organizational performance which enhance
organizational performance (Mohamad et al 2007). CRM is also defined by Baran et al.
(n.d.) as a process that capitalizes on customer value through on-going marketing activity
instituted on intimate customer knowledge established through collection, management and
leverage of customer information and contact history. In addition, CRM is about perfecting
relationships to maximize a customer’s value over time (Baran et al. n.d.). CRM can thus be
viewed as a very effective growth strategy that can yield significant benefits and changing
both organizations and industries into customer focused entities (Sharp, 2003). According to
Sharp (2003) CRM has twelve core strategies that have been proven to resolve many issues
in a logical and efficient manner. These proven strategies are tremendously insightful and
can be applied by SMEs in the construction industry that are often faced with dissatisfied
customers due to cost over runs, delays or substandard quality of the projects delivered.
While some mishaps are beyond the control of construction Project managers, their impact on
the project success can be minimised with effective customer relations management skills.
Table 2 highlights these twelve core strategies for CRM.
Table 2: Twelve core strategies for CRM
Source: Sharp (2003)
Strategies
1 Develop a clear and consistent set of business objectives
2 Prepare a detailed Plan of Action
3 Build the system in stages, beginning with the most crucial area for meeting the first
objectives
4 Provide strong leadership and mobilize the organization
5 Implement and follow through on a change in the corporate culture
6 Enlist a senior management member to support the project
7 Create an integrated business design
8 Establish a customer-driven product and service development process
9 Learn through action to jump-start development of organizational capabilities
10 Generate early wins and create a self-funding process
11 Focus on activities that create economic value
12 Establish a two-way flow of communications with customers
Effective CRM and SM can be regarded as a plausible solution to the low success rates in the
execution and management of construction project. Bourne (2009) points out that success is
bound up in how well the organisation conducts its activities, be it strategically, operational
or tactical, to meet their project requirements. ‘Success is measured in part by reports of
financial compliance, and in part by other less tangible aspects such as meeting expectations
of its stakeholders such as the public, government, shareholders, customers, employees and
lobby groups or voters’ (Bourne 2009:11). Given that project success is positively correlated
with meeting stakeholders’ expectations; there is a need to firstly understand who the
stakeholders are in any given project and subsequently determine each of their expectations
with the intention of managing these expectations throughout the life of the project.
Managing these expectations entails constant communication with the stakeholders, a process

629
which requires stakeholder relationship management skills. This paper thus explores the best
strategies and mechanism that can be implemented by SME project managers to effectively
achieve stakeholder management with the desired results yielding project success in the
construction industry.
3.4 Nature of Stakeholder Management and CRM in the Construction industry in
Botswana
Ssegawa (1999) states that one of the reasons behind Botswana’s inadequate capacity is the
ineffective structure and organization of the construction industry characterized by
constraints such as unavailability, insufficient or inappropriate use of resources, functions and
institutions (Khairuddin et al., 1998 and BOCCIM 1992). Ssegawa (1999) looks at some of
the Vision’s targets (the Botswana vision 2016) and reviews the current state of the economy
in relation with the identified target. The extraordinary importance of stakeholders in projects
has been clearly articulated in the field of project management by several authors such as
Beringer et al. (2013); Cleland (1986); Freeman (1984); Littau et al. (2010), Savage et al.
(1991) as cited by Missonier & Loufrani (2013). Additionally, Bourne and Walker (2006)
allude that successful project management is influenced by stakeholders and their capacity to
impact the project outcome. Lim & Yang (2008) points out that different stakeholders have
different levels and types of investment and interest in construction projects and can be seen
as multiple clients or customers for the project in which they are involved. Failing to
acknowledge such dynamism, especially in an infrastructure project that involves various
parties with vested interest would potentially jeopardize the project objectives and its smooth
implementation (Lim & Yang 2008). Successful completion of construction projects is
therefore dependent on meeting the expectation of stakeholders (Lim & Yang 2008).
3.5 Project Life Cycle
According to Malkat & Byung-GYOO (n.d.), construction stakeholders can be classified in
different ways namely primary and secondary stakeholders. It is highly critical to ensure that
the objectives set by the contractor meet the stakeholders’ expectation. Furthermore, ‘the
extent to which the project objectives and the stakeholders’ aims are aligned creates possible
uncertainties, such as schedule deviation and conflicting stakeholders interests that project
managers need not to underestimate.’ (Malkat & Byung-Gyoo n.d.:79). Figure 1 illustrates
the different stakeholders involved in any given construction project within the lenses of the
different phases of the Project Life Cycle.

630
Figure 1: Project Life Cycle in Construction (Malkat & Byung-GYOO n.d.)
The involvement of the client in the three stages of the Project Life Cycle can be observed in
Figure 1. The level of involvement of the client throughout the entire project life cycle
illuminates the importance of Customer Relationship Management as a crucial technique in
ensuring that the project objectives are well aligned with the customers (stakeholders’) aims.
This fusion of Customer Relationship Management and Stakeholder Management can be
effectively incorporated to develop a Stakeholder Relationship Management Model for use
by SME Project Managers.
4. METHODOLOGY
In order to address the gaps in literature, the study used qualitative data collection techniques
to acquire emerging themes in view of the current practices in the construction industry by
SME Project Managers. Specifically, 6 in-depth interviews were conducted with the aide of
an interview guide which was designed within the scope of the aim of the study. The target
for the interviews were expert project managers with a minimum of 10 years as these were
considered to possess a wealth of knowledge about the industry in general and about project
management in the construction industry. Specifically, main contractors and sub-contractors
were interviewed. The qualitative approach was selected as the most suitable as it would
allow a high level of data extraction from the respondents. From the qualitative data obtained
concepts were derived using the deductive category development approach in thematic
analysis. The findings of the study provide insights on the current practices in use by project
managers as well as shed some light on the challenges and gaps in terms of capacity of the
Project managers in managing Stakeholders in every project.
5. RESULTS
The study targeted 6 Project managers with at least 10 years’ experience in the construction
industry. They were asked about the construction industry in general and their current
practices regarding project execution.
5.1 Market Situational analysis
The study sought to obtain the views of the project managers regarding the industry in
general and to assess whether there existed any stakeholder relationship management models
PROJECT LIFE CYCLE
Pre-
construction
Construction Operations
Client
Consultant
Authority
Contractor
Supply
chain
Client
Consultan
Client
End user
Authorit
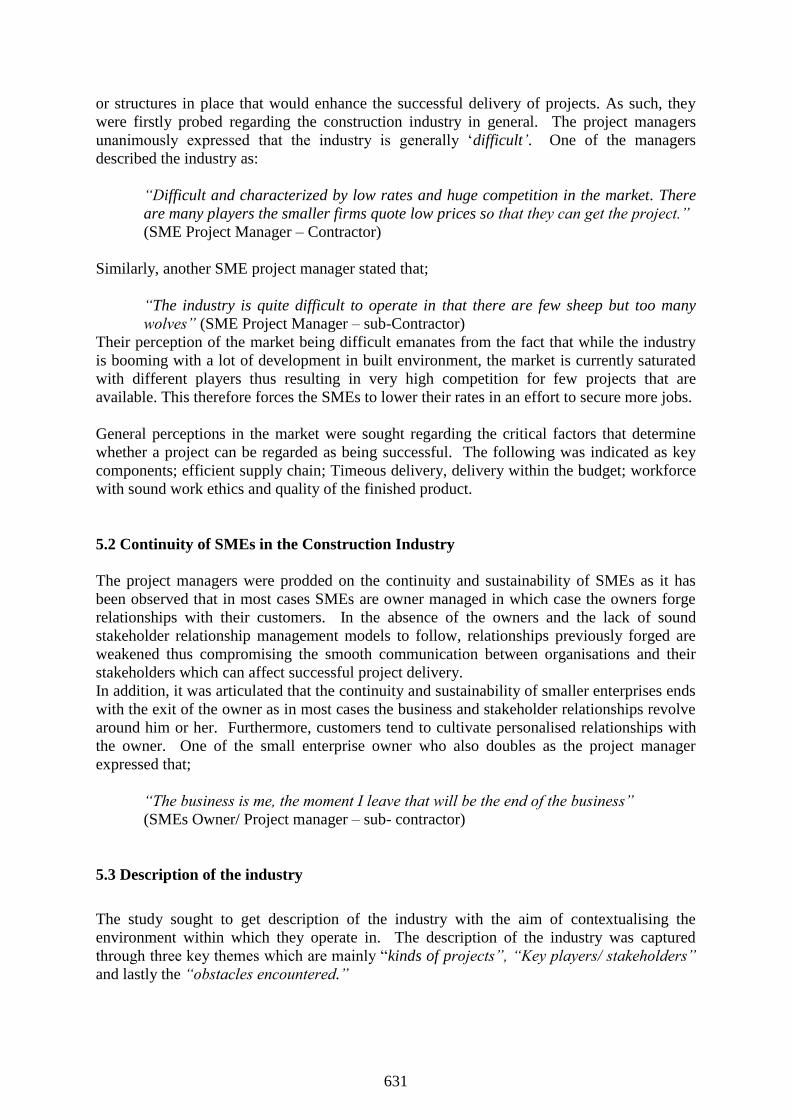
631
or structures in place that would enhance the successful delivery of projects. As such, they
were firstly probed regarding the construction industry in general. The project managers
unanimously expressed that the industry is generally ‘difficult’. One of the managers
described the industry as:
“Difficult and characterized by low rates and huge competition in the market. There
are many players the smaller firms quote low prices so that they can get the project.”
(SME Project Manager – Contractor)
Similarly, another SME project manager stated that;
“The industry is quite difficult to operate in that there are few sheep but too many
wolves” (SME Project Manager – sub-Contractor)
Their perception of the market being difficult emanates from the fact that while the industry
is booming with a lot of development in built environment, the market is currently saturated
with different players thus resulting in very high competition for few projects that are
available. This therefore forces the SMEs to lower their rates in an effort to secure more jobs.
General perceptions in the market were sought regarding the critical factors that determine
whether a project can be regarded as being successful. The following was indicated as key
components; efficient supply chain; Timeous delivery, delivery within the budget; workforce
with sound work ethics and quality of the finished product.
5.2 Continuity of SMEs in the Construction Industry
The project managers were prodded on the continuity and sustainability of SMEs as it has
been observed that in most cases SMEs are owner managed in which case the owners forge
relationships with their customers. In the absence of the owners and the lack of sound
stakeholder relationship management models to follow, relationships previously forged are
weakened thus compromising the smooth communication between organisations and their
stakeholders which can affect successful project delivery.
In addition, it was articulated that the continuity and sustainability of smaller enterprises ends
with the exit of the owner as in most cases the business and stakeholder relationships revolve
around him or her. Furthermore, customers tend to cultivate personalised relationships with
the owner. One of the small enterprise owner who also doubles as the project manager
expressed that;
“The business is me, the moment I leave that will be the end of the business”
(SMEs Owner/ Project manager – sub- contractor)
5.3 Description of the industry
The study sought to get description of the industry with the aim of contextualising the
environment within which they operate in. The description of the industry was captured
through three key themes which are mainly “kinds of projects”, “Key players/ stakeholders”
and lastly the “obstacles encountered.”

632
5.4 Kinds of Projects
The construction industry in Botswana is mainly characterised by government funded
projects. This can be primarily attributed to the fact that the government finances most of the
development in the industry. One of the project managers illustratively expressed that;
“Our projects are mainly commissioned by the government because it is able to pay
and is more reliable as compared to private entities”
(SME Project Manager – Contractor)
Other kinds of construction projects mentioned include residential developments, office
buildings and a few projects in the private sector. Clients in the private sector were cited as
often facing difficulties when paying for projects undertaken and as such some contractors
expressed their unwillingness to take on projects commissioned by such entities.
5.5 Key players
With reference to the key players in the construction industry, the following themes emerged;
the players were grouped into two distinct categories namely “Customers” and “other
stakeholders”. In these two categories the “customers” were described as the end
beneficiaries of the projects for example the government, estate companies, big constructions
companies, and the Regulators. The “other stakeholders” category consisted of the players
that make the project possible through the different roles they play in the execution phase of
the project. These are namely; employees and employers within the construction SMEs, the
suppliers, financers and other construction companies that are sub-contracted for other
components of the project such as the electrical fittings. While the different stakeholders
were perceived in different categories, the project managers solidly confirmed that all
stakeholders were important in the successful delivery of projects.
5.6 Barriers to project success
While there are many factors that have been known to be barriers to the successful delivery of
projects, the project managers stated the below as key barriers to project delivery in
Botswana. The following themes emerged; “Regulatory barriers”, “Human Resources
barriers” and “environmental barriers”. Regarding the regulatory barriers, the project
managers articulated that the licensing procedures in the market are unclear and poorly
articulated to the contractors. In addition, additional certification is required for industry
players or entities that are foreign owned. One project manager highlighted the need to
acquire an Economic Diversification Drive certification where the company is foreign owned.
This process has been cited as barrier which at times causes delays that are then passed on to
the project timelines resulting in possible project delays.
Human Resources related constraints were expressed as barriers that affect their ability to
effectively and timeously deliver projects to their customers. The first issue highlighted was
that of workmanship of the low level staff in the construction industry. The low level were
reported to have a tendency of working irregular hours thus affecting the project progress.

633
This tendency is exacerbated by the labour and regulatory obligations of the companies
which do not permit them to fire the employees without following the stipulated labour
regulation protocols. In relation to human resource issues, the project manager further stated
that they lose skilled labour after they have trained them. One project manager illustratively
stated that;
“The company invests money in training workers in things like operating overhead
cranes and once they are trained they demand higher salaries or they move to other
companies or to more lucrative markets such as South Africa.”
(SME Project Manager – Contractor)
The third issue articulated regarding human resources was that of work permit processing for
personnel working onsite in a case where they are none locals. This process was said to be
long and usually impedes progress where the person involved is a key member in the project
execution team. The last barrier stated by the project managers was that of the construction
industry in general. Given the low population of Botswana, the market was viewed as being
too small in relation to the number of players in existence. The market saturation was
emphasized by one of the SME project managers who highlighted that;
“Most buildings are becoming white elephants there is market saturation.”
(SME Project Manager – Contractor)
6. CURRENT PRACTICES REGARDING STAKEHOLDER RELATIONSHIP
MANAGEMENT
A key component of the study was to determine the current market practices regarding how
project managers manage their stakeholders in order to ensure project success where the
customer is satisfied with the delivery time and quality. As such, the project managers were
assessed through three key components namely; maintaining a balance between all
stakeholders, managing the interest of the stakeholders and their current practices regarding
customer relationship management.
6.1 Maintaining a balance between stakeholders
This component was viewed as an important aspect during project execution as this was seen
as a measure to avert project delays. Risk Management and Control were stated as measures
that are put in place to ensure that the SMEs are well prepared for possible unforeseen
mishaps that could potentially affect the project delivery. In addition, insurance was also
pointed as a way to protect the interests of the SME and its customers.
6.2 Managing the interests of stakeholders
With regard to stakeholder relationship management, the project managers unanimously
alluded to the fact that there is no documented model or structure in this regard. They further
articulated that there is no formal strategy that is used to manage stakeholders nor is there a

634
structured approach to stakeholder management. While they fully appreciated the importance
of managing stakeholder relationships to ensure project success, they were not practicing any
set procedures to achieve this. Despite the absence of set standards some project managers
highlighted some of their practices in an effort to manage stakeholder relationships. They
reported that they are cognisant of the fact that they need to ensure that their customers are
satisfied. Thus, some do follow ups with their customers to monitor their expectations and
satisfaction levels. Similarly, they added that their customers are different and thus they
require different levels of monitoring and management. They added that they are conscious
of the fact that customer is king. In view of these assertions, the project managers were asked
about their levels of understanding regarding Customer Relation Management in the
construction industry.
6.3 Customer Relationship Management (CRM)
The perceptions of the project managers were sought regarding the concept of CRM.
Although this concept was not widely used, it was not entirely foreign to the project
managers. They expressed that project success that is typified by prompt delivery and high
quality is meant to leave the customer satisfied with the work done. One of the SME project
managers highlight how they actively use technology to improve their project delivery times.
He further stated that;
“We use SAS Machines to bend re-enforcements to improve the project delivery through
saving time”
(SMEP Project Manager – Contractor)
In contrast, CRM was not perceived as a very important task by some. This is evidenced by
the lack of a high level personnel designated to manage customer relations. In this instance
the receptionist was tasked with dealing with the customers. This highlights how CRM is not
highly regarded despite its importance in ensuring greater chance of project success.
7. DISCUSSION
The main aim of the study was to assess the current practices in the construction industry in
Botswana with particular focus on stakeholder relationship management as this has been
perceived as a key factor in ensuring project success. The findings of the study clearly affirm
the observations made in extant literature in relation to the inadequacy of stakeholder relation
management models. Furthermore, the project managers all confirmed that they do not have
any set measure that they implement when managing their stakeholders. Similarly, the
concept of Customer Relationship Management in the construction industry was rarely used
in its full capacity. At most, some project managers were seen to be concerned about the
satisfaction of their customers as illustrated by their efforts in conducting follow ups with
their customers.
Given that SME project managers are cognisant of the need to manage their relationships
with their stakeholders as well as importance of ensuring customer satisfaction, one can
conclude that the fusion of the two concepts can be coined to construct a Stakeholder
Relationship Management model (SRM). The use of such a model can be further explored by

635
SMEs in Botswana to mitigate the poor delivery of projects that is attributed to their inability
to effectively manage their relationships with other stakeholders in the industry thus
inhibiting their growth and sustainability.
Figure 2: Proposed SME Stakeholder Relation Management Model
Figure 2 illustrates a proposed model of how stakeholder management and customer
relationship can be used throughout the project life cycle to ensure that project objectives are
well aligned will the customers aims (Malkat & Byung-GYOO n.d.).
8. CONCLUSIONS AND FURTHER RESEARCH
The findings of the study are indicative of the inadequacy of stakeholder relationship
management capacity of the Project Managers as highlighted in existing literature. In
addition, there is no formal structure for strategies in SM and CRM as standard practice in the
construction industry in Botswana. Further to that, the homogeneous environment within
which the SMEs in Botswana operate limits them to unstructured strategies and practices in
both Stakeholder Management (SM) and Customer Relationship Management (CRM). This
scenario has a negative effect on the growth, sustenance and continuity of the SMEs. From
this viewpoint this study developed a model for stakeholder management and customer
relationship management for use in developing countries such as Botswana. There is need
for further research to ascertain the efficacy of the model.
9. REFERENCES
Adekunle O, Ajibola W.K., 2015. Factorial Causative Assessments and Effects of Building
Construction Project Delays in Osun State, Nigeria. J Archit Eng Tech 4: 150. doi: 1
Baran, R., Zerres, C. & Zerres, M., Customer Relationship Management.
BOCCIM.,1992, Report on the Study of the Construction Industry in Botswana, prepared by Botswana
Technology Centre, Gaborone, Botswana.
Buchholtz, A. K, Carroll, A.B, 2012. Business and Society Ethics and Stakeholder Management, 8 th Edition
Bourne, L., 2009. Stakeholder Relationship Management Lynda Bourne A Maturity Model for Organisational
Implementation, Surrey, GU9 7PT: Gower Publishing Limited.
Bourne, L. & Walker, D.H.T., 2006. Visualizing Stakeholder Influence— Two Australian Examples. Project
Management Journal, 37(1), pp.5–22.
Chinyio, E. and Akintoye, A. 2010 Construction stakeholder management / edited by Ezekiel Chinyio, Paul
Olomolaiye.
Freeman, R.E.1984 Strategic Management: A stakeholder Approach. Boston: Pittman Publishing Company
Ju, C. & Rowlinson, S., 2013. Institutional Determinants Of Construction Safety Management Strategies Of
Contractors In Hong Kong. , Pp.347–356.
SME
Project
Life Cycle
Surrounding
Environment
Pre-
ConstructioConstruction Operations PROJ
ECT
SUCC
ESS
Stakeholder Management
Customer Relationship Management

636
Karlsen, J.T., 2002. Project Stakeholder Management. Engineering Management Journal, 14(4), pp.19–24.
Available at: http://onlinelibrary.wiley.com/doi/10.1002/9780470172353.ch13/summary.
Kirchoff 1991, Entrepreneurship’s contribution to economics, Entrepreneurship: Theory and Practice,16 (2),
Lawrence, T.B., 2008. Institutional Theory. In International Encyclopedia of Communication. pp. 2288–2293.
Lim, S.K. & Yang, J., 2008. Understanding the need of project stakeholders for improving sustainability
outcomes in infrastructure projects. Proceedings of the Performance and Knowledge Management Joint
CIB Conference, pp.332–343.
Littau, P., Jujagiri, N. J., Adlbrecht, G,2010 25 years of stakeholder theory in project management literature
(1984-2009), Conference paper
Malkat, M. & Byung-GYOO, K., An Investigation on the Stakeholders of Construction Projects in Dubai and
Adjacent Regions. Ipedr.Net, pp.77–82. Available at: http://www.ipedr.net/vol45/016-ICMTS2012-
M00008.pdf.
Meyer, J.W., Reflections on Institutional Theories of Organizations.
OECD 2010 SMEs, Entrepreneurship and Innovation © http://www.oecd.org/berlin/45493007.pdf
Palalani 2000. Challenges Facing the Construction Industry: A Botswana Perspective. Third Dimension
Rwelamila, P.D., Talukhaba, A.A. & Ngowi, A.B., 1999. Tracing the African Project Failure Syndrome: the
significance of “ubuntu.” Engineering, Construction and Architectural Management, 6(4), pp.335–346.
Available at: http://dx.doi.org/10.1108/eb021122 [Accessed November 10, 2016].
Sharp, D.E., 2003. Customer Relationship Management Systems Handbook, Florida 33431.: Crc Press.
Siti Hajar Mohamad1, Norfaridatul Akmaliah Othman1, Juhaini Jabar1, Izaidin Abdul Majid1, M.F.K., 2007.
the Impact of Customer Relationship Management in Small and Medium Enterprises in Malaysia. , 2(July),
pp.11–26.
Ssegawa, J K 1999 Construction industry’s contribution towards Botswana’s vision 2016. In: Hughes, W (Ed.),
15th Annual ARCOM Conference, 15-17 September 1999, Liverpool John Moores University.
Association of Researchers in Construction Management, Vol. 2, 743-52.
Ssegawa-kaggwa, J., 2008. Adequacy of project based financial management systems of small and medium
construction enterprises in botswana. Environment.
Ssegawa-Kaggwa, J., Ngowi, A.B. & Ntshwene, K., 2013. Using a Situation Analysis to Identify the
Construction Industry Deficienci...: THOL1Search. Journal of Construction in Developing Countries,
18(1), pp.1–18. Available at:
http://eds.a.ebscohost.com.ezproxy.sunway.edu.my/eds/pdfviewer/pdfviewer?sid=52f22f91-cfbd-445c-
b061-ad49fcf972d6@sessionmgr4005&vid=3&hid=4202.
Verbeke, A. & Tung, V., 2013. The Future of Stakeholder Management Theory: A Temporal Perspective.
Journal of Business Ethics, 112(3), pp.529–543.
Vogwell, D. 2002. Stakeholder Management
Yang, J., Shen, Q. & Ho, M., 2009. An overview of previous studies in stakeholder management and its
implications for the construction industry. Journal of Facilities Management, 7(2), pp.159–175.
Zucker G Lynne, 1977. The Role of Institutionalization in Cultural Persistence.

637
ID 120
A QUANTIFIABLE METHOD OF ASSESSING THE RISK OF
SELECTING THE LOWEST BIDDER IN CONSTRUCTION
PROJECTS: A LITERATURE REVIEW
G. Eke, G. Wedawatta and J. Elgy
School of Engineering and Applied Sciences, Aston University, Aston Express Way, Birmingham B4 7ET.
Email: [email protected]
Abstract: Contractor selection is an important step in ensuring the success of any construction
project. Failing to adequately select the winning contractor may lead to problems in the project
delivery phase such as bad quality and delay in the expected project duration; which ultimately
results in cost overruns. This paper reviewed the strength of existing studies on the link
between contractor selection strategy and project outcomes, with a view of proposing an
approach on how one might try to examine this relationship moving forward. There are
research that try to establish a direct relationship between contractor selection strategy and the
outcome of the construction project. There are also decision support tools such as AHP or
ANP that help clients prioritise various factors when selecting contractors. However the
majority of these research and tools are informed by self-perception questionnaires and
surveys that makes it difficult to gauge the strength of the relationship between contractor
selection and project outcomes. In other words, there are hardly any empirical research that
tries to establish this relationship. Literature review on the sources of cost overruns did not
entirely reveal contractor selection as a main source of cost overrun; although from the
explanations given for causes of cost overruns, one would be able to see how wrong contractor
selection does play a part. Literature review on the various approaches to contractor selection
on the other hand, did little to show the effect of contractor selection on the outcome of
construction projects. Hence, the future direction of the research is to help clients see choosing
a particular contractor selection strategy; whether lowest bid, or best value, affects the
outcome of a construction project: cost and duration.
Keywords: cost overrun, contractor selection, best value, lowest bid.
1. INTRODUCTION
In today’s competitive construction environment, it is almost impossible to achieve project
success without adequate selection of the winning contractor. Wrong contractor selection can
lead to disputes, lengthy dispute resolutions, project or contractor termination, low quality
work and defects. Selecting the lowest bid has long been the traditional method of choosing
contractors in construction. As recent as 2015, the National Construction Survey for the UK
industry found this as the most used strategy for awarding contracts (NBS, 2015). However,
Palaneeswaran and Kumaraswamy (2001) have argued that basing the final choice of
contractor based solely on the lowest price, does not guarantee the delivery of the required
outcome in terms of cost, time and quality. This is due to the fact that, they believe, that most
clients ignore the fact that the same contractor performs differently in a dissimilar
environment. Furthermore, Kashiwagi and Byfield (2002) say that though lowest price
criterion is an objective and transparent approach, it fails to guarantee the quality of the
contractor’s performance. Thus, the lowest bid price may not correspond to the most
economic choice in the long term; in other words may not result in a lower overall cost. This
is due to the fact that selecting contractors based on the lowest bid price motivates contractors
to provide minimally acceptable construction products (Kashiwagi and Byfield 2002).

638
This has led to the introduction of the best value strategy, which is to select contractors on the
combination of price and quality. But what is quality? This is the client’s discretion; the
meaning of quality differs from client to client. Stilger et al. (2015) noted that there are over
thirty-eight available formulas to calculate the best value contractor, all of which may provide
a different winning contractor if used on the same project. Furthermore there are different
methods that have also been developed to help select the best value contractor. Selecting on
the lowest bid is objective and transparent, while selecting on best value is vague. Kashiwagi
and Savicky (2003) say that owners are reluctant to pay more for best value if they do not
understand what best value is. We are also seeing the use of selective tendering in the UK,
particularly in the private sector, whereby clients have a list of preferred contractors; perhaps
due to familiarity and trust, or because those contractors have passed a prequalification
process, and from there select the lowest bid for any of their project. This is not a way of
selecting on best value however, but how can one justify to the client to do otherwise? From
the existing literature, there have been efforts to do so, though they may not be considered
strong enough.
The idea is not to advocate for one strategy over another. Instead, it is to show clients the
effects a contractor selection strategy; whether lowest bid or best value have on the outcomes
of a project before they decide on the strategy to go for. Project outcomes can mean a number
of things but the proposed study focuses on the outcome cost and duration due to its
objectivity. There are existing studies that have tried to establish a link between contractor
selection and project outcomes which will be critiqued in this paper. But first, it is important
to understand the sources of cost overruns. By doing this, one will understand that although
selecting a competent contractor influences project success, it is not the only antidote.
2. SOURCES OF OVERRUNS
In a construction project, whenever there is a budget increase, a cost increase, or cost growth,
it means that the project has overran (Love et al., 2014). The reasons for cost overruns in
construction projects are vast, however the ones that seem to come up the most stem from
Flyvberg et al. (2008) and Cantarelli et al. (2010) studies.
Flyvberg et al. (2008) studied the cost performance of 258 transportation projects in 20
nations worth US$90 billion and found that ninety percent of them overran their cost. The
study grouped the reasons for this cost overrun into three groups: technical, psychological,
and political-economic; explaining the meaning of these groups. The Cantarelli et al. (2010)
study then added to the latter study by offering examples of these groups. Below are tables
that summarise the reasons for cost overruns from Flyvberg (2008) and Cantarelli et al.
(2010).
Table 1: Causes of Overruns Group and Examples/Explanation
Group Flyvberg (2008) Cantarelli et al. (2010)
Technical Inaccurate and unreliable data.
Technical complications in
project leading to increased costs.
Incomplete estimates, poor
project design, scope changes,
uncertainty, inappropriate
organizational structure,
inadequate decision-making
process etc.

639
Psychological Optimism bias; being overly-
optimistic about the
implementation of the project.
Optimism bias among local
officials, cognitive bias of
people, cautious attitudes
toward risk.
Political-
economic
Strategic misrepresentation;
overestimate benefits and
underestimate costs.
Deliberate cost
underestimation, manipulation
of forecasts, private
information.
Lack of incentives, lack of
resources, inefficient use of
resources, inadequate contract
management etc.
Source: Flyvberg (2008) and Cantarelli et al. (2010). Adapted by researcher
The technical aspect of cost overruns can be attributed to risk and uncertainty; the failure of
managing them adequately leads to cost overrun. It is important to understand that, despite
the fact that the two are used simultaneously, risk and uncertainty are two different things.
Ustinovicius et al., (2007) say that the reason the two are used simultaneously is because
“uncertainty” is used in most scientific literature concerning risk management, while
uncertainty management is concerned as managing perceived threats and opportunities;
including their risk implications, as well as managing the various sources of uncertainty
which give rise to and shape risk, threat and opportunity.
Flyvbjerg (2008) offers optimism bias as a psychological explanation for cost overruns; this
theory is primarily from behavioural studies and it is to do with the inclination for people to
be overly positive when making predictions about the outcomes of future planned actions
(Siemiatycki, 2010). Nicholas (2004) suggests that estimators usually have to rely heavily on
their own experience and historical information when preparing initial estimates. Which also
explains why Flyvbjerg (2009) refers to optimism bias as delusion in the following way:
"Delusion accounts for the cost underestimation and benefit overestimation that occurs when
people generate predictions using the inside view. Executives adopt an inside view of the
problem by focusing tightly on the case at hand, by considering the plan and the obstacles to
its completion, by constructing scenarios of future progress, and by extrapolating current
trends. In other words, by using typical bottom-up decision-making techniques, they think
about a problem by bringing to bear all they know about it, with special attention to its
unique details. There are two cognitive delusions the inside view facilitates: the planning
fallacy and a heuristic rule-of-thumb called anchoring and adjustment."
Strategic misrepresentation alludes to suspicion of foul play and corruption (Flyvbjerg, 2008;
Flyvberg, 2009) a situation whereby forecasters and planners knowingly overestimate
benefits and underestimate costs in order to win the project or get approval and funding; this
refers to its political-economic explanations. Flyvberg (2009) refers to this as deception
which is described in the following way:
“Deception accounts for flawed planning in decision making in terms of politics and agency
issues. The political and organizational pressures in executive decision making involve: the
principal agent problem and the sources of strategic deception."

640
Though cost is an important factor that gauges whether a projects was successful or not, it is
not the only factor. The project duration is another important factor; and the causes of delay
can also be seen in Cantarelli et al. (2010) and Flyvbjerg’s (2008) study. From these studies
we see that there are a number of reasons why a project is unsuccessful; contractor selection
is one of the reasons but may not be the only reason why a project turns out bad.
Nevertheless, this is enough reason to establish the link between contractor selection strategy
and project outcomes: cost and duration. The next section reviews the various methods to
picking a contractor on best value.
3. CONTRACTOR SELECTION METHODS FOR BEST VALUE
There are a plethora of tools developed to assist in clients in selecting the best contractors for
executing a construction projects. This section will examine them.
Lo and Yan (2009) developed simulation models to analyse contractors’ pricing behaviour
and dynamic competition process under the qualification based system (QBS). The strength
of this research is that it is possible to identify an unrealistic bid using the model.
Furthermore El Asmar et al. (2009) used simulation to quantify criteria and combine them
into a single score when assessing contractors. The major drawback to this research is the
assumption that it could be used in all types of projects to assess contractors. Construction
projects usually differ; clients’ needs also differ and models should be able to take this into
consideration. Having said that, there are methods that exist and were introduced a while ago
that are being used as contractor selection approaches to account for the clients’ needs or the
specific needs of the project at hand. The AHP, being one, is a popular technique used for
ranking and prioritising criteria used in selecting contractor; it is able to analyse multi-criteria
problems according to pairwise comparison scale. According to Fong and Choi (2000) the
technique identifies contractors with the best potential to deliver satisfactory outcomes in a
final contractor selection process which is not based simply on the lowest bid. One of the
main benefits of this tool is that it can be combined with other tools to assist decision makers
such as fuzzy logic and ANP. The ANP in particular is an extension for the AHP to allow for
interdependencies between criteria in selecting contractors (Cheng and Li, 2004).
Abdelrahman et al. (2008) introduced a concept of best value modelling that was specific to
each project. It combined the AHP and the weighted average method to quantify the
qualitative effect of subjective factors in selecting the contractor. This particular study was
relatively easy to understand and implement, however there is a high level of subjectivity to
this study. The weights given to the criteria was the researchers discretion, even at that there
is no real evidence that this criteria used to select the contractors will result in project
success. Although it is fair to add, that the main purpose of their o study was to assist in
selecting the best value contractor not whether the best value contractor will be successful or
not. Similar studies have also been undertaken like Kwong et al. (2002) and Bevilacqua and
Petroni (2002), which used the combination of a scoring system and fuzzy theory for ranking
the best value bids. Bendana et al. (2008) also developed a fuzzy logic assessment model
both the qualitative and quantitative issues that influence whether or not a contractor is
suitable to win the bid for the project. Zadeh (1965) first introduced the concept of fuzzy set,
which basically transforms linguistic variables that are ill-defined into traditional quantitative
terms (El Agroudy et al. 2009). In this type of study contractors are scored in each criteria as
Low, Medium, and High (1, 2, and 3). Then depending on the number of criteria used to
assess the contractors, let us say for example 5, this usually results in a final score for each
contractor between 5 and 15. So if a contractors’ score is between 5 and 9 they will be

641
considered Poor. 10 and 13 will be considered good, while 14-15 is Very Good. This is just
an example of a scale used, each client can subsequently their own scale. However using this
example, one can question how sensitive the scores are to subjectivity; with the fact that at 9
a contractor is considered Poor and at 10 Good. Assuming the choice of the contractor boiled
down to 9 and 10 contractors, with the latter at a higher price. How can it possibly be justified
to the client to select the contractor with the score 10 at a higher price, when it’s supposed
‘quality score’ is just one above a contractor with a lower price? How much of a difference
does that one point make in the project outcome? The strength of this technique however is
that it can be tailored to the owners’ requirement; the client should have the power to score
contractors the way the like, but whether that results in project success usually remains
unclear until the end of the project.
Other research have proposed the use of multi-criteria evaluation model for contractor
selection; Topcu (2004) for one incorporated this method for construction contractor
selection in the Turkish public sector. A major strength of these models is the capacity to
allow more factors that are likely to influence a contractor’s performance to be taken into
consideration. Zavadskas et al. (2008) demonstrated this in its research by developing a
contractors’ assessment and selection based on the multi-attribute method. There are also
models that have been developed to assess the contractors after project completion. Hancher
and Lambert (2002) developed an evaluation system to evaluate the performance of
contractors at the end of each year of project duration. Minchin and Smith (2005) also
produced a quality based performance rating system model that generated an index for each
contractor to represent contractor’s quality over a specified frame. Despite the vague nature
of quality really is, these research at least tries to establish a link between contractor selection
and the outcome of the project by assessing the contractors. By doing so, clients can take
these assessments into consideration for future projects.
It is also worth mentioning that the use of subcontractors in the construction industry has
been steadily on the rise. Main contractors are now subcontracting majority of the works of a
project which means that subcontractors should be assessed as well. Albino and Garavelli
(1998) have proposed a neural network process for subcontracting rating. While, Arslan et al.
(2008) developed a web based subcontractor evaluation system called WEBSES for the
Singaporean construction industry that evaluated contractors based on combined criterion.
Interserve Plc, also run a database that scores subcontractors performance on past projects for
main contractors. With the increase in selective tendering; whereby a client has a preferred
list of contractors, it makes it difficult for small to mid-size companies or companies in
general who are not in the list to win work. Hence, these companies result to being
subcontractors.
There are a plethora of research that are aimed to determine the best value contractor,
whether they are mathematical models, or linear weighting models, or statistical approach; all
of which include cluster analysis, simple weighting, AHP, fuzzy set theory, discriminant
analysis, etc. (Waara and Bröchner 2006; Tsai et al., 2007; Lambropoulos 2007). However,
these methods do little to show the effect of a contractor selection strategy: either lowest bid
or best value, has on the outcome of a construction project: final cost and duration. El-Abassy
et al. (2013, pp 766) recommends a further study:
“if the developed model determined the best contractor for a project whose submitted price is
not the lowest price, then an analysis should be done to show what-if scenarios for the
contractor with the lowest price if he/she is awarded the contract instead. The analysis can

642
include the response to claims for this contractor, the rework that may occur during the
project because of inadequate past experience, for example, or any other weak points for the
contractor with the lowest price that may result in an extra cost beyond the original price.
These extra costs might include (1) rework because of bad quality, (2) delays because of
incompetence, (3) short life cycle because of bad quality material, (4) operation and
maintenance problems because of inadequate experience, and (5) many claims because of
bad management.”
The research will aim to carry out this further study, but not by assuming that the lowest
tenderer has all these problems. Rather by using historic data and analysing how they have
performed in the past, to predict how they will likely perform in the future. Yu and Wang
(2012) say that the market should dictate what strategy to go for; meaning that there are times
when it is best to for the lowest bid strategy. The next chapters will now aim to provide a
conceptual model that seeks to provide a quantifiable methods of assessing the risks of
choosing the different basis for contractor selection for specific projects. Up to date there has
been no quantitative assessment of the frequency distribution of the final outcome cost and
duration of either selection method. The client may want to know not just the expected
outcome cost of a particular strategy but also what would be the probability of a strategy
leading to an extremely high final cost. In other words, is there a chance that one selection
criteria would give the lowest cost on average but could, on occasions, give to outcome costs
so high that bankruptcy may occur?
Therefore we see that there are many approaches and models that have been developed for
contractor selection; some with a view of showing how they affect outcomes. However, the
bulk of this studies have done little to justify to a client why he/she should pay more for a
best value contractor over the lowest bid contractor. The lowest bid contractor can turn out to
be the best value contractor after they have been ranked. But when the lowest bid contractor
is not the best value contractor, how can it be justified to the client to go with the best value
contractor especially when working under tight margins. A method should be developed that
shows that if a contractor is picked whose price is not the lowest price, how will the lowest
priced contractor fare if he/she is given the contract instead. The method proposed in the next
section should be viewed as an extension to these various approaches of selecting the best
value contractor not the replacement. Also establishing a link between contractor selection
and project outcomes from the perspective of a main contractor picking a subcontractor is
necessary, but a link between selecting the main contractor and the overall project outcome is
more important. A main contractor, if it chooses to can subsequently subcontract all the
works on a project, and not just to one subcontractor but a multiple of them. Therefore
selecting the right strategy to go for is important. But due diligence must start from the
beginning of selecting the main contractor. A main contractor picked on the basis of lowest
bid will subsequently subcontract to the lowest bid, and this is the case with the best value
contractor. The proposed method should not try to dissuade a client from going for the lowest
bidder, instead to show the client the range of possible outcomes available if it does go with
either the lowest bid or the best value bid.
4. PROPOSED METHOD
The proposed method is not seeking to select the best value contractor. The proposed method
is one that seeks to use Monte Carlo simulation to produce frequency distributions of all the
possible outcomes in terms of cost and duration when a client decides on a strategy: lowest

643
bid or best value. This method can be taken solely as a cost estimation technique, however
the difference here is that the method does not just set out to purely estimate the cost or the
duration of a project. Instead, it will incorporate the strategy; whether lowest bid or best
value, by which the contractor was selected. Furthermore, it does not set out to predict the
final cost or duration of the project, rather the range of outcomes that can be expected for a
project depending on the strategy chosen. By doing so a direct link can be established on how
contractor selection affects the outcome of a construction, if it does at all.
For this to happen historical data on projects will have to be analysed. The details and
requirements needed to develop this model include:
Details of the contract awarded (tender bids received from all the contractors that
bided for the project; companies were anonymous)
Selection criteria; (lowest tender accepted)
The wining contractor: the eventual tender accepted
Project outcome cost: initial tender cost, final cost, the expected duration, and actual
duration.
Same sector projects (e.g. educational facilities, hospitals etc.)
The study here is to whether awarding to lowest tender will result in a higher cost and project
time than awarding to the best value tender. There is a pre-conceived notion that the best
value tender whose price is not the lowest price will generally fare better in a project than the
lowest bid tender. Hence, analysing historic data on similar types of project that selected the
lowest tender, can give us a general view of how they might fare in a project that selected the
best value tender.
From the details provided correlations can be derived from variables that will be inputted into
the model:
Bid price (BP, which in this case, is always the lowest tender)
The difference between the final cost of the project and the tender bid (Diff)
Delay
The correlation between these variables are then used to derive numbers that are inputted into
the model. Which is then able to generate frequency distribution of the tender bids accepted
(which will be instructed to always be the lowest tender), a Diff cost, and Delay time.
Subsequent analysis will then be undertaken by the model to calculate the frequency
distributions of the total cost and actual duration of the project. Therefore the idea here is that
when a client is assessing tender bids, and it knows it best value tender, this model will be
able to show how the lowest tender will fare.
Monte Carlo simulation technique is not new, this has been applied in various fields
including construction. Below are a few examples:
Wall (1996) collected 216 office building from the BCIS database of RICS to outline the
issues that should be recognised when using Monte Carlo methods. The study concluded that
lognormal distributions are superior to beta distributions in representing a data set.
Furthermore the result of this study show that the effect of excluding correlations is more

644
profound than the effect of choosing between lognormal and beta distribution to represent a
data set.
Clark (2001) details another example of a Monte Carlo application provided by the
Honeywell Performance Polymers and Chemical, which used the tool to estimate contingency
on 47 projects ranging from US$1.4 million to US$505 million.
Moghaddam (2015) combined hybrid Monte Carlo simulation and goal programming to
develop a method for supplier selection and order allocation in closed loop supply chain
systems.
Vose (2000) highlights some of the main advantages to Monte Carlo:
It does not require specialist knowledge in mathematics.
Computer applications are commercially available and can be used to run the analysis.
Monte Carlo simulation is a parallel process; i.e. iteration results are independent of
each other.
The model elements can be correlated for more reliable and realistic scenarios.
Furthermore there are tools available to carry out this technique. The @RISK software is a
popular tool that is used for this analysis by both academics and practitioners. GoldSim is
also another popular tool. There is also MATLAB, and Mathematica; therefore there are a
number of software packages that can be utilised for this study.
The major challenge to this study is seeing whether client companies are willing to release
such sensitive information, not only does this study need their consent, but the consent of the
contractors involved in the project. The benefit to this study however, is the fact that results
can be presented in different forms; most importantly in terms of financial numbers. Having
said that, if companies are unwilling to release such sensitive information, there are databases
that have the details and requirements needed to carry out this research. One being the
Building Cost Information Service (BCIS) database from the Royal Institution of Chartered
Surveyors (RICS hereafter). The downside to it may possibly only harbour projects that did
well or not too badly, therefore result would be interpreted with a bit of caution.
Nevertheless, it will be able to offer a practical example of the benefits of this study.
5. CONCLUSIONS
The approaches to contractor selection were analysed; there are essentially two strategies to
selecting a contractor: lowest bid, or best value tender. The lowest bid is relatively
straightforward and simple, the best value tender is not. The literature is rich with approaches
and models for selecting the best value contractor; from simple weighting, to AHP, ANP,
fuzzy theory etc. The literature is rife with models developed to select the best value bid. The
proposed method is not one of them; the proposed method here should be seen as an
extension. So if a best value tender is selected whose price is not the lowest price, there
should be a method to justify to the client that the lowest tender would not fare better. The
study is not advocating for one strategy over another nor is it a tool for selecting the best
value contractor. Instead, it will show all the possible outcomes involved when a client
decides on a strategy: lowest bid or best value. There are cases when it will make economic
sense to go for the lowest bid strategy, while there are other cases where it is best to go for
the best value bid. This proposed method of analysing historic data on how these strategies

645
have fared in past projects, in order to develop a model that will produce frequency
distributions of outcomes of a strategy will help clients decide on what strategy to go for. The
next step of the PhD research is to analyse sector specific projects, all of which have selected
the lowest bid. This would be used to develop a model that will be able to predict the likely
range of outcomes: final cost and duration of the lowest tenderer in future projects in that
sector. Furthermore if a client’s selection criteria is best value and it turns out that the best
value contractor does not have the lowest bid, this model would then be able to show how the
lowest bid amongst the tenders would have fared if he/she was given the contract instead.
6. REFRENCES
Abdelrahman, M., Zayed, T., and Elyamany, A. (2008). Best-value model based on project specific
characteristics. Journal of Construction Engineering Management, 134 (3), 179–188.
Albino, V., and Garavelli, A. C. (1998). A neural network application to subcontractor rating in construction
firms. International Journal of Project Management, 16(1), 9–14.
Arslan, G., Kivrak, S., Birgonul, M. T., and Dikmen, I. (2008). Improving sub-contractor selection process in
construction projects: Web-based sub-contractor evaluation system (WEBSES). Automation Construction,
17(4), 480–488.
Bendana, R., Cano, A., and Pilar de la Cruz. (2008). Contractor selection: Fuzzy-control approach. Canadian
Journal of Civil Engineering, 35(5), 473-486.
Bevilacqua, M. and Petroni, A. (2002). From traditional purchasing to supplier management: a fuzzy logic-
based approach to supplier selection. International Journal of Logistics, 5(3), 235-255.
Cantarelli, C. C., Flyvbjerg, B., Molin, E.J.E., and van Wee, B. (2010). Cost Overruns in Large-Scale
Transportation Infrastructure Projects: Explanations and Their Theoretical Embeddedness, European
Journal of Transport and Infrastructure Research, 10(1), 5-18.
Cheng, E.W. and Li, H. (2004). Contractor selection using the analytic network process. Construction
Management and Economics, 22(10), 1021-1032.
Clark, D.E. (2001). Monte Carlo analysis: ten years of experience. Cost Engineering, 43(6), 40-45.
El Agroudy. M., Elbeltagi, E., El Razek A, M, E. (2009). A Fuzzy Logic Approach for Contractor Selection. In:
Fifth International Conference on Construction in the 21st Century (CITC-V) “Collaboration and
Integration in Engineering, Management and Technology” May 20-22, 2009, Istanbul, Turkey.
El Asmar, M., Hanna, A., and Chang, C. (2009). Monte Carlo Simulation Approach to Support Alliance Team
Selection. Journal of Construction Engineering and Management, 135(10), 1087-1095.
El-Abbasy, S.M., Zayed, T. M.ASCE., Ahmed, M., Alzraiee, H., and Abouhamad, M. (2013). Contractor
Selection Model for Highway Projects Using Integrated Simulation and Analytic Network Process. Journal
of Construction Engineering and Management, 139(7), 755-767.
Flyvbjerg, B (2008) Curbing optimism bias and strategic misrepresentation in planning: Reference class
forecasting in practice. European Planning Studies, 16(1), 3-21.
Flyvbjerg, B. (2009). Survival of the unfittest: why the worst infrastructure gets built—and what we can do
about it. Oxford Review of Economic Policy, 25(3), 344-67.
Flyvbjerg, B., M.K. Skamris Holm and S.L. Buhl. (2002). Underestimating cost in public works. Error or Lie?
Journal of the American Planning Association, 68(3), 279-295.
Fong, P. S., and Choi, S. K. (2000). Final contractor selection using the analytical hierarchy process.
Construction Management Economics, 18(5), 547–557.
Hancher, D. E., and Lambert, S. E. (2002). Quality based prequalification of contractors. Journal of
Transportation Research Board, 1813(0361–1981), 260–274.
Kashiwagi, D. and Savicky, J. (2003). The cost of ‘best value’ construction. Journal of Facilities Management, 2
(3), 285-295.
Kashiwagi, D., and Byfield, R. E. (2002). Selecting the best contractor to get performance: On time, on budget,
meeting quality expectations. Journal of Facilities Management, 1(2), 103-116.
Kwong, C.K., Ip, W.H., and Chan, J.W.K. (2002). Combining Scoring Method and Fuzzy Expert Systems
Approach to Supplier Assessment: A Case study. Integrated Manufacturing Systems, 13(7), 512-519.
Lambropoulos, S. (2007). The use of time and cost utility for construction contract award under European Union
Legislation. Building and Environment, 42 (1), 452–463.
Lo, W. and Yan, M. (2009). Evaluating qualification-based selection system: A simulation approach. Journal of
Construction Engineering and Management, 135(6), 458-465.

646
Love, P E D, Smith, J, Simpson, I, Regan, M, Sutrisna, M and Olatunji, O. (2014). Understanding the
Landscape of Overruns in Transport Infrastructure Projects. Environment and Planning B: Planning and
Design, 42(3), 490-509.
Minchin, R. E., Jr., and Smith, G. R. (2005). Quality-based contractor rating model for qualification and bidding
purposes. Journal of Management and Engineering, 21(1), 38–43.
Moghaddam, K.S. (2015) Supplier selection and order allocation in closed-loop supply chain systems using
hybrid Monte Carlo simulation and goal programming. International Journal of Production Research,
53(20), 6320-6338.
NBS (2015). The National Construction Contracts and Law Survey 2015. [online] Available from:
https://www.thenbs.com/knowledge/nbs-national-construction-contracts-and-law-survey-2015-finds-
disputes-continue-to-blight-construction-industry [Accessed: 21st February 2017].
Nicholas, J.M. (2004). Project Management for Business and Engineering: Principles and Practice. 2nd ed. MA,
USA; Oxford, UK: Elsevier Butterworth-Heinemann
Palaneeswaran, E., & Kumaraswamy, M. (2001). Recent advances and proposed improvements in contractor
prequalification methodologies. Building and Environment, 36(1), 73-87.
Siemiatycki, M. (2010). Managing Optimism Biases in the Delivery of Large-Infrastructure Projects: A
Corporate Performance Benchmarking Approach. European Journal of Transport and Infrastructural
Research, 10(1), 30-41.
Stilger, S.P., Siderius, J. and van Raaji, E.M. (2015). A Comparative Study of Formulas for Choosing the
Economically Most Advantageous Tender. [online] Available from:
http://poseidon01.ssrn.com/delivery.php?ID=44100400510302411207211008606508111303207203604005
70600730840890690040681030270081110590391250120271230081081150911201120211231170370210
23046027089014101082120026070071038078086081118126091015064110122026000121004000097107
071119092065112101096098092085&EXT=pdf [Accessed: 21st February 2017].
Topcu, Y. (2004). A decision model proposal for construction contractor selection in Turkey. Building
Environment, 39(4), 469–481.
Tsai, H., Wang, L., and Lin, L. A. (2007). Study on improving the ranking procedure for determining the most
advantageous tender. Construction Management Economics, 25 (5), 545–554.
Ustinovicius, L., Migilinskas, D., Tamosaitiene, J., Zavadskas, E.K. (2007). Uncertainty Analysis in
Construction Projects Appraisal Phase. [online] Available from:
http://leidykla.vgtu.lt/conferences/MBM_2007/2pdf/Ustinovicius_Migilinskas.pdf [Accessed: 21st
February 2017].
Waara, F., and Bröchner, J. (2006). Price and non-price criteria for contractor selection. Journal Construction
Engineering Management, 132 (8), 797–804.
Wall, M.D (1996). Distributions and correlations in Monte Carlo simulation. Construction Management and
Economics, 15, 241-258.
Yu, Wen-der and Wang, Kwo-Wuu (2012). Best Value or Lowest Bid? A Quantitative Perspective. Journal of
Construction Engineering and Management, 138, 128-134.
Zadeh, L.A. (1965). Fuzzy Sets. Information and Control, 118, 338-353.
Zavadskas, E., Kazimieras, T. Z., and Tamosaitieme, J. (2008). Contractor selection of construction in a
competitive environment. Journal of Business Economics and Management, 9(3), 181–187.

647
ID 127
AN INTEGRATED BIM-IBS MODEL FOR IMPROVING
PRODUCTIVITY IN CONSTRUCTION
R.H. Monib, Z.A. Adamu and W. Lord
School of Civil and Building Engineering, Loughborough University, Epinal Way , Loughborough
Leicestershire , LE113TU, United Kingdom
Email: [email protected]
Abstract: The construction sector plays a major role in the UK economy but its productivity
has decelerated from 3% in 2014 to approximately 2% in the first quarter of 2016. Due to the
impact of productivity and waste minimisation on the efficiency and sustainability of this
sector, this issue has caused concern for both industry and government stakeholders. Recent
research has tried to identify the causes and potential solutions and from these studies, two
recognized systems and technologies that could impact on the industry’s productivity include:
Building Information Modelling (BIM) and Industrialised Building System (IBS). Although
the singular benefits of BIM and IBS are well established, these technologies have rarely been
studied in parallel and with synergy to each other. This paper has two main objectives. First, it
identifies the key factors that affect productivity during the construction phase based on
fundamental economic principles. Second, it uses a ‘system of systems’ theory approach to
explore the feasibility of merging the delineated processes of BIM and IBS. In this regard,
BIM was viewed as a socio-technical system. Data collected from pilot expert interviews were
used to extract the opportunities for productivity enhancement as obtainable from both
processes, including: dealing with tolerances and construction errors in IBS by using BIM's
capability for appraising different construction schemes including the risks associated with
variations; using BIM's 3D and data-driven capabilities to resolve interface issues between
IBS components; reducing the volume of site activities by optimizing the number of modules
required to achieve IBS-based connections and; using BIM's collaboration framework to
harmonise the participation of project stakeholders. Subsequently, a proof-of-concept model
for improving construction productivity is proposed through an integrated BIM-IBS
productivity enhancement model. A validation roadmap was also developed to support the
proposition that the summative productivity impacts of the integrated BIM-IBS systems are
greater than the singular impacts of either system.
Keywords: BIM, IBS, Productivity, System of systems, Waste minimisation.
1. INTRODUCTION
Over the years there has been a great interest in the trend of construction productivity in
United Kingdom. The European Association of National Productivity Centres (2005) defines
productivity as “How efficiently and effectively products and services are being produced”
(Pekuri, Haapasalo and Herrala, 2011). Efficiency in productivity refers to doing things
correctly and getting the best use of resources to achieve a certain result (Pekuri, Haapasalo
and Herrala, 2011) while effectiveness refers to the extent to which customer requirements
are met ( Pekuri, Haapasalo and Herrala, 2011).
The construction industry is one of the major sectors that has a significant effect on UK
economic growth (CIOB, 2016). However, In the last few years, the sector has been suffering
from a slow productivity growth (PWC, 2016) . According to the Chartered Institute of
Building (CIOB, 2016) growth in UK construction productivity has been slow since 1994
with 7% improvement over the last two decade (Rhodes, 2015, CIOB, 2016). Due to the

648
importance of construction sector productivity in UK, the slight growth of the sector
comparing to other sectors in the industry drags down the performance productivity of UK as
a whole (Rhodes, 2015, CIOB, 2016).
There are two technologies that could assist the construction industry to be more productive:
Building Information Modelling (“BIM”) and Industrialised Building System (“IBS”) and.
Although the individual benefits of BIM and IBS are well established, these technologies
have rarely been studied together. Hence, there is a gap in the literature relating to the
integration of IBS into BIM (Namini et al., 2012). Accordingly, this paper investigates the
feasibility of integrating the two technologies as a solution for construction productivity
improvement.
2. LITERATURE REVIEW
2.1 Productivity: Concept, Characteristics, and Challenges
There are several definitions for the term productivity. The Office for National Statistics
(ONS) defines productivity as “The rate of output per unit of input” (CIOB, 2016). According
to this definition, generating more outputs (measured in quantities and qualities) for specific
and unchanged inputs could attribute to productivity improvement (CIOB, 2016). Thus,
productivity could be improved either by reducing the inputs (i.e. material used, energy
consumed, labor) to generate the same output, increase the output with the same level of
inputs or a combination of the two (CIOB, 2016). On the other hand, New Zealand Statistics
(2012) noted that increase in output produced could be due to increasing input (resources),
utilization of resource inputs in a more efficient way or a combination of the two (Statistics
New Zealand, 2012). Based on the above, it is clear that there is no agreed definition for
productivity among researchers. However, for the purpose of this paper, the research will
consider the ONS Productivity Handbook’s definition of productivity throughout the study.
The study will aim to investigate and provide a solution to improve utilization of the
resources inputs to its maximum and accordingly improve productivity during the
construction phase.
There are several types of productivity measures. The choice between them depends on “the
purpose and availability of data (Statistics New Zealand, 2012). This paper is concerned with
construction productivity improvement at project /task level. The factors affecting single
factor productivity needs to be investigated. Factors affecting productivity could be
categorized into: environmental, group, individual and organizational factors (Ailabouni and
Gidado, 2009). Environmental factors such as the level of technology used, weather
conditions, site layout and project requirement. Group factors such as the different
background of project stakeholders, labour and employee skills. Individual factors include
labour, motivation, education and training. Organizational factors include contract used,
working hours, the complexity of project and scope. However, these factors are not generic
but context specific and are dependent on location, types of work or productivity levels.
New technologies such as BIM could have positive impacts on some of the mentioned
factors. The same could be said of IBS. However, evidence from literature reveals that
although there are key indicators linking both BIM and IBS with enhanced productivity, there
is little evidence that the problem of low productivity could be solved by either BIM or IBS
separately. Integrating both systems represents an important area of concern for this study.

649
2.2 Defining Industrialised Building System
IBS definition are more different and sometimes inconsistent (Vernikos et al., 2014). The
term could be defined as building system, its components are produced in a factory or at site
depending on the specification, transported and assembled at site location (Trikha, D. N., &
Ali, 2004, Abdullah and Egbu, 2010). CIDB (2003) defines IBS as construction method in
which the building components are manufactured in control environment onsite or offsite.
There is no agreed definition of industrialized building system in the industry. However, For
the purpose of this paper, the first definition above is used to refer to IBS throughout this
paper.
2.3 Defining Building Information Modelling
BIM is a digital model that “represents building elements such as beams, columns, and walls
as smart three-dimensional (3D) objects that include embedded data such as geometry details,
energy use data, and life cycle cost information” (Karan et al., 2015). Although several
researchers define BIM as a tool or technology (i.e. Teo et al., 2015, Davies and Harty,
2012), however, there are some studies that define BIM as a system. WSP (2013) define BIM
as a sociotechnical system and multi-layered system. The model includes technical systems
(i.e. hardware and software: 3D, 4D, nD) and also operational process and users (i.e.
architect, structural, MEP engineers and other project disciplines) who utilize and interact
with the technical system (Davies and Harty, 2012, Mourtzis et al., 2016). For the purpose of
this paper, the latter definition is used to refer to BIM in the following sections.
2.4. System Integration
Review of Integration Concept
The term system is defined as “groups or combination of interrelated, interdependent, or
interacting elements forming collective entities” (Arnold and Wade, 2015). System
integration is defined as “a progressive and interactive cycle of melding technologies, human
performance and operation processes together” (Myerson, 2001). From a technological
perspective, system integration is melding of incompatible technologies, applications, and
data into uniform information technology architecture and functioning working structure.
Houser (2011) defined system integration as “assembling the constituent parts of a system in
a logical, cost effective way, comprehensively checking system execution and including a full
functional checkout” (Houser, 2011).
There are four stages of system integration. Each stage has its own characteristics, aspects
and implications and application. Stage 1 is the Integration technology, sometimes called
interconnectivity and is the mechanism in which data is transferred between two systems or
conduct a common pathway between different components in order to initiate new systems.
Data transfer could be achieved through manual data transfer, automatic data transfer,
common database or process to process communication (Myerson, 2001, Nilsson, et al.,
1990). Stage 2 is the architecture or interoperability Integration. In this stage, one
technology or application functions with another in order to achieve the capabilities of both.
Thus it is essential at this stage to distribute responsibility for data and functionality between
systems so when the two systems are integrated, a total cohesive system is achieved. That
could be through controlled redundancy, activating other systems, under this strategy, the

650
system that activate the other one should decide which function to activate, which data, how
errors should be handled (Myerson, 2001, Nilsson, et al. , 1990). Stage 3 is the Sematic
Integration, in which a standard database definition should be established to reduce any
human errors during integration. common set of concepts should be used by all applications
in the system and in the user interfaces of the system (Myerson, 2001, Nilsson, et al. , 1990).
Stage 4 is the convergent, in which technology and knowledge, process and performance are
integrated (Myerson, 2001, Nilsson, et al., 1990). This paper is concerned on achieving this
stage in BIM and IBS integration.
Literature
The literature reveals that there have been few attempts trying to integrate BIM and IBS for
different purposes. Namini, Meynagh and Vahed (2012) examined the integration from
design perspective. The study aims to generate Industry Foundation Class standards for IBS
components to be suitable for integration with BIM application. The study results show that
among IBS Classification that the most suitable IBS categories could be integrated is Planar
or Panel system (Namini et al., 2012). Although the study did not investigate the
consequences of integration on site productivity, it rather identifies the limitation of the BIM
model when integrated with IBS. On the other hand, other researcher considers the
integration very beneficial to improve one of the main challenges of IBS i.e. the
standardization of its components that attribute to low site productivity. A recent study by
Isaac, Bock and Stoliar (2016) examines the opportunity to overcome this problem aided by
BIM through the use of a graph-based analysis that decomposes the design into nonstandard
modules. The module components should have common replacement rates and a restricted
number of connections to each other. In order to achieve the optimum definition of the
module, a clustering algorithm applied on the design data extracted from BIM (Isaac, Bock
and Stoliar, 2016). The previous two researchers attempt to utilize BIM technology as a tool
for better engineering efficiency. However, the research did not emphasize the importance of
the integration during the construction phase.
The aim of this paper is to investigate the feasibility and opportunity offered by integrating
BIM and IBS for enhancing on-site productivity. The literature reveals that few studies
examine the two technologies together during the construction phase. A study conducted by
Xie, Shi and Issa (2010) examine the opportunity of reducing the project schedule through
improving the efficiency of the process of the project life cycle. The study proposed a
framework that integrates the Radio-frequency identification (RFID) and BIM model to
improve engineering, manufacturing, installation through more detailed consideration of
alternative design that reduces the efforts required for the installation process (Xie, Shi and
Issa, 2010). However, the research was specific to one type of structure i.e. steel structure
beams or columns. Thus, there is a little evidence that confirm the results on other type of
structures. Another study conducted by Rausch (2016) aimed to improve productivity in the
construction phase, the research utilizes BIM model to improve the definition of the module
components and accordingly facilitate the assembly process at site and reduce the rework and
idle time in site (Rausch et al., 2016). The researcher proposed an assembly plan for modular
components that could help in reducing the geometric deviation assembly type (Rausch et al.,
2016). Although the later research utilize BIM model differently from the former, the study
was also limited to only one type of deviation and the results were verified through a single
case study.

651
The review above allows three general observations. First, despite the previous studies that
evaluate different construction technology, utilizing the BIM model and integrating with IBS
technology has not been studied together sufficiently in the last ten years to improve site
productivity. Second, the framework proposed in previous research is presented in generic
terms with little explanation about the type of construction projects. Third, there has been
little or no in depth examination exploring the opportunity of utilize a BIM model to solve
IBS problems in transportation and installation.
3. METHODOLOGY
This research is at its early stage. Thus the adopted approach in this paper is based firstly, on
the analysis of the recent published studies investigating productivity growth, BIM, and IBS
in construction projects. Secondly, the research develops a conceptual framework for
integrating BIM and IBS using the ‘systems of systems’ theory. In order to explore the
feasibility and opportunities of integrating these two systems in construction projects, four
semi-structured pilot interviews were conducted with personnel from the industry. Two of the
interviewees were a senior engineer and a project manager in consultancy companies and two
interviewees were project managers in contractor companies. A peer review method was
employed in this study, in which six invitations for an interview were submitted to in-house
personnel and colleagues in the industry to participate. Due to the exploratory nature of this
study, the selection of interviewees was based on two main factors: the interest from the
respondent to be involved in an interview and their experience in BIM-IBS aspects of
construction projects. The interview questions focused on two main areas which were: (a)
productivity related issues and; (b) the drivers, opportunities and implications of integrated
BIM & IBS to derive a hybrid system that could improve construction productivity. The
qualitative data obtained from the interviews were analysed through content analysis, key
data were recorded, coded and categorized into key themes to help identify similar and
different consultant and contractors opinions.
4. RESULTS
4.1. Rationale and Benefits of Integrating BIM-IBS
As emphasized in section 2.1, there are several factors attribute to slow productivity in the
construction phase such as material control, site orientation, environmental conditions and
logistics. There has been few evidence confirm the possibility of solving some of these
factors through utilizing IBS system and BIM technology separately (Table 1) (Abdullah and
Egbu, 2010, Azhar, Lukkad and Ahmad, 2012).
Table (1) BIM and IBS Potential to improve productivity Factors
Impact on
Productivity
BIM
Potential
IBS
Potential
References
Design error (Abdel-Wahab, 2008, CEFRIO, 2011, Ibbs, 2015, Teo et
al., 2015, Naoum, 2016)
Quality of work
executed (Abdel-Wahab, 2008, CEFRIO, 2011, Ibbs, 2015, Teo et
al., 2015, Ai et al., 2016, Naoum, 2016)
Site overcrowding (Abdel-Wahab, 2008, Chelson, 2010, Statistics New
Zealand, 2012, Yi and Chan, 2014, Ma, Liu and Mills,
2016, Naoum, 2016)

652
Complexity of site
works (Chan, 2002, Kuykendall, 2007, Abdel-Wahab et al.,
2008, Ibbs, 2015, Naoum, 2016)
Environmental
conditions&
Project location
(Abdel-Wahab, 2008, Ailabouni and Gidado, 2009, The
Modular Building Institute, 2010, Vernikos et al., 2013,
Yi and Chan, 2014, Ibbs, 2015)
Inefficient
Planning The Modular Building Institute, 2010, Poirier, Staub-
French and Forgues, 2015, Teo et al., 2015)
Coordination of
Subcontractors (Chelson, 2010, The Modular Building Institute, 2010,
Statistics New Zealand, 2012, Ibbs, 2015, Naoum, 2016)
The technology has the potential to improve the factor little evidence that the technology could improve
the factor
As mentioned in the above table, BIM and IBS technology has the potential to improve
productivity separately in some areas. However, the gaps identified in the above literature are
that there has been little research attempts to utilize the advantages of the two technologies to
achieve optimum productivity growth. The first contribution of knowledge for this paper is to
examine the possibility of achieving maximum productivity improvement as an outcome of
integrating both technologies. Figure 1 presents an overview about the areas in which the
integration of two technologies could be feasible.
Figure 22: Potential BIM and IBS areas to optimise productivity in construction process
Despite the potential of the two technologies to impact on construction productivity, few
studies emphasize challenges in implementing those technologies in the construction phase.
Modular buildings require intensive planning for activities throughout the project cycle.
Problems related to manufacturing, lifting, logistics (which includes: transportation
regulation, arrangements with respect to modulus dimension, size, weight, height,
coordination, permits for oversized module components) and connecting the modular
components with site activities are one of the challenges that face contractors who use IBS.
Lack of knowledge of IBS technology could attribute to improper structural analysis of
modular components resulting in improper assembly during the installation phase.
Coordination of modular design, material supply schedule is another obstacle that hinders
IBS implementation. Due to the standardized of IBS components, issues such as low interface
tolerances in between two components, interfaces between new and in situ components are
likely to occur (Jabar, Ismail and Mustafa, 2013). Based on the literature, use of a BIM model

653
could have the potential to enhance some of IBS challenges during the construction phase and
improve productivity. However, there has been little evidence to confirm the results. The
second area of contribution of knowledge for this paper is to illustrate the feasibility of
integrating BIM to IBS and areas that could require integration for productivity improvement
to enhance the negativity of each technology when it works separately and eventually better
productivity growth at project level, as illustrated in Figure 2 below.
Figure 2: Identification of potential for Integration BIM and IBS technologies
4.2 Interview Results
Productivity: Findings from the interviews suggest that from a consultant’s perspective, there
are factors attributed to loss of productivity such as less site control, lack of supervision,
inaccurate planning through the use of inadequate productivity standards, environmental
conditions, material control and management. However, from contractor’s perspective,
factors that affect productivity include: insufficient or lack of material control; lack of
construction equipment maintenance; changes in scope of work; imposed restrictions to site
activities (e.g. hot work permits); climate and weather conditions; delays due to coordination
between subcontractors as well as interfaces between stakeholders and authorities.
Integration: With regards to BIM and IBS drivers and the feasibility of integration, both
consultants and contractors agree that system integration could be considered if there is a
specific problem that cannot be solved using each system separately. However, the
discussions revealed some questions as well as examples of how such integration could be
achieved. An example of an emergent question is, whether integration could provide different
scenarios for construction in cases where limited IBS components tolerances are difficult to
achieve or where unexpected construction errors might exist. In this case, it is clear that BIM
has the advantage of considering different construction schemes and risks of variation of IBS
components orientation during construction phase, whereas IBS on its own does not have
such capability. Further, the respondents thought that BIM could assist in optimizing the
number of modules required to achieve the minimum number of IBS-based connections on

654
site and this could lead to reduction in number of site activities. Also, unlike IBS-based
processes, BIM is a powerful mechanism for collaboration between project stakeholders, thus
issues like: testing different design options at earlier stage of the project; accessing the project
information; and taking decisions on the best design options are areas that could improve
productivity at site. Finally, the respondents argue that BIM could have the potential to assist
in solving interface issues of IBS with onsite works through of adequate and controlled
management and planning system.
4.3 BIM and IBS Integration Model
System integration is melding two technologies, human performance and process together to
achieve a specific task and functioning all together as one system (Myerson, 2001). Thus
establishing a roadmap that provides step by step implementation of BIM- IBS integration as
two systems is crucial as shown in Figure 3 below
Figure 3: BIM-IBS implementation roadmap
5. DISCUSSION
Waste reduction and improved efficiency are required in order to help address the slowed
growth in construction productivity as shown by CIOB (2016), which has seen only 7%
improvement over the last two decade (Rhodes, 2015, CIOB, 2016). The key factors and

655
technologies that can be attributed to the issue of construction productivity have been
examined and a novel solution that could enhance productivity requires integration of two
essential systems (BIM and IBS). The systems thinking approach adopted for this integration
provides a holistic way of understanding the advantages and implications of merging both
systems via their technologies, process and users in construction processes. The feasibility of
integrating BIM and IBS systems has been demonstrated in literature (Namini, et al. 2012)
but there has been a lack of perspective on ‘how’ to use the merged system to improve site-
based productivity. Based on the interview data collected from consultants and contractors,
some examples of scenarios where integrating BIM and IBS could be beneficial include: (a)
dealing with limited tolerances and unexpected construction errors in IBS by using BIM's
capability for appraising different construction schemes including the risks associated with
variations; (b) using BIM's 3D and data-driven capabilities to resolve interface issues
between IBS components (c) reducing the volume of site activities by optimizing the number
of modules required to achieve IBS-based connections; (d) using BIM's collaboration
framework to harmonise the participation of project stakeholder.
It is clear from the scenarios described by both consultants and contractors that there are
opportunities for integrating both systems. One explanation for the fact that such
opportunities are largely unexplored is that BIM is mostly seen as a process (e.g. Karan et al.,
2015) and driven from a technology perspective (e.g. Teo et al., 2015) and rarely from a
whole ‘systems’ perspective (WSP, 2013). This is with the exception of when the ‘systems’
in BIM refer to the architectural, structural or mechanical systems, which are just sub-sets of
the entire ‘BIM system’. Literature suggests that the entire process and technology aspects of
BIM qualify it to be a system, albeit a socio-technical system (WSP, 2013). The socio-
technical nature of BIM lends itself to system integration which, according to Myerson,
requires the fusion of different technologies, human performance and process that will
function together and solve a problem as single system (Myerson, 2001). Consequently, the
two frameworks developed in this study explore these potential areas where integration of
both systems could be achieved. In addition, a preliminary road map for implementing the
integration is proposed. However, evidence from the pilot interview respondents revealed that
there are several risks associated with introducing a new system or paradigm to construction
projects. Such risks will also be investigated.
6. CONCLUSION
This paper emphasizes the benefits of integrating two technologies BIM and IBS as two
systems to improve construction productivity. A framework was used to illustrate the
feasibility of integration using a systems thinking approach. This was followed by a road map
describing the sequences and steps required for successful implementation of a BIM-IBS
integrated system for the construction industry. This roadmap could provide some constructs
to enable professionals in the industry to explore the feasibility and opportunities of
integrating BIM to IBS. Further work is required to: (a) identify the risks of introducing
systems integration to construction projects; and (b) develop a risk management strategy. The
scope of this study has been limited mainly to infrastructure projects for the sake of clarity in
understanding the factors and process of integration. The methods used were also based on a
limited (pilot) number of interviews from professionals in the industry and more interviews
(data) will be required to validate the integration framework and the road map proposed.

656
This research is still in its early stages. Thus the direction of future research is towards
tailoring and verifying the framework and the road map presented.
7. REFERENCES
ABDEL-WAHAB, M.S., 2008. An examination of the relationship between skills development and productivity
in the construction industry. [online]. Loughborough. Available from: https://dspace.lboro.ac.uk/2134/4658.
ABDEL-WAHAB, M.S., DAINTY, A.R.J., ISON, S.G., BOWEN, P., and HAZLEHURST, G., 2008. Trends of
skills and productivity in the UK construction industry. Engineering, Construction and Architectural
Management. 15, pp. 372–382.
ABDULLAH, M.R. and EGBU, C., 2010. Selection criteria framework for choosing industrialized building
system for housing projects. Procs 26th Annual ARCOM Confernece. (September), pp. 1131–1139.
AI, E., TEO, L., HONS, B., and QS, D., 2016. Brie fi ng : Determining productivity and safety indices using
BIM. 169, pp. 143–144.
AILABOUNI, N. and GIDADO, K., 2009. Evaluation of Factors Affecting Productivity in the UAE
Construction Industry : Regression Models. Group. pp. 131–142.
ARNOLD, R.D. and WADE, J.P., 2015. A definition of systems thinking: A systems approach. Procedia
Computer Science [online]. 44 (C), pp. 669–678. Available from:
http://dx.doi.org/10.1016/j.procs.2015.03.050.
AZHAR, S., LUKKAD, M., and AHMAD, I., 2012. Modular v. stick-built construction: Identification of
critical decision-making factors. 48th Annual Conference of Associated Schools of Construction [online].
(May), p. 8. Available from: http://ascpro0.ascweb.org/archives/cd/2012/paper/CPRT202002012.pdf.
CEFRIO, 2011. Improving Efficiency and Productivity in the Construction Sector Through the Use of
Information Technologies [online]. Cefrio. Quebec. Available from:
http://www.cefrio.qc.ca/media/uploader/Improving_efficiency_and_productivity_in_the_construction_secto
r_final.pdf.
CHAN, P., 2002. Factors affecting labour productivity in the construction industry. Construction Management
[online]. 2 (September), pp. 791–800. Available from: http://www.arcom.ac.uk/-docs/proceedings/ar2002-
771-780_Chan.pdf.
CHELSON, D.E., 2010. The effects of building information modeling on construction site productivity.
[online]. p. 3. Available from:
http://drum.lib.umd.edu/bitstream/1903/10787/1/Chelson_umd_0117E_11427.pdf.
CIOB, 2016. Productivity in Construction : Creating a Framework [online]. Bracknell. Available from:
WWW.CIOB.org.
DAVIES, R. and HARTY, C., 2012. Control, surveillance and the ‘dark side’ of BIM. Association of
Researchers in Construction Management, ARCOM 2012 - Proceedings of the 28th Annual Conference
[online]. 1 (September 2012), pp. 23–32. Available from: http://www.scopus.com/inward/record.url?eid=2-
s2.0-84911434507&partnerID=40&md5=97c637e62bffcdaf6a4f17b81127c7c3.
HOUSER, P., 2011. Best Practices for Systems Integration [online]. Available from:
www.dtic.mil/ndia/2011/system/13007_HouserThursday.pdf.
IBBS, W., 2015. Change and the Loss of Productivity in Construction: A Field Guide [online]. Available from:
http://www.theibbsconsultinggroup.com/uploads/Changes_Field_Guide_Feb_2015.pdf.
ISAAC, S., BOCK, T., and STOLIAR, Y., 2016. Automation in Construction A methodology for the optimal
modularization of building design ☆. Automation in Construction [online]. 65, pp. 116–124. Available
from: http://dx.doi.org/10.1016/j.autcon.2015.12.017.
KARAN, E.P., IRIZARRY, J., ASCE, M., and HAYMAKER, J., 2015. BIM and GIS Integration and
Interoperability Based on Semantic Web Technology. Journal of Computing in Civil Engineering. 30 (3),
pp. 1–11.
KUYKENDALL, C.J.O., 2007. Key Factors Affecting Labor Productivity in the Construction. Master Thesis,
university of Florida.
MA, L., LIU, C., and MILLS, A., 2016. Construction labor productivity convergence: a conditional frontier
approach. Engineering, Construction and Architectural Management. 23 (3), pp. 283–301.
MOURTZIS, D., FOTIA, S., GAMITO, M., NEVES-SILVA, R., CORREIA, A., SPINDLER, P., PEZZOTTA,
G., and ROSSI, M., 2016. PSS Design Considering Feedback from the Entire Product-service Lifecycle and
Social Media. Procedia CIRP [online]. 47, pp. 156–161. Available from:
http://dx.doi.org/10.1016/j.procir.2016.03.092.

657
NAMINI, S., HASSANABADI, M., VAHED, Y., and MEYNAGH, M., 2012. Prioritization of Industrialized
Building System Components for BIM Applications. Ipedr.Com [online]. (Iccpm), pp. 128–132. Available
from: http://www.ipedr.com/vol45/026-ICMTS2012-M00026.pdf.
NAMINI, S.B., MEYNAGH, M.M., and VAHED, Y.K., 2012. Developing IFC Standards for Implementing
Industrialized Building System Components into BIM Applications. Proceedings of 2012 International
Conference on Construction and Project Management (ICCPM 2012), Dubai, 4-5 August, 2012 [online].
pp. 133–137. Available from: http://connection.ebscohost.com/c/articles/83377030/developing-ifc-
standards-implementing-industrialized-building-system-components-bim-applications.
NAOUM, S.G.N., 2016. Factors influencing labor productivity on construction sites. International Journal of
Productivity and Performance Management. 65 (3), pp. 401–421.
NILSSON, E.G., NORDHAGEN, E.K., and OFTEDAL, G., 1990. Aspects of systems integration. Systems
Integration, 1990. Systems Integration ’90., Proceedings of the First International Conference on. 0, pp.
434–443.
PEKURI, A., HAAPASALO, H., and HERRALA, M., 2011. Productivity and Performance Management –
Managerial Practices in the Construction Industry. International Journal of Performance Measurement. 1,
pp. 39–58.
POIRIER, E. a., STAUB-FRENCH, S., and FORGUES, D., 2015. Measuring the impact of BIM on labor
productivity in a small specialty contracting enterprise through action-research. Automation in Construction
[online]. 58, pp. 74–84. Available from: http://dx.doi.org/10.1016/j.autcon.2015.07.002.
PWC, 2016. UK Economic Outlook. PWC [online]. (July), pp. 1–40. Available from:
http://www.pwc.co.uk/en_uk/uk/assets/pdf/ukeo-jul2015.pdf.
RAUSCH, C., NAHANGI, M., PERREAULT, M., HAAS, C.T., and WEST, J., 2016. Optimum Assembly
Planning for Modular Construction Components. Journal of Computing in Civil Engineering. p. 4016039.
RHODES, C., 2015. Construction Industry: Statistics and policy. House of Commons Library. (1432), pp. 1–13.
STATISTICS NEW ZEALAND, 2012. Comparing approaches to compiling macro and micro productivity
measures using Statistics New Zealand data [online]. Available from: http://www.nzae.org.nz/wp-
content/uploads/2012/07/Mai-Warmke-comparing-approaches-to-compiling-macro-and-micro-productivity-
measures.pdf.
TEO, E.A.L., OFORI, G., TJANDRA, I.K., and KIM, H., 2015. The Potential of Building Information
Modelling (BIM) for Improving Productivity in Singapore Construction. Raidén, A B and Aboagye-Nimo, E
(Eds) Procs 31st Annual ARCOM Conference. (September), pp. 661–670.
THE MODULAR BUILDING INSTITUTE, 2010. Improving Construction Efficiency & Productivity with
Modular Construction [online]. Charlottesville. Available from:
www.modular.org/marketing/.../Whitepaper_ImprovingConstructionEfficiency.pdf.
TRIKHA, D. N., & ALI, A.A., 2004. Industrialised building systems. Universiti Putra Malaysia Press.
VERNIKOS, V.K.., GOODIER, C.I.., BROYD, T.W.., ROBERY, P.C.., and GIBB, A.G.F.., 2014. Building
information modelling and its effect on off-site construction in UK civil engineering. Proceedings of
Institution of Civil Engineers: Management, Procurement and Law [online]. 167 (3), pp. 152–159.
Available from: http://www.scopus.com/inward/record.url?eid=2-s2.0-
84931465483&partnerID=40&md5=48e1e49247e65ecc2d55468428be4f54.
VERNIKOS, V.K., NELSON, R., GOODIER, C.I., and ROBERY, P.C., 2013. IMPLEMENTING AN
OFFSITE CONSTRUCTION STRATEGY : A UK CONTRACTING ORGANISATION CASE STUDY.
[online]. (September), pp. 667–677. Available from: http://www.arcom.ac.uk/-docs/proceedings/ar2013-
0667-0677_Vernikos_Nelson_Goodier_Robery.pdf.
XIE, H., SHI, W., and ISSA, R., 2010. Implementation of BIM/RFID in computer-aided design-manufacturing-
installation process. 3rd IEEE International Conference on Computer Science and Information Technology
(ICCSIT) [online]. pp. 107–111. Available from:
http://ieeexplore.ieee.org/xpls/abs_all.jsp?arnumber=5563653.
YI, W. and CHAN, a P.C., 2014. Critical review of labor productivity research in construction journals. Journal
of management in engineering. 30 (2), pp. 214–225.

658
ID 131
THE HOUSE BUILDING SECTOR: ARE CUSTOMERS CORE TO THE
HOUSE BUILDING PROCESS OR JUST AN INCONVENIENCE?
C. Boothman1, and N. Craig2.
1 School of Engineering; University of Central Lancashire, Preston UK. 2School of Engineering and Built Environment, Glasgow Caledonian University, Glasgow UK
Email: [email protected]
Abstract: In 2005 the Home Builders Federation (HBF) developed a strategy to improve the
overall level of customer satisfaction within house building in the UK. This was developed as
a direct result of the findings of the Barker review (2004), which demanded that the sector
improve its approach to customer satisfaction. This research examines how house builders use
the data collected by the HBF to improve the service provided to the customers, the transition
of any changes into practice and the overall management of the customer satisfaction process
at all levels within the house builder's organisation. In order to explore how this data is utilised
in practice, the changes implemented by senior/site management to improve the customer
satisfaction and the transition of these changes to the sales, customer care and aftercare teams,
ten semi structured in depth interviews have been carried out. Analysis of the exploratory data
reveals a palpable divide between senior/site management and the sales and aftercare services
provided by the developers. The research concluded that until developers address this apparent
disconnect and make a paradigm shift to completely embrace customer satisfaction and
customer care the overall service is unlikely to advance.
Keywords: Customer Care, Customer Satisfaction, Defects, Housing, Quality.
1. INTRODUCTION
For more than two decades the construction industry as has seen an unremitting furor from
the government and homeowners alike to improve the quality of new homes built by the
private house-building sector in the UK. As a direct result of the findings of the
Mori/Constructing Excellence annual surveys completed between 2000 and 2003 and the
Barker Review of Housing (2004) the National House Building Council (NHBC) in
partnership with the HBF introduced a national survey of house builders, which launched in
2005 as a self-completion survey to the purchasers of new build homes at both eight weeks
and nine months following legal completion. The annual survey is funded by the NHBC and
the HBF undertake this survey on behalf of the NHBC. However, it should be noted that the
members of the HBF (the house builders) are the same house builders that are registered with
NHBC and therefore it may be argued that there is no separation between the two
organisations or indeed the survey undertaken.
The results of the eight week (after taking ownership and moving in to the property) customer
satisfaction surveys completed by the purchases of new homes over the past twelve years
indicate that there has been a steady improvement in customer satisfaction across the sector,
as commanded by Barker albeit the target of 85% for service quality was not met until 2010
and has only managed to exceed the target set for two of the twelve reported years (2012,
2013) for the “overall service provided”. The target of at least 85% still needs to be achieved
for the “after sales service” provided by the builders to their customers. With the increase in
demand for new homes and a decrease in both NHBC new home registrations and

659
completions over the twelve years the HBF Customer Satisfaction survey results published
include a limited sample of the data collected from the eight week (not the nine month)
customer satisfaction survey of new homeowners in the UK.
This study builds on previous work that explored how the senior management use the data
collected by the NHBC to improve the service provided to the customers and the transition of
any changes into practice within the developer’s organisations. This paper seeks to
investigate how the data collected from the NHBC is used by the house builders to improve
the “overall service” (sales, aftercare services or customer care) provided to the customers
and the transition of any changes into practice implemented by the house builders
management team.
2. THE LITERATURE
2.1 Quality and House the Building Sector
Historically one of the most perplexing issues facing organisations in the construction
industry is their inability to become quality focused, which is resulting in a substandard
product or service (Love et al 1999). During the course of the last seventeen years following
the findings of the Mori surveys (2000-2003), the HBF surveys (2005-2017), Barker (2004),
the OFT (2007) and the APPG (2016), house building organisations have been more focused
on managing quality as an attempt to improve their overall performance and competitiveness
within the sector and thus has received a considerable amount of attention.
The principles of good quality in the house-building sector are encapsulated in legislation and
standards such as the Building Regulations and NHBC Standards and it must be remembered
that speculative developers will not respond unless it is imposed by regulations (Watts 2007).
The volume of research specifically related, to the new speculative house building sector of
the construction industry, is remarkably scant given the size of the industry sector and its
overall contribution towards the construction industry. This research includes Bentley (1981),
Bonshor and Harrison (1982), BRE (1988) and Harrison, (1993) which all focuses
predominantly on regulatory defects i.e. contraventions to either building regulations or the
warranty providers’ standards. Auchterlounie and Hinks, (2001) suggest that the rest of the
construction industry view house building as second division and private housing being lower
than social housing with little literature regarding private house building and so little to
measure quality against. It must be noted that the granting of a Local Authority Building
control (LABC) “habitation certificate”, a “final certificate” if the building control body is an
approved inspectors (AI) or an NHBC “completion certificate” is not an assurance that the
new home is of the required quality levels expected by the home buyer as the LABC, AI or
the NHBC standards departments also have no control over many of the fixtures and fittings
within a new home that are often the cause of many complaints, as these are not controlled or
specified within current building standards or regulations within the UK.
Numerous academics and practitioners have researched defects, snagging, quality and rework
within the UK house building industry including Sommerville and McCosh (2006),
Sommerville et al (2006), Craig (2007), Sommerville (2008), Auchterlounie (2009) and
Rotimi et al (2014) with the majority of these focusing on defects in terms of numbers
created. It is generally acknowledged that the number of defects at the completion or
handover stage (completion of the end-product) of a building appears to have a positive or
negative influence on the satisfaction of the client or customer, however over the last two

660
decades the construction industry has become obsessed with the attainment of quality through
the measurement and use of defects as a proxy. This is demonstrated by Craig et al (2010)
whose research analysed over 199,000 defects related to technical and functional quality and
established the issues and problems associated with snagging and the house-building sector.
Prior to the introduction of quality assurance (ISO9000 & 9001), the primary measure of
quality was the finished product and in the private house building sector the finished product
is still the end indicator of overall quality although the house building sector has been
inherently slow to adopt the principles of ISO 9000/1 whilst one of the main
recommendations of the APPG report (2016) was that house builders should’ instigate a new
quality culture by adopting quality systems to ISO standards’. Macdonald & Piggott (1990)
state that the 'customer's perception of quality includes more than the satisfaction obtained
from the primary product or service, quality is delighting the customer by continuously
meeting and improving upon the agreed requirements'. Furthermore Forsythe (2015)
emphasizes that the tone of the quality debate has gradually shifted from a predominantly
supply-side perspective of quality, to one that increasingly aims to deliver customer value,
service and satisfaction. The overall problem is that quality is a subjective issue and
positively correlates with overall customer satisfaction. Craig et al (2010) indicate that the
customer is “perceived simply as a buyer who purchases the final product and as the
“customer” they have no control over the finished product or the quality of the product”.
2.2 Customer Satisfaction in the House Building Sector
Stephenson & Carrick (2006) comment that the purchase of a house is likely to be the largest
single investment an individual/family may make and the industry is facing a more informed
client. They further suggest that the construction industry still has a poor reputation and
image with regards to house building, customers are becoming increasingly more aware and
savvy and this has forced the industry to review the way it views the customer or home buyer.
Dulaimi (2004) suggests that the emergence of the customer as the champion for change has
increased the pressure on the construction industry to provide the higher quality and better
service to satisfy customer needs and expectations.
Karna and Sorvala (2004) postulate that customer satisfaction can be seen as either a goal or a
measurement tool to aid in the development of quality within the construction industry. The
literature indicates that there is no commonly accepted method of measuring customer
satisfaction in the construction industry (Auchterlounie and Hinks 2001) and it has been
acknowledged that customer satisfaction has become an essential part of performance criteria
in the construction sector, particularly house-building. Satisfaction can be viewed as a post
purchase affect and its measurement therefore naturally reactive. The heart of the satisfaction
process is the comparison of what is expected with the product or service performance, which
Vavra (1997) describes as the confirmation or disconfirmation process. Furthermore
customer satisfaction can be determined by either subjective (e.g. customer needs, emotions)
or objective factors (e. g. product and service) (Oduro 2012).
The constant media attention on defects, the resulting quality issues in new homes ensures
that the issue continues to be a subject of popular debate. Many prospective house buyers
deem they are investing in top quality housing developments only to move into their new
home and discover it is riddled with faults. The negative manner in which the problem of
quality and customer satisfaction has been reported over the years (Kelly, 1998; Dyson, 2004;

661
Barrie, 2006; Linning 2015) is an indication that the house building industry has done little to
address ‘customer issues’ within the new homes arena as customers still feel that the quality
standards that have been achieved are low and not to their overall satisfaction.
2.2 NHBC/HBF Customer Satisfaction Surveys
For more than two decades the construction industry as has seen an continuous tumult from
the government and homeowners alike to improve the quality of new homes and as a result of
the findings of the Mori/Constructing Excellence surveys (2000- 2003) and the Barker
Review of housing in 2004 the HBF in partnership with the NHBC introduced a national
survey of house builders, which launched in 2005 as a self-completion survey to the
purchasers of new build homes at both eight weeks and nine months after legal completion.
Figure 1 highlights the results collected and reported by the surveys undertaken since 2000.
It was expected from the launch date that the overall “service quality” would significantly
improve and rise from 65% to at least 85% by 2007.
Figure 1: Levels of Quality & Service Provided 2000 – 2017 (adapted from Constructing
Excellence 2000, 2001,2003 and the HBF 2006-2017).
The target of 85% was not met until 2010 for the “overall service provided” and has still to be
met for the “after sales service” the builders provide to their customers, which both
demonstrate a downward trend as the number of NHBC registration and completions rise.
Heath’s (2014) findings following “The Barker review” a decade on state that all the three
levels highlighted within the Barker’s review are still to be achieved and the last decade may
have been a lost one in terms of the service quality provided to the customers.
40
50
60
70
80
90
100
110
Cu
sto
me
rS
ati
sfa
ctio
n%
YearSurveyPublished
OverallQualityofNewHome
OverallDefectsorSnagging
QualityofFinish
OverallServiceProvided
ConditionofNewHome
AfterSalesService
RecommendtheBuilder

662
Further analysis of the published results indicates that there has been a steady improvement
across the sector as commanded by the Barker review 2004. Taking into account all the four
aspects that determine the “quality of a home” the data displays an upward trend in customers
reporting defects or snagging, this rising significantly and remaining over 90% reaching an
all-time high of 98% in 2017 and downward trends in the “quality of the finish”, “condition
of the new home” and “quality of the new home” which, all significantly reduce until 2006
and then fluctuate for a three year period until a sharp improvement in 2010 which was
throughout the years when a significantly lower number of homes were completed and
registered with the NHBC. This comes as no surprise as the number of registrations fall the
reported results improve, as the number of registrations was significantly lower than the
200,700 registrations in 2007, which further reduced in 2008 to 106,900 and bottomed out in
2009 with 88,080 registrations. However as the number of registrations started to rise to
146,359 in 2014, 156,140 in 2015 and 153,430 in 2016 the recorded results decline to the
lowest levels since 2009, hence the published figures illustrate that as the number of
completions and registrations increase the overall quality, service and customer satisfaction
levels are reducing and the overall defects and snagging are increasing.
The literature reveals that the construction industry and specifically the housing market
predominately concentrate on defects as an indication of quality when considering customer
satisfaction. Albeit the HBF/NHBC customer satisfaction completed over the twelve-year
period demonstrates that the house-building sector met some of the improvements
commanded by Barker there are other improvements that have still to be met. None of the
academic or practice lead research undertaken to date has explored how the data collected by
the HBF is used in practice to improve the “overall service” (sales, aftercare services or
customer care) provided to the customers or the transition of any changes into practice
implemented by the house builders management team.
3. RESEARCH DESIGN
The research reported in this paper sought to explore how the data collected by the NHBC is
used in practice by speculative house builders to (i) improve the overall service (sales,
aftercare services or customer care) provided to the customers (ii) the transition of any
changes into practice resulting from the data received following the satisfaction surveys and
(iii) the overall management of the customer satisfaction process by the house builder(s).
To meet the objectives of the study, a qualitative research approach was implemented with
semi-structured interviews used to collect data from a range of developers within the North
West of England (small, medium and large). The criteria for the size of the house builder is
based on the total number of units built per annum with the small <500, Medium >500 but <
2500 and the large builder >2501 units per year. This approach is supported by Creswell
(2009) who states that it is an unfolding model that occurs in a natural setting that enables the
researcher to develop a level of detail from high involvement in the actual experiences,
allowing the researchers to gather data for the social phenomenon being investigated from the
participant’s viewpoint (a Phenomenological Study).
To ensure reliability with the data collection the interview sample was selected using
'discriminate sampling' to maximise the chances of collecting relevant data from a small
sample. A total of ten developers/house builders (selected from “Buildings” top 25 list of
house builders) were identified within the North West (NW) of England who have been

663
involved with all HBF customer satisfaction surveys published to date (2003–2017). Initially
invitation emails were sent to the top ten NW house builders outlining the purpose and
background of the study and asking them if they would be willing to participate prior to
sending the finally invitation. A total of (4) companies and (10) individuals agreed to
participate in the study as displayed in table 1.
Table 1: Interview Participant profile. Respondent Role Type of organisation
A Sales Consultant Medium Developer
B Sales Manager Medium Developer
C Sales & Customer Care Small Developer
D Sales Consultant Large Developer
E Customer Care Advisor Large Developer
F Sales Manager Large Developer
G Sales Manager Large Developer
H Sales Consultant Small Developer
J Aftercare Team Medium Developer
K Sales Consultant Small Developer
Each of the participants was invited to take part in a 30 - 45 minutes face-to-face interview,
held at their offices between October 2015 and April 2016. The interviews were transcribed
before being thematically analysed based on a theoretical framework developed from the
researchers’ previous analysis of the NHBC customer satisfaction surveys.
4. RESULTS
4.1 Improvements to the Service Provided to the Customer
The initial area explored during the interviews sought to determine how the differing sizes of
builder/developers manage the service provided to the customers both post and pre legal
completion.
The sales consultants/executive from both the large and medium size developers all indicated
that the service provided is in line with either the developer’s policies or the seven-step
training they received from an independent recruitment company who specialises in training
sales consultants for the house-building sector. The data revealed that the various developers
are very focussed on the service they provide to the customer and are aware of the importance
of the results of the NHBC customer satisfaction survey results and the impact that it can
have on the company’s future ales and success in the sector. The data revealed that the
builders concentrate on the seven areas that make up the quality and the service provided
elements of the satisfaction questionnaire (see figure 1) will all the interviewees agreeing that
customer satisfaction is the number one priority.
The interviews revealed that the large builder concentrates on all aspects of the service they
provide to the customer both pre and post legal completion until the new home owner is
happy with their new home;
“Within reason we just give the customer what they want. If it’s in the lead up to the eight
weeks NHBC survey it becomes a priority for the aftercare team to ensure that we get a
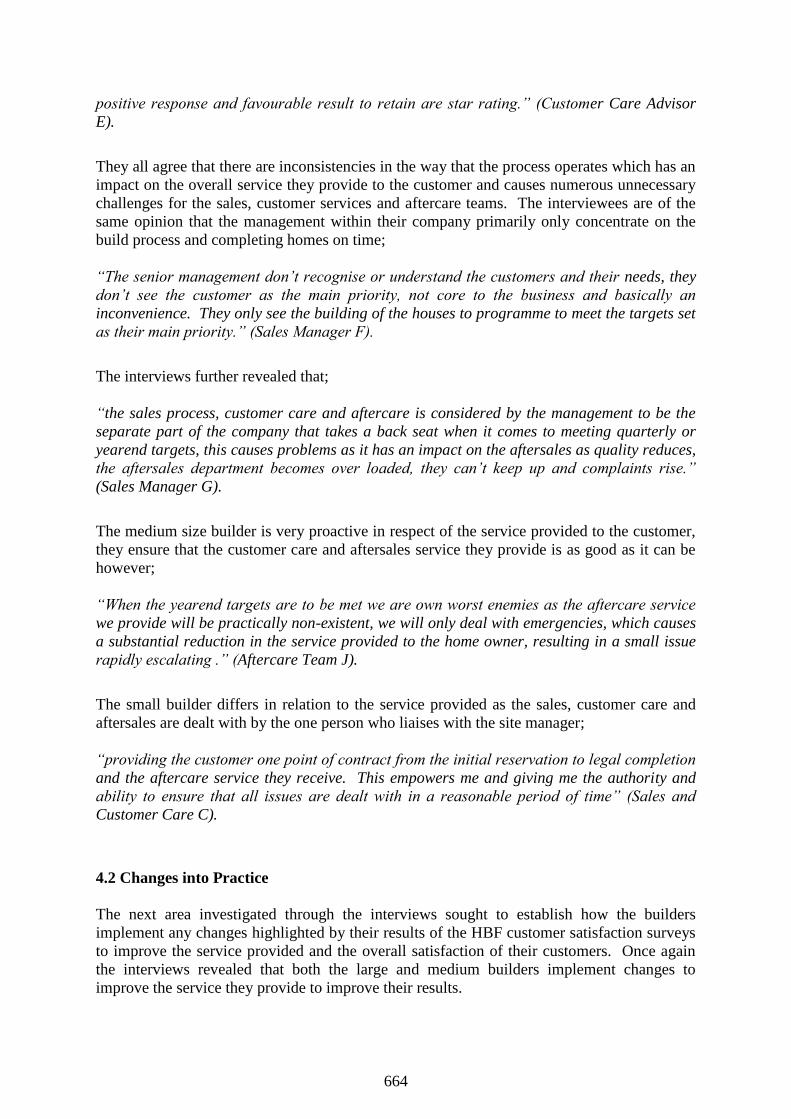
664
positive response and favourable result to retain are star rating.” (Customer Care Advisor
E).
They all agree that there are inconsistencies in the way that the process operates which has an
impact on the overall service they provide to the customer and causes numerous unnecessary
challenges for the sales, customer services and aftercare teams. The interviewees are of the
same opinion that the management within their company primarily only concentrate on the
build process and completing homes on time;
“The senior management don’t recognise or understand the customers and their needs, they
don’t see the customer as the main priority, not core to the business and basically an
inconvenience. They only see the building of the houses to programme to meet the targets set
as their main priority.” (Sales Manager F).
The interviews further revealed that;
“the sales process, customer care and aftercare is considered by the management to be the
separate part of the company that takes a back seat when it comes to meeting quarterly or
yearend targets, this causes problems as it has an impact on the aftersales as quality reduces,
the aftersales department becomes over loaded, they can’t keep up and complaints rise.”
(Sales Manager G).
The medium size builder is very proactive in respect of the service provided to the customer,
they ensure that the customer care and aftersales service they provide is as good as it can be
however;
“When the yearend targets are to be met we are own worst enemies as the aftercare service
we provide will be practically non-existent, we will only deal with emergencies, which causes
a substantial reduction in the service provided to the home owner, resulting in a small issue
rapidly escalating .” (Aftercare Team J).
The small builder differs in relation to the service provided as the sales, customer care and
aftersales are dealt with by the one person who liaises with the site manager;
“providing the customer one point of contract from the initial reservation to legal completion
and the aftercare service they receive. This empowers me and giving me the authority and
ability to ensure that all issues are dealt with in a reasonable period of time” (Sales and
Customer Care C).
4.2 Changes into Practice
The next area investigated through the interviews sought to establish how the builders
implement any changes highlighted by their results of the HBF customer satisfaction surveys
to improve the service provided and the overall satisfaction of their customers. Once again
the interviews revealed that both the large and medium builders implement changes to
improve the service they provide to improve their results.

665
The sales consultants/executives are of the same opinion and agree that they are very
restricted and have no input or influence in any changes implemented within the sales,
aftersales or customer care process. The management team without consultation implements
all the changes as they are precluded from the whole process. Furthermore the consensus of
opinion is that they would be able to improve and ultimately provide a service provided if
they had the opportunity to contribute to the changes made within the developers companies.
4.3 Managing the Customer Satisfaction Process
The final area explored during the interviews revealed that the large developer is more
customer focussed and commercially aware of the importance of the service they provide to
the customers as this directly affects the overall satisfaction of the customer, therefore they
are very proactive in contacting the client over the first two - three weeks through there
dedicated customer services department.
“the aftercare department will contact the client seven and fourteen days after legal
completion to see if they are experiencing any problems or issue since they moved in
enquiring and if the site manager has completed the minor issues highlighted either at the
home induction or issues highlighted within 14 days of legal completion. This allows the
team to arrange for the outstanding issues or defects to be completed, at six weeks they are
again contacted to ensure that all the issues have been completed to their satisfaction.”
(Sales Manager B).
The medium sized developer is not proactive in the follow up service they provide and they
are much more reliant on site staff to rectify issues, which can result in delays to remedy the
outstanding issues this having a negative effect on the company. They employ the same
external company to complete a satisfaction survey providing them with a similar data set as
the large builder, which acts as a trigger point to complete any outstanding issues or defects if
not already complete prior to the customer receiving the eight-week NHBC customer
satisfaction survey.
The interviews further revealed that both the large and medium builders offer a range of
incentives to the staff if they (i) meet the quarterly sales targets, (ii) the overall HBF results
relating to the service provided and customer satisfaction improve or (iii) sales and
completion on star plots (hard to sell plots). The Sales consultants, executive, and sales
managers actively encourage the customers to complete the HBF satisfaction survey,
canvassing the customer in relation to the importance of a favourable outcome for the
“recommend the builder to a friend” question.
5. DISCUSSION
It has been established within the review of the literature that there is a lack of research in
relation to the quality of new build homes within the UK house-building sector. The current
role of the HBF/NHBC surveys proscribes the discussion of the findings of this research
directly with prior work completed within this area. Albeit the previous studies and research
in associated areas identified the major sources and causes of quality issues, whilst this work
is centred on new housing, a full-scale industry wide research effort is required to investigate
the wider issues to provide a wider range of conclusions.

666
As there continues to be a fissure between the customer’s expectations and what the house-
building sector delivers in terms of quality, there is limited evidence that the industry is
responding to the needs and concerns of their customers within the house building sector to
bridge this obvious gap. The various reports produced over the last thirty years, highlighted
the quality issue as an area of concern however this appear to have been ignored or
disregarded by the house builders leaving them and the construction industry open for
comments and investigations.
6. CONCLUSIONS
This paper sought to explore how the data collected by the NHBC is used in practice by
speculative house builders to (i) improve the overall service (sales, aftercare services or
customer care) provided to the customers (ii) the transition of any changes into practice
resulting from the data received following the satisfaction surveys and (iii) the overall
management of the customer satisfaction process by the house builder(s). The literature
revealed that the HBF customer satisfaction survey results demonstrate that the house-
building sector has met some of the improvements commanded by Barker but still need to
meet the others. The results published by the HBF neglect to look at the long-term
satisfaction of the customer, due to the published statistics and figures being solely based on
the eight-week satisfaction survey.
The analysis of the exploratory data provided by the interviews revealed that there is an
apparent disconnect between the senior management team, sales, aftersales and the customer
care departments. The house building industry needs to address this apparent disconnect and
make a paradigm shift to completely embrace customer satisfaction and customer care, if this
is not the case the overall service provided to the new home owners is unlikely to advance.
The recent parliamentary recommendation to make the annual customer satisfaction survey
"independent" should be implemented by central government to collect an unbiased survey
providing a more reliable data set and results for service, quality, and customer satisfaction
for the house-building sector. The surveys currently conducted by the HBF are unlikely to
reflect the true experiences and opinions of the customer as the sales team are actively
encouraged by senior management to try to influence the customers prior to the completing
the NHBC eight-week customer satisfaction survey to attain a favourable outcome for the
survey.
7. REFERENCES
APPG, (2016) All Part Parliamentary Group for excellence in the Built Environment, More Homes Fewer
Complaints, July 2016, House of Commons, London
Auchterlounie, T (2009),"Recurring quality issues in the UK private house building industry”, Structural
Survey, 27 (3) pp. 241 – 251.
Auchterlounie, A. and Hinks, J. (2001) Assessing customer criteria for quality in new housing, first post-
graduate research Conference University of Salford, Manchester.
Barker, K. (2004) Review of Housing Supply, Her Majesty’s Stationery Office, Norwich.
Barrie, J. (2006) House of Horrors, Daily Record and Sunday Mail, Glasgow
Bentley, M.J.C. (1981) Quality control on building sites, Building Research Establishment, Watford.
Bononshor, R.B. and Harrsion, H.W. (1982) Traditional housing: a BRE study of quality, Building Research
Establishment, Watford.
BRE, (1988) Common Defects in low-rise traditional housing, Building Research Establishment, Watford
Curtis, M.D. (2011), New House Owners’ Satisfaction Survey 2011, Building Research Levy, Wellington.

667
Craig, N. Sommerville, J. and Auchterlounie, A. (2010) "Customer satisfaction and snagging in the UK private
house building sector." Proc., 26th Annual ARCOM Conf. Association of Researchers in Construction
Management, Leeds, UK, 2010.
Creswell, J W (2009) "Research Design: Qualitative, quantitative and mixed method approaches" 3ed. London:
Sage Publications.
Dulaimi, M, F. (2004) The challenge of customer orientation in the construction industry. Construction
innovation, Edward Arnold.
Dyson, R. (2004) These houses are defective. I should know I built them, Evening Standard, London.
Forsythe, P. (2015) Monitoring Customer Perceived Service Quality and Satisfaction during the Construction
Process, Construction Economics and Building, 15(1), 19-42.
Harrison, H.W. (1993) Quality in new build housing, Building Research Establishment, Watford.
HBF, (2006-17) New home customer satisfaction, Home Builders Federation, London.
Heath, (2014a) Barker Review a decade on, Home Builders Federation, London.
Housing Forum. (2000-2003) National Customer Satisfaction Survey, Constructing Excellence, London.
Karna, S. and Sorvala, V. (2004) Factor-specific approach to customer satisfaction with construction, CIB
W55/65CIB, Rome.
Kelly, R. (1998) Complaints rise over defects in new houses, Times Newspapers Limited, London.
Linning, S. (2015) The new house from hell! Cracks in the walls, no loft insulation and a £3,000 kitchen
worktop that doesn't fit: Homeowner finds 140 problems with his brand new £580,000 house, Mail Online,
London
Love, P. E. D, Mandal, L, P: Li, H. (1999): Determining the causal structure of rework influences in
construction, Construction Management and Economics, 17:4, 505-517.
Macdonald, J. and Piggott, J. (1990) Global Quality: the new management culture, London, Mercury Books.
Oduro, R. (2012) Factors that determine customer satisfaction level in banking institutions: Evidence from
Ghanaian banking industry, Asian Journal of Business and Management Sciences, Vol 2 No 7 pp 01-13.
Rotimi, F.E., Tookey,J.E. and Rotimi, J.O.B (2015),"Home owners and developers relationships: exploring the
cordiality factor", Structural Survey, Vol. 33 Iss 3 pp. 278 – 292.
Sommerville, J. (2008), “Homebuilding market study”, Office of Fair Trading.
Sommerville, J., Craig, N. and Ambler, V. (2006), “Functional and technical quality in new homes in the UK:
the snagging problem”, paper presented at the COBRA RICS Annual Conference, 7-8 September,
University College, London.
Sommerville, J. and McCosh, J. (2006) Defects in new homes: an analysis of data on 1696 new UK houses,
Journal of Structural Survey, vol. 24, no. 1, pp. 6-21.
Stephenson, P and Carrick, C.J. (2006) Select and accept a new build home: buyers’ experiences, expectations
and attitudes. In: Smyth, H. (eds) Royal Institution of Chartered Surveyors Annual COBRA Conference.
London: RICS.
Torbica, Z.M. and Stroh, R.C. (2000) HOMBSAT - An instrument for measuring home buyer satisfaction,
Quality Management Journal, vol. 7, no. 4, pp. 32-44.
Vavra, T.G. (1997) Improving your measurement of customer satisfaction: A guide to creating, conducting,
analyzing, and reporting customer satisfaction measurement programs. Milwaukee, WI: Society of
Automotive Engineers,U.S.
Watts, G. (2007). The Callcut Review of House building Delivery. London: Construction Industry Council.

668
ID 137
KEY SUCCESS FACTORS OF TOTAL QUALITY MANAGEMENT
AND EMPLOYEES PERFORMANCE IN IRAQI OIL INDUSTRY
A. Aletaiby, U. Kulatunga and C. Pathirage
School of the Built Environment, University of Salford, Salford, M5 4WT, UK
Email: [email protected]
Abstract: In times of the business world, under globalisation and overlapping variables, the
concept of total quality management (TQM) as a philosophy to excel organisational
performance is growing in significance. Many companies across the globe including oil and
gas companies employ TQM, as its effectiveness has been observed to improve business
performance in various aspects. The oil industry has a critical impact on the economy of Iraq
as it represents the backbone and the major source of income to this country. The main aim of
this paper is to developing a conceptual framework to improve the employee performance in
Iraqi oil industry through applying key success factors of TQM. Therefore, the researcher
conducted an extensive literature review on the TQM studies in order to identify and evaluate
the key success factors of TQM in addition to the key measures of employee performance. The
results of this paper find that there are nine TQM key factors: top management commitment,
customer focus, continuous improvement, process management, training and developing,
quality culture, employee empowerment and participation and communication. Moreover,
three measures of employee performance have been investigated in this study: employee
satisfaction and improving work climate. The main finding of this paper is a proposed
conceptual framework which contains key success factors of TQM and their impact on
employee performance. The proposed framework validate by interviewing ten decision makers
in one of the most significant oil company in Iraq which is Iraqi oil company.
Keywords: Total Quality Management, TQM Key Factors, Employee Performance, Iraqi Oil
Industry.
1. INTRODUCTION
In recent times, companies face continuous and massive changes in its business environment.
Technological and economic levels are affected by the rapid development of globalisation,
information technology, increased competition and modern management approaches. Thus,
maintaining successes has become more challenging as companies face an environment that
has become more complex, dynamic and challenging (Al-Khalifa & Aspinwall, 2001). TQM
considered being one of the most long-lasting management innovations in the recent decades.
TQM views an organisation as an integrated process that should be constantly improved by
merging employees’ knowledge and experience in order to attain organisational aims. It must
be accomplished by management and employees in all company's activities (Hashmi 2004).
Successful implementation of TQM assist the companies to run their activities more
efficiently. It has been suggested that implemented TQM leads to better organisational
performance (Nilsson et al, 2001). Abusa & Gibson (2013) argued that many multi-national
companies especially Oil Company have already boosted up their organisational performance
by effectively utilising the practices of TQM. The organisational performance is achieved by
key indicators including customer performance, employee performance, financial
performance, operational performance and environmental performance. However, according
to Alsaidi (2014), the success to achieve TQM standards in many oil companies in the Middle
East still lower than expected. Brah et al., (2002) stated within the context of TQM

669
implementation, there is increasing recognition of the significant role of employees in
achieving the success.
In Iraq, the oil industry plays a critical role in the economy as it represents the major source
of income for the economy. However, Iraqi oil companies are at the very initial stage of TQM
development, despite its benefits and results on employee performance, even the quality
management and developing performance was only developed in Iraq in early 2008 (IMOO,
2013).
From what has been mentioned previously, what is the impact of TQM implementation on
the employee performance and does TQM practices and key factors provide benefit for the
employees? This paper is seeking to enhance the literature review through highlighting the
relationship between the key success factors of TQM and the employee performance in the
context of the oil industry.
2. RESEARCH METHODOLOGY
This paper depends on conducting an extensive literature review as a method to identify the
relevant book, journals, articles websites that describe, examine and concentrate on the key
success factors of TQM in addition to the measures and indicators of organisational
performance in general and employee performance in particular. A comprehensive literature
search based on the keywords search method was conducted using the search engines like
Solar, Scopus and Google Scholar. The keywords searched for “TQM”, “oil industry”,
“employee performance”
3. TOTAL QUALITY MANAGEMENT
TQM is a term that was initially coined by the Department of Defence in the United States
(Evans & Lindsay, 2001). TQM is considered as a new managerial concept; it took place in
the USA in the early 1980s as a result of poor manufacturing product quality compared with
their Japanese competitors (Talha, 2004). By 1982, American corporations were in a near
panic due to the high productivity of Japanese companies who spread their products
throughout America and they gained a high market share as a result of low labour costs in
Japan, the Japanese work ethic, conflict between labour and management and burdensome
government regulations in the USA (Mele and Colurcio, 2006). The spread of the TQM
philosophy is expected to be accompanied by greater sophistication in the implementation of
tools and techniques and extra emphasis on people. The process will also extend beyond the
organisation to include partnerships with suppliers and customers. Activities will be
reoriented to focus on the internal and external customer (Dale et al., 2013). By the 1990s
quality programmes for productivity and innovation had been intensified to respond to new,
often harsh, world conditions and contingencies. Quality management provided the basis for
“a new approach in business management for the turn-around” (Mangelsdorf, 1999). Lau &
Tang (2009) mention that the complex and dynamic technology, resources and task
environment, and customer expectations and orientation are the primary factors behind
adopting TQM in today's organisations. They add that TQM has shifted management style
away from traditional thinking in terms of process control and organisation aims to giving
more attention to the organisational culture as the essential driver of process control. TQM
approach is now seen essential to long- term survival in business and a key factor that
everyone in the company should be involved and committed from the top to the bottom of the

670
organisation. The successful total – quality-managed company ensure that their goods and
services can meet their following criteria: (Harris et al., 2013)
1. Be fit for purpose on consistency reliable basis.
2. Delight the customer with the service that accompanies the supply of a good.
3. Supply a quality of the product that is so much better than that of `the competition that the
customers want it regardless of price.
Therefore, TQM can have a transforming impact on an industry that is in a state of substantial
structural change and facing increased competition by raising performance. Invariably, the
implementation of TQM by the Iraqi oil industry could result in the provision of overall high-
quality standard that contributes effectively to improving the entire performance.
4. KEY SUCCESS FACTORS
The identification of key success factors of TQM assist the companies to understand more
regarding the dynamic and active nature of this approach. For achieving successful TQM
implementation within any company, thus, the characteristics prominent in these factors
consider as essential elements that influence the implementation of TQM within any
company. According to Najeh (2006), key factors there can be the production of two logical
statements. Firstly, quality philosophers and empirical researchers. Secondly, there is no
agreement observed on the sacrosanct critical factors of quality. Therefore, the majority have
cited various factors that are common. For instance, leadership has always been included.
Therefore, ‘near-universal’ acceptance has been expected by some of them whilst the rest are
secondary or just marginal. Communication, teamwork, training and education are some
examples of ‘nearly-universal’ quality factors. Labour-union relations are an example of
marginal factors. Researchers such as (Flynn et al., 1994; Yasamis et al. 2002; Koh & Low
2010; Kumar, et al., 2011; Hietschold et al., 2014; Neyestani and Juanzon 2016) have
contributed to the examination of the key factors of TQM implementation where they came
up with more or fewer factors but of the same ground. Forming a general conclusion from
these studies is that, there is a range of factors which have to be considered by each
organisation for TQM implementation process to be precise and sure. The TQM concept is
enforced by key factors which differ from each other as they are determined by the specific
company. Table 1 reveals the numerous TQM factors that can be identified as being
significant to the successful TQM implementation.

Table 1: Comparisons of TQM key success factors Propositions by different authors
Flynn et
al., 1994
Black and
Porter 1996
Yasamis et
al. 2002
Lewis et
al., 2006
Koh1 and
Low 2010
Kumar et
al,. 2011
Gherbal et
al., 2012
Hietschold
et al., 2014
Dedy et al.,
2016
Neyestani &
Juanzon
2016 Top
manageme
nt support
people and
customers
Leadership Customer
satisfactio
n
Top
managemen
t leadership
Management
commitment
Communicati
on to
improve
quality
Human
Resource
Management
Top
Management
Customer
focus
Quality
informatio
n
Management
supplier
partnerships
Customer
focus
Human
resources
utilisation
Customer
managemen
t
Customer
satisfaction
Organisation
management
teamwork Leadership Leadershi
p
process
manageme
nt
communicati
on of
improvemen
t information
Employee
empowerm
ent
Manageme
nt of
process
quality
People
managemen
t
Continuous
improvemen
t
Training and
development
Top
management
commitment
Communicati
on
Process
manageme
nt
Product
design
customer
satisfaction
orientation
Partnership
developme
nt
Training
and
education
Supplier
managemen
t
Teamwork Employee
involvement
and
recognition
process
management
Customer
focus
Supplier
quality
manageme
nt
Workforce
manageme
nt
external
interface
management
Information
and
analysis
Manageme
nt
commitme
nt
Quality
information
Managemen
t
Employee
training
Culture Customer
focus
Teamwork Employee
involveme
nt
Supplier
involveme
nt
strategic
quality
management
Project
managemen
t process
Continuou
s
improvem
ent
Process
managemen
t
Feedback Supplier
partnership
Training Informatio
n and
analysis
Customer
involveme
nt
Teamwork
structures
for
improvemen
t
Continuous
improveme
nt
Leadership Organizatio
nal learning
Effective
communicati
on
Training and
learning
Training
Operational Strategic Continual Information

672
quality
planning
quality
planning
improvemen
t
and analysis
Quality
improvemen
t
measuremen
t systems
performan
ce
measurem
ent
Strategic
quality
planning
Corporate
quality
culture
Customer
focus
Culture and
communicati
on
Suppliers
profession
al
Associates
Benchmarki
ng

673
An extensive review and analysis have been conducted on the above-mentioned studies by
several industries worldwide. Based on professionals, researchers and experts findings and
supported by the writing of quality pioneers, empirical surveys, case studies and quality
awards and models, Eight factors have been identified which form the basis of the most
significant factors to be considered as the key success factors of TQM. According to the
nature of quality management implementation within the Iraqi oil industry, the identified
eight key factors of TQM expect to be more relevant in the Iraqi context.
4.1. Top management commitment
With respect to its vital role in implementing TQM top management commitment considered
as the initiation point in which quality activities stems from it (Hietschold et al., 2014). Top
management commitment represents the main driving force behind the TQM thus, it is a
responsibility to create an appropriate environment for TQM implementation. According to
Seetharaman et al. (2006), an organisation cannot be transformed into a TQM if the TQM
practices have not performed in the organisation by the top management. Having said that,
the essential task of the top management is to guarantee this transformation and ensure its
commitment towards the TQM activities.
4.2. Customer Focus
The main factor of TQM, in accordance with Richards (2012), is customer focus. Richards
emphasizes that quality is defined by the customer but not by the organisation or the product
or service manufacturer since quality is what the end user desires. Brah et al., (2002) claims
that the success of any organization in near future would depend upon the satisfaction of its
customers’ needs efficiently and effectively on a continuous basis. In the same regards,
Zhang (2000) stress that customer focus is the extent to which an organization continuously
satisfies customer needs and expectations. Thus, it is one of the major means of TQM for
improving and enhancing business performance.
4.3 Quality Culture
Quality is not a process that can be operated through evaluation and assessment only, but it is
also a set of values and practices shared by the organisation environment and community and
should be undertaken by all the organisation levels. The employees’ roles in the success of
quality culture in an organisation. These are considered as the asset of an organisation and its
success depends on how the employees are treated (Watson & Howarth, 2012). The activities
and efforts of employees are affected by the dominant culture in a working environment.
Gherbal et al., (2012) stated, within the TQM culture an open and co-operative culture has to
be established by the management in which all the employees regardless their managerial
levels or positions have to be made to feel that all of them are responsible for achieving the
organisation’s objectives.

674
4.4 Continuous Improvement
Continuous improvement is the planned, organized and systematic process of continuing,
incremental and company-wide change of current practices meant to enhance company
performance (Boer & Gertsen, 2003). According to Dean and Bowen (1994), this key factor
refers to an organization's ongoing quest for better work methods and organizational
processes. A commitment to continuous improvement is ideally recognizable at the work unit
and employee level. Moreover, continuous improvement is able to elevate the performance of
an employee who is engaging in the TQM implementation.
4.5 Training and Development
Effective training and development of employees have been observed as an important part of
human resource management. Training considered as a vehicle for applying and reinforcing
TQM practices (Dedy et al., 2016). Training and developing lead employees better
understand quality-related issues and improve their role within the quality management
approach (Hietschold et al., 2014). Thus, effective training and development equipped
employees with knowledge, skills and abilities for constructive contributions to quality.
4.6 Employee Empowerment
The success of TQM implementation is facilitated by employee empowerment and
involvement in the company. Additionally, it stimulates employees to offer better job quality
and contribute more in the new business process and therefore observed to be a crucial factor
(Hietschold et al., 2014). Therefore, managers should motivate and encourage employees to
take responsibility, authority and communicate effectively to improving the quality at all
aspects of work. This will enhance the belongingness feeling of employees to their company.
4.7 Process Management
Process management as stated by Ibrahim et al. 2011), includes the set of behavioural and
methodological practices that emphasis on companies activities and actions rather than
achieving results. Kanji, (2012) reveals in a TQM organization, the focus is not on formal
systems or structures. Rather, the focus is placed on setting up process management teams to
solve the organization problems. The essential point, in this case, is to alight employees and
their responsibilities with the organization and the processes in it. The success of an
organization is based on its focus on the processes i.e. activities and tasks themselves rather
than on abstract issues
4.8 Communication
Effective communication is established starting with communicating the values, policies and
measures of the organisation to its employees. Thus, the organisation should communicate to
its employees about its goal and quality policies without any doubt. To have an effective
administrative system with least bureaucratic, all employees should be clarified with their
own roles and responsibilities (Li et al., 2000). Kanji (2012) pointed out that without

675
communication, organisations would not function. If communication is diminished the entire
organisation suffers. When communication is thorough, accurate, and timely, the organisation
tends to be vibrant and effective.
Having discussed the above eight key success factors of TQM, it can be concluded that
applying the TQM key success factors has a significant advantage on the entire organisational
performance. The success of TQM implementation depends heavily on employees who will
be directly involved in the implementation process. According to Ibrahim et al. (2011), TQM
implementation depends mostly on employees’ attitudes and activities in the company.
Therefore, TQM must focus not just on the quality of the product but also on the quality of its
employees to remain an effective management approach.
5. THE EFFECTS OF TQM ON EMPLOYEE AS A MEASURE OF COMPANY’S
PERFORMANCE
Employees are the most important asset for any organisation as they provide support in
productivity and performance enhancement. In order to become more successful and
competitive, companies must consider their employees as the main engine towards achieving
their goals in both short and long term (Mehmood et al., 2014). Performance improvement is
approached as an operational philosophy that management adopts to benefit customers,
employees, suppliers and shareholders alike in a context where quality improvement is a
major organisational strategy to achieve competitive advantage. The performance
improvement programs cannot be ignored in a company as they directly benefit the bottom
line while providing a competitive advantage (Gharakhani et al., 2013). Considering the
focus of TQM improving and empowering employees as well as conferring them with
autonomy and authority, results in employees are likely to manifest in different dimensions.
Among the various employee benefits to be gained by implementing TQM this study has
been focused on Employee satisfaction and improve work climate as the most significant
indicators that influenced by the eight key success factors of TQM.
5.1 Employee Satisfaction
Employee satisfaction is one of the primary cornerstones of TQM and is included as one of
the quality goals, as satisfied employees are prerequisites for a desirable business result
(Dedy et al., 2016). According to Alsughayir (2014), a strong link is expected to exist
between an organization adopting TQM practice and employee job satisfaction with TQM
giving emphasis on the significance of teamwork in facilitating the ability of employees in
working together in getting a job done. Furthermore, Peris-Ortiz et al., (2015) advance that
the tendency of TQM philosophy to let employees to control the quality of their work, to be
more autonomous and to suggest improvement actions contribute in contributing to ensure
that employee experience the benefits of job enrichment. From these, it can be derived that
TQM is designed in a manner that employee satisfaction is one of the results of implementing
TQM practices in companies.

676
5.2 Improve Work Climate
A key aspect in TQM in the workplace includes teamwork, which prospers when the different
factions share the same vision of the organisation and which influence the roles they assume
in the organisations. As quality is influenced by the environment which the employees
operate in, TQM has to give attention to fostering the necessary work environment and
endeavour to manage it with a view of achieving its conformity with the company’s product
requirements (Kaynak, 2013). According to Anvari et al (2011), the leadership informed by
TQM provides the tools for working effectively and the work environment fostering
productive work. With the workers satisfied and having the feeling of being part of the
organisation, the employees are likely to work harder towards achieving organisational goals.
Furthermore, the focus given to quality by TQM promotes a work climate that encourages
learning to take place among employees while in the workplace and this further fosters
improvement in quality and productivity. As it emerges, the workplace environment
promotes in companies implies that those companies that adopt TQM exhibit improve work
climate favourable for employee performance.
6. THE PROPOSED CONCEPTUAL FRAMEWORK
The above discussion is conceptualised in (figure 1). The conceptual framework illustrates
the overall links between the main issues discussed in the theoretical and empirical literature
review. In other words, the conceptual framework suggests the impact of eight key success
factors of TQM and its implementation on improving the employee performance. Having said
that, in this study top management commitment, customer focus, quality culture, continuous
improvement, training and development, employee empowerment, process management and
communication represent the key success factors of TQM.
In order to reflect the resulted eight KSFs from the literature to adapt to the oil industry
practice in Iraqi, validation process was conducted through interviewing 10 leading
executives in one of the significant Iraqi oil company which is Iraqi drilling company IDC.
Thus, the proposed framework with the eight KSFs reflects on practitioners of the oil industry
in Iraq through improving the employee performance particularly in terms of achieving
employee satisfaction and improve work climate.

677
Figure 1: The proposed conceptual framework
7. CONCLUSION
This study reveals the importance of adopting TQM and its benefits/impacts on employee
performance. Although there are several studies have been conducted to identify the required
key factors of successful TQM implementation, however, there is still a lack of studies to
examine the relationships between key success factors of TQM and employee performance,
particularly in Iraqi oil industry. This mainly attributed to the fact that Iraqi oil companies are
at the very initial stage of TQM journey. Therefore, this study has been identified and
emphasised eight key success factors of TQM among many others in various studies. The
study attempts to contribute to employ these key factors of TQM to achieve utmost results of
employee performance in the context Iraqi oil industry. Therefore, the study proposed a
conceptual framework that links the eight key success factors of TQM with the employee
performance that directed by employee satisfaction and improved work climate.

678
8. REFERENCES
Abusa, F. M., & Gibson, P. (2013). TQM implementation in developing countries: A case study of the Libyan
industrial sector; Benchmarking: An International Journal, 20(5), 693-711.
Al-Khalifa, K. N., & Aspinwall, E. M. (2001). Using the competing values framework to investigate the culture
of Qatar industries. Total Quality Management, 12(4), 417-28.
Alsaidi, A. (2014). Benefits of Total Quality Management in mechanical working in oil companies in Libya.
International Journal of Engineering Research and Social Technology, 3(4), 241-247.
Alsughayir, A. (2014). Does practising total quality management affect employee job satisfaction in Saudi
Arabian organizations? European Journal of Business and Management, 6(3), 169-175.
Anvari, A., Ismail, Y., & Hojjati, S. M. (211). A study on total quality management and lean manufacturing:
through lean thinking approach. World Applied Sciences Journal, 12(9), 1585-1596.
Black, S. A., & Porter, L. J. (1996). Identification of the critical factors of TQM. Decision sciences, 27(1), 1-21.
Boer, H. & Gertsen, F. (2003). From Continuous Improvement to Continuous Innovation, International Journal
of Technology Management, 26(6), 805-827.
Brah, S. A., Tee, S. S. & Rao, B. M. (2002). Relationship between TQM and performance of Singapore
companies, International Journal of Quality and Reliability Management, 19(4), 356-379.
Dale, B. G.; Wiele, T. V. D. & Iwaarden, J. V. (2013). Managing quality, 5th ed., Blackwell Publishing Ltd.
Dean, J., W., & Bowen, D.E. (1994). Management theory and total quality: improving research and practice
through theory development, Academy of Management Review, 19(3), 392-418.
Dedy, A., Zakuan, N., Bahari, A., Ariff, M., Chin, T., & Saman, M. (2016). Identifying Critical Success Factors
for TQM and Employee Performance in Malaysian Automotive Industry: A Literature Review. IOP
Conference Series: Materials Science and Engineering, 131(1), 7.
Evans ,J.R., & Lindsay, W. M. (2001). The Management and Control of Quality, 5th ed., New York: West
Publishing.
Flynn, B. B., Schroeder, R. G., & Sakakibara, S. (1994). A framework for quality management research and an
associated measurement instrument. Journal of Operations management, 11(4), 339-366.
Gharakhani, D., Rahmati, H., Farrokhi, M. R. & Farahmandian, A. (2013). Total quality management and
organizational performance. American Journal of Industrial Engineering, 1(3), 46-50.
Gherbal, N., Shibani, A., Saidani, M., & Sagoo, A. (2012, July). Critical Success Factors of Implementing Total
Quality Management in Libyan Organisations. In Proceedings of the International Conference on Industrial
Engineering and Operations Management, Istanbul, Turkey, July 3-6.
Harris, H., Mccaffer, R., & Eduw-Fotwe, F. (2013). Modern construction Management, 7th ed., John Wiley &
Son, Ltd.
Hashmi, K. (2004). Introduction and Implementation of Total Quality Management (TQM). [Online], Available
at: http://www.isixsigma.com/library/content/c031008a.asp [Accessed: 08/12/2016].
Hietschold, N., Reinhardt, R., & Gurtner, S. (2014). Measuring critical success factors of TQM implementation
successfully–a systematic literature review. International Journal of Production Research, 52(21), 6254-
6272.
Ibrahim, I., Amer, A., & Omar, F. (2011). The Total Quality Management Practices and Quality Performance: A
Case Study of Pos Malaysia Berhad, Kota Kinabalu, Sabah. In International Conference on Business and
Economic Research.
IMOO. )2015(. QUALITY MANAGEMENT AND DEVELOPING PERFORMANCE [Online]. Iraqi Ministry
of Oil Available: ttps://www.oil.gov.iq/index.php?name=Pages&op=page&pid=106 [Accessed
17/11/2015].
Kanji, G. (2012). Total quality management: proceedings of the first world congress. Springer Science &
Business Media.
Kaynak, E., & Rogers, R. E. (2013). Implementation of total quality management: A comprehensive training
program. New York; London: Routledge.
Koh, T. Y., & Low, S. P. (2009). Empiricist framework for TQM implementation in construction
companies. Journal of management in engineering, 26(3), 133-143.
Kumar, R., Garg, D., & Garg, T. K. (2011). TQM success factors in North Indian manufacturing and service
industries. The TQM Journal, 23(1), 36-46.
Lau, A. W., & Tang, S. L. (2009). A survey on the advancement of QA (quality assurance) to TQM (total
quality management) for construction contractors in Hong Kong. International Journal of Quality &
Reliability Management, 26(5), 410-425.
Lewis, W.G., Pun K.F., & Lalla T.R.M. (2006). Exploring soft versus hard factors for TQM implementation in
small and medium-sized enterprises, International Journal of Productivity and Performance Management,
55(7), 539-554.

679
Li, E. Chen, E., & Cheung, C. (2000). Total quality management in software development process, The Journal
of Quality Assurance Institute,4, 5–41.
Mangelsdorf, D. (1999). “Evolution from quality management to an integrative management system based on
TQM and its impact on the profession of quality managers in industry”, The TQM Magazine, 11(6), 419.
Mele C. & Colurcio M. (2006). "The evolving path of TQM: towards business excellence and stakeholder
value". International Journal of Quality & Reliability Management, 23 (5), 464 – 489.
Mahmood, S., Qadeer, F., & Ahmed, A. (2014). Relationship between TQM dimensions and organizational
performance.
Najeh, R. T., (2006). A Road Map for the Effective Adoption of Total Quality Management in Libyan Oil
Industries. Doctoral Thesis, University of Bradford.
Neyestani, B., & Juanzon, J. B. P. (2016). Identification of A Set of Appropriate Critical Success Factors for
Successful TQM Implementation in Construction, and Other Industries. International Journal of Advanced
Research 4(11), 1581-1591.
Nilsson, L., Johnson, M., & Gustafsson, A. (2001). The impact of quality practices on customer satisfaction and
business results: product versus service organizations. Journal of Quality Management, 6, 5-27.
Peris-Ortiz, M., Álvarez-García, J., & Rueda-Armengot, C. (2015). Achieving competitive advantage through
quality management. Cham: Springer.
Richard, J. (2012). Total Quality Management, Business Management and Strategy, 3(2), 36-42.
Seetharaman, A., Sreenivasan, J., & Boon, L. P. (2006). Critical success factors of total quality
management. Quality and quantity, 40(5), 675-695.
Talha, M. (2004). “Total quality management (TQM): An over view, the bottom line”, Managing Library
Finances, 17(1), 15-19.
Watson, P., & Howarth, T. (2012). Construction Quality Management: Principles and Practice. Routledge.
Yasamis, F., Arditi, D., & Mohammadi, J. (2002). Assessing contractor quality performance. Construction
Management & Economics, 20(3), 211-223.
Zhang, Z. H. (2000). Developing a model of quality management methods and evaluating their effects on
business performance, Journal of Total Quality Management, 11(1), 129-137.

680
ID 138
THE EFFECTIVINESS OF PROJECT RISK MANAGEMENT: A
STUDY WITHIN THE LIBYAN OIL AND GAS INDUSTRY
R. Elhoush and U. Kulatunga
School of the Built Environment, University of Salford, Salford, M5 4WT, UK
Email: [email protected]
Abstract: Oil and gas projects are large, complex and risky, as they involve a considerable
number of stakeholders, are technologically difficult and must adhere to tight budgets and
schedules. Many of these projects are not delivered on time and within budget. The literature
indicates that this failure is a result of improper project risk management practices. The
literature also shows that although some scholars doubt the effectiveness of these practices,
according to others, a positive relationship exists between applying these practices and project
outcomes. This paper aims to explore the effectiveness of project risk management practices
within the Libyan oil and gas industry. This paper follows a single case study approach. The
data collection method adopted for this study was thirteen semi-structured interviews with
experts. Results show that even though there is no written procedure for project risk
management practices within the Libyan oil and gas industry, participants believe that
applying these practices can increase overall project performance. This paper concludes that
establishing an organisational culture to support the creation of a written risk management
guideline, project manager leadership and familiarity of the individual with the project risk
management concept supports the effectiveness of project risk management within the Libyan
oil and gas industry, increasing project performance.
Keywords: Libya, Oil and gas, Project management, Project performance, Project risk
management.
1. INTRODUCTION
Oil and gas projects are challenging, as they are complex, risky, involve a considerable
number of stakeholders, are technologically difficult and must adhere to tight budgets and
schedules (Briel, Luan, & Westney, 2013; Deloitte, 2015; EY, 2014, 2015). The continued
need to ensure projects are managed properly and efficiently across the oil and gas sector has
led both the industry and academia focusing on the development of reliable project
management strategies to reduce project failures. Project risk management has been
identified as a strong factor in need of careful assessment to ensure project failures are
minimised (Al Subaih, 2015; Carvalho & Rabechini Junior, 2015; Rabechini Junior &
Monteiro de Carvalho, 2013; Rogers & Ethridge, 2013; Salazar-Aramayo, Rodrigues-da-
Silveira, Rodrigues-de-Almeida, & de Castro-Dantas, 2013). Briel et al. (2013) believe that,
in these challenging environments, experienced project managers and the available project
management best practices are not enough; instead, project managers should follow a
coherent reference framework based on, but not limited to, official project phases and stage
gates, the constant monitoring and reviewing of project risks and a strong integrated project
team. To increase project performance, companies have committed to implementing effective
project management and project risk management strategies. These strategies are meant to
help companies remain competitive, while improving value creation among the company
deliverables (Denney, 2006). The oil and gas industry has been subject to recent fluctuations
in oil prices. In 2015, the price of oil fell to the lowest rate in almost four decades

681
(Baumeister & Kilian, 2016; Cagianelli, Michelez, & Nava, 2015a; Zhao, Hwang, & Gao,
2016), leading to project performance uncertainties, especially in regions affected by other
additional risks, such as the uprisings and wars affecting the Middle East and North Africa
(Khatib, 2014).
In Libya, the oil and gas sector is the economic backbone of the country, contributing
significantly to the nation’s income. According to the International Monetary Fund (IMF)
(2013) and (2014), Libya’s economy depends on oil and gas production. Hydrocarbon
production contributes approximately 96% of the total government revenue. With the current
risky and unsecured situation in Libya, the study of issues related to risk management in the
oil and gas sector should be prioritised. Given the importance of project risk management as
a factor in improving the performance of oil and gas projects, this paper aims to explore the
practical effectiveness of project risk management in the Libyan oil and gas industry. The
aims of this paper are as follows:
Reviewing the relevant literature on reported project failures within the oil and gas
industry and critically reviewing project risk management and the benefits and
limitations of the tools and techniques used to support the process. This paper
investigates the relationship between project risk management and project
performance.
Addressing the methodological choice followed.
Presenting and discussing primary data collected for this study.
Drawing conclusions, while also theorising about the way forward.
2. LITERATURE REVIEW
2.1 Oil and Gas Project Failure
Despite the importance of oil and gas projects, these projects still fail. In a
recent universal study on the performance of 365 oil and gas projects conducted by one of the
big four audit firms, Ernst & Young (EY) (EY, 2014), EY determined that a high percentage
of projects failed to adhere to their approved time and budget. The study also revealed that
project delivery success is declining when compared with the long-term industry
outlook. The same study identified that improper project risk management practices are a
primary reason for schedule delays and cost overruns. The study concluded with the
recommendation that applying project management tools and techniques could improve
project performance and reduce the risks of schedule delays and cost overruns. Aligned with
these findings, according to Merrow (2012)―the founder of Independent Project Analysis
(IPA) Inc. (IPA is a widely known for being a respected research organisation on project
analysis including analysing projects within the oil and gas industry)―78% of oil and gas
projects suffer from real problems with cost overruns and schedule delays.
Long (2015) identified several problems related to the improper project risk management that
causes oil and gas projects to exceed their budget and have major delays. The author
summarised the main problems as follows:
Inadequate project definition during early project stages.
Insufficient documentation.
Lack of experienced workforces.
A large number of change orders.

682
Inadequate camp size facilities, leading to additional cost and time in construction for
additional facilities to fill the gap.
Incorrect cost estimates.
Not clear contract documents.
Poor baseline schedules.
Poor production design.
Insufficient project management teams to manage change orders.
2.2 Project Risk Management
It is believed that the word ‘risk’ originated from the Italian word risicare; a literal translation
for this word is ‘to dare’. Therefore, risk is seen as an option rather than a destiny
(Massingham, 2010). In recent years, the topics of risk and uncertainty have drawn the
attention of many researchers and practitioners (Besner & Hobbs, 2012; Marle & Vidal,
2011; Rabechini Junior & Monteiro de Carvalho, 2013; Zwikael & Ahn, 2011). The topic of
risk and risk management has been studied by different disciplines; the literature concludes
there is no clear or standardised definition of these terms, and that different fields, such as
economics, management, strategic management and project management view the concepts
differently (Ehsan, 2013). Despite these differences, risk management is increasingly vital
because the uncertainty surrounding many businesses continues to rise (Becker & Smidt,
2016).
According to the Project Management Institute (PMI) (PMI, 2013), project risk management
is a significant area of project management. The PMI’s Project Management Body of
Knowledge (PMBOK) considers project risk management one of 10 knowledge areas. Their
belief is that if a project manager complies with these 10 areas, the success of the project is
guaranteed (PMI, 2013). However, the literature shows that there is no standardised
definition of project risk management. Ghosh and Jintanapakanont (2004) define risk
management as a ‘tool for managing projects effectively through their life cycles’. Variations
in the definition of project risk management exist even among professional project
management bodies such as the Association for Project Management (APM) and the PMI.
APM defines project risk management as ‘a process that allows individual risk events and
overall risk to be understood and managed proactively, optimising success by minimising
threats and maximising opportunities.’ (APM, 2004), while PMI says, ‘Project Risk
Management includes the processes of conducting risk management planning, identification,
analysis, response planning, and controlling risk on a project. The objectives of project risk
management are to increase the likelihood and impact of positive events, and decrease the
likelihood and impact of negative events in the project’ (PMI, 2013).
Project risk management is a valuable component of project management, as it augments the
worth of the other project management processes, offering support when employed with good
practice values (Benta, Podean, & Mircean, 2011; Besner & Hobbs, 2012; PMI, 2013). The
current practices of project risk management aim at recognising project challenges and
multicultural environments, particularly those associated with increasingly global and
complex environments (Thamhain, 2013). In the view of Besner and Hobbs (2012), project
risk management is an organised practice to effectively manage project risks. Scholars and
professional bodies, with slight differences in the level of detail, generally agree that the
project risk management process consists of five steps: risk identification, risk assessment,
risk classification, risk mitigation and risk controlling. Figure 1 (below) demonstrates these
steps.

683
Figure 23: Project risk management process (Firmenich & Firmenich, 2017)
2.3 Different tools and techniques that support project risk management process
There are currently over 30 risk management techniques in the literature supporting project
risk management activity, with varied applications and suitability depending on the nature,
size and complexity of the projects (Cagliano, Grimaldi, & Rafele, 2015; Salazar-Aramayo et
al., 2013). Such risk techniques require the utilisation of specific tools, so some projects may
combine more than one set of techniques (Suslick & Schiozer, 2004). The following list
shows the different practices in risk management as summarised by the extensive literature
review done by Cagliano et al. (2015).
Checklist
Brainstorming
Risk Ranking/Risk Probability and Impact
Change Analysis
Decision Tree Analysis
Fuzzy Logic
Cause and Effect Diagram
Expert Judgement
Fault Tree Analysis
Event Tree Analysis
Delphi
Expected Monetary Value
Hazard and Operability
Human Reliability Assessment
Hazard Review
Interview
Incident Reporting
Pareto Analysis
Monte Carlo
Preliminary Hazard Analysis
Sensitivity Analysis
Swift Analysis
Strengths, Weaknesses, Opportunities and
Threats
‘5’ Whys Technique
What-if Analysis
Risk Breakdown Matrix
Risk Breakdown Structure
Event and Causal Factor Charting
Failure Mode and Effect Criticality
Analysis (FMECA

684
2.4 Limitations of project risk management tools and techniques
The current tools utilised to assess and manage project risk have certain limitations, as
outlined in this section. The literature underlines that there is a problem with the current risk
management tools within the project management environment (Benta et al., 2011; Besner &
Hobbs, 2012; Thamhain, 2013; Zwikael & Sadeh, 2007). The tools and techniques do not
provide strong answers and have limitations based on a number of presumptions and
assumptions (Aven, Vinnem, & Wiencke, 2007). According to Zwikael and Ahn (2011),
although risk planning tools are popular within the project management discipline, the
literature identifies many disadvantages regarding risk planning practices. These include: a
limited variety of tools used, the poor quality of tool use and the high complexity and the
perceived low effectiveness of existing tools.
Although many tools for assessing risks in projects are available, the majority of project risk
assessments are limited to using risk-ranking tools only (Cagliano et al., 2015; Mojtahedi,
Mousavi, & Makui, 2010; Osabutey, Obro-Adibo, Agbodohu, & Kumi, 2013; Whitfield,
2015). Evidence shows that effective risk assessment has gone beyond ranking the risk of
projects and into developing an integrated and sustainable approach to risk management
(Brandt, Sarif, & Mohd, 2013; Cagianelli, Michelez, & Nava, 2015b). Such models of risk
assessment have two obvious shortcomings: the subjective nature of judgment and
interpretation of data inputs, as human actors are likely to either underestimate or
overestimate the frequency and chance of possible risks occurring; and the incompleteness of
the analysis related to an assessor’s failure to identify all relevant sources of risk. The main
issue here is that while the calculation of risk through probability analysis may appear
scientific in nature, it may be misleading and inaccurate in evaluating the true nature of risks
(Carter & Hancock, 1994, p. 116; Harris, 2009).
2.5 Selecting an effective project risk management tool/technique
Choosing an effective risk management technique/tool is one of the key steps in ensuring
guaranteed project performance. Considering how projects differ in nature, location, size or
even complexity (Cagliano et al., 2015; EY, 2015; Salazar-Aramayo et al., 2013), projects
may require different risk assessment tools to ensure project performance in different cultures
(Liu, Meng, & Fellows, 2015). The selection of an appropriate risk assessment tool is a
function of three important dimensions: the risk management phase, the project phase and the
corporate maturity of the project team towards the risk (Cagliano et al., 2015). The following
subsections discuss these three dimensions in detail.
Risk phases
Risk assessment is established by first understanding the nature and sequence of events
around the risk. Risk is characterised by the sequence of three events: the cause, occurrence
and consequences (Hillson & Murray-Webster, 2007). These three events have been
converted into the phases of the risk management process, involving planning, identification,
analysis, monitoring, response and control of the risk (Cagliano et al., 2015). The way they
derive the risk assessment and management is provided in Table 1.

685
Table 1 Risk management phases and actions
Risk management phase Action towards risk management
Planning Identify objectives, resources and approaches to risk
Identification Causes of risk
Analysis Probability of occurrence and impact of the risk
Response Actions to develop opportunities and reduce threat
Despite the clarity of the risk phases and their corresponding action plan, identifying the
objectives, causes and even the probability of risk occurrence due to the individual
knowledge and understanding of a particular risk is complex (Cagianelli et al., 2015b;
Cagliano et al., 2015; Rabechini Junior & Monteiro de Carvalho, 2013). Many project
failures, are due to the risk assessment team’s inability to understand and identify possible
sources of project risk (Zwikael & Ahn, 2011), and their inability to accurately score the risk
for a variety of projects, especially in the Middle East and North Africa (MENA) region
(Aven et al., 2007; Liu et al., 2015; Srivastava & Gupta, 2010). Although the sequence risk
phases are conducted in differs, the early part of the risk assessment, i.e. planning, is a crucial
step in ensuring a project’s success during its implementation (Salas, 2015; Ward &
Chapman, 1995).
Project life cycle phases
A project’s life cycle is demarcated by four distinct phases―conceptual, planning, execution
and termination (Cagliano et al., 2015; Ward & Chapman, 1995)―which enables the
management of a project’s schedule with distinct deliverables at each phase. The possible
sources and causes of uncertainties are identified in the conceptual and planning phases
(Cagliano et al., 2015).
Risk corporate maturity
Tackling and mitigating risk is different for every project and company. Risk corporate
maturity requires an understanding and awareness of risk by considering that risk scope data
are required to ensure the systematic implementation of the measures to mitigate risk (Pitsis,
Kornberger, & Clegg, 2004). Perhaps some projects’ risks are managed based on an informal
risk management approach, which tends to manage risks as they occur (Cagliano et al., 2015;
Lyon & Hollcroft, 2012; Suslick & Schiozer, 2004; Ward & Chapman, 1995).
2.6 Project Risk Management and Project Performance
Several scholars have debated about the relationship between performing project risk
management process and project success. Some believe applying these these practices has a
strong positive relation with desirable project outcomes, while others believe the complete
opposite. Elkington and Smallman (2002) stress the importance of earlier (e.g. project brief
stage) project risk management in the project and consider the amount of project risk
management used increases the level of project success. A recent comprehensive study
conducted by Zwikael and Ahn (2011) examines the effectiveness of current risk
management practices to reduce project risk. In their study, they used a multi-industry,
multinational survey during the 2002–2007 period covering 701 project managers in seven

686
industries in three countries, including Japan, New Zealand and Israel. They found that the
country and industry of the executed project has an important impact on the level of the
perceived project risk and the risk management process adopted. The authors conclude that
even a reasonable or moderate quantity of risk management helps minimise project risks,
increasing the project’s level of success. De Bakker, Boonstra and Wortmann (2012) agree
that project risk management has a significant positive influence on project success,
emphasising the risk identification stage as the most important factor contributing to project
success. Baloi and Price (2003) and Zou, Zhang and Wang (2007) also found a strong
relationship between performing project risk management and project success.
While numbers of authors support the idea that project risk management has a positive impact
on project performance, other scholars do not seem as optimistic. For example, Raz, Shenhar
and Dvir (2002) did not find a relationship between project success and risk management,
stressing the need for more training, better tools and techniques, promoting the effectiveness
of project risk management and the development of more tools specific to types of projects.
Bannerman (2008) claims that, in practice, risk management methods lag behind the
understanding and recommendations of the research literature. The author insists that, even if
a project is successful, it can be challenging to relate that successful result to project
management practices, believing instead that success is often credited to good luck or the
efforts and exclusive skills of the individuals involved in the project.
Therefore, it is evident that many oil and gas projects still fail because of poor project risk
management. As the relationship between project risk management and project performance
is still ambiguous, this paper aims to investigate this phenomenon within the Libyan oil and
gas industry.
3. METHODOLOGY
This paper aims to explore the practical effectiveness of project risk management in the
Libyan oil and gas industry. Therefore, the National Oil Corporation (NOC) of Libya was
chosen as a case study for this research. The NOC is fully responsible for all oil and gas
activities (upstream, midstream and downstream) in Libya. The context of this research is
limited to the oil and gas upstream projects within the Libyan oil and gas industry.
To gain full understanding of the phenomena, semi-structured interviews with 13 experts
were conducted. All participants were chosen carefully to add value to the research and avoid
any bias in the results. This research’s participants include six department heads, three senior
project managers, three project engineers and one board advisor. This research includes
interactions between different people and technological influences in real-life situations.
Different perspectives regarding risk management within the Libyan oil and gas industry
were investigated during the research. This research largely follows the social
constructionism (interpretivism) philosophy, the ontological position of subjectivists and the
axiological view of being value-laden.
First, participants were asked about the availability of a written project risk management
framework or procedure within the company. Then, they were asked to identify the tools and
techniques most currently used to support the management of project risks within the Libyan
oil and gas industry. Finally, they were asked about their views on the effectiveness of these
tools and techniques related to project success.

687
4. FINDINGS AND DISCUSSION
Project risk management is a significant area of the project management discipline. The
PMI’s PMBOK considers project risk management one of its ten knowledge areas; their
belief is that the project manager complying with these ten areas guarantees the success of the
project (PMI, 2013). Yet, according to Cervone (2006), not all project managers appreciate
the true value of risk management, and in many cases it is not given the attention it deserves.
This may be because some authors doubt the effectiveness of project risk management
practices related to the project’s performance (Zwikael & Ahn, 2011). As mentioned in
section 2.3, many tools and techniques support the project risk management process.
Participants were asked to identify the most currently used tools and techniques within the
Libyan oil and gas industry. When interviewees were asked about the availability of a written
framework or procedure to perform project risk management, all answers revealed the lack of
a structured framework or policy to follow. Instead, they mainly focus on identifying and
assessing risks related to health, safety and environment. Therefore, all the tools and
techniques used are solely based on the prior knowledge and experience of the project
manager or engineer and his or her team. All interviewees were shown various tools and
techniques used to evaluate project risks including brainstorming, risk matrix, Hazard
Identification (HAZID) and Hazard and Operability (HAZOP), lessons learned, expert
judgment, workplace risk assessment, Quantitative Risk Assessment (QRA) and Monte Carlo
simulations. According to participants, the most frequently used techniques are brainstorming
sessions and risk matrix. The other techniques are less commonly used, especially Monte
Carlo simulations. This finding echoes the findings of the academic literature, as many
scholars believe that, despite the many tools available project risk assessment, the majority of
project risk management practices are limited to using risk-ranking tools (e.g. risk matrix)
(Cagliano et al., 2015; Mojtahedi et al., 2010; Osabutey et al., 2013; Whitfield, 2015). Only
simple techniques are used to evaluate risks within the Libyan oil and gas industry. This
could be because the industry does not appreciate the value of having proper project risk
management practices in place. One reason for this, according to Ahlemann, El Arbi, Kaiser,
and Heck (2013), is that risk management applications are considered to have several issues,
such as non-acceptance in practice, limited effectiveness and vague application situations. In
addition, Ibbs and Kwak (2000) and Zwikael and Globerson (2006) identify a gap in the area,
confirming that risk management practices are infrequently applied in many projects.
Surprisingly, even in large and complex projects, their application rates are still very low.
When participants asked about the effectiveness of the current tools and techniques they used
to identify and evaluate project risks, most of the participants believed that applying these
techniques could enhance project performance. One participant mentioned, ‘Of course it
[applying the tools and techniques to evaluate project risks] does improve the success rate of
the project because you will have a plan in advance’. De Carvalho and Rabechini (2015)
argue that applying project risk management practices can have a positive influence on
project success, emphasising the importance of having a risk manager available for the
project, as this could have a positive impact on the project outcome. Only two interviewees
did not seem very optimistic about these tools and techniques. They did not think they are
very effective. One respondent stated, ‘…I do not think they are very effective’. One reason
for this was mentioned by one of the interviewees: ‘All of the available techniques rely on the
input data, so if people involved with the data input process have accurate readings, then the
results will be accurate, as this is strongly related to the truth level of the input data’.
Another reason could be that the accuracy of the data depends on the person’s own
experience and knowledge. To this end, de Carvalho and Rabechini (2015) emphasise the

688
importance of soft skills in performing the project risk management process, stressing the
significance of combining both soft and hard skills as a crucial factor in increasing project
success. According to Grabher (2004) and Söderlund and Maylor (2012), soft skills are
defined as the management of interpersonal relationships allowing the different people
involved in the project to work together, while hard skills are mainly centred on
administrative activities and the available toolsets to facilitate them.
Therefore, it is evident from the opinions of the participants that project risk management
could improve project performance; however, within the Libyan context, it is also evident
that no clear written framework guiding the project manager or his or her team to follow or
facilitate the process currently exists. One possible reason for not implementing an efficient
project risk management process could be as a result of the organisational culture. Different
scholars (see Crawford, Morris, Thomas and Winter (2006); Sharma and Gupta (2012)) point
to the influence of organisational context on risk management. These contexts include
organisational culture, climate and demographics. Other factors that can influence the project
risk management process, according to Gladwell (2012) and Söderlund and Maylor (2012),
include the beliefs, power conflicts, judgement and trust of individuals. One would argue that
to achieve an effective project risk management strategy, strong leadership is required to
enforce these practices. According to Thamhain (2013), in order to establish a strong and
effective project risk management process within an organisation there must be
comprehensive participation and collaboration throughout all divisions of the project team
and its setting. Thus, to ensure the effective implementation of project risk management
within the Libyan oil and gas industry, making use of the value of its supportive tools and
techniques, there should be a strong relationship between all team members including the
decision-makers and top managers.
5. CONCLUSION AND WAY FORWARD
The aim of this paper was to explore the effectiveness of project risk management practices
within the Libyan oil and gas industry. Ensuring that risks are identified, assessed, controlled
and mitigated are the key steps of the project risk management process because unmanaged
risks can cause significant issues throughout a project’s life cycle, potentially affecting
overall project performance. This paper identified a positive relationship between performing
risk management and project performance, although some scholars noted in the academic
literature do no support this argument. Different tools and techniques are available to support
the process of conducing project risk management practices. Although there is no structured
written risk management framework or procedure within the Libyan oil industry, most
participants strongly believe that applying project risk management practices with the help of
available tools and techniques could increase the project performance in the Libyan oil and
gas industry. However, findings also showed that, even though there are different tools and
techniques, only the simple ones are used (namely brainstorming and risk matrix). This paper
concluded that establishing an organisational culture that supports the founding of a written
risk management guideline or procedure, supports project manager leadership and ensures the
familiarity of individuals with the project risk management tools, techniques and concepts,
will increase the effectiveness of project risk management and project performance within the
Libyan oil and gas industry.

689
6. REFERENCES
Ahlemann, F., El Arbi, F., Kaiser, M. G., & Heck, A. (2013). A process framework for theoretically grounded
prescriptive research in the project management field. International Journal of Project Management, 31(1),
43–56.
Al Subaih, A. (2015). Integrated Project Delivery: A Paradigm Shift for Oil and Gas Projects in the UAE and
the Middle East Region. Oil and Gas Facilities, 4(04), 64–77. doi:10.2118/171722-PA
APM. (2004). PRAM - Project Risk Analysis and Management guide. Buckinghamshire: APM Publishing.
Aven, Vinnem, J. E., & Wiencke, H. S. (2007). A decision framework for risk management, with application to
the offshore oil and gas industry. Reliability Engineering & System Safety, 92(4), 433–448.
doi:http://dx.doi.org/10.1016/j.ress.2005.12.009
Baloi, D., & Price, A. D. (2003). Modelling global risk factors affecting construction cost performance.
International Journal of Project Management, 21(4), 261–269.
Bannerman, P. L. (2008). Risk and risk management in software projects: A reassessment. Journal of Systems
and Software, 81(12), 2118–2133.
Baumeister, C., & Kilian, L. (2016). Forty Years of Oil Price Fluctuations: Why the Price of Oil May Still
Surprise Us.
Becker, K., & Smidt, M. (2016). A risk perspective on human resource management: A review and directions
for future research. Human Resource Management Review, 26(2), 149–165.
doi:http://dx.doi.org/10.1016/j.hrmr.2015.12.001
Benta, D., Podean, M., & Mircean, C. (2011). On Best Practices for Risk Management in Complex Projects.
Informatica Economica Journal, 15(2), 142–152.
Besner, C., & Hobbs, B. (2012). The paradox of risk management; a project management practice perspective.
International Journal of Managing Projects in Business, 5(2), 230–247. doi:10.1108/17538371211214923
Brandt, H., Sarif, M., & Mohd, S. (2013). Life extension of offshore assets-Balancing safety & project
economics. Paper presented at the SPE Asia Pacific Oil and Gas Conference and Exhibition.
Briel, E., Luan, P., & Westney, R. (2013). Built-In Bias Jeopardizes Project Success. Oil and Gas Facilities.
doi:10.2118/0413-0019-OGF
Cagianelli, M., Michelez, J., & Nava, F. (2015a). Integrated Risk Management to Meet the Challenges of
Today’s Oil&Gas Industry. Paper presented at the Offshore Mediterranean Conference., Ravenna,
Italy.
Cagianelli, M., Michelez, J., & Nava, F. (2015b). Integrated Risk Management to Meet the Challenges of
Today’s Oil&Gas Industry. Paper presented at the Offshore Mediterranean Conference., Ravenna, Italy.
Cagliano, A. C., Grimaldi, S., & Rafele, C. (2015). Choosing project risk management techniques. A theoretical
framework. Journal of Risk Research, 18(2), 232–248.
Carter, B., & Hancock, T. (1994). J. Morin, and N. Robins. Introducing RISKMAN methodology: Blackwell
Ltd.
Carvalho, M. M. d., & Rabechini Junior, R. (2015). Impact of risk management on project performance: the
importance of soft skills. International Journal of Production Research, 53(2), 321–340.
Cervone, H. F. (2006). Project risk management. OCLC Systems & Services: International digital library
perspectives, 22(4), 256–262. doi:10.1108/10650750610706970
Crawford, L., Morris, P., Thomas, J., & Winter, M. (2006). Practitioner development: From trained technicians
to reflective practitioners. International Journal of Project Management, 24(8), 722–733.
de Bakker, K., Boonstra, A., & Wortmann, H. (2012). Risk managements' communicative effects influencing IT
project success. International Journal of Project Management, 30(4), 444–457.
de Carvalho, M. M., & Rabechini, R. (2015). Impact of risk management on project performance: the
importance of soft skills. International Journal of Production Research, 53(2), 321–340.
doi:10.1080/00207543.2014.919423
Deloitte. (2015). Oil and Gas Reality Check 2015: A look at the top issues facing the oil and gas sector.
Retrieved from London: http://www2.deloitte.com/content/dam/Deloitte/global/Documents/Energy-and-
Resources/gx-er-oil-and-gas-reality-check-2015.pdf
Denney, D. (2006). Stage-Gate Project-Management Process in the Oil and Gas Industry. Society of Petroleum
Engineers. doi:10.2118/1206-0068-JPT
Ehsan, E. (2013). Risk management: the next source of competitive advantage. Foresight, 15(2), 117–131.
doi:10.1108/14636681311321121
Elkington, P., & Smallman, C. (2002). Managing project risks: a case study from the utilities sector.
International Journal of Project Management, 20(1), 49–57.
EY. (2014). Spotlight on oil and gas megaprojects. Retrieved from London:
http://www.ey.com/Publication/vwLUAssets/EY-spotlight-on-oil-and-gas-megaprojects/$FILE/EY-
spotlight-on-oil-and-gas-megaprojects.pdf
690
EY. (2015). Joint ventures for oil and gas megaprojects. Retrieved from London:
http://www.ey.com/Publication/vwLUAssets/ey-joint-ventures-for-oil-and-gas-megaprojects/$FILE/ey-
joint-ventures-for-oil-and-gas-megaprojects.pdf
Firmenich, J., & Firmenich, J. (2017). Customisable framework for project risk management. Construction
Innovation, 17(1), 68–89.
Ghosh, S., & Jintanapakanont, J. (2004). Identifying and assessing the critical risk factors in an underground rail
project in Thailand: a factor analysis approach. International Journal of Project Management, 22(8), 633–
643. doi:http://dx.doi.org/10.1016/j.ijproman.2004.05.004
Gladwell, M. (2012). Blink: The Power of Thinking Without [thinking]: CNIB.
Grabher, G. (2004). Learning in projects, remembering in networks? Communality, sociality, and connectivity
in project ecologies. European urban and regional studies, 11(2), 103–123.
Harris, E. (2009). Strategic project risk appraisal and management: Gower.
Hillson, D., & Murray-Webster, R. (2007). Understanding and managing risk attitude. Aldershot: Aldershot :
Gower.
Ibbs, C. W., & Kwak, Y.-H. (2000). Assessing project management maturity.
Khatib, H. (2014). Oil and natural gas prospects: Middle East and North Africa. Energy Policy, 64, 71–77.
Liu, J., Meng, F., & Fellows, R. (2015). An exploratory study of understanding project risk management from
the perspective of national culture. International Journal of Project Management, 33(3), 564–575.
doi:http://dx.doi.org/10.1016/j.ijproman.2014.08.004
Long, R. J. (2015). Typical Problems Leading to Delays, Cost Overruns, and Claims on Process Plant and
Offshore Oil and Gas Projects. Retrieved from Littleton, Colorado: http://www.long-
intl.com/articles/Long_Intl_Typ_Prob_Lead_to_Delay-Cost_Overruns-Claims_on_Proj_Pl-
OffShore_OG_Proj.pdf
Lyon, B. K., & Hollcroft, B. (2012). Risk Assessments: Top 10 Pitfalls & Tips for Improvement. American
Society of Safety Engineers.
Marle, F., & Vidal, L.-A. (2011). Project risk management processes: improving coordination using a clustering
approach. Research in Engineering Design, 22(3), 189–206. doi:10.1007/s00163-011-0106-9
Massingham, P. (2010). Knowledge risk management: a framework. Journal of Knowledge Management, 14(3),
464–485. doi:10.1108/13673271011050166
Merrow, E. (2012). Oil and gas Industry Megaprojects: Our Recent Track Record. Oil and Gas Facilities, 38–42.
doi:10.2118/153695-PA
Mojtahedi, S. M. H., Mousavi, S. M., & Makui, A. (2010). Project risk identification and assessment
simultaneously using multi-attribute group decision making technique. Safety science, 48(4), 499–507.
Osabutey, D., Obro-Adibo, G., Agbodohu, W., & Kumi, P. (2013). Analysis of risk management practices in the
oil and gas industry in Ghana. Case study of Tema Oil Refinery (TOR). European journal of business and
management, 5(29).
Pitsis, T. S., Kornberger, M., & Clegg, S. (2004). The art of managing relationships in interorganizational
collaboration. M@ n@ gement, 7(3), 47–67.
PMI. (2013). A Guide to the Project Management Body of Knowledge (PMBOK Guide). Newtown Square,
Pennsylvania: Project Management Institute.
Rabechini Junior, R., & Monteiro de Carvalho, M. (2013). Understanding the Impact of Project Risk
Management on Project Performance: an Empirical Study. Journal of technology management &
innovation, 8(suppl 1), 6–6. doi:10.4067/s0718-27242013000300006
Raz, T., Shenhar, A. J., & Dvir, D. (2002). Risk management, project success, and technological uncertainty.
R&D Management, 32, 101–109.
Rogers, V. C., & Ethridge, J. R. (2013). Enterprise Risk Management In The Oil And Gas Industry: An Analysis
Of Selected Fortune 500 Oil And Gas Companies' Reaction In 2009 And 2010. American Journal of
Business Education (Online), 6(6), 577.
Salas, R. (2015). Managing Risks at the Early Phases of Oil and Gas Major Capital Projects. Paper presented at
the Health, Safety, Security and Environmental Conference-Americas, Denver, Colorado, USA.
Salazar-Aramayo, J. L., Rodrigues-da-Silveira, R., Rodrigues-de-Almeida, M., & de Castro-Dantas, T. N.
(2013). A conceptual model for project management of exploration and production in the oil and gas
industry: The case of a Brazilian company. International Journal of Project Management, 31(4), 589–601.
doi:http://dx.doi.org/10.1016/j.ijproman.2012.09.016
Sharma, A., & Gupta, A. (2012). Impact of organisational climate and demographics on project specific risks in
context to Indian software industry. International Journal of Project Management, 30(2), 176–187.
Söderlund, J., & Maylor, H. (2012). Project management scholarship: Relevance, impact and five integrative
challenges for business and management schools. International Journal of Project Management, 30(6), 686–
696.

691
Srivastava, A., & Gupta, J. P. (2010). New methodologies for security risk assessment of oil and gas industry.
Process Safety and Environmental Protection, 88(6), 407–412.
doi:http://dx.doi.org/10.1016/j.psep.2010.06.004
Suslick, S. B., & Schiozer, D. J. (2004). Risk analysis applied to petroleum exploration and production: an
overview. Journal of Petroleum Science and Engineering, 44(1–2), 1–9.
doi:http://dx.doi.org/10.1016/j.petrol.2004.02.001
Thamhain, H. (2013). Managing risks in complex projects. Project Management Journal, 44(2), 20–35.
Ward, S. C., & Chapman, C. B. (1995). Risk-management perspective on the project lifecycle. International
Journal of Project Management, 13(3), 145–149. doi:http://dx.doi.org/10.1016/0263-7863(95)00008-E
Whitfield, S. (2015). Managing Nontechnical Risk in Offshore Projects. SPE-1015-0016-OGF.
doi:10.2218/1015-0016-OGF
Zhao, X., Hwang, B.-G., & Gao, Y. (2016). A fuzzy synthetic evaluation approach for risk assessment: a case of
Singapore's green projects. Journal of Cleaner Production, 115, 203–213.
doi:http://dx.doi.org/10.1016/j.jclepro.2015.11.042
Zou, P. X., Zhang, G., & Wang, J. (2007). Understanding the key risks in construction projects in China.
International Journal of Project Management, 25(6), 601–614.
Zwikael, & Ahn, M. (2011). The effectiveness of risk management: an analysis of project risk planning across
industries and countries. Risk analysis, 31(1), 25–37.
Zwikael, & Globerson, S. (2006). From critical success factors to critical success processes. International
Journal of Production Research, 44(17), 3433–3449.
Zwikael, & Sadeh, A. (2007). Planning effort as an effective risk management tool. Journal of Operations
Management, 25(4), 755–767.

692
ID 140
A STUDY OF BARRIERS TO ACHIEVEMENT OF VALUE FOR
MONEY IN PUBLIC CONSTRUCTION PROJECTS PROCURED
UNDER THE NIGERIAN PUBLIC PROCUREMENT ACT (2007)
I. D. Obieje and G. Wood
School of the Built Environment, University of Salford, Salford, M5 4WT, UK
Email: [email protected]
Abstract: In 2007, the Nigerian legislative arm of government enacted an Act of Parliament
known as the Public Procurement Act (PPA 2007) to govern the public-sector procurements.
The PPA (2007) amongst other objectives, aim to achieve value for money from government
procurements. However, the reality for public construction procurements would suggest that
this aim for value for money is not being achieved. Review of existing body of knowledge
indicate apparent lack of in-depth qualitative understanding why this problem is occurring and
how it may be improved. Adopting a qualitative research method design, and following a case
study strategy, this study attempts a contribution to what is currently known about the
problem. Data was collected through semi-structured in-depth interviews of construction
project participants, targeting their experiences, reflections and opinions on case project
procurement. Analysis was via thematic content analysis technique. Preliminary findings
indicate that the causal factors why achievement of value for money was limited in scope was
mainly due to excessive government bureaucracy, contractual disputes, rushed pre-contract
period, scope variations, poor facility management planning, and lack of PPA (2007)
compliance monitoring by external organizations. Addressing these factors could help public
procurement practitioners make future improvements.
Keywords: Nigerian Public Procurement Act (2007), qualitative research, value for money.
1. INTRODUCTION
Nigeria has witnessed series of public sector reforms especially since 1999 when the country
returned to a civil democratic system of government after many years of military dictatorship.
Notable is the reforms on government procurements which culminated to an Act of
parliament known as the Public Procurement Act of 2007 or PPA (2007) for short. Ude &
Ahmadu (2013) suggests that the policy objective of this Act could be inferred from section
16 of the Act which states that:
“all public procurement shall be conducted … in a manner which is transparent, timely,
equitable for ensuring accountability and conformity with this Act and regulations deriving
therefrom; with the aim of achieving value for money and fitness for purpose; in a manner
which promotes competition, economy and efficiency”.
Therefore, it could be concluded that one of the basic aim of the PPA (2007) is to help
achieve value for money in government procurements.
However, many years after the enactment of the PPA (2007), there are evidence in literature
which suggest that this aim is not being achieved especially in construction procurement.
What is not evident in literature however, is why the implementation of the Act to
construction procurement is achieving limited success in terms of achievement of and how

693
achievement of value for money may be improved. Review of literature indicates that the
PPA (2007) is faced with many challenges which mitigate its effective implementation.
However, there are no empirical evidence linking these challenges to PPA (2007)
underachievement as regards value for money. In addition, evidence from current literatures
mainly relied on secondary data sources and/or quantitative assessment of practitioners’
collective opinion and experiences across a number projects.
This paper contends that profound rich picture understanding of the challenges limiting the
achievement of value for money based on in-depth qualitative investigation would be a
valuable addition to what is currently known and can lead to suggestions on how future
improvement could be made. It therefore presents evidence of challenges limiting the scope
of achievement of value for money on public construction procurement based on in-depth
qualitative study of the implementation of the PPA (2007) from a real-life construction
project context. These are preliminary findings from an on-going doctoral research study
aimed at developing a framework for implementation of the Nigerian Pubic Procurement Act
(2007) that will improve achievement of value for money on public construction
procurement.
2. LITERATURE REVIEW
2.1 Value for Money Concept
Value for money (VfM for short) is a phrase in common use, but for practical purposes,
attaching a precise meaning to it has been described as inconsistent and problematic
(MacDonald, et al, 2012; Glendinning, 1988). Various definitions of value for money exist in
literature, for example, Glendinning (1988), HM Treasury (2006), Barnett, et al (2010), DFID
(2011), National Office Audit (2013), etc. However, MacDonald, et al (2012) suggests that
the more considered meaning of VfM recognize that value has many dimensions beyond the
conventional economic rationalization perspective and includes social and environmental
objectives and other intangible deliverables such as relationships, leadership, learning,
reputation and trust. Accordingly Dewulf, et al, (2012, p.122) submits that VfM is not a
unitary concept but a social construct which has become institutionalized in terms of what
public auditors do in its name.
From the PPA (2007) point of view, no express definition of VfM was provided in the
document, but the Director-General of the Nigerian Bureau of Public Procurement (BPP)
defined VfM from the “Bureau’s perspective” as:
“the term used to gauge whether or not an entity has derived maximum benefit from the
goods, works and services it acquired and/or provides, within the resources available to it.
Not only a measure of cost of goods and services, but also taking into account the
combination of Quality, Cost, Resource utilization, Fitness for Purpose, Timeliness and
Convenience to judge whether or not, when taken together, they constitute good value”
(Ezeh, 2012).
The BPP is a public agency created by the PPA (2007) to oversee the implementation of the
provision of the Act and formulate general policies and guidelines relating to public sector
procurement.

694
2.2 Value for Money in Public Procurement of Construction
Public procurement of is the process through which the State acquires goods, works and
services needed to fulfil its social and economic functions. VfM in public construction
procurement, going by the forgoing definitions of VfM, would imply the explicit
commitment to ensuring best results possible are obtained from money spent in acquiring
construction works. Public construction projects fulfill strategic needs. According to
Watermeyer (2013), construction of public infrastructure creates value through the economic
and social activities the infrastructure support. Staples (2010) also suggests that the public
sector might decide to spend more than is economically rational to achieve better whole-of-
government outcome such as development of Small and Medium Scale Enterprises (SMEs),
training of Apprentices or providing employment for at risk unemployed youths. Therefore, it
could then be inferred that public-sector construction delivers value both as an end product as
well as a means-to-an-end. Arrowsmith, et al, (2011, p. 5) opines that the objective of
achieving value for money is a central to most public sector procurement.
However, the reality for public construction projects in Nigeria, would suggest that there is a
limited scope of achievement of value for money as the PPA (2007) has aimed. Symptoms
indicating that there are problems with public sector construction procurements in this regard
which are evident in literature includes: high cost of construction works, construction cost
over-runs, construction time over-runs, poor quality of works, increasing cases of re-work,
use of in-efficient procurement strategies, and abandonment of projects (Bima, et al, 2015;
Ajayi & Oyeyipo, 2015; Adegboye, 2014; Ekung, et al, 2013; Ade-ojo & Babalola, 2013;
Shittu, et al 2013; Shwarka & Anigbogu, 2012; Onyema, 2011; Ibrahim & Musa-Haddary,
2010; Ayangade, et al, 2009; Olatunji, 2008).
2.3 The Nigerian Public Procurement Act (2007)
The Nigerian Public Procurement Act (2007) is an Act of parliament enacted by the Nigerian
legislative arm of government. Williams-Elegbe (2012b, p.346) described the Act as a
comprehensive statute, which created new institutions, new obligations for procuring
authorities and strengthened existing ones, instituted the use of competitive procurement
procedures; created a system of supplier remedies; a debarment mechanism and also created
several procurement related offenses. It is made up of sixty-one sections divided into thirteen
parts, covering the steps for procurement process, from procurement planning to contract
award, and these are to be supplemented by the regulations issued from time to time by the
Bureau of Public Procurement (BPP) (Udeh & Ahmadu, 2013). All procurement by the
Nigerian public sector and other sectors where public contribution to funding is up to 35% of
the total fund must follow the provisions of the Act (PPA, 2007).
The enactment of the PPA (2007) was a response to the deficiencies of the public
procurement regime which existed before it. This regime was characterized with allegation
of abuse and irregularities, loss and diversion of public fund due to inflated contract sums,
over invoicing, “white elephant” projects, award of contracts to friends and cronies, use of
primordial considerations in procurement decisions, non-transparent and flawed processes
that yielded incompetent contractor which were linked to project failures, endemic
corruption, poor service delivery, denial of social amenities to the people and collapse of
local industries and infrastructure (Olatunji, 2008; Ezeh, 2011; Aladeloba, 2012; Shwarka

695
and Anigbogu, 2012; Olatunji, et al, 2016). It could be summed up that the public sector’s
procurement expenses in those days did not deliver value for money to the public.
The PPA (2007) is a decent of 1994 UNCITRAL Model Law on Procurement of Goods,
Construction and Services which according to Udeh & Ahmadu (2013) is representative of
international standard and best practices. The minimal impact of the law may very well lie
within its implementation or lack of it. Amemba, et al, (2015), suggests that poor
performance of public sector procurement results from non-adherence to laid-down process
and procedure.
2.4 Challenges with PPA (2007) Implementation
There are compelling evidence in literature on challenges with public procurement
implementation generally in Nigeria. These can be grouped under procurement personnel
competence issues, organization and management issues, ethical issues, ambiguity or
misinterpretations of PPA (2007) provisions, etc. For public construction procurement,
Familoye, et al, (2015) identified sixteen (16) of these challenges and assessed them to
determine the most significant by quantitative survey of practitioners’ opinion. It concluded
that procurement practitioners ranked ‘Size and Complexity of procurement’, ‘Political
interference’ and ‘Shortage of public procurement practitioners’ as the top three (3)
significant challenges facing the effective implementation of PPA (2007). It did not however,
provide evidence towards what can be concluded in terms of the ability of the PPA (2007) in
achieving its stated aim for achievement of value for money on account of these
implementation challenges.
Generally, most literature on application of PPA (2007) to public procurement lack evidence
based on in-depth qualitative understanding of the implementation of PPA (2007) to
construction; why the PPA (2007) is having limited scope of achievement in-terms of value
for money and how improvements could be made. This can be inferred from Table 2, a
summary of literatures sources on application of the PPA (2007) to government procurement
and their sources for evidence.
Overall, evidence from existing literature mainly relied on secondary literature sources and
on practitioners’ collective reflections and experiences across a number projects over some
period of time based on a quantitative survey. There is need therefore to deepen current
understanding of the problem through a more in-depth study to get richer qualitative
assessment and interpretation of experiences on a project by project basis.
3. RESEARCH METHODOLOGY
The purpose of this study is to investigate the issues limiting the achievement of VfM in
public construction procurement under the rules of the Nigerian Public Procurement Act
(2007). Opinions in literature suggests that the judgement about achievement of value for
money is subjective and depends on viewpoint of the assessor, varying from one individual to
another and also form one point in time to another (Glendinning, 1998; Erikshammar, et al,
2010; Dewulf, et al, 2012; MacDonald, et al, 2012). Also, literatures focusing on the
implementation of the Nigerian PPA (2007) in construction mainly relied on positivist
quantitative analysis of primary data across a number of projects over some period of time
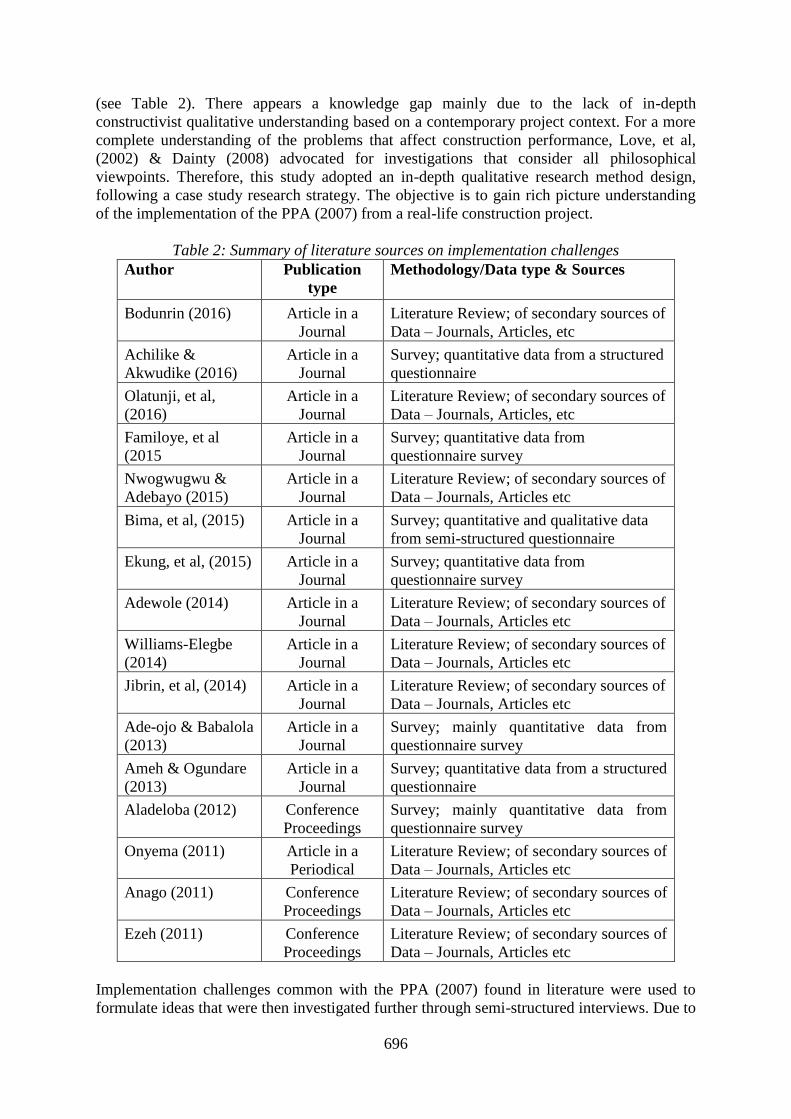
696
(see Table 2). There appears a knowledge gap mainly due to the lack of in-depth
constructivist qualitative understanding based on a contemporary project context. For a more
complete understanding of the problems that affect construction performance, Love, et al,
(2002) & Dainty (2008) advocated for investigations that consider all philosophical
viewpoints. Therefore, this study adopted an in-depth qualitative research method design,
following a case study research strategy. The objective is to gain rich picture understanding
of the implementation of the PPA (2007) from a real-life construction project.
Table 2: Summary of literature sources on implementation challenges
Author Publication
type
Methodology/Data type & Sources
Bodunrin (2016) Article in a
Journal
Literature Review; of secondary sources of
Data – Journals, Articles, etc
Achilike &
Akwudike (2016)
Article in a
Journal
Survey; quantitative data from a structured
questionnaire
Olatunji, et al,
(2016)
Article in a
Journal
Literature Review; of secondary sources of
Data – Journals, Articles, etc
Familoye, et al
(2015
Article in a
Journal
Survey; quantitative data from
questionnaire survey
Nwogwugwu &
Adebayo (2015)
Article in a
Journal
Literature Review; of secondary sources of
Data – Journals, Articles etc
Bima, et al, (2015) Article in a
Journal
Survey; quantitative and qualitative data
from semi-structured questionnaire
Ekung, et al, (2015) Article in a
Journal
Survey; quantitative data from
questionnaire survey
Adewole (2014) Article in a
Journal
Literature Review; of secondary sources of
Data – Journals, Articles etc
Williams-Elegbe
(2014)
Article in a
Journal
Literature Review; of secondary sources of
Data – Journals, Articles etc
Jibrin, et al, (2014) Article in a
Journal
Literature Review; of secondary sources of
Data – Journals, Articles etc
Ade-ojo & Babalola
(2013)
Article in a
Journal
Survey; mainly quantitative data from
questionnaire survey
Ameh & Ogundare
(2013)
Article in a
Journal
Survey; quantitative data from a structured
questionnaire
Aladeloba (2012) Conference
Proceedings
Survey; mainly quantitative data from
questionnaire survey
Onyema (2011) Article in a
Periodical
Literature Review; of secondary sources of
Data – Journals, Articles etc
Anago (2011) Conference
Proceedings
Literature Review; of secondary sources of
Data – Journals, Articles etc
Ezeh (2011) Conference
Proceedings
Literature Review; of secondary sources of
Data – Journals, Articles etc
Implementation challenges common with the PPA (2007) found in literature were used to
formulate ideas that were then investigated further through semi-structured interviews. Due to

697
the nature of the phenomenon being investigated, the study relied mainly on socially
constructed reality of what value for money mean to the practitioners involved, through their
experiences, reflections and opinions. To get to contemporary issues, the study selected three
‘common case’ public sector construction projects, one each form Nigeria’s main three geo-
political regions of North, South-East and South-West. Semi-structured in-depth interviews
collected data from project participants about their experiences in-terms of achievement of
VfM, reflecting on the project. Participants sampled for interview include representatives of
the employer, project consultants, representatives of the contractors and the project
beneficiaries, all with direct involvement with the case project and conversant with the PPA
(2007) as in Proverbs & Gameson (2008).
Data analysis was done by Content analysis technique. The procedure was approached by
first sending all interview recordings to a professional transcriber for accurate verbatim
transcription. Interview transcripts were then formatted and uploaded into Nvivo 11 for Mac
software to facilitate coding. Thematic coding technique was used to group excerpts from the
interviews into themes following the interview agenda and other themes emerged during the
coding process. Coding at each theme was studied for similarities, contrasts and
contradictions. Deliberate search of specific data from project documents was done to
confirm findings from interviews, resolve contradiction or to gain additional insight on an
issue already raised from the interviews. Extensive use of direct quotations was used in
presenting findings and are indented and italicized for clarity. The objective was to stay as
close as possible to the data, and to avoid or minimize bias of reliance on latent content which
according to Robson (2002) is a matter for inference or interpretation.
4. FINDINGS
The following are preliminary findings of the study from one of the selected case projects,
involving six project participants.
4.1 Barriers to Achievement of Value for Money
A number of challenges faced during the procurement process of the case project became
barriers that limited the achievement of value for money in various ways. When asked why
the case project did not meet expectation on some key VfM metrics as earlier assessed by the
respondents themselves, opinions given based on their reflections are presented under the
following subheadings.
Prolongation
The respondents were concerned that the value for money achieved by the Case project was
limited in scope due to the time it took to complete the project. Construction of the project
was initially contracted for complete within two years, but it lasted over six years in the end.
There were concern about the time value of money lost due to prolongation, and the loss of
use or benefits of the facilities all through the years of delay.
“…. And I think if you were going to measure the opportunity cost in the loss, or in the
unavailability of the project, of the building, of the facilities for the beneficiaries to use in

698
the past four years; if you put that into monetary terms, then, maybe you would say it did
not have value for money, because it took too long”
Prolongation cascaded the project into deeper problems which further limited the scope of
VfM achieved on the project in-terms of increased cost due to market price volatility.
Cost escalation
When asked to assess the cost performance of the project, respondents were unanimous that
the project had not performed to expectations, although for some reasons. One reason cited
was the macro-economic realities that unfolded during project execution, which of course
were beyond the control of the project management in some sense.
“…. also taking into account the volatility of the economy, fluctuations here and there which
added to the cost of the project. I think the cost performance of the project (I wouldn’t say it
is spectacular) is a derivative of other things that occurred”
However, another respondent made a point to suggest that the prolongation of the project
meant that it was vulnerable to the realities that continued to unfold.
“… the project was taking longer and you’re sure, too, prices were changing on us”.
Then again, from the perspective of the Contractor Organization, expectations were not met
on the cost dimension, in-terms of losses or reduced profits.
“…. also, we had to execute works in the later part of the project based on the rates we had
at the beginning of the project. … because of the delay, we found that a lot of money was
actually lost”
Changes in project scope or variations
Variations are common to construction projects. However, respondents were concerned about
the limiting effects variations had on achievement of value for money. Some changes in
design caused in-efficiencies and wastages resulting from re-work.
“…. well, many of the re-works we did were not because of bad workmanship, but it was,
maybe, because the Architect or the Client had a re-think…”
There were changes that impacted the contractor’s ability to proceed diligently with the
works and these had impact on the overall project delivery time. One respondent cited an
example:
“… there was a requirement from the client that we do an extra basement because of the
general topography of where the hostel block was located. So, that actually held down the
project, in terms of time delivery …”

699
Some of the changes were attributed to external realities that became emergent or issue that
came up due to additional information that were not available during the design phase of the
project.
“… as technology changed we too, we changed too, to meet the state-of-the art technology.”
Notwithstanding the desirability or inevitability of this sorts of change, they had their
disruptive impact on progress as they have on budget because it appeared that Client
Organizations’ express approvals were required; and those approvals were not easy to come-
by.
There was also a suggestion that some changes encountered on the project were because of
late involvement of the Contractor in the procurement process. When asked to give an
assessment of the project delivery process in-terms of achievement of value for money, one
respondent pointed out the non-early involvement of contractor deficiency of the traditional
method of procurement adopted for the project.
“I think the traditional way of procurement delivery of design, bid and build have a lot of
inefficiency in it, …. a lot of these variations are things that, naturally, wouldn’t have come
up if the contractor was involved in the design process.”
However, this negative perspective of the traditional method of procurement was not shared
by most respondents. Most believe the procurement method was not a problem. However,
one respondent, albeit with a positive view of the traditional method, supported that some
variations would have been averted had the Contractor been involved early.
“I would say on the strategy for this project, the strategy has proved to be very efficient and
effective. However, we can’t go without saying that there were little conflicts between the
contractors and the consultant on the terms of buildability, construction method and, you
know, output in terms of availability of some of the materials that were specified”
Occupancy and maintenance issues
Another challenge that is viewed as a barrier to achievement of VfM by some of the
respondent bordered on effective facility management of the completed project, putting the
prior whole-life-cycle consideration of the project into question. Having delivered a facility
which in the opinion of most respondents, is a high quality state-of-the-art facility that is fit
for purpose, there are skepticism about the appropriate usage and maintenance of the
buildings that will guarantee the building will continue to maintain the quality standard
achieved during construction.
“…. it’s a highly-sophisticated building with sophisticated air-conditioning systems, you
know, and security systems, and all of that, in place. … it is of concern how this project is
going to fare in the next five years.”

700
Insufficient pre-contract period
Insufficiency of the time allocated to the design development and information documentation
phase of the procurement process was pointed out as one of the reasons that caused the delays
which contributed to the prolongation of the project. After the construction contract was
awarded, some design detailing were still ongoing and certain decisions were yet to be
finalized. One respondent recall the pre-contract phase as follows:
“I remember it was a very, very frantic rush.”
Bureaucratic bottlenecks
When asked about their experience with government bureaucracy on the project, most
respondents were unanimous on the prevalence of delays on project activities due to
bureaucracy in the Client Organization. According to the respondents, these delays affected
the contractor’s cash flow negatively and led to slowing down of the works, and sometimes
outright stoppage of works by the contractor.
“I remember one re-curing decimal where the contractor would stall work on site, reduce
their manpower and say, oh, they are unable to work because they haven’t been paid for
three months”.
Some delayed decisions by the Client Organization also had its impact on completion
program on items which stood on the critical path.
“…. bureaucratic bottlenecks occurred in terms of getting approvals for changes and
variations that stood at critical path and it took, sometimes, several weeks to get approvals
….” “.… major reason why the time performance expectation was not met was the delay in
the approval process [of the Client Organization] …”
Disregard of contract terms
While recounting the reasons why the case project failed to meet completion time, one
respondent suggested that not keeping to some key contractual terms by the Client
Organization led to disruptions to the work program that resulted in project prolongation.
“… also, an incident where the advance payment was amortized very quickly, very suddenly,
contrary to the terms of the contract, and all of this led to the situation where the contractor
says, I can’t deal with this, and they shut down the site”
Lack of PPA (2007) compliance monitoring
Compliance monitoring implementation by civil society groups, professional bodies, etc. is
one of the requirements of PPA (2007). This appear not to have been fully complied with as
the respondents could recall outside organizations attending the bid opening during tendering,
but cannot not recall any visits to site during the construction phase.

701
When asked how compliance monitoring can help improve achievement of value for money,
some respondents were quite optimistic that oversight compliance monitoring by an agency
outside the Client organization would help mitigate some of the challenges that became
barriers to achievement of value for money experienced in the project.
5. DISCUSSION OF FINDINGS
5.1 Causes of Barriers to Achievement of Value for Money
Generally, evidence so far appear to indicate that the primary reasons why the project had
limited achievement in the scope of value for money are due to project prolongation, cost
escalation, variations in scope, occupancy and maintenance concerns and in –efficient project
implementation process. It could be inferred that these are mainly management and
organizational issues and don’t seem to directly relate to Familoye, et al, (2015) three most
significant challenges facing the effective implementation of PPA (2007) of ‘Size and
Complexity of procurement’, ‘Political interference’ and ‘Shortage of public procurement
practitioners’. By applying Ishikawa diagram, Figure 24 is an attempt at cause-and-effect
analysis of why achievement of VfM was limited in scope for the case project, based on
current preliminary findings.
Figure 24: Barriers to achievement of value for money
Prolongation limited the scope of value for money achievable in more than one way. The
completed facility was not ready for use as expected by the stakeholders, thereby deferring
the benefits accruable or the need that the facility was meant to mitigate continued to be
endured for extra four years. Also, prolongation had a contributing effect on cost escalation,
another reason for limited scope of VfM, in the form of prolongation claims. Again, as the
project prolonged, market prices of basic materials were also escalating due to macro-
economic reason.

702
In addition to the cascading effect of project prolongation on cost, findings indicate that cost
escalation was also caused by scope variations that led to wastages, progress disruption and
rework. Although, it could be argued that benefits of changes in project scope that targeted
increases or improvement of the project’s value proposition but had negative impact on the
other value for money dimensions is much of an individual’s judgement. In terms of a Public-
sector project, involving several and diverse individuals, this judgement could become
complicated (Glendinning, 1988).
Respondents also believe that the project would have performed better in terms of
achievement of value for money if there were PPA (2007) compliance monitoring by an
external organisation and adequate whole-life approach to procurement planning that will
consider facility management issues during the project design phase. Bello, et al (2013) had
argued that ensuring value for money on a whole-life basis has been only a presumption of
the PPA (2007).
6. CONCLUSION
This paper has presented barriers to achievement of value for money on public construction
procurement under the Nigerian Public Procurement Act (2007) based on in-depth qualitative
investigation on a contemporary public construction project context. These are however,
preliminary finding from an on-going doctoral research study. So far, findings indicate that
the compelling reason why the project has limited achievement in the scope of value for
money is because of the undue project prolongation caused mainly by excessive government
bureaucracy, contractual disputes, insufficient pre-contract period, variations to scope, poor
facility management planning, and lack of PPA (2007) compliance monitoring by external
organization. Therefore, it would appear that success factors for improving the scope of value
for money achievable for public-sector procurement under the regulatory framework of the
PPA (2007) will include the following: allocation of sufficient time for pre-contract activities,
minimization of scope variations, measures to mitigate or minimize payment delays,
Measures to mitigate or minimize approval delays, reduction of contractual disputes,
adequate advance planning for facility management of completed facility, PPA (2007)
compliance monitoring by external organization.
7. REFERENCES
Achilike, N. I., & Akuwudike, H. C. (2016). The Impact of Due Process Policy on Construction Projects in
South East Nigeria. European Journal of Business and Management, 8(22), 85-91.
Adegboye, K. (2014, February 3). Experts decry high cost of construction in Nigeria. Vanguard News, p.
[online].
Ade-ojo, C. O., & Babalola, A. A. (2013). Cost and Time of Construction Projects under the Due Process
Reforms in Nigeria. Research Inventy: International Journal of Engineering And Science, 3(6), 01-06.
Adewole, A. (2014). Governance Reform and the Challenge of Implementing Public Procurement Law Regime
across Nigeria State and Local Governments. International Journal of Public Administration and
Management Research (IJPAMR), 2(4), 25-32.
Ajayi, O., & Oyeyipo, O. (2015). Effect of Rework on Project Performance in Building Projects in Nigeria.
International Journal of Engineering Research & Technology (IJERT), 4(02), 294-300.
Aladeloba, A. S. (2012). Effectiveness of Due Process Unit of Nigeria - Construction Proffessionals' Veiw.
COBRA. London: RICS.
Ameh, J. O., & Ogundare, O. (2013). Impact of Due Process Policy on Construction Projects Delivery in
Nigeria. Journal of Building Performance, 4(1), 13-23.

703
Anago, I. T. (2011). Public Procurement Act: A Vehicle for Accountability and Value-for-Money in Building
and Construction. Proceedings of the 1st Building & Construction Economic Round-Table [BCERT 3] (pp.
165-180). Abuja: Quantity Surveyors Registration Board of Nigeria.
Ayangade, J. A., Wahab, A. B., & Alake, O. (2009). An Investigation of the Performance of Due Process
Mechanism in the Execution of Construction Projects in Nigeria. Civil Engineering Dimension, Vol 11(1),
1-7.
Barnett, C., Barr, J., Christie, A., Duff, B., & Hext, S. (2010). Measuring the Impact and Value for money of
Governance and Conflict Programme. DFID.
Bello, F. M., Doko, A. I., & Kolo, B. A. (2013). Whole Life Costing in Procurement of Public Buildings in
Nigeria. In S. Laryea, & S. Agyepong (Ed.), Procs 5th West Afria Built Enviroment Research (WABER)
Conference, (pp. 1191-1201). Accra, Ghana.
Bima, A. M., Tafida, A., & Baba, D. L. (2015). Appraisal of Construction Project Procurement Policies in
Nigeria. American Journal of Engineering Research, 4(3), 19-24.
Bodurin, A. K. (2016). Emperical Review and Analysis of Public Procurement Practices in Nigeria: Challenges
and Prospects. Public Policy and Administration Research, 6(3), 128-135.
Dainty, A. (2008). Methodological pluralism in construction management. In A. Knight, & L. Ruddock,
Advanced Research Methods in the Built Environment (pp. 1-13). West Sussex: Wiley-Blackwell.
Dewulf, G., Blanken, A., & Bult-Spiering, M. (2012). Strategic issues in Public-Private Partnerships (2nd ed.).
John Wiley & sons, Ltd.
DFID. (2011). Department for International Development's Approach to Value for Money.
Ekung, S., Siriwardena, M., & Adeniran, L. (2013). Optimised Selection and Use of Project Procurement
Strategy in Nigeria: A Practical Case Study. Ethiopian Journal of Enviromental Studies and Management,
6(6), 661-669.
Ezeh, E. (2011). The Public Procurement Act 2007 as an Anti-Corruption Tool. Proceedings of the 2011
Quantity Surveying Assembly and Colloquium (pp. 51-56). Abuja: Quantity Surveyors Registration Board
of Nigeria.
Ezeh, E. (2012). Acheiving Value for Money in Building and Construction Projects. Proceedings of the 2nd
Annual Building & Construction conomic Round-Table [BCERT2] (pp. 77-81). Abuja: Quantity Surveyors
Registration Board of Nigeria.
Familoye, O., Ogunsemi, D. R., & Awodele, O. A. (2015, November). Assessment of the challenges facing the
effective operation of the Nigeria Public Procurement Act 2007. International Journal of Economics,
Commerce and Management, III(11), 957-968.
Glendinning, R. (1988). The Concept of Value for Money. International Jornal of Public Sector Management,
1(1), 42-50.
HM Treasury. (2006). Value for Money Assessment Guide. Norwich: Her Majesty Stationery Office.
Ibrahim, A. D., & Musa-Haddary, Y. G. (2010). Concept of Value for Money in Public Infrastructure
Development. Paper Presented at the International Workshop organised by NIQS at Abuja, July 13-15,
2010.
Jibrin, M. S., Ejura, S. B., & Augustine, N. I. (2014, October). The Public Procurement Reform in Nigeria:
Implimentation and Compliance Challenges. Journal of Asian Business Strategy, 149-162.
Love, P. D., Holt, G., & Li, H. (2002). Triangulation in construction management research. Engineering,
Construction and Architectural Management, 9(4), 294-303.
MacDonald, C., Walker, D. H., & Moussa, N. (2012). Value for money in project alliances. International
Journal of Managing Projects in Business, 5(2), 311-324.
National Audit Office. (2013). Getting Value for Money from Procurement. Retrieved June 30, 2015, from
National Audit Office: http://www.nao.org.uk/wp-content/uploads/2013/02/vfmprocurementguide.pdf
Olatunji, O. A. (2008). Due Process and Contractor Selection for Public works in Nigeria. Building Abroad:
Procurement of Construction and Reconstruction Projects in the International Context, 385-395.
Olatunji, S. O., Olawumi, T. O., & Odeyinka, H. A. (2016). Nigeria's Public Procurement Law - Puissant Issues
and Projected Amendments. Public Policy and Administrative Research, 6(6), 73-85.
Onyema, E. (2011, September 2011). Challenges and prospects of public procurement practice in Nigeria: An
analysis. Nigeriaworld, p. (online).
PPA. (2007). Public Procurement Act. Abuja: Federal Republic of Nigeria.
Proverbs, D., & Gameson, R. (2008). Case study research. In A. Knight, & L. Ruddock (Eds.), Advanced
Research Methods in the Built Environment (pp. 99-110). Chichester, UK,: Wiley-Blackwel.
Robson, C. (2002). Real World Research: a resource for social scientists and practitioner-researchers (2nd ed.).
Oxford: Blackwell.
Shittu, A. A., Adamu, A. D., Mohammed, A., Suleiman, B., Isa, R. B., Ibrahim, K., et al. (2013). Appraisal of
Building Defects Due To Poor Workmanship In Public Building Projects In Minna, Nigeria. IOSR Journal
of Engineering (IOSRJEN), 3(9), 30-38.

704
Shwarka, S. M., & Anigbogu, N. A. (2012). Impact of the Public Procurement Reform on public building
projects delivery in Nigeria. In S. D. Smith (Ed.), Procs 28th Annual ARCOM Conference (pp. 969-977).
Edinburgh, UK: Association of Researchers in Construction Management.
Staples, W. J. (2010). Public Value in Public Sector Infrastructure Procurement. PhD Thesis, RMIT University,
School of Management, College of Business.
Udeh, K. T., & Ahmadu, M. L. (2013). The Regulatory Framework for Public Procurement in Nigeria. In G.
Quinot, & S. Arrowsmith (Eds.), Public Procurement Regulation in Africa (pp. 141 - 161). Cambridge:
Cambridge University.
Watermeyer, R. (2013). Value for Money in the Delivery of Public Infrstructure. In S. Laryea, & S. Agyepong
(Ed.), Proceedings of 5th West African Built Enviroment Research (WABER) Conference, (pp. 3-19).
Accra - Ghana.
Williams-Elegbe, S. (2012). A Comparative analysis of the Nigerian Public Procurement Act against
International Best Practice. 5th International Public Procurement Conference, (pp. 832-848). Seatle,
Washington.
Williams-Elegbe, S. (2012). The Reform and Regulation of Public Procurement in Nigeria. Public Contract Law
Journal, 41(2), 339-366.
Williams-Elegbe, S. (2014). Beyond UNCITRAL: The Challenges of Procurement Implementation in Africa.
Stellenbosch Law Review(1), pp. 209-224.

705
ID 145
AN ASSESSMENT OF CRITICAL SUCCESS FACTORS FOR
IMPLEMENTATION OF CRITICAL INFRASTRUCTURE PPP
PROJECTS IN GHANA
J. Tchorly and A. Higham
School of the Built Environment, University of Salford, Salford, M5 4WT, UK
Email: [email protected]
Abstract: Owing to the growing demand in critical infrastructure in Ghana and a decrease in
public sector investment as a result of serious fiscal constraints, it has become necessary to
encourage private sector revenue generation through participation in critical infrastructure
delivery in order to offset public cost. The continuous call by the government to create an
enabling environment for private capital in critical infrastructure delivery and the need to not
only introduce but successfully implement the PPP model cannot be overemphasised taking
into consideration other differing approaches. Despite the attraction to the PPP model around
the world, its implementation has not been void of difficulties. The paucity of knowledge as a
result of its novelty requires the identification of context-specific Critical Success Factors as
Ghana is in its initial stage of adoption and implementation of PPP as a financial model. Major
parameters critical for successful implementation are identified through literature and semi-
structured interviews engaged amongst stakeholders both in the public and private sector key
in the implementation of PPP to investigate the significance and efficacy of these parameters:
Whole Life Cycle Costing; Risk Management and Competitive Advantage.
Keywords: Competitive Advantage (CA), Critical Infrastructure (CI), Public Private
Partnerships (PPP), Risk Management (RM) Whole Life Cycle Costing.
1. INTRODUCTION
The significance of the Ghanaian Construction Industry (GCI) like other countries, is such
that an investment in the industry by way of capital expenditure or a disinvestment affects not
only all the other sectors of the economy but the entire citizenry. However, Ghana is faced
with serious infrastructure gaps as a result of the ailing economy, adverse macro-economic
conditions such as major depreciation of the currency, high inflation and interest rates
aggravated with the overwhelming population growth: making growing needs steeper. Its
infrastructure deficit requires a total of $2.5 billion spend annually to meet the existing
infrastructure demand (MoFEP, 2014) even as a high of 99.4 per cent of its total revenue
(GDP) in 2016 constituted only: public sector wage-bill, statutory payments and interest
payments on loans (Ofori-Atta, 2017). The remaining 0.6 per cent of GDP is woefully
inadequate to support government activities let alone develop critical infrastructure as the
$2.5 billion required to meet the infrastructure gap annually represents circa 15 per cent of
average GDP. The intractability of the public sector wage bill which is currently a high of 73
per cent of total government revenue, mandatory statutory payments necessary for
government operations and interests on loans taken by the government to advance
development and other government activities leaves no fiscal space for economic growth.
Ghana’s prospects are at risk as there are serious fiscal and external imbalances with an over-
blown wage-bill (IMF, 2015). Set against this background of fiscal constraint, the total debt
stock till date stands at a high of about 73 per cent of the country’s GDP (MoFEP, 2017). The
economy therefore continues to shrink with a decreased growth rate annually as further

706
borrowing is unsustainable because of the nations’ debt to GDP ratio (IMF, 2015). Although
paradoxically, borrowing for an investment in the ailing construction industry for instance
will reduce lapses in demand and supply of critical infrastructure and help develop the
economy in the long term in terms of GDP growth and the like.
High interest rates coupled with the significant fall in oil revenue resulted in a fiscal deficit
slightly above 10 per cent in 2014 (World Bank, 2015). These structural imbalances led to the
depreciation of the cedi, high inflation rates and a decline in the financial reserves (Bank of
Ghana, 2016). Inflation rates recorded a high of 17 per cent in December 2014 compared to
13.5 per cent in 2013 (Ghana Statistical Service, 2015). The cumulative cedi depreciation
increased from 14.5 per cent to 31.2 per cent in 2013 and 2014 respectively (Bank of Ghana,
2015). It is however argued that expenditure over-runs are usually on recurrent budgets as
capital expenditure in particular is reduced (ibid). The government tends to resort to the
domestic banking system, divestiture proceeds and external sources to mitigate these issues
which cripple private sector growth in terms of their access to credit and the like. Also, the
government has had to depend on several short-term domestic debts with high interest rates
as well as other important monetary financing in order to arrest the ailing economy (Bank of
Ghana, 2016). These fiscal challenges provide a clear indication of the significance of
adoption and implementation of PPP as a financial model which utilises private capital to
bridge the gap in the demand and supply of public goods and services. Ghana’s initial stages
of PPP implementation requires that CSFs be identified and considered to mitigate challenges
from best practice which is the underlying motive of this paper. Private sector participation in
terms of finance, operation, maintenance and the like will go a long way to ease the
government of fiscal constraints such as infrastructure capital expenditure. It will deliver
critical infrastructure for social and economic development as the provision of this
infrastructure will provide an environment for GDP growth. This paper therefore investigates
major parameters identified from literature which have been refined through best practice for
successful implementation of PPP projects in Ghana. The knowledge of these parameters, its
applicability in Ghana and the extent to which they are being considered are investigated
amongst key PPP implementers in Ghana both in the private and public sector.
2. PUBLIC-PRIVATE PARTNERSHIPS
Khanom (2010) maintains that there are globally recognised concepts of PPP but there is still
no accepted definition of the phenomenon. William (1997) postulates the insignificance of an
accepted definition since PPPs are commonly defined as a cooperation between the public
and private sector. Hodge and Greve (2007) argue the need to re-examine the distinct
meanings and concepts attributed to PPPs to investigate the use of the idea for empirical
studies. PPPs are typically touted as a collaboration between parties of the public and private
sectors to achieve a common goal or a series or goals as the term literally expounds (Eaton,
2013; Mouraviev, 2013). The researcher simply describes Public-Private Partnerships as a
definite binding contractual arrangement between parties of the public and private sector
where most often private capital is used in delivering a public product or service for a specific
period of time. The Government of Ghana (GoG) has sought to stir policy and legal
restructuring, finance mechanisms and institutional backing to promote private sector
involvement in public sector infrastructure provision (World Bank, 2015). The World Bank
(WB) has also been instrumental in the call for private sector participation in public service
delivery and is very well involved in the creation of a strong PPP policy that will bring
mutual benefits to the parties involved (MoFEP, 2015). The WB therefore provided a US$ 30

707
million credit over a four-year period between 2012 and 2016 for capacity building at various
levels for a more comprehensive programme available for the adoption and implementation
of PPP from 2017 (World Bank, 2015). On June 3, 2011, GoG approved a National Policy on
PPPs as a foundation to build on structured PPP contracts in Ghana. For this reason, a
legislation has been put before the Parliament of Ghana to be promulgated which will provide
the essential legal framework pursuant to the National Policy (MOFEP, 2015). With regards
to this policy document, PPP is defined as a contractual arrangement between a public entity
and a private sector party, with clear agreement on shared objectives for the provision of
public infrastructure and services traditionally provided by the public sector.
2.1 Critical Success Factors (CSFs)
PPPs have made significant impacts worldwide in public infrastructure development. PPP
implementation around the world have spurred researchers into the determination of CSFs
particularly in mature PPP jurisdictions like the UK, Canada, Australia among others
(Babatunde, 2015). Since the inception of PPPs as a procurement route, it has been important
for researchers and respective implementers of this policy to engage CSF modalities in the
development of infrastructure. Indeed, the concept has been engaged in diverse sectors of
PPP arrangements and all infrastructure sectors including transportation, telecommunication,
energy and housing (Ozdoganm & Birgonul, 2000; Askar & Gab-Allah, 2002; Jamali, 2004).
Again, Meng et al. (2011) investigated the CSFs in the water sector where projects in the
Chinese industry were developed under a transfer operate transfer model (Osei-Kyei & Chan,
2015). CSFs are therefore defined as the few aspects of activity where favourable results are
absolutely necessary for project success or achievement of goals (Qiao et al., 2001). It is
important to determine CSFs responsible for successful implementation of PPPs in different
countries (Stonehouse et al., 1996; Tiong, 1996; Gupta & Narasimham, 1998; Qiao et al.,
2001; Jefferies et al., 2002; Zhang, 2005; Li et al., 2005; Cheung et al., 2012) to inform
implementation in Ghana. In the PPP/PFI procurement model, the main features that ensure
an effective and sustainable process are the identification of the WLCC perspective, the
introduction of RM and appropriate risk transfer, VFM features and the capability of
introducing new sources of Competitive Advantage (CA) (HM Treasury, 2003: NAO, 2001).
Li and Akintoye (2003) opine that RM is core to the implementation of PPPs around the
world as it it one of the mutual benefits of the model. The efficient RM is one of the pillars of
PPP implementation and it ensures VFM (ibid). A study by Akbiyikli (2005) finds that to
ensure effective implementation and sustainability of PFIs, CA should be considered among
RM and WLCC. Parameters critical to implementation of PFI projects are WLCC, RM and
CA (Akbiyikli & Eaton, 2006). Therefore, CA will be considered as a major CSF concept for
intents of this research. A pedagogic perspective of these key parameters as major concepts
for CSFs necessary for successful implementation is illustrated in Table 1.
Table 1-Key Parameters and brief description
Adapted from Akbiyikli, 2005; Eaton, 2005; Meng et al., 2011
KEY PARAMETERS BRIEF EXPLANATION
Whole life Cycle Costing
(WLCC)
Opportunity for full integration under the responsibility of
one party (SPV) of up-front design and construction costs
with on-going service delivery, operation and
maintenance costs that will provide VFM.

708
3. METHODOLOGY
It was prudent to use a qualitative research design to collect data from the key stakeholders of
PPP implementation in Ghana to meet the aim of this paper. This survey entailed the vigorous
engagement of semi-structured interviews to seek answers of relevant questions that would
bridge the gap or confirm related CSF subjects identified in literature. The semi-formal
interaction dismisses certain sensitive issues and in the case the inefficiencies, mishaps etc.
that will otherwise not be expressed on a questionnaire. A total of eight semi-structured
interviews were conducted amongst the public and private sector players: two key
government players in the Ministry of Finance; three major players of a major advisory firm;
two instrumental legal experts and a private investment banker. The rationale for this was to
provide a strategic approach to a pertinent population for better and quality results. Also, the
Ministry of Finance in Ghana is solely responsible for PPP undertakings in the country and
drives all government agenda regarding PPP. It serves as an intermediary for the government
and private sector entities rolling out trainings, policies etc. (Apenteng, 2013). The
international advisory firm handles all major PPP projects from the Expression of Interest
(EoI) stage through pre-feasibility and feasibility stages etc. The legal experts were also
instrumental in formulating the draft PPP bill in Ghana and so are on top of all legal issues
regarding PPP implementation in the country. The head of a private investment company
responsible for funding for the major public sector deals from the potential private sector
participants in major PPP undertakings was also interviewed. This sample reflected a true
representation of all stakeholders in the implementation of all PPP projects and potential
projects in the pipeline. See table 2 for profile of participants.
Risk Management (RM)
Risk retained by the public sector in owning and operating
infrastructure typically carries substantial, and often
unvalued cost
Transferring some of the risk to a private party which can
better manage it can substantially reduce the overall cost
to public sector.
Competitive Advantage
(CA)
PFI deal focuses on output specification, providing wider
opportunity and incentives for bidders to develop
innovative solutions in meeting these requirements.
PFI incentivises SPV to take a longer term approach to
design and construction
PFI incentives allow SPVs to deliver the built asset to
budget and on-time Payments are fixed in the Project
Agreement (PA), which encourages accurate assessment
of costs and risks.
Private sector providers are motivated to develop
opportunities for revenue beyond the public sector
payment stream and this is used in part to reduce the cost
of services to the public sector.

709
Table 2 - Respondents’ profile
(Developed by Author)
RESPONDENT’S
CODE BACKGROUND SECTOR
CI 1 Finance Public
CI 2 Accounting and Finance Public
CI 3 Transport Engineer Private
CI 4 Infrastructure Economist/ Transport Modeller Private
CI 5 Project Finance-PPPs Private
CI 6 Government Business & Policy Reform in Law,
Banking & Finance, PPPs and Procurement Public
CI 7 Construction, PPPs, Procurement, Banking & Finance,
Energy, Oil & Gas Private
CI 8 Business Consultant/ Investment Banking Private
All interviews were transcribed to enhance efficient analysis via the NVIVO software. The
decision to use the qualitative software minimised dependence on personal bias, avoids an
analysis via arrangement of pieces of paper and increases the accessibility of the data for
interpretation by other researchers. It also enhanced the transparency and reliability of the
analysis and provided a more structured approach in the analysis of the interviews. Before the
start of each interview, the participants were told of the academic-purpose driven semi-
structured interview and the confidentiality of their data. They were given a right to withdraw
from the interview at any time as per the code of ethics. The duration of the interview was
between forty-five and sixty minutes. This allowed time for rendering the interview questions
based on the guideline, asking supplementary questions for clarification and soliciting more
details if necessary without interrupting respondents chain of thoughts. The most important
advantage of these semi-structured interviews was its flexibility and the fact that it allowed
the researcher to probe deeper into the questions when required in order to gain valuable
information from the participants. Questions were kept open ended and were designed to
gather the respondents' views thorough responses surrounding the topic. Their responses were
then identified and generated into prominent themes and triangulated with the literature.
4. RESULTS AND DISCUSSIONS
The following are the emerged themes from the semi-structured interviews based on the
objective set out in this paper and the CSF parameters identified in the literature review. All
parameters are interrogated on their merits, benefits, applicability in the context of Ghana,
recommendations in their enhancement amongst others.
4.1 Whole Life Cycle Costing (WLCC)
Whole Life Cycle Costing (WLCC) is considered in all major projects especially as PPPs is a
long term project relative to traditional projects. All costs including maintenance, operation
costs are considered during the feasibility stages. These have to be considered before any

710
form of finance is introduced in the project. All respondents recognised the importance of
WLCC and to a large extent alluded to its consideration in any PPP project. Value for Money
and affordability was however deemed as an important factor of WLCC and was also
discussed appropriately.
“Feasibility reports entail all these costs, because feasibility report includes the financial
model, your economic assessment, your risk assessment, your engineering, technical, what
kind of design they want to do and the costing”. [CI 3]
“So all that go into technical and the cost. And then sometimes they give you an idea of what
the operational cost would be, maintenance cost would be, so all those gives you the whole
life cycle cost. So it’s not just only the cost that you need during the construction but also
during the operation. You need to know what the cost would be when you do the operations
as well. So all that goes into your financial model”. [CI 5]
“The financial model has a spreadsheet. So if it’s a 30-year agreement, you have year 1, year
2, year 3, year 4, year 5, year 6 all the way to 30. Then you have other costs like the capital
costs and others so you work out the operation cost. Your financial model is the last thing
after the technical guys have done their work, they know the cost and all that. After all that,
you start considering your ratios where you will be looking at NPV, the debt service cover
ratio etc. Those are the things that are performance indicators. Those are indicators that
more of the banks even look forward to see”. [CI 4]
“There is a spreadsheet that allows a calculation of the Net Present Value or the internal
rate or return, auditing is done per year and you looking at all that up till the end of the
concession. Sometimes after multiple calculations, the first 15 years records a loss, then
maybe after 15 years, that is when you will end up making a bit of profit. So they want to see
the cash flow before the bank would support the project. So if it doesn’t look good, they know
what to do. There are certain simulations and financial modelling approaches that are
engaged to make the project attractive and viable which is presented to the client. So most of
the time, when a certain fixed amount like a toll charge is being determined, the number of
years in the concession, the total cost of the project etc are all taken into consideration. So
maintenance, operation etc. are are all considered which forms part of whole life cycle
costing”. [CI 7]
In Ghana major projects surpassing a total cost of about GH¢ 100 million need a Value for
Money assessment carried out before the loans are passed in parliament so all huge projects
are outsourced mainly to crown agents, a company in Ghana that does most of these audits. It
has however been of concern to most technocrats and experts, how value for money is
assessed in smaller projects or any project costing less. It is also important to note that Value
for Money in PPP projects in the public interest and are critical in the determination of the
viability of the projects and its attractiveness. However, in the National Policy of Public-
Private Partnerships in Ghana one of the major objectives stated is to encourage and facilitate
investment by the private sector by creating an enabling environment for PPPs where value
for money for government can be clearly demonstrated.
“The government is very aware of the importance of Value for Money in PPPs and welcomes
it any day. When you look at the National Policy, you realise its strong presence all over the
document and in fact it is the first guiding principle of the document”. [CI 1]

711
“The Project and Financial Analysis Unit (PFA) under the Ministry of Finance is mandated
amongst other things to ensure financial viability and economic soundness that is Value for
Money of PPP projects in the country. There are unsolicited projects and solicited projects.
Unsolicited projects are projects which are identified by a private sector person and then
they write to the ministry of their intention to undertake that project with their own
proposals, if the project is viable then they go ahead with the financial assessment stage
which is also submitted to the ministry. In order to ensure Value for Money, the project is
listed and other private entities invited to bid so that other costs are brought forward for
comparison. If another party wants to undertake the project for a lesser amount, we go back
to first entity and tell them another company wants to undertake the project for less taking
into consideration other project factors or deliverables. They then have a choice to review
their cost or leave the project. On the other hand, solicited projects are the ones identified
and sought by the government and then it invites bidders. The Government of Ghana (GoG)
is to establish a Project Development Facility (PDF) in line with the upcoming PPP
programs. It will operate according to standard operating procedures to finance upstream
investment appraisal, value for money assessments and other feasibility and safeguard
studies”. [CI 2]
Value for money is paramount and PPPs should give greater value for money than the best
realistic public sector project designed to achieve similar service outputs. Achieving value for
money is a key requirement of government at all stages of a project’s development and
procurement and is a combination of the service outcome to be delivered by the private
sector, together with the degree of risk transfer and financial implications for government.
Value for money is the driver for adopting the PPP approach, rather than capital scarcity or
the balance sheet treatment. This is therefore shown in different stages of the procurement
process and is set as a requirement in some cases before advancement to the next stages.
VFM is widely accepted as essential and incorporated in the procurement route.
“In the pre-feasibility reports submitted to the Public Investment Division (PID), all
documents are required to demonstrate the anticipated Value for Money to be achieved by
the PPP project so all projects at an early stage require a VFM assessment. Similarly, after
the evaluation of bids, but prior to appointing the winning bidder, the Contracting Authority
must submit an evaluation report for review and recommendation by MOFEP-PID
demonstrating how the criteria of affordability, value for money and substantial technical,
operational and financial risk transfer were applied in the evaluation of the bids as well as
demonstrating how the criteria of affordability, value for money, and risk allocation were
satisfied in the winning bid, and including any other information as required by MOFEP”.
[CI 1]
Affordability is key in VFM assessments and the government or public sector must still be
able to afford to pay for the project, regardless of whether is it a traditional pubic project or a
PFI. Full analysis of this service must be performed to benchmark current performance levels
and compare with not only traditional procurement methods but competitive outside bids to
ensure affordability and better value for the public money. It is also important throughout the
concession period as maintenance and other post construction charges need to be considered.
“Value for Money Analysis is still needed after any PPP contract is signed to ensure that the
actual performance delivered does not drop below planned & contracted output levels. To
ensure the PPP projects continues to provide value for money, we should avoid ambiguity
that can lead to unnecessary delays and disputes”. [CI 7]

712
“There is no doubt about the importance and benefits of value for money. It is actually
critical to the successful achievement of PPP objectives and is also a key component of the
evaluation of PPPs. However, it requires diligent management of project risks during the
execution phase of PPP projects hence the monitoring and supervision functions must be
integrated into PPP processes to achieve value for money”. [CI 5]
It was revealed that VFM needed to be more standardised in terms of determination so as
ensure transparency and an unbiased assessment. It is also necessary for efficient time
management when assessments are being done.
“In the United Kingdom for instance, the Public Sector Comparator is used, I think we need
something like that in Ghana and I understand the Ministry of Finance is developing a
template for quantities in construction so as to have a standard that can be referred to in
determining or having an idea of how much some projects should cost. PPP value for money
should be evaluated against the Public Sector Comparator. The most important thing
however is to compare the value for money of implementing the project as a PPP or through
public procurement”. [CI 2]
4.2 Risk Management (RM)
Risk Management is a key component of Public Private Partnerships as equal risk sharing and
effective mitigation are core to this model and provides an enhanced implementation. This
notion was shared by all respondents interviewed. General risk category including site risks,
pre contract risks, operational risks, force majeure risks etc. are outlined by the National PPP
Policy in accordance with the World Bank policies which are adhered to by all interested
parties of any PPP undertaking. However, it was argued that rather than a template or generic
categories to be looked at, a more tailored risk register should be developed for all PPP
projects.
“Each PPP project is unique. Thus a model list of typical PPP risks can only cover a portion
of the risks for any given project. Customised risk identification is necessary”. [CI 7]
“Model PPP Risk Matrixes can greatly help foster a culture of PPPs with a common
vocabulary when it comes to identifying, analysing and allocating PPP risks. However, we
need to avoid broad, vague categories like political risk. We need to be very specific”. [CI 8]
Even with clear, detailed institutional & regulatory frameworks, government decision-makers
often do not follow their own procedures & regulations (political interference & non-
transparency). It is important regulations are put in place not fully necessitate a fully robust
analysis.
Too few proposed PPP projects are being fully analysed and structured by the government
before they are offered to the private sector. Many are offered based only on traditional
technical feasibility studies without detailed PPP risk allocations or bankable contract
structures”. [CI 6]
As expected, risk should be allocated to the party best able to control the likelihood of the
risk event occurring, the impact of the risk on project outcomes and one that is best to absorb

713
the risk at lowest cost. All projects require a risk management assessment and is done through
workshops for the identification, analysis and mitigation etc. of the risks.
“All PPP projects require a workshop that involve all stakeholders which will list the
potential risks of all categories and discuss them. This is done to allocate the risks to the best
parties ready to control or manage it it. Let’s say for an environmental bid of a road or rail
way, issues regarding right of way and compensations of land issues are best managed by the
public sector which is government than the private sector. The government can give an order
and make sure they clear the land etc. The risk is on government. On the other hand, the risk
is on the private sector with regards to finance”. [CI 6]
“With all the reports we have worked on, we list all the risks under construction, the things
you think need to be addressed and who has to manage it. Whether the private or the public
entity. If the risk is too high on the private sector party, for instance, when the private sector
takes over a poorly functioning utility network, there is a higher risk of unknown condition of
assets so then you come out with ways of mitigating that. Then if it’s low to the government
since every risk is firstly likely to be pushed to the private sector, then both parties will take
the risk but one person takes definitely takes more than the other. This is usually done after
the workshop where the risks are identified etc.”. [CI 7]
Apart from what is being done at the moment in terms of labelling risks and attaching parties
best able to mitigate or control them, there is the need to also consider perceived risks when
talking about risk management. This is usually related to the political risks etc. which poses
some loss of confidence in PPP undertakings. The absence of sovereign guarantees and the
lack of tight and specific policies does not provide the right platform for effective
implementation of PPPs.
“Government Department agencies in charge of education collects any school fees from
students and families and pays a unitary payment or availability payment to the private
partner as long as it meets performance standards. The private partner therefore does not
face a risk of change in demand for the schools and is not bothered if there is enough
confidence from the government. Also, private investors usually will not be willing to bear
many commercial and demand-based risk which require more public financial supports when
there is not a clear level playing field hence the need for specific policies binding both
parties”. [CI 3]
PPP projects requires more forms of public risk-sharing and supports, both contingent and
non-contingent to become bankable. The government must develop systematic frameworks
for analysing, approving, funding and monitoring public sector risks in PPPs.
“In addition to budget allocations, the government may make further contributions, such as
providing land; contributing existing assets; or providing various forms of guarantees that
enable risk to be shared effectively between the government and the private company”. [CS
5]
The cost to the Government under the most likely outcomes (modal value) should be
estimated and assessed in especially conducting sensitivity analysis (at minimum scenario-
based) to estimate how the cost to the Government could change if assumed risks changed
and assessing the likely cost and risk scenarios against fiscal priorities and existing
commitments.
“Risk mitigation strategies should be cost-benefit justified”. [CI 3]

714
The two concepts of Risk Management (RM) and the enablers are linked to each other, hence
a careful assessment of one of these concepts leads to a substantial mitigation of the other.
“I strongly believe that as discussed earlier the enablers are interlinked to risk management.
When they are considered carefully less threats will be seen”. [CS 3]
4.3 Competitive Advantage (CA)
All interviewees indicated that very little was being done about competitive advantage as far
as they were concerned. It was a rather new issue as PPP in itself was a relatively new
procurement approach. They agreed that it was important all the same and it was worth
looking at in the mean time.
“This is something we have not really considered to be honest, we are currently looking at
how to implement PPP effectively”. [CI 2]
“I am not sure whether that is being considered at the minute, I don’t know if it is competitive
advantage with regards to the public sector that is the government itself or the private sector
but we still not to consider this issue as early as possible so that we can maximise efficiency
and also promote value for money and sustainability”. [CI 7]
On the contrary some respondents decided to elaborate on what is being done about
competitiveness or their personal experience on competition which they believed was also
imbibed in the competitive advantage concept especially for the fact that they both have a
common goal of enhancing efficiency. These have been detailed below.
“When Selecting Appropriate PPP Candidates, there are certain things that one needs to
consider. Firstly, the size of the project counts because the larger the project the higher the
risk construction cost overruns, which a PFI can better manage. Scope of construction
should be clearly defined to enable a more detailed assessment. As PPPs are typically long
term in nature, the project requires important levels of on-going maintenance & measurable
performance so the best parties should be considered”. [CI 4]
“Competition is critical because if we don’t have that, there’s no value for money. You can’t
undertake a right assessment; you don’t know whether you getting value for your project by
giving it to one person. So it’s always good to throw it out there and get people to submit
proposals, you know. You assess everybody’s bid that says how their technical submission,
what they are bringing on board, whether they have come to give us new designs, innovations
etc. Some of the things that are considered are environmental issues and how they intend to
deal with them. Like replacement of trees when they are uprooted for some construction
work”. [CI 6]
PPPs should already have clear technical, economic & environmental feasibility. PPPs cannot
on their own make technically or environmentally risky projects become feasible. An
advantage of this is to encourage efficiency and innovation.
“You assess technical, environmental, financials. So the competition is very important. So
those are all the things that you want to check whoever submits their bids has really
addressed all your issues, all your criteria you looking to assess them. So by bringing
different people on board as a matter of bidding, it creates some competition which makes
every party innovative because they want to win”. [CI 8]

715
“One of the objectives of the National PPP policy though is to set up efficient and
transparent institutional arrangements for the identification, structuring and competitive
tendering of PPP projects. So that is written there, at least it is being recognised, if only it
will be followed. It also brings about Value for Money and Competition”. [CI 5]
“Attracting multiple bidders will definitely maximize value by creating competitive tension in
the bidding process”. [CI 7]
Competitive advantage explained by some respondents, all of whom were from the private
sector, were based on their knowledge on the concept and the research they did prior to this
interview based on the emails sent to them as stated by themselves.
“Competitive Advantage is vital to any construction firm or organisation’s performance and
the way that one firm satisfies other people by performing better than another. It is the
isolation and exploitation of areas of superiority over competitors that stems in construction
from the strategic management of both companies and projects. Competitive advantage is
attained from the firm’s ability to control its internal sub-systems and exploit opportunities
and lessen or avoid threats from its external environments. Determining areas of Competitive
advantage requires an analysis of the value activities of the private company when competing
in a particular industry”. [CI 4]
“Competitive Advantage will only remain an advantage for a period of time before it
becomes replicated within co-operating organisations. Hence the principle of sustainable
competitive advantage is that the sources of CA are continually evolving”. [CI 5]
“The successful SPVs to a large extent demonstrate their competitive advantage through the
incorporation of innovations during the procurement phase. Selections include the appraisal
of the innovativeness of the proposal. The contract awarded to the consortium, SPV will
always step up to the next level of innovation. The product, which is the constructed asset and
the corresponding service are then sustainable over the concession period. This is a major
source of competitive advantage. The creation of a series of short term competitive
advantages during the concession period in order to deliver a superior service and reduce
whole life cycle costs which enables competitive advantage to be appropriated over the entire
concession period”. [CI 3]
“Competitive Advantage is not only in product and processes but also strategy, structure,
system and behaviour. CA in PPP projects is a holistic phenomenon that concerns all
stakeholders in the deal”. [CI 7]
5. CONCLUSIONS
The study which engaged public and private officials who are the stakeholders of PPP
implementation in Ghana ascertained the significance of the CSF parameters adopted for this
research in this particular context. The findings were generally in tandem with previous
studies in the literature review with particular regards to state of PPP and the relevance of the
key parameters set for investigative purposes in this thesis. However, CA was a concept that
participants had very little knowledge about but asserted the importance of competition
amongst bidders and the entire PPP process that will ensure VFM, affordability as well as
quality. One of the major findings of the study which is necessary for effective infrastructure
development on a steady basis was the set up of a central PPP unit. A number of institutional

716
investors and commercial lenders have highlighted that they have the necessary funds and
mandate to invest in or lend to infrastructure in the region, but, what is lacking is a pipeline of
well-structured, bankable projects in which to invest or lend their funds. Undeniably, extra
funds will not necessarily guarantee a solution or a curtailment of the infrastructure gap in the
country and even in the world but a prudent and effective implementation of the model to
ensure success is a means.
6. REFERENCES
Akbiyikli, R. (2005). The holistic realisation of PFI road project objectives in the UK. (Published Thesis),
University of Salford, Salford.
Akbiyikli, R., & Eaton, D. (2006). Operation and Maintenance (O&M) management in PFI road projects in the
UK. In D. Boyd (Ed.), Proceedings from the 22nd Annual ARCOM Conference, Birmingham, UK.
Association of Researchers in Construction Management, 1, 393–402.
Ameyaw, E. E., & Chan, A. P. C. (2015). Risk allocation in public-private partnership water supply projects in
Ghana. Construction Management and Economics. doi: 10.1080/01446193.2015.1031148
Apenteng, M. (2013). Ghana steps up infrastructure investment. Retrieved 18th May, 2015, from
http://www.worldfinance.com/inward-investment/middle-east-and-africa/ghana-steps-up-infrastructure-
investment-programme
Askar, M., & Gab-Allah, A., (2002). Problems facing parties involved in build-operate-transfer projects in
Egypt. Journal of Management in Engineering. 18(4), 173–178.
Babatunde, S. O. (2015). Developing public private partnership strategy for infrastructure delivery in Nigeria.
(Published PhD Thesis), University of Northumbria, Newcastle
Bank of Ghana. (2016). Monetary policy report volume 1.1. Retrieved from
https://www.bog.gov.gh/privatecontent/MPC_Press_Releases/Monetary%20Policy%20Report%20%20May%2
02016.pdf
Cheung, E., Chan, A. P. C., Lam, P. T. I., Chan, D. W. M. & Ke, Y. (2012). A comparative study of critical
success factors for Public Private Partnerships (PPP) between Mainland China and Hong Kong special
administrative region. Facilities-Special Issue on Facility Management Development, 30(13/14), 647-666.
Eaton, D. (2005). Quantifying quality: a report on PFI and the delivery of public services. London: RICS.
Eaton, D, (2013). Construction risk identification and planning. Learning notes, finance and risk management
module, Construction Management, School of Built Environment, University of Salford, UK.
Ghana Statistical Service. (2015). Revised 2014 annual gross domestic products. Retrieved from
http://www.statsghana.gov.gh/docfiles/GDP/GDP2015/AnnualGDP2014_template_2014Q4_April%202015
%20edition_web.pdf
Ghana Statistical Service. (2016). Revised 2015 annual gross domestic product. Retrieved from
http://www.statsghana.gov.gh/docfiles/GDP/GDP2016/Revised_Annual_2015_GDP_September%202016
%20Edition.pdf
Gupta, M. C., & Narasimham, S. V. (1998). Discussion of CSFs in competitive tendering and negotiation model
for BOT projects. Journal of Construction Engineering and Management, 124(5), 430.
HM Treasury. (2003). The green book—appraisal and evaluation in central government. London: TSO.
Hodge, G. A., & Greve, C. (2007). Public private partnership: an international performance review. Public
Administration Review, 545-558.
Jamali, D. (2004). Success and failure mechanisms of Public Private Partnerships (PPPs) in developing
countries: insights from the Lebanese context. International Journal of Public Sector Management, 17(5),
414–430.
Khanom, N. A. (2009). Conceptual issues in defining Public Private Partnerships (PPPs). Paper presented at the
Asian Business Research Conference 2009, Faculty of Business and Government, University of Canberra,
Australia.
Li, B., & Akintoye, A. (2003) An overview of public private partnerships. In A. Akintoye, M. Beck, & C.
Hardcastle (Eds.), Public Private Partnerships: Managing Risks and Opportunities (pp.3-30). New Jersey:
Blackwell Science.
Li, B., Akintoye, A., Edwards, P.J., & Hardcastle, C. (2005). Perceptions of positive and negative factors
influencing the attractiveness of PPP/PFI procurement for construction projects in the UK: findings from a
questionnaire survey. Engineering, Construction and Architectural Management, 12(2), 125 – 148, doi:
10.1108/09699980510584485

717
Meng, X., Zhao, Q., & Shen, Q. (2011). Critical success factors for transfer–operate–transfer urban water supply
projects in China. Journal of Management in Engineering, 27(4), 243-251.
Ministry of Finance and Economic Planning. (2014). Fiscal and Monetary measures. Retrieved from
http://www.mofep.gov.gh/?q=content/5-year-republic-ghana-ghs-denominated-treasury-bond-issuance-
book-build-summary-tender-1461
Ministry of Finance and Economic Planning. (2014). Pipeline projects Ghana Public Private Partnership (PPP)
programme: partnering the private sector for improved delivery of public infrastructure and services.
Retrieved from http://www.mofep.gov.gh/sites/default/files/docs/pid/Pipeline-Projects-Ghana-PPP-11-08-
14.pdf
Mouraviev, N. (2013). An analysis of governance policy and practice in public-private partnerships in
transitional economies: a case study of Kazakhstan and Russia. (Published Doctoral Thesis), The University
of Northampton, UK.
National Audit Office. (2001). Modernising construction – report by the Comptroller and Auditor General. HC
Session 2000–2001.
Ofori-Atta, K. (2017). The budget statement and economic policy of the Government of Ghana for the 2017
financial year. Retrieved from
http://www.mofep.gov.gh/sites/default/files/budget/2017%20BUDGET%20STATEMENT%20AND%20E
CONOMIC%20POLICY.pdf
Osei-Kyei, R., & Chan, A.P.C. (2015). Review of studies on the critical success factors for Public-Private
Partnership projects from 1990 – 2013. International Journal of Project Management, 33(6), 1335-1346.
doi: 10.1016/j.ijproman.2015.02.008
Özdoganm, I. D., & Birg.nül, M. T. (2000). A decision support framework for project sponsors in the planning
stage of Build-Operate-Transfer (BOT) projects. Construction Management and Economics, 18, 343-353.
Qiao, L., Wang, S. Q., Tiong, R. L. K., & Chan, T. S. (2001). Framework for critical success factors of BOT
projects in China. Journal of Project Finance, 7(1), 53–61.
Stonehouse, J. H., Hudson, A. R., & O'keefe, M. J. (1996). Public private partnerships: the Toronto hospital
experience. Canadian Business Review, 23(2), 17-20.
Tiong, R. L. K., Yeo, K. M., & McCarthy, S. C. (1992). Critical success factors in winning BOT contracts.
Journal of Construction Engineering and Management, 118(2), 217-228.
William, A.T. (1997). Regional governance: contemporary public private partnerships in the South. (PhD
Thesis), Virginia Commonwealth University, Virginia.
World Bank. (2015). Ghana overview. Retrieved from http://www.worldbank.org/en/country/ghana/overview
International Monetary Fund. (2015). IMF approves US$918 million ECF arrangement to help Ghana boost
growth, jobs and stability. Retrieved from http://www.imf.org/external/np/sec/pr/2015/pr15159.htm
Zhang, X. (2005). Critical success factors for public private partnerships in infrastructure development. Journal
of Construction Engineering and Management, 131(1), 3-14.

718
ID 147
EXAMINING THE KEY LEADERSHIP ATTRIBUTES THAT LEAD TO
SUCCESSFUL DELIVERY OF COMPLEX CONSTRUCTION
PROJECTS IN THE UK
J. Picken and C. Liyanage
The School of Engineering, University of Central Lancashire, Preston, PR1 2HE, UK
Email: [email protected]
Abstract: Whilst there is a plethora of literature on the topics of leadership and complex
projects, there is limited research, correlating these two aspects of complex construction
projects. This paper presents the findings of a 12-month study, which examines the key
leadership attributes that lead to the successful delivery of complex construction projects. The
methodology adopted for the study is a questionnaire survey targeted at construction leaders
and managers in the UK. Corporate and Fellow Members of the Chartered Institute of
Building (CIOB) provided an appropriate sample for the study. The sample comprised 1805
CIOB Fellows and Corporate Members. “Survey Monkey” online facilitated questionnaire
distribution and collection of responses. The response rate was 10.52%. SPSS 22 statistical
software enabled coding and analysis of the data. Findings firstly provided clarification of the
definition of a complex project, confirming that high project value need not necessarily reflect
project complexity. The findings identified attributes of leaders in respect to teamwork,
planning, monitoring and controlling of projects and decision making associated with
dilemmas. These attributes reflect current trends in leadership styles with increased team
empowerment.
Keywords: Complex projects, Decision Making, Leadership, Planning, Teams.
1. INTRODUCTION
In a continuously evolving construction sector, the professional institutions, governments and
construction clients (BIS, 2013) are setting strategic expectations to increase productivity,
reduce project durations, reduce project costs and increase exports. The Egan Report (Egan,
1998:14) comments that in 1998 there was “a lack of a burning commitment of leaders in
construction to improve quality and efficiency through change of organisational culture”.
Constructing Excellence (2015) consider leadership to be a significant contributor to the
construction sector’s performance and as such have formed a “G4C” forum for leadership
development. Mϋller and Turner (2010) are amongst the few authors who correlate the
attributes of vision, influence and motivation provided by leaders to the success of complex
projects. Kerzner and Belack (2010) argue that three critical requirements for the successful
outcome of a complex project are clear project objectives, user involvement throughout the
project life (cradle-to-cradle), and clear governance. The National Audit Office and the
Office of Government Commerce (OCG, 2012) consider that factors contributing to the
failure of projects include lack of agreed measures of success, lack of clear leadership, lack of
engagement with stakeholders, and the lack of project management and risk management
skills.
Lack of clear senior management leadership, lack of effective engagement with stakeholders,
and lack of clear links between the project and agreed critical success factors or key strategic
priorities are common causes of project failure (Morgan and Gbedemah, 2010; The Office of

719
Government Commerce (OGC), 2012; Chartered Institute of Building (CIOB), 2014). Data
analysed by The Chartered Management Institute (CMI, 2016) identifies that economic
productivity in the UK ranks 6th in the G7 (Group of seven) countries, which includes the
USA, Canada, UK, France, Germany, Italy and Japan. UK economic productivity is ranked
17th in the Group of Twenty (G20), whose countries represent 85% of global GDP. CMI
suggests that poor leadership is to blame for the poor productivity record. This reflects
findings identified in the Construction 2025 Strategy document particularly in complex
projects.
Whilst Pickervance (2011) considers complex projects to be those above six storeys, those
with extensive ground works, or those with extensive mechanical and electrical services, Li
et.al. (2011), Sage et.al. (2011) and Ireland (2014) consider complex projects to be those that
involve a broad and diverse range of stakeholders, with unclear and changing boundaries.
This latter view may explain some of the challenges in UK projects such as the HS2 & HS3
high-speed rail links or new nuclear power stations. “Complicated” projects are challenging,
but tend to be linear and predictable. On the other hand, complex projects tend to be
unpredictable, often leading to cost and schedule overruns. BS 6079 – Part 1 (2010)
recognises that complexity of a project is associated with risk to project outcomes, (project
success) and identifies factors, which contribute to complexity. The standard requires leaders
to manage the complexity, but appears to be simplistic in linking leadership and project
complexity. The Global Alliance for Project Performance Standards, (GAPPS), (2007) has a
thread of “leadership” throughout their standards for project managers, and suggest that
complex projects require a level of project manager performance beyond that of the Global
Level 2 Project Manager, which itself certifies an accepted level of competency to manage
complex projects. There is a plethora of literature, which considers leadership in projects.
However, there is a clear gap in extant literature, which links leadership attributes specifically
to complex construction projects. The paper fulfils this gap by identifying a relationship
between leadership attributes and complex construction project delivery. In doing so, it
consists of three (3) main sections. Firstly, detailed discussions on complex projects and
leadership are given in section 2, using an in-depth literature review. Secondly, the
methodology adopted to identify the relationship between leadership attributes and project
delivery in complex construction projects is presented in section 3. Finally, the findings,
which emerged from the questionnaire survey, are evaluated in section 4.
2. LITERATURE REVIEW
2.1 Definition of leadership
Rickards (2015) cites two definitions of leadership provided by Bryman (2011) and Rost
(1993): “The leader gives a sense of direction and purpose through the articulation of a
compelling world view [the defining characteristic of which is] the active promotion of
values which provide shared meanings about the nature of organisation”, (Bryman, 2011).
“Leadership is an influence relationship among leaders and followers who intend real
changes that reflect their mutual purposes”, (Rost, 1993). These definitions would support
commonly accepted views that 21st century leaders need to have clear vision together with an
ability to develop a team culture, with high moral and ethical values. Grisham (2010) defines
leadership as “The ability to inspire the desire to follow and to inspire achievement beyond
expectations”. It could be argued that this definition favours not the coercion of staff
members into meeting targets, but rather provision of the charisma that promotes the
evolution of “superteams”. This might provide further support to the previous definitions.

720
The CIOB code of practice for project management (2014) cites Shackleton’s (1995)
definition of leadership as being “The process in which an individual influences other group
members towards the attainment of group or organisational goals”. It could be argued that
the CIOB has adopted a definition that is concise yet clearly defines the influence of the
leader upon a team or stakeholders in meeting successful construction project outcomes. The
definition may suggest active promotion of values, which provide shared meanings about the
nature of the organisation as proposed by Bryman. The definition may also consider the
intention to make real changes for mutual purposes as proposed by Rost (1993). Cooke-
Davies (2002) also affirms that it is not the processes or systems that deliver projects but the
human interactions that undertake those processes and systems. It is the decision-making
process of the teams involved, which ultimately lead to adequacy, and success of a project.
Extant literature concerning leadership identifies commonly used terminology such as traits,
characteristics and attributes when discussing approaches to leadership. The English Oxford
Dictionary (2017) defines a trait as a “genetically determined characteristic”; a characteristic
is defined as “typical of a particular person”, and an attribute is defined as “regards
something being caused by”. Sometimes it may appear to readers that different authors use
these varied terminologies in an interchangeable manner to mean the same or similar things
relating to leadership. Traits are considered by Mϋller and Turner (2010), Clarke (2012),
Chamorro-Prezumic (2013), Chartered Institute of Building (CIOB) (2014) and Chartered
Management Institute (CMI) (2015). Characteristics are considered by Ireland (2008), Toor
and Ofori (2008), Mϋller and Turner (2010), Clarke (2012), Chamorro-Prezumic (2013) and
Chartered Management Institute (CMI) (2015). Attributes are considered by Global Alliance
for Project Performance Standards (2007), Toor and Ofori (2008) and Mϋller and Turner
(2010). In operational or organisational contexts, personality traits are usually exhibited in
terms of the personal behaviours of leaders, (Van Eeden et al, 2008). These personal
behaviours are referred to by many authors as leadership characteristics (Hay, 2006). Simply,
traits or characteristics are the ways that leaders behave in their efforts to ensure that
followers follow. To differentiate between a characteristic and a trait, a characteristic refers to
the distinctive qualities that make up an individual. A trait on the other hand, is a feature of
an individual that is inherited. The main difference between a characteristic and a trait is
while a characteristic need be built by a person and absorbed, a trait comes genealogically. In
the transactional style of leadership, the leader clarifies what followers need to do, with the
leader looking for deviation from standards and taking corrective action. On the other hand,
in transformational leadership, the leader shows dedication, a strong sense of purpose and
perseverance, and confidence in purpose. These are attributes that provide followers with a
sense of empowerment and ownership, and encourages intellectual stimulation. For this
reason, this study has focused on “leadership attributes” which may be considered a
collective approach to traits, characteristics and attributes displayed by leaders. Chamorro-
Prezumic (2016) identifies that popular culture embeds “charisma” as an attribute of famous
leaders, (apart from Angela Merkel). Charisma can help persuade and inspire followers.
However, consideration is given to charisma disguising incompetence, which in turn leads to
unsuccessful outcomes. It is arguable that for complex projects the probability of success is
likely to be higher when attributes previously identified are in place rather than reliance on
charisma. It is arguable that a leader need not be charismatic as long as he or she has the
appropriate knowledge and skills to meet the feelings and requirements of stakeholders.
Typical methods of meeting those stakeholder requirements are likely to include effective
selection and management of experienced and qualified teams, and the ability to deal with
dilemmas as they arise during the course of a project.

721
2.2 Definition of a complex project
Complex projects tend to be unpredictable, often leading to cost and time overruns. Kerzner
and Belack (2010) reflect upon the difficulty in defining a complex project, arguing that
projects are defined as being complex, if they have a combination of any number of factors
that might include size, value, uncertain scope, uncertain requirements, uncertain
deliverables, complex interactions, uncertain staff competencies and geographical location.
Pickervance (2011) defines a complex project as any project with “extensive work below
ground, more than six storeys in height, or with complicated services”. This contrasts with Li
et al’s (2011) suggestion that complex projects “involve elements showing highly complex
multiple relations, (both formal and informal)”; and Sage et al’s (2011) definition of “the
unpredictable, multi-actor and emergent nature of project work”. Ireland (2014) defines a
complex project as “(a project) which includes autonomous independent systems which have
a life of their own outside of the (particular) project”. What Ireland attempts to demonstrate in
this definition is that every stakeholder is likely to be an independent organisation or entity.
Each of these organisations or entities are likely to have their own agendas. The challenge for
the project team is to integrate these agendas, for a project outcome that will be considered
satisfactory to the majority of stakeholders.
2.3 How leadership attributes contribute to successful complex construction projects
Many authors provide different elements of project delivery in wider literature. Synthesis of
the literature provided by Gadeken (2005), Remington (2011), Giles (2016) and Tremaine
(2016) suggests that there are four different elements that leaders focus on when it comes to
successful delivery of complex projects, i.e. teamwork; planning; monitoring and control; and
decision making. Accordingly, Table 1 provides a summary of leadership attributes that relate
to each element.
Table 1 –Different Elements of Project Delivery and Leadership Attributes
Different
elements
Leadership attributes relating to
key elements of project delivery
Sources of Reference
Teamwork Leaders recognise that they cannot possess
all the expertise necessary to micro-
manage a complex project, and select
teams of appropriately qualified and
experienced personnel
Gadeken (2005); Hay (2006); Back et al (2012)
Leader promotes empowerment and
ownership in team members, and allows
the team to solve their own issues
Li et al (2005); Hay (2006); Grisham (2010);
Back et al (2012); CMI (2016)
Each member of the team can be a leader
on some occasions
Bigley and Roberts (2001); Friedrich et al (2016)
Leaders place total trust in the team Gadeken (2005); Zenger and Folkman (2014);
Giles (2016)
Leaders will remove team members who
underperform or who lose focus on the
end result
Machiavelli (2008)
A leader must be charismatic Chamorro-Prezumic (2016); Friedrich et al (2016)
Leader will demonstrate clear authority
and will coerce the team into strict
compliance
Machiavelli (2008)
Leader sets the team to work on the
project then is absent, leaving the team to
progress alone.
Judge and Piccolo (2004); Back et al (2012)

722
Planning A leader breaks a task down into
"manageable" packages
OCG (2012)
Leaders understand the requirements of all
stakeholders
Gadeken (2005); Machiavelli (2008); Toor and
Ofori (2008); Sutton (2009); Mϋller and Turner
(2010); Kerzner and Belack (2010); Bucculo et al
(2012); Clarke (2012); OCG (2012); Chamorro-
Prezumic (2013 & 2015); Zenger and Folkman
(2014); CMI (2015); Kennett (2015); Williams
(2016)
Leaders need to reflect on their own
performance
Gadeken (2005); Ovolio and Gardner (2005);
Back et al (2012); Räisänen et al (2015);
Tremaine (2016)
Leaders focus on the end result Ovolio and Gardner (2005); Machiavelli (2008)
Leaders can identify problems before they
arise
Bigley and Roberts (2001); Gadeken (2005);
Machiavelli (2008); Back et al (2012)
Leaders are optimistic and hopeful Ovolio and Gardner (2005); Back et al (2012)
Monitoring
and
Control
Leaders recognise that they cannot micro-
manage a complex project
Gadeken (2005); Back et al (2012)
Leaders can identify problems before they
arise
Bigley and Roberts (2001); Gadeken (2005);
Machiavelli (2008); Back et al (2012)
Leaders should instil strict adherence to
procedures and rules
Remington (2011)
Leader monitors the team continuously to
check for deviations to instructions given
Gadeken (2005); Back et al (2012)
Leader does not monitor the project,
leaving the team to progress alone
Judge and Piccolo (2004); Back et al (2012)
Decision
Making
Leader focuses on timely resolution of
issues
Bigley and Roberts (2001); Gadeken (2005);
Machiavelli (2008); Back et al (2012)
Leader demonstrates dedication,
perseverance and strong sense of purpose
Gadeken (2005); Hay (2006); Remington (2011);
Back et al (2012); Zenger and Folkman (2014)
Leaders need high moral and ethical
standards
Back et al (2012); Giles (2016)
Leaders understand the requirements and
feelings of all stakeholders
Gadeken (2005); Machiavelli (2008); Toor and
Ofori (2008); Sutton (2009); Kerzner and Belack
(2010); Mϋller and Turner (2010); Bucculo et al
(2012); Clarke (2012); OCG (2012); Chamorro-
Prezumic (2013 & 2015); Zenger and Folkman
(2014); CMI (2015) Kennett (2015); Pryke et al
(2015); Williams (2016)
Leaders focus on the end result Machiavelli (2008); Back et al (2012)
Leaders attempt to satisfy most of the
stakeholders most of the time, but
acknowledge that total satisfaction of all
stakeholders is beyond the power of
mortals
Gadeken (2005); Machiavelli (2008); Toor and
Ofori (2008); Sutton (2009); Kerzner and Belack
(2010); Mϋller and Turner (2010); Bucculo et al
(2012); Clarke (2012); OCG (2012); Chamorro-
Prezumic (2013 & 2015); Zenger and Folkman
(2014); CMI (2015) Kennett (2015); Pryke et al
(2015); Williams (2016)
Leaders will remove underperforming
team members
Machiavelli (2008)
Leaders are aware of flattery from others Machiavelli (2008); Back et al (2012)
3. METHODOLOGY
The purpose of the paper is to examine the role that the leadership attributes play in
successful delivery of complex construction projects. This was fulfilled using a questionnaire
survey. The generation of a questionnaire survey based on prior knowledge of the author, as a

723
Fellow of the CIOB (being an experienced practitioner in the construction industry for over
20 years), together with views offered by extant literature, justified the use of a quantitative
research methodology. This argument is further justified when considering the very
experienced nature of the sample selected for the questionnaire survey.
There is a total membership of over 50,000 in the CIOB (CIOB, 2016). Within this
population, only corporate and fellow members in the UK were selected for this study. It was
considered that these groups would have an increased probability of having experience in
complex projects compared to members within the Incorporated, Associate or Student grades
of membership. Based on members’ willingness to share their email contact details on the
CIOB “search a member” forum, finally, a purposive systematic sample of 1805 was chosen
for the questionnaire survey. The sample represented most of the regions within the UK (refer
to Appendix 1), in order to ensure objectivity of the data collected. Initially, it was not
practical to categorise the specific professional specialisms of the survey recipients.
However, the questionnaire survey was designed to allow categories of professional
specialisms to be identified from the responses. This approach was taken to identify any bias
arising from any specialisms within the CIOB membership.
Based on the literature review, the questions for the quantitative survey were developed and it
consisted closed questions. The aim of the questionnaire was to capture information linking
complex projects to leadership attributes. The general questions concerned matters such as
job role, level of experience in the industry, level of experience of complex projects, and
experience of projects. A small number of dichotomous or binary questions prompting a
response of yes or no were used to simplify what may have been considered complex
questions. A range of multi-chotomous questions, that is, questions where a range of
alternative answers is presented for consideration were generated. For this, a 4-Likert scale of
responses was chosen, prompting a non-neutral response by not having a “neither agree nor
disagree” option. Care was taken to restrict “don’t know” responses to questions where
respondents may genuinely not know the answer. The survey questionnaire made use of the
format provided by “Survey Monkey” online. The reasoning behind this was the relatively
low cost and provision of a template, which allows easy building of a questionnaire. The
questionnaire can then be tested, and is received by the sample in a format that is easy to
navigate.
A total of 186 responses were received providing a response rate (RR) of 10.52%. The use of
a large survey sample was intended to enable the categorising of respondents into categories
of experience in complex projects. Data was recorded, coded and analysed using SPSS 22
statistical software making use of UCLan’s software provision. Whilst this method required
manual inputting of data received, using Survey Monkey into SPSS this task was undertaken
to minimise costs. As identified previously, the sample chosen for the quantitative
questionnaire survey concerned a selection of Corporate and Fellow Members of the CIOB.
Ninety-seven percent (97%) of respondents confirmed that they undertake a leadership or
management role within the construction sector. This confirms the reliability of this sample
of which the greater majority have extensive leadership experience in a range of project
values across the sector. Statistical inference validity is provided when the statistics of the
sample reflects the statistics of the population, Fellows and Liu, (2015). This demonstrates
that the sample provides a good representation of the target population. The use of SPSS 22
statistical software enabled access to validity and reliability testing for parametric and non-
parametric correlation of data variables. The Chi-Squared test was specifically favoured due
to its ease of use in establishing a 95% significance value of the data collected.

724
4. FINDINGS
It was clear from the study that most construction professionals do not consider that the value
of a project reflects its complexity, but rather that complexity reflects the diverse nature of
stakeholders, interactions, uncertain scope and deliverables, staff competencies and
geographical location. This was confirmed by the respondents’ response to a survey question
asking respondents to select from a choice of four definitions of a complex construction
project. Analysis of the findings provided positive correlation of links between leadership
influences and the success of complex construction projects. Table 2 presents a summary of
the questionnaire survey findings.
Table 2 –Leadership attributes that lead to successful delivery of complex projects Elements Leadership attributes that relate to different elements of project
delivery
Mean Ranking
Tea
mw
ork
Leaders recognise that they cannot possess all the expertise necessary
to micro-manage a complex project, and select teams of appropriately
qualified and experienced personnel
3.77 1
Leader promotes empowerment and ownership in team members, and
allows the team to solve their own issues
3.44 2
Each member of the team can be a leader on some occasions 3.17 3
Leaders place total trust in the team 2.99 4
Leaders will remove team members who underperform or who lose
focus on the end result
2.82 5
A leader must be charismatic 2.74 6
Leader will demonstrate clear authority and will coerce the team into
strict compliance
2.55 7
Leader sets the team to work on the project then is absent, leaving the
team to progress alone.
1.61 8
Pla
nn
ing A leader breaks a task down into "manageable" packages 3.48 1
Leaders understand the requirements of all stakeholders 3.45 2
Leaders need to reflect on their own performance 3.44 3
Leaders focus on the end result 3.20 4
Leaders can identify problems before they arise 3.17 5
Leaders are optimistic and hopeful 3.02 6
Mon
itori
ng
an
d
Con
trol
Leaders recognise that they cannot micro-manage a complex project 3.43 1
Leaders can identify problems before they arise 3.04 2
Leaders should instil strict adherence to procedures and rules 2.87 3
Leader monitors the team continuously to check for deviations to
instructions given
2.86 4
Leader does not monitor the project, leaving the team to progress alone 1.58 5
Dec
isio
n M
ak
ing
Leader focuses on timely resolution of issues 3.55 1
Leader demonstrates dedication, perseverance and strong sense of
purpose
3.53 2
Leaders need high moral and ethical standards 3.52 3
Leaders understand the requirements and feelings of all stakeholders 3.30 4
Leaders focus on the end result 3.21 5
Leaders attempt to satisfy most of the stakeholders most of the time,
but acknowledge that total satisfaction of all stakeholders is beyond the
power of mortals
3.15 6
Leaders will remove underperforming team members 2.82 7
Leaders are aware of flattery from others 2.75 8 (* 4-point Likert scale used = 4 -Strongly Agree, 3 – Agree, 2 – Disagree, 1 – Strongly Disagree)

725
When considering factors associated with teamwork in complex projects, the highest-ranking
attribute in respect of leadership was “Leaders recognise that they cannot possess all the
expertise necessary to micro-manage a complex project, and select teams of appropriately
qualified and experienced personnel”. This question was considered essential for the
recognition of key attributes that influence the formation and management of project teams.
The ranking of these results suggests that there is a tendency of leaders of project teams to
recognise that they cannot micro-manage complex projects. The study shows that these
leaders are inclined to promote empowerment of teams, and their ownership of the project,
with team members taking their own leadership roles on occasions. This relies upon placing
trust in appropriately qualified and experienced team members. The extant literature suggests
that these might be attributes appropriate to a democratic style of leadership. The lower
ranking responses were indicative of an autocratic style of leadership, which might encourage
selection of charismatic leaders who maintain authority and coerce teams into strict
compliance with procedures. The Laissez Faire style of leadership with a characteristic of
leadership absence, having the lowest ranking would suggest that this leadership style has no
place in complex construction projects.
It may be argued that when considering how leaders contribute to the planning of complex
projects, all related attributes identified in Table 2 are essential. Similarly, when questioned
about attributes influencing decision-making from questionnaire participants, particularly
associated with project dilemmas, the responses suggest that all related attributes are
considered essential in an effective leadership style. What is particularly evident is that
leaders need high moral and ethical standards, which is currently a topic of discussion
amongst construction professionals. This is considered important and so is having a strong
sense of purpose and timely resolution of issues.
In respect to monitoring and controlling, Table 2 suggests that, whilst leaders accept that
they are unable to micro-manage a complex projects, they will attempt to identify problems
before they arise and be willing to allow deviance from procedures. Careful examination of
the findings suggest that, for successful delivery of complex projects (i.e. mostly projects
valued above £250m), all highly ranked attributes in different elements of project delivery
lean towards a flexible but controlled style of leadership, especially due to the high
possibility of the changing nature of complex construction projects.
5. DISCUSSION AND CONCLUSIONS
Morris (2013) and Mϋller & Turner (2010) are cited in many authoritative texts, providing an
overview of the history of leadership. The trait models developed from the 1930’s; and the
behaviour models of the 1940’s, which led to the belief that leadership could be taught. The
contingency models of the 1960’s, considered leaders being selected based on their task
expertise. The visionary and charismatic models of the 1980’s distinguished between
transactional and transformational leadership styles. The emotional intelligence models
developed from 2000 based leadership styles on empathy. Reflective practice is now
becoming a common topic being introduced into construction higher education, (Räisänen et
al, 2015). It is arguable that fostering self-awareness and self-criticism through reflective
practice is a key tool for leadership development.
The CIOB (2014) identifies the differing styles of leadership to be coercive, authoritative,
affiliative, democratic, pace setting or coaching, with each style being appropriate for the
726
situational requirements and context. In recent years, (Friedrich et al, 2016) the trend towards
forms of “collectivistic leadership” have been studied under the topics of “shared leadership”,
“distributed leadership”, “collective leadership”, “emergent leadership” and “team
leadership”. It is certainly arguable that there has been a trend that moves away from the
leader who uses a charismatic hero style approach to one who uses a collectivistic approach,
particularly for projects requiring high levels of creativity in complex environments.
However, Friedrich et al (2016) justify the need in any collectivistic approach to leadership to
have a “focal leader” to facilitate the emergence of informal leaders in teams. Back et al
(2012) agree that the extant literature generally concurs that for project success effective
leadership needs to be visible at all phases of a project’s execution. Another approach to
leadership is the authentic leadership style. Avolio and Gardner (2005) define authentic
leaders as: “those who are deeply aware of how they think and behave, and are perceived by
others as being aware of their own and others’ values, knowledge and strengths; aware of the
context in which they operate; and who are confident, hopeful optimistic, resilient, and of
high moral character”. In Avolio and Gardner’s study, comparison is made between
authentic, transformational, charismatic, servant and spiritual styles of leadership based upon
the reasoning that each has some similarity. The extant literature considers the autocratic
leadership style with absolute power of the leader, and compares this approach to the
democratic leadership style where employees contribute to the decision–making process, with
the leader making the final decision. Bureaucratic leadership concerns adherence to rules and
procedures. Transformational leadership is associated with leaders recognising a need to
refocus on important changes required, and communicate this to employees. This is
contrasted with transactional leadership concerned with constructive and corrective styles of
management. Another approach is the Laissez-Faire style of leadership, but many
practitioners would agree with Judge and Piccolo (2004) that this is avoidance of leadership;
with leaders being absent when needed, avoiding making decisions and hesitance in taking
action.
Ireland (2008), Toor and Ofori (2008), Sutton (2009), Mϋller and Turner (2010), Buccolo et
al (2012), Clarke (2012), Chamorro-Prezumic (2013), CMI (2015), Chamorro-Prezumic
(2015), Haughton (2015), and Kennett (2015) confirm that organisations need to respond to
changing customer or stakeholder expectations. It may be considered that project teams be
considered as organisations in the context of complex construction projects. The changing
styles and values of leaders such as those from the next generation of “millennials” are
advised to display attributes associated with emotional intelligence and shared
leadership/democratic leadership styles. Leaders should have visionary strategies, but also
able to communicate those visions to their operational management teams, particularly in
times of dilemma or crisis. Moreover, leaders should possess the attributes of honesty, vision,
direction, flexibility, communication, resilience, empathy and delegation. It appears from
extant literature that there is convincing reasoning to change ‘leadership attributes’ according
to the project context and it’s changing nature, especially when it’s a complex construction
project.
6. REFERENCES
Avolio, B.J. & Gardner, W.L. (2005) ‘Authentic leadership development: Getting to the root of positive forms
of leadership’. The Leadership Quarterly. Vol. 16 (3) pp.315-338.
Back, W.E., Macdonald, R. & Grau, D. (2012) ‘An Organizational Approach to Leadership Development for
Engineering and Construction Management Project Practitioners’. International Journal of Business,
Humanities and Technology. Vol. 2 (2) pp. 121-131.
727
Bigley, G.A. & Roberts, K.H (2001) ‘The Incident Command System: High-Reliability Organising for Complex
and Volatile Task Environments’. Academy of Management Journal. Vol. 44 (6) pp. 1281-1299.
British Standards Institution (2010) BS 6079-1:2010 Project Management – Part 1: Principles and guideline for
the management of Projects. London: BSI.
Buccolo, S., Wrigley, C. & Matthews, J.H. (2012) ‘Gaps in organisational leadership: linking strategic and
operational activities through design led propositions’. Design Management Journal. Vol. 7 (1) pp. 18-28.
Business Innovation and Skills (BIS) (2013) Construction 2025 - Industrial strategy, government and industry
in partnership. URN BIS/13/955. Crown Copyright.
Chamorro-Prezumic, T. (2016) ‘The problem with the charisma cult’. Management Today. February 2016 p.52.
Chamorro-Prezumic, T. (2015) ‘Stop worrying about millennials’. Management Today. December 2015/January
2016 p.76.
Chamorro-Prezumic, T. (2013) ‘Why do so many men become incompetent leaders?’ Harvard Business Review.
August 22nd, 2013. Available online: https://hbr.org/2013/08/why-do-so-many-incompetent-men [accessed
8 December 2015].
Chartered Institute of Building (CIOB) (2016) “Why Join?” Available at: http://www.ciob.org/become-a-
member/why-join [accessed 29 January 2016].
Chartered Institute of Building (CIOB) (2014) Code of Practice for project management for construction and
development. 5th ed. Chichester: Wiley-Blackwell.
Chartered Management Institute (CMI) (2015) “What is the most important character trait of a great leader?” –
a video of delegates at the CMI Midlands Conference at the ICC, Birmingham. Available at:
http://www.managers.org.uk/insights/news/2015/september/what-is-the-most-important-character-trait-of-
a-great-
leader?utm_source=Chartered%20Management%20Institute&utm_medium=email&utm_campaign=61531
12_Insights&dm_i=SYT,3NVRS,4H1XT4,D69A4,1 [accessed 4 October 2015].
Chartered Management Institute (CMI) (2016) “Inefficient UK: Three Remedies”. Professional Manager.
Spring 2016 pp.14-15.
Clarke, N. (2012) ‘Shared leadership in projects: a matter of substance over style’. Team Performance
Management: An International Journal. Vol. 18 (3/4) pp. 196-209.
Cooke-Davies, T. (2002) ‘The “real” success factors on projects’. International Journal of Project Management.
Vol. 20 (3) pp. 185-190.
Constructing Excellence (2015) ‘Annual Report 2015 16’ http://constructingexcellence.org.uk/wp-
content/uploads/2015/11/CE-Annual-Report-web.pdf [accessed 22 May 2016].
Egan, J. (1998) Rethinking Construction. Department of the Environment, Transport and Regions, London.
English Oxford Dictionary (2017). Available at: https://en.oxforddictionaries.com/definition/trait [Accessed 26
June 2017].
Fellows, R. & Liu, A. (2015) Research Methods for Construction. 4th ed. Chichester: Wiley Blackwell.
Friedrich, T.L., Griffith, J.A. & Mumford, M.D. (2016) ‘Collective leadership behaviours: Evaluating the
leader, team network and problem situation characteristics that influence their use’. The Leadership
Quarterly. Vol. 27 (2) pp. 312-333.
Gadeken, O.C. (2005) ‘PM Leadership: Seven Keys to Success’. Defense AT&L: January-February 2005 pp. 10-
12. http://www.dau.mil/publications/DefenseATL/DATLArchivecompletepdf/jan-feb05.pdf [accessed 30
May 2016].
Giles, S. (2016) ‘The Most Importance Leadership Competencies, According to leaders Around the World’.
Harvard Business Review. 15th March 2016. https://hbr.org/2016/03/the-most-important-leadership-
competencies-according-to-leaders-around-the-world&cm_sp=Article-_-Links-_-
End%20of%20Page%20Recirculation [accessed 30 May 2016].
Global Alliance for Project Performance Standards. (2007) “A framework for performance standards for global
level 1 and level 2 project manager”. Available at: http://globalpmstandards.org/wp-
content/uploads/2014/12/GAPPS_Project_Manager_v1.1150411_A4.pdf [accessed 15 May 2016].
Grisham, T.W. (2010) International project management: Leadership in Complex Environments. Hoboken,
New Jersey: Wiley.
Hay, I. (2006) ‘Transformational leadership: characteristics and criticisms’. E-Journal of Organizational
Learning and Leadership. Vol. 5 no. 2 pp. 1-19.
Haughton, J. (2015) ‘How to Up Manage a Visionary Boss’. Chartered Management Institute – Insights. 25
November 2015. Available at: http://www.managers.org.uk/insights/news/2015/november/how-to-up-
manage-a-visionary-
boss?utm_source=Chartered%20Management%20Institute&utm_medium=email&utm_campaign=6483717
_insights%2026%20November%202015&dm_i=SYT,3UYV9,4H1XT4,DWUK9,1 [accessed 29 November
2015].

728
Ireland, V. (2008) ‘Leadership: The role of transformational leadership and emotional intelligence’. Australian
Journal of Civil Engineering. Vol. 5 (1) pp. 7-18.
Ireland, V. (2014) ‘Appropriate Leadership and Management of Complex Projects’. In: Project Perspectives –
2014, The Annual Publication of International Project Management Association. Vol. 36, pp. 46-51.
Judge, T.A & Piccolo, R.F. (2004) ‘Transformational and transactional leadership: a meta-analytic test of the
relative validity’. Journal of Applied Psychology. Vol. 89 (5) pp.755-768.
Kennett, M. (2015) ‘Leadership Qualities’. Management Today. July/August 2015 p 62.
Kerzner, H.R. & Belack, C. (2010) Managing Complex Projects. Hoboken: Wiley.
Li, Y., Lu, Y., Hoon Kwak, Y., Le, Y., & He, Q. (2011) ‘Social network analysis and organisational control in
complex projects: construction of EXPO 2010 in China’. The Engineering Project Organisation Journal.
Vol. 1 (4) pp. 223-237.
Machiavelli, N. (2008) The Prince. trans. by Bondanella, P. Oxford: Oxford University Press.
Morgan, A. & Gbedemah, S. (2010) ‘How poor project governance causes delays’. A paper presented to the
Society of Construction Law at a Meeting in London, 2 February 2010.
http://www.pwc.co.uk/assets/pdf/society-of-construction-law-oct10.pdf [accessed 3 April 2016].
Morris, P. (2013) ‘Reconstructing Project Management Reprised: A Knowledge Perspective’. Project
Management Journal. Vol. 44 (5) pp. 6-23.
Mϋller, R. & Turner, R. (2010) ‘Leadership competency profiles of successful project managers’. International
Journal of Project Management. Vol. 28 (5) pp. 437-448.
Office of Government Commerce (OGC) (2012) ‘Common causes of project failure’.
https://www.google.co.uk/webhp?ie=UTF-8&rct=j#q=ogc+common+causes+of+project+failure [accessed
3 April 2016].
Ovolio, B.J. & Gardner, W.A. (2005) ‘Authentic leadership development: Getting to the root of positive forms
of leadership’. The Leadership Quarterly. Vol. 16 (3) pp. 315-338.
Pickervance, K. (2011). Managing the Risk of Delayed Completion in the 21st Century – A presentation to the
CIOB. Available at: http://www.youtube.com/watch?v=rsU7EftWVx0 [accessed 4 October 2015].
Pryke, S., Lunic, D. & Badi, S. (2015) ‘The effect of leader emotional intelligence on leader–follower
chemistry: a study of construction project managers’. Construction Management and Economics. Vol. 33
(8) pp. 603-624.
Räisänen, C., Josepsson, P.E. & Luvö, B. (2015) ‘Stakeholders’ views and experiences of leadership education
in construction: suggestions for improvements’. 8th Nordic Conference on Construction Economics and
organization. Procedia Economics and Finance. Vol. 21 pp. 540-547.
Remington, K. (2011) Leading Complex Projects. Farnham: Gower.
Rickards, T. (2015) Dilemmas of Leadership. 3rd ed. Abingdon: Routledge.
Sage, D., Dainty, A. & Brookes, N. (2011) ‘How actor‐network theories can help in understanding project
complexities’, International Journal of Managing Projects in Business. Vol. 4 (2) pp.274 – 293.
Sutton, R.I. (2009) ‘How to Be a Good Boss in a Bad Economy’. Harvard Business Review. Harvard Business
Publishing. http://www.ocvets4pets.com/archive17/How_to_Be_a_Good_Boss_in_a_Bad_Economy_-
_HBR.org.pdf [online] [accessed 25 June 2015].
Tannenbaum, R. & Schmidt, W. (1958) ‘How to Choose a Leadership Pattern’. Harvard Business Review. Vol.
36 (2) pp. 95-101.
Toor, S.R. & Ofori, G. (2008) ‘Leadership for future construction industry: Authentic leadership’. International
Journal of Project Management. Vol. 26 pp. 620-630.
Tremaine, R.L. (2016) ‘The High Flying Leadership Qualities: What matters the most?’ Defense ARJ. Vol. 23
(2) pp.122-150. http://www.dau.mil/publications/DefenseARJ/ARJ/ARJ77/ARJ77-Tremaine_Article01.pdf
[accessed 30 May 2016].
Van Eeden, R., Cilliers, F., & Van Deventer, V. (2008) ‘Leadership styles and associated personality traits:
Support for the conceptualisation of transactional and transformational leadership’. South African Journal
of Psychology. Vol. 38 (2) pp. 253-267.
Zenger, J. & Folkman, J. (2014) ‘9 Habits That Lead to Terrible Decisions’. Harvard Business Review. HBR
Blog network pp. 1-2. Available at http://www.energycollection.us/Board-Of-Directors/9-Habits-Lead.pdf
accessed 1 August 2017].

729
7. APPENDIX 1: SURVEY SAMPLE SUMMARY BY REGION
Centre/Region Number of members and fellows
Aberdeen 10
Bedfordshire 44
Birmingham & Solihull 55
Cambridgeshire 16
Cardiff 66
Cheshire 22
Cornwall 16
Coventry & Warwickshire 34
Cumbria 10
Devon 39
Dorset 39
Dundee 16
Durham & Wearside 16
East of Scotland 32
Essex 109
Gloucestershire 40
Greater Manchester 112
Hampshire 80
Herefordshire & Worcester 40
Hertfordshire 130
Highlands & Islands 10
Humber York & North Yorkshire 52
Isle of Man 6
Kent 116
Lancashire 39
Leeds & West Yorkshire 82
Leicestershire 36
Lincolnshire 24
Liverpool 50
London 233
North Wales 30
Sheffield & South Yorkshire 38
Staffordshire 36
Tyneside 38
West of Scotland 89
Total 1805

730
ID 148
THE NEED FOR QUALITY CULTURE IN IRAN’S OIL AND GAS
PROJECTS: A CRITICAL REVIEW
M. Maleki Sadabad and C. Pathirage
School of the Built Environment, University of Salford, Salford, M5 4WT, UK
Email: [email protected]
Abstract
Quality is an approved management concept in the twentieth century and an intense catalyst
for driving organisational competitiveness and effectiveness. The cornerstone of any type of
quality enhancement includes cultivating a ‘quality culture’ in the target organisation and
incorporating it all through the organisation. ‘Organisational culture’ is characterised as the
collective views, standards, outlooks, and behaviours that represent the staff in a company. As
a management system, Total Quality Management (TQM) initiated in the 1950's and has
persistently progressed and has become more widespread since the early 1980's. TQM is
considered as an improvement to the conventional commercial methods and is an established
strategy securing survival in the worldwide rivalry. Project Management (PM) is the field of
utilising recognised standards, procedures and policies to deal with a project from origination
to completion. It is frequently abbreviated as PM and entails organising and connecting the
company’s resources to accomplish a specific activity, event or responsibility. Different
organisations and project teams possess exclusive features, value structures and manners of
performing objectives to be successful. A project leader is supposed to comprehend the notion
of culture; in turn, he can receive support from the organisation members and lead the project
efficiently. The aim of this paper is to stress the necessity of quality culture in PM teams
within Iran’s oil and gas industry. Therefore, a critical review of the related literature is
performed to clarify challenges in conventional PM structure in Iran’s oil and gas industry,
current practices in TQM and methods with which quality culture can enhance the performance of PM teams. A critical literature survey and review of existing published data is
carried out to explain the needs of quality culture in Iran’s oil and gas projects.
Keywords: Oil and Gas Industry, Project Management, Quality Culture, Organisational
Culture
1. INTRODUCTION
Quality is an approved management concept in the twentieth century and an intense catalyst
for driving organisational competitiveness and effectiveness (Butler, 2009). As of late,
research interests have moved from the implementation aspect of quality and subsequently
the formation of organisational and local culture that drive quality through consistent change
and optimisation, towards the emerging concept of sustainable organisational excellence.
According to Goetsch and Davis (2014), quality is defined as a dynamic condition connected
to products, procedures, setting, services, and individuals that satisfy customer desires and
needs and assists in generating higher value. These authors also state that to differentiate
Total Quality (TQ) method from conventional methods of business, attempts must be made to
amplify the competiveness by consistent enhancement of the quality of products, procedures,
setting, services, and individuals.

731
According to Oakland (2014), TQM is a management system that initiated in the 1950's and
has persistently progressed and has become more widespread since the early 1980's. TQM is
considered as an improvement to the conventional commercial methods and is an established
strategy securing survival in the worldwide rivalry (ibid). The culture and activities of an
organisation can be modified by transforming the management activities. Oakland (2014)
continues to state that TQM is an inclusive and organised way to deal with organisational
management that attempts to enhance the quality of services and products by means of
progressing improvements in light of constant feedback. The three words are broken down in
the following section:
Total: construction of an entirety;
Quality: Amount of superiority a service or product offers; and
Management: Action, skill, or method of managing, controlling, coordinating etc.
(Oakland, 2014).
As a result, TQM is the skill of dealing with the entirety to achieve superiority. TQM is also
characterised as an attitude and an arrangement of standards that embody the establishment of
a ceaselessly enhancing organisation (Oakland, 2014). It is utilisation of quantitative
strategies and human resources to enhance the whole procedures in an organisation and
surpass customer needs at the present time and also in the future. TQM combines essential
management methods, current modification endeavours and specialised apparatuses under an
organised approach.
A critical review of the related literature is performed to clarify challenges quality culture
faces in Iran’s oil and gas PM teams. The paper starts with the notion of quality and then
quality culture constituents are discussed. Afterwards, quality culture within PM and Iran’s
oil and gas is briefly discussed followed by addressing the challenges of quality culture in
PM. Further, the connection between these challenges and the impact on Iran’s oil and gas
performances is discussed.
2. QUALITY
Chandrupatla (2009) believes that different individuals view quality in their own specific
ways; however, everybody can realise what is referred to as ‘quality’. As an example, a
customer using a specific product views the concept of quality in the form, performance and
function of that product. The extent of satisfaction by the customer indicates the quality of the
received service. In the dictionary, quality is defined as the amount of superiority.
Nevertheless, the definition is not considered as absolute because of the relative nature of the
definition. The evaluation procedure is eventually done by the customer. Every service or
product should reflect customers’ requirements in the form of quantifiable features. After
these specifications are set, it is necessary to find ways for assessing and observing the target
features. Indeed, this procedure leads to constant enhancement in the service or product with
the end goal to persuade the customer to buy the service or product. This persuasion brings
about profit for the service provider and creates a strong relationship between the customer
and the service provider. Establishing and maintaining this relationship is contingent upon the
reliability of the service or product.

732
2.1 Quality Culture
Business owners, who start organisations, or managers in charge of controlling the company,
regularly develop organisational cultural frameworks which reflect their own logic. The
applicability of these frameworks in finding opportunities and facing limitations reflects the
organisation’s success or failure (Bass & Avolio, 1993; Dellana & Hauser, 1999). Thus, the
culture of an organisation can be considered as the source of business attitude and value and
it is this culture that defines guidelines, techniques and activities within an organisation
(Batten, 1994; Dellana & Hauser, 1999, Malhi, 2013). As Malhi (2013) puts it, Quality
Culture includes the coordination of shared principles, philosophies and standards that
concentrates on delighting customers and constantly enhancing the quality of products and
services. Thus, in an organisation that possesses quality culture, quality is deeply rooted in
almost every facet of organisational life.
A border not clearly defined is the one between TQM as an organisational culture and TQM
as a management agenda. A large portion of the TQM categorisations entail individual
aspects or components that have a place in organisational culture. Definitely, one may
contend that the essence of TQM is culture modification and that TQM activities are only
instruments for cultural change (Flood, 1993; Zeitz, Johannesson, & Ritchie, 1997). The
answer to this riddle can be found in organisational culture. Culture comprises of the
convictions, standards and fundamental assumptions that support behavioural items and
patterns (Ott, 1989; Zeitz et al., 1997).
2.2 Quality Culture in Iran Context
It is significant for this study to inspect levels of adoption of quality, but also to analyse the
presence of quality cultures in Iran and the oil and gas industry. Gershman (2016) believes
that the relationship between culture and economic growth is by no means a new subject. In
addition, Prajogo (2007) also states that there is a strong relationship between quality,
strategy and competitiveness.
In the Middle East, quality or TQM is viewed as a profitable management approach.
Nevertheless, culture change in Iran appears to be misjudged, yet in the West, organisations
have developed business cultures that positively affect benefit and financial improvement. In
the Middle East, associations are likely to lack a long-term view (Zairi, 1996). Business goals
are in general short term and concentrated on fulfilling immediate social needs of the
business owners. Moreover, the practices set up frequently fulfil the social needs of the
business owners, and thus there is occasionally little concentration on consumer satisfaction
as required in TQM.
The poor work practices, high degrees of self-satisfaction, distrust among groups of workers,
doubt, trivial jealousies, demonstrations of treachery, nepotism, dishonesty, passive outlooks,
absence of eagerness to coordinate, ‘them and us’ syndrome, and numerous other unsuitable
work habits are found in Iranian organisations. These issues should be handled and tested
immediately if success with quality is to be sustained.
In 1997, Aly carried out a study which analysed TQM execution in the Middle East (a
territory which entails Iran). At that point, he set up that the need to research quality and
TQM was ‘very worthwhile’. Additionally, it was found that the quantity of associations
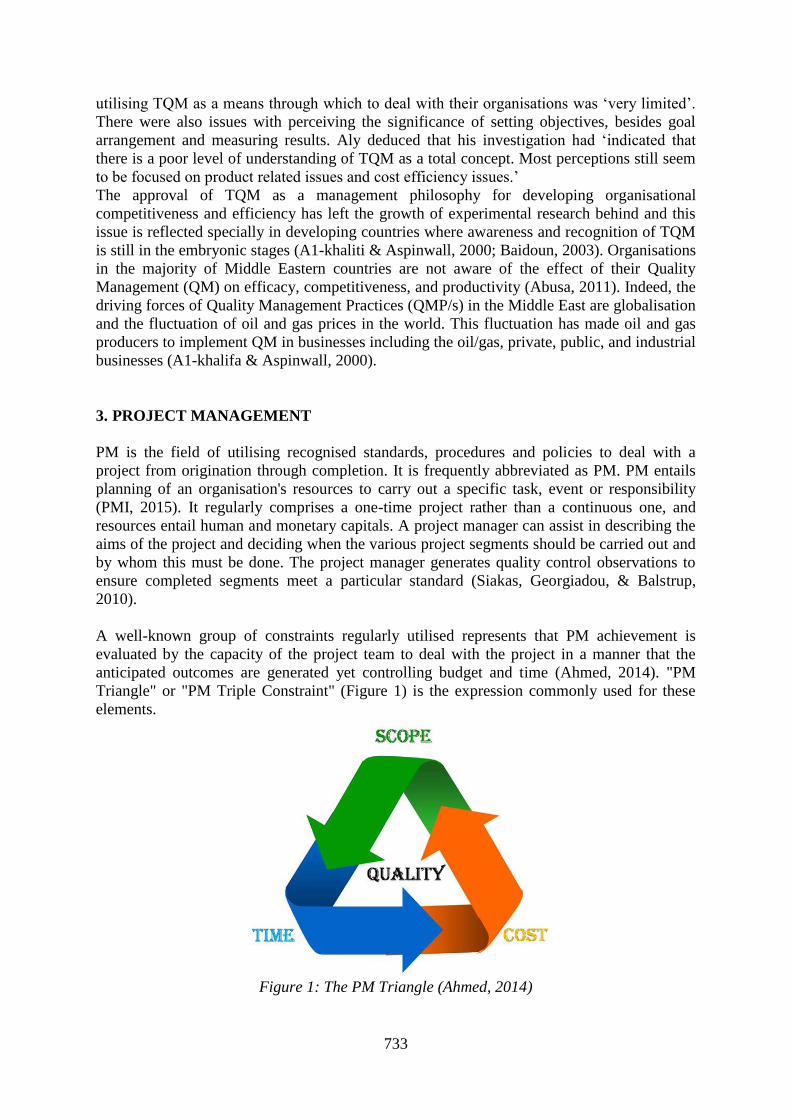
733
utilising TQM as a means through which to deal with their organisations was ‘very limited’.
There were also issues with perceiving the significance of setting objectives, besides goal
arrangement and measuring results. Aly deduced that his investigation had ‘indicated that
there is a poor level of understanding of TQM as a total concept. Most perceptions still seem
to be focused on product related issues and cost efficiency issues.’
The approval of TQM as a management philosophy for developing organisational
competitiveness and efficiency has left the growth of experimental research behind and this
issue is reflected specially in developing countries where awareness and recognition of TQM
is still in the embryonic stages (A1-khaliti & Aspinwall, 2000; Baidoun, 2003). Organisations
in the majority of Middle Eastern countries are not aware of the effect of their Quality
Management (QM) on efficacy, competitiveness, and productivity (Abusa, 2011). Indeed, the
driving forces of Quality Management Practices (QMP/s) in the Middle East are globalisation
and the fluctuation of oil and gas prices in the world. This fluctuation has made oil and gas
producers to implement QM in businesses including the oil/gas, private, public, and industrial
businesses (A1-khalifa & Aspinwall, 2000).
3. PROJECT MANAGEMENT
PM is the field of utilising recognised standards, procedures and policies to deal with a
project from origination through completion. It is frequently abbreviated as PM. PM entails
planning of an organisation's resources to carry out a specific task, event or responsibility
(PMI, 2015). It regularly comprises a one-time project rather than a continuous one, and
resources entail human and monetary capitals. A project manager can assist in describing the
aims of the project and deciding when the various project segments should be carried out and
by whom this must be done. The project manager generates quality control observations to
ensure completed segments meet a particular standard (Siakas, Georgiadou, & Balstrup,
2010).
A well-known group of constraints regularly utilised represents that PM achievement is
evaluated by the capacity of the project team to deal with the project in a manner that the
anticipated outcomes are generated yet controlling budget and time (Ahmed, 2014). "PM
Triangle" or "PM Triple Constraint" (Figure 1) is the expression commonly used for these
elements.
Figure 1: The PM Triangle (Ahmed, 2014)

734
A limitation is indicated on every side of this triangle so that change in one side influences
the other sides. These sides include ‘Cost’, ‘Scope’, and ‘Time’ while ‘Quality’ is placed in
the centre of the triangle as the forth limitation (Kerzner, 2013).
3.1 Quality Culture in Project Management
Suda (2007) suggests that any project team or organisation has its own exclusive
characteristics, value structures, and the manner they perform their tasks to succeed. In order
to lead and support the target project to success, the project leader should have a clear picture
of the notion of culture. Many of these projects include business with various cultures at the
same time. These project leaders usually perform their duties based on the core culture of
their organisation; indeed, they also consider the subcultures of different departments such as
research and development (R & D), sales, and etc. Project managers also take into account
the customers and the core cultures related to them. For accomplishment of the project,
comprehension of immediate culture is also a must as this is the key for developing time-
honoured plans. Subsequently, practices that disturb the end goal and principles of the client
organisation must be bypassed. To form a focused project culture, many chances are provided
for project leaders contingent upon the fact that this culture be consistent with the lead culture
of the target organisation. In order to have a team with a healthy atmosphere and to improve
the project team, all the factors mentioned above must be taken into consideration.
4. RESEARCH METHODOLOGY
This paper is based on secondary data analysis that characterises and clarifies the needs of
quality culture in Iran’s oil and gas projects.The data have been collected from peer reviewed
journals, and some books and conference papers. At this stage of research, a qualitative
content analysis will form the key research tool to analyses the secondary data. At this point,
the primary data gathering and analysis has not yet been completed, which will be collected
by interviewing relevant expert views regarding the impact of quality culture in Iran’s oil and
gas projects. This present study will, therefore, purely adopt a qualitative data gathering
method, and consider various secondary sources accessed via Internet and academic
databases.
5. CHALLENGES OF CULTURE AS AN INFLUENCE ON QUALITY
A fundamental element distinguished in the literature is the failure of numerous organisations
to adapt TQM properly to the particular cultural setting in which it is being applied. This
turned into a significant theme in the TQM literature alongside the developing realisation that
‘soft’ behavioural and cultural aspects of TQM are in any event equally as essential to its
prosperity as the ‘hard’ aspects, such as particular instruments and techniques (e.g. Dale &
Cooper, 1992; Katz, 1993).
Culture influences individuals' beliefs and indirectly affects performances. The socio-cultural
condition, in which the association exists, specifically influences organisational culture and
functioning of organisations (Siakas et al., 2010). The execution and adequacy of quality
management practices could also be emphatically affected by the national culture (Tata &
Prasad, 1998). Noronha (2002, 2003) contended that quality management programmes ought

735
to be culture-specific and the effective adoption requires understanding the fundamental
national cultural variables. Cultural change is progressively being perceived as a vital part of
total quality development (Adebanjo & Kehoe, 1998).
The cultural impacts on business and organisational exercise generally, and on TQM
implementation specifically, can be partitioned into national cultural influences and
organisational culture influences, which frequently overlap, however are not necessarily the
same.
6. CHALLENGES OF ORGANISATIONAL CULTURE IN PROJECT
MANAGEMENT
The culture of an organisation is connected to the degree of success of the projects in various
regions, including processes, administration style, time controlling and training.
Organisational culture includes the potentials and performances of that organisation’s
employees. A guide to the PM body of knowledge (PMBOK ® Guide) (2008) summarises
these elements as:
General quality of the staff experience
Collective perspectives, duty declarations and expectations
Encouragement and payment procedures
Work principle
Manners of behaviour
Atmosphere
Social standards
Risk-taking procedures
The PMBOK Guide notes that these attributes assume a significant part in deciding whether
objectives of the project are accomplished. The point of view of employees about their role in
the project and in the organisation is a crucial aspect of organisational culture. Projects that
are viewed as adjusting to organisational culture may have smoother application and higher
achievement rates contrasted with tasks that contradict with those cultural standards. Tasks
that comply with the elements of organisational culture may have better application and
greater achievement than the activities that are not in line with those elements.
Comprehension of organisational culture along its connection to PM can assist organisations
in figuring out which activities are considered as effective to tackle. Inserting PM mind-set in
organisational culture can bring about long-term advantages in competition with other
organisations. This is based on a research carried out by PM Institute (PMI®) in 2015: Pulse
of the Profession: Capturing the Value of PM.
The research recognised a number of ways for developing a culture that grasps PM such as
recognising the significance PM offers; involving project patrons at administrative levels; and
adjusting tasks to organisational plan (Bradley, 2017). Companies with such credits will
probably indicate greater amounts of accomplishment in PM.

736
7. OIL AND GAS SECTOR IN IRAN
The Anglo-Persian oil organisation discovered oil in 1908 at Masjid-i-Suleiman located in the
southwest of Iran and thus put an end to the seven-year ailment and debts (Kent, 2015). The
finding established the backgrounds for the organisation called BPPLC and the mounting of a
huge oil power.
During the previous century, Iran has had the opportunity to be one of the world's most
powerful oil producers despite its recurrent difficulties with Saudi Arabia's oil lobby (Kent,
2015). Iran started opening up before the beginning of the new century, seeking the skill of
worldwide oil organisations to assist in increasing production. European oil organisations put
billions of dollars in the nation, enthusiastic to access Iran's boundless reserves regardless of
tough terms (Raval, 2015). As Stevens (2015) reports:
The oil and gas sector in Iran is vital for the nation's financial outlook. The future of
this country is dependent upon how restrictions are removed and also upon
arrangements Iran has made to offer to the international oil companies (IOCs).
Innovation and capital are what Iran requires which can be accessible from IOCs.
Although Iran has indicated a great interest, the IOCs will probably be attracted if the
condition is profitable.
The trade of liquefied gas has been offered from Iran to Europe to eliminate over-
dependence on Russia. Various pipeline courses have also been proposed (Stevens,
2015).
In May 2014, Zanganeh, Iranian minister of petroleum, expressed that Iran has been always
ready to export liquefied gas and gas to Europe. At the same time, Ali Majedi, the
representative oil minister for international trade affairs stated that 4 million cu m and 50
million cu m of natural gas can be transferred to Europe every day through a pipeline in
Turkey. Also, alternative lines can go through Iraq, Lebanon, Syria, Armenia, Georgia and
the Black Sea (Stevens, 2015).
8. QUALITY CULTURE CHALLENGES OF OIL AND GAS INDUSTRY IN IRAN
Ranked first for oil and gas reservoirs, the National Iranian Oil Company (NIOC) is in charge
of studying, planning and performing hundreds of projects per annum. While managing these
projects, the anticipated consistency and efficiency should be met; otherwise, considerable
losses of money, time and other resources is inevitable (Brumberg & Ahram, 2007). Thus, the
notion of founding an appropriate PM procedure in NIOC seems essential. Furthermore, the
top management highly endorses any novel and applicable solutions regarding this issue.
Unfortunately, improper PM has led to failure in achieving goals on time in many NIOC
projects (Kerzner, 2013). This scenario becomes worse when lessons learned from previous
or present projects are not collected and utilised in the form of an official, unified and
comprehensive system.
Knowledge of essential tools, tactics and methodologies within TQM is a necessary skill for
project managers with which most are not professionally familiar. As a result, already solved
problems in other projects or those that could have been easily avoided waste a great deal of
time and effort to be resolved (Umble, Haft, & Umble, 2003). As an example, an ordinary
and not large oil production plant in NIOC (50,000 bpd) will bring about $100 million loss

737
for a one-month delay which could be easily avoided by using a proper TQM system
(Moghaddasi, 2013).
The Iranian Oil Company is not only the largest organisation in the Middle East but also a
major member in oil companies around the world (Karimi & Kadir, 2012) which plays a
prominent role in the economy of the country. Many helpful activities have been initiated in
the domain of quality management, quality enhancement of products, and economical
progress by this company. The ISO standard is held by the majority of oil and petro
chemistry companies; other companies have also won the EFQM prize. In order to achieve
the maximum customer satisfaction, a number of companies have created suggestion systems
to improve TQM. However, the key question addresses the amount of success companies
have achieved with pre-planned quality agenda. The review of the related literature reveals
that no studies thus far have been conducted in this domain. Therefore, the present research
aims to address this gap and thus help eliminate shortcomings of the aforementioned issues. It
is necessary to conduct research on the effect of TQM on the level of quality, enhancement of
production quality as well as performance of the oil industry particularly in their operational
performance.
As Sharafedin (2016) reports, in the past decades, many incidents have happened within oil
and gas industry of Iran, ranging from $40 Million oil rig collapse into the sea to fire
incidents in Iranian major petrochemical plants because of lack of quality. For example, in
2016 a fire at Iran's Mobin Petrochemical refinery complex located in Assaluyeh left 4
employees injured and $66 Million damages to the plant.
9. DISCUSSION
PM includes organising different parts of a project to yield a satisfactory outcome. This
organising entails various factors as employees, resources, facilities, and techniques
(Amalraj, Hernani, Ladouceur, & Verma, 2007). Unfortunately, project managers have
encountered major challenges during the past ten years. Quality, agenda, and cost are
variables that have made PM a challenging issue along with a number of mitigating factors
over which the project manager can have no control. Occasionally, these external variables
can affect PM in a way similar to controllable variables. Amalraj et al. (2007) suggest that
quality is the part of PM that can cause problems in this domain and project owners view
quality as a challenge. The owner representatives usually do not concentrate on the notion of
quality as required since they devote most of their time to supervising managers.
Culture includes a group of developed behaviours that individual have within a society. To
E.B. Taylor, an anthropologist, culture is a multifaceted whole that entails information, faith,
art, ethics, regulations, conventions and all the other habits and behaviours people in a society
might acquire. Organisational culture entails the principles, customs, information,
performance and the predictable practices of a specific social group (Cleland, 1988). People
create organisations and each organisation has its own distinctive features which connect
these people to each other while providing a group of values and principles for working and
living.
The general cultural climate of each organisation is reflected in its policies which is also the
case with PM. In a nuclear project, for instance, culture can have a great impact on the
connection between efficacy and different controlling bodies. When efficacy is not in line
with the Nuclear Regulatory Commission (NRC) guidelines, quality reassurance turns into a

738
piece of paper instead of a managing instrument (Cleland, 1988). On the contrary, cultural
climate can also influence projects in a constructive manner.
The effect of cultural difference on business productivity is not a new concept in oil and gas
industry of Iran, yet has increased because of globalisation. Nonetheless, the correspondence
among different social groups and effective control of emotions has not received enough
attention. The technical challenges have also made the situation more complicated and strong
determination is required to tackle these problems (Weijermars & De Jong, 2008).
Traditionally, the oil and gas sector has concentrated on managing economic, political and
methodical uncertainties and risks connected to them. Bringing an intelligible perspective to
cultural risk management assists in preventing undesirable results from happening in
discussions and implementations of PM in oil and gas business. The oil and gas industry is
usually multifaceted and includes a great diversity with regard to different cultures
professionals of the field come from. Since human behaviours and activities are partly
influenced by emotions instead of logic, it seems reasonable to stress the part emotions and
cultural obstacles play and thus measure their potential effect on oil and gas industry
internationally. This critical review research not only extends previous research on quality
culture, but also enables project managers to be aware of key challenges and barriers that
exist in oil and gas projects especially in Iran. As this paper is critically reviewing quality
culture issues in Iran’s oil and gas industry, critical literature survey and review of existing
published data is carried out to explain the needs of quality culture in Iranian oil and gas
projects.
10. CONCLUSION
The impact of culture to a project team has received various answers in the literature: a) it
creates social standards to control behaviour; b) it conveys messages to both insiders and
outsiders about the organisation objectives; c) it assists in connecting people, organisational
objectives and standards; and d) it helps regulate, supervise, and develop views and activities
in the organisation. The purpose of this study is to understand the necessity of quality culture
in PM teams within Iran’s oil and gas industry. Therefore, a critical review of the related
literature is performed to clarify challenges in conventional PM structure in Iran’s oil and gas
industry, current practices in TQM and methods with which quality culture can enhance the
performance of PM teams. A critical literature survey and review of existing published data is
carried out to explain the needs of quality culture in Iran’s oil and gas projects. As a
contribution to the existing body of literature, the present study will make an attempt to
provide a comprehensive perspective to project managers in oil and gas sector. These
managers will also be able to perceive the role of different factors in executing oil and gas
projects. Consequently, a more extensive and multi-faceted image of quality culture in project
management will be created. This can indeed enhance their performance and effectiveness as
the so called project managers and give their companies the needed boost.
11. REFERENCES
Abusa, F. (2011). TQM implementation and its impact on organisational performance in developing countries:
A case study on Libya. Doctoral dissertation, University of Wollongong.
Adebanjo, D., & Kehoe, D. (1998). An evaluation of quality culture problems in UK companies. International
Journal of Quality Science, 3(3), 275-286.

739
Ahmed, G. (2014). PM triangle: How to manage its scope, cost and time. Retrieved online from
http://www.studylecturenotes.com/project-management/project-management-triangle-how-to-manage-its-
scope-cost-time
A1-khalifa, K. N. & Aspinwall, E. M. (2000). The development of total quality management in Qatar. The TQM
Magazine, 12 (3), 194-204.
Aly, M. A. (1997). Is self-assessment (as a powerful tool for TQM implementation) suitable in the Middle East
context? The experience of a petrochemical global company. Total Quality Management, 8(2-3), 54-59.
Amalraj, J., Hernani, C., Ladouceur, K., & Verma, A. (2007). PM: Challenges & lessons learned. Retrieved
from http://www.beg.utexas.edu/energyecon/ua_2007/AB_Project_Mgt_challenges.pdf
Baidoun, S. (2003). An empirical study of critical factors of TQM in Palestinian organizations. Logistics
Information Management, 16(2), 156-171.
Bass, B. M., & Avolio, B. J. (1993). Transformational leadership and organizational culture. Public
Administration Quarterly, 17(1), 112-121.
Batten, J., (1994). A total quality culture. Management Review, 94, 61.
Bradley, J. (2017). Implications of organizational culture on project structure. Retrieved online from
http://smallbusiness.chron.com/implications-organizational-culture-project-structure-73039.html
Brumberg, D., & Ahram, A. I. (2007). The National Iranian oil company in Iranian politics. Paper prepared in
conjunction with an energy study sponsored by Japan Petroleum Energy Center and the James A. Baker III
Institute for Public Policy, Rice University.
Butler, J. M. (2009). Implementation of quality management in the public sector versus the private sector: A
cultural analysis. Doctoral dissertation: Dublin City University.
Chandrupatla, T. R. (2009). Quality and reliability in engineering. Cambridge: Cambridge University Press.
Cleland, D. I. (1988). The cultural ambience of PM-another look. PM Journal, 19(3), 49-56.
Dale, B. C., & Cooper, C. L. (1992). TQM and human resources: An executive guide. Oxford: Basil Blackwell.
Dellana, S. A., & Hauser, R. D. (1999). Towards defining quality culture. Engineering Management Journal,
11(2), 11-15.
Flood, R. L. (1993). Beyond TQM. New York, NY: John Wiley & Sons.
Gershman, B. (2016). Long-run development and the new cultural economics. Retrieved from
http://www.american.edu/cas/economics/research/upload/2016-06.pdf
Goetsch, D. L., & Davis, S. B. (2014). Quality management for organizational excellence. Upper Saddle River,
NJ: Pearson.
Karimi, Y., & Kadir, S. L. S. A. (2012). The impact of organisational culture on the implementation of TQM:
empirical study in the Iranian oil company. American Journal of Industrial and Business
Management, 2(4), 205-216.
Katz, L. (1993). Multiple perspectives on the quality of early childhood programs. ERIC # ED355 041.
Kent, S. (2015). A brief history of the Iranian oil industry. Retrieved online from
https://www.wsj.com/articles/a-brief-history-of-the-iranian-oil-industry-1428063016
Kerzner, H. (2013). PM: A systems approach to planning, scheduling, and controlling. Hoboken, New Jersey:
John Wiley & Sons.
Malhi, R. S. (2013). Creating and sustaining: A quality culture. Journal of Defence Management, 3,
doi:10.4172/2167-0374.S3-002.
Moghaddasi, H. (2013). Improving consistency and efficiency in managing oil and gas projects of national
Iranian oil company (NIOC) by establishing a PM office (PMO). Retrieved online from
http://cpm.nioc.ir/Monthly_OilReport/EnergyConsumption_EvaluationOfProject/Moghadasi-Paper-1.pdf
Oakland J. S. (2014). TQM and operational excellence: Text with cases. New York: Routledge.
Ott, S. J. (1989). The organizational culture perspective. Florence, KY: Brooks/Cole.
PMI. (2008). A guide to the PM body of knowledge (PMBOK ® Guide) (4th Ed.). Newtown Square, PA: PM
Institute, Inc.
PMI. (2015). Pulse of the profession: Capturing the value of PM. PM Institute, Inc.
Prajogo, D. I. (2007). The relationship between competitive strategies and product quality. Industrial
Management & Data Systems, 107(1), 69-83.
Raval, A. (2015). Iran prepares to open up to foreign oil companies. Retrieved online from
https://www.ft.com/content/df9f4ef0-71a2-11e5-9b9e-690fdae72044
Sharafedin, B. (2016). Fire breaks out at petrochemical plant in southern Iran. Retrieved online from
http://www.reuters.com/article/us-iran-fire-petrochemicals-idUSKCN11K0S8
Siakas, K. V., Georgiadou, E., & Balstrup, B. (2010). Cultural impacts on knowledge sharing: Empirical data
from EU project collaboration. Vine, 40(3/4), 376-389.
Stevens, P. (2015). Prospects for Iran’s oil and gas sector. Retrieved online from
https://www.chathamhouse.org/publication/prospects-irans-oil-and-gas-sector

740
Suda, L. V. (2007). The meaning and importance of culture for project success. Paper presented at PMI® Global
Congress 2007-EMEA, Budapest, Hungary. Newtown Square, PA: PM Institute.
Tata, J., & Prasad, S. (1998). Cultural and structural constraints on TQM implementation. Total Quality
Management, 9(8), 703-710.
Umble, E. J., Haft, R. R., & Umble, M. M. (2003). Enterprise resource planning: Implementation procedures
and critical success factors. European Journal of Operational Research, 146(2), 241-257.
Weijermars, R., & De Jong, V. (2008). Closing communication gaps can improve the success of oil & gas
ventures. Oil and Gas Business Journal, 1-24. Retrieved from
http://www.ogbus.ru/eng/authors/Jong/Jong_1.pdf
Zairi, M. (1996). Benchmarking for best practice. Oxford: Butterworth-Heinemann.
Zeitz, G., Johannesson, R., & Ritchie, J. E. Jr. (1997). An employee survey measuring TQMpractices and
culture: Development and validation. Group and Organization Management, 22(4), 414-444.

741
ID 160
EXPLORING THE EFFECTS OF PERFORMANCE MEASUREMENT
PRACTICES IN OIL AND GAS PIPELINE MAINTENANCE
C. Aduku1, C. Liyanage2 and G. John3
School of Engineering, University of Central Lancashire, PR12HE, United Kingdom
Email: [email protected]
Abstract: This paper defines manager’s job performance in pipeline maintenance and how
performance usage practices enhances capabilities in pipeline maintenance.This study was
conducted through a multiple case studies using three multinational oil and gas companies in
Nigeria. Comparisons are made between performance measurement usage practices in pipeline
maintenance, focusing on managers’ job performance, their influence in pipeline maintenance.
Clear value and importance of performance measurement usage and usage situation
perspective for identifying and solving problems in pipeline maintenance is the main findings
of this study. In the interpretative perspective, managers’ job performance is
multidimensional. This study focus on managers’ job performance, the interactive nature of
performance measurement usage practices, future research will applied a holistic approach to
observe all personnel involved in pipeline maintenance, which will allow a richer picture of
the impact of performance measurement in pipeline maintenance. This paper outlined the
importance of performance measurement usage and situation usage in pipeline maintenance in
the Nigeria O&G industry, by amalgamating performance measurement and pipeline integrity
management, an innovative way of improving integrity management practices in the Nigeria
O&G industry.
Keywords: Condition based maintence, Oil and Gas, Performance measurement, Pipeline
maintenance, Pipeline integrity management
1. INTRODUCTION
Pipeline undoubtedly is one of the influential components in the production of Oil and Gas
(O&G), also in the sales of O&G in the world market today. It is also a highly valued
component of the extractive industry. Its functions involved exploration, extraction and
transportation of O&G to costumers. Many countries energy requirements solely depend on
the regularity of service of pipelines
The Nigeria government also depend on the uninterrupted supply of O&G through pipeline in
order to generate revenue and electricity. To maintain constancy in the production and
distribution of O&G, the O&G companies operating in Nigeria have adopted maintenance
performance measurement (MPM) strategy. The adoption process was to optimise the
efficiency and effectiveness of the maintenance function. A clear focus in optimising the
internal effectiveness and external effectiveness as pipeline integrity affects customers
demand at all time. The industry perceived that MPM can be used to improve the existing
pipeline integrity management (PIM) program- a means of improving all activities
concerning the integrity of pipeline and to ensure pipeline safety values are up dated at all
times to avoid catastrophic pipeline failure that may damage companies reputation. However,
despite the use of MPM strategy in pipeline maintenance, several challenges have been found
dwindling the benefits of MPM in fulfilling its purpose in the Nigeria O&G industry. Hence,
this paper thoroughly and carefully reviews MPM elements for pipelines maintenance

742
improvement by identifying the factors leading to the efficiency and effectiveness of MPM in
pipeline maintenance projects in the Nigeria O&G industry.
2. LITERATURE REVIEW
2.1 MPM Issues and Challenges in Pipeline Integrity Management
Several high-profile pipeline accidents and breakdown considered damaging to the
environment has been recorded in local communities of the oil bearing Niger Delta region in
Nigeria (Aroh et al. 2010; Agbakwuru 2011; Omodanisi et al. 2014). The high profile
pipeline incident recoded have served to substantiate the relevance of MPM as a mean of
improving the PIM operation and ensuring the set target are met. Maintenance managers have
also identified MPM as a mean by which the appropriate people selected to perform an
excellent work. They also acknowledge MPM as a mean of realising the full benefits of
maintenance. Top management also known that MPM enable users to identify risk and
hazards associated to a certain pipeline maintenance project, they know it help in the
formulation of a workable maintenance strategy and it is also called a versatile management
tool used for the implementation of maintenance strategy. However, MPM success depend on
the user’s capability and ability to discover and use the relevant key performance indicators
(KPIs) that can inform in the area that require attention for improvement at all time.
Kutrowski (2013) identify that some PIM systems focus attention on a single problem at a
specific location in the pipeline, rather than taking a more global look at the integrity of the
entire system. As a result, some areas of the pipeline are not adequately maintained. This can
eventually lead to pipeline ruptures that damage the company's reputation cost much more in
repairs, clean-up and fines levied by regulatory agencies. Aroh et al. (2010), Bonvicini et al.
(2014) and Ebrahimi (2015) identify PIM system issues and challenges, which led to the
adoption of MPM as follows:
Risk management: the process for identifying the cause and effect of pipeline failure is slow
and management often takes more than the required time before conducting corrective
maintenance and clean-up of oil spill in the region.
Operation control: managers hardly use MPM during maintenance operation to provide
strategic planning, vital information that is intended to be useful to managers in performing
their jobs and to assist their company in developing and maintaining viable patterns of
behaviour that is matched with working according to the established parameters. MPM also
help to build a robust system where manager may well be responsible for elements of
strategy, management control and operational control. In addition, Eti et al. (2006) observed
that weak link in the management control systems framework are intentional. This attitude
and behaviour also propagate need for management of change.
Management of change: operators deliberate avoid MPM usage in identifying areas that
require management attention in constantly changing situation. Top management deliberately
ignore the critical success factors (CSF) which agree that the integrity of the pipeline
infrastructure are to be maintained at all times, contractors staff must be contactable,
responsive and sensitive to company’s needs, maintenance service shall ensure a safe and
stimulating environment for stakeholders, pipeline operators must be satisfied and motivated.
In addition, management must responsive to pipeline maintenance needs, and experiencing
changing needs and goals as the situation changes in order to maintain company’s reputation
in the operating environment.

743
Incident management and investigation: operators hardly report accurate incident for the
sake of fear of being punished for their offence, unless when such incident result to huge
O&G spill. Vital information concerning human error are hindered and there is no data to
educate people about the event that led to failure.
Emergency response: In the event of oil spillage, the company often experience slow
emergency response. In most cases, the community are aware of the pipeline leak before the
company could identified or traced the area where oil spill.
Communications plan: the communication link or gap between top management staff and
the contractor staff often hindered pipeline issues that requires urgent top management
attention in the region.
Competency, awareness and training: management are more concern with the bottom line
figure (i.e. benefit and profit) than coordinating training or awareness program. They
understand that MPM activities involve recruitment, hiring experts, providing education for
employees and ensuring that all pipeline operators possess the multi-skills or functional
knowledge and skills, right attitude and behaviour that represent the company image in the
course of maintenance.
Good recordkeeping: management hardly use lessons learned, as a result people hardly
document events or occurrences.
Quality control plan: some workers have mitigate quality control plan for self-benefit
(corrupt practice) as a result are often undermined.
Furthermore, relative benefits of CBM depends of organisational commitment and support.
Organisational commitment also means leadership commitment and attitude that describe the
linkage and relationship between the pipeline operators and the company they represent, and
a set of behaviours that operators follow to manifest that relationship (Aladwan et al. 2013).
Furthermore, this context observed that human factors in pipeline maintenance, maintenance
performance, pipeline performance and MPM are uniquely interconnected. Nevertheless,
existing literature concerning PIM does acknowledged human factors in pipeline
maintenance, however, very few PIM framework incorporate theses human factors as
measureable indicators using MPM approaches (Zardasti et al. 2017).
According to Peach et al. ( 2016) human factors or top management commitment can be seen
as a leading indicator that can predict the quality of maintenance tasks, predict compliance
with set standard, predict compliance with pipeline safety and policies, and the desire to meet
performance target. Prediction of pipeline performance and other maintenance related matters
also aligned with CBM methodologies, as asserted by de Jonge et al. (2017) companies that
are interested in implementing CBM must also consider the risks related to the lack of
experience. From the construction industry perspective, Detsimas et al. (2016) emphasis the
need for workplace training, a means for developing operators performance and experience.
Another factor that may affect maintenance performance is the decision-making processes in
the company (Bazrafshana and Hajjari 2012).
Maintenance decision may vary from day-to-day decisions to strategic decisions, particular,
when management perceived community violent or attack on pipeline workers. On the other
hand, Aragonés-Beltrán et al. (2017) says that stakeholder’s influences, stakeholders demand,

744
and individual group’s interest are major problem maintenance manager’s encounter in the
industry. The ability to understand the often hidden influence of the various stakeholders is a
critical skill for successful maintenance project managers (Aragonés-Beltrán et al. 2017). In
this course, maintenance manager’s duty is to select key performance measurement indicators
(KPIs) pertinent for the particular business situation. However, it is not possible to monitor or
measure all of the available indicators due to the increase in number and type of measure
(Horenbeekn and Pintelon 2014). According to British Institute of Facilities Management
(BIFM 20124), the main reason for measuring performance if to learn to improve
maintenance performance, report internally and externally, demonstrate compliance to
company set pipeline safety and operating requirements or regulation, provide information to
help managers make better informed decisions and to comply with external reporting
regulations and information requests.
Therefore, measuring human performance is paramount in achieving effective PIM activities
in the O&G industry. Insights on how the various characteristics influence MPM in pipeline
maintenance are lacking. Even with the fact that real usage of MPM often help to set agreed-
upon performance goals, allocating and prioritising resources, informing managers to either
confirm or change current policy or programme directions in order to meet those goals, and
sharing results of performance in pursuing those goals (Amaratunga and Baldry, 2003; Parida
et al. 2015; Sheikhalishahi et al. 2016). Yet, pipeline maintenance and management activities
still undergoes frequent failure in the Nigeria context. It is also important that operators be
involve in the formulation processes. Yasin and Gomes (2010) view that improvement of any
project always rely on the participation and involvement of all related personnel throughout
the planning, implementation and feedback stages.
Top management support also enforce the process of ensuring that the set PIM objectives are
achieved as the deliverables are measured according to KPIs (Steenhuizen et al. 2014).
Typically, MPM also serves three functions, which are (1) formulation/implementation of
workable maintenance strategies using situation report, (2) coordinate PIM operations
involving maintenance, (2) motivate employees to do their assigned task, (3) monitor
performance and to identify areas for improvement in pipeline maintenance. In this course,
workplace performance, effective commitment, and work motivation are key area that
requires managers’ attention. In the Nigeria context, pipeline problems are expected but not
prevented in advance, as asserted by Eti et al. (2006) that such attitude and behaviour lies
within maintenance culture is that problems occur due to factors beyond practical and
resource control: it is accepted that something will always go wrong and nothing much can be
done about it in advance. In the overall, PIM requires effective commitment, in terms of
organisational commitment, top management support, and team commitment to ensure that
MPM function adequately and without intentionally weakening the purpose, which MPM
stand for.
3. METHODOLOGY
In order to understand the reason behand the incessant breakdown of pipeline in the Nigeria
context, qualitative strategy of enquiry was selected for this research. Literature review
suggested that there are broad categories and guidelines on how performance measurement
could be used but information about specific usage and usage situation is yet to be revealed in
pipeline maintenance. As a result, this study employed the case study methodology to better
understand the use of performance measurement systems as it emerges from the data. In this

745
case, the study is absorb in theory building approach in which a key variables and their
linkages are identified (Nenonen and Sarasoja, 2014; Bryman, 2016; Yin, 2014). The
propositions of the conceptual model provided the theoretical foundation that guided the data
collection aspects of performance measurement for this study. Three multinational O&G
companies were used for this study. The chosen case design is multiple embedded design
(Yin, 2014), in which pipeline maintenance process of the company is the main unit of
analysis and the field service units are the embedded units of analysis (Tätilä et al., 2014;
Yin, 2014). Managers answered the research questions primarily from the perspective of a
field service unit because the bulk of activity in the use of the performance measurement
system in this case takes place at the field unit level. Instead of a single design, the researcher
chose multiple case embedded design “multiple sources of evidence”. That is data from three
different sources (interviews, observations and focus groups) these three sources of date
strengthen the findings (Bryman, 2016; Yin, 2014). The convergent validity helps to establish
construct validity when using three different measurement procedures and research methods
mentioned above to collect data about a construct (e.g. task performance) (Hosie and
Nankervis 2016)
An in-depth interviews regarding MPM usage in pipeline maintenance was conducted in
order to gain a fuller understanding of the research context. The interviews also focused on
factors affecting performance measurement usage (Pekkola et al. 2016). The participants
interviewed were a senior manager in charge of decision making in pipeline maintenance.
The case study lasted for two months intensive data gendering process. In each company, five
managers were interviewed in different locations. Each of the five meetings lasted for about
an hour minimum (45 minutes). Field written notes on observation and focus group centred
on the research topics for subsequent analysis and for guidance in the research process. In
addition, semi-structured interviewed was used. The purpose of the semi-structured
interviews was to identify individual companies’ maintenance formulation strategy,
performance measurement involvement in pipeline maintenance, usage practices, usage
situations, and purposes for performance measurement in pipeline maintenance. In general,
interviews were audio recorded and transcribed, coded with a unique label for easier
identification during the analysis. The study employed QRS NVivo qualitative data analysis
software to analyse the transcribe data. Analysis process assume the following (1) data
reduction to separate the important pieces of data; (2) data display to highlight and present
reduced data in a cognitively easy form; and (3) Conclusion drawing and verification to
explain what the data mean (Tätilä et al. 2014).
Equally, observation was conducted in order obtain an understanding of context-specific
circumstances pertaining to MPM practices, site visits were made to enable observations of
situated social interaction amongst operators which involve field-note taking (Gluch and
Räisänen 2012). Observation study enable the researcher to see the deviation in operators’
behaviour when executing prescribed tasks, workers also divulge the high level of
management inconsistency and lack of total support for contractors staffs in charge of
pipeline maintenance. Through the observation, the researcher noticed impact of militants’
activities in the region, delay at work and inconsistency in the use of MPM due to conflict
between the companies and the communities’ youth seeking for casual employment. External
interference (e.g. community youths) violence are predominant in the region. Operators are
through the community youth or groups’ informal standards.
Focus group study was conducted, it involve extensive discussions, and the researcher was
able to collect some archival materials relating to the development of the PIM. The

746
participants presented issues for improvement based upon their most relevant concerns. In
general, information gathered in this case studies were put in different arrays, the research
make a matrix of categories and placing the evidence within such categories, this led to data
display and creating flow chart via QRS NVivo and other graphics to examine the data. The
frequency of the event was tabulated and information are then put in chronological order
(Yin, 2014). Finally, result are discussed according to cases, and findings from the three case
studies involve triangulation, that is, the convergence of data collected from different sources,
to determine the consistency of a finding. Coding for participants are as follow:
MM1: for participant one on case study one (CS1)
MM2: for participant two on case study two (SC2)
MM3: for participant three on case study three (SC3)
In the overall, fifteen (15) participants were interviewed during the case study (i.e. in each
company five participants were interviewed).
4. FINDINGS
4.1 Company A
Top management commitment is the main finding in the study. The result extracted from the
QRS NVIvo analysis is shown in Table 4.1. This tend to be the leading problem effecting
pipeline maintenance project in the company.
Table 4.1 Top Management Commitment in MPM
Parent Node: Theme Total number of
respondents
Word References
Count
Top management
commitment impact in
pipeline maintenance
5 57
The Table 4.1 above also provide the number of participant interviewed and the frequency
query result captured in the case study. Participant MM1 acknowledged that top management
commitment as a factor affecting PIM in the Nigeria context. This aligned with Pennanen et
al. (2005) concerned about top management commitment, a value and requirements that
inspire people to perform better at work. As identified by Pennanen that affective
commitment is concerned with personnel attachment and involvement to improved
maintenance culture. Participants MM1, MM4, MM7, MM10 and MM13 agreed that
individual work experiences, attitude and behaviour also play a significance role in the
development of commitment toward a commitment target in pipeline maintenance. The same
level of commitment to PIM and maintenance is responsible for the current and ongoing
conflict between the company and the host communities. Participant MM 1 state that people
hardly comply with the recommended practice and standard due to lack of commitment at the
top management level.
Participant MM 4 explain that some top management are mainly concerned with bottom line
figures (i.e. profit oriented) as long as O&G are flowing, need for maintenance are
deliberately suppressed unless when unexpected happened. Participants MM1, MM4, MM7,
MM10 and MM13that CBM involving condition monitoring is an essential maintenance
strategy that allows operators to understand the various situations and the corresponding

747
elements that requires maintenance attention. Participant MM1 state that the existing pipeline
maintenance policy incorporate internal and external measures that help the company to
reflect on the need for inspection, the need to comply to statutory or legislative requirements
at all times. As asserted by Peach et al. (2016) in the literature review, the quality, efficiency,
and effectiveness of maintenance work are solely dependent on top management commitment
and the maintenance worker executing the maintenance tasks.
One of the participant said that top management commitment also influence maintenance
culture, an attitude and behaviour that led to the underperformance of some pipelines and
other government O&G infrastructures in the country. Clearly, the company policy expect all
pipelines operators to maintain focus and persevere, even in the face of obstacles. Also to use
time efficiently, and adapts plans when changes occur. Participant MM 3 state that people no
longer adhered to stringent instruction in the maintenance of pipeline in the remote location
due to insecurity, militants attack on pipelines, and coupled with lack of top management
commitment to addressing the root causes of the problem.
4.2 Company B
A clear value and importance of organisational structure is the main finding in this company.
There are many pipeline maintenance project facing and the causes of the problems were
traced be poor organisational structure. The result extracted from the QRS NVivo analysis
concerning organisational structure is shown in Table 5.1. poor organisational structure often
cause delay in funding pipeline maintenance project. Particularly, delay in carrying out
corrective maintenance caused by militants attack on pipeline infrastructure.
Table 5.1 Organisational Structure
Parent Node: Theme Total number of
respondents
Word References
Count
Organisational structure 5 46
Participants MM2, MM5, MM8 MM10, and MM14 agreed that the existing organisational
structure affect MPM usage in pipeline maintenance. Participant MM8 said that
organisational structure should be should be reorganised in such a way to serve performance
measurement strategy and strategic priorities. With this, managers should be able to transmit
long-term maintenance strategy. Participant MM 14 state that MPM cannot function solely it
required human effort to utilise its concept. It is quite unfortunate that some group of people
have chosen the wrong part and they would not make things work the way it should be.
Current the three refineries are not operating and people suffer fuel shortages due to
corruption, militants’ attack on pipeline for selfish interest ‘a get rich quick syndrome is
collapsing the system so fast’ lack of commitment. Even the multinational O&G companies
are not exempted, poor management and infrastructure problems is what we get due to
corruption. Nevertheless, change can be created planned and managed as asserted by Marie-
Anne (2013) it involve collecting and applying valid data using MPM problem solving
methods will lead to change. Participant MM8 believe that MPM have the capacity to
influence employees’ behaviour in the organisation towards greater success. With a
responsible person, it would have the capacity to transform organisational cultures and the
employee’s willingness to participate in change processes.

748
Equally, contingency theory concept regards organisational structure as a contingent variable,
which implies that managers face maintenance situations, which vary and they must choose
whatever structural arrangement are most appropriate in the prevailing context. The proper
role of maintenance organisation theory is not to seek one best way to manage, but to provide
insight and guidance for mangers to help them formulate responses in the complex situations
of maintenance organisational decision-making (Finchman and Rhodes, 2005 pp. 473-474).
The general model implicit in contingency theory assumes that, for organisation to be
effective, there must be an appropriate fit between structure and context. Figure 5.2 depict a
model suitable for the reformation of organisational structure. In accordance to contingency
theory.
Figure 5.1. Organisational structural model for pipeline maintenance
Similarly, a theory of individual differences in maintenance task and contextual performance
has been researched by many performance measurement authors (Borman and Motowidlo
1997; Hosie and Nankervis 2016; Marques-Quinteiro et al. 2015). As asserted by participant
MM2 that organisational structure relates and guide individual performance in maintenance
operation. One implication of the functional approach to prosocial behaviour is that if one
knows the motives that are most important to an individual, one can maximise the
effectiveness of attempts to elicit prosocial behaviours by developing persuasive appeals that
target the motives most important to the recipient of the appeal (Borman and Motowidlo
1997).
4.3 Company C
The main finding in this company is commitment to work. This tend to be the major problem
mitigating the benefit of MPM usage in pipeline. Table provide result extracted from the
QRS NVivo analysis.
Table 6.1 Commitment to work
Parent Node: Theme Total number of
respondents
Word References
Count
Commitment to work 5 35
Participants MM3, MM6, MM9, MM12, and MM15 agreed that performance measurement
usage in CBM and usage situation promotes commitments, interconnection, consistency and
friendliness at work. In particular, participant MM9 agreed that MPM enable managers to
assess individual contribution in CBM activities. Participant MM 15 state that operators have
been trained on how to use MPM framework in their operation. Participant MM3 state that
MPM have the organisation to maintain focus in O&G business and monitoring of pipeline
performance. The company CBM strategy also aligned with the IAEA-TECDOC-1551
(2007) CBM concept shown in Figure 6.1. Participant MM6 state that the major problem the
company have is external influence such as militant attacks on pipeline integrity and this have
caused social disengagement and lack of commitment among workers in the remote location.
Environment
Factors
Organisational
Structure
Maintenance
Performance

749
The fear of kidnappers and community conflict. Several high profile oil spill have led to the
current social attack on pipeline issues in the region. This aligned with Zardasti et al. (2017)
concerning reputation loss due to oil spillage. They proposed viable indicators for redeeming
company’s image. According to Zardasti, repuation loss can be identified based on the
consequence assessment of O&G pipelines. Participant MM3 state that MPM can effectively
reduce working pressure, promotes interconnection, supporting onsite learning, and motivate
workers to do their job according to set target. MM15 said that the company uses MPM to
address internal and external effectiveness. The internal effectiveness is addressed in terms of
internal efficiency, education, training, communication, collaboration, quality health safety
and environment QHSE that is reflected in terms of O&G production in right way, using the
right quality material in maintenance work. Participants MM3, MM6, MM9, MM12, and
MM15 agreed that correct usage and usage situation always bring job satisfaction. Such
model is set out as follows.
Figure 6.1 Performance measurement model for pipeline maintenance
Participant MM12 state that MPM model should be feasible, coherent for adoption and usage.
A feasible model attract operators, it helps managers in identifying the relevant improvement
factors. It also help in regulating and communicating the useful information that will improve
operators’ performance.
5. OBSERVATION AND FOCUS GROUG FINDINGS
There is common issue between the three case studies. The most critical issue appears to be
management’s commitment/support and operators’ behaviour. Observation and focus groups
results combined using a restructured effects matrix: organisational change after application
of performance measurement program Miles et al., (2014). The effect matrix is supporting the
deployment of performance measurement in pipeline maintenance and in advancement.
Table 6.1: Observation and Focus group results
Company name Factors Case comparison
Case A 1.1 Maintenance culture,
1.2 Management commitment
1.3 Operators behaviour
2.3; 3.1; 3.3.
Case B 2.1 Environmental factors,
2.2 Organisational structure,
2.3 Operators behaviour
1.1, 2.2; 1.3. there is a
correlation
Case C 3.1 Commitment to work,
3.2 Operators behaviour,
3.3 Maintenance culture
1.1; 1.3; 1.2 and 2.3
Total no: of influencing factors 9
Monitoring Condition Analysed
Methods Implemented
Methods Chosen CBM Project
Evaluated
Condition-Based Maintenance Strategy

750
mentioned
Most frequent performance
measurement issue
Maintenance culture, Operators behaviour, and
Management/operators commitment to work.
6. SUMMARISING THE FINDINGS
Precisely each company have similar problem. Problem in these cases can be resolved using
Figure 6.1 below. Time for adoption, time for agreement, time for planning and time for the
implementation of the planned maintenance, should involve top management commitment
and support, which is the key finding in this study. In general, the uptake and implementation
of MPM in pipeline lies on management understanding and willingness to change. Figure 6.1,
present key issues and challenging factors explored in the study.
Time
Improved functional knowledge and skills
(training)
Manages job performance
All stakeholders involvement/commitments
Performance measurement in
pipeline
Figure 6.1 Major factors between the three case studies
The above factors in Figure 6.1 required urgent management attention to enable the industry
utilise the benefits of MPM. In this case, the above factors can be used measurement
indicators to improve the PIM program.
7. LIMITATION
Pipeline is a critical infrastructure that requires management attention and commitment
because breakdown in pipeline correspond to breakdown in O&G production. The current
militants’ activities and attacks on O&G installation, social conflict due to O&G spill.
Participants somehow withhold some key MPM information due to stringent company policy
and culture that does not permit them to discuss pertinent information regarding their core
MPM strategy. In addition, the researcher was not able to visit some key area where the
companies are facing pipeline maintenance challenges to observe workers performance due
to issues of insecurity in the remote locations.

751
8. CONCLUSIONS
This paper emphasis on performance measurement effect in pipeline maintenance. Findings
have established performance usage and usage situation. The three case studies used solely
depend entirely on the performance of operators to achieve their production and O&G
transportation objectives. However, the quality of operators work in the maintenance services
cannot be measured directly. Knowing individual experience, qualification, education,
training and skills is essential to measure adequately the result of the work performed. In few
occasion they measure the excellence of their human factor; nor do they include this factor in
their assessment of the performance of the maintenance function (Kumar et al. 2013). In
addition, measures of organisational performance are often selected based on convenience.
Measures are too complex due to third parties interferences.
There are future research opportunities in building on the findings to expand the
understanding of performance measurement usage and situation usage in a broader way. In
particular, motivational, leadership use and the motivation induced with use have been
dominated by the strategic control views in current literature (Enshassi and El Shorafa 2015;
Eaidgah et al. 2016). Findings suggest that these areas are important to capture the potential
of performance measurement usage and practices for some organisations. Another direction
for further research is the beneficiary of performance effect that stem management actions
from the deployment of performance measurement in pipeline rather than its use. Future
research is needed to specify how the emergent understanding of the operational use of
performance measurement can contribute to the body of knowledge on pipeline integrity
management design and implementation of performance measurement processes.
9. REFERENCES
Agbakwuru, J., 2011. Pipeline Potential Leak Detection Technologies: Assessment and Perspective in the
Nigeria Niger Delta Region. Journal of Environmental Protection, 2(8), pp.1055–1061.
Aladwan, K., Bhanugopan, R. & Fish, A., 2013. To what extent the Arab workers committed to their
organisations? International Journal of Commerce and Management, 23(4), pp.306–326.
Aragonés-Beltrán, P., García-Melón, M. & Montesinos-Valera, J., 2017. How to assess stakeholders’ influence
in project management? A proposal based on the Analytic Network Process. International Journal of
Project Management, 35(3), pp.451–462.
Aroh, K.N. et al., 2010. Oil spill incidents and pipeline vandalization in Nigeria: Impact on public health and
negation to attainment of Millennium development goal: the Ishiagu example. Disaster Prevention and
Management, 19(1), pp.70–87.
Bazrafshana, M. & Hajjari, T., 2012. Diagnosing Maintenance System Problems, Case study approach. Article,
pp.594–603. Available at: Published online 29 August 2012 in Wiley Online Library.
Bonvicini, S. et al., 2014. Quantitative assessment of environmental risk due to accidental spills from onshore
pipelines. Process Safety and Environmental Protection, 93(April), pp.31–49
Borman, W. & Motowidlo, S., 1997. A Theory of Individual Differences in Task and Contextual Performance.
Human Performance, 10(2), pp.99–109.
Detsimas, N. et al., 2016. Workplace training and generic and technical skill development in the Australian
construction industry. Journal of Management Development, 35(4), pp.486–504.
Eaidgah, Y. et al., 2016. Visual management , performance management and continuous improvement : a lean
manufacturing approach. , 7(2).
Ebrahimi, N., 2015. Implementation of 50 Key Performance Indicators ( KPIs ) in Corrosion Control of an Oil
Transmission Pipeline. , (December), pp.1–6.
Eti, M.C., Ogaji, S.O.T. & Probert, S.D., 2006. Impact of corporate culture on plant maintenance in the Nigerian
electric-power industry. Applied Energy, 83(4), pp.299–310.
Finchman, R. & Rhodes, P., 2005. Principles of Organistional Behaviour Fourth edi., Oxford University Press
Inc., New York.

752
Gluch, P. & Räisänen, C., 2012. What tensions obstruct an alignment between project and environmental
management practices? Engineering, Construction and Architectural Management, 19(2), pp.127–140.
Horenbeekn, A. Van & Pintelon, L., 2014. Development of a maintenance performance measurement
framework—using the analytic network process (ANP) for maintenance performance indicator selection.
Omega, 42(1), pp.33–46.
Hosie, P. & Nankervis, A., 2016. A multidimensional measure of managers’ contextual and task performance.
Personnel Review Personnel Review Personnel Review Iss Personnel Review, 45(2), pp.419–447.
IAEA-TECDOC-1551, 2007. Implementation Strategies and Tools for Condition Based Maintenance at Nuclear
Power Plants. , (May).
de Jonge, B., Teunter, R. & Tinga, T., 2017. The influence of practical factors on the benefits of condition-based
maintenance over time-based maintenance. Reliability Engineering and System Safety, 158
Kumar, U. et al., 2013. Maintenance performance metrics: A state-of-the-art review. Journal of Quality in
Maintenance Engineering, 19(3), pp.233–277.
Kutrowski, K., 2013. A Systematic Approach To Ensuring Pipeline Integrity. Pipeline & Gas Journal, 240(7),
pp.48–51.
Marie-Anne, C., 2013. An organisational change approach based on Gestalt psychotherapy theory and practice.
Journal of Organizational Change Management, 26(3), pp.458–474.
Marques-Quinteiro, P. et al., 2015. Measuring adaptive performance in individuals and teams. Team
Performance Management, 21(7/8), pp.339–360.
Nenonen, S. & Sarasoja, A.-L., 2014. Facilities management research in Finland – state-of-art about current
Finnish PhD-projects. Facilities, 32(1/2), pp.58–66.
Omodanisi, E.O., Eludoyin, A.O. & Salami, A.T., 2014. A multi-perspective view of the effects of a pipeline
explosion in Nigeria. International Journal of Disaster Risk Reduction, 7, pp.68–77.
Parida, A. et al., 2015. Performance measurement and management for maintenance: a literature review,
Peach, R., Ellis, H. & Visser, J.K., 2016. A Maintenance Performance Measurement Framework that includes
maintenance human factors: a case study from the electricity transmission industry. South African Journal
of Industrial Engineering, 27(August), pp.177–189.
Pekkola, S., Saunila, M. & Rantanen, H., 2016. Performance measurement system implementation in a turbulent
operating environment. International Journal of Productivity and Performance Management, 65(7),
pp.947–958.
Pennanen, A., Whelton, M. & Ballard, G., 2005. Managing stakeholder expectations in facility management
using workplace planning and commitment making techniques. Facilities, 23(13/14), pp.542–557.
Sheikhalishahi, M., Pintelon, L. & Azadeh, A., 2016. Human factors in maintenance: a review. Journal of
Quality in Maintenance Engineering, 22(3), pp.218–237.
Steenhuizen, D. et al., 2014. The road to facility management. Facilities, 32(1/2), pp.46–57.
Yasin, M.M. & Gomes, C.F., 2010. Performance management in service operational settings: a selective
literature examination. Benchmarking: An International Journal, 17, pp.214–231.
Zardasti, L. et al., 2017. Review on the identification of reputation loss indicators in an onshore pipeline
explosion event. Journal of Loss Prevention in the Process Industries, 48, pp.71–86.

753
SUSTAINABILITY AND ENVIRONMENTAL
SYSTEMS

754
ID 010
IMPROVING THE REGULATORY FRAMEWORK OF FLOODPLAIN
MANAGEMENT AND DEVELOPMENT IN THE UNITED KINGDOM
B.Alam1 and C.Pathirage2
1 School of the Built Environment, University of Salford, 43 Crescent, M5 4WT, United Kingdom 2 School of the Built Environment, University of Salford, 43 Crescent, M5 4WT, United Kingdom
Email: [email protected]
Abstract: Flooding is a natural disaster that most commonly impacts the United Kingdom.
The frequency of flooding makes it an important focus for a researcher. The scope of flooding
is wide-ranging as it can affect people, society and the economy. A particular location
vulnerable are the floodplains as these are naturally prone to flooding. Such developments
suffer from varying degrees of risk during times of flooding. In the United Kingdom,
floodplain developments have risen leading to added risk to occupants. Property owners are
thus exposed to risk with flood regulation coming into effect through planning, defences,
insurance and taking precautionary measures. A deep understanding of flood response and
management will be needed for this research. For this project, each stage of the regulatory
process involving flooding and floodplains in the United Kingdom will be examined to
provide an overview of current flood management practice. Current findings show that there
are regulatory gaps with regards to flood resilience in relation to aspects such as flood
insurance and though a unified strategy exists there is a disconnect with flood response. An
extensive literature review will be used to showcase the challenges and barriers to flood
response on the floodplains. This is with the aim of better improving the existing regulatory
framework of floodplain management in the United Kingdom.
Keywords: Disaster Management, Flooding, Floodplain, Floodplain Development
1. INTRODUCTION
Flooding is a natural disaster that is ranked as the most common the affect the world. It is
held as the worst threat to the UK with the danger posed by it set to increase in the future
(Defra, 2015). Their frequency makes it an important focus for research. Guha-Sapir et al.
(2010) noted floods being the most common natural disaster worldwide. Thus, their effect is
wide ranging and communities are more likely to be affected by it. Floodplains are
particularly vulnerable as they are ecologically connected to a body of water making them
naturally prone to flooding. In England, rivers and coastal floodplains have been populated
for centuries with floodplains making 12% of the country and 8% of those having property
developments (CCC, 2012). Flooding also impacts infrastructure such as energy, water and
communications (EA, 2009). Thus, damages to affected regions can be extensive with
floodplains being particularly vulnerable. The Environment Agency (2015) states that
floodplains, “would naturally be affected by flooding if a river rises above its banks, or high
tides and stormy seas cause flooding in coastal areas”. In 2009, an estimated 2.4 million
properties were already situated in a floodplain (NAO, 2014). The damage can include
disruption in the community, damage to structures and the loss of human lives.
For methodology, an exploratory based research has been used to highlight improvements to
the existing framework with qualitative methods being utilised through the use of an
extensive literature review.

755
2. FLOODING
Flooding is a natural hazard that can come from a variety of sources including river or ground
water. The United Nations stated, “flooding can arise from overflowing river, heavy rainfall
over the short period or an unusual inflow of sea water onto land, such as storm surge, tidal
flooding, seismic events (tsunami) or large landslide” (Proverbs and Mambretti, 2012; pg.
156). Floods impact human life with them being a growing risk to populations, particularly
those in floodplain areas. It has the greatest potential for damage among the natural disasters
and affects large numbers of people (UN, 2004). The dangers posed by it are widespread with
it capable of devastating entire communities. Fleming (2002; pg. 15) stated, "floods are a
natural occurrence and the risk they pose is wide ranging. However, for society, the main
focus is the risk to people and property." Thus, floodwaters can destroy both residential and
commercial properties. It also affects; transportation, communication, agricultural
developments and damages the environment. In addition, the after effects can lead to health
risks from pollution and water-borne diseases (Marriott et al, 1999). The frequency of
flooding makes it the most common of the natural disasters with is effects illustrated in
Figure 25.
Figure 25: Reported Flood Phenomena (number of floods per 10,000 km), per country (since
1980) (Source: EEA, 2015)
A Climate Change Committee (2012) report noted that flood damage is expected to increase
across the UK in the future. Flood damage amounts to £1.1 billion per year in costs in
England (Bennett and Hartwell-Naguib, 2014). In 2000, 10,000 properties in England and
Wales suffered from flooding and weather-related insurance claims totally to around £1
billion (POST, 2001). There are an estimated 5.8 million (nearly 20%) of properties that
suffer from the risk of flooding in the UK (Defra, 2013). As such, the effects of flooding are
wide-ranging in the UK. Research has indicated that the effects of flooding may be more
extreme than previously estimated when taking into account the potential increases in rainfall

756
volume and intensity and risk of extreme sea level rise (Evans et al., 2008). Thus, the danger
posed by flood risk is only set to increase in the future.
2.1 Floodplains
An area prone to flooding are regions known as floodplains. These are, “the land next to, or
hydraulically or ecologically connected to, the flowing river” (Freitag, 2009; pg. 44). These
areas are naturally prone to flooding and therefore suffer from a higher degree of flood risk.
However, Freitag (2009) noted human developments on floodplains can bring about a quick
and deadly response from the river. Such areas are subject to urban development but suffer
from extreme floods making them contested regions. Annually, extreme floods create
enormous and mounting damage on floodplains (Hartmann, 2011). The IPCC (2007) noted
human development on floodplains and inadequate flood response plans have led to greater
potential for damage caused by flooding. Despite the dangers, there have been developments
in floodplain areas (Hartmann, 2011). This is due to factors such as growing population
pressures and the land being viable for development. Floodplains are among the most densely
populated areas in the world with these being particularly well suited for development (Kron,
2005). However, environmental changes alongside wider societal changes can potentially
alter the likelihood of human exposure to hazards and the susceptibility of people to their
impacts (Few, 2007).
In England and Wales, there were approximately 1.85 million homes, 185,000 commercial
properties, around 5 million people and half of agricultural land suffering flood risk (Few,
2013). In 2009, the Environment Agency (EA) noted that 2.4 million properties were situated
on the floodplains in the UK (EA, 2009). A CCC (2012) report stated that floodplain
development grew faster in England over the past ten years. Many developments were
deemed protected but one-in-five suffered from significant flood risk. It is for this reason a
framework is necessary to better manage new developments in floodplain regions and prevent
inappropriate constructions. These developments expose inhabitants to the danger of flood
risk as floodplains are more vulnerable to hazards. During floods, such areas can experience
disruption in the community, damage to property and possible loss of life. However, due to
their nature, floodplains serve as sites that are subject to development.
2.2 Floodplain Developments
Floodplain developments hold many advantages but unrestrained development is noted for
being costly and dangerous (Owen, 1981). Marriott (1999) noted that many of the worlds
densely populated areas resided on floodplains. Such sites face an ever-present danger as they
are prone to flooding. In 2004, a consultation with the Association of British Insurers (ABI)
stated a need for stronger and more transparent planning systems to curtail developments on
floodplains (ABI, 2004). It recommended the EA be made a statutory consultee on all
planning applications in flood areas. However, there have been a number of developments on
floodplains. The CCC (2012) noted floodplain development had grown at a fast rate
compared to the past ten years. Whilst 80% of floodplain development were in well-protected
locations, one-in-five properties built in such areas suffered from significant flood risk (CCC,
2012). On the approval process, the report stated that it was ‘not sufficiently transparent or
accountable’. Furthermore, the EA stated that they only knew the outcome of 65% of
planning applications that they objected.
757
The CCC (2012) report also were concerned on whether local authorities considered
alternative developments before agreeing to construction on floodplains and whether long-
term effects of climate change with regards to flooding had been considered. In 2013, local
councils allowed 87 planning developments that saw 560 homes built in areas of high flood
risk in England and Wales (RIBA, 2014). In 2009, an estimated 2.4 million properties were
already situated in a floodplain (EA, 2009). Floodplain development had grown at a fast rate
compared to the past ten years with one-in-five properties built in such areas that suffered
from a significant flood risk (CCC, 2012). The number of homes stated to be built in flood
risk had risen by a third in 2013 as compared to the previous year (RIBA, 2014). Despite the
risks, such developments are only increasing and exposing their occupants to danger from
flooding. The CCC (2014) noted that continued floodplain development leads to an
increasing reliance on the use of flood defences. As such, the regulation of floodplain
developments can reduce the burden placed on flood defences through the use of an effective
flood risk management system that seeks to avoid inappropriate construction in these areas.
3. REGULATORY FRAMEWORK
Parliament, regulatory authorities and courts have recognised the dangers of flooding and
have attempted to address this through regulatory frameworks. To combat these risks, efforts
are made in order to mitigate their impact. Such mitigation takes the form of disaster
management that seeks to either avoid or reduce the potential losses from the hazard. To
mitigate their impact, disaster management aims to either avoid, adapt or control the hazards
effect. Wisner (2003) stated that disasters are a, "complex mix of natural hazards and human
action". The UNISDR noted that disaster risk is composed of multiple factors that include the
occurrence of an extreme hazard event caused by natural forces/natural forces alongside
human interference and that this affects something or someone (Holt, 2012).
The approach adopted by the courts established in the case of Arscott v. The Coal Authority
(2004) referred to flooding as a ‘common enemy’ that needs to be prevented. This involves
taking steps to reduces likelihood of flooding and mitigate its impact. The strategic overview
and management of flooding lay with set regulatory bodies such as the EA (Defra, 2014).
Legislation such as the Flood and Water Management Act (2010) provides the framework for
flood management. Ultimately, flooding cannot be avoided though the general approach is to
manage the risk (Schanze, Zeman and Marsalek, 2006). In the UK, the EA operates as the
oodplains (RIBA, 2009). It offers statutory consultee on all new developments within fl
guidance and operates as part of the regulatory framework in managing the risks in
floodplain developments. It is a requirement that Local Authorities consult with the EA
during planning applications when a proposed development can suffer from a risk of
flooding. Despite these measures, the UK has experienced flooding on numerous occasions as
detailed in the following section.
3.1 Flood Regulations
Flood risk is the combination of probability/hazard and consequence/impact (Sene, 2008).
Thus, flood risk management operates by mitigating the extent of the flood damage. To
combat flooding, regulatory systems are used to create a system to implement and manage
flood defences. As a result, through management and organization it seeks to better respond

758
and cope with hazards/disasters. The tools created as part of this framework include; flood
risk assessments, hazard maps, management plans, improved strategic coordination and
public participation. This creates an element of flood defence with the goal of protecting
human lives and property from flooding events. Developments in the international landscape
have also led to incorporation of such frameworks into the UK as highlighted in Figure 26.
Through law, a system is introduced through which guidance and enforcement is produced to
implement such a framework with the aim of mitigating the impact of flooding hazards.
Figure 26: Flood Legislation in the United Kingdom (Source: Devon County Council, 2015)
Within the UK, the EA operates as a regulatory body who provides guidance on measures
needed to protect homes from floods. Effective flood risk management offers an important
role for the UK in the defence against hazards and protects communities, businesses and
infrastructure (NAO, 2014). Legislation is the basis through which regulatory bodies can
enforce/implement means to combat flooding. Under the Climate Change Act (2008), there is
a general duty to adapt and mitigate the dangers from climate change with Local Authorities
taking part in ‘active strategies’ to achieve this goal. As climate change can increase flood,
these strategies seek to promote a policy of adaptation. As a result, the regulatory framework
operates with the goal of empowering flood management by providing guidance, policy and
regulations.
3.2 Regulatory Bodies
In the UK, flood management involves a complex framework of institutions that are
responsible for its administration, finance and service (Brown and Damery, 2002). Defra and
the EA take the leading role in developing strategies to mitigate the effects of flooding. The
EA operates as the primary authority and has a supervisory duty on matters of flood defence
(Brown and Damery, 2002). Legislation such as the Environment Act (1995) confer
investigatory powers to the EA in the commission of its duties. The Flood Risk Regulations
(2009) placed duties on the EA and local authorities to prepare flood risk assessments, flood
risk maps and flood risk management plans (Defra, 2009). Though operating in the role of
flood defence, legislation also imparts on it a duty as a flood risk management authority.

759
Cooley (2006) stated that, “land-use management is among the most effective mitigation
measure available”. Thus, proper control over its management is deemed as the best
approach in managing flood risk. The Environment Agency (2009) noted that developing in
such areas means being exposed to flood risk. It is for this reason that their guidance is to
avoid developing in such areas as this eliminates the risk.
4. DISCUSSION
Flood risk management was identified as a national priority area of development (HM
Government, 2012). Floodplains suffer from added risk of flooding that can be mitigated by
implementing regulations to reduced its impact and manging the flood risk. According to Hall
et al. (2003), flood risk management uses a strategy that seeks to review prior decisions made
with the aim to “reduce, control, accept, or redistribute risks of flooding". Thus, it
distinguishes itself from flood defence as it seeks to mitigate the impact rather than avoid it
entirely. Flood risk management has been noted as moving towards a continuous holistic
approach that emphasized the need to analyse, assess and mitigate risk on a catchment scale
(Sayers et al., 2013). Despite such features, there have been significant cases of damage to
properties as a result of flooding. The EA stated that one-in-six properties among 5.2 million
such residences in England experience a risk of flooding (Abbey and Richards, 2016). In both
residential and non-residential properties, expected annual damages are estimated to be more
than £1 billion that are at risk from flooding (Bennett and Hartwell-Naguib, 2014). Similarly,
flooding has led to 2.4 million properties at risk from river/sea, 3 million suffer from risk of
flooding from surface water and 1 million are exposed to flood risk from both (Law Society,
2016). In 2007, the summer floods resulted in heavy downpours that caused 55,000 properties
to be flooded (Defra, 2009; Jha et al., 2012). Similarly, the Bonfield Report has shown that
sustained rain in 2016 led to extensive damage across the country with 17,000 properties
being flooded and costs expected to amount to £1.3 billion (Defra, 2016). Reports indicated
further research could bring about better management in order to reduce flood events (Efrac,
2008).
There exists a need from policy and law to regulate and mitigate flooding due to it being an
ever-present danger. The UK Climate Projections (2009) noted floods being among the
extreme events to affect the country, with greater frequency in the future (Defra, 2009). A
Climate Change Risk Assessment (2012) indicated the UK being already vulnerable to
extreme weather changes from flooding and heatwaves. This highlights the key goal of
avoiding developments should they be made in areas designated as being inappropriate due to
flooding. However, it highlights that developments could be made if safety measures, such as
adaptations, were made in case of flooding. An Environmental Audit report highlighted,
“planning system also has a flood defence role to play by minimising development on
floodplains and maximising the use of 'sustainable drainage' techniques” (House of
Commons, 2015). This system attempts to steer such developments away from areas of risk.
It was noted that crucial changes in flood risk management came in two aspects; a shift from
reliance on physical power to social power and that no single organisation has the power to
affect change (Pender, 2011). Thus, a holistic approach combines the various organisations
power for the use of effective floodplain management that can only occur through regulatory
influence.
Insurers have sought better control of floodplain development and increase spending on flood
defences (Crichton, 2012). This shows that better regulations and guidelines are needed to

760
control flood risk management including those in the floodplain areas. Crichton (2012) noted
floodplain developments have become easier through a succession of planning policies and
due to reduced flood defence spending. As such, rules come into effect as they create the
boundaries on the use of power. According to Pender (2011), “legal frameworks are the
archetypal system of formal rules, whilst governments are the archetypal setters of formal
rules”. A research gap identified from literature shows a lack of a coordinated strategy
towards managing flood risk. Pender (2011) noted holistic approaches to managing flood risk
is needed to better cope with impacts of flooding and climate change. The OST Future
Flooding project sought to develop a holistic thinking approach to flood risk (Pender, 2011).
Similarly, Surminski and Eldridge (2015) noted that there does not exist a long-term strategy
to managing flood risk with flood insurance affordability being a short-term perspective. In
conclusion, they said insurance was simply, “tool amongst the many that are required for a
holistic strategy on flood risk management” (pg. 12). Insurance operates by covering
unexpected losses but it does not prevent the risk of flooding from returning. Thus, they
noted that risk reduction operates as an important element in combating flooding with the use
of effective planning policy along with flood risk management playing an even more
important role.
5. CONCLUSION
Whilst floodplain management has faced increased improvements over the years, research
has indicated that the danger posed by flooding is set to increase in the future. Floodplain
development has increased according to research and literature has shown that goal of a
holistic approach towards floodplain management is in need of further improvements.
Aspects such as insurance and flood adaptations operate independently from that of Flood
resilience. Thus, this misses the goal of improving flood resilience, response and
management. Such a gap can be better resolved through the use of regulation, legislation and
policy to address this missing link. By linking policy and regulations flood resilience with a
long-term strategy this could see a more holistic approach to being adopted with regards to
floodplain management in the UK.
6. REFERENCES
Abbey, R. and Richards, M. (2016) A Practical Approach to Conveyancing. OUP Oxford; 18th Edition.
Association of British Insurers (2004) Taking it on: developing UK sustainable development strategy together.
Retrieved from:
https://www.abi.org.uk/~/media/Files/Documents/Consultation%20papers/2004/07/sustdev.pdf
Bennett, O. and Hartwell-Naguib, S. (2014) Flood defence spending in England. House of Commons Library.
Retrieved from: https://www.gov.uk/government/uploads/.../geho0609bqds-e-e.pdf
Brown, J.D. and Damery, S.L. (2002) Managing flood risk in the UK: towards an integration of social and
technical perspectives. Transactions of the Institute of British Geographers, Vol.27 (4), pp.412-426.
Climate Change Committee (2012) Climate change – is the UK preparing for flooding and water scarcity?
Adaptation Sub-Committee Progress Report 2012. Retrieved from:
https://www.theccc.org.uk/archive/aws/ASC/CCC_ASC_2012_bookmarked_2.pdf
Cooley, H. and Gleick, P.H. (2006) The world's water, 2006-2007 : the biennial report on freshwater resources.
Washington, DC : Island Press.
Crichton, D. (2012) Floodplain Speaking 3rd Edition. The Chartered Insurance Institute: London
Defra (2009) Adapting to Climate Change: UK Climate Projections. Retrieved From:
https://www.gov.uk/government/uploads/system/uploads/attachment_data/file/69257/pb13274-uk-climate-
projections-090617.pdf
761
Defra (2013) Securing the future availability and affordability of home insurance in areas of flood risk.
Retrieved from:
https://consult.defra.gov.uk/flooding/floodinsurance/supporting_documents/20130626%20FINAL%20Futur
e%20of%20Flood%20Insurance%20%20consultation%20document.pdf
Defra (2014) The National Flood Emergency Framework for England. Retrieved From:
https://www.gov.uk/government/uploads/system/uploads/attachment_data/file/388997/pb14238-nfef-
201412.pdf
Defra (2016) The Property Flood Resilience Action Plan. Retrieved From:
https://www.gov.uk/government/uploads/system/uploads/attachment_data/file/551615/flood-resilience-
bonfield-action-plan-2016.pdf
Environment, Food and Rural Affairs Committee (2008) Flooding: Fifth Report of Session 2007–08 - Volume I.
House of Commons. Retrieved from:
http://www.publications.parliament.uk/pa/cm200708/cmselect/cmenvfru/49/49.pdf
Evans, E.P., Simm, J.D., and Thorne, C.R. (2008) An Update of the Foresight Future Flooding 2004 Qualitative
Risk Analysis. Cabinet Office, London.
Few, R. (2007) Health and climate change hazards: Framing social research on vulnerability, response and
adaptation. Global Environment Change, 17, 281-295.
Fleming, G. (2002) Flood risk management: learning to live with rivers. London: Thomas Telford.
Freitag, B (2009) Floodplain management : a new approach for a new era. Washington, DC : Island Press.
Guha-Sapir, D. (2010) Health impacts of floods in Europe: Data gaps and information needs from a spatial
perspective. CRED: European Commission's Sixth Framework Programme - MICRODIS.
Hall, J.W., Meadowcroft, I.C., Sayers, P.B., and Bramley, M.E. (2003) Integrated flood risk management in
England and Wales. Natural Hazards Review, Volume 4(3), pp.126-135.
Hartmann, T. (2011) Contesting land policies for space for rivers – rational, viable, and clumsy floodplain
management. Journal of Flood Risk Management, September 2011, Vol.4(3), pp.165-175.
Holt, W.G. (2012) Urban Areas and Global Climate Change. Research in Urban Sociology. Bingley, U.K. :
Emerald Book Serials and Monographs.
House of Commons (2015) Environmental Audit, Tenth Report. Retrieved From:
http://www.publications.parliament.uk/pa/cm201415/cmselect/cmenvaud/453/45307.htm#a11
Kron, W. (2005) Flood Risk = Hazard • Values • Vulnerability. Water International
Law Society (2016) Flood Risk. Law Society. Retrieved from: http://www.lawsociety.org.uk/support-
services/advice/practice-notes/flood-risk/
Marriott, S., Alexander, J., and Hey, R. (1999) Floodplains: Interdisciplinary Approaches. Geological Society;
First Edition.
National Audit Office (2014) Strategic flood risk management. Retrieved from:
https://www.nao.org.uk/report/strategic-flood-risk-management-2/
Owen, J.H. (1981) Floodplain management handbook. Water Resources Council (U.S.) ; Flood Loss Reduction
Associates. Washington, D.C.
Pender, G. (2011) Flood risk science and management. Oxford : Wiley-Blackwell.
POST (2001) Managing Floods. Parliamentary Office of Science and Technology. Retrieved from:
http://www.parliament.uk/documents/post/pn169.pdf
Proverbs, D.G. and Mambretti, S. (2012) Flood Recovery, Innovation and Response. WIT Press.
RIBA (2014) Building a Better Britain: A vision for the next Government. Retrieved
from:https://www.architecture.com/RIBA/Campaigns%20and%20issues/Assets/Files/BuildingABetterBrita
inChapter6Flooding.pdf
Sayers, P. Li, Y. Galloway, G. Penning-Rowsell, E. Shen, F. Wen, K. Chen, Y. and Le Quesne, T. (2013) Flood
Risk Management: A strategic approach. Paris, UNESCO, WWF, ADB, GIWP.
Schanze, J. Zeman, E. and Marsalek, J. (2006) Flood Risk Management – hazards, vulnerability and mitigation
measure. NATO Science Series, IV Earth and Environmental Sciences – Vol. 67, Springer, Dordrecht, The
Netherlands.
Sene, K. (2008) Flood Warning, Forecasting and Emergency Response. Springer Berlin Heidelberg.
Surminski, S. and Eldridge, J. (2015) Flood insurance in England – an assessment of the current and newly
proposed insurance scheme in the context of rising flood risk. Journal of Flood Risk Management . ISSN
1753-318X.
Wisner, B., Blaikie, P. and Cannon, T. and Davis, I. (2003) At Risk: Natural Hazards, People's Vulnerability
and Disasters. Routledge Ltd; 2nd Edition.

762
ID 011
IMPROVING PRODUCTIVITY OF ROAD SURFACING OPERATIONS
BY USING VALUE STREAM MAPPING AND DISCRETE EVENT
SIMULATION
R. M. Qasim and Z. Aziz
School of the Built Environment, University of Salford, Salford, M5 4WT, UK
Email: [email protected]
Abstract: The Highways Infrastructure is one of the most valuable assets owned by the
public sector. Road construction projects suffer from tight schedules, heavy traffic volumes,
low budgets and environmental constraints that affect the productivity as well. Guaranteeing
smooth traffic services demands preservation and improvements of the best criterion. Existing
optimisation approaches are based on manual procedures, are fragmented and not making the
best use of computer-aided methods to improve processes. This research highlights a
synergistic relationship between applications of Value Stream Mapping (VSM) along with
Discrete Event Simulation (DES) methods to enhance the productivity of the delivery of road
maintenance (resurfacing) processes by gaining higher utilisation rates and least road closures.
Research plan included the use of primary data that was obtained from interviews, direct
observations, productivity databases and review of archival records. Process maps and value
stream maps were developed using this data that were finally used to create discrete event
simulation models, to explore different optimisation scenarios. A simulation model was used
to run various what-if scenarios that are not possible in real life and efficiency of equipment
and the over all process was improved dramatically using this DES-VSM integration. This
research demonstrated that current maintenance operations are not efficient enough and could
be enhanced to a great extent using simulation techniques and this study can be replicated as a
best practice as well.
Keywords: Paving, Process Improvement, Simulation, DES-VSM framework, Productivity.
1. INTRODUCTION
Road surfacing is a major component of Highways Development and Maintenance.
Highways construction sector, in general, is characterised by its slow pace of change, low
productivity, waste, fragmentation, and long-established processes and ways of doing
business, that has not evolved over decades (Aziz et al. 2017). Efficient running of the road
network has the success of national and local economies as well as the quality of public life,
dependent on it (INRIX & CBR 2014). Increasing volumes of traffic require maintenance and
improvements of the highest standard. A key challenge is to deliver major road schemes in
resource-constrained environments while maintaining safety, cost efficiency, sustainability
and minimal impact on road users (Qasim et al. 2017). Enhancing productivity of existing
processes is a key to operating in a resource-constrained environment.
Recent reviews of the construction productivity performance, specifical roadworks, indicate
that the industry fell short in comparison to manufacturing and services-based industry
sectors (Changali et al. 2015; Graham Ruddick 2016; Haughton 2017; Moore et al. 2015).
Some of the key factors restraining the productivity of construction are related to quality, use
of project controls, and proper levels of supervision. Similar observations were made in the
annual UK Construction Industry Performance Report (Anon 2015), indicating that majority

763
of construction projects continue to fail to meet their time and cost targets. These
observations are often coupled with falling profitability and client dissatisfaction with regards
to product quality, service and value for money.
Considering above findings, there is an urgent need for improving the productivity of road
works projects within the construction industry to deliver ongoing and future projects, with
maximum efficiency and minimum waste. Discrete Event Simulation (DES) along with
Value Stream Mapping (VSM) has been recognised as a technique that can improve the
overall process as well as some specific key areas. Manufacturing, process, construction and
healthcare sectors have advanced their operations and benefitted from either simulation, value
stream mapping or the integration of both.
2 LITERATURE REVIEW
The literature review discusses the relationship between DES and VSM and how they both
complement each other and its relevance to support highways operations.
Table 1 Showing synergic relation of DES and VSM and its popular applications
References
Industry Findings
D
E
S
V
S
M
DES-VSM
framework
(Marzouk
et al. 2011)
Highways,
Resurfacing
This paper only uses simulation for improvement
in traffic flow while resurfacing happens under
lane closure condition. It does not mention VSM
or the holistic view of the overall process.
X
(Xie &
Qingjin
Peng 2012)
Healthcare
Integration of simulation and VSM can analyse
alternatives for problems of capacity planning and
schedule control and improve health care
operations.
X
(Mcdonald
& Aken
2002)
Manufacturing DES can be a vital part of VSM to complement
the future design. X
(Lian &
Van
Landeghem
2007)
Manufacturing Integration of DES with VSM improves
information for process design. X
(Agyapong
-Kodua et
al. 2009)
Manufacturing
Transforming static VSM models to dynamic DES
increases validity and reliability of the future
design.
X
(Marvel &
Standridge
2009)
Manufacturing DES provides validation and visualisation of VSM
future design.
X
(Singh &
Sharma
2009)
Manufacturing
VSM is a powerful tool for lean manufacturing
and allows firms to understand and continuously
improve its understanding towards lean.
X
(Huang et
al. 2009) Construction
The combination of DES and VSM increases
understanding of the behaviour of the future
design.
X
(Gurumurth Construction DES validates, approves and visualises the VSM X

764
y & Kodali
2011)
future design.
(Jarkko et
al. 2013) Construction
VSM is unable to evaluate the performance of the
future state design analytically without the help of
DES.
X
(Labban et
al. 2013) Construction
Although research into simulation of construction
continues to advance and thrive in the academic
world, application of simulation in the
construction industry remains limited
X
(Abdulmale
k &
Rajgopal
2007)
Process Data obtained from DES evaluates and validates
VSM process design.
X
(Seth et al.
2008) Process
VSM serves as a starting point to help
management, engineers, suppliers, and customers
recognise waste and its sources.
X
The synergic relationship between Value Stream Mapping (VSM) and Discrete Event
Simulation (DES) has been tested and applied before in Manufacturing and construction
industry. However, its usage has not been adequately explored within resurfacing and asphalt
industry. Table 1 above presents a summary of key previous literature published within road
resurfacing context. Published literature focuses on logistics involved in resurfacing
operations and do not adequately cover hybrid VSM-DES relationship in resurfacing of road
pavement. This paper tries to fill this gap and utilise this integration in highways maintenance
for process improvement purposes.
VSM was formed from Toyota production system and Lean manufacturing principles
(Womack et al. 1990)It is defined as an iterative method to map and analyse value streams,
and its goal is to evaluate and communicate production process aspects, such as material and
information flows as well as non-value adding actions (Lasa et al. 2008; Rother & Shook
2003). It is used in improvements schemes like increasing throughput and for reduction of
Lead time and works in progress (WIP) (Álvarez et al. 2009). VSM is made up of three
components; a) Current State Gap that visualises value adding and non-value adding
activities in a process, b) Future State Design, a value stream that solves the identified
problems of current state and c) Yearly Value Stream Plan, that creates the operational plan
to reduce gap between present and future state (Martin & Osterling 2014).
Value Stream Mapping cannot provide hard facts for decision making and simply points
toward a direction. It lacks the ability to forecast the effects on future performance of a
system analytically, hence the need for simulation arises to experiment and evaluate the
future behaviour of a scheme (Jarkko et al. 2013). Basic lean tools, including VSM, are
sufficient for analysing straightforward and linear processes with relatively consistent
demand patterns. Static approaches are incapable of investigating methods that incorporate
volatile demand dynamics, mix product complexity or the shared use of resources. In such
scenarios, time dependencies are necessary as a process simulation model can accurately
describe and visualise the dynamics of the process, its performance, and the required
resources (Aziz et al. 2017).

765
Simulation is the process of modelling a real world situation and developing a framework
within which the system can be analysed (Law & Kelton 2000). Application of simulation in
construction operations has many advantages including estimation of possible delays,
productivity determination and improvement. In addition to resource management and
optimisation, stochastic system response to unexpected conditions, and ability to respond to
random and dynamic features, while the system is operating (Labban et al. 2013). Simulation
is also defined as a “controlled statistical sampling technique (experiment) that is used, in
conjunction with a model, to obtain approximate answers for the question about complex,
multifactor probabilistic problems (Ulrich 1991).
Simulation is used by many industries to model real-life and hypothetical situations, due to its
dynamic nature and complex scenarios. This was acknowledged as well by (Bhasin 2015),
stating that as an integral part of a lean activity, companies spend much time designing new
processes layouts, producing CAD drawings and building process maps en-route. The cost of
these activities can run into significant amount while none of these outputs will indicate
whether the new process will succeed or not. That is the job of process simulation which can
examine the capability of the new design and provide vital implementation support to
decision-makers that they are on the right path or not.
The combination of Simulation and Value Stream Mapping is more dominant in
manufacturing industry than construction. Simulation-based VSM makes it possible to
investigate complex systems and interpret the simulation results in a language that lean
recognises (Solding & Gullander 2009). Both DES and VSM provide a holistic assessment of
system and DES also adds a fourth dimension, time, to VSM. This combination offers
insights that may have been missed if VSM alone had been used (Donatelli & Harris 2009). It
has been noticed that DES can enhance VSM and a process can benefit incredibly with the
integration of both (Jarkko et al. 2013; Flores 2015). The fundamental purpose of using their
combination is to boost the productivity of resurfacing process, reduce waste and maximise
the efficiency of resources involved in the process.
3. CASE STUDY WORK
The case study about road improvement project is related to a section of a road in the United
Kingdom, carrying 108556 vehicles annually (2013 data), including 20% Heavy Good
Vehicles and it required re-surfacing. The motivation of improvement project was to deliver
efficiency by maximised output and use of resources, improved utilisation of road space and
by benefiting travellers through fewer road closures. There were inefficiencies noticed in the
process and due to the incompetent working style of subcontractors, an enormous amount of
resources were wasted, and traffic was disrupted on a daily basis.
All types of road work processes, whether new constructions or maintenance work, are
classified into two broad categories i.e. surfacing and resurfacing. Every road surface has its
diverse characteristics, which vary according to its geography, location, surrounding terrain,
speed related parameters, intended use, and type of pavement. Key constraints that must be
addressed before the start of pavement process include setting up of Traffic Management
(typically 15 minutes), material call-off and planer mobilisation (typically 30 minutes), and
planning a head start (usually 45 minutes), leading to a total non-value adding the pre-paving
time of 1 Hr 30 minutes.

766
Key post-pavement process constraints include rolling (usually 30 minutes), cooling and
curing (typically 75 minutes) and Traffic Management removal (typically 30 minutes). This
means a total of 2 hours and 15 min post is paving shift period. A safety margin of around 1
Hr 30 Mins is left for safety related activities. Installation and removal of Traffic
Management has an average duration between 30 minutes to 45 minutes and depend on a
broad range of variables including use of different designs and types of TM, delays and
operator/process related variables.
Figure 1 above shows the Value stream map of As-is operation
Based on this value stream map, various opportunities for waste reduction can be identified.
Firstly, planning process starts at 22:37, given site access, has been granted at 22:08, this
signifies a delay of 29 minutes after access to the area for surfacing has been issued.
Secondly, main value adding activity paving starts at 00:17. This highlights a paver sitting
idle for over 2 hours, awaiting material arrival. Thirdly, while working window is till 6 am,
workers are off-site about 1 hour 21 minutes before allocating period, highlighting another
area for improvement. Fourthly, there is a possibility to extend working window by obtaining
an early access to work.
4. ROOT CAUSE ANALYSIS
This Section presents root cause analysis from 6 different perspectives, with an end objective
to improve the total production per shift. Figure 2 below helps to give an understanding of the
current issues of a surfacing operation system as well as to provide project strategy ideas to
improve the output. Fishbone (Ishikawa) Diagram shows many constraints identified in road
surfacing process review and their cause (Vertex42 2013). The fishbone diagram was chosen
due to the need of studying and analysing the possible reasons that can negatively affect the
process output target (Yazdani & Tavakkoli-Moghaddam 2012). The four W’s questions
should be answered and considered to explain the fishbone diagram. “What” refers to issues
related to objects such as materials and machines, “Why” is used to answer questions

767
concerned with work conditions such as motivation of manpower. Moreover, “When” refers
to problems related to time sequence in operation such as time needed in production. Finally,
“Where” is concerned with effects related to the place, production line, loading area, and so
on. Figure 2 below shows different factors that were regarded as constraints and were
considered responsible for low productivity.
Figure 2 Showing Fish-Bone analysis of as-is situation
4.1 Steps to Create a Simulation Model
For the purpose of this research, the DES was chosen due to the flexibility and precise state
fluctuation within the process. While multiple DES software applications were introduced to
the market by different developers, such as FlexSim, Simio, Anylogic, JaamSim, MASON,
Sim.JSS. Simio was selected to carry out the intended simulations considering it is one of the
most popular simulation software applications for its ease-of-use, rich functionality, and its
capabilities of tracking different data points such as throughput, content, machine state, and
utilisation. According to Manuj et al. (2005), there are seven major steps in the methodology
of creating a simulation of a real life situation applying it back to the system. These include:
1. Problem formulation
2. Specify dependent and independent variables
3. Develop and validate conceptual model
4. Collect data
5. Establish and verify computer-based model
6. Validate model
7. Perform simulations

768
Figure 3 Showing the simulation model drawn up in Simio software
To perform different what-if scenarios to improve the as-is processes, various experiments
were conducted in the computer based environment as it can be seen in figure 3. These
experiments tested by changing variables that are otherwise not possible to modify in real life
environment due to cost, health and safety and other physical conditions. Some of the
scenarios tested are explained:
4.2 Scenario No.1: Creating Zones within the job site and increasing the number of
Planers and Pavers.
The first scenario assumes dividing the job site into two (2) equal zones (Zone A & B,). Each
zone has its planers, one for each lane, while maintaining two (2) lanes closed for resurfacing
and two lanes open to public traffic. Both zones share two (2) pavers, five (5) sweepers/pitch-
sprayers and four rollers. In the same time, the scenario maintained the same working
window. Key expected outcome is increased production in laying asphalt. Figure 4 below
shows the arrangement of vehicles that was performed in the software called Simio.
Figure 4 Showing the Simulation of Resurfacing vehicles in computer based environment
Simulation output is illustrated in Table 2, with total production rate increased up to two
times (i.e. 276.9 Tonne/hour) the standard production rate. The simulation shows that the
utilisation of pavers through the working window remains the same, despite added machinery
with an average usage rate of 65.3%. As a result, an increment in the values of total
production and production rate was expected, and the outcomes of simulation met these
expectations. Even though production output has increased, the added cost because of
additional machines should also be taken into account.

769
Table 2 showing results of Scenerio1
Scenario 1: Using Two pavers and closing two lanes together
Paver total output Paver Avg. output Paver 1 utilization Paver 2 utilization
1892 Tons 276.9 Tons/hour 65.3% 65.3%
4.3 Scenario No.2: Providing a 30 min break from 2:00-2:30 am
This scene focuses on measuring the impact on production rates of a 30-minute worker break
from 2:00 am to 2:30 am. Single paver operations are assumed. A 30-minute break resulted
in a decrease in total production and production rate. A 30-minute break leads to total asphalt
laid reducing to 865 Tonnes in comparison with the previous scenario of 1892 Tonnes output.
The production rate was recorded as 126.6 Tonne per hour, respectively. The utilisation of
Paver through the working window shrank by 5.6%. A 30-minute break could lead to
significant delays in larger projects. As a result, staggered break times are suggested, in
which each team takes its break in a manner that does not affect the flow of work.
Table 3 showing results of Scenerio2
Break from 2:00-2:30 am
Paver total output Paver Avg. output Paver utilization
865 Tons 126.6 Tons/hour 59.7 %
4.4 Scenario No.3: Using two Pavers in parallel (shut) lanes
3rd Scenario assumes limiting motorway closures to a 6 km stretch. Two lanes at a time are
closed to public traffic, and a 45mm thick asphalt is to be overlaid as shown in Figure 5. Each
closure interval (2 lanes) requires one (1) extra hour to complete resurfacing of the closed
lanes. The additional hour is needed for the paving operation. Thus, a further investigation of
the paving operation is required in order to accelerate the process and reduce the necessary
time for one hour instead of adding one hour to it. Finally, resurfacing of the entire closure
area requires an hour to be added or eliminated from each shift.
Figure 5 showing 2 lanes shut and 2 open for the public in Simulation Environment

770
Table 4 showing results of scenario 3
5. CONCLUSIONS
The literature review indicated that while there is an uptake of lean concepts and tools within
the manufacturing, process and construction industry; there are very few examples and
limited use of value stream mapping and process simulation within road transportation
context. There is a need for integrated approaches that allow for a comparison between the
performances of such practices to the existing systems (Detty & Yingling 2000). An
Integrated Value Stream Map and Discrete Event Simulation Framework based on the review
of literature presented a precise description of how future VSM can be validated before
implementation and achieve benefits. Mcdonald and Aken (2002) explained how the
integration might be able to predict the outcomes of dynamic situations that VSM is not
capable of addressing alone.
The most significant activity in resurfacing operation is paving, where the paver machine lays
asphalt on the road. It was noticed in the case study that paver was being used for only 2.5
hours out of the 8 hours’ working window which reduces its efficiency to only 33%. It can be
seen that paver utilisation can be maximised from 33% to 65% by implementing the scenarios
described above. In the UK, resurfacing operation is usually carried out overnight, and two
lanes are shut for operation, and one paver operates in one lane at a time. During simulation
trials, it was noticed that using two pavers in two different lanes is also a do-able scenario
that can double the amount of work done in same time.
The factors that can affect this experiment are weather, traffic volume, working styles and
planning. The maximum paver efficiency achieved in the UK is 65% that was performed only
once during the 1000-ton case study and has never been replicated afterwards. On the other
hand, it is common to have more than 70% paver productivity in the USA due to different
working window and working style. In California, the roads are shut for the whole weekend
(55 hours), and alternatives are provided, but it pays off well at the end of the day.
The purpose of this research was to investigate the relationship between DES and VSM and
then apply it in Highways operations perspective to achieve higher production rates and
minimum road closures. Value Stream Map was created after obtaining the primary data,
which helped in understanding and mapping the complicated process. VSM is used to gain
the in-depth understanding of the process to eliminate any waste and then a simulation model
can be created using this.
Various possibilities can further be experimented in the simulation model to suit the needs of
a particular environment. Different scenarios have been performed in the simulation to
optimise the process, and the best practice can be chosen after validating it through focus
group discussions or workshops, etc. It has been seen in the case study that just by changing
the working style, huge benefits can be achieved.
Scenario 3: Closing two lanes at once
Paver total
output
Paver Avg. output Paver 1 utilization Paver 2 utilization
1892 Tons 276.9 Tons/hour 65.3 % 65.3 %

771
6. REFERENCES
Abdulmalek, F.A. & Rajgopal, J., 2007. Analyzing the benefits of lean manufacturing and value stream
mapping via simulation: A process sector case study. International Journal of Production Economics,
107(1), pp.223–236.
Agyapong-Kodua, K., Ajaefobi, J.O. & Weston, R.H., 2009. Modelling dynamic value streams in support of
process design and evaluation. International Journal of Computer Integrated Manufacturing, 22(5), pp.411–
427.
Álvarez, R. et al., 2009. Redesigning an assembly line through lean manufacturing tools. International Journal of
Advanced Manufacturing Technology, 43(9–10), pp.949–958.
Anon, 2015. UKCIPR - UK Industry Performance Report, Available at:
https://www.glenigan.com/sites/default/files/UK_Industry_Performance_Report_2015_883.pdf.
Aziz, Z., Qasim, R.M. & Wajdi, S., 2017. Improving productivity of road surfacing operations using value
stream mapping and discrete event simulation. Construction Innovation, 29(1), pp.1–6.
Bhasin, S., 2015. Lean Management Beyond Manufacturing, A Holistic Approach, Springer International
Publishing.
Changali, S., Mohammad, A. & van Nieuwland, M., 2015. The construction productivity imperative. McKinsey
Productivity Sciences Center, (June). Available at:
https://www.mckinsey.it/file/5209/download?token=mGewq6Zc.
Detty, R. & Yingling, J., 2000. Quantifying benefits of conversion to lean manufacturing with discrete event
simulation: A case study. International Journal of Production Research, 38(2), pp.429–445.
Donatelli, A.J. & Harris, G.A., 2009. Combining Value Stream Mapping and Discrete Event Simulation.
Available at: http://www.simulation.co.kr/attachment/[email protected].
Flores, E., 2015. Evaluating Lean Manufacturing Proposals through Discrete Event Simulation – A Case Study
at Alfa Laval. Malardalen University, Sweden.
Graham Ruddick, 2016. Low productivity, an enduring and growing drag on the UK economy | Business | The
Guardian. , p.1. Available at: https://www.theguardian.com/business/2016/nov/23/low-productivity-an-
enduring-and-growing-drag-on-the-uk-economy [Accessed July 10, 2017].
Gurumurthy, A. & Kodali, R., 2011. Design of lean manufacturing systems using value stream mapping with
simulation: A case study. Journal of Manufacturing Technology Management, 22(4), pp.444–473.
Haughton, J., 2017. Ann Francke calls for investment in management skills training as productivity weakens -
CMI. managers.org.uk, pp.1–2. Available at:
http://www.managers.org.uk/insights/news/2017/february/ann-francke-calls-for-investment-in-
management-skills-training-as-productivity-weakens [Accessed July 13, 2017].
Huang, Y., Bird, R. & Bell, M., 2009. A comparative study of the emissions by road maintenance works and the
disrupted traffic using life cycle assessment and micro-simulation. Transportation Research Part D:
Transport and Environment, 14(3), pp.197–204.
INRIX & CBR, 2014. Traffic Congestion to Cost the UK Economy More Than £300 Billion Over the Next 16
Years, Available at: http://inrix.com/press/traffic-congestion-to-cost-the-uk-economy-more-than-300-
billion-over-the-next-16-years/.
Jarkko, E. et al., 2013. Discrete Event Simulation Enhanced Value Stream Mapping : An Industrialized
Construction Case Study. Lean Construction Journal, 10, pp.47–65.
Labban, R. et al., 2013. A discrete event simulation model of asphalt paving operations. In Proceedings of the
2013 Winter Simulation Conference - Simulation: Making Decisions in a Complex World, WSC 2013. pp.
3215–3224.
Lasa, I.S., Laburu, C.O. & Vila, R.D.C., 2008. An evaluation of the value stream mapping tool. Business
Process Management Journal, 14(1), pp.39–52.
Law, a M. & Kelton, W.D., 2000. Simulation Modeling and Analysis. ACM Transactions on Modeling and
Computer Simulation, 2(2), pp.1370–1375. Available at:
http://content.imamu.edu.sa/Scholars/it/VisualBasic/306537540.pdf.
Lian, Y.-H. & Van Landeghem, H., 2007. Analysing the effects of Lean manufacturing using a value stream
mapping-based simulation generator. International Journal of Production Research, 45(13), pp.3037–3058.
Manuj, I., Mentzer, J.T. & Bowers, melissa R., 2005. Improving the rigor of discrete-event simulation in
logistics and supply chain research. Journal of Small Business and Enterprise Development, 12(4), pp.564–
578.
Martin, K. & Osterling, M., 2014. Value Stream Mapping: How to Visualize Work and Align Leadership for
Organizational Transformation 1st ed., McGraw-Hill Education.
Marvel, J.H. & Standridge, C.R., 2009. Simulation-enhanced lean design process. Journal of Industrial
Engineering and Management, 2(1), pp.90–113.
772
Marzouk, M., Fouad, M. & El-said, M., 2011. Simulation of Resurfacing Pavement Operation of Highways. In
Department of Structural Engineering, Cairo University, Giza, Egypt, pp. 706–710. Available at:
http://www.iaarc.org/publications/proceedings_of_the_28th_isarc/simulation_of_resurfacing_pavement_op
eration_of_highways_under_lane_closure_condition.html.
Mcdonald, T. & Aken, E.M. Van, 2002. International Journal of Applications : A Leading Journal of Supply
Chain Utilising Simulation to Enhance Value Stream Mapping : A Manufacturing Case Application.
International Journal of Logistics Research and Applications, 5(2), pp.213–232.
Moore, A. et al., 2015. Area 9 Pavement Process Improvement Improving Road Surfacing Productivity – 1000t
project,
Qasim, R.M., Aziz, Z. & Alfar, E., 2017. INCREASING EFFICIENCY OF EARTHMOVING & PAVEMENT
PROCESSES AT HIGHWAYS ENGLAND, Manchester. Available at:
https://kol.withbc.com/pub/english.cgi/d379427192/A3 KTP - Earthworks.pdf.
Rother, M. & Shook, J., 2003. Learning to See: Value Stream Mapping to Create Value and Eliminate Muda.
Lean Enterprise Institute Brookline, p.102.
Seth, D., Seth, N. & Goel, D., 2008. Application of value stream mapping (VSM) for minimization of wastes in
the processing side of supply chain of cottonseed oil industry in Indian context. Journal of Manufacturing
Technology Management, 19(4), pp.529–550.
Singh, B. & Sharma, S.K., 2009. Value stream mapping as a versatile tool for lean implementation: an Indian
case study of a manufacturing firm. Measuring Business Excellence, 13(3), pp.58–68.
Solding, P. & Gullander, P., 2009. Concepts for simulation based Value Stream Mapping. Proceedings of the
2009 Winter Simulation Conference (WSC), pp.2231–2237.
Ulrich, G., 1991. Simulation methodology for statisticians, operations analysts and engineers, Vol. I, by P. A.
W. Lewis and E. J. Orav, Wadsworth, Belmont, CA, 1989, 416 pp. Networks, 21(3), pp.369–370. Available
at: http://doi.wiley.com/10.1002/net.3230210308.
Vertex42, 2013. Fishbone Diagram / Cause and Effect Diagram. Fishbone Diagram / Cause and Effect Diagram.
Available at: http://www.vertex42.com/ExcelTemplates/fishbone-diagram.html.
Womack, J.P., Jones, D.T. & Roos, D., 1990. The Machine that Changed the World: The Story of Lean
Production,
Xie, Y. & Qingjin Peng, 2012. Article information : Business Process Management Journal, 18, pp.585–599.
Yazdani, A.A. & Tavakkoli-Moghaddam, R., 2012. Integration of the fish bone diagram, brainstorming, and
AHP method for problem solving and decision making-a case study. International Journal of Advanced
Manufacturing Technology, 63(5–8), pp.651–657.

773
ID 029
SUSTAINABLE BUILDINGS AND POST-OCCUPANCY
EVALUATION: AN END-USER BEHAVIOR BASED APPROACH FOR
CERTIFIED OFFICE BUILDINGS
E. Tezel1 and H. Giritli
1 Department of Architecture, Istanbul Technical University, Taşkışla Campus, Istanbul, Turkey
Email: [email protected]
Abstract: After recognition of sustainable development theme in late 1900s worldwide,
construction sector was adapted itself into this concept in many ways to limit its negative
impact against nature. Sustainable building certification systems was one of the adaptation
tools, which have been basically summarized as categorization of buildings according to
certain criteria; and such practice is becoming widespread day by day from its firstly start as
almost three decades ago. However, as researches indicate that, even constructing a building
according to sustainability rules is vital, there is more to be considered to reach higher success
level in sustainability.
This study focuses on the connection between sustainability perceptions and pro-
environmental behaviours (PEBs) of end-users in sustainable buildings and their effect on
such buildings’ operational phase. Findings of current research highlights the importance of
user and its interaction with sustainable building, in terms of building’s actual performance
that sustainability professionals in construction industry need to consider. In the conclusion
part of the study, a framework has been suggested in order to minimize current performance
gap of sustainability certified office buildings through concentrating not only on building’s
technical characteristics determined in sustainability policies, but also its major actors as users
during its occupational process.
Keywords: post-occupancy evaluation, pro-environmental behavior, sustainable buildings.
1. INTRODUCTION
Sustainability and sustainable development are two significant themes, which have been
discussing more than a-quarter century all around the world. Even though different
definitions of sustainability and sustainable development have been put forward and
discussed, the most widely used one is from the Brundtland Report by the World
Commission on Environment and Development (1987), which defined sustainable
development as: “Development that meets the needs of the present without compromising the
ability of future generations to meet their own needs.” However, this definition does not
provide any specific pathway to sustainability.
Since the Brundtland Report in 1987, awareness of sustainability issues is increasing in the
construction industry. This attention for the construction industry arises from its exploitation
of natural resources. Evidence shows that the construction industry is responsible for high
energy consumption, solid waste generation, global greenhouse emission, external and
internal pollution, environmental damage and resource depletion (Chan et al., 2010). There is
reason to believe that, construction industry has an enormous influence on the environment
when compared to other industries (Khalfan et al., 2003). In fact, the World Watch Institute
estimated that by 2030 the world will run out of several raw materials for construction
774
(Gorgolewski, 2006). For this reason, green or sustainable building concepts are gaining
popularity to serve as a standard to mitigate the environmental impact of new and existing
building stock.
Scanning the literature reveals that, most of the global research on sustainable construction
has been focused on environmental issues (Seoung-Wook and Kim, 2015). However, it is
only through the successful integration of environmental, economic and social issues to
achieve sustainable development. Despite lack of given importance to user actions during
sustainability assessment of buildings (Monfared and Sharples, 2011), user behaviours, that
have direct effect on buildings’ operation maintenance process, are crucial for buildings’
sustainability scores (Hei and Yu, 2014).
This study aims to evaluate environmentally oriented behaviours of end-users during
operation phase of buildings to enlighten the relationship between pro-environmental
behaviours and sustainability characteristics of certified buildings. With this aim, two groups
of occupants of certified and traditional offices in Turkey were contributed to the self-report
based survey. Outcomes of the survey is expected to widen the perspective of sustainability
applications in construction industry.
2. SUSTAINABLE BUILDING TERM AND BUILDING ASSESSMENT SYSTEMS
In a general review of literature “sustainable building”, “sustainable design”,
“environmentally-friendly building” and “ecological architecture” are seen as the most
preferred terms to explain sustainability in construction. Withal, “sustainable building” and
“green building” are two concepts that have been used in terms of each other. However, the
critical difference between sustainable building and green building has been indicated by
Raymond J. Cole (1999) as; green building achieves one or more ecological features, while
sustainable building includes environmental, social and economic dimensions. Similarly,
Berardi (2013a) argues that, sustainable buildings have economic and social roles in addition
to green buildings’ ecological attributes. Considering the definition and characteristics of
sustainable building; “the primary goal of sustainable design is to lessen the harm poorly
designed buildings cause by using the best of ancient building approaches in logical
combination with the best of new technological advances” by Barnett and Browning (1995),
“creating a healthy built environment based on ecologically sound principles” by Kibert
(2002), “buildings whose loadings on global environment are manageable enough to maintain
the sustainability of the ecosystem” by Mukarami (2007) or “creates required performance
and functionality with minimum adverse environmental impact, while encouraging
improvements in economic and social aspects at local, regional and global levels by ISO
2008 in Häkkinen and Belloni (2011) are seem to provide a clear understanding about the
sustainable building subject.
Researchers Barnett and Browning (1995), expects sustainability as a standard operation in
construction industry within two decades. U. S. Environmental Protection Agency (EPA), the
institution that is responsible for protection of human health and environment, also
emphasizes sustainability as a practice rather than a theoretical approach (2008). Thus, for
almost 30 years, sustainable building assessment tools are considered as an unignorable
movement displayed by construction sector in terms of sustainable development. According
to İlter and İlter (2011), sustainable building certificates are the initial and concrete step of
sustainability practice in construction industry. Such that, a number of national and
775
international organizations are still working to generate a systematic and comprehensive road
map to improve the industry’s environmentally responsible identity (Xiaoping et al., 2009).
In year 1990, BREEAM of Building Research Establishment in United Kingdom was
released as the first building assessment tool and followed by many other tools from different
countries. LEED in United States (1998), Green Star in Australia (2003), Green Globes in
Canada (2000), DGNB in Germany (2009), CASBEE in Japan (2004) and Green Mark in
Singapore (2005) are other widely known sustainable building certification systems all
around the world. Despite these tools generally rooted from BREEAM and LEED systems,
they were developed according to each countries’ local conditions and regulations. Basic
principle behind these systems and tools is to evaluate buildings according to certain
sustainability criteria defined and accepted by governmental and/or commercial accredited
institutions and categorize or label buildings accordingly.
According to Kamali and Hewage (2015), there are almost 70 sustainability certification
system are available all around the world. Even they all have their own systematic approach
for building sustainability evaluation; energy efficiency, water efficiency, materials and
resources and indoor environmental quality are the four major principles that play active role
in many tools (Say and Wood, 2008). On the other hand, according to the World Green
Building Trend Report, most of the sustainable building projects are implemented especially
with the expectation of energy consumption reduction, rather than natural resource
conservation or water consumption reduction (Dodge Data & Analytics, 2016).
3. EVALUATION OF SUSTAINABILITY TRAIT OF BUILDINGS
Despite sustainability practices during the design and construction phases of buildings is a
significant action, targeted decrease in the negative impact of construction activities against
nature has not been fully achieved yet (Monfared and Sharples, 2011; Whitfield, 2014). Some
researchers emphasize the lack of adaptation of environmentally oriented approaches in
construction industry due to certain barriers such as; high initial cost of sustainable building
projects, insufficient site conditions and incompatible building regulations (Williams and
Dair, 2007); lack of knowledge of owners, affordability issues and lack of planning policies
(Pitt et al., 2009); high design/construction and material/product costs, lack of knowledge of
contractor and lack of awareness about sustainability of owners (Ahn et al., 2013), etc.
However, many of these barriers are argued to act as accelerators, for instance;
environmentally oriented features of sustainable buildings provide decrease in operation and
maintenance cost and increase in productivity, which refers ten times more monetary gain
against their initial costs (Kats, 2003); building regulations including investment and tax
benefits improves owner awareness and demand (Pitt et al., 2009) and announcement of
productivity level increases of commercial buildings enhance corporate image in society
(Ahn et al., 2013).
Another approach to understand the unsatisfactory success level of sustainability in
construction sector is believed to be the social dimension of sustainability. Although
sustainability has three complementary aspects in economic, ecological and social context,
according to Berardi (2013b), social extent of sustainability is the most disregarded aspect.
Monfared and Sharples (2011) indicate that, most of the building assessment tools focus on
ecological and economic aspects of sustainability, while not focusing on social dimension
which includes operational process of buildings. However, as Cotera (2011) indicates that,

776
most of the sustainability certificated buildings exceed their calculated consumption values
during occupational process due to their users. Thus, environmentally oriented behaviours of
end-users during operational phase should be considered while evaluating buildings’
sustainability performance, in addition to buildings’ environmentally oriented features in
design and construction phases (Kirk, 2010; Hei and Yu, 2014; Hassan et al., 2015). Through
integrating end-user factor into evaluation criteria of building assessment tools, a better
sustainability practice in construction industry may be achieved.
Since human actions are the most important cause of environmental problems, searching for
solutions of those problems through considering individual’s environmentally responsible
behaviours are accepted as a reasonable approach (Steg and Vlek, 2009; Nag, 2012; Greaves
et al., 2013). In literature, “pro-environmental behaviour” term is used to refer
environmentally responsible activities (Kurisu, 2015) and it is indicated that, sustainability
can be evaluated according to individual level behaviours (Turaga et al., 2010; Nag, 2012).
Pro-environmental behaviours (PEBs) are explained by various researchers as; “behaviour
that consciously seeks to minimize the negative impact of one’s actions on the natural and
built world” (Kollmuss and Agyeman, 2002); “behaviour that harms the environment as little
as possible, or even benefit the environment” (Steg and Vlek, 2009) and “purposeful and
effective actions that result in the conservation of natural resources” (Tapia-Fonllem et al.,
2013). In United Kingdom and United States, organizations perform studies about pro-
environmental behaviours recently. As a result of those studies, a comprehensive list of pro-
environmental behaviours was provided by Department for Environment, Food and Rural
Affairs-DEFRA in UK and Environmental Protection Agency-EPA.
Despite existing awareness about global warming or environmental problems, most people
fail to act in environmentally responsible way (Tsarenko et al., 2013) or sustain their
ecologically sound behaviours (Lynn, 2014) for certain reasons, such as; difficulty of
behavioural changes in older ages (Cottrell, 2003), expected satisfaction from the outcomes
of individual’s behaviours and efficacy (Barr and Gilg, 2006) or lack of sufficient conditions
(Kurisu, 2015). Therefore, Lynn (2014) emphasizes the importance of understanding the
influential factors that affect pro-environmental behaviours and interaction among them.
Studies focusing on the prediction of PEBs and influential factors on them have been
maintained for almost five decades. In the early years of research, direct relationship between
environmentally oriented behaviours and environmental concern has been claimed and high
level of concern has seen as the most important element of pro-environmental behaviours
(Bamberg, 2003). After the recognition of low-to-moderate effect of environmental concern
on PEBs (Bamberg, 2003), the Value-Belief-Norm Theory has been developed by Stern et al
in 1999 that focuses on the personal norms as predictors of pro-environmental behaviours
(McDonald, 2014; Kurisu, 2015). According to the theory, “value” factor refers to
individual’s approach related with environmental problems and categorized into three sub-
factors as; egoistic, altruistic and biospheric values, while “belief” factor contains awareness
about negative impact of individual’s behaviours on nature, awareness of consequences about
adverse results of natural problems and ascription of responsibility about individual’s ability
of increasing environmental threat. Finally, with the effect of personal norms, individual’s
environmentally oriented behaviours are generated (Stern et al., 1999).
Considering existing behaviour theories, Hines et al. prepared a meta-analytical model to
explain PEBs that was based on detailed literature review. According to the model,
environmentally responsible behaviours are generated according to the balance between

777
intention to act and situational factors. Researchers also explained the influential factor
behind intention to act as; personality factors, action skills as individual’s ability to act,
knowledge issues about nature related problems and knowledge of action strategies against
those environmental problems (Hines et al., 1987).
Similar to Hines et al., Kollmuss and Agyeman and Bamberg and Möser also developed two
different and comprehensive meta-analytical models in early 2000s, in order to understand
influential factors underlying PEBs. According to Kollmuss and Agyeman’s model,
environmentally responsible behaviours are generated according to the synergy between
personal (internal) and environmental (external) factors and effected by lots of criteria such
as; old behavioural patterns, lack of external possibilities or lack of environmental conscious
level (2002). In addition to this explanation, researchers indicated that, they only considered
the most influential factors that effecting PEBs in order not to decrease practicality of their
model (Kollmuss and Agyeman, 2002). Finally, Bamberg and Möser applied Structural
Equation Model on all influential factors of PEBs argued in various theories and provided
another meta-analytical model in 2007. In their model, the direct relationship between
intention and behaviour has been strongly emphasized and the importance of moral norms,
attitude and perceived behavioural control on intention has been explained in detail (Bamberg
and Möser, 2007).
However, longitudinal studies showed that, none of the theories work better while explaining
the reasons of PEBs than others (Cordano et al., 2011) and it is not feasible to explain all
predictors of PEBs with a single model (Kollmuss and Agyeman, 2002). Thus, most of the
studies about PEBs focus on to prediction of certain behaviours like; energy consumption,
recycling or ecological travelling recently.
4. RESEARCH METHODOLOGY
According to the World Green Building Trend report in 2016, almost one of each two
commercial building projects are expected to be green (Dodge Data & Analytics, 2016).
Starting from this point, conducting a research with commercial buildings’ occupants is
believed to be the most coherent way in order to minimize the current knowledge gap about
buildings’ environmental performance. Different from the countless numbers of researches
related with sustainable buildings, this study focuses on occupational phase of buildings and
evaluates the environmental performance of both certified and traditional office buildings
through their end-users’ perspectives and actions.
As it is seen in Figure 1, current study examines pro-environmental behaviours of occupants
through environmental values, beliefs about sustainability in office buildings and awareness
of building’s sustainability aspects of occupants. According to the proposed framework
approach in Figure 5, three statements have been proposed;
Proposition 1: Environmental values, beliefs about sustainability aspects of building and
awareness about sustainability aspects of building significantly predict pro-environmental
behaviours in workplace.
Proposition 2: Environmental values mediates the relationship between each specific belief
and awareness about sustainability aspect.
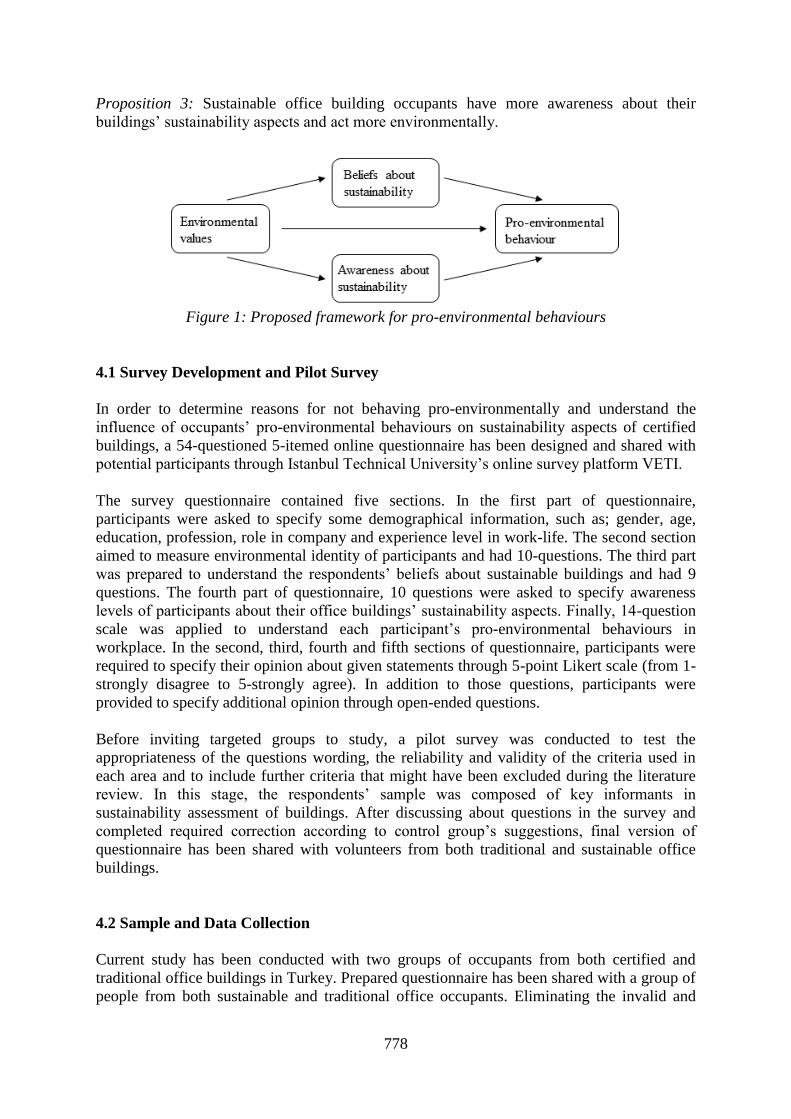
778
Proposition 3: Sustainable office building occupants have more awareness about their
buildings’ sustainability aspects and act more environmentally.
Figure 1: Proposed framework for pro-environmental behaviours
4.1 Survey Development and Pilot Survey
In order to determine reasons for not behaving pro-environmentally and understand the
influence of occupants’ pro-environmental behaviours on sustainability aspects of certified
buildings, a 54-questioned 5-itemed online questionnaire has been designed and shared with
potential participants through Istanbul Technical University’s online survey platform VETI.
The survey questionnaire contained five sections. In the first part of questionnaire,
participants were asked to specify some demographical information, such as; gender, age,
education, profession, role in company and experience level in work-life. The second section
aimed to measure environmental identity of participants and had 10-questions. The third part
was prepared to understand the respondents’ beliefs about sustainable buildings and had 9
questions. The fourth part of questionnaire, 10 questions were asked to specify awareness
levels of participants about their office buildings’ sustainability aspects. Finally, 14-question
scale was applied to understand each participant’s pro-environmental behaviours in
workplace. In the second, third, fourth and fifth sections of questionnaire, participants were
required to specify their opinion about given statements through 5-point Likert scale (from 1-
strongly disagree to 5-strongly agree). In addition to those questions, participants were
provided to specify additional opinion through open-ended questions.
Before inviting targeted groups to study, a pilot survey was conducted to test the
appropriateness of the questions wording, the reliability and validity of the criteria used in
each area and to include further criteria that might have been excluded during the literature
review. In this stage, the respondents’ sample was composed of key informants in
sustainability assessment of buildings. After discussing about questions in the survey and
completed required correction according to control group’s suggestions, final version of
questionnaire has been shared with volunteers from both traditional and sustainable office
buildings.
4.2 Sample and Data Collection
Current study has been conducted with two groups of occupants from both certified and
traditional office buildings in Turkey. Prepared questionnaire has been shared with a group of
people from both sustainable and traditional office occupants. Eliminating the invalid and

779
deficient return of questionnaire, 55 participants from certified office buildings and 48
participants from traditional office buildings, totally 103 people working on various
disciplines (managers, architects/engineers, law and accounting professionals, academic staff
and technical staff) constitute the sample of this study.
According to the given answers to the questions in the first section of the survey, obtained
demographic information about the sample is shown in Table 1. 53 of 103 participants were
signified themselves as female and 48 as male, while 1 participant who chose “not mention”
and 1 participant who did not answer the gender question (See Table 1). Considering the age
range of participants; 1 person from the age below 20, 35 people from the age among 20-30,
46 people from the age among 31-40, 17 people from the age among 41-50, 3 people from
the age among 51-60 and a person from the age above 60 have answered the questions.
Finally, it is observed among the participants that; more than half have 4-years degree and
32% of the participants have even higher educational background.
Table 1: Sample characteristics Gender Age Education
Female Male <20 20-30
31-40
41-50
51-60
>60 High school
Two years
degree
Four years
degree
Master Ph.D.
Certified
office occupants
29 24 - 20 22 11 1 1 3 1 31 15 5
Traditional
office
occupants
25 23 1 15 24 6 2 - 1 6 28 12 1
Total 53 48 1 35 46 17 3 1 4 7 59 27 6
5. DATA ANALYSIS
The information obtained from the questionnaire consisted of primarily nominal and ordinal
data. As far as ordinal data is concerned, it comprised five preference-ordered categories
from strongly disagree (1) to strongly agree (5). Likert-type replies are thus the major
components of the results, which do not allow for parametric statistics. Conversely,
nonparametric tests such as the Mann-Whitney test can handle ordinal data gained from the
survey results.
The analysis of the replies from the respondents included reliability assessment through
Cronbach’s alpha, correlation analysis, Mann-Whitney u-test and path analysis.
5.1 Reliability Assessment
Cronbach’s alpha coefficient was used for the reliability of each scale in the questionnaire.
Except the Environmental Value scale’s moderate reliability score (.673), all other scales in
the questionnaire have high reliability results as Environmental Belief scale (.895),
Environmental Awareness scale (.958) and Pro-Environmental Behaviour scale (.841), since
they scored greater than .700 case. Thus, results obtained from the analysis of data gathered
via these scales are accepted as persuasive results.

780
5.2 Correlation Analysis
To test the Proposition 2 which focuses on each scales relationship with pro-environmental
behaviours, Spearman correlation analysis has been applied and gathered results are shown in
text and in Table 2 and Table 3.
In Table 2, it is observed that, ecocentric value of individual (idea about protection of nature
as its importance) significantly effects individual’s beliefs about all four sustainability aspects
(CO2, electric consumption, water consumption and waste and recycling) investigated in the
study, while anthropocentric value (idea about protection of nature for human benefit) does
not. Furthermore, ecocentric value also motivates individuals to act more responsible on
electric consumption, water consumption and waste minimization and recycling issues (see
Table 3). However, it only effects CO2 emission and waste and recycling related awareness of
individuals. On the other hand, anthropocentric value of individual only has effect on water
consumption behaviour.
Secondly, considering the relationship between beliefs and pro-environmental behaviours, it
is seen in Table 2 that, CO2 related belief does not have significant effect on any of the
investigated behaviours. However, there exist high positive correlation between electric
related beliefs and electric related behaviour, water related behaviour and waste and recycling
related behaviour of occupants. For example, if an occupant believes energy consumption is
an important parameter for sustainability, that occupant acts more responsible not only on
electric consuming, but also water consuming and waste minimizing issues. Also,
individual’s water related belief significantly predicts that individual’s electric and water
consumption behaviours. Interestingly, waste related belief has no significant effect on waste-
related behaviour, but on water-related behaviour.
Table 2: Spearman correlation coefficients of value, belief and behavior scales Environmental
Value
Beliefs about sustainability Pro-environmental behaviours
(1) (2) (3) (4) (5) (6) (7) (8) (9) (10)
(1)Ecocentric value 1.00
(2)Anthropocentric value - 1.00 (3)Belief-CO2 .350** - 1.00
(4)Belief-Electric .460** - .567** 1.00
(5)Belief-Water .486** - .613** .684** 1.00 (6)Belief-Waste .334** - .536** .649** .485** 1.00
(7)Behaviour-CO2 - - - - - .197* 1.00
(8)Behaviour-Electric .324** - - .357** .270** - .468** 1.00 (9)Behaviour-Water .317** .224* - .337** .233* .274** .241* .655** 1.00
(10)Behaviour-Waste .365** - - .289** - - - .540** .816** 1.00
*p<.05, **p<.01
Thirdly, considering the relationship between awareness and pro-environmental behaviours,
almost all of targeted behaviours show significant correlations with occupants’ awareness
about environmental features of their buildings. According to results in Table 3, awareness
about CO2, electric and waste and recycling can significantly predict individuals’ CO2
emission, electric consumption, water consumption and waste and recycling related
behaviours. In other words, if an occupant has high awareness of CO2 emission, electric
consumption and recycling issues, that occupant develop more careful actions in use of
energy (such as, turning PC off while going for lunch) and water (such as, reporting a broken
faucet), less greenhouse gas emission and less waste disposal (such as, use of wrong printed
papers to take notes). Moreover, individuals’ CO2 and electric consumption behaviours show
significant correlation with awareness of water and sustainability certificate of buildings.

781
Lastly, pro-environmental behaviours show significant correlations with each other, that
means, correlated behaviours predict each other. As it is seen in Table 3, electric and water
consumption behaviours have significant positive relationship with CO2 emission behaviour.
Such that, an individual’s responsible electric and water consumption behaviours indicate that
individual’s responsible CO2 emission behaviour, such as; public transportation use, etc.
similarly, an individual’s environmentally responsible behaviours like waste minimization or
proper disposal of recyclable waste indicate that individual’s less energy and water
consumption motivated behaviours.
Table 3: Spearman correlation coefficients of value, awareness and behavior scales Environmental
Value
Awareness about sustainability Pro-environmental behaviours
(1) (2) (3) (4) (5) (6) (7) (8) (9) (10) (11) (1)Ecocentric value 1.00
(2)Anthropoce. value - 1.00
(3)Awareness-CO2 .228* - 1.00 (4)Awareness-Electr. - - .737** 1.00
(5)Awareness-Water - - .748** .752** 1.00
(6)Awareness-Waste .292** - .683** .663** .668** 1.00 (7)Awareness-Certific - - .796** .736** .742** .611** 1.00
(8)Behaviour-CO2 - - .213* .211* .226* .252* .256* 1.00 (9)Behaviour-Electric .324** - .359** .351** .301** .423** .250* .468** 1.00
(10)Behaviour-Water .317** .224* .337** .264** .236* .303** - .241* .655** 1.00
(11)Behaviour-Waste .365** - .249* .213* - .292** - - .540** .816** 1.00
*p<.05, **p<.01
5.3 Mann-Whitney U-Test
Mann-Whitney U-test is the non-parametric alternative test to the independent sample t-test.
It is a non-parametric test that used to compare two sample means that come from the same
population and used to test whether two sample means are equal or not.
The results from Mann-Whitney U-test to investigate Proposition 3 are shown in Table 4.
According to table, significant differences between awareness about buildings’ water
consumption minimization oriented aspect of certified office occupants are exist. Also,
people who work in certified buildings have significantly higher awareness about their
buildings’ certificates.
Table 4: Mann-Whitney U-test Variable n Mean Rank Sum of
Ranks
p
Awareness-Water .042
Certified office 55 56.06 3083.50 Traditional office 46 44.95 2067.50
Awareness-Certificate .000
Certified office 55 60.33 3318.00 Traditional office 45 49.05 1732.00
Behaviour-Electric .016
Certified office 55 45.00 2475.00 Traditional office 47 59.11 2778.00
Behaviour-Water .038
Certified office 55 46.01 2530.50
Traditional office 47 57.93 2722.50
Behaviour-Waste .005
Certified office 55 43.94 2416.50 Traditional office 47 60.35 2836.50
Contrary to expectation, there exist electric consumption, water consumption and waste and
recycling related behavior difference between two groups in reverse way; that is, occupants

782
of traditional office buildings act more carefully on electric and water consumption amounts
and waste minimization and recycling issues in their offices than those in sustainable offices.
Such an unexpected result may be related with certified office occupants’ perceptions about
their buildings; they may have the idea that, technology and materials used in the building are
environmentally friendly and they do not need to consider consumption reduction anymore.
5.4 Path Analysis
Finally, to test the Proposition 1 which focuses on prediction of pro-environmental
behaviours, a path analysis model has been applied using AMOS 24.0 software. Validity of
the proposed model for PEBs has been calculated through model fit calculations. According
to the calculated values as; chi-square=1357.860 and x2/df=1.640, validity of the model is
acceptable. Fit indices were (GFI=.606, NFI=.613, CFI=.797, RMSEA=.092) moderate fit.
As it is shown in Figure 2, none of the estimated regression coefficients from environmental
value to belief (.66, p>.05), to awareness (.05, p>.05) and to pro-environmental behaviour
(.03, p>.05) were significant. On the other side, regression coefficients from belief (.65,
p<.05) and awareness (.35, p<.05) to pro-environmental behaviour indicates significant
correlations. According to correlations it can be concluded that, pro-environmental
behaviours can be predicted through beliefs and awareness about sustainability; in other
words, a person’s beliefs about sustainability and awareness about the sustainable features of
the building he/she works, regulate that person’s behaviours in more environmentally
responsible way.
Figure 2: Path analysis of pro-environmental behavior with standardized regression
coefficients
6. CONCLUSION
As sustainability is a global issue, “one size fits all” approach (Say and Wood, 2008) during
the assessment of buildings’ environmental characteristics sounds rational. However, in order
to prevent possible defects during assessment due to national level or indigenous reasons,
development of local building assessment systems is suggested (Say and Wood, 2008).
Furthermore, despite various effort to improve sustainable characteristics of construction
industry, desired results have not been achieved so far. One of the reasons of this fault may
be derived from lack of understanding about the social dimension of sustainability while high
concentration on economic and ecological features. Thus, distinctly from current application,
more focus on operational phases of buildings while sustainability assessment is believed to
be a significant factor for better success level in sustainability in construction sector.
783
Considering these reasons, this study targets to determine the predictors of pro-environmental
behaviours and the interaction between building’s sustainability aspects and PEBs. With this
aim, two groups of occupants from both traditional and sustainable offices were asked to
complete a self-report questionnaire. According to results from gathered data, high awareness
of certified office occupants’ about their buildings’ environmental aspects and high
correlation between awareness and pro-environmental behaviour were determined.
It may be concluded that, sustainable buildings create high awareness about sustainability
subject on occupants and through this awareness, more environmentally responsible
behaviours are exhibited, though some unexpected behavioural difference. In order to prevent
misunderstanding of sustainability and sustainable building issues, more focus on informative
training and regular control over sustainability scores of buildings may be supportive actions
that construction professionals should consider. Additionally, while accounting sustainable
buildings as teaching mediums for society about ecological subjects, individual effort based
evaluation of building’s environmentally-oriented performance may lead society to be more
proactive against global environmental problems. Further focus on the integration of PEBs
and sustainability assessment measures and local and territorial authority support on
sustainability practices in construction industry are recommended.
4. REFERENCES
Ahn, Y. H., Pearce, A. R., Wang, Y. and Wang, G., 2013. Drivers and barriers of sustainable design and
construction: the perception of green building experience. International Journal of Sustainable Building
Technology and Urban Development, 4(1), pp. 35-45.
Bamberg, S. and Möser, G., 2007. Twenty years after Hines, Hungerford and Tomera: a new meta-analysis of
psycho-social determinants of pro-environmental behaviour. Journal of Environmental Psychology, 27, pp.
14-25.
Bamberg, S., 2003. How does environmental concern influence specific environmentally related behaviours? A
new answer to an old question. Journal of Environmental Psychology, 23, pp. 21-32.
Barnett, D. L. and Browning, W. D., 1995. A primer on sustainable building. USA: Rocky Mountain Institute.
Barr, S. and Gilg, A., 2006. Sustainable lifestyles: framing environmental action in and around the home.
Geoforum, 37, pp. 906-920.
Berardi, U., 2013a. Clarifying the new interpretations of the concept of sustainable building. Sustainable Cities
and Society, 8, pp. 72-78.
Berardi, U., 2013b. Moving to sustainable buildings: paths to adopt green innovations in developed countries.
London: Versita.
Brundtland, G., Khalid, M., Agnelli, S., Al-Athel, A., Chidzero, B., Fadika, L., Hauff, V., Lang, I., Shijun, M.,
de Botero, M. M., Singh, M., Okita, S. and others., 1987. Report of the World Commission on Environment
and Development: our common future. Oslo: United Nations General Assembly.
Cole, R. J., 1999. Building environmental assessment methods: clarifying intentions. Building Research &
Information, 27(4-5), pp. 230-246.
Cordano, M., Welcomer, S., Scherer, R. F., Pradenas, L. and Parada, V., 2011. A cross-cultural assessment of
three theories of pro-environmental behavior: a comparison between business students of Chile and the
United States. Environmental Behavior, 43(5), pp. 634-657.
Cotera, P.-J. N., 2011. A post-occupancy evaluation: to what degree do LEED certified buildings maintain their
sustainable integrities over time. Master. University of Florida.
Cottrell, S. P., 2003. Influence of sociodemographics and environmental attitudes on general behavior among
recreational boaters. Environment and Behavior, 35(3), pp. 347-375.
Dodge Data & Analytics, 2016. World green building trends 2016: Developing markets accelerate global green
growth SmartMarket Report. Massachusetts: Dodge Data & Analytics.
EPA, 2008. Green building strategy. USA: Environmental Protection Agency.
Greaves, M., Zibarras, L. D. and Stride, C., 2013. Using the theory of planned behavior to explore
environmental behavioural intentions in the workplace. Journal of Environmental Psychology, 34, pp. 109-
120.

784
Häkkinen, T. and Belloni, K., 2011. Barriers and drivers for sustainable building. Building Research &
Information, 39(3), pp. 239-255.
Hassan, M. N. A., Pozi, F. M., Almsafir, M. K. and Alias, R., 2015. Exploring environmental behavior at green
office building using theory of planned behavior (TPB). In: The 3rd National Graduate Conference
(NatGrad2015). Putrajaya, 8-9 April 2015.
Hei, C. and Yu, L. S. S., 2014. Determinants of residential building occupants’ behavior in sustainable living: a
questionnaire survey in Hong Kong. In: The European Conference on Sustainability, Energy and the
Environment. United Kingdom, 3-6 July 2014.
Hines, J. M., Hungerford, H. R. and Tomera, A. N., 1987. Analysis and synthesis of research on responsible
environmental behavior: a meta-analysis. The Journal of Environmental Education, 18(2), pp. 1-8.
İlter, D. and İlter, T., 2011. An overview of green building practice in Turkey. In: Management and Innovation
for a Sustainable Built Environment (MISBE 2011). The Netherlands, 20-23 June 2011.
Kamali, M. and Hewage, K. N., 2015. Performance indicators for sustainability assessment of buildings. In: 5th
International/11th Construction Specialty Conference. Vancouver, 8-10 June 2015.
Kats, G. H., 2003. Green building costs and financial benefits. USA: Massachusetts Technology Collaborative.
Kibert, C. J., 2002. Policy instruments for a sustainable built environment. Journal of Land Use &
Environmental Law, 17(2), pp. 379-394.
Kirk, J., 2010. Sustainable environments and pro-environmental behavior. Master. University of Nebraska.
Kollmuss, A. and Agyeman, J., 2002. Mind the gap: why do people act environmentally and what are the
barriers to pro-environmental behavior. Environmental Education Research, 8(3), pp. 239-260.
Kurisu, K., 2015. Pro-environmental behaviors. Japan: Springer.
Lynn, P., 2014. Distinguishing dimensions of pro-environmental behavior. UK: Economic and Social Research
Council Secondary Data Analysis Initiative.
McDonald, F. V., 2014. Developing an integrated conceptual framework of pro-environmental behavior in the
workplace through synthesis of the current literature. Administrative Sciences, 4, pp. 276-303.
Monfared, I. G. and Sharples, S., 2011. Occupants’ perceptions and expectations of a green office building: a
longitudinal case study. Architectural Science Review, 54(4), pp. 344-355.
Murakami, S., 2007. Promotion of sustainable buildings based on the paradigm of eco-efficiency. In: 6th
International Conference on Indoor Air Quality Ventilation & Energy Conservation in Buildings
(IAQVEC2007). Japan, 28-31 October 2007.
Nag, M., 2012. Pro-environmental behaviors in the workplace: is concern for the environment enough. PhD.
University of Maryland.
Pitt, W., Tucker, M., Riley, M. and Longden, J., 2009. Towards sustainable construction: promotion and best
practices. Construction Innovation, 9(2), pp.201-224.
Robichaud, L. B. and Anantatmula, V. S., 2011. Greening project management practices for sustainable
construction. Journal of Management in Engineering, 27(1), pp. 48-57.
Say, C. and Wood, A., 2008. Sustainable rating systems around the world. Council on Tall Buildings and Urban
Habitat Journal, 2, pp. 18-29.
Steg, L. and Vlek, C., 2009. Encouraging pro-environmental behaviour: an integrative review and research
agenda. Journal of Environmental Psychology, 29, pp. 309-317.
Stern, P. C., Dietz, T., Abel, T. D., Guagnano, G. A. and Kalof, L., 1999. A velue-belief-norm theory of support
for social movements: the case of environmentalism. Research in Human Ecology, 6(2), pp. 81-97.
Tapia-Fonllem, C., Corral-Verdugo, V., Fraijo-Sing, B. and Duron-Ramos, M. F., 2013. Assessing sustainable
behavior and its correlated: a measure of pro-ecological, frugal, altruistic and equitable actions.
Sustainability, 5, pp. 711-723.
Tsarenko, Y., Ferraro, C., Sands, S. and McLeod, C., 2013. Environmentally conscious consumption: the role of
retailers and peers as external influences. Journal of Retailing and Consumer Services, 20, pp. 302-310.
Turaga, R. M. R., Howarth, R. B. and Borsuk, M. E., 2010. Pro-environmental behavior. Annals of the New
York Academy of Sciences, 1185, pp. 211-224.
Whitfield, M., 2014. Performance in sustainable community developments: closing the gap between perception
and reality. Master. Boston Architectural College.
Williams, K. and Dair, C., 2007. What is stopping sustainable building in England? Barriers experienced by
stakeholders in delivering sustainable developments. Sustainable Development, 15, pp. 135-147.
Xiaoping, M., Huimin, L. and Qiming, L., 2009. A comparison study of mainstream sustainable/green building
rating tools in the world. In: International Conference on Management and Service Science (MASS ’09).
China, 16-18 September 2009.
Khalfan, M. M. A., Bouchlaghem, N. M, Anumba, C. J. and Carrillo, P. M., 2003. Knowledge management for
sustainable construction: the C-SanD project. In: Construction Research Congress. US, 19-21 March 2003.
Seoung-Wook, W. and Kim, S., 2015. Balanced sustainable implementation in the construction industry: the
perspective of Korean contractors. Energy and Buildings, 96, pp. 76-85.

785
Gorgolewski, M., 2006. The implications of reuse and recycling for the design of steel buildings. Canadian
Journal of Civil Engineering, 33(4), pp. 489-496.
Chan, A. P. C., Lam, P. T. I., Chan, D. W. M., Cheung, E. and Ke, Y., 2010. Critical success factors for PPPs in
infrastructure developments: Chinese perspective. Journal of Construction Engineering and Management,
136(5), pp. 484-494.

786
ID 032
CLIMATE CHANGE RISK ON INFRASTRCTURE AND POLICY
IMPLICATIONS OF APPROPRIATE MITIGATION MEASURES IN
THE NIGERIAN AGRICULTURAL SECTOR
S. Goyol, C. Pathirage and U. Kulatunga
School of the Built Environment, University of Salford, Salford, M5 4WT, UK
Email: [email protected]
Abstract: Agriculture a critical sector of the Nigerian economy contributes 26% to the
country’s GDP, and supports livelihoods by employing over 70% of the active population. The
importance of the sector for food security, poverty reduction and economic development has
been recognized. While population growth places increasing food demand and raw materials,
the sector will have to double its productivity to meet demand and this is highly dependent on
the availability of infrastructure. Infrastructure to support agricultural production and other
economic purposes are found to be inadequate and the few available are in poor conditions due
to inappropriate policy processes amongst others. The frequency and severity of climate
related events occurring as rapid onset and slow onset events are on the rise posing threats to
the few available infrastructures. This paper aims to analyse climate change risks on
infrastructure in the Nigerian agricultural sector through a review of existing of literature.
Findings reveal that policy and institutional processes at levels of authority significantly
influences the status of infrastructures at community levels which in turn contributes to
increased risks and impacts of climate change. Suggestions for infrastructure appropriation for
continuous capacity building can reduce risks from climate change, and improve resilience of
infrastructures in agrarian communities.
Keywords: Climate change, Impacts, Infrastructure, Risk, Policy
1. INTRODUCTION
Climate change, a change in the average climate patterns is a challenge experienced globally
with adverse impacts on almost all sectors of world economies. Climate change driven by
both natural and anthropogenic activities contributes to global warming with consequences of
rising temperatures, increased evaporation, heavy rains and storms, leading to extreme
weather events such as floods on one end and droughts on the other end of an extreme.
Climate change also increases the frequency and intensity of these extreme weather events
with adverse impacts globally. These are expected to have more impacts on developing
regions due to their limited capacity to adapt to adverse conditions (Sherman et al., 2016).
Nigeria, a tropical African country bounded by the Sahara desert to the north and the Atlantic
Ocean to the south experiences contrasting adverse climate related events ranging from
floods to droughts due to its location. Alongside, seasonal changes in weather patterns
influences the climate related events experienced as floods are experienced mostly during
rainy seasons and droughts in the dry season. These changes in weather and climate has
resulted to more frequent and severe floods mostly along coastal/ riverine areas, droughts
around the northern arid regions, prolonged dry spells, irregular precipitations, and water
scarcity (Elusoji, 2016; Olayide, 2016). This has led not only to personal and large economic
losses but huge impacts on critical infrastructure systems supporting everyday living thereby
a threat to economic development (Ebele & Emodi, 2016).

787
Infrastructures, referring to core services in the form of hard physical facilities and
organisational structures needed for the effective functioning of an economy, are at risk of
adverse effects of climate change. However particular emphasis are placed on infrastructures
in the agricultural sector; a critical sector which when affected will lead to high food
insecurity, and poverty (Boko et al., 2007; Ebele & Emodi, 2016). Agrarian communities also
known as rural communities that host agricultural activities are dependent on the availability
of infrastructure systems such as roads, electricity, and water for optimal productivity.
However these are grossly inadequate and the few available ones in poor conditions leading
to economic underdevelopment and decay (Ayinde, Falola, Babarinde, & Ajewole, 2016).
Infrastructures in rural communities are generally characterized by a state of low quality
and/or long periods of usage without maintenance (Sam, 2014). Growing populations and the
continuous use of the few available infrastructure systems reduces the resilience of such
systems thereby exposing them to multiple risks such as climate change. Infrastructure risk is
therefore the potential for losses due to the failure of infrastructure systems supporting
agricultural production.
The increasing incidences of climate change driven events and the inadequacy in terms of
quality and quantity of infrastructure systems to support agricultural production are major
challenges that can lead to a failure in the agricultural sector with resultant impacts on the
general economy. While little can be done to influence the changing weather and climate
conditions, policies and processes can be tailored towards safeguarding infrastructures from
loss/damage. Hence, infrastructure appropriation: the act of ensuring the adequacy of
infrastructures in terms of quality and quantity is critical for climate change risk and impact
reduction as well as improved resilience of infrastructures.
This paper aims to analyse climate change risk on infrastructure in the Nigerian agricultural
sector in order to highlight the importance of resilient infrastructures for impact and risk
reduction in agrarian communities. While extensive studies have been conducted on the
importance of infrastructure to agricultural and economic development (Ikeji, 2013; T.
Lawal, 2014), and limited research on the impacts of climate change on infrastructures such
as roads, buildings and irrigation facilities (Adewole, Agbola, & Kasim, 2015; Ede & Oshiga,
2014) research on how the condition of infrastructure can exacerbate climate change risks
and impacts are lacking. The main focus of this paper is on how institutional processes at
levels of authority influences the status of infrastructures which in turn increases
infrastructure risk to damage or loss by climate change so as to propose best practices for
improved resilience of infrastructure systems. Following a critical review of existing
literature, major climate related events experienced in Nigeria were identified and categorized
into rapid and slow onset events according to DWF’s (Development Workshop France)
classification of disasters. We examined the current and future impacts of these events on
infrastructure (transport systems, irrigation systems and agricultural services). We then
considered how institutional processes influence the status of infrastructures thereby exposing
them to further threats. The following sections of the paper are outlined thus. First is a
general overview of climate change and its related events in Nigeria. The second section
focusses on the impacts of climate change on critical infrastructure systems, particularly
transportation systems, irrigation systems and agricultural services. Thirdly, is critical
infrastructure status and factors influencing the status of infrastructure. Finally, the
conclusion and recommendations.

788
2. CLIMATE CHANGE & RELATED EVENTS IN NIGERIA
Climate is the general weather conditions of a place over a period of time. Climate change is
a shift in the average climate patterns as a result of increasing concentrations of greenhouse
gasses (GHG) due to natural or human activities GHGs such as carbon dioxide (CO2),
chlorofluorocarbon (CFCs), methane (CH4), and Nitrous oxide (N2O) contributes to global
warming resulting to high temperatures, higher rates of evaporation, drying of water bodies,
higher concentration/ condensation of atmospheric pressure, consequently falling back as
heavy rains. The concern about these alteration of weather patterns is that resultant climate
related events such as floods and droughts attributes to the frequency and intensity of natural
disaster globally (Holling, 1973; Pelling, 2010). Not only is there an increase in the
occurrence of these events but also its increasing impacts on the built environment and
socioeconomic activities.
Generally, temperature and rainfall projection in Nigeria reveals hotter and drier conditions.
Annual mean temperature increase of between 1-4oC is expected. Lower rainfalls are
expected towards the north however due to high evaporation and ocean currents, higher
rainfalls are expected towards the coast (B. J. Abiodun, Lawal, Salami, & Abatan, 2013).
Rainfall in particular is a major determinant to the occurrence of either floods or droughts
across the country (Fuwape, Ogunjo, Oluyamo, & Rabiu, 2016).Climate related events
commonly recorded in Nigeria include drought, epidemic, extreme temperature, flooding, and
storm (refer to Table 2).
Table 2: Climate Related Events in Nigeria 1900-2016 (EM-DAT IDD, 2017)
Event type Events count Total deaths Total affected
Drought 1 0 3,000,000
Epidemic 42 23,978 304,436
Extreme temperature 2 78 0
Flood
44 1493 10,478,919
Storm 6 254 17,012
Nigeria a tropical African country is particularly vulnerable to climate related events ranging
from droughts on one end and floods on the other end of the extreme driven by climate
change. Floods record the highest frequency as well as the highest impact. Droughts on the
other hand have the least frequency of occurrence yet a very high impact in terms of the
number of people affected. Flooding is recorded almost annually in recent years due to the
continuous rise in sea levels threatening coastal towns as well as infrastructures located in
those regions (Davis, 2013). Droughts formerly linked to only the north-eastern region of the
country is gradually experienced in other parts of the country as prolonged periods of
precipitation deficiency leads to water shortages (Gwamzhi, Dongurum, Dabi, & Goyol,
2013). Warmer temperatures are increasingly experienced and new temperature records are
set (Eludoyin, Adelekan, Webster, & Eludoyin, 2014). Changing rainfall patterns: late onset
of rains, irregular and erratic rains often accompanied by storms are continuously recorded
(Lawal et al., 2016).

789
Climate change and its related events can exhibit as rapid onset events or slow onset events
(refer to Figure 27). Rapid onset events include floods, epidemics, and storms; while slow
onset events include extreme temperatures, and droughts.
Figure 27: Classification of Climate Related Events
Whether rapid onset events such as floods or slow onset events such as droughts, both are on
the increase and have impacts not only on individuals, communities and livelihoods, but also
on infrastructures (Imo, 2014). As such, while studying the frequency and occurrence of
climate related event is important, likewise the impacts of these events on critical
infrastructures.
3. CLIMATE CHANGE IMPACTS ON CRITICAL INFRASTRUCTURE
Climate change and its associated events either occurring as rapid onset events such as floods
or slow onset events such as droughts are on the increase and projections reveals that more
will be experienced in the coming years. They have impacts on both human and
socioeconomic activities thereby affecting the general economic development of a nation.
These have negative implications for critical infrastructures such as roads, and bridges,
irrigation systems, as well as agricultural services resulting in negative effects on water
sources, disruption of services, the spread of epidemics from plant pests and diseases and
lower rates of food production. This section focuses on the impacts of different climate
related events namely: floods, drought, storms, extreme temperature and changing rainfall
patterns on transportation systems, irrigation systems and agricultural services.

790
3.1 Impacts on Transportation Systems
Transportation systems to include but not restricted to roads, culverts, drainages and bridges
are vulnerable to the impacts of climate change. Roads transportation occupies over 75% of
total movements in Nigeria (FRSC, 2015). The development of new roads or an improvement
of existing ones have a strong correlation on improved agricultural production (Laurance et
al., 2014). Roads contributes to the increase in agricultural production by easing the
movement of inputs and workers to farms and the transportation of produce from farms to
markets (Binswanger-Mkhize & Savastano, 2017). The lack of good road network or a
disruption in the system affects production rates and commuters wellbeing.
Rapid onset events such as floods of all kinds either coastal or flash floods have impacts on
transportation systems. Coastal floods and storm surges can affect roads and bridges as
salinity can speed up the rate of deterioration in road surfaces as well as concrete
reinforcements. The 2012 floods in Nigeria brought to prominence the vulnerability of
transportation system to impact of climate change. In parts of Plateau state, heavy rains
resulting to flooding washed out the top soil, weakened drainages and culverts. Roads and
bridges were destroyed cutting off communities and hindering recovery efforts to affected
places (Umweni, 2014). This led to the loss of lives, properties and livelihoods as well as the
disruption of services. Commuters were forcing to take longer routes at a higher cost or
journey on canoes with uncertainty of getting to their destinations in safety (Plateau News
update, 2012). This had huge impacts on agricultural production as low yields were recorded
due to farmer’s inability to access and move farm inputs such as fertilizers. The
transportation of farm produce from farms to markets was also affected leading to large
quantities of food waste. Though road transportation was crippled, new opportunities to a
new source of income emerged for canoe operators (Times, 2012).
Droughts on the other end, either hydrological, meteorological or socioeconomic, can change
the morphology of the land. Drought as a result of heat and rainfall changes can alter
moisture balance consequently influencing the deterioration of road pavements. Cracks on
road surfaces as a result of heat and subsequent water percolation into cracks causes potholes.
The implication of droughts on road and bridges is that high heat and lack of moisture can
leads to the gradual caving in of the land area thereby affecting designs and constructions
under the initial land conditions. Extreme heat softens asphalts and expands bridge joints;
heavy freight under these conditions damages road surfaces, and bridges respectively. Its
nature reveals their vulnerability and makes them liable to destruction by adverse conditions.
3.2 Impacts on Irrigation Systems
Irrigation is an agricultural practice to augment for water supply for crop growth during
periods of insufficient rainfall. Water for irrigation purposes are sourced from dams, tube
wells, wash bores and boreholes: collectively referred to irrigation infrastructures. Sourcing
water for agricultural purposes from these systems is increasingly difficult as both slow and
rapid onset climate events affect their functioning (Binswanger-Mkhize & Savastano, 2017).
Heavy rains and floods accompanied by surface run-off deposits sand, silt and mud blocking
irrigation systems. Wash bores drilled on shallow alluvial aquifers along river beds to source
for underground water and wells can completely be blocked leaving farmers with no option
but to recover by drilling new wash bores for the next planting season and re-dig the wells

791
(Umara, 2010). This affects the farmer’s income levels. Small earth dams are commonly
constructed by impoundment of river basins to collect water for agricultural purposes. The
increasing demand for water resources has led to the construction of both concrete and earth
dams which are used for either irrigation, water supply, hydropower generation or a
combination.
Increase in temperature, evaporation and consequent droughts results in water shortages and
lower water levels affecting the availability of water for irrigation. According to Olagunju
(2015) droughts depletes not only surface and ground water but also affects land and
environmental conditions. Rasul and Sharma (2016) opined that water shortages due to
climate change among others, affects water levels of dams for irrigation and hydro-energy
generation. The interdependencies between these two sectors is that the hydro-energy
generated is in turn used to power irrigation facilities and run small scale food processing
industries. For instance the six (6) dam sites used by Nigerian Electricity Supply Corporation
(NESCO) for electricity generation in Plateau state is at risk of water shortages due to climate
change (FMPS, 2006) . Communities where these dams are located also use these water
sources for irrigation and other purposes. This will trigger competition for water resources
between the energy sector and the agricultural sector. Other critical sectors interdepending on
the water sector can also be affected by water shortages.
3.3 Impacts on Agricultural Services
Climate change has impacts not only on hard physical infrastructures such as transportation
and irrigation systems but also on soft infrastructure services that support agricultural
production. Here agricultural services includes but not limited to research and development
(R&D) and extension services. Agricultural services provide support to meet the increasing
demand from growing populations, through educational methodologies, technology transfer
and advisory services. However climate change can challenge agricultural research and
services.
Floods, excess rains and moisture supports the germination of fungi and bacteria as they
thrive under damp conditions (Delcour, Spanoghe, & Uyttendaele, 2015). Rising temperature,
high evaporation rates and changing rainfall patterns leading to warmer conditions causes
genetic changes in pathogens making them develop resistance and contributing to the
emergence of new or the spread of existing diseases (Delcour et al., 2015; Elad & Pertot,
2014; Sable & Rana, 2016).
Multiple and interconnected infrastructure systems ranging from telecommunications,
transportation, and electricity can affect agricultural services in one way or the other. For
instance, chemical agents such as pesticides, insecticides and herbicides acquired from input
and extension services require optimal storage condition in order to get to the farmer in good
quality. These conditions range from cool room temperature, dry environment and away from
sunlight. The movement of these chemicals from the point of supply to the point of demand is
critical in guaranteeing its quality. The storage conditions in most cases are not adhered to
and the local farmer does not have the means to check the effectiveness of the agents before
being administered. The poor quality of roads and vehicles are likely to make the journey
longer and transportation will have an impact on the conditions of the chemical agents.

792
In another scenario, the administration of chemical agents is suitable non-rain days. The lack
of early warning weather systems and weather information mechanisms greatly affects the
functionality of chemical doses administered. Local farmers often rely on local knowledge to
predict rainy and non-rain days (Kijazi, Chang'a, Liwenga, Kanemba, & Nindi, 2013).
Uncertainties from climate change will challenge rainfall predictions from local knowledge
(van Wilgen, Goodall, Holness, Chown, & McGeoch, 2016). Other times chemicals applied
based on predictions from local knowledge are washed off leaving the farmer with no option
than to re-administer the doses at a later date. Low-income farmers might not be able to
afford another round of chemical agents. Farmers who have successfully curtailed the
infestation on their farms are at risk of re-infestation from farms that have not been able to
complete the treatment of such diseases.
Both rapid onset and slow onset events have impacts on transportation and irrigation
infrastructures systems and disrupt agricultural services. The increasing frequency and
resultant impacts of these events can reduce infrastructures life span. In assessing the impacts
of climate change, though the frequency, intensity and severity of these events are a threat to
infrastructures, the conditions or design of such infrastructures are important factors driving
impacts. The next section focuses on the status of infrastructures and factors affecting the
status of infrastructures at community levels.
4. CRITICAL INFRASTRUCTURE STATUS IN NIGERIA
Nigeria is increasingly becoming a society with multiple infrastructural challenges ranging
from power blackouts due to power failure, transportation gridlock due to poor transportation
network (Steven, O'Brien, & Jones, 2014; Yapicioglu, Mogbo, & Yitmen, 2017). These were
ones seen as unfamiliar situations but in recent years are becoming common circumstances.
Nigerian economy has experienced very little growth in the recent years due to poor
productivity, this is however, strongly linked to the lack of infrastructural needs to support
optimal productivity. The lack of or poor state of infrastructure for improved agricultural
production increases the risk propensity of infrastructures to adverse climate change.
Appropriate infrastructure particularly to the rural areas is critical for sustainable agricultural
development and the economic advancement of a country. Infrastructures such as roads,
bridges and irrigation systems play a vital role in the physical and socioeconomic
development of not only individuals and but communities as a whole. (Ibem 2009) regards
such infrastructures as essential assets that enable, sustain and enhance societal living
conditions. As such they facilitate the production of goods and services, the distribution of
finished products to markets, and the provision of basic social services.
The provision and maintenance of critical infrastructures which includes transportation and
irrigation systems has solely been the responsibility of the three (3) tiers of government
(federal, state, and local government) until in recent years when public private partnership
has become common due to policy changes in national economy (Udoka, 2013). More than
80% of infrastructures are provided by the government through ministries, agencies, and
government parastatals saddled with the responsibility of providing public services to the
teaming population. However, the conditions of infrastructures such as roads are in
deplorable states, characterized by large potholes, gullies, and reduced road width due to
eroded road shoulders.

793
The limited design of infrastructures including roads, bridges and irrigation systems exposes
of such infrastructures to impacts from extreme weather. For instance, Roads in agrarian
communities are mostly unpaved feeder roads, characterized by laterite surfaces, heavy rains
coupled with poor drainage, therefore the top soil is washed off. Water logging is experienced
mostly at the peak of the rainy season though not necessarily as a result of heavy rains but
consistent rains for days the soil becomes saturated with water thereby making roads un-
motorable. Also traditional earth dams commonly constructed for agricultural purposes are
more or less temporary structures which can easily be destroyed leading to dam breaks due to
the material and nature of construction (Stephens, 2010). They are liable to dam leaks and
water seepage which will lead to higher rates of water loss as compared to a properly
constructed dam. Ebele and Emodi (2016) observed that weak infrastructure systems which
are already at risk to adverse conditions are liable to damage or loss and disruption in
services.
5. FACTORS INFLUENCING INFRASTRUCTURE STATUS IN NIGERIA
In recent year, government policies adjusted to involve private partnership in infrastructure
provision in the country. Though PPP (public private partnership) provides about 15% of
infrastructure provision which is yet to be fully been implemented (Adeyinka & Olugbamila,
2015), government still remains the main provider. Despite these efforts, the state of
infrastructure has continuously been a thing of concern for sustainable development in
Nigeria. Existing Literature such as Nchuchuwe and Adejuwon (2012), Agber, Iortima, and
Imbur (2013), Agber et al. (2013), Abiodun, Akintoye, Liyanage, and Goulding (2013),
Gbadebo and Olalusi (2015) have identified a number of factors that influence the status of
infrastructures in Nigeria (refer to Figure 28).

794
Figure 28: Factors Influencing Infrastructure Status
First, the poor state of infrastructure in Nigeria is as a result of financial constraints.
Underfunding and inadequate budgetary allocation by the government as well as the high cost
of infrastructure provisioning has led to inadequate number of infrastructures in Nigeria.
Nchuchuwe and Adejuwon (2012) observed that government’ activities reveal that priority in
policy formulation and resource allocation is accorded to urban areas at the expense of the
rural agrarian areas. For instance, more than 70% of good paved roads are located in urban
areas in Nigeria. As resources are meagre, the number of projects awarded will be less
thereby affecting the available quantity of infrastructures most of which are not in favour of
agrarian communities.
Secondly, weak institutional management as a result of lack of technical capacities,
continuous employment of the traditional method of infrastructure procurement, lack of
monitoring and evaluation alongside poor maintenance strategies.
Thirdly, weak, inconsistent and incompatible policies/programs influence the status of
infrastructures at community levels. This leads to conflicting roles and a lack of synergy
between different programs/projects of the 3 tiers of government. The relationship between
existing institutions and the local community is important for the realization of the set roles
for programs and projects.
Fourthly, is undue political interference. Political instability resulting to change in
government has led to short duration of policies and programs as well as uncompleted
FACTORS AFFECTING INFRASTRUCTURE
STATUS
FINANCE
INSTITUTIONAL
MANAGEMENT
POLICY
POLITICAL
INTERFERENCE
CORRUPTION
Insufficient Funds Inadequate Budgetary Allocation Underfunding High cost of Infrastructure Provision
Lack of Technical Capacities Traditional method of procurement Lack of Monitoring and Evaluation Poor Maintenance Strategies
Weak, Incompatible and Inconsistent Policies Lack of Clear Goals Conflicting roles Lack of Synergy
Political Instability Short duration of Policies/Programs Politics of the Project
Delays Embezzlement Misappropriation Lack of Funds Abandoned Projects

795
projects without full accountability. Political office holders award infrastructure contracts to
friends and associates who are not trained to execute projects. This affects the final outcome
such projects.
Finally, Corruption leads to delays, embezzlement, misappropriation and lack of funds to
pursue specific policy/program to an expected end. Due to corruption, the quantified cost of a
project at the point of execution is mostly not commiserating with the funds approved at the
points of decision (Egharevba & Chiazor, 2013). This affects the designs of infrastructures as
standards are not adhered to. Corruption is a major factor that foils almost all the factors
influencing the state of infrastructure in Nigeria.
6. CONCLUSION AND RECOMMENDATION
Infrastructures (transport, irrigation and agricultural services) supporting agricultural
production is in deficit and the few available ones are in poor condition. Climate change and
its related events (droughts, floods, storms, extreme temperature, changing rainfall patterns
and epidemics) will have future implications on the current state of infrastructures which will
further weaken efforts towards improving agricultural production. Evidence reveals human
influence through complicated institutional processes contributes to climate change risks and
impacts as such the availability of appropriate infrastructures can reduce risk and impacts.
Though infrastructures are located and function within communities, planning decisions for
its provision are made by the government at levels of authority. It is recommended that
infrastructure providers which are the 3 tiers of government (federal, state and local) as well
private providers incorporate standards into the plan, design, operation and maintenance of
infrastructures. Legal systems should be put in place to check corruption and undue political
interference. Government budgetary allocation should accord priority to the infrastructure
sector as well as rural agrarian communities. For improved resilience of infrastructures,
periodic maintenance of roads and irrigation systems, reinforcement of bridges, renewal of
stressed systems and redundant systems to ease stress on overused systems.
7. REFERENCES
Abiodun, Akintoye, A., Liyanage, C., & Goulding, J. (2013). Developing a decision model for PPP
implementation towards a sustainable highway development and operation in Nigeria. Paper presented at
the Proceedings of the International Conference on Public Private Partnerships Body of Knowledge.
Abiodun, B. J., Lawal, K. A., Salami, A. T., & Abatan, A. A. (2013). Potential influences of global warming on
future climate and extreme events in Nigeria. Regional Environmental Change, 13(3), 477-491.
Adewole, I. F., Agbola, S., & Kasim, O. F. (2015). Building resilience to climate change impacts after the 2011
flood disaster at the University of Ibadan, Nigeria. Environment and Urbanization, 27(1), 199-216.
Adeyinka, S., & Olugbamila, M. O. (2015). Public private participation for infrastructure in developing
countries. Academic Journal of Interdisciplinary Studies, 4(2), 11.
Agber, T., Iortima, P., & Imbur, E. (2013). Lessons from implementation of Nigeria’s past national Agricultural
Programs for the Transformation Agenda. American Journal of Research Communication, 1(10), 238-253.
Ayinde, O., Falola, A., Babarinde, O., & Ajewole, O. (2016). EMPIRICAL ANALYSIS OF POVERTY AND
AGRICULTURAL GROWTH IN NIGERIA.
Binswanger-Mkhize, H. P., & Savastano, S. (2017). Agricultural intensification: the status in six African
countries. Food Policy, 67, 26-40.
Boko, M., Niang, I., Nyong, A., Vogel, C., Githeko, A., Medany, M., . . . Yanda, P. (2007). Africa.
Davis, R. (2013). Nigeria Floods and Flooding.
Delcour, I., Spanoghe, P., & Uyttendaele, M. (2015). Literature review: Impact of climate change on pesticide
use. Food Research International, 68, 7-15.

796
Ebele, N. E., & Emodi, N. V. (2016). Climate Change and its Impact in Nigerian Economy. Journal of Scientific
Reserach and Reports, 10(6), 1-13.
Ede, A. N., & Oshiga, K. (2014). Mitigation Strategies for the Effects of Climate Change on Road
Infrastructure in Lagos State. European Scientific Journal, ESJ, 10(11).
Egharevba, M. E., & Chiazor, A. I. (2013). Political corruption and national development in Nigeria.
International Journal of Social Sciences and Humanities Review, 4(1).
Elad, Y., & Pertot, I. (2014). Climate change impacts on plant pathogens and plant diseases. Journal of Crop
Improvement, 28(1), 99-139.
Eludoyin, O., Adelekan, I., Webster, R., & Eludoyin, A. (2014). Air temperature, relative humidity, climate
regionalization and thermal comfort of Nigeria. International Journal of Climatology, 34(6), 2000-2018.
Elusoji, S. (2016). Nigeria: The Burden of Climate Change. This Day.
FMPS. (2006). Renewable Electricity Action Program (REAP). Nigeria.
Fuwape, I., Ogunjo, S., Oluyamo, S., & Rabiu, A. (2016). Spatial variation of deterministic chaos in mean daily
temperature and rainfall over Nigeria. Theoretical and Applied Climatology, 1-14.
Gbadebo, M. A., & Olalusi, O. C. (2015). Critical Factors Affecting Development of Infrastructure in Nigeria.
International Journal of Advances in Mechanical and Civil Engineering, 2(1).
Gwamzhi, R., Dongurum, C., Dabi, D., & Goyol, S. (2013). Vulnerability of Rural Households in Northern
Nigeria to Climate Change and Food Security. Journal of Envinmental Sciences, 16(1&2), 166-178.
Holling, C. S. (1973). Resilience and stability of ecological systems. Annual review of ecology and systematics,
1-23.
Ikeji, C. (2013). Rural infrastructural development in Nigeria: Policies and implementation strategies.
Developing Country Studies, 3(6), 122-128.
Imo, J. E. (2014). Slow Response to Climate Change in Nigeria: Need for Urgent and Comprehensive Action.
Studies in Social Sciences and Humanities, 1(1), 19-29.
Kijazi, A., Chang'a, L., Liwenga, E., Kanemba, A., & Nindi, S. (2013). The use of indigenous knowledge in
weather and climate prediction in Mahenge and Ismani wards, Tanzania. Journal of Geography and
Regional Planning, 6(7), 274.
Laurance, W. F., Clements, G. R., Sloan, S., O’connell, C. S., Mueller, N. D., Goosem, M., . . . Balmford, A.
(2014). A global strategy for road building. Nature, 513(7517), 229-232.
Lawal, Abatan, A. A., Angélil, O., Olaniyan, E., Olusoji, V. H., Oguntunde, P. G., . . . Wehner, M. F. (2016).
The Late Onset of the 2015 Wet Season in Nigeria. Bulletin of the American Meteorological Society,
97(12), S63-S69.
Lawal, T. (2014). Local government and rural infrastructural delivery in Nigeria. International Journal of
Academic Research in Business and Social Sciences, 4(4), 139.
Nchuchuwe, F. F., & Adejuwon, K. D. (2012). The challenges of agriculture and rural development in Africa:
the case of Nigeria. International Journal of Academic Research in Progressive Education and
Development, 1(3), 45-61.
Olagunju, T. E. (2015). Drought, desertification and the Nigerian environment: A review.
Olayide, O. E. (2016). Assessing the Impact of Climate Change on Adaptation for Evidence-based Policy and
Susutainable Development in Nigeria. Retrieved from
Pelling, M. (2010). Adaptation to climate change: from resilience to transformation: Routledge.
Rasul, G., & Sharma, B. (2016). The nexus approach to water–energy–food security: an option for adaptation to
climate change. Climate Policy, 16(6), 682-702.
Sable, M., & Rana, D. (2016). Impact of global warming on insect behavior-A review. Agricultural Reviews,
37(1), 81-84.
Sam, I. O. (2014). Achieving sustainable poverty reduction and rural development in Nigeria through local
economic development strategies. American Journal of Rural Development, 2(1), 13-19.
Sherman, M., Berrang‐Ford, L., Lwasa, S., Ford, J., Namanya, D. B., Llanos‐Cuentas, A., . . . Harper, S. (2016).
Drawing the line between adaptation and development: a systematic literature review of planned adaptation
in developing countries. Wiley Interdisciplinary Reviews: Climate Change, 7(5), 707-726.
Stephens, T. (2010). Manual on small earth dams: a guide to siting, design and construction: Food and
Agriculture Organization of the United Nations (FAO).
Steven, D., O'Brien, E., & Jones, B. D. (2014). The New Politics of Strategic Resources: Energy and Food
Security Challenges in the 21st Century: Brookings Institution Press.
Times, P. (2012). Floods cause Plateau South Residents to Use Canoe for Transport. Premium Times.
Udoka, I. S. (2013). The Imperatives of the Provision of Infrastructure and Improved Property Values in
Nigeria. Mediterranean Journal of Social Sciences, 4(15), 21.
Umara, B. (2010). The State of Irrigation Development in Nigeria. Irrigation in West Africa: Current Status and
a View to the Future, 243.

797
Umweni, O. J. (2014). Breaking construction boundaries through the use of a novel deployable bridge. Breaking
Boundaries 2014, 38.
van Wilgen, N. J., Goodall, V., Holness, S., Chown, S. L., & McGeoch, M. A. (2016). Rising temperatures and
changing rainfall patterns in South Africa's national parks. International Journal of Climatology, 36(2), 706-
721.
Yapicioglu, B., Mogbo, O. N., & Yitmen, I. (2017). Innovative Strategies for Transport Policies in Infrastructure
Development: Nigerian Stakeholders’ Perspective. International Journal of Civil Engineering, 1-15.

798
ID 041
TOWARDS A CONCEPTUAL INTEGRATED FRAMEWORK FOR
SUSTAINABLE RURAL DEVELOPMENT PROJECTS IN NIGERIA
B. David and C. Udeaja
School of the Built Environment, University of Salford, Salford, M5 4WT, UK
Email: [email protected]
Abstract : Over the years, National Governments in Developing countries have invested
heavily in implementing development projects in rural areas. This is in a bid to ensure that
economic activities in these areas are promoted and the general livelihood of rural dwellers are
improved in line with the Sustainable Development Goals (SDGs). Rural development
projects have not stood the test of time because of poor planning, implementation and
sustainability practices. The dearth of facilities in the rural areas is a major factor that has
brought about unprecedented rural-urban migration which has resulted in the over-population
of urban areas.
As the implementation of the Sustainable Development Goals commences globally, a key
focus of the Goals is the development of robust monitoring & evaluation Systems that will
promote accountability and sustainability of projects. The aim of this paper is to conceptualize
an Integrative framework for the Planning and Implementation of sustainable rural
development projects. This exploratory research studies seeks to conceptualize project themes
related to the planning and implementation of sustainable rural development projects and to
evaluate the methodologies involved in the Design, Implementation, Monitoring, Evaluation
and Supervision of projects and programmes targeted at people living in rural and undeserved
areas.
Keywords: Conceptual Integrative Framework, Nigeria Government, Rural Development
Projects and Sustainable Development.
1. INTRODUCTION AND BACKGROUND
Rural development has for long been given the back seat in terms of funding, planning and
implementation. A major void can be currently noticed in rural development as rural areas are
being left behind in development. There is a dearth of sustainable rural projects which can be
noticed in the variation of indices between rural and urban areas. A 2015 world Bank report
highlights that only 23% of rural dwellers in Sub Saharan Africa(SSA) have access to
improved sanitation facilities in contrast to 67.5% average of people with access to improved
sanitation facilities worldwide. Also, only about 56% of the rural population in Sub Saharan
Africa have access to improved water sources as against the global average of 96.5% of urban
dwellers who have access (World Bank, 2016). With the above, rural development has
become an imperative for SSA countries like Nigeria.
In some cases, projects are implemented in the rural areas but they have since failed for so
many reasons. For example, a 2014 project mapping study carried out in Bayelsa State of
Nigeria (a largely riverine state with over 80% made up of rural communities) showed that of
the 1,527 projects identified and captured, 563 representing 37% of the implemented projects
were found to be Non-functional. These projects include Education, Health, Water &
Sanitation projects amongst others (OSSAP-MDGs, 2014).

799
Moving ahead, it is pertinent to have a grasp of the concept of development projects as the
terminology could also be used in reference to Software development in the computer science
field. For the purpose of this study, the term ‘development project’ is restricted to Human and
Economic development. Hirschman defines development projects as units of public
investments that bring about the direct involvement of political authorities and are seen as
major components of the entire development process (Hirschman, 2014). Likewise, Gittinger
also defines projects as ‘an investment activity in which financial resources are expended to
create capital assets that produce benefits over an extended period of time’ and development
project as the ‘smallest operational elements prepared and implemented as a separate entity in
a national plan or programme’(Gittinger, 1982).
Rural development programmes and initiatives exist in different forms. Education,
Entrepreneurship, physical infrastructure and social infrastructure are important components
in rural community development (Rowley, 1996). Rural development programmes could also
involve the provision of material and technical assistance to rural communities and villages to
improve the quality of their lives, socially and economically (Akyurek, 1985).
Till date, several attempts have been made in formulating rural development frameworks by
Governments, International development organizations, Non Governmental Organizations
and Private Organizations; mostly as corporate social responsibility initiatives. In 2003, under
the Food and Agriculture organization, a conceptual framework for National agricultural,
rural development and food security strategies and policies was developed. Aimed at
promoting food security through agricultural and rural development, the authors of the
framework highlighted lack of will power, poor implementation and inability to effectively
monitor the impact of the framework as drawbacks of the framework. (FAO, 2003).
Likewise in South Africa, a comprehensive rural development framework was set up to be an
effective response against poverty and food insecurity by maximizing the use and
management of Natural resources to create vibrant, equitable and sustainable rural
communities (MRDLR, 2009). A further review of this framework by Impact Economix in
2013 revealed various gaps in the framework such as; weak institutional arrangements and
planning processes, absence of a collaborative procurement process, low level community
mobilization, lack of an approach to targeting vulnerable groups, the need to improve value
for money and sustainability amongst others (Impact Economix, 2013)
The aforementioned frameworks amongst many others provide evidence on the need to
develop an integrative framework for sustainable rural development projects. This research
work provides a premium opportunity to advance research and knowledge in rural
development and it’s accompanying systems. Accordingly, this paper aims to explain the key
concepts involved in the planning and implementation of sustainable rural development
projects and propose a conceptual framework towards the implementation of sustainable rural
development projects in Nigeria
2. RURAL DEVELOPMENT IN NIGERIA
This section seeks to explore various policies and institutions that have been established till
date and also bring to the fore current practices in rural development. To address monumental
development deficits in Nigeria, successive Governments have since independence created
and implemented development plans. Till date four plans and a development strategy have
been rolled out. Table 1 below shows the plans and their timeline.

800
Table 1: Nigeria’s National Development Plans (Iheanacho, 2014).
S/N PLAN TIMELINE
1 The First National Development Plan 1962
2 The Second National Development Plan 1970-1974
3 The Third National Development Plan 1975-1980
4 The Fourth National Development Plan 1981-1985
The civilian Government of President Olusegun Obasanjo also introduced the National
Economic Empowerment Development Strategy(NEEDS) in 2004. The NEEDS was
designed as a home grown strategy geared towards sustainable poverty reduction,
employment generation, wealth creation and value oriented economy (Obasanjo, 2004).
The major objective of the first National Development Plan was to maintain and if possible,
surpass an average annual growth rate of 4% of GDP. This was majorly to be achieved by
allocating over 70% of Federal Government capital expenditure towards economic
development expenditure (Forrest, 1968). A major reason for the failure of this plan was the
‘elitist’ approach it took. This statement was further collaborated by (Okowa, 1982) who
expressed that only 6% of planned investment of infrastructural facilities was allocated to the
rural sector as compared to over 90% allocated to the urban sector. Furthermore, The second
National Development plan was aimed at building a strong, united and self-reliant country.
Although the objectives of the plan suggested a balance for the rural and urban sectors, those
were mere political posturing as the plan focused on large scale industrial development
thereby leaving out small scale industrial development (Ejumudo, 2013). The first and second
development plans can be viewed from an urban theoretical point of view.
According to (Iheanacho, 2014), The third National development plan first presented the
platform for priority to be given to projects and programmes that impacted positively and
directly on the lives of rural dwellers. This was however conflicted by the very small
allocations given to agriculture and social development schemes. The agriculture and Social
Development schemes (Education, Housing, Health, Welfare etc.) only received 5% and 11%
and these sectors were crucial to the improvement of the living conditions of the rural
populace (Okigbo, 1989). This purportedly led to a negative growth of 2.1% of the
agricultural sector while the ‘urban sectors’ such as the manufacturing sector recorded the
fastest growth with an average of 18.1% per annum; building and construction grew at 13.9%
(Egonmwan and Ibodje, 2001). The fourth National development plan took a similar posture
to the third national development plan. The major differences were that increased fund
allocations were made to the sub sectors and the objectives were enlarged and became more
defined. Unfortunately, the implementation of the plan was marred by falling oil prices in the
oil market (Ayo, 1988)
Several other reasons have been identified for the failure of these development plans which
include but not limited to: Corruption, Lack of plan discipline, Lack of commitment, Absence
or relevant data, over ambitious development plans, Lack of continuity of Government plans
etc. (Iheanacho, 2014). These reasons have thus far shown to be the reason why no

801
comprehensive rural development plan or strategy has been developed for Nigeria, merely
programmes and schemes. For example, between 1973 and 2000, the federal government of
Nigerian launched five rural development programmes and over eight supportive schemes
(Akpomuvie, 2010). A break down of some of these schemes and the year of their launch is
shown in the table below.
Table 2: Rural Development Schemes in Nigeria (Paul et al, 2014).
S/N PROGRAMME YEAR
1 National Accelerated Food Production Programme and the
Nigeria Agricultural and Cooperative Bank.
1972
2 Operation Feed the Nation: to teach the rural farmers how to
use modern farming tools.
1976
3 Green Revolution Programme: to reduce food importation
and increase local food production.
1979
4 Directorate of Food, Roads and Rural Infrastructure
(DFFRI).
1986
5 National Directorate of Employment (NDE). 1987
6 Family Support Programme and the Family Economic
Advancement Programme.
1993
7 National Poverty Eradication Programme (NAPEP) to
replace the previously failed Poverty Alleviation Programme
2001
8 National Economic Empowerments and Development
Strategy. (NEEDS). (Paul et al, 2014).
2004
It is important to note that these schemes were majorly interventionist programmes with little
or no plans to promote and ensure sustainable development of rural areas in Nigeria. The
continuous re-christening of some of these schemes without the consideration of economic
realities and their non-articulation have been identified as major reasons for the failure of
these schemes (Jonathan, 2014). For example, Operation feed the Nation was re-christened
to Green revolution. Other reasons attributed for the failure of these schemes include; weak
industrial base, limited social amenities, dependence on small scale farming, deficiency of
skilled technical, management and entrepreneurial labour force (Isigwe et al, 2014).
Presently, the Federal Ministry of Agriculture and rural development is charged with the
mission of ensuring rural development in Nigeria. Notwithstanding, Ministries, Departments
and Agencies implement projects relevant to rural areas in Nigeria. Some of these ministries
are; The Federal Ministry of Education- Construction of classroom blocks and supply of
learning and instructional materials to schools etc, Federal ministry of Water resources-
Water and sanitation facilities in communities nationwide, Federal Ministry of Health-
Construction of Primary Health care centres, supply of essential drugs and equipment etc.

802
3. CONCEPTUALIZING THE FRAMEWORK FOR SUSTAINABLE RURAL
DEVELOPMENT PROJECTS
3.1 What is Sustainable Rural Development?
Sustainable rural development entails the continuous progression of the livelihoods and
economic indices of rural dwellers. More succinctly, the Centre for Sustainable Development
defines Sustainable rural development as “improving the quality of life for the rural poor by
developing capacities that promote community participation, health and education, food
security, environmental protection and sustainable economic growth, thereby enabling
community members to leave the cycle of poverty and achieve their full potential”(CSD,
2017). This approach brings to the fore the fact that sustainable rural development is a
continuum and not a stop gap measure. Furthermore, the need to achieve sustainable
development in rural areas is intertwined in our understanding of the interrelations of the
economy, society, environment and politics (Sachs, 2015).
3.2 Planning and Implementation of Rural Development Projects in Nigeria
As with most developing countries, Nigeria has witnessed little development in it’s rural
areas over the last two decades. This can be attributed to the failure of past rural development
programmes, the neglect of ‘rural’ sectors such as Agriculture and the ever increasing rural-
urban Migration the country is witnessing. The Local Government Authorities are
empowered by the 1976 local Government reform to ensure rural development as a major
function. Nonetheless, the three tiers of Government implement rural development projects
through various platforms. At the Federal Government level, Line Ministries, Departments
and Agencies and regional ministries like the Ministry of Niger Delta implement projects
using a budgetary method approach. This section will focus on Project Planning and
implementation using the Nigeria Millennium Development Goals Office as a case study.
The Nigerian Millennium Development Goals(MDGs) Office (now known as the Sustainable
Development goals office following the adoption and subsequent roll out of the Sustainable
Development Goals) was charged with the fast tracking of the achievement of the MDGs in
Nigeria. Utilizing a tripartite partnership arrangement called the Conditional Grants Scheme,
states and Local Governments in Nigeria in Nigeria were invited to submit designed project
proposals for specific development projects in their constituencies. The proposals were
approved based on them possessing certain indicators like stakeholder inclusion, viability etc.
On approval, Projects and programmes were implemented by local contractors in the mostly
rural locations.
The MDGs Office project planning and implementation structure stood out from previous
programmes due to the presence of a comprehensive independent Monitoring, Supervision
and Data Collection(MSD) framework. This ensured that projects were implemented using a
strict timeline and with the right quality/quantity of materials. As a major breakaway from the
traditional OPEN M&E in Nigeria, the MSD helped improve project implementation rates
drastically. Using the annual budgeting methods, the federal, state and local Governments
implement rural development projects ranging from rural feeder roads to Primary health care
centers to rural electrification, water supply systems etc. However, there is the urgent need to
stop the failure of already implemented rural projects and design a framework to help
promote sustainable rural development projects for future interventions.

803
3.3 Conceptualizing the Framework
Frameworks can generally be divided into conceptual, practical and theoretical types. A
conceptual framework utilizes concepts to proffer a solution to a problem (Hicks, 1991).
(Crossan, 2003) further explains a conceptual framework as one that can be represented using
a graphic or narrative format. The conceptualized framework shows the main concepts to be
studied, key factors and the supposed relationship between them. (Delueze et al, 1991)
describe a concept as having components and being defined by them. (Jabreen, 2009) further
defines a conceptual framework as: “a network, or “a plane,” of interlinked concepts that
together provide a comprehensive understanding of a phenomenon or phenomena. The
concepts that constitute a conceptual framework support one another, articulate their
respective phenomena, and establish a framework-specific philosophy. (Jabareen, 2009)
proposes a methodology for a conceptual framework analysis in seven phases; namely:
i. Mapping the selected data sources,
ii. Extensive reading and categorising of selected data
iii. Identifying and naming concepts,
iv. Deconstructing and categorising the concepts
v. Integrating concepts
vi. Synthesis, re-synthesis, and making it all make sense
vii. Validating the conceptual framework.
This paper focuses on conceptualizing the different components involved in the planning and
implementation of sustainable rural development projects. The review of multi- disciplinary
literature shows the absence of an integrative/comprehensive framework for the planning and
implementation of Sustainable rural development projects. To buttress this point, a 2009
report by the International fund for Agriculture development suggests that inefficient linkages
between project components, lack of a unifying framework for analysis of impact and
underinvestment in institutional strengthening amongst others are constraining factors to the
likelihood of rural development project sustainability (IFAD, 2009)
The Project Management institute, the world’s leading organization for project management
suggests Five stages in a Project Life cycle viz; Initiating Phase, Planning phase, executing
phase, controlling phase and closing phase (PMI, 2000). The challenge with the
aforementioned stages is that it is generic and does not reflect the peculiarities of rural
development programming. Furthermore, Bennett suggests a six phase cycle that can be
utilized for Development projects which are Construction related and could also be fairly
applicable to other categories of projects. These phases are; The Pre-project phase, Planning
and design, Contractor selection, project mobilization, project operations and project close
out (Bennett, 2007).
Accordingly, Dennis Rondinelli also proposes a twelve-stage life-cycle of development
projects. These stages include Project identification and design, project formulation, Project
appraisal etc (Rondinelli, 1977), a preliminary review of this project life cycle shows the
absence of some crucial components and they generally do not reflect the four tenets of
sustainable development. Viz; Economic growth, Environmental Sustainability, Social
Inclusion and Good governance (Sachs, 2015).

804
A 14- stage development project life cycle is proposed and shown below:
Figure 1: A proposed 14- stage model of the project life cycle
In conceptualizing the framework, the concepts have been sub divided into three broad
phases. Namely: Phase one- Planning Phase, Phase two - Implementation phase and Phase
three- evaluation phase. All the itemized concepts revolve around these three phases.
4. KEY PHASES IN SUSTAINABLE RURAL DEVELOPMENT PROJECT
IMPLEMENTATION
4.1 Planning
The planning phase has been identified as a central element in modern day project
management. Although, it does not guarantee project success, a lack of it will invariably
ensure project failure this is because planning reduces the uncertainties in a project and thus
improves project success possibilities (Dvir et al, 2003). The planning phase usually includes
preparatory activities towards the actual implementation of the project.
Stakeholder Mapping, involvement and sensitization ensures that the relevant stakeholders in
the project are discovered, entrenched into the project at all stages and efficiently sensitized
on all activities during and after the life cycle of the project. Barker identifies stakeholders for
a National project in Nigeria to be: National Government Agencies, Government Partners
such as: USAID, DFID etc, State Government agencies, Local NGOs, Opinion leaders,
Media and the academic sector (Barker, 2013). However, stakeholders are not limited to the
aforementioned as they most times also include Community based organizations/groups,
religious organizations, community leaders etc. A lucid process for stakeholder engagement
as proposed by (IFC, 2007) is shown below:

805
Figure 2: A lucid process for stakeholder engagement
Other components of the Planning phase include: Project identification, project formulation
and feasibility analysis, project design; which puts into consideration the specific
requirements of the intended beneficiaries, project approval and selection.
4.2 Implementation
The project implementation phase is the second phase in the proposed project life cycle and it
includes the project procurement; which entails the gathering of goods and services which are
key to the achievement of project objectives, Project Supervision and Control, Project
Completion, flag off and handing over. Rwelamila also suggests that ‘the incorrect choice
and use of procurement systems has led to the neglect of the four pillars of sustainability and
this has consequently contributed to poor project performance (Rwelamila, 2000). The four
pillars of sustainability as proposed by (Hill and Bowen, 1996) are Social sustainability,
Economic Sustainability, Biophysical sustainability and Technical sustainability.
In summary, a project can be said to be successfully implemented when it is completed on
schedule, completed on budget, achieves the original goals set for it and is accepted and used
by the intended beneficiaries. (Pinto and Slevin, 1987).
4.3 Evaluation
The last phase of the project cycle is the Evaluation phase. The evaluation phase addresses
the following issues:

806
a. Relevance: Is the project addressing the initial problems given. Is the project in line with
national policies and is it meeting the needs of the beneficiaries?
b. Effectiveness: The extent to which intended beneficiaries are being served by the project
c. Coverage and targeting: The extent to which the right people are benefiting at the right
time.
d. Sustainability: How the project will be maintained and continued after
Government/donor funding comes to an end; the overall process of ensuring that
people’s lives continue to be impacted (SPARC, 2013).
Results from the Evaluation process are vital to the planning for subsequent interventions as
gaps that have been identified can be avoided in future projects. In all, effective Project
Monitoring, Supervision and Control is crucial to the success of any project as it ensures that
projects are completed on time and with the right quality. This should be undertaken
throughout the life cycle of the project.
A proposed conceptual framework is represented in the figure below:
Figure 3: The proposed conceptual framework
The proposed conceptual framework above shows the integration of the three identified
phases. viz; The planning stage, the implementation stage and the evaluation stage. From the
above, the results from the planning stage feed into the implementation stage, the results from
the implementation stage feed into the evaluation stage and the results from the evaluation
stage feed into the Planning stage of subsequent project life cycles.
5. CONCLUSION
Towards filling the void in rural development projects in Nigeria, the need for an integrative
framework for the implementation of sustainable rural development projects cannot be over-
emphasized. The conceptual framework in this exploratory research has brought to the fore
the different concepts that make up the successful planning, implementation and evaluation
of rural development projects. Also described, is the interaction between the critical concepts
and the cardinal factors involved in sustainability.

807
A potential pitfall of this research is the validity of the framework developed. In finalizing
the research, there is a need to test the framework to determine its viability. In conclusion, the
conceptualized framework still needs to be subjected to an expanded literature review and
also employ a mixed methods survey research design. This will bring about the integrative
framework; which is the end result of the conceptual framework.
6. REFERENCES
Akpomuvie, O.B.,(2010). Self-help as a strategy for rural development in Nigeria: A bottom-up approach.
Journal of Alternative Perspectives in the Social Sciences, 2(1), pp.88-111.
Akyurek, A (1985) The drawbacks of rural development in a developing country.
Ayo, E. (1988) Development Planning in Nigeria. Ibadan: Foundation press.
Barker, T. (2013). A Stakeholder Map for Nutrition Policy and Programming in Northern Nigeria.
Bennett, F. (2007). The Management of Construction: A Project Lifecycle Approach. Routledge.
Chambers, R (2014). Rural development: Putting the Last first
Crossan, F. (2003) Research Philosophy: towards an understanding. Nurse Researcher, 11, 46-55.
CSD (2017). Accessed via: http://www.csd-i.org/sustainable-rural-development/. Accessed on: 14th May, 2017
Deleuze, G., & Guattari, F. (1991). What is philosophy? New York: Columbia University Press.
Dvir, D., Raz, T. and Shenhar, A.J., (2003). An empirical analysis of the relationship between project planning
and project success. International journal of project management, 21(2), pp.89-95.
Egonmwan, J.A. and Ibodje, S.W.E., (2001). Development Administration: Theory and Practice. Resyin (Nig)
Co, p.p14.
Ejumudo, K (2013) The problematic of Development Planning in Nigeria: A critical discourse. Developing
Country Studies, Vol. 3, No. 4; 2013.
Forrest, O. (1968) Notes on Nigeria’s development plan 1962-1968.
Gittinger, J. (1982). Economic Analysis of Agricultural Projects, Johns Hopkins University Press, Baltimore.
HICKS, M. (1991). Problem Solving in Business and Management, Hard, Soft and Creative Approaches,
London, Chapman and Hill.
Hill, R.C., Bowen, P.A. and Soboil, J.H., (1996). Environmental management systems in the attainment of
sustainable construction in South Africa. Industry and environment, 19(2), pp.13-18.
Hirschman, A (2014) Development projects observed. Brookings Institution Press
IFAD(2009) Sustainability of rural development projects: Best practices and lessons learned by IFAD in Asia.
Iheanacho, E (2014) National Planning in Nigeria: An endless search for Appropriate Development Strategy.
International Journal of Economic Development Research and Investment, Vol. 5, No. 2; August 2014
International Finance Corporation(IFC) (2007) Stakeholder engagement: A good practice handbook for
companies doing business in emerging markets
Isigwe, P. and Elebua I. (2014) Policy Failure in National Development: The challenge of public bureaucracy.
Imo State University Business Journals.
Impact Economix. (2013) Implementation Evaluation of the Comprehensive Rural Development Programme.
Jabareen, Y. R. (2009) Building a conceptual framework: philosophy, definitions, and procedure. International
Journal of Qualitative Methods, 8, 49–62. Jonathan, G. (2014) Why Operation Feed the Nation, Green Revolution failed, Accessed via:
http://thenationonlineng.net/why-operation-feed-the-nation-green-revolution-failed-jonathan/. Accessed on
14th May, 2017.
MRDLR (2009) The comprehensive Rural Development programme framework.
Obasanjo, O. (2004). An address delivered during the formal launch of the Nigerian National Economic
Empowerment and Development Strategy(NEEDS) at the Presidential Villa, Abuja on 20 March, 2004.
Okigbo, P. (1989). National development planning in Nigeria, 1900-92.
Okowa, H. (1982). “Development Planning in Nigeria”, Ibadan: Foundation Press.
OSSAP-MDGs (2014) Comprehensive Millennium Development Goals Projects and Programmes Mapping
Report, Nigeria.
Paul, S and Agba M. (2014). Rural Development programmes and rural underdevelopment in Nigeria: A
rethink. International Journal of Public Administration and Management Research (IJPAMR), Vol. 2, No
4.
Pinto, J.K. and Slevin, D.P., 1987. Critical factors in successful project implementation. IEEE transactions on
engineering management, (1), pp.22-27.

808
Project Management Institute (2000). A guide to the project management body of knowledge. Newton square,
Pennsylvania USA
Rondinelli, D.A. (1977), “Planning and Implementing Development Projects: An Introduction” in Dennis A.
Rondinelli (ed) Planning Development Projects, Dowden: Hutchinson & Ross.
Rowley, T (1996) Rural Development Research: A foundation for policy. Greenwood Publishing group
Rwelamila, P.D., Talukhaba, A.A. & Ngowi, A.B. 2000, "Project procurement systems in the attainment of
sustainable construction", Sustainable Development, vol. 8, no. 1, pp. 39.
Sachs, JD (2015) The age of Sustainable Development. New York: Columbia University Press
World Bank (2016) World Development Indicators 2016. Washington, DC: World Bank. doi:10.1596/978–1-
4648–0683–4. License: Creative Commons Attribution CC BY 3.0 IGO
SPARC (2013) An M&E framework for tracking and managing CGS projects. Accessed via www.sparc-
nigeria.com/RC/files/4.2.10_ME_Framework_CGS_Projects.pdf.
809
ID 042
TECHNOLOGICAL INNOVATION AND FACILITIES MANAGEMENT
PRACTICE: IMPLICATIONS FOR SOCIAL SUSTAINABILITY
U.J. Adama and K.A. Michell
1 UCT–Nedbank Urban Real Estate Research Unit, Department of Construction Economics and Management,
University of Cape Town, Private Bag X3, Rondebosch, 7701, South Africa
Email: [email protected]
Abstract: This study evaluates social sustainability in facilities management (FM)
organisations against the backdrop of advancement of technological innovations. Past studies
have revealed that the practice of sustainability in FM is not holistic. A greater emphasis is
placed on the economic and environmental pillars of sustainability to the exclusion of the
social pillar. This exclusion is attributed to the inability to reach a consensus on what
constitutes a social sustainability construct in light of the diverse elements of social
sustainability. The study is explorative and relied on available literature on social
sustainability integrated with FM literature. The author argues for the promotion of social
sustainability in FM through the integration of three constructs of social sustainability,
namely: social relationship, job satisfaction; knowledge development; and several other sub-
indices. These constructs are seen as a starting point towards evaluating social sustainability
practice in FM. The study proposed a social sustainability framework towards enhancing the
understanding of social sustainability in FM practice. The framework suggests that an
organisation’s commitment to the promotion of social sustainability practice could result in
optimal delivery of the core business objectives of the organisation. The framework provides
useful direction for further studies in this research area.
Keywords: Facilities management, social sustainability, sustainable facilities management,
sustainability, technological innovation.
1. INTRODUCTION
Technological advancement has brought a variety of possibilities to the built environment.
Hence, FM is engaging in the adoption of new technologies to both transform and improve
the overall triple bottom line of organisations. The common types of technological
innovations that are adopted in FM practice include: Information Communication
Technology (ICT), Radio Frequency Identification (RFID), cloud-based technology, drone
technology, social media technology, robots and sensors. The adoption of these technological
innovations has assisted in promoting the efficiency, profitability, flexibility, corporate
image, connectivity and reduced the overall cost of doing business. However, previous
studies argued that these technological innovations have changed the work patterns in
organisations resulting in a negative impact on employees. For instance, employees' social
well-being is affected by ICT-based technological innovations (Hing Lo et al., 2014; Jiang,
2016; Hoeven et al., 2016). The technologically induced work pattern causes employees to
face social isolation, alienation, partial invisibility in the organisation, coupled with overwork
and the intrusion of work into employees’ home life (Grimshaw, 2007). Furthermore,
employees face job losses due to the introduction of robots (West, 2015). The introduction of
RFIDs in organisations results in a violation of employees’ privacy and security, in addition
to labour intensification (Fisher and Monahan, 2008; Azevedo and Carvalho, 2012). Fisher
and Monahan (2008) further argued that both surveillance and labour intensification can

810
bring about additional stress and an overall decline in employees’ morale. The challenges
highlighted above have a social dimension and resultant implications for the social wellbeing
and sustainability of the employees. There is a need for concrete action else, the quality of
employees and social capital that will be available to organisations in the future will not be
able to guarantee organisational success (Abbott, et al., 2013). Moreover, Ware et al. (2017)
argue the importance of evaluating how these social problems affect workforce productivity,
innovation, and employment relationships on a sustainable basis.
International Facilities Management Association (IFMA) (2014) stated that sustainability is
crucial to FM practice. However, there has been an increased demand for a holistic view of
sustainability due to the imbalance in the application of the economic, social and
environmental pillars of sustainability (Elmualim et al., 2008; Jensen et al., 2013). The social
pillar which represents the people’s concerns (Omann and Spangenberg, 2002) among the
sustainability pillars has suffered continuous neglect despite the benefit that is derivable from
exploring peoples’ potential (Omann and Spangenberg, 2002; Sarpin, 2015). This is a gap in
the practice of sustainable FM. Hence, this study explores the impact of technological
innovations on FM practice and the influence on social sustainability by reviewing and
integrating available literature on FM and social sustainability. The study adopted three
constructs, namely: social relationship, job satisfaction and knowledge development to
measure social sustainability against the backdrop of technological innovations in
organisations. The strategy of the study is first, to carry out an overview of how technological
innovation has influenced FM practice as evidenced in the literature. In addition, to
investigate how the emerging FM practice influences social relationship, job satisfaction and
knowledge development as measures of social sustainability.
2. INFLUENCE OF TECHNOLOGICAL INNOVATIONS IN FM PRACTICE
Technological innovations in this study includes cutting-edge technologies that are being
adopted by FM professionals, for improved service delivery. These include: information
communication technology (ICT), cloud-based technology, drone technology, robotics and
the social media. These classes of technological innovations have provided opportunities for
organisations to optimise employee capabilities, and respond efficiently to customer needs,
gain valuable feedback, ideas and useful information (Lindkvist and Elmualim, 2009; Martin
and Omrani, 2015; Kandampully et al., 2016). From previous studies, the influence of
technological innovations in FM practice includes: effective job performance, innovative
work practices, operation of “Virtual Office” and the development of green buildings,
increased commitment of employees, job flexibility, and greater task involvement (Huselid
and Becker, 1996; Nutt, 2000; Grimshaw, 2005; Osterman, 2006; White and Bryson, 2013;
Martin and Omrani, 2015). Furthermore, the adoption of technological innovation has
transformed FM practice from being reactive to proactive, and with increased sophistication
in technological innovations towards being predictive (Taival, 2017). More specifically,
technological innovations like the Building Information System (BIM) has transformed
operational FM. BIM is a tool used by architects to create a complete model of building
before it is built. It enables the facilities manager to visualise the building in the pre-
construction stage and make informed contributions at the design stage that will enhance the
overall performance of the building throughout the building life cycle. BIM has also
promoted enhanced communication by making data sharing flexible among the facilities
maintenance managers in a building (Taival, 2017).

811
The drive towards “Smart building” is boosted by the integration and control of the different
systems in a building facility like heating, lighting, ventilation, sanitation and security from
one central point using technological innovations. From such point, smart sensors are used to
detect and rectify inefficiencies like a leaky tap or a light that has been left on. This, has
enhanced the practice of sustainable FM through the effective management of energy, water
and waste. Furthermore, the internet and other wireless technologies have enabled FM
productivity and efficiency on a sustainable basis. For instance, the virtual office is made
possible by the internet. When applied to the transportation logistics, internet connectivity has
helped FM professionals to determine and optimise the most fuel-efficient routes for transport
services amongst others. The availability of different censors has enabled effective remote
monitoring and control using alarm monitoring and services in FM practice (Taival, 2017).
The use of automated devices and smart robots have also helped to transform FM practice in
several ways. Robots are increasingly being deployed in FM sector for portering, security,
waste management, building maintenance services, logistic deliveries, catering and customer
services etc. These were services hitherto undertaken by human beings with all the associated
overhead costs. Moreover, the increased use of robots in FM has reduced the energy cost and
increased management efficiency. In the same manner, drones fitted with a camera can carry
out efficient building survey assessment, do video and thermal imaging especially at a high
level or high-risk areas thereby reducing the risk of falls associated with such tasks
(Marginalia, 2016). Drones for FM services also known as "Aerial FM", can diagnose and
record on video, the condition of roof defects, storm damages, and weathering issues in a
quick and cost-efficient manner (Marginalia, 2016).
The adoption of technological innovations like computer-aided facilities management
(CAFM) software has also increased the level of integration amongst employees and
departments in FM organisations and promoted business operation on a sustainable basis. For
instance, the integration of (CAFM) software removes ambiguity by ensuring that contractors
and employees are using the same data set and methods over any contractual activity.
Furthermore, smartphones, cloud computing and social media have increased the mobility of
the FM services whereby facilities managers can conduct their operations from anywhere in
the world. Cloud-based technology has promoted the unification of management in multiple
geographically dispersed facilities, with immense capacity to store historic and current
maintenance data about the facility (Lau et al., 2013). The smartphones and social media
technologies enable video conferencing, multimedia instant messaging, recording and
photographing, which enables facilities managers to carry out their assignment from any
remote location without necessarily visiting the site. Hence, technological innovation has
influenced the practice of FM over the years. However, the impact of technological
innovation in FM organisation is on the core business and the employees, but little is known
about the impact on the employees as they are rarely discussed. This has made the discussion
of technological innovation impact in FM not holistic. Since organisations are required to act
sustainably, it therefore, has become important to assess the influence of technological
innovation in the organisation holistically.
3. SUSTAINABLE FM PRACTICE
There is a growing interest in sustainable FM practice, especially with respect to evolving
new strategies that will enhance the skills of facilities managers towards meeting
sustainability criteria (Nielsen et al., 2009; Sarpin, 2015). This is apparent as a result of the

812
critical role that the facilities managers play throughout the entire facility life-cycle
(Elmualim et al., 2008). Moreover, previous research efforts emphasised the possibility of
deriving substantial benefits from sustainable FM practice (Hodges 2005; Lai and Yik 2006;
Nielsen et al. 2009). This is because facilities managers have a growing influence over how
profitability, productivity, energy management, waste management, employee wellbeing and
public perception of an organisation are determined (Pitt, 2005; Shah, 2007). Brown and Pitt
(2001) argued that the growth in the built environment practice and the consequential growth
of the FM sector is expected to be significant and will impact on all aspects of sustainability.
However, the practice of sustainable FM has not reflected a holistic approach because
previous sustainable FM studies have been more favourable to the economic and
environmental issue with little effort being directed towards the social issues. Sustainability
comprises three pillars: economic, environmental and social that should be in equilibrium for
sustainability to be holistic (Hodges 2005; Dillard and King, 2008; Teodorescu, 2015). In
other words, the impact of one of the components is felt by the other two at any given time
because of their interrelatedness. It further implies that there is an unbreakable relationship
existing among the pillars of sustainability. However, Elmualim (2009), Vallance et al.
(2011) and Jensen et al. (2013) all argued that the social pillar of sustainability has received
the least attention. In a similar submission, the European Council (2001) affirmed that “at
best social sustainability is mentioned separately including social objectives, but not fully
integrated into the sustainability framework”.
Elmualim et al. (2009) argued that a balanced sustainability policy should integrate all the
elements of the triple-bottom line (TBL). Elkington (1998) asserts that the essence of the
TBL is to compel organisations to be more responsive by shifting their focus from
wholesome economic pursuits toward some social and environmental concerns while
conducting their business. An organisation (FM) is a social function (Ohmae, 1999; Gao and
Zhang, 2006) that should not only be responsible for the well-being of its shareholders alone
but ensures that its employees, customers, suppliers, local communities and the society enjoy
security and a sustainable good life (Deegan, 2002; Gao and Zhang, 2006). Vanclay (2004)
argued that although FM organisations are adopting the concept of TBL in their development
and operations, a clear social dimension as a measure for the attainment of social
sustainability is still unclear. Social sustainability is fundamental to sustainable FM practice
because the performance of building designs and social infrastructure including access to
services and recreation have a direct effect on the quality of life and wellbeing, and the
cohesiveness of society (CIRIA, 2006). Therefore, the inability to fully integrate the
economic, social and environmental issues in FM is a gap in FM knowledge (Sarpin 2015).
Vanclay (2004) suggested the integration of stakeholders’ interest as a starting point for
measuring social sustainability. Other studies like Wehling (1999) suggested combining both
objective and subjective indicators of people as a measure of their social sustainability. This
study combines the two positions, by adopting the employees in FM organisations as
stakeholders that represents the society for testing social sustainability practice. This is
because employment is a factor of social sustainability that mediates nature-society
relationship. Therefore, when employees can meet their needs and other extended sets of
human needs, the society’s reproductive capabilities are sustained (Littig and Grießler, 2005).
The study adopted three main constructs of social relationship, job satisfaction and
knowledge development and several sub-indices as shown in Table 1 as social sustainability
indicators. The inter-relationship of these constructs and sub-indices led to the formulation of
social sustainability framework as shown in Figure 1. It is acknowledged that the subjective
nature of social sustainability factors will negate having a set of constructs as absolute for its

813
study. Therefore, this study ensured that the sub-indices that constituted the three main
constructs have direct bearing on employees’ wellbeing and comfort. Furthermore, the study
recognises that organisations contribution to their host community is a form of social
sustainability practice that is well established in literature. However, it should be noted that
the intention of the current study is to evaluate such contribution through the employees as
representatives of the community. Hence, the premise of the study is that the employees’
experiences whether positive or negative has an influence on the social wellbeing of the
community and therefore on society as a whole.
4. THE CONCEPT OF SOCIAL SUSTAINABILITY
The sustainability concepts of the Brundtland report (WCED 1987) and the Rio documents
(UN, 1992) required that the environmental, economic, social, factors be equally combined
(Littig and Grießler, 2005). These different factors are referred to as "dimensions" or "pillars"
of sustainability. In order for sustainability to be operationalised, the individual
pillars/dimensions must be related to each other in more concrete terms. Kopfmüller et al.
(2001) categorised the operationalisation of sustainability as either a one-pillar model or
multi-pillar models. The one-pillar model prioritises the environmental dimension on the
basis that, sustainability should essentially help to preserve the environmental systems and
resources which are necessary for economic and social life as an important requirement for
meeting the future needs of humanity (Littig and Grießler, 2005). However, the three-pillar
model which is more recognised internationally emphases an equal treatment of the
environmental, economic, and social goals of sustainability. The proposition is that human
needs are beyond merely providing an environmentally stable and healthy environment, but
in addition social and cultural needs should be addressed (Littig and Grießler, 2005). In
another argument, it was stressed that the environmental, economic, and social needs are
three individually connected systems, which must remain stable so as not to endanger the
successes of progressive development.
Sustainability in FM has traditionally been evaluated by in terms of the environmental pillar.
Wackernagel (2001) argued that human well-being is essential for the well-being of a society.
In a contrary view, Hodge and Hardi (1997) expressed the interdependence of people and
their surrounding world by stating that the achievement of progress toward sustainability will
require maintaining and improving, both human and environmental wellbeing, and not one at
the expense of the other. Furthermore, Brandl (2002) argues that sustainability is the
relationship between environmental and social elements which needs to be maintained in
such a way that it doesn’t destabilise the whole system: "From a system theoretical point of
view, this approach aims to uphold both the functionality and the resilience of linked sub-
systems, thus keeping the whole system stable" (Brandl 2002, p.13ff, transl. by Littig and
Grießler, 2005). Evaluating the definition of sustainable development by the Brundlandt
Commission as “development which meets the needs of the present without comprising the
ability for future generations to meet their own needs" (WCED 1987, p.43), it can be argued
that the use of the term "needs" in the Brundtland definition of sustainability, summaries the
interplay of society and nature (Littig and Grießler, 2005). Within the context of nature, the
needs of human beings are challenging to nature because of the emission of gases and
generation of waste and alteration of the ecological systems associated with the exploitation
of natural resources. However, if the meaning of "needs" is expanded within the context of
paid employment, it includes the quest for education, recreation/leisure, social relationships,
and self-fulfilment. The satisfaction of these needs will call for a much broader scope of
814
action and opportunities. In this study, we defer to the latter option, because by meeting these
needs, employees will be able to take responsibility for shaping a decent life for themselves
and the society.
Employment in the broadest sense plays an essential role in sustainability because the
fulfilment of needs derived from employment requires some exchange between society and
nature. Moreover, gainful employment is one of the foremost organisational and structural
principles of society, which has continued to experience transformation over time (Fischer-
Kowalski and Haberl, 1993). However, work in modern working societies, especially paid
employment, has transformed beyond ensuring that people get a livelihood to satisfy their
needs, towards becoming the means to stratify and structure society (Senghass-Knoblauch,
1998). Therefore, employment has become a factor of social sustainability that mediates the
nature-society relationship, by reflecting the way that an extended set of human needs are met
and the society’s reproductive capabilities for a long period are promoted through social
justice, human dignity and participation. Furthermore, it is expected that the concept of social
sustainability in an organisation reflect elements of social welfare (Brandl and Hildebrandt,
2002) that not only secure employees’ income but also promote integration and social
cohesion (Senghass-Knoblauch, 1998). Based on these social sustainability concepts
discussed above, this study adopted a set of three core indicators to assess the social
sustainability in FM practice. The first construct is ‘social relationship’ which measures
alienation, social network, work and home life balance, overwork and social isolation. The
second social indicator deals with ‘job satisfaction’ which assesses job indices like
remuneration, autonomy, job security, interaction, professional status, task requirement and
organisational policy. The third social sustainability construct adopted in this study deals with
‘knowledge development’. Knowledge development evaluates the level of workshops and
seminars, professional development programs, retirement development plans and on-the-job
training in organisations. Each of these will be discussed briefly below.
4.1 Social Relationship and Social Sustainability
Social relationship refers to any connection with at least one or more people that act
harmoniously in a social situation. Alienation as a factor of social relationship involves
estrangement from the larger social world. From the analysis of Marx’s early writings,
occupational alienation can be in the form of lack of control over ones’ labour and the lack of
control over ones’ process of work are factors of occupational alienation. Therefore, the new
order of work pattern due to technological innovation in organisations encourages
occupational alienation because technology in most cases takes control over work processes
(Bailey and Kurland, 2002; Kurland and Cooper, 2002; Grimshaw, 2007; Osin, 2009;
Dempsey et al., 2011; Rey, 2012; Nam, 2014; Mokyr et al., 2015; Nørgaard et al., 2015;
Valtorta, 2016; Zhang, 2016). ICT promotes more virtual connectivity than physical
connectivity which has affected social networks. Social networks are characterised by the
joint activities of, and constant exchanges between, members in an organisation or a social
system. This reflects the state of recurrent relationship that connects the actors in a social
system (Bhatt 2001; Grimshaw, 2007; Bennett et al., 2010; Dempsey et al., 2011; Nam,
2014; Zavaleta, 2014; Valtorta, 2016). Also, the increased adoption of technological
innovation because of globalisation has blurred the boundaries between work life and home
life (Allen et al., 2000; Frone, 2003; Galinksky et al., 2004; Wallace, 2004; Wajcman, et al.,
2008; Grimshaw, 2007; Nicholas and Guzman, 2009; Beutell, 2010; Nam, 2014; Fapohunda,
2014; Mokyr et al., 2015; Nørgaard et al., 2015; Valtorta, 2016; Zhang, 2016)). A poorly
managed balance between work and home life has been associated with stress, sub-optimal

815
productivity and high absenteeism. However, employees with better work and home life
balance are reported to have a better sense of responsibility, ownership and control of their
work life. Employees have demonstrated greater commitment and loyalty to organisations
that help them balance their work and home-life (Thompson et al., 1999; Allen, 2001; Clark,
2001; Behson, 2002, 2005).
Overwork as a sub-index of social relationship is one of the factors that is responsible for
workplace stress (Eikhof et al., 2007; Grimshaw, 2007; Nam, 2014; Valtorta, 2016). The
resultant tress created by overwork negatively influence workers’ health and well-being and
in turn a negative impact on the productivity and profits of the organisation (Bickford, 2005).
In a similar submission, The National Institute for Occupational Safety and Health (NIOSH)
(1999) confirmed that the health of workers, and in turn, the health of organisations faces a
threat from job stress due to the changing nature of work. It follows therefore, that, inefficient
management of over work induced stress can result in sick and socially unsustainable society
because workers will be spending their resources on health care challenges. Social isolation is
the opposite of social inclusion. An organisation is presumed to pursue social inclusion when
formal and informal social events at work are perceived as equally appropriate for employees
(Beehr et al., 2000; Cattan et al., 2005; Marshall et al., 2007; Casper, et al., 2007; Dempsey
et al., 2011; Nam, 2014; Zavaleta et al., 2014; Nørgaard et al., 2015; Valtorta 2016). This is
important in the promotion of social sustainability in light of previous studies on social
identity theory which argues that people classify themselves into in-groups and out-groups
using salient measures, while looking out to maintain a positive social identity in the process
(Brewer, 1979; Tajfel and Turner, 1986). FM is a relationship management oriented
profession with enormous responsibility to people, place and planet (Grimshaw, 2007; Ware
et al., 2017). Moreover, FM has to evolve new ways of operation that favours not only the
shareholders of the organisation but also promoting positive community life (Kasim and
Hudson, 2006).
4.2 Job Satisfaction and Social Sustainability
As earlier mentioned, employment is a factor of social sustainability that mediates the nature-
society relationship, by reflecting the way that an extended set of human needs are satisfied.
Therefore, job satisfaction for the employees becomes critical. Lance (1991) and Irvine and
Evans (1995) in previous studies argued that a significant relationship exists between a low
level of job satisfaction and the rate of employee turnover. Hence, job satisfaction is a buffer
against conditions that encourage a high level of employee turnover. In a similar submission,
van Saane et al. (2003) argued that job satisfaction also serves as a barrier to occupational
stress, which is a factor that negatively affects social sustainability. Authors that have
identified social sustainability factors that influence job satisfaction to include: remuneration,
autonomy, job security, interpersonal relationship, professional status, task requirement and
organisational policy (Beehr et al., 2000; Bhatt, 2001; Grimshaw, 2007; Bennett et al., 2010;
Dempsey et al., 2011; Nam, 2014; Mokyr et al., 2015; Nørgaard et al., 2015; Zhang, 2016).
4.3 Knowledge Development and Social Sustainability
Kandampully (2002) acknowledged that technological innovation has created a knowledge
dimension to almost every manual job. Hence, organisations seek employees that are able and
willing to update their knowledge on a continuous basis (Bhatt, 2001; Wiewiora et al., 2010;

816
Ware, 2003; Dempsey et al., 2011). Unlike the old practice, experience is of limited value
because new knowledge is required to be productive with new technology (Kandampully,
2002; Pathirage et al., 2008). Drucker (1993) and Nutt (1999) argued that the ability of the
employees and organisations to be proactive in seeking current knowledge is the only means
through which organisations can be sustainable. Nutt (2000) further affirmed that knowledge
development is the foundation for synchronising organisation objectives with the facilities
objective. In the context of sustainability, Bhatt (2001) maintained that the development of
employees’ knowledge should be regarded as significant in terms of the adoption of
technological innovation in organisations. Sarpin (2015) further argued that the knowledge
gap has remained a challenge to the practice of holistic sustainable FM. Hence, the upgrading
of people’s knowledge has a correlation with their wellbeing, which is fundamental factor in
social sustainability.
5. TOWARDS THE PROPOSED SOCIAL SUSTAINABILITY FRAMEWORK FOR
FM
As earlier stated, the study has evaluated social sustainability through the three concepts of
social relationship, job satisfaction, and knowledge development. The systematic search of
past literature on social sustainability between years 2000-2016 yielded sixteen factors with
direct bearings on the employees’ wellbeing, which are described as social sustainability
indicators in the literature. These factors were grouped into the three main constructs for
conciseness as shown in Table 1 below.
Table 1: Social sustainability constructs from the literature Construct
Social
sustainability
indictors
Author
Social
relationship
Alienation Bailey and Kurland, (2002); Kurland and Cooper (2002); Grimshaw (2007); Osin (2009);
Dempsey et al. (2011); Rey (2012); Nam (2014); Mokyr et al. (2015); Nørgaard et al. (2015);
Valtorta (2016); Zhang (2016)
Social
network
Bhatt (2001); Grimshaw (2007); Bennett et al. (2010); Dempsey et al. (2011); Nam (2014);
Zavaleta (2014); Valtorta (2016)
Work/home
life balance
Nicholas and Guzman (2009); Wajcman, Bittman and Brown (2008); Wallace (2004); Allen
et al. (2000); Frone (2003); Grimshaw (2007); Beutell (2010); Nam (2014); Fapohunda
(2014); Mokyr et al. (2015); Nørgaard et al. (2015); Valtorta (2016); Zhang (2016)
Overwork Eikhof et al. (2007); Grimshaw (2007); Nam (2014); Valtorta (2016)
Social
isolation
Beehr et al. (2000); Cattan et al. (2005); Marshall et al. (2007); Grimshaw (2007); Dempsey
et al. (2011); Nam (2014); Zavaleta et al. (2014); Nørgaard et al. (2015); Valtorta (2016)
Job
satisfaction
Remuneration Nørgaard et al. (2015); Mokyr et al. (2015)
Autonomy Nørgaard et al. (2015)
Job security Grimshaw (2007); Dempsey et al. (2011); Mokyr et al. (2015); Nørgaard et al. (2015)
Interpersonal
relationship
Beehr et al. (2000); Bhatt (2001); Bennett et al. (2010); Nam (2014); Nørgaard et al. (2015);
Zhang (2016)
Professional
status
Nørgaard et al. (2015)
Task
requirement
Nam (2014); Nørgaard et al. (2015)
Organisationa
l policy
Grimshaw (2007); Nørgaard et al. (2015)
Knowledge
developmen
t
Workshop and
seminars
Bhatt (2001); Dempsey et al. (2011)
Professional
development
program
Ware (2003)
Retirement Wiewiora et al. (2010)

817
development
plan
On-the-job
training
Bhatt (2001); Wiewiora et al. (2010); Dempsey et al. (2011)
Based on the on the number of times that each of the constructs in Table 1 were cited in the
literature, a tentative ranking, from a theoretical point of view, of the constructs was
generated in Table 2 to show the frequency of each of the sub-indices under the main
construct based on the emphasis placed on them in previous studies. The tentative ranking in
Table 2 indicates that over the years under review (2000 – 2016), out of the 69 references
made to social sustainability, 44 of those references were in relation to social relationship, 18
were related to job satisfaction and 7 were related to knowledge development. The authors
perceive that this could be indicative of the relative importance of these factors that may
require further empirical study to substantiate.
Table 2: Strength of each sub-constructs by frequency and ranking
Subject to further empirical analysis, organisations that seek to promote social sustainability
may need to pay more attention to the factors of ‘social relationship’ as, in terms of the
literature, these seen as being more important to the employees than job satisfaction and
knowledge development.
6. THE PROPOSED SOCIAL SUSTAINABILITY FRAMEWORK
This paper aims to provide a critical view of the changes that the introduction of
technological innovation will cause to the employees in an FM organisation. Although the
introduction of technological innovation in FM organisation will affect both the core business
and the employees of the organisation as shown in Figure 1, as earlier stated, this study will
concentrate on the employees as being indicative of the community and society. The
conceptual framework in Figure 1 consists of five parts: firstly, the FM organisation;
secondly, the technological innovation which is perceived as the external enabler that is
adopted into the organisation. Thirdly, the core business to the left of the framework, and
fourthly, the employee to the right of the framework. They are both impacted by the effect of
any technological innovations that are adopted into the organisation. Lastly, social
Construct Social sustainability indictors Frequency Ranking Overall Ranking
Social
relationship
Work/home life balance 13 1st 1st
Alienation 11 2nd 2nd
Social isolation 9 3rd 3rd
Social network 7 4th 4th
Overwork 4 5th 6th
Job
satisfaction
Interpersonal relationship 6 1st 5th
Job security 4 2nd 6th
Remuneration 2 3rd 8th
Task requirement 2 3rd 8th
Organisational policy 2 3rd 8th
Autonomy 1 4th 9th
Professional status 1 4th 9th
Knowledge
development
On-the-job training 3 1st 7th
Workshop and seminars 2 2nd 8th
Professional development program
Retirement development plan
1 3rd 9th
1 3rd 9th
69

818
sustainability which is the point of the interrelationship between the FM organisation and
society.
Figure 1: Proposed framework for social sustainability in FM
7. CONCLUSION
Technological innovations have influenced the practice of FM profoundly by helping to
promote efficiency, profitability, flexibility, corporate image, connectivity and reduced the
overall cost of doing business. It has also helped to improve safety and competitiveness.
However, more benefits may be possible if the organisations explored the social
sustainability of the employees. Organisations that will survive the global business
competition in view of the technological advancements are those that will be more socially
inclined to promoting employees’ welfare. The study revealed from the analysis of literature
searched, the most probable constructs for promoting social sustainability are the social
relationship construct, the job satisfaction construct, and the knowledge development
construct. It is further concluded that further empirical research is required in order to
ascertain the relative importance of each of these constructs. Lastly, it may be concluded that
facilities managers, in adopting technological innovations in their practice, should not only
evaluate the advantages for the core business alone but also understand how the adoption
thereof will impact on the social dimension of sustainability. This paper represents a
preliminary stage of a comprehensive ongoing study in this regard.
8. REFERENCES
Allen, T. (2001) Family-supportive work environments: The role of organizational perceptions. Journal of
Vocational Behavior. 58, pp.414–435.

819
Allen, T. D., Herst, D. E. L., Bruck, C. S., and Sutton, M. (2000) Consequences associated with work-to-family
conflict: A review and agenda for future research. Journal of Occupational Health Psychology. 5(2),
pp.278–308.
Andrew W. Brown, M.R. Pitt, (2001) Measuring the facilities management influence in delivering sustainable
airport development and expansion. Facilities, 19 (5/6), pp. 222-232, doi: 10.1108/02632770110387814
Azevedo, S. G. and Carvalho, H, (2012) Contribution of RFID technology to better management of fashion
supply chains. International Journal of Retail & Distribution Management, 40(2) pp. 128 – 156
Bailey, D. E., and Kurland, N. B. (2002) A review of telework research: Findings, new directions, and lessons
for the study of modern work. Journal of Organizational Behavior. 23, pp.383-400.
Beehr, T. A., Jex, S. M., Stacy, B. A., and Murray, M. A. (2000) Work stressors and co-worker support as
predictors of individual strain and job performance. Journal of Organizational Behavior, 21, pp.391- 405.
Behson, S. J. (2002) Which dominates? The relative importance of work-family organizational support and
general organizational context on employee outcomes. Journal of Vocational Behavior, 61, 53–72.
Behson, S. J. (2005) The relative contribution of formal and informal organizational work-family support.
Journal of Vocational Behavior, 66, 487–500.
Bennett, J. Owers. M., Pitt, M., Tucker, M. (2010) Workplace impact of social networking. Property
Management. 28(3), pp.138 – 148.
Bhatt, D. G. (2001) Knowledge management in organizations: Examining the interaction between technologies,
techniques, and people. Journal of Knowledge Management, 5(1), pp.68-75.
Brandl, S. (2002) Konzepte sozialer nachhaltigkeit im deutschen diskurs', in Ritt, T. (Ed.): Soziale
Nachhaltigkeit: Von der Umweltpolitik zur Nachhaltigkeit? Arbeiterkammer Wien, Informationen zur
Umweltpolitik 149, Wien, pp.11-32.
Brandl, S. and Hildebrandt, E. (2002) Zukunft der Arbeit und soziale Nachhaltigkeit, Zur Transformation der
Arbeitsgeselischaft vor dem Hintergrund der Nachhaltigkeitsdebatte, Leske und Budrich, Opladen.
Brewer, M. (1979). In-group bias in the minimal intergroup situation: A cognitive-motivational analysis.
Psychological Bulletin, 86, 307–324.
Cattan, M., White, M., Bond, J., and Learmouth, A. (2005) Preventing social isolation and loneliness among
older people: A systematic review of health promotion interventions. Ageing and Society, 25, pp.41–67.
Casper, W. J., Eby, L. T., Bordeaux, C., Lockwood, A., and Burnett, D. (2007). A review of research methods in
IO/ OB work-family research. Journal of Applied Psychology, 92(1), 28–43.
Clark MS. Social relationships in adulthood. In: Baltes PB, Smelser NJ, eds. International encyclopedia of the
social & behavioral sciences. Oxford: Pergamon, 2001:14423–9
Cooper, C. D. and Kurland, N. B. (2002) Telecommuting, professional isolation, and employee development in
public and private organizations. Journal of Organizational Behavior. 23, pp.511-532.
Dempsey, N., Bramley, G., Power, S., and Brown, C. (2011) The social dimension of sustainable development:
defining urban social sustainability. Sustainable Development. 19, pp.289-300.
Dillard, J. and King, M.C. (2008). Understanding the social dimension of sustainability, Routledge, New York.
Eikhof, D. R., Warhurst, C., and Haunschild, A. (2007) Introduction: What work? What life? What balance?
Critical reflections on the work-life balance debate. Employee Relations. 29(4), 325–333.
Elkington, J. (1998) Partnerships from cannibals with forks: the triple bottom line of 21st-century business.
Environmental Quality Management. 8, pp. 37-51.
Elmualim, A., Czwakiel, A., Valle, R., Ludlow, G. and Shah, S. (2008) Barriers for implementing sustainable
facilities management. In World Sustainable Building Conference September 2008, Melbourne, Australia,
edited: CSIRO, Australia.
European Council (2001) Presidency Conclusions, Göteborg European Council, European Council.
Empacher, C., Wehling, P. (1999) Indikatoren sozialer Nachhaltigkeit, ISOE Diskussionspapiere 13.
Fapohunda T. M. (2014) An exploration of the effects of work life balance on productivity. Journal of Human
Resources Management and Labor Studies [online June 2016]. 2(2), pp.71-89.
Fischer-Kowalski, M. and Haberl, H. (1993) Metabolism and colonisation: modes of production and the
physical exchange between societies and nature. Innovation in Social Science Research. 6, pp.415-442.
Fisher, J. A., and Monahan, T. (2008) Tracking the social dimensions of RFID systems in hospitals. Int J Med
Inform, 77(3), 176-183. doi:10.1016/j.ijmedinf.2007.04.010
Frone, M. R. (2003). Work-family balance. In J. C. Quick and L. E. Tetrick (Eds.), Handbook of occupational
health psychology. pp. 143–162. Washington, DC: American Psychological Association.
Galinsky, E., Bond, J.T., and Hill, E.J. (2004) When work works: A status report on workplace flexibility: Who
has it? Who wants it? What difference does it make? Retrieved on 16/03/2017 from
http://familiesandwork.org/3w/research/downloads/status.pdf
Grimshaw, B. (2007) History is bunk: Considerations on the future of FM. Facilities, 25(11/12), pp. 411-417.
Grimshaw, R.W. (2005). Mobility: indicators of performance. Knowledge paper, JCI, London.
820
International Facilities Management Association (IFMA) (2014). Sustainable facility management:
the integration of sustainability into a facility manager’s core competencies. Accessed from
http://www.feapc.com/ on 16/05/2016.
Hing Lo, S., van Breukelen, G. J. P., Peters, G. J. Y., and Kok, G. (2014) Teleconference use among office
workers: An interorganizational comparison of an extended theory of planned behavior
model. Administrative Sciences, 4(1), 51-70.
Hodges, C. P. (2005) A facility manager's approach to sustainability. Journal of Facilities Management, 3(4),
pp. 312-324.
Hodge, R. A. and Hardi, P. (1997) The Need for Guidelines: The Rationale Underlying the Bellagio Principles
for Assessment’, in P. Hardi and T. Zdan (Editors.) Assessing Sustainable Development. Principles in
Practice, International Institute for Sustainable Development, Winnipeg, Manitoba, pp. 7-20
Hoeven, C. L. T., van Zoonen, W., Fonner, K. L. (2016). The practical paradox of technology: The influence of
communication technology use on employee burnout and engagement. Communication Monograph 83(2),
239-263.
Huselid, M. A. and Becker, B. E. (1996) Methodological issues in cross-sectional and panel estimates of the
human resource – firm performance link, Industrial Relations, 35, 400–22.
Jensen, P.A., Sarasoja, A.L., Van der Voordt, T. and Coenen, C. (2013) How can facilities management add
value to organisations as well as to society? Conference paper. Brisbane, Australia: CIB World
Building Congress, 5-9 May 2013.
Jiang, H. (2016) The impact of communication technologies on employees' well-being. Available from:
http://www.instituteforpr.org/impact-communication-technologies-employees-well/ [Accessed 2/04/2017.
Kandampully, J., Bilgihan, A., and Zhang, T. (2016) Developing a people-technology hybrids model to unleash
innovation and creativity: The new hospitality frontier. Journal of Hospitality and Tourism Management,
29, 154-164. doi:10.1016/j.jhtm.2016.07.03
Kasim, R., and Hudson, J. (2006). FM as a social enterprise. Facilities, 24(7/8), pp.292-299.
Kurland, N. B., and Cooper, C. D. (2002). Manager control and employee isolation in telecommuting
environments. Journal of High Technology Management Research, 13, pp.107-126.
Kopfmüller, J., Brandl, V., Sardemann, G., Coenen, R., and Jörissen, J. (2000), Vorläufige Liste der Indikatoren
für das HGF-Verbundprojekt, HGF Project Working Papers, Karlsruhe.
Lindkvist, C. and Elmualim, A. (2009) Pervasive technologies for workspace management. Journal of Facilities
Management, 7, pp.98-110.
Lance, C. E. (1991) Evaluation of a structural model relating job satisfaction, organizational commitment and
precursors to voluntary turnover. Multivariate Behav Res. 26, pp.137–162.
Lai, J.H.K. and F.W.H. Yik. (2006) Knowledge and perception of operation and maintenance practitioners in
Hong Kong about sustainable buildings. Facilities 24 (3/4) pp.90-105.
Littig, B., and Grießler, E. (2005) Social sustainability: a catchword between political pragmatism and social
theory. International journal of sustainable development, 8(1-2), pp.65-79.
Martin, L., and Omrani, N. (2015). An assessment of trends in technology use, innovative work practices and
employees’ attitudes in Europe. Applied Economics, 47(6), pp.623-638.
Marshall, G. W., Michaels, C. E., and Mulki, J. P. (2007) Workplace isolation: Exploring the construct and its
measurement. Psychology and Marketing, 24(3), pp.195-223. http://dx.doi.org/10.1002/mar.20158
Mokyr, J., Vickers, C. and Zieberth, N. L. (2015) The History of Technological Anxiety and the Future of
Economic Growth: Is This Time Different? Journal of Economic Perspectives, 29, pp. 31-50.
Nam, T. (2014) Technology Use and Work-Life Balance. Applied Research Quality Life. 9, pp.1017–1040
Nicholas, A. J., and Guzman, I. R. (2009) Is Teleworking for the Millennials? Paper presented at the
SIGMISCPR 2009, May 28–30
Nicholas J. Beutell, (2010) Work schedule, work schedule control and satisfaction in relation to work-family
conflict, work-family synergy, and domain satisfaction. Career Development International, 15(5) pp.501 –
518
Nutt, B. (1999) Linking FM practice and research. Facilities, 17 (1/2), pp. 11-17.
Nutt, B. (2000) Four competing futures for facility management. Facilities, 18 (3/4), pp.124-32.
Osterman, P. (2006) Wage effects of high performance work organization in manufacturing, Industrial and
Labor Relations Review, 59, pp.187–204.
Osin, E, (2009) Subjective Experience of Alienation: Measurement and Correlates. EMPIRISCHE
FORSCHUNG
Pathirage, C., Haigh, R., Amaratunga, D., and Baldry, D. (2008) Knowledge management practices in facilities
organisations: a case study. Journal of Facilities Management, 6(1), pp.5-22.
Pitt, M. (2005) Innovation in strategic supplier contract management. Property Executive, January 2005
Sarpin, N. (2015). Developing people capabilities for the promotion of sustainability in facilitiy management
practices Ph.D., Queensland University of Technology.

821
Senghaas-Knobloch, E. (1998) Von der Arbeits- zur Tätigkeitsgesellschaft? Politikoptionen und Kriterien zur
ihrer Abschätzung’ Feministische Studien, Vol. 16(2), pp. 9-30.
Shah, S. (2007) Sustainable Practice for the Facilities Manager. Blackwell Publishing, Oxford.
Taival, D. (2017). Emerging tools and technologies for high-performance buildings. Retrieved 10/04/2017,
from FMLink Group http://fmlink.com/articles/emerging-tools-and-technologies-for-high-performance-
buildings/
Tajfel, H., and Turner, J. (1986) The social identity theory of intergroup behavior. In S. Worchel & W. Austin
(Eds.), Psychology of Intergroup Relations (pp. 7–24). Chicago: Nelson.
Thompson, C. A., Beauvais, L. L., and Lyness, K. S. (1999) When work-family benefits are not enough: the
influence of work-family culture on benefit utilization, organizational attachment, and work-family conflict.
Journal of Vocational Behavior, 54(3), pp.392–415.
Division for Sustainable Development. Department of Policy Co-ordination and Sustainable Development
(UNDPCSD UN) (1995) Work Programme on Indicators of Sustainable Development, Document
UN/E/CN.17/1995/18. United Nations, New York.
United Nations (UN) (1992) Agenda 21, New York.
United Nations (Ed.) (1993) Earth Summit: Agenda 21, the United Nations programme of action from Rio,
United Nations, New York.
van der Merwe C. (2010) Facilities managers vital in achieving green building targets
http://www.engineeringnews.co.za/article/facility-managers-vital-in-achieving-green-building targets. accessed
30/03/17
van Saane, N. J. K. Sluiter, J. H. A. M. Verbeek and M. H. W. Frings-Dresen (2003) Reliability and validity of instruments
measuring job satisfaction—a systematic review. Occupational Medicine 2003;53:191–200
Van Reenen, J. (2011) Does competition raise productivity through improving management quality?, International Journal
of Industrial Organization. 29, pp.306–16.
Vallance, S., Perkins, H. C. and Dixon, J. E. (2011). What is social sustainability? A clarification of concepts. Geoforum,
42(3).
Valtorta, N. K., Kanaan, M., Gilbody, S., and Hanratty, B. (2016) Loneliness, social isolation and social
relationships: what are we measuring? A novel framework for classifying and comparing tools. BMJ
open, 6(4).
Vanclay, F. (2004) Impact Assessment and the Triple Bottom Line - Competing Pathways to Sustainability?
Sustainability and Social Science: Round Table Proceedings. H. Cheney, E. Katz and F. Solomon.
Melbourne, Institute for Sustainable Futures, Sydney and CSIRO Minerals, Melbourne: 27-39.
Wackernagel, M. and Rees, W. E. (1995) Our Ecolocigal Footprint, Reducing Human Impact on Earth. New
Society Publication, Gabriola Island.
Wackernagel, M. (2001) Shortcomings of the Environmental Sustainability Index. http://www.anti-
lomborg.com/ESI%20critique.rtf (download 01.31.2017).
Ware, J. and Grantham, C. (2003) The future of work: Changing patterns of workforce management and their
impact on the workplace. Journal of facilities management. 2(2), pp.142 – 159.
Wajcman, J., Bittman, M., and Brown, J. (2008). Families without borders: Mobile phones, connectedness and
work-home divisions. Sociology. 40(4), pp.635–652.
Wallace, P. (2004). The Internet in the workplace: How new technology is transforming work. New York:
Cambridge University Press
West, D. M. (2015). What happens if robots take the jobs? The impact of technologies on employment and
public policy.
White, M. and Bryson, A. (2013) Positive employee attitudes: how much human resource management do you
need?, Human Relations, 66, 385–406. doi:10.1177/0018726712465096
Wiewiora, A., Trigunarsyah, B. and Murphy, G. (2010) Knowledge transfer in project based organisation
Rethinking Sustainable Development: Urban Management, Engineering, and Design
World Commission on Environment and Development, WCED (1987) Our Common Future, Oxford University
Press, Oxford
Wolbring, G. and Rybchinski, T. (2013) Social sustainability and its indicators through a disability studies and
an ability studies lens. Sustainability, 5(11), 4889-4907.
Zavaleta, D., Samuel, K., and Mills, C. (2014) Social isolation: A conceptual and measurement proposal (No.
ophiwp067). Queen Elizabeth House, University of Oxford.
Zhang, J. (2016) The dark side of virtual office and job satisfaction. International journal of business and
management. 11(2).

822
ID 044
THE ROLE OF HUMAN ERROR IN ACCIDENTS WITHIN OIL AND
GAS INDUSTRY IN BAHRAIN
M. AlKhldi, C. Pathirage and U. Kulatunga
School of the Built Environment, University of Salford, Salford, M5 4WT, UK
Email: [email protected]
Abstract: Through the last few decades, there is an increase in occupational accidents figures
in different workplaces around the world. A number of causes contributes to these accidents
but one of the main causes of these accidents is human error. Human error is an improper
decision or behaviour of any worker in the workplace which leads to a negative impact on the
workplace. In other words, it is an act which creates an emergency situation, causes loss of
lives, damages property and environment, and hampers the economic activities of any
workplace. In the case of Oil and Gas (O&G) industry, human error constitutes as the largest
contributor of over 70% of all accidents. As O&G industry deals with a variety of risky
chemicals and operations, the costs of these accidents are too high to the employees,
workplace, economy and society. Few studies have paid attention to human error issue
particularly within O&G industry. Therefore, considering human error related accidents within
O&G industry is becoming an important global concern. Thus, the aim of this paper is to
highlight the role of human error in accidents within O&G industry. This will be done through
an extensive review of literature. Paper will provide a definition on human error in general and
in O&G industry and discuss main causes that lead to human error related accidents. Study
will consider Bahrain O&G industry as a case study and explore some recommendations that
help in reducing the occurrence of human error related accidents.
Keywords: Accident, Human Error, Oil and Gas Industry, Safety.
1. INTRODUCTION
During the industrial history, there are several drastic industrial accidents that happened and
resulted in loss in workers’ life and workplaces. Piper Alpha disaster (1988), Bhopal Gas
Plant disaster (1984), Chernobyl Nuclear Power Plant disaster (1986) and BP Deepwater
Horizon Oil Spill disaster (2010) are examples of these accidents. As a result, safety revealed
as a building block of any industrial policy to protect workers against sickness, disease and
injury related to the working environment. Safety is reflected in numbers of believes or myths
like ‘safety first’, ‘safety comes first’ and ‘most accidents are caused by human error’
(Besnard & Hollnagel, 2012). In simple expression, safety is the absence of an undesirable
event that involves an unplanned and unacceptable loss; therefore, safety, risk, beliefs,
perceptions of risk, causes of accidents and safety culture are fundamental prerequisites for
effectively managing risks and designing preventive measures in workplaces (Edwards,
Davey and Armstrong, 2013; Turtiainen and Vaananen, 2012; Nordlöf, Wiitavaara, Winblad,
Wijk and Westerling, 2015). Thus, today more than ever, most types of industries have
started to concern about ensuring safety, identifying, evaluating, and managing different risks
and reducing accidents (Díaz-de-Mera-Sanchez, Gónzalez-Gaya, Morales and Rosales, 2015;
Zakaria, Mansor and Abdullah, 2012; Besnard & Hollnagel, 2012).
This concern is highly required in risky workplaces like O&G industry as the economic
perspective of the accidents in this industry is an important issue (Bolu, 2011). Health and
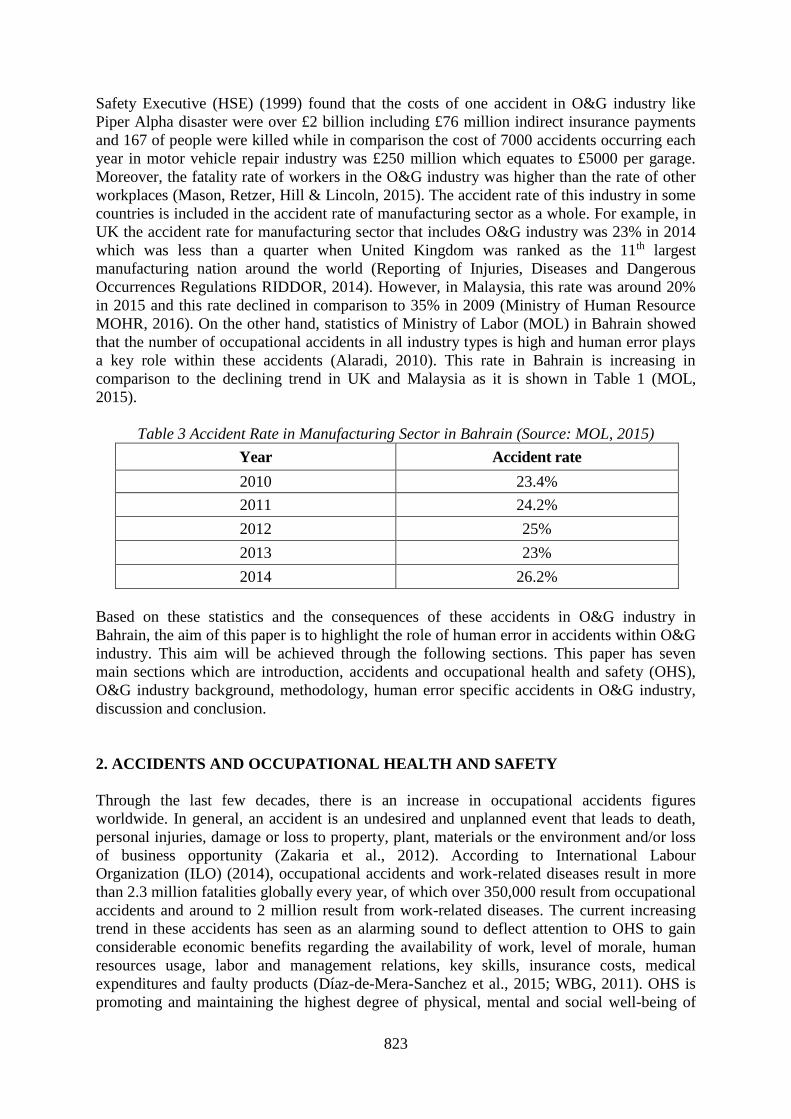
823
Safety Executive (HSE) (1999) found that the costs of one accident in O&G industry like
Piper Alpha disaster were over £2 billion including £76 million indirect insurance payments
and 167 of people were killed while in comparison the cost of 7000 accidents occurring each
year in motor vehicle repair industry was £250 million which equates to £5000 per garage.
Moreover, the fatality rate of workers in the O&G industry was higher than the rate of other
workplaces (Mason, Retzer, Hill & Lincoln, 2015). The accident rate of this industry in some
countries is included in the accident rate of manufacturing sector as a whole. For example, in
UK the accident rate for manufacturing sector that includes O&G industry was 23% in 2014
which was less than a quarter when United Kingdom was ranked as the 11th largest
manufacturing nation around the world (Reporting of Injuries, Diseases and Dangerous
Occurrences Regulations RIDDOR, 2014). However, in Malaysia, this rate was around 20%
in 2015 and this rate declined in comparison to 35% in 2009 (Ministry of Human Resource
MOHR, 2016). On the other hand, statistics of Ministry of Labor (MOL) in Bahrain showed
that the number of occupational accidents in all industry types is high and human error plays
a key role within these accidents (Alaradi, 2010). This rate in Bahrain is increasing in
comparison to the declining trend in UK and Malaysia as it is shown in Table 1 (MOL,
2015).
Table 3 Accident Rate in Manufacturing Sector in Bahrain (Source: MOL, 2015)
Year Accident rate
2010 23.4%
2011 24.2%
2012 25%
2013 23%
2014 26.2%
Based on these statistics and the consequences of these accidents in O&G industry in
Bahrain, the aim of this paper is to highlight the role of human error in accidents within O&G
industry. This aim will be achieved through the following sections. This paper has seven
main sections which are introduction, accidents and occupational health and safety (OHS),
O&G industry background, methodology, human error specific accidents in O&G industry,
discussion and conclusion.
2. ACCIDENTS AND OCCUPATIONAL HEALTH AND SAFETY
Through the last few decades, there is an increase in occupational accidents figures
worldwide. In general, an accident is an undesired and unplanned event that leads to death,
personal injuries, damage or loss to property, plant, materials or the environment and/or loss
of business opportunity (Zakaria et al., 2012). According to International Labour
Organization (ILO) (2014), occupational accidents and work-related diseases result in more
than 2.3 million fatalities globally every year, of which over 350,000 result from occupational
accidents and around to 2 million result from work-related diseases. The current increasing
trend in these accidents has seen as an alarming sound to deflect attention to OHS to gain
considerable economic benefits regarding the availability of work, level of morale, human
resources usage, labor and management relations, key skills, insurance costs, medical
expenditures and faulty products (Díaz-de-Mera-Sanchez et al., 2015; WBG, 2011). OHS is
promoting and maintaining the highest degree of physical, mental and social well-being of

824
workers in all occupations, preventing departures from workers’ health caused by their
working conditions, protecting workers from risks resulting from factors adverse to health
and placing and maintaining the worker in an occupational environment adapted to his
physiological and psychological capabilities (WBG, 2011).
Walters, Wadsworth and Quinlan (2013) argued that introducing and managing OHS in a
workplace are based on how this workplace operates and what types of risks it has. Besides,
identifying the causes of any accident is also a fundamental requirement. Based on literatures,
many causes of accidents were identified as it is shown in Figure 1. Human error is one of
critical causes, which will be explained in the next section.
Figure 29: Causes of Accidents
2.1 Human Error
Human error constitutes as the largest cause of up to 80% of all workplace accidents and it
was a root cause of all critical accidents in recent memory, including the Bhopal Gas Plant
disaster, Hillsborough football stadium disaster, Paddington and Southall rail crashes,
capsizing of the Herald of Free Enterprise, Chernobyl and Three-Mile Island incidents and
the Challenger Shuttle disaster (Pitblado & Nelson, 2013; Manchi, Gowda & Hanspal, 2013;
Zeng, Tam & Tam, 2008). Mattia (2013) and Patel, Sherratt and Farrell (2012) found that
human error was and still is a concern of different researches and books since the Domino
Theory of Heinrich. Heinrich is a leader of Industrial Safety Engineer (Mattia, 2013; Patel,

825
Sherratt and Farrell, 2012) and he described human error as a poor behaviour or an
inadequate risk perception (Patel et al., 2012). In addition, Manchi et al. (2013) described it
as a result of human nature. It is deemed as an improper decision or behavior of a worker
which may has a negative impact on the effectiveness of safety performance system.
However, Mattia (2013) interpreted human error as a natural consequence that is resulted
from a break between human capacities (human) and the demands of processes and
procedures (machine). He also found that human error is a result of lack of situation
awareness, which is the perception of components in the process environment, the
understanding of the meaning of these components and the projection of their situation in the
future. However, earlier researches also had expressed human error. For example, Zhu and
Xiao-ping (2009) found from the perspective of human mind that human error happens due to
the artificial mistakes, whether intentional or unintentional. As well as, Zeng et al. (2008)
claimed that human error that potentially causes an accident can be referred as an unsafe act
that depart from hazard control or job procedures to which the person has been trained or
informed and in turn this act leads to unnecessary exposure of a person to hazards.
Further, Reason (1990) and Kontogiannis and Embrey (1992) have introduced different
classifications to illustrate this term as it is summarized in Table 2 and Table 3. According to
Reason (1990), human failure is divided into two main categories which are human error and
violation. Human error is by definition, an unintentional action or decision whereas violation
is a deliberated intention to do the wrong thing or to depart from safe operating procedures,
recommended practices, rules, standards or any noncompliant acts but not the bad
consequences. Simply, human error is the failure of planned actions to reach the desired aim
(Reason, 1990). Based on that, human error is divided into three main categories as slip, lapse
and mistake. Slip and lapse are considered as failures in the execution time of routine and
well-practiced tasks in a familiar environment. Within these two categories, the planned
action does not go as planned or properly because something happened and prevented that.
Slip occurs when actions were not carried out as intended or planned while lapse occurs when
actions were missed. This scenario occurs due to confusing or poor labelling. On the other
hand, mistakes occur in the planning phase. Mistakes are defined as actions that are executed
entirely as planned, but the plan itself is inadequate to achieve the intended outcome.
Mistakes occur due to a lack of knowledge or an inappropriate judgement. Reason (1990)
also divided mistake into two categories based on the level of performance at which they
occur as rule-based mistakes and knowledge-based mistakes. Indeed, rule based mistake
describes a failure in the selection or application of problem solving rules. These problem
solving rules are predefined rules that are known from experience and training. In contrast,
knowledge-based mistake describes a failure of information processing capabilities of a
worker while evaluating and solving a novel problem that does not have any pre-packaged
rules. This form of mistake requires a solution from first principles.
Table 4: Reason's (1990) Classification of Human Error
Classification of human error based on Reason (1990)
Slips: Actions were not carried out as intended or planned.
Lapses: Actions were missed.
Mistakes: A plan was inadequate to achieve the intended outcome.
Apart from that, Kontogiannis and Embrey (1992) have formulated another classification
structure of human error. They divided human errors into six types which are action,
checking, retrieval, transmission, diagnostic and decision errors. First, action errors occur

826
when no action is taken or the wrong action is taken or the correct action is taken but on the
wrong object. Second, checking errors occur when the checks are omitted, the wrong checks
are made or the correct check is made on the wrong object. Third, retrieval errors occur when
information that is required is not available, or the wrong information is received. Fourth,
transmission errors occur when information has to be passed onto someone else,no
information is sent, the wrong information is sent, or it is sent to the wrong place. Fifth,
diagnostic errors occur when an abnormal event arises and the actual situation is
misinterpreted. Last but not least, decision errors occur when the circumstances were
considered but the wrong decision is made. In fact, action and checking errors are related to
Reason's (1990) skill-based slips and lapses, retrieval and transmission errors are related to
Reason's (1990) rule-based mistakes and diagnostic and 'decision' errors are related to
Reason's (1990) knowledge-based mistakes.
Table 5: Kontogiannis and Embreys’ (1992) Classification of Human Error
Classification of human error based on Kontogiannis and Embrey (1992)
Action errors: No action was taken/ wrong action was taken.
Checking errors: Checks were omitted/ wrong checks were made.
Retrieval errors: Required information was not available/ wrong information
was received.
Transmission errors: No information was sent/ wrong information was sent/
information was sent to the wrong place.
Diagnostic errors: Misinterpretation of an abnormal event.
Decision errors: Wrong decision was made.
As many definitions tried to define human error differently, human error is an unintended
failure of achieving the planned outcomes in a form of action, checking, retrieval,
transmission, diagnostic and decision errors. Thus, this definition has four main
characteristics as:
1. there was no intention to commit an error,
2. the action was purposeful,
3. the action was action error, checking error, retrieval error, transmission error,
diagnostic error or decision error,
4. the intended outcome was not achieved.
Having discussed accidents and human error in general, next section will discuss O&G
industry and its current challenges from different angles.
3. O&G INDUSTRY BACKGROUND
O&G industry is an important part of the national economy and a backbone of the economy
of most countries located in the Middle East like Bahrain and other regions worldwide
(Mitchell et al., 2012). It is divided into three major units as upstream, midstream and
downstream. The upstream unit embodies exploration, development, drilling and production
of crude oil or natural gas. While the midstream unit focuses on processing and gathering the
crude oil and gas and the downstream unit involves refining, storing, distributing and
marketing petroleum products to domestic and industrial consumers. O&G industry has
grown rapidly over the past 40 years and it is expected to grow more with a strong demand

827
(Mattia, 2013). Despite the fact that the recent rapid development projects in this industry
have provided a wealth of new jobs and a burst of economic vitality for various countries,
these benefits are at a cost (Paraventi, 2014).
The ageing O&G industry presents with numerous challenges that limit many developments.
First of all, the price of oil is currently a great deal of uncertainty. As well as, O&G industry
nowadays is confronting a sharpened focus on cost and an increased demands for uptime
(Christ, 2015). Indeed, this industry is highly vulnerable to risks as many built-in health and
safety risks may appear in most of the levels, operational conditions, production projects,
facility operations, maintenance, construction, transport, storage, chemicals and end products
which may spark serious health and safety problems and accidents (Awodele et al., 2014;
Achaw & Boateng, 2012). Unfortunately, accidents are still relatively common in O&G
industry (Christ, 2015; Pitblado and Nelson, 2013). Paraventi (2014) found that the rate of
accidents in O&G industry is two and a half times higher than the construction industry and
seven times higher than general industries.
3.1 O&G Industry in Bahrain
O&G industry is a pillar of Bahrain’s economy. It covers the exploration, production,
refining, marketing, and distribution of Bahraini oil for both domestic use and the
international market such as Middle East, India, the Far East, South East Asia and Africa
(Economic, 2013; EIA, 2011). O&G industry reserves more than 80% of total government
revenues and more than 60% of total exports (EIA, 2011). Several new investments and
competing projects are being planned or have recently been completed in O&G industry in
Bahrain. For example, the current government policy in this industry is to consolidate the oil
industry through further development in petroleum resources, improvement in seismographic
surveys and enhancement in developmental drilling which all lead to explore new sources of
O&G (WTO, 2014) and to double output from O&G fields (Economic, 2016). On the other
hand, several challenges are facing O&G industry in Bahrain which will be illustrated in the
next sub-sections.
Challenges as a Developing Country
Bahrain as a developing country that operates in today globalized market is enforced to
operate among several regions and countries. As a result, a new challenge is initiated to
propose more sophisticated accident prevention programs and OHS management systems
taking into account cultural differences (Hassanzadeh, 2013). Furthermore, the complexity of
the required instrumentation, regulatory regime, expertise and technology in O&G industry,
the nature of the impact of the products, by-products and waste products on human health and
the environment are main questions in this industry especially with the global trend for a safe
and friend environment (Achaw & Boateng, 2012). Besides, Marcella et al. (2011) have
indicated that this industry within these countries requires better OHS regulations, greater
consistency, better safety standards and better enforcement due to lack of openness and
sharing across management, robust safety assessment, agreement on competence
measurement techniques and accurate training program. After explaining these challenges,
the next section will explain challenges of petroleum countries.

828
Challenges as a Petroleum Country
Bahrain as a petroleum country is confronting also with several health and safety related
problems regarding their economy and nature. For example, there are limited integrated
researches on the region's long-term institutional and sectoral development and hence its
long-term geoeconomic significance is missed (AlBanna, 2002; Matooq & Suliman, 2013).
Further, ports and oil terminals in Bahrain are at high risk of major oil spills and accidents
(Naser, 2011). Besides, details and statistics of occupational accidents in Bahrain are seldom
recorded and this may be explained by likelihood of recording bias (Matooq & Suliman,
2013). Additionally, these statistics do not contain a lot of data about the root causes of the
accidents (Matooq and Sulima, 2013; Bahrain News Agency BNA, 2013; AlBanna, 2002);
thereby, Matooq and Suliman (2013) indicated that OHS framework in Bahrain is not suitable
now to depend on. However, National Examination Board of Occupational Safety and Health
(NEBOSH) in 2007 and Matooq and Suliman (2013) have confirmed that safety framework
in Bahrain needs strongly more redesigning and development plans with more fairness and
transparency in enforcement decisions. On top of that, there are no ongoing dedicated
regulations for the processes in O&G industry. This poses a question to Bahrain, especially as
it concerns on generating revenue instead of improving OHS standards while other
industrialized countries are contemplating the importance of OHS laws within this industry
(Neave, 2010).
4. METHODOLOGY
An extensive literature review of existing published relevant materials is carried out to
explain human error, O&G industry and human error specific accidents in O&G industry in
general and in Bahrain in specific. These relevant materials include textbooks, journals,
conference papers, and Internet information that assist in capturing the background of
accident and human error specific accidents in O&G industry in general and in Bahrain in
specific. Some Bahrain’s Governmental publications from the Ministry of Labor were also
used to show some critical statistics related to the aim of this paper. The main purpose behind
reviewing all these materials is to address human error related accidents in O&G industry in
Bahrain by explaining the real setting of this issue and developing clear insights regarding it
in order to provide some recommendations and solutions that help in reducing the occurrence
of this type of accidents in this industry.
5. HUMAN ERROR SPECIFIC ACCIDENTS IN O&G INDUSTRY
Different causes were identified in literatures that focused on why an accident has occurred in
O&G industry as they are shown in Table 4. The most common contributor with over 70% of
all O&G industry accidents is human error (Bhavsar, Srinivasan and Srinivasan, 2015).
Pitblado and Nelson (2013) and Mattia (2013) pointed out that the recent ongoing series of
major accidents showed that current safety management programmes and improvement are
not sufficiently effective in treating human element appropriately in O&G industry. However,
Bhavsar et al. (2015) indicated that the cognitive challenges faced by operational workers
during their interactions with the process and decision making in this industry were behind
this high rate. To sum up, Lawyers and Settlements (2011) argued that accidents in O&G
industry typically occur due to worker’s carelessness or recklessness, workers postpone the

829
equipment’s maintenance or repair and worker’s misunderstanding. Next sub-section will
explain human error in O&G industry in Bahrain.
Table 6: Causes of Accidents in O&G Industry
Causes of accidents in O&G industry Authors
Human error (Mattia, 2013) and (Bhavsar,
Srinivasan and Srinivasan, 2015)
Ineffective safety management programs (Pitblado and Nelson, 2013)
High numbers of active drillings
Inexperienced workers
(Christ, 2015), (Paraventi, 2014),
(NIOSH, 2014) and (Lawyers and
Settlements, 2011)
Continuous increasing demand (Christ, 2015), (Paraventi, 2014),
(NIOSH, 2014) and (Lawyers and
Settlements, 2011)
Risk inherent to the production activity
Level of training of workers
(Díaz-de-Mera-Sanchez et al.,
2015)
High numbers of people employed
Nature of drilling process
(Lawyers and Settlements, 2011)
Reoccurring disruptions during daily operations
Pre-warning signals
(Korvers & Sonnemans, 2008)
Unique job requirements
Labor-intensive
Work overtime
Hard activities
(Roth, 2006)
Inadequate training strategies
Poor maintenance priorities
Inadequate supervision
Failure of effective hazard identification
Inadequate auditing
(Anderson, 2005)
5.1 Human Error issues in O&G Industry in Bahrain
As many projects have been undertaken recently in O&G industry in Bahrain and notable
improvements have presented currently, these projects have appeared with several
shortcomings. For instance, the evaluation of impacts of these projects on workers, workplace
and environment is not sufficiently adequate as the cumulative and long-term impacts are
neglected in addition to the fail in addressing the monitoring measures effectively in this
industry (Naser, 2011). These shortcoming are putting Bahrain nowadays under a permanent
threat from O&G industry especially as Bahraini ports and O&G terminals are at high risk.
Further, from nineteens different researchers, like Madany, Jaffar and Al-Shirbini (1998), De
Mora, Tolosa, Fowler, Villeneuve, Cassi and Cattini (2010), Naser (2011) and Freije (2013)
have remarked that some mistakes during several operations and maintenance activities done
by workers in O&G industry in the coastal areas of Bahrain were the primary causes of
accidents in this area. In 2000, this industry in Bahrain had recorded six oil spills, including
leakages in pipelines, over flooding of containers, weathered oil and tarballs, and incidents
during loading of tankers in the terminals.

830
Though, these accidents led to oil spillages which have a strategic effects on people,
workplace and environment. For instance, this kind of human error in this industry were
behind the increase of hydrocarbon concentrations in this place (De Mora et al., 2010; Naser,
2011; Freije, 2013). Additionally, all these researches confirmed that the highest pollution
concentrations in GCC countries were particularly in the places that have continuous human
interventions to transport oil and clean oil tankers. This indicates that workers in these places
did some errors while they are proceeding their job and this have created cumulatively in this
highest pollution. Besides, Sheppard, Al-Husiani, Al-Jamali, Al-Yamani, Baldwin, Bishop,
Benzoni, Dutrieux, Dulvy, Durvasula and Jones (2010) and Naser (2011) have noticed an
escalating in human activities in the area of O&G industry in Bahrain which have several
negative effect on human, workplace and environment in Bahrain. On top of that, Salminen
(2011) expressed that the foreign employees were mostly behind the most of occupational
accidents in Bahrain. Further, Alaradi (2010) found that workers’ mistakes are behind the
delay in daily procedures which indeed hinders several improvement in this industry.
Therefore, Naser (2011) has indicated the importance of improving worker’s understanding
regarding the negative impacts of their mistakes.
6. DISCUSSION
As recent industrial statistics in O&G industry have revealed a high rate of occupational
accidents that were caused by human error and have a great toll on workers, workplace and
environments, attention should be diverted to investigate human error extensively even if
some research have started to do so because still various perspectives remain question till yet.
Serious attention should be paid currently because most of the expletory attentions to
improve OHS performance were allocated to Nuclear and Aviation industry (Mattia, 2013)
and to construction industry (Patel et al., 2012) but not O&G industry. On top of that, as
currently this industry has a rapid pace of growth in demand along with an uncertain price of
oil, this industry should shed lights on reducing costs and accidents by controlling risks
across all different levels. Thus, O&G industry should give safety a top priority and
continually build upon this record. In other words, this industry should press ahead to ensure
that safety issues meet international standards and best practices that are needed to build and
maintain safety with the lightest environmental footprint possible (API, 2016).
Nevertheless, as human error seems as a failure in the interactions between workers and other
factors in the workplace, understanding the real setting of a human error specific accident is
not just a seldom concept, rather, it is an integrated one that embeds factors like individuals,
workplace components and environment. Hence, if there is a gap in one or more of these
factors then errors will be common and accidents will be more probable. However, as the
relationships among these factors and safety practices are complex, safety issues cannot be
adequately addressed in any workplace using technical analysis solely instead a broader
strategy that outlines the strategic direction of workplaces is required increasingly (Johnson,
Whittington, Scholes, Angwin, & RegnŽr, 2013) especially to enable OHS at work widely. It
is important to note here, as there is no best strategy and even if any strategy built a success it
will not stand as a best without any alterations; therefore, radical changes in this strategy are
required to remain effective and relevant.
Apart from that, driving a safety culture in the industry is a significant contributor. This can
be achieved by creating a multidisciplinary team that directs this culture. This team indeed
understands the needs of the industry and the gaps in skills clearly. Therefore, this team

831
should invest in the human capital of the industry and especially in the talented one to address
the shortage in any required personnel capabilities and skills. This team also should be
responsible for creating an open channel for new ideas and encouraging innovative ways of
working. Nevertheless, adapting Information Communication Technologies (ICT) in this
industry is a valuable point that should be added to the strategic agendas of the industry in
order to take advantage from the current trend of digital transformation which is described by
an extensive use of ICT and automation systems. Aligning with the benefits of these
technologies, companies in this industry should develop collaborative partnerships and beers
and invest together through these technologies in order to generate, innovate, share, analyze,
store data quickly. This point is an important enabler for this industry if the current concerns
over data privacy and usage, security and interoperability are addressed and balanced.
On the other hand, O&G industry is thirsting for any extensive studies on a continuous basis
to improve its performance and reduce accident rate as the mainstream of research tends to
reflect the priorities of political and economic elites. Therefore, governments in
petrochemical countries in specific should reform this stream to safety aspects and
applications through shaping, for example, shared safety information systems, research
donations and partnerships. In addition, these governments should increase the awareness of
carrying out this nation widely in the nearest future in contrast with the status quo of silence.
Moreover, governments should establish an authorized agency or authority that works as a
coordinator or regulator. This coordinator tends to oversight and coordinate O&G industry
and other essential industries to ensure that these industries survive within safe workplace
conditions. Besides, this party is responsible of issuing annual risk assessment reports and
evaluating all comments. It is important to mention that having this authority will not neglect
the importance of having a safety committee in each industry also.
Finally, these recommendations need first to be sponsored from the top and then to set a clear
vision, commit funding and resources and actively coordinate the associated management
changes in order to ensure that these recommendations are fully integrated into the industry’s
core business. On top of that, O&G industry, governments and other related parties will not
maximize the benefits of these recommendations to reduce human error accidents if they each
act separately. Instead, addressing human error accidents with all these parties stands to reap
potential gains that have never been greater.
7. CONCLUSION
From the overall review of the literature, O&G industry in general and in Bahrain in specific
has a strategic importance in the national and local economy and safety is a core value in this
industry. Unfortunately, accidents are common in this industry in general and the main cause
of most of these accidents is referred to human error. In Bahrain, human error specific
accidents in O&G industry are also high. This problem is increasing recently during the
pressure of high demand. Many negative consequences and costs on workers, workplace and
environment were recorded. As a result, this industry in general have started to adopt
different safety-related programmes and systems to reduce this high rate of human error
specific accidents. In conclusion, addressing human error effectively can be a challenging,
but necessary, endeavour. Clearly, focusing on the real scheme of these accidents in this
industry and committing to safety requirements in all operations may assist in overcoming
this problem and identifying various solutions. Further empirical studies of this problem in
Bahrain are needed as it has not been sufficiently researched to date. These studies should

832
place particular emphasis on not only OHS implementation and legislations in the overall
industry in Bahrain but also on improving the employees in term of their safety awareness.
8. REFERENCES
Abbe, O.O., Harvey, C.M., Ikuma, L.H. and Aghazadeh, F., 2011. Modeling the relationship between
occupational stressors, psychosocial/physical symptoms and injuries in the construction
industry. International Journal of Industrial Ergonomics, 41(2), pp.106-117.
Achaw, W. and Boateng, D., 2012. Safety practices in the oil and gas industries in Ghana, International Journal
of Development and Sustainability 1 (2), 456–465.
Alaradi, H., 2010. Training. Bay Publishing Magazines. Retrieved August 22, 2016, from
http://www.hsmemagazine.com/article.php?article_id=228
AlBanna, N., 2002. Development an Occupational Injury Reporting System for the Kingdom of Bahrain.
American Petroleum Institute (API), 2016. Gulf of Mexico offshore Safety. Retrieved August 30, 2016, from
http://www.api.org/oil-and-natural-gas/environment/clean-water/oil-spill-prevention-and-response/gulf-of-
mexico-offshore-safety
Anderson, M., 2005. Behavioural safety and major accident hazards: Magic bullet or shot in the dark?. Process
Safety and Environmental Protection, 83(2), pp.109-116
Awodele, O., Popoola, T.D., Ogbudu, B.S., Akinyede, A., Coker, H.A. and Akintonwa, A., 2014. Occupational
hazards and safety measures amongst the paint factory workers in Lagos, Nigeria. Safety and health at
work, 5(2), pp.106-111.
Besnard, D. and Hollnagel, E., 2012. Some myths about industrial safety (Doctoral dissertation, MINES
ParisTech).
Bhavsar, P., Srinivasan, B. and Srinivasan, R., 2015. Pupillometry based Real-time Monitoring of Operator’s
Cognitive Workload to Prevent Human Error during Abnormal Situations. Industrial & Engineering
Chemistry Research, 55(12), pp.3372-3382.
Bolu, A.G., Economics of Safety: An empirical Study.
Boughaba, A., Hassane, C. and Roukia, O., 2014. Safety culture assessment in petrochemical industry: a
comparative study of two Algerian plants. Safety and health at work, 5(2), pp.60-65.
Christ, G., 2015. Safety 2015: The Oil and Gas Industry’s Death Problem. EHS Today, [online] p.A single page.
Available at: http://ehstoday.com/safety-leadership/safety-2015-oil-and-gas-industry-s-death-problem
[Accessed 21 Apr. 2017].
De Mora, S., Tolosa, I., Fowler, S.W., Villeneuve, J.P., Cassi, R. and Cattini, C., 2010. Distribution of
petroleum hydrocarbons and organochlorinated contaminants in marine biota and coastal sediments from
the ROPME Sea Area during 2005. Marine pollution bulletin, 60(12), pp.2323-2349.
Det Norske Veritas and Germanischer Lloyd (DNV.GL), 2016. Human factors in the O&G industry - Oil & Gas
- DNV GL. Retrieved August 30, 2016, from https://www.dnvgl.com/services/human-factors-1094
Díaz-de-Mera-Sanchez, P., Gónzalez-Gaya, C., Morales, F. and Rosales, V., 2015. Strengthening Competencies
in Learning of Industrial Safety Focused on Projects. Procedia Engineering, 132, pp.183-189.
Economic, B., 2013. Development Board. Kingdom of Bahrain Economic Yearbook 2013.
Economic, B., 2016. Development Board. Kingdom of Bahrain Economic Quarterly March 2016.
Edwards, J.R., Davey, J. and Armstrong, K., 2013. Returning to the roots of culture: A review and re-
conceptualisation of safety culture. Safety science, 55, pp.70-80.
Energy Information Administration (EIA), 2011. Country Analysis Brief – Bahrain, last updated: March 2011,
available at http://www.eia.gov/EMEU/cabs/ Bahrain/pdf.pdf
Freije, A.M., 2015. Heavy metal, trace element and petroleum hydrocarbon pollution in the Arabian Gulf:
review. Journal of the Association of Arab Universities for Basic and Applied Sciences, 17, pp.90-100.
Hassanzadeh, M.A., 2013. Competitive Advantages of Occupational Health and Safety Management Systems
for Ports. Occupational Medicine & Health Affairs.
HSE, U., 1999. HSG48, Reducing Error and Influencing Behaviour. ISBN 0, 7176(2452), p.8.
ILO, S., 2014. Health at work: a vision for sustainable prevention: XX World Congress on Safety and Health at
Work 2014: Global Forum for Prevention, 24–27 August 2014, Frankfurt, Germany. International Labour
Office.
Information Affairs Authority, 2013. Occupational Health and Safety. Manama: Information Affairs Authority,
p.A single page. Retrieved August 30, 2016, from http://www.bna.bh/portal/en/news/550343
Johnson, Whittington, Scholes, Angwin & RegnŽr, 2013. Exploring Strategy Text & Cases. UK: Pearson
Higher Ed. 16.
833
Kontogiannis, T. and Embrey, D., 1992. Human reliability assessment. Practical Techniques for Assessing and
Reducing human error in industry.
Körvers, P.M.W. and Sonnemans, P.J.M., 2008. Accidents: a discrepancy between indicators and facts!. Safety
Science, 46(7), pp.1067-1077.
Lawyers and settlements, 2011. Oil and Gas Accidents. Retrieved August 30, 2016, from
https://www.lawyersandsettlements.com/lawsuit/oil-and-gas-accidents.html
Madany, I.M., Jaffar, A. and Al-Shirbini, E.S., 1998. Variations in the concentrations of aromatic petroleum
hydrocarbons in Bahraini coastal waters during the period October 1993 to December 1995. Environment
International, 24(1-2), pp.61-66.
Manchi, G.B., Gowda, S. and Hanspal, J.S., 2013. Study on cognitive approach to human error and its
application to reduce the accidents at workplace. International Journal of Engineering and Advanced
Technology (IJEAT), 2(6), pp.236-242.
Marcella, R., Pirie, T. and Doig, D., 2011. Tick safety not boxes: competency and compliance in the oil and gas
industry.
Mason, K.L., Retzer, K.D., Hill, R. and Lincoln, J.M., 2015. Occupational fatalities during the oil and gas
boom—United States, 2003-2013. Morbidity and Mortality Weekly Report, 64, pp.551-554.
Matooq, A. and Suliman, S.M., 2013. Performance measurement of occupational safety and health: model for
Bahrain inspectorates. Journal of Safety Engineering, 2(2), pp.26-38.
Mattia, D., 2013. Evaluation and Mitigation of Human Error during LNG Tanker Offloading, Storage and
Revaporization through Enhanced Team Situational Analysis. ExxonMobil Production Company.
Ministry of Human Resource Portal in Malaysia, 2016. Retrieved August 22, 2016, from
http://www.mohr.gov.my/index.php/en/
Ministry of Labor, 2015. Occupational Accidents by Sector until December 2014 (Investigated).
Naser, H., 2011. Human impacts on marine biodiversity: macrobenthos in Bahrain, Arabian Gulf. INTECH
Open Access Publisher.
Neave, A., 2010. SH&E Challenges in the Gulf. World Focus Newsletter, American Society of Safety
Engineers.
Nordlöf, H., Wiitavaara, B., Winblad, U., Wijk, K. and Westerling, R., 2015. Safety culture and reasons for risk-
taking at a large steel-manufacturing company: investigating the worker perspective. Safety science, 73,
pp.126-135.
Paraventi, M., 2014. How to reduce the high fatality rate in oil & gas. Retrieved August 31, 2016, from
http://www.ishn.com/articles/99967-how-to-reduce-the-high-fatality-rate-in-oil-gas
Patel, M., Sherratt, F. and Farrell, P., 2012, September. Exploring human error through the safety talk of utilities
distribution operatives. In Proceedings 28th Annual ARCOM Conference (pp. 403-12).
Payne, N., 2011. Machinery accidents in the workplace. Retrieved March 8, 2016, from
http://www.articlesnatch.com/Article/Machinery-Accidents-In-The-Workplace.
Pitblado, R. and Nelson, W.R., 2013. Advanced safety barrier management with inclusion of human and
organizational aspects. Chemical engineering transactions, 31.
Reason, J., 1990. Human error. Cambridge university press.
Reporting of Injuries, Diseases and Dangerous Occurrences Regulations, 2014. Retrieved August 22, 2016,
from http://www.hse.gov.uk/riddor/
Roth, C., 2006. Fueling Ergonomics in the O&G industry. Retrieved August 26, 2016, from
http://ehstoday.com/health/ergonomics/ehs_imp_38328
Salminen, S., 2011. Are Immigrants at Increased Risk of Occupational Injury? A Literature. The Ergonomics
Open Journal, 4, pp.125-130.
Sheppard, C., Al-Husiani, M., Al-Jamali, F., Al-Yamani, F., Baldwin, R., Bishop, J., Benzoni, F., Dutrieux, E.,
Dulvy, N.K., Durvasula, S.R.V. and Jones, D.A., 2010. The Gulf: a young sea in decline. Marine Pollution
Bulletin, 60(1), pp.13-38.
Turtiainen, J. and Väänänen, A., 2012. Men of Steel? The masculinity of metal industry workers in Finland after
World War II. Journal of Social History, 46(2), pp.449-472.
Unnikrishnan, S., Iqbal, R., Singh, A. and Nimkar, I.M., 2015. Safety management practices in small and
medium enterprises in India. Safety and health at work, 6(1), pp.46-55.
Walters, D., Wadsworth, E.J.K. and Quinlan, M., 2013. Analysis of the determinants of workplace occupational
safety and health practice in a selection of EU member states.
World Bank, 2011. Guidance Notes on Tools for Pollution Management.
World Trade Organization (WTO), 2014. Trade Policy Review Body: Bahrain. Retrieved August 30, 2016, from
https://www.wto.org/english/tratop_e/tpr_e/s294_e.pdf
Zakaria, N.H., Mansor, N. and Abdullah, Z., 2012. Workplace accident in Malaysia: most common causes and
solutions. Bus Manag Rev, 2, pp.75-88.

834
Zeng, S.X., Tam, V.W. and Tam, C.M., 2008. Towards occupational health and safety systems in the
construction industry of China. Safety science, 46(8), pp.1155-1168.
Zhu, J. and Xiao-ping, M., 2009. Safety evaluation of human accidents in coal mine based on ant colony
optimization and SVM. Procedia Earth and Planetary Science, 1(1), pp.1418-1424.

835
ID 063
CHANGE MANAGEMENT IN PUBLIC AGENCIES TO ATTAIN
EFFICIENCIES
K. Ibbotson and P. Farrell
School of Engineering, University of Bolton, Deane Road, Bolton. BL3 5AB, UK
Email: [email protected]
Abstract: There is great impetus to implement change in all areas of the UK economy. Key
aims are to progress low carbon solutions, reduce costs and to increase efficiency. There are
often difficulties in putting change into practice, evidenced by the perceived lack of progress
on 1990s recommendations by Latham and Egan. Change can be most difficult in the public
sector; whereby long established ways of working are culturally ingrained. The foundation for
this research is a comprehensive literature review, followed by an electronic survey of
practising professionals in a leading government agency that procures major Flood and
Coastal Risk Management construction projects. The survey embraces the whole supply chain
of the agency, since many authoritative sources call for integration, and for change to be
implemented in partner organisations. The main analytical approach is quantitative. There is
a focus upon the role of leadership in implementing change and judgements are made about
whether the knowledge level of practitioners is sufficient to allow them to drive new
initiatives. Conclusions and recommendations are made regarding training, knowledge
management, organisational culture and low carbon prioritisation.
Keywords: Construction, Low carbon solutions, Organisational culture.
1. INTRODUCTION
n an everchanging economic climate and a fast-paced work environment, trying to put change
into practice becomes a challenging task. The difficulties of implementing change however,
are not specific to the here and now, with the UK construction industry having had many
attempts to move into a more ‘Lean’ and innovative industry; recommendations by Latham
(1994) and Egan (1998) highlighted the need for the industry as a whole to improve. These
previous attempts have been limited, with Egan stating that ‘Since 1998 we could have had a
revolution and what we’ve achieved so far is a bit of improvement’ (Wolstenholme, 2009).
The question then is why have previous attempts at implementing change been received with
enthusiasm, but the results have been limited in their effect? According to Wolstenholme
‘the construction industry has been sheltered by a strong economy. This has enabled
construction to prosper without having to strive for innovation’. The review by Farmer
(2016) also highlights the fragmented leadership role within government and asserts the
current ambitions highlighted within the Construction 2025 (HM Government, 2013) report
regarding Carbon reduction ‘look impossible to achieve’. It does however, note that some
sectors are actively focusing ‘on key industry issues that can deliver change and enable the
construction supply chain to improve the efficiency and delivery of construction projects for
the benefit of the UK economy’ (Farmer, 2016).
Today’s economic climate is different and offers an opportunity to think again, with both
risks and opportunities (Wolstenholme, 2009; GLA Economics, 2008; Sundar, 2013; Farmer,
2016). To address the underlying issue of whether the construction industry and the public
sector will be successful in implementing current Government initiatives for change, further

836
understanding of organisational culture and change is required. Employees in both public
and private sectors, and in all areas of the value chain need to buy-in to change processes for
this to be successful; the process for change needs to be linked to organisational culture. The
challenge for public sector organisations and their supply chain is to ensure that Government
priorities for a low carbon economy, are fully understood, embedded and prioritised on public
sector construction schemes. This is in addition to the demand for construction schemes to be
built on time, to the required engineering and environmental quality and cost, and meeting the
needs of partnership funding bodies and stakeholders. All of these requirements do not
always cohesively work together in an asset management environment, and can result in
conflicting priorities and rely on a collaborative approach and common objectives. The
collaborative and common objective approach to low carbon is supported by the Publicly
Available Standard (PAS) 2080 report, which outlines the roles and responsibilities for all
members of the value chain, who have the ability to influence carbon reduction (Construction
Leadership Council, 2016).
The construction industry has been affected by many Government initiatives focused on
improvement. The ‘Never Waste a Good Crisis’ (Wolstenholme, 2009) report suggests that
changes to the industry have not been as wide ranging or self-evident due to lack of
incentives, which has been masked by a buoyant economy and it is only since the recent
recession within the UK that organisations are having to make cutbacks and demonstrate that
they are not only adding value to the work they do, but leading the way with green
technology and low carbon initiatives. Moving to a low carbon economy is the right thing to
do; this view is supported by the Infrastructure Carbon Review (HM Treasury, 2013) and
Construction 2050 (HM Government, 2013).
This paper presents research work and major findings from a pilot survey undertaken: to
measure whether organisational culture influenced the prioritisation of low carbon in the UK
Public Sector Flood Coastal Risk Management (FCRM) construction industry. A leading
government agency and its supply chain was selected as the population, whereby carbon had
historically been measured on public sector FCRM construction projects. The survey
consisted of three sections and consisted of 33 questions: background; organisational culture
and organisational leadership; and low carbon. Both qualitative and quantitative analysis
methods were included within the survey. The paper makes a comprehensive review of the
previous research on the prioritisation of low carbon government initiatives and the effect of
organisational culture; it then discusses the data collection method; presents a selection of the
raw data collected and, finally, analyses the results by mapping public and private sector
returns against the review of low carbon and cost against specific project stages.
2. LITERATURE REVIEW
2.1 Low carbon within Public Sector Construction
For public sector organisations undertaking construction schemes it is not just the
organisation itself but the supply chain that needs to be influenced. Implementing change in
commercial construction organisations should focus on the need to stand out from their
competitors making them more commercially attractive. Economic competitiveness is
defined as the ability to maintain or expand market position based on cost structure; the loss
or gain of competitiveness can be caused by a relative increase or decrease in cost (Sathre,
2007). However, due to the current culture of the construction industry after initial and basic
requirements are met, the cheapest construction materials are utilised. This highlights ‘the

837
importance of the public sector driving and providing incentives for the use of low carbon
dioxide materials in the construction industry’ (Ng, 2012). There could be a feeling that
cheaper unsustainable materials are often used in favour of more expensive and more
sustainable alternatives, given that capital cost may often be prioritised over life-cycle issues.
Similarly the requirement to include carbon emissions in risk assessments has not been
emphasised (Bogle, 2010), and climate change has been specifically excluded from the UK
National Risk Register (HM Government, 2010) on the grounds that it would not affect the
safety and security of the UK within a five-year time scale (Thornley-Walker, 2010).
The use of a Carbon Calculator within public sector construction schemes enables project
teams to demonstrate that they have achieved a saving on the carbon output, from appraisal
through to detailed design and at construction end. This information is monitored within the
public sector and contributes to the carbon target for each leading government agency.
Although monitored to ensure that set targets are not exceeded, it falls short in both recording
the full carbon figure, as operational carbon is not consistently taken into account; it also fails
to actively motivate project teams to prioritise low carbon within their projects. With no
clear project level targets set or the ability to accurately and routinely challenge the cost of
low carbon solutions, construction professionals frequently do not reduce greenhouse gas
(GHG) emissions, for example by specifying granular material instead of concrete in many
locations. Under the correct incentives or pressures, effort in design and procurement
processes could affect changes each week, that most members of society would hardly
achieve in years (Thornley-Walker, 2010). However, the likely outcome is that cheaper cost
solutions are prioritised over low carbon materials, ensuring that low carbon targets are not
exceeded but efficiency targets are achieved as an alternative.
The Infrastructure Carbon Review (HM Treasury, 2013) clearly highlights the benefits of low
carbon and through its promotion the resultant cost saving; his saving has largely been
focused within the infrastructure sector with clear evidence from Anglian Water for example,
of the quantums of carbon reduced and costs saved. In refining the scope of this research, to
obtain originality and maximise current network opportunities available, the sector focused
on became UK Public Sector FCRM construction schemes. Wolstenholme (2009) in Never
Waste a Good Crisis, highlighted that the construction industry as a whole had not progressed
as envisaged and there is a lack in overall motivation and culture change to embrace and
embed new initiatives. Further research noted that in-order to embed new ways of working, a
change of both organisational culture and organisational leadership (Construction Leadership
Council, 2016, HM Treasury, 2013) is required to successfully achieve a positive change.
2.2 Organisational Culture
Culture is viewed as the foundation that establishes the trust that impacts on the degree at
which employees buy-in to change and highlights the commitment to drive and sustain
change; in addition to this, it focuses on employee willingness to share information and
collaborate, which ultimately determines the ability of organisations to survive disruptions,
effecting and its capacity to advance (Alavi, et al., 2005; Barney, 1986; Janz et al., 2003;
Taylor, 2013). According to Gaplin (1996) there is no single component to describe
organisational culture as each element is individual to the organisation and relies on how each
element interacts on a day-to-day basis. Understanding and diagnosing organisational culture
can assist in implementing the type of change needed and establishing organisational

838
readiness for change (Johnson, et al., 2008; Clerke 1994 cited in Burnes, 1996; and Sundar,
2013). This view is also supported by Gaplin (1996) who states that ‘the primary motive for
managing culture during change is to implement and sustain changes. Too often, executives
and managers struggle when implementing change because they don't understand how to
make it important to employees’.
Bascal (2009) emphasises that the success of organisational change ‘require the
understanding of how individuals change, associating this understanding with the specific
phases such as Preparation, Acceptance and Commitment whereby an individual gains more
of an understanding of the changes and therefore automatically has a positive acceptance of
these stages’. In contrast Kubler-Ross and Fisher (Kubler, 2009) focus on the psychological
changes associated with individual positive and negative feelings and reactions. As
individuals and their reactions are different, this poses a risk that can develop into negative
attitudes towards work. This will in turn make people risk adverse and afraid to innovate
(Scott, 1989).
The ability for individuals to cope with change varies, since for some not enough pressure
leads to boredom and low self-esteem. The correct amount of pressure can be a challenge,
and improves performance and innovation; for others too much pressure can lead to feelings
of being out of control, poor quality work, then leading to stress and a loss of confidence in
ability (Willis, 2008). Kotter and Schlesinger’s (May, 2014) six change approach method for
overcoming opposition are mirrored with Galpin’s (1986), organisational culture
components; Galpin however takes a step further into how methods for change can be
sustained through knowledge management. Hogg, (1996) believes for a public body,
employee commitment is the way forward, utilising a marketing strategy of ‘trust,
empowerment and effective communication’. However, trust replies on having the
confidence that people will do what they say they are going to do or are competent to do the
things they say they are going to do (Mink, et al., 1993).
3. METHODOLOGY
The survey was sent out to 1000 individuals listed on the Government Knowledge
Management registration list. All users who had access has an involvement within Public
sector FCRM Construction projects. People were randomly selected, and of the 1000 emails
sent out a total of 255 out of office replies were received indicating individuals were no
longer within the organisation or were on long term absence. Of the possible 745 survey
returns a total of 35 were received. To understand the current position of a leading
government agency and its supply chain, the survey focussed on several Government
initiatives: low carbon, BIM and efficiency savings. Results presented are related to low
carbon and cost.
This paper focusses on the findings from three specific questions from the survey these can
be found in Table 1. Firstly, participants were asked if they work in the public or private
sectors. Secondly they were asked ‘At what stage is LOW CARBON actively discussed (i.e.
action plans put in place and/or monitored) on your projects?’ Nine possible stages were
offered in tick boxes, ranging from ‘the start of projects’ to ‘the end of projects’. A ‘never’
option was given also. Participants were able to select more than one possible answer.
Thirdly, participants were asked ‘At what stage are COSTS actively discussed on your
projects?’ The same nine answer options and a ‘never’ were again offered. For these latter

839
two questions, the basis of the multiple-choice answers was derived from the stages within
the 5 Case Business Model (HM Treasury, 2003) and for evidence within the Infrastructure
carbon review (HM Treasury, 2013) that tackling carbon early can result in the greatest
opportunities to reduce carbon on projects
4. RESULTS AND ANALYSIS
Of the 35 surveys returned, 60% were from the Private sector and 40% from the public
sector. All returned surveys were fully completed with no missing or ambiguous data.
Tables 1, 2 and 3 outline the results from the two main questions. Overall there was a greater
response to cost (72%) being reviewed at each stage compared to low carbon (41%). ‘Never’
was selected once in each question this was not by the same return; both of these were from
the public sector. The stage that scored the highest return for both low carbon and cost was
the ‘At the start of the project’ with 73%; this was followed by ‘At construction stage’ with
69%.
Table 1: Summary of results; frequency scores for each question
Question Multiple choice answer Frequency
scores
At what stage is LOW CARBON
actively discussed (i.e. action plans put
in place and/or monitored) on your
projects?
At the start of a project 22
At every progress meeting 8
At the start of a contract 11
At the procurement of material
stage
17
At options appraisal stage 17
At detailed design stage 18
At construction stage 20
At the end of each stage 4
At the end of a project 12
Never 1
At what stage are COSTS actively
discussed on your projects?
At the start of a project 29
At every progress meeting 26
At the start of a contract 25
At the procurement of material
stage
22
At options appraisal stage 26
At detailed design stage 24
At construction stage 28
At the end of each stage 21
At the end of a project 24
Never 1
On reviewing the results further stages where low carbon was actively discussed showed
similar results for 5 out of the 9 stages (Table23), but showed significant differences for
stages: At the start of every progress meeting; At the start of the contract; At construction
stage; and most significantly, At the end of construction. The Public sector was more
consistent throughout the project lifecycle and its stages in actively discussing low carbon.
The key reporting stages for carbon have historically been at options appraisal, detailed

840
design and end of construction for public sector reporting to Government. Both the public
and private sector score similar results for options appraisal and detailed design. The end of
the project stage shows a significant difference; this is attributed to the public sector having
to report end of project carbon results to Government.
Table 2: At what stage is LOW CARBON actively discussed (i.e. action plans put in place
and/or monitored) on your projects? Percentage scores for public and private sectors.
Nine possible multiple-choice
answers and ‘never’
Public
%
Private
%
At the start of a project 64 62
At every progress meeting 14 29
At the start of a contract 43 24
At the procurement of material
stage
50 48
At options appraisal stage 50 48
At detailed design stage 50 52
At construction stage 64 52
At the end of each stage 14 10
At the end of a project 57 19
Never 7 0
Where cost is actively discussed the public sector scored higher at every stage apart from
options appraisal (excluding never) Table 4 shows significant differences for each stage.
This is consistent with the need for public sector to provide key cost information on a
monthly basis. Again, both the public and private sector score similar results for options
appraisal and detailed design. The end of the project stage shows a significant difference;
this is attributed to the public sector having to report end of project cost results to
Government.
Table 3: At what stage is COST actively discussed (i.e. action plans put in place and/or
monitored) on your projects? Percentage scores for public and private sectors.
Multiple choice answer Public
%
Private
%
At the start of a project 93 76
At every progress meeting 86 67
At the start of a contract 79 67
At the procurement of material
stage
64 62
At options appraisal stage 71 76
At detailed design stage 71 67
At construction stage 86 76
At the end of each stage 79 48
At the end of a project 86 57
Never 7 0
When comparing cost and carbon responses for the public and private sector separately, it is
evident that cost is a more important consideration than carbon. Many participants have
different project priorities and therefore overall, there is not a cohesive and common
objective for all project members in regards to low carbon. The problem is aggravated by a

841
lack of consistency between the public and private sector, in discussing low carbon
throughout project stages. Figures 1 and 2 outline the key differences for each sector in
regards to cost and low carbon being actively discussed. What is evident from both results is
that low carbon is not being discussed adequately at each progress meeting, at the start of a
contract, nor at the end of each stage. The latter two of these stages can have a significant
impact on how low carbon is viewed and prioritised on projects. If low carbon is not
discussed and adequately written into contracts as a requirement for suppliers, then there is
little incentive to ensure that it is discussed on a regular basis. This is evident from the
survey returns whereby private sector participants do not actively discuss low carbon at the
end of projects. Not actively discussing low carbon at the end of each stage, highlights that
key learning and decision-making opportunities are not being raised and shared with project
teams, and specifically those involved in the next stage of work.
Figure 1: Public sector cost and low carbon comparison
Figure 2: Private sector cost and low carbon comparison
0%10%20%30%40%50%60%70%80%90%
100%
Public sector cost and low carbon comparison
cost carbon
0%10%20%30%40%50%60%70%80%
Private sector cost and low carbon comparison
cost carbon

842
5. CONCLUSION
Although carbon is one of the key reporting criteria to government for UK public sector
Flood and Coast Risk Management construction schemes, it is as yet, not at the same level of
importance as cost. In the absence of a mechanism that is particularly designed to assess
carbon and cost alongside each other, truly embedding low carbon solutions and materials
within the FCRM asset management industry will always be a challenge. This paper reports
on a pilot survey of 35 public and private sector practitioners who actively work on FCRM
schemes to gain their opinions on how low carbon and cost is actively discussed at project
level. The survey participants represent a broad spectrum of construction stakeholders,
including the public-sector client, consultant, and contractor organisations.
The results of the survey indicate that cost is considered a higher priority for both public and
private sector organisations with low carbon, although included in discussions, not featured
as prominently throughout each project stage. However, cost and carbon are discussed by
both public and private sector participants at options appraisal and detailed design. At
present, the opportunity to discuss and capture key learning for cost and carbon at the end of
projects is diminished, with the public-sector valuing discussion at this stage more important
than the private sector.
The problem is aggravated by a lack of consistency between the public and private sector, in
discussing low carbon throughout project stages. One view is that project participants have
different project priorities and therefore overall there is not a cohesive and common objective
for all project members in regards to low carbon. Utilisation of current publicly available
standards such as the PAS 2080 (Construction Leadership Council, 2016), will provide the
opportunity for initiatives such as low carbon to be consistently and actively discussed at key
project stages; with members of value chains having clear objectives and understanding of
their roles in regards to low carbon at each stage.
Ensuring that low carbon is adequately included at the procurement stage and explicitly
included as a requirement under contracts, is essential to ensuring the delivery of the
objective on projects, with clear reporting stages identified; this would reduce the impact of
low carbon information, and shared learning being lost at the end of each stage and the end of
projects. Resources and effort are required to develop and maintain a clearer link between
carbon and cost to enable a more consistent approach to low carbon on projects, this
alongside better communications across all organisations within the value chain will assist in
change within industry required.
Future research, therefore, needs to be aimed at finding solutions to the following problems
identified in this research:
(a) establishing a mechanism for low carbon to be included and reported upon at key
stages within project lifecycles;
(b) establishing a key link between carbon and cost;
(c) better understanding of the impact of cost, on low carbon solution/material
implementation;
(d) collection and maintenance of a suitable carbon database for knowledge share and
target setting.

843
In addition, further work is needed to clarify how PAS 2080 (Construction Leadership
Council, 2016) and its general principles can be embedded within UK public sector FCRM
industry, to attain clear organisational and cultural change in the prioritisation and promotion
of low carbon projects. Finally, it is felt that the UK public sector FCRM construction
community would benefit considerably from client led initiatives that collaboratively includes
and benefits all members of the value chain in regards to the implementation low carbon
projects.
6. REFERENCES
Bascal, R., 2009, Understanding the change process - How individuals change. Retrieved from
www.work911.com: http://www.work911.com/managingchange/understandignchanges.html
Construction Leadership Council, 2016, PAS 2080, Carbon Management in infrastructure. London: BSI.
Egan, J., 1998, Rethinking Construction. London: Department of Trade and Industry.
Environment Agency, 2016, e:mission. London: Environment Agency.
Farmer, M., 2016, The Farmer Review of UK Construction Labourt models. London: Construction Leadership
Council.
Galpin, T., 1986, Connecting culture to organisational change. Society for Human Resource management, 84.
HM Government, 2010, National Risk Register 2010. Retrieved from Cabinet Office:
http://interim.cabinetoffice.gov.uk/media/349023/nrr2010-chapter5.pdf for further details
HM Government, 2013, Construction 2050:Industrial strategy for construction - government and industry in
partnership. London: HM Government.
HM Treasury, 2003, www.gov.uk/government/publications. Retrieved from ‘The Green Book’. Appraisal and
Evaluation in Central Government: https://www.gov.uk/government/publications/the-green-book-appraisal-
and-evaluation-in-central-governent
HM Treasury, 2013, Infrastructure Carbon Review. London: Crown.
Hogg, C., 1996, Selling your soul. Human Resources, 88 - 90.
Ibbotson, K., 2009, Change Management. Unpublished MSc thesis. University of Bolton.
Kubler, E., 2009, Kubler-Ross five stages of grief. Retrieved from www.businessballs.com:
http://www.businessballs.com/elisabeth_kubler_ross_five_satges_of_grief.htm#elisabeth_kubler-
ross_five_stages_of_grief
Latham, M.,1994, Constructing the Team. London: HMSO.
May, V.V., 2014, Six change approaches, developed by John Kotter and Leonard Schlesinger . Retrieved from
www.toolshero.com: http://www.toolshero.com/change-management/six-change-approaches-kotter/
Mink, O. G. (1993). Developing high performance people: The art of coaching. New York: Persueus Press.
Ng, S. T. (2012). Challenges facing carbon dioxide. ICE Proceedings, pp. 20 - 31.
Sathre, R. and Gustavsson, L., 2007, Effects of energy and carbon taxes on building. Energy and Buildings, pp.
488 - 494.
Scott, C.D., 1989, Managing Organisational Change - A Guide For Managers. California: Crisp Publications.
Sundar, S.B., 2013, Impact of change management over personal behaviour and culture on construction projects.
International Journal of Marketing and Technology, pp. 49 - 70.
Thornley-Walker, R., 2010, Carbon Footprint and Risk. ICE proceedings, pp. 147 - 160.
Willis, J.A., 2008, Springboard Womens development workbook. Stroud: Hawthorne Press.
Wolstenholme, A., 2009, Never Waste a Good Crisis. London: Constructing Excellence.

844
ID 071
HOUSING AND URBAN REGENERATION: HONING AN EXISTING
ASSESSMENT METHOD THROUGH THE DESIGN SOCIENCE
METHODOLOGY
K. Dean, C. Trillo and E. Bichard
School of the Built Environment, University of Salford, Salford, M5 4WT, UK
Email: [email protected]
Abstract: The Design Science (DS) methodology has emerged from the information
technology field as a robust framework that allows researchers to create something not yet
existing (the artefact) and subsequently validating it against more conventional evaluation
methods. In this paper, the Design Science methodology is applied for honing and validating
an existing assessment method – Sustainable Return on investment or SuROI - which places a
value on social and environmental change in the built environment. The housing sector is
currently lacking a specific evidence-based assessment methodology that quantifies the
impacts of both the social and environmental effects of regeneration. Failure to quantify the
economic implications of sustainable change could lead both to favouring the wrong priorities,
and can contribute to a lack of engagement of key stakeholders. This paper aims at solving this
practical problem by showing how housing associations can use a tailored methodology that
both contributes to a better understanding of hidden social and environmental benefits, and
creates meaningful partnerships with people capable of influencing the outcome of the
regeneration project. The paper builds on the Sustainable Return on Investment methodology
by using DS to produce a decision-making tool (the artefact) for place-making bodies
promoting social housing. This is intended to support better decision making in the housing
sector, but could be applied in a wider context to tackle the current financial constraints that
hinder sustainable regeneration processes.
Keywords: Sustainable Return on Investment, Housing led urban regeneration, Assessment
methodology, Design Science
1. SETTING THE CONTEXT: THE DESIGN SCIENCE RESEARCH
Research carried out under the paradigm of the traditional sciences, such as the natural and
social sciences, focus on explaining, describing, exploring or predicting phenomena and their
relationships with each other (van Aken, 2004; March and Smith, 1995). This translates into
the assessment of things that exist. However the traditional sciences have limitations when
the goal of research is to study the design, construction or creation of a new artefact i.e.
something that currently does not exist (Simon, 1996), or to conduct research based on
problem solving. March and Smith (1995) emphasised the importance of a science that is able
to support the construction and evaluation of new artefacts. It is in these circumstances when
the usage of Design Science Research (DSR) is recommended as a new epistemological
paradigm for conducting research (van Aken, 2004; March and Smith, 1995, Simon, 1996).
This paper is driven by a problem solving approach and aims at creating something new,
suitable to fill an existing gap in the current methods of assessment of interventions on social
housing. For this reason, the DSR has been considered the most appropriate framework to
create and validate a novel artefact, which is, in this paper, a new method. DSR is an
example of constructive research approach, which focuses on producing innovative

845
constructions to solve real world problems, to implement the developed construction and test
its practical applicability and to make a contribution to the theory of the discipline within
which it is applied (Lukka, 2003) brought from the pragmatist philosophical stance
(Vaishnivi and Kuechler, 2007; Lukka, 2003).
DSR is the scientific study and creation of artefacts as they are developed and used by people
with the goal of solving practical problems of general interest (Johannesson and Perjons,
2012) which subsequently make a contribution to the theory of the discipline in which it is
applied (Lukka, 2003). It is a systemic but flexible methodology aimed at improving
practices through iterative analysis, design, development and implementation in real-world
settings (Wang, Vogel and Ran, 2011). Whilst empirical research seeks to “describe, explain
and predict the world” and sees the world “as it exists, regardless of human interests and
biases”, DSR does not only describe, explain and predict, but wants to “change the world and
create new worlds” (Johannesson and Perjons, 2012:1). Along the same lines, Iivari and
Venable (2009) define DSR as “a research activity that invents or builds new, innovative
artefacts for solving problems or achieving improvements”. Academic research in applied
disciplines such as the built environment have the dual role of generating theoretical
conceptual knowledge and simultaneously contributing to the solution of practical problems
(Azhar et al., 2010). DSR is a research procedure which incorporates this ‘research for
practice’ stance (Chynoweth, 2013) and seeks a solution to a real world problem of interest to
practice. It stems from a problem solving paradigm and seeks to create innovations (Hevner
et al., 2004), which, through the artefact being developed, is the goal of this study.
The main goal of this paper is, by applying DSR, to deal with a real life organisation where
the problem and potential solution is practice based and practice related. DSR is therefore an
appropriate choice of methodology. As Archer (1995) writes “there are circumstances where
the best or only way to shed light on a proposition, a principle, a material, a process or a
function is to construct something, or to enact something, calculated to explore, embody or
test it”. This is exactly what DSR does. It “attempts to create things that serve human
purposes” and devises artefacts to obtain goals (March and Smith, 1995).
This paper will apply the DSR to create an artefact in a disciplinary field still new to this
approach, i.e. evaluation methods, by: (1) exploring the problem to be solved and the artefact
needed; (2) demonstrating how DSR can be employed to support the creation and validation
of a new method, building on and putting forward an existing method (SuROI) already tested;
(3) showing the outcomes of such an innovative method through a case study allowing to test
the process in an extant housing initiative (validation of the artefact).
2. THE PROBLEM TO BE SOLVED AND THE ARTEFACT NEEDED:
HALLENGES TO HOUSING ASSOCIATIONS
Housing associations are currently operating under severe financial constraints, which make
the decision making process extremely demanding, since every choice needs to be thoroughly
assessed in terms of benefits. This situation has become particularly harsh in recent times,
while in the past, less scarcity of resources allowed more flexibility in choices. Before the
economic crash of 2008, housing associations could rely on significant bank financing to
fund their development. Banks and other lenders historically provided housing associations
with loans in favourable terms. Until the advent of the credit crunch, banks priced loans to
housing associations at 20 to 30 basis points above the London inter bank lending rate (House

846
of Commons, Communities and Local Government Committee, 2009). However, once the
credit crunch came about, not only did banks charge more for new loans, but they also sought
to rewrite the already existing housing association loans they had outstanding. Housing
associations seeking additional financing found that banks demanded rates as high as 300
basis points above LIBOR, often more than 10 times higher than their previous rates. A
number of lenders refused altogether to lend to housing associations (Hilditch, 2009; House
of Commons, Communities and Local Government Committee, 2009). Banks sharply
increased the cost of credit for housing associations, whilst demand for for-sale homes and
shared-ownership housing plummeted, reducing revenue for housing associations (Dowler,
2009). More recently as part of the housing white paper, the UK Government has announced
that the recent 1% rent decrease is to remain in place until 2020 and that there remains a
focus on Right to Buy (UK Government, 2017).
Because the economic climate is now more demanding, it is important that the evaluation of
housing led urban regeneration schemes is of a high standard, and that the conclusions
coming about from a particular evaluation, are accurate. To this end, it is additionally
important that all benefits arising from a particular scheme are taken into consideration, and
that as much information as possible on scheme impacts is available for strategic decision
makers. However, authors have noted an absence of frameworks used to assess impacts in
terms of sustainable development in the built environment (Thomson et al., 2009) or certainly
a limited number of such frameworks (DETR, 1998; OECD, 2000) and the absence of
appropriate frameworks has often been considered as playing a part in the inability to deliver
the desired objectives of urban regeneration schemes (Kazmierczak et al., 2009) which can
have negative repercussions, especially in the current economic climate when money is not
always readily available and mistakes are costly. Along these lines, Tyler et al. (2013:171)
pose the question as to why, despite the resources that many countries commit to urban
regeneration, there has been “so little evidence available on the aggregate value of
regeneration benefits?”
A systematic review of existing methods for evaluating housing schemes has been provided
by Dean and Trillo in previous work (2017), including the EGRUP Guidance, the Evaluation
of City Challenge, the Evaluation of the Single Regeneration Budget and of the New Deal for
Communities programme, of Urban Development Corporations and Enterprise Zones, the
Hemphill framework, the Sustainable Urban Renewal Project Assessment Model, the
INDicator-based Impact-assessment and the Regeneration Balance Sheet. However, these
methods do not appear to take into consideration the previously hidden or intangible social
and environmental benefits of a scheme. In addition, until now no tool has been used to
quantitatively measure such hidden benefits.
However, the literature provides evaluators with alternatives. The Sustainable Return on
Investment (SuROI) approach (Bichard, 2015) is a structured approach to calculating the
social and environmental value of change in the built environment, which can be used for this
purpose. SuROI incorporates such valuation method frameworks as Social Return on
Investment (SROI), Ecosystem Services Analysis (ESA), Wellbeing Valuation or Life Cycle
Assessment which allows the appraiser to make a quantitative valuation of both social and
environmental benefits following the implementation of a regeneration scheme. In this study,
SuROI has been selected in order to: (1) deliver a quantitative assessment of tangible and
intangible benefits deriving from urban regeneration schemes including those within social
housing; (2) adding a further component to the current SuROI, thus creating a new

847
methodology suitable to support decision making in social housing and to map stakeholders
potentially interested in collaborating to the delivery of the social housing project.
According to Nicholls et al. (2012:8), “things which get bought and sold take on greater
significance”. Sustainable Return on Investment takes this mantra on board (Bichard, 2015)
and places a numerical value on the social and environmental components of the triple
bottom line; aspects which are normally difficult to compare against more easily measured
economic impacts (Conejos, Langston and Smith, 2013). Authors have previously cited that
there is typically a difficulty in measuring the social ‘pillar’ within the realm of sustainability,
due to its abstract nature and that they consider that it could be overshadowed by economic
and environmental domains (Lehtonen, 2004; Davidson, 2009; Littig and Griessler, 2005).
Xing et al. (2009:210) cite that one of the main challenges can be a difficulty in the
measurement of what they term “apples and pears”, which is to compare the measurement of
costs and values which are expressed in different units. The SuROI method potentially solves
this issue. In addition, recent guidance from the Royal Institute of Chartered Surveyors
(2014) recognises the need to include a wider range of factors that can influence the value of
built environment projects and asserts that sustainability considerations are now considered
as being important when undertaking valuations (Bichard, 2015). The Social Value Act
(2012) additionally requires that economic, environmental and social benefits are taken into
consideration as part of any procurement processes, showing that the focus on sustainability
is perhaps starting to change and become more important at national level also.
SuROI aims to allow the environmental and social value of a project, programme or policy in
the built environment to be made explicit through evidence, and be added to capital costs to
give an overall sustainable value (Bichard, 2015). SROI compares the prospective social
benefits of a particular scheme against its costs and ESA takes the costs and benefits of the
environment into consideration. ESA covers both the natural and built environment,
including architectural aspects within its definition (DEFRA, 2013).
The SuROI approach assesses the degree to which change has occurred, both in terms of the
significance of the change and the number of people experiencing that change. Both social
and environmental outcomes are then monetised by identifying an appropriate indicator for
the change and then by applying a suitable monetary value or proxy to each indicator.
Indicators and proxies are typically taken from wellbeing sources, or socio-economic
statistics compiled by a range of agencies. The values are multiplied by the numbers affected
and the amount of time the change is expected to last for (Bichard, 2016). SuROI combines
stakeholder accounts and statistical trends as part of its calculations, to ensure “a robust and
defendable result” (Ibid, 2016). Because all value is monetised, this has the advantage of
measuring and presenting information according to the same metric. The social monetary
changes are added to the environmental monetary changes to give a gross value used to
calculate SuROI. The net value is then subsequently derived once adjustments are made,
including deadweight (amount of outcome that would have occurred anyway), displacement
(amount of activity that has been displaced), attribution (amount of outcome caused by other
interventions) and drop off (the deterioration of an outcome over time).
Data used within the impact map can be that of primary data, secondary data or both.
Methods of primary data include interviews, focus groups, surveys or questionnaires, whilst
secondary data includes data sets such as social/ economic statistic sets, indicators, proxies
and databases. Stakeholder data collected in the field can be used to evaluate social and

848
environmental change caused by previously completed projects, and also to predict future
change from planned projects.
3. FURTHERING THE SUROI METHOD THROUGH THE DESIGN SCIENCE
METHOD
As anticipated in the previous section, this paper suggests that SuROI can be further
improved by being used to map out costs and benefits of potential future stakeholders,
potentially involved in the housing led urban regeneration scheme or process. The assessment
methodology can be easily adaptable by being refocused in terms of stakeholders’
engagement. By repacking the financial calculation allocating costs and benefits across
different stakeholders involved, it would be possible to attract potential new investors, willing
to increase the benefits that the method has unveiled. This resulting form of SuROI means
that it is packaged as a hybrid, including both the exposure of hidden costs and benefits, but
additionally with a transfer of the methodology to attract potential new investors.
If previously invisible and intangible benefits resulting from a housing led urban regeneration
scheme are being made visible and tangible by using the SuROI method, then by analysing
which potential stakeholders are receiving benefit from the said scheme, we can highlight to
those stakeholders not yet involved in the scheme, the cost benefit that is attributable and
which is actively helping that stakeholder organisation, as a result of the said scheme.
By actively seeking out and discussing the financial benefits that are coming the way of the
not yet involved stakeholder, we can prevent schemes being affected by current economic
cuts, by offsetting budgetary cuts through striking agreements with those stakeholders who
benefit.
As an example, let us say that due to a regeneration scheme, local housing association tenants
are benefitting health wise from works that have been carried out, but the NHS is not
currently an active stakeholder in the scheme in question. Through using the SuROI
methodology, we can highlight to the NHS how much we feel they are receiving in terms of
previously intangible benefits being costed out, according to the methodology.
We can highlight to the NHS that although they do not have to participate in any way in the
urban regeneration scheme in question, by donating an amount of money to the ongoing
works involved in the said scheme, they could be saving an outlay of money in the future. It
could be the case that by not investing, they accrue higher costs if the sustainability of the
scheme is compromised by lack of funds, which then ends the productivity of the scheme and
ends the benefits that were previously created; those benefits previously saving the NHS
money.
It was the results of the previously conducted interviews with key members of staff at City
West Housing Trust which led to the hybrid idea. Interviewees stated that there had
previously been many regeneration schemes where lots of investment had been put in, only
for the social return to be minimal. Interviewees additionally stated that in the current
economic climate, the housing trust doesn’t want to be outlaying massive investment, only to
be having to do exactly the same in 30 years’ time. Employees interviewed wanted to see
more sustainability, less wasting of money and most importantly, ways to plug the gap

849
created by the recently experienced economic shortfall which is impacting on housing
associations, tenants and communities alike.
Since this resulting hybrid is different from the original method, it can be considered an
“artefact” within the DSM. The application of the DSR method in order to produce a new
methodology will be clarified by referring to an extant case study, the City West Housing
Trust, based in West Salford. It will be showed how the DRS model can be successfully
employed as robust framework to create and verify the new method, following a rigorous and
cross-reliable process. There are many models within DSR literature including Peffers et al.
(2007), Hevner et al. (2004) and March and Smith (1995), however the most comprehensive
one is that of Johannesson and Perjons (2012).
The following sub-sections will systematically show the application of this DSR model to the
design and verification of the new method, by going through each individual stage through
the selected case study perspective. The City West Housing Trust housing association has
been chosen for easy access to data, since an author of this paper works for it as an employee.
The implementation of the DSR to the case study has been performed through a qualitative
methodology, based on a constructivist approach, by administering a set of semi structured
interviews modelled both on the SuROI method and allowing the development of further
concepts, thus deriving a further component of the method, suitable to put it forwards in a
different perspective (stakeholders mapping and quantification of the respective benefits/
costs). It is anticipated that the evaluation of the artefact still needs to be performed and will
be done through a qualitative method through the implementation of the hybrid method to
two examples. For validation purposes, interviews with experts from different housing
associations, other than the City West Housing Trust will also be administered.
Stage 1: Explicate problem
The problem experienced within housing led urban regeneration is that there is no tool which
can evaluate schemes holistically and sustainably, by quantitatively measuring social and
environmental impacts and no tool which takes into account potential budgetary cost savings
to ensure future financial sustainability.

850
Figure 1: Stage 1 of DSR broken down according to the case study (authors’ elaboration)
Stage 2: Outline artefact and define requirements
Further to the explication of the problem above, a tool is needed that evaluates housing led
urban regeneration schemes, by using SuROI to uncover the hidden social and environmental
benefits of a given scheme and by analysing company budgetary costs and, which goes
further, by identifying potential further stakeholders capable of turning a cost into a profit to
satisfy the concept of economic sustainability.
Figure 2: Stage 2 of DSR broken down according to the case study (authors’ elaboration)
Stage 3: Design and develop artefact (i.e.: the “hybrid” method)
The design and develop artefact stage can be viewed as a “search process through a solution
space” (Simon, 1996). The designed and developed artefact created after the outline artefact
and define requirements DSR stages takes previous research on SuROI into account (Bichard,
2015), stakeholder interests and views, the existing literature and interviews with key
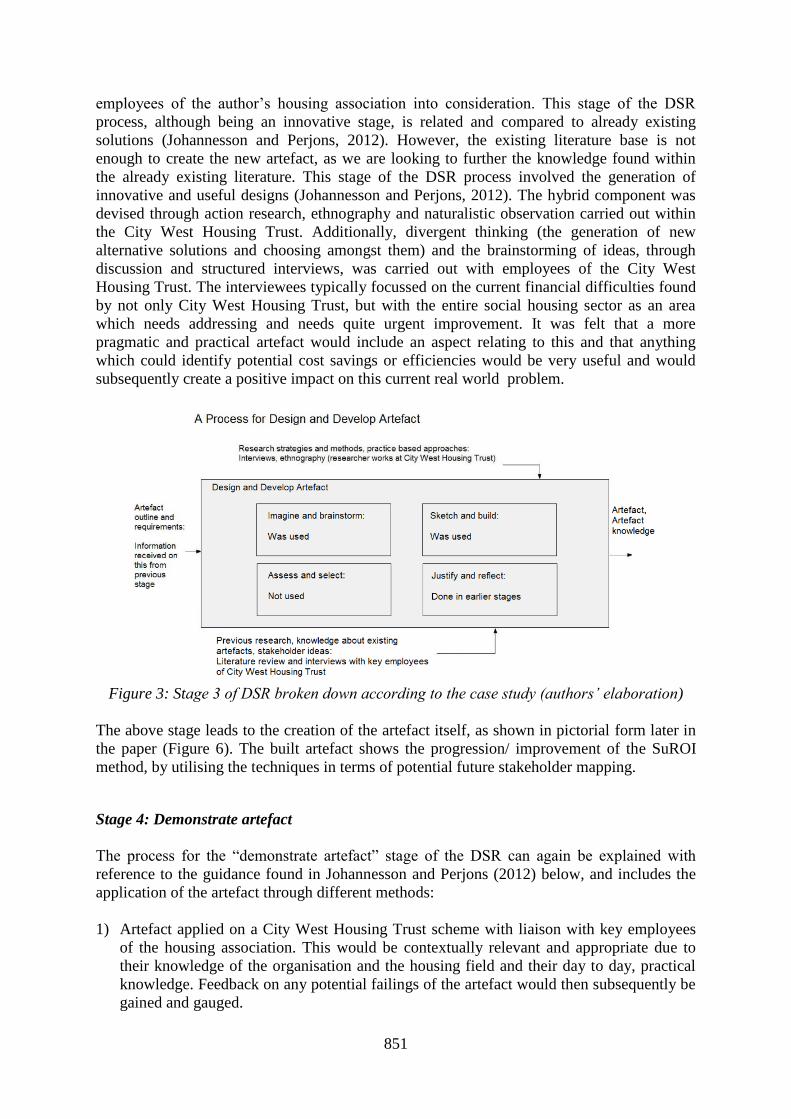
851
employees of the author’s housing association into consideration. This stage of the DSR
process, although being an innovative stage, is related and compared to already existing
solutions (Johannesson and Perjons, 2012). However, the existing literature base is not
enough to create the new artefact, as we are looking to further the knowledge found within
the already existing literature. This stage of the DSR process involved the generation of
innovative and useful designs (Johannesson and Perjons, 2012). The hybrid component was
devised through action research, ethnography and naturalistic observation carried out within
the City West Housing Trust. Additionally, divergent thinking (the generation of new
alternative solutions and choosing amongst them) and the brainstorming of ideas, through
discussion and structured interviews, was carried out with employees of the City West
Housing Trust. The interviewees typically focussed on the current financial difficulties found
by not only City West Housing Trust, but with the entire social housing sector as an area
which needs addressing and needs quite urgent improvement. It was felt that a more
pragmatic and practical artefact would include an aspect relating to this and that anything
which could identify potential cost savings or efficiencies would be very useful and would
subsequently create a positive impact on this current real world problem.
Figure 3: Stage 3 of DSR broken down according to the case study (authors’ elaboration)
The above stage leads to the creation of the artefact itself, as shown in pictorial form later in
the paper (Figure 6). The built artefact shows the progression/ improvement of the SuROI
method, by utilising the techniques in terms of potential future stakeholder mapping.
Stage 4: Demonstrate artefact
The process for the “demonstrate artefact” stage of the DSR can again be explained with
reference to the guidance found in Johannesson and Perjons (2012) below, and includes the
application of the artefact through different methods:
1) Artefact applied on a City West Housing Trust scheme with liaison with key employees
of the housing association. This would be contextually relevant and appropriate due to
their knowledge of the organisation and the housing field and their day to day, practical
knowledge. Feedback on any potential failings of the artefact would then subsequently be
gained and gauged.

852
2) Artefact discussed within a focus group context with key employees of City West
Housing Trust. Gain and gauge feedback on potential artefact failings.
3) Artefact discussed with contacts and colleagues of the author, pertaining to other,
different organisations within the housing sector, to attempt to get a further, more
rounded and fuller feedback on the artefact, from real world professionals working within
the field on a day to day basis, but from other organisations than City West Housing
Trust. Gain and gauge feedback on potential artefact failings.
Any required changes gathered as a result of feedback and/or any practical failings are carried
out, in accordance with the feedback received, and changes made continually until all
stakeholders are happy with the artefact. This process continues until all are in agreement that
the artefact has been developed to such a stage where all are happy with it. On the receiving
of feedback which is thought to either highlight failings, or be of added value to the artefact,
the DSR process goes back to “design and develop artefact” and then moves on again to
“demonstrate artefact”.
Figure 4: Stage 4 of DSR broken down according to the case study (authors’ elaboration)
Stage 5: Evaluate artefact
The detailed process for the final stage, the “evaluate artefact” stage of the DSR process, is
visualised below, following Johannesson and Perjons (2012).

853
Figure 5: Stage 5 of DSR broken down according to the case study (authors’ elaboration)
Upon verifying that all defined requirements are met in the artefact, from the demonstration
stage, the artefact/ tool can then be validated by being applied to a housing led regeneration
scheme which has already had a more traditional form of evaluation carried out on it in the
past. An evaluation will then be carried out of the same scheme, but this time through the
“hybrid” artefact. Results will then be compared, contrasted, discussed and analysed.
Furthermore, a second round of interviews for validation purposes will be administered with
a sample of experts from housing associations different from the City West Housing Trust
case study.
Because the SuROI methodology incorporates in its very essence, the usage of stakeholder
involvement, we can look into the area of stakeholder analysis to uncover some gaps within
the stakeholder analysis and SuROI literature base, to better clarify the “SuROI Hybrid” that
this paper subsequently focuses on.
4. STAKEHOLDERS ANALYSIS: LIMITATIONS AND POTENTIAL FOR HONING
THE SUROI METHODOLOGY
A stakeholder analysis can be used to inform the planning, implementation or evaluation of a
project (ODA, 1995; MacArthur, 1997) by typically identifying key persons involved in a
project, and subsequently assessing their knowledge, interests, positions, alliances, and
importance related to the policy in question. This enables more interaction, success and the
prevention of potential problems (Schmeer, 1999). A stakeholder approach reflects the
realisation that the interests and influence of individuals or groups, both within and outside a
prospective organisation, need to be taken into consideration (Brugha and Varvasovsky,
2000).
Stakeholder analysis was derived from business management (Reed et al., 2009), with the
original concept behind stakeholder analysis being to identify any stakeholder groups wishing
to threaten corporate organisations. This changed full swing over time, to give a voice to
marginalised stakeholders in order that decision making by the powerful could be influenced.
Various methods and techniques outlining how to carry out a stakeholder analysis have been
outlined previously within the literature.

854
These typically follow a set amount of “steps” to follow. Such methods include Schmeer’s
“eight steps” (Schmeer, 1999), the five steps of Grimble and Chan (1995), the four steps of 1)
stakeholder identification 2) mapping of stakeholder interests 3) evaluation of stakeholder
importance and influence and 4) development of stakeholder strategy plan (Rietbergen-
McCracken and Narayan, 1998), Shirey (2012)’s four steps, the three steps of Reed et al.,
(2009) or Jepson and Eskerod (2008), or the two steps of Jones (2003).
5. TOWARDS A HYBRID ASSESSMENT METHOD
As anticipated, the aim of this paper is that of offering preliminary insights on a novel
methodology, created by furthering an existing assessment method, that of SuROI. This will
be achieved by creating a “hybrid” method, aimed at drawing from the stakeholder analysis
to sharpen the understanding of measurable benefits and costs for each stakeholder. The
benefit from merging two different approaches will consist of filling each other’s gaps, which
are due to the intrinsic nature or either qualitative or quantitative methods.
From one side, the stakeholder analysis presents some weaknesses: (1) Subjectivity. It has
been noted that subjectivity can weaken the effectiveness of a stakeholder analysis (Shirey,
2012). The quantitative approach outlined within SuROI could be utilised to reduce the
subjectivity of the stakeholder analysis. (2) Lack of outcomes. Bryson, (2004) has argued that
at present there is no overwhelming body of evidence indicating that stakeholder analyses
help produce desirable outcomes. Therefore, an addition is needed to the stakeholder analysis
process showing a potential quantified outcomes, thus proving that such an analysis can
produce a desirable outcome. (3) Consider levels of interest/ influence. Reed et al. (2009)
proposed the use of ‘extendable matrices’ that consider levels of interest and influence of
stakeholders. This paper suggests that not only should the interest and influence of
stakeholders be quantified, but how much a particular stakeholder would stand to gain, or
lose, quantifiably, from a given project.
On the other hand, SuROI still presents room for improvement: (1) Understanding of the
“extent of stakeholders”. As stated in Bichard et al. (2017), Watson and Whitley (2016)
suggest that with SROI, and so consequently SuROI, being very stakeholder orientated,
without an understanding of the extent of the “web of interconnected stakeholders”, it cannot
be clear at the outset if the analysis can capture the full nature of the project’s eventual
impact. This “understanding” can potentially be improved by reinforcing the stakeholder
analysis component of the SuROI methodology. (2) Understanding who the winners and
losers are. SuROI doesn’t take into account who the winners and losers of a given project are,
and how much they gain or lose from a project individually: it normally only allows the
quantification of the overall benefits from a given intervention.

855
Figure 6: The SuROI Hybrid
The proposed “SuROI Hybrid” (Figure 6) is transdisciplinary in nature, in that it combines
the quantitative approach of SuROI (which stems from cost benefit analysis), with the
qualitative approach of stakeholder analysis (which in essence is a management/policy
making tool). The creation of a “hybrid” method allows the production of a new “artefact”,
useful in supporting decision makers not only in making the right decision, but also in
negotiating with potential further interested parties. Being a management/ policy making tool,
current stakeholder analyses fall into the same category as previous methods of evaluating
housing led urban regeneration projects, which is that it is typically qualitative in nature. As
has been seen earlier in this paper, qualitative methods have disadvantages, which can be
solved by introducing quantities into the analysis. To counteract the qualitative essence of
stakeholder analysis, we can use the SuROI methodology to change the analysis into a
quantifiable one. By doing this, it would be possible to quantifiably measure how much each
given stakeholder of a project gains or loses from a given project. At the same time, by
readdressing the SuROI traditional methodology towards a stakeholder oriented perspective,
it is possible to emphasise the potential benefits for different stakeholders influenced by the
intervention, thus orienting its usability from a decision making tool to a management tool.
This is particularly relevant in the era of “New Public Management” within public
administration which involves such aspects as explicit standards and measures of
performance, a greater emphasis on output controls, a shift to the disaggregating of units in
the public sector, a shift to greater competition in the public sector and a stress on greater
discipline in resource use (Hood, 1991). Rather than thinking in terms of overall “public”
benefit, it is important to rely on quantifiable methods showing benefits and costs for
different public actors.
The SuROI hybrid would be used to gauge the quantifiable amount of impact for each
stakeholder involved in a housing led urban regeneration scheme and would show in
monetary units whether or not each stakeholder gains or loses from a given project, and
additionally, by the cash flow amount involved.
Future research will exploit the potential of the SuROI as a quantitative methodology for the
assessment of the interventions. In particular, the concept of time can be brought into SuROI.
It is possible to pinpoint the time of the break even point for a project, by using the resulting
quantifiable impact from the SuROI methodology to make explicit the point at which total
cost and total revenue are equal.
In addition, the time of the break even point, where the quantifiable impact meets the figure
of the inputted cost of the project, can be calculated by using the SuROI methodology and

856
would typically result in a graphical format as shown below. The break even point can be
calculated for both the entirety of the scheme and, alternatively, for each individual
stakeholder, as can been seen in Figure 7 below:
Figure 7: Break even point by using calculations from the SuROI methodology
A validation of the “SuROI Hybrid” will be carried out as part of future research, to gauge
how effective it is, by following and adhering to the previously described DSR methodology.
Liaison will be carried out with colleagues within housing associations and organisations
specialising in the field of housing led urban regeneration that the author knows from his
extensive work and longevity of employment in the field.
6. CONCLUSIONS
This paper aims at addressing an existing gap in the current assessment methods, which can
cause a lack of knowledge on the real values of housing led regeneration schemes, by
assuming that within the midst of a difficult economic climate for housing associations to
operate in, current assessment methods tend to underestimate intangible benefits and costs
associated with urban regeneration interventions. Sustainable Return on Investment (SuROI)
can overcome these limits by providing a better understanding of hidden social and
environmental benefits. Not only this, but the existing SuROI approach can also be
progressed and improved, leading to a mapping of potential stakeholders capable of
contributing to covering the budgetary costs of a housing association. This is highly
applicable in the current times of economic hardship.
The paper explored the potential of the Design Science Methodology (DSM) in order to adapt
the current SuROI method to the housing sector with a stakeholder led approach. The built
artefact incorporated the novel SuROI method outlined. The artefact will be subsequently
validated by comparing and contrasting with a more traditional form of evaluation carried out
in the past. By having adopted a DSM framework, the developed artefact can be considered a
more general solution applicable to the wider scale. Possible applications of the new method
are suitable to support decision makers on housing regeneration schemes in the larger
international context, since the method can be replicated in different areas by quantifying
hidden costs and benefits and associating them to a different map of potential stakeholders to
be engaged in the production of housing. For this reason, the impact of the method can be
extremely relevant to the housing sector internationally. The SuROI Hybrid was explained,

857
which was formed from the gaps in the literature base from the quantitative SuROI
methodology and the qualitative stakeholder analysis. This new contribution to knowledge
can gauge the quantifiable amount of impact, in terms of cash flow, for each stakeholder
involved in a housing led urban regeneration scheme and can additionally introduce the
concept of time into the methodology, by being able to use the quantified outputs and
outcomes to gauge when the break even point occurs; either for a scheme itself, or for each
separate stakeholder involved in a scheme. This quantified information provided can be
extremely useful to housing associations in today’s difficult financial environment.
Further research can explore the application of the method to different sectors, such as health
care or sport facilities, by exploring a variety of different stakeholders and respective benefits
and burdens and testing their willingness to be subsequently engaged in the production of
public goods.
7. REFERENCES
Archer, B, 1995. ‘The Nature of Research’, Co-design: the interdisciplinary journal of design and contextual
studies, January 1995, 6 – 13.Assessment: Tools and Techniques, The World Bank, Washington DC.
Azhar, S., Ahmad, I. and Sein, M., 2010. Action Research as a proactive research method for construction
engineering and management. Journal of Construction Engineering and Management. 136:1. 87-98.
Bichard, E. (2016). Sustainable Return on Investment: Towards a Method of Valuing Social and Environmental
Change in the Built Environment. In: 2nd Annual International Conference on Social Sciences.
Bichard, E., 2015. Developing an Approach to Sustainable Return on Investment in the UK, Brazil and the USA.
A report for the Royal Institution of Chartered Surveyors Research Trust.
Bichard, E., Higham, A., Barlow, C., and Richards, A., 2017. Valuing Sustainable Change in the Built
Environment: Using SuROI to appraise built environment projects. Yildiz Technical University.
Brugha, R., and Varvasovsky, Z., 2000. Stakeholder Analysis: A Review. Health Policy and Planning, 15:3,
239-246.
Bryson, J.M., 2004. What To Do When Stakeholders Matter. Public Management Review, 6:1, 21-53.
Case study research in logistics. Publications of the Turku School of Economics and Business Administration:
Series B1, 83-101, 2003.
Chynoweth, P., 2013. ‘A Taxonomy of Research Styles for the Chartered Surveying Profession: Research into
Practice, for Practice, and through Practice’, Proceedings of the Royal Institution of Chartered Surveyors
Construction, Building, and Real Estate Conference (COBRA) New Delhi, India, 10th – 12th September
2013.
Conejos, S. Langston, C. and Smith, J., 2013. AdaptSTAR Model: A Climate –Friendly Strategy to Promote
Built Environment Sustainability. Habitat International, 37, 95-103.
Davidson, M., 2009. Social Sustainability: A potential for politics? Local Environment, 14, 607-619.
Dean, K and Trillo, C., 2017. Assessing sustainability in housing led urban regeneration: Insights from a
housing association in Northern England. (2017). In: AMPS, Living and Sustainability: An Environmental
Critique of Design and Building Practices, Locally and Globally. London: London South Bank University.
DEFRA, 2013. Payments for Ecosystem Services (PES): best practice guide. [ONLINE] Available at
https://www.gov.uk/government/publications/payments-for-ecosystem-services-pes-best-practice-guide
[Accessed 01.04.17]
DETR, 1998. Planning for Sustainable Development: Towards Better Practice. London: HMSO
Dowler, C., 2009. Shared ownership sales slump [ONLINE] Available at http://www.insidehousing.
co.uk/shared-ownership-sales-slump/6506100.article [Accessed 01.04.17]
Grimble, R., and Chan, M.K., 1995. Stakeholder analysis for natural resource management in developing
countries: some practical guidelines for making management more participatory and effective. Natural
Resources Forum, 19, 113–124.
Hevner, A.R., March, S.T., and, Park, J., 2004. Design Science in Information Systems Research. MIS
Quarterly, 28:1, 75–105
Hilditch, M., 2009. Spot the Difference [ONLINE] Available at http://www.insidehousing.co.uk/story.
aspx?storycode=6505317 [Accessed 01.04.17]
Hood, C., 1991, A public management for all seasons? Public Administration, 69, 3–19.
House of Commons, Communities and Local Government Committee, 2009.

858
Housing and the credit crunch Third report of session 2008–09 (2009) Available at:
http://www.publications.parliament.uk/pa/cm200809/cmselect/cmcomloc/101/101.pdf. Accessed 01/08/17.
Iivari, J., and Venable, J., 2009 Action Research and Design Science Research – Seemingly Similar but
decisively dissimilar. ECIS 2009 Proceedings. Paper 73.
Jepsen, A. L., and Eskerod, P., 2008. Stakeholder analysis in projects: Challenges in using current guidelines in
the real world, International Journal of Project Management, 4:2, 1–9.
Johannesson, P. and Perjons, E., 2012. A Design Science Primer. CreateSpace Independent Publishing Platform.
Jones, P.S., 2003. Urban regeneration's poisoned chalice: is there an impasse in (community) participation-based
policy? Urban Studies, 40 (3), 581–601
Kazmierczak, A.E; Curwell, S.R., and Turner, J.C., 2009. Regeneration of large urban area: assessment
methods. Proceedings of the Institute of Civil Engineer, Issue ME2, 117-124.
Lehtonen, M., 2004. The environmental-socio interface of sustainable development: capabilities, social capital,
institutions. Ecological Economics, 49, 199-214.
Littig, B., and Griessler, E. 2005. Social sustainability: a catchword between political pragmatism and social
theory, International Journal for Sustainable Development, 8, 65-79.
Lukka, K., 2003 “The constructive research approach”. In Ojala, L. & Hilmola, O-P. (eds.)
Case study research in logistics. Publications of the Turku School of Economics and Business Administration:
Series B1, 83-101, 2003.
MacArthur, J., 1997. Stakeholder analysis in project planning: origins, applications and refinements of the
method. Project Appraisal 12, 251–265.
March, S. T., and Smith, G. F., 1995. Design and natural science research on information technology. Decision
Support Systems, 15:4, 251-266.
Nicholls, J., Lawlor, E., Neizert, E., and Goodspeed, T., 2012 ‘A Guide to Social Return on Investment’ SROI
Network, January 2012, Liverpool.
ODA, 1995. Guidance note of how to do a stakeholder analysis of aid projects and programmes. London.
Overseas Development Administration.
OECD (ORGANISATION FOR ECONOMIC CO-OPERATION AND DEVELOPMENT) (2000) Urban
Renaissance: Belfast’s Lessons for Policy and Partnership. Paris: OECD
Peffers, K., Tuunanen, T., Rothenberger, M., and Chatterjee, S., 2007. A Design Science Research Methodology
for Information Systems Research. Journal of Management Information Systems, 24:3, 45-78.
Reed, M., Graves, A., Dandy, N., Posthumus, H., Hubacek, K., Morris, J.,Prell, C., Quinn, C.,, Stringer,L.,
2009. Who’s in and why? A typology of stakeholder analysis methods for natural resource management.
Journal of Environmental Management, 90, 1933-1949.
RICS, 2014. RICS Valuation –Professional Standards. Royal Institution of Chartered Surveyors, London.
Rietbergen-McCracken, J. and Narayan, D., 1998. Participation and Social Assessment: Tools and Techniques,
The World Bank, Washington DC.
Schmeer, K., 1999 Guidelines for Conducting a Stakeholder Analysis [ONLINE], Bethesda, MD: Partnership
for Health Reform. Available at
http://www.who.int/management/partnerships/overall/GuidelinesConductingStakeholderAnalysis.pdf>
[Accessed 01/07.17]
Shirey, M. R., 2012. Stakeholder analysis and mapping as targeted communication strategy. Journal of Nursing
Administration, 42:9, 399-403.
Simon, H, 1996. The Sciences of the Artificial. 3rd ed. Cambridge, MA: The MIT Press.
Thomson, C.S; El-Haram, M.A., and Hardcastle, C., 2009. Managing knowledge of urban sustainability
assessment. Engineering Sustainability, 162 Issue ES1, 35-43.
Tyler, P., Warnock, C., Provins, A., and Lanz, B., 2013. Valuing the benefits of urban regeneration. Urban
Studies 50:1, 169-190.
UK Government, 2017. Housing white paper [ONLINE] Available at
https://www.gov.uk/government/collections/housing-white-paper [Accessed 01.04.17]
Vaishnavi, V.K., and Kuechler, W.Jr., 2007. Design Science Research Methods and Patterns Innovating
Information and Communication Technology. Taylor & Francis Group.
van Aken, J.E., 2004. Management Research Based on the Paradigm of the Design Sciences: The Quest for
Field-Tested and Grounded Technological Rules. Journal of Management Studies, 41:2, 219-246.
Wang, M., Vogel, D. and Ran, W., 2011. Creating a performance-oriented e-learning environment: A design
science approach. Information And Management, 48:7, 260-269
Watson, K.J., and Whitley, T., 2016. Applying Social Return on Investment (SROI) to the Built Environment.
Building Research and Information [ONLINE]. Available from:
http://www.tandfonline.com/doi/full/10.1080/09613218.2016.1223486 [Accessed: 27/07/17]

859
Xing, Y., Horner, R., El-Haram, M., and Bebbington, J., 2009. A framework model for assessing sustainability
impacts of urban development. Accounting Forum, 33, 209–224.
860
ID 086
IMPORTANCE OF COMMUNITY PARTICIPATION IN DISASTER
RECOVERY
T. Van Krieken, U. Kulatunga and C. Pathirage
School of the Built Environment, University of Salford, Salford, M5 4WT, UK
Email: [email protected]
Abstract: The aim of this paper is to investigate the views about community on their
participation during disaster recovery and how they can be empowered. The community
participation from the beginning to end of the project, and future maintenance of the
community is essential for a successful recovery in an efficient and effective manner. Little, or
token, participation by the community has proved to be fatal through schedule delays in
recovery or public uprising. This article will outline a global literature review of community
participation complemented with some interview preliminary data from San Francisco and
Christ Church, New Zealand. The outcome is a framework of community participation and
empowerment. As "owners", the community will ensure a well- maintained community for
many years ahead.
Keywords: Community, Disaster, Empowerment, Survivors, Project Management.
1. BACKGROUND
1.1 Need of empowering the disaster effected community
Communities are the first responders during the aftermath of a disaster. Numerous studies
about single countries (Ainuddin, 2012; Bornstein, 2013; Chandrarsekhar, 2012; Crawford,
2013; Magnin, 2007; Olofsson, 2007; Twigg, 2009; World Bank, 2005, 2008) provide
incredible insightful information on why the community is very important even when their
power and influence are low and why it is important to empower to disaster affected
community (San Francisco, 2013; Rowlands, 2013; Slotterback, 2013).
Currently, Federal Emergency Management Association (FEMA) encourages the community
to take care of itself during the first 72 hours after a disaster as shown during the recovery
from Hurricane Sandy (San Francisco, 2013). Following a disaster, if the government does
not deliver on recovery, or on time, then citizens protest. According to a San Francisco
interviewee, to offset the potential dissatisfaction from the affected community, the
community needs to be encouraged to be part of the recovery. However, the community tends
to ignore disaster recovery plan after the disaster event and their demands could be not
possible to fulfil after the disaster. In essence, they become stakeholders with unreasonable
expectations and a single person within the community can stop the recovery project.
Therefore, agreement with the community from the beginning of the disaster recovery
process must be established.
Rowlands (2013) indicates that empowering the community and maximizing the
community’s participation at the local level will give the community control of the process
and enable it to take charge of its rebuilding. This means tapping into the community’s
resourcefulness; tapping local providers to supply materials and services (such as psychology
and social work); and tapping workers to rebuild the community is required to ensure

861
meaningful disaster recovery projects within the social and cultural sectors of natural
disasters.
The community's ideas and wisdom helps to shape the community through empowered
decision making with the government and other agencies. Would the government go this far?
That is part of empowerment: community involvement in the process. Not everyone from the
community sits at the planning table. The chain of command of the recovery project does not
allow ownership but allows participation in decision making. There are rules to govern on
how this happens through civic engagement of the community to the government.
Community is not asked to meddle nor implement in the recovery process. Accordingly, this
paper investigates the about community on their participation during disaster recovery and
how they can be empowered
2. LITERATURE REVIEW
2.1 Community Empowerment
Davidson's study (2006) proved that there existed variation in community participation
among different countries as stakeholders in the projects. Some of the communities were
informed, consulted but were not empowered; in essence have no power to affect the
deliverables of the project. The International Association of Public Participation (2007)
developed the following guidelines on how the community can participate and powered and
be empowered.

862
Figure 1: Spectrum of Public Participation
As noted in Figure #1, empower enables final decision-making in the community. Regional
Australian Institute (2013) indicates the empowered community share responsibility in
decision making and accountability. Legislative and policy frameworks within the
state/country establish the level of power communities can decide: some were limited and
some wide ranging within a defined time period. In the case of collaboration, there is
delegated decision-making, but the government retains the overall decision-making power.
The different types of participation is effective in different contexts; empower may not be
suitable for all situations. Slotterback (2013) noted that effective management of power
differences between stakeholders and community can help the community trust the process;
some powerful stakeholders might be reluctant in the process if they feel their power is
diminished. We need to make the Government and Project Manager aware and utilize
community empowerment within their projects. Community empowerment within disaster
recovery has much to offer as shown in the next section.

863
2.2 Community Empowerment in Disaster Recovery
The premise of Figure #1 above is those affected by a decision must be involved in the
decision-making process (IAP, 2007). Work in San Francisco, based on the “Whole
Community Approach” from the Federal Emergency Management Agency (2011), has taken
the above premise to enable community members to be trained in leadership and in project
management for the communities to adapt to stressors, such as residential fires, heat waves,
earthquakes and power outages (San Francisco, 2016). The community will act immediately
in an effective and efficient manner when trained and recognized (ADAP, 2004). Their
performance goes beyond traditional disaster management practices of preparedness and
response to mitigation and recovery (San Francisco, 2016) when masterly dealing with
stressors (disasters). Community empowerment has great benefits for Emergency
Management, government agencies, private and non-profit sector organizations when their
budgets are impacted by economic constraints (FEMA, 2011).
2.3 How to empower the community?
Collective Resilience
The news presents disasters as mass panic: rioting, looting and killing. Once the masses have
descended to a primitive psychological state, it is thought to be pointless trying to reason with
them about their civic obligations — let alone attempting to involve them as active partners
in disaster response. Instead, greater legal powers for government, and even coercive force,
should be used to restore social order. ‘Sensitive’ information is restricted to the
establishment elite, government and their functionaries, who not only ‘know best’, but are
somehow immune to the “mass panic” (Drury, 2012). The conclusion is that the victims are
too traumatized to take care of themselves.
“Collective resilience” forms in which the attitude of mutual helping and unity in the middle
of danger (Drury, 2012). In the initial absence of the emergency services, people within the
crowd act as ‘first responders’: applying make-shift bandages and tourniquets, sharing water,
talking to keep each other’s spirits up, physically supporting each other, and thus contributing
to each other’s survival and recovery as far as they were physically able. Majority of the
people, who are strangers to one another, see themselves as fellow mates helping one another.
Survivors need the provision of resources (food, shelter, communications and technologies),
know their family’s whereabouts, and find contact and location details of agencies and
professional services to restore their lives.
Survivor Assets
Survivor assets are the human, economic, physical and social capital. Human capital refers to
skills, education and job experience. Economic capital refers to funds to rebuilt housing,
agricultural, retail and manufacturing. Physical capital refers to material, housing,
infrastructure and land to rebuild the community. The least acknowledge is the social capital
– people and their networks. Are the networks loose or dense? The residents of New Orleans’
Village de L’Est were a close-knit community before Hurricane Katrina hit; through their
parish priest they maintained their sense of community when temporarily relocated to
Houston. Within two years, there was a 90% population return and 90% rate of business re-
opening (Aldrich, 2008).

864
Survivors’ resourcefulness
The next step for empowerment is to understand community resources. During the Japan’s
March 2011 earthquake, elderly and infirm were saved by the social capital, such as,
networks of neighbors, friends, and family and the resources (Aldrich, 2015). Social capital
provides financial (such as, loans and gifts for property repair) and nonfinancial resources
(such as, child care during recovery, emotional support, sheltering, and information). Isolated
individuals with few social ties are less likely to be rescued, seek medical help, take
preventative action in evacuation, and receive assistance from others, such as shelter (Dynes,
2005, 2006). Linking social capital connects community members with those in power.
After the Aceh Tsunami, Aldrich (2011) noted that Indian villages with high levels of
bonding and linking capital received greater amounts of aid and assistance more quickly than
communities which possessed only bonding capital. The villages who overcame collective
action problems and efficiently extracted resources from donors and government officials also
left out tsunami-affected villagers on the social margins of society.
Vulnerable Survivors
Vulnerable groups must be engaged not just protected and in need of care. The elderly,
children, and women, must be made priorities during effective post disaster response
(Ranghieri, 2014). Older people are more often thought of as a vulnerable group in need of
care rather than as a resource to support younger generations. When marginalized, elders lose
opportunities for interaction and the ability to contribute to society, and young people lose the
wisdom and talents that elders can offer. After the Great East Japan Earthquake of 2011,
Ibasho, an NGO, heard many stories about elders who saved the younger generation by
telling them where to escape or by teaching them how to survive with extremely limited
resources.
Marcillia (2012) recommended that flexibility and open ended design in reconstructing
homes be very advantageous in the critical transition of the community to their new homes
such as the location and size of kitchen or parlour.
Social and Cultural Coping
Another way is how to utilize those resources through social and cultural coping. Cretney
(2016) outline coping, response and adaptive capacities to rebuild. Wlodarczyk (2016)
confirmed that coping strategies and participation occurred at an individual and communal
level in different cultural contexts. Communal coping strategy was found to be higher in
collectivism countries as Colombia and Chile rather than in individualistic culture of Spain.
Spiritual coping was found to be high in Colombia and Chile but growth was found in Spain.
Social support was high in Colombia and Chile, but had a mediating role in Spain.
The importance of coping as an avenue to build relationships between community
organizations and higher level governance institutions allow for communities to take some
level of ownership and control. This reinforces the importance of moving away from the
command and control approach that has focused on an intensive role of State and governance
actors, relegating individuals and communities to passive roles in response and recovery
(Singh-Peterson et al., 2015; Prior and Eriksen, 2013).

865
A paradigm shift from perceiving the community as victims to survivors is necessary to
utilize the inner strengths and resources of the community to rebuild the community after a
disaster into a resilient and sustainable community.
3. RESEARCH METHODOLOGY
To investigate the views about community on their participation during disaster recovery and
how they can be empowered, a case study research strategy has been used. Accordingly, the
below section includes the findings of the initial case study carried out in San Francisco. The
unit of analysis of the case study is Project Manager and Community Leader. Semi-structured
interviews were used as the data collection method within the case study. Data obtained
through the semi-structured interviews were analysed by using NVivo software. This section
aims to present and analyze the data obtained from fourteen semi-structured interviews in the
San Francisco area.
The analyzing of data through Nvivo started by classifying the data into nodes related to
Community empowerment methods (49%) and Project Management methods (51%).
Community node was further broken down into community strategies, community response
and community factors. The result is highlights of learned experience in community
participation and empowerment. The highlights gave an understanding of which dynamics to
note, such as social capital and organizational change management, for the efficient and
effective rebuilding a community.
4. FINDINGS
The analysis is to establish the importance of empowering disaster affected communities in
the post-disaster phase. Accordingly, the below node on Community Empowerment in NVivo
was established.
Figure 2: Nvivo screenshot of the Community Empowerment themes nodes
The references discussed in the interviews were subdivided into three groups: Social Capital,
Community and Empowerment. Social capital is defined by interviewee IP13 as "created by
individuals who work in an area of concern for necessity or interest. The work they do often
volunteer bring benefits to larger group of people. Bottom up approach in social capital.
Brought to the community skills that they can utilize to the benefits of the community".
Interviewee IP4 stressed: "Need to focus on what is tangible to the community. … Community
let the professionals to do the work. Citizens and professionals must establish a balance on
what can be done by each other. Once ask citizens to do work of professionals then the

866
citizens will push back". This indicates that what we need to have during the post-disaster
recovery is a collaborative working relationships between the community and professionals.
Interviewee IP6 commented that consultation with the community does not exist: “Consult
does not exist: City agencies working with themselves. Do not listen (active listen). They have
their own agenda. This agnostic approach is not getting anywhere. Belief in collaboration
rather than conformational to form better relationships. A lot of infighting within city and
community result…Community has kernels of knowledge. Meet with the community in group
and one to one. Get to know them. Project manager cannot do this because they have a lot of
money to spend. Get their buy in”. The community expresses this frustration of being
ignored, priority is on the funders (government and banks) for expediency of the project.
Priority is to spend the money expediently; consulting with many people is onerous and
bothersome with many conflicting views. Interviewee IP9 stress that “Community ideas and
wisdom helps to shape the community. Empower to shape decision making. The challenge
for poor communities is what they want their community to look like”.
Interviewee IP9 stress that you "Cannot separate all the components of public participation.
Community needs to be informed to start decision making. Community is allowed to decide
after the decision was made to move them. Community participate in final phase of the
project not the first phase”. The result is tokenism takes place to ensure government and
other organizations have public participation. A token to shareholders but a blow to the
community. From a stakeholder perspective, interviewee IP4 commented:
"Government is not a stakeholder. It is a hired help: a layer bureaucracy.
Government players do not have vested interests in the project. Their vested interests
is only as a job. They lose their job rather than house, family and friends that
community experience. If government employees live in the area; they are
stakeholders as citizens but they are employees; therefore their jobs becomes
priority".
Importance of community member’s participation is emphasized where interviewee IP1
indicated the community: "it is where the community lives and works. They sense what
happened in the past. They may not want to restore in the same way as the past; parks and
roads are different design dependent on changing values.” Community input is stressed.
Interviewee IP4 stressed the community is the owner of the project; hence major stakeholder
of the project through the following quote: "community owns the project. Owns is the
ultimate responsibility for the benefits or deficiencies of the project. Own is an extension of
the idea the citizen are responsible to their representatives (elected officials and
professionals). They are the major stakeholder; they are the owners. The community tend to
ignore to plan after the event. Their demands are not possible to fulfill. They become
stakeholders with unreasonable expectations".

867
5. DISCUSSIONS AND CONCLUSION
Figure 3: Importance of Community Participation in Disaster Recovery
5.1 Discussion - Empowerment
The above conceptual model summarizes the interview comments as highlighted in this
paper. As shown above, the community is the "owner" of the project. The community has
vested interest because they raise their children in the community; work in the area; have
intimate knowledge of the geography, social and cultural environment; and have close friends
they grew up in the area. In addition there are people with leadership and project management
skills within the community to assist in the recovery. These skills were taught through the
community and assistance from local universities. The community members have to learn to
work with the various levels of government which takes time and guidance – civic
engagement. Time to build expertise in civic engagement and be recognized by various levels
of government in return. The most important advice given is the community has an intimate
knowledge of itself. That knowledge and expertise is available in a collaborative and
empowerment manner. The community asks to be walked through the process in an advisory
role as the "owner" of the project. The principles of organizational change management on
close involvement and frequent communication of stakeholders is greatly stressed.
The community is a major stakeholder since the community "owns" the project. They are the
"owners" of the project as the persons ultimately responsible for the benefits or deficiencies
of the project. Extending the idea that the citizen are responsible to their representatives
(elected officials and professionals). Ownership part of the project is formed by the attitude
of citizens. Citizens feel that government should do their job. Government is going to fix if
government has the capacity. These ideas formed the basis for Figure #3 (Importance of
Community Participation in Disaster Recovery). The community is shaped by social capital;
funds available for recovery through various mechanisms; well-being indicators on health,
social and economics; civic engagement (working relationships within the community and

868
government); and leadership skills of community leaders to work within the community and
stakeholders (government, NGOs, and INGOs). The first 72 hours the community is on their
own after disaster; therefore community participation is extremely important in disaster
recovery.
5.2 Conclusion
To investigate the views about community on their participation during disaster recovery and
how they can be empowered, a case study research strategy has been used. Accordingly,
findings of the initial case study carried out in San Francisco. The unit of analysis of the case
study is Project Manager and Community Leader. The findings were based on 14 semi-
interviews. The result is highlights of learned experience in community participation and
empowerment. The highlights gave an understanding of which dynamics to note, such as
social capital and organizational change management, for the efficient and effective
rebuilding a community. Further analysis is required for the statistical relationships of the
various components. A note of caution: similar cookie approach in recovery cannot be
applied in disaster recovery since the community and its environment differ from one
another. Principles of participation and empowerment must be understood and worked with.
6. REFERENCES
Anderson, W. (November 2008), Mobilization of the Black Community Following Hurricane Katrina: From
Disaster Assistance to Advocacy of Social Change and Equity. International Journal of Mass Emergencies
and Disasters, Vol. 26, No. 3, pp. 197–217.
Ainuddin, S., Routray, J. K., (2012) "Institutional framework, key stakeholders and community preparedness for
earthquake induced disaster management in Balochistan", Disaster Prevention and Management, Vol. 21
Issue: 1, pp.22 – 36
Aldrich, D. (2008), The Crucial Role Civil Society in Disaster Recovery and Japan’s Preparedness for
Emergencies, Japan Aktuell 3 (2008): 81-96
Aldrich, D. (2011), The Externalities of Strong Social Capital: Post-Tsunami Recovery in Southeast India,
Journal of Civil Society Vol. 7, No. 1, 81–99, April 2011
Aldrich, D., Meyer, M.A., (2015) Social Capital and Community Resilience, American Behavioral Scientist
2015, Vol. 59(2) 254 –269
Araki, C., (2013), Earthquake and Disaster Response in the Japanese Community: A Strengths and Community
Perspective. Journal of Social Work in Disability & Rehabilitation, 12:39–47
Asian Disaster Preparedness Center (ADPC) (2004). Program Completion Report: Asian Urban Disaster
Mitigation Program. Asian Disaster Preparedness Center (ADPC). Bangkok, Thailand.
Barnshaw, J. 2006. “Beyond Disaster: Locating Katrina within an Inequality Context.” Pp. 47-70 in Learning
from Catastrophe: Quick Response Research in the Wake of Hurricane Katrina". Boulder, CO: University
of Colorado Natural Hazards Research Applications and Information Center.
Bolin, R., 2006. “Race, Class, Ethnicity, and Disaster Vulnerability.” Pp. 113-129 in Handbook of Disaster
Research, edited by Havidán Rodríguez, Enrico L. Quarantelli, and Russell R. Dynes. New York: Springer.
Bornstein, L., Lizarralde G., Gould, K., and Davidson, C. (2013). Framing responses to post-earthquake Haiti
How representations of disasters, reconstruction and human settlements shape resilience International
Journal of Disaster Resilience in the Built Environment, Vol. 4, No. 1, page 43-57
Bretherton, Diane; Ride, Anouk, 2011, Community Resilience in Natural Disasters
Palgrave MacMillian, New York
Chandrasekhar, D., (2012). Digging deeper: participation and non-participation in post-disaster community
recovery. Community Development Vol. 43, No. 5, 614–629
Chandrasekhar, D., Zhang, Y., Xiao, Y., (2014). Non-traditional Participation in Disaster Recovery Planning:
Cases From China, India, and the United States. Journal of the American Planning Association, Autumn,
Vol. 80, No. 4

869
Crawford, L. H., Taylor, N., & Blythman, T. (2013). Understanding the permanent / temporary interface: the
case of disastrous events. In IRNOP XI Conference, Oslo, Norway, 16-19 June 2013 BI Norwegian
Business School.
Crawford, L., Langston, C., Bajracharya, B., (2013) "Participatory project management for improved disaster
resilience", International Journal of Disaster Resilience in the Built Environment, Vol. 4 Issue: 3, pp.317 –
333
Davidson, C. H., et al. (2006). Truths and myths about community participation in post-disaster housing
projects. Habitat International, doi:10.1016/j.habitatint.2006.08.003
Dynes, R. (2005).Community social capital as the primary basis of resilience, University of Delaware, Disaster
Research Center, Preliminary Paper #344
Dynes, R. (2006).Social capital: Dealing with community emergencies. Homeland Security Affairs, 2(2), 1-26.
Drury, John (2012) Collective resilience in mass emergencies and disasters: A social identity model. In: Jetten,
Jolanda, Haslam, Catherine and Haslam, S Alexander (eds.) The social cure: identity, health and well-being.
Psychology Press, Hove; New York, pp. 195-215.
Federal Emergency Management Agency (FEMA), 2011. A Whole Community Approach to Emergency
Management: Principles, Themes, and Pathways for Action. FDOC 104-008-1
International Association of Public Participation, http://www.iap2.org/
Lightfoot, E., Simmelink-McCleary, J., Lum, T. (2014). Asset Mapping as a Research Tool for Community-
Based Participatory Research in Social Work. Social Work Research Volume 38, Number 1 March
Maginn, P. (2007). Towards more effective community participation in urban regeneration: The potential of
collaborative planning and applied ethnography. Qualitative Research, 7(1), 25–43.
Marcillia, S. R., Ohno, R. (2011), Learning from Residents' Adjustments in Self-built and Donated Post Disaster
Housing after Java Earthquake 2006. Procedia – Social and Behavioural Sciences 36 (2012), pp. 61-69.
Olofsson, A. (2007), “The preparedness of local authorities for crisis communication with people who have
foreign backgrounds – the case of Sweden”, International Journal of Mass Emergencies and Disaster, Vol.
25 No. 2, pp. 145-173.
Prior, T. and Eriksen, C. (2013), “Wildfire preparedness, community cohesion and socialecological systems”,
Global Environmental Change, Vol. 26 No. 3, pp. 1575-1586. Pryke, Stephen. (2012) Social Network
Analysis in Construction. Somerset, NJ, USA: John Wiley & Sons
Ranghieri, F, and Ishiwatari, M., (2014) Learning from Megadisasters: Lessons from the Great East Japan
Earthquake. International Bank for Reconstruction and Development / The World Bank
Regional Australian Institute (2013), From Disaster to Renewal: The Centrality of Business Recovery to
Community Resilience
Rowlands, A. (2013). Disaster Recovery Management in Australia and the Contribution of Social Work. Journal
of Social Work in Disability & Rehabilitation, 12:19–38, 2013
San Francicso, (2016). Empowered Communities Program, Toolkit.
Singh-Peterson, L., Salmon, P., Baldwin, C. and Goode, N. (2015), “Deconstructing the concept of shared
responsibility for disaster resilience: a Sunshine Coast case study, Australia”, Natural Hazards, Vol. 79 No.
2, pp. 755-774.
Slotterback, C., Crosby, B., (2012), Designing Public Participation Processes, Public Administration Review,
73, 1, 23-34/
Twigg, J. (2009). Characteristics of a Disaster-resilient Community: A Guidance Note. London: DFID. .
http://discovery.ucl.ac.uk/1346086/1/1346086.pdf
Wapdarczyk. A. (2016). Communal Coping and Posttraumatic Growth in a Context of Natural Disasters in
Spain, Chile and Columbia. Cross-Cultural Research 2016, Volume 50(4), pp. 325-355
World Bank (2005b). Learning Lessons from Disaster Recovery: The Case of Mozambique. Disaster Risk
Management Working Paper Series No. 11. Washington DC: World Bank.
www.proventionconsortium.org/?pageid=37&publicationid=40#40
World Bank, 2008; “Building Resilient Communities: Risk Management and Responses to Natural Disasters”
870
ID 093
SUSTAINABLE BUILDING CONSTRUCTION PRACTICES IN LAGOS
STATE, NIGERIA
O. Faremi, I.B. John and C. Nwokediuko
Department of Building, Faculty of Environmental Sciences, University of Lagos, Nigeria
Email: [email protected]
Abstract: It is a globally acknowledged discourse that the construction industry significantly
consumes enormous energy and emits greenhouse gases (GHG). This is due to its effort in
bridging the current housing deficit which is a resultant of increased population both in
developed and developing countries. Extant studies have revealed the barriers and challenges
in adopting sustainable construction practices. Hence, this study assesses the extent to which
sustainable building construction practices are incorporated in the construction of buildings in
Lagos State, Nigeria. A survey of one hundred (100) construction professionals was conducted
on frequently implemented sustainable practices on buildings projects and the perceived
satisfaction of users of buildings on sustainability features. A total of eighty (80)
questionnaires were successfully retrieved and processed for analysis using frequency tables
and relative implementation index (RII) as tools for the descriptive statistics while spearman
rank correlation was used as the inferential statistical tool for this study. The results of
analysed data shows that there is a significant positive relationship between sustainable
practices and the satisfaction of building users. This study recommends enlightenment of both
construction project designers and clients on the need to implement sustainable features in the
construction of buildings within the study area.
Keywords: Construction industry, Buildings, Sustainability, Stakeholders, Sustainable
construction.
1. INTRODUCTION
The importance of the construction industry in any developing country, such as Nigeria
cannot be overemphasized. Nwokoro and Onukwube (2011) opine that the construction
industry is a complex one due to the involvement of its numerous stakeholders and their
divergent interest. Notwithstanding its complexity, the construction industry plays a critical
role in the economic, social and environmental sector of the nation, hence the need for
resource optimization and implementation of global best practices in the industry. The
process by which such resource optimization and environmental preservation while the set
goal is achieved is termed sustainability (Kuhlman & Farrington, 2010). Sustainable
construction entails the effective application of the principles of sustainable development to
the comprehensive construction cycle of a building. This ensures optimum comfort and
viable use of a building through its lifetime (Rahim, Yusoff, Zainon, Wang, & Lumpur,
2014).
There are criteria by which a building or construction project is evaluated for sustainability
compliance. These criteria are recognised as the metrics of sustainability (Loman, 2014).The
US Green Building Council (2009) posits that sustainable building development entails the
construction of buildings in a manner that it effectively meet the metrics of resource
efficiency, water efficiency, innovation in design, energy efficiency, improved indoor and
environment air quality as well as reduction in the emission of greenhouse gases. Although

871
Elmualim and Alp (2016) opine that the construction industry should be the main sector in
which the requirements of sustainability are met, far from that expectation is the present
reality especially in developing countries. In Nigeria for example, buildings are often times
constructed using the traditional construction practice in which the goal is to complete
construction activities as quickly as possible while little or no attention is paid to the
consequential impact of the activities on the environment.
The practice of sustainable construction is further seen to be at infancy in Nigeria with the
low level of awareness of construction professionals on the key concepts of sustainable
building development (Nduka & Ogunsanmi, 2015). It appears that construction professionals
are generally reluctant to embracing the totality of the practices of sustainability on
construction projects. This study therefore investigates frequently implemented sustainable
practices in the design and construction of building projects in Lagos State as well as the
extent to which building occupants are satisfied with the level of sustainability features in
their buildings.
1.1 Research hypothesis
Ho There is no significant relationship between sustainable construction practices and the
satisfaction of building occupants in Lagos state.
2. LITERATURE REVIEW
Literature has established that there are three dimensions of sustainability namely; social,
economic and environmental dimensions (Kuhlman & Farrington, 2010; Pancovska, 2017).
The process of achieving sustainable construction involves the optimisation of design,
tendering, site planning, organisation, material selection, recycling and waste minimisation.
Globally, the incorporation of sustainable practices across different fields have become an
increasing trend that is aimed at scaling down the negative impact of man’s activity on the
environment. In the construction industry, a project is considered sustainable only when all
the basic principles of sustainability are compatible with each other (Mateus & Bragança,
2011). It is in this regard that Ilesanmi (2015) describes the concept of sustainability as the
attempt towards simultaneously achieving the goals of a better economy, improved
environment and a more participating society. In addition, Du Plessis et al. (2001) posit that
the construction of sustainable building is a concept aimed at creating harmony between the
natural and built environment. This involves all processes initiated during construction that
satisfies economic, environmental and social issues throughout the service life of a building
(Basiago, 1999).
The practices of sustainability are a fast rising trend amongst countries especially the
developed ones as it has become the pivot around which all other activities depend (Miranda
& Marulanda, 2002). This is because the earth’s resources are under severe pressure due to
the increase in population and economic expansion (Ametepey, Aigbavboa, & Ansah, 2015).
Sustainable development of any building or construction projects is characterised with the
major goal of creating a healthy built environment based on efficient use of resources and
smart ecological design (Shofoluwe, 2013). The elements and key feature of sustainability
comprises of energy efficiency, resource or material efficiency, healthy indoor environmental
quality, utilizing clean and renewable energies, environmental degradation followed by

872
greenhouse gas emission, sustainability in designs and contracts and water conservation
(Taheriattar & Farzanehrafat, 2014).
Schwarz, Beloff and Beaver (2002) explain that there are five basic indicators of
sustainability metrics for construction projects. These indicators include material utilisation,
energy utilisation, water utilisation, toxic emissions and pollutant emissions. Furthermore,
Robert, Parris and Leiserowitz (2005) add that the entire exercise of sustainability
compliance aim at achieving leadership role in greenhouse gas emissions reduction, energy
efficiency, renewables, and waste treatment and handling. One of the known agents
promoting sustainability in the construction industry is the Leadership in Energy and
Environmental Design (LEED). LEED is a third-party certification program and an
internationally accepted benchmark for the design, construction and operation of high
performance sustainable buildings (Canada Green Building Council, 2017). LEED provides
sustainability metrics for benchmarking the design and construction of buildings across five
areas comprising sustainable site development, water efficiency, energy efficiency, material
selection and indoor environmental quality. This study adopts all the metrics of sustainability
highlighted in the literature that were reviewed in the investigation of sustainable practices in
the construction of buildings in Lagos state.
Furthermore, the implementation of sustainable practices on a project largely depends on the
knowledge, perception and involvement all stakeholders on the project. It is also of
importance that these stakeholders have an appreciable understanding of the consequences of
their individual actions (Plessis & Africa, 2012). However, Abidin (2010) reveals that the
overall awareness and knowledge of construction stakeholders on sustainability concepts in
developing countries are below satisfactory taking the case of Malaysia as an example. The
case in Nigeria is not so far from that of Malaysia as the practice of sustainability in the
Nigerian construction industry is yet to be pronounced.
Previous studies (Mensah & Castro, 2004; Abolore, 2012; Loman, 2014; Abisuga &
Oyekanmi, 2014) have highlighted the potential benefits of sustainable construction practices
to the built environment and eco-system through protection of natural resources and efficient
energy utilization. The studies posit that sustainable practices significantly increase financial
profit, delivers long term competitiveness, maximum utilisation of land, optimised energy
input and decrease in the possible impacts of risks for the global and local environment.
Furthermore, Nwokoro and Onukwube (2011) opine that the practice of sustainability in
buildings also impact on the satisfaction and safety of occupants through the attainment of
visual and thermal comfort, and satisfactory indoor air quality. This study adopts the criteria
of visual comfort, thermal comfort and indoor air quality as variables for assessing the
satisfaction of the respondents on sustainable practices within the study area.
3. METHODOLOGY
This study was delimited to Lagos state located in the south-western region of Nigeria. The
choice of Lagos State was because Lagos state is the economic nerve centre of Nigeria with
the largest concentration of industries, financial institutions and major sea port. The human
population of the state is in excess of 9 million people (National Population Commission,
2009). This rank the state among the fastest growing cities in Nigeria with a significant level
of construction activities which enhanced the collection of data for this study.

873
A structured questionnaire was developed and administered as the principal instrument for
collecting data for this study. Using simple random sampling technique, a total of one
hundred (100) questionnaires were administered to professionals engaged in the construction
of buildings within the study area. A total of eighty (80) questionnaires were retrieved.
Retrieved questionnaires were scrutinized for errors, omissions, completeness and
consistencies and were found to be adequately completed and suitable for analysis. The
returns represent 80% response rate. The data were processed and analysed with the aid of
Statistical Package for Social Sciences (SPSS) version 20.0. Frequency tables and relative
implementation index were used for the descriptive statistic while correlation analysis was
utilized to test the hypothetical statement formulated for this study.
4. RESULTS AND DISCUSSION
Table 1 below shows the characteristics of respondents for this study. The table shows that
about 23 percent of the respondents were Architects, 35 percent were Builders, 25 percent
were Civil Engineers and 20 percent belong to other profession. The other profession
category comprises of other professionals that were involved in the management of building
construction projects within the study area.
Table 1: Demographic data of respondents
Demographic Data Frequency Percentage
Years of experience
Below 5 years 38 47.5
6 – 10 years 32 40
11 – 15 years 6 7.5
16 – 20years 2 2.5
Above 20 years 2 2.5
Total
80 100.0
Profession of respondent
Architect 18 22.5
Builder 28 35
Civil engineer 18 22.5
Others 16 20
Total
80 100.0
Academic qualification
OND 4 5
HND 14 17.5
B.Sc. 40 50
M.Sc 22 27.5
Total 80 100
Nature of organization
Building contracting 12 15

874
Demographic Data Frequency Percentage
Building and Civil contracting 36 45
Building and Civil consulting 20 25
Others 12 15
Total 80 100
Furthermore, Table 1 reveals that 15 percent of the respondents work in building contracting
firms, 45 percent work in building and civil contracting firms, 25 percent work in building
and civil consulting firms and 10 percent work in other type of firms. Also the years of
experience of respondents show that 47.5 percent of the respondents had working experiences
below 5 years, 40 percent had work experiences ranging between 6 to 10 years, about 8
percent of the respondents had work experiences ranging between 11 to 15 years, about 3
percent of the respondents had work experiences of between 16 to 20 years and about 3
percent had work experiences above 20 years. The general outlook of the length of working
experiences of the respondents implies that the respondents are conversant with construction
processes and have ample experiences on construction activities. This suggest that majority
of the respondents have the requisite experience to answer questions on the practices of
sustainable construction and were able to provide valuable responses in line with the
objective of this study.
This study assessed sustainable practices that were frequently implemented in the design and
construction of buildings in Lagos state. In evaluating sustainable practices that were often
incorporated into the design of buildings, a list of sustainable practices that should be
incorporated into the design of buildings were extracted from literature into the questionnaire
and presented to the respondents. The respondents were asked to rate their responses on a 5
point Likert scale ranging from 1= never to 5= always. This was intended to elicit
information on how often each of the sustainable practices were incorporated into the design
of buildings in Lagos state. The data collected were analysed using relative implementation
index (RII) formula. The RII is expressed as:
RII = ∑W/ (A*N) …………..equation 1
Where:
W= weight given to each sustainability practices by the respondents
A = is the highest weight
N = is the total number of respondents
The calculated RII values were interpreted using the scale RII ≥ 0.76 means most often
implemented , 0.67 ≤ RII ≤ 0.75 means often implemented, 0.45 ≤ RII ≤ 0.66 means rarely
implemented and RII ≤ 0.44 means not implemented (Waziri & Vanduhe, 2013; Magutu &
Kamweru, 2015). The resulting analysis is presented in Table 2.
Table 2: Frequency of implementing sustainable practices in building design
Sustainable practices N RII Rank Remark
Ease of access in and out of site 80 0.97 1 MOI
Health, welfare and satisfaction of occupants 80 0.92 2 MOI

875
Sustainable practices N RII Rank Remark
Effective prevention of water pollution. 80 0.89 3 MOI
Improved indoor air quality using daylighting
system and passive ventilation
80 0.88 4 MOI
Minimization of waste 80 0.84 5 MOI
Efficient use of water in building during and
after construction
80 0.83 6 MOI
Optimization of energy during and after
construction.
80 0.82 7 MOI
Comfortable thermal environment 80 0.81 8 MOI
Cost efficiency 80 0.78 9 MOI
Reduction in the whole life cost of the
building
80 0.77 10 MOI
The use of passive and efficient ventilation
system for improve indoor air quality
80 0.73 11 OI
Visual comfortability 80 0.71 12 OI
Proximity of site and effective land utilization 80 0.69 13 OI
Control of pollution and abatement of noise 80 0.69 14 OI
Use of recyclable and renewable materials to
effect cost efficiency
80 0.57 15 RI
Reduction of environmental impact through
sustainable site allocation
80 0.44 16 NI
Conservation of existing natural areas and
promoting biodiversity
80 0.44 17 NI
Efficient utilization/consumption of energy
within building overtime
80 0.43 18 NI
Conserving energy through renewable and
recyclable materials
80 0.42 19 NI
Note: MOI = Most often incorporated, OI = Often incorporated, NI=Not incorporated
Table 2 shows that the sustainability practices that were often incorporated into the design of
buildings in Lagos state include; efficient use of water in building during and after
construction, optimization of energy during and after construction, comfortable thermal
environment, cost efficiency and reduction in the whole life cost of the building. However,
reduction of environmental impact through sustainable site allocation, conservation of
existing natural areas and promoting biodiversity, efficient utilisation or consumption of
energy within building overtime and conserving energy through renewable and recyclable
materials were sustainable practices that were not incorporated in the design of buildings
within the study area. The results suggest that building designers and construction
professionals within the study area incorporate sustainable practices that impact on the
project overall cost than those that impact on the environment in which the buildings were
constructed.
The implication of this result is that not all the possible sustainability practices are
incorporated in the design of buildings in Lagos state. Building construction activities in the
state therefore have potential negative consequences on the environment. This implication
buttress the concern of Baloi (2003) that the lack of recognition in the design process for the
extensive use of natural resources, various sources of energy, and water demand of a building

876
would often result in severe consequences on the environment. Furthermore, Ofori, Gyadu-
Asiedu, and Assah-Kissiedu (2015) explain the importance of conceiving sustainability right
from the design of building projects. The authors posit that the future of sustainable
construction has its roots in past and present actions and the future depends on the awareness
of the consequences of construction stakeholders’ acts and deeds.
This study also assessed the sustainable practices that are implemented during the
construction of buildings in Lagos state. In assessing this, a 5 point Likert scale ranging from
1= never to 5= always was presented to the respondents. The data collected was analysed
using the relative implementation index (RII) formula. The calculated RII values were
interpreted using the scale RII ≥ 0.76 means most often implemented , 0.67 ≤ RII ≤ 0.75
means often implemented, 0.45 ≤ RII ≤ 0.66 means rarely implemented and RII ≤ 0.44
means not implemented (Waziri & Vanduhe, 2013; Magutu & Kamweru, 2015). Table 3
shows the result of the analysis.
Table 3: Frequently implemented sustainable practices during building construction
Sustainable practices N RII Rank Remark
Downsizing the dominant use of incandescent bulbs and
replacing them with energy saving bulbs (i.e. CFLs &
LEDs)
80 0.89 1 MOI
Innovative waste water technologies to reduce waste
water generation
80 0.83 2 MOI
Use of efficient insulating wall materials to enhance
indoor air quality
80 0.83 3 MOI
Innovative water management to increase water
efficiency
80 0.82 4 MOI
Application of daylighting to increase visual comfort 80 0.82 4 MOI
Use of low energy cooling system to enhance Indoor Air
Quality (IAQ)
80 0.80 6 MOI
Use of effective acoustics materials 80 0.78 7 MOI
On site application of renewable technology 80 0.67 8 OI
Note: MOI = Most often implemented, OI = Often implemented, NI=Not implemented
The results in table 3 shows that the downsizing of the dominant use of incandescent bulbs
and replacing them with energy saving bulbs (i.e. CFLs & LEDs) to achieve energy
optimization is the most often implemented sustainable practice (RII= 0.89) during the
construction of buildings. Innovative waste water technologies to reduce waste water
generation and the use of efficient insulating wall materials to enhance indoor air quality
jointly ranked as the second most implemented sustainable practices (RII= 0.83) during the
construction of buildings. These were closely followed by innovative water management to
increase water efficiency and the application of day lighting to increase visual comfort (RII=
0.82). Use of low energy cooling system to enhance IAQ (RII= 0.80) and the use of effective
acoustics materials (RII= 0.78) ranked as the second to the last and last most often
implemented sustainable practices respectively. This results aligns with the findings of
(Degefa, 2010; Natural Resources Defense Council, 2012; Apanavičiene, Daugeliene,
Baltramonaitis, & Maliene, 2015) that significant cost savings can be achieved in the cost of
energy through the use of energy saving bulbs.

877
This study assess the level of satisfaction of building occupants on the features of
sustainability in their buildings. This was done by asking the respondents of this survey to
rate the feedback of occupants on the parameters of sustainability in their buildings. A 5 point
Likert scale ranging from 1=very dissatisfied to 5= very satisfied was provided to the
respondents for the assessment. Table 4 shows the result of the analysis.
Table 4: Occupants satisfaction on the level of sustainability features in buildings
Sustainability features N Mean
Indoor air quality 80 4.08
Visual comfort and lighting 80 4.05
Thermal comfort 80 4.03
Acoustic comfort 80 3.68
Table 4 shows that the building occupants were satisfied with all the four sustainability
features in their buildings. The level of satisfaction was in the order; indoor ventilation and
air quality (4.08), lighting and visual comfort (4.05), thermal comfort (4.03) and acoustic
comfort (3.68) respectively.
4.1 Test of research hypothesis
Ho- There is no significant relationship between sustainable practices and the level of
occupants’ satisfaction with sustainable features
H1- There is significant relationship between sustainable practices and the level of occupants’
satisfaction with sustainable features
The postulated hypothesis was analysed using the spearman rank correlation. The result of
the analysis is shown in table 5 below:
Table 5: Correlation between sustainability practices and building users’ satisfaction
EIW WWT ART ADL EAD LEC WRT ESB ADS VCS LDS IAQ TCS
EIW r 1
p
WWT r .897** 1
p .000
ART r .886** .886** 1
p .000 .000
ADL r .859** .794** .890** 1
p .000 .000 .000
EAD r .935** .877** .904** .919** 1
p .000 .000 .000 .000
LEC r .876** .825** .903** .943** .943** 1
p .000 .000 .000 .000 .000
WRT r .917** .927** .883** .854** .927** .880** 1
p .000 .000 .000 .000 .000 .000
ESB r .871** .760** .824** .894** .889** .874** .806** 1
p .000 .000 .000 .000 .000 .000 .000
ADS r .937** .947** .865** .799** .876** .826** .930** .790** 1
p .000 .000 .000 .000 .000 .000 .000 .000
VCS r .842** .837** .894** .915** .875** .875** .869** .824** .851** 1
p .000 .000 .000 .000 .000 .000 .000 .000 .000
LDS r .999** .899** .887** .862** .935** .877** .918** .872** .937** .844** 1

878
EIW WWT ART ADL EAD LEC WRT ESB ADS VCS LDS IAQ TCS
p .000 .000 .000 .000 .000 .000 .000 .000 .000 .000
IAQ r .823** .821** .913** .898** .859** .867** .833** .818** .812** .952** .824** 1
p .000 .000 .000 .000 .000 .000 .000 .000 .000 .000 .000
TCS r .844** .836** .895** .919** .876** .880** .873** .826** .855** .997** .845** .956** 1
p .000 .000 .000 .000 .000 .000 .000 .000 .000 .000 .000 .000
Note: **. Correlation is significant at the 0.01 level (2-tailed), EIW= efficient insulating walls, WWT= waste
water technologies, ART= application of renewable technology, ADL= application of daylighting, EAD=
effective acoustics design, LEC= low energy cooling system, WRT= water reduction technology, ESB= energy
saving bulbs, ADS= acoustic design satisfaction, VCS= visual comfort satisfaction, LDS= lighting design
satisfaction, IAQ= indoor air quality satisfaction, TCS= thermal comfort satisfaction.
Table 5 shows the relationship between the variables. The result shows that the correlation
coefficient values (r) was greater than 0.3 and the corresponding significant p-values are less
than 0.01 for all the cases. The results shows statistically significant positive relationship
between sustainable practices and building users’ satisfaction with sustainable features in
their buildings. This results suggest a rejection of the null hypothesis (H0) and an acceptance
of the alternative hypothesis (H1).
4.2 Discussion of Findings
This study explored the level of sustainable construction practices in the construction industry
in Lagos state. The result of the survey shows that sustainability practices that are often
incorporated into building designs include the ease of access in and out of site, health,
welfare and satisfaction of occupants, effective use of water during and after building
construction, control of pollution and cost efficiency The result correlate with the study of
Khalfan, Noor, Maqsood, Alshanbri and Sagoo (2015) and Ofori et al (2015) that
construction professionals should incorporate sustainability practices in the design of
buildings which would assists in making the right construction solutions in terms of materials
selection, building orientation, costs and lighting system.
Furthermore, the practice of sustainability in construction is not limited on the building
designers’ desk. It however transcends the designing, planning and construction stage of a
building and dovetails into the occupancy, operation and maintenance of the building.
Therefore, the result of this survey shows that the top three sustainability practices often
implemented during the construction of buildings within the study area include a reduction in
the use of incandescent bulbs, innovative waste water management and the use of efficient
insulating wall materials. This result aligns with results of previous studies (Blok et al., 2007;
Degefa, 2010; Heberling, 2013) on the need to increase the use lighting bulbs that are energy
efficient and to embrace technological solutions for effective waste water management in
buildings to promote sustainable environment. In addition, the positive correlation between
sustainable practices and the satisfaction of building occupants agrees with the findings of
Asmar, Chokor, & Srour (2014) that the satisfaction of building occupants was influenced by
good space layout, good indoor air quality and high lighting level.
5. CONCLUSIONS AND RECOMMENDATIONS
The implementation of sustainability practices in the construction industry is a global
challenge as stakeholders in the industry need to achieve a balance between environmental
and economic performance of building construction projects. Although in Nigeria, the

879
construction professionals appear to be making effort at the application of sustainable
practices during construction, those at the design end of building projects appears not to be
doing enough in incorporating sustainable practices in the design of buildings This study
therefore recommends that building designers should be enlightened on the benefits of
incorporating sustainable concepts in building designs. Furthermore, the campaign for
sustainability practices on construction projects should not be targeted at construction
professionals alone but should be extended to clients of building construction projects. This
approach would improve the awareness of clients of building construction projects on the
potential benefits of sustainable buildings. Consequently, clients of building construction
projects could express their project requirements within the provisions of sustainability.
6. REFERENCES
Abidin, N. Z. (2010). Sustainable Construction in Malaysia – Developers ’ Awareness. Proceedings of World
Academy of Science, Engineering and Technology, 5(2), 122–129.
Abolore, A. A. (2012). Comparative Study of Environmental Sustainability in Building Construction in Nigeria
and Malaysia, 3(6), 951–961.
Ametepey, O., Aigbavboa, C., & Ansah, K. (2015). Barriers to Successful Implementation of Sustainable
Construction in the Ghanaian Construction Industry. Procedia Manufacturing, 3(Ahfe), 1682–1689.
https://doi.org/10.1016/j.promfg.2015.07.988
Apanavičiene, R., Daugeliene, A., Baltramonaitis, T., & Maliene, V. (2015). Sustainability aspects of real estate
development: Lithuanian case study of sports and entertainment arenas. Sustainability (Switzerland), 7(6),
1–26. https://doi.org/10.3390/su7066497
Azapagic, A., Howard, A., Parfitt, A., Tallis, B., Duff, C., Hadfirld, C., … Gillett, J. (2002). The Sustainability
Metrics.
Baloi, D. (2003). Sustainable Construction: Challenges and Opportunities. Arcom.Ac.Uk, 1(September), 3–5.
Retrieved from http://www.arcom.ac.uk/-docs/proceedings/ar2003-289-297_Baloi.pdf
Basiago, A. D. (1999). Economic, Social, and Environmental Sustainability in Development Theory and Urban
Planning Practice. The Environmentalist, 19, 145–161. https://doi.org/10.1023/A:1006697118620
Canada Green Building Council. (2017). Leadership in Energy and Environmental Design (LEED).
Characteristics of High Performance Green Buildings Sustainable construction & Green Building. (n.d.).
Degefa, M. Z. (2010). Energy efficiency analysis of residential electric end-uses: based on statistical survey and
hourly metered data. Aalto University School of Science and Technology.
Du Plessis, C., Laul, A., Shah, K., Hassan, A. S., Adebayo, A., Irurah, D. K., … Marulanda, L. (2001). Agenda
21 for Sustainable Construction in Developing Countries: First Discussion Document. Cib, (2), 48.
Elmualim, A., & Alp, D. (2016). Perception and Challenges for Sustainable Construction in Developing
Countries: North Cyprus Case. Journal of Civil Engineering and Architecture, 10(4), 492–500.
https://doi.org/10.17265/1934-7359/2016.04.012
Ilesanmi, A. O. (2015). Urban sustainability in the context of Lagos mega-city, 3(October 2010), 240–252.
Kuhlman, T., & Farrington, J. (2010). What is sustainability? Sustainability, 2(11), 3436–3448.
https://doi.org/10.3390/su2113436
Loman, M. (2014). Measuring and Reporting Sustainability : The Role of the Public Sector, (August), 1–14.
Magutu, J., & Kamweru, K. (2015). The Phenomenon of Building Maintenance Culture : Need for Enabling
Systems The Crisis of Building Maintenance in Kenya. Global Journal of Engineering,Design &
Technology, 4(5), 8–12.
Mateus, R., & Bragança, L. (2011). Sustainability assessment and rating of buildings : Developing the
methodology SBTool PT e H. Building and Environment, 46(10), 1962–1971.
https://doi.org/10.1016/j.buildenv.2011.04.023
Mensah, A. M., & Castro, L. C. (2004). Sustainable resource use and Sustainable development: a
contradiction?! Desarrollo de Base : Revista de La Fundación Interamericana, 15(3), 1–22. Retrieved from
http://www.ncbi.nlm.nih.gov/pubmed/12320277
Miranda, L., & Marulanda, L. (2002). Sustainable construction in developing countries - A Peruvian
perspective. Agenda 21 for Sustainable Construction in Developing Countries.
National Population Commission. (2009). 2006 population and housing census of the Federal Republic of
Nigeria. Official Gazette of the Federal Republic of Nigeria, 96(2), 1.
Natural Resources Defense Council. (2012). The Facts about Light Bulbs and Mercury.

880
Nduka, D. O., & Ogunsanmi, O. E. (2015). Stakeholders Perception of Factors Determining the Adoptability of
Green Building Practices In Construction Projects In Nigeria. Journal of Environment and Earth Science,
5(2), 188–197.
Nwokoro, I., & Onukwube, H. (2011). Sustainable or Green Construction in Lagos , Nigeria : Principles ,
Attributes and Framework, 4(4), 166–174. https://doi.org/10.5539/jsd.v4n4p166
Ofori, S. A., Gyadu-Asiedu, W., & Assah-Kissiedu, M. (2015). Sustainable construction implementation in
Ghana : Focusing on awareness and challenges. Civil and Environmental Research, 7(2), 109–120.
Pancovska, Z. (2017). Construction Managers ’ Perception for Sustainable Construction Contributing Factors :
Analysis using Support Vector Machine, 6(2), 391–399. https://doi.org/10.18421/TEM62-26
Plessis, C., & Africa, S. (2012). Towards a regenerative paradigm for the built environment, 7–22.
Rahim, F. A., Yusoff, N. S. M., Zainon, N., Wang, C., & Lumpur, K. (2014). SUSTAINABLE
CONSTRUCTION THROUGH LIFE CYCLE COSTING, 5(1), 84–94.
Robert, K. W., Parris, T. M., & Leiserowitz, A. A. (2005). What is Sustainable Development? Goals, Indicators,
Values, and Practice. Environment: Science and Policy for Sustainable Development, 47(3), 8–21.
https://doi.org/10.1080/00139157.2005.10524444
Schwarz, J., Beloff, B., & Beaver, E. (2002). Use sustainability metrics to guide decision-making. Chemical
Engineering Progress, 98(7), 58–63.
Taheriattar, R., & Farzanehrafat, M. (2014). Construction Managers ’ Perception of the Factors Affecting
Sustainability in Construction Projects, 5(1), 22–32.
United Nations. (2007). Indicators of Sustainable Development : Guidelines and Methodologies. New York.
https://doi.org/10.1016/j.cirpj.2010.03.002
US Green Building Council. (2009). LEED 2009 for new construction and major renovations, (November
2008), 1–88.
Waziri, B. S. (2016). Design and construction defects influencing residential building maintenance in Nigeria.
Jordan Journal of Civil Engineering, 10(3), 313–323.
Waziri, B. S., & Vanduhe, B. A. (2013). Evaluation of Factors Affecting Residential Building Maintenance in
Nigeria : Users ’ Perspective. Civil and Environmental Research, 3(8), 19–25.

881
ID 109
MOBILITY AND ACCESS TO TRANSPORTATION FOR THE RURAL
POOR: EXAMINING THE ROLE OF INTERMEDIATE MEANS OF
TRANSPORT (IMTS) IN GHANA
C. Asafo-Adjei, U. Iyer-Raniga and G. Aranda-Mena
School of Property, Construction and Project Management. RMIT University, GPO Box 2476, Melbourne VIC
3001, Australia
Email: [email protected]
Abstract: In the absence of conventional vehicles, there is the need to consider other
alternatives and one such alternatives is the use of intermediate means of transport. The
research examined the role of Intermediate Means of Transport (IMT) in addressing the
transportation needs of the rural poor in Ghana. The study was undertaken from a qualitative
perspective because of the need to ask more probing questions than just limiting the
participants to a set of responses. The data was collected through in-depth interviews and
focus group discussions. The questions for the in-depth interviews and focus group discussions
were generated from a critical review of literature on intermediate means of transport as well
as rural transport in general. The responses highlight the fact that in the absence of the
conventional vehicle, IMTs can be used as the main vehicle on rural roads as they have the
potential to address some of the transportation challenges particularly associated with the rural
poor in Ghana. The research concludes that IMTs positively impact on the transportation of
small and medium loads which are difficult for human beings to carry and, at the same time,
expensive to carry by other means of transport.
Keywords: Accessibility, Mobility, Rural transport, Intermediate means of transport, Feeder
Roads in Ghana
1. INTRODUCTION
It is recognised that a good transport system does not only rely on road infrastructure but also
the availability of suitable vehicles. These vehicles must be at the right place and the right
time, so as to serve the needs of the people or the purpose for which the road was constructed
(Dawson & Barwell, 1993; Ellis & Hine, 1998; Porter et al, 2012; 2013). In the absence of
conventional vehicles, there is the need to consider other alternatives. One such alternative is
the use of Intermediate Means of Transport (IMT). This is defined as any form of transport
ranging from human walking to large-scale transport. IMT seeks to address some of the
transportation challenges particularly associated with the rural poor (Starkey, 2001). They are
seen as intermediate because they are between human walking and motorised transport and
can positively impact on the transportation small and medium loads which are difficult for
human beings to carry and, at the same time, expensive to carry by other means of transport.
The call for the use of IMTs in Sub-Saharan Africa came up strongly in the 1980’s even
though not much research has been conducted in this arena (Starkey, 2001; Porter, 2014).
A number of studies have identified different types of small-scale road transport carriers
which are suitable for Sub-Saharan Africa. These include wheelbarrows, hand-drawn carts,
animal-drawn carts, motorised three-wheelers, tricycles, motorcycles and others (Starkey et
al., 2002; Starkey, 2001). These same studies have indicated that despite the suitability of the
IMTs identified above, the use of IMTs have been very low in most parts of Africa. Countries

882
such as Ghana, Angola, Nigeria, Kenya and Zambia have attempted to adopt IMTs but are
faced with numerous problems. The reasons for this low patronage include, but are not
limited to, low economic activity, lack of expertise in design, high seasonality of cashflows
and transport demands, inadequate supply of components among others (Starkey, 2001;
Okoth, 2005; Gauthier & Hook, 2005). Most people in rural areas do not have the means to
own a car and, therefore, mobility is synonymous with walking or intermediate means of
transport (IMT) or, better still, public transport. Transport services in most rural settings
along feeder roads are delivered by way of animal-drawn carts, bicycles, motorcycles,
tricycles or taxis. These are the main transport for the rural population in most countries. An
interesting observation is that IMT as a means of transport is often ignored even though it
plays a critical role in the mobility of rural people. While providing access to markets,
healthcare facilities and educational facilities, IMTs also provide employment to the
operators of these IMTs (Porter, 2002a; Iga, 2002; Okoth, 2005).
Despite the contribution or the relevance of IMTs as a means of transport, African
governments have not given it the needed attention. Currently tricycles and motor cycles
imported from China and India seem to be making headway as far as rural transport is
concerned. The assumption underlying the construction of roads in developing countries is
that if roads are constructed, automatically the private sector will take advantage by
developing transport services along the road. This continues to be a failure as in most cases
the roads have been built but only a few number of people are actually utilizing the roads as
there are no conventional transportation systems. It is important for governments’ in
developing countries to look for innovative ways of address the transport challenges facing
the rural people through proper and effective planning which was hitherto not the case.
Therefore, the study examines the issues of mobility and access transportation in rural Ghana
by critically analysing the role that IMTs can play.
2. LITERATURE REVIEW
2.1 Government and Transport Infrastructure
A country with a sound infrastructure base is able to attract investment growth and expansion
of its economy as it becomes very attractive for further investment (OECD, 2006; World
Bank, 2008). Transport infrastructure has been in demand for many developing countries;
there is the need for new construction and the maintenance of the existing roads. Lack of road
access deprives many people access to educational, health care and other economic activities.
Poor transport infrastructure are the causes of many deaths, for this reason, transport needs
have become major discussion for consideration under the United Nations post 2015 agenda
(Doczi, Dorr, Mason, & Scott, 2013). Sound investment in the transport infrastructure and
services contributes to economic growth; because transport infrastructure is a key to tourism
development. There is enough evidence that countries with high level of investment in
transport infrastructure have comparative high volume of trade. Generally, high investment in
transport infrastructure also leads to lower transport cost (Canning & Pedroni, 1999).
Infrastructure availability influences decision made by individuals, households and
entrepreneurs. The cost of transport, for instance, serve as incentives for firms and individuals
to locate or relocate activities to a given place. Transport is a necessary input for wealth-
creation and transformation of economies from lower income levels to higher ones.
Across Africa, banks, clinics, hospitals, secondary schools, extension agents, produce
markets and the likes tend to be located in larger rural service centres, usually served by

883
paved roads. For women, the financial, time and, in some cases, cultural constraints on
mobility (and thus on access to these facilities), can be particularly restrictive. A review of
three aspects of access to medical care, markets and credit facilities illustrates the difficulties,
frustrations and costs of off-road residence. Villagers emphasize the need for access to health
care in emergencies, but health facilities of any kind are rare in off-road locations. In
Morocco, places with better rural roads reportedly have twice the use of health care facilities
(World Bank, 2000:78). Ironically, off-road inhabitants are often the most in need of medical
assistance, since water supplies are frequently poor, and poverty levels are above regional
averages. Research in Ghana and Uganda on Participatory Poverty Assessment (World Bank,
2000) suggests that vaccination programs sometimes miss off-road settlements, exposing
these residents to further risk. In a nutshell, ill-health is most often worse in rural regions and
very poor during wet seasons precisely at a time where travelling conditions even for
pedestrian are worse off due to poor roads. This problem constantly persist in Ghana and
among many other countries in Africa, although in less densely populated areas the distances
to hospital are often much greater and it may be impossible to make the journey at all.
According to Porter (1995; 1997) due to poor and inaccessible roads traders are often
reluctant to move into remote areas to do business unless suppliers from accessible areas are
insufficient. Moreover, when urban-based traders visit areas where access is difficult, the
competition from other traders is likely to be limited and prices achieved by local farmers
will thus be poor, especially for perishable produce (Lyon, 2000). Indeed, market decline and
closure in off-road locations appears frequently to be one of the unforeseen effects of road
construction programmes. In some parts of sub-Saharan Africa, there are cultural constraints
which restrict women’s movements. In addition to physical and economic constraints, off-
road market closures following road construction have had a particularly severe impact on
women living off-road. When vehicles are available, off-road journeys to market by motor
vehicle tend to be more expensive, because of the increased costs of maintenance. In coastal
Ghana, journeys off paved roads are roughly double those along paved routes.
2.2 The role of IMTs in addressing transportation issues
IMTs provide solutions to the numerous transportation challenges faced by people to reduce
labour cost associated with transport (Starkey, 2001). They are seen as intermediate because
they are between human walking and large-scale transport. IMTs can improve transport of
both small and medium loads which may be a bit difficult for human beings to carry. The
recognition of the potentials of IMTs in Sub-Saharan Africa was discovered in the 1980’s
even though it is only in recent times that research and development have been enormous
(Starkey, 2001; White et al., 2000). The dominant IMTs identified in the late 1980’s include
bicycles, tricycles, ox-carts and water carriers. IMTs have been adopted extensively in Asia.
It is yet to make similar impact in Africa due to differences in population density, income
levels, industrial base, taxation and cultural factors (Ellis, 1997).. As earlier indicated, most
people in rural areas do not have the means to own a car and therefore mobility is
synonymous with walking or IMTs or, better still, public transport. Transport services in most
rural settings along feeder roads are delivered by way of animal-drawn carts, bicycles,
motorcycles, tricycles or taxi (Fasakin, 2001; Porter, 2002a; Iga, 2002; Okoth, 2005, Lopes,
2005).

884
2.3 Benefits of IMTs
IMTs provide solutions to the numerous transportation challenges faced by people to reduce
labour cost associated with transport (Starkey, 2001). IMTs can improve transport of both
small and medium loads which may be a bit difficult for human beings to carry. The
recognition of the potential of IMTs in Sub-Saharan Africa was discovered in the 1980’s,
even though it is only in recent times that research and development have been enormous
(Starkey, 2001; White et al., 2000). Most people in rural areas do not have the means to own
a car and therefore mobility is synonymous with walking or IMTs or, better still, public
transport. An interesting observation is that IMT as a means of transport is often ignored even
though it plays a critical role in the mobility of rural people. IMTs present numerous benefits
to the rural people which studies have confirmed (White et al., 2000; Gauthier & Hook, 2005;
Starkey, 2007). For example, these studies have found that IMTs represent a reliable means
of transport both for goods and human beings. While providing access to markets, health care
and educational facilities, IMTs also provide employment for the operators (Guyer, 1997;
Yunusa, 1999; Fasakin, 2001; Porter, 2002a; Iga, 2002; Okoth, 2005, Lopes, 2005).
2.4 Challenges affecting the adoption of IMTs
IMTs are not new in Africa as several countries such as Angola, Ghana, Kenya, Nigeria,
Uganda, Zambia and others have attempted to adopt them, even though they have been
confronted with numerous challenges. A number of challenges hamper the adoption of IMTs,
particularly in Africa. Literature reveals that economic activity, lack of expertise in design,
high seasonality of cashflows and transport demands, inadequate supply of components
constitute some of the challenges affecting the adoption of IMTs in most developing
countries (Starkey, 2001; Okoth, 2005; Gauthier & Hook, 2005). The influence of gender in
the adoption of IMTs seems to be posing a challenge to its adoption in some countries such as
Ghana (Porter, Blaufuss & Acheampong, 2012). It is also believed that the adoption of IMTs
is challenged by such issues as culture, gender, cost, poor road network and others (Porter &
Lyon, 2006; Starkey et al., 2007; Porter et al., 2012). In addition to the above, most
government officials in Africa look down on IMTs as means of addressing the transportation
problems facing rural people (Starkey, 2001). For example, the provision of poor or low
quality equipment has been a very significant challenge for most of these countries,
especially Ghana. Most of the equipment provided for the implementation of the Village
Infrastructure Projects were all inappropriate (Porter, 2002; Porter and Lyon, 2006). It is
important for governments in developing countries to look for innovative ways of addressing
the transport challenges facing the rural people through proper and effective planning which
has hitherto not been the case.
3. METHODOLOGY OF THE STUDY
For the purposes of achieving the study objectives, a qualitative approach was adopted. The
study was undertaken from a qualitative perspective because of the need to ask more probing
questions than just limiting the participants to a set of responses. The qualitative approach
was adopted because there was the need to get a detailed account of the key issues affecting
rural transportation and intermediate means of transport. This approach enabled the
participants to freely discuss these issues without any fear or limitation. The interviews and
the focus-group discussions focused on the what, why and how questions. The study sought

885
to explore the issues surrounding access and mobility of the rural poor, hence the need to
adopt an approach which could drive this agenda. As indicated by Teddlie & Tashakkori
(2003), qualitative studies are very relevant when a study seeks to explore or gather in-depth
understanding of a particular issue such as this.
The study relied on data from both primary and secondary sources. With respect to the
primary data, the study collected information through in-depth interviews and focus group
discussions whereas the secondary information was gathered from Annual Reports, policy
documents, and research reports on rural transport and intermediate means of transport. In all,
thirty (30) respondents participated in the study and they were made of up of the community
people such as community leaders, chiefs, opinion leaders and other members of the
community and selected engineers. The study specifically interviewed ten (10) Road
Engineers in in the Head Office of Department of Feeder Roads while the focus-group
discussions featured twenty (20) participants who were mainly farmers and indigents who
live around the selected roads. The Engineers were selected from Department of Feeder
Roads whereas the focus group participants were selected from Abekoase, Obuasi, and
Subriso. These are communities along some feeder roads in the Eastern Region of Ghana.
The engineers were purposively selected due to the role in rural transportation whereas the
focus group participants comprising of community elders, and opinion leaders were
conveniently selected from the communities above. The respondents participated willingly
when they were informed of the purpose of the study. The Engineers were selected
purposively because they exhibited the characteristics expected to answer the research. It
made it possible for the researcher to reach the target sample within a very short time.
Purposive sampling is normally used to select information-rich cases in qualitative studies
(Patton, 2002). Scholars such as Creswell & Klassen, Plano Clark & Smith (2011) have
shown that purposive sampling involves the selection of individuals or groups who have
experienced an issue of interest. Quite apart from the above, it was also important to consider
the willingness and ability of respondents to participate to get the right answers.
The questions for the in-depth interviews and focus group discussions were generated from a
critical review of literature on Intermediate Means of Transport as well as Rural Transport in
general. The data gathered from the interviews and the focus-group discussions were
analysed qualitatively by inspecting the data for recurrence. For the sake of clarity, the
contents of the interviews and focus-group date were grouped according to the study themes.
As indicated by Wilkinson (2004), content analysis presents a comprehensive overview or
summary of the data collected making it possible for researchers to have a broad view of the
data collected. The content analysis was undertaken for the purposes of coming out with the
key themes as they occur in the data collected. These themes were grouped together in view
of coding which made it easier for further conclusions to be drawn. Based on the above the
findings were then compared to the literature.
4. ANALYSIS AND DISCUSSION OF FINDINGS
IMTs have emerged as popular interventions to address the challenges associated with
mobility and accessibility particularly in developing countries. The findings gathered from
the interviews and the focus group discussions are presented in this section, which contains
information on the role and use of IMTs, benefits of IMTs and the challenges associated with
the use of IMTs.

886
4.1 The role and Use of Intermediate means of transport
IMTs are generally seen as anything between walking or motorized transport and therefore
this section analyses the views of respondents in respect of the role and use of IMTs in
Ghana.
On the role and use of IMTs, an engineer indicated that:
“IMTs are for short distance. They are most appropriate to use because you don’t need to get
a certain number of people. In terms of short distances, IMTs are needed. Eventually, IMTs
are used for commercial purposes, therefore I see IMTs as good transport system on rural
roads to carry goods”.
Adding to that, a female respondent revealed that “IMTs are not that common and few ones
are used by men whereas we the women and children walk either to farm or school” (AAF).
Another respondent who happens to be an engineer also said: “IMTs can serve several
purposes as it can even be used in times of emergency. Some communities I have visited use
IMTs for emergency services. From my experience, I feel it will be useful for the rural
community. They can be used to carry goods, children, and other passengers”
An interviewee (BOM) stated that “IMTs are very important and, if managed properly, they
will serve as one of the best solutions for rural transport services, because people will move
from head loading practices which can greatly affect their health”.
On the issue of IMT suitability, some respondents indicated that IMTs are suitable in
communities where conventional transport systems are ineffective or absent. To these
respondents the suitability depends on the availability of other forms of transport as well as
the nature of the road network. A respondent reiterated that: “In communities where they
have no commercial means such as buses and taxis, IMTs can be used as a means of
transport for both human beings and goods. They can serve emergency purposes. I’m saying
this because it is used to convey pregnant women in the rural areas” (CSM).
According to the responses IMTs have been adopted in several African countries which
implies that Ghana can also adopt these, provided the right framework or policy is developed.
Respondents see the adoption of IMTs on rural road as a good as it is largely cheap,
economical, affordable and user-friendly. Thus, in the absence of the conventional vehicle,
(like buses, taxis, etc.) IMTs can be used as the main vehicle on rural roads. All these can be
achieved if road planning considers transport as well. Roads are meant for vehicles so there is
the need to investigate the type of vehicle that will be using the road.
4.2 Benefits of IMTs
Adding his voice to the above, an engineer illustrated how IMTs can be beneficial in the fight
against poverty in rural areas. He shared this: “to the rural folks, whether it is bicycles, camel
or donkeys, the most important thing is that it relieves the hardship from the rural folks. So
instead of carrying it on the head, these non-motorised means will help. It saves them a lot of
time”.

887
Some respondents noted that IMTs, such as bicycles, are very helpful for school children and
farmers especially those who travel distances every day before they get to school or farm. A
respondent opined “Oh, bicycles are very good for school children and farmers, as it is a
good way of keeping fit on daily basis”.
Respondents also added that IMTs provide alternative means of transport for the rural who
cannot afford to use motorised transport. A respondent shared his thoughts “it is very good
for those of us who are poor because… we cannot afford to use motorised transport” (BOM).
As an alternative means, some respondents revealed than IMTs are very beneficial in times of
emergency. A respondent who shared his experience had this to say “in my community we
use IMTs a lot for emergency services. Over here bicycles are sometimes used to carry
pregnant women who are about to deliver to nearest hospital because of the absence of
conventional vehicles. Had it not been this, am sure a lot of people would have lost their
lives” (CSM).
In addition, a respondent indicated that “IMTs are very useful to those of us far from the main
road because the roads that link our community to the main feeder road are very bad and
therefore IMTs do a great job for us” (BOF).
Though the responses point to the fact that only a limited number of people use IMT, the
respondents were quick to add that it presents significant benefits to the users as evident in
the responses presented above. What is more interesting is the fact that IMTs can be very
beneficial in times of emergency which is an indication that they can be promoted to make it
more useful than it is now.
4.3 Challenges with the use of IMTs
Asked why IMTs are not making the necessary impact in Ghana, respondents indicated a
number of challenges confronting their promotion and subsequent adoption. A respondent
shared that: “even though the cost of acquisition is not high, as compared to motorized
transport, there is the need for subsidies to be provided because a lot of them cannot afford to
buy on their own. Loan schemes can contribute in this arena” (BOM).
In addition to the above, a respondent noted that: “The reason why we don’t use IMT is the
fact that we are poor and we are unable to finance the purchases. Unlike vehicles or
motorized transport that have several financing mechanisms, IMTs are not like that and so if
you don’t have the money, you need to wait until you get it” (AAM).
An engineer who had an issue with that quality of equipment in the market and poor nature of
some of the roads are also affecting the adoption of IMTs. He indicated that “most of the
supporting equipments are of inferior quality and therefore it doesn’t last. Again, most of the
rural paths or roads are in bad shape such that donkeys or other animals will struggle to
ply”.
An engineer who complained about the nature of the road had this to share: “Apart from
Subriso, all the communities mentioned earlier are not in a good shape. We are even affected
by it as well especially during the raining season”. Adding to the above, a respondent
revealed that “we find it difficult to use IMTs because of the nature of the roads in our
888
community. For me when the road is good I will use IMTs but in this deplorable state I won’t
risk my life” (BOF).
Some of the respondents indicated that IMTs are not making the necessary impact because of
cultural differences. Some of the respondents believe that the use of IMTs, particularly
animal driven carts and the likes, are very alien to them and therefore it will be very difficult
for them to adopt, irrespective of government’s intervention. A respondent had this to say
“Oh as for our community, people will laugh at you when you decide to use animal-driven
carts. In fact, they will give you all sorts of names because it is alien to our culture. Our
culture is different from that of the Northerners so that is why it is not common here” (AAM).
In addition to the above, a respondent stated that though IMTs can be used by all people,
women and children are often discouraged about their use, because it is perceived that men
are the ones who are supposed to use them. He had this to share: “we don’t encourage women
and children all because it is not good for them IMTs. In our culture women don’t use these
things” (CSM). Again a respondent noted that “because of our household chores we do not
get enough time to learn how to ride a bicycle and other IMTs and also one of the challenges
we, as women, face. This significantly affects the adoption of IMTs” (CSF).
The responses show that IMTs can be very useful in addressing the challenges faced by the
rural poor in Ghana, though certain issues are affecting the adoption and need to be
effectively addressed.
4.4 Discussion of Findings
The responses above point to the fact that IMTs are very relevant for rural transport and can
be used for both short and long distances, depending on the area and activity. Respondents
believe IMTs are appropriate because they can be used anytime and for commercial purposes
in some cases. It is pretty clear that IMTs provide significant benefits to the rural folks, from
transportation of goods to improving health care. The responses on the adoption of IMTs are
not surprising as previous studies have hinted the extent to which countries in the Sub-
Saharan Africa have adopted IMTs as a reliable means of transport, both for goods and
human beings. This has been supported by numerous studies (Ellis, 1997; White et al., 2000;
Gauthier & Hook, 2005; Starkey, 2007).
The challenges, as revealed, differ from what previous studies have found. Whereas some
literature have found low economic activity, lack of expertise in design, high seasonality of
cashflows and transport demands, inadequate supply of components (Starkey, 2001; Okoth,
2005; Gauthier & Hook, 2005), as key challenges affecting the adoption of IMTs in Ghana
and some other countries, this study revealed poor nature of some of the roads, acquisition
costs, cultural differences, lack of time, location and others. This shows that though the
challenges identified in literature may have existed in the past, recent dynamics may have
shifted the attention from them. For example, respondents believe that culture is playing a
key role in the adoption and promotion of IMTs in Ghana. The adoption rate in the Northern
part of Ghana is higher than the Southern part, primarily because the Northerners have been
using IMTs, whereas the reverse is the case in Southern Ghana. Again, the responses show
that the limitations in the use of IMTs in the selected communities can be attributed to the
perception that IMTs are men’s prerogatives and therefore women are not expected to use
them.

889
IMTs generally offer a complementary transport mode for the rural people, particularly for
personal travel and carrying loads. Though mostly used by men, because women and children
are normally discouraged from using them, a situation which does not prevail in the southern
part of Ghana. This to some extent confirms the views of some scholars on the influence of
gender on IMT adoption (Porter, Blaufuss & Acheampong, 2012). The findings, as presented
above, show that IMTs continue to play key roles in many areas particularly in the
hinterlands despite the costs involved. Notwithstanding preference for motorized transport by
the respondents, the contribution of IMTs cannot be discounted. Scholars such as Starkey et
al. (2007) have indicated that the adoption of IMTs vary according to the regions, due to
reasons such as culture, gender, costs, poor road network and others (Porter & Lyon, 2006;
Starkey et al., 2007; Porter et al., 2012). Unlike motorised vehicles which are financed by
several institutions, IMTs are normally supported by NGOs which largely affects its
adoption.
5. CONCLUSIONS
IMTs are assuming significant roles in developing countries such as Ghana. The study has
shown that IMTs can be very significant to the rural poor in Ghana though there are a number
of issues facing their adoption. These include, but are not limited, to low income and cultural
barriers in most of rural communities. It is clear from the above that the adoption rate varies
depending on the location of the country. For example, the adoption rate in the Northern part
of Ghana is higher than the southern part, primarily because the northerners are used to them.
On the other hand, IMTs are not common in the southern part because the people prefer
motorized transport to IMTs, primarily as a result of their cultural orientation. Most people
prefer motorised transport because it is fast and it carries a lot of goods and requires little
human efforts as compared to IMTs. Some of the respondents also noted that they prefer
motorised transport to IMTs because IMTs are kept for individual use. An interesting
observation was the fact that the closer a village or community is to the main road, the lesser
the use of IMTs. This implies that IMTs are very relevant and supportive to communities in
the hinterlands, as compared to those closer to main roads. In the absence of conventional
vehicles, emergency situations, such as carrying patients in critical condition, most rural poor
communities resort to innovative approaches by using bicycles, pedicabs and other IMTs to
provide these essential services.
6. REFERENCES
Airey, T., 1992. The impact of road construction on the spatial characteristics of hospital utilization in the Meru
district of Kenya. Social science & medicine, 34(10), pp.1135-1146.
Bryceson, D.F. and Howe, J., 1993. Rural household transport in Africa: Reducing the burden on
women? World development, 21(11), pp.1715-1728.
Canning, D. and Pedroni, P., 1999. Infrastructure and long run economic growth. Center for Analytical
Economics working paper, 99(09).
Creightney, C.D., 1993. Transport and economic performance: a survey of developing countries (No. WORLD
BANK TP-232).
Creswell, J.W., Klassen, A.C., Plano Clark, V.L. and Smith, K.C., 2011. Best practices for mixed methods
research in the health sciences. Bethesda (Maryland): National Institutes of Health, pp.2094-2103.
Dawson, J. and Barwell, I., 1993. Roads are not enough: new perspectives on rural transport planning in
developing countries. Intermediate Technology Publications Ltd (ITP).
Doczi, J., Dorr, T., Mason, N. and Scott, A., 2013. The post-2015 delivery of universal and sustainable access to
infrastructure services. Overseas Development Institute, London, UK.

890
Ellis, S.D., 1997. Key issues in rural transport in developing countries. Crowthorne: Transport Research
Laboratory.
Ellis, S. and Hine, J., 1995, July. The transition from non-motorised to motorised modes of transport. In 7th
World Congress on Transport Research, Sydney.
Gauthier, A. and Hook, W., 2005. Tapping the market for quality bicycles in Africa. Sustainable Transport,
(17).
Grieco, M., Apt, N. and Turner, J., 1996. At Christmas and on rainy days: transport, travel and the female
traders of Accra. Avebury.
Iga, H., 2002. Bicycles, Boda Boda and Women's Travel Needs. In P. Fernando and G. Porter (eds) Balancing
the load: women, gender and transport. London: Zed Books
IMF. 2012. Ghana: Poverty Reduction Strategy Paper. Washington, D.C.: International Monetary Fund (IMF).
Lyon, F., 2000. Trust, networks and norms: the creation of social capital in agricultural economies in
Ghana. World Development, 28(4), pp.663-681.
Mwankusye, J.A., 2002. Do intermediate means of transport reach rural women? In P. Fernando and G. Porter
(eds) Balancing the load: women, gender and transport. London: Zed Books
Okoth, N. J., 2005. Cycle-based transport services in Kenya: the Ngware Bicycle Transporters Youth Group.
Schopfheim: Schorrell Analysis Engineering Publications.
Patton, M.Q., 2002. Two decades of developments in qualitative inquiry a personal, experiential
perspective. Qualitative social work, 1(3), pp.261-283.
Porter, G., 2002. Intermediate means of transport: a review paper with special reference to Ghana. Durham.
Porter, G., 2014. Transport services and their impact on poverty and growth in rural sub-Saharan Africa: A
review of recent research and future research needs. Transport reviews, 34(1), pp.25-45.
Porter, G., Tewodros, A., Bifandimu, F., Gorman, M., Heslop, A., Sibale, E., Awadh, A. and Kiswaga, L., 2013.
Transport and mobility constraints in an aging population: health and livelihood implications in rural
Tanzania. Journal of Transport Geography, 30, pp.161-169.
Porter, G. and Lyon, F., 2006. Groups as a means or an end? Social capital and the promotion of cooperation in
Ghana. Environment and Planning D: Society and Space, 24(2), pp.249-262.
Porter, G., Hampshire, K., Abane, A., Munthali, A., Robson, E., Mashiri, M., Tanle, A., Maponya, G. and Dube,
S., 2012. Child porterage and Africa’s transport gap: Evidence from Ghana, Malawi and South
Africa. World Development, 40(10), pp.2136-2154.
Porter, G., Blaufuss, K. and Acheampong, F.O., 2012. Gendered patterns of IMT adoption and use: Learning
from Action Research. Research in transportation economics, 34(1), pp.11-15.
Riverson, J., Gaviria, J. and Thriscutt, S., 1991. Rural roads in sub-Saharan Africa. World Bank Technical
Paper, 141.
Starkey, P. ed., 2002. Improving rural mobility: options for developing motorized and nonmotorized transport
in rural areas (Vol. 23). World Bank Publications.
Starkey, P., 2001. Local transport solutions: people, paradoxes and progress. World Bank, Washington, SSATP
Working Paper, (56).
Teddlie, C. and Tashakkori, A., 2003. Major issues and controversies in the use of mixed methods in the social
and behavioural sciences. Handbook of mixed methods in social & behavioural research, pp.3-50.
Tighe, D. 2006. Roads and Poverty Reduction. International Seminar on Rural Road Transport to on the 15-16
May, 2002 in Siem Reap. Cambodia: www.ruralroads.org.
Van de Walle, D. and Cratty, D., 2002. Impact evaluation of a rural road rehabilitation project. Washington, DC:
World Bank. Processed.
Wilkinson, S., 2004. 10 Focus Group Research. Qualitative research: Theory, method and practice, pp.177-199.
Witkiss, M., Hine, J.L. and Ellis, S.D., 2001. The provision of rural transport services: an agenda for
reform. Rural Transport Knowledge Base, 4(2).

891
ID 112
ADAPTING SUSTAINABILITY IN PALESTINE; BARRIERS AND
MOTIVATORS IN THE IMPLEMENTATION OF GREEN
ARCHITECTURE
H.Sabboubeh and P.Farrell
University Of Bolton, Deane Road, Bolton, BL3 5AB, UK
Email: [email protected]
Abstract: As a developing country under occupation, Palestine has limited resources but huge
development needs. Whilst construction is a main driver for the economy, it is also the main
source of pollution and the largest consumer of its natural resources. Palestine has no fossil
fuel, and has to import petroleum products and electrical energy from Israel. This study aims
to create better understanding and classification of barriers and motivators in the development
of sustainable construction in Palestine, and links these to a need to implement green
architecture.
The main data collection instrument is questionnaire survey, that received 43 replies from
construction professionals in Palestine. The questionnaire design was founded on issues in the
literature; data reliability was supported by interviewing five Palestinian experts in sustainable
construction. Participants agreed that barriers listed in literature were applicable in the context
of Palestine. Accordingly, financial, educational, cultural, political and technical constraints
were ranked. It is recommended that efforts at all levels: environmental, educational, political
and governmental should be combined. Industry stakeholders supported by authorities should
formulate legislation, standards and codes to enhance sustainable construction practices,
together with training courses, campaigns and workshops on green buildings. Authorities
should introduce financial incentives for green buildings.
Keywords: Green architecture, Palestinian construction sector, sustainable construction.
1. INTRODUCTION
Green architecture is defined as “… a current design attitude which requires the consideration
of resource reduction and waste emissions for the period of the building’s whole life cycle”
(Wang et al., 2005).
Energy is considered to be influential in every life aspect, and plays a key role to support the
development of economies and the prosperity of the communities on one hand; on the other
hand it adversely affects the environment, especially in the case of increased usage of energy
where the environment cannot disencumber itself of the negative effects of unrenewable
energy consumption. Therefore, reducing the energy consumption is a public responsibility of
society and institutions (Brundtland, 1987).
Palestine has a tenuous environment due to: high levels of land degradation and loss of land
to Israeli settlements; high price of energy; shortage of fresh water, and; rapid urbanization
arising from population increase with its associated problems of air pollution and high
pressure on the existing infrastructure such as waste management systems (Enshassi and
Mayer, 2005). The Palestinian National Authority (PNA) have made some initiatives to put in
place some key stones to promote sustainable development. However, these initiatives are not

892
enough to promote a strong sustainable construction sector. The success of sustainable
construction is highly dependent on the desire of construction industry stakeholders to be
committed to change and work towards conformed objectives and goals (Ofori et al., 2015).
1.1 Natural resources in Palestine
There are no fossil fuel resources, and the PNA has to import 100% of petroleum products
from the Israeli market and around 92% of electrical energy from the Israeli Electric
Corporation; that costs more than 385 million Euros per year (Yaseen, 2008). Israel controls
the import of energy and prevents open trade of electricity and petroleum products between
Palestine and any other country (Yamin, 2015). The cost of electricity is a huge debt burden
and a major concern of the public and private sectors, especially with the political risks that
electricity supplies may be cut off or Palestinian energy distributing companies confiscated
(Aljazeera, 2014).
According to the International Middle East Media Center (IMEMC), since year 1967, there
has been many Israeli resolutions that have confiscated natural resources, including
underground water. Palestine has been unable to secure permits to dig new wells. This is an
old practice which means once a well is dry, there is no more water; inside Israeli settlements
the drilling is free-flowing as it notable from greenery (IMEMC, 2007). Political conflicts
have led to the destruction of large parts of the water utilities in the West Bank, such as wells,
irrigation systems, reservoirs and water pipelines. This results in a major deficit in
underground reservoirs, and an increasing difficulty for the Palestinian population to have
access to drinking water on a daily basis (Issac et al., 2004).
2. THE LITERATURE
As populations grow and seek higher standards of living, there is increased consumption of
energy. Construction is one of the most important drivers of job creation in Palestine; it is
also the largest sector in the Palestinian economy. Construction has grown at an annual rate
of 20.5% and made the largest sectorial contribution to overall gross domestic product (GDP)
growth since year 2006 (Trust, 2013; Enshassi and Mayer, 2005). Construction has the
potential to nearly double its annual contribution to GDP to reach $2.8bn per year and create
up to 64,000 new jobs through to 2030 (Trust, 2013). However, construction is a high
contributor to environmental pollution, due to its dependency on conventional machines,
material and transportation, in addition to the large quantity of waste produced during the life
cycle of buildings and a lack of suitable areas to dump or recycle (Salameh, 2012).
Demolition that arises from political disputes places extra pressure on natural resources and
energy consumption.
2.1 Motivators in implementing green architecture:
The sustainable construction movement is reshaping the construction industry and its market
share is rising internationally (Ahn and Pearce, 2007). Hydes and Creech (2010) stated that
the schemes and concepts for sustainable construction are already there, the trick is to control
the safety of businesses and dare to innovate. There are many benefits and motivators to
encourage societies to go green. Motivators for green architecture are classified thus:

893
Economic (Financial) and market motivators
Green buildings are more popular and sellable, and there is often customer demand and a
willingness to pay for it. Cruickshanks (2012) pointed out that green architecture improves
property value. The purpose of all businesses is to ensure they can persistently generate more
value; while the main concern of green architecture is environment, developers will always
insist it proves its financial viability (Robichaud and Anantatmula, 2011). A study carried out
by Fuerst and McAllister (2010) investigated the selling price of buildings with
environmental certification on commercial real assets, and found that there is price raise of
10% and 31%. The same fact was confirmed in a later study by Chegut et al (2013), who
pointed out that buildings with green characteristics have a positive impact on rental and sales
prices, with an increase per square meter between 21 and 26%.
Yudelson (2009), Häkkinen and Bellon (2011) and Langdon (2007) agreed that it is predicted
that sustainable construction will have higher initial cost than the conventional construction
because of the increase of the unfamiliarity of the design, which increases consultant’s fees,
and the cost of construction assessment tool documentation. However, the cost is returnable
over the project life cycle during maintenance and operation phase (Häkkinen and Bellon,
2011; Pearce, 2008).
Social motivators
Green lifestyles have turned out to be fashionable and socially attractive these days which has
formed belief about sustainable demand and has influenced community behavioural
intentions and motivations (Kaiser and Scheuthle, 2003).
Studies in behavioural sciences according to Berit (2010) and Heerwagen and Orians (1993)
suggest that green buildings sustain: the relationship with nature; sense of community;
behavioural control and choice; opportunity for habitual exercise; sensory variability and
privacy when needed. McGraw Hill Construction (2013) agreed with Kibert (2007) that
social sustainability enhances some social facets such as well-being feelings, aesthetics,
health and comfort, safety, security and occupants’ satisfaction, suitable living environment
and social integration. Behavioural theories support arguments that the features and
attributes of buildings are strongly linked to wellbeing of occupants such as ensuring natural
ventilation, suitable temperature, and the ability of buildings to adapt to environments to suit
personal needs and preferences of users (Heerwagen and Orians, 1993).
Environmental motivators
Construction affects the environment due to the extraction and the use of materials during
lifecycle of buildings. Construction activities start with the utilization and processing of raw
materials, extending to the supply of inputs such as: energy, water and equipment, and
terminate with demolition phase and waste disposal (Gundogan, 2012). Hence, sustainable
construction reduces the negative impact of buildings and that is a motivator for the green
buildings.
According to a study carried out by United Nations Environment Programme (UNEP, 2009),
around 30% of greenhouse gas emissions are produced by buildings. Intelligent design of

894
green buildings, can lead to a saving of about 12% in water. Studies have shown around 40%
of the solid waste produced, arises from population activities when using buildings (Karzam,
2016).
Organisational motivators
Promoting sustainable practice in organisations leads to change in organisational culture.
Green buildings may enhance productivity, product quality, increase innovation and time
saving (Heerwagen, 2000). Organisations can integrate sustainable strategies into their
strategic plans. Zhang et al. (2010) argued that the meaning of green strategy is that
organisations can gain sustainable advantage by contributing to environment savings as a part
of their social responsibility. This can have an impact on financial performance, because it
leads to better employee well-being and satisfaction, with improved morale and productivity.
2.2 The barriers to green buildings
Barriers to green architecture could be categorized as following:
Economic barriers
Higher initial cost is cited as one of the top challenges. Green architecture solutions may be
abandoned because clients are concerned about higher financial risks (Nelms et al., 2005). It
is important to realise that design fees are largely paid before implementation phases start,
and that is before clients decide with certainty whether projects will be developed or not
(Chegut et al, 2013). Hence, design fees are very high risk investments.
Educational/ awareness barriers
A survey was carried out in Kuwait by Al Sanad et al. (2011), to measure the level of
awareness of industry leaders and their understanding and use of sustainable construction
strategies. The results showed that whilst there seems to be a good level of awareness, that is
not currently well reflected in design and construction practices. On the other hand, engineer
Hani Al Hassan (2011) stated in an interview, that the current scattered buildings in Palestine
reflect the ignorance and lack of concern and awareness regarding the environment; these
buildings do not interact with the surroundings and designs neglect the orientation of
buildings in four directions.
Market barriers
Currently in Palestine, the availability of delivered green buildings is very limited. This
makes the sustainable buildings market very weak, and there is a lack of exemplar or flagship
projects that can be held up as best practice. Furthermore, there is poor availability of
sustainable construction materials, technology and skills, and therefore procurement options
are very much restricted.

895
Organisational and legal barriers
The Palestinian National Authority (PNA) and municipalities have basic rules and regulations
in regard of green architecture and its development in the country, calling for the inclusion of
the environmental conditions in building permits and placing emphasis on it (Hasan, 2011).
However, most Palestinian construction companies have weak management systems and
processes, so at early stages of development a decision is often made not to go green.
3. METHODOLOGY
A detailed literature review was carried out, to investigate barriers and motivators for
implementing sustainable construction in general. A questionnaire was used as the main data
collection instrument. A preliminary draft was evaluated by experts and academics in
Palestine, to ensure that the questions were valid, clear and precise; subsequently, the
questionnaire was modified. Methodological procedures and ethics were adapted from the
work of Farrell et al (2016). The questionnaire assumed seven categories which are based on
the literature review as follows: people impact, cost impact, time impact, technology impact,
market impact, legal impact, political impact. The selected sample were professional people
that are working in the construction industry in Palestine (engineers, architects, contractors,
academics, developers and construction materials suppliers). Each category was measured
using multiple questions; 61 questions across the seven categories. 70 questionnaires were
distributed in all districts in Palestine, and 43 replies received representing a response rate of
61%. Interviews were carried out with five key persons in sustainable construction in
Palestine. Interviewees were selected according to the recommendation of the Engineers
Association of Palestine and from the lead author’s experience in the construction field. The
aim of these interviews was to collect supplementary data and to cross check the findings of
the survey.
3.1 Scoring method
Participants were asked the extent to which they agree or disagree that given barriers and
motivators apply in Palestine. A quantitative score of 0 (zero) was allocated to strongly
disagree, 1 = disagree, 2 = neutral, 3 = agree and 4 = strongly agree. To analyse the
responses, the arithmetic mean was calculated using the following standard:
High level of agreement: if the arithmetic mean is more than 2.0.
Medium level of agreement: if the arithmetic mean is equal to 2.0.
Low level of agreement: if the arithmetic mean is less than 2.0.
Arithmetic means were converted to a percentage score to aid ease of understanding by
multiplying by a factor of 25, such that for example a mean score of 3 out of 4 became 75%.
An overall mean percentage for the study was determined, and each of the seven categories
ranked from most severe to least severe.
4. RESULTS, FINDINGS AND DISCUSSION

896
For brevity in this paper, results and discussion are limited to barriers; it is hoped to
disseminate results about motivators in future work. Table 1 illustrates results for the seven
perceived categories of barriers to sustainable construction development in Palestine; the
table shows in rank order the arithmetic mean for each category.
Table 1: Barriers overall results, arithmetic mean and ranking
Category Number of
questions/category
Arithmetic
mean
Percent Ranking
Political situation 6 3.21 80% 1
Legal aspects
(legislation)
7 3.08 77% 2
Market 6 2.93 73% 3
People 12 2.89 72% 4
Time 11 2.77 69% 5
Technology 5 2.75 69% 6
Cost 14 2.69 68% 7
Summary 61 total questions 72%
overall
mean
score
The overall mean score is 72% which equivalent to a score of 3, therefore in average people
‘agree’ the suggested barriers are present. That would seem to suggest that there is a lot of
work to be done in Palestine to break down these barriers.
4.1 Discussion
The study findings show that participants believe that the main obstacle to sustainable
construction implementation is the political situation, which scored 80%. Although the
Palestinian National Authority (PNA) was established more than twenty years ago, Israeli
occupation impedes development. Palestine has limited sovereignty on its land, borders and
resources. It is recognised that this barrier is not easily overcome. Investors, developers and
construction leaders are often cautious and afraid to bring new ideas to the table, and this
confirms the view of Halas (2016), that future development depends on the ability of the
PNA to control its own resources, without dependence on foreign aid. There is consensus
from participants that occupation inflicts damage upon urban landmarks, especially in the
Gaza strip (Wattan, 2009). Furthermore, the construction industry and its supporting
technologies are restricted, since the PNA do not control policy on the trade movements
across borders (Yaseen, 2008). Moreover, 88.3% of the sample think that access difficulties
cause extra cost, since there are several check points within Palestinian territories, and
closure may occur anytime, thus requiring that alternative longer routes have to be taken for
materials, plants, and labour.
The second barrier was legislation. Palestine is a newly developing country with limited
capacities, managerial skills, financial resources, and experiences; in addition legal and
administrative systems are limited in their support of development, and codifying and

897
formulating strong regulations (Enshassi and Mayer, 2005). Williams and Dair (2007)
identified lack of sustainability measures by stakeholders as the most commonly recorded
barrier. The attainment of sustainable development needs to activate the cooperation of the
international community in both capital and expertise, and needs the application and
development of systems for economic and environmental strategies (Enshassi and Mayer,
2005).
There are clearly, multiple stakeholders and local bodies in charge of the environment, which
creates complexity in relations between different programmes. The Palestinian construction
industry has not yet succeeded in application mechanisms; big efforts are there but they are
not interconnected with each other and there is weak coordination between different parts of
the country to provide the possibility of building green materials becoming available locally.
Moreover, questionnaire participants agreed that a lack of strategic planning hinders the start
of a sustainable construction movement in Palestine, and there are inadequate institutional
structures at a local level.
The country should have mandatory controls on the use of new buildings licences. New
construction rules should be set for projects at early stages of development and the licensing
phase. According to Karzam (2011) as sustainable construction is not compulsory in
Palestine, authorities should provide economic incentives that include tax reduction on green
building related goods, and encourage easy availability of finance; the private-sector should
provide incentives such as discounts on green buildings’ insurance fees, and give preference
to green buildings housing loans. High interest rates are a lead obstacle in promoting
sustainable development, and banks may restrict loan facilities for such projects, especially
when any predicted gains may not come to fruition (Yaseen, 2008). Enshassi and Mayer
(2005) agreed with Karzam (2011) and confirmed that sustainable construction should be a
natural result of legislation and sustainable development. A lot could be achieved by
integrating the sustainable concept into management systems including planning and design,
and action must include long-term structural change in policy frameworks, market incentives,
technologies and legislation. Authorities should form new codes to protect the industry. 88.5
% of the questionnaire participants think that there are no clear regulations to protect national
products and thus enhance a sustainable materials industry.
An interesting finding of the study is that the third barrier for implementing sustainable
construction is markets, which conforms with Williams and Dair’s (2007) work that
identified the lack of demand by clients as a commonly recognised barrier for implementing
sustainable construction. People in Palestine are not familiar with green architecture, and not
aware of its benefits. The importance of "doing the right thing" as a motivator for green
building is not common, as sustainable behavioural patterns are a long away from being
achieved. “Doing the right thing” may explain why the green building market has matured
internationally, and has become more visible and standard in some countries; market-driven
factors may have supplanted the early-adopter vision as a trigger for choosing sustainable
construction (Benjamin, 2016).
A further problem related to market, is the availability of sustainable materials. Locally
manufactured green building materials are very limited, and successful projects usually need
products to be imported from elsewhere (Osaily, 2010). There is industry dependence on
using natural unrenewable resources such as natural stone, and quarries and stone crushers
are scattered all over Palestine. These pose environmental threats in many ways: the
uprooting of vegetation which leads to a sharp decline in pastoral and agricultural area, and

898
impeded biodiversity including in surrounding areas, as has happened in Seir, which contains
more than 30 species of rare plants threatened with extinction as a result of quarries.
Quarrying is also changing the topographic features of land by making huge cavities, with
depths varying from 10 to 40 meters, causing a distortion of the landscape of the earth. There
can be weak compliance with occupational health and safety matters in these quarries
(WAFA, 2011), and consequently there is a threat of collapse to surrounding houses. The
survey also showed that 86% of the sample think that there is too little interest or demand for
sustainable construction by both clients and designers. There is belief that green labelled
products are used for marketing reasons more than for environmental conditions. Also, most
developers think that there is absence of distributors and importers for the sustainable
materials, in addition to restrictions and obstacles imposed on importing materials, including
high import taxes. 83.7% of participants expressed the view that Palestine local raw materials
are not able to support the construction of green buildings. Environmental alternatives are
often unavailable or substantially more expensive than in other countries. There are no strong
regulations to protect local products.
That leads directly to the fourth barrier (people impact), as there is a lack of awareness of
sustainable construction, which accords with the findings of Häkkinen and Belloni (2011).
There are no live examples for green houses or “demonstration projects”, and people are still
not familiar with the idea of green buildings and sustainability. Every new idea is challenging
in the beginning, but as communities realise benefits they may become established. Karzam
(2012) argued that unfortunately, the Palestinian community are not aware of the necessity
and importance of developing green architecture, which has the potential to make a
significant contribution to economic growth. 76.7% of participants believe there is an absence
of sustainability culture and there is resistance to change. Palestinian society is very cautious
and there is a clear reluctance by all parties to try new ideas, and thus avoid risks. There is
too little evidential data about capital and running costs associated with environmental
improvements, and hence clients, developers and other organisations can be reluctant to
invest.
Time barrier was the fifth in the study list, and scored 69%. Time barriers were: weak time
planning skills; time for training workforce; time risk in providing sustainable materials as
they are not readily available, and; a lack of exemplar buildings in Palestine, that facilitate
templates to prepare accurate plans. It can be argued that time constraints can be overcome if
there is careful planning.
The effect of technical barriers is ranked as the sixth barrier. There is a lack of technology
implementation, and a lack of trust in technology which perhaps derives from too little
experience. Rydin et al (2006) asserted that designers and developers in the construction
industry are not confident in their own knowledge about sustainable construction. Whilst the
availability of technical information on sustainable construction is substantial for designers,
contractors responsible for implementing designs, have problems gaining access to such
information at an affordable rate (Osaily, 2010). Construction industry leaders are not open to
admit that there is shortage of experiences and skills related to technologies in sustainable
construction in Palestine. Inadequate professional training among engineers on new
applications and schemes in sustainable construction and green architecture is also an
obstacle. The results suggest that technological capability in both human, institutional and
other resource terms is relatively weak.

899
Surprisingly, cost turned out to be the last barrier, which contradicts literature sources that
suggest high influence of financial barriers e.g. Häkkinen and Belloni, 2011; Nelms et al,
2005; and Hydes and Creech, 2000. The survey identified fear of higher investment costs,
ignorance of lifecycle costs, lack of financial resources and dependence on external funds,
absenteeism of local currency, risks in exchange rates as more than one currency is used, and
finally the financial investment in building up capacities to provide sustainable materials. The
additional financial cost of sustainability of construction has been cited by many researchers
as being a major barrier to the realisation of sustainable construction (Ofori et al, 2015),
though it is documented that the long-term benefits are worth initial increases in investment
(Safadi, 2016). Since there are limited initial budgets available to clients, sustainability
implementation may lead to an increase in construction costs in the short term. 80% of
participants believe that financial barriers are an important obstacle halting sustainable
construction development. It is also relevant that there is an important socio-economic
barrier, which is the low income of the families in Palestine, which makes them unable to
cover the initial cost of green homes. In addition, most large construction projects depend on
international funding with many constraints imposed on budgets, so designers often need to
focus on achieving the function of buildings with available limited means. There is also a
reluctance from funders to adopt innovative technologies, due to high risks in politically
unstable conditions. The need to import sustainable materials makes cost predictability
uncertain, and there is an issue in procurement systems over which parties to contracts accept
price volatility movements as work progresses on sites. If contractors are asked to accept
risks, this may lead to very high tender bids. Palestine does not have its own currency, and
uses alternatively the Jordanian Dinar, Israeli Shekel and US Dollar. Contractors deal with
different currencies under the same contract, and may get paid in one currency and have
expenditure in another. There can be rapid fluctuation in exchange rates, which is in addition
to delays in payments by funders, can impose risks that money loses its value over time.
5. CONCLUSIONS
Incentives to enhance green buildings in Palestine are inadequate. Regulations do not insist
on higher standards of building design and construction, which leads developers to produce
buildings at the lowest price and in the shortest time possible. It is noticeable in the survey
and interviews responses that apparently, the education and raising awareness of the necessity
of green architecture would achieve improvement in the building culture in Palestine;
authorities should start working on an environment education movement by funding
educational initiatives in this sector. Another important role for authorities is to set clear
mandatory regulations and update building laws in Palestine, and introduce energy-efficiency
regulations and code changes so that market demand can be created.
To support successful implementation of sustainable construction, authorities with the help of
construction industry stakeholders, should formulate training courses, discussions, seminars,
campaigns and workshops. Developers should include sustainability credentials in their
design briefs and authorities need to consider introducing financial incentives. The
environment for constructing green buildings should be enabled, to successfully start
sustainable construction and promote construction sustainability for the benefit of the society
at large.
There may be a perception amongst some officials that sustainable development is only for
rich people, and is not an aspiration that most Palestinian people can aim for; that needs to

900
change, since sustainability is key to a prosperous future for all. There is desperate need to
find solutions to the energy crisis and enhance green architecture, but given that Palestine
continues to face many political challenges, it can be difficult for administrators to implement
medium and long term initiatives, when there are always short term political issues that take
priority. Never-the-less, it is important to pursue research in this area, in order that small
windows of opportunity are grasped when sustainability choices do become available.
6. REFERENCES
Ahn, Y. and Pearce, A. (2007) Green Construction: Contractor Experiences, Expectations, and Perceptions.
Journal of Green Building.
Aljazeera, 2014. Aljazeera.net. [Online] Available at:
http://www.aljazeera.net/news/ebusiness/2014/5/21/%D9%82%D8%B7%D8%A7%D8%B9-
%D8%A7%D9%84%D9%83%D9%87%D8%B1%D8%A8%D8%A7%D8%A1-
%D8%A8%D9%81%D9%84%D8%B3%D8%B7%D9%8A%D9%86-
%D8%A3%D9%85%D8%A7%D9%85-%D8%AA%D8%AD%D8%AF%D9%8A%D8%A7%D8%AA-
%D8%AC%D8%AF%D9%8A%D8%A9 [Accessed 27 June 2016].
Al Sanad, S. Gale, A. and Edwards, R. Challenges of Sustainable Construction in Kuwait: Investigating level of
Awareness of Kuwait Stakeholders. of Sustainable Construction in Kuwait: World Academy of Science,
Engineering and Technology. International Journal of Environmental, Chemical, Ecological, Geological
and Geophysical Engineering. Vol 5, 201.
Benjamin, H. 2016. LEED/ World Green Building Trends in 2016: Motivators and Obstacles. [Online]
Available at: http://www.usgbc.org/articles/world-green-building-trends-2016-motivators-and-obstacles
[Accessed 25 July 2016].
Berit, S. 2010. Impact of Sustainability on Property Values , s.l.: University of Regensburge Germany.
Brundtland, G. H. 1987. Our Common Future, Oslo: the United Nations.
Chegut, A., Eichholtz, P and Kok, N. 2013. Supply, Demand and the Value of Green Buildings, California:
Urban Studies Journal Limited.
Cruickshanks, G. 2012. Motivation for Green Buildings. [Online] Available at:
http://www.ey.com/Publication/vwLUAssets/Motivation_for_Green_Buildings/$FILE/130304%20Inform%
20Vol%203%204-7.pdf [Accessed 22 July 2016].
Enshassi, A. and Mayer,P.E. 2005. Barriers to the Application of Sustainable Construction in Palestine, London:
Taylor and Francis Group
Farrell, P. with Sherratt, F. and Richardson, A. 2016. Writing Built Environment Dissertation and Projects.
Practical Guidance and Examples. 2nd ed. United Kingdom: Wiley Blackwell.
Fuerst, F. and McAllister, P. (2010) “Green noise or green value? Measuring the price effects of environmental
certification in commercial buildings”, Real Estate Economics, 39, 1, 46-69.
Gundogan, H. 2012. Motivators and Barriers for Green Building Construction Market in Turkey. s.l.:s.n.
Häkkinen, T. and Belloni, K. 2011. Barriers and Drivers for Sustainable Building. Building Research and
Information, 39(April/ 2011), p. 239 – 255.
Halas, R. 2016. Dunia Al Wattan. [Online] Available at:
http://pulpit.alwatanvoice.com/content/print/391499.html [Accessed 10 August 2016].
Hasan, H. A., 2011. Marginalized Green Homes in Palestine/ Wattan TV [Interview] (01 Dec 2011).
Heerwagen, G. and Orians, H. 1993. Human, habitats and aesthetics. In S R Kellert and E O Wilson(Eds) The
Biophilia Hypothesis. Washington DC: Island Press Shearwater Books.
Heerwagen, J. 2000. Green Buildings, Organizational Success and Occupant Productivity, London: Building
Research and Information.
Hydes, K. and Creech, L. 2000. Reducing Mechanical Equipment Cost: The Economics of Green Design.
Building Research and Information, 28(5/6), p. 403–407.
IMEMC. 2007. IMEMC Agencies. [Online] Available at: http://imemc.org/article/46460/ [Accessed 03 August
2016].
Issac, J. Rishmawi, K. and Safar, A. 2004. The Impact of Israeli's Unilateral Action on the Palestinian
Environment, Jearusalem: Applied Research Institute.
Kaiser, F. and Scheuthle, H. (2003) (Tow Challenges to a Moral Extension of the Theory of Planned Behavior:
Moral norm and Just World Beliefs in Conservationism) Personality and Individual Differences, vol 35,
P1033-1048.
Karzam, G. 2011. [Online] Available at: http://www.maan-ctr.org/magazine/Archive/Issue36/topic4.php
[Accessed 13 August 2016].

901
Karzam, G. 2016. Wattan/ Green Buildings as a Priority in Developement Policies in Palestine. [Online]
Available at: http://www.wattan.tv/news/168923.html [Accessed 22 July 2016].
Kibert, C. J. 2007. Sustainable Construction; Green Building Design and Delivery. New York: John Wiley and
Sons).
Langdon, D. 2007. The cost and benefit of achieving green buildings, Sydney: Davis Langdon and Seah
International.
McGraw-Hill Construction. 2013. World green building trends: Business benefits driving new and retrofit
market opportunities in over 60 countries. Bedford, MA: McGraw-Hill Construction.
Nelms, C. Russel. A, D and Lence, B.J. 2005. Assessing the Performance of Sustainable Technologies for
Building Projects. Canadian Journal for Civil Engineering, Volume 32, pp. 114-128.
Ofori, A. Clinton, A and Kwame, A. 2015. Barriers to Successful Implementation of Sustainable Construction
in Ghanaian Construction Industry. Ghana, Elsevier B.V.
Osaily, N. 2010. The key Barriers to Implementing Sustainable Construction in West Bank –Palestine, UK:
Robert Kennedy College / Zurich University of Wales .
Robichaud, L. B. and Anantatmula, V.S. 2011. Greening Project Management Practices for Sustainable
Construction. Journal of Management in Engineering, 27(1/ Jan 2011), p. 48 – 57.
Rydin, Y., Amjad, U., Moore, S., Nye, M. and Withaker, M. 2006. Sustainable Construction and Planning. The
Academic Report. Centre for Environmental Policy and Governance, The LSE SusCon Project, London:
London School of Economics.
Safadi, F. A. 2016. [Interview] (09 July 2016).
Salameh, W. 2012. Towards Sustainable Construction Systems Of External Walls Of Buildings In The West
Bank Of Palestine. Nablus: An Najah National University.
Trust, T. P. 2013. Beyond Aid: A Palestinian Private Sector Initiative for Investment, Growth and Employment,
London: The Portland Trust.
UNEP. 2009. Buildings and Climate Change, Paris: United Nations Environment Programme UNEP/
Sustainable Buildings & Climate Initiative.
WAFA. 2011. Palestinian News and Info Agency. [Online] Available at:
http://www.wafainfo.ps/atemplate.aspx?id=3090 [Accessed 22 June 2016].
Wattan, D. A., 2009. Dunia AL Wattan. [Online] Available at:
http://www.alwatanvoice.com/arabic/news/2009/04/08/136752.html [Accessed 12 July 2016].
Williams, K. and Dair, C. 2007. What is Stopping Sustainable Building in England? Barriers Experienced by
Stakeholders in Delivering Sustainable Developments. Sustainable development, 15(3), pp. 135-147.
Yamin, M. Z. 2015. EcoMENA. [Online] Available at: http://www.ecomena.org/tag/energy-sector-in-palestine/
[Accessed 19 July 2016].
Yaseen, B. 2008. Renewable Energy Applications in Palestine , Ramallah: Palestinian Energy and Environment
Research Center (PEC) – Energy Authority Technical Department Director (PEC) .
Yudelson, J. 2009. Green Building Through Integrated Design. 1st ed. New York: McGraw Hill.
Zhang, X., Shen, L., Wu, Y. (2010) “Green strategy for gaining competitive advantage in housing development:
a China study”, in: Journal of Cleaner Production, 19 (2011), 157-167.

902
ID 113
RATING THE COMPONENTS OF INDOOR ENVIRONMENTAL
QUALITY IN STUDENTS CLASSROOMS IN WARM HUMID
CLIMATE OF ULI, NIGERIA
C. Munonye and Y. Ji
School of the Built Environment, University of Salford, Salford, M5 4WT, UK
Email: [email protected]
Abstract: The indoor environment of classrooms needs to be comfortable for the occupants to
perform their class work effectively. To achieve this objective, architects and engineers need
to be proactive at the early design stage by giving adequate consideration to the very
component of Indoor Environmental Quality (IEQ) occupants of buildings consider most as
the hindrance to comfortable living. This paper presents the findings of a post-occupancy
evaluation of students’ subjective responses to the various environmental qualities; lighting,
odour, noise and temperature/thermal comfort in warm, humid university classrooms. The aim
was to rank the IEQ on the scale of students’ consideration of a comfortable indoor classroom
work. This was done using questionnaires to get subjective responses from the respondents.
The work was conducted in January 2017 in two university classrooms while the students
were engaged in various class activities. Sixty-five students participated in the study. The
result suggested that a majority of occupants rated thermal comfort number one as the
component of the IEQ that usually gives them the most concern. This result is consistent with
earlier studies on IEQ attributes conducted in other climatic zones in Nigeria and will be
helpful to designers, engineers, facility maintenance managers when taking decisions on
construction of classroom blocks. The findings inform future work whereby a comprehensive
subjective and objective evaluation of thermal comfort will be conducted in the warm humid,
climate using the primary school setting as a case study.
Keywords: Classrooms, Indoor environmental quality, Rating, Students, Thermal comfort.
1. INTRODUCTION
Studying in a classroom that has an acceptable Indoor Environmental Quality (IEQ) enhances
the well-being, productivity, learning ability and reduces stress, fatigue of the occupants.
These benefits of a good IEQ are confirmed by studies such as Wargochi & Wyong (2007);
Ayeni & Adelabu (2012). On the other end of the spectrum, studying in an unacceptable
indoor environment has its negative consequences. A growing body of research recognizes
that poor IEQ in schools may result in illness, leading to student absenteeism as well as
adverse health symptoms and decreases academic performance (Mendel & Heath, 2005;
Wargocki, & Wyon, 2006; Simeons et al, 2010; Haverinen-Shaughnessy et al, 2012). Also,
research on IEQ conducted by numerous researchers has proved its significant influence on
occupants’ health and productivity regarding air quality, lighting, acoustics, and thermal
comfort (Fisk, 2002; & Moon, 2016).
However, providing an acceptable indoor environment is possible if IEQ parameters are
given adequate consideration at the early design stage of buildings. Al horr et al (2016)
agrees that design of buildings needs to consider occupants well-being parameters with IEQ
right at the beginning. Bogenstätter (2000) had noted that 20% of any decision made in the
early phase of design has 80% consequences on the overall design cost. Apart from cost

903
implication, the Pareto 80-20 rule also applies to other general design success or failures
whereby 20% poor design input could lead to 80% building failure. This could be attributed
to an issue such as not seeking the opinion of users when designing a building. As such, early
design decisions are of great importance to design outcomes. Allu et al (2013) added that
assessing the IEQ should be the first step to designing a low-energy building and ensuring the
comfort of the occupants.
Despite the importance of knowing the IEQ of an indoor space, there is still very limited
research work involving building occupants that ask them to identify the component of IEQ
that gives them most concern, especially in a school setting. Huizenga et al (2006) argues that
there is far less data that assesses occupants’ satisfaction across a large number of buildings
using occupant opinion as a measure. Sundstrum (1987) reported some findings of increased
satisfaction with environments designed through user involvement. Peretti & Schiavon
(2011) added that building occupants are a very rich source of information about indoor
environmental quality and its effect on comfort and productivity. The post-occupancy (PO)
survey has identified that occupants are more ‘’forgiven of’’, and work effectively in
buildings they like (Nicol, 2012). According to Jiboye (2012), PO involves systematic
opinions about buildings from the perspective of the people who use them. It aims at
identifying what the occupant considers possible mistakes in the occupied building that
hinder comfortable living so that lessons are learned to guide future designs. However, PO
evaluation is achieved through mutual interaction between the buildings and the users with an
ultimate goal of providing this improvement.
Chukwuemeka Odumegwu Ojukwu University, Uli (COOU) is to embark on the
construction of phase two of the Department of Architecture (Fig 1). Students have been
using Phase one (Fig2) for classroom/studio work for years. Literature reviews have reported
various cases of unacceptable thermal conditions of indoor spaces, especially in institutions
of higher learning in Nigeria. For example, Olanipekun (2014) evaluated the thermal
perception of the occupants of naturally ventilated hostel blocks and observed that occupants
frequently complained of inadequate comfort in their indoor environment of their buildings
because of high temperature, especially in the afternoon periods. Amasuomo & Amasuomo
(2016) investigated the relationship between students’ perceived thermal discomfort and
stress behaviours in lecture theatres in the humid tropics in Nigeria with findings that the
students experienced a considerable level of thermal discomfort. Uzuegbunam (2011)
investigated comfort conditions in hostel buildings in Enugu, Nigeria and reported poor
indoor thermal conditions because of the replication of the western style of architecture
which conserves heat and limits infiltration of outside air to the interior. The best way to
know how people actually feel in a particular situation is to go and ask them by the method of
fieldwork (Nicol et al, 2012). As a result, there is a need for PO evaluation of phase one in
the form of feedbacks from the users (students) to know the very component of IEQ that
gives them most concern to comfortable classroom work. This feedback will guide in the
final design of phase two of the school building.
This paper, therefore, presents the findings of a field study of Post-Occupancy (PO)
evaluation of students’ subjective responses to the various environmental qualities namely:
lighting, odour, noise, and temperature/thermal comfort in warm, humid university
classrooms in Uli, Nigeria. The aim was to rank the IEQ on the scale of students’
consideration for a comfortable indoor classroom work.

904
Fig 1: Phase 2 view from courtyard Fig 2: Phase 1 view from courtyard
2. LITERATURE REVIEW
2.1 Previous Studies on IEQ
Indoor Environmental Quality (IEQ) of educational buildings has been vigorously studied in
primary, secondary and university classrooms. However, the various research specifically
concerned with the learning effect of the learning environment of students tends to be carried
out in western Europe and particularly in the USA (Higgins et al, 2005), while Peretti &
Schiavon (2011) mentioned North America, Europe, and Australia as the focus of Centre for
the Built Environment (CEBE) surveys with limited data available from Asia, Africa, and
South America.
Frontczak (2011) summarized previous studies on IEQ undertaken between 1977-2009 with
findings that thermal, acoustical, visual environment and air quality all influence evaluations
of the overall indoor environment, noting that thermal comfort was ranked by the majority of
cases to be of slightly greater importance for overall comfort than acoustics and visual
comfort and satisfaction with air quality. Kim et al (2013) investigated gender differences in
occupants’ perception on various aspects of the indoor environmental quality with samples
from North and South America, Asia, Middle East, Europe, and Oceania. Among the four
main dimensions of IEQ notably Indoor Air Quality (IAQ), thermal comfort, lighting, and
acoustics; the literature was dominated by IAQ and thermal comfort. However, findings from
these regions may not be generalized to other parts of the word, especially in the tropical
Africa, because climate, culture, adaptation and other variables may have effects on the
perception and ranking on the IEQ components.
Gado et al (2005), did a subjective investigation of the environmental performance of
government schools in Egypt and came out with findings that 78% of the occupants were
thermally uncomfortable. Hayatu et al (2015) assessed the environment of school theatres in
Nigeria and reported thermal discomfort as a major problem to the occupants of the theatres.
Uzuegbunam (2011) investigated the comfort conditions of the hostel buildings in Enugu and
observed that thermal comfort tops the list of human needs in a hot humid tropical
environment in South East Nigeria. Olanipekun (2014) studied the perception of the
occupants to the environmental conditions of naturally ventilated hostel blocks in Nigeria and
observed that occupants frequently complained of inadequate comfort in the indoor
environment of their buildings because of high temperature, especially in the afternoon
periods.
Researchers have adopted various methods to rate the IEQ of a building. Some employed
both objective and subjective methods while some others such as Carlopio (1996) & Leaman,

905
(2010) used subjective approach. However, Holiday & Turner-Henson (1989); Borgers et al,
(2000) advised the adoption of well-structured and brief questionnaires since long
questionnaires could result to low motivation and difficulties in keeping up concentration and
may result in poorer data quality.
2.2 IEQ Rating Tools
Literature from IEQ researchers remains unclear on common or standardized POE tools to
measure occupant ratings of the built environment (Veitch et al, 2007 & Kim et al, 2013).
However, building sustainability rating tools assess the indoor environmental quality of
buildings using two broad strategies: occupant questionnaires called POP, and instrument
measurements of physical conditions inside buildings (de Dear et al, 2016). Kim et al (2013)
adopted the Centre for the Built Environment (CEBE) survey questionnaire while
investigating the gender differences of occupants on various aspects of IEQ. This is actually
the most widely used POE tool to date. For example, it is recommended by ASHRAE
(American Society of Heating, Refrigerating and Air-conditioning Engineers) as a basic
evaluation process of building performance measurement (ASHRAE, 2013a).
Various types of scales have been adopted by researchers in the Post Occupancy (PO)
evaluation of the IEQ in buildings. Rohles et al (1989) while rating the components of IEQ
used a six-point scale of acceptability ranging from 1 (very unacceptable) to 6 (very
acceptable). Zhang et al (2007) adopted a 7-point semantic differential scale with end points
‘’very dissatisfied ‘’ to ‘’very satisfied’’ to conduct occupant satisfaction with respect to nine
environmental categories in office buildings. De Giuli et al (2012) while evaluating the IEQ
of pupils of primary schools in Italy used a four-point rating scale. De Giuli’s argument was
that ‘’it forces pupils to give an answer that is clearly positive or negative’’. Neutral option
were removed, arguing that choosing neutral option results in loss of information.
2.3 INDOOR ENVIRONMENTAL QUALITY COMPONENTS
Literature reviews have narrowed IEQ attributes to four basic components namely; Lighting,
noise, thermal Environment and Indoor air quality.
(i) Lighting
There are various debates among researchers on which form of lighting, daylight or artificial
light, is the most suitable for the classroom. In relation to student achievement, it is argued
that day lighting offers the most positive effect. Liberman (1991) argues that the majority of
humans prefer a daylight environment because sunlight consists of a balanced spectrum of
colour, with the benefits of reduced utility costs for school districts, improved student
attendance and academic performance, and a less stressful environment for students.
Furthermore, other benefits are increased student and teacher attendance, increased
achievement rates, reduced fatigue factors, improved student health, and enhancement of
general development.
(ii) Acoustics/Noise
Acoustic problems in buildings could come from airborne sounds, outdoor noise, noise from
adjacent spaces, noise from office equipment, noise from nearby facilities or noise from
students themselves in school. A more reliable finding is that chronic noise exposure impairs

906
cognitive functioning and a number of other noise-related problems (Suter, 1989; Goines, &
Hagler, 2007). As a result, reviews of the consequences of aspects of the physical
environment tend to conclude that acoustics and noise are important factors in a school
environment (Earthman, 2004).
(iii) Thermal Environment
A good learning environment that is thermally comfortable cannot be overemphasized,
especially in this era of global action on climate change mitigation. Thermal comfort is
defined by the American Society of Heating, Refrigerating and Air-Conditioning Engineers
(ASHRAE) as ‘’that condition of mind that expresses satisfaction with the thermal
environment (ASHRAE, 2013a) and sets an 80% satisfaction quota as target for human
comfort. Fanger (1970) suggested that the six most important factors or variables that
determine the thermal condition of a given space are: air temperature, humidity, air velocity,
mean radiant temperature, clothing and activity/metabolic rate.
Air temperature is considered an important determinant to thermal comfort evaluation of a
given indoor space. Relative humidity (RH) is a measure of the moisture in the air, compared
to the potential saturation level. High humidity accompanied by high ambient temperature
causes a lot of discomfort (Eliah, 2014). Earlier, de Dear et al (1991) came out with results,
after investigating the preferred temperature of two subjects with different clothing values
that there are no significant differences when the RH was set at 70 and 55%. Mallick (1996)
added that there are instances where people have reported to be comfortable in a humidity
above 95%. In naturally ventilated buildings, especially in the tropics, air movement is
believed to have some positive effect on the thermal comfort conditions of the occupants.
Study by Candido et al (2011) suggests that more people view air movement as positive in
offices and in classrooms. Researchers, such as Cena & de Dear (2001); Wong et al (2002);
Zhang et al (2007), who conducted various surveys around the world in different climates
suggest the idea that the width of the comfort zone could be increased with higher air
movement. Mishran and Ramgopal (2015) further argued that with the setting of a fan to raise
air movement up to 0.3m/s, there could be a rise in the lower and upper limits of temperature
by 2.4 and 2.2oC respectively.
Adaptation is another factor that plays an important part in thermal comfort especially as it
applies to naturally ventilated buildings. The adaptive thermal comfort is based on the
premise that humans will generally change their behaviour and act in ways that will make
them thermally comfortable which, according to (Nicol et al, 2012), has proven to be more
suitable for free running buildings. This premise suggests that there is a relationship between
preferred indoor temperature and outdoor temperatures (Nicol, 1999; Du, et al, 2014).
Comfort temperature was, therefore, defined as ‘’a band rather than a single threshold’’ for
free-running buildings (Ji et al, 2016). Adaptive actions could include taking off clothing,
reducing activity levels, opening a window, moving to a different place in the building, and
by drinking hot or cold water (Nicol, 1999; & Wong et al, 2002). However, unlike in
residential buildings, these actions are reported to be restricted in places such as in offices
and in schools.
(iv) Indoor Air Quality
Natural ventilation using air infiltration mechanism is considered an appropriate zero carbon
emission strategy that could help vary the indoor pollution. On the other hand, natural
ventilation can be harmful in buildings where air pollution is high. However, design
considerations such as building location, orientation, overall design such as space allocations

907
and ventilation, climate control, materials selections, and specifications, ought to be
considered at the earliest building design stage to avoid locating these buildings in polluted
environments. Al horr et al (2016) added that based on research on sick building syndrome
(SBS), it is important that buildings be designed in such ways as to reduce the exposure to
indoor chemicals.
3. METHODOLOGY
3.1 The Study Area
COOU, Uli is situated in Anambra State South East of Nigeria, has geographical coordinates:
latitude 5o 471N and longitude 6o 521E. Hot & Dry, Warm & Humid and Composite between
the two (Batagarawa ,2012) constitute the three basic types of climate in Nigeria. The study
area under discussion falls within the warm, humid. With an average temperature of 28.5oC,
March is the warmest month while July has the lowest average temperature of the year which
is 25.2oC. The dry season runs from November to March, while rainy season runs from April
to October. The annual relative humidity is 75% reaching 85% in the rainy season. COOU
has two campuses; Igbariam and Uli campus. The Department of Architecture is located in
Uli campus.
3.2 Data Collection
This study adopted the subjective approach to rate the different components of the IEQ in the
classrooms. Questionnaires, observations and the physical measurement of the classroom
spaces were used to collect data from the participants. Evaluation was conducted in the early
January, 2017. The administrative protocol to have access to the participants was brief
because the researcher is a staff of the institution. Participants (students) had no prior
information about the nature of the study as they were waiting for their lecturer to arrive for
class work. The survey did not disrupt their class schedule as they had their lecture
immediately after the questionnaires were collected (Fig 3). However, before the
commencement of the survey, the students were informed that participation was voluntary
and the confidentiality of any information they provide would be respected. Two naturally
ventilated classroom spaces, with ceiling fans which were never used, were randomly
selected for this study; studio 300 level and MSc 1 studio (fig 4) measuring 81m2 and 143 m2
respectively. The building was chosen because the second phase is at the stage of design
completion, so the need for the users (participants) to rate the indoor conditions of phase one
became imperative.

908
Fig 3: Students after the survey
Fig 4; Floor Plan of the existing school Building
3.3 Participants
A total of seventy-five participants from a sample population of about three hundred and
eighty (380) students of the Department of Architecture Uli was distributed questionnaires.
Sixty-five participants completed the questionnaires representing 87%, while ten opted out.
100% of these questionnaires were correctly completed. Out of this sixty-five participants, 77
% and 23% were male and female respectively. However, a survey based on gender
differences was not one of the objectives of this study. The majority of the students’ (78%)
ages ranged from 18-24 years. The survey was conducted at 1400 hrs with an average
completion time of four minutes for the questionnaires. However, the researcher spent an
400 LEVEL
STUDIO
O
p
OPEN
COURTYARD
MSC 2 STUDIO
OPEN
COURTYA
RD
COMPUTER
LAB

909
additional two hours to observe and note the behaviours of the respondents as they adapted to
the indoor conditions.
This study employed ‘’Yes’’ or ‘’No’’ methods to rate the general comfort conditions of the
classrooms. Prior to this question, participants were asked to vote where they usually prefer
to sit in the classroom (‘’beside the window, at the rear of the classroom or at the centre’’). A
follow-up question asking them to rank the reason they would prefer to sit in that position
(‘’to avoid noise, better lighting, better thermal comfort/temperature, to avoid odour’’) using
a four- point scale ranging from 1 (not important) to 4 (most important). The last question,
using the same four-point scale, asked them to rank the components of the IEQ that they
consider would make them comfortable while in the classroom (‘’ Less noise, better lighting,
less temperature and less odour”). The last two questions seemed related, but the reason was
to see how the rating they gave to both questions correlates.
4. RESULTS AND DISCUSSION
The findings of the PO evaluation of the students’ subjective responses to the various IEQ are
summarized below.
(i) Subjects’ response to the question ‘’ where do you prefer to sit in the classroom?’’
The subjects’ response, as shown in fig 5, indicate that 71% of the respondents prefer to sit
beside the windows, while 23% would prefer the centre of the classroom. Only 6% of the
respondents would prefer to sit at the rear of the classrooms. 79% of this number which
prefers to sit beside the window rated thermal comfort their number one reason. Hence, there
is a strong linear relationship between thermal comfort and window openings which agree
with the previous studies that window opening, which allows air flow, is the number one
adaptive opportunity used by occupants of buildings to restore comfort. The fans, though in
good condition, were not put to use by the students during the survey even when electricity
was available. However, only 10% of the number that prefers to sit beside the window rated
odour last on their scale of the reason for preferring to sit near the window. Hence, there is a
very weak correlation between preferring to sit near the window and odour. This might be
attributed to the location of the campus in a non-industrial zone.
Fig 5: Pie Chart showing percentage of responses to sitting preferences in the class/studio
[n (respondents) for centre=15, n for window=46, n for rear=4]

910
(ii) Subjects’ response to the question ‘’rank the reason why you prefer to sit in that
position’’?
The subjects’ response indicates that 65% of the respondents rated better thermal comfort as
the most important reason why they prefer to sit in a particular position, better lighting, avoid
noise and avoid odour were rated 20%, 7.5% and 7.5% respectively. The responses are
consistent with those in result (i). Furthermore, 89% of the respondents rated thermal comfort
by voting ‘’most important (4) and important (3)’’ as their reason for preferring to sit near the
window.
(iii) Subjects’ response to the question ‘’rank the component of the IEQ you consider that will
make you comfortable while in the classroom”’?
Subjects’ response, as shown in fig 6, indicate that the respondents ranked ‘’Less
temperature/ better thermal comfort’’ 62%, ‘’less noise/acoustic and better lighting’’ each
ranked 15% while ‘’less odour’’ was ranked only 8%. Questions (ii) and (iii) appear similar
but the intention was to check how consistent the participants were in answering questions
and whether the answers could correlate. Generally, both questions show consistency having
followed the same trend in the rating. Majority of the respondents rated thermal comfort very
high while odour was rated low in both questions (ii) and (iii).
Fig 6: Pie Chart showing percentage ranking of IEQ components by the respondents
{n(respondents) for noise=10, n for light=10, n for thermal=40, n for noise=5}
(iv)Subjects’/ acceptability answer to the question” is the classroom presently comfortable”?
Subjects’ response as shown in fig 7 Indicates that the classrooms’ general comfort was
acceptable to 54% of the respondents while 46% rated it unacceptable.

911
Fig 7: Pie Chart showing percentage of acceptability to IEQ
{n(respondents) for acceptable=35, n for non-acceptable=30}
The high-level of acceptability could be because of the large window openings and their
placements in opposite directions in the classrooms which allowed high infiltration of air and
cross ventilation. This confirms earlier literature review that highlighted the importance of air
movement to the indoor thermal conditions. Even with the high humidity of 71 %, which the
weather channel showed on the survey day, the majority of the participants still accepted the
indoor condition. This also confirms the argument by various researchers that humidity has
little or no effect on thermal comfort even when, according to Mallick (1996), it is reported at
95%. Though the majority (54%) accepted the indoor thermal conditions, the acceptability
could have been higher if the adaptive opportunities available were effectively used, and the
high occupancy in the classroom was resolved.
5. CONCLUSIONS
Field subjective survey of 65 respondents, (using PO survey), in the university classroom of
COOU, Uli campus was conducted. The conclusions are as follows:
i) Majority of the respondents ranked thermal comfort as the component of IEQ that gives
them most concern for comfortable indoor classroom work. This is consistent with other
previous work in Nigeria.
ii) The majority of the respondents prefers to sit beside the window. This confirms previous
studies that find a strong relationship between thermal comfort and the opening of windows.
iii) The majority of the respondents accepted the general indoor condition of the classrooms
though the acceptability was short of the 80% acceptability criterion set by ASHRAE
(ASHRAE 55:2013a).
In addition to the above findings, the researcher observed the inability of the students to put
on the ceiling fans which were in good condition even when the lights were on. The
researcher reasoned that it might be because the majority of the students who accepted the
general thermal condition of the classrooms may not like the ceiling fans to be put on or that
they were not free to do so because of the presence of their lecturer. The indoor comfort of
the occupants of the classrooms that voted ‘’No’’ to thermal acceptability could probably
have been enhanced if they made use of the ceiling fans that were available. Humphreys and
Nicol (2002) argued that subjects can be comfortable at temperatures up to or even exceeding
30oC, in hot climates, especially if fans are used to increase indoor air movement. Mishran

912
and Ramgopal (2015) further argued that with the setting of a fan to raise air movement up to
0.3m/s, there could be a rise in the lower and upper limits of temperature by 2.4 and 2.2oC
respectively. Results from the various field studies led to the extension of the boundaries of
the comfort zones with respect to three different air speeds – still air (up to 0.2m/s), natural
air flow (0.2m/s – 0.5m/s) and forced air flow with ceiling fan assist (0.5m/s – 1.5m/s)
(ASHRAE, 2013).
Generally, the results of this study show the rating of the different components of IEQ in a
university building and highlight the importance of post-occupancy evaluation. The findings,
will guide in the final design of phase two of the department of architecture, COOU and will
also be useful to other designers, engineers, facility maintenance managers and stakeholders
in educational institutions when taking decisions on construction of classroom blocks in order
to increase the comfort of the occupants. This PO information also motivates the need for
future work that will adopt both objective and subjective methods to evaluate the thermal
comfort perception of children, this time, in a primary school setting.
6. REFERENCES
Al horr,Y., Arif, M., Katafygiotou, M., Mazroei, A., Kaushik, A., and Elsarrag, E. (2016), Impact of indoor
environmental quality on occupant well-being and comfort: A review of the literature International
Journal of Sustainable Built Environment Vol 5, Issue 1, June 2016, Pages 1–11.
Allu, E., Ebohon, O., and Taki, A. (2013), Architectural Design: Its Roles on Buildings for Sustainable
development International Post Graduate Research Conference IPGRC Salford-UK, pp. 92-104.
Amasuomo, T., and Amasuomo, J. (2016), Perceived Thermal Discomfort and Stress Behaviours Affecting
Students Learning in the Humid Tropics, doi:10.3390 Journal/Building.
ASHRAE (2013a), ASHRAE Standard 55-2013: Thermal Environmental Conditions for Human
Occupancy, American Society of Heating, Refrigerating and Air-Conditioning Engineers, Atlanta, GA.
Ayeni, A,. and Adelabu, M, (2012), Improving learning infrastructure and environment for
sustainable quality assurance practice in secondary schools in Ondo State, South West Nigeria.
International Journal of Research Studies in Education: Vol 1, No 1, 2012.
Batagarawa, A. (2012), Benefit of conducting energy calculations in the b built environment of Nigeria In:
a Agyepong, S.A., Leiringer, R. and Hughes W. (Eds) Procs 4th West Africa Built Environment
Research (WABER)Conference,24-26Jul2012,Abuja,389-397.
Bogenstätter, U. (2000), Prediction and Optimization of Life-Cycle Costs in Early Design, Building
Research and Information,28 (5), pp.376-386.
Borgers, N., de Leeuw, E., and Hox, J. (2000), Children as Respondents in Survey Research: Cognitive
Development and Response Quality 1. Bulletin de Méthodologie Sociologique, 66(1), pp. 60.
Cândido, C., de Dear, R., and Lamberts, R. (2011), Combined thermal acceptability and air movement
assessment in a hot humid climate. Building & Environment Vol 46, Issue 2. Pg 376
Carlopio, J. (1996), Construct validity of a physical work environment satisfaction questionnaire. Journal of
OccupationalHealthPsychology
Cena, K., and deDear, R. (2001), Thermal comfort and behavioural strategies in office buildings located in
a hot arid climate Journal of Thermal Biology Vol 26, Issues 4–5, September 2001, Pages 409–414.
deDear, R., Leow, K., and Ameen, A. (1991), Thermal comfort in the humid tropics—part 1: climate
chamber experiments on temperature preferences in Singapore. part 2: climate chamber experiments
on thermal acceptability in Singapore, ASHRAE Transactions, 97 (1) (1991) 874–879, 880–886.
deDear, R., Parkinson, T., and Parkinson, A. (2016), Pervasive and real-time indoor Environmental Quality
(IEQ) monitors. Proceedings of 9th Windsor Conference; Making Comfort Relevant Cumberland
Lodge, Windsor, UK; Network for Comfort & Energy Use in Building.
De Giuli, V., Da Pos, O., and Da Carli, M., (2012), Indoor environmental quality and pupil perception in
Italian primary schools Building and Environment Vol 56, October 2012, Pages 335–345.
Du, X., Bokel, R., and Dobbelsteen, A. (2014), Building microclimate and summer thermal comfort in free-
running buildings with diverse spaces: A Chinese vernacular case, Building & Environment
82(2014). Earthman, G. I.( 2004), Prioritization of 31 Criteria for School Building Adequacy
available:www.aclu-md.org Eliah, F. (2014), Thermal comfort Investigation of multi-storey Residential

913
buildings in Mediterranean Climate Darnah PhD Theses
Fisk, W. (2002), How IEQ affects health productivity ASHRAE journal, 44(5) 56.
Frontczak, M. (2011), Human comfort and self-estimated performance in relation to indoor environmental
parameters and building features Ph.D. Thesis Department of Civil Engineering Denmark University.
Jiboye, A. (2012), Post-occupancy evaluation of residential satisfaction in Lagos, Nigeria: Frontier of
Architectural Research Vol 1, Issue 3 Page 236 – 24.
Gado, T., Mohamed, M., and Unwin, S. (2005), The environmental performance of classrooms in Egypt: a
case study from El- Minya governorate. Conference: he Second Scottish Conference for Postgraduate
Researchers of the Built & Environment (PRoBE 2005), At Glasgow Caledonian University, UK, Vol:
1. Goines, L., and Hagler, L. (2007), Noise pollution: A modern plague Southern Medical Journal, 100 (3)
(2007), pp.287–293.
Haverinen-Shaughnessy, U.,Turunen M.,Metsämuuronen, J., Palonen,J,. Putus,T., Kurnitski. J.,
Shaughnessy R. (2012), Sixth Grade Pupils’ Health and Performance and
Indoor Environmental Quality in Finnish School Buildings British Journal of
Educational Research 2(1): 42-58. Hayatu, I; Mukhtar,I; Mu’az,N; & Enaburekhan.
J.(2015), An Assessment of Thermal Comfort in Hot and Dry Season (A Case Study at Bayero
University Kano) In’t Jou’ of Mult’ and Current Research Vol 3.
Higgins, S. (2005) The impact of schools environments: A literature review uploaded by Steven Edward
Higgins https://www.researchgate.net/publication/232607630.
Holaday, B.,and A.,Turner-Henson. (1989), Response effects in surveys with school age children. Nursing
research,38(4),pp.248.
Huizenga,C ; Abbaszadeh, S; Zagreus. L; & Arens, E. (2006). Air Quality and Thermal Comfort in Office
Building Results of a Large Indoor Environmental Quality Survey. Proceedings of Healthy Buildings
2006 Lisbon,Vol.III,393-397.
JI, Y., Zhang Yi., Korolija, I., and Futcher J. (2016), Design summer year weather-outdoor warmth ranking
metrics and their numerical verification. Building Services Engineering research and
technology . Vol 37(6) 639-663.
Kim, J., deDear, R., and Arens, E. (2013), Gender differences in office occupant perception
of Ind Env Quality (IEQ). Building and Environment Volume 70, December 2013, Pages 245–25.
Leaman, A. (2010), BUS occupant survey method: details for licensees. BUS occupant survey method:
details A for licensees.http://www.usablebuildings.co.uk.
Liberman, J. (1991), Light Medicine of the Future. New Mexico: Bear & Company Publishing .Mendel, M;
and Heath, G. (2005), Do indoor pollutants and thermal conditions in school’s influence student
performance? A critical review of literature, indoor air.
Mallick, F., (1996), Thermal comfort and building design in the tropical climate Energy and Buildings, 23
(1996), pp.161–167.
Mishra, A. and Ramgopal, M. (2015), Thermal comfort & comfort standards for Naturally
ventilated classrooms in hot humid climates. Research Gate.
Moon, J. (2016), Objectivity and Specification: Extending POE Research on Office Environment of South
California, PhD Theses.
Nicol, J., Raja, I., Allaudin, A., and Jamy, G. (1999), Climatic variations in comfortable temperatures: The
Pakistan Projects: Energy and Buildings Vol. 30 Pages 261 – 279.
Nicol, F., Humphreys, M., Roaf, S. (2012), Adaptive Thermal Comfort: Principles and Practice: London,
United Kingdom: Routledge.
Olanipekun, A. (2014), Thermal Comfort and Occupant Behaviour in a Naturally Ventilated Hostel in
Warm- Humid Climate of Ile-Ife, Nigeria: Field Study Report During Hot Season Global Journal of
HUMAN- SOCIAL SCIENCE: B Geography, Geo-Sciences, Environmental Disaster Management Vol
14 Issue 4 Peretti, C., & Schiavon, S. (2011), Indoor environmental quality surveys. A brief literature
review Centre for the Built Environment UC Berkeley.
Rohles, F., Woods, J., and Morey, P. (1989), INDOOR ENVIRONMENT ACCEPTABILITY: THE
DEVELOPMENT OF A RATING SCALE CONFERENCE PROCEEDING by ASHRAE, Vol 95
Simons,E; Hwang, S; ; Fitzgerald,E; Kielb C; & Lin, S; 2010. The Impact of School Building
Conditions on Student Absenteeism in Upstate NY Am J Public Health. 2010 September; 100(9):
1679–1686a. Sundstrom, E. (1987),
Work Environments: Offices and factories, in D Stockol and I Altman (eds), Handbook of
Environmental Psychology.
Suter., A. (1989), The effects of noise on performance Tech. Mem. 3-89 U.S. Army Human Engineering

914
Lab., Aberdeen Proving Ground, MD.
Uzuegbunam, F. (2011), Towards a design strategy for effective passive ventilation of student hostel in hot
humid tropical environment of Enugu Campus, PhD Theses.
Veitch, J., Charles, K., Farley, K., and Newsham, G. (2007), A model of satisfaction with open-plan office
conditions: COPE field findings. Journal of Environmental Psychology. 2007; 27:177-89.
Wargocki, P., and Wyon, D. (2006), Effects of HVAC on student performance. ASHRAE J., 48, 22-28.
Wargochi, P., and Wyon, D. (2007), The effects of moderately raised classroom temperatures and
classroom ventilation rate on the performance of schoolwork by children(RP-1257), HAAC R. RES
13(2)2007)193 Wong, N., Feriadi, H., Lim, P., Tham, K., Sekhar, and C; Cheong, K.(2002),Thermal
comfort evaluation of naturally ventilated public housing in Singapore Building and Environment
Vol 37, Issue 12, December 2002, Pages 1267–1277.
Zhang, H., Arens, E., Fard, S., Huizenga, C., Paliaga, G., Brager, G., Zagreus, L. (2007), Air movement
preferences observed in office buildings. International Journal of Biometeorology 51:349 – 360.

915
ID 125
THE DEVELOPMENT OF PERFORMANCE SPECIFICATIONS TO
PREDEFINE THE NEEDS OF REFUGE DWELLINGS IN HOT DRY
CLIMATES
A. Aburamadan, B. Trillo and P. Coates
School of the Built Environment, University of Salford, Salford, M5 4WT, UK
Email: [email protected]
Abstract: Accommodating refugees is becoming an increasingly relevant issue in many
countries. Climate change related natural and human hazard will increase this trend. Despite of
the magnitude of the problem and its widespread diffusion across the globe, humanitarian
agencies and institutional bodies still approach it with one-size fits all solutions, including the
provision of standardized shelters. This is particularly true in hot climate contexts. However,
to appropriately accommodate refugees it is necessary to provide accommodation that aligns
with their needs.
This paper offers a different perspective, by providing the readers with a list of performance
specifications, capable to address the shelters design in hot dry climates according to the end
users’ perspective of the case of Al Za’atari camp in north-western Jordan, which has
accommodated Syrian refugees since 2012. A robust research methodology allows drawing
conclusions from a wide variety of sources. Lessons learned is there is a need to overcome an
approach based on standardizations of users’ needs, there is needs to recognize the actual time
frame of the duration of the camps and to prioritize stakeholders’ needs.
Keywords: accommodating refugees, Al Za’atari camp, hot dry climate, lessons learned,
specifications
1. INTRODUCTION
The world is currently facing significant difficulties in accommodating refugees because of
the unstable situation that many countries are experiencing. As the United Nations High
Commissioner for Refugees [UNHCR] reported in 2013a, many areas around the world are
suffering from security situations and political unrest that has led to major challenges.
Recently, Syria, Libya, Yemen and other countries have experienced conflict situations
leading to large outflows of refugees. The UNHCR (2014-2015) describes the main
stakeholders in conflict areas as refugees, governments, non-government organizations
(NGOs), and neighboring areas. The Middle East and North Africa (MENA) region are the
most region that suffer from dwelling refugees and it showed 60 refugees camps are
distributed in MENA region. They were categorized by the UNHCR as protected refugees,
returned refugees, protected Internally Displaced Persons (IDPs), returned IDPs, Asylum-
seekers, people under UNHCR’s stateless mandate and ‘various’ others. By the end of 2012,
Sub-Saharan Africa and Asia accounted for 63% and 29% of refugee camps, respectively.
Maak (2015) indicated in Sub Saharan Africa 72 percent of the population live in slums, the
demand from this increasing population is a critical concern around the world and the United
Nation (UN) reports indicate that by 2050 the increasing refugee population will reach 1.5
billion people and additional needs of dwellings and services must be completed to meet the
demand.

916
The aim is to develop specifications as framework for refugees’ shelters. The research
focuses on developing specifications list and populate to stakeholders as frame work to
dwelling refugees, it is a process as roadmap for refugees’ studies and shelter establishment
by following criteria specifications list. Specifically the research will assess refugees’
physical and social needs and put forward specifications for shelters that are modified based
on these needs, related to the particular circumstances of being located in the hot-dry climate
of Jordan.
The paper considers refugee camps in hot-dry climate conditions that are located in different
places around the world. The Al Za’atari camp in Jordan is located in such hot-dry climate
conditions and represents the second largest camp in the world as reported by the UNHCR
(2013b). For this reason, this camp will be used as the location for primary data collection in
this study.
2. REVIEW LITERTURE- USERS’ NEEDS
Increasing refugees and concerning of accommodating are an issue that needs to review
several requirements which present in users’ needs, who are concern of stakeholders and their
requirements, environment challenges and specifically hot dry climate which is area of the
paper, and practices of shelter performance of previous studies.
A review of the literature showed a lack of attention to human needs regarding what refugees
exactly needs and their differences and situations. Eastmond (2015, p.105) defines refugees
regarding UNHCR “is an individual who has crossed a national boundary, and has a well-
founded fear of persecution in the county of origin on the basis of race, religious or political
affiliation, ethic or social group”. In common with others, refugees had their own lives before
becoming refugees. Due to the harsh situation that refugees have faced, it is normal that they
refuse adaptation to a new community, they lost everything; their homes, indigenous location,
their daily activities, so it is difficult to be part of a new community (Lambo, 2012). It is
important that refugees continue their lives as normal after the threat of war has disappeared.
When they first arrive in a host community, it may be enough to provide them with their
basic needs but over time, stress and psychological suffering lead to a more complex
framework in providing for their needs. Zavei and Jusan (2012) mentioned the consequences
of absence of the social factor from humanitarian organization reports as this can cause
instability and impact on human psychological health that might lead to community violence.
Also, findings of primary data in this study showed refugees’ stories of frightening and
terrifying times besides what they faced before and after settlement and how this impacts on
health and social stability. Refugees overlap between needs levels as shows in Figure (1) in
order to obtain their needs. When people cannot obtain their needs at the lower level of the
pyramid needs, they go to another level of needs and it is possible for them to go back and
forth between these levels. Duncan (2011) argues Alderfer's theory (1969) that presents that
people may intensify their focus on the lower level of needs if they are frustrated in locating
the higher level of needs. In history, refugees’ needs and satisfactions have shown an
overlapping pattern in terms of obtaining needs. In this regards, the requirements of modern
life have an influence on people, despite refugees’ need for protection and security. Also they
need to interface with modernity, for instance using modern devices such as phones, washing
machines that explain another level of self-actualization needs. Kesebir, Graham and Oishi
(2010) mentioned how social and cultural aspects play a vital role in driving peoples’ needs

917
and show variability even in physical needs that cross culture features such as people’s sleep
or eating patterns which impact on satisfaction of living conditions.
Figure 1: Maslow’s classic hierarchy of needs (Source: Kenrick et al., 2010)
Additionally, one of the essential basic needs is shelter, various factors determine the
characteristics of a shelter, such as comfort, control, stability, environmental resistance and
privacy. Shelter provides protection from the elements, climate conditions and other physical
dangers such as animals and strangers. The provision of refugees’ shelters is influenced by
several requirements and the lack of establishing basic human needs and desire in existing
shelters is apparent in most shelter solutions (Heywood, 2004). Zavei et al., (2012) shows the
importance of finding the connection between peoples’ motivations and the architectural
elements that could lead to a suitable result of shelter satisfaction, it will be more appropriate
to establish a framework of peoples’ needs, environment aspects and the context then suggest
a proposed design of a shelter by defining shelter performance.
3. HOT DRY CLIMATE DIFFICULTIES AND AFFECTING DESIGN FACTORS
Hot dry climate have hot summer and cold winter and the more concentrated sun in summer
means high summer aridity. This climate has an average temperature of between 0°C in
winter and above 38°C in summer, and a large variance in temperature between day and night
in the same season (Fuchs, Stark, Zeumer & Hegger, 2012).
This climate has a number of elements that formulate its conditions. These are: direct sun,
low humidity, very low average precipitation with the possibility of sudden heavy
precipitation, severe winds that cause dust storms, temperature fluctuations, clear skies and
low cloud density and high levels of dust in the atmosphere (Fuchs et al., 2012). There are
fundamental building requirements that are obligatory in achieving internal comfort in
buildings in a hot-dry climate. These building incorporate protection from high heat
absorption due to high temperatures and building materials that offset direct heat and
minimize temperature fluctuations.
Accordingly, the nature of such a climate must be clarified by orientation, formation,
vegetation, materials and construction. Designers should limit the amount of dust entering a

918
dwelling during sandstorms and prevent dust from blowing around inside. Also, the cold
should be considered in terms of the nights being surprisingly chilly, especially in arid areas
(Corsellis & Vitale, 2005).
In short, the point of interest is to enhance the quality of refugee shelters by establishing a
framework of performance specifications suitable to steer the design process. First, criteria
are formulated on the basis of theories of human needs, refugee studies and involved
organization reports. Then, performance specifications are; related to the following criteria:
safety and security, social context, comfort, stability, flexibility and modularity, being
demountable, durability and having constant energy which are formulated by reviewing
literature.
4. INVOLVING STAKEHOLDERS
The significance of the paper is about creating a framework of establishing refugees shelter
with taken onto consideration stakeholders’ opinions and views about the problems and
reality of dwelling refugees in camps which is absence on previous practices in this field,
moreover, the researcher had to understand the context carefully by determining who
stakeholders are involving in dwelling refugees which presents in local governments,
humanitarian organizations, refugees, manufacturing companies, professionals and experts
which the paper chooses stakeholders based on reviewing literature and primary data, while
other researchers could add other stakeholders who are involving on the context of refugees’
dwelling, both socially and environmentally. The potential point is formulated by the
researcher to determine who has a direct and indirect connection with the whole process of
developing performance specifications and it is limitless to determine due to the differences
of camps situation in terms of environment challenges and social aspects.
Concerning the justification of choosing stakeholders stands on literature, and explicating the
problem of dwelling refugees. It was appropriate in order to achieve the paper aim to find the
right explanations. In this regard, the researcher conducted the data analysis through
involving those stakeholders to develop performance specifications as framework for who are
in charge to dwelling refugees in hot dry climates area.
4.1 Stakeholders’ Requirements
The paper explores stakeholders’ needs and requirements by secondary data as well as
primary data that conducted in the Al Za’atari camp in Jordan. Stakeholders’ requirements
formulate their prioritizations where the priorities are different between stakeholders in terms
of the research criteria. An analysis of the results presents the differences in stakeholders’
priorities, the different priorities helped in considering further requirements when
demonstrating performance specifications. The paper draws stakeholders prioritizations by
exploring primary data from the field with taken into consideration the criteria of adequate
living conditions from reviewing literature which presents in the paper criteria.
As collected data from the fieldwork that indicated in the refugees’ sections, protection is the
first priority while other priorities fluctuate between other requirements in relation to social
and environment context, as for local government priorities. The establishment of security
inside camps is a vital part of the political issue in host countries, whereas local
manufacturing companies’ priorities are mainly concentrated on financial income. The

919
priorities of humanitarian organizations located in Jordan are primarily the protection of
refugees as well as minimizing service difficulties (discontinuous electricity and water).
These priorities are followed by social and cultural differences, climate difficulties and
shelter performance.
Experts and professionals noted that their priority is construction and the structural
requirements of shelters which are referring to durability under shelter performance. They
stated their priorities as the following; at first construction and structural elements must be
obtained from a local market for adapting the environment context and decreasing the high
cost of transferring, the second considering environment context (climate and land
conditions) which is referring to comfort, dignity and identity consideration is the third
priority which relate to social context, other priorities varied between stability, safety and
security, and independent constant energy. Responsible institutions noted that the first
priority was management control (cost and time) which relates to settlement implementation
which is outside the research criteria, considering background diversity is the second priority
which refers to social context, the third priority is environment context (climate and land
conditions) under comfort, then stability, safety and security, shelter performance and
independent constant energy are the next other priorities that fluctuated depending on the
context situation.
In summary, the refugees’ requirements pay more attention to social and cultural difficulties
and shelter performance than other stakeholders’ requirements. Some interesting points to
humanitarian organizations are the same as the priorities of refugees’ requirements;
humanitarian organizations have direct contact with refugees and are involved in their stories
due to their position in the field. The quality of production, the absence of standardized
supervision, local market forces and obtaining financial benefits for local manufacturing
companies. Regarding considering the social network, local manufacturers have a subjective
understanding that refugees must go back home and units are adequate for a short period of
time.
5. PREVIOUS STUDIES
Humanitarian organizations and other involved institutions are concerned with delivering
shelters for large numbers of people. Crawford, Manfield and McRobie (2005) point out that
the main concern is to provide shelters for large numbers of refugees within a limited time
even though recent examples show that shelters are slow to develop and often inadequate for
occupation.
Davis (1978 cited in Hadafi & Fallahi, 2010) that refugees need to be accommodated
immediately in an emergency or temporary shelter as a quick response to their situation at
relatively short notice. Emergency shelters are often provided in the form of tents which can
last for up to two years, if facing changing weather conditions (Jabr, 1989). After this time,
refugees should be moved to semi-permanent or permanent prefab shelters. A variety of
strategies have been employed in pre-disaster and post-disaster programmes, including
industry based on standardisation, repetition and a single technology, while the informal
sector leads to variety, multiplicity and a combination of structural technologies (Lizarralde
& Root, 2007).

920
At the beginning, refugees need shelters as the immediate environment of family life and
daily activities. It provides protection and security, personal safety, and access to services
such as clean water and sanitation (Hadafi et al., 2010). Shelter is referred to in many
different ways but all have the same meaning; emergency shelter, temporary shelter,
temporary housing or dwellings, recovery and reconstruction housing. All these refer to
protecting people who have faced unpredictable situations. Temporary shelters provide places
for a limited stay for refugees until they move to permanent accommodation. Problems arise
when people stay beyond the life of the temporary shelter which cannot function under the
climate difficulties and structural limitations. A United Nation [UN] (2006) points out that as
well as providing immediate shelter, a shelter must consider the importance of adaptation
within a host community. Verderber (2001) discusses four levels of providing shelters, each
of which has programming implications for design and urban organizations. The first level is
the provision of shelters in up to seven days; the second level is provision between 30 to 60
days and the third level is a transitional shelter that may be established on a destroyed site or
near to the host community and which exists up to one year. The fourth level is a permanent
shelter which is not acceptable to the local community in most cases.
The recent approach to providing shelters was as a transitional shelter, as developed by the
Shelter Center. The approach to the transitional shelter as described by Corsellis is to
improve a temporary shelter from plastic sheet to sustainable local materials until the
reconstruction of destroyed houses is complete. Life of between two to five years means it is
more durable than tents which last no more than 12 months (Corsellis et al., 2005).With
regards to the transitional shelter, Corsellis and Johan, who created an IKEA T-shelter, stated
during an interview that there was a difference between the prototype and the product. There
were 45 developed shelters in the UNHCR alone and the challenge was to develop the
prototype through establishing a process, involving a non-stop design process. However, the
examples established to accommodate affected people were presented as a prototype for
certain circumstances rather than global concerns.
Thus, several examples are developed for accommodating affected people each year, which
are discussed, yet there are many others that are not discussed, however, most of these
examples provide solutions for certain circumstances considering cost and time factors, but
there is a limitation in terms of offering adequate accommodation. Additionally, although
agencies present guides and standards in reports for providing shelters, inappropriate shelters
are often the result due to the lack of their understanding of users’ needs.
Data has been compiled from the results analysis for stakeholders throughout the
methodology phases. It shows different concerns for each group (local governments,
refugees, humanitarian organizations, local manufacturing companies, responsible institutions
and experts). Such differences depend on the interest and points of view regarding the
problem of dwelling refugees in hot dry climates.
6. METHODOLGY
An anticipated, the paper adopts a Design Science (DS) method to describe and develop a
new opportunity of understanding the world that can help people to obtain their needs.
Design science is a new area in the Information system (IS) which aims to create novel ideas,
methods, models or other opportunities to solve practical problem of broad interest and
support its knowledge under (IS).

921
Saunders, Lewis, and Thornhill (2009) mentioned that design science aim is to develop an
artefact by valid knowledge to support solving the problem in the context. Design science
method tries to create something that in purpose of human needs, in this regard it is a solution
oriented in considering human activities, and design science is key feature applied to link
between theoretical aspects and a solution in the field. Also, the paper presents design science
with considering clarification the application of design science activities on the research
besides the reasoning behind using design science rather than other behavioral science in
terms of methodology to achieve the research aim.
Many empirical research methods describe, explain and predict the world, whereas Design
Science goes further by seeking change, improvement and the creation of new worlds. Design
Science can produce a solution to practical problems of general interest while maintaining the
rigour of an empirical study. The following section will discuss design science method
besides justifying design science method comparing with other research methods where the
research considers the reliability and validity of such method regarding collecting data and
iteration process.
6.1. The Design Science Activities
The paper follows the techniques of design science method. Techniques differ between
design science phases and that depends on the purpose of each phase and the goal that the
paper would be achieved by the researcher. Johannsson and Perjons (2012) points out the
researcher needs to determine which technique and tools are appropriate to produce
knowledge needed for global practice and get the result discussed and evaluated, for this
reason researchers use design science to determine appropriate tools and techniques
applicable for each activity of design science to get sufficient knowledge and results. Design
science method includes five phases which are; explicate problem, outline requirements and
define artefact, develop artefact, demonstrate artefact and evaluate artefact. In this regards,
the performance specifications is the means of artefact that is formulated by research criteria
from phase one, then outline stakeholders’ requirements from the field in the phase two.
Developing and demonstrating performance specifications are followed in phase three and
four respectively and finally evaluating phase by involving local architects to illustrate design
proposals of refuges shelters based on understanding the list of performance specifications
and validate feasibility of using performance specifications in dwelling refugees.
The research techniques included interviews and questionnaires regarding the design science
phases as follows:
Phase one aims to explicate the problem and it conducts a literature review of
previous studies to define and clarify the problem.
Phase two is to define the requirements of the problem, in this activity, the researcher
conducted informal interviews, in-depth interviews. The informal interview was with
local government in the Al Za’atari camp to explain the context of refugees besides
allowing her to formulate and design questions for the next step in phase two. In-
depth interviews and structured interviews were conducted, where the former was
with 29 refugees in their context to focus on their needs and requirements in the
context where the result of interviews was continuous with the latter technique with
147 refugees for explaining the connection between refugees’ needs and settlement

922
challenges variables. In the same phase the researcher lead in-depth interviews with
local humanitarian organizations in Al Za’atari camp, also the researcher conducted in
depth interviews with local prefabricated manufacturing companies to explain the
ability of shelter performance, challenges and barriers faced this field regarding the
refugees’ situation. All steps in this phase led to formulating and defining the list of
requirements of stakeholders to develop the list of performance specifications to
provide adequate refugee shelters in a hot dry climate.
Phase three was developing the list of performance specifications for refugee
requirements and considering the output of literature review and other stakeholders.
Phase four aimed to demonstrate the requirements; in-depth interviews were
conducted with 31 participants, including experts, professionals, architects, engineers,
and researchers. This provided the benefit to reformulate the specifications list
regarding the iteration process of design science.
Phase five was the evaluating phase where the researcher presented the specifications
list to 7 architects that are not involved in dwelling refugees and allowed for
illustration of the performance specifications list to validate the defined requirements.
The contributors were selected by the researcher based on three conditions; the first was that
they had to possess a wide knowledge of refugee situations concerning their needs and
challenges regarding the environmental impact (in a hot dry climate), social need and shelter
implementation. The second condition that the phase requires to choose certain participants to
obtain the aims of the phase, the last condition was all of the participants are part of
accommodating refugees in camps whether they are the main stakeholders such as refugees
or because of their experiences in this field, to improve and implement refugee shelters, such
as researchers, architects and NGOs.
7. JUSTIFICATION OF USING DESIGN SCIENCE
Many factors are involved in the production of a solution for the settlement of refugees in a
new community, and this is a crucial challenge for humanitarian organizations, local
institutions and local governments. Previous studies have shown that most shelter practices
suggested several solutions in terms of prototypes that could implement design performance
or urban planning strategy, however, there is an absence of solution that combines
stakeholder requirements and as a result it produces a number of prototypes without
considering a process. Turner (2011) discussed developing an artefact (which is the
performance specifications list) occurs throughout the design science method that provides
the process and connections between many factors in one process where the other research
methods do not offer the opportunity of iteration in the development process (Johannesson et
al., 2012).
The paper conducts the design science approach and follows the process to achieve the
proposed solution of formulating performance specifications for refugees’ shelters in a hot
dry climate. The design science method was selected for the following reasons;
Most academic research on refugees’ studies currently point to an understanding of
the refugees’ situation with less attention to innovate a proposed solution that might
present challenges. Unclear evidence is presented in the literature about the use of

923
design science as a method to producing an original solution to the problem (Dresch,
Lacerda, & Antunes 2014).
Unlike behavioral science research, design science is solution oriented, so the result
comes from a scientific understanding of the theory and practical problems in the
relevant field and involving people in the solution which is driven through an
iterative design cycle of data collection and analysis (Wieringa, 2013).
Many research strategies have been conducted to achieve the research aims,
objectives and results, although there are similarities between design science and
other strategies including the case study and action research approaches. However,
the difference appears in term of the whole process of design cycle as a main
variance, clearly interpretivists’ perspective show hermeneutic as cycle of design and
documentation text of the researcher in certain point of the field (Bryman, 2012).
In summary, design science investigates the reality of the problem and offers a practical
understanding of the gaps between theoretical academic research discipline and the practical
field. Purao (2002) discussed that natural science research stands on existing and emerging
phenomena without effect on phenomenon and the barriers to delivering an original solution
for general interest which is appropriate to refugees’ situation as general interest around the
world.
8. LESSONS LEARNED
The lessons learned are from the paper supported by literature and field work which included
interviewed refugees, humanitarian organization members and experts. The broad findings of
the paper showed gaps of understanding users’ needs from one side and standardization of
such needs in different cases by humanitarian organizations on the other side. Humanitarian
organizations have formulated reports or annual reviews with lessons learned that are rigid to
add new knowledge and updating the lessons. Drawing from all the evidence gathered
through the research, it can be concluded that:
1. It is difficult to find a balance between financial viability that leads to standardized
solutions, and community needs, that require a customized and tailored response,
however a good balance is paramount in order to avoid situations of discomfort in
living conditions.
2. Overcoming the rigidity of the current shelter performance is essential to fill the gap
of the variances between shelter elements, users’ requirements and camp layout.
3. Donors’ awareness on the actual refugees’ specific needs should be elicited by
humanitarian organizations.
4. Lack of integration between social and physical well-being in shelter negatively
influences users’ daily activities and leads to social instability.
5. Shifting from the shelter to the camp is often a merely quantitative issue, while more
attention should be paid to the social dimension of the camp.
6. It is still possible to design an architectural prototype that meets both the requirements
of the producers and the needs of the users.

924
Different prioritizations between stakeholders meant it was difficult to confirm one standard
list, besides the difficulties to confirm a social framework. The interpretation of local policy
and rigid annual reviews of humanitarian organizations leads to a top down strategy which
mitigates providing users’ the right of self-settlement, to contribute to a bottom-up strategy
throughout the duration of stay allows users to be involved in the process of choosing a way
of life and allocating shelters within a plot inside a camp. This thesis can address lessons
learned by contributing to knowledge that impacts on housing refugees with better
circumstances.
9. CONCLUSION
The paper highlights challenges in providing refugees with shelters in a hot dry climate. It
serves through perception gaps between the literature review and primary data that support
stakeholders to face challenges. In this regard, the paper links between theoretical stance and
practical solutions filled through the design science method. The connection between two
approaches (theoretical and practical) gives a foundation to improve performance
specifications that might be a solution for the settlement of refugees globally. The broad
principles and guides of establishing refugee shelters which were shown in reviewing the
literature led the paper to comprehensive understanding, it is impossible supporting technical
or engineering issues through following such general perspectives already used by
organizations, so the theoretical knowledge is constructed by an absence of the concept of
performance specifications, while connecting between physical, technical approaches and
social and cultural meanings, in this regard the research developed performance
specifications with take into consideration different social directions in the context. Thus,
such flexibility of presentation is what people need in the same list of specifications
depending on the local context and environment conditions as another identification of
theoretical contribution.
Adoption of the design science method allows the field work providing unique insights into
connecting the theoretical and the practical parts in the process of producing refugee shelters
in terms of building, testing and demonstrating prototypes kept a balance between all needs
of stakeholders and specifically users’ needs. This led to highlighting the gap of awareness
about stakeholders’ prioritizations which is another key issue of considering appropriate
solutions for refugee shelters not just producing a prototype.The paper contains a general
approach by developing the performance specifications list and to maximize the impact of the
research findings, the conclusions are complemented by a set of lessons learned targeted to
decision makers involved in the process of providing refugees with shelters in hot dry
climates.
10. REFERENCES
Alderfer, C. P. (1969). An empirical test of a new theory of human needs. Organizational Behavior and Human
Performance, 4(2), 142-175. doi: http://dx.doi.org/10.1016/0030-5073(69)90004-X.
Bryman, A. (2012). Social research methods. London: Oxford university press.
Corsellis, T., & Vitale, A. (2005). Transitional settlement: Displaced populations. London: Oxfam Publishing.
Crawford, C., Manfield, P., & McRobie, A. (2005). Assessing the thermal performance of an emergency shelter
system. Energy and Buildings, 37(5), 471-483. doi: http://dx.doi.org/10.1016/j.enbuild.2004.09.001
Davis, I. (1978). Shelter after disaster. London: Oxford Polytechnic Press.
Dresch, A., Lacerda, D. P., & Antunes Jr, J. A. V. (2014). Design science research: A method for science and
technology advancement. Switzerland: Springer.

925
Duncan, M. K. W. (2011). Understanding Hospitality House Guests' Needs: A Brief Case Report. Journal of
Pediatric Nursing, 26(4), 332-333. doi: http://dx.doi.org/10.1016/j.pedn.2010.04.006
Eastmond, M. (2015). Refugees in Anthropology, 2nd ed. In (pp. International Encyclopedia of Social &
Behavioral Sciences 2nd Edition James D. Wright, Editor-in-Chief).
Fuchs, M., Stark, T., Zeumer, M., & Hegger, M. (2012). Energy manual: sustainable architecture. München:
Birkhäuser
Hadafi, F., & Fallahi, A. (2010). Temporary housing respond to disasters in developing countries-case study:
Iran-Ardabil and Lorestan province earthquakes. World Academy of Science, Engineering and Technology,
66. 1536-1542.
Heywood, F. (2004). Understanding Needs: A Starting Point for Quality. Housing Studies, 19(5), 709-726. doi:
http://www.tandfonline.com/loi/chos20
Jabr, H. (1989). Housing Conditions in the Refugee Camps of the West Bank. Journal of Refugee Studies, 2(1),
75-87. doi: 10.1093/jrs/2.1.75
Johannesson, P., & Perjons, E. (2012). A design science primer. United States: CreateSpace Independent
Publishing Platform.
Kenrick, D. T., Griskevicius, V., Neuberg, S. L., & Schaller, M. (2010). Renovating the Pyramid of Needs:
Contemporary Extensions Built Upon Ancient Foundations. Perspectives on Psychological Science, 5(3),
292-314. doi: 10.1177/1745691610369469
Kesebir, S., Graham, J., & Oishi, S. (2010). A Theory of Human Needs Should Be Human-Centered, Not
Animal-Centered: Commentary on Kenrick et al. (2010). Perspectives on Psychological Science, 5(3), 315-
319. doi: 10.1177/1745691610369470
Lambo, I. (2012). In the shelter of each other: notions of home and belonging amongst Somali refugees in
Nairobi, in new issues in refugee research. Policy Development and Evaluation Service. UNHCR.
Retrieved from httpp://www.unhcr.org/4face3d09.pdf
Lizarralde, G., & Root, D. (2007). Ready-made shacks learning from the informal sector to meet housing needs
in South Africa. CIB World Building Congress, 87, 2068-2082
Maak, N. (2015). Living complex from Zombie city to the new communal. Berlin: Hirmer Publishing.
Purao, S. (2002). Design research in the technology of information systems: Truth or dare. GSU Department of
CIS Working Paper. Atlanta: Georgia State University.
Saunders, M., Lewis, P., & Thornhill, A. (2009). Research methods for business students. England: Pearson
Education Ltd.
Turner, R. (2011). Specification. Minds & Machines, 21(2), 135-152. doi: 10.1007/s11023-011-9239-x
United Nation. (2006). Exploring Key Changes and Developments in Post- Disaster Settlement, Shelter and
Housing, 1982-2006: Scoping Study to inform the Revision of "Shelter after Disaster: Guidelines for
Assistance". UN. Retrieved from http://www.alnap.org/resource/11484
United Nations High Commissioner for Refugees. (2013a). Displacement. The new 21st Century Challenge.
Geneva: UNHCR global trends. Retrieved from
http://unhcr.org/globaltrendsjune2013/UNHCR%20GLOBAL%20TRENDS%20 2012_V05.pdf
United Nations High Commissioner for Refugees. (2013b). Shelter and Settlement Strategy Syrian refugee
crisis. Jordan: Shelter working Group Office. Retrieved from http://reliefweb.int/
United Nations High Commissioner for Refugees. (2014-2015). Middle East and North Africa. UNHCR Global
Appeal. Retrieved from http://www.unhcr.org/publications/fundraising/528a0a190/unhcr-global-appeal-
2014-2015-middle-east-north-africa-mena-regional-summary.html
Verderber, S. (2001). Recent trends in the design of shelters for victims of domestic violence. Loyola Law
Review, 47. 457-470.
Wieringa, R. (Director) (2013). Introduction to design science methodology [Slide Show]. Unknown: Unknown.
Retrieved from https://refsq.org/wp-content/uploads/2013/05/Wieringa-2013-REFSQ-DS-Introduction-to-
design-science-methodology-slides.pdf
Zavei, S. J. A. P., & Jusan, M. M. (2012). Exploring Housing Attributes Selection based on Maslow's Hierarchy
of Needs. Procedia - Social and Behavioral Sciences, 42(0), 311-319. doi:
http://dx.doi.org/10.1016/j.sbspro.2012.04.195

926
ID 126
ENHANCING DISASTER RISK TRANSFER AND SHARING IN THE
BUILT ENVIRONMENT THROUGH CONSTRUCTION CONTRACTS
V. Nguyen, D. Greenwood and K. Ginige
Faculty of Engineering and Environment, Northumbria University, 2 Ellison Pl, NE1 8ST, UK
Email: [email protected]
Abstract: Reducing the financial impact of natural disasters and extreme weather events
(NDEWE) on governments and societies through the mechanisms for disaster risk transfer and
sharing for both public and private investment has been emphasized as a vital and critical
element by Sendai Framework for Disaster Risk Reduction 2015 – 2030. The entire built
environment, which contributes around 50% of Gross Domestic Capital Formation across
most developed countries and facilitates the functions of the society, is one that is directly
exposed and most susceptible to NDEWE. The increasing pattern of NDEWE witnessed over
the recent times prompts the importance of achieving the optimum response to the impact of
NDEWE-related risks on construction projects. The normal vehicle for doing this is the
construction contract: the commonly-used standard forms contain provisions for handling the
impact of NDEWE-related risks. However, not only do different standard forms of contract
deal with weather-related risks in different ways, there is a gap between these principles and
their application, which often involves subjectivity; hence uncertainty. A review of the
literature reveals that the principles of NDEWE-related risk allocation within construction
contracts appears, at first sight, to be reasonable and straightforward. However, its
implementation remains problematic. The provisions of standard forms of contract are far
from easy to apply. Different standard forms of contract have presented numerous problems,
including the use of vague language to define adverse weather conditions, and exclusion of
important factors necessary for precise weather analysis. What is proposed is a guidance
protocol as a means by which contracting parties can limit the need for subjectivity; hence
reduce uncertainty, and thereby avoid unnecessary efforts, disputes and their associated costs.
Such a protocol would integrate disaster risk reduction into the construction projects in a more
efficient and effective manner. This paper is compiled based on the desk study of the initial
stage of a PhD research that aims to develop a framework to integrate disaster risk reduction
more effectively into the built environment.
Keywords: Built Environment; Construction Contract; Extreme Weather Event; Disaster Risk
Management; Natural disaster.
1. INTRODUCTION
Climate change has become one of the major challenges faced by countries worldwide.
Recent years have witnessed a noticeable increase in both frequency and intensity of the
phenomena of climate change. An example is the occurrence of natural disasters and extreme
weather events (NDEWE). Therefore, reducing the financial impact of NDEWE on
governments and societies through the mechanism for risk transfer and sharing for both
public and private investment has been emphasised as a vital and critical element by Sendai
Framework for Disaster Risk Reduction 2015 – 2030 (UNISDR, 2015).
The built environment sector (i.e. the industries that create the built environment) typically
contributes about 50% of Gross Fixed Capital Formation in most developed countries; a
figure which increases in less-developed economies. It is also one that is directly exposed to,
and most susceptible to NDEWEs. In construction projects, NDEWEs can result in work

927
delays, cost overruns, disruption and also conflicts and legal disputes between project parties
(Baldwin, 1971; Laufer and Cohenca, 1990; El-Razek, 2008; Nguyen, 2010). In response, a
variety of risk management tools and strategies are normally adopted. These include buying
insurance and sharing or transferring risk to other parties via appropriate contract terms and
conditions.
Contracts are considered to be one of the most effective method for dealing with risk and
uncertainty, and for reducing claims and disputes since they outline and define roles,
relationships, rights and obligations between parties (Shapiro, 2013). To this extent,
construction contracts potentially offer an important means by which impacts of NDEWEs
can be minimised and mitigated via rational negotiation of risk transfer and risk sharing terms
and conditions. However, different forms of contracts deal with NDEWE-related risks in
different ways and the risk allocation within construction projects in practice is intrinsically
problematic.
This study proposes a new approach to dealing with NDEWE-related risks through contracts.
The paper begins with a review of the related literature to explore current NDEWE-related
risk allocation in construction contracts, its efficacy and residual problems of NDEWE-
related risk transfer and sharing among contracting parties. It then proposes an outline
solution that addresses what are perceived to be the shortcomings of current practice. Finally,
a protocol is proposed, that would overcome the problems that exist between the interpreting
and understanding the broad principles of risk allocation of NDEWE-related risks, as they
exist in most standard forms of construction contract, and their application to specific
instances as they occur in actual construction projects. The aim of such an approach would be
to minimise subjectivity, uncertainty and ambiguity, thus creating more efficiency in the
forming of contractual agreements.
2. PRINCIPLES OF TRANSFERING AND SHARING OF NDEWE-RELATED
RISKS
2.1 NDEWE-related risk allocation: theory versus reality
No construction project is risk free. Risks can be specific to the project, its location and the
availability of information, especially when the risk comes down to the question of weather
systems (storm, typhoon, hurricane, flood, for example), and geological phenomena such as
volcanic eruptions and earthquakes (Ling and Hoi, 2006). The fundamental principles of risk
allocation and issues regarding to the transfer and sharing of risk are widely discussed.
However, when it comes to applying these principles, for example, in the case of NDEWE-
related risks in construction, there has been less published work. It is commonly accepted that
risks should sit with the party that has the best capability to control and manage them
(Cooper, 2005; Xu, 2010). Risks that are beyond the control of contracting parties, such as
NDEWE, should best be shared (Groton and Smith, 2010). Some risks are unavoidable and
can hardly be ever eliminated (Loosemore and McCarthy, 2008). Instead, they can only be
transferred to another party or shared, based on relevant contractual terms and conditions
(Andi, 2006). Such transfer and sharing of risk should be done in an effective manner as this
has a crucial impact upon construction costs (Yates and Sashegyi, 2001). Nonetheless, risk is
often indiscriminately allocated to parties that do not hold the best control capabilities
(Waldron, 2011; Sharkey, 2014). Contractors are parties that perform the most tasks in
delivery of projects, meanwhile they are also in charge of the majority of risks, including
those pertaining to NDEWE (Akintoye, 2003). A contract can be perceived as a trade-off

928
between the contractor’s bid price for executing the work and their willingness to carry all
manageable and unmanageable risks that have been assigned to them (Flanagan and Norman,
1993). The allocation of risk is therefore one of the most significant decision-making
processes in support of successful delivery of construction projects.
In reality, a contract is normally compiled or established by the 'employer' or 'owner", which
is the party initiating a project (Yates and Sashegyi, 2011). Consequently, the employer leans
towards allocating more risks to the contractor by intentional adjustments to standard forms
of contract with the expectation that the contractors are competent to manage the risk (Groton
and Smith, 2010; Waldron, 2011). Such perception correspondingly forces the contractors to
enter the tendering process in a reactive mode and input higher amounts of contingency to
their bid price for the purpose of minimising their risk liability (Andi, 2006).
2.2 Risk allocation models and their implementation in practice
The goal of risk management in construction is not only to diminish the total cost of risks to a
project, but also to minimise the costs to each party separately following a contractual
agreement (CII, 1993). The toughest task is determining how risks, including those related to
NDEWE, can be efficiently allocated to achieve such goal upon the completion of the project.
Over 20 years ago, Thompson and Perry (1992) observed that, despite the availability of
various models as well as standard packages of general conditions of contract, the principles
used to establish the risk allocations in these contract documents were not been explicitly
stated. It is arguably the case that little has changed. Furthermore, the nature and extent of
risks have a considerable element of subjectivity to them, varying from project to project and
circumstance to circumstance. This makes standard form of contracts tend to be inappropriate
in the high-risk scenarios of modern construction and multi-disciplined complex projects due
to increased complexity and shorter delivery times. In the other words, the utilisation of
tailor-made contract strategies is believed to be more suitable and desirable (Rahman and
Kumaraswamy, 2002).
Hitherto, there has been a variety of risk allocation principles developed by a number of
researchers, which the transfer and sharing of NDEWE-related risks can follow. These
include work by Casey (1979), Kuesel (1979), Barnes (1979), Abrahamson (1984), and
Thompson and Perry (1992). These principles are said to be an essential platform for
allocating risks, which is useful to avoid bias in making decision and correspondingly
beneficial to both employers and contractors (Grove, 1998). However, in common with a
majority of management doctrines, all of these risk allocation principles are normally
expressed in natural language, which makes their actual application become ambiguous. This
leads to final decisions that rely substantially on the qualitative judgement and experience of
construction professionals. In fact, the attitude of the project parties together with bias
existing in personal perception and judgment may produce substantial variations on the
decision outcomes (Barnes, 1979; Lam, 2007).
In contrast to the qualitative approach, Lam (2007) suggests an alternative principle for
allocating risks in a more efficient manner by the use of a prototypic quantitative model.
Lam's proposed model demonstrates its ability to extract and transform vague linguistic
principles and experiential expert knowledge into a more viable quantitative analysis. In
context of NDEWE, this provides a number of advantages, in that an explicit and systematic
framework to support distribute NDEWE-related risks is utilised rather than a prejudiced and

929
undetectable approach built upon individual’s expert judgement. In addition, the allocation of
risks is examined in a more fundamental way based on accepted principles rather than simply
adopting standard clauses of construction contract without considering the rationale behind
them. Importantly, recommendation from the model has shown the consistency with the
contracting practice as NDEWE are conventionally treated as a shared risk in most
contractual arrangements.
Besides Lam’s research, a number of other previous publications have also suggested
quantitative models of risk allocation (Jin and Doloi, 2008; Jin, 2009; Xu, 2010; Jin and
Zhang, 2011). In follow, Khazaeni (2012) developed a fuzzy ('TOPSIS') decision model
which accommodates a reasoned decision-support tool in order to achieve optimal allocation
of risks. Interestingly, unlike Lam’s original model, this improved version is able to consider
different parties simultaneously and can be applied flexibly to be appropriate with different
project contexts and contractual arrangements. Due to the inclusion of the objectives of all
the project parties, the ultimate outcome is argued to be more realistic and satisfactory to
them.
Despite the fact that there has been a broad industry experience with the principles of realistic
and equitable risk allocation, construction project employers have shown lack of progress in
adopting and applying recognised risk allocation framework, even as implementation
methodologies have been continuously upgraded. According to Groton and Smith (2010), the
main barrier that limits the implementation of better risk allocation practices being more
widespread is the difficulty in educating employers to the reality of risks in construction, as
well as the benefits that can be earned from the application of realistic risk allocation. In fact,
many employers are the least experienced stakeholders in construction projects, particularly
those that are occasional or even one-time participants. It is indisputable that the questions of
transferring and sharing NDEWE-related risks cannot escape from the aforementioned
problems in implementing proper risk allocation principles.
3. PROVISIONS FOR TRANSFER AND SHARING OF NDEWE-RELATED RISKS
IN STANDARD FORMS OF CONTRACT
According to the majority of standard forms of construction contract used in the UK, delays
caused by NDEWE are considered as being permissible but not compensable (Cobb, 2015),
which means the contractor is entitled to additional time and released from the imposition of
ascertained and liquidated damages, but not able to recover any direct loss and expense arisen
from the delay. Besides, there are some other forms of contract even exclude any extension of
time (EOT), which is GCWorks form for example, leading the contractor to bear the effects
of a potential natural hazard in its entirety.
Nevertheless, even EOT that relates to NDEWE is innately a problematic area. The most
dominant challenge lies with the definition of adverse weather, where the description for
distinguishing “normally” from “abnormally severe weather conditions” has remained
unclear (Nguyen, 2010). Additionally, Nguyen (2010) through his research on analysis of
adverse weather for excusable delays also reveals other fundamental points that typical
construction contracts may overlook, including weather thresholds, type of work, lingering
days and criteria for lost days.

930
The following sections present an overview of standard contract forms that are prevalently
used in the UK construction industry, including Joint Contract Tribunal (JCT), New
Engineering Contract 3 (NEC3) and International Federation of Consulting Engineers
(FIDIC) with regards to provisions of NDEWE-related risk allocation.
3.1 JCT Standard Building Contract and Sub-Contract Models
Under JCT suite of contracts, NDEWE can be found under the term “exceptionally adverse
weather conditions”. These are classified as ‘Relevant Events’ (i.e. under clause 2.29.10 in
JCT Standard Building Contract with Quantities 2011) which entitles the contractor to an
EOT for completion. However, as these events are not listed as one of the ‘Relevant Matters’,
the contractor is unable to claim payment for loss and expense originated from impact of
NDEWE disregarding to the extent of their severity.
However, exceptionally adverse weather conditions are not clearly defined by the JCT and
also there exists no universally accepted definition of what this important term really means
(Frame, 2010): whether the application for EOT under JCT contracts is successful depends on
the way that the denotation of exceptionally adverse weather conditions is ultimately decided,
subject to the discretion of the contract administrator (Wakefield, 2012).
In addition, ‘Relevant Events’ through the JCT forms of contract also includes loss and
damages originated from any events that are listed under force majeure. Yet, it would be a
real challenge for a contractor who sought an EOT under JCT contract by citing force
majeure. Despite the existence of the term ‘Force Majeure’, its meaning is effectively
restricted since events otherwise qualified to be within the force majeure definition are
specifically dealt with under separate headings (Williamson, 2012).
3.2 NEC3 Standard Building Contract and Sub-Contract Models
NDEWE, according to NEC3 contract family, can be considered as a ‘Compensation Event’
under clause 60, and specifically a force majeure event under clause 60.1 (19), which
provides the contractors with entitlement for additional time for the delay of construction
works, and payment to cover associated loss and damages (Danby, 2014).
The employer, at the tender stage, decides what types of measurements will be recorded,
where the weather measurements will be taken, who will be authorized to supply them and
against which local weather data in the history the measurements will be confronted. In the
UK construction industry, the default measurements of weather comprise cumulative rainfall,
the number of days with over-5mm rainfall, the number of days with less-than-0-degree-
Celcisus minimum ambient temperature, and the number of days with snow covering the
ground. In comparison to JCT, the NEC3, with its inclusion of such analysis, is seen as a
much more objective and prescriptive route (Tatham, 2011). However, these also reflect that
NEC3 contracts only deals with cold, snow and rain and excludes other types of weather
extremes, such as intensive wind, which have been proved to cause many collapsing crane
incidents across the UK (Eggleston, 2006).
In fact, NDEWE will only entitle the contractor to a compensation event if its related weather
measurement, which is recorded within a calendar month, shows that such phenomenon has
occurred less frequently than once in ten years. According to NEC3 contracts, only
931
exceptional adverse weather (with reference to weather measurement data) will be considered
(Evans, 2013). Consequently, this means that the contractor will suffer the risk of any bad
weather that cannot be proved to lie within the list of strict criteria constituting a
compensation event. In addition, an adverse weather condition under NEC3 contracts is only
measured based on calendar months. If the event lasts from a particular month to the
following one, the weather measurements accounted within each individual month may not
reach the level of adversity that qualifies a compensation event (Wakefield, 2012).
3.3 FIDIC Standard Building Contract and Sub-Contract Models
In FIDIC standard forms of contract, there are several clauses that provide platforms to deal
with NDEWE. In FIDIC Red Book, clause 8.4 states that risks pertaining to climatic
conditions are shared between the employer and the contractor, in that the employer will
allow an EOT if exceptionally adverse climatic conditions obstruct construction activities and
productivity of the contractor. However, like the JCT suite of contracts, this means that the
contractor will have to be responsible for relevant costs incurred due to such risks.
Nevertheless, in accordance with clause 17.3 and 17.4 in FIDIC Red Book, the contractor
possesses the entitlement to an EOT and also payment as cost compensation if any event
concerning unforeseeable natural forces occurs. These forces may consist of some climatic
conditions, especially when they turn out to be natural catastrophes, such as hurricane,
typhoon, etc. under clause 19.1 and 19.4 which deal with force majeure. In terms of other
natural catastrophes including earthquake and volcanic-related events, the risks are mainly
allocated to the employer under clause 19.1 and 19.2 (Zhang, 2006).
In short, it can be seen that the NDEWE-related risks are basically shared between the
employer and the contractor under FIDIC standard forms of contract. However, the problem
with regards to vague language remains the same as with JCT, with exclusion of guidance to
prescriptively define the term “exceptionally adverse climatic conditions”. In addition, a
contractor may find it confusing when differentiating “exceptional” from “unforeseeable”.
4 TRANSFERING NDEWE-RELATED RISKS TO INSURANCE
No discussion of risk transfer and sharing is complete without considerations of the role of
insurance. NDEWE-related risks can be shared with, or partially transferred to an insurance
company through appropriate terms and conditions. An insurance policy is perceived as a
contract whereby the insurance company promises to assume financial responsibility for a
specific loss and expense, or liability on behalf of another, who is commonly known as the
insured (Clough, 2015). However, insurance is regarded as the subject that has the least
attention during pre-contract negotiations due to the fact that the project parties at that stage
do not want to envision what might go wrong, and that they are questions which tend to be
passed to the professionals (Bellhouse and Walton, 2012). In practice, project insurance
procured should be tailored to meet the specific risk inherent to the work and the project’s
location (Boswall, 2005). It is beyond the scope of this paper to give an in-depth discussion
of insurance, but there are a few points that need to be mentioned.
Firstly, all risks are not covered. Coverage against storms, hurricanes and other types of
NDEWE such as earthquakes, varies with insurance provider and product: some policies do

932
not accommodate coverage for such losses at all, while others offer some level of protection
(SDV, 2015). Secondly, contractors' risk policies that specifically cover hurricane or named-
storm perils characteristically contain restriction on the available limits for associated losses
of such events by imposing another figure that is below the general coverage, or including a
greater amount of deductible (Roth and Kunreuther, 1998). Moreover, availability as well as
limitation for coverage of those NDEWE-related perils can also be influenced by geographic
region. For instance, areas with a significant number of insured events witnessed in the over
years, like Christchurch, New Zealand (in the case of earthquakes) the number of add-ons
that were formerly provided by insurance companies at low or no additional premium had
declined dramatically, and in several cases insurance is even unavailable (Bellhouse and
Walton, 2012). Lastly, provisions that contain a so-called 'anti concurrent cause clause' (i.e. a
policy provision that modifies cover when two or more causes occur concurrently) can have
an impact upon coverage of NDEWE-related damages and losses. For example, with regard
to a hurricane, the contractor according to such provisions, is not insured against losses in
occasions where an excluded peril such as water is associated with covered peril like wind to
result in a loss (SDV, 2015). In the other words, the anti-concurrent cause language is used
for the purpose of precluding coverage even if the excluded peril is not a proximate or
predominant cause.
Thus, despite the fact that insurance can bring about some reliefs for the insured in case of
occurrence of NDEWE, it should not be used and compromised as an opportunity to put aside
a forthright discussion about NDEWE-related risks, or abandon the procedures in the contract
for tackling with responsibility allocation and claims with regards to NDEWE, simply
because such risks are covered.
5. DISCUSSION, CONCLUSIONS AND FUTURE WORK
NDEWEs involve forces beyond the control of project parties and this makes them
particularly demanding of careful consideration. Project stakeholders usually employ various
strategies that include the transfer and sharing of NDEWE-related risks via contractual
provisions. According to standard forms of construction contract, including JCT, and FIDIC,
a majority of NDEWE-related risk is shared, in that the contractor is entitled to an EOT but is
not able to gain any additional payments to cover associated loss and damages, and the
employer recovers no liquidated damages. To this extent, the contractual practice expressly
reflects its similarity to a various realistic risk allocation principles developed by a number of
researchers.
The principle is straightforward but the provisions in standard forms of contract are also far
from easy to apply. Different standard forms of contract present numerous problems that
include the use of vague language to define adverse weather condition, and exclusion of
important factors needed for precise weather analysis. Furthermore, construction project
employers have shown reluctance in adopting risk allocation frameworks, and their tendency
is to pass risks to contractors wherever possible.
The ultimate aim of the study described within this paper is to supplement the standard
contractual approach to NDEWE-related risks through developing a protocol that would
overcome the problems of interpreting the broad principles of the standard contracts and their
application to specific instances in actual construction projects. The protocol should contain
the following elements:

933
NDEWEs must be explicitly defined. They must be linked with contractual provisions
through the inclusion of appropriate means of distinguishing the 'exceptional' from the
'normal' to systematically classify a particular event based on its intensity and potential
impact.
A preferred method of evaluating loss and damage resulting from NDEWEs should be
included. This should take into account all possible elements of the project, including
construction plans, machines, tools and equipment logs, materials and labour force
records, work schedules, etc.
Assessment and evaluation of NDEWE-related loss must be done in an objective manner,
possibly through the involvement of a third-party inspection.
The share of responsibility assigned to each side has to be explicitly determined for each
element of the project.
NDEWE-related delay analysis must be systematically approached and executed in order
to obtain reasonable EOT. This can be done by the inclusion of weather thresholds, types
of work, lingering days and criteria for lost days. It may also necessary to involve a third-
party to ensure proper judgement.
The aim of such an approach would be to minimise subjectivity, uncertainty and ambiguity,
thus creating more efficiency in the forming of contractual agreements.
6. REFERENCE
Abrahamson, M W (1984) Risk management. “International Construction Law Review”, 1(3), 241–264.
Andi (2006) The importance and allocation of risks in Indonesian construction projects. “Construction
Management Economics”, 24, 69–80
Akintoye, A, Beck, M and Hardcastle, C (2003) “Public-private partnerships managing risk and opportunities”.
1st ed. Oxford (UK): Blackwell Science Ltd.
Baldwin, J R, Manthei, J M, Rothbart, H, and Harris, R B (1971) Causes of delay in the construction industry.
“Journal of the Construction Division”, 97(2), 177–187.
Barnes, M (1983) How to allocate risks in construction contracts. “International Journal of Project
Management”, 1(1), 24–8.
Bellhouse, J and Walton, J (2012) Risk-avoidance, transfer acceptance or management. In: “International
Society of Construction Law conference”, May 2012, Melbourne. John G Walton.
Bosher, L. (2008) “Introduction: the need for built-in resilience”, in Bosher, L.S. (Ed.), Hazards and the Built
Environment: Attaining Built-in Resilience, London (UK): Taylor & Francis
Boswall, R G (2005) Builder’s Risk Insurance. Retrieved from
https://www.cwilson.com/publications/construction/builders-risk-insurance.pdf
Casey, J J (1979) Identification and nature of risks in construction project: a contractor’s perspective. In:
“Proceedings: construction risk and liability sharing conference”. Scottsdale (USA): American Society of
Civil Engineers, 17–24
CII (Construction Industry Institute) (1993) Allocation of insurance related risks and costs on construction
projects. University of Texas at Austin.
Clough, R H, Sears, G A, Sears, S K, Segner, R O and Rounds, J L (2015) “Construction contracting: A
practical guide to company management”. 8ed. New Jersey: John Wiley & Sons
Cobb, L (2015) Weather: A British obsession with financial consequences. Retrieved from
http://www.building.co.uk/professional/legal/weather-a-british-obsession-with-financial-
consequences/5073386.article
Cooper, D, Grey, S, Raymond, G and Walker, P (2005) “Project risk management guidelines: managing risk in
large projects and complex pro-curements”. Chippenham (UK): John Wiley & Sons, Ltd.

934
Eggleston, B (2006) “The NEC 3 Engineering & Construction Contract: A Commentary”. 2ed. Oxford:
Blackwell Publishing.
El-Razek, M E A, Bassioni, H A and Mobarak, A M (2008) Causes of delay in building construction projects in
Egypt. “Journal of Construction Engineering and Management”, 134(11), 831– 841.
Evans, S (2013) Whether the weather is fine, or whether the weather is a compensation event under NEC3.
Retrieved from http://www.stevencevans.com/whether-the-weather-is-fine-or-whether-the-weather-is-a-
compensation-event-under-nec3/
Flanagan, R and Norman, G (1999) “Risk management and construction”. UK: Blackwell Science. Ltd
Frame, S (2010) Contractual remedies for adverse weather. Retrieved from
http://www.lexology.com/library/detail.aspx?g=2bdd4446-a1e0-42b7-ac74-a1345b1afbca
Groton, J and Smith, R J (2010) Realistic Risk Allocation (CPR Dispute Prevention Briefing: Construction).
Retrieved from https://www.cpradr.org/resource-center/
Grove, J B (1998) “Consultant’s report on review of general conditions of contract for construction works for
the government of the Hong Kong special administrative region”. New York: Thelen Reid & Priest Lip.
Jin, X H (2009) Determinants of efficient risk allocation in privately financed public infrastructure projects in
Australia. “Journal of Construction Engineering and Management”, 136, 138–150.
Jin, X H and Doloi, H (2008) Interpreting risk allocation mechanism in public–private partnership projects: an
empirical study in a transaction cost economics perspective. “Construction Management Economics”, 26,
707–721.
Jin, X H and Zhang, G (2011) Modelling optimal risk allocation in PPP projects using artificial neural networks,
“International Journal of Project Management”, 29(5), 591-603.
Khazaeni, G, Khanzadi, M and Afshar, A (2012). Optimum risk allocation model for construction contracts:
Fuzzy TOPSIS approach. “Canadian Journal of Civil Engineering”, 39(7), 789–800.
Kuesel, T R (1979) Allocation of risks. In: “Proceedings: construction risk and liability sharing conference”.
Scottsdale (USA): American Society of Civil Engineers, 51–60.
Lam, K C, Wang, D, Lee, P T K and Tsang, Y T (2007) Modelling risk allocation decision in construction
contracts. “International Journal of Project Management”. 25, 485–493.
Laufer, A and Cohenca, D (1990) Factors affecting construction planning outcomes. “Journal of Construction
Engineering and Management”, 116(1), 135–156.
Ling, F Y Y and Hoi, L (2006) Risks faced by Singapore firms when undertaking construction projects in India.
“International Journal of Project Management”, 24, 261–270.
Loosemore, M and McCarthy, C S (2008) Perceptions of contractual risk allocation in construction supply
chains. “Journal of Professional Issues in Engineering Education and Practice”,134, 95–105.
Nguyen, L D, Kneppers, J, García de Soto, B and Ibbs, W (2010) Analysis of Adverse Weather for Excusable
Delays. “Journal of Construction Engineering and Management”, 136(12), 1258–1267.
Rahman, M M and Kumaraswamy, M M (2002) Risk management trends in the construction industry: moving
towards joint risk management. “Engineering Construction & Architectural Management”, 9(2), 131–151.
Roth Sr, R J and Kunreuther, H (1998) “Paying the price: The status and role of insurance against natural
disasters in the United States”. United States: Joseph Henry Press.
SDV (2015) Builders Risk Insurance: Weather-related Claims. Retrieved from http://www.sdvlaw.com/wp-
content/uploads/2015/04/Builders-Risk-Insurance-Weather-Related-Claims.pdf
Sharkey, J, Bell, M, Jocic, W and Marginean, R (2014) Standard forms of contract in the Australian construction
industry. Research Report, University of Melbourne.
Shapiro, B S (2013) Transferring Risks in Construction Contracts. Retrieved from http://www.shk.ca/wp-
content/uploads/2013/02/Transferring-Risks-in-Construction-Contracts-BSS.pdf
Tatham, D (2011) The cold war: NEC3 and adverse weather conditions. Retrieved from
http://ramskillmartin.co.uk/article/the-cold-war-nec3-and-adverse-weather-conditions/
Thompson, P and Perry, J (1992) “Engineering construction risks: a guide to project risk analysis and risk
management”. London (UK): Thomas Telford Ltd.
UNISDR (2015) 'The Sendai Framework' The World Conference on Disaster Risk Reduction, Sendai City,
Miyagi Prefecture, Japan. Retrieved from: http://www.unisdr.org/we/coordinate/sendai-framework
Wakefield, J (2012), Adverse weather conditions. Retrieved from
http://www.hklegal.co.uk/2012/01/05/adverse-weather-conditions/
Waldron, B (2011) Scope for improvement 2011 - Project risk getting the right balance and outcomes. Retrieved
from http://careers.blakedawson.com
Williamson, A (2012) Force majeure and construction contracts. In: “Meeting of Construction Law Society”, 7
February 2012, London. Society of Construction Law, 172-187.
Xu, Y, Chan, A P, Yeung, J F (2010) Developing a fuzzy risk allocation model for PPP projects in China.
“Journal of Construction Engineering and Management”. 136, 894–903.

935
Yates, A and Sashegyi, B (2001) Effective risk allocation in major projects: rhetoric or reality? "A survey on
risk allocation in major WA construction projects". East Perth: Institution of Engineers, Australia &
Chamber of Commerce and Industry of Western Australia.
Zhang, S, Zhang, L and Gao, Y (2006) A comparison of China’s Standard Form of Contract and FIDIC
Conditions of Contract for Construction. Retrieved from
http://fidic.org/sites/default/files/2%20zhang_risk_mgt_2006.pdf

936
ID 130
NATURAL HAZARDS AND BUILDING SKIN: SYSTEMATIC
LITERATURE REVIEW
M. Bigolin1, L.C. PINTO Da Silva Filho1 and H. Elkadi2
1 UFRGS, Brazil 2 School of the Built Environment, University of Salford, Salford M5 4WT, UK
Email: [email protected]
Abstract: This paper investigates the extent of research of the inter-relationship between
building skin and natural hazard. The paper explores the trends and identifies the research gaps
in this increasing field of concern. A total of 162 peer-reviewed papers published between
1984 to 2016 were systematically analysed and classified in the following research areas:
assessment of damages caused by natural events (field observations, field measurements,
laboratory measurements, innovative methodologies for measurements, analytical and
numerical modelling and cross studies) and new building skin technologies developed to
mitigate the impacts of those events. Additionally, the articles were organised chronologically,
their geographic location, and the building skin typologies. Results showed that the number of
building skin research related to the natural hazards has grown during the period of study; with
over 60% of all papers published since 2010. Earthquakes and storm were the most researched
themes followed by fire. Additionally, this review enabled concluded that, although there is a
great interest about buildings skin research in events of disaster, some important key gaps in
the knowledge still remains, especially about flood research. Based on the analysis, some
suggestions for further investigation to fulfil those gaps are provided.
Keywords: systematic review, disasters, building skin, climate change, natural hazard
1. INTRODUCTION
Natural events, such as flooding, earthquakes, tornados etc., causing damage and disruption
in urban environment, have increased environmental stress (Iyer & Mastorakis 2006).
According to the United Nations Office for Risk Reduction (2015), just in 2015, 346 disasters
connected with natural events were reported around the world. These frequent events caused,
at least, 23.000 fatalities affecting about 100 million people. Apart from the loss of lives and
physical damages, these disasters resulted in approximately USD 70 million in damage
during 2015 (CRED & OFDA, 2016).
Furthermore, these disasters occurred in high density built environment and thus increase the
number of victims and financial losses. In order to mitigate these problems and reduce loss of
lives and damages in buildings, a number of studies were developed several of them are
related to building skin. These studies have different approaches. A number of research
papers aim to investigate, measure and assess the resistance and damages caused for specific
disasters (Grayson et al. 2013; Spence et al. 2004; Rocha et al. 2011) while others aim to
introduce new materials, technologies or techniques to improve the performance to specific
or multiple disaster (Shetty et al. 2014; Pantelides & Truman 1996; Feng et al. 2012).
A building skin is crucial to performance in natural hazard (Pita et al. 2015). At the same
time, it is one of the most vulnerable parts of the building (Pantelides & Truman 1996). There
are various definition of a building skin; for instance: “A transition between inside and

937
outside – between the building and the urban space” (Schittich, 2010) or “A group of roof
and walls with partially or none structural purpose (Del Grosso & Basso 2010). In this paper,
a building skin is the area where different internal and external forces are interplay to
maintain a constant internal comfortable environmental conditions. Thus, the building skin
could be viewed as an important building system to be studied in an event of disasters.
Building skin have different functions: energy saving, natural ventilation insulation and sun
protection. Although, nowadays, they are more frequently associated to energy efficiency
besides the traditional function of lighting, glare, noise and fire protection (Del Grosso &
Basso 2010). Therefore, the design of a building skin requires multi criteria objectives and
trade-offs about the impacts on environment and the technologies assessed, economic and
aesthetic reason.
Several authors have reviewed the performance of building skin to different impacts. For
example, Minor (2005) reviewed damage documentation, insurance records and computer
simulation of building skin failure in windstorms. Sadineni et al. (2011) made a technical
review about the components of building skin and the improvements from an insulation
perspective. Blocken et al. (2013) presented an important state of the art about rainwater on
building facades. More recently, Mavrigiannaki & Ampatzi (2016) have presented a
systematic review of heat storage in buildings elements to cold climates. However, despite
practical experiences and methodological advances, there is no comprehensive literature
review that explores a holistic perspective about the impacts caused by natural hazard in
building skin.
It is believed that there is a need for a systematic survey to consolidate and synthesize
research conducted in this area. Therefore, this paper aims to provide a literature review
about papers regarding measurements and assessments of damages in building skin caused by
different natural hazard, seeking to assess emerging trends and identify issues for future
investigation. In addition, it attempts to provide a better understanding of the current status of
new technologies developed to mitigate the damages. With this review, it attempts to answer
the following questions:
1. which natural hazard are most often assigned to building skin in literature?
2. where was the research undertaken?
3. are these studies correlated with the occurrence historical natural hazard in this
locales?
4. which skin typologies are the most frequently studied?
5. which are the gaps of knowledge and which methodology is undertaken on the studies
related to each natural hazard?
It is important to highlight that this study do not intend to drawn any conclusion, but start a
discussion around the theme and find possible gaps. The remainder of this paper is structured
as follows. In Section 2, the selection of natural hazard adopted in this review are briefly
described. Section 3 outlines the search strategy and the methodology used to classify the
literature. Section 4 covers the discussion of the outcomes and provides answers to the
research questions. Finally, Section 5 presents concluding remarks, limitations and
assumptions that were taken into account at the beginning of the study, as well as
recommendations for further research.

938
2. NATURAL HAZARD
Hazard and Disaster do not have the same definition. The IPCC definition mentioned that a
hazard is “the potential occurrence of a natural or human-induced physical event that may
cause loss of life, injury, or other health impacts, as well as damage and loss to property,
infrastructure, livelihoods, service provision, and environmental resources”. A disaster in
other hand, takes place when a hazard (natural or man-made) interacts with the human
environment, especially in a vulnerable scenario (CEPED/RS-UFRGS 2016).
There are many definitions of disaster as many authors writing about it. A definition widely
accepted is presented by The United Nations Office for Risk Reduction that defines disaster
as “a serious disruption of the functioning of a community or a society involving widespread
human, material, economic or environmental losses and impacts, which exceeds the ability of
the affected community or society to cope using its own resources” (UNISDR, 2009).
There is no common agreement regarding the classification of disasters and the subdivision
typologies. Some researchers classify disasters in 5 categories: natural, unnatural or man-
made, purely social, technological and hybrid (Shaluf, 2007a). The Centre for Research on
Epidemiology of Disasters (CRED) classifies disasters in two groups: natural and
technological. In (Shaluf, 2007b) opinion on natural disasters, those events are resulting from
natural forces, where man has no control. However, the terminology of “natural disaster” is
continually used by some authors and by the media, it is not widely accepted. O’Keefe et al.
(1976) stated that the term ‘natural disaster’ was a misconception, and argue that disaster are
more consequence of socio-economic vulnerability and lack of preparedness than natural
factors. Therefore, it is more appropriate to use the term ‘natural hazard’ when talking about
earthquakes, droughts, floods, or storms, or ‘disasters’ when discussing a serious disruption
of the functioning of a community or a society as a result of an exposure to a hazard. A better
classification of disaster based on its root cause: geological, hydrological, meteorological,
climatologically and biological (CENAD, 2013), besides technological and human induced
threats. In this paper, this classification will be used to group the natural hazard, and the
chosen keywords are the events related in which group. It is important to highlight that the
events select are those who is believed affect in some instance the building skin.
3. FRAMEWORK FOR SYSTEMATIC LITERATURE REVIEW
3.1 Search strategy
A comprehensive literature review was undertaken, aiming to identify peer-reviewed papers
relating natural hazard to building skin. With this scope, the systematic quantitative approach
outlined in Pickering & Byrne (2014) was used, since this method is explicit, reproducible
and offers more insights than traditional narrative reviews. To ensure that potentially relevant
papers were not missed, five mayor library databases were systematically searched, including
Scopus, ProQuest, Science Direct, Emerald Insight, and Web of Science. Publications such as
doctoral dissertations, book chapters, reports, and conference proceedings were not taken into
account. Furthermore, only papers written in English were included. To find eligible papers
in the mentioned databases, Boolean functions were applied to combine the following
keywords, as show in Table 2:

939
Table 2: Keywords and Boolean functions
GROUP KEYWORDS KEYWORDS
Geological
Earthquake Earthquake*
Tsunami*
AND Envelope*
Façade*
Skin*
Volcanic
activity Volcan*
Mass
Movement Landslide* OR
Mudslide*Subsidence*
OR Avalanche*
Hydrological Flood Flood*
Meteorological
Storm
Storm* OR Hailstorm*
OR Blizzard*
Hurricane* OR
Tornado* OR Typhon*
Lightning*
Extreme
Temperature
Cold OR Snow
Heat* OR heatwave*
Climatologically Wildfire Fire* OR explosion*
Distinct combinations of these terms were used, taking into consideration the requirements of
each search engine. For example, some databases allowed search in “title, keywords and
abstract”, whereas others did not. Thus, different functions were applied for each database.
When possible, only the abstract, title, and keywords were searched. These criteria narrowed
the search and allowed excluding papers that mentions the keywords only in the references.
These queries elicited over 1900 potentially eligible references published between 1984 and
June 2016. At first, the title, abstract and keywords were screened manually to exclude
irrelevant references. After this pre-selection, the full-text of 242 select papers was revised in
detail. The paper was excluded if it was not specifically focused on building skin, or when the
disaster and the effect were not clear. At the end, 162 papers met all inclusion criteria and
were considered in the analysis.
The review covers articles published in 81 different journals, in several knowledge areas.
Journals with most papers were Engineering Structures, followed by Journal of Wind
Engineering and Industrial Aerodynamics, with 12 and 8 articles respectively. The remaining
journals account only for one or two published papers each.
3.2 Classification scheme
Following the selection, all included papers were classified according to some domains:
natural hazard, publication year, country of application, building typology, skin typology and
research aims, that include new technologies developed, and impact assessments (classified
in field observation, field measurements, laboratory measurements, and analytical and
numerical modelling). Regarding to natural hazard seven types were identified, as follows:
1. Earthquake: comprises the selection of studies that aim to investigate the effects of
earthquakes in building skin, as fissures and other damages, or new technologies developed

940
to support the seismic events. Among the keywords has also been included tsunami since had
been noted that the studies connected both subjects.
2. Volcanic activity: the papers in this class are mainly concerned with the damages
linked to the high temperatures of the ashes.
3. Mass Movement: mainly consists of papers about the assessment of potential damages
caused by soil subsidence and avalanches landslide or mudslide in building skin and
comprises the articles that investigate the structural problems.
4. Flood: refers to articles that assess the problems related to mechanical failure and
water infiltration besides mould and moisture issues
5. Storm: this group comprises all the articles related to hailstorms, blizzard, hurricanes,
tornados, typhoons and lightning. The concern was related to tightness problems and
structural failure.
6. Extreme temperature: refers to articles that assess the lack performance in thermal
comfort, when the building skin was under extreme cold or extreme hot temperatures.
7. Wildfire: the papers in this class are concerned with the behaviour of building skin
related to fire and explosion, as fire resistance and reaction and smoke characteristics.
4. ANALYSIS OF FINDINGS
This section presents a systematic analysis of 162 papers published between 1980 and June
2016, since this was the period of time that papers were find in the database consulted. The
papers have been analysed form a quantitative point of view at five different levels:
distribution by natural hazard, year of publication, geographic distribution, building skin
typology and research methodology. The aim of this analysis is to better understand the
maturity of the research topic from different points of view. The results are summarized in
various charts and tables that allow a visual comparison of the results.
4.1 Trends by natural hazard
The findings regarding the different natural hazards reveal that the most common event
related to building skin was earthquake with 33.3% of the articles selected. These studies
mainly focus in the damages that earthquakes can cause to building skin. A reason for this
type of hazard to be the most studied among the group may be a reflection of the maturity of
this field study on buildings. Also because, even moderate earthquakes, can cause important
disruptions in the function and security of building skin (Pantelides & Truman 1996).
The second most common disaster type was storm (32.7%) followed by fire with 18.4%.
Regarding the hazard type extreme temperature, just 8 papers were selected despite the large
number of papers selected during the first step of the research (1219 articles). This is because
the subjects about heat and cold associated to building skin have wide interest regarding to
thermal comfort and energy efficiency. However, when the articles related just about extreme
temperature and how this could be dangerous for users or damage to building skin were
selected, the number of papers were considerably reduced. Flood, volcano, and mass
movement presented a reduced number of papers, indicating gaps of research that could be
better explored of the building environment fields. Especially regarding to floods since this

941
kind of hazard is a challenge to all the river cities and are expected to increase due to climate
change (Liao 2012). In order to have a complete vision of works published through the group
types of natural hazard Error! Reference source not found. present the results of the two
teps of the research.
Table 3: Distribution of papers by natural hazard topic
Natural Hazard N° %
Earthquake 56 33.33
Storm 55 32.74
Fire 31 18.45
Extreme temperature 8 4.76
Flood 7 4.17
Volcano 3 1.79
Mass movement 2 1.19
Total 162 100
4.2 Trends by year of publication
In an attempt to model the evolution of the concern about buildings skin research related to
natural hazard in time, the data gathered was organized by year of publication (Error!
eference source not found.). This figure shows how there was a continued growth of the
number of every hazard types analysed, mainly in the last five years. In fact, over 60% of the
compiled papers have been published since 2010. A reason for the increasing number of
publications could be a reflection of a growing interest by the academia about how natural
hazard affect the built environment. Secondly, other factor is the increase of the information
and data analysed about the hazards. As an example the first papers about flood started after
2000, as presented in Error! Reference source not found..
0
1
2
3
4
5
6
7
8
9
10
11
12
1984 1986 1988 1990 1992 1994 1996 1998 2000 2002 2004 2006 2008 2010 2012 2014 2016
Intensity by year
Earthquake Volcano Flood Storm Mass movement Extreme temperature Fire
Figure 1: Number of papers published over the period 1982-2016.

942
The result analysis about the number of papers related with Storm and Earthquakes compared
with the number of disaster in time do not present a direct correlation, since the studies about
specific events can be taken even years after. However, had been noted that several of the
studies are indeed related to some specific event. As example, the consequences about the
hurricane Andrew of 1992, were reflected in the articles published in 1996 (Behr &
Kremer1996). Other example, is the 2009 L`Aquila earthquake that was focus of seven
different papers. The earliest of them was published 4 years after the disaster occurred
(Lucibello, Brandonisio et al. 2013, Bisegna, Ambrosini et al. 2014, Boscato, Pizzolato et al.
2014, Ferreira, Vicente et al. 2014, Gattulli, Lampis et al. 2014, Arcidiacono, Cimellaro et al.
2015, Mauro, de Felice et al. 2015).
4.3 Mapping geographic distribution
Totally, 30 countries have contributed to this survey (Figure 2: Distribution of papers by
country
), showing that the concern about natural hazard in the built environment is a global issue.
United States accounts for 26,19% of the overall publications. It is not surprising, especially
regarding to the studies about storms, in which this country present 58% of the papers
selected for this research. This is also explained because, in United States, storm events are
the most numerous kind of natural disasters reported (CRED & OFDA, 2016). Similar
approaches were also found regarding to volcanic activities. All the papers selected for this
hazard type were presented by Italy. This country has also a high participation in papers
about earthquakes, followed by United States and Australia.
Figure 2: Distribution of papers by country
However, it is understood that since this systematic review just take into account papers
written in English, this figure does not represent the full picture of research related to natural

943
hazard associated with building skin, but it is possible analysing the papers put some light on
this theme. As instance, South American countries, such as Brazil, Colombia and Venezuela,
which are severely affected by floods, were not represented among the selected papers in this
theme. About flood, the UK is the country which accounts for the highest participation. UK
and China were found to be prolific in studies about fire. Portugal had showed a important
concern about earthquakes. The results about this topic are summarized in the Figure 2:
Distribution of papers by country
.
4.4 Trends by building and skin typology
Building skin is an important subject in architecture and engineering research. Traditional
and new technologies have been constantly studying which concerns to performance and
durability. The papers selected in this review were classify according to building typology
(residential, commercial, educational, religious, etc.) and skin types analysed for each hazard
group. Several papers do not define any specific building or skin typology. Due to this fact,
some considerations could be made.
In the earthquake review, 28 papers (48,27%) discuss about masonry wall. Related to storm
the concern turn to roofs and glazing systems. Among the articles selected for Fire disaster,
several articles have been highlighted about double skin façade, and some about windows
themes, as geometry and glass resistance. Flood, extreme temperature and volcano types, do
not present any building skin type, also because the number of papers is reduced. In general,
the papers just analyse the damages caused by these disasters in different types of building
skin.
Regarding to building typology most of the papers analysed (69%) do not present a specific
building typology studied. From the remaining articles, 9 are about religious buildings related
to earthquakes and 18 papers are specific to residential building under storm.
4.5 Trends by methodology
Natural hazards are a concern for multiple research fields and the research about building
skin is a main area of interest in architecture and engineering. Research on building skin
associated with natural hazard could be performed by multiples assessment methods. In this
review, the papers report field observation, field measurements, laboratory measurements
analytical and numerical modelling, some cross studies (laboratory measurements and
analytical numerical modelling) and innovative methodologies for damages measurements
and innovative technologies to withstand disasters. The papers selected were classified into
these categories (Error! Reference source not found.), in order to provide a understanding
f the gaps and which sort of methodology is undertaken on building skin research related to
natural hazard. The analysis and methodologies undertaken was indicated for this review was
defined following the categories summarized and reported in Error! Reference source not
ound.. These categories define field observation, field measurements, until innovations that
was considerate the level when the problems related to the disaster are already well know and
is possible to develop new technologies to cope with this possible events.

944
The survey shows that more than 40% of the research into earthquakes and storm develop
analytical and numerical modelling. Surprisingly, the number of papers doing some type of
field analyses was not as high as expected. This in part may be explain, for the difficulties in
disaster research are where field works can be restricted to some point events, and not for
measures that you can take on a regular basis. Similar situation was found with flood and
extreme temperature types, that besides they have a reduced number of papers, they presented
analytical and numerical modelling papers.
Figure 3: Distribution of papers by application
This table enabled identify, although earthquakes and storms have a greater number of
papers, they have few papers about innovative technologies to cope with hazard. Therefore,
with the existent knowledge about earthquakes and storm risks related to building skin, there
is still have research opportunities to develop new technologies to withstand these hazards.
5. CONCLUSIONS
5.1 Summary and limitations
This study presented a systematic literature review of 162 papers about building skin research
related with natural hazard, aiming to provide an overall picture of the gaps of knowledge to
develop strength and resilient building skin. This concern has motivated researchers and
practitioners of 28 different countries over the past 32 years. The findings suggest an
increasing interest about all different hazard analysed in the last 10 years. A wide range of
analysis was identified, with most of the papers focusing on earthquake, storm and fire,
followed by extreme temperature, flood, volcano and mass movement. Surprisingly, the
number of papers related to flood was lower than expected, since this events are worldwide a
concern mostly in the built environment. Nearly 55% of the studies were conducted in four
countries: United States, China, Italy and United Kington. Most of the papers do not present a
specific building typology or present a specific building skin type as a focus of study.
However, several papers in earthquake group discuss about masonry problems and related to
fire and storm, the concern are focused in glass systems. Most of the papers about
earthquakes, storm and fire, performed analytical and numerical modelling, followed by
laboratory measurements. Overall, have been not finding a high number of field work studies,
what may can be explained by the eventuality characteristic of this research area.
Nevertheless, is important to highlight that this study aimed to identify just the papers in
English related to building skin; other building systems (structural, foundations, hydraulic
etc.) have not been included, also no other languages what could potentially change the
present results.
Field
observations
Field
measurements
Laboratory
measurements
Inovative
methodologies
for
measurements
Analytical and
numerical
modelling
Cross studies:
laboratory and
analytical/
numerial
Inovative
building skin
technologies
Critical review
Earthquake 8 3 12 0 25 5 3 0
Storm 7 4 13 0 23 1 4 3
Fire 3 2 12 1 9 1 3 0
Extreme temp. 0 1 2 0 5 0 0 0
Flood 2 0 1 1 3 0 0 0
Volcano 1 2 0 0 0 0 0 0
Mass Movement 2 0 0 0 0 0 0 0
TOTAL 23 12 40 2 65 7 10 3
1 2 3 4
NATURAL HAZARD

945
5.2 Recommendations for future research
This review enabled identifies key gaps in the knowledge about buildings skin research
related with natural hazard. First, there were, surprisingly, few studies that effectively
considered the impacts of natural hazard in building skin. Although earthquakes, storm and
fire events, have more papers, it could be assessed that these studies do not cover all areas of
the different existing building skin technologies. Besides that, there were just a few papers
discussing about innovative technologies to cope with hazard. Future research could focus in
developing new technologies based on the modelling and results already identified in the
literature.
Secondly, there were identified just a few papers about extreme temperature, although it is a
consolidated research field regarding to thermal comfort and energy efficiency. The papers
analysed discuss about the performance of the building skin regarding to insulation and
ventilation in cold and hot weather. But most of them do not consider future climate
projections. Even those studies about thermal comfort and energy efficiency that have
included some considerations, do not consider extreme temperatures. Innovative approaches
could focus in the analysis of better understanding the performance of the building skin to
extreme high temperatures, developing possible solutions for this scenario.
The third challenge, and perhaps the most relevant gap, refers to the studies regarding floods
since flood hazard is already a growing concern in many cities and it is the cause of many
damages, especially in densely built environments. Future research could be directed to
assess and measure the impacts of floods in the building skin, and additionally to develop
solutions for new materials and designs to mitigate or avoid the flood impacts in the building
interior and the building skin itself.
Although just a few papers were identified related to mass movement, flood and volcano,
even for the other natural hazard types, the number of papers identified do not represent
consolidated research fields. Besides to be a challenge, a change in this scenario is also
fundamental. Research regarding building skin related with natural h are important in a world
where the human population is increasing and more building will be necessary. Moreover, the
future climate predicts more stress and disasters, and the buildings need to withstand and be
resilient. This has been tackled in a recent study by Champagne & Aktas (2016) that set some
resilience requirements and indicate the importance of the building skin to develop buildings
that can withstand stress and be resilient.
6. ACKNOWLEDGEMENTS.
This work was supported by the Brazilian Coordination for the Improvement of Higher
Education Personnel (CAPES) through the grant 002-16-0.
7. REFERENCES
Arcidiacono, V., et al. (2015). "Analysis of the failure mechanisms of the basilica of Santa Maria di
Collemaggio during 2009 L’Aquila earthquake." Engineering Structures 99: 502-516.

946
Bisegna, F., et al. (2014). "A qualitative method for combining thermal imprints to emerging weak points of
ancient wall structures by passive infrared thermography – A case study." Journal of Cultural Heritage
15(2): 199-202.
Boscato, G., et al. (2014). "Seismic behaviour of a complex historical church in L'Aquila." International Journal
of Architectural Heritage 8(5): 718-757.
Blocken, B., Derome, D. & Carmeliet, J., 2013. Rainwater runoff from building facades : A review. Building
and Environment, 60, pp.339–361. Available at: http://dx.doi.org/10.1016/j.buildenv.2012.10.008.
CENAD (2013). Centro Nacional de Gerenciamento de Riscos e Desastres. Anuário Brasileiro de Desastres
Naturais: 2012. Available: http://www.mi.gov.br/c/document_library/get_file?uuid=fee4007a-ab0b-403e-
bb1a-8aa00385630b&groupId=10157
CRED and OFDA: EM-DAT International Disaster Database, available at: http://www.emdat.be/, last access: 15
June 2016.
Feng, R. et al., 2012. Nonlinear response spectra of cable net facades $. Soil Dynamics and Earthquake
Engineering, 32(1), pp.71–86. Available at: http://dx.doi.org/10.1016/j.soildyn.2011.08.006.
Ferreira, T. M., et al. (2014). "Seismic vulnerability assessment of masonry facade walls: Development,
application and validation of a new scoring method." Structural Engineering and Mechanics 50(4): 541-561.
Gattulli, V., et al. (2014). "Simulations of FRP reinforcement in masonry panels and application to a historic
facade." Engineering Structures 75: 604-618.
Grayson, J.M., Pang, W. & Schiff, S., 2013. Building envelope failure assessment framework for residential
communities subjected to hurricanes. Engineering Structures, 51, pp.245–258. Available at:
http://dx.doi.org/10.1016/j.engstruct.2013.01.027.
Del Grosso, a E. & Basso, P., 2010. Adaptive building skin structures. Smart Materials and Structures, 19(12),
p.124011.
Iyer, G. V & Mastorakis, N.S., 2006. Important elements of disaster management and mitigation and design and
development of a software tool. WSEAS Transactions on Environment and Development, 2(4), pp.263–
282.
Lucibello, G., et al. (2013). "Seismic damage and performance of Palazzo Centi after L’Aquila earthquake: A
paradigmatic case study of effectiveness of mechanical steel ties." Engineering Failure Analysis 34: 407-
430.
Mauro, A., et al. (2015). "The relative dynamic resilience of masonry collapse mechanisms." Engineering
Structures 85: 182-194.
Mavrigiannaki, A. & Ampatzi, E., 2016. Latent heat storage in building elements : A systematic review on
properties and contextual performance factors. Renewable and Sustainable Energy Reviews, 60, pp.852–
866. Available at: http://dx.doi.org/10.1016/j.rser.2016.01.115.
Minor, J.E., 2005. Lessons learned from failures of the building envelope in windstorms. Journal of
Architectural Engineering, 11(1), pp.10–13. Available at:
http://ascelibrary.org/doi/abs/10.1061/(ASCE)1076-
0431(2005)11:1(10)\nhttp://cms.asce.org/uploadedFiles/Communications-
NEW/Hurricane/Lessons_Learned_from_Failures_of_the_Building_Envelope_in_Windstorms.pdf.
O’Keefe, P., Westgate, K., Wisner, B., 1976. Taking the naturalness out of natural disasters. Nature 260, 566–
567. doi:10.1038/260566a0
Pantelides, C.P. & Truman, K.Z., 1996. Development of a loading history for seismic testing of architectural
glass in a shop-front wall system., 0141(12), pp.917–935.
Pickering, C. & Byrne, J., 2014. The benefits of publishing systematic quantitative literature reviews for PhD
candidates and other early-career researchers. Higher Education Research & Development, 33(3), pp.534–
548. Available at: http://www.tandfonline.com/doi/abs/10.1080/07294360.2013.841651.
Pita, G. et al., 2015. State of the Art of Hurricane Vulnerability Estimation Methods: A Review. Natural
Hazards Review, 16(2), p.04014022.
Rocha, D., Eamon, C.D. & Murphy, J.F., 2011. Reliability analysis of roof sheathing panels exposed to a
hurricane wind. Structural Safety, 33(1), pp.74–81. Available at:
http://dx.doi.org/10.1016/j.strusafe.2010.08.003.
Sadineni, S.B., Madala, S. & Boehm, R.F., 2011. Passive building energy savings: A review of building
envelope components. Renewable and Sustainable Energy Reviews, 15(8), pp.3617–3631. Available at:
http://dx.doi.org/10.1016/j.rser.2011.07.014.
Shaluf, I.M., 2007a. An overview on disasters. Disaster Prevention and Management, 16(5), pp.687–703.
Shaluf, I.M., 2007b. Disaster types. Disaster Prevention and Management, 16(5), pp.704–717.
Shetty, M.S. et al., 2014. Failure probability of laminated architectural glazing due to combined loading of wind
and debris impact. ENGINEERING FAILURE ANALYSIS, 36, pp.226–242. Available at:
http://dx.doi.org/10.1016/j.engfailanal.2013.10.005.

947
Spence, R.J.S., Baxter, P.J. & Zuccaro, G., 2004. Building vulnerability and human casualty estimation for a
pyroclastic £ ow : a model and its application to Vesuvius. , 133.
Schittich C 2001 In Detail: Building Skins—Concepts, Layers, Materials (Basel:Birkhauser)

948
MAPS-LED

949
ID 046
TOWARDS A NOVEL FRAMEWORK OF KEY PERFORMANCE
INDICATOR FOR MEASURING THE MPACTS OF SMART CITIES IN
EMERGING ECONOMIES
M. Aghbali, C. Trillo and T. Ferrnando
School of the Built Environment, University of Salford, Salford, M5 4WT, UK
Email: [email protected]
Abstract: Smart Cities take advantage of innovative technologies to improve city-
administration, increase the level of interactivity and improve the quality of life of citizens in a
community. An important question is whether cities are truly measured in their policies and
practices relative to any proposed model. Based on focus-group interview supplemented by an
aspect of Q-methodology, this paper investigates how stakeholders prioritize the
factors/indicators of cities smartness in the context of Abuja city. The paper addresses the
challenges of quantifying the Key Performance Indicators (KPIs) needed to monitor the
impacts of smartness in emerging economies. To propose a novel framework model, the study
analyse the existing models and frameworks for measuring the impacts of Smart Cities with a
view to identifying the core indicators that will be unique for cities in emerging economies.
The analysis shows that the existing models focused on the identification of indicators of
economy, people, governance, environment, mobility, and living. However, the study found
that core indicators on infrastructure are omitted. The paper therefore propose collapsing the
well-known indicators into three core components of smart cities, namely Smart infrastructure,
smart institution and the smart people to have a more holistic assessment of smart cities
impacts.
Keywords: Smart Cities, KPIs, Emerging Economies, Smart Infrastructure, Smart Institutions,
Smart People.
1. INTRODUCTION
Many cities are transitioning from traditional cities into Smart Cities and a main motivation
for this trend is because of their perceived ability to improve the standard of living of the
people residing in such cities. However, in order to justify this assertion it is necessary to
identify some relevant Key Performance Indicators (KPIs) through which we can analyze
their impact. A number of research efforts have focused on the development of such
indicators and many of their derived KPIs are already in use today.
A systematic literature review of such prior research shows that many of the KPIs were
developed with the assumption that they would be implemented in developed countries,
which already have the relevant amenities and infrastructure. However, this assumption does
not hold for developing economies, where many amenities and basic infrastructure are
lacking. The examples cited in the analysis are illustrations of potential aspirational and
practical solutions that are already realized in advanced economies such as USA.
This research aims to bridge this knowledge gap by proposing a list of KPIs that can be
readily used in emerging cities in a developing country context. In particular, the study have
derived KPIs that take the infrastructure problems in developing countries into account.
Hence in order to elicit knowledge from professionals that will assist in developing a simple

950
and adoptable model of measurement, this study adopted Federal Capital Territory (FCT),
Abuja focusing on key stakeholders in academia, ICT industry, and the City Administration
as case study. FCT-Abuja is a typical emerging city in an emerging economy embarking on
laudable Smart City initiatives (Jiriko, JY et al. 2015). The focus group interview with FCT
Abuja Smart City stakeholders adopted an aspect of Q methodology that grouped the core
components of Smart Cities into three (3) distinct components of smart infrastructure, smart
institutions, and smart people respectively. Q methodology invented by William Stevephen (a
British physicist/psychologist), permits the systematic study of subjectivity and
communicating the subjective perceptions of the participants point of view central to its
investigative procedures (Du Plessis 2005).
The remainder of this paper is organised as follows: section 2 gives the theoretical
background and relevant literature review. Section 3, presents the proposed KPIs for
measuring the smartness of cities and discuss the theoretical framework extensively while
section 4 gives an overview of the methodology used for this work. Section 5 summarizes the
result of the focus group (experts’ interviews) leading to the proposed Smart Cities KPIs and
section 6 gives a conclusion to the paper and discusses the proposed future work.
2. THEORETICAL BACKGROUND
2.1 Smart City Definition
Smart Cities represent an emerging area of research that is gaining a lot of attention. A
number of definitions have been proposed and one such notable definitions was given by
Forrester, who defined a Smart City as ‘the use of smart computing technologies to make the
critical infrastructure components and services of a city – which include city administration,
education, healthcare, public safety, real estate, transportation, and utilities – more intelligent,
interconnected, and efficient’ (Washburn, Sindhu et al. 2009). Similarly, IBM (2009) gave a
definition from an industry point of view- ‘a Smarter City uses technology to transform its
core systems and optimize resources. At the highest levels of maturity, a Smarter City is a
knowledge-based system that provides real-time insights to stakeholders, as well as enabling
decision-makers to proactively manage the city’s subsystems. Effective information
management is at the heart of this capability, and integration and analytics are seen as the key
enablers’ (ITU 2014).
According to Gartner as cited by Lee, Hancock et al. (2014) ‘a Smart City is based on
intelligent exchange of information that flow between its many different subsystems. This
flow of information is analyzed and translated into citizen and commercial services. The city
will act on this information flow to make its wider ecosystem more resource-efficient and
sustainable. The information exchange is based on a smart governance operating framework
designed for sustainable cities. The authors posited that Smart City is a concept that derives
its definition from a combination of ‘information city, knowledge city, intelligent city,
ubiquitous city, and digital city’. After critical evaluation of different characteristics of the
Smart City concept, these authors concluded that ‘Smart Cities are envisioned as creating a
better, more sustainable city, in which people’s quality of life is higher, their environment
more livable and their economic prospects stronger’.
In addition, Harrisson C. as cited in Chourabi, Nam et al. (2012) considered Smart City as the
city connecting the physical infrastructure, the IT infrastructure, the social infrastructure, and
the business infrastructure to leverage the collective intelligence of the city. According to

951
Batty, Axhausen et al. (2012), Smart Cities are simply ‘instruments for improving
competitiveness in such a way that community and quality of life are enhanced’. The
International Telecommunications Union (ITU) during its focused group analysis (ITU 2014)
and in an effort to come up with a standardized definition for Smart and Sustainable Cities,
analyzed over 100 publications and this gave different definitions of Smart Cities. From
ITU’s analysis, the over 100 definitions of ‘Smart City’ kept revolving around 50 keywords
like quality of life, ICT, Technology, innovations, management, systems, integrate,
intelligent, etc., where the instance of about 726 of those keywords were analyzed to measure
or compare the importance of those words on the subject matter.
In summary, the issue of improved services and quality of life are considered imperative in a
Smart City. Thus, the concept of Smart City has the central objective of improving quality of
life in today’s densely populated cities around the globe socially, politically, culturally, and
economically with equal access devoid of any form of exclusion in terms of time and
location. Hence, it is crucial for Smart Cities to create knowledge, as well as transfer
knowledge, social innovations and a host of other services using the emerging technologies in
Cloud Computing as a platform for solving environmental, ecological, social, and
sustainability problems facing the ever-expanding cities today.
2.2 Smart Cities Standardization and the Framework for Measurement
A couple of Smart City scholarships have discussed the issue of standardization and the
metrics for monitoring cities development from different perspectives. For instance, City
Protocol (2015) developed an interesting hierarchical model for city governance, evaluation,
and transformation. The City Protocol model incorporated the original City Anatomy CPA-I
001 body of knowledge, Anatomy Indicators CPA-PR 002, Anatomy Ontology CPAPR 003,
and Livable District CPC 004, etc. It is important to note that every city in different regions
of the world is unique with different development challenges depending on their experiences
and history. In this context, while some cities are dealing with challenges of environmental
pollution, others are faced with congestion, energy, and security related issues (Ceballos and
Larios 2016). However, because of the interrelationship that exists amongst the indicators of
Smart City systems, a number of standards have been proposed for monitoring performance
of cities smartness. The existing standards include ISO-37120 standard for Sustainable
Development and Resilience of Communities –Global City Indicators for Service and Quality
of Life, ISO-37101 Sustainable Development and Resilience Communities –Management
Systems, ITU Smart Sustainable Cities, Spanish Standards (AENOR) –UNE 178301 on Open
Data and UNE 178303 Requirements for Municipal’s Asset Management, NIST – Internet of
Things (IoT) Enabled Smart City Framework, etc.
The ISO 37120 standard for instance, established 46 core indicators and 54 supporting
indicators for measuring smartness (Hernandez 2014). According to Hernandez (2014), the
ISO-37120 indicators are applicable to any city and it can serve as tools for City Mayors,
Urban planners, researchers, professionals and other stakeholders for benchmarking
investment, building smart sustainable cities, impacts evaluation, comparison, and measuring
effectiveness of city governance, etc. Overall, ISO-37120 standard introduces methodologies
in the form of indicators for measuring performance of services in cities especially in the area
of quality of life with a matrix that attempts to reveal key technologies that underpin many
Smart Cities initiatives today. On the other hand, ITU introduced standard specification for
Smart Sustainable cities. As revealed by Anthopoulos and Giannakidis (2016), the ITU

952
standard for Smart Sustainable Cities defines a set of primary smart services for cities.
Further, the standard introduced a technical report that can form the basis for global Smart
Sustainable City that can afterward, be adopted for developing a framework for measuring
performance of Smart Cities (ITU, 2014).
At the sub-regional level, Spanish standard (AENOR) have adopted the ISO-37120, which
correspond to its standardization efforts to introduce the UNE-178301 and UNE 178303
respectively. The Spanish standards address Open Data standardization and requirements for
municipal asset’s management. Similarly, in the USA the National Institute of Standards and
Technology (NIST) embarked on a couple of Smart City related standards which include
Internet of Things (IoT) Enabled Smart City Framework standard in an attempt to enhance
interoperability of Smart City technologies across cities with cost effectiveness and
convergence that will serve the global Smart City needs (NIST 2016). The NIST IoT standard
was developed in collaboration with ANSI, MISP ITIA and ETSI. For further information on
existing Smart City standard, see (Zdraveski et al., 2017, Lombardi et al., 2012, ISO IEC
2014, BSI 2014).
The standard defined in ISO-37120 above identified 17 key areas of measures with 100
indicators. In practice, Cohen (2015) proposed a Smart City model for measuring city
performance with six dimensions i.e. Smart Economy, Smart Environment, Smart People,
Smart Governance, Smart Mobility, and Smart Living (Cohen 2012). Cohen’s model was
based on ranking and benchmarking approaches using indicator average of the six dimensions
of Smart Cities. The model relied on secondary data from different sources which includes
IDC rankings of Smart Cities in Spain, Siemens Green City Index, Global Metro Monitor,
and a host of international organisations (Benamrou et al. 2016). A couple of Smart City
scholars have attempted to integrate the Boyd Cohen’s model of Smart City KPIs with the
ISO-37120 with the corresponding indicators to simplify the metrics for measuring cities see
for instance (Ceballos and Larios 2016). Section 4.3 discusses the KPI models in details.
2.3 Key Performance Indicators (KPIs) for Measuring the Smartness of Cities and the
Existing Smart City Wheels
The recent concerns on the need to identify metrics and key performance indicators (KPIs)
that can measure the impact of Smart City solutions and platforms in order to improve city
smartness characteristics, through well-articulated performance indicators, is receiving
stakeholders support. Many cities are transitioning from traditional cities into Smart Cities
and a main motivation for this trend is because of their perceived ability to improve the
standard of living of the people residing in such cities. However, in order to justify this
assertion, it is necessary to identify some relevant Key Performance Indicators (KPIs)
through which we can analyze their impact.
In a comparative study by Giffinger, Fertner et al. (2007), on the role of city-rankings in a
regional competition focused on operationalising Smart Cities, they identified a
comprehensive catalogue of indicators for measuring developments in medium-size cities of
Europe. Drawing from their findings, the authors summarised the characteristics of a Smart
City into six (6) major headings, namely Smart Economy, Smart People, Smart Governance,
Smart Mobility, Smart Environment, and Smart Living. The study, which adopted the
methodology of weighing the influence and importance of the factors or indicators, produced
a framework model for analysing Smart Cities with thirty-three (33) factors described by a

953
number of indicators. Carli et al. (2013), in a similar framework for classifying performance
indicators for measuring and managing the smartness of cities stressed further that to achieve
the goal of making cities smarter, there is need to optimally and intelligently measure and
monitor cities performance and analyse their competitiveness as well as evaluate their
sustainability. Although the authors were of the view that there is no valid set of indicators
for measuring performance of cities in each context and purpose, they proposed a novel two-
dimensional framework (human and technological context) for classifying KPIs of a Smart
City. This study also adopted the six (6) characteristics of Smart Economy, Smart People,
Smart Governance, Smart Mobility, Smart Environment, and Smart Living in the framework
to enable policy makers, planners and other stakeholders make intelligent decisions. Figure
4.1 highlights the six commonly used Smart City wheels proposed by Giffinger et al. (2007).
Smart Economy
Smart People
Smart Government
Smart Mobility
Smart Environment
Smart Living
Figure.1: Characteristics of Smart City
Source: (Giffinger et al., 2007)
The model and the framework were discussed using the above six (6) characteristics
extensively. Cohen and Giffinger’s model are similar in terms of the six characteristics and
ranking/benchmarking approaches. However, measuring the six characteristics without
infrastructure as a core component could result in ignoring a major issue in the context of
emerging economies since many of these countries struggle to put the proper infrastructure in
place that will drive Smart Cities. Similarly, the framework proposed by Carli et al. (2013)
succeeded in re-grouping the characteristics and the corresponding indicators into objective
and subjective dimensions but the basic issue of identifying the core indicators for measuring
the impacts of Smart City in line with common taxonomy was not addressed. This ignores
the challenges of infrastructure provisioning in emerging cities.
In an attempt to further streamline the existing Smart City wheels and indicators,
(Chowdhury and Dhawan 2016) introduced the Delphi method to evaluate the set of Smart
Cities performance indicators established by ITU. Chowdhury and Dhawan’s model also
characterised the key performance indicators for Smart Cities into six similar dimensions
identifying Information and Communication Technology (ICT), Environmental
Sustainability, Productivity, Quality of Life, Equity and Social Inclusion, and Physical
Infrastructure with the corresponding parameters for measuring performance. The authors
attempted to further split the six dimensions into measurable categories with a test case study
using the Delphi review in India.
In contrast, Ceballos and Larios (2016), adopted a Kano model to provide empirical support
in planning a Smart City using the Cohen’s model of KPIs with comprehensive integration of
the 17 metrics of measurement models identified in ISO-37120. Ceballos and Larios’s
principle proposes a Smart City investment model that encourages improved identity of the
people with the city by prioritising their service needs in terms of investment in Smart City
and quality of life. The study adopted the use case of CUCEA UDG living Lab –Guadalajara
to validate the model. For further information on the integration of ISO-37120 model with
Cohen’s model of Smart Cities, see Ceballos and Larios (2016).

954
Further, numerous academic literature addresses Smart City development from different
perspectives of characterising the core components of Smart Cities while a host of others
attempted to develop taxonomies that are based on the drivers. In this area, Nam and Pardo
(2011) developed a framework based on three (3) core components discussed earlier:
technology, people and institutions, both in terms of dimension and factors. In another
example, Lee, Hancock et al. (2014) taxonomised the characteristics of Smart City based on
technological and institutional elements well represented in six (6) taxonomies: urban
openness, service innovation, partnerships formation, urban proactiveness, Smart City
infrastructure integration and Smart City governance. It is imperative to suggest that Smart
Infrastructure should form the core characteristic of Smart Cities. In this direction, the six
characteristics can be summarised and discussed under three core dimensions of Smart City
(i.e. Smart Infrastructure, Smart Institutions and Smart People).
This study explores the findings from available research results in view of the dynamic nature
of this field in order to identify the major drivers of Smart Cities and the practical challenges
before proposing a model for measuring the impacts. The paper therefore aims to provide a
novel framework model for measuring smartness, factoring in the core indicators that can be
universal and meeting the major challenges of an emerging economy using primary data.
3. THEORETICAL FRAMEWORK FOR SMART CITY PERFORMANCE
INDICATORS
Identifying appropriate performance indicators for measuring, managing, and monitoring the
smartness of cities need to comply substantially with existing knowledge in the field of Smart
City development. The imperative involves the development of a novel framework for
measurement, but it goes beyond it to address the key challenges in detail. Building on
existing knowledge in this field and the literature discussed earlier, this study identified three
(3) core components of Smart Cities with comprehensive factors and key indicators to form
the theoretical foundation to suggest a holistic view of metrics with which the KPIs of Smart
Cities can be measured. The proposed core components include infrastructure, institution, and
the people. Infrastructure is at the core of Smart City development. It is also the platform
upon which Smart Economy, Smart Mobility, Smart Living and other dimensions introduced
in the previous research are built.
In most emerging economies, cities are faced with the challenges of infrastructure
provisioning (e.g. power, ICT, transport, water, etc.) that need to be measured. The factors
and the specific indicators that drive the infrastructure component therefore need further
consideration in order to produce an all-inclusive framework that can be adopted in an
emerging economy. There is limited literature that explains infrastructure as a component in
this manner; the proposed three dimensions of classifying Smart City factors and indicators
are validated through a focus group exercise as summarised in the methodology. Table-1
presents the three (3) dimensional framework for measuring impacts of Smart City planning
with more consideration for infrastructure as the foundation.
It is imperative to emphasise that the infrastructural performance of a city cannot be taken for
granted because Smart Economy, effective management and the technological advancement
that drives smartness in all dimensions depends on the existence of Smart infrastructure (Nam
and Pardo 2011). Based on the focus group exercise, Smart Infrastructure, Smart Institutions,
and Smart People were prioritized as the core components of Smart Cities upon which Smart

955
Economy can strive. In this arrangement, core factors/indicators for Smart living were
considered very relevant to people hence, the three agreed core components were used to
identify the core factors/indicators of Smart Cities that can conveniently be used to analyze
similar indicators used in Europe and America depending on the peculiarity of the city.
Table 1. The Proposed Framework for Measuring Impacts of Smart City
Components Factors Indicators
Sm
art
In
frast
ructu
re
Availability of smart
grid/robust energy
Number of green energy sources and megawatts
generated per inhabitant
Rate of uninteruptible power available per
inhabitant
Availability of ICTs
Infrastructure (source: ITU,
2014)
Number of mobile phone as % of city population
Number of Internet access as % of city
population
Secured and innovative
transport system (source:
Giffinger et al, 2007)
Use of environmental friendly vehicles
Number of autonomous vehicles
Efficient transport network per inhabitant
Availability of sustainable
healthcare facilities (source:
Giffinger et al, 2007)
Increased life expectancy
Number of hospital and hospital beds per
inhabitant
Number of qualified doctors, nurses, and health
attendants per inhabitant
Sm
art
In
stit
uti
on
Environmental Sustainability
(source: ITU, 2014)
Improved Air quality (CO, SO2, NO2 reduction)
Reduction in noise pollution
Reduction in Greenhouse gas emission per capita
Innovative and proactive
security system
% reduction in crime rate
Number of crime profiled in real-time
Tourist potential (source:
Giffinger et al, 2007)
Number of visitors to tourist centres
Revenue generated in tourism as % of total
revenue
Entrepreneurship (source:
Giffinger et al, 2007)
Increased number of new registered businesses
Increased number of innovation hubs
Sm
art
Peo
ple
Creativity (source: Cohen,
2015)
Number of creative industries as % total
industries
Share of people working in creative industries
Quality education (source:
Giffinger et al, 2007)
Number of educated citizens at different levels
of education
Number of skilled citizen as % of city population
Increased productivity (source:
Cohen, 2015)
GDP as % of employed citizen
Ratio of employed to unemployed citizens
The six commonly used Smart City wheels have been discussed in various Smart City
scholarship, thus this paper will not dwell on the entire six wheels in the theoretical
framework since previous efforts have sufficiently discussed them in different perspectives as
highlighted in the literature review. Although in some of the literature, institutional

956
arrangements were discussed under organization and governance but the emphasis on
institutional capabilities remain unchanged. This paper therefore considers the need to
contribute to the research gap by focusing on infrastructure, institution, and the people as key
components of Smart Cities where there is need to identify factors and indicators for
measuring smartness especially in an emerging economy.
3.1 Smart Infrastructure
Most of the existing literature on Smart City discussed the issue of infrastructure with a focus
on ICT infrastructure. Although the perception or the alignment of infrastructure component
with ICT is understandable because of the critical role that ICT plays in making the dream of
building a sustainable city a reality; in other instances, infrastructure is seen as technological
infrastructure or techno-ware (Schaffers et al. 2011). In contrast, ICT infrastructure cannot be
singled out as the most critical component in measuring the impact of Smart Cities in that
ICT as a component of Smart City requires the existence of other infrastructure like energy
(Smart Grid), utilities, safety, etc. In addition, Schaffers et al. (2011), discussed infrastructure
from a different perspective with the dimension of ICT and utilities introducing the concept
of smart transportation, mobility and parking, broadband, embedded systems, energy and
savings/smart grid, environment monitoring and safety.
In supporting the position of infrastructure as a critical component of Smart Cities, Forrester
(Washburn et al. 2009) posited that “Smart City is a collection of Smart Computing
technologies applied to the seven critical infrastructure components and services”. The study
further identified seven (7) critical infrastructure components of Smart City and services
which include education, healthcare, administration, public safety, transportation, real estate,
and utilities. The authors presented these critical infrastructure components with real-life
examples to assist stakeholders in visualizing Smartness of cities.
Education: The metrics for quality education range from availability of digital content,
improved access to online resources, low cost of educational programmes to technological
platforms for collaboration since these are factors that need to be identified and properly
classified for measurement.
Healthcare: The metrics include the availability of accurate diagnosis, patient records, and a
platform for quick response to emergency services, knowledge sharing amongst health
workers, tele-medicine facilities, and the existence of various platforms for remote medical
services. These also have infrastructure components that need to be identified for
measurement.
Public Safety: The police and other security agencies (e.g. fire service men) are now
leveraging innovative technologies to improve response rate to emergencies and threats. In
this area, Washburn et al. (2009) cited an example of a 911 real-time dashboard providing
information on emergency needs that have helped New York City to reduce crime rate by
27% with the aid of closed circuit television (CCTV) and video analytics. The factors
affecting the rate of response and the outcome as cited in the New York case can be classified
and measured.
Transportation: The financial and environmental impacts of transportation in Smart Cities
as well as reduction in the congestion can be measured. In this topic, Stockholm, Sweden as

957
cited in (Naphade et al. 2011), implemented a system equipped with lasers and cameras that
automatically charge drivers on a “pay as you go” basis, thereby reducing gas emission and
congestion. See Washburn et al. (2009) for details on utilities, real-estate, and administrative
components of Smart Infrastructure. See also Naphade et al. 2011 for use case examples.
In order to arrive at workable KPIs for measuring impacts of Smart Cities, factors/indicators
for measuring the critical areas/components of infrastructure need to be identified and
classified accordingly.
3.2 Smart Institutions
In defining the Smart Institution as a core component of Smart Cities, a good number of
authors stresses the quality of political strategies, availability of public services, support of
government and policy for governance (see for instance Nam and Parado, 2011, Giffinger et
al, 2007). Smart governance in this context refers to our concept of Smart Institution that
leverage technologies (ICTs, sensors, RFID, etc) for efficient service delivery (see also
Komninos 2009). Further, (chourabi et al 2012) also discussed extensively the component of
Smart governance from the perspective of public-private partnership (PPP), leadership and
effective collaboration for quality decision making. In summary, the Smart Institution
includes all the essential factors of institutional arrangements that strive to ensure improved
quality of life for the citizenry and availability of the entire factor in different perspectives of
governance, sustainability, and few other dimensions that only differ in terms of terminology.
Some of the core themes defining the Smart Institution component are summarised below:
Environmental Sustainability: Environmental Sustainability is one of the most important
issues in the urban environment that affects the quality of life of the people. A couple of
Smart City scholarship have also addressed the issues of environment as a major
characteristic/dimension of Smart Cities see for instance (Giffinger et al. 2007, Cohen, 2015).
The metrics for quality of environment in this case ranges from improved air quality, climate
change (e.g. CO, NO2, SO2, etc.) to traffic flow which can be measured with the emergence
of Big Data analytics even in real-time. In Europe for instance, research findings (Penza,
Suriano et al. 2014) revealed that a couple of Smart City scholars are experimenting solutions
for measuring air quality in cities in line with EU’s Air Quality Directive 2008/50/EC.
Dealing with environmental sustainability therefore is a critical challenge that smarter
institutions must address.
Entrepreneurship: For cities to attain smartness, they key performance indicators relating to
how they are entrepreneuring are crucial and can be measured as part of the city’s image in
maximizing their innovative spirit and creative potentials for global competiveness. In this
regards, access to innovation hubs/R&D as well as improved business environment are
important parameters.
Productivity: Productivity parameters basically deal with measuring key performance
indicators relating to income, trade balance at the city level, capital investment, job creation
indices in both formal and informal sub-sectors of the city.

958
3.3 Smart People
In addition to the above two core components, the concept of Smart Cities includes the
people as core components. The Smart People as a core component of Smart Cities have been
addressed extensively in both academic journals and industry report within the domain of
Smart Cities. The definition of people component stress the role of human capital and
education in the innovative development in cities changing the patterns of citizen engagement
to bottom-up rather than top-down (Batty, Axhausen et al. 2012). According to Glaeser
(2005), one of the key characteristics of Smart Cities is the availability of a skilled workforce.
Similarly, the transformation to Smart City environment entails capabilities for vibrant R&D
(knowledge-base) driven by educational institutions for urban diversity, social inclusion,
crime-free society, and a host of other societal values (Yigitcanlar et al. 2008). The
component of “people” is further summarised as follows:
Quality of Life: WHO (1998) defines Quality of Life (QoL) as “individual perceptions of
their position in life in the context of culture and value systems in which they live and in
relation to their goals, expectations, standards and concerns”. In Smart Cities, improved
quality of life of the people either in terms of emotional well-being, health status, financial
status, and other aspects of life are of great concern. Quality of Life is beyond national GDP
as measure of prosperity for national economies in the context of smart cities, it addresses
key performance indicators relating to health, education, safety, and convenience
(Chowdhury & Dhawan, 2016).
Equity and Social Inclusion: In Smart Cities, social cohesion is of utmost priority in city
governance. Thus, the main concerns of equity and social inclusion parameters includes
dealing with racial discrimination, gender inequalities, transparency (openness) and
participatory system of governance. For instance, one of the major Smart City initiatives of
Boston includes the Participatory China Town – A platform for public participation in policy
making for urban planning (Chinatown 2017). The concept of Smart People is well discussed
in a number of academic and industry-based Smart City journals (see for instance Giffinger et
al, 2007, 2010). See also (Nam and Pardo, 2011, Edvinsson 2006).
4. METHODOLOGY
A systematic literature survey was conducted to elicit the knowledge required to meet the
objective of this study. Current data on Smart City development and the key performance
indicators for measuring smartness of a city were sourced from academic journals, reports
from research institutions, and white papers of international/regional organisations in an
effort to identify core indicators that are already being used as reference for Smart City
impact assessment. The idea was to first generate a comprehensive list of factors/indicators
based on the existing Smart City wheels and ISO-37120 resilient city standard for measuring
the smartness of a city and subject these priority themes to a focus group to validate and
refine the indicators for the purpose of analyzing them using Smart City stakeholders in
Abuja. The focus group exercise started in Abuja from July 04, 2016 and was concluded July
20, 2016. Abuja was selected as a case study because the focus of this study is on emerging
economies and FCT-Abuja had recently launched a vibrant campaign for smart growth
(Jiriko, JY et al. 2015). Besides, Nigeria has been labelled an “emerging economy” in the
league of the MINT nations i.e. Mexico, Indonesia, Nigeria and Turkey (Financier
Worldwide Magazine 2014), (Akpan et al. 2014).
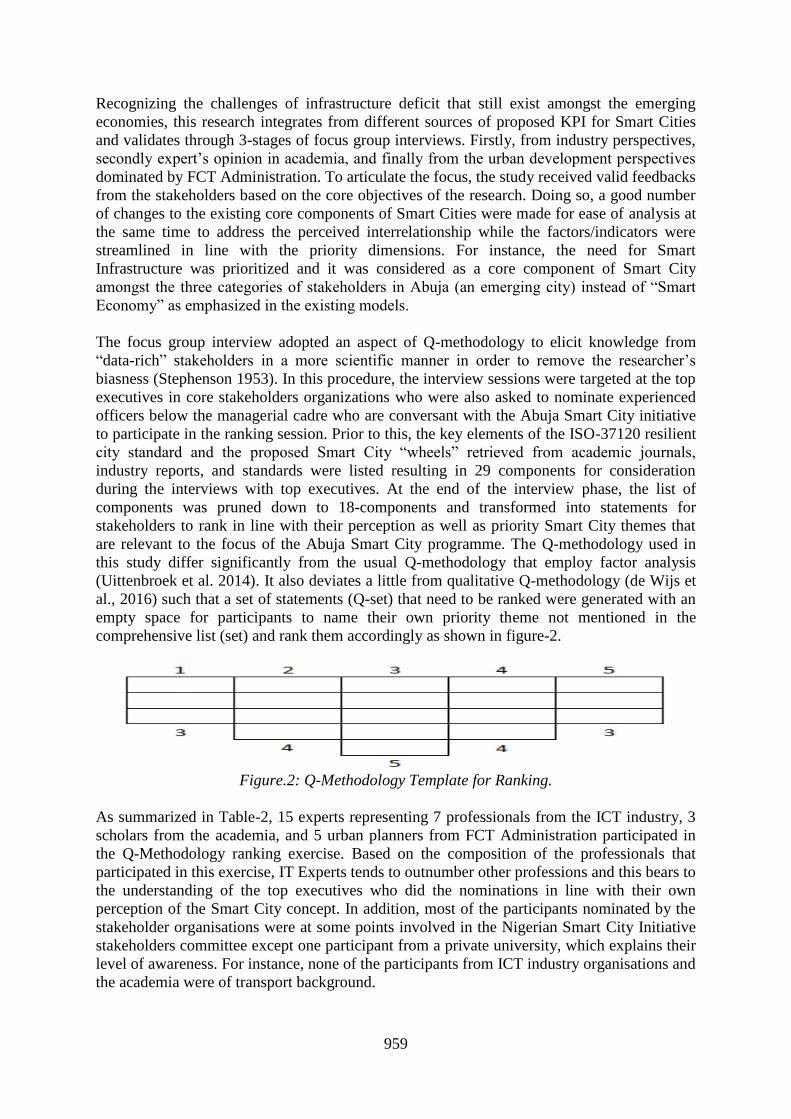
959
Recognizing the challenges of infrastructure deficit that still exist amongst the emerging
economies, this research integrates from different sources of proposed KPI for Smart Cities
and validates through 3-stages of focus group interviews. Firstly, from industry perspectives,
secondly expert’s opinion in academia, and finally from the urban development perspectives
dominated by FCT Administration. To articulate the focus, the study received valid feedbacks
from the stakeholders based on the core objectives of the research. Doing so, a good number
of changes to the existing core components of Smart Cities were made for ease of analysis at
the same time to address the perceived interrelationship while the factors/indicators were
streamlined in line with the priority dimensions. For instance, the need for Smart
Infrastructure was prioritized and it was considered as a core component of Smart City
amongst the three categories of stakeholders in Abuja (an emerging city) instead of “Smart
Economy” as emphasized in the existing models.
The focus group interview adopted an aspect of Q-methodology to elicit knowledge from
“data-rich” stakeholders in a more scientific manner in order to remove the researcher’s
biasness (Stephenson 1953). In this procedure, the interview sessions were targeted at the top
executives in core stakeholders organizations who were also asked to nominate experienced
officers below the managerial cadre who are conversant with the Abuja Smart City initiative
to participate in the ranking session. Prior to this, the key elements of the ISO-37120 resilient
city standard and the proposed Smart City “wheels” retrieved from academic journals,
industry reports, and standards were listed resulting in 29 components for consideration
during the interviews with top executives. At the end of the interview phase, the list of
components was pruned down to 18-components and transformed into statements for
stakeholders to rank in line with their perception as well as priority Smart City themes that
are relevant to the focus of the Abuja Smart City programme. The Q-methodology used in
this study differ significantly from the usual Q-methodology that employ factor analysis
(Uittenbroek et al. 2014). It also deviates a little from qualitative Q-methodology (de Wijs et
al., 2016) such that a set of statements (Q-set) that need to be ranked were generated with an
empty space for participants to name their own priority theme not mentioned in the
comprehensive list (set) and rank them accordingly as shown in figure-2.
Figure.2: Q-Methodology Template for Ranking.
As summarized in Table-2, 15 experts representing 7 professionals from the ICT industry, 3
scholars from the academia, and 5 urban planners from FCT Administration participated in
the Q-Methodology ranking exercise. Based on the composition of the professionals that
participated in this exercise, IT Experts tends to outnumber other professions and this bears to
the understanding of the top executives who did the nominations in line with their own
perception of the Smart City concept. In addition, most of the participants nominated by the
stakeholder organisations were at some points involved in the Nigerian Smart City Initiative
stakeholders committee except one participant from a private university, which explains their
level of awareness. For instance, none of the participants from ICT industry organisations and
the academia were of transport background.

960
Table-2: Profile of Focus Group Participants
S/N Focus Group Profession
IT
Experts
Urban
Planners
Transport
Experts
Security
Experts
1 City
Administration
1 2 1 1
2 ICT Industry 6 0 0 1
3 Academia 1 2 0 0
Total 8 4 1 2
The results from the ranking were analysed using qualitative manual method due to the size
of participants involved. Although the founder of Q-method recommended between 40 to 80
statements and between 40 to 60 participants but effective Q-methodology studies with fewer
statements and very few participants have been carried out (Watts and Stenner 2005). Again,
the provision of empty space for participants to make their own inputs makes the data
analysis more complex and unsuitable to apply Q-methodology software such as PQMethod
for inverted factor analysis, PCQ for Windows, and SPSS, etc.
5. RESULT AND DISCUSSION
In this section, we describe the most important results based on the focus group interviews in
Abuja city region. The discussion focuses on the three core components prioritised by the
different groups of Smart City stakeholders summarised in figure-2 above. This section
therefore attempts to reflect the perception of the participants on a broad-range of Resilient
City indicators established in ISO-37120, Smart Sustainable Cities and the different
dimensions of Smart Cities in the context of FCT-Abuja as a case in an emerging economy.
Group-1 Academia Group-2 Industry Group-3 City
Administration
Group-1 Academia Group-2 Industry Group-3 City
Administration Figure. 3: Schematic View of Experts Perceptions of the Smart City Components
5.1 Smart Infrastructure
As summarised in section 3.1, the component of Smart Infrastructure is at the core of Smart
innovation. For instance, a Smart City environment requires robust broadband infrastructure
to spur smart innovation in virtually every sub-sector of the city, it needs energy especially
smart grid, embedded systems, transport, etc. The findings of these interviews with experts
reflects that in all stakeholders groups i.e. academia, industry, and the city administration
(urban planning), Smart Infrastructure is of higher priority. The experts in all the three groups
ranked “infrastructure” very high as the basic requirement to transform FCT-Abuja into a
smarter city. Based on the outcome of the group discussion and the ranking exercise,

961
consensus were reached amongst the participants that adequate investment in the
infrastructural component is needed to support the smart aspiration of FCT-Abuja as
summarised in figure-3. Although several Smart City KPI models focus on Smart Economy,
Smart Living, Smart Safety and a host of others; participants in this study perceived these
categories of Smart City characteristics as important but emphasized the need to focus on the
core components of infrastructure, institution, and people with core indicators that cut-across
the supporting components for ease of management.
5.2 Smart Institution
The second component also ranked very high in this exercise is the Smart Institution. As
noted in the literature review, for Smart Cities to improve entrepreneurial growth, improve
city administration for quality of life of the citizen and so on, they require smarter institutions
that will manage all governance issues. In which case, they will promote productivity (job
creation), efficiency, sustainability (air quality and climate change), improved access to
innovation hubs/R&Ds. In all the focus group interviews and Q-methodology ranking
exercise with the stakeholders, the need for smarter institutions that will drive the smart
initiatives in all sectors of the city is high on the agenda. As shown in figure-3, there was
consensus in ranking by the participants confirming the positions of the interviewees that
smarter institution is a priority and one of the most important components for all the group of
stakeholders.
Interestingly, participants from the academia and their counterparts in urban planning agreed
with the views of the “industry” participants on the three core components highlighted above
but a couple of participants from these two groups considered the component of environment
as very important theme in FCT-Abuja Smart City project. As shown in figure-3, the
component of environment is regarded as one the popular priority areas for this group. This
position largely aligns with the views of some of the interviewees who emphasized the need
to identify the core indicators of environment as important indicators that smarter institutions
can address. Specifically, these participants (academia/urban planning) highlighted the
factors of “environmental pollution” and “environmental protection” as key issues for
Smarter Abuja.
5.3 Smart People
Finally, the third priority component for Abuja Smart City stakeholders is the Smart People.
This component as summarised in the literature review represents the social capital in Smart
City initiatives. As shown in figure-3, the participants expressed in strong terms the central
role of the people component during the ranking and interview exercise. Again, one of the
interviewees in the academia group suggested that Smart City deployment in Abuja should
start from serious investment in the people component in order to develop adequate human
capacity that will drive the innovation and knowledge exchange in the envisioned smarter
environment in the capital city of Abuja.

962
6. CONCLUSIONS AND FUTURE WORK
The importance of Smart Cities has been discussed and the social innovations that they bring
and the impact that this has on the cities where they are implemented have been identified.
An analysis of the KPIs that have been used to quantity the impact of Smart Cities in prior
research has been carried out. Although this is an ongoing research, the immediate findings
revealed that most KPIs took it for granted that the host cities already have the adequate
infrastructure to support the deployment of Smart Cities.
This condition holds true in many developed countries but the dearth of appropriate
infrastructure in developing countries makes a case for a review of the KPIs with a view to
ensuring that the infrastructure challenge takes centre stage. The result of this work is the
development of infrastructure-centric KPIs that can be readily used for assessing the impact
of Smart Cities. With many cities around the globe adopting the concept of Smart City, it has
become imperative to proactively identify the critical factors and indicators that will be useful
to both developed and emerging economies for measuring how the smartness of a city
impacts on its environment and citizens.
In the future, the conceptual framework will be used to conduct surveys covering larger
stakeholder groups with a view to use the result of the empirical evidence in proposing a
Smart City model based on the identified indicators for assessing the impacts of Smart Cities.
7. REFERENCES
Akpan, U. S., et al. (2014). "Determinants of foreign direct investment in fast-growing economies: a study of
BRICS and MINT."
Anthopoulos, L. and G. Giannakidis (2016). Task-based process modeling for policy making in smart cities.
ITU Kaleidoscope: ICTs for a Sustainable World (ITU WT), 2016, IEEE.
Batty, M., et al. (2012). "Smart cities of the future." The European Physical Journal Special Topics 214(1): 481-
518.
Benamrou, B., et al. (2016). Ranking models of smart cities. Information Science and Technology (CiSt), 2016
4th IEEE International Colloquium on, IEEE.
BSI, T. B. S. I. (2014). Smart city framework Guide to establishing strategies for smart cities and communities.
UK, BSI.
Carli, R., et al. (2013). Measuring and managing the smartness of cities: A framework for classifying
performance indicators. Systems, Man, and Cybernetics (SMC), 2013 IEEE International Conference on,
IEEE.
Ceballos, G. R. and V. M. Larios (2016). A model to promote citizen driven government in a smart city: Use
case at GDL smart city. Smart Cities Conference (ISC2), 2016 IEEE International, IEEE.
Chinatown, P. (2017). "Participatory Chinatown, Boston." from http://www.participatorychinatown.org/.
Chourabi, H., et al. (2012). Understanding smart cities: An integrative framework. System Science (HICSS),
2012 45th Hawaii International Conference on, IEEE.
Chowdhury, S. N. and S. Dhawan (2016). Evaluation of key performance indicators of smartcities by Delphi
analysis. Recent Trends in Electronics, Information & Communication Technology (RTEICT), IEEE
International Conference on, IEEE.
Cohen, B. (2012). What Exactly is Smart City? 2017.
Cohen, B. (2015). Keynote Address -What Exactly is Smart City? 2017.
de Wijs, L., et al. (2016). "How smart is smart? Theoretical and empirical considerations on implementing smart
city objectives–a case study of Dutch railway station areas." Innovation: The European Journal of Social
Science Research 29(4): 424-441.
Du Plessis, C. (2005). A theoretical framework of corporate online communication: a marketing public relations
(MPR) perspective.
Financier Worldwide Magazine (2014). MINT countries to be next economic giants?

963
Giffinger, R., et al. (2007). Smart cities-Ranking of European medium-sized cities, Vienna University of
Technology.
Hernandez, J. L. (2014). "Connecting Cities with Globally Standardized City Data ICLEI Resilient Cities
Webinar: ISO 37120 and the World Council on City Data." Retrieved April 18,, 2017, from http://resilient-
cities.iclei.org/fileadmin/sites/resilient-cities/files/Webinar_Series/HERNANDEZ_-
_ICLEI_Resilient_Cities_Webinar__FINAL_.pdf.
IBM, G. B. S. (2009). A vision of smarter cities: How cities can lead the way into a prosperous and sustainable
future.
ISO IEC (2014). Smart Cities Preliminary Report.
ITU (2014). Smart sustainable cities: An analysis of definitions
Jiriko, G., et al. (2015). "THE EVOLUTION OF ABUJA AS A ‘SMART CITY’A PROGNOSIS."
Lee, J. H., et al. (2014). "Towards an effective framework for building smart cities: Lessons from Seoul and San
Francisco." Technological Forecasting and Social Change 89: 80-99.
Lombardi, P., et al. (2012). "Modelling the smart city performance." Innovation: The European Journal of Social
Science Research 25(2): 137-149.
Nam, T. and T. A. Pardo (2011). Conceptualizing smart city with dimensions of technology, people, and
institutions. Proceedings of the 12th Annual International Digital Government Research Conference: Digital
Government Innovation in Challenging Times, ACM.
Nam, T. and T. A. Pardo (2011). Smart city as urban innovation: Focusing on management, policy, and context.
Proceedings of the 5th International Conference on Theory and Practice of Electronic Governance, ACM.
Naphade, M., et al. (2011). "Smarter cities and their innovation challenges." Computer 44(6): 32-39.
NIST (2016). Internet of Things (IoT) Enabled Smart City Framework. 2017.
Penza, M., et al. (2014). Towards air quality indices in smart cities by calibrated low-cost sensors applied to
networks. SENSORS, 2014 IEEE, IEEE.
Protocol, C. (2015). City Anatomy: A Framework to support City Governance, Evaluation and Transformation.
C. Protocol. CPA-I_001-v2.
Schaffers, H., et al. (2011). "Smart Cities and the Future Internet: Towards Cooperation Frameworks for Open
Innovation." Future Internet Assembly 6656: 431-446.
Stephenson, W. (1953). "The study of behavior; Q-technique and its methodology."
Uittenbroek, C. J., et al. (2014). "Organizational values and the implications for mainstreaming climate
adaptation in Dutch municipalities: using Q methodology." Journal of Water and Climate Change 5(3): 443-
456.
Washburn, D., et al. (2009). "Helping CIOs understand “smart city” initiatives." Growth 17.
Watts, S. and P. Stenner (2005). "Doing Q methodology: theory, method and interpretation." Qualitative
research in psychology 2(1): 67-91.
WHO (1998). PROGRAMME ON MENTAL HEALTH: WHOQOL User Manual Geneva.
WHO/MNH/MHP/98.4.
Zdraveski, V., et al. (2017). "ISO-Standardized Smart City Platform Architecture and Dashboard." IEEE
Pervasive Computing 16(2): 35-43.

964
ID 069
ON EMERGING CIVIC SPACES’ ROLE IN INNOVATIVE LOCAL
SOCIO-ECONOMIC DEVELOPMENT, RIACE AS A CASE
Y. OU and A. Errigo
Heritage, Architecture and Urban Planning Department (PAU), Mediterranea University of Reggio Calabria,
Via Salita Melissari, Feo di Vito, Reggio Calabria, 89124, Italy
Email: [email protected]
Abstract: There seems to be a political inaction and stagnating local socio-economic
development (LSED) in rural and peri-urban areas of Calabria Region in southern Italy. In
response, this paper, based on literature review and case study, seeks to cast light on an
innovative LSED pattern driven by emerging civic spaces. To this end, this paper carries out a
case study of Riace so as to explore the dynamics, forms and socio-economic impacts of
emerging civic spaces in relation to innovative LSED. By analysing the quantitative data
collected from Istat and qualitative data collected from field studies and interviews of key
stakeholders, it looks into the emerging multicultural civic spaces in Riace, focusing on their
impacts on socio-economic innovation. Finally, based on the case study, the paper points out
the viability of adopting a place-based and community-driven approach to LSED. It concludes
that civic spaces, formed through the empowerment of local population and community
collaboration, stimulates socio-cultural and economic innovation, which serves as a driver of
LSED.
Keywords: Civic Spaces, Community Collaboration, Innovation, Local Socio-Economic
Development (LSED), Territory.
1. INTRODUCTION
1.1. Literature Review
Civic spaces, where “civic entrepreneurship” occurs (Goldsmith et al., 2010), are perceived
mainly in two ways within the academia. On the one hand, civic spaces are physical spaces
with an embedded value system. While they serve as physical sites for civil society to
organise and function autonomously, they represent a value system composed of place-
making ingredients, such as identity, meaning, memory, history and linkages with the rest of
the world (Daniere & Douglass, 2008). Without these place-making ingredients, which are in
essence social and cultural capital, a place tends to lose its vitality due to community
decohesion. On the other hand, civic spaces are also popularly seen as a social construct with
a political economic implication. Therefore, they are inclusive social spaces with a high
degree of autonomy from the state and corporate economy (Daniere, 2003). According to
Abrahamson (2008: 3), they describe “the social processes of defining membership and
exclusion, rules of interaction, and the desired image of the civic process”. Indeed,
inclusiveness of civic spaces is vital to the well-being of society, in that it contributes to “the
social and political life of cities through public participation in place-making and
governance” (Douglass & Daniere, 2008: 1).
In fact, a participatory planning process accompanied by a decentralisation process is
commonly acknowledged as indispensable for the formation and functionality of civic spaces
(Daniere, 2003; Balassiano, 2011). Meanwhile, civic spaces are important contexts to have a
precise understanding of participation and the underlying processes of empowerment (Huq,

965
2013). In terms of local development, participatory approach is believed to contribute to
sustainable development (Strzelecka, 2011). As contributing factors for the formation of a
participatory community, community empowerment and institutional autonomy are principal
preconditions for alternative approaches to local development—decentralised sectoral, local
government, and community support approaches (Serrano et al., 2010). To guarantee a
quality community empowerment, Aswad proposes a combined approach that incorporates
procedural justice in planning development and social learning in its implementation (Kolo,
2002; Aswad, 2013). The procedural justice implies a process of community involvement in
policy making and implementation. In this process, social learning contributes to policy
making and implementation by providing context-based evidence and building relationships
among stakeholders (Cundill & Rodela, 2012). It is obvious that community involvement is
impossible without community empowerment achieved with a participatory approach.
According to Daniere (2003), civic spaces emerge as a response to globally-linked economic
growth and access to information. However, the existing literature does not overtly touch
upon the relationship between civic spaces and LSED. Besides, their socio-cultural and
economic impacts are barely discussed. As for Riace in Calabria Region in southern Italy,
emerging civic spaces are more of a response to unfavourable external political-economic
environment and resulting endogenous place-based local socio-economic development
(LSED) led by the civil society. Just as Abrahamson (2008: 3) remarks, civic spaces represent
“the role of the citizen in the operation and oversight of the government”. Taking into
account the realities in Calabria Region and the limitation of the existing literature, the
authors pose such questions as:
1) How do emerging civic spaces contribute to innovative LSED?;
2) Do civic spaces also represent the role of the non-citizens, namely, immigrants?
The following sections dedicated to the case study of Riace will help answer these two
questions.
1.2. Objective and Significance
As mentioned earlier, currently academic discussions on civic spaces seldom deal with the
socio-economic impacts of civic spaces, especially in a multicultural community. That is to
say, the role of civic spaces in LSED is not explicitly discussed. Therefore, this paper is
aimed to explore the dynamics, forms and socio-economic impacts of civic spaces in relation
to innovative LSED.
It is desirable that this research invite more future discussions on the socio-economic impacts
of civic spaces in relation to local development. In addition, it is also hoped that policy-
makers, will be more willing to adopt an innovative approach to local development which is
driven by emerging civic spaces.
1.3. Methodology
This research carried out a case study of Riace so as to explore the dynamics, forms and
socio-economic impacts of emerging civic spaces in relation to innovative LSED. For this
purpose, it adopted both quantitative and qualitative methods. It first of all carried out a
literature review to build up the theoretical structure of the entire research. Then
966
quantitatively speaking, it collected secondary baseline data of 1991, 2001 and 2011 from
Istat, especially those on demography and economic performance, such as population, rate of
foreign residents, old age index, young household with children rate, potential vacancy of
buildings and unemployment rate of Riace and Roghudi (the latter was chosen as a contrast).
By comparing these quantitative data, the regenerative effect of emerging civic spaces is
indicated, in terms of community structure, population rejuvenation, reuse of abandoned
buildings, job creation, etc. Qualitatively speaking, it undertook field studies1 so as to gather
various visual observations with regard to the forms, functions, mechanism, etc. of civic
spaces that appear in Riace. Besides, it administered semi-structured interviews with key
stakeholders, especially the Mayor of Riace.
2. CIVIC SPACES AND SOCIO-ECONOMIC INNOVATION IN RIACE
2.1. Background
Calabria Region boasts many minor historic centres (MHCs) of Greek origins, which are
well-known for their strong territorial identity and rich cultural and landscape heritage. Often
located in mountainous inner areas, they are isolated from the urban basin, which partly
explains their delicate socio-economic conditions. Over the past three decades, these MHCs
have gone through a continuous socio-economic decline due to aging population
accompanied by outbound migration and low birth rate, changes in productive patterns,
natural disasters, and demographic concentration in new settlements of the towns along the
coast. While these new settlements keep the name of the towns, they are often differentiated
from the latter with the word “marina”, since they are coastal. Riace (the new settlement of
the town is called Riace Marina), the focus of this paper, is one of these MHCs.
The name of Riace probably came from the Greek-Byzantine “Ryaki” which means small
brook. Since the refugee crisis in Europe, Riace has gradually earned an international fame
because of its innovative approach to dealing with refugees. From 2004 until today, it has
been the centre of immigration policy. In 2016 only, more than 800 immigrants were hosted
by the local community, which helped revitalise the town itself.
As mentioned above, Riace, like many other MHCs, has suffered from aging population and
depopulation since the 1980s. To better illustrate its “demographic crisis”, Roghudi2, having
similar conditions, was chosen as a contrast. The geographic location of Riace and Roghudi is
shown in the map below (see Map 1). The table below (see Table 1) shows their population,
old age index, young household with children rate and potential vacancy of buildings in 1991,
2001 and 2011. While there is a constantly decreasing population and young household with
children rate as well as a constantly increasing old age index in Roghudi, Riace saw an
increasing population and young household with children rate as well as a decreasing old age
index in 2011, which implies an increase of immigrants. This increase of immigrants is also
confirmed by a significant decrease in potential vacancy of buildings in both towns.
1 The co-author Antonio Errigo carried out all the field investigations and interviews. 2 As an ancient settlement, Roghudi owes its name perhaps to the ancient Greek “Rochùdios”. The Old Roghudi
(Roghudi Vecchio) enjoys a breath-taking landscape: it is located on the top of a hill about 500 meters above sea
level which stands right in the middle of the seasonal river Amendolea. Following the floods in the early 1970s,
the old town was abandoned and all of its inhabitants were relocated to the newly constructed town called New
Roghudi (Roghudi Nuovo, hereinafter referred to as Roghudi) in Melito Porto Salvo, very close to the Ionian
coast.

967
It is worth noting that in Riace, inverse changes have been happening since 2001. For
example, its old age index increased from 1991 to 2001 and decreased from 2001 to 2011.
Meanwhile, its population and young household with children rate decreased from 1991 to
2001 and increased from 2001 to 2011. Since civic spaces have started to emerge in Riace
since 1999, which is to be discussed in detail in the following section, the year 2001 was
considered as a baseline year to catch the trend before and after with the emergence of civic
spaces. It therefore can be concluded that emerging civic spaces have helped rejuvenate the
population of Riace and regenerate the town.
The emerging civic spaces in Riace are mainly represented and fostered by autonomous
NGOs (under the coordination of the institutional leadership, namely, the mayor) and
collaboration between the host community and the guest community. In the following
sections, the dynamics, forms and socio-economic impacts of emerging civic spaces in
relation to innovative LSED are discussed in detail.
Map 1: Geographic location of Roghudi and Riace3
Source: Google Map (2017). Processed by A. Errigo.
Table 14: Population, old age index, young household with children rate and potential
vacancy of buildings in 1991, 2001 and 2011 in Roghudi and Riace Source: Istat, 8000 Census. Retrieved from http://ottomilacensus.istat.it/provincia/080/, accessed on 26/05/2017.
3 The boundary in thick white line shows the metropolitan city of Reggio Calabria. The inner white boundaries
are the administrative territorial divisions (i comuni). 4 Notes: Old age index: percentage of population aged 65 years old and over and that aged 0-14 years old; Unemployment
rate: Percentage of residents seeking job in relation to active population (employed and job-hunting); Incidence of foreign
residents: incidence of foreign residents per 1,000 Italian residents; Potential vacancy of buildings: percentage of unused
buildings on total buildings.
Town Indicators 1991 2001 2011
Roghudi Population 1,530 1,365 1,172
Riace 1,694 1,605 1,793
Roghudi Old age index 75.4 118.5 143.4
Riace 103.5 117.2 116.8
Roghudi Young household with children
rate
20.1 14.5 8.1
Riace 18.1 11.3 13.5
Roghudi Potential vacancy of buildings NA 23.3 18.3
Riace NA 11.7 8.2

968
2.2. Multicultural Community Building and Social Inclusion
Both Roghudi and Riace are hosting immigrants to rejuvenate their population and regenerate
their urban fabrics, but it is Riace that has a longer tradition of being open to immigrants that
dates back to the 1990s. As the table below (see Table 2) shows, the number of foreign
residents is rocketing up in both towns, especially in Roghudi.
The drastically increasing number of immigrants, just like a double-edged sword, proves to
be both an opportunity and a risk. Immigrants mean not only more labour force and cultural
diversity, but also possible tension and even conflict between the host community and the
guest community. When referring to the new patterns of migration to Pacific Asia’s
metropolitan regions, Douglass (2003) maintains that whether the accompanying cultural
diversity can be accomplished in a socially just, inclusive manner is among the most
important issues of this century. Often times, a so-called “crisis of inclusion” happens when
there is a troubled access to public and civic spaces (Daniere, 2003). Indeed, how to foster a
multicultural community that is socially and economically inclusive to all community
members is undoubtedly an important but challenging task for Riace.
Table 2: Rate of foreign residents in Roghudi and Riace Source: Istat, 8000 Census. Retrieved from http://ottomilacensus.istat.it/provincia/080/, accessed on 26/05/2017.
In Riace, grass-roots NGOs (under the coordination of the institutional leadership, namely,
the mayor), such as associations and cooperatives, have played a significant role in promoting
integration and inclusion of the immigrants, while building up the towns’ social capital.
NGOs often have a significant role to play in decentralisation (Balassiano, 2011). This can be
evidenced by the autonomy of local associations in Riace in planning and implementing
cultural initiatives aimed at the integration of immigrants. In 1999, the association Città
Futura (Future City), the first of its type, was founded in Riace, echoed successively by four
other associations A Sud di Lampedusa, Girasole, Real Riace and Riace Accoglie. These
associations have collaboratively planned and carried out a series of welcome projects for
immigrants, which has finally become a national and international prototype, the “Riace
Model”. In the following section, this paper will have a close look at the work of the leading
non-profit organisation Città Futura, which is directed by the Mayor of Riace, Domenico
Lucano5.
Città Futura is aimed at promoting and managing the activities related to the integration of
immigrants. It also serves as a research institution for ethnografic history and culture. Its
major objectives are:
- facilitating the socio-economic integration of foreigners present in Riace;
- creating jobs for unemployed young people;
- improving the local economy;
- making sure that the history of Riace can continue to live by means of folklore, traditions
and handicrafts.
5 Currently serving his third term as Mayor of Riace, Domenico Lucano was listed by Fortune as one of the
world’s greatest leaders in 2016.
Town Indicators 1991 2001 2011
Roghudi Rate of foreign residents 3.9 58.6 120.3
Riace 1.8 12.5 56.9

969
Basically speaking, Città Futura is dedicated to promoting the integration of immigrants in
four ways: housing provision, conscious urban design, amenities improvement and public
spaces diversification. To begin with, Città Futura developed a project of hospitality called
Global Village (Villaggio Globale). Through the project, now completed, more than 20
abandoned houses were reclaimed, generating a total of more than 100 beds. With this
project, the organisation has successfully combined the need of social integration and urban
regeneration. It is worth noting that the Global Village is a very innovative project, in that it
is not only aimed at improving housing for immigrants, but also creating new jobs. A typical
design based on mixed use, Global Village, besides housing, also established bars, taverns,
shops, etc. Actually, the Global Village, through the reclamation of abandoned buildings, is
probably the key to foster civic spaces according to the Mayor. The shops, which sell
different kinds of handicrafts, have contributed to regenerate and revitalise the historic centre
of Riace, stimulate the local economic activities and allow immigrants to learn local skills
necessary for making a living.
Secondly, with conscious considerations of the need to promote social inclusion of
immigrants in public spaces, Città Futura has helped design public signs (see Figure 1) and
decorative structures (see Figures 2-3) that all convey the value of tolerance and cultural
diversity.
Thirdly, to help deliver better public services, Città Futura promoted the provision of various
public amenities, such as theatre (see Figure 4), where performances and citizen meetings
take place, and oil mill with stone grinders for the production of extra virgin olive oil (see
Figure 5).
Figure 2: “Welcome to Riace”, signs of
welcome on the gate of Riace © A. Errigo (2017)
Figure 1: Public board showing
nationalities present in Riace © A. Errigo (2017)

970
In addition, to make sure that different ethnic groups can interact and socialise with each
other, Città Futura has realised a series of projects focusing on public spaces. Some of the
existing squares in the historic centre were rehabilitated with considerations of social
integration promotion (see Figure 6).
2.3. Community Collaboration and Economic Inclusion
It is acknowledged that people’s capabilities to participate effectively in local development
are determined not only by individual resource endowments, but also by social capital that
provides the basis for collective action (Serrano et al., 2010). As mentioned above, in Riace
local NGOs have helped build up the community’s social capital by promoting integration
and socio-cultural inclusion. This serves as a starting point for the host community and guest
community to collaborate. In so doing, besides socio-cultural inclusion, economic inclusion is
also achieved, since new jobs, especially jobs for immigrants, are created. As the table below
(see Table 3) demonstrates, there was a constant decrease in unemployment rate in Roghudi.
In contrast, Riace saw an increase in unemployment rate in 2011, which may be explained by
the economic crisis across Europe.
Figure 4: Theatre of Riace © A. Errigo (2017)
Figure 3: Mural painting and “Global
Village”, entrance arch to the shops © A. Errigo (2017)
Figure 5: Oil mill with stone grinders for
the production of extra virgin olive oil © A. Errigo (2017)
Figure 6: A small square in the historic
centre transformed into a stage decorated
with multi-ethnic paintings © A. Errigo (2017)

971
Table 3: Unemployment rate in Roghudi and Riace Source: Istat, 8000 Census. Retrieved from http://ottomilacensus.istat.it/provincia/080/,accessed on 26/05/2017.
Community collaboration is deemed as a rural restructuring strategy (Baker, 1993).
According to interviews with key stakeholders, Riace has freed itself from an over-
dependency on traditional agricultural economy and moved towards new economic sectors.
Tourism is a good example. By adding value to the Heritage, both material and immaterial,
the host community and guest community collaborate to help promote tourism development.
In Riace, for example, various artistic laboratories were established where immigrants can
work as apprentices to learn handicrafts (see Figure 7), just to name a few, laboratories of
glassware, embroidery, weaving (with traditional wooden looms), jam, etc. The handicrafts
normally bear strong territorial identity, and they are popular commodities on the tourism
market (see Figure 8). Community collaboration of this kind has not only added value to local
Heritage and promoted the territorial identity, but also generated income for both the host
community and guest community. Needless to say, this has contributed to local economic
development.
Apart from artistic laboratories, the host community and the guest community collaborate,
under the guidance of Città Futura, to revitalise agricultural production by reclaiming
abandoned farming lands. A good example is the “Didactic Farm” (see Figure 9) dedicated to
immigrants. This “Didactic Farm” allows immigrants to take advantage of the tools and
facilities needed for agricultural work. For examples, they are instructed how to raise
domestic animals in the small buildings on the farm (as is shown on the picture below).
Town Indicators 1991 2001 2011
Roghudi Unemployment rate 44.5 15.3 7.4
Riace 39.4 19.8 22.9
Figure 8: Boutique selling local
handicrafts while promoting fair trade
concept © A. Errigo (2017)
Figure 7: Immigrant weaving in a
laboratory © A. Errigo (2017)

972
Figure 9: Panoramic view on the “Didactic Farm”
© A. Errigo (2017)
3. CONCLUSIONS
As the literature available demonstrates, currently academic discussions on civic spaces
seldom deal with the socio-economic impacts of civic spaces, especially in a multicultural
community. This research found that the emerging civic spaces in Riace are mainly
represented and fostered by autonomous NGOs (under the coordination of the institutional
leadership, namely, the mayor) and collaboration between the host community and the guest
community. The emerging civic spaces do contribute to the integration of immigrants, and at
the same time, the promotion of an innovative local socio-economic development. The socio-
economic development in Riace proves to be innovative mainly because, firstly, local NGOs,
Città Futura in particular, play a proactive role in promoting social and economic inclusion
by building up a cohesive multicultural community. Housing provision for immigrants,
conscious urban design, amenities improvement and public spaces diversification are crucial
contributing factors leading to the success of Riace. Secondly, according to the needs of all
community members, the historic centre of Riace has been regenerated and revitalised by
mobilising the idle physical capital, namely, abandoned buildings. During the regeneration
process, mixed use strategy, as the project Global Village shows, has been an effective,
innovative tool for Riace to achieve both social integration and inclusive job creation. This
strategy finally contributes to increasing community cohesion and local economic
development through a value-adding of its Heritage (handicrafts for instance). Last but not
the least, collaboration between the host community and the guest community has not only
helped build up Riace’s social capital which is vital for its emerging civic spaces, but also
contribute to its economic development, as the artistic laboratories and “Didactic Farm”
demonstrate.
It is desirable that the findings of this research serve as an empirical reference for policy-
making, especially for other communities in Calabria Region which have similar socio-
economic challenges. Policy-makers would integrate into local development initiatives an
innovative approach to local socio-economic development which is driven by emerging civic
spaces. Besides, it is equally hoped that the role of civic spaces in innovative socio-economic
development would be popularly acknowledged by both the academia and policy-makers, and
more importantly, brought into play locally.
973
Due to space limitation, the research didn’t discuss the role of the public sector in fostering
the civic spaces, which is unarguably important in Riace. Future research may well fill this
gap. In addition, it would be interesting to compare Riace to other minor historic centres
which see emerging civic spaces as well. Finally, as Daniere (2003: 4) points out, that civic
spaces “require rules of access and use if they are to function in an inclusive, fundamentally
non-violent and civil manner”, one more question for future research is, how should these
civic spaces be properly managed and regulated?
4. ACKNOWLEDGMENT
This research was undertaken within the MAPS-LED project, which has received
funding from the European Union’s Horizon 2020 research and innovation programme
under the Marie Skłodowska-Curie grant agreement No. 645651. Hereby, the authors would
like to extend their sincere thanks to all participants in the interviews, especially to Mr.
Domenico Lucano, the Mayor of R
5. REFERENCES
Abrahamson, W.H. (2008). New Civic Landscapes: Manifesting Cultural Sustainability and Civic Myth in
Urban Public Places. Massachusetts Institute of Technology.
Aswad, S. (2013). Local Development Planning and Community Empowerment in Decentralised Indonesia: The
Role of Local Planning in Improving Self Organising Capabilities of Local Communities in Takalar,
Indonesia. Queensland University of Technology.
Baker, H. R. (1993). Restructuring Rural Communities. Part 1: with Special Emphasis On Multicommunity
Collaboration. University Extension Press.
Balassiano, K. (2011). “Civic Space Production and Local Government Capacity: Lessons from Muang Klang,
Thailand”. Sojourn Journal of Social Issues in Southeast Asia. 26(1), pp. 58-79.
Cundill, G. & R. Rodela (2012). “A Review of Assertions About the Process and Outcomes of Social Learning
in Natural Resources Management”. Journal of Environmental Management. 113 (1), pp. 7-14.
Daniere, A. & M. Douglass (2008). The Politics of Civic Space in Asia: Building Urban Communities.
Routledge.
Daniere, A. (2003). “Civil Society for Itself and in the Public Sphere: Comparative Research on Globalization,
Cities and Civic Space in Pacific Asia”. Conference Proceedings of the 2nd GRAD Conference. Vancouver,
June 14-16, 2003.
Douglass, M. & A. Daniere (2008). “Urbanization and Civic Space in Asia” in A. Daniere & M. Douglass (eds.)
Building Urban Communities: The Politics of Civic Space in Asia. London: Routledge.
Goldsmith, S., G.E. Georges, T.G. Burke & M.R. Bloomberg (2010). The Power of Social Innovation: How
Civic Entrepreneurs Ignite Community Networks for Good. Jossey-Bass.
Huq, P. A. (2013). Leading to Participatory Local Governance? Participation, Empowerment and Community-
Driven Development. Flinders University.
Kolo, J. (2002). “Civic Innovation in America: Community Empowerment, Public Policy, and the Movement
for Civic Renewal”. Public Organization Review. 2(2), pp. 193-97.
Serrano, R., Warren, D., & Helling, L. (2010). “Linking Community Empowerment, Decentralized,
Governance, and Public Service Provision through a Local, Development Framework”. SP Discussion
Paper. No. 535.
Strzelecka, M. (2011). “Rural Tourism and Community Empowerment: Practice of Local Democracy in
Pomerania”. University of Illinois.

974
ID 072
FROM BROWN-FIELDS TO INNOVATION DISTRICTS: A
COMPREHENSIVE APPROACH TO SUSTAINABILITY
L. Biancuzzo
PAU Department, Università degli Studi Mediterranea di Reggio Calabria, Salita Melissari, 92124, Reggio
Calabria, Italy
Email: [email protected]
Abstract: In the globalisation era, the future of older industrial cities will result from their ex-
pertise on investing into their underutilised assets in order to keep being competitive globally;
it is therefore necessary to revitalise the land known as brown-field. An emerging urban
model, the innovation district, puts forward ground breaking promises about its ability to cope
with this specific challenge, standing as a driver for a sustainable and inclusive economic
devel-opment. This paper aims to show the degree to which innovation is effective in giving a
mean-ingful response to brown-field problems, first by considering a conceptual framework to
assess the comprehensive approach aimed at improving the social, economic and physical
issues in-herent to post-industrial landscapes; then by testing it through empirical research
work. To support the discussion with evidence, the Boston Innovation District case study will
be investi-gated, pointing out the policies and planning initiatives undertaken in the Seaport
area. Find-ings from this research highlight the innovative-led approach effectiveness in
matching all the issues considered as relevant to sustainable brown-fields redevelopment, and
useful lessons can be drawn in encouraging planners and policy-makers towards considering
the role of in-novation in urban regeneration initiatives targeting distressed areas.
Keywords: Brown-field Redevelopment, Innovation District, Local Economic Development,
Sustainability.
1. INTRODUCTION
Deindustrialisation has left tangible traces on the territorial geography; thus, some of the
areas where once vital industries used to thrive have been replaced by brown-fields (Bartsch
& Collaton 1997). Nowadays, a wide consensus exists on the need to take actions - targeted
at revitalising the stagnant economy in these distressed markets, while restoring a safer and
uncontaminated urban environment, and ensuring environmental justice (Dernbach 1998;
Ruthl 1998), within broader smart growth policies which promote compact development and
land consumption reduction (Greenberg et al. 2001). Although several research studies
attempted to face the challenge of how to plan, manage and assess brown-fields
redevelopment complying with the principles of sustainability (Boer 1995; EPA 2015;
RESCUE 2003), less emphasis has been placed on the potential key role of innovation,
despite its recognised ability to foster economic growth (Katz & Wagner 2014). This paper
puts the body of knowledge forward on the nexus between brown-field regeneration and
innovation, by analysing the capability of the newly conceived “re-imagined urban areas”
model to achieve the objectives of sustainable brown-field redevelopment. To do that, the
paper investigates the Boston Innovation District case study, by focusing on the
implementation process of the innovation-led strategy undertaken by the Boston
Redevelopment Authority (BRA). Accordingly, the planning initiative sought to guide
economic, social and physical changes in the Seaport area in order to create a neighbourhood
consistent with the highly innovative Boston’s environment. This paper is organised in five

975
parts. Following this introduction, it provides a scientific background through an overview of
theoretical approaches to brown-field redevelopment and prevailing assessment
methodologies in terms of sustainability, introducing the concept of innovation in the
sustainable development context. In the third part, the methodology that determined the
objectives of each dimension for the sustainability assessment model is presented, followed
by the description of the case study. Next, the Boston Innovation District achievements are
analysed, and how these outcomes might affect the further planning practices is discussed.
Finally, findings and conclusions are presented in the fifth part.
2. RESEARCH BACKGROUND
This paper aims to present one of the most common phenomenon lately facing communities
in the Western countries: the land classified as brown-field, focusing on the outcomes of its
regeneration process.Three issues of the growing literature, dealing with the
abovementioned area of concern, focused on the United States perspective, make a significant
contribution to the understanding of the topic: (1) the literature exploring the reasons brown-
field regeneration is considered a strategy for local economic development, (2) studies
examining the innovation district urban model as a powerful driver for a sustainable
economic development, and (3) the literature attempting to assess the impacts of brown-field
reclamation in heading towards sustainability.
2.1 Brown-field Redevelopment as a Local Economic Development Strategy
To set the context between brown-field redevelopment and urban regeneration, a preliminary
investigation of the process which led to the creation of derelict land and sites is presented.
Over the past few decades, the great economic powers, Europe and the United States, have
experienced considerable processes of change in terms of spatial, social, environmental and
economic arrangement. The glorious days of several industrial cities came to an end when the
reallocation of many factories to foreign countries started the process of deindustrialisation.
Even more significant in the context of globalisation, industrial activities have undergone
substantial changes due to a shift from manufacturing to service economies, which has
resulted in the downsizing of enterprises as well as the complete loss of whole production
industries. These significant transformations have left tangible traces on the territorial
geography; thus, some of the areas where once vital industries used to thrive have been
replaced by vacant and most likely polluted land, strongly affecting the citizens who live
close to them (Bartsch & Collaton 1997; Olivier et al. 2005; Adams et al. 2009). These sites
are known as brown-fields. While individual nations hold independent definitions of brown-
field sites, the American context commonly refers to “abandoned or underutilised industrial
and commercial facilities where expansion or redevelopment is complicated by real or
perceived contamination” (Knox & McCarthy 2012). In addition, “The Environmental
Protection Agency estimates the number of brown-fields located in the U.S. to be between
500,000 and 1,000,000” (EPA 2012).
Given the impressive figures, the presence of brown-field sites across the country represents a
significant urban management problem; additionally, it has been documented that beyond the
scale and spatial configuration, the existence of brown-fields has multiple adverse effects, not
only over the environment, but also on the economic and social health of an entire region
(COBRAMAN 2009). These sites have been held up as “blights of the neighbourhoods, able

976
of discouraging economic development and undermining local [government] tax bases”
(Preston 2003); moreover, they often serve as gathering sites for the downtrodden citizens of
a community, which inevitably leads to neighbourhoods in greater decline in pure economic
terms (Sirmans & Macpherson 2003). Beside the economic and societal impacts, the concept
of brown-field as an environmental issue has to be highlighted, due to the increasing number
of abandoned areas with real or plausible hazardous contamination, representing a heartfelt
public concern.
As a consequence of the afore mentioned reasons, in the last decades, federal, state, and local
governments redirected their priorities to regenerate unproductive lands. As a matter of fact,
brown-fields redevelopment is considered the preferable method to fight the decaying
phenomenon of core inner urban areas, enhancing the quality of inner cities environments
(Dixon et al. 2010); and a powerful smart growth policy which promotes compact
development and significantly reduces land consumption (Greenberg et al. 2001). In support
of this, it has been demonstrated that “putting clean land back into productive use brings with
it a range of social and economic benefits that will strengthen those communities for years to
come” (EPA 2015) by providing a remarkable opportunity for the redevelopment of the
social equity, economic stability, and environmental equilibrium. Traditionally, brown-fields
remediation results in a deep community economic revitalisation and job creation, significant
neighbourhood restoration, not to mention the meaningful reduction of the development
pressures on green-fields through the reuse of urban space (PCSD 1998). Moreover, cleaning
up abandoned industrial sites leads to a twofold advantage in terms of economic opportunities
and investments: on the one hand, the private sector benefits from the convenient chance to
purchase properties at below market price and make profits thanks to the financial and
technical assistance they obtain to clean them up; on the other hand, state and local
governments create economic viability through a variety of financial incentives and fiscal
exemptions which facilitates and accelerates the development process (Verbit 2001).
However, for years now, brown-fields run up against the increasing scepticism towards the
revitalisation of neglected sites; strict environmental and economic policies are commonly
considered to be a major barrier to redevelopment, combined with the expensiveness of
assessment and rehabilitation practices, and the difficult management of such a significant
scope projects (BenDor & Metcalf 2005). To overcome these obstacles, it is worth evaluating
to what extent brown-field redevelopment programs "pay for themselves" by generating
economic (jobs, wages, increases in property values) and fiscal (increased tax revenues
without increasing tax rates) benefits (Frank 2014). The attempted literature highlights the
potentially remarkable results of investments in the distressed areas, as emphasised by the
United States Conference of Mayors report (2008), which provided data relative to a
compilation of a questionnaire responded by more than 200 US cities - belonging to more
than 41 different states - that have been involved in a brown-field redevelopment project. The
cities were asked to identify the four most important benefits as a result of the regeneration:
neighbourhood revitalisation was the most frequently cited benefit, along with job creation,
and an increase in city’s tax base and environmental protection. On the same line, the
Chicago Metropolitan Agency for Planning (2008) gives credit to the wide-ranging benefits
of bringing a site back to active use, focussing on the opportunity for businesses to thrive
creating new jobs and attracting private investments. In sum, a single site intervention entails
remarkable spill-over effects on the quality of life for people living in neighbourhoods with
brown-field sites and on the economy of the entire region (Chilton et al. 2008).

977
2.2 Innovation Districts: a driver for a sustainable economic development
One sound argument in response to the challenge of post industrial sites comes from a new
urban and economic redevelopment strategy: the creation of innovation districts. Innovation
districts have been considered an emerging urban model, a product of the shift in the spatial
geography of innovation occurred over the last few years in several cities and metropolitan
areas in the United States and other countries (Feldman 1994). A growing number of talented
workers and innovative firms chose to move from the spatially isolated suburban corridors -
places best exemplified by the Silicon Valley in the San Francisco Bay Area - and cluster
spatially in compact and more desirable areas in the inner city; at the same time, an
increasing share of citizens is drawn to these districts, given the shifted location preferences
toward more vibrant and amenity rich places to live and work (Audretsch & Feldman 2003).
The purposes behind the rise of innovation districts are clear: to create a dynamic place where
entrepreneurs and knowledge-intensive businesses can share ideas, and benefit from the
impact of proximity on learning and knowledge spill overs, increasing their competitive
advantage (Boschma 2005). Nevertheless, the trend is still recent and, lacks a univocal
definition due to its multi-dimensional nature. As stated in the influential Brookings
Institution report, edited by Bruce Katz and Julie Wagner (2014), the term innovation district
is mostly used to identify “geographic areas physically compact, transit-accessible, and
technically-wired where leading- edge anchor institutions and companies cluster and connect
with start-ups, business incubators, and accelerators. They also offer mixed use housing,
office, and retail.” As the afore mentioned explanation suggests, these districts perfectly
embody the comprehensive concept of “cityness” coined by Saskia Sassen (1991): the
complex intersection of differences embedded in these urban spaces produces something
new; proximity and density, together with diversity of people, subcultures, practices, lead to
innovation indeed. The affirmation of this concept is translated into reality in “new or
improved ideas, products, services, technologies, or processes creating new market demand
or cutting-edge solutions to economic, social and environmental challenges” (Katz & Wagner
2014).
Additionally, innovation district urban forms and functions cannot be defined a priory; given
their ability to leverage the economic strengths of the specific metropolitan area in which
they locate, they significantly vary by type and size, but also differ in specializations for
growth - some of them slant toward life sciences, while others are focused on the information
technology sector or different highly creative industries (Read 2016). Whether the districts
have been strategically planned or represent the spontaneous response to the market forces,
they all contain a powerful and unique combination of economic, physical, and networking
assets (see Figure 30) which, brought together in geographic proximity, stimulate the idea
generation facilitating the entrepreneurial activity (Giuffrida et al. 2015).

978
All of
these
observations highlight how
this new approach to economic development takes place. Under the assumption that
innovation districts have the unique capabilities to foster an inclusive and sustainable
economic development, they contribute to address three of the modern-day plagues: the
stagnant economy of the post recession period, the growing inequality that is damaging
today’s social structure, and the environmental threat due to the extensive sprawl. To this
end, the most convincing line of evidence supporting this theory, are observations drawn
from the “re-imagined urban areas”, one of the three general models of District (Katz &
Wagner 2014; Montini 2014). Accordingly, historic waterfronts and de-industrialised areas
are the subject of physical and economic transformations charting a new path of innovative
growth (Clark & Moonen 2015).
2.3 Assessing the Sustainability of Brown-field Redevelopment
As the first sub-section suggests, brown-field land use strategies clearly fit in the
sustainability paradigm; brown-field revitalisation became one of the main issues to take into
account to achieve a sustainable development indeed (Boer 1995; Dorsey 2003). On this
matter, the number of references the literature makes is relevant, as demonstrated by the
several federal agencies’ initiatives targeted at the promotion of brown-fields “sustainable
reuse” (EPA 2015). These actions aim for economic growth in the distressed property market,
while improving the living conditions of neighbouring residents - as known as environmental
justice communities, extremely affected by economic, social and environmental inequalities.
(Dernbach 1998; Ruthl 1998).
Although the idea of sustainable development has significantly changed over the past decades
and it can be defined in many ways, broad consensus is reached on the triple bottom line
framework (Elkington 1998). The comprehensive approach rests therefore on “three pillars:
economic growth, social progress and protection of the environment and natural
resources”(Annan 2002), representing the core of the sustainability vision of the widely cited
Brundtland report (WCED 1987) that refers to the potential of meeting the “needs of the
present without compromising the ability of future generations to meet their own needs.” A
particularly important milestone in the attempt of translating the sustainability concept into a
“solid basis for decision making at all levels” (Capello & Nijkamp 2002), was the drafting of
two documents: the Rio Declaration on Environment and Development (United Nations
1992b) and the Agenda 21 (United Nations 1992a); within the afore mentioned, a well
structured framework has been defined, providing recommended actions and detailed
activities the governments should undertake in order to achieve sustainable development
practices, accordingly to the desired performances. From then on, several frameworks have
been developed in the attempt of providing an exhaustive assessment of the sustainability
Economic Assets
firms, institutions and organizations that drive, cultivate or support an innovation rich environment
i) innovation drivers ii) innovation cultivators iii) neighbourhood amenities
Networking Assets
relationships and social ties that connect employees and institutions
i) strong ties ii) weak ties
Physical Assets
relationships and social ties that connect employees and institutions
i) spaces in the public realm ii) spaces in the private realm iii) assets that join spaces together
Figure 30: Common Features of Innovation Districts (Author's elaboration
based on Katz & Wagner 2014)

979
threefold component, but not without disputes over the choice and suitability of the aspects to
be covered and their proper calculation (Hueting & Reijnders 2004).
However, in order to point out the uniqueness of a brown-field redevelopment effort,
distinguishing it from a conventional urban redevelopment initiative, it is deemed necessary
to properly define a sustainable brown-field redevelopment process as “the management,
rehabilitation and return to beneficial use of brown-fields in such a manner as to ensure the
attainment and continued satisfaction of human needs for present and future generations in
environmentally sensitive, economically viable, institutionally robust and socially acceptable
ways within the particular regional context” (RESCUE 2003). The complex combination of
planning policies, public and private initiatives, diverse stakeholder interests and technical
skills, have an impact not only on the implementation process, but above all on the
sustainability of the outcomes.
In support of the findings raised above, a great deal of uncertainty, regarding the
measurement of the intended and unintended spill over effects of brown-fields regeneration,
generated an impressive theoretical debate on the construction of sustainability frameworks
in order to manage and assess the revitalisation of distressed areas. Some authors claim that,
to successfully achieve a sustainable brown-field development, the holistic principle of
sustainability has to be embedded in the entire process. One sound argument in support of
this theory comes from the Model Framework devised by the Environmental Protection
Agency (1999), that aims at guiding the stakeholders to properly structure the planning and
development process, in order to direct their efforts towards a viable and sustainable brown-
field redevelopment. Nijkamp et al. (2002) likewise propose a qualitative impact assessment
model to provide a detailed description of the procedures to be followed, ensuring the critical
success factors for a sustainable brownfield rehabilitation. According to this train of thought,
the Redevelopment Assessment Framework provides a procedure that “informs stakeholders
about the sustainability performance in a practical way” (Pediaditi et al. 2005) guaranteeing
that sustainability is addressed and monitored across the life cycle of a brown-field site. Other
scholars consider the evaluation a priori crucial to fulfil the sustainable brown-field
development objectives. Specifically, the adoption of a decision-support system is seen as
crucial to significantly reduce the uncertainties and the complex decision making process
concerning the sustainability values of different land use scenarios for brown-fields. The
computer-based module proposed by Bleicher & Gross (2010) deals precisely with this
theory, as well as the approach chosen by Schädler et al. (2011). According to these
assessment methods, through a comparative analysis of alternative brown-field rehabilitation
options, the degree of sustainability is calculated, and the optimal redevelopment option is
chosen. Still other authors place the emphasis on the methodology to be applied in order to
measure the performance of brown-field regeneration processes according to sustainability
principles. In this regard, the Principle - Criteria - Indicators framework approach describes
the attempt to capture the complexity of the measurement starting from the definition of the
three main sustainability dimensions, moving to the identification of specific objectives that
have to be assessed through properly chosen indicators (Worrall et al. 2009). The
Sustainability Assessment Tool is another good illustration of a three steps methodology
which provides a wide range of qualitative and quantitative criteria to evaluate how
sustainable a brown-field regeneration project is, on the basis of objectives, indicators and
best practices (Franz et al. 2006). Accordingly, the framework built by Sardinha et al. (2013)
consists in validating the achievement of six sustainability dimensions - environmental
reconversion, cultural regeneration, social revalorisation, economic revitalisation, community
reinforcement and strategic reframing - through the identification and application of some

980
categories for action. Furthermore, the measurement of sustainability is in many cases subject
to a preliminary and well structured selection of indicators. This practice is well exemplified
by the indicator based approach, applied by Hemphill et al. (2004), where the complex
procedure of choosing the potentially relevant indicators is broken down into rigorous steps
and followed by a points scoring phase, ensuring a comprehensive and transferable
framework to quantify the sustainability of brown-fields revitalisation. Other researchers
apply a similar methodology to select indicators capable of measuring the brown-field
redevelopment success in terms of environment-health, finance, livability, and social-
economic sustainability through a partially automated tool (Wedding & Crawford-Brown
2007), while still others consider the definition of economic and environmental performance
indicators instrumental for measuring the unequivocal recognition of the sustainability
achievements (Bacot 2006).
Despite the above mentioned debates, it appears commonly recognised that sustainability
calls for context sensitive evaluation criteria, given its strict reliance on temporal, spatial and
thematic context; thus, the selection of the most appropriate indicators lie with the local
stakeholders and are tailored to reflect the site specific situation (Franz & Nathanail 2005;
Olsson 2009). Hence, the local context dictates the specific sustainability needs, as defined by
the local authorities and decision-makers’ expectations. This implies that, on the one hand the
stakeholders involved in the land reuse play a key role in the sustainability achievements,
having a direct impact on whether the development is sustainable (Williams & Dair 2007); on
the other hand, it determines the impossibility to apply a standardised list of indicators to
measure “some unspecified type of sustainability brownfields” (Bleicher & Gross 2010).
In sum, while evaluating the current state of the art for the body of knowledge reviewed, it
became clear that innovation, through the “re-imagined urban areas” model in particular, is
potentially able to give a meaningful response to the problems shown by de-industrialised
areas, leveraging the assets already present within the existing city limits. However, a gap in
research about the nexus between brown-field and innovation district multiple positive effects
(over the environment, on the economic and social health of the entire region) has been
found. This paper puts forward the application of an objective-led framework designed to
assess the sustainability of brown-fields development in order to capture the above mentioned
relationship.
3. RESEARCH METHODOLOGY
In the light of the findings raised above, the inclination to measure brown-fields
redevelopment sustainability according to specific indicators is quite misleading. A better
understanding of the innovation multiple response can be achieved by approaching the
research from a more comprehensive perspective, thus, by taking into consideration criteria
that illustrate the general values recognised by the society.
The objectives-led approach adopted by Williams & Dair (2007) provides a framework broad
enough to embrace the diverse contexts of brown-field redevelopment and the
multidimensionality of impacts. It allows the author to effectively assess the sustainable
development in the context of land reuse through a better insight of cause and effect; in
addition, it also leads to the derivation of general principles from it, since it facilitates the
transposition of abstract concepts - such as economic, social and environmental
sustainability, into tangible practices. According to the method, all the range of potential key

981
stakeholders should be first identified in order to investigate what can be achieved in terms of
sustainability by their participation in land reuse. Subsequently, the objectives-led model is
devised, which relates to the development of several precise sustainability objectives,
deducted from a sound knowledge of the state of the art, regarding the economic, social and
environmental systems (see Table 7).
Table 7: Sustainability objectives to be met in brown-field developments (Source: Williams &
Dair, 2007)
Economic sustainability objectives
1. To enable businesses to be efficient and competitive
2. To support local economic diversity
3. To provide employment opportunities
Social sustainability objectives
1. To adhere to ethical standards during the development process
2. To provide adequate local services and facilities to serve the
development
3. To provide housing to meet local needs
4. To integrate the development within the locality
5. To provide high quality, liveable developments
6. To conserve local culture and heritage, if appropriate
Environmental sustainability objectives
1. To minimise the use of resources
2. To minimise pollution
3. To protect biodiversity and the natural environment
First, as far as the sustainable economic development is concerned, the perspective adopted in
the model reflects the prevailing approach of the last 20 years considering the brown-field
revitalisation as an opportunity to foster sustainable economic growth through the objectives
spelt out within the framework. Second, the model confirms its proper assessment
methodology with regard to the social issue as related to the environmental conditions; hence,
the factors affecting individuals and human well-being have been considered, together with
the aspects associated with the development of social capital. Third, when it comes to
environmental sustainability, the brown-field redevelopment is deemed to be, according to
the well developed literature, a successful strategy to restore the natural ecosystem by the
implementation of the objectives set out in the model.
By taking the abovementioned criteria as a starting point, an attempt of a qualitative
evaluation of the impact of innovation on brown-field redevelopment sustainability is carried
out. Therefore, the empirical research, developed on a purposely selected US area, aims to
apply a methodology to examine to what extent the main sustainability outcomes have been
achieved, through a qualitative direct analysis.
The conceptual model is tested on a case study that has been analysed in the framework of
the wider international MAPS-LED Project, designed to investigate the spatial dimension of
Smart Specialisation Strategies, with the purpose of exploring the key role of S3
implementation in placed-based regeneration policies. Accordingly, through a spatially-led
approach, the urban dimension ability to foster knowledge dynamics promoting innovation
within the Greater Boston area has been investigated. Thereby, the physical localisation of
innovation within an urban territorial scale has resulted in the identification of several case

982
studies, among which the Boston Innovation District planning initiative has been chosen -
given the outstanding implementation of an innovation-led brown-field redevelopment
initiative. Therefore, this study adds an additional element to the original research, to allow a
deeper understanding of how the Boston Innovation District fostered the process of brown-
field revitalisation from a sustainable development perspective, with the aim to provide
transferable instruments and recommendations.
The empirical analysis has been conducted with a research methodology based on a two-step
approach. Initially, secondary data have been the subject of an in-depth analysis: the main
urban attributes and key socio-economic indicators were collected in order to improve
knowledge on the specific features of the context; in addition, qualitative planning and
financial documents were gathered to retrace the urban development activities undertaken in
the Boston Seaport area over the last few decades. A direct analysis of the case study, mostly
based on field work and interviews, has been performed at a later stage: an active
participation during meetings and events held in incubators was ensured, multiple valued
visual analysis of the urban environment was carried out and supported by photographic
evidence, as well as the organisation of semi-structured and informal interviews with key
informants conveniently sampled. Finally, in order to test the conceptual model, each
sustainability objective has been mapped on the findings of the extensive qualitative
observations and data collection.
3.1 Case Study Description
The Boston Innovation District provides an outstanding case study of brown-field
revitalisation project (Cohen 2014). The underused Boston’s South Waterfront has been
converted into a centre of knowledge economy: an urban environment that fosters innovation,
collaboration, and entrepreneurship (Menino 2010b). The geographic area dates back to the
19th century when it was a hub of fast-growing industrial development, serving as home to
rail yards and manufacturing companies for Boston’s working port until about 1955.
Successively, the development of transportation infrastructure, with the construction of the
elevated Central Artery highway and the Interstate 93, made it hardly accessible, isolating the
district and marking its decline. A radical change took place when the Seaport District has
been integrated into Downtown Boston again, with the completion of the Big Dig project.
Inspired by the successes of 22@, the world's first innovation district located in Barcelona,
Mayor Thomas Menino, in the Inaugural address (2010a), announced his vision of
redeveloping the large declined industrial waterfront, calling for a “more deliberate and more
experimental approach” in order to create a “hub for knowledge workers and creative jobs.”
As in Barcelona, the Boston Innovation District has employed an economic development
strategy where government operated as the regulatory and administrative gatekeeper, working
collaboratively with cross-sector private enterprises to enhance the chances of succeeding and
affecting such a large scale change. Key private-sector players have been personally engaged,
and the public sector openly advocated for financial incentives in order to spur established
companies and emerging entrepreneurs to move into the District, creating new jobs and
providing tax revenues to fund public services. Hence, a dense community of innovators and
entrepreneurs has been created increasing proximity and density, according to the notion that
“people in clusters innovate at a quicker rate, sharing technologies and knowledge easier”
(Muro & Katz 2011). In line with Brookings Institution researchers’ thought, the Boston
Innovation District represents a remarkable example of sustainable economic development
aimed at revitalising an underutilised parcel of land. It provides a favourable environment for
983
the launch and growth of firms by helping entrepreneurs and investors, universities and
researchers generate new findings for the market; at the same time, it fosters employment
expansion through a massive job creation phenomenon densifying the employment patterns;
additionally, it facilitates the repopulation of an influential urban area, encouraging a dense
residential structure and strengthening mass transit.
4. CASE STUDY RESULTS AND DISCUSSION
The objective-led model has been used as a research tool in the case study of the Boston
Seaport regeneration. An extensive analysis, carried out between April 2016 and today in the
Boston metropolitan area, allowed the author to assess the brown-field redevelopment against
the above mentioned criteria related to the threefold sustainability objectives. The main
purpose was to advance the body of knowledge on the nexus between brown-field and
innovation, by assessing the degree of sustainability achievements and giving credit to the
trend that considers innovation as a comprehensive strategy that invests on the cities
underutilised assets in order to boost an inclusive and sustainable growth. The findings from
the investigation are summarised and discussed in the following sub-sections.
4.1 Economic sustainability objectives
The South Boston Waterfront Public Realm Plan (BRA 1999), followed by the Municipal
Harbour Plan (BRA 2009), have been issued with the specific purpose of supporting
businesses to be efficient and competitive through the Seaport physical environment
adaptation. Specifically, the underutilised land was the planning context for the development
of a 24-hour neighbourhood providing a place for business expansion, supported by an
attractive open space network and a strong urban design character. Furthermore, the
construction of the Central Artery Tunnel Project, the Silver Line completion, and the
strengthening of the MBTA buses have been instrumental in providing a convenient system
of transport infrastructure, ensuring links from the site to the main transport corridors.
Another success factor for the sustainable economy of the area is represented by the
willingness to welcome every kind of industries; the area is indeed characterised by a broad
inclusivity of established companies and small enterprises providing a wide range of
economic activities which maximise job opportunities for local workforces. “More than 5,000
new jobs have been created in the Innovation District since 2010, as over 200 startups have
set up shop in the area. From software and digital marketing to manufacturing and design, the
Innovation District’s young firms span a wide array of industries and business models. The
support infrastructure that these young companies need to grow, including incubators and
accelerators, as well as law, design, advertising, and other professional services firms, has
also moved to the District, providing a healthy ecosystem for innovative companies to thrive”
(TIP 2014). Moreover, to ensure an adequate accommodation for companies, maximum
flexibility for the use of the buildings is assured; most of the buildings are therefore designed
to accommodate different types of groups and gatherings, concept best exemplified by the
District Hall (see Figure 31) and the Innovation & Design Building.

984
Figure 31: District Hall (Author's pictures)
4.2 Social sustainability objectives
The factors affecting individuals and human well-being, together with the aspects associated
with the development of social capital are at the core of the strategic plan that identifies key
actions and initiatives to transform the Seaport area into a healthy, thriving and innovative
district. Expanding Opportunities stands for the citizens’ vision coupled with the Mayor’s
priorities and research, guiding the growth of the district towards creating a liveable
neighbourhood for all residents and generations to come (Image Boston 2016). At the same
time, Boston Creates strives to encourage the city’s arts and culture sector in order to make it
more inclusive and equitable (Boston Creates 2016). The Go Boston 2030 (2015) initiative
actively engages the community envisioning a bold transportation system. A high quality
architectural design and a master plan well integrated with the context, capable to attract
people and businesses to live, work and play, are the result of the InnovationBoston vision
(BRA 2010). The liveability is achieved by a diverse and dense complement of offices, retail,
restaurant, residences and entertainment uses - as highlighted by the newly conceived Seaport
Square (SSDC 2017), in order to meet people’s needs for education, healthcare and leisure,
but also to help communities develop social capital by providing space for formal and
informal social interaction. Numerous cultural and civic institutions are located in the
Innovation District, including the Children's Museum and the Institute for Contemporary Art,
while numbers of experimental event landscape, such as The Lawn On D and the Fan Pier
Park, have been successfully realised to bring together different communities, encouraging
social interaction and fostering creativity (see Figure 32)
Figure 32: Seaport District (Courtesy of BRA); Fan Pier (Author's pictures)
The Boston Innovation District also provides a mix of housing types including residents’
apartments, condominiums, and micro-unit options - without ignoring the affordability issue.
With the specific purpose of providing flexible housing options to meet the needs of local
people and entrepreneurs, the Boston Redevelopment Authority launched the Innovation
Housing Unit Experience (BRA 2010a) allowing developers to build 300 micro apartments to
help young professionals collaborate more effectively; such units can be found just in the

985
Seaport area at buildings like Pier 4, Flats on D, Watermark Seaport and Factory 63. The
efforts of meeting the growing and changing transportation needs of the Seaport, while
ensuring good connections to the rest of the city led to the South Boston Waterfront
Sustainable Transportation Plan (BRA 2015). The mobility and access to local services for all
has been improved, relying on a development design that considers a wide range of users
including children, people with disabilities and older people (BRA 2017). Furthermore, the
local culture and heritage related to the historic harbour have been firmly preserved (see
Figure 33), as demonstrated by the Seaport World Trade Centre, as well as the Massachusetts
Port Authority efforts towards the Boston Fish Pier conservation - a social and culturally
significant space that still represents the epicentre of Boston’s seafood industry after more
than a century; the original buildings’ structures are currently home to fishing vessels and
seafood processing businesses, several maritime industrial office tenants, and the Exchange
Conference Center (Massport 1976). Other historic brick warehouses are equally subject to
rehabilitation in order to host the headquarters of resonant companies, such as General
Electric (BRA 2016).
Figure 33: Boston Fish Pier and General Electric site (Author's picture)
4.3 Environmental sustainability objectives
Minimising the use of resources and pollution throughout the life cycle of the brown-field
redevelopment has been one of the main concerns of the innovation-led strategy. Indeed, with
the Boston Zoning Code Article 37 (BRA 2015a), the city requires that all large-scale
projects meet certain LEED certification standards. Accordingly, the Seaport District is home
to several green building best practices - such as the Fraunhofer Centre, Boston Design
Centre, District Hall, Waterside Place Apartments, The Boston Convention and Exhibition
Centre, which awarded high LEED ratings for their commitment in minimising negative
environmental impacts because of the way they were planned, designed, constructed, and
managed (USGBC 2017). Compliance with the environmental sustainability objectives is
ensured by the Seaport Square development project in which energy efficient building design
are complemented by infrastructure encouraging people to walk and cycle, direct access to
public transportation, and thoughtful consideration to open and green spaces that connect
with pathways to the waterfront.
4.4 Discussing the BID innovation-led brown-field redevelopment
The nexus between brown-field and innovation district has been proven through the
application of a robust and theoretically grounded objective-led model for assessing the
sustainability of brown-fields redevelopment. Based on the investigation of the secondary
data collected and the direct analysis performed, the planning initiatives and development

986
projects put in place within the Boston Innovation District have been slotted into the three
sustainability dimensions, as required by the structure of the framework proposed. As
illustrated above, innovation was able to physically and economically revitalise a disused
post industrial landscape, creating an attractive place and a vibrant ecosystem for wide-
ranging business expansions and job opportunities maximisation. Moreover, it provided
adequate housing, facilities and local services to meet individuals’ needs - thanks also to a
fruitful collaboration with the community, fostering social capital development and
contributing to residents well-being. Finally, regardless of the massive intervention, a
particular attention to the use of resources and pollution minimisation has been paid, together
with a thoughtful protection of the harbour as a shared natural resource. Hence, the case study
proved evidence of the effectiveness of innovative-led approach in matching all the issues
considered as relevant to the redevelopment of brown-fields. Useful lessons can be drawn in
encouraging planners and policy-makers towards considering the role of innovation in urban
regeneration initiatives targeting distressed areas, given its capability to turn an underutilised
property into an economic and environmental asset that yields dividends for the entire region.
5. CONCLUSIONS
The research is grounded on the widely recognised principle that older industrial cities have
to invest into their underutilised assets to become globally competitive again; therefore, the
effectiveness of the “re-imagined urban areas” model has been analysed according to the
objectives of sustainable brown-fields redevelopment. Thus, a purposely chosen methodology
to assess the Boston Innovation District sustainability has been applied, highlighting how
innovation is experimented with within a brown-field revitalisation context. This study
confirms the cities current propensity to issue innovation-oriented urban policies which, in
the specific case of Boston, seek to rehabilitate urban distressed areas operating as main
development driver after the economic downturn.
However, some findings raise legitimate questions about transferability issues. The Boston
Innovation District took shape in a geographically privileged area - the core of the historical
harbour, open to the surrounding urban grid and easy to be connected and integrated with it;
moreover, the Seaport area was not affected by relevant contamination problems, as well as
significant social deprivation issues. Also the significant critical mass played a key role; the
Greater Boston area, indeed, has been repeatedly mentioned as one of the most innovative
hubs within the US context, supported by the conspicuous presence of companies,
educational institutions, business incubators and accelerators that boost the innovative
ecosystem. Another relevant component that might have influenced the innovation-led
strategy was the strong continuity in the planning and management policies, despite a change
in the local administration and the long lead times for the project implementation; as a matter
of fact, the experimental framework characterised by high planning flexibility and expedited
decision making keeps being the leitmotif of the intervention.
In this respect, further research studies could attempt to provide a quantitative evaluation
regarding compliance of innovation with brown-fields redevelopment in terms of
sustainability achievements, by creating a set of indicators to both give a weight and prioritise
the objectives, so as to grade the performance, allowing the comparison with other cases. It
would be also worthwhile to explore other case studies, in order to observe the potential of
innovation as a driver for a sustainable economic development in brown-fields characterised

987
by real hazardous contamination and social decline, as well as to examine further areas where
the innovation component is less ingrained in the economic structure of the city.
6. ACKNOWLEDGEMENTS
This paper is based on research realised in the scope of the MAPS-
LED Project, Multidisciplinary Approach to Plan Smart
specialisation strategies for Local Economic Development, founded
by the European Commission through the Horizon 2020 Research
Programme - Marie Sklodowska Curie Actions RISE under the
Grant Agreement No. 645651.
7. REFERENCES
Adams, D., De Sousa, C. & Tiesdell, S., 2009. Brownfield Development: A Comparison of North American and
British Approaches. Urban Studies, 47(1), pp.75–104. Available at:
http://usj.sagepub.com/content/47/1/75.short.
Annan, K.A., 2002. The Secretary-General’s Message on World Environment Day, New York.
Audretsch, D.B. & Feldman, M.P., 2003. Knowledge Spillovers and the Geography of Innovation. Handbook of
Urban and Regional Economics, 4.
Bacot, H., 2006. Establishing Indicators to Evaluate Brownfield Redevelopment. Economic Development
Quarterly, 20(2), pp.142–161.
Bartsch, C. & Collaton, E., 1997. Brownfields: Cleaning and Reusing Contaminated Properties.
BenDor, T. & Metcalf, S., 2005. Conceptual Modeling and Dynamic Simulation of Brownfield Redevelopment.
Proceedings of the 23rd International Conference of the System Dynamics Society, p.21.
Bleicher, A. & Gross, M., 2010. Sustainability assessment and the revitalization of contaminated sites:
operationalizing sustainable development for local problems. International Journal of Sustainable
Development & World Ecology, 17(1), pp.57–66. Available at:
http://dx.doi.org/10.1080/13504500903488263%5Cnhttp://www.tandfonline.com/doi/abs/10.1080/1350450
0903488263#.VR5k8OH8ZYU.
Boer, B., 1995. Institutionalising Ecologically Sustainable Development: The Roles of National, State, and
Local Governments in Translating Grand Strategy Into Action. Willamette Law Review 307, 31, pp.342–57.
Boschma, R., 2005. Proximity and Innovation: A Critical Assessment. Regional Studies, 39(1), pp.61–74.
Boston Creates, 2016. Cultural Plan. Available at: http://plan.bostoncreates.org/wp-
content/uploads/2016/06/BostonCreates_ExecSummary_June2016_rspdf.pdf.
BRA Boston Redevelopment Authority, 2017. Accessibility Guidelines and Checklist. Available at:
http://www.bostonplans.org/planning/planning-initiatives/accessibility-guidelines-and-checklist.
BRA Boston Redevelopment Authority, 2015a. Boston Zoning Code Article 37, Green Buildings, and Climate
Change Preparedness Guidlines. Available at: http://www.bostonplans.org/getattachment/76c48774-c670-
4568-8e53-74931fa09fb5.
BRA Boston Redevelopment Authority, 2016. General Electric (GE) Headquarters Project PDA Development
Plan. Available at: http://www.bostonplans.org/getattachment/83a7fe48-dcaf-4492-afda-c97b2870c710.
BRA Boston Redevelopment Authority, 2010a. Innovation Housing Unit Experience.
BRA Boston Redevelopment Authority, 2010b. InnovationBoston. Available at:
http://www.bostonplans.org/business-dev/initiatives/innovationboston/overview.
BRA Boston Redevelopment Authority, 2009. South Boston Waterfront District. Municipal Harbor Plan
Amendment. Available at: http://www.bostonplans.org/getattachment/95495e05-9595-4989-9b21-
52930a9e57b0.
BRA Boston Redevelopment Authority, 2015b. South Boston Waterfront Sustainable Transportation Plan.
Available at: http://www.bostonplans.org/getattachment/f69f2335-529c-497b-b512-3c3b0830349b.
BRA Boston Redevelopment Authority, 1999. The Seaport Public Realm Plan. Available at:
http://www.bostonplans.org/getattachment/6add3767-6eb3-4a06-9d2d-03dd960391ad.
Capello, R. & Nijkamp, P., 2002. In search of sustainable human settlements. Ecological Economics, 40,
pp.151–155.

988
Chilton, K., Schwarz, P. & Godwin, K., 2008. Verifying the Social, Environmental, and Economic Promise of
Brownfield Programs,
Clark, G. & Moonen, T., 2015. Technology, Real Estate, and the Innovation Economy,
CMAP Chicago Metropolitan Agency for Planning, 2008. Personal communication with David Graham.
COBRAMAN, 2009. Report about concepts and tools for Brownfield redevelopment activities. CENTRAL
EUROPE Project 1CE084P4 COBRAMAN.
Cohen, A., 2014. THE DEVELOPMENT OF BOSTON’S INNOVATION DISTRICT: A Case Study of Cross-
Sector Collaboration and Public Entrepreneurship,
Dernbach, J.C., 1998. Sustainable Development as a Framework for National Governance. Case Western
Reserve Law Review, 49(1).
Dixon, T., Otsuka, N. & Abe, H., 2010. Cities in Recession : Urban Regeneration in Manchester ( England )
and Osaka ( Japan ) and the Case of “ Hardcore ” Brownfield Sites, Oxford Brookes University. Available
at: http://oisd.brookes.ac.uk/news/resources/REPORTDRAFTv8.pdf.
Dorsey, J.W., 2003. Brownfields and Greenfields: The Intersection of Sustainable Development and
Environmental Stewardship. Environmental Practice, 5, pp.69–76.
Elkington, J., 1998. Cannibals with Forks: the Triple Bottom Line of 21st Century Business,
EPA Environmental Protection Agency, 1999. A Sustainable Brownfields Model Framework,
EPA Environmental Protection Agency, 2012. Brownfields and Land Revitalization, Basic Information.
EPA United States Environmental Protection Agency, 2015. Basic Information | EPA Research | EPA.
http://www3.epa.gov/pm/basic.html. Available at: http://www3.epa.gov/pm/basic.html.
Feldman, M.P., 1994. The geography of Innovation,
Frank, N., 2014. Benefits of Public Investment in Brownfield Cleanup and Redevelopment,
Franz, M. et al., 2006. Sustainable development and brownfield regeneration. What defines the quality of
derelict land recycling? Environmental Sciences, 3(2), pp.135–151. Available at:
http://www.tandfonline.com/doi/abs/10.1080/15693430600800873%5Cnhttp://www.tandfonline.com/doi/fu
ll/10.1080/15693430600800873#.Ua2yEkAqzL8%5Cnhttp://www.tandfonline.com/doi/pdf/10.1080/15693
430600800873.
Franz, M. & Nathanail, P., 2005. A sustainability assessment framework for brownfield regeneration. In
Sustainable Brownfield Regeneration in Europe - Improving the Quality of Derelict Land Recycling. p. 18–
30.
Giuffrida, G., Clark, J.J. & Cross, S.E., 2015. Putting Innovation in Place: Georgia Tech’s Innovation
Neighbourhood of ‘Tech Square,
Go Boston 2030, 2015. Vision and Action Plan.
Greenberg, M. et al., 2001. Brownfield redevelopment as a smart growth option in the United States.
Environmentalist, 21(2), pp.129–143.
Hemphill, L., Berry, J. & Mcgreal, S., 2004. An Indicator-based Approach to Measuring Sustainable Urban
Regeneration Performance : Part 1 , Conceptual Foundations and Methodological Framework. Urban
Studies, 41(4), pp.725–755.
Hueting, R. & Reijnders, L., 2004. Broad sustainability contra sustainability: The proper construction of
sustainability indicators. Ecological Economics, 50(3–4), pp.249–260.
Image Boston, 2016. Expanding Opportunities 2030. Available at: http://20222-presscdn.pagely.netdna-
cdn.com/wp-content/uploads/2016/11/Ib2030-Vision-Report-WEB-2016-11-17-SPREADS.pdf.
Katz, B. & Wagner, J., 2014. The Rise of Innovation Districts : A New Geography of Innovation in America.
Brookings Institution, (May), pp.1–34. Available at:
http://www.brookings.edu/~/media/Programs/metro/Images/Innovation/InnovationDistricts1.pdf.
Knox, P.L. & McCarthy, L., 2012. Urbanization: an introduction to urban geography 3rd editio., Boston:
Pearson Publishers.
Massport, 1976. Boston Fish Pier Feasibility Study.
Menino, T., 2010a. Inaugural Address.
Menino, T., 2010b. Panel Comments, Florence. Available at:
http://www.innovationdistrict.org/2010/12/02/ciao-innovation-district-menino-shares- bostons-innovation-
agenda-in-italy.
Montini, L., 2014. 3 Types of Thriving “Innovation Districts” in America. Inc.
Muro, M. & Katz, B., 2011. The New Cluster Moment: How Regional Innovation Clusters can Foster the Next
Economy. Entrepreneurship and Global Competitiveness in Regional Economies: Determinants and Policy
Implications, 22, pp.93–140. Available at: http://dx.doi.org/10.1108/S1048-4736(2011)0000022008.
Nijkamp, P., Rodenburg, C. a & Wagtendonk, A.J., 2002. Success factors for sustainable urban brownfield
development. Ecological Economics, 40(2), pp.235–252. Available at:
http://www.sciencedirect.com/science/article/pii/S0921800901002567.

989
Olivier, L. et al., 2005. The scale and nature of European brownfields. In International Conference on
Managing Urban Land LQM Ltd, Nottingham, UK, Belfast, Northern Ireland, UK. p. Available at:
http://www.cabernet.org.uk/resourcef.
Olsson, J., 2009. Sustainable development from below: institutionalising a global idea-complex. Local
Environment, 14(2), pp.127–138. Available at:
http://www.tandfonline.com/doi/abs/10.1080/13549830802521436.
PCSD President’s Council on Sustainable Development, 1998. Sustainable America: A New Consensus for
Prosperity, Opportunity, and a Healthy Environment for the Future,
Pediaditi, K., Wehrmeyer, W. & Chenoweth, J., 2005. Monitoring the sustainability of Brownfield
redevelopment projects. The Redevelopment Assessment Framework (RAF). Land Contamination &
Reclamation, 13(2), pp.173–183.
Preston, M., 2003. Greening brownfields. American City & Issue, 118 12, p.p26, 1p, 1c.
Read, D.C., 2016. Case Studies in Innovation District Planning and Development,
RESCUE Regeneration of European SItes in Cities and Urban Environment Report, 2003. Development of an
Analytical Sustainability Framework for the Context of Brownfield Regeneration in France, Germany,
Poland and the United Kingdom. Final Report of Work Package 1., Available at: http://www.rescue-
europe.com/download/reports/1_Analytical sustainability framework.pdf.
Ruthl, J.B., 1998. The Seven Degrees of Relevance: Why Should Real World Environmental Attorneys Care
Now About Sustainable Development Policy? 8 DUKE ENVTL. L. & POL’Y F. 273, 288 n.46.
Sardinha, I.D., Craveiro, D. & Milheiras, S., 2013. A sustainability framework for redevelopment of rural
brownfields: stakeholder participation at SÃO DOMINGOS mine, Portugal. Journal of Cleaner Production,
57, pp.200–208.
Sassen, S., 1991. The global city, Available at: https://op.kulib.kyoto-
u.ac.jp/webopac/catdbl.do?pkey=BB02333006.
Schädler, S. et al., 2011. Designing sustainable and economically attractive brownfield revitalization options
using an integrated assessment model. Journal of Environmental Management, 92(3), pp.827–837.
Seaport Square Development Company LLC, 2017. Seaport Square. Available at:
http://www.bostonplans.org/getattachment/8005ea79-e8dd-40d8-82b8-ada0d7daa442.
Sirmans, S. & Macpherson, D., 2003. The state of affordable housing. Journal of Real Estate Literature, 11,
pp.133–155. Available at: http://ares.metapress.com/index/V417570582656112.pdf.
TIP The Intersector Project, 2014. THE DEVELOPMENT OF BOSTON’S INNOVATION DISTRICT: A Case
Study of Cross-Sector Collaboration and Public Entrepreneurship,
United Nations, 1992a. Agenda 21. United Nations Conference on Environment & Development, (June), p.351.
Available at: https://sustainabledevelopment.un.org/index.php?page=view&nr=23&type=400.
United Nations, 1992b. Rio Declaration on Environment and Development. Environmental Conservation, 19(4),
p.366.
US Conference of Mayors, 2008. Recycling America’s Land. A National Report on Brownfield Redevelopment,
USGBC U.S. Green Building Council, 2017. LEED Projects. Available at: http://www.usgbc.org/projects.
Verbit, S.R., 2001. New Law May Unlock Potential for Brownfields. Environmental Protection, 12(8), pp.31–
33.
Wedding, G.C. & Crawford-Brown, D., 2007. Measuring site-level success in brownfield redevelopments: A
focus on sustainability and green building. Journal of Environmental Management, 85(2), pp.483–495.
Williams, K. & Dair, C., 2007. A Framework for Assessing the Sustainability of Brownfield Developments.
Journal of Environmental Planning and Management, 50(1), pp.23–40.
World Commission on Environment and Development, 1987. Our Common Future, Available at:
http://www.un-documents.net/wced-ocf.htm.
Worrall, R. et al., 2009. Towards a sustainability criteria and indicators framework for legacy mine land.
Journal of Cleaner Production, 17(16), pp.1426–1434.
990
ID 076
PRODUCTIVE STRUCTURE AND SPATIAL INEQUALITIES: THE
ROLE OF INNOVATIVE CLUSTERS
F. Parente
Department of Economics and Law, Sapienza University of Rome, via del Castro Laurenziano 9, 00161, Italy
Email: [email protected]
Abstract: This paper focuses on the interactions among socio-economic inequalities and the
spaces they concern, investigating the connections between economic production, social
capital and inequality in a region. Main research questions are about the spatial relations
between the demand side of labour market and multidimensional inequality, especially looking
at the role of innovative clusters. The production structure and social capital endowments of
205 selected EU15 regions have been reviewed for the time range 2000-2011. Available data
have been synthesised by explorative Principal Component Analysis. Extracted indicators for
the two selected economic and social dimensions have been compared to the levels of the
estimated multidimensional measure of inequality in the regions. Results say that spatial
distributions of considered domains share similar patterns, opposing north to south of Europe.
Keywords: Clusters, Europe, Inequality, Region, Social-Capital.
1. INTRODUCTION:
A theory of territorial inequality does not exist as such, but in the wide range of spatial
approaches to territorial analysis, valuable contributions to this research field have been
produced by many economists, sociologists, and geographers among others. These
complementary approaches have, however, rarely been combined in regional studies. One
aim of this piece of research is to contribute to fill this gap, drawing from several theoretical
references and bringing together their separate objects of analysis in a multidisciplinary
approach to the study of territorial inequality. The final goal is to produce a multidimensional
analysis of socio-economic inequalities based on different regional traits. Specific focuses are
business structure and production clusters’ specialisation, along with levels of social capital.
The definition of clusters assumed in this article refers to the concept of agglomeration of
firms, and especially to the extensive research carried out by the Center for Strategy and
Competitiveness (CSC) at the Stockholm School of Economics and the European Cluster
Observatory (Sölvell et al., 2007; Ketels, Protsiv, 2013). Due to the several approaches
available for the measurement of inequality itself, it is worth clarifying also that the
inequality here used is defined as inequality of outcomes, specifically with regards to the
multidimensional framework of human development economics and capability approach.
Main questions to be answered in this paper are then the following: how EU15 regions
position themselves with respect to multidimensional inequality when it comes to the
interaction among production structure and social endowments? what is the role of innovative
business clusters in respect to these spatial distributions? In the search for the answers, an
overarching assumption implies that the economic engines of inequality are not enough to
explain its trends. Some other aspect such as spatial, cultural and social elements has to be
taken into consideration, together, so to identify the latent factors in these complex dynamics.
In order to get a complete picture and a better understanding of the relationship between man,

991
community and space, and how to study their joint development (eventually unequal),
considering the spatial context seems vital. The relations in place between the considered
dynamics of regional development, based on economic production and specialisation, have
not been totally clarified yet- not with specific attention to their implications in terms of
innovation and social inclusiveness either. The exercise here proposed tries to find other
evidence of the spatial disparities in their interactions. Drawing on the mentioned strands of
literature and available databases for the EU Member States, 205 regions have been
considered over the period from 2000 to 2011. Statistics about regional production clusters
and social capital endowments have been reduced to synthetic indicators by applying a
Principal Component Analysis. Results have been mapped together with the level of
multidimensional inequality, in order to explore their spatial distribution.
This paper is then structured as follows: next section reflects on the importance of
considering the spatial dimension in the study of inequality; the third section provides a brief
overview of the relevant contributions in the literature about regional disparities in Europe,
focusing on the role of social capital and production clusters; the fourth section explains data
and methodology applied in the analysis carried out; the fifth section discusses the results of
this explorative study; and the last one introduces some preliminary conclusions.
2. WHY SPACE MATTERS IN THE INEQUALITY ANALYSIS
The Oxford Dictionary of Human Geography defines spatial inequality as “the geographical
expression of social inequality, recognising that space is both the medium and outcome of
social relations” (2013). Inequality means also spatial disparity, and this is so because each
territory has a set of geographic, social, cultural, institutional and human resources that
constitutes the space of its own set of resources and potential for development at the same
time. Disparities exist also because socio-economic and policy dynamics of regions and cities
are different from each other, and often they are particular to a specific geographic area: that
is the reason why the spatial dimension has to be considered when studying inequality
(OECD, 2016). Generally speaking, inequality is a matter of uneven distribution of resources
among members of a certain community, and that is why it has always been a topic of interest
for scholars of distribution theory indeed, within both economics and sociology.
About the multidimensional inequality assumed in this article, it is defined as inequality of
outcomes, and it relates mainly to what has been extensively wrote about it by Amartya Sen
and Anthony Atkinson. Sen is the main representatives of the capability approach in the
frame of the human development economics, which has had the remarkable merit of driving
the crucial shift “beyond GDP” in economic development studies. It is an intrinsically
multidimensional approach that focuses on people and their empowerment in an all-round
process of development throughout their lives within the society (about the approach and its
operationalisation has been further developed by Alkire, Deneulin, et al. at UNDP). Atkinson
has been one of the most prominent scholars of economics of inequality in Europe. He dealt
with technical issues of measurement, but also with the definition of inequality and some
specific aspects about the labour market mechanisms- notably wage inequality and top
income shares (1983, 2007, 2013). His contribution is here relevant also because, even if still
in the framework of income inequality studies, he addressed the importance of a
multidimensional approach when dealing with distributive justice issues (1983). Clarifying
this is important in order to frame the way it has been here measured either development or
inequality: focusing on outcome instead than input variables. Attention has so been given to

992
individuals and their well-being, focusing on personal distribution of achievements. But
importance is recognised to the spatial context too, because people’s life and their
capabilities are influenced also by the space they live in.
Specifically looking at the European case, regional studies in all of the above mentioned
disciplines have variously contributed to the analysis of disparities between regions of the
Union. Stress has been alternatively placed on innovation, geography, institutions, labour
market dynamics, business clusters, and so on. Economists are usually more concerned with
income inequalities or GDP growth rate differentials, looking at convergence processes
between regions and the decomposition of these trends. Sociologists are instead more prone
to consider the local processes in terms of territorial systems triggered by –or coming up
with- social ties and collaborative activities. Geographers have generally dealt with the
spatial dynamics of agglomeration and localisation choice’s process. Although such a variety
of approaches contributes to improve our understanding of the persistence of inequalities in
several domains, along with some of its possible drivers, there has been limited mutual
enrichment between these different, but nevertheless complementary strands of literature.
Finally, a comprehensive picture of the specific relationships between economic cluster
policies and human development across European regions is still missing.
Thinking about all of the possible ways that well-being and its dimensions can be related, it
appears clear that many different domains contribute to the level of (unequal) development,
and also that they are all related to each other. One way to tackle the analysis is restricting the
focus to the employment dimension only. And this is at least for two reasons. First,
employment is acknowledged by all theories as one of the main domains enabling people to
actively participate in the society and so to realise their aspirations. Second, at the same time
the labour market is the main place where different kinds of inequality involving several
domains take place and reinforce themselves (of course wage inequalities, but also
educational and gender inequality can be faced there). Moreover, here policy interventions
can have a substantial as well as immediate impact. Most of the inequality studies dealing
with labour market structure and its functionings often focus on the labour supply side only,
investigating wage inequalities and top income shares, investments in human capital and
returns to education, welfare institutions and workers, just to name a few examples. A lot has
been written about how the labour force performs, how it allocates and relocates, how it is
employed and rewarded. Plenty has been published even on the mechanisms governing social
networks, or the intergenerational transmission of wage inequality (Atkinson, 2007, 2013).
Less has been studied about the influence of the labour demand side on different sorts of
inequalities. Furthermore, even if Atkinson himself focused more on the labour supply, he
recognised the importance of looking at the demand side in order to fill our gaps in
knowledge about the economic inequality mechanisms (Atkinson, 1983).
Especially, when it comes to territorial inequalities, the studies focusing on regional
employment and production structures are still intrigued mostly by the possible ways for
boosting growth towards regional convergence, rather than jointly considering some other
related social implications. In addition, the EU regional Cohesion Policy is always more
concerned with innovative clusters, as a good way of boosting growth and promoting local
development (2014). Can we say these growth spill-overs are actually inclusive though?
Based on this, regions are called on always more attention to locally established strong
specialisation and innovations, and may be classified in leaders and followers according to
their innovation pace (Regional Innovation Scoreboard, 2014). But what about the effects on
the multidimensional inequalities in the regions these industries are located in? If we agree

993
that territories are made of people and they are the last recipients of any policy intervention in
the end, the development of a territory can be considered equitable or not based on the
implications for citizens' well-being. Finally, inequalities between territories may mean
inequality of opportunities for their inhabitants, which may lead to low social mobility: too
often socio-economic issues are faced without taking into account their territorial aspects,
while the consideration of the spatial context may be crucial for a correct analysis.
3. UNEQUAL DEVELOPMENT, CLUSTERS AND SOCIAL CAPITAL
Spatially contextualising this study at a subnational scale is important because a local system
is probably the best territorial unit of analysis to gather and practice new policies, as well as
the one where human and social capital are more likely to emerge as driving forces of
development. There is evidence that the real engines of world’s economy are still established
at the local level. And since the localisation of people and activities determines nature and
quality of our lives, in recent decades local development has become a central issue in both
the national public policy and the international development cooperation (Glaeser, 2003).
Historically, localisation choices have variously been analysed by economic theory,
especially with respect to agglomeration dynamics and related externalities. From the first
models of localisation theory, through those of regional growth, to the more recent local
development ones, the mechanisms locally determined by proximity, complementarity or
functionality factors have always interested economists and geographers (Capello, 2004). The
spatial diffusion of economic development can indeed produce amazingly beneficial spin-
offs, but also powerful agglomeration diseconomies that hold back and eventually stop the
growth of poles (Prager, Thisse, 2012). The specificity of the last theories is the strong spatial
feature of development, which is affected and reinforced itself by the connection to a specific
territory. Furthermore, high importance is given to intangible elements, such as knowledge
exchange, know-how, social and institutional relations. These characteristics seemed more
likely to occur within regional economic systems, and -when present- to be as well the main
reason of the local economies resilience to possible external shocks.
In the frame of regional studies’ spatial analysis, the role of firms’ clusters as engines of
development has therefore become relevant. Different approaches have been elaborated, and
their impact on growth and regional progress further studied (Porter 2003, 2013; Becattini,
1990, 2000; Boschma, 2014). Dating back to Alfred Marshall (1890, 1921), the social
characteristics and business environment –i.e. the territorial milieu- typical of areas where
geographic concentration of production activities occur was clear. Since then, it has been
approached and analysed in depth by different point of views, and it became central again
during the 90s, after Porter’s and Krugman’s works (1990, 1991). Object of the study has
come to be the relation between presence of clusters and local (and national) economic
performance, and the positive association between the two has been emphasised.
One aspect that is still mostly unclear is the trigger for a favourable environment to turn into
a successful cluster location. And here the local endowments of social capital come into play:
their importance as driver of the performance difference across locations has been
increasingly recognised (Rodriguez-Pose, Crescenzi, 2008). Social capital is a complex
concept, for which several definitions have been developed. It can include a variety of
elements, such as the level of trust (Fukuyama, 1995); the civic involvement and participation
of citizens (Putnam, 1993); and different kinds of social relations (Bordieu, 1986; Coleman,

994
1988). In the end, all of these aspects have an impact on either the public or private actors,
both at the individual and collective level, and eventually seem to make it more likely that
“mere co‐location is leveraged through active collaboration and that beneficial local
conditions are strengthened through coordinated or joint action” (Ketels, Protsiv, 2013).
Furthermore, as Rodriguez-Pose wrote years ago about the role of “local social structures” in
explaining the persistence of regional disparities in Europe (1998): the existing social
conditions may play an essential role in an area’s receptivity to -and assimilation of-
technological change and economic processes.
Looking more closely at social endowments of regions and their relation with local economic
structure, an interesting more recent piece of research by Boschma et al. (2016) tries to infer
the role of different kinds of social capital (and of quality of institutions) on regional
diversification and production specialisation. Drawing on previous work about the different
economic payoffs of either bridging or bonding social capital by Knack and Keefer (1997)
and Beugelsdijk et al. (2005, 2009), they analyse the role of informal institutions in more than
one hundred European regions from 2004 to 2012. First of all, they find the relatedness of
regional specialisations to be positively linked to existing strong industries in the region.
Second of all, they show that informal institutions have a big play in this development path,
and that bridging social capital is a key driver for regional diversification with significant
levels of “trust and active participation in bridging type of groups increase the probability of
regions to diversity into new sectors”. Bonding social capital, instead, seems to have no
impact, or even a negative one where the quality of local government is poor.
While being more widely analysed in its (positive) relation to economic growth, social capital
has also been studied in its relation to economic inequality, in both directions: what is the
effect of different kinds of social capital on the level of inequality? And how does the extent
of inequality affect the formation of social capital in a region? Here a generally negative
association has been suggested, but the direction of the effects results less clear. Interesting
evidence in both sense has been produced by De Blasio and Nuzzo about Italian regions
(2005, 2012). They found a significant association between several inequality measures and
social capital indicators, highlighting that different social capital definitions may produce
different results: the relation is negative in the case of bridging and linking ones, while
positive for the bonding networks (which, favouring their members only, may foster the
persistence of existing disparities). An interesting aspect is that these associations seem to
pass through –and be then more evident in- the labour market. There may be several drivers,
which may explain the negative association that goes from low level of social capital (or a
bonding one stronger than the bridging/linking ones) to higher level of inequality. These may
be, for example, a lower productivity due to professionally unfair behaviour and higher costs
borne by firms to counter them; inefficient job-matching because of the prominent use of
personal network in the job search; poor propensity to entrepreneurship in an unfavourable
business environment; strong family ties that hampers women’s employment. Even on the
other side, when inequality is lower, pro-social behaviours are more likely to occur. A
broader look at the European situation suggests similar considerations, as emerge from the
last Reports on Economic, Social and Territorial Cohesion in the EU (2014). The mutual
influence of territorial characteristics and social unrest is stated, highlighting an eroded social
capital where inequality is spatially concentrated, along with the need for place-based
policies to tackle social exclusion (2010).
When talking about regional disparities and policy interventions tackling them, the EU
Cohesion Policy is actually the related tool for European regions. Main objective is stated as

995
helping less developed regions to catch up and “to reduce the economic, social and territorial
disparities that still exist in the EU” (EC, 2014). Recently, it has been always more concerned
with innovative industries and their role within place-based Smart Specialisations Strategies
(S3). These are currently intended as the mainstream for regional development policy
planning, as well as the necessary step to get access to related communitarian funding in
Europe (EC, 2015. Further details about S3 and their application to EU Cohesion Policy are
provided by McCann., Ortega-Argilés, 2011, and Boschma, Giannelle, 2014).
Finally, some interesting contributions specific to the role of clusters in a sustainable regional
growth in the EU have been produced in the direction of a compound approach, aiming at
jointly consider different dimensions of analysis and coming up with some policy
recommendations. In 2013, Ketels and Protsiv provided background research to the
WWWforEurope project. Beside other relevant studies previously produced (INNOVA,
2006), here they have specifically contributed to the evaluation of the role of clusters and
cluster-based policies in the overall EU strategy for a New Growth Path (i.e. more sustainable
and balanced between economic, social and environmental domains). Drawing on related US
literature and evidence framework (Porter, 2003), their goal was to test if European regions
where clusters and cluster initiatives are present have better performance in economic,
environmental and social outcomes. They found confirmed that average wages are
significantly and positively influenced by the presence of clusters in the regions, suggesting
that specialisation and industry concentration have a role in lifting economic performance.
Specifically looking at the implications also for social and environmental components, they
were able to draw six different typologies of regions, based on the combinations between
performances in the three domains. A general conclusion is that regions with strong clusters
tend to follow a more balanced development path, and so clusters can be considered as an
indicator for conditions that contribute to the outcomes of a more sustainable growth, even
though not being their root cause. Furthermore, a big effort in these works has been put on
establishing a new comprehensive database for European NUTS2 regions with the European
Cluster Observatory (launched in 2007), and designing a new Regional Competitiveness
Index. This measure is intended to assess “the ability of a region to offer an attractive and
sustainable environment for firms and residents to live and work” and so to better summarise
the business environments of regions, going beyond the mere economic productivity of their
business structures (Dijkstra et al, 2011). These are some of the reasons why production
clusters and related social environment are still central in local development, and it so may be
of interest to further analyse their role on regional disparities.
4. AN EXPLORATION OF EUROPEAN REGIONS
Data used in this study come from several sources and regional databases. As regards
regional inequalities, the main measure here used as proxy for multidimensional inequality is
the percentage loss in human development due to the inequalities present in the society
(Alkire and Foster, 2010) calculated on OECD and Eurostat databases, and EU-SILC survey.
Detailed methodology and results from this previous section of the study are not object of this
paper, but it is here worth it to mention how this measure has been statistically derived per
205 selected regions: comparing the estimated Human Development Index (HDI) to its
adjustment to within-region inequalities (related statistical analysis is part of the work
developed within the PhD dissertation this paper relates to as well- and whose conclusions
and publishing are forthcoming). Following the related literature and the most recently
applied UNDP methodology (HDR, 2016), regional HDIs and Inequality-adjusted Human

996
Development indices have been calculated over a span of time of twelve years, from 2000 to
2011. The territorial unit of analysis has been set at the Eurostat NUTS2 regions, within the
EU15 only and excluding the extra-continental regions (French, Spanish and Portuguese
oversea departments). This level of detail has been preferred for at least two reasons: wider
and more homogeneous availability of human development variables in the selected span of
time for countries of interest; comparability to other regional performance and innovation
indicators not available yet at a lower territorial specification. Results say that despite a
general increase in the potential human development across regions, the levels of its loss due
to inequality have not significantly improved over the selected period. Especially, its spatial
distribution reveals complex dynamics, showing an increasing concentration of better
performances around some more advanced and educated core regions (e.g. in southern UK
and Germany, and around the French and Scandinavian capital cities) and confirming the
well-known North-South contrast.
For the same 205 regions, trends of production structure have been here explored. Among the
available business structure statistics, the distribution of employment across sectors and
industries has been considered, and especially looking at regional diversification and clusters’
specialisation. Specific data about forty-one production clusters collected by the European
Cluster Observatory are available at the level of detail of 4-digits NACE2 industries per
region. Related Location Quotients (LQs) help explore some territorial paths of economic
production, to discover if a region has developed one or more core industries over time, and
in which sector. LQ considers the level of employment in a “x” sector in the selected region
compared to the national level in the same sector. If the measure is: lower than 0, that sector
is not present in the region; equal to 1, region and country specialised at the same level;
higher than 1, the region is specialised; over 2, the region is highly specialised. The local
level of social capital endowments refers to some measures from the European Social Survey
(2014): the level of inter-human trust, along with two items on the perception of helpfulness
and fairness of citizens; also, the rate of participation in voluntary activities implying
bridging/bonding networks has been considered. The innovation performance relates to the
Regional Innovation Scoreboard by Eurostat (2014). The quality of local institutions has been
included as captured by the European Quality of Governance Index (EQI) produced by the
Quality of Government Institute (2013). Another predictor, used to spatially characterise
these regions and account for geography, is the degree of urbanisation.
The methodology applied in the study here reported draws on the social sciences research
methods and is an exploratory factor analysis by Principal Component Analysis method
(PCA) (Di Franco, Marradi, 2013). Originally conceived by psychologists and sociologists
straddling the 19th and 20th centuries, this method uses multivariate analysis’ techniques to
synthesise variance of processed variables into a reduced number of factors. Underling
hypothesis is that selected variables have a substantial degree of association and especially
share a common semantic meaning. For these reasons, extracted components can be used as
synthetic indicators for common latent variables that capture more dense information about
them. In this case, it allows to include condensed information on innovative clusters in the
analysis aiming at better understanding their possible relation with levels of inequality and
other regional characteristics- to be further explored by additional quantitative models. Due
to the high number of items available to represent the production structure, drawing on some
recent similar application on the Italian case (Gemmiti, Santini, 2016) a PCA has been
performed on the clusters LQs database first. This has allowed to construct a synthetic
measure summarising main traits of regional production, and reduce the original number of
forty-one variables (e.g. the 41 industries’ clusters). Moreover, a second PCA has been

997
separately applied to the five available social capital items referred to above. Results of these
applications are presented in the following paragraph, after a brief overview of the
interactions between considered variables and levels of estimated inequality.
5. SOME RESULTS AND DISCUSSION
As explained in the second paragraph, one underlying assumption is that inequality is
influenced by different specialisation paths, and these are related to regional specific
characteristics such as the social capital endowments. As the following Charts 1. to 5. show, a
first comparison between the previously estimated measure of inequality and the values of
selected predictors in the 205 regions reveals that relations in place are not necessarily linear,
and some State-effects may also be considerable. Different colours of dots stand for different
EU Member States, and vertical and horizontal lines –when present- respectively mark the
average levels of indicators either on y- or x- axis.
1 Chart 1. Trust and Inequality Chart 2
. Quality of Government and Inequality
Chart 3. Innovation and Inequality Chart 4. Degree of urbanisation
and Inequality
Regions where levels of trust are higher than average (in the upper-left quarter of Chart 1)
tend to have lower value of loss in human development. While for those below the average
level of trust indicator (in the same Chart 1), the performances in inequality are bad only
(they all fall within the right-end side marked by the vertical line). Regions where the quality
of local institutions is higher than average (those above the horizontal line in Chart 2), show
concentration of multidimensional inequality below its average value (all regions are on the
left-end side defined by the vertical line). At the same time, for those below the EQI index
average, the pattern is more scattered and a slightly negative correlation emerges, associating
0.15
0.25
0.35
0.45
0.55
0.65
0.75
0% 1% 2% 3% 4% 5% 6% 7% 8% 9%
TR
US
T
LOSS in potential Human Development
0.1
0.2
0.3
0.4
0.5
0.6
0% 1% 2% 3% 4% 5% 6% 7% 8% 9%
EQ
I I
nd
ex
LOSS in potential Human Development
0.20
0.30
0.40
0.50
0.60
0.70
0.80
0% 1% 2% 3% 4% 5% 6% 7% 8% 9%
INN
OV
AT
ION
SC
OR
EB
OE
AR
D
LOSS in potential Human Development
-0.01
0.19
0.39
0.59
0.79
0.99
0% 1% 2% 3% 4% 5% 6% 7% 8% 9%
UR
BA
NIS
AT
ION
LOSS in potential Human Development

998
better performances of institutions to lower level of inequality. Still with some probable
State-effect different dynamics, a higher level of inequality tends to appear in regions where
the performances in terms of innovation are poorer (see Chart 3). Finally, all of this is more
or less regardless of the degree of urbanisation, as evident from Chart 4.
As introduced in previous paragraph 4, a PCA has been applied to the clusters database. The
first two components extracted reproduce one third of the variance of selected variables
together, so are not sufficient to provide a comprehensive picture of the regional business
structure alone. But they are already informative on a first interpretation of the ties between
the domains object of this work. The components have been interpreted based both on the
loading components recorded on each of the 41 clusters, and on the measured correlation to
regional characteristics. The first component seems to relate to the degree of diversification
of regional business structures and to have a double polarity- opposing industry to services.
Its correlation with the count of industries in which regions have LQ values higher than 2 is
60%. The second component pertains more to the business environment features, and has a
single polarity probably ranging from low to higher content of innovation- showing a strong
correlation with both the Regional Innovation Scoreboard (55%) and the number of patents
(43%, when the correlation between these two is 50%). Drawing on this, Chart 5. can be read
looking at the combinations of the characteristics of the two components resulting in the
plane quarters, and the relative placement of analysed regions.
Chart 5. First two components extracted by PCA on clusters’ LQs, 2011
Running the same analysis on each year, and comparing the scores of extracted factorial
components at the beginning to the end of the considered period, the variation seems in line
with the given interpretation. Plotted data are shown below in Chart 6. and 7. Production
diversification looks relatively stable and regions tend to maintain their core industries. Chart
6. shows an almost perfect overlapping of scores in first and last year of the period by the
linear correlation shape of the dots cloud. Degree of specialisation and innovation in clusters,
instead, have changed generally more over time- even in a relatively short period of twelve
years. The pattern in Chart 7. appears more scattered indeed.
-2.8
-1.8
-0.8
0.2
1.2
2.2
-4 -3 -2 -1 0 1 2 3
PR
OD
UC
TIO
N
DIV
ER
SIF
ICA
TIO
N
INNOVATIVE SPECIALISATIONBE DK DE IE EL ES FR IT LU NL AT PT FI SE UK
Regions with prevalence of
LOW specialised
INDUSTRIES
Regions with prevalence of
HIGHLY specialised
SERVICES
Regions with prevalence of
HIGHLY specialised
INDUSTRIES
Regions with
prevalence of LOW
specialised
SERVICES

999
Chart 6. First component in 2000 and 2011 Chart 7. Second component in 2000 and 2011
Plotted regional PCA scores (Chart 5.) provide a first picture of the spatial distribution of
some production structure characteristics (in 2011), which can be better explored by a map.
Figure 1. shows the spatial pattern of the groupings based on the four combinations of first
two extracted PCs. In addition, the multidimensional inequality introduced in the previous
paragraph can be here visualised by a grid (Fig. 2.). This exercise can allow the search for
common typologies to group regions based on their production structure characteristics, and
so may serve as a first basis to recognise shared spatial patterns. The adherence to inequality
categories (split by distribution’s quartiles) appears not to be perfectly exact, but some traits
to be further explored (e.g. by means of a Cluster Analysis) can be traced. More unequal
regions are those of southern Europe (thicker grid in Fig. 2.), and correspond mainly to
territories with low production diversification and weak innovative specialisation (red in Fig.
1.). Regions with lower level of inequality instead (coarser grid in Fig. 2.), generally present
higher values of industries’ diversification and cluster specialisation (light green in Fig. 1.).
Figure 1. PCA combinations based 4 groupings Figure 2. Addition of inequality-based 4
groupings
Same levels of multidimensional inequality can be looked at in comparison to social capital
and quality of government measures. The two extracted PCs for social capital reproduce the
whole variance of original five survey items, and clearly pertain to two different traits of
social capital: trust and networks. Results confirm the conclusions suggested by the literature.
Trust components of social capital, along with the level of fairness and helpfulness
themselves, are negatively associated with inequality indices (significantly around -60%) and
positively with quality of government measures (69%). Networks’ ties are instead
controversial. Being generally not much significant (with values either a bit lower or higher
than zero), when they are considered in the distinction between bridging (volunteering for
-3
-2
-1
0
1
2
3
-2 -1.5 -1 -0.5 0 0.5 1 1.5 2
2011
2000
Production Diversification
-3.5
-2.5
-1.5
-0.5
0.5
1.5
2.5
3.5
-4 -3 -2 -1 0 1 2
2011
2000
Innovative Specialisation
IV quartile III quartile II quartile I quartile
I quarter II quarter IV quarter III quarter
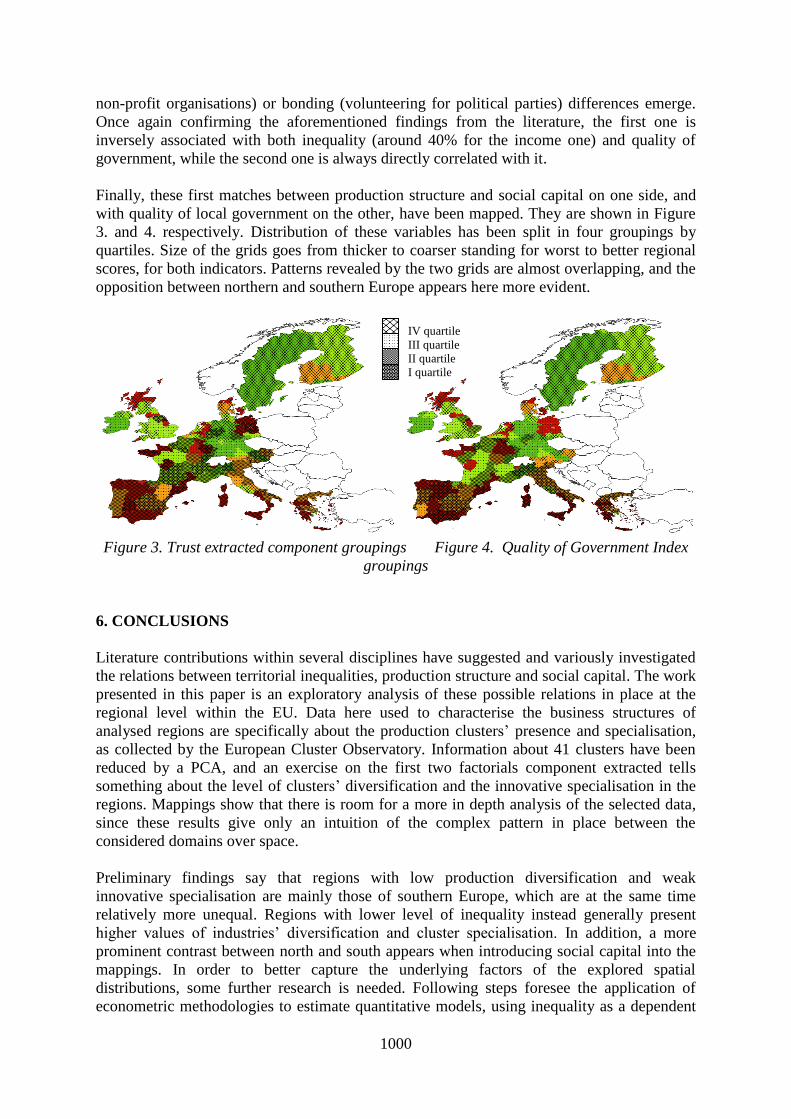
1000
non-profit organisations) or bonding (volunteering for political parties) differences emerge.
Once again confirming the aforementioned findings from the literature, the first one is
inversely associated with both inequality (around 40% for the income one) and quality of
government, while the second one is always directly correlated with it.
Finally, these first matches between production structure and social capital on one side, and
with quality of local government on the other, have been mapped. They are shown in Figure
3. and 4. respectively. Distribution of these variables has been split in four groupings by
quartiles. Size of the grids goes from thicker to coarser standing for worst to better regional
scores, for both indicators. Patterns revealed by the two grids are almost overlapping, and the
opposition between northern and southern Europe appears here more evident.
Figure 3. Trust extracted component groupings Figure 4. Quality of Government Index
groupings
6. CONCLUSIONS
Literature contributions within several disciplines have suggested and variously investigated
the relations between territorial inequalities, production structure and social capital. The work
presented in this paper is an exploratory analysis of these possible relations in place at the
regional level within the EU. Data here used to characterise the business structures of
analysed regions are specifically about the production clusters’ presence and specialisation,
as collected by the European Cluster Observatory. Information about 41 clusters have been
reduced by a PCA, and an exercise on the first two factorials component extracted tells
something about the level of clusters’ diversification and the innovative specialisation in the
regions. Mappings show that there is room for a more in depth analysis of the selected data,
since these results give only an intuition of the complex pattern in place between the
considered domains over space.
Preliminary findings say that regions with low production diversification and weak
innovative specialisation are mainly those of southern Europe, which are at the same time
relatively more unequal. Regions with lower level of inequality instead generally present
higher values of industries’ diversification and cluster specialisation. In addition, a more
prominent contrast between north and south appears when introducing social capital into the
mappings. In order to better capture the underlying factors of the explored spatial
distributions, some further research is needed. Following steps foresee the application of
econometric methodologies to estimate quantitative models, using inequality as a dependent
IV quartile III quartile II quartile I quartile

1001
variable and the other listed predictors as explanatory variables. A multiple linear regression,
a longitudinal analysis over the twelve years’ time (Wooldridge, 2002), and finally a
geographically weighted regression (Fotheringham, 2002) are just a few examples useful to
better explain the findings and the spatial relations between them.
In the light of the links between production structure, social capital and inequality suggested
in the literature, some first hypothesis to be tested suppose that relations between inequality
and social capital may be mediated by the interaction with local business environment and
specialisation. Especially, different production specialisations allow to foster diverse kinds of
social relations and cultural effects. These effects can engender the spatial interactions within
the concerned territories, whose degree of urbanisation can be very different. In addition,
policies to address land use and infrastructures’ asset can have substantial impacts on the
overall pattern: lowering or increasing inequalities, depending on the level of inclusiveness
and relatedness they can facilitate, and the localisation of different industries they can favour.
7. REFERENCES
Alkire S., Foster ., 2010, Designing the Inequality-Adjusted Human Development Index (IHDI), 2010 HDR
Background Paper No. 10.
Alvaredo F., Atkinson A. B., Piketty T., Saez E., 2013, The Top 1 Percent in International and Historical
Perspective, Journal of Economic Perspectives- Vol. 27, No. 3- 2013- Pp. 3- 20.
Atkinson A. B., 1983, The Economics of Inequality, Oxford University Press, UK.
Atkinson A. B., 2007, The distribution of earnings in OECD countries. International Labour Review, V.146(1-2).
Becattini G., 2000, Dal distretto industriale allo sviluppo locale, Bollati Boringhieri, Torino.
Becattini G., 1990, The Marshallian district as a socio-economic notion, in: Pyke F., Becattini G., Sengenberger
W. (eds.), Industrial districts and intra-firm collaboration in Italy, IILS, Geneva.
Boschma R., Cortinovis N., Xiao J., van Oort F., 2016, Quality of government and social capital as drivers of
regional diversification in Europe, No 1610, PEEG Utrecht University, Utrecht.
Boschma R., Giannelle C., 2014, Regional Branching and Smart Specialisation Policy, No JRC88242, JRC-
Technical Reports, S3 Policy Brief Series 6/2014, Publications Office of the European Union, Luxembourg.
Bourdieu P, 1986, The Forms of Capital, in Richardson. J. G., ed., Handbook of Theory and Research for the
Sociology of Education, Greenwood, New York.
Capello R., 2004, Economia regionale. Localizzazione, crescita regionale e sviluppo locale, Il Mulino, Bologna.
Coleman ,1988, Social capital in the creation of human capital, American Journal of Sociology 94: S95-S120.
De Blasio G., Nuzzo G., 2005, Il capitale sociale alla Putnam e le regioni italiane: un’analisi empirica, Scienze
regionali, Vol.I.
De Blasio G., Nuzzo G., 2012, Capitale sociale e disuguaglianza in Italia, QEF No. 116, Banca d’Italia.
Di Franco G., Marradi A., 2013, Factoral Analysis and Principal Component Analysis, Franco Angeli, Milano.
Dijkstra L., Annoni P., Kozovska K., 2011, A New Regional Competitiveness Index: Theory, Methods and
Findings, Working Paper 2/2011, Brussels: European Commission.
EC, 2015, National/Regional Innovation Strategies for Smart Specialisation (RIS3), Luxembourg.
Fotheringham A. S., Charlton M., Brunsdon C., (2002), Geographically Weighted Regression: The Analysis of
Spatially Varying Relationships, Wiley, UK.
Fukuyama F., 1995, Social capital and the global economy, Foreing Affairs No.74 pp. 89-103.
Gemmiti R., Santini I., 2016, Resilienza e specializzazione. Alcune considerazioni empiriche, Annals of the
MEMOTEF Department, p. 95-105. Sapienza University of Rome, Italy.
Glaeser E. L., 2003, The New Economics of Urban and Regional Growth, in: Gordon L. C., Meric S. Gertler,
Maryann P. Feldman, 2003, Oxford handbook of economic geography, Oxford University Press, UK.
Ketels C., Protsiv S., 2013, Clusters and the New Growth Path for Europe, Working Paper no 14,
WWWforEurope.
Krugman P., 1991, Geography and Trade, The MIT Press, 1991, pp xi + 142, Cambridge, USA.
McCann P., Ortega-Argilés R., 2011, Smart specialisation, regional growth and applications to EU Cohesion
policy, IEB working papers, Barcelona, Spain.
Nicholas C., Dijkstra L., Lapuente V., 2015, Mapping the Regional Divide in Europe: A Measure for Assessing
Quality of Government in 206 European Regions. Social Indicators Research. vol 122 (2): 315-346.
OECD, 2016, The Productivity-Inclusiveness Nexus, OECD Paris.

1002
Porter E. M., 2003, The Economic Performance of Regions, Regional Studies, Vol. 37, No. 6/7.
Putnam R.D., 1993, La tradizione civica delle regioni italiane, Mondadori, Milano, Italia.
Rodríguez-Pose A., 1998, Social conditions and economic performance: The bond between social structure and
regional growth in Western Europe, International Journal of Urban and Regional Research, Vol. 22 pp.
443- 459.
Rodríguez-Pose A., Crescenzi R., 2008, R&D, spillovers, innovation systems and the genesis of regional growth
in Europe, Regional Studies, Vol. 42(1), pp. 51-67.
Rogers, Castree N., Kitchin R., 2013, A Dictionary of Human Geography, Oxford University Press, UK.
Sen A. K., 1972, On economic inequality. Oxford University Press, Oxford, UK.
Sen A. K., 1993, Inequality re-examined, Oxford University Press, Oxford, UK.
Sölvell Ö., Ketels C., Lindqvist G., (2008), Industrial specialization and regional clusters in the ten new EU
member states, Competitiveness Review, 18:1/2, 104-130
UNDP, 2015, Human Development Report. Technical Notes, Oxford University Press, UK.
Wooldridge, J. M. (2010), Econometric Analysis of Cross Section and Panel Data. Cambridge, MA: MIT Press.

1003
ID 079
PUBLIC-PRIVATE PARTNERSHIPS FOR THE KNOWLEDGE
ECONOMY: THE CASE OF INNOVATION CENTERS
A. Morisson
PAU Department, Mediterranean University of Reggio Calabria, Reggio Calabria, 89124, Italy
Email: [email protected]
Abstract: In the late 2000s, new spaces—such as co-working, maker spaces, and co-living
spaces—have been emerging in the knowledge-based post-industrial cities. The paper
investigates the emergence of innovation centers through the use of public-private
partnerships. The research methodology is based on a multiple case-study approach in which
three cases were selected: Barcelona Growth Center in Barcelona (Spain), District Hall in
Boston (USA), and Edney Innovation Center in Chattanooga (USA). Innovation centers,
which consist of widely diverse creative and knowledge-based activities located within the
same building, participate in the urban regeneration of downtown areas through the promotion
of entrepreneurship. The paper finds that the local governments, which adopt public-private
partnerships to create innovation centers, are entrepreneurial and are aligning their actions and
visions with those of the entrepreneurs they are trying to attract. For the entrepreneurial local
governments, innovation centers are anchor spaces incorporated in a broader vision of making
“innovation districts”.
Keywords: Creative City, Innovation Districts, Public-Private Partnership, Knowledge
Economy, Urban Regeneration.
1. INTRODUCTION
In the late 2000s, new spaces—such as hacker spaces, maker spaces, Living Labs, Fab Labs,
and co-working spaces—have been emerging in concert with the rise of the knowledge and
collaborative economy (Botsman & Rogers, 2011; Capdevila, 2015). Civic and innovation-
driven entrepreneurs are the main beneficiaries of these new spaces. Entrepreneurs and
outsiders are the engine of creative destruction, job creation, economic growth, and the
initiators of radical innovations (Christensen, 1997; Kane, 2010; Saxenian, 1994;
Schumpeter, 1942). Entrepreneurs have also become, for local governments, the center of
attention since the publication by Richard Florida (2002) of The Rise of the Creative Class.
Chatterji, Glaeser, and Kerr (2013) point out that place-based policies to attract and retain
entrepreneurs and startups are positively seen by economists who can be skeptics to the
ability of policymakers in picking winners but believe in their ability of picking winning
sectors.
Local and regional governments are promoting policies, like the creation of innovation
centers, to promote their local entrepreneurial ecosystems. Since 2000, local and regional
governments are implementing policies to create innovation districts, which are place-based
initiatives that aim to regenerate downtown districts through the promotion of innovative
companies and startups, to accelerate their cities’ transitions into the knowledge economy
(Katz & Wagner, 2014; Morisson, 2014). Innovation centers are anchor spaces in innovation
districts that aim to accelerate the innovation process through promoting collaboration,
serendipity, proximity, face-to-face interactions, and the exchange of tacit knowledge
between diverse actors through different activities.

1004
The paper investigates the creation of innovation centers through public-private partnerships.
Three case studies have been selected: Barcelona Growth Center in Barcelona (Spain),
District Hall in Boston (USA), and Edney Innovation Center in Chattanooga (USA). The
research conducted for this paper is based on three sources of data: semi-structured
interviews, secondary data, and direct observation. Innovation centers are the outcomes of
innovative private-public partnerships between entrepreneurial public organizations,
entrepreneurial mayors, and private partners (see table 1. for an overview of each case-study).
Innovation centers align the vision of local governments with the vision of the entrepreneurial
community. As a result, the creation innovation centers through innovative public-private
partnerships contribute to reinforce local governments’ entrepreneurial spirits.
2. KNOWLEDGE ECONOMY AND PUBLIC-PRIVATE PARTNERSHIPS
In the 1990s, capitalist countries started to undergo an economic transition towards post-
Fordism or knowledge-based economies (Amin, 1994; Drucker, 1998). The knowledge-based
economy recognizes the importance of knowledge as the driver of productivity and economic
growth, emphasizing the role of information, technology and learning in economic
performance (OECD, 1996). In the knowledge economy, technological innovation is essential
for economic prosperity. The academic literature provides, both across nations and over time,
a solid theoretical background linking technological innovation to the progress of countries,
regions, cities, and firms (Fagerberg, 1988; Freeman, 1987; Rosenberg, 1982, 2004;
Schumpeter, 1934; Solow, 1957).
In this economic transitions, with the rise of the global economy and the revolutionary nature
of ICT, metropolitan areas are the key units to produce technological innovations (Castells,
1989; Florida, Adler, & Mellander, 2017). Indeed, patents and innovations are heavily
concentrated in space (Acs & Audretsch, 1988; Carlino, 2001; Jaffe, Trajtenberg, &
Henderson, 1993). In introducing the concept of knowledge-based urban development,
Knight (1995) correctly recognized that as the economic structure becomes more knowledge-
based, the basic nature of urban development changes. Building the “next Silicon Valley” and
knowledge-based development initiatives that involve public institutions, universities, and
private firms are the epitome of contemporary economic development strategies due to their
strong multiplier effect (Etzkowitz, 2015; Moretti, 2012; Sturgeon, 2000).
Metropolitan regions are seen as the most appropriate entity for designing supportive
competitive and innovative environments for companies compared to nation states, which in
an increasingly borderless world, are increasingly becoming dysfunctional (Cooke, 1997;
Krugman, 1995; Ohmae, 1995). In the European Union and the United States, central
governments are devolving power and regulatory tasks to subnational institutions, which are
becoming more entrepreneurial in order to deliver public services and foster economic
growth (Brenner, 2004; Hall & Hubbard, 1996).
One of the tools that local governments are increasingly embracing are public-private
partnerships (PPP). Indeed, since the 1990s, public-private partnerships have been used as a
key tool of the new public governance for delivering and implementing public policies
around the world (Osborne, 2002; Osborne, 2006). In the United States and in the European
Union, local and regional governments are taking advantage of private-public partnerships as
a way to innovate in times where Federal funds and central governments subsidies are

1005
declining (Sagalyn, 2007). Public-private partnerships are defined as “cooperation of some
sort of durability between public and private actors in which they jointly develop products
and services and share risks, costs and resources which are connected with these products”
(Van Ham & Koppenjan, 2001, p. 598).
In the United States, public-private partnerships have extensively been used in urban
development, most notably for the regeneration of Central Business Districts (CBDs) and
downtown areas (Harding, 1990; McQuaid, 2000). The limited resources at the disposal of
local governments have forced them to take advantage of multiple sources of funding and to
work with a wide range of actors, such as the central or federal government, the regional
government, the private sector, and the local community, in order to deal with multifaceted
local economic development challenges (McQuaid, 2000; Newman & Verpraet, 1999).
Lately, local governments are promoting knowledge-based activities out of the desire of
generating high-growth activities and high-quality jobs in their cities. Local governments use
public-private partnerships to deliver knowledge-based policies and programs, like
innovation centers, in very entrepreneurial and innovative manners. Indeed, public-private
partnerships can be used in a variety of ways since Mayors and local development offices are
only limited by their “imaginations” (Lyons & Hamlin, 1991, p. 55).
3. TACIT KNOWLEDGE AND COLLABORATION
Innovation centers are spaces whose objectives are to promote collaboration and face-to-face
interactions between diverse organizations, stakeholders, and innovative actors. Innovation
centers aim to accelerate the diffusion of tacit knowledge by being open to external and
diverse sources of knowledge and to reinforce as a result, the innovative capacities of
startups, individuals, and innovative companies located in the building and the district.
In The Tacit Dimension, Michael Polanyi (1966) disseminates the concept of tacit knowledge,
when he famously observed: “we can know more than we can tell”. Tacit knowledge, in
opposition to codified knowledge, refers to the knowledge, ideas, concepts, or insights that
individuals possess but cannot be fully expressed. Tacit knowledge is largely transferred
through repeated face-to-face, formal and informal, interactions that can only take place at
the level of the city or even the district, and is as a result, highly localized. The academic
literature widely recognizes the importance of tacit knowledge in the innovation process and
in the clustering of high-technology companies (Bathelt, Malmberg, & Maskell, 2004;
Gertler, 2003; Howell, 2002; Morgan, 2004, Rodríguez-Pose, & Crescenzi, 2008; Von
Hippel, 1994). The general assumption is that by its difficulty of being codified and its
dependence on context-specificity, tacit knowledge is more difficult to transfer through
distance, and thus, more ‘sticky’ (Von Hippel, 1994). Indeed, while codified knowledge can
be disseminated globally at a low cost, due to the process of ubiquitification, tacit knowledge
becomes even more critical for competitiveness (Maskell & Malmberg, 1999). Proximity—
geographical, cognitive, organizational, social, and institutional—affects the quality of face-
to-face interactions and the diffusion of tacit knowledge (Boschma, 2005).
The concepts of the national innovation system (Lundvall, 1992), the sectoral innovation
system (Breschi & Malerba, 1997) the regional innovation system (Braczyk, Cooke, &
Heidenreich, 1998), the learning region (Florida, 1995; Morgan, 1997), the innovative milieu
(Aydalot & Keeble, 1988), and the industrial district (Becattini, 1992), all point out the
importance of intraregional networks and interactions in enhancing industrial innovativeness

1006
and regional competitiveness. Collaboration is thus, seen as an important driver in
accelerating the innovation process. The interactions between companies and organizations
not only in similar economic sectors but also diverse ones can be beneficial to the innovation
process thanks to knowledge spillovers (Jacobs, 1969). The concept of open innovation
acknowledges the importance of inflows and outflows of ideas and tacit knowledge in the
process of innovation (Chesbrough, 2003). Interactions and cooperation between university-
industry-government and the civil society are necessary preconditions for regional
competitiveness in the context of the knowledge economy (Carayannis & Campbell, 2009;
Leydesdorff & Etzkowitz, 1996).
4. METHODOLOGY
The research methodology is based on a qualitative multiple case-study approach, using
primary and secondary data. The author uses case studies “out of the desire to understand
complex social phenomena” (Yin, 1994, p. 4). Indeed, this research investigates in an
exploratory manner a contemporary phenomenon in which the researcher has no control on
the actual phenomenon (Eisenhardt, 1989). Moreover, the investigation of public-private
partnerships for the creation of innovation centers has not been fully examined. A qualitative
approach is as a result, the most appropriate method (Eisenhardt, 1989). The researcher uses a
comparative exploratory multiple case-study approach in order to generalize findings on the
new concept studied. The three innovation centers selected are located in three different cities
in developed countries, they are: Barcelona Growth Center in Barcelona (Spain), District Hall
in Boston (USA), and Edney Innovation Center in Chattanooga (USA).
The research conducted for this paper is based on three sources of data: semi-structured
interviews, secondary data, and direct observation. The semi-structured interviews were
conducted for each innovation center in person and over the phone with the key stakeholders
who have directly participated in the innovation center’s design and/or implementation. In
total, seven interviews were conducted: three interviews for Barcelona Growth Center, two
interviews for District Hall, and two interviews for Edney Innovation Center. The persons
interviewed were: the District Hall’s director, Chattanooga’s strategic planner, 22@
Barcelona’s employees and director, university professors, and the City of Boston Mayor’s
Office. The stakeholders were selected according to their strong knowledge and diverse
perspectives on the phenomena studied (Eisenhardt & Graebner, 2007). The secondary data
that were used for the research are, but were not limited to: innovation centers’ websites,
namely District Hall, Edney Innovation Center, and 22@ Barcelona; the municipal
organizations’ websites, namely Boston Redevelopment Authority, The Enterprise Center,
and 22@ Barcelona; the government websites of the City of Barcelona, Boston, and
Chattanooga; real-estate developers’ websites such as WS Development, Consorci de la Zona
Franca de Barcelona; articles in news websites, newspapers, and magazines such as
nooga.com, New York Times, Boston Globe, La Vanguardia, and Boston.com; annual reports
from The Enterprise Center, and official planning documents from 22@ Barcelona and
Boston Redevelopment Authority. The direct observations involved non-participatory
observations in each of the innovation center. In total, the researcher conducted about 6 hours
of formal and informal observations. The data were then, converged in a triangulating fashion
in order to “assure that the right information and interpretations have been obtained” (Stake,
2013, p. 36).

1007
5. CASE-STUDIES
5.1 Barcelona Growth Center - Barcelona, Spain
The Barcelona Growth Center, previously known as the MediaTic building, is at the center of
the innovation district—22@ Barcelona. In 2000, under Mayor Joan Clos, the City of
Barcelona launched the innovation district, 22@ Barcelona, in order to accelerate the city’s
transition into the knowledge economy (Barceló & Oliva, 2002; Trullén, 2001). The
innovation district is located in the district of Poblenou, a former industrial district, used to be
known as the “Manchester of Catalonia” (López, Romani, Sagarra, & Piqué, 2011). The
objectives of 22@ Barcelona were: to redevelop the district of Poblenou, to promote
industries in five clusters—media, ICT, medical technologies, energy, and design—and to
accelerate Barcelona’s transition into the knowledge economy (Trullén, 2001; López et al.,
2011). A municipal company, 22 ARROBA BCN S.A., was created by Mayor Joan Clos
with the sole purpose to transform the Poblenou district into an innovation district
The Barcelona Growth Center is a nine-story and 15,000-square-meter building located in the
center of the district—22@ Barcelona . The users and activities of the innovation center are:
a business support office; the Cibernàrium, a public-sponsored program that offers training
for professionals, students, and residents; the Mobile StartUp Barcelona, a co-working space
for entrepreneurs and startup accelerators; the Mobile World Capital Barcelona, a public
organization that organizes the Mobile World Congress in Barcelona; the GSMA, which is
the global trade association for mobile phone operators, manufacturers and suppliers;
Accenture Mobile Knowledge; Deloitte; the Technological Circle of Catalonia (CTecno), a
foundation that unites companies and professionals in the Information and Communications
Technology sector; Softonic, a software company; previous tenants included the Open
University of Catalonia; the Internet Interdisciplinary Institute (IN3); and an eLearning
Center. The Barcelona Growth Center is today a hub and meeting point for entrepreneurs,
accelerators, public institutions, students, and private companies in the sectors of ICT and
Media (Barcelona Activa, 2012).
The Barcelona Growth Center was opened in 2010 to serve as the center for 22@ Barcelona’s
Media and ICT clusters (Barceló & Guillot, 2013). The public-private partnership that led to
the creation of the innovation center followed a complex two-step process. In the first step,
the land, which was privately-owned, was transferred to the municipal company, 22
ARROBA BCN S.A., due to the compulsory land transfer in the innovation district. In 22@
Barcelona, the zoning laws were modified in 2000 to give an incentive for real estate
developers to build more by providing them additional zoning rights under certain conditions.
First, real-estate developers were obliged to dedicate twenty percent of the total built area to
“@” activities, which are knowledge-based activities as defined by the OECD (Barceló &
Guillot, 2013; Barcelona, 2000). Second, real estate developers had to transfer 30 percent of
the built land to 22 ARROBA BCN S.A. (Barceló & Guillot, 2013; Barcelona, 2000). The
municipal company was then allocating the land to provide parks, public housing, and “7@
amenities” like the Barcelona Growth Center, which are spaces to accommodate knowledge
activities and diffuse new technologies (Barcelona, 2000). In the second step, a joint-venture
was created between the municipal company, 22 ARROBA BCN S.A., and a quasi-public
real estate developer, the Consorci of Zona Franca de Barcelona, in order to build “7@
amenities” on the land transferred by a private real estate developer to the municipal
company. The joint-venture negotiated to determine the architectural aspects, the activities,
and uses of the building. It was agreed that the Consorci of Zona Franca de Barcelona would
finance the construction of the Barcelona Growth Center and would have the right to use the

1008
building for a period of 70 years before transferring back the right to use the building to the
city. The city would have the right to use three floors of the building to promote knowledge
activities for the same period of 70 years.
In Barcelona, the public-private partnership that led to the creation of the innovation center
consisted of a joint-venture and negotiations between 22 ARROBA BCN S.A. and the
Consorci of Zona Franca de Barcelona. The municipal company, 22 ARROBA BCN S.A.,
consisted of public entrepreneurs who had a certain degree of autonomy and flexibility to
form innovative public-private partnerships in order to transform the district into an
innovation district. The local government in Barcelona through its entrepreneurial spinoff, 22
ARROBA BCN S.A., was using the codes of the entrepreneur community to create a space
dedicated to entrepreneurship and innovative activities.
5.2 District Hall - Boston, United States
The District Hall is a flagship program at the center of Mayor Menino’s vision to build an
innovation district in the South Boston waterfront, a former industrial district in Boston.
Boston’s Innovation District was the outcome of a negotiation between real-estate companies
and the City of Boston (BRA, 2010). The Boston Redevelopment Authority (BRA)
negotiated with Gale International, Morgan Stanley, and W/S Development Associates, to
include, in their plans for developing the Seaport Square, a real estate megaproject, a range of
public benefits consisting of “Innovation Uses”, civic and cultural spaces (BRA, 2010). The
Innovation Uses include: laboratories, small business incubators, public event spaces for
exhibitions, rooftop gardens, the District Hall, retail businesses, hotels, innovation
transportation and energy, and public, common, or shared spaces within
innovation/workforce housing (BRA, 2010).
The District Hall is a single-story and 1,115-square-meter located in the heart of Boston’s
Innovation District. The innovation center claims to be “the world’s first free-standing public
innovation center and a dedicated civic space where the innovation community can gather
and exchange ideas” (www.districthallboston.org). The activities located in the innovation
center are: a restaurant, a coffee shop; a lounge, which is completely open to the public; a
large and flexible conference room; and 3 flexible meeting rooms. The users of the
innovation center are: startups, entrepreneurs, students, nonprofit organizations, local
associations, local residents, and corporate companies.
The District Hall was opened in 2013 to serve as an anchor institution that contributes to the
visibility of Boston’s Innovation District. The District Hall was created as a public benefit
through Boston’s incentive zoning rights. In Boston, the Boston Redevelopment Authority,
Boston’s urban planning department, which is supervised by the Mayor’s office, confers
property rights, such as additional density, to real estate developers in exchange for public
benefits to the community. The innovation center is the outcome of a yearlong negotiation
between real estate companies that asked for additional density in the Seaport Square’s
project, the largest real estate development in Boston’s history, and the Boston
Redevelopment Authority that requested for specific public benefits, namely innovation uses
(BRA, 2010). In the public-private partnership, the real estate companies built the District
Hall and granted a lease to Boston Redevelopment Authority for $1 per year for a minimum
period of 5 years with renewable rights for an additional period of 5 years (BRA, 2010). The
Boston Redevelopment Authority transferred the right to use the building to a nonprofit
1009
organization, Venture Café Foundation, which was created in 2010 by Timothy Rowe, the
founder of the Cambridge Innovation Center in Kendall Square. In exchange, the Venture
Café Foundation agrees to organize programming and events in the innovation center. The
Boston Redevelopment Authority evaluates on a quarterly basis the activities of the
innovation center. The funding to operate the innovation center comes from corporate
sponsors, corporate events, and the rents given by a restaurant and a coffee shop located in
the building that are operated by the Briar Group. Additionally, Venture Café Foundation
doesn’t pay taxes to the City of Boston for innovation-related events and activities.
In Boston, the public-private partnership that led to the creation of the innovation center
consisted of a yearlong negotiation between Boston Redevelopment Authority and real estate
developers. The Boston Redevelopment Authority then partnered with a nonprofit
organization, which is funded through the rents given by the restaurant and coffee shop
located in the building, in order to run events and operate the innovation center. The Mayor’s
office used multidimensional and creative partnerships in order to spur the creation of its
innovation center.
5.3 Edney Innovation Center - Chattanooga, United States
Chattanooga is a mid-sized city located in Tennessee in the United States. Since the 1970s,
Chattanooga has reinvented itself from being “America’s Dirtiest City’ into becoming an
emerging innovation hub (Motoyama, Fetsch, Jackson, & Wiens, 2016). The city has built
upon its capacity to generate successful public-private partnerships with philanthropic
foundations, entrepreneurs, and public organizations, to redevelop its waterfront and its
Central Business District. In 2010, the Electricity Power Board (EPB), a public-owned utility
company owned by the City of Chattanooga, launched the fastest fiber-optic Internet network
in the United States, dubbed as the “Gig”, that provided residents with one gigabit speed
Internet (Motoyama et al., 2016).
In 2015, Mayor Berke announced the creation of an innovation district and an innovation
center in downtown Chattanooga that was to be piloted by the Enterprise Center. The
Enterprise Center is a nonprofit public-private partnership that focus on promoting the
innovation economy in Chattanooga. The Enterprise Center was created in 2014 to build
upon the the opportunities that could be leveraged from the Gig upon the recommendations of
the Chattanooga Forward Gig, Entrepreneurship and Technology Task Force Report.
The Edney Innovation Center is a 10-story and 8,360-square-meter building located in the
heart of Chattanooga’s innovation district. The tenants of the innovation center are: CO.LAB,
a nonprofit startup accelerator; Tech Town, a technology learning center; Society of Work, a
co-working space; private companies, and the Enterprise Center. The building includes a
community space open to the public, a rooftop gathering space, and proximately a restaurant,
a coffee shop, and an open space on the ground floor. The users of the building are:
entrepreneurs, community and nonprofit organizations, private companies, and students. The
Enterprise Center, which is located on the fifth floor, organizes networking events,
workshops, and public and private events in its community space. The innovation center aims
to become the catalyst connector for Chattanooga’s entrepreneurial ecosystem.
The Edney Innovation Center was opened in late 2015 and is at the center of Mayor’s Berke’s
vision to establish an innovation district in Chattanooga. The creation of the innovation center

1010
was the outcome of negotiations between a wide range of different actors. The building was
owned by the Tennessee Valley Authority (TVA), a Federally-owned utility agency. Mayor
Berke and Harold DePriest, the CEO of the Electricity Power Board, facilitated the purchase
of the building to the Enterprise Center for favorable terms due to EPB’s and the City of
Chattanooga’s historical partnerships with TVA on the condition that the building be used as
an innovation center (The Enterprise Center, 2015). The Mayor’s office funded the inspection
of the building before the purchase by the Enterprise Center. In early 2015, the Enterprise
Center issued a Request for Proposal (RFP) in order to identify a real estate developer to
retrofit the building into an innovation center (The Enterprise Center, 2015). The Request of
Proposal stated that Co.Lab was to lease the eastern section of the first floor of the building
and the Enterprise Center was to lease the western section of the first floor and an additional
floor at market rate for a period of 5 years, with a 5 year option (The Enterprise Center,
2015). Co.Lab and the Enterprise Center would assist the real estate developer in the creation
and programming of the innovation center. The real estate developer selected was to become
a full partner in supporting the innovation center’s vision by selecting tenants and promoting
uses relevant for the knowledge economy (The Enterprise Center, 2015). In 2015, a local real
estate developer, DEW Edney LLC, was selected to retrofit the building (Motoyama et al.,
2016).
In Chattanooga, the Enterprise Center played the role of coordinating, planning, and
implementing the Mayor’s vision of an innovation center in the city. The Enterprise Center is
a nonprofit public-private partnership that receives its funding from the City of Chattanooga,
Federal grants, foundations, and private companies (The Enterprise Center, 2016). The
Enterprise Center is to some extent, the entrepreneurial arm of the Mayor’s office. The
public-private partnership that led to the creation of the innovation center consisted of a
Request for Proposal and negotiations between the Enterprise Center and the local real estate
developer, Dew Edney LLC.
6. DISCUSSION
Innovation centers are being created in diverse cities around the world to accommodate
entrepreneurs and knowledge workers. While innovation centers are often built with private
funds by entrepreneurs, this paper shows that innovation centers can also be the outcome of
public-private partnerships in which local governments act as public entrepreneurs.
Innovation centers are innovation districts’ anchor institutions that participate in knowledge-
based development and the urban regeneration of previously industrial or manufacturing
urban districts. Local governments that build innovation centers aim to provide their local
entrepreneurial ecosystems with the required informal infrastructures to facilitate face-to-face
interactions, collaboration, and the exchange of tacit knowledge in order to accelerate the
process of innovation. As Peter Hall (1998) showed, innovative city-regions not only have
few, if not any, barriers to the diffusion of innovations, but have also strong but informal
structures for exchanges of ideas and knowledge. Local policymakers are more and more
keen to embrace innovation policies for their cities. Innovation centers are not however, a
“one-size-fits-all” innovation policy. Indeed, innovation centers participate in the making of
an innovation district and as a result, should only be promoted when an existing innovation
ecosystem already or potentially exists.

1011
Table 1. Overview of the Case-Studies
6. CONCLUSIONS
The paper finds that an innovation center can be the outcome of creative and innovative
private-public partnerships as it was the case in Barcelona, Boston, and Chattanooga. In each
case-study, the local government had a strong direct or indirect leadership role in negotiating
or providing resources and incentives to build their innovation centers. More importantly,
Mayors were critical in communicating their visions for the creation an innovation center to a
wide range of potential partners. Mayors took advantage of or created entrepreneurial
organizations, such as 22 ARROBA BCN S.A. in Barcelona, the Boston Redevelopment
Authority in Boston, and the Enterprise Center in Chattanooga, in order to gain in flexibility
and to remove bureaucratic processes, and thus, facilitated the implementation of their
entrepreneurial visions.
Entrepreneurial mayors support the creation of entrepreneurial organizations to endorse
public-private partnerships in order to rapidly and efficiently create innovation centers and
accelerate their cities’ transition into the knowledge-based economy. In endorsing creative
and innovative public-private partnerships, local governments are adopting the codes of the
entrepreneurial community. In doing so, this new wave of public entrepreneurialism enhances
the legitimacy and signals the local governments’ commitment to improving their local
innovation ecosystems to the entrepreneurial community. The new wave of entrepreneurial
mayors and public organizations participate in the current debate of the supposedly superior
local government’s advantages in finding innovation solutions to local economic
development challenges (Pike, Rodríguez-Pose, & Tomaney, 2017). The paper has however,
a limited scope since it deals with the creation of innovation centers through public-private
Name Edney Innovation Center District Hall Barcelona Growth Center
Location Chattanooga-Tennessee-USA Boston-Massachusetts-USA Barcelona-Spain
Creation Date 2015 2013 2010
Type of
Partnership
Public-Private Partnership -
RFP-Legal Agreement
Public-Private Partnership -
Public Benefit
Public-Private Partnership -
Joint Venture
Lead Coordinating
OrganizationThe Enterprise Center Boston Redevelopment Authority 22 ARROBA BCN S.A.
Floor Area 8,360 Square Meters 1,115 Square Meters 15,000 Square Meters
PurposeAnchor space for Chattanooga's
Innovation District
Anchor space for Boston's
Innovation District
Anchor space for 22@
Barcelona's Media and ICT
clusters
Key Actors
The Enterprise Center; The
Mayor's Office; Private
Foundations; Real Estate
Developer; Tennessee Valley
Authority
The Boston Redevelopment
Authority; The Mayor's Office;
Real Estate Developers; The
Venture Foundation; Briar Group
22 ARROBA BCN S.A.; The
Mayor's Office; Barcelona Activa;
Consorci Zona Franca de
Barcelona
Activities in the
Innovation Center
Coffee Shop (opening soon),
Restaurant (opening soon), Co-
Working Spaces, Accelerators,
Collision Space, Office Space,
Public and Private Events
Coffee Shop, Restaurant,
Conference Rooms, Meeting
Rooms, Open Co-working Spaces,
Public and Private Events
Conference Rooms, Co-Working
Spaces, Accelerators,
Cibernarium Training Center,
Business Support Office, Office
Spaces, Parking, Public and
Private Events
Innovation Centers

1012
partnerships in developed and relatively large cities with efficient public institutions, and as a
result, offers little relevance to urban policymakers in lower-income countries.
7 REFERENCES
Acs, Z. J., & Audretsch, D. B. (1988). Innovation in Large and Small Firms: An Empirical Analysis. The
American Economic Review, 78(4), 678–690.
Amin, A. (1994). Post-Fordism: A Reader. Oxford: Blackwell.
Aydalot, P., & Keeble, D. (1988). High Technology Industry and Innovative Environments: The European
Experience. London: Routledge.
Barceló, M., & Guillot, S. (2013). Gestión de proyectos complejos. Barcelona: Piramide.
Barceló, M., & Oliva, A. (2002). La Ciudad Digital. Barcelona: Pacto Industrial de la Región Metropolitana de
Barcelona.
Barcelona Activa. (2012, November). Barcelona Smart City Tour. Retrieved from
http://w42.bcn.cat/web/es/media-room/presentacions/index.jsp?componente=221-95513
Barcelona. (2000). Modificación del PGM para la renovación de las zonas industriales del Poblenou - Districte
d’Activitats 22@bcn. Barcelona: Ayuntamiento de Barcelona. Retrieved from
www.22barcelona.com/content/blogcategory/39/125/lang,ca.
Bathelt, H., Malmberg, A., & Maskell, P. (2004). Clusters and Knowledge: Local Buzz, Global Pipelines and
the Process of Knowledge Creation. Progress in Human Geography, 28(1), 31-56.
Becattini, G. (1992). Le District Marshallien: Une Notion Socio-Economique. In Benko G. & Lipietz, A. (Eds.).
Les régions qui Gagnent (pp. 35-55). Paris: Presses Universitaires de France.
Boschma, R. (2005). Proximity and Innovation: A Critical Assessment. Regional Studies, 39(1), 61-74.
Boston Redevelopment Authority. (2010). Development Plan for Planned Development Area No. 78 Seaport
Square Project. Boston: Boston Redevelopment Authority.
Botsman, R., & Rogers, R. (2011). What’s Mine Is Yours: How Collaborative Consumption Is Changing the
Way We Live. London: Collins.
Braczyk, H. J., Cooke, P. N., & Heidenreich, M. (1998). Regional Innovation Systems: The Role of Governances
in a Globalized World. London: University College London Press.
Brenner, N. (2004). Urban Governance and the Production of New State Spaces in Western Europe, 1960–2000.
Review of International Political Economy, 11(3), 447-488.
Breschi, S., & Malerba, F. (1997). Sectoral Innovation Systems: Technological Regimes, Schumpeterian
Dynamics, and Spatial Boundaries. Systems of Innovation: Technologies, Institutions and Organizations,
130-156.
Capdevila, I., (2015). Co-Working Spaces and the Localised Dynamics of Innovation in Barcelona.
International Journal of Innovation Management, 19(3).
Carayannis, E. G., & Campbell, D. F. (2009). ‘Mode 3’ and ‘Quadruple Helix’: toward a 21st century fractal
innovation ecosystem. International Journal of Technology Management, 46(3-4), 201-234.
Carlino, G. A. (2001). Knowledge Spillovers: Cities’ Role in the New Economy. Business Review Q, 4, 17-24.
Castells, M. (1996). The Rise of the Network Society. Oxford: Blackwell Publishers.
Chatterji, A., Glaeser, E., & Kerr, W. (2014). Clusters of entrepreneurship and innovation. Innovation Policy
and the Economy, 14(1), 129-166.
Chesbrough H. (2003). Open Innovation: The New Imperative for Creating and Profiting from Technology.
Boston, MA: Harvard Business School Press.
Christensen, C. (1997). The Innovator’s Dilemma. Boston, MA: Harvard Business School Press.
Cohendet, P., Grandadam, D., & Simon, L. (2010). The Anatomy of the Creative City. Industry and Innovation,
17(1), 91-111.
Cooke, P. (1997). Regions in a global market: the experiences of Wales and Baden-Wurttemberg. Review of
International Political Economy, 4(2), 349-381.
Drucker, P. F. (1998). The Discipline of Innovation. Harvard Business Review, 76(6), 149-157.
Eisenhardt, K. M. (1989). Building Theories from Case Study Research. Academy of Management Review,
14(4), 532-550.
Eisenhardt, K. M., & Graebner, M. E. (2007). Theory Building from Cases: Opportunities and Challenges.
Academy of Management Journal, 50(1), 25-32.
Etzkowitz, H. (2015). Making a Humanities Town: Knowledge-Infused Clusters, Civic Entrepreneurship and
Civil Society in Local Innovation Systems. Triple Helix, 2(1), 1-22.
Fagerberg, J. (1988). International Competitiveness. The Economic Journal, 98(391), 355-374.
Florida, R. (1995). Toward the Learning Region. Futures, 27(5), 527-536.

1013
Florida, R. (2002). The Rise of the Creative Class: And How It’s Transforming Work, Leisure, Community, and
Everyday Life. London: Basic Books.
Florida, R., Adler, P., & Mellander, C. (2017). The City as Innovation Machine. Regional Studies, 51(1), 86-96.
Freeman, C. (1987). Technical Innovation, Diffusion, and Long Cycles of Economic Development. In Vasko,
T. (Eds.). The Long-Wave Debate (pp. 295-309). Springer Berlin Heidelberg.
Gertler, M. S. (2003). Tacit Knowledge and the Economic Geography of Context, or the Undefinable Tacitness
of Being (There). Journal of Economic Geography, 3(1), 75-99.
Hall, P. (1998). Cities in Civilization. Oxford: Blackwell.
Hall, T., & Hubbard, P. (1996). The Entrepreneurial City: New Urban Politics, New Urban Geographies?.
Progress in Human Geography, 20(2), 153-174.
Harding, A. (1990). Public-Private Partnerships in Urban Regeneration, In Campbell, M. (Eds.). Local
Economic Policy (pp. 108-127). London: Cassell.
Howells, J. R. (2002). Tacit Knowledge, Innovation and Economic Geography. Urban Studies, 39(5-6), 871-
884.
Jacobs, J. (1969). The Economy of Cities. New York: Random House.
Jaffe, A. B., Trajtenberg, M., & Henderson, R. (1993). Geographic Localization of Knowledge Spillovers as
Evidenced by Patent Citations. The Quarterly Journal of Economics, 108(3), 577–598.
Kane, T. (2010). The importance of startups in job creation and job destruction. Kauffman Foundation
Research Series: Firm Formation and Economic Growth.
Katz, B., Wagner, J. (2014). The Rise of Innovation Districts: A New Geography of Innovation in America.
Washington: Brookings Institute.
Knight, R. V. (1995). Knowledge-Based Development: Policy and Planning Implications for Cities. Urban
Studies, 32(2), 225-260.
Krugman, P. (1995). Increasing returns, imperfect competition and the positive theory of international trade.
Handbook of International Economics, 3, 1243-1277.
Leydesdorff, L., & Etzkowitz, H. (1996). Emergence of a Triple Helix of university-industry-government
Relations. Science and Public Policy, 23(5), 279-286.
López, A., Romani, A., Sagarra, R., Piqué, J. H. (2011). 22@Barcelona: Exportando el Modelo. Revista
Económica de Cataluña, (64), 70-79.
Lundvall, B. A. (1992). National Innovation System: Towards a Theory of Innovation and Interactive Learning.
London: Pinter.
Lyons, T. S. & Hamlin, R. E. (2001). Creating an Economic Development Action Plan: A Guide for
Development Professionals, Revised and Updated Edition. Westport, CT: Praeger.
Maskell, P., & Malmberg, A. (1999). The Competitiveness of Firms and Regions ‘Ubiquitification’and the
Importance of Localized Learning. European Urban and Regional Studies, 6(1), 9-25.
McQuaid, R.W. (2000). The Theory of Partnerships - Why Have Partnerships. In Osborne, S. (Eds.). Managing
public-private partnerships for public services: an international perspective (pp. 9-35). London: Routledge.
Moretti, E. (2012). The New Geography of Jobs. Boston: Houghton Mifflin Harcourt.
Morgan, K. (1997). The Learning Region: Institutions, Innovation, and Regional Renewal. Regional Studies, 31:
491-504.
Morgan, K. (2004). The Exaggerated Death of Geography: Learning, Proximity and Territorial Innovation
Systems. Journal of Economic Geography, 4(1), 3-21.
Morisson, A. (2014). Innovation Districts: An Investigation of the Replication of the 22@ Barcelona’s Model in
Boston. (Master Dissertation). Retrieved from bibliotecadigital.fgv.br/dspace/handle/10438/13135
Motoyama, Y., Fetsch, E., Jackson, C., & Wiens, J. (2016). Little Town, Layered Ecosystem: A Case-Study of
Chattanooga. Kauffman Foundation Research Series on City, Metro, and Regional Entrepreneurship.
Kansas City: Kauffman Foundation.
Newman, P., & Verpraet, G. (1999). The impacts of partnership on urban governance: Conclusions from recent
European research. Regional Studies, 33(5), 487-491.
OECD. (1996). The Knowledge-Based Economy. Paris: OECD Publishing.
Ohmae, K. (1995). The End of the Nation State: The Rise of Regional Economies. New York: The Free Press.
Osborne, S. (2002). Public-Private Partnerships: Theory and Practice in International Perspective. London:
Routledge.
Osborne, S. (2006). The New Public Governance? Public Management Review, 8, 377-388.
Pike, A., Rodríguez-Pose, A., & Tomaney, J. (2017). Shifting horizons in local and regional development.
Regional Studies, 51(1), 46-57.
Polanyi, M. (1966). The Tacit Dimension. London: Routledge & Kegan Paul.
Rodríguez-Pose, A., & Crescenzi, R. (2008). Mountains in a Flat World: Why Proximity Still Matters for the
Location of Economic Activity. Cambridge Journal of Regions, Economy and Society, 1(3), 371-388.

1014
Rosenberg, N. (1982). Inside the Black Box: Technology and Economics. Cambridge: Cambridge University
Press.
Rosenberg, N. (2004). Innovation and Economic Growth. Innovation and Economic Growth. Paris: OECD
Publishing.
Sagalyn, L. B. (2007). Public/private development: Lessons from history, research, and practice. Journal of the
American Planning Association, 73(1), 7-22.
Saxenian, A. (1994). Regional Advantage: Culture and Competition in Silicon Valley and Route 128. Boston,
MA: Harvard University Press.
Schumpeter, J. (1934). The Theory of Economic Development: An Inquiry into Profits, Capital, Credit, Interest,
and the Business Cycle. New Jersey: Transaction Publishers.
Schumpeter, J. (1942). Socialism, Capitalism and Democracy. London: Allen & Unwin.
Solow, R. M. (1957). Technical change and the aggregate production function. The review of Economics and
Statistics, 312-320.
Stake, R. E. (2013). Multiple Case Study Analysis. New York: Guilford Press.
Sturgeon, T. J. (2000). How Silicon Valley came to be. In Kenney, M. (2000). Understanding Silicon Valley:
Anatomy of an Entrepreneurial Region (pp. 15-47). Palo Alto: Stanford University Press.
The Enterprise Center. (2015). The Edney Building 1100 Market Street Chattanooga, TN 37402. Request for
Proposals. The Enterprise Center. Retrieved from
https://static1.squarespace.com/static/54a0561ae4b0d1a214afcf82/t/54b6ab69e4b0b6572f717ac8/14212575
77834/Enterprise+Center+Request+for+Proposals+1.12.2015.pdf
The Enterprise Center. (2016). Annual Report 2016. The Enterprise Center.
https://static1.squarespace.com/static/54a0561ae4b0d1a214afcf82/t/57969692197aea844557a49c/14694867
47573/TEC-AnnualReport-2016.pdf
Trullén, J. (2001). El Projecte Barcelona. Ciutat del Coneixement desde L’Economia. Monogràfics de
Barcelona
Metropolis Mediterrània, 1, 16-25
Van Ham, H., & Koppenjan, J. (2001). Building public-private partnerships: Assessing and managing risks in
port development. Public Management Review, 3(4), 593-616.
Von Hippel, E. (1994). “Sticky Information” and the Locus of Problem Solving: Implications for Innovation.
Management Science, 40(4), 429-439.
Yin, R. K. (1994). Case Study Research: Design and Methods. Newbury Park, CA: Sage.

1015
ID 094
CLUSTERS IN DESIGNING S3-ORIENTED POLICIES
C. Bevilacqua and G. Pronestì
PAU Department, Università Mediterranea di Reggio Calabria, Salita Melissari, 89124, Italy
Email: [email protected]
Abstract: Enhancing economic performances of regions is currently perceived as a priority.
Given these needs, the role of regional clusters has been recently coupled with the concept of
Smart Specialization Strategy (S3). This paper aims at contributing to the debate on the role of
clusters in the arduous implementation of S3, towards investigating the potentials of the
clusters life cycle (CLC) and spatial analysis to guide the Entrepreneurial Discovery Process
(EDP). This argument is theoretically discussed on the base of literature evidence. Firstly, the
concept of S3, its relation to clusters and the emerging EDP gaps are presented. Secondly, the
potentials of CLC and spatial analysis are investigated by (i) studying the literature and
selecting a set of indicators, accounting for clusters stage-specific and spatial attributes. (ii)
framing the indicators into a model and providing a qualitative judgment of their strength at
each stage of the CLC (iii) interpreting the model towards testing whether the CLC and spatial
analysis display the potential to input EDP.
The authors find that CLC and spatial analysis can play a significant role towards supporting
EDP operationalization. This finding calls for the consideration of policymakers as a valuable
source of information towards tackling EDP gaps.
Keywords: Clusters, Design, Maps-Led, Policy, S3.
1. INTRODUCTION
During the last decades, the concepts of competitiveness and innovation, at the regional level,
gained a growing consideration becoming key topics of both academic and political debates.
The urge to enhance regional economic performances, through the creation of appropriate
context-conditions, is perceived as a priority, which would enable territories to tackle the
challenges posed by globalisation (Farrell et al., 1999; Doloreux and Parto, 2005; Foray et al.,
2009; Camagni and Capello, 2013). Given these emerging needs, the role of regional clusters
has become progressively more significant (Porter, 2000, 2003; Martin and Sunley, 2003)
and recently it has been coupled with the policy concept of Smart Specialization Strategy
(S3). The latter is a relatively new academic idea, which has enjoyed a fast success towards
suddenly turning into a crucial element of the EU 2020 innovation plan (Dominque Foray,
David, and Hall, 2011). S3 brings into prominence an innovative territorial development
policy framework, which enhances the place-based approach. S3 policies are mainly
advocated in EU regions. The attention is pushed on whether the core toolkit provided by the
experience with clusters and cluster policies could potentially guide the challenging design
and implementation of S3. As much research confirms, while Cluster policy and S3 are not
completely corresponding, it is still reasonable identifying many synergies between the two
policy constructs (Foray, David, and Hall, 2011; Foray et al., 2012; Aranguren and Wilson,
2013; Castillo, Paton and Saez, 2013; Ketels et al., 2013). Notwithstanding the valuable
contribution of many scholars on the subject of Cluster and S3, the academic debate still falls
somewhat short of addressing some issues. In particular, various scholars observed that one
of the S3’s policy principles, the so-called Entrepreneurial Discovery Process (EDP), is
affected by significant implementation gaps (Hermosa and Elorduy, 2015; Rodríguez-Pose

1016
and Wilkie, 2015; Gheorghiu, Andreescu, and Curaj, 2015; Capello and Kroll, 2016). The
emerging issue, mentioned above, calls attention to the need to disclose new perspectives on
the relationship between Cluster and S3.
This work aims at exploring new perspectives on the role of clusters in S3 design and
implementation, with a focus on EDP. The theoretical constructs, presented in the following
sections, are meant to provide policymakers with valuable insights to adequately tackle EDP-
related challenges. The authors believe that S3 and, particularly, EDP implementation could
highly benefit clusters' stage-specific and spatial analysis. Considering the research purpose,
the article structure is the following. The second section reflects on the concept of S3, its
relation with clusters and the emerging EDP gap. The third section investigates the potential
role of the clusters life cycle (CLC) and spatial analysis in the way of EDP. The fourth
section presents the conclusions.
2. A BACKGROUND ON S3 AND CLUSTERS: CONCEPTS AND CHALLENGES
The discussion on S3 has originated from the work of the Knowledge for growth experts
group, which highlighted the need for re-thinking EU regional development policies to bridge
the so-called transatlantic gap. Accordingly, the academic concept of S3 defines an
innovative, place-based development policy framework. S3 primary objectives pertain to (i)
production of smart, sustainable and inclusive growth, (ii) promotion of research potential,
and (iii) maximisation of the usage of innovations (Foray et al., 2009, 2012; Foray and
Goenega, 2013). This strategy also emphasises the urge to prioritise policy initiatives by
operating with a vertical logic and defining methods to “identify (…) desirable areas for (…)
intervention”(Foray and Goenega, 2013: p.1). Since its birth, the concept of S3 has had an
extraordinary career and rapidly became a crucial element of the EU 2020 innovation plan.
However, translating such academic idea in practice is not a trivial matter and poses many
implementation barriers. In the way of facilitating the operationalization of S3, the EU
Commission has produced a sort of implementation handbook, entitled “Guide to Research
and Innovation Strategies for Smart Specialization (RIS3)” (Foray et al., 2012). This guide
sets a quite demarcated implementation framework, including six steps (Foray et al., 2012):
(i) analysis of the national/regional context and the potential for innovation, (ii) set-up of a
sound and inclusive governance structure, (iii) production of a shared vision for the future of
the country/region, (iv) selection of a limited number of priorities for national/regional
development, (v) establishment of suitable policy mixes, and (vi) integration of monitoring
and evaluation mechanisms (Foray et al., 2012). Besides the implementation steps mentioned
above, the work of Foray et al. (2012) also offers an important reflection on the relationship
between clusters and S3. Clusters are intended by the authors as a valuable source of
knowledge, which has to be cautiously deployed in the way of S3. EU Regions' experience
with clusters and cluster policies is seen as an essential "building block" to implementing S3
policies. The importance of clusters’ contribution to S3, is particularly acknowledged for: (i)
identifying regional competencies and assets, (ii) meeting the objectives of S3, and (iii)
reinforcing local and international cooperation (Foray et al., 2012). Comparable arguments
are later recalled in the EU Commission’s report on "The role of clusters in Smart
Specialisation Strategy" authored by Ketels et al. (2013), which defines similarities and
differences between clusters and S3. This report claims that, while both clusters and S3 focus
specifically on productivity and innovation as drivers of competitiveness and aim to foster
regional embeddedness, there are still many differences in emphasis between the two policy
constructs. Clusters, it is said, focus more on: (i) the critical mass of economic activities, ii)

1017
the performance of a set of linked companies (iii) the external effects through shared
infrastructure and input markets, and (iv) the groups of companies operating in related
industries (Ketels et al.; 2013). Instead, S3 refers to (i) the exploration of emerging market
opportunities, (ii) the facilitation of knowledge spillovers between knowledge domains, (iii)
the exploitation of related variety, and (iv) the generation of structural changes in regional
economies (Ketels et al.; 2013). After comparing clusters and S3, the report of Ketels et al.
(2013) streamlines clusters’ potential support to S3 implementation, through a six-leverage-
point framework. The latter includes : (i) prioritization process (ii), design of integrated
policy mixes, (iii) evidence-based policy-making, (iv) multi-level governance, (v) cross-
border dimension, and (vi) stakeholders engagement (Ketels et al., 2013: p.5). Finally, the
report on "The role of clusters in Smart Specialisation Strategy" provides some early
suggestions on the need to take into consideration the level of clusters development as an
element potentially supportive to S3 implementation. On a similar line of thoughts, Araguren
and Wilson (2013) observed correspondences and distinctions between Cluster and S3. The
latter authors report three key differences between the two policy constructs, namely (i) scale,
(ii) focus and (iii) tools. Araguren and Wilson noticed that cluster policies usually aim at
supporting cooperation among distinct groups of agents, focusing on the enhancement of
competitiveness at the cluster level by employing relatively narrow tools. Instead, S3 has a
broader scope than cluster policies and aim at fostering processes of economic prioritisation
which will eventually lead regions towards economic restructuring. However, Araguren and
Wilson (2013) still affirm that there are potential synergies between clusters and S3. Indeed,
the two scholars observed that both the policy constructs have a place-specific feature, seek
to promote cooperation among actors that develop complementary economic activities and
aim to support the existent and building new competitive advantages. In conclusion,
Aranguren and Wilson (2013) actualize the study about clusters and S3 on the case of the
Basque country. In contrast whit the studies mentioned above, an on-field analysis conducted
by Perło (2015), in the Polish regions, reveals that "the development of clusters with smart
specialisations (…) proves that it is difficult to detect a practical correlation between these
concepts”(Perło, 2015: p.107).
Despite the extensive literature on the subject, the operationalization of S3 remains arduous.
The difficulties are due both to the experimental nature of the concept, and the complexity of
the policy construct itself. The most severe challenges seem to concern the EDP, which is
discussed in the next subsection.
2.2 EDP: process and gaps
EDP is undoubtedly the peculiar element of S3 policies. According to Foray's perspective,
EDP is the key engine enabling the success of S3 by disclosing regions' hidden potential to
specialise (Foray et al., 2009, 2012; Foray and Goenega, 2013; Bevilacqua et al., 2015).
Foray stresses that the key EDP inputs are "framework conditions for innovation",
“relational density”, and “diversity of economic actors” (Foray, 2015: p.61). These inputs
should drive EDP towards the (i) integration of entrepreneurial and economic knowledge, (ii)
engagement of stakeholders, and (iii) exploration of new economic domains at the regional
level. Tersely, EDP is meant to territorially detect economic priorities, by engaging a broad
group of local stakeholders (entrepreneurial agents, policy makers and the remainder of the
society), to enlarge the local knowledge-base and produce relevant information to S3. Given
these considerations, it has to be observed that EDP requires a bottom-up approach, which
implies a paradigmatic shift in the traditional conception of “administration and politics [as]

1018
omniscient planners” (Foray, 2015: p.3). Accordingly, the significance of administrators' role
is downscaled, while the position of other local actors (particularly, entrepreneurial agents) is
enhanced. Because of its very nature, EDP is as much essential as challenging to S3. Foray
first, observed that the identification of entrepreneurial discoveries “[is] not [an] easy
empirical investigation” (Foray, 2015: p.61). Since then, various academics noted the
difficulties associated with EDP implementation. Recently, Capello and Kroll (2016)
extensively discussed the barriers limiting S3 implementation. The same academics
highlighted that, among other factors, “the lack of concrete elaboration of the
entrepreneurial discovery process (…) c[o]me[s] to play a hindering factor”(Capello and
Kroll, 2016: p.6 ). Gheorghiu, Andreescu, and Curaj (2015) offer a similar finding, by
lamenting the lack of a “functional blueprint for the entrepreneurial discovery process”
(p.2). The pieces of evidence, mentioned above, call for consideration from both scholars and
practitioners to tackle such EDP-related issues. It reasonable to affirm that disclosing new
perspective on the relationship between clusters and S3, could potentially contribute towards
resolving EDP implementation gaps.
3. EXPLORING NEW PERSPECTIVES: CLUSTERS’ LIFE CYCLE AND SPATIAL
ANALYSIS
The processes of policy design and implementation are rarely concerned with the different
phases of the clusters life cycle. However, considering that clusters dynamics and spatial
configurations change over time, it is expectable "that different policy measures vary in their
effectiveness over the clusters life cycle" (Brenner and Schlump, 2011: p.1364 ). The latter
idea seems to apply, to some extent, also to S3. Consistently, it is reasonable to suppose that
some clusters’ stage-specific attributes (in term of innovative dynamism, cooperation among
firms, diversity of knowledge and actors, and spatial significance) can be considered, much
then others, suitable to support the operationalization of S3, and in particular of EDP. This
theoretical argument, which is the core of the present study, is tested through the
methodological approach that follows. Firstly, the study of the literature on the CLC allows
the authors to understand which are the leading indicators accounting for the evolution of
clusters. Secondly, the indicators drawn from the literature study, are used to build a
theoretical model, and a qualitative judgment is assigned by the authors to each indicator at
every stage of the CLC. Thirdly, the discussion on the model logically compares stage-
specific features (in term of innovative dynamism, cooperation among firms, diversity of
knowledge and actors, and spatial significance) of clusters with key inputs and characteristics
(according to Foray) of EDP, in order to test if and which stage of the CLC display a
potential towards inputting EDP.
3.1 Literature study
While the academic literature has plenty of studies dissecting the functioning of clusters,
there are still relatively few pieces of work adequately explaining the dynamics of clusters
evolution. Various academics claim that clusters evolve through a precise life cycle
consisting of different stages. However, such stages are not univocally identified yet. The
literature indeed, offers different models, which treat clusters' evolution according to three-
stage- (Bianchi, Miller and Bertini, 1997; Mario A Maggioni, 2004; Maskell and Kebir,
2006), four-stage- (Press, 2006; Bergman, 2008; Menzel and Fornahl, 2009; Handayani et al.,
2012) or even five-stage-based frameworks (Andersson et al., 2004; Brenner and Schlump,

1019
2011). This article describes the CLC, according to a three-stage taxonomy, including the
phases of (i) emergence, (ii) development and (iii) maturity of clusters. This study does not
consider the stage after maturity as it is not precisely predictable whether clusters are going to
transform or decline after reaching the mature stage.
Emergence. This stage is usually triggered by an exogenous economic shock, caused by the
introduction of a process- or product- innovation (Mario A. Maggioni, 2004). The exogenous
shock induces the take-off of the clustering process and consequently drives a limited number
of small companies to agglomerate in certain geographical areas (Bianchi, Miller, and
Bertini, 1997; Andersson et al., 2004; Maggioni, 2004; Menzel and Fornahl, 2009). Such
early agglomeration phenomenon presents a scattered spatial configuration and lacks
consistency because the locational benefits are not evident yet (Mario A Maggioni, 2004).
However, the more the innovation, which sparked the clustering process, spreads out, the
more firms enter the cluster being encouraged by involuntary knowledge spillover. Indeed,
the flow of knowledge and information at this stage is mainly involuntary and informal as it
does rely nor on structured networks neither on consolidated partnerships. Despite the lack of
sharpened inter-firm organisational forms, nonetheless, a stock of heterogeneous knowledge
circulates among insider businesses. At this stage, it is reasonable to identify four key factors
potentially leading the new-born cluster to success, namely: (i) number of start-ups and
imitative businesses entering the market (Brenner and Schlump, 2011; Suire and Vicente,
2014); (ii) heterogeneity of accessible knowledge which “facilitates continuous adjustment to
changing external circumstances”(Shin and Hassink, 2011: p.1390); (iii) local
political/institutional context, in terms of policy environment and the presence of high quality
Public Institutions, Universities and research centres (Menzel and Fornahl, 2009); (iv) local
industrial context, in terms of the presence of related industries (Porter, 1998). The two
former factors function actively to support clusters development. Instead the two latter play a
background role (Brenner and Schlump, 2011). This explorative stage of the CLC is also
characterised by significant Venture Capital (VC) and Research and Development (R&D)
investments. To summarise, the emergence is a very early, upstream and explorative phase of
the CLC and it is featured by a marked tendency of firms towards innovativeness. The role of
start-ups, as well as the values of creativity, and willingness to risk added by entrepreneurs,
are crucial to further the prosperity of clusters. The benefits deriving from network activities
and knowledge spillovers are somehow available, and the stock of accessible knowledge is
highly heterogeneous.
Development. In this stage clusters expand through both a substantial proliferation of the
companies entering the market and a significant increase in employment. The locational
benefits become incredibly high towards fostering up the spatial agglomeration phenomenon.
Accordingly, the profitability of insider businesses rises, reaching its peak. In this phase, the
agglomeration economies, theorised by Marshall, are the key engine enabling the endogenous
growth of the cluster (Mario A Maggioni, 2004). Consequently, many positive externalities
take place, including (i) specialised labour pooling; (ii) interactions among stakeholder, and
(iii) knowledge spillovers. In addition to the Marshallian externalities, another factor
contributing to the cluster prosperity is the medium/high level of heterogeneity of available
knowledge within the clusters’ environment (Shin and Hassink, 2011). Tersely, the success of
clusters at this stage seems boldly rooted in regional self-reinforcing processes (such as
networking activities, interactions, and cooperation) occurring among local firms and
institutions. The number of Start-ups and entrepreneurs is still relevant but no longer crucial.
The R&D and VC investments remain significant as well as the level of heterogeneity of
accessible knowledge.
1020
Maturity. In this stage clusters reach a stable configuration, towards focusing on specific
business segments, consolidating networks’ structure and acquiring cooperative routines
(Menzel and Fornahl, 2009; Brenner and Schlump, 2011). This state of quasi-equilibrium of
clusters is featured by a severe decrease in frequency and number of entries, which in turn
makes the clusters’ growth rate dropping down. At this point, while locational benefits and
self-reinforcing effects are still somehow accessible, they tend inevitably to attenuate and
slowly dissolve (Mario A. Maggioni, 2004; Brenner and Schlump, 2011). Moreover, clusters
at this stage are usually featured by a tendency towards high specialisation (if not over-
specialisation), which narrows the variety of economic activities as well as the heterogeneity
of available knowledge (Shin and Hassink, 2011). To sum up, in the maturity clusters reach
the maximum size, have a well-shaped network structure, and a precisely-defined core
business. In this context, the entry of Start-ups in the clusters becomes irrelevant, R&D and
VC investments decrease, and the knowledge accessible becomes homogeneous.
In conclusion this literature study provides a description of clusters stage-specific attributes,
allowing the authors at deducing that clusters evolution can be explained, to some extent, by
variations in the following indicators: R&D investment; VC investment, new firms (start-ups)
birth rate (Bergman, 2008; Brenner and Schlump, 2011); intensity of network activities
(Brenner and Schlump, 2011); heterogeneity of available knowledge (Menzel and Fornahl,
2009; Shin and Hassink, 2011); specialization and agglomeration (Maggioni, 2002;
Maggioni, 2004). These elements will be deployed to outline a theoretical model which is
ultimately meant to present the potential of CLC and spatial analysis in inputting EDP.
3.2 Theoretical model
Outlining such a theoretical model presents some difficulties. Firstly, because the lack of
established conventions on indicators for the study of clusters makes the selection of the
variables a relatively arbitrary process. Secondly, because nor clusters neither the CLC can be
satisfyingly explicated through a single model. Given these premises, while the model cannot
fully explain the CLC and the related spatial dynamics, it can still adequately present the
potential of CLC and spatial analysis in inputting EDP. Accordingly, the model is designed as
follows: (i) a set of indicators is selected by drawing insights from the literature study (see
subsection 3.1). This set includes: R&D investment, VC investment, new firms birth rate as
indicators of clusters dynamism (Bergman, 2008; Brenner and Schlump, 2011), intensity of
network activities as indicator of cooperation (Brenner and Schlump, 2011), heterogeneity of
available knowledge (Menzel and Fornahl, 2009; Shin and Hassink, 2011) specialization and
agglomeration as indicator of spatial significance (Maggioni, 2002; Mario A Maggioni,
2004); (ii) the strength of each indicator at each stage of the CLC is qualitatively scored. The
scores are assigned by the authors on the base of the insights drawn from the literature. For
the scoring, the authors used a scale based on five degrees of intensity: low, medium/low,
medium, medium/high and high.
Tersely, the model both systematises clusters' stage-specific and spatial attributes, and opens
to a discussion.
Table 1: Strength of the indicators by CLC stage
DYNAMISM COOPER VARIET SPATIAL

1021
ATION Y SIGNIFICANCE
R&D
investm
ent
VC
investm
ent
Start-
ups
birth
rate
Intensity of
network
activities
Heteroge
neity of
available
knowled
ge
Specializ
ation
Agglome
ration
Emerge
nce high high high medium high low low
Develop
ment
medium
/high
medium
/high
medium
/high
medium/hig
h
medium/
high medium
medium/h
igh
Maturit
y low low low
medium/hig
h low high high
3.3 Discussion on the model
The model presented in Table 1 opens to a discussion: firstly, provides an interpretation of
the indicators and their variation in strength over the CLC stages, and secondly, highlights the
relevance of clusters stage-specific and spatial features relatively to EDP’s key inputs and
characteristics (according to Foray). The finding emerging from the discussion are
summarised in Table 2.
Table 2: Findings
DYNAMISM COOPE
RATION
VARIE
TY
SPATIAL
SIGNIFICANCE
COMP
ARISO
N TO
EDP
R&D
invest
ment
VC
invest
ment
Start-
ups
birth
rate
Intensity
of
network
activities
Hetero
geneity
of
availab
le
knowle
dge
Special
ization
Agglom
eration
Potentia
l input
to EDP
Emerg
ence high high high medium high low low
high
Develo
pment
mediu
m/high
mediu
m/high
mediu
m/high
medium/h
igh
mediu
m/high
mediu
m
medium
/high high
Matur
ity low low low
medium/h
igh low high high
low
R&D investments target a broad range of creative activities, including “basic research,
applied research, and experimental development” (OECD, 2013: p.1). These activities aim at
expanding “the stock of knowledge (…) and the use of this knowledge to devise new
applications”(OECD, 2013: p.1). According to the literature R&D investment is considered
as a reliable indicator of clusters innovativeness (Davis et al., 2006), and as a determinant of
entrepreneurship (OECD, 2013, 2016). Tersely, R&D catalyses the generation and diffusion
of new knowledge, towards creating a vibrant entrepreneurial environment and supporting
inventions. The benefits of R&D spread over regions by availing entire groups of firms.
However, it has been found that R&D seems to play a particularly prominent role “during the

1022
early life course of (…) firms” (Stam and Wennberg, 2009: p.79). Furthermore, new-born
firms (such as start-ups) tend to use the innovative inputs (investment on R&D) more
efficiently than the old ones. Consequently, clusters featured by a high number of start-ups,
attract and call for R&D investment, which in turn generate remarkable innovative outputs.
Given these considerations, it seems logically more convenience to operate R&D investments
during the initial phases of the CLC, namely emergence and development. These two initial
stages appear to be more suitable for entrepreneurial discoveries, because of a high start-ups'
birth rate (which will be discussed in the next paragraph) within a flourishing innovative
environment. Conversely, clusters in their maturity rely on aged firms, which operate
according to consolidated, if not stagnating, industrial practices. Henceforth, envisioning that
EDP is meant to “(...) logically identify (…) the domains where new R&D and innovation
projects will (…) create future domestic capability” (Dominque Foray, David and Hall, 2011:
p.4), it is reasonable to conclude that emergent and developing clusters offer optimal context
conditions for EDP implementation. The same conclusion is also valid when taking in
consideration Venture Capital (VC) investments. VC investments refer to “a form of equity
financing particularly important for young companies with innovation and growth potential
but untested business models and no track record”(OECD, 2016: p.142). This funding
system is seen both as a marker of clusters innovative potential, as well as an essential factor
nourishing clusters’ entrepreneurial environment (Breschi and Malerba, 2005). Indeed, VC is
especially advocated in, and attracted by, highly pioneering territorial contexts (Bevilacqua,
Pizzimenti and Maione, 2017). Such setting coincides with those of emerging and developing
clusters. Therefore, VC investments, by focusing especially on the explorative stages of the
CLC (Bergman, 2008), trigger potential innovations which could be intercepted in the way of
EDP. Both the indicators discussed so far, R&D and VC investments, are tightly related to
the presence of entrepreneurs and new businesses within the clusters’ environment.
Specifically, the incidence of start-ups birth rate, within clusters’ environment, seems to be
particularly relevant. Start-ups include all newly born firms that are up to two years old
(OECD, 2016). Such “young” and usually small-sized businesses, because of their very
explorative, and potentially innovative nature, are crucial endogenous drivers of territorial
development. Indeed, start-ups birth rate is an important indicator signalling both the
dynamism of clusters (Davis et al., 2006) and the overall goodness of the entrepreneurial
environment (OECD, 2016). High values of the indicator start-ups birth rate also mean that
entrepreneurial actors (the holders of entrepreneurial knowledge) are particularly active. To
sum up, there is a positive correlation at the territorial level between high values of the
indicator start-ups birth rate (which usually attributes emerging and developing clusters), high
density of entrepreneurs and high availability of entrepreneurial knowledge. Given that EDP
has a “(…)special focus on the regional entrepreneurial environment, assessing whether it is
lively and can generate a significant flow of experiments, innovation ideas (…)” (Foray et al.,
2012: p.20), it is reasonable to deduce that emerging and developing clusters could provide
valuable inputs in the way of entrepreneurial discoveries. As already stressed, high values of
the indicator start-ups birth rate are a marked feature of clusters' emergence and development
stage. Instead, the entry of start-ups, and their importance in the functioning of the cluster,
drastically decreases during maturity. This theoretical evidence suggests that EDP can be
effectively supported by the bold entrepreneurial, innovation-oriented, cross-sectoral
environment manifested at the two initial stages of clusters' evolution.
Networks activities embrace the broad range of actions aiming at generating or nourishing
"organisational forms] of economic activities that may allow firms to cope with market
failures (…).” (OECD, 2004: p.20). The intensity of network activities provides a measure of
knowledge exchange and firms connectedness, within certain geographic boundaries (which

1023
are mutable and permeable). Empirical studies demonstrate that increases in network
activities are positively correlated with the rise of firms' innovativeness (OECD, 2001).
However, the same studies also prove that the willingness to engage in knowledge-based
networks has a negative correlation with firms' size. These two latter pieces of evidence,
suggest that network activities are more intense in the presence of new-born, small-sized
firms (such as start-ups). The latter (usually concentrating in emergent or developing clusters)
orientate towards more flexible, sometimes informal, network forms. On the contrary, big
firms (usually concentrating in mature clusters) rely on routine-based, formally-regulated
networks. These differences in the structure and willingness to engage in networks make
small firms' more innovative, more adaptable and less sector-specific than big ones. The
features of networks are also tightly tied to Marshallian spillovers. In a life cycle perspective,
one should consider that networks and the related knowledge spillover evolve over the
different stages of the CLC. As previously highlighted (see subsection 3.1), networks are
mostly informal, and spillovers often happen involuntarily during clusters' emergence. This is
due both to the scattered configuration of the spatial agglomeration of firms and to the
explorative nature of the businesses entering the market (mainly start-ups). When clusters
move on to the development stage, networks get gradually more structured and spillovers
more formal. This condition evolves further on during the maturity stage. At this point
clusters are composed mainly of big firms, there is no start-ups entry, and consequently,
networks become rigid and spillovers significantly decrease. Given these considerations, it is
reasonable to affirm that EDP should focus on emergent and eventually developing clusters,
which are featured by the “relational density” postulated by Foray. Indeed, the significant
density of start-ups and entrepreneurs, the marked attitude of firms towards innovative
activities and knowledge sharing, make emergent and developing clusters an exceptional
source of various entrepreneurial and economic knowledge.
The heterogeneity of knowledge (Shin and Hassink, 2011), indicates the variety of the
available knowledge-stock inside clusters. Considering that knowledge is detained by
entrepreneurial actors, the variety of accessible knowledge seems also indicating, to some
extent, the assortment of entrepreneurial actors. The more such assortment is diversified, the
more clusters manifest a marked attitude towards adjusting to changing conditions. It has
been said (see subsection 3.1) that the heterogeneity of knowledge and actors evolve over the
CLC. Specifically, while the initial phases of the CLC are featured by high and medium
heterogeneity of accessible knowledge, during maturity, this variety tends to attenuate toward
homogenization. This shift from heterogeneous to homogeneous knowledge is due both to a
decrease in the number of diverse entrepreneurial actors entering the clusters and to an
increase in specialisation. Considering that EDP calls for a diversity of economic actors and
knowledge, the best match in the way of EDP operationalization seems to be manifested by
the features of emerging and developing clusters.
Specialisation is expressed through a location quotient. The latter defines the share of
regional employment in a sector, relative to the national context. This indicator is widely
endorsed in literature as a marker of spatial concentration of industries (Mayer, 2003; Mario
A Maggioni, 2004; Maggioni and Riggi, 2008). The discourse on specialisation presents a
split-screen view. On the one hand, low specialization: (i) prevents clustered firms from
exploiting the full potential of competitive advantages and (ii) allows clustered firms to
benefit a vibrant, cross-sectoral and diversified entrepreneurial environment (typical attribute
of emergent and developing clusters). On the other hand, high specialisation leads clustered
firms to exploit competitive advantages fully, while eventually leading to stagnation and
lock-in (a common attribute of mature clusters). Tersely, high specialisation can lead towards

1024
flattening clusters' economic vibrancy and innovativeness as well as losing the positive
effects of the variety externalities theorised by Jacob. Once again, the best fitting ecosystem
for EDP is expectedly the one provided by emergent and developing clusters. Indeed,
considering that EDP pertains to the detection of potential domains for future regional
specialisation, targeting already specialised clusters would mean pointing out traditional
industrial sectors instead of S3-type domains. Another indicator accounting for the spatial
configuration of clusters is the agglomeration. The latter indicates the number of firms
concentrating in some geographical regions (Mario A Maggioni, 2004). This indicator's value
increases as clusters get holder, till reaching its peak during the maturity stage. At this point,
the mass of economic activities located in a specific geographic area reaches its maximum.
As a consequence, the attractiveness of such areas starts decreasing due to a scarce
availability of locational benefits (Mario A Maggioni, 2004). Conversely, in cases when
spatial agglomeration presents a configuration not saturated yet, businesses from outside are
encouraged to locate inside clusters because of potentially high locational benefits. These
considerations reveal that the locational attractiveness should be found in clusters that have
not reached the spatial agglomeration peak yet, namely: emerging and developing clusters.
In conclusion, this discussion theoretically confirmed that the CLC and spatial analysis have
a potential to impact EDP operationalization. In detail, the authors find that emergent and
developing clusters can provide a number of significant inputs towards implementing EDP:
(i) the significant strength (medium and high) of dynamism and innovativeness (in terms of
R&D and VC investment, and start-ups’ birth rate) signal high quality framework conditions
for innovation; (ii) the medium and high strength in intensity of network activities indicates a
significant relational density among clusters insiders and a tendency towards innovative,
cross-sectoral cooperation; (iii) the medium and high heterogeneity of available knowledge,
which also indicate the variety in the assortment of economic actors, enables the opportunity
to enlarge the regional knowledge-base, gathering economic and entrepreneurial knowledge;
finally, (iv) the low/medium levels of firms’ agglomeration and specialization suggest the
existence of a territorially localized economic potential, which has not been fully exploited
yet.
4. CONCLUSION
This article presented a theoretical discussion on the role of clusters and cluster policies to
support S3 and specifically EDP implementation. Although a significant body of scientific
literature confirms that EU experience with clusters and cluster policies is a crucial element
towards supporting the implementation of S3, nonetheless many operational gaps keep
standing out. One of the most problematic factors pertains to the operationalization of the
EDP. Consistently the authors intended to test whether the CLC and spatial analysis could
eventually guide the discovery of regional economic potentials. This problem is approached
theoretically and discussed on the base of literature evidence. Firstly, the concept of S3, its
relation to clusters and the emerging EDP gap is presented. Secondly, the potentials of
clusters' life cycle and spatial analysis is tested by: (i) deducing from a literature study a set
of indicators accounting for clusters stage-specific and spatial attributes. (ii) framing the
indicators into a model and providing a qualitative judgment of their strength at each stage of
the CLC, finally (iii) interpreting the model to test if and which stages of the CLC display a
potential towards inputting EDP.
The authors conclude that the EDP implementation could significantly benefit the framework
conditions for innovation, relational density, and diversity of knowledge and actors provided

1025
by some specific stages of the CLC. Moreover, the identification of the variations in the
spatial configuration of clusters, during different phases of the CLC, can offer valuable
information about the existence of a territorially localised economic potential. Particularly,
the authors find that, according to the logical comparison of clusters' stage-specific attributes
and EDP's key inputs and features, it is reasonable to target emerging and developing clusters
as a suitable breeding ground towards favouring EDP implementation. These findings call for
consideration of policy-makers, to reflect more consciously both on clusters' evolution and
spatial configuration, to overcome EDP implementation issues, and consequently get to a
fully effective implementation of S3.
5. LIMITATIONS OF THE STUDY
The main limitations of this study pertain to the theoretical model presented. Firstly, because
the lack of established conventions on the indicators for the study of cluster makes the
selection of the variables a relatively arbitrary process. Secondly because nor clusters neither
their life cycle can be satisfyingly explicated through a single model. Given these
considerations, some potentially influential factors are ignored (for example the propensity of
the big companies to internalise the functions of R&D, the consequences of the global crisis
on investment flows, and others), while the variables that are most frequently endorsed in the
literature are included. Moreover, given that industries are not alike, and that different
variables have different importance in the industries, it might be that the model does not
represent the mechanism of some industrial sector (for example the industrial sectors
controlled by monopolist holdings and others). However, the theoretical literature provides
evidence that a detailed modelling of all relevant processes might not be of crucial
importance. From this, it is reasonable to conclude that while the model is not fully
explanatory, it still reflects appropriately the potential contribution of the CLC and spatial
analysis in the way of S3 and EDP.
6. ACKNOWLEDGMENTS
The MAPS-LED project has received funding from the European Union’s Horizon
2020 research and innovation programme under the Marie Skłodowska-Curie grant
agreement No 645651.
7. REFERENCES
Andersson, T. et al. (2004) The Cluster Policies Whitebook.
Aranguren, M. J. and Wilson, J. R. (2013) ‘What can experience with clusters teach us about fostering regional
smart specialisation?’, Ekonomiaz, 83(2), pp. 126–145. Available at: http://www.eca-
tactics.eu/sites/default/files/newsroom/2013/06/Aranguren Wilson Smart Clusters.pdf.
Bergman, E. M. (2008) ‘Cluster Life-Cycle: An Emerging Synthesis’, Handbook of Research on Cluster
Theory, pp. 114–32. doi: 10.4337/9781848442849.00013.
Bevilacqua, C. et al. (2015) ‘Smart Specialisation Strategy : the Territorial Dimension of Research and
Innovation Regional Policies’, in XXXVI CONFERENZA ITALIANA DI SCIENZE REGIONALI. doi:
10.13140/RG.2.1.2912.0724.
Bevilacqua, C., Pizzimenti, P. and Maione, C. (2017) SPATIAL PLANNING KNOWLEDGE DYNAMICS ,
SPATIAL DIMENSION. MAPS-LED Project, Multidisciplinary Approach to Plan Smart Specialistation
Strtaegies for Local Economic Development Planning.

1026
Bianchi, P., Miller, L. and Bertini, S. (1997) ‘The Italian SME experience and possible lessons for emerging
countries’, In Executive Summary, …. Available at:
http://citeseerx.ist.psu.edu/viewdoc/summary?doi=10.1.1.194.6357.
Brenner, T. and Schlump, C. (2011) ‘Policy Measures and their Effects in the Different Phases of the Cluster
Life Cycle’, Regional Studies, 45(10), pp. 1363–86. doi: 10.1080/00343404.2010.529116.
Breschi, S. and Malerba, F. (2005) Clusters, Networks, and Innovation, Area. Available at:
http://www.loc.gov/catdir/toc/ecip0516/2005020567.html.
Camagni, R. and Capello, R. (2013) ‘Regional Innovation Patterns and the EU Regional Policy Reform :
Toward Smart’, 44(2), pp. 355–389.
Capello, R. and Kroll, H. (2016) ‘From theory to practice in smart specialization strategy : emerging limits and
possible future trajectories’, 4313(April). doi: 10.1080/09654313.2016.1156058.
Castillo, J., Paton, J. and Saez, A. (2013) ‘Smart Specialisation and Clusters : the Basque Country Case’, p. 26.
Davis, C. H. et al. (2006) ‘What Indicators for Cluster Policies in the 21’, Innovation, (September), pp. 1–15.
Doloreux, D. and Parto, S. (2005) ‘Regional innovation systems: Current discourse and unresolved issues’,
Technology in Society, 27(2), pp. 133–153. doi: 10.1016/j.techsoc.2005.01.002.
Farrell, G. et al. (1999) ‘Territorial competitiveness Creating a territorial development strategy in light of the
LEADER experience D E D É V E L O P P E M E N T D E L ’ É C O N O M I E R U R A L E D E L ’ A
G R I C U LT U R E D I R E C TO R AT E - G E N E R A L’, pp. 1–43.
Foray, D. et al. (2009) The Question of R&D Specialisation Perspectives and Policy Implications. doi:
10.2791/1094.
Foray, D. et al. (2012) ‘Guide to Research and Innovation Strategies for Smart Specialisations (RIS 3)’, (May),
pp. 1–116. doi: 10.2776/65746.
Foray, D. (2015) ‘Smart Specialisation: Opportunities and Challenges for Regional Innovation Policy’, Regional
Studies, 49(3), pp. 480–482. doi: 10.1080/00343404.2015.1007572.
Foray, D., David, P. A. and Hall, B. H. (2011) Smart specialisation - From academic idea to political
instrument, the surprising career of a concept and the difficulties involved in its implementation, MTEI-
WORKING_PAPER-2011-001. Available at: https://infoscience.epfl.ch/record/170252.
Foray, D., David, P. A. and Hall, B. H. (2011) Smart specialization From academic idea to political instrument,
the surprising career of a concept and the difficulties involved in its implementation, MTEI Working Paper.
Available at: http://infoscience.epfl.ch/record/170252/files/MTEI-WP-2011-001-Foray_David_Hall.pdf
(Accessed: 21 October 2015).
Foray, D. and Goenega, X. (2013) ‘The Goals of Smart Specialisation’, (1), p. 18. doi: 10.2791/20158.
Gheorghiu, R., Andreescu, L. and Curaj, A. (2015) ‘A foresight toolkit for smart specialization and
entrepreneurial discovery’, Futures. Elsevier Ltd, 80(2015), pp. 33–44. doi: 10.1016/j.futures.2016.04.001.
Handayani, N. U. et al. (2012) ‘A conceptual assessment model to identify phase of industrial cluster life cycle
in Indonesia’, Journal of Industrial Engineering and Management, 5(1), pp. 198–228. doi:
10.3926/jiem.447.
Hermosa, C. and Elorduy, J. P. (2015) ‘Smart specialization and entrepreneurial discovery : Theory and reality
Especialização Inteligente e Descoberta Empreendedora : Teoria e Realidade’, Revista Portuguesa de
Estudos Regionais, (39).
Ketels, C. et al. (2013) The Role of Clusters in Smart Specialisation Strategies. doi: 10.2777/43211.
Kroll, H. (2015) ‘Efforts to Implement Smart Specialization in Practice — Leading Unlike Horses to the Water’,
(August). doi: 10.1080/09654313.2014.1003036.
Maggioni, M. A. (2002) Clustering Dynamics and the Location of High-Tech-Firms Contributions to
Economics. First. Heidelberg: Physica-Verlag HD.
Maggioni, M. A. (2004) ‘The rise and fall of industrial clusters: Technology and the life cycle of regions’,
Documents de treball IEB. Available at: http://dialnet.unirioja.es/servlet/articulo?codigo=1289144.
Maggioni, M. A. and Riggi, M. R. (2008) ‘High-tech firms and the dynamics of innovative industrial clusters.’,
in Handbook of Research on Innovation and Clusters,. Northampton, MA: Edward Elgar Publishing, pp.
54–78.
Martin, R. and Sunley, P. (2003) ‘Deconstructing clusters: chaotic concept or policy panacea?’, Journal of
Economic Geography, 3(1), pp. 5–35. doi: 10.1093/jeg/3.1.5.
Maskell, P. and Kebir, L. (2006) ‘What qualifies as a cluster theory?’, Clusters and Regional Development:
Critical Reflections and Explorations, (5), pp. 30–49. doi: 10.2307/3680488.
Mayer, H. (2003) ‘A Guide for analyzing industry clusters in the Portland-Vancouver metropolitan region.’
Portland: Institute of Portland Metropolitan Studies.
Menzel, M. P. and Fornahl, D. (2009) ‘Cluster life cycles-dimensions and rationales of cluster evolution’,
Industrial and Corporate Change, 19(1), pp. 205–238. doi: 10.1093/icc/dtp036.
OECD (2001) Innovative Networks: Co-operation in National Innovation Systems. Paris: OECD Publishing.
doi: http://dx.doi.org/10.1787/9789264195660-en.

1027
OECD (2004) ‘Networks, Partnerships, Clusters and Intellectual Property Rights: Opportunities and Challenges
for Innovative SMEs in a Global Economy’, 2nd OECD Conference of Ministers Responsible for Small and
Medium-sized Enterprises (SMEs), (June 2004), pp. 1–78.
OECD (2013) ‘OECD Factbook 2013: Science and Technology’, p. 17.
OECD (2016) Entrepreneurship at a Glance 2016, Entrepreneurship at a Glance 2016. Paris: OECD
Publishing. doi: 10.1787/9789264097711-en.
Perło, D. (2015) ‘Clusters and smart specializations’, Prace Naukowe Uniwersytetu Ekonomicznego we
Wrocławiu, (394). doi: 10.15611/pn.2015.394.11.
Porter, M. E. (1998) ‘Clusters and the New Economics of Competition Harvard Business Review’, Harvard
Business Review, pp. 77–90. doi: 10.1042/BJ20111451.
Porter, M. E. (2000) ‘Location, Competition, and Economic Development: Local Clusters in a Global
Economy’, Economic Development Quarterly, 14(1), pp. 15–34. doi: 10.1177/089124240001400105.
Porter, M. E. (2003) ‘The Economic Performance of Regions’, Regional Studies, 37(6–7), pp. 545–546. doi:
10.1080/0034340032000108688.
Press, K. (2006) A Life Cycle for Clusters? The Dynamics of Agglomeration, Change, and Adaption,
Contributions to Economics. Available at: http://www.scopus.com/inward/record.url?eid=2-s2.0-
77950412527&partnerID=40&md5=b9fe81aec11bf625b9d0fb41628a4a0e.
Rodríguez-Pose, A. and Wilkie, C. (2015) ‘Institutions and the Entrepreneurial Discovery Process for Smart
Specialization’, Papers in Evolutionary Economic Geography, (23).
Shin, D.-H. and Hassink, R. (2011) ‘Cluster Life Cycles: The Case of the Shipbuilding Industry Cluster in South
Korea’, Regional Studies, 45(10), pp. 1387–1402. doi: 10.1080/00343404.2011.579594.
Stam, E. and Wennberg, K. (2009) ‘The roles of R&D in new firm growth’, Small Business Economics, 33(1),
pp. 77–89. doi: 10.1007/s11187-009-9183-9.
Suire, R. and Vicente, J. (2014) ‘Clusters for Life or Life Cycles of Clusters: in Search of the Critical Factors of
Clusters’ Resilience’, Entrepreneurship & Regional Development, 26(1–2), pp. 142–64. doi:
10.1080/08985626.2013.877985.

1028
ID 101
A FOURTH WAY: CULTURAL HERITAGE AS THE KEY TO
UNLOCKING SUSTAINABLE PLACE-DRIVEN INNOVATION
C. Devaney
School of the Built Environment, University of Salford, Salford, M5 4WT, UK
Email: [email protected]
Abstract: Set against a powerful context of political instability and global economic
uncertainty, and driven in part as a response to unprecedented challenges including Brexit and
UK regional devolution, the paradigm of ‘place’ has seen rapid incorporation into national and
global policy making and practice. Interpretation, development and evaluation of place has
thus far been dominated by two fairly static definitions: a physical understanding of ‘a place’
as a defined, geographic territory and a socio-economic understanding of place as a self-
contained economic and social system. This paper introduces cultural heritage as a third and
critical criterion in realising a more comprehensive understanding of place. Through pragmatic
application of mixed methods including ethnographic interview, questionnaire and survey,
design science and action research, and utilising cutting-edge ‘living platform’ mapping
techniques in analysis and visualisation, the research seeks to interrogate the inter-relationship
between place and innovation, exploring that nexus through a cultural heritage lens. Through
integrating critical factors of space and time, it creates a new conceptual framework for
sustainable place-driven development and presents a new ‘place-driven’ economic paradigm,
within which a whole series of previously accepted tripartite models can be elevated;
presented collectively as ‘a fourth way’.
Keywords: Culture, Heritage, Innovation, Place, Sustainability.
1. INTRODUCTION/BACKGROUND
The paradigm of ‘place’ has seen rapid incorporation into policy making and practice, in the
UK and across the world. The speed at which its incorporation has occurred has arguably,
and in some cases demonstrably, led to the concept’s application while not being fully
formed. To some extent as a result of this, and an associated need for anchoring it as a
concept, its interpretation, development and evaluation has thus far relied on and been
dominated by two fairly static definitions: a physical understanding of ‘a place’ as a defined,
geographic territory and a socio-economic understanding of place as a self-contained
economic and social system.
These well-practiced tenets fit ‘place’ comfortably within the current and predominantly
capital-driven economic paradigm, in which the spatial/territorial understanding of place fits
neatly with the notion of capital ‘spatial fix’ (Harvey, 2001) and the socio-economic
application of ‘place’ mimics the defined parameters of a capital labour market.
Less comfortable is the interaction between these static definitions of ‘place’ and the
inherently dynamic innovation landscape. The construct of ‘embeddedness’ is critical to this
nexus (as, for example, applied to the Smart Specialisation innovation process, which
requires ‘an accent on fostering regional embeddedness’ (Ketels, 2013b)), and its application
in this sense tends to refer to a deep immersion in one or more acknowledged industrial,
geographic or economic strengths of a particular place; characterised as ‘place-based’
innovation.

1029
This paper introduces cultural heritage as a critical criterion in realising a more
comprehensive understanding of place, and in effect as a key driver in catalysing a less
constrained and more fluid and reciprocal interaction between place and innovation.
2. LITERATURE
2.1 The innovation-place nexus: Smart Specialisation
Smart Specialisation is a central concept in the ESRC’s vision for Europe’s innovative future
(EC 2016). It is based on the principle of defined economic systems (predominantly regions)
generating new specialisms through a process of discovery which builds on unique local
assets and competences, toward economic growth. Smart Specialisation Strategies (S3)
(Foray 2015) translate the academic concept of Smart Specialisation into policy, allowing
regions to prioritise concentration of resources as the basis for competitive advantage. S3 is
based on five core design principles: entrepreneurial discovery, mid-level (predominantly
regional) granularity, inclusiveness, an expectation of progress (specifically in that priorities
will not be supported forever) and the promotion of experimentation and risk. S3 is now
firmly established as a key feature in European innovation policy. Since 2013, it has been a
compulsory ex-ante conditionality requirement for EU member states and regions accessing
EU funds to have an S3 in place (EC 2013a).
The rapid rise of S3 from academic theory to legal requirement has mirrored its own design
principles. It is an experimental strategy which has made extraordinarily fast-paced and
dynamic progress, benefiting from and contributing to a focus on entrepreneurialism,
innovation and inclusion, and the growing movement toward regional, devolved and ‘place-
based’ development. Whilst there is clear ideological synergy between the regional focus of
S3 and the place-based approach, “Smart Specialisation Strategies… were initially developed
from an a-spatial concept (and) have needed to be reworked and redefined in the context of
regional analysis” (EC 2013b: 12). The EC’s 2013 report on S3 and cluster policy, based on
the findings of a special advisory group chaired by Ketels (EC 2013b) advocates for
regionally distinct, place-based approaches to S3, as opposed to “place-blind interventions”,
setting out a desired logic for S3 delivery which prioritises regional context, participation and
ownership and place-specific future visioning. The report identifies a lack of stakeholder
engagement, insufficient analysis of regional assets and a “Tendency for regional strategies to
chase the same “bandwagon” sectors” (EC 2013b:11) as key S3 policy flaws.
Place is implicit in the level of granularity required by S3. The co-relation between place and
innovation, via S3, is made explicit by the 2009 Barca report (and has been recently restated
by McCann, 2015). The Barca report defines a place-based approach as “a long term strategy
aimed at tackling persistent underutilization of potential and reducing persistent social
exclusion in specific places through external interventions and multi-level governance”
(2009:3). Whilst this is a useful definition, and of its time, both S3 and place-based concepts
have since continued to evolve, and whilst the concept of ‘place’ remains “incompletely
developed” (Taylor & Devaney 2014: 6), in emerging just ahead of the place-based
paradigm, S3 has been able to respond to and absorb a deepening understanding of what
‘place’ means.

1030
2.2 Place-based innovation
A portfolio of work from The Brookings Institute’s Bass Initiative has been seminal in
framing emerging thinking around the interconnectivity between innovation and place. Katz
and Wagner (2014) assert a typology based around three models of ‘innovation districts’ in
cities: the ‘anchor-plus’ model, in which a clustering of assets and infrastructure occurs
around the presence of an anchor institution, such as a university; the ‘re-imagined urban
areas model’, in which former industrial or warehousing sites undergo large-scale
regeneration (often, Katz and Wagner observe, to be found in historic waterfront districts);
and the ‘urbanized science park’ model, which sees new industry and commercial activity in
suburban or ex-urban areas growing around clustered scientific activity.
In a later review of this predominantly spatial analysis of innovation strategy, Katz, Vey and
Wagner (2015) introduce “the imperative to combine and activate physical assets in ways that
create vibrant “places”, quoting Ethan Kent, Chief Executive of The Project for Public
Spaces’ description of place as “environments in which people have invested meaning over
time. A place has its own history—a unique cultural and social identity that is defined by the
way it is used and the people who use it.” (Katz, Vey and Wagner, 2015: 3).
2.3 Place-based innovation and cultural heritage
Place-based innovation, and S3, tends to focus on the acknowledged strengths of a place.
Often, these strengths are so acknowledged because they have a basis in a place’s industrial
or cultural heritage. Greater Manchester (GM), for example, is pioneering innovative models
of advanced manufacture in its work with Graphene, building on its recognised historic
strength in manufacturing.
As with the dominant understandings of ‘place’, heritage too tends to be characterised as a
fixed and static concept, based primarily on the 1972 UNESCO World Heritage Convention
definition of cultural heritage as ‘monuments, groups of monuments and sites’. The ICOMOS
Nara Document in 1994, which called for cultural context in regards to permanence,
recognising, for example, the cultural heritage value - but impermanence - of ritually rebuilt
wooden temples and mud huts, pioneered a school of thought which has since introduced a
more fluid understanding, particularly in regard to cultural heritage, and which was
underscored by the formal recognition of ‘intangible heritage’ by UNESCO in 2003. This
thinking continues to influence contemporary cultural heritage research, such as the Royal
Society of Arts’ advocacy for ‘Networked Heritage’ and ‘Heritage Citizens’ in its ‘Heritage,
Identity and Place’ portfolio of work, co-sponsored by the Heritage Lottery Fund (RSA,
2016) While there is a wealth of emergent academic literature on cultural heritage and place,
the relationship between cultural heritage and innovation is a relatively fresh domain. From a
policy perspective, where a relationship is noted, the focus tends to be on the economic value
of cultural heritage, principally through tourism. The report of the EC Horizon 2020 expert
group on cultural heritage (EC 2015) asserts that “modest investment in cultural heritage can
pay substantial dividends” and that the EU should “vigorously promote the innovative use of
cultural heritage for economic growth.” (EC 2015:8).
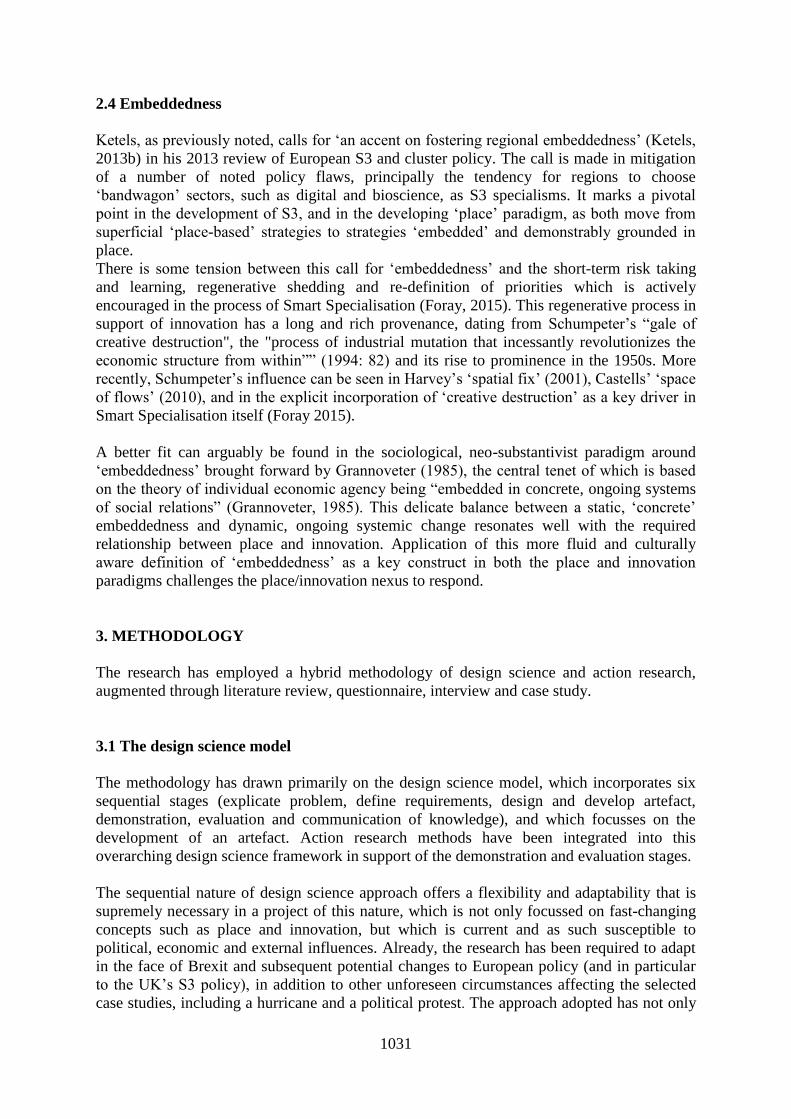
1031
2.4 Embeddedness
Ketels, as previously noted, calls for ‘an accent on fostering regional embeddedness’ (Ketels,
2013b) in his 2013 review of European S3 and cluster policy. The call is made in mitigation
of a number of noted policy flaws, principally the tendency for regions to choose
‘bandwagon’ sectors, such as digital and bioscience, as S3 specialisms. It marks a pivotal
point in the development of S3, and in the developing ‘place’ paradigm, as both move from
superficial ‘place-based’ strategies to strategies ‘embedded’ and demonstrably grounded in
place.
There is some tension between this call for ‘embeddedness’ and the short-term risk taking
and learning, regenerative shedding and re-definition of priorities which is actively
encouraged in the process of Smart Specialisation (Foray, 2015). This regenerative process in
support of innovation has a long and rich provenance, dating from Schumpeter’s “gale of
creative destruction", the "process of industrial mutation that incessantly revolutionizes the
economic structure from within”” (1994: 82) and its rise to prominence in the 1950s. More
recently, Schumpeter’s influence can be seen in Harvey’s ‘spatial fix’ (2001), Castells’ ‘space
of flows’ (2010), and in the explicit incorporation of ‘creative destruction’ as a key driver in
Smart Specialisation itself (Foray 2015).
A better fit can arguably be found in the sociological, neo-substantivist paradigm around
‘embeddedness’ brought forward by Grannoveter (1985), the central tenet of which is based
on the theory of individual economic agency being “embedded in concrete, ongoing systems
of social relations” (Grannoveter, 1985). This delicate balance between a static, ‘concrete’
embeddedness and dynamic, ongoing systemic change resonates well with the required
relationship between place and innovation. Application of this more fluid and culturally
aware definition of ‘embeddedness’ as a key construct in both the place and innovation
paradigms challenges the place/innovation nexus to respond.
3. METHODOLOGY
The research has employed a hybrid methodology of design science and action research,
augmented through literature review, questionnaire, interview and case study.
3.1 The design science model
The methodology has drawn primarily on the design science model, which incorporates six
sequential stages (explicate problem, define requirements, design and develop artefact,
demonstration, evaluation and communication of knowledge), and which focusses on the
development of an artefact. Action research methods have been integrated into this
overarching design science framework in support of the demonstration and evaluation stages.
The sequential nature of design science approach offers a flexibility and adaptability that is
supremely necessary in a project of this nature, which is not only focussed on fast-changing
concepts such as place and innovation, but which is current and as such susceptible to
political, economic and external influences. Already, the research has been required to adapt
in the face of Brexit and subsequent potential changes to European policy (and in particular
to the UK’s S3 policy), in addition to other unforeseen circumstances affecting the selected
case studies, including a hurricane and a political protest. The approach adopted has not only

1032
supported the research in meeting these challenges, but has also allowed for the research to
respond to emerging thinking in the field. Adopting a dual focus on the artefact and the
context has also been helpful maintaining a balance, and in ensuring neither aspect overly
dominates the research; the two aspects in fact reciprocally ‘feed off each other’, ensuring
freshness and relevance.
For the purposes of the research, ‘the artefact’ in question is a novel method for articulating
and evaluating innovation strategies, incorporating cultural heritage as a critical criterion.
‘The requirements’, the contextual conditions for the artefact, focus on ‘place’ and are
represented by the emerging hierarchal place taxonomy.
The first stage of the research (relating to stage one of the design science methodology,
‘Explication of the problem’) saw findings from the literature review synthesised to create a
core research framework. That framework was tested and refined through a pilot case study
focussed on Greater Manchester (GM)’s S3 strategy, incorporating a series of scoping
interviews with key GM public sector, private sector and academic stakeholders.
3.2 ‘The artefact’ – the ‘Sustainable S3 Wheel’
Based on preliminary findings from the literature review and scoping stage, an initial sketch
of a novel evaluation tool for innovation strategies (‘the artefact’) was conceived. The sketch
visualised an inherently complex concept through a user-friendly metaphor, the “Sustainable
S3 Wheel”, in which the wheel is representative of an innovation economy, structurally
supported by three axes of ‘place’, two of which represent the traditional concepts of spatial
and social considerations, and introducing a third axis to represent cultural factors (see Figure
1).
Figure 1: The “Sustainable S3 Wheel” (sketch)
3.3 ‘The requirements’ – case studies in ‘place’
A series of case studies was selected to further test and refine the structure of the artefact, and
to generate an initial understanding of the requirements, that is, the contextual role of ‘place’.
Case study selection drew on the work of Katz and Wagner (2014), focussing in the US on
Boston (Kendall Square) and Seattle (South Lake Union), and in the UK on Manchester’s
Oxford Road Corridor as examples, respectively, of the ‘anchor plus’, ‘re-imagined urban

1033
areas’ and ‘urbanized science park’ models of innovation district. Case studies were
conducted through a mix of quantitative and qualitative methods supported primarily by four
analytical tools: survey, questionnaire, interview and presentation of the case study results
themselves.
A second phase of case studies, looking in more depth at Manchester’s Oxford Road Corridor
and including other selected ‘innovation districts’ across GM such as The Sharp Project, The
Federation and Salford’s Media City UK is in progress to allow development, testing and
application of an a emerging ‘place hierarchy’ taxonomy and of the nascent evaluation tool
(based on spatial, social and cultural criteria), enabling critical assessment of these areas as
‘innovation districts’ in relation to the findings from the earlier case studies.
3.4 Action Research – M4
The development, demonstration and evaluation stages of the research have been augmented
by adoption of action research methods, principally centring on an ambitious practical project
which has responded to emerging findings to establish ‘M4’, a civic innovation space
designed to represent the emerging ‘fourth typology’ of innovation district. Launched in May
2017, M4 operates as a network, and while not confined to a geographic space, its
administrative base is located in The Federation in central Manchester, which also houses a
number of tech and social enterprises. The M4 project will incorporate an in-motion
evaluation of the effects of its introduction on the GM innovation ecosystem over a twelve-
month period.
3.5 The ‘Living Platform’
A cutting-edge data visualisation technique, the ‘Living Platform’, developed by the
University of Salford’s ThinkLab and School of the Built Environment (SoBE) and launched
in June 2017 is being utilised to collate and demonstrate the results of the second phase of
case study, enabling evaluation of the spatial, social and cultural aspects of the selected
innovation district to be cross-referenced, analysed and presented via a real-time, dynamic
platform, and allowing for spatial and temporal factors, emerging as critical to the research,
to be factored into results. A still showing ‘innovation hotspots’ displayed on the platform
from the in-progress case study focussing on MediaCityUK in Salford, Greater Manchester,
is shown as Figure 2.

1034
Figure 2: Still from The Living Platform showing ‘innovation hotspots’ at MediaCityUK
4. RESULTS AND DISCUSSION
4.1 The ‘Sustainable Innovation Wheel’
“The Sustainable Innovation Wheel”, a prototype tool for the evaluation of innovation
economies (piloted in its initial stages with a focus on S3 strategies) has been developed as
both an output and tool for the research (see Figure 3).
Figure 3: The Sustainable Innovation Wheel
In this novel evaluation model, each axis represents a critical quality in successful innovation
economies. The first axis – the where – represents spatial factors, incorporating granularity,
proximity and built environment considerations; the second axis – the who – represents social
factors, incorporating inclusivity, participation and stakeholder engagement, and the third
axis, completing the spokes in the wheel, represents cultural factors – the what – those
aspects of place such as heritage, identity and culture, that make a place distinctive and its S3
specialisms unique. The fourth aspect, the catalyst to make the wheel spin is the how.
Too often, the perception – and reality – of innovation sees an overly-dominant focus only on
the strengths of a particular place. This tends to come at the expense of the application of
innovation capacity in addressing place-based weaknesses, social demands or issues of need.
Successful and sustainable innovation has the opportunity to bring a vast range of different
actors together in addressing a whole range of collective place-based goals. Instead, the
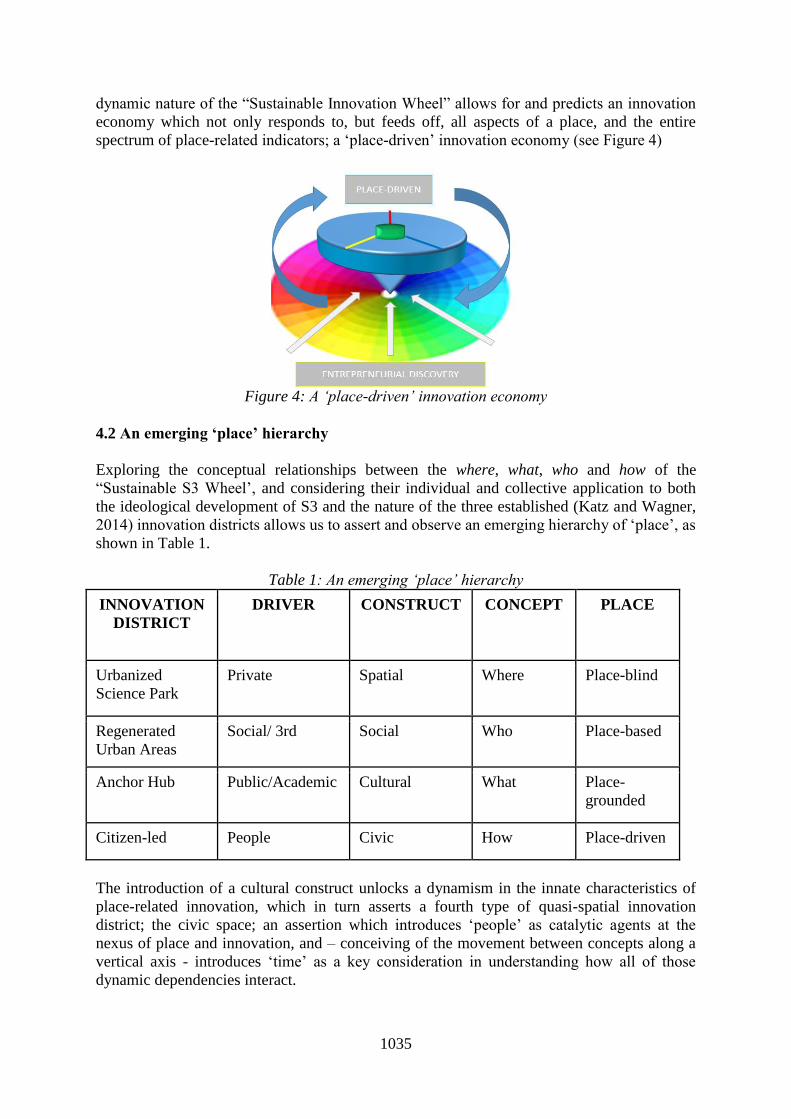
1035
dynamic nature of the “Sustainable Innovation Wheel” allows for and predicts an innovation
economy which not only responds to, but feeds off, all aspects of a place, and the entire
spectrum of place-related indicators; a ‘place-driven’ innovation economy (see Figure 4)
Figure 4: A ‘place-driven’ innovation economy
4.2 An emerging ‘place’ hierarchy
Exploring the conceptual relationships between the where, what, who and how of the
“Sustainable S3 Wheel’, and considering their individual and collective application to both
the ideological development of S3 and the nature of the three established (Katz and Wagner,
2014) innovation districts allows us to assert and observe an emerging hierarchy of ‘place’, as
shown in Table 1.
Table 1: An emerging ‘place’ hierarchy
INNOVATION
DISTRICT
DRIVER CONSTRUCT CONCEPT PLACE
Urbanized
Science Park
Private Spatial Where Place-blind
Regenerated
Urban Areas
Social/ 3rd Social Who Place-based
Anchor Hub Public/Academic Cultural What Place-
grounded
Citizen-led People Civic How Place-driven
The introduction of a cultural construct unlocks a dynamism in the innate characteristics of
place-related innovation, which in turn asserts a fourth type of quasi-spatial innovation
district; the civic space; an assertion which introduces ‘people’ as catalytic agents at the
nexus of place and innovation, and – conceiving of the movement between concepts along a
vertical axis - introduces ‘time’ as a key consideration in understanding how all of those
dynamic dependencies interact.

1036
4.3 Culture and place-grounded innovation
Evidence from both the Boston and Seattle case studies demonstrates the dominance of large,
private companies in the selected areas of those cities (Kendall Square and South Lake
Union, respectively), identified in the Katz and Wagner piece (2014) as exemplars of
‘innovation districts’. Both districts are physically located at some distance to the urban core
(and in Boston’s case separated by a river), and show limited resonance with each city’s
distinctive cultural heritage, which is demonstrably better integrated into more organic
innovation offers emerging in ‘downtown’ areas such as Pioneer Square, in Seattle, and the
Seaport District, in Boston, both of which are driven by a nascent small enterprise scene.
Greater Manchester’s ‘Oxford Road Corridor’, representing the ‘urbanized science park’
typology also demonstrates a marked literal and figurative distance from Manchester’s city
centre.
Key stakeholders in both US cities have, however, acknowledged the importance of cultural
activity to innovation, with one civic leader in Boston commenting that “Innovation happens
when culture and the economy clash together”. In support of this assertion, the Boston
Mayor’s Office is currently supporting a programme of micro-grants through its Boston
Creates initiative specifically for artists and creatives working in the innovation space,
described by Interviewee A as “watering the innovation seedlings”.
Cultural appropriation is evident in a number of case studies in the second phase of the
research, including for example, The Sharp Project and its strong heritage links to the Sharp
processing plant, an industrial brand synonymous with Manchester and the former occupier
of its site (the site layout forms The Sharp Project logo), and at The Federation, where local
street artists Nomad Clan have recently been commissioned to create art on the walls of the
central collaborative workspace, shown in Figure 5. The art depicts ‘worker bees’ (symbolic
of Manchester) and incorporates various cultural references including Manchester United and
City football strips, Coronation Street characters and famous Mancunian musicians. The
artwork also includes quotes from Tony Walsh’s poem (writing under the pen-name of
Longfella) ‘This is the Place’, which came to particular prominence as an anthem for the city
following the terrorist attack at Manchester Arena in May 2017.
4.4 Place-driven innovation in practice
Evidence from the Boston and Seattle case studies demonstrates how both cities are
beginning to apply their acknowledged innovation strengths to tackling their key urban and
social challenges. In Boston, widely acknowledged as a global leader in innovation thanks
largely to the presence of Harvard University and MIT and the clustering effect of large
corporate tech and biotech firms around those anchor points, there is a growing sense of the
need to better connect its anchor institutions and citizens, and to apply the city’s vast
knowledge capital to its ‘wicked problems’. Positioned on the Atlantic coast, and with much
of its development along that coastline built on landfill, climate change and rising water
levels are of particular concern. 2016 saw the inaugural Hub Week, a ‘festival of innovation’
which included a series of open-sourced, place-based challenges inviting innovative
responses to issues around the city’s bodies of water, generating a range of actionable and
multiple-bottom line ideas, including water cleansing bio-pellets made from the city’s
significant food waste.
1037
In Seattle’s Pioneer Square district, fast-emerging as a grassroots innovation ‘hotspot’,
Impact Hub Seattle acts as a centre-point for the district’s social enterprise, digital and
creative businesses. It is currently hosting a collaborative work programme to focus the
district’s collective innovation capacity on the city’s homelessness crisis, declared as a ‘state
of emergency’ by the city’s Mayor in 2016. Steve Johnson, CEO of Impact Hub Seattle
describes the hub’s role in the programme as “a catalytic convenor between the place and the
people”. The importance of people as citizens in Seattle’s emerging ‘place-driven’ innovation
ecosystem was noted by several civic leaders, with one describing “the role of government”
as “empowering people on the ground so that those solutions that citizens already have,
which have been lying dormant, can be brought to life”.
Findings from both the pilot case study in GM (January 2016), and the second phase of case
study research, in-progress, suggest that while a number of social enterprises and initiatives
exist with a focus on the city-region’s social challenges, there is a distinct lack of
understanding of this activity as being in the innovation space, alongside a continued
ideological and fiscal investment focus on the Oxford Road Corridor. There is little too in
terms of infrastructure and networks designed to enable GM’s citizens to participate in this
innovation space. The M4 project, launched in May 2017, has been designed as a citizen-led
civic innovation space with the stated mission of filling these gaps. It is an ambitious piece of
action research, and includes an in-motion evaluation of its introduction to the GM
innovation ecosystem, which will report in September 2018.
5. CONCLUSIONS
5.1 Place, innovation and embeddedness
There is a clear tension between the static (spatial and socio-economic) definitions of ‘place’
and the inherent dynamism of innovation. At the heart of this tension is a problematic
spatiotemporal relationship, which sees the defined characteristics and spatial territory of
place juxtaposed against the fluidity and incompleteness of the innovation process. To date,
this tension been alleviated – and arguably avoided – by employing only a very superficial
understanding of place in innovation spaces. Urbanized science parks, the first typology of
innovation district identified by Katz and Wagner (2014), and still stereotypical ‘go to’ in the
concept of places for innovation, have historically shown little resonance with place and have
maintained a cultural and geographical distance.
Ketels’ call for ‘regional embeddedness’ (Ketels, 2013b) in Smart Specialisation strategies, a
principal driver in European innovation policy, brought this tension into sharp focus, and
marks a pivotal point in both the innovation and place paradigms, and where they intersect.
The concept of embeddedness had existed implicitly in the ‘place-based’ strategic space, but
its explicit introduction via this intervention, particularly as a response to regions selecting
‘bandwagon’ specialisms (pointing to the superficiality of the ‘place-based’ approach), came
as a challenge to the innovation landscape to incorporate and demonstrate a deeper
understanding of place.
This ‘cultural awakening’ of the innovation space has coincided with a developing
understanding of cultural institutions as ‘anchor hubs’, as markers and stewards of a place
and its heritage, alongside the predominantly academic institutions traditionally identified as
‘Anchor Hubs’ (as in the 2014 Katz and Wagner piece). This in turn has led to an ‘opening
up’ of those, historically isolated, academic institutions, and their pro-actively seeking out

1038
more progressive and active roles in local communities (Jackson & McInroy, 2016). As
academic institutions continue to better integrate with place, so too we can see a move away
from innovation as the acknowledged domain of universities, through culture, and toward the
civic space.
5.2 Cultural heritage and place-driven innovation
Evidence from the case studies suggests we are at a particular ‘point in time’ in the
integration of cultural aspects in the place/innovation nexus. That point sits between the
‘place-grounded’ and ‘place-driven’ concepts presented in Table 1. There is evidence in some
case studies of place-driven activity, specifically innovation in response to a broader place
spectrum (incorporating weaknesses as well as strengths), and also evidence of a growing
acknowledgement of the potential role for citizens – people – as innovators.
Cultural heritage is key at and for this ‘point in time’ juncture. The dual effect of heritage,
recently defined by the RSA (2015) as “anything inherited from the past that helps us,
collectively or individually, to understand the present, and create a better future” is both to
underscore the temporal nature of that juncture in relation to the innovation/time axis, and,
through its inter-relationship with ‘identity’ to introduce people into the space/place equation.
That said, there remains a current fixation on districts and spaces ‘for innovation’, buildings
and places in which innovation happens, and in some instances, a sense of overcompensation
through cultural re-appropriation. The general direction evidenced across the case studies,
however, is toward this more fluid and responsive ‘place-driven’ innovation model. By
reversing the concept from the (conceptually insular) constraints of ‘place-based’ to the
(conceptually open) movement of ‘place-driven’, the initial spatiotemporal tension is
effectively eliminated.
5.3 Place-driven innovation and sustainability
Elimination of this conflict would in itself suggest that the ‘place-driven’ model is more
sustainable than previous approaches. At a basic level, the model contributes to the
sustainability of place through the inclusion of people as catalysts, an inarguably renewable
resource, and by its advocacy for innovation to address needs and challenges.
There is a more complex relationship between the model and sustainability in terms of
permanence. Clearly, the model calls for openness, fluidity and dynamism, and advocates for
responsiveness to people and place over time as key to sustainability. It is not, however, a
rejection of permanence, or prioritising one over the other. Conceptually speaking, the
“Sustainable Innovation Wheel” requires all ‘fixed’, ‘permanent’ elements – including the
where, the who and the what (spatial, social and cultural), to be in place and balanced in order
to turn; it cannot turn on the how alone.

1039
5.4 A Fourth Way
Taken cumulatively, the evidence asserts a ‘place-driven’ fourth typology of innovation
district; a citizen-led, people-driven, civic innovation space. This quasi-spatial district is non-
territorial, eschewing to some extent the notion of ‘districts’ and ‘hubs’, in favour of an open
and dynamic interconnected network. By transcending the territorial boundaries of place, it
avoids the ‘unintended impacts’ of hyper-investment in specific geographic districts,
promoting instead a new and democratised approach to innovation, at the heart of an
inclusive, and people-driven economy. Over the next twelve months, the ‘M4’ action
research programme will seek to test the viability and validity of the fourth innovation space
in practice, using a series of human-centred value metrics related to the four constructs
(spatial, social, cultural and civic). This is an innovation economy, liberated. A fourth way.
6. REFERENCES
Barca, F. (2009) ‘An agenda for a reformed cohesion policy. A place-based approach to meeting European
Union challenges and expectations’, Independent Report prepared at the request of Danuta Hübner,
Commissioner for Regional Policy, Brussels: European Commission
Castells, M (2010). The Rise of the Network Society. London: Wiley & Blackwell pp. 376–428.
Devaney, C (2016) Spinning the wheel and stepping into the light: Toward a novel evaluation tool for S3.
Milan: Planum
EC (2013 a) Regulation 1301/2013 of the European Parliament and Council, 17th December, Luxembourg:
Publications Office of the European Union
EC (2013 b) ‘The role of clusters in smart specialisation strategies’. DG Research & Innovation, Luxembourg:
Publications Office of the European Union
EC (2015) ‘Getting Cultural Heritage to Work for Europe’. DG Research & Innovation, Luxembourg:
Publications Office of the European Union
EC (2016) - ‘Opportunity Now: Europe’s Mission to Innovate’, ESRC Strategic Notes prepared by Madelin. R,
5th July, Luxembourg: Publications Office of the European Union
Fairchild Ruggles, D & Silverman, H (2009) Intangible Heritage Embodied. New York, Springer
Foray, D. (2015) Smart Specialisation: Opportunities and Challenges for Regional Innovation Policy. London:
Routledge
Granovetter, M (1985) ‘Economic Action and Social Structure, the Problem of Embeddedness’, American
Journal of Sociology Volume 91, Issue 3. Chicago. University of Chicago Press.
Harvey, D (2001) Spaces of Capital: Towards a Critical Geography. London: Routledge pp. 284–311.
Jackson, M & McInroy N (2016) Community Wealth Building through Anchor Institutions. Manchester, CLES
Johanneson, P & Perjons, E (2014) ‘An Introduction to Design Science’. London: Springer
Johnson, S 2016 Impact Hub Seattle, Interview with Clare Devaney on 25th June 2016, Boston
Katz, B & Wagner, J (2014). The Rise of Innovation Districts: A New Geography of Innovation in America.
Washington: Brookings
Katz, B, Vey JS, Wagner, J (2015). One Year After: Observations on the Rise of Innovation Districts.
Washington: Brookings
Kleibrink A., Gianelle C. & Doussineau M. (2016) ‘Monitoring innovation and territorial development in
Europe: emergent strategic management’, European Planning Studies, doi:
10.1080/09654313.2016.1181717
McCann, P. (2015) ‘The Regional and Urban Policy of the European Union: Cohesion, Results-Orientation and
Smart Specialisation’. Cheltenham, UK and Northampton, MA, US: Edward Elgar Publishing Limited
Schifferes, J (2015) ‘Heritage, Identity and Place’. London, The Royal Society of Arts and the Heritage Lottery
Fund
Schumpeter, J A. (1994) [1942]. Capitalism, Socialism and Democracy. London: Routledge. pp. 82–83
Taylor M. & Devaney C. (2014), ‘A Place for Heritage’. London: The Royal Society of Arts and the Heritage
Lottery Fund

1040
ID 135
THE URBAN DIMENSION OF INNOVATION POLICY: ROXBURY
INNOVATION CENTER
C. Bevilacqua, C. Maione, V. Borrello and L. Parisi
PAU Department, Università degli Studi Mediterranea di Reggio Calabria, Salita Melissari, 89124 Reggio
Calabria, Italia
Email: [email protected]
Abstract: The paper intends to explore a new paradigm of urban development process driven
by the increasing demand of innovation. The aim is to demonstrate how innovation has
become part of the urban settlement dynamics towards regeneration processes. Spurring
innovation through knowledge-based economy has been driving the design of public
development policies. Knowledge generates economic growth by stimulating the potential of
entrepreneurship and innovation. In this context, cities are emerging as knowledge hubs, able
to attract high-skilled workers, generate creativity and innovation and provide advanced
services and infrastructures connected through formal and informal network systems. Findings
from the MAPS-LED project (Horizon-2020) show how in specific urban areas the knowledge
dynamics in activating the concentration of innovation generate spillover effects, which
supported by urban planning tools, allow the expansion of innovation and the generation of
physical transformations. Among the case studies of the MAPS-LED project, the Roxbury
Innovation Center (Boston, MA) has been investigated as an emblematic case of public
initiative to spur economic development and urban regeneration processes through innovation.
The public authority of the city of Boston, trough the creation of this public Innovation Center
is trying to generate a positive impact on the local community by providing the necessary
tools, workspaces, connections and programs to enhance the development of the knowledge-
based economy and support startups and entrepreneurs.
Keywords: Cities, Innovation Ecosystem, Innovation Space, MAPS-LED, Urban
Regeneration.
1. INTRODUCTION
In response to the past and the ongoing economic crisis, the primary challenge for National
and Regional Government, both in Europe and in the USA, is to promote policies and actions
focused on fostering creativity and innovation aiming at repositioning cities in a competitive
scenario. New geographical, political, economic dynamics generated by the global crisis have
reformulated the significance of Innovation, which becomes a process able to intercept the
market opportunities based on the exploitation of endogenous resources and potential local
assets.
In 2007, the OECD (Organization for Economic Co-operation and Development) sustained
that new strategies to reduce the degree of social exclusion and improve the economic growth
in deprived contexts should focus on promoting innovation as the main engine to enhance
competitiveness and foster social and economic development (OECD, 2007). A few years
later, the World Bank recognized innovation as a key factor for socioeconomic progress,
generating wealth and skilled jobs, promoting the development of the urban systems, and
increasing the level of competitiveness between cities (The World Bank, 2010).

1041
“In the global knowledge economy, knowledge-intensive industries and knowledge workers
are extensively seen as the primary factors needed to improve the welfare and
competitiveness of cities” (Yigitcanlar, 2011a, p.22).
In order to support these dynamics, the public strategies are promoting the discovery of
niches of innovation and knowledge hubs, in which the entrepreneurial phenomena can
evolve towards a specialized diversification, by producing competitive advantages in urban
contexts (del Castillo Hermosa, Elorduy and Eguia, 2015). According to the emerging change
within the development and innovation policies, Smart Specialisation has been introduced in
2006 by Foray as a new innovation policy framework designed to promote an effective use of
public resources by investing in the local assets to foster innovation and create competitive
advantages. The goal is to make European regions able to achieve economic growth and
prosperity to compete in the globalization era.
In order to reduce the increasing gap between the EU and the U.S. in terms of producing and
using innovation for economic growth, the Smart Specialisation Strategies (S3) have gained
relevance within the EU2020 framework. The Regional Plan for S3 became an ex-ante
conditionality in the new Programming Period 2014-2020 (Del Castillo, Paton and Barroeta,
2015) in order to invest structural funds towards innovation strengthening.
S3s are considered as key factors for enhancing place-based innovation policies. In the report
“Implementing Smart Specialisation Strategies: A Handbook” (2016), the European
Commission recognized the Entrepreneurial Discovery Process (EDP) as a key driver of
Smart Specialisation Strategies, considered as an inclusive and interactive process where the
‘entrepreneurial knowledge’ is at the core of the innovation-based development. Therefore,
the EDP can be interpreted also as a learning process for regions. The involvement of
entrepreneurs in the design and implementation of Smart Specialisation Strategies is crucial
to recognize the competitive advantages of cities (Pinna, 2016).
In this context, cities have emerged as knowledge hubs (center of knowledge creation), since
they are able to attract high-skilled workers, generate creativity and innovation and provide
advanced services and infrastructures connected through formal and informal networking
systems (Penco, 2011).
Cities stimulate innovation through the creation of favorable ecosystems, which boost
competitiveness, foster knowledge production, innovation and socioeconomic development
(Spinosa, Schlemm and Reis, 2015), being also able to revitalize urban distressed areas. In
some cases, these ecosystems develop spontaneously thanks to existing conditions, such as
the presence of strong anchor institutions and the proximity to infrastructures, while in some
other cases they need a consistent push from the public or private sector.
The challenge for cities in today’s knowledge economy lies in creating and supporting
innovation ecosystems, that consist of a set of complex relationships among different actors,
entities, and intangible resources “whose functional goal is to enable technology development
and innovation” (Jackson, 2011, p.2).
In order to understand how cities are facing this challenge, the MAPS-LED project (a Marie
Sklodowska-Curie RISE research project funded by the European Union’s HORIZON 2020
program) has observed how innovation-oriented policy initiatives may affect the knowledge
concentration process, considering also the exogenous dynamics acting on the specific

1042
neighborhoods. For this purpose, the research activities focused on the investigation of
different case studies in the cities of Boston and Cambridge (MA), identified by overlapping
urban regeneration initiatives with the innovation-oriented policy initiatives, including the
occurrence of the geographic concentration of interconnected firms (according to the
definition of clusters by Porter, 1998). The innovation spaces have been investigated as
physical facilities that provide workspaces, equipment and business services to innovators,
hosting networking events, training and mentoring programs to increase workers’ skills and
facilitate connections between the different actors involved in the innovation process.
The paper aims at pointing out how, in specific urban areas, innovation spaces stimulate
knowledge dynamics in order to favor the concentration of innovation in generating spillover
effects due to the implementation of specific urban planning tools. The phenomenon of
innovation concentration in particular places characterized by the presence of mutual factors
(anchor institutions, startupper centers, physical transformations towards the demand of
innovation) has created a regeneration process in backward urban areas, by triggering a
process that can be called ‘expansion of innovation’.
This contribution is articulated into three main sections: the first explores the role of the
Innovation spaces as an expression of knowledge dynamics; the second investigates the main
innovation policies spurring regeneration processes at the city level in the U.S.; the last
section presents the results of the case study of the Roxbury Innovation Center, a public
innovation space considered as an engine for the socioeconomic and urban growth of
Roxbury, a deprived neighborhood of the city of Boston (MA). The paper further investigates
the policy initiatives and tools implemented by the public authorities to support the creation
of an innovation ecosystem.
The Roxbury Innovation Center represents an emblematic case study, since it is among the
new generation of urban planning tools and initiatives focused on innovation that has been
promoted to spur urban regeneration processes. The innovation center has helped to realize
the willingness of the Local Administration to revitalize, economically and socially, the
multi-ethnic and disadvantaged neighborhood of Roxbury. The public authority through the
creation of this innovation facility aims to generate a ripple effect on the creation of jobs and
the development of an innovation ecosystem that will spur the growth of the local economy.
The emphasis on Innovation Spaces, that is becoming common both in the European and the
U.S. cities, highlights the need to focus on supporting interaction, cooperation and knowledge
flows even with the support of urban planning tools and economic development measures.
This approach could be crucial for the urban and economic growth and the development of
the knowledge economy, especially where the innovation community is just beginning to
evolve.
2. THE ROLE OF INNOVATION SPACES AS AN EXPRESSION OF KNOWLEDGE
DYNAMICS
In the literature, from Alfred Marshall (1920) to Robert Park (1925), cities have been
considered as melting pots of diversity and sources of creativity and innovation (Florida,
2003). Jane Jacobs (1969) has long pointed to the role of the urban environment as an
incubator for creativity, innovation and entrepreneurship. Her theoretical approach, together
with the one of Joseph Schumpeter (1934) about on the relevance of innovation and

1043
entrepreneurship for cities, today stands again at the heart of the scientific and political
debate.
Urban areas, in fact, by offering proximity to services, density, variety, knowledge
institutions and specialized labor force, facilitate the networking process (Athey, Nathan,
Webber and Mahroum, 2008) and create the right atmosphere for spurring the knowledge
dynamics, that involve higher research institutions, local organizations and communities,
comprehending both entrepreneurs and citizens.
Both in Europe and America, cities are implementing a new urban innovation-oriented
development paradigm, characterized by the creation of innovation ecosystems, supported by
the urban policies and the spatial planning. The combination of the two has the potential to
economically regenerate specific urban areas, promoting the existing local assets (material
and immaterial) and identifying the new ones.
In this context, innovation spaces (innovation centers, co-working, research labs,
accelerators, etc..) are emerging as important instruments to enhance local development and
support the creation of innovation ecosystems by encouraging exchanges of knowledge
between different actors, assisting entrepreneurs, and promoting cross-fertilization of ideas
and cross-sectoral collaborations. They accomplish these missions by providing affordable
offices, business services, networking events, training and mentoring programs for local
startups, entrepreneurs and innovators.
Innovation spaces are attracting entrepreneurs, startups, innovators and investors in cities,
generating new knowledge dynamics and spurring urban and economic development.
They represent an emerging factor of the new demand of innovation-oriented physical
transformations that recall the specific requirement of the Entrepreneurial Discovery Process
about catalyzing the entrepreneurial knowledge dynamics.
In recent years, policymakers recognized the potential of these spaces as enablers of
innovation and they are supporting them by stimulating a favorable environment for
innovation (Rodriguez, Congdon and Ampelas, 2015).
3. THE PUBLIC POLICY EFFORT TO ENHANCE THE ECONOMIC
DEVELOPMENT THROUGH INNOVATION
The City of Boston is actively enhancing the socioeconomic development by exploiting the
potential of innovation. As a matter of fact, over the past years, different innovation
initiatives have been implemented to generate urban transformation processes able to trigger
the territorial growth. Together with the urban planning, they have acted in a complementary
way for supporting the knowledge dynamics and the regeneration of the local economy. A
sample of these innovation-oriented policy initiatives are illustrated in Table 1.
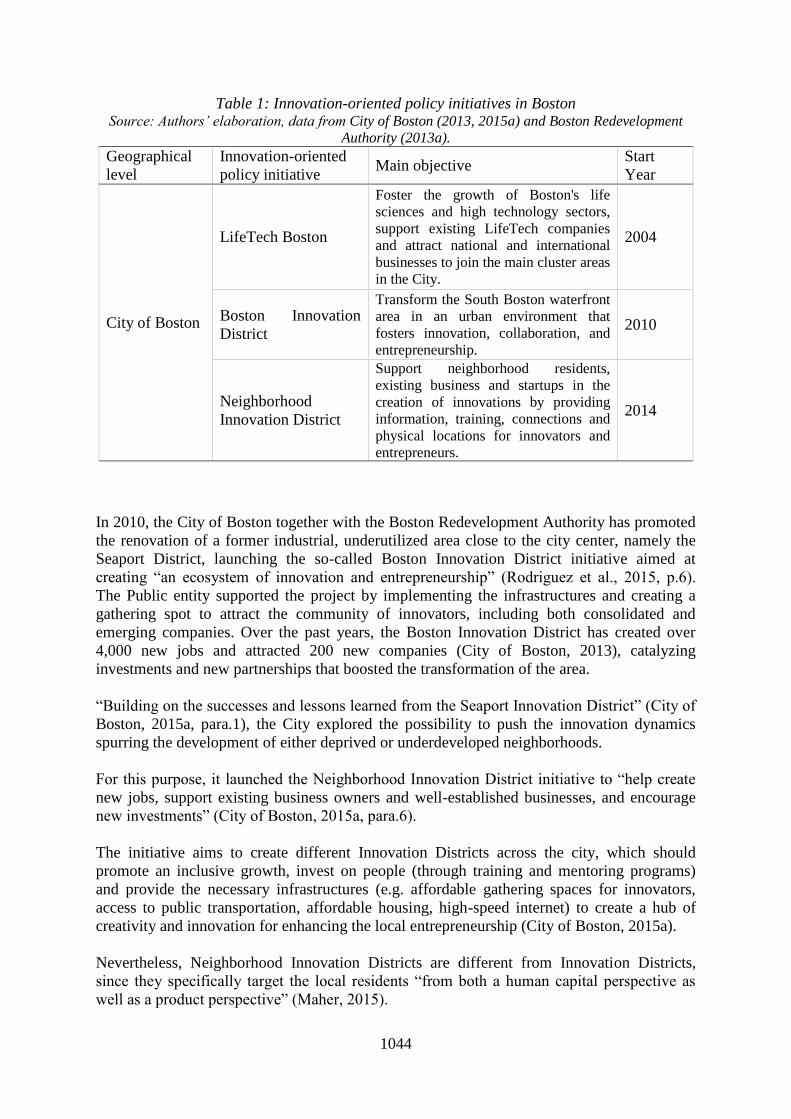
1044
Table 1: Innovation-oriented policy initiatives in Boston
Source: Authors’ elaboration, data from City of Boston (2013, 2015a) and Boston Redevelopment
Authority (2013a).
Geographical
level
Innovation-oriented
policy initiative Main objective
Start
Year
City of Boston
LifeTech Boston
Foster the growth of Boston's life
sciences and high technology sectors,
support existing LifeTech companies
and attract national and international
businesses to join the main cluster areas
in the City.
2004
Boston Innovation
District
Transform the South Boston waterfront
area in an urban environment that
fosters innovation, collaboration, and
entrepreneurship.
2010
Neighborhood
Innovation District
Support neighborhood residents,
existing business and startups in the
creation of innovations by providing
information, training, connections and
physical locations for innovators and
entrepreneurs.
2014
In 2010, the City of Boston together with the Boston Redevelopment Authority has promoted
the renovation of a former industrial, underutilized area close to the city center, namely the
Seaport District, launching the so-called Boston Innovation District initiative aimed at
creating “an ecosystem of innovation and entrepreneurship” (Rodriguez et al., 2015, p.6).
The Public entity supported the project by implementing the infrastructures and creating a
gathering spot to attract the community of innovators, including both consolidated and
emerging companies. Over the past years, the Boston Innovation District has created over
4,000 new jobs and attracted 200 new companies (City of Boston, 2013), catalyzing
investments and new partnerships that boosted the transformation of the area.
“Building on the successes and lessons learned from the Seaport Innovation District” (City of
Boston, 2015a, para.1), the City explored the possibility to push the innovation dynamics
spurring the development of either deprived or underdeveloped neighborhoods.
For this purpose, it launched the Neighborhood Innovation District initiative to “help create
new jobs, support existing business owners and well-established businesses, and encourage
new investments” (City of Boston, 2015a, para.6).
The initiative aims to create different Innovation Districts across the city, which should
promote an inclusive growth, invest on people (through training and mentoring programs)
and provide the necessary infrastructures (e.g. affordable gathering spaces for innovators,
access to public transportation, affordable housing, high-speed internet) to create a hub of
creativity and innovation for enhancing the local entrepreneurship (City of Boston, 2015a).
Nevertheless, Neighborhood Innovation Districts are different from Innovation Districts,
since they specifically target the local residents “from both a human capital perspective as
well as a product perspective” (Maher, 2015).

1045
4. THE CASE STUDY: ROXBURY INNOVATION CENTER
The pilot project of the Neighborhood Innovation District has been launched in 2014, focused
on the neighborhood of Roxbury, located just 3 miles South West from downtown Boston.
Roxbury is one of the poorest and most densely populated neighborhoods of the city, where
the percentage of population below the poverty level is about 33%, compared to the 21% of
Boston (City-data, 2013), while the unemployment level is 17% versus 10% of the whole city
(Boston Redevelopment Authority, 2014).
It is a multiethnic neighborhood, representing the nucleus of the Afro-American community
in Boston (The Boston Indicators Project, 2010, e.g. see Figure 1). The median household
income ranged from $18,000 to $44,000 between 2009 and 2013, compared to the $53,601 of
the city average (Hartman and Zhu, 2013).
Figure 1: Population Breakdown by Race.
Source: Authors’ elaboration. Data from U.S. Census Bureau, 2016.
The Dudley Square area (e.g. see Figure 2), belonging to the neighborhood of Roxbury, has
been selected as the preferred location for the implementation of the pilot project “due to its
economic vitality and the opportunity to use the infrastructure already established to create a
hub of innovation and entrepreneurship” (City of Boston, 2015 a, para.8).
Figure 2: Dudley Square area. Source: Authors’ elaboration.

1046
Since the 2000s, Dudley Square has been the focus of several urban regeneration initiatives,
aiming at providing new housing, commercial facilities and public services, including the
enhancement of the transportation system. The following table shows the main urban
planning initiatives that have been implemented in the last years to revitalize the area.
Table 2: Dudley Square Planning Initiatives
Source: Authors’ elaboration, data from the Boston Redevelopment Authority (2017a).
Target
area
Planning
Initiative Planning Type Description
Start
Year
Dudley
Square,
Roxbury
Dudley Square
Transportation
& Air Quality
Study
Transportation
Planning
The Dudley Square Transportation & Air
Quality Study provides a set of
recommendations upon transportation
network, environment and quality of life
in Dudley Square outlining development
options supported by the community.
2001
Dudley Square
Vision
Economic
Development
The planning initiative includes: real
estate development; creation of a
comprehensive Retail Strategy to
enhance the commercial district; traffic
improvements.
2007
Dudley Square
Municipal
Office Facility
Economic
Development
Redevelopment of an historic municipal
facility located in the hearth of Dudley
Square. It will be the new Boston Public
Schools headquarters, and will include
retail and office spaces.
2012
Plan: Dudley
Square
Community
Planning
The planning initiative will revisit the
recommendations presented in the
‘Dudley Square Vision’ to align them
with current community goals.
2016
In relation to the urban planning initiatives activated in the area, a gradual change in the
explanatory variables of regenerative effects is observed: increases in the number of
inhabitants, housing values and the number of adults with college degree (e.g. see Figures 3,
4, 5).
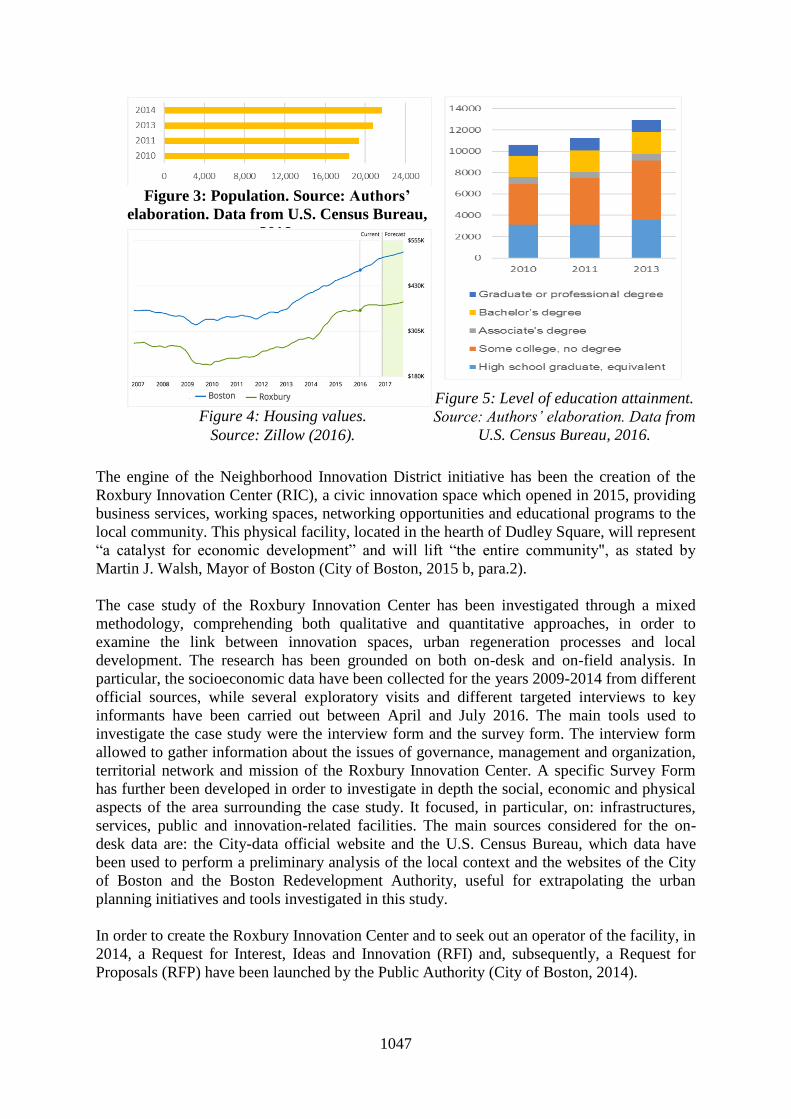
1047
The engine of the Neighborhood Innovation District initiative has been the creation of the
Roxbury Innovation Center (RIC), a civic innovation space which opened in 2015, providing
business services, working spaces, networking opportunities and educational programs to the
local community. This physical facility, located in the hearth of Dudley Square, will represent
“a catalyst for economic development” and will lift “the entire community", as stated by
Martin J. Walsh, Mayor of Boston (City of Boston, 2015 b, para.2).
The case study of the Roxbury Innovation Center has been investigated through a mixed
methodology, comprehending both qualitative and quantitative approaches, in order to
examine the link between innovation spaces, urban regeneration processes and local
development. The research has been grounded on both on-desk and on-field analysis. In
particular, the socioeconomic data have been collected for the years 2009-2014 from different
official sources, while several exploratory visits and different targeted interviews to key
informants have been carried out between April and July 2016. The main tools used to
investigate the case study were the interview form and the survey form. The interview form
allowed to gather information about the issues of governance, management and organization,
territorial network and mission of the Roxbury Innovation Center. A specific Survey Form
has further been developed in order to investigate in depth the social, economic and physical
aspects of the area surrounding the case study. It focused, in particular, on: infrastructures,
services, public and innovation-related facilities. The main sources considered for the on-
desk data are: the City-data official website and the U.S. Census Bureau, which data have
been used to perform a preliminary analysis of the local context and the websites of the City
of Boston and the Boston Redevelopment Authority, useful for extrapolating the urban
planning initiatives and tools investigated in this study.
In order to create the Roxbury Innovation Center and to seek out an operator of the facility, in
2014, a Request for Interest, Ideas and Innovation (RFI) and, subsequently, a Request for
Proposals (RFP) have been launched by the Public Authority (City of Boston, 2014).
Figure 3: Population. Source: Authors’
elaboration. Data from U.S. Census Bureau,
2016.
Figure 4: Housing values.
Source: Zillow (2016).
Figure 5: Level of education attainment.
Source: Authors’ elaboration. Data from
U.S. Census Bureau, 2016.

1048
The City of Boston selected The Venture Café Foundation (VCF) to operate the Innovation
Center as a “mission-driven not-for-profit gathering and event space to connect the
innovation community, expand the definition of innovation, and build a more inclusive
innovation economy” (Roxbury Innovation Center, 2015, para.1).
The Venture Café, besides running the space, organizes free networking events, mentoring
and training programs for both adults and young people, and educational initiatives together
with Public, Private and no-profit organizations to provide community-driven activities
(Roxbury Innovation Center, 2015). As a matter of fact, the VCF is also focused on avoiding
people’s displacement and maximizing the benefits of the local community. Private and
public actors have been involved in the development of the space, demonstrating the
willingness to create an ecosystem of innovation (and not simply a facility) that will enhance
innovation and economic growth in this deprived area. The RIC will represent the anchor
institution of this ecosystem. In particular, the Massachusetts Technology Collaborative
(MassTech), a State-funded Agency supporting cluster development, has provided $150,000
grant funding to support the management and programming of the Innovation Center (City of
Boston, 2014).
The 3,000 square feet of the RIC, offer free co-working areas, affordable private office
spaces, flexible conferences and event rooms available for renting. In particular, the physical
capital provided consists of: the Think Space (a large multi-purpose event room), the Learn
Lab (medium-sized room for classes and workshops), the Team Room (a small room for
meetings of 4/8 people). In addition to those renting spaces, RIC is equipped with a digital
Fabrication Laboratory (FabLab) and an open co-working area, which are available to the
local community. The Roxbury Innovation Center is a dynamic, interactive space, where
innovators, investors, students, entrepreneurs and startups from different sectors (not just
technology) can run into each other, share ideas and learn.
The Innovation Center is housed inside the Bruce C. Bolling Municipal Building, that hosts
also the headquarters of the Boston Public Schools (BPS). The BPS and the Venture Cafè
Foundation work together to support and connect people “so that every person with an idea
can build it, grow it, [and] become a successful entrepreneur” (City of Boston, 2014, para.5).
Figure 6: Development Projects and Transportation system of the area. Source: Authors’
elaboration.

1049
The building is near several innovation centers and education facilities (such as the
Northeastern University) and close to two subway stations and the Dudley Square
transportation hub (e.g. see Figure 6). This proximity helps to enhance the connection
between entrepreneurs, students, graduates and academia, and encourages the access to the
Innovation Center. The following maps illustrate respectively the transportation system with
the main completed and planned development projects implemented by the Boston
Redevelopment Authority (BRA) in the area (e.g. see Figure 6) and its built environment,
including the research centers and labs, the academic institutions and the innovation centers
(e.g. see Figure 7), detectable within half-mile radius (about 800m) of the Innovation Center.
Figure 7: Map of the Built Environment. Source: Authors’ elaboration.
The above-mentioned development projects are implemented through specific regulatory
actions that are hierarchically organized as follows:
- Metropolitan Area Planning, which promotes Smart Growth and Regional Collaboration.
The Metropolitan Area Planning Council (MAPC), the regional planning agency that is
responsible for the Metropolitan plan of Boston, works towards “sound municipal
management, sustainable land use, protection of natural resources, efficient and affordable
transportation, a diverse housing stock, public safety, economic development, clean energy,
healthy communities, an informed public, and equity and opportunity among people of all
backgrounds” (MAPC, 2014);
- City Comprehensive Plan, that implements “ordinances, such as Zoning or subdivision”
within the urban contexts (American Planning Association, 2017);
- Downtown districts, neighborhood districts, Harborpark District and Special Purpuse
Overlay Zoning Districts, among others (Boston Redevelopment Authority, 2017b).
Within the Roxbury Neighborhood District, the Article 50 of the Boston Zoning Code has
established a specific Economic Development Area (EDA) in Dudley Square, called “Dudley
Square EDA”, to encourage economic development and commercial activities, with a specific
focus on the interests of the community (Boston Redevelopment Authority, 2013b). A
particular attention is given to the promotion of innovation by requiring a certain amount of
research and development uses in the area, intended the same way as the usual urban land use
category of the zoning.

1050
As a matter of fact, the amount of space dedicated to innovation acquires a sort of "service"
implication, becoming a requirement of the zoning, like the spaces for commercial facilities,
residential areas, education, etc.
According to the Article 50, the 30% of the gross floor area of any new development plan
proposed within the area must be dedicated, or must support the following uses:
- “Research, development, and production of pharmaceutical and biomedical products;
- The design, development, fabricating, and testing of instruments for engineering, medical,
dental, scientific, optical, or other similar professional use;
- Other scientific Research and Development Uses, including laboratories and facilities for
theoretical, basic, and applied research, product development and testing, prototype
fabrication, or production of experimental products” (Boston Redevelopment Authority,
2013b).
These spaces of innovation can be managed by either private, public, or governmental entities
(Boston Redevelopment Authority, 2013b). The city of Boston is trying to push innovation
through the above-mentioned tools and planning initiatives in Dudley Square, among which
the Roxbury Innovation Center represents an interesting case. This facility, as a pilot project
of the Neighborhood Innovation Initiative, aims to create a positive impact on the local
community by providing the necessary skills, tools, workspaces, connections and programs to
enhance the development of innovation and support new entrepreneurs to start and grow new
companies. This, in turn, acts towards bridging the existing gap between the disadvantaged
neighborhood of Roxbury and the rest of the city, by strengthening and expanding the
innovation economy (Pagones, 2015). This is one of the most difficult challenges that the
Boston administration is called to face, for bucking the trend of the traditional urban
strategies, disrupting the patterns of inequality.
5. CONCLUSIONS
Quoted Yigitcanlar (2011b), in the emerging role of intensive-knowledge economy, cities
produce various development strategies. Such strategising is an important development
mechanism for cities to complete their transformation into knowledge cities. The case study
of Roxbury Innovation Center is an example of how innovation policy supports urban
innovation-led initiative to attract companies, research institution, startups, accelerators in
creating a dense community of innovators, in other words to contribute in building an
innovation ecosystem. Alongside the emerging rise of innovation districts across the U.S. and
EU with a specific and recognizable connotation, the urban regeneration initiatives
encompass also those planning activities that include innovation as a characterization of the
area under zoning rules. More in particular, the case study is paradigmatic in the way in
which innovation turns on urban regeneration planning initiative to transform a backward
urban area into a vibrant neighborhood. The phenomenon of innovation concentration in
particular places of Boston characyerized by the presence of mutual factors (anchor
institutions, startupper centers, physical transformations towards the demand of innovation)
has created a regeneration process in backward urban areas, like Roxbury, by triggering a
process that can be called “expansion of innovation”.
“There has been a huge plan to connect Roxbury to the rest of the city. The Administration
hopes that the neighborhood will be the next Innovation District, making sure that people go
back there with their families attracted by the new opportunities that will arise” (personal

1051
communication, June 30, 2016). Differently from the other innovation spaces spread all over
the city, the Roxbury Innovation Center is more locally focused and represents a great
opportunity for the specific deprived neighborhood to change its path (personal
communication, June 25, 2016). As the Director of the Roxbury Innovation Center
Alessandra Brown stated “we are hoping to assist the growth of entrepreneurship and helping
people really to sustain themselves and their small businesses . . . We are giving them the
ability to choose to stay in the community” (2016). One of the main aim of the Innovation
Center is to provide a gathering point for people, providing them several local community
outreach activities, so that “people can come in and feel engaged in very productive
programs” (personal communication, June 25, 2016). The Boston Planning Authority
contributed to the implementation of this innovation space in Roxbury by providing new
public services and including specific requirements within the zoning code of the area to
support local innovation, that, in turn, can spur the Urban Regeneration processes across the
city. This public effort, sustained by specific planning tools, can be considered a good
practice of how to trigger these processes and augment innovation also in the most lagging
regions of Europe, bridging the existing “innovation gap”. As a matter of fact, Europe still
presents deep differences: on the one hand, there are regions that are able to compete in the
globalized market by focusing mainly on the high tech sectors (Borrás, 2011) and, on the
other hand, regions with unsolved structural economic weaknesses. In these last ones, in fact,
there are several barriers to innovation linked to the shortage of high-skilled workers,
innovators, research and technological infrastructures, the poor cooperation between
businesses, universities, and research centers, as well as the lack of support to startups and
entrepreneurs. As in the case of Roxbury, one of the measures implemented by the Public
Authorities to overcome these deficiencies and enhance innovation and competitiveness, is
the creation of Innovation Spaces that can emerge as promoters of urban and economic
growth, supporting the local communities to express their potential. At the city level, they are
conceived to stimulate the knowledge convergence by endorsing the local organizations. It is
interesting to observe how the urban policies supporting these initiatives, can be considered
the input of these Knowledge concentration processes, which, in turn, trigger the
Entrepreneurial Discovery Process (EDP), important for the implementation of the innovation
ecosystem and the coordination of the efforts of different actors (public administrations,
research institutions, entrepreneurs, communities). These measures can support the
enhancement of the Smart Specialization Strategy (S3) for designing the changes of the
Cohesion Policy 2014-2020, which aim is to reduce the disparities among the European
regions (Barca, 2009). The S3 process needs to be translated into Regional Plans (RIS3), that
can contribute to understand where innovation occurs and how to boost it in order to reach a
smart, inclusive and sustainable growth. The major challenge for an effective RIS3
implementation is the territorialisation of the urban redevelopment strategies. Thus, the place-
based approach allows to build virtuous regeneration projects, spurring the potential of the
“territorial DNA” for identifying, recovering and increasing the values of the local
specificities. For this purpose, the planning process has the potential to become a key-driver
for enhancing innovation. The case study of the Roxbury Innovation Center emphasizes the
importance of these factors that should be comprised within the public policies in order to
foster the S3 in lagging regions, where the creation of an ecosystem of innovation can trigger
the EDP, by overcoming the conventional barriers to growth.

1052
6. AKNOWLEDGEMENTS
The MAPS-LED project has received funding from the European Union’s
Horizon 2020 research and innovation program under the Marie Skłodowska-
Curie grant agreement No 645651.
7. REFERENCES
American Planning Association. (2017). Chapter 8: Local Land Development Regulation. Available at:
https://www.planning.org/growingsmart/guidebook/eight01.htm#8101 [Accessed 15 Apr. 2017].
Athey, G., Nathan, M., Webber, C. and Mahroum, S. (2008). Innovation and the city. Innovation, [online] 10(2-
3), pp. 156-169. Available at: https://www.questia.com/library/journal/1P3-1626531291/innovation-and-
the-city [Accessed 27 Feb. 2017].
Barca, F. (2009). An agenda for a reformed cohesion policy: a place-based approach to meeting European
Union challenges and expectations. [online] Independent Report prepared at the request of Danuta Hübner,
Commissioner for Regional Policy, European Commission, Brussels. Available at:
http://www.europarl.europa.eu/meetdocs/2009_2014/documents/regi/dv/barca_report_/barca_report_en.pdf
[Accessed 20 Sept.2016].
Borrás, S. (2011). Policy learning and organizational capacities in innovation policies. Science and Public
Policy, 38(9), pp. 725-734.
Boston Redevelopment Authority. (2013a). LifeTech Boston. [online]. Available at:
http://www.bostonplans.org/business-dev/initiatives/lifetech-boston/overview [Accessed 20 Nov. 2016].
Boston Redevelopment Authority. (2013b). Article 50 Roxbury Neighborhood District. [online]. Available at:
http://www.bostonplans.org/getattachment/94daf533-0516-454e-8a8f-857c3b19024f [Accessed 05 Nov.
2016].
Boston Redevelopment Authority. (2014). Unemployment in Boston. [online]. Available at:
https://www.bostonplans.org/getattachment/390b9ea9-61d7-467b-9a4c-f6e8588aa4b0 [Accessed 11 Nov.
2016].
Boston Redevelopment Authority. (2017a). Planning Initiatives-Roxbury. [online] Available at:
http://www.bostonplans.org/planning/planning-initiatives?neighborhoodid=16&sortby=date&sortdirection
=DESC&viewall=1 [Accessed 15 Apr. 2017].
Boston Redevelopment Authority. (2017b). Section 3-1. - Division of City Into Districts. [online] Available at:
https://www.municode.com/library/ma/boston/codes/redevelopment_authority?nodeId=ART3ESZODI_S3-
1DIINDI [Accessed 15 Apr. 2017].
Brown, A. (2016). The Roxbury Innovation Center, a Bostonian game-changer. [Video]. Available at:
https://www.thecityfactory.com/fabrique-de-la-cite/site/en/films/pages/the_roxbury_innovation_center
_a_bostonian_game_changer.htm [Accessed 10 Mar. 207].
City of Boston. (2013). Boston’s Innovation District: 3 years + counting. [PDF]. Available at:
http://www.cityofboston.gov/news/uploads/20806_50_1_41.pdf [Accessed 09 Nov. 2016].
City of Boston. (2014). Roxbury Innovation Center Operator Selected. [online]. Available at:
http://www.cityofboston.gov/news/default.aspx?id=17912 [Accessed 10 Feb. 2017].
City of Boston. (2015a). Mayor Walsh releases report exploring the creation of additional Neighborhood
Innovation Districts. [online]. Available at: http://www.cityofboston.gov/news/Default.aspx?id=20356
[Accessed 09 Nov. 2016].
City of Boston. (2015b). Mayor Walsh celebrates the opening of the Roxbury Innovation Center. [online].
Available at: https://www.boston.gov/news/mayor-walsh-celebrates-opening-roxbury-innovation-center
[Accessed 20 Feb. 2017].
City-data. (2013). Roxbury-Boston-MA. [online]. Available at: http://www.city-
data.com/neighborhood/Roxbury-Boston-MA.html [Accessed 09 Nov. 2016].
Del Castillo Hermosa, J., Elorduy, J. P., and Eguía, B. B. (2015). Smart specialization and entrepreneurial
discovery: Theory and reality. Revista Portuguesa de Estudos Regionais, 39(1).
Del Castillo, J., Paton, J., and Barroeta, B. (2015). Smart Specialisation for Economic Change: The Case of
Spain. Symphonya. Emerging Issues in Management, (1), pp. 30-43.
European Commission. (2016). Implementing Smart Specialisation Strategies: A Handbook. [online] Available
at: http://s3platform.jrc.ec.europa.eu/documents/20182/154972/Implementing+Smart+Specialisation+
Strategies+A+Handbook/2a0c4f81-3d67-4ef7-97e1-dcbad00e1cc9 [Accessed 10 Mar. 2017].
Florida, R. (2003). Cities and the creative class. City & Community, 2(1), pp. 3-19.
http://www.europarl.europa.eu/meetdocs/2009_2014/documents/regi/dv/barca_report_/barca_report_en.pdf

1053
Hartman, D. J. and Zhu, S. (2013). Boston Maps. [online] Available at: http://dj.github.io/boston/# [Accessed 02
Nov. 2016].
Jackson, D. J. (2011). What is an innovation ecosystem. National Science Foundation, Arlington, VA.
Jacobs, J. (1969). The Economy of Cities, 1st ed. New York: Random House, pp. 268.
Maher, A. (2015). Can Neighborhood Innovation Districts Spur Sustainable Economic Growth in Boston?
[online]. Available at: http://icic.org/can-neighborhood/ [Accessed 20 Oct. 2016].
MAPC. (2014). Promoting Smart Growth and Regional Collaboration. [online]. Available at:
http://www.mapc.org/about-0 [Accessed 15 Apr. 2016].
Marshall, A. (1920). Principles of Economics: An Introductory Volume, 8th ed. London: Macmillan, pp. 871.
OECD. (2007). Innovation and Growth Rational for an Innovation Strategy. [online] Luxemburg: Statistical
Office of the European Communities. Available at: http://www.oecd.org/sti/inno/39374789.pdf [Accessed
03 Feb. 2017].
Pagones, S. (2015). Roxbury Innovation Center Opens in Dudley Square. [online]. Available at:
http://bunewsservice.com/roxbury-innovation-center-opens-in-dudley-square/ [Accessed 03 Mar. 2017].
Park, R. E., Burgess, E. W. and McKenzie, R. D. (1925). The city, 1st ed. Chicago: University of Chicago Press,
pp. 250.
Penco, L. (2011). Large Cities, Intangible Consumption and Knowledge Production. Symphonya, (2), pp. 34.
Porter, M. E. (1998). Clusters and the new economics of competition. Harvard Business Review, 76(6), pp. 77-
90.
Rodriguez, H., Congdon, D. and Ampelas, V. (2015). The development of Boston’s Innovation District: a case
study of cross-sector collaboration and public entrepreneurship. [PDF]. Available at:
http://intersector.com/wp-content/uploads/2015/10/The-Development-of-Bostons-Innovation-District.pdf
[Accessed 10 Nov. 2016].
Roxbury Innovation Center. (2015). What is Roxbury Innovation Center. [online]. Available at:
http://roxburyinnovationcenter.org/about/[Accessed 17 Nov. 2016].
Schumpeter, J. A. (1934). The theory of economic development: An inquiry into profits, capital, credit, interest,
and the business cycle, Vol. 55. Cambridge, MA: Harvard University Press, pp. 255.
Spinosa, L. M., Schlemm, M. M., and Reis, R. S. (2015). Brazilian innovation ecosystems in perspective: some
challenges for stakeholders. Revista Brasileira de Estratégia, 8(3), pp. 386-400.
The Boston Indicators Project. (2010). Racial and Ethnic Diversity, Boston. [online]. Available at:
http://www.bostonindicators.org/indicators/race-and-ethnicity [Accessed 02 Nov. 2016].
The World Bank. (2010). Innovation Policy: A guide for developing Countries. [online] Washington, D.C.:
World Bank Group. Available at: https://openknowledge.worldbank.org/bitstream/handle/10986/2460/
548930PUB0EPI11C10Dislosed061312010.pdf [Accessed 10 Oct. 2016].
U.S. Census Bureau. (2016). American Fact Finder. [online database]. Available at:
https://factfinder.census.gov/faces/nav/jsf/pages/index.xhtml [Accessed 10 May. 2016].
Yigitcanlar, T. (2011a). Moving Towards a Knowledge City?. International Journal of Knowledge-Based
Organizations (IJKBO), 1(3), pp. 22-38.
Yigitcanlar, T. (2011b). Knowledge-based urban development redefined: from theory to practice knowledge-
based development of cities. Summit Proceedings of the 4th Knowledge Cities World Summit, pp. 389-399.
Zillow. (2016). Roxbury Home Prices & Values. [online]. Available at: https://www.zillow.com/roxbury-
boston-ma/home-values/ [Accessed 10 Nov. 2016].

1054
ID 162
GREEN ECONOMY AS A DRIVER FOR URBAN REGENERATION:
INSIGHTS FROM GREENTOWN LABS, USA
G. U. Cantafio
PAU Department, Università degli Studi Mediterranea di Reggio Calabria, Salita Melissari, 92124, Reggio
Calabria, Italy
Email: [email protected]
Abstract: The objective of this study is to investigate the linkages between economic
development, innovation and environmental sustainability inside urban areas. To achieve this
goal, this paper adopts a case study strategy, by drawing inspiration from an incubator located
in the Boston metropolitan area, named Greentown Labs. The case study is discussed by
analysing the different stages the Greentown Labs went through, relocating from Cambridge to
Boston and then from Boston to Somerville. The present contribution will give some
recommendations considering the creation of incubators as facilitator of growth of innovative
start-ups that can be essential for spurring innovation and economic development within urban
centres.
Keywords: MAPS-LED, Greentown Labs, Sustainability, Innovation, Incubator.
1. INTRODUCTION
Innovation is a procedure that brings to a result: this result is, by definition, new in the sense
that it is a thing or a way of making something that before was not there (Godin, B., 2008).
Innovation is a proxy of the generation of new knowledge and it happens by means of several
causes: project and engineering activities, specialization courses organized by the production
divisions, interactions with customers and contractors, re-utilization of existing knowledge
coming from outside the firm (Katz, J., 2004). Innovation must be distinguished from
invention. Many theorists have defended this argument over the course of the years.
Innovation is essential to all economic activity: it is an invention, activity, market, source of
supply or business group that is not only created, but put in action, utilized or promoted by a
firm (OECD, 2005).
The incubator of Greentown Labs, in Somerville, MA (USA) has an important role for the
innovation, being an incubator for start-ups with the mission of enabling a vibrant community
of entrepreneurs to work on their visions and to provide access to the space, funding, a
prototyping lab and co-located office space and other facilities to enable start-ups to rapidly
grow their networks and their companies.
MAPS LED is a European research project aimed at examining how innovation happens
spatially. This project has first mapped at the urban level the most performing clusters in the
Boston metropolitan area and then identified within this area the initiatives, where creation
and use of innovation happen. Figure 1 shows the initiatives selected for the project. Among
them, Greentown Labs has been chosen for this paper, since it is focused on the Green tech
sector, or more in general on the Green Economy. The case study will be discussed by
analysing all the steps of its development, exploring the different locations where Greentown
Labs was placed through the years. Finally, lesson learned will be discussed, lesson transfer,

1055
justification for the case study selected, benchmarking across indicators, possible elements of
transferability, limitations and constraints.
Figure 1: Selected initiatives in the Boston area
2. GREENTOWN LABS
Green Town Labs (GL) is located in Somerville, inside the Boston Metropolitan Area. The
case study of Greentown Labs has been analysed under eight factors of success: Constant
City Leadership, Supportive National Policy, Focus on city specific issues, Intellectual
capital, Public engagement, Strong partnerships, History of global trading, Financial
incentives. These eight factors of success have allowed this case study to be successful in
attracting investment in the so-called “green tech” sector and in tackling key environmental
challenges. Some of these factors are a result of the city’s history and context, rather than
having been developed exclusively for the purposes of encouraging the green tech. These
factors are important for creating an ideal process to implement this sector in the city (Power,
S., 2015).
Greentown Labs is an incubator for start-ups that enables entrepreneurs to solve the world's
biggest energy and environmental challenges. The mission of this laboratory is to enable a
vibrant community of entrepreneurs to work on their visions and to provide access to the
space, resources, and funding that allows their early-stage companies to thrive. They offer
40,000 sq. ft. of prototyping lab and co-located office space, a shared machine shop,
immersion in a growing community of energy and clean technology entrepreneurs, and on-

1056
site events and programs designed to enable start-ups to rapidly grow their networks and their
companies.
Most of the companies located into GL have already raised some money; they are not in their
first phase. It is different than an accelerator like the other present in Boston, e.g. Mass
Challenge. Companies located inside GL get some benefits from locating into the incubator,
apart from knowledge sharing with other companies and casual networking, companies also
get discounts for software purchasing and discount for shipping. GL does not have formal
agreements with educational institutions and does not get money from them. GL has a good
survival rate regarding start-ups. Among 102 total companies that have been incubated inside
GL from 2011, just 18 did not make it until 2016. This means that the 82% of the companies
after 5 years was still operating, and this rate is way higher than the one relative to the entire
Finance/Insurance/Real Estate Industry which has in US 58% of start-ups still operating after
4 years, while the average rate of start-ups still operating after 4 years among all the
industries in US is 50,5% (statisticbrain.com). To have a more general data on the average
survival rate of establishments, after 5 years in US it was 56.3 % in the period 2011-2016,
while the average survival rate of establishments after 4 years was 61,6% in the period 2010-
2014 (Bureau of Labour Statistics, 2016). Other data say that in the U.S. the Percentage of
firms that remained in operation through their first five years was 43,2 % in 2012, 45,95% in
2013 and 48,73% in 2014 (Kauffman Index, 2016).
The impact on job creation of GL is impressive, producing currently about 528 jobs. After
incubating companies, the incubator tries to retain companies in Boston area, trying to
struggle against the migration of the companies elsewhere, in order to keep on generating
economic development in the area.
GL collaborates with several agencies and networks for improving its network and receiving
funding:
- Mass Development, which is a quasi-governmental agency, supporting manufacturing in
Massachusetts. Mass Development, is a state’s economic development and finance agency,
works with businesses, non-profits, financial institutions, and communities to stimulate
economic growth across the Commonwealth. Through these collaborations they help create
jobs, increase the number of housing units, revitalize urban environments, and address factors
limiting economic growth including transportation, energy, and infrastructure deficiencies.
- The Department of Energy, though it does not receive any money from it.
- The Incubate Energy Network, which is accelerating the transition to a sustainable economy
through national coordination of incubator resources supporting entrepreneurs focused on
clean energy innovation and deployment. The network has supported more than 500
companies to date and has a significant pipeline.
2.1 The relocations of Greentown Labs
GL started as a start-up in the Kendall Square Area in 2011, and then it grew until it needed
more space for developing. To fulfil its needs of more space, it moved into the Boston
Seaport district, where it remained for about six months and finally relocated again into
Somerville, in a vibrant and large area, seat of already existing up and coming firms.
In order to have a brief idea of the first two areas in which has been located GL, will be
provided a brief description. In the Boston Seaport district there has been a huge amount of

1057
public investments by the city of Boston in the last decade, with the intention to regenerate
the area and make the district more attractive for business and foster innovation. The Kendall
Square area, located in the City of Cambridge, MA, U.S.A., very close to the Massachusetts
Institute of Technology (MIT), is one of the most successful international innovation hubs
where the integrated approach made possible to create a development processes in social,
economic, and physical terms.
Three factors mainly caused the relocation of Green Town labs from South Boston to
Somerville:
1) One of the factors that caused the relocation of GL from Boston Innovation District to
Somerville is the price of the land. The rent went from 8$/sq. ft. to $52/sq. ft. in the Seaport
district (South Boston) in a year and a half. The median home value in 2012 in South Boston
was $374,000, while in Somerville in 2012 was $362,000 (Zillow.com). Now in 2017, the
average office space price for sale in the neighbourhood of South Boston is about $ 650/ sq.
ft. while in the city of Somerville is $ 535/ sq. ft. (Officespace.com). The Commercial Real
Estate average rental rate now in South Boston is almost $37/ sq. ft., while in Somerville is
$32/ sq. ft. (Loopnet.com). This means that still there is a gap in the real estate market
between the two areas.
Figure 2 - Median listing price comparison between Somerville (green curve) and South
Boston (orange curve). Source: http://www.zillow.com/somerville-ma/home-values/
2) Another important factor that emerged from qualitative research carried out by means of
interviews was the investment into innovation done by the city of Somerville through
“SomerVision”, the local plan utilized by the city for the economic development of the area
in the long run. It was a flexible document about the new economy, encouraging the growth.
3) The last factor that caused the relocation of the incubator into Somerville was the intention
from the city of moving the laboratories much closer to the places where the young
professional lived, since the creative class that worked into the incubator stayed in
Somerville. By relocating GL into the community, the intention from the city was to create a
vibrant community, much more liveable for the workers, that in this way had the possibility
to commute to work in shorter time, by walking or bicycling.

1058
At that time, next to the location where GL would have moved, Artisan Asylum was located,
a non-profit community fabrication centre including workspaces for local craftsmen. On the
other side, there was Brooklyn Boulders, a community space for climbers. The warehouse
was a former envelops factory.
Figure 3 - Greentown Labs Locations over the years: A (Cambridge), B (Boston Innovation
District) and C (Somerville)
3. DISCUSSION
In this section it will be analysed the lessons learned from the GL case study, the lessons
transfer, the justification of the case study selected for lesson transfer and the possible
elements of transferability, limitations and constraints.
In terms of lessons learned from the GL case study, it can be highlighted that the presence of
an incubator related to a growing sector like the green tech can work as an attractor for
investments, both at the local level and at the national level. The success of this initiative has
been favoured also by the presence of significant anchor institutions such as important
universities like the MIT and Harvard. These two universities, with the other universities
present in the Boston area, played a key role not only because of the high supply of skilled
and educated workforce which they furnish, but also because of their essential role in the
local community and their strategic influence to the local economy and the consistent
relationship which they form together with the local government and the philanthropic sector.
In terms of lesson transfer, the analysis will be conducted by referring to Rose (1991), i.e.
under what circumstances and to what extent can a programme that is effective in one place
transfer to another.
MIT
Harvard
Boston Innovation District
Greentown Labs
East Cambridge Logan
Woburn
Medford
Malden
Burlington
Stoneham
LexingtonWinchester
Melrose
Belmont
Everett
Waltham
Watertown
Wakefield
Arlington
Newton Center
Newton
Waban
Somerville
Hyde Park
East Boston
West Roxbury
Brighton
Roslindale
Jamaica Plain
Mattapan
Allston
Dorchester
Roxbury
Dorchester Center
42
20
00
42
30
00
71 10 00 71 00 00
Greentown Labs Location
Scale 1:150.000
Legend
MBTA Commuter Rail
Transportation
Boundaries
Train Stations
Highways
Rail Lines
Zip Code Boundaries

1059
Moreover, Rose (2005) proposed ten steps that policy makers could undertake in order to
deduce lessons from foreign experience:
1) Learn the key concepts;
2) Catch the attention of policymakers;
3) Scan alternatives and see where to look for policy lessons;
4) Learn by traveling abroad;
5) Theorize a generalized model of how a program or policy works;
6) Turn the model into a lesson fitting your own national context;
7) Decide whether is a good lesson and if it should be implemented;
8) Decide whether the lesson should be applied;
9) Simplify the means and conclusions for a greater chance of succeeding;
10) Evaluate a lesson’s outcome prospectively as it evolves over time.
Policymakers can draw lessons from the GL. The collaboration among different actors and
stakeholders can be taken into account as a positive example for lagging regions. The fertile
innovation ecosystem present in the Boston area has favoured the rise of several innovation
hubs, like GL. The justification of the choice of the GL is briefly explained. This is an
exploratory study and implements a case study research of a green tech incubator and it helps
in the process of decisions making for the implementation of innovation hubs and incubators
in lagging regions, trying to draw possible elements that can be transferred and less positive
elements that should be analysed more in depth before being transferred in lagging regions.
The benchmarking process across the context indicators of the two cases consists of
comparing indicators and it can be used as a tool to understand if GL can be considered as a
positive case study.
In the period 2011-2016 the 82% of the companies incubated in GL after 5 years was still
operating. This survival rate of the companies is impressive if compared with the U.S.
average rate of start-ups still operating after 4 years among all the industries, which is 50,5%,
and with the average survival rates of establishments in the U.S., which was 61,6% in the
period 2010-2014. In Europe the average survival rate of firms after 4 years in the period
2010-2014 was 50,6%, while in Italy the survival rate for companies after 4 years in 2014
was 50% in the same period (Eurostat, 2017). These data show that the survival rate for firms
in Europe and in Italy are lower than the U.S. average and way lower than the Greentown
Labs survival rate. The higher survival rate of firms incubated can represent a success factor
due to a better supply of services for the firms inside the incubator, and a better source of
investments for entrepreneurs who decided to place their firm inside an incubator in the green
tech sector.

1060
Figure 4 – Survival rate of start-ups incubated into Greentown Labs vs. survival rate of U.S.
start-ups, U.S. establishments, European firms and Italian firms
(Bureau of Labour Statistics, 2017; Eurostat; Istat; Statisticbrain.com)
*For Greentown Labs the survival rate is calculated after 5 years
Another indicator for the benchmarking is the entrepreneurship level. The success of GL can
be explained also as the effect of a high level of entrepreneurship in the United States in
general, advantaged by all the aforementioned factors. The United States have the highest
Global Entrepreneurship Index, resulting first in the 2017 Global Entrepreneurship Index
rankings, which considers data on entrepreneurial attitudes, skills and aspirations of the local
population. This resulted in a GEI Score of 83,4 for the U.S. versus lower GEI Scores for all
the other countries, comprising European countries from Switzerland (GEI score 78) to
Bulgaria (GEI score 22,7) (GEDI, 2017). Moreover, it has to be taken into account an
historical American tendency to entrepreneurship.
Figure 5 – Global Entrepreneurship Index in the United States and Europe -
Author’s elaboration based on GEDI, 2017
The installation of more incubators like GL could spur the entrepreneurship level and the
number of start-ups in lagging behind regions, especially in a growing sector like the green
tech. This kind of incubators work well if there is a highly educated workforce and if there is
0%10%20%30%40%50%60%70%80%90%
Survival Rate after 4 years
0.0010.0020.0030.0040.0050.0060.0070.0080.0090.00
GEI Score

1061
the presence of anchor institutions. To some extent the presence of incubators or accelerators
could exploit the high number of educated people in lagging regions, functioning also as a
brake to the persistent phenomenon of out-migration, which is strangling some lagging
regions like the European peripheral regions.
In order to understand the possible elements of transferability of the model in a different
context like the one of lagging behind regions, the Italian start-ups environment will be
analysed. Following this rationale, we do not assume a policy or an investment in a specific
sector to be transferred like an emulative process from one place to another without social
and historical background, and institutions being taken into account.
In Italy, at the end of September 2016, the number of innovative start-ups (entered in the
special section of the Register of Companies in accordance with Decree-Law 179/2012)
amounted to 6,363 with an increase of 420 units respect to the end of June (+7,07%). Start-
ups represent 0.4% of the Million and a half active capital companies. Moreover, in Italy at
the end of June the incidence of the phenomenon was equal to 0.38%, while it represented a
0.35% in March (Union Camere et al., 2016).
These data show how an innovation led entrepreneurial ecosystem is growing according to
national wide indicators, although important gaps are still existing among the North and the
South of the nation, where the lagging regions are mostly located, both in terms of economy
and innovation. For example, the total share of start-ups of the Southern regions and Islands
(Campania, Basilicata, Puglia, Calabria, Sicily and Sardinia) does not even reach the National
share of start-ups of Lombardy region alone, which is by far the most innovative region
(20,27% of the south versus 21,82% of Lombardy) (Union Camere et al., 2016).
Figure 6 - Number of start-ups per region in Italy and regional density - regional ranking.
(Union Camere et al., 2016)
Possible element of transferability can be represented by the collaboration among all the
different actors, so as to create a vibrant innovation ecosystem that can favour the growth of
several business and innovation hubs. The success of GL in the Boston area would not have
been possible without a cooperative environment among anchor institutions, local
government, third sector and private investors.

1062
In order to understand where it is possible to find resources for the implementation of
innovation hubs, the potential of some European Funds will be assessed, by considering the
Calabria region as a sample amongst lagging behind regions. Some important actions can be
undertaken at local level by means of European Structural Funds, coordinated by the region.
The European Regional Development Fund (ERDF), in the framework of the cohesion
policy, in furtherance of the economic growth and attractiveness of the regional territory,
represents the principal investment instrument of the European Union. The targets arranged
by the Europe 2020 strategy are Job creation, competitiveness between enterprises, economic
growth, sustainable development and improvement of the quality of life of citizens. For the
2014-2020 period, almost one third of the EU investments, amounting to 352 billion euro, are
dedicated to this strategy, which is applied by means of three principal funds: European
Regional Development Fund, European Social Fund, Cohesion Fund which, in common with
European Agricultural Fund for Rural Development and European Fund for Maritime Affairs
and Fisheries, compose the EU Structural & Investment Funds. European Regional
Development Fund (ERDF) intends to reinforce regional economic and social cohesion, by
subsidizing projects to increase competitiveness and generate jobs. ERDF invests also in
integration projects among member nations, with the European territorial collaboration.
Within the axis 1, the objective 1.1 has the goal of increasing the companies' innovation
activities, especially increasing the indicator of researchers working in enterprises in the total
number of employees, representing the specialization rate of the lagging regions. In 2012 the
indicator was the 0,05%, and has to increase to the target value of 0,32% by 2023 (Regione
Calabria, 2015).
Another important action is the Action 1.4.1, which aims at supporting the creation and
consolidation of innovative start-ups-intensive application of knowledge and the spin-offs of
research initiatives. This action supports the development and qualification of the regional
production system through the promotion and creation of innovative enterprises (spin off of
the research, innovative start-ups and micro-enterprises), in S3 innovation areas. This action
aims at increasing the incidence of innovative specialization in application perimeters with
high knowledge intensity. The actions of the European development funds have the objective
of increasing the indicators. In particular, the action 1.4.1 aims at increasing the indicator of
the birth rate of enterprises in knowledge-intensive sectors. This indicator is rather low in
Calabria, if compared to other southern Italy regions. It was 10,6% in 2011 (Istat data) and by
means of European Funds it is intended to rise to 18% by 2023 according to the Regional
plan.
4. CONCLUSIONS
The case study of GL has shown how the cooperation among different actors such as
innovation spaces, governmental agencies, non-profits, and private investors can bring more
people to participate to the innovation process, inside a growing sector like the green tech.
The case study has revealed also that innovation centres, incubators, and co-working spaces
can increase the innovation level and the employment within urban areas, if there are some
favourable conditions promoted by the implementation of the right actions in the right time in
the right locations.

1063
All the urban processes and actors involved can be summed up in a term: Innovation
Ecosystem (IE). The IE is defined as the assorted array of members and capitals that
contribute to and are essential for on-going innovation in a contemporary economy (World
Economic Forum, 2016). GL represents a space where all the aforementioned actors converge
and can meet in order to share knowledge, create innovation and contribute to economic
growth. These innovative structures embedded within the urban framework, can increase the
level of engagement of people, who can be empowered to actively participate by means of a
collaborative innovative process, helping to leverage the innovation capacity.
The presence of an incubator in a growing sector like the green tech can work as an attractor
for investments, both at the local level and at the national level. The success of this initiative
has been favoured also by the presence of significant anchor institutions such as important
universities like the MIT and Harvard. These two universities, with the other universities
present in the Boston area, played a key role not only because of the high supply of skilled
and educated workforce which they furnish, but also because of their essential role in the
local community and their strategic ability to influence to the local economy and the
consistent relationship with the local government and the philanthropic sector. GL also
mirrors the high level of entrepreneurship in the Boston area, advantaged by all the
aforementioned factors. Reasonably, the presence of incubators or accelerators could also
take advantage of the high number of educated people in lagging behind regions, working as
a brake to the persistent phenomenon of out-migration, which is suffocating some lagging
regions like the European peripheral regions.
5. AKNOWLEDGEMENTS
The MAPS-LED project has received funding from the European
Union’s Horizon 2020 research and innovation programme under the
Marie Skłodowska-Curie grant agreement No. 645651.
6. REFERENCES
Bureau of Labour and Statistics, 2016. Entrepreneurship and the U.S. Economy. Chart 3. Survival rates of
establishments, by year started and number of years since starting. [online] Available at:
https://www.bls.gov [Accessed June 2017]
Eurostat, 2017. Business demography by size class (from 2004 onwards, NACE rev.2). [online] Available at:
http://appsso.eurostat.ec.europa.eu/nui/submitViewTableAction.do [Accessed June 2017]
GEDI, 2017. Global Entrepreneurship Index. [online] Available at: https://thegedi.org [Accessed June 2017]
Godin, B., 2008. Innovation: the History of a Category. Project on the Intellectual History of Innovation
Working Paper, 1.
Istat. Rate of enterprises in knowledge-intensive sectors. [online] Available at: https://www.istat.it [Accessed
October 2016].
Katz, J., 2004, May. Industrial Dynamics, Innovation and Development. In druid Summer Conference,
Denmark.
Kauffman index, 2016. Survival rate. [online] Available at: http:// http://www.kauffman.org/ [Accessed June
2017]
Loopnet. Somerville Commercial Real Estate for Sale and Lease - Somerville, Massachusetts and South Boston
Commercial Real Estate for Sale or Lease. [online] Available at: https://www.loopnet.com [Accessed June
2017]
MAPS-LED, 2017. S3: Cluster Policy & Spatial Planning. Deliverable 2.2 Knowledge Dynamics, Spatial
Dimension and Entrepreneurial Discovery Process. Available at: http://www.cluds-7fp.unirc.it/about-maps-
led.html

1064
OECD, 2005. Oslo manual: The measurement of scientific and technological activities. Paris: Organisation for
Economic Co-operation and Development.
Office Space. Somerville, MA Office Prices and South Boston, MA Office Prices. [online] Available at:
https://www.officespace.com [Accessed June 2017]
Power, S., Cousin, A., England, S., & Brown, C., 2015. Greentech in the City Whitepaper. A roadmap based on
seven cities. [online] Bristol: Arup. Available at:
http://publications.arup.com/publications/g/greentech_in_the_city_whitepaper [Accessed September 2016].
Regione Calabria, 2015. Programma Operativo Regionale 2014-2020. Fondo Europeo di Sviluppo Regionale
Fondo Sociale Europeo. [online] Available at: http://www.regione.calabria.it [Accessed May 2017]
Rose, R., 1991. “What is Lesson-Drawing?,” Journal of Public Policy. Cambridge University Press, 11(1), pp.
3–30. doi: 10.1017/S0143814X00004918.
Rose, R., 2005. Learning from Comparative Public Policy: A practical guide. London, Routledge.
Statistic Brain, 2017. Startup Business Failure Rate By Industry. [online] Available at:
http://www3.statisticbrain.com [Accessed May 2017]
Union Camere, Ministero dello Sviluppo Economico & Info Camere, 2016. Cruscotto di Indicatori Statistici.
Available at: http://startup.registroimprese.it/report/3_trimestre_2016.pdf [Accessed December 15, 2016].
World Economic Forum, 2016. China’s Innovation Ecosystem. [online] Available at: http://www3.weforum.org
[Accessed March 2017]
Zillow. Home prices in Somerville and South Boston. [online] Available at: http://www.zillow.com/somerville-
ma/home-values/ [Accessed September 2016]

1065
POSTERS

1066
ID 153
CRITICAL REVIEW OF OCCUPATIONAL ACCIDENTS DATA AND
STATISTICS IN OIL AND GAS INDUSTRY IN BAHRAIN
M. Alkhaldi, C. Pathirage and U. Kulatunga
School of the Built Environment, University of Salford, Salford, M5 4WT, UK
Email: [email protected]
Abstract: Occupational accidents data and statistics in Oil and Gas (O&G) industry are
published annually in many countries. Having accurate, reliable and standardized accidents
data and statistics is a starting point for any safety work. Unfortunately, these official
published numbers are unreliable and unstandardized, however; these data are missing for
many countries. Therefore, attention should be paid for providing reliable and standardize
accidents data and statistics in O&G industry particularly as there is a countless serious
occupational accidents yearly in this industry. The importance of deflecting the attention
countries regarding the reliability of accident data and statistics is increasing incrementally.
Therefore, this poster is an attempt to examine the role and importance of accurate accident
data and statistics in O&G industry in Bahrain. A critical review of literature on the
occupational accident statistics in Bahrain, status of occupational health and safety in Bahrain,
and challenges in O&G industry in the developing countries reveals that O&G industry in
Bahrain is confronting with a challenge of unreliable and unstandardized accident data and
statistics. In other words, the published occupational accidents data in Bahrain do not contain a
lot of data about the root causes and the published occupational accidents statistics in Bahrain
do not reflect the actual situation of occupational health and safety. On top of that, the overall
occupational health and safety framework in Bahrain is not suitable now to depend on and it
needs serious redesigning plans to promote more consistency, transparency and fairness.
Improving accident reporting system in O&G industry in Bahrain and having a standardized
one will help in achieving a high level of reliability and standardization in occupational
accidents data and statistics and will have a strong foothold in term more effective safety
policy, procedures, and practices, lower accident rate in this industry and higher safety
performance.
Keywords: Accident Reporting System, Occupational Accident, Oil and Gas Industry and
Safety.

1067
ID 154
STATISTICS ABOUT TERRORIST OPERATIONS IN IRAQ
H. Al-Dahash and U. Kulatunga
School of the Built Environment, University of Salford, Salford, M5 4WT, UK
Email: [email protected]
Abstract: Iraq is exposed to numerous types of natural and man-made disasters. Regarding
human-made disasters, terrorism is considered the most salient hazard due to a remarkable
upsurge in terrorist acts during the past decade, particularly in Iraq. Therefore, terrorist attacks
have become an increasingly serious concern and need more attention especially in the Middle
Eastern countries and in Iraq specifically. Accordingly, reviewing statistics about terrorist
operations can provide useful insights into the context of Iraq. Such statistics contains a wealth
of information about a country, and indeed a region of the world, which does not receive
adequate coverage in the disaster literature. At the same time, they do not likely exist
anywhere else in the world. As a result, these statistics would be an important contribution to
the literature. Further, by conducting this review, disaster response management in the context
of terrorism could be conceptualized.
Keywords: Disaster Response Management, Statistics, Terrorism, Iraq.

1068
ID 155
MAPPING STREAM FLOW CHANGES AND ITS IMPLICATIONS ON
IRRIGATION INFRASTRUCTURE IN AGRARIAN COMMUNITIES
OF NIGERIA
S. Goyol, C. Pathirage and U. Kulatunga
School of the Built Environment, University of Salford, Salford, M5 4WT, UK
Email: [email protected]
Abstract: Climate change, a global environmental challenge driving natural hazards is a threat
to socio-economic development. Changes in average weather conditions, alongside
unpredictable temperature and rainfall patterns are altering the climate system resulting to
floods and droughts on two different ends of an extreme. Persistent alteration of the climate
system is already affecting water levels as evident in stream flow changes and the drying water
bodies. These changes are increasingly affecting the availability of water for irrigation
purposes and having impacts on irrigation infrastructure. This can have future implications on
agricultural production, food security and poverty levels if left unchecked. This study aims to
assess stream flow changes and its impacts on irrigation infrastructures by mapping how
different types of irrigation infrastructures respond to changes in stream flow. A multiple case
study approach of three (3) agrarian communities first identified the types of irrigation
infrastructure in each case study. Secondly, an assessment of the stream flow during both the
dry and rainy season was achieved to obtain the pattern of stream discharge. Then, using maps
of case study communities, irrigation infrastructures sensitive to stream flow changes due to
extremes is presented. Findings reveal that erratic and heavier rains are increasing stream
flows in rainy seasons affecting irrigation infrastructures in flood prone areas, while drier
periods and water shortages are causing decreased stream flows in the dry seasons thereby
affecting the yield of irrigation infrastructures due to lower water levels. Findings will provide
decision makers with information to plan ahead of future climate changes/ stream flow
changes and its effects irrigation agriculture.
Keywords: Agrarian Communities, Climate Change, Irrigation Infrastructure, Mapping,
Stream Flow.
1069
ID 156
DEVELOPMENT OF A RESILIENCY FRAMEWORK FOR CRITICAL
INFRASTRUCTURE IN EXTREME WEATHER EVENTS
R. DeMel, U. Kulatunga and C. Pathirage
School of the Built Environment, University of Salford, Salford, M5 4WT, UK
Email: [email protected]
Abstract: Meteorologically speaking, the UK has had a large number of near misses in terms
of extreme weather events (EWEs). Be it luck or chance, the EWEs of the last few decades
have not occurred in severity within concentrated critical infrastructure regions, or within
financial hubs, and while multiple EWEs have topped loss and damages in the billions (GBP),
the UK remains untested for EWE worst case scenarios.
Nevertheless, in terms of extreme weather events, the UK is exposed to considerably large
portfolio of hazards: from localised freak events, to large scale weather phenomena, such as
floods or heavy snowfall, heat waves and cold snaps, wind storms and gales, and less
frequently from droughts. Any of these events could potentially impact critical infrastructures,
having potentially far-reaching consequences, including the loss of life, property, goods, or the
disruption to services, from tertiary services to essential services (such as hospitals and
emergency management services). A large number of interconnected factors feed into the
increasing risk, intensity and loss and damages from EWEs, particularly where CI is affected.
The proposed research methodology, therefore, to develop a resiliency framework for these
EWEs therefore initially involves a multiple case-study of the impact of past EWEs, combined
with semi-structured interviews of a range of stakeholders, both within CI infrastructure,
government, as well as the public. The research aims to develop a framework to evaluate the
resilience of critical infrastructure specifically to EWEs, their direct and indirect impacts, and
determine ways to mitigate these impacts. The purpose of the research is to consider different
aspects of the development and evolution of the resiliency frameworks, as well as the concept
of criticality and critical infrastructure, whilst also looking at existing standards and technical
guidance, as well as policy documents, on critical infrastructure.
Keywords: Critical Infrastructure, Extreme Weather Events, Resilience.

1070
ID 157
CHALLENGES FACED THE UK CONSTRUCTION INDUSTRIES, THE
MOTIVATION, BENEFITS OF ADOPTING OF STRATEGIES
ALLIANCES STRATEGY
W. Hameed and C. Abbott
School of the Built Environment, University of Salford, Salford, M5 4WT, UK
Email: [email protected]
Abstract: The construction industry considered one of the biggest sectors around the world
generally and in the UK especially; however, it faces a large number of challenges such as
construction processes, cost, achieving sustainability of products, a pressure to achieve
sustainable goals through improving the utilisation of natural resources, etc. These challenges
decrease the level of profits and growth in overall business and lower overall construction
industry performance. One response to these challenges is the adoption of a strategic alliance
strategy. An adopting a strategic alliance strategy in construction sector can provide
substantial benefits to all stakeholders. In addition, this strategy avoids a number of negative
behaviours such as opportunism and conflict, as well as enabling those construction actors to
develop long-term relationships and commitments. This literature review will provide a
systematic review regarding those challenges which face the UK construction industries and
the consequent to adopt strategic alliances strategy as well as illustrating the benefits of
applying such a strategy in this sector.
Keywords: Strategic Construction Alliances, Construction Industries Challenges, Motivations
Benefits.

1071
ID 158
BUSINESS MODEL INNOVATION FOR THE DELIVERY OF
SUSTAINABLE HOUSING IN THE KINGDOM OF SAUDI ARABIA
A. Alshahrani and C. Abbot
School of the Built Environment, University of Salford, Salford, M5 4WT, UK
Email: [email protected]
Abstract: In recent years, sustainable housing (SH) has been the subject of significant
innovations, resolving former housing problems and reducing the negative effects of the built
environment. Many of these innovations have targeted efficient use of energy during housing
design, construction, operation, renovation or destruction, etc. Owing to the challenges
associated with sustainability the industry over the world, to date has recorded a limited
number of SH’s being built meeting verifiable sustainable performance standards. In
developing countries, such as Saudi Arabia, that experience rapid urbanization and a scarcity
of resources, the government is motivating the construction industry especially the housing
sector to implement sustainable ideas through the initiation of a number of regulations and
polices. In the Saudi market, much of the SH available is costly, partly arising from flawed
business model (BM). BM in the past have failed to understand that SH will preserve Saudi
Arabia’s resources and ensure people can depend on renewable energy sources, thereby
benefitting future generations. This research therefore reviews the main strategies considered
essential in reducing costs and ensuring feasibility such as: low and zero carbon housing,
smart housing, social housing, low cost housing and net zero energy housing. Furthermore, the
reviews identify main challenges based on the PESTEL analytical framework. Investigates the
conceptual framework of business models for SH. Nine key elements of the business model
are identified include value proposition, target customer, distribution channel, customer
relationship, value configurations, core capabilities, partner network, cost and revenue model.
Finally, the results of the conceptual framework presented to help address the challenges of the
delivery of SH.
Keywords: Sustainable Housing, Business Model, PESTEL Analysis, Saudi Arabia.
1072
ID 159
RE-INTERPRETATION OF THE CONTEXTUAL VALUES
INNOVATIVE CAMPUS OUTDOORS AS A PLATFORM FOR
ENHANCING STUDENT EXPERIENCE IN UK HIGHER EDUCATION
SECTOR
M. Gabr and H. Elkadi
School of the Built Environment, University of Salford, Salford, M5 4WT, UK
Email: [email protected]
Abstract: University campuses are 40 billion pounds business. 2.28 million students spent
most of their times in more than 170 university campus outdoors in the UK; the 2nd most
wanted destination (after US) and top overall student satisfaction (86%). 11.7% (£4
Billion/year) of UK spending are on maintaining campuses. Universities are ranked by their
Academic prestige, the research and scholar excellence. Part of this is also the attractiveness of
campus and the amount and quality of extracurricular activities and facilities provided.
Moreover, the identification and implementation of satisfactory design parameters, relevant in
particular to outdoor learning spaces, is likely to provide an opportunity to maximize students'
creativity and awareness for social and environmental issues. So on campus, where and how
should students invest their time and efforts? What are the most relevant and effective space
features? Which outdoor spaces, with what improvements, would have the greatest impact?
This poster presents dynamics of the use of campus outdoor spaces at the University Of
Salford (UOS) that reveal aspects of possible development towards capitalize on the context
environmental characteristics for the improvement of the students' creativity and awareness
and the desired student-faculty interaction. The unique contribution is towards drawing
attention to the effectiveness and space potentials for the most dominant outdoor student
activities for challenging questions that face urban university campus planners. It will define
effective as well as problematic areas related to current spaces use compared with the planner's
design philosophy and intentions.
Keywords: Outdoor Space Design, Campus Outdoor Planning, On-Campus Experiences.
1073
ID 161
THE RELATIONSHIPS BETWEEN TRAVEL PATTERNS AND URBAN
LANDUSE: REALISING THE 21ST CENTURY GAZA CITY?
A. Shabat and C. Udeaja
School of the Built Environment, University of Salford, Salford, M5 4WT, UK
Email: [email protected]
Abstract: Cities are like human bodies. Their success and liveability depends on their
homogeneity of residents, workers, supplies and services being able to move about.
Particularly in a rapidly growing cities, it is certainly effective for the process of re-developing
our cities to start from insight into the complex relationship that exists between the
transportation system as a service function and all the other land use activities in the city. A
kind of ‘x-ray’ view that can see where their arterial structure is strong enough to support
transportation as a functional system that consists of different modes, interacts with different
activities and influences land use side of the transport/land use relationship form, and hence
the character of the city.
Gaza is a revolutionary city with a set of challenges which is largely being influenced by the
effects and shifts in population growth, economic development and high political pressures.
This poster brings together in a systematic way the results of many recent studies on
transportation/land use strategies to alleviate congestion and urban problems. It presents the
emerging trends and challenges that confront to the 21st Century City, and Gaza in particular.
As well as this systematic approach, other key aspects of this review paper include the
identification of where research has been concentrated (and where there are gaps in research),
and the focuses in some detail on the interaction of socio-economic factors with urban form
and travel patterns.
Keywords: Transportation Plaaning, Land Use, Travel Patterns, Urban Growth.

1074
ID 163
THE CHALLENGES TOWARDS PROVIDING AFFORDABLE
HOUSING TO THE INTERNALLY DISPLACED PEOPLE IN
MAIDUGURI, NIGERIA
Y. A. Abdu and C. Pathirage
School of the Built Environment, University of Salford, Salford, M5 4WT, UK
Email: [email protected]
Abstract: In the past many have been displaced as a result of religious, ethnic, tribal conflicts
in Nigeria, but the number of people displaced due to Boko Haram conflict is high in the
history of Nigeria with over 5 million people displaced. The Nigerian government is now left
with the task of providing affordable housing to this group of people and there are number of
challenges towards providing housing to the internally displaced people in Maiduguri, Nigeria.
These challenges include corruption, government bureaucracy, insecurity, and lack of funds,
lack of commitments, relocation, urgency, and reintegration of the IDPs among others. The
aim of this poster presentation is to examine the challenges towards providing affordable
housing to the internally displaced people in Maiduguri, Nigeria. The critical literature
reviewed on the challenges and barriers towards providing affordable housing to the internally
displaced people in Maiduguri shows that there are number of challenges which include
corruption, insecurity, lack of funds, and lack of commitments, urgency, and relocation among
others. The above mentioned challenges are considered as major challenges Nigerian
government must overcome in order to provide affordable housing to the internally displaced
people in Maiduguri.
Keywords: Affordable Housing, Boko Haram, Conflict, Maiduguri, Nigeria.

1075
Generously supported by:
Conference Chair
Dr Chaminda Pathirage
Conference Co-Chairs
Dr Udayangani Kulatunga
Dr Yingchun Ji
Dr Rod Gameson
Dr Chika Udeaja
Organising Committee
Dr Claudia Trillo
Dr Mohammad Takhtravanchi
Dr Belqais Allali
The University of Salford
Salford, M5 4WT
t: +44 (0)161 295 5000
www.salford.ac.uk http://conference.org.uk/
international-research-week/post-graduates