Bacterial profiles of saliva in relation to diet, lifestyle factors, and socioeconomic status
9
ORIGINAL ARTICLE Bacterial profiles of saliva in relation to diet, lifestyle factors, and socioeconomic status Daniel Belstrøm 1 *, Palle Holmstrup 1 , Claus H. Nielsen 2 , Nikolai Kirkby 3 , Svante Twetman 4 , Berit L. Heitmann 5,6,7 , Vanja Klepac-Ceraj 8 , Bruce J. Paster 9,10 and Nils-Erik Fiehn 11 1 Section of Periodontology, School of Dentistry, Faculty of Health Science, University of Copenhagen, Denmark; 2 Institute for Inflammation Research, Department of Infectious Diseases and Rheumatology, Copenhagen University Hospital Rigshospitalet, Copenhagen, Denmark; 3 Department of Medical Microbiology, Rigshospitalet, Copenhagen University Hospital, Copenhagen, Denmark; 4 Section of Cariology, School of Dentistry, Faculty of Health Science, University of Copenhagen, Denmark; 5 Institute of Preventive Medicine, Bispebejerg and Frederiksberg Hospitals, The Capital Region, Copenhagen, Denmark; 6 The Boden Institute of Obesity, Nutrition, Exercise & Eating Disorders, University of Sydney, Australia; 7 National Institute of Public Health, University of Southern Denmark, Copenhagen, Denmark; 8 Department of Biological Sciences, Wellesley College, Wellesley, MA, USA; 9 Department of Microbiology, The Forsyth Institute, Cambridge, MA, USA; 10 Department of Oral Medicine, Infection & Immunity, Harvard School of Dental Medicine, Boston, MA, USA; 11 Department of International Health, Immunology & Microbiology, University of Copenhagen, Copenhagen, Denmark Background and objective: The bacterial profile of saliva is composed of bacteria from different oral surfaces. The objective of this study was to determine whether different diet intake, lifestyle, or socioeconomic status is associated with characteristic bacterial saliva profiles. Design: Stimulated saliva samples from 292 participants with low levels of dental caries and periodontitis, enrolled in the Danish Health Examination Survey (DANHES), were analyzed for the presence of approx- imately 300 bacterial species by means of the Human Oral Microbe Identification Microarray (HOMIM). Using presence and levels (mean HOMIM-value) of bacterial probes as endpoints, the influence of diet intake, lifestyle, and socioeconomic status on the bacterial saliva profile was analyzed by MannWhitney tests with Benjamini Hochberg’s correction for multiple comparisons and principal component analysis. Results: Targets for 131 different probes were identified in 292 samples, with Streptococcus and Veillonella being the most predominant genera identified. Two bacterial taxa (Streptococcus sobrinus and Eubacterium [11][G-3] brachy) were more associated with smokers than non-smokers (adjusted p-value B0.01). Stratifica- tion of the group based on extreme ends of the parameters age, gender, alcohol consumption, body mass index (BMI), and diet intake had no statistical influence on the composition of the bacterial profile of saliva. Conversely, differences in socioeconomic status were reflected by the bacterial profiles of saliva. Conclusions: The bacterial profile of saliva seems independent of diet intake, but influenced by smoking and maybe socioeconomic status. Keywords: saliva; HOMIM; bacteria; diet lifestyle *Correspondence to: Daniel Belstrøm, Section of Periodontology, School of Dentistry, Faculty of Health Science, University of Copenhagen, Copenhagen, Denmark, Email: [email protected] To access the supplementary material for this article, please see Supplementary Files under Article Tools online. Received: 18 December 2013; Revised: 10 March 2014; Accepted: 13 March 2014; Published: 1 April 2014 T he oral cavity is an open environment harboring a complex community comprising 700 different oral bacterial species, of which only around 50% have been cultivated (1, 2). Over recent decades, mole- cular methods based on sequencing of the bacterial 16S ribosomal RNA (rRNA) gene have expanded the knowl- edge about oral bacteria considerably (3). Thus, studies have revealed a hitherto unknown diversity of the oral microbiota, with significant variation between different oral locations (4, 5). The resident oral microbiota is ournal of ral icrobiology i i r æ Journal of Oral Microbiology 2014. # 2014 Daniel Belstrøm et al. This is an Open Access article distributed under the terms of the Creative Commons Attribution-Noncommercial 3.0 Unported License (http://creativecommons.org/licenses/by-nc/3.0/), permitting all non-commercial use, distribution, and reproduction in any medium, provided the original work is properly cited. 1 Citation: Journal of Oral Microbiology 2014, 6: 23609 - http://dx.doi.org/10.3402/jom.v6.23609 (page number not for citation purpose)
-
Upload
independent -
Category
Documents
-
view
2 -
download
0
Transcript of Bacterial profiles of saliva in relation to diet, lifestyle factors, and socioeconomic status
ORIGINAL ARTICLE
Bacterial profiles of saliva in relation to diet, lifestylefactors, and socioeconomic status
Daniel Belstrøm1*, Palle Holmstrup1, Claus H. Nielsen2, Nikolai Kirkby3,Svante Twetman4, Berit L. Heitmann5,6,7, Vanja Klepac-Ceraj8,Bruce J. Paster9,10 and Nils-Erik Fiehn11
1Section of Periodontology, School of Dentistry, Faculty of Health Science, University ofCopenhagen, Denmark; 2Institute for Inflammation Research, Department of Infectious Diseases andRheumatology, Copenhagen University Hospital Rigshospitalet, Copenhagen, Denmark;3Department of Medical Microbiology, Rigshospitalet, Copenhagen University Hospital, Copenhagen,Denmark; 4Section of Cariology, School of Dentistry, Faculty of Health Science, University ofCopenhagen, Denmark; 5Institute of Preventive Medicine, Bispebejerg and Frederiksberg Hospitals,The Capital Region, Copenhagen, Denmark; 6The Boden Institute of Obesity, Nutrition, Exercise &Eating Disorders, University of Sydney, Australia; 7National Institute of Public Health, University ofSouthern Denmark, Copenhagen, Denmark; 8Department of Biological Sciences, Wellesley College,Wellesley, MA, USA; 9Department of Microbiology, The Forsyth Institute, Cambridge, MA, USA;10Department of Oral Medicine, Infection & Immunity, Harvard School of Dental Medicine, Boston,MA, USA; 11Department of International Health, Immunology & Microbiology, University ofCopenhagen, Copenhagen, Denmark
Background and objective: The bacterial profile of saliva is composed of bacteria from different oral surfaces.
The objective of this study was to determine whether different diet intake, lifestyle, or socioeconomic status is
associated with characteristic bacterial saliva profiles.
Design: Stimulated saliva samples from 292 participants with low levels of dental caries and periodontitis,
enrolled in the Danish Health Examination Survey (DANHES), were analyzed for the presence of approx-
imately 300 bacterial species by means of the Human Oral Microbe Identification Microarray (HOMIM).
Using presence and levels (mean HOMIM-value) of bacterial probes as endpoints, the influence of diet intake,
lifestyle, and socioeconomic status on the bacterial saliva profile was analyzed by Mann�Whitney tests with
Benjamini�Hochberg’s correction for multiple comparisons and principal component analysis.
Results: Targets for 131 different probes were identified in 292 samples, with Streptococcus and Veillonella
being the most predominant genera identified. Two bacterial taxa (Streptococcus sobrinus and Eubacterium
[11][G-3] brachy) were more associated with smokers than non-smokers (adjusted p-valueB0.01). Stratifica-
tion of the group based on extreme ends of the parameters age, gender, alcohol consumption, body mass
index (BMI), and diet intake had no statistical influence on the composition of the bacterial profile of saliva.
Conversely, differences in socioeconomic status were reflected by the bacterial profiles of saliva.
Conclusions: The bacterial profile of saliva seems independent of diet intake, but influenced by smoking and
maybe socioeconomic status.
Keywords: saliva; HOMIM; bacteria; diet lifestyle
*Correspondence to: Daniel Belstrøm, Section of Periodontology, School of Dentistry, Faculty of Health
Science, University of Copenhagen, Copenhagen, Denmark, Email: [email protected]
To access the supplementary material for this article, please see Supplementary Files under Article Tools
online.
Received: 18 December 2013; Revised: 10 March 2014; Accepted: 13 March 2014; Published: 1 April 2014
The oral cavity is an open environment harboring
a complex community comprising �700 different
oral bacterial species, of which only around 50%
have been cultivated (1, 2). Over recent decades, mole-
cular methods based on sequencing of the bacterial 16S
ribosomal RNA (rRNA) gene have expanded the knowl-
edge about oral bacteria considerably (3). Thus, studies
have revealed a hitherto unknown diversity of the oral
microbiota, with significant variation between different
oral locations (4, 5). The resident oral microbiota is
ournal ofral
icrobiologyiir �
Journal of Oral Microbiology 2014. # 2014 Daniel Belstrøm et al. This is an Open Access article distributed under the terms of the Creative CommonsAttribution-Noncommercial 3.0 Unported License (http://creativecommons.org/licenses/by-nc/3.0/), permitting all non-commercial use, distribution, andreproduction in any medium, provided the original work is properly cited.
1
Citation: Journal of Oral Microbiology 2014, 6: 23609 - http://dx.doi.org/10.3402/jom.v6.23609(page number not for citation purpose)
believed to play an essential role in maintaining oral
homeostasis, protecting the oral cavity against the devel-
opment of disease (3). However, dental caries and period-
ontitis, the two most prevalent oral diseases, have been
found to be associated with site-specific changes in the oral
microbiota (6, 7).
Differences in diet intake, lifestyle, and socioeconomic
status are generally considered important factors in the
multifactorial background of dental caries and period-
ontitis. Obesity often measured by a body mass index
(BMI) above 30 kg/m2 is associated with high levels of
dental caries (8) and periodontitis (9, 10), and a high
frequency of sugar intake increases the risk of dental caries
(11). Smoking increases the risk of acquiring periodontitis
and of aggravating existing diseases (12). High intake of
alcohol has been suggested to protect against periodontitis
(13), as well as being a risk factor for periodontitis (14).
In addition, low socioeconomic status is also known to
be associated with periodontitis (15, 16) and dental caries
(17, 18). At present, little is known about the influence of
differences in diet, lifestyle, and socioeconomic status on
composition of the oral microbiome, and whether differ-
ences in bacterial composition may be detected in saliva
samples.
Being an easily collectable, non-invasive biological
material, saliva is suitable for medical investigation, and
several health and disease-associated factors are reflected
in saliva (19). Thus, saliva is currently being thoroughly
investigated in general and in dental medicine in the
search for biomarkers of health and disease (20�22).
A few studies have investigated the bacterial composi-
tion of saliva in oral health (5, 23�25) and verified that
a salivary bacterial profile resembles that of the throat,
tonsils, and dorsum of the tongue (26). In addition, the
salivary microbiome has been shown to be highly diverse
and is proposed to depend on lifestyle and diet intake
(25, 27). Also, oral disease may influence the bacterial
profile, and recently it has been shown that both dental
caries and periodontitis are associated with characteri-
stic bacterial profiles of saliva different from that of oral
health (28, 29).
In this study, we investigated stimulated saliva samples
collected from 292 participants of the Danish Health
Examination Survey (DANHES). We used the Human
Oral Microbe Identification Microarray (HOMIM), a 16S
rRNA high-throughput based microarray technique able
to identify around 300 different bacterial species simu-
ltaneously. The purpose of the study was to determine
whether differences in diet intake, lifestyle, and socio-
economic status associate with the bacterial profile of
saliva.
Materials and methods
Study populationThe cohort of the Danish population-based study DANHES
(30) and the subpopulation participating in the oral part
of the study (31) have been described in detail elsewhere. In
brief, the DANHES study was carried out in 13 different
municipalities in 2007�2008, and oral examinations were
performed in 2008�2009. A total of 76,484 individuals
participated in the questionnaire survey concerning gen-
eral health, and 18,065 had a general medical examination
performed. In addition to the general medical examina-
tion, 4,402 subjects had a dental examination performed,
of which 4,337 delivered a stimulated saliva sample and
4,230 answered a questionnaire concerning self-perceived
oral health. All participants received written information
prior to participation and signed informed consent. The
study was approved by the regional ethical committee
(H-C-2007-0118) and reported to the Danish data author-
ity (2007-41-1567). This study is part of a group of studies
conducted on saliva samples collected from the DANHES
cohort, including studies investigating how periodontitis
and dental caries associate with the bacterial profile of
saliva (28, 29). Population characteristics are presented in
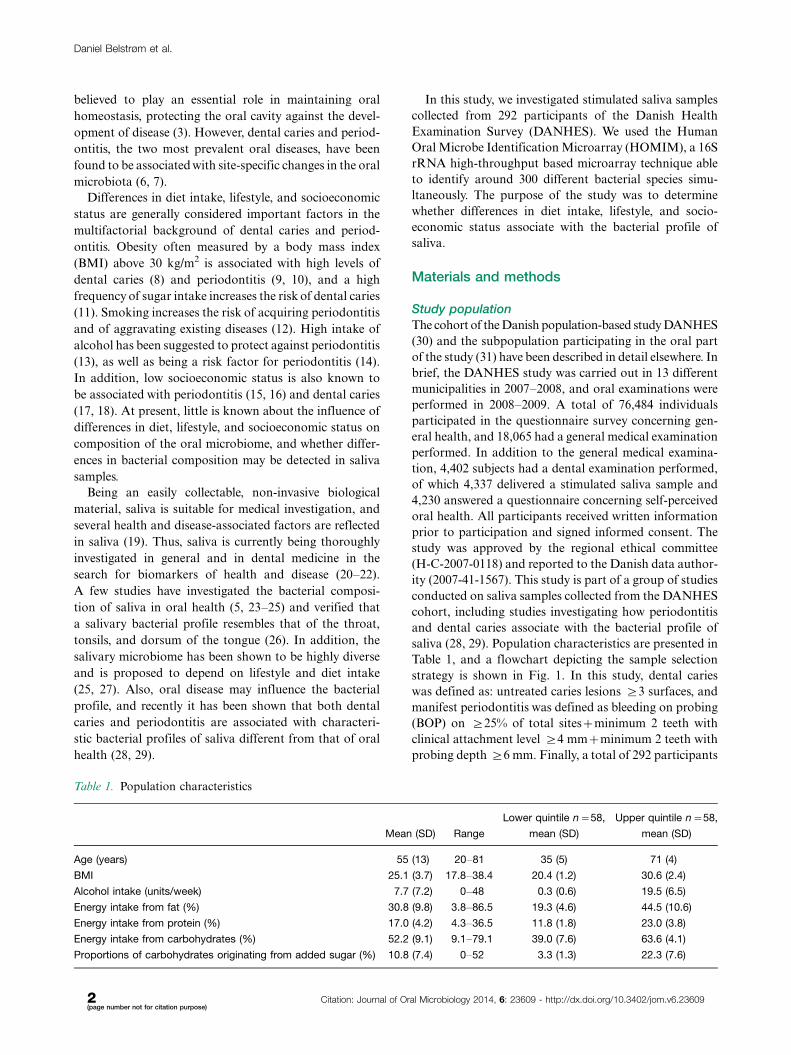
Table 1, and a flowchart depicting the sample selection
strategy is shown in Fig. 1. In this study, dental caries
was defined as: untreated caries lesions ]3 surfaces, and
manifest periodontitis was defined as bleeding on probing
(BOP) on ]25% of total sites�minimum 2 teeth with
clinical attachment level ]4 mm�minimum 2 teeth with
probing depth ]6 mm. Finally, a total of 292 participants
Table 1. Population characteristics
Mean (SD) Range
Lower quintile n�58,
mean (SD)
Upper quintile n�58,
mean (SD)
Age (years) 55 (13) 20�81 35 (5) 71 (4)
BMI 25.1 (3.7) 17.8�38.4 20.4 (1.2) 30.6 (2.4)
Alcohol intake (units/week) 7.7 (7.2) 0�48 0.3 (0.6) 19.5 (6.5)
Energy intake from fat (%) 30.8 (9.8) 3.8�86.5 19.3 (4.6) 44.5 (10.6)
Energy intake from protein (%) 17.0 (4.2) 4.3�36.5 11.8 (1.8) 23.0 (3.8)
Energy intake from carbohydrates (%) 52.2 (9.1) 9.1�79.1 39.0 (7.6) 63.6 (4.1)
Proportions of carbohydrates originating from added sugar (%) 10.8 (7.4) 0�52 3.3 (1.3) 22.3 (7.6)
Daniel Belstrøm et al.
2(page number not for citation purpose)
Citation: Journal of Oral Microbiology 2014, 6: 23609 - http://dx.doi.org/10.3402/jom.v6.23609
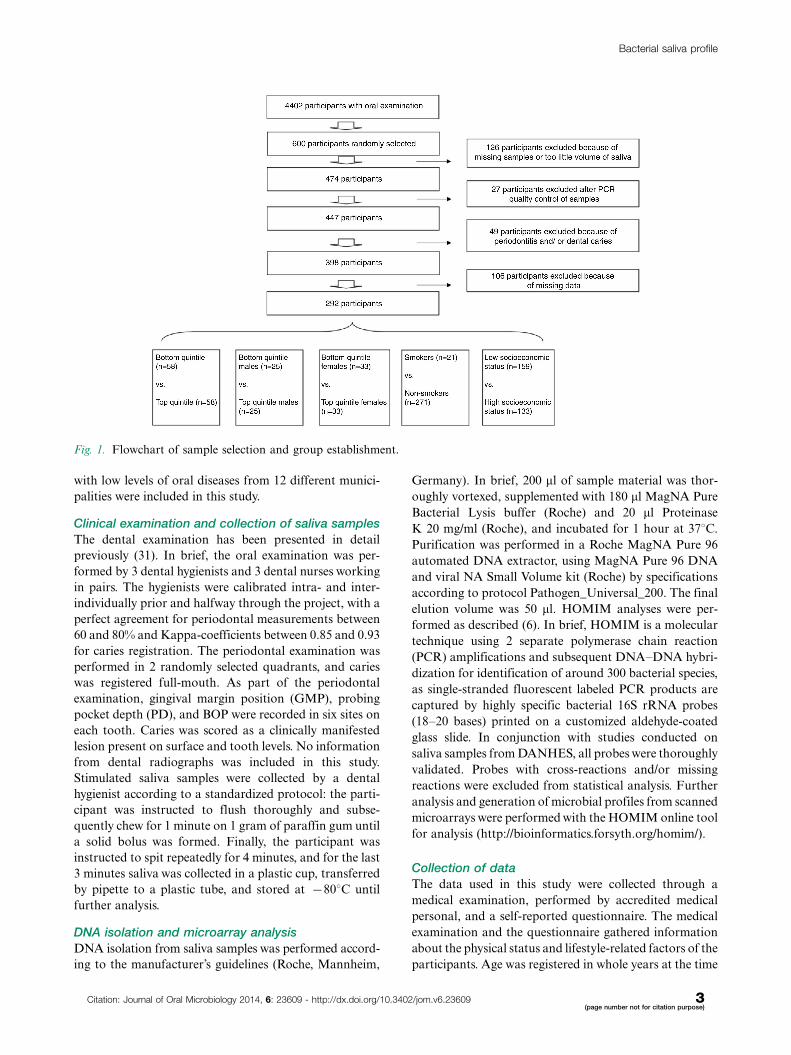
with low levels of oral diseases from 12 different munici-
palities were included in this study.
Clinical examination and collection of saliva samples
The dental examination has been presented in detail
previously (31). In brief, the oral examination was per-
formed by 3 dental hygienists and 3 dental nurses working
in pairs. The hygienists were calibrated intra- and inter-
individually prior and halfway through the project, with a
perfect agreement for periodontal measurements between
60 and 80% and Kappa-coefficients between 0.85 and 0.93
for caries registration. The periodontal examination was
performed in 2 randomly selected quadrants, and caries
was registered full-mouth. As part of the periodontal
examination, gingival margin position (GMP), probing
pocket depth (PD), and BOP were recorded in six sites on
each tooth. Caries was scored as a clinically manifested
lesion present on surface and tooth levels. No information
from dental radiographs was included in this study.
Stimulated saliva samples were collected by a dental
hygienist according to a standardized protocol: the parti-
cipant was instructed to flush thoroughly and subse-
quently chew for 1 minute on 1 gram of paraffin gum until
a solid bolus was formed. Finally, the participant was
instructed to spit repeatedly for 4 minutes, and for the last
3 minutes saliva was collected in a plastic cup, transferred
by pipette to a plastic tube, and stored at �808C until
further analysis.
DNA isolation and microarray analysis
DNA isolation from saliva samples was performed accord-
ing to the manufacturer’s guidelines (Roche, Mannheim,
Germany). In brief, 200 ml of sample material was thor-
oughly vortexed, supplemented with 180 ml MagNA Pure
Bacterial Lysis buffer (Roche) and 20 ml Proteinase
K 20 mg/ml (Roche), and incubated for 1 hour at 378C.
Purification was performed in a Roche MagNA Pure 96
automated DNA extractor, using MagNA Pure 96 DNA
and viral NA Small Volume kit (Roche) by specifications
according to protocol Pathogen_Universal_200. The final
elution volume was 50 ml. HOMIM analyses were per-
formed as described (6). In brief, HOMIM is a molecular
technique using 2 separate polymerase chain reaction
(PCR) amplifications and subsequent DNA�DNA hybri-
dization for identification of around 300 bacterial species,
as single-stranded fluorescent labeled PCR products are
captured by highly specific bacterial 16S rRNA probes
(18�20 bases) printed on a customized aldehyde-coated
glass slide. In conjunction with studies conducted on
saliva samples from DANHES, all probes were thoroughly
validated. Probes with cross-reactions and/or missing
reactions were excluded from statistical analysis. Further
analysis and generation of microbial profiles from scanned
microarrays were performed with the HOMIM online tool
for analysis (http://bioinformatics.forsyth.org/homim/).
Collection of data
The data used in this study were collected through a
medical examination, performed by accredited medical
personal, and a self-reported questionnaire. The medical
examination and the questionnaire gathered information
about the physical status and lifestyle-related factors of the
participants. Age was registered in whole years at the time
Fig. 1. Flowchart of sample selection and group establishment.
Bacterial saliva profile
Citation: Journal of Oral Microbiology 2014, 6: 23609 - http://dx.doi.org/10.3402/jom.v6.23609 3(page number not for citation purpose)
point of questionnaire answering. Height was recorded in
centimeters (cm), and weight was recorded in kilograms
(kg). BMI was calculated using the formula [height (cm)//
weight (kg)*weight (kg)]. Smoking status was recorded by
questionnaire, and the probands were grouped in current
smokers and non-smokers. Information about alcohol
consumption was gathered from the questionnaire and
recorded as intake of units/week. Dietary data were
collected using an Internet-based, 267 items food fre-
quency questionnaire (FFQ), that included 32 photoseries
of food portions to quantify portion sizes. The amount
of daily energy originating from fat, protein, and carbo-
hydrates was calculated using the Foodcalc program.
In addition, the proportion of carbohydrates consisting
of added sugar was determined. Information concerning
the socioeconomic status of the 12 municipalities was
gathered by information from Denmark’s statistics using
the parameters: average income per year (2007), percen-
tage of unemployed inhabitants, and percentage of in-
habitants with a non-western citizenship. In addition,
average level of education (International Standard Classi-
fication of Education, levels 1�6) was calculated using
individual educational information gathered from the
questionnaire. In each of the four categories, the munici-
palities were scored from 1 to 12 (1 being the best ranked
municipality) and the values were added (theoretical
range 4�48).
Formation of subgroups for analysis
The influence of each of the following variables on the
bacterial profile of saliva was tested separately: age,
gender, BMI, smoking status, alcohol consumption, pro-
portion of energy originating from fat, proportion of
energy origination from protein, and proportion of energy
originating from carbohydrates and proportion of carbo-
hydrates originating from added sugar. Based on each
of the variables, the total cohort of 292 was divided into
quintiles of 58 individuals, and the top quintile was com-
pared to the bottom quintile. In addition, the cohort
was split into two subgroups according to gender, es-
tablishing a subgroup of males (n�126) and females
(n�166). Each gender subgroup was split into quintiles
(males: n�25, females: n�33), and based on the same
parameters, the top quintile was compared to the bottom
quintile separately by gender. The subgroup of smokers
(n�21) was compared to the subgroup of non-smokers
(n�271). The 12 municipalities were ranked socioecono-
mically from 1 to 12 based on each of the 4 socioeconomic
parameters and the values added up. A total of 133
participants from 5 municipalities constituted a subgroup
of high socioeconomic status (16�19 points) that was
compared to a subgroup of 159 participants from 7 munici-
palities with low socioeconomic status (26�44 points)
(Fig. 1).
Statistical analysis
Differences in hybridization patterns were analyzed using
the Mann�Whitney test, and differences in data between
groups were compared with unpaired t-test. For these
analyses, a p-value B0.05 was considered statistically sig-
nificant. Comparison of quintiles using frequency and
levels (mean HOMIM-value) at taxon/cluster level as
parameters of investigation was carried out using a
Mann�Whitney test with Benjamini�Hochberg’s correc-
tion for multiple comparisons (32). For these analyses, an
adjusted p-value B0.01 was considered statistically sig-
nificant. Principal component analysis was used for
visualization through data reduction of patterns in this
n-dimensional dataset. Graph Pad prism 5 (San Diego,
CA) and MeV 4.8.1 (33) were used as statistical software.
Results
Population characteristics
Population characteristics are presented in Table 1. For
each parameter presented in Table 1, the highest and
the lowest quintile were highly significantly different
(pB0.0001).
General findings
In 292 samples from participants with low levels of oral
diseases, we observed positive identification for targets
of 131 probes. The number of hits per sample was
24.6199.3 (mean9SD). Sixty-six percent of the targets
identified were present in �1% of the samples, while 42%
were identified in �5% of the samples. A total of 6 bac-
terial phyla were identified (Firmicutes, Proteobacteria,
Bacteroidetes, Actinobacteria, Fusobacteria, and TM7).
Firmicutes was the predominant phylum present, repre-
senting approximately 50% of the total probe signal,
followed by Proteobacteria and Bacteroidetes, each of
which accounted for approximately 17% of the targets
present. No statistical differences were found in number
of targets identified, mean probes per sample, or phylo-
genetic distribution between subgroups divided on the
basis of the parameters investigated (data not shown).
A complete list of targets identified is presented in the
Supplementary file. The predominant bacterial profile
(taxa/clusters identified in �50% of the samples) was
dominated by taxa/clusters traditionally associated with
oral health representing the genera Streptococcus and
Veillonella. In general, the targets most frequently iden-
tified were also those present at the highest levels
(mean HOMIM-value). Putative periodontal pathogens
such as Porphyromonas gingivalis, Aggregatibacter actino-
mycetemcomitans, and Prevotella intermedia and sug-
gested cariogenic bacteria such as Streptococcus mutans
and Lactobacillus species were all found in B4% of the
samples.
Daniel Belstrøm et al.
4(page number not for citation purpose)
Citation: Journal of Oral Microbiology 2014, 6: 23609 - http://dx.doi.org/10.3402/jom.v6.23609
Differences between subgroups at bacterial
taxon/cluster level
By comparison of the parameters, that is, age, gender,
BMI, alcohol consumption, proportion of energy origi-
nating from fat, proportion of energy origination from
protein, and proportion of energy originating from car-
bohydrates and proportion of carbohydrates originating
from added sugar separately, no statistical difference in
presence or levels (mean HOMIM-value) of any taxon/
cluster was observed (adjusted p-values�0.01) between
the top and bottom quintile of the cohort. Based on the
same parameters, no statistical difference in presence or
levels of any taxon/cluster was observed when analyz-
ing each gender separately by comparison of the top
and bottom quintile of each gender subgroup (adjusted
p-values�0.01).
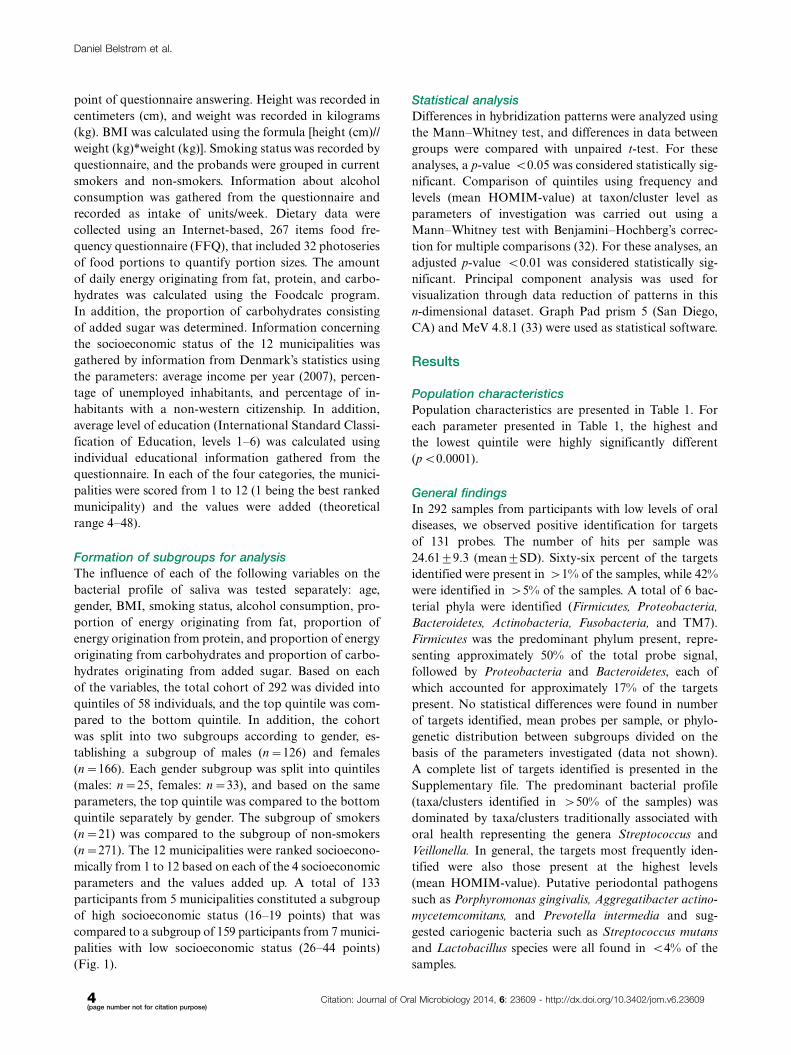
Comparison of smokers (n�21) with non-smokers
(n�271) revealed that 2 bacterial taxa (Streptococcus
sobrinus and Eubacterium[11][G-3] brachy) were identified
at higher levels in smokers than in non-smokers (adjusted
p-valueB0.01). Principal component analysis displayed
clustering of the 21 samples from smokers combined with
a random distribution of the samples from non-smokers
(Fig. 2). In addition current smokers (n�21) and never-
smokers (n�148) were compared, and the same bacterial
taxa (S. sobrinus and Eubacterium[11][G-3] brachy) were
found to be associated with current smokers, when com-
pared to never-smokers. Finally, former-smokers (n�123)
were compared against never-smokers, and no statistical
differences were observed between these groups (data not
shown).
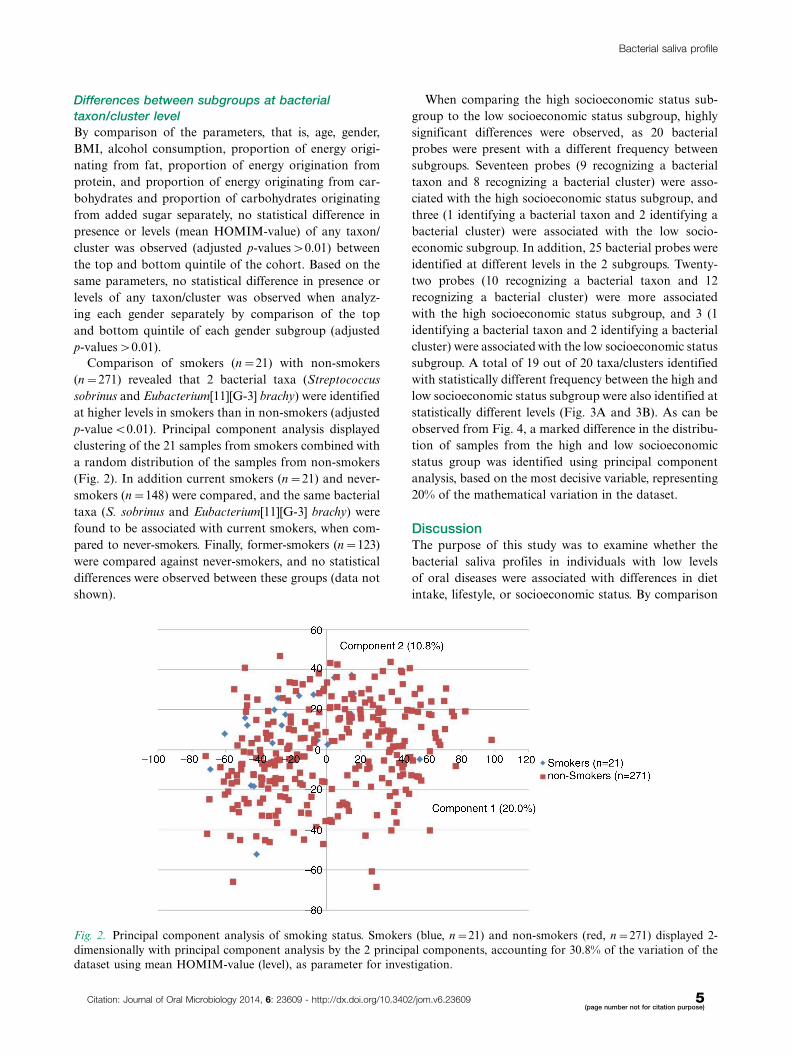
When comparing the high socioeconomic status sub-
group to the low socioeconomic status subgroup, highly
significant differences were observed, as 20 bacterial
probes were present with a different frequency between
subgroups. Seventeen probes (9 recognizing a bacterial
taxon and 8 recognizing a bacterial cluster) were asso-
ciated with the high socioeconomic status subgroup, and
three (1 identifying a bacterial taxon and 2 identifying a
bacterial cluster) were associated with the low socio-
economic subgroup. In addition, 25 bacterial probes were
identified at different levels in the 2 subgroups. Twenty-
two probes (10 recognizing a bacterial taxon and 12
recognizing a bacterial cluster) were more associated
with the high socioeconomic status subgroup, and 3 (1
identifying a bacterial taxon and 2 identifying a bacterial
cluster) were associated with the low socioeconomic status
subgroup. A total of 19 out of 20 taxa/clusters identified
with statistically different frequency between the high and
low socioeconomic status subgroup were also identified at
statistically different levels (Fig. 3A and 3B). As can be
observed from Fig. 4, a marked difference in the distribu-
tion of samples from the high and low socioeconomic
status group was identified using principal component
analysis, based on the most decisive variable, representing
20% of the mathematical variation in the dataset.
DiscussionThe purpose of this study was to examine whether the
bacterial saliva profiles in individuals with low levels
of oral diseases were associated with differences in diet
intake, lifestyle, or socioeconomic status. By comparison
Fig. 2. Principal component analysis of smoking status. Smokers (blue, n�21) and non-smokers (red, n�271) displayed 2-
dimensionally with principal component analysis by the 2 principal components, accounting for 30.8% of the variation of the
dataset using mean HOMIM-value (level), as parameter for investigation.
Bacterial saliva profile
Citation: Journal of Oral Microbiology 2014, 6: 23609 - http://dx.doi.org/10.3402/jom.v6.23609 5(page number not for citation purpose)
of high-throughput data collected using the HOMIM with
available data from the DANHES, we were able to show
that the bacterial saliva profile associated with low levels
of oral diseases was independent of diet intake, but in-
fluenced by smoking and socioeconomic status. To the
best of our knowledge, this is the first study to combine
high-throughput microbiologic information with compre-
hensive data, characterizing the composition of the
bacterial profile of saliva in individuals with low levels of
oral diseases.
The bacterial profile described in this study was, in spite
of high diversity, largely dominated by the phylum of
Firmicutes, expressed by a massive probe signal represent-
ing Streptococcus and Veillonella species. These findings
are in line with studies using 16S rRNA pyrosequencing of
saliva samples showing that the microbial profile of saliva
in oral health resembles the profiles found on the tongue,
the tonsils, and the throat and is characterized by high
numbers of Firmicutes (25�27). Using molecular methods,
putative periodontal pathogens such as P. gingivalis and
Fig. 3. Differences at taxon/cluster level by socioeconomic status. A. The 20 statistically significant probes are presented based
on presence (%) of total amount of samples in the high and low socioeconomic status subgroup, respectively. Black bars: low
socioeconomic status subgroup. White bars: high socioeconomic status subgroup. *Adjusted p-value B0.01, **adjusted
p-value B0.001, ***adjusted p-value B1.0�10�4, ****adjusted p-value B1.0�10�6. B. Levels (mean HOMIM-value) of
the 25 statistically significant probes are visualized based on means of HOMIM-value in samples from the high and
low socioeconomic status subgroup. Black bars: low socioeconomic status subgroup. White bars: high socioeconomic
status subgroup. *Adjusted p-value B0.01, **adjusted p-value B0.001, ***adjusted p-value B1.0�10�5, ****adjusted
p-value B1.0�10�12.
Daniel Belstrøm et al.
6(page number not for citation purpose)
Citation: Journal of Oral Microbiology 2014, 6: 23609 - http://dx.doi.org/10.3402/jom.v6.23609
A. actinomycetemcomitans have been identified to be
associated with saliva samples from patients with period-
ontitis (34) and S. mutans with samples from carious
lesions (35). Interestingly, these bacteria were only found
sporadically in this cohort, indicating that saliva is not
a major reservoir of putative oral pathogens in individuals
with low levels of dental caries and periodontitis.
One possible limitation of this study was that samples
were not collected at the same time of the day. As studies
have shown that the oral microbiome might vary con-
siderably over time because of food consumption and
mental and physical stress (36), it cannot be excluded that
some of the differences observed might result from diurnal
variation in sample collection. In addition, it is important
to emphasize that the microarray technique used only
provides information of bacterial taxa/clusters with a
corresponding probe present on the microarray. There-
fore, only parts of the complex saliva bacterial profile were
visualized using this technique. Moreover, with a probe
length of 18�20 bases, it is not possible to detect all
bacteria at species level. As a consequence, some taxa are
targeted using cluster probes recognizing 2 or more closely
related bacterial taxa, which is why some detail may
be lost.
It is highly interesting that the bacterial profile of saliva
appears not to be influenced by diet. Based on different
carbohydrate fermentation abilities, aciduric and acido-
genic oral streptococci, for example, S. mutans, are be-
lieved to play an essential role in caries development (37).
However, according to our data, the amount of carbohy-
drate intake had no influence on the presence of such
bacteria in saliva. As frequency of sugar intake is an
important risk factor for caries development (11), it is
however possible that the bacterial profile of saliva might
be influenced by frequency of sugar intake rather than the
amount of sugar consumed, but no information about
frequency of sugar intake was included in this study. High
levels of BMI have been described to be associated with
high occurrence of caries lesions (8), and intake of high
amounts of alcohol has been suggested as a risk factor
for periodontitis (14), as well as protective against period-
ontitis (13). In the population examined in this study,
these parameters had no influence on the bacterial saliva
profile, even when the upper and lower quintiles were
compared. These findings suggest that the bacterial
profile of saliva is, in general, not associated with the
mechanism linking different lifestyle factors with major
oral diseases. However, the value of these results might be
limited by a problem often encountered in epidemiologi-
cal research: individuals participating in medical studies
tend to be healthier than the general population, as
visualized by the small percentage of current smokers
in this group (7.2%), compared to the background Danish
population (22%). This may limit the variability, and
hence the chance to find significant associations. This may
also compromise the generalizability of the conclusions
drawn to general population subsets. Furthermore, in
this study quintiles were chosen for comparison of the
Fig. 4. Principal component analysis of socioeconomic status. The subgroup with high socioeconomic status (blue, n�133) and
the subgroup with low socioeconomic status (red, n�159) visualized 2-dimensionally by principal component analysis, with
axes expressing the 2 most crucial components accounting for 30.8% of the total variation of the dataset.
Bacterial saliva profile
Citation: Journal of Oral Microbiology 2014, 6: 23609 - http://dx.doi.org/10.3402/jom.v6.23609 7(page number not for citation purpose)
most extreme ends of the cohort based on each para-
meter investigated. The advantage with this approach
was accomplishment of major differences between the
subgroups analyzed. However, as this strategy resulted
in relatively small subgroups, there was risk of loss of
statistical power, theoretically masking some of the
associations investigated.
In this study, the bacterial taxa S. sobrinus and
Eubacterium[11][G-3] brachy were found to be associated
with saliva samples from smokers when compared to a
group of non-smokers and never-smokers, respectively.
As discussed in a recent review of the literature (38),
a possible association between smoking and alterations
of the subgingival bacterial profile remains controversial.
Thus, even though our data suggest that smoking is asso-
ciated with a different bacterial profile of saliva than the
one observed in non-smokers, this needs to be addressed
in future studies.
Our results suggest that the bacterial profile of saliva is
influenced by socioeconomic status. Thus, when dividing
the cohort into subgroups of high and low socioeconomic
status, 20 and 25 probes differed significantly between
subgroups based on presence and levels (mean HOMIM-
value), receptively (Fig. 3A and 3B). As can be observed
from Fig. 4, the 2 subgroups clustered almost completely
separately based on the principal component, expressing
20% of the total variation of the dataset. This finding is in
accordance with other studies suggesting that differences
of the salivary microbiome observed in various geo-
graphic locations might be explained by different lifestyle
and socioeconomic profiles between populations (25, 27).
It is noteworthy that the differences observed at taxon/
cluster level affected probes targeting bacterial taxa
as Veillonella parvula and Veillonella atypica and clusters
as Streptococcus parasanguinis, all being part of the
predominant commensal bacterial profile of saliva. In
this study, we used general information about the muni-
cipalities from Denmark’s statistics concerning the para-
meters: average income a year, percentage of unemployed
inhabitants, and percentage of inhabitants with a non-
western citizenship, in combination with average level
of education (International Standard Classification of
Education, levels 1�6), calculated from individually based
information. As the socioeconomic variable was mostly
constructed using general municipality based informa-
tion, there is a risk that this variable was not fully repre-
sentative of the actual individuals participating in the
study, questioning extrapolation of the results obtained.
In conclusion, with the limitations mentioned above,
this study suggests that the bacterial saliva profile in
individuals with low levels of oral diseases is not influ-
enced by diet. Conversely, smoking and possibly socio-
economic status seem to affect the bacterial profile of
saliva. Prospective studies may reveal if bacterial profiles
of saliva can be used as biomarkers of health and disease.
Acknowledgements
The authors wish to thank the National Institute of Public Health,
University of Southern Denmark, Copenhagen, Denmark, for con-
ducting the DANHES, Dr. Lisa B. Christensen for her assistance
analyzing socioeconomic parameters, Dr. Mogens Kilian for his
help interpreting microbiological data, and Sean Cotton, Alexis
Kokaras, and Christina Murphy from the Forsyth Institute for
laboratory assistance.
Conflict of interest and fundingThe authors declare no conflicts of interest in this study.
This study was supported by external financial support
from the following: the Danish Dental Association, the
Danish Foundation for Mutual Efforts in Dental Care,
TrygFonden, the Health Insurance Foundation, and the
Simon Spies Foundation.
References
1. Aas JA, Paster BJ, Stokes LN, Olsen I, Dewhirst FE. Defining
the normal bacterial flora of the oral cavity. J Clin Microbiol
2005; 43: 5721�32.
2. Paster BJ, Boches SK, Galvin JL, Ericson RE, Lau CN,
Levanos VA, et al. Bacterial diversity in human subgingival
plaque. J Bacteriol 2001; 183: 3770�83.
3. Jenkinson HF, Lamont RJ. Oral microbial communities in
sickness and in health. Trends Microbiol 2005; 13: 589�95.
4. Dewhirst FE, Chen T, Izard J, Paster BJ, Tanner AC, Yu
WH, et al. The human oral microbiome. J Bacteriol 2010; 192:
5002�17.
5. Bik EM, Long CD, Armitage GC, Loomer P, Emerson J,
Mongodin EF, et al. Bacterial diversity in the oral cavity of 10
healthy individuals. ISME J 2010; 4: 962�74.
6. Colombo AP, Boches SK, Cotton SL, Goodson JM, Kent
R, Haffajee AD, et al. Comparisons of subgingival microbial
profiles of refractory periodontitis, severe periodontitis, and
periodontal health using the human oral microbe identification
microarray. J Periodontol 2009; 80: 1421�32.
7. Tanner AC, Sonis AL, Lif Holgerson P, Starr JR, Nunez Y,
Kressirer CA, et al. White-spot lesions and gingivitis micro-
biotas in orthodontic patients. J Dent Res 2012; 91: 853�8.
8. Cinar AB, Christensen LB, Hede B. Clustering of obesity and
dental caries with lifestyle factors among Danish adolescents.
Oral Health Prev Dent 2011; 9: 123�30.
9. Suvan J, Petrie A, Moles DR, Nibali L, Patel K, Darbar U,
et al. Body mass index as a predictive factor of periodontal
therapy outcomes. J Dent Res 2014; 93: 49�54.
10. Saxlin T, Ylostalo P, Suominen-Taipale L, Mannisto S,
Knuuttila M. Association between periodontal infection and
obesity: results of the Health 2000 Survey. J Clin Periodontol
2011; 38: 236�42.
11. Anderson CA, Curzon ME, Van LC, Tatsi C, Duggal MS.
Sucrose and dental caries: a review of the evidence. Obes Rev
2009; 10(Suppl 1): 41�54.
12. Van Dyke TE, Sheilesh D. Risk factors for periodontitis. J Int
Acad Periodontol 2005; 7: 3�7.
13. Kongstad J, Hvidtfeldt UA, Gronbaek M, Jontell M, Stoltze K,
Holmstrup P. Amount and type of alcohol and periodontitis in
the Copenhagen City Heart Study. J Clin Periodontol 2008; 35:
1032�9.
14. Tezal M, Grossi SG, Ho AW, Genco RJ. Alcohol consumption
and periodontal disease. The Third National Health and
Daniel Belstrøm et al.
8(page number not for citation purpose)
Citation: Journal of Oral Microbiology 2014, 6: 23609 - http://dx.doi.org/10.3402/jom.v6.23609
Nutrition Examination Survey. J Clin Periodontol 2004; 31:
484�8.
15. Borrell LN, Crawford ND. Socioeconomic position indicators
and periodontitis: examining the evidence. Periodontol 2000
2012; 58: 69�83.
16. Buchwald S, Kocher T, Biffar R, Harb A, Holtfreter B, Meisel
P. Tooth loss and periodontitis by socio-economic status and
inflammation in a longitudinal population-based study. J Clin
Periodontol 2013; 40: 203�11.
17. Ekback G, Persson C. Caries in five different socio-economic
clusters in Orebro county. Community Dent Health 2012; 29:
229�32.
18. Pieper K, Dressler S, Heinzel-Gutenbrunner M, Neuhauser A,
Krecker M, Wunderlich K, et al. The influence of social status
on pre-school children’s eating habits, caries experience and
caries prevention behavior. Int J Public Health 2012; 57: 207�15.
19. Lee YH, Wong DT. Saliva: an emerging biofluid for early
detection of diseases. Am J Dent 2009; 22: 241�8.
20. Giannobile WV, McDevitt JT, Niedbala RS, Malamud D.
Translational and clinical applications of salivary diagnostics.
Adv Dent Res 2011; 23: 375�80.
21. Rathnayake N, Akerman S, Klinge B, Lundegren N, Jansson H,
Tryselius Y, et al. Salivary biomarkers of oral health: a cross-
sectional study. J Clin Periodontol 2013; 40: 140�7.
22. Rathnayake N, Akerman S, Klinge B, Lundegren N, Jansson H,
Tryselius Y, et al. Salivary biomarkers for detection of systemic
diseases. PLoS One 2013; 8: e61356.
23. Crielaard W, Zaura E, Schuller AA, Huse SM, Montijn RC,
Keijser BJ. Exploring the oral microbiota of children at various
developmental stages of their dentition in the relation to their
oral health. BMC Med Genomics 2011; 4: 22.
24. Cephas KD, Kim J, Mathai RA, Barry KA, Dowd SE, Meline
BS, et al. Comparative analysis of salivary bacterial microbiome
diversity in edentulous infants and their mothers or primary
care givers using pyrosequencing. PLoS One 2011; 6: e23503.
25. Nasidze I, Li J, Quinque D, Tang K, Stoneking M. Global
diversity in the human salivary microbiome. Genome Res 2009;
19: 636�43.
26. Segata N, Haake SK, Mannon P, Lemon KP, Waldron L,
Gevers D, et al. Composition of the adult digestive tract
bacterial microbiome based on seven mouth surfaces, tonsils,
throat and stool samples. Genome Biol 2012; 13: R42.
27. Nasidze I, Li J, Schroeder R, Creasey JL, Li M, Stoneking M.
High diversity of the saliva microbiome in Batwa Pygmies. PLoS
One 2011; 6: e23352.
28. Belstrøm D, Fiehn N-E, Nielsen CH, Kirkby N, Twetman S,
Klepac-Ceraj V, et al. Differences in bacterial saliva profile
between periodontitis patients and a control cohort. J Clin
Periodontol 2014; 41: 104�12.
29. Belstrøm D, Fiehn N-E, Nielsen CH, Holmstrup P, Kirkby N,
Klepac-Ceraj V, et al. Altered bacterial profiles in saliva from
adults with caries lesions: a case-cohort study. Caries Res 2014;
48: 368�75.
30. Eriksen L, Gronbaek M, Helge JW, Tolstrup JS, Curtis T.
The Danish Health Examination Survey 2007�2008 (DANHES
2007�2008). Scand J Public Health 2011; 39: 203�11.
31. Kongstad J, Ekstrand K, Qvist V, Christensen LB, Cortsen B,
Grønbæk M, et al. Findings from the oral health study of the
Danish Health Examination Survey 2007�2008. Acta Odontol
Scand 2013; 71: 1560�9.
32. Hochberg Y, Benjamini Y. More powerful procedures for
multiple significance testing. Stat Med 1990; 9: 811�8.
33. Saeed AI, Bhagabati NK, Braisted JC, Liang W, Sharov V,
Howe EA, et al. TM4 microarray software suite. Methods
Enzymol 2006; 411: 134�93.
34. Paju S, Pussinen PJ, Suominen-Taipale L, Hyvonen M,
Knuuttila M, Kononen E. Detection of multiple pathogenic
species in saliva is associated with periodontal infection in
adults. J Clin Microbiol 2009; 47: 235�8.
35. Torlakovic L, Klepac-Ceraj V, Ogaard B, Cotton SL, Paster BJ,
Olsen I. Microbial community succession on developing lesions
on human enamel. J Oral Microbiol 2012; 4: 1�7.36. Wade WG. The oral microbiome in health and disease.
Pharmacol Res 2013; 69: 137�43.
37. Tanzer JM, Thompson A, Sharma K, Vickerman MM, Haase
EM, Scannapieco FA. Streptococcus mutans out-competes
Streptococcus gordonii in vivo. J Dent Res 2012; 91: 513�19.
38. Johannsen A, Susin C, Gustafsson A. Smoking and inflamma-
tion: evidence for a synergistic role in chronic disease. Period-
ontol 2000 2014; 64: 111�26.
Bacterial saliva profile
Citation: Journal of Oral Microbiology 2014, 6: 23609 - http://dx.doi.org/10.3402/jom.v6.23609 9(page number not for citation purpose)