Physical Activity and Psychosocial Correlates in Normal Weight and Overweight 11 to 19 Year Olds**
Upload
westscotlandCategory
view
0download
0
Clinical Endocrinology (2002)
57
, 793–803
© 2002 Blackwell Publishing Ltd
793
Blackwell Science, Ltd
IGF-I in a normal population: relation to psychosocial factors
Anna-Lena Unden*, Stig Elofsson†, Sarah Knox‡, Moira S. Lewitt§ and Kerstin Brismar§
*
Research Center in General Medicine, Karolinska Hospital,
†
Institution for Social Work, University of Stockholm, Sweden,
‡
Division of Epidemiology and Clinical Application, National Heart, Lung, and Blood Institute, Bethesda, MD, USA,
§
Department Molecular Medicine, Endocrine and Diabetes Unit, Karolinska, Institute, Stockholm, Sweden
(Received 6 December 2001; returned for revision 11 January 2002; finally revised 22 April 2002; accepted 15 August 2002)
Summary
OBJECTIVE
IGF-I has important actions on cell divi-sion, apoptosis, differentiation and metabolism, aswell as on cell proliferation in vascular smooth muscle.Deficiency of GH, an important regulator of IGF-I, isassociated with reduced well-being. IGF-I levels havebeen related to cognitive function in older individuals. Theaim of the present study was to investigate the IGF-Iconcentrations in a normal population of men andwomen aged 20–74 years and to determine the influenceof a variety of behavioural and psychosocial factors aswell as metabolic factors on these concentrations.
DESIGN
Cross-sectional study.
PATIENTS
The study group consisted of 408 randomlyselected people who had answered a questionnaireconcerning health care utilization and quality of lifethat was administered to a random sample of 4200people over age 17 from the northwestern region ofgreater Stockholm in 1995. Thirty-four men and 34 womenwere randomly selected from the age group 20–24and from each 10-year age group between the ages of25–75 years. Seventy-one per cent of the 408 peopleinvited to come in for an examination agreed to attend,making a total sample size of 288 people.
MEASUREMENTS
A medical examination was per-formed and blood drawn in the morning after subjects
had been fasting overnight. Before the examination,they were asked to fill out a questionnaire concerninglifestyle and psychosocial factors.
RESULTS
The distribution of IGF-I was positivelyskewed, but using logarithmically transformed IGF-I,a more symmetrical distribution was obtained. A linearinverse correlation was found between logarithmicallytransformed IGF-I levels and age which explained morethan 40% of the variation in men and women. Linearcorrelation analysis between IGF-I and different para-meters of health and disease, lifestyle and psychosocialfactors, resulted in several significant correlationsmost of which disappeared after controlling for age.In the younger age group (20–44) there were positivecorrelations between IGF-I and psychosocial factorsrepresenting quality of life and psychological well-being.In the middle age group (45–59) higher IGF-I levelswere related to better physical health, higher educationand higher concentrations of lipoprotein Lp(a). In theolder age group (over 59 years) higher levels of low-density lipoprotein-cholesterol (LDL-C) and lowerlevels of SHBG were associated with higher IGF-I levels.
CONCLUSION
In a randomly selected (nondisease)population, IGF-I concentrations show a consistentdecrease with age in both men and women, accom-panied by different association patterns relevant todisease risk. Levels are related to psychosocialparameters in the younger age group and metabolicimpairment associated with increased cardiovascularrisk in the older age groups. We speculate on therelative roles of age and cohort differences in rearingconditions in determining these differences.
Insulin-like growth factor I (IGF-I) has important actions on celldivision, apoptosis, differentiation and metabolism (Langfordand Miell, 1993; Le Roith, 1997; Grimberg and Cohen, 2000).There is an age-dependent pattern for serum IGF-I concentra-tions with peak levels during puberty followed by a decline withincreasing age (Bang
et al
., 1994; Juul
et al
., 1994; Hilding
et al
.,1995; Hilding
et al
., 1999). IGF-I circulates bound to bindingproteins (IGFBPs) of which the first to be isolated and charac-terized was IGFBP-1. This binding protein has a rapid turnoverand has been shown to modulate bioavailability of free IGF-I,
Correspondence: Anna-Lena Unden, Research Centre in General Medicine, Borgmästarvillan, Karolinska Hospital, 171 76 Stockholm, Sweden. Tel: +46-851775976, Fax: +46-8317034, E-mail: [email protected]

794
A.-L. Unden et al.
© 2002 Blackwell Publishing Ltd,
Clinical Endocrinology
,
57
, 793–803
both as a transport protein from the circulation to the target organand as an inhibitor of the biological activity of IGF-I (Brismar
et al
., 1995; Lee
et al
., 1997). The production of IGF-I is depend-ent on growth hormone, nutrition and insulin, whereas its activityis regulated by IGF-binding proteins (IGFBP-1–6; Brismar
et al
.,1995; Clemmons, 1998; Grimberg and Cohen, 2000).
A study of 300 pairs of twins has shown that approximately63% of the individual differences in serum levels of IGF-I aredue to hereditary factors (Hong
et al
., 1997), while nonhereditaryfactors explain the remaining variation. From a clinical and pre-ventive perspective, it would be important to identify potentiallynonhereditary influences on IGF-I. There are a number of otherfactors reported to be related to IGF-I. Nutritional status andphysical activity are considered to be regulators (Le Roith, 1997)and significant associations between IGF-I and height, body massindex (BMI) and blood lipids have been reported (Juul
et al
., 1994;Cigolini
et al
., 1995). In a study of 97 pairs of twins, Hong
et al
.(1997) found that IGFBP-1 and glucose were significant pre-dictors for the levels of IGF-I. When IGFBP-1 was dropped fromthe regression model, insulin was found to be the only independ-ent predictor, explaining 19% of the nonhereditary variation.
IGF-I administration to humans reduces insulin and glucoselevels (Guler
et al
., 1989), enhances insulin sensitivity undercertain conditions (Hussain
et al
., 1994) and induces a fall in serumtriglycerides and total cholesterol (Guler
et al
., 1989). Previousstudies have shown that IGF-I can stimulate lipid oxidationand decrease the concentrations of total cholesterol, low-densitylipoprotein-cholesterol (LDL-C), and very-low-density lipoprotein-cholesterol (VLDL-C), although the overall impact of IGF-I onthe cardiovascular system is still controversial (Froesch
et al
., 1994;Pfeiffer and Schatz, 1995; Ren
et al
., 1999; Ruotolo
et al
., 2000).IGF-I has primarly been studied in connection with GH disorders,
diabetes and other conditions associated with insulin resistance.There is a demand for population-based reference values as abasis for the diagnosis of GH disturbance and as guidelines forGH substitution. There is also a demand for studies investigatingpotentially nonhereditary influences on IGF-I. The purpose ofthe present study was to investigate the IGF-I concentrations ina normal population of men and women aged 20–74 years andwhether IGF-I concentrations and its metabolic parameters areinfluenced by demographics, behavioural and psychosocial factors.
Methods
Participants
All residents of Sweden have an identity number which includestheir date of birth and other vital statistics. Names, addresses andidentity numbers are filed by the County Census Bureau in apopulation registery that is continuously updated. A random sampleof 4200 people over the age of 17 drawn from this registery,
covering the northwestern region of greater Stockholm, was senta questionnaire in 1995. The questionnaire targeted health careutilization, general health and quality of life. The response rate was71%. The study group comprised a random selection of 408 peoplewho answered this questionnaire and who were invited to a medicalexamination. Thirty-four men and 34 women were randomly selectedfrom the age group 20–24 and from each 10-year age group betweenthe ages of 25–75 years. Seventy-one per cent of the 408 peopleinvited agreed to attend, making a total sample size of 288 people.As the analysis of IGF-I was not part of the original protocol, analysisof IGF-I could only be executed on 274 (136 men and 138 women)of the 288 people in the study group due to a shortage of bloodsamples. The other 14 people did not differ from the study groupwith respect to demographics, physical or psychosocial factors.Two persons with outlying values of IGF-I were excluded fromthe analyses, one 30-year-old man with gout and renal calculusand a 29-year-old woman with gluten intolerance. The studywas approved by the Ethics committee of Karolinska Hospital.
Procedure
A 30-min medical examination with blood sampling was per-formed in the morning after subjects had been fasting overnight.Before the examination, they were asked to fill out a question-naire concerning demographics, health behaviours and psy-chosocial factors. Weight and height were measured and bodymass index (BMI) was calculated as weight (kg)/[height (m)]
2
.Blood pressure was measured sitting after 10 min rest. Pulmonaryfunction was measured by peak expiratory flow rate using aPeakflow meter (Vitalograph Ltd, Maids Moreton, Buckingham,UK) and registered as l/min.
Physical health
The patient’s physical health was rated on a scale from one tofive using the following definitions (Unden and Elofsson, 2001):(i) No illness, no problems, no treatment; (ii) No symptoms butunder treatment for one or more slight problems without seriousunderlying causes; (iii) Chronically ill or temporarily ill with one(or several) disease(s) that do not unduly limit (for the age)normal activities; (iv) Chronically ill with symptoms that giveonly limited reduction in age appropriate normal activities, ortemporary illness that gives the same limitations; (v) Acute orchronic illness with pronounced limitations of normal activities.
Blood samples
Total cholesterol (TC; mmol/l) and total triglyceride (mmol/l)were determined enzymatically using a modified colouroimetricmethod (Zlatkis
et al
., 1953; Fletcher, 1968). High-density lipo-protein cholesterol (HDL-C; mmol/l) was measured enzymatically

IGF-I in a normal population
795
© 2002 Blackwell Publishing Ltd,
Clinical Endocrinology
,
57
, 793–803
after dextran sulphate–magnesium precipitation. LDL-C (mmol/l) was calculated by the Friedewald equation. The ratio of TCto HDL-C was calculated. Insulin (mU/l) was analysed withthe Pharmacia (Uppsala, Sweden) Insulin RIA 100 and serumcortisol with the AutoDELFIA Cortisol kit (Wallac, Finland).Free testosterone (nmol/l) was measured by a radioimmunoassay(RIA) technique using commercial kits. SHBG (nmol/l) wasmeasured by an immunoradiometric assay technique using a SHBGassay kit (AutoDELFIA, Wallac, Finland). IGF-I (
µ
g/ l) wasdetermined by RIA after separation from IGFBPs by acid–ethanolextraction and cryoprecipitation. To minimize interference ofremaining IGFBPs, des (1–3) IGF-I was used as the radioligand(Bang
et al
., 1991). Blood was stored at
−
23
°
C and was notthawed before IGF-I was measured.
Psychosocial factors
To measure general well-being, the Gothenburg Quality of LifeInstrument (GQLI) was used (Tibblin
et al
., 1990). GQLIcomprises ratings of social well-being (home and family, housing,work situation, economy, leisure), physical well-being (vision,hearing, memory, appetite, fitness), mental well-being (endur-ance, mood, energy, self confidence, sleeping) and feelings ofbeing appreciated within and outside of the home (socialsupport). All the areas were rated on Lickert scales rangingfrom ‘very bad’ (1) to ‘excellent could not be better’ (7). Self-ratedhealth was assessed according to the same scale. Depressivesymptoms were assessed according to MADRS (Montgomeryand Åsberg, 1979). Coping was measured by a seven-item Lickertscale, high values indicated high coping (Derogatis
et al
., 1971).Educational attainment was classified according to five levels,ranging from mandatory education to university education.
Health behaviours
Alcohol was measured as total amount of alcohol consumptionper week, calculated in centilitres (Myrhed, 1974). Smoking wasmeasured by the number of cigarettes smoked per day. Physicalactivity during leisure time was estimated on a four-point scale,ranging from no activity to hard training at least three times aweek (Grimby
et al
., 1971). Nutrition was measured with a simplequestion about general perception of health consciousness: Doyou try to eat nutritional food? A four-point scale was used withthe alternative answers – seldom, occasionally, mostly and always.
The use of medication in the studied population did not differfrom that in a normal population.
Statistical methods
The distribution of IGF-I was calculated with and withoutlogtransformation (log
10
). The skewness of the distribution was
calculated as the third moment around the mean. The linearregressions of log IGF-I on age were calculated separately for menand women. Differences in study group characteristics betweengender and age group were analysed with
t
-tests and analysis ofvariance. Associations between log IGF-I and other factors werecalculated as Pearson product–moment correlations. All calcu-lations were adjusted for age. The preliminary results showedseveral significant interactions with age and indicated that theassociations with IGF-I could not be well approximated withlinear associations across the life span. Therefore the study groupwas divided into three age groups relevant from a physiologicalas well as a psychosocial perspective. Linear step-wise multipleregression analyses with log IGF-I as the dependent variable werecalculated using a step-wise regression procedure where eachstep seeks to explain the maximum amount of variance in theequation (SAS 6·04, STEPWISE/MAXR). Age was forced intothe models as the first independent variable. Only variables reach-ing significance at the 0·05 level are presented. Results arepresented as amount of variance explained (adjusted for numberof degrees of freedom), standard regression coefficients andsignificance levels, which all were calculated from an ordinarymultiple regression.
Results
IGF-I in relation to age and sex
The distribution of IGF-I was somewhat positively skewed (1·19for men and 1·26 for women). Using log-transformed values gavea better fit to the normal distribution with skewness –0·25 formen and –0·34 for women. The distribution was similar for menand women. For both men and women the IGF-I-values declinedwith age (Table 1). Even if women tended to have lower valuesthan men, the differences were not significant either in the totalgroup or in any age group.
The regression of log IGF-I-values on age were calculatedseparately for men and women. The estimated regression coefficientwere for men –0·00586 and for women –0·00630, with an inter-cept of 2·562 and 2·554, respectively. No significant differencewas found between the slopes. For all men, age explained 40%(
r
=
−
0·63) of the variation in log IGF-I and for all women 44%(
r
=
−
0·67). However, for the different age groups, age explainedless of the variation in logIGF-I (see Table 5).
Correlation analyses
We began our analyses by examining the whole group. Thepreliminary results showed several significant interactions withsex and age and indicated that the associations with IGF-I couldnot be well approximated with linear associations across the lifespan. Therefore the study group was divided into three age

796
A.-L. Unden et al.
© 2002 Blackwell Publishing Ltd,
Clinical Endocrinology
,
57
, 793–803
groups (20–44, 45–59 and 60–74 years) relevant from a phy-siological as well as a psychosocial perspective.
Descriptive characteristics of study population
Clinical characteristics
Means and standard deviations for anthro-pometric variables and psychosocial factors are presented separ-ately for men and women in the different age groups in Tables 2and 3, respectively.
T
-tests of gender differences and interactions betweengender and age can be seen in Table 3. There were no genderdifferences in BMI but the women had lower waist /hip ratio inall age groups. Women reported lower physical activity, a morenutritious diet, lower alcohol consumption but no significantdifferences in smoking compared to men. Their pulmonaryfunction was decreased compared to men and so were theirsystolic and diastolic blood pressures before the age of 60. Inboth sexes there was an increase in BMI, waist/hip ratio, systolicand diastolic blood pressure as well as a decrease in physicalactivity and pulmonary function with age. Both men andwomen showed a tendency towards worse physical health withincreasing age.
Psychosocial factors
As can be seen in Table 3, there was asignificant association between age and education in both sexes,such that younger people had higher education. With respect tomen there were several indicators that the younger age group(20–44) has a higher quality of life than the older age groups.This is demonstrated in higher mental well-being, self-esteem,social support and coping. Among women, social well-beingwas higher in the age group 40–59 than in the younger andolder groups. The women had higher depression scores than men,especially in the younger age group, and there was significantlylower coping among women than men.
Metabolic factors
Also shown in Table 3 are the age and gendercomparisons for metabolic factors. There were sex differences
in the lipid profiles, blood glucose, insulin and SHBG, but notin cortisol levels. As expected, LDL-C and triglyceride concen-trations increased with age, while HDL-C decreased. SHBGdecreased with age in the females while it increased in males.Serum cortisol decreased with age in females but not in males.In contrast, testosterone levels decreased in males concomitantwith an increase in SHBG, suggesting lower levels of freetestosterone in older age. In both sexes there was an increasewith age in lipids such as triglycerides and LDL-C suggestingincreased risk for cardiovascular diseases above the age of 59.This risk was especially marked for males, who had severalindicators of the metabolic syndrome (high concentrations ofcholesterol, triglycerides, LDL-C, glucose and SHBG, low levelsof testosterone and increased insulin resistance).
Association with IGF-I
To study environmental and other possible influences on IGF-Iconcentrations, correlation analyses were performed. In allanalyses the log
10
value of IGF-I was used. The correlations formen and women are presented separately and, because of theage-dependency the correlation analyses, were also adjustedfor age. These values can be seen in Table 4.
Many of the significant associations were confounded by ageand disappeared when age was taken into account. Total choles-terol was the only variable that was correlated to IGF-I both inmen and women after controlling for age. In men no other vari-ables except for smoking were correlated to IGF-I independentlyof age. Among women, however, another association pattern wasfound. There was a significant positive association between IGF-I and education in women such that the higher the education thehigher the IGF-I concentrations. A positive correlation betweenIGF-I and pulmonary function also remained. The significantnegative correlations between IGF-I and TC and LDL-C, respect-ively, changed to positive, when age was taken into account,most pronounced among women. Among women, a positivecorrelation between IGF-I and the TC/HDL-C ratio also appeared
Table 1 Statistical characteritics of IGF-I (µg/l) by sex
Number of persons Men Women
Men Women Age Mean SD Median Q Geometric mean Mean SD Median Q Geometric mean
24 27 20–29 270 61 260 28 264 245 55 257 39 23924 21 30–39 242 47 247 28 237 238 61 226 28 23222 22 40–49 191 37 193 29 187 191 51 186 33 19224 28 50–59 184 64 171 49 174 176 50 174 28 16840 38 60–74 159 53 151 33 150 142 47 134 28 134134 136 Total 203 67 200 49 192 194 68 190 40 182
Q, quartile deviation.

IGF-I in a normal population
797
© 2002 Blackwell Publishing Ltd,
Clinical Endocrinology
,
57
, 793–803
when age was taken into account. The negative correlationbetween IGF-I and HDL-C was the same even after controllingfor age.
To further investigate the influence of age, correlation analyseswere performed separately for the age groups 20–44, 45–59 and60–74 years. As the IGF-I concentrations did not differ betweenmen and women, the results for men and women have beenpooled in order to diminish power problems. The results canbe seen in Table 5.
Correlations of IGF-I with age differed among the threegroups, being significant only in the youngest and oldest agegroups. An interesting new finding was the significant positivecorrelations between IGF-I and factors representing psycholog-ical well-being in the age group 20–44. In this group, IGF-I waspositively correlated to social well-being, mental well-being,
self-esteem, social support (appreciation inside and outsidehome) and self-rated health. In this same group, depression wasalso inversely associated with IGF-I, such that the higher thedepression the lower the IGF-I. This group also showed a positivecorrelation between IGF-I and triglycerides and TC/HDL-Cratio. However, the correlations between IGF-I and serum lipidswas most pronounced in the age group 60–74, being significantfor TC, HDL-C, LDL-C and TC/HDL-C ratio. A new finding wasa negative correlation to SHBG in the oldest group. To controlfor confounding effects, regression analyses were performed.The results of step-wise multiple regression analyses with logIGF-I as the dependent variable are presented in Table 6.
Table 6 presents standard regression coefficients, significancelevels and amount of variance explained by the model. In the agegroup 20–44, age remained as a significant predictor together
Table 2 Descriptive characteristics in men
18–44 (n = 54) 45–59 (n = 42) 60–74 (n = 39)
Age group mean SD mean SD mean SD Sign level*
Age (years) 30·2 6·67 51·5 4·32 67·0 4·26Height (cm) 181 5·27 178 8·00 176 5·18 ¶BMI (kg/m2) 24·9 3·11 25·7 4·45 26·4 4·02 §Waist /hip 0·88 0·06 0·94 0·05 0·96 0·05 ¶Smoking 0·95 3·38 2·47 6·23 3·35 8·76 †Alcohol 106 80 84 142 96 197Nutrition 3·64 0·70 3·65 0·81 4·00 0·65 §Physical activity 2·54 0·83 1·93 0·72 2·05 0·64 ¶Systolic BP (mmHg) 131 10·9 136 13·5 146 19·8 ¶Diastolic BP (mmHg) 83 8·1 88 9·5 90 12·1 ¶Pulmonary funct. (l /min) 589 90 564 111 497 116 ¶Physical health 1·91 0·65 2·37 1·07 2·93 0·92 ¶Total Cholesterol (mmol/ l) 4·88 1·27 5·93 1·05 6·00 1·06 ¶Triglycerides (mmol/ l) 1·36 1·04 1·73 0·87 2·17 1·51 ¶HDL-C (mmol/ l) 1·14 0·30 1·26 0·37 1·22 0·28LDL-C (mmol/l) 3·13 1·01 3·89 1·03 3·93 1·05 ¶TC/HDL 4·50 1·55 5·03 1·59 5·29 1·73 §Lipoprot(a) (g/ l) 0·17 0·24 0·31 0·39 0·29 0·37Glucose (mmol/ l) 4·59 0·43 5·23 1·50 5·87 2·72 ¶Insulin (mU/l) 9·6 5·09 12·0 7·43 12·6 6·88 §Insulin/Glucose 2·07 1·04 2·34 1·47 2·26 1·13SHBG (nmol/ l) 33·7 13·8 46·3 22·4 60·7 27·5 ¶Cortisol (nmol/ l) 409 134 398 157 415 97Testosterone (nmol/ l) 20·6 6·38 18·8 7·55 17·3 7·10 §Education 3·42 1·41 2·88 1·76 2·38 1·73 §Social well-being 5·48 0·87 5·59 1·21 5·85 0·88Mental well-being 5·59 0·95 5·35 1·45 5·33 0·97Depression 3·06 2·46 3·86 4·08 3·74 4·27Self-esteem 5·73 0·97 5·49 1·36 5·50 1·06Social support 6·09 0·91 5·81 1·11 5·76 1·14 ‡Self-rated health 5·40 1·36 5·30 1·77 5·18 1·32Coping 3·45 0·46 3·33 0·49 3·30 0·45 †
*Differences between age groups tested by analysis of variance (ANOVA). †P < 0·10; ‡P < 0·05; §P ≤ 0·01; ¶P < 0·001.
798
A.-L. Unden et al.
© 2002 Blackwell Publishing Ltd,
Clinical Endocrinology
,
57
, 793–803
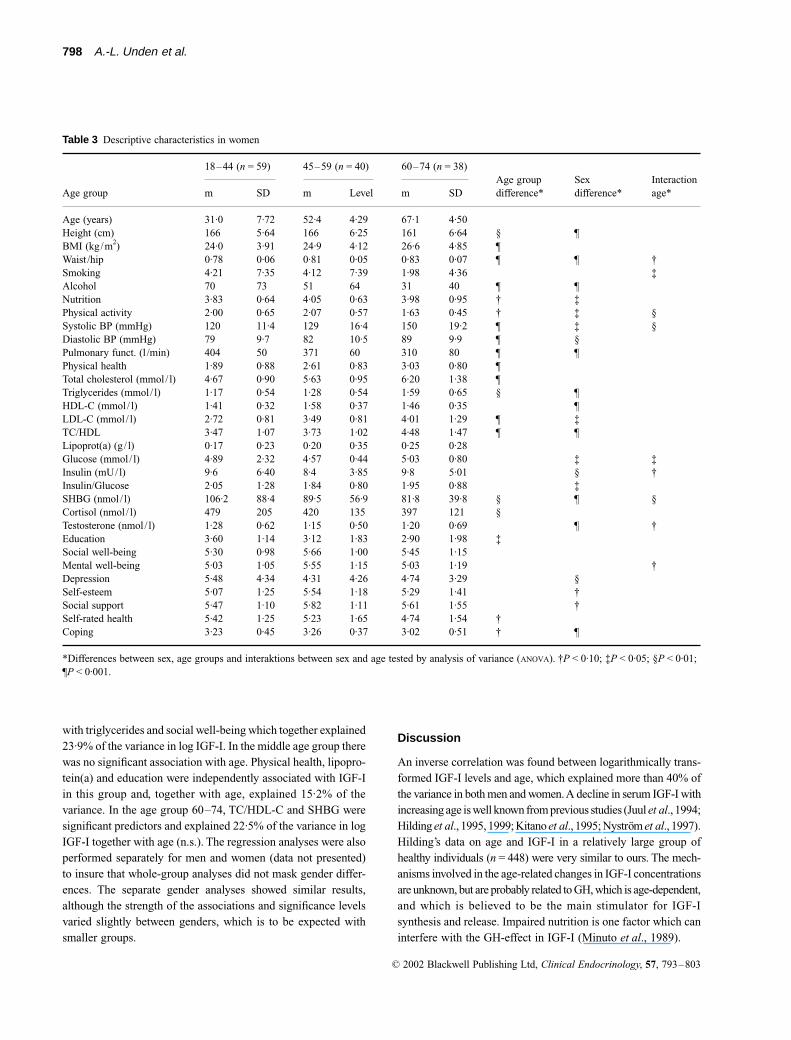
with triglycerides and social well-being which together explained23·9% of the variance in log IGF-I. In the middle age group therewas no significant association with age. Physical health, lipopro-tein(a) and education were independently associated with IGF-Iin this group and, together with age, explained 15·2% of thevariance. In the age group 60–74, TC/HDL-C and SHBG weresignificant predictors and explained 22·5% of the variance in logIGF-I together with age (n.s.). The regression analyses were alsoperformed separately for men and women (data not presented)to insure that whole-group analyses did not mask gender differ-ences. The separate gender analyses showed similar results,although the strength of the associations and significance levelsvaried slightly between genders, which is to be expected withsmaller groups.
Discussion
An inverse correlation was found between logarithmically trans-formed IGF-I levels and age, which explained more than 40% ofthe variance in both men and women. A decline in serum IGF-I withincreasing age is well known from previous studies (Juul
et al
., 1994;Hilding
et al
., 1995, 1999; Kitano
et al
., 1995; Nyström
et al
., 1997).Hilding’s data on age and IGF-I in a relatively large group ofhealthy individuals (
n
= 448) were very similar to ours. The mech-anisms involved in the age-related changes in IGF-I concentrationsare unknown, but are probably related to GH, which is age-dependent,and which is believed to be the main stimulator for IGF-Isynthesis and release. Impaired nutrition is one factor which caninterfere with the GH-effect in IGF-I (Minuto
et al
., 1989).
Table 3 Descriptive characteristics in women
18–44 (n = 59) 45–59 (n = 40) 60–74 (n = 38)Age group difference*
Sex difference*
Interaction age*Age group m SD m Level m SD
Age (years) 31·0 7·72 52·4 4·29 67·1 4·50Height (cm) 166 5·64 166 6·25 161 6·64 § ¶BMI (kg/m2) 24·0 3·91 24·9 4·12 26·6 4·85 ¶Waist /hip 0·78 0·06 0·81 0·05 0·83 0·07 ¶ ¶ †Smoking 4·21 7·35 4·12 7·39 1·98 4·36 ‡Alcohol 70 73 51 64 31 40 ¶ ¶Nutrition 3·83 0·64 4·05 0·63 3·98 0·95 † ‡Physical activity 2·00 0·65 2·07 0·57 1·63 0·45 † ‡ §Systolic BP (mmHg) 120 11·4 129 16·4 150 19·2 ¶ ‡ §Diastolic BP (mmHg) 79 9·7 82 10·5 89 9·9 ¶ §Pulmonary funct. (l /min) 404 50 371 60 310 80 ¶ ¶Physical health 1·89 0·88 2·61 0·83 3·03 0·80 ¶Total cholesterol (mmol/ l) 4·67 0·90 5·63 0·95 6·20 1·38 ¶Triglycerides (mmol/ l) 1·17 0·54 1·28 0·54 1·59 0·65 § ¶HDL-C (mmol/ l) 1·41 0·32 1·58 0·37 1·46 0·35 ¶LDL-C (mmol/ l) 2·72 0·81 3·49 0·81 4·01 1·29 ¶ ‡TC/HDL 3·47 1·07 3·73 1·02 4·48 1·47 ¶ ¶Lipoprot(a) (g/ l) 0·17 0·23 0·20 0·35 0·25 0·28Glucose (mmol/ l) 4·89 2·32 4·57 0·44 5·03 0·80 ‡ ‡Insulin (mU/l) 9·6 6·40 8·4 3·85 9·8 5·01 § †Insulin/Glucose 2·05 1·28 1·84 0·80 1·95 0·88 ‡SHBG (nmol/ l) 106·2 88·4 89·5 56·9 81·8 39·8 § ¶ §Cortisol (nmol/ l) 479 205 420 135 397 121 §Testosterone (nmol/ l) 1·28 0·62 1·15 0·50 1·20 0·69 ¶ †Education 3·60 1·14 3·12 1·83 2·90 1·98 ‡Social well-being 5·30 0·98 5·66 1·00 5·45 1·15Mental well-being 5·03 1·05 5·55 1·15 5·03 1·19 †Depression 5·48 4·34 4·31 4·26 4·74 3·29 §Self-esteem 5·07 1·25 5·54 1·18 5·29 1·41 †Social support 5·47 1·10 5·82 1·11 5·61 1·55 †Self-rated health 5·42 1·25 5·23 1·65 4·74 1·54 †Coping 3·23 0·45 3·26 0·37 3·02 0·51 † ¶
*Differences between sex, age groups and interaktions between sex and age tested by analysis of variance (ANOVA). †P < 0·10; ‡P < 0·05; §P < 0·01; ¶P < 0·001.

IGF-I in a normal population
799
© 2002 Blackwell Publishing Ltd,
Clinical Endocrinology
,
57
, 793–803
We found no significant gender differences between the slopesof the regression lines and this is also in agreement with previousresults from some studies (Juul
et al.
, 1994; Hilding
et al.
, 1995;Nystrom
et al.
, 1997), but in contrast to those presented byothers (Kitano
et al.
, 1995; Yamamoto
et al.
, 1991; Landin-Wilhelmsson and Lappas, 1994). We think that the differencesmight be explained by the fact that the latter investigators basedtheir results on smaller groups. It is also possible that errorvariance in IGF-I assays may explain some of the variation ingender differences.
There were several significant correlations between IGF-I andmetabolic, lifestyle and psychosocial factors; however, most ofthem disappeared after controlling for age. This was true forparameters in the metabolic syndrome and for physical activity
and SHBG in men. However, a positive association between totalcholesterol and IGF-I remained in both men and women. Inwomen there was also an inverse correlation between IGF-I andHDL-C.
The preliminary results showed several significant interactionswith age and indicated that the associations with IGF-I couldnot be well approximated with a linear model across the lifespan.Therefore we have decided to group the data into three agegroups relevant from a physiological as well as a psychosocialperspective. Analyses in the separate age groups are of coursenot without problems. One clear problem is that of multiplecomparisons, increasing the risk of getting significant results bychance. Thus, we cannot preclude that some of the age-specificrelations found could be simply due to chance. Another fact isthat the number of observations in the different age groupsdecrease which deteriorate the power. The results must thus beinterpreted with care and in the first hand be seen as hypothesisgenerating rather than confirmatory. Even if there is some un-reliability in our results, we, however, found them worth takinginto consideration when discussing potential correlates to IGF-I.
What is most striking about these data are the abundantpositive correlations between IGF-I and psychosocial factors inthe younger age group (20–44). Multiple regression analyseswith age forced into the model in the first step, showed that socialwell-being was as important in predicting IGF-I concentrationsas triglycerides. Together with age these variables explained 23%of the variance in IGF-I.
The fact that so many of the psychosocial factors that weresignificant in univariate analyses were not significant in themultivariate analyses can be explained by the strong correlationbetween the individual psychosocial factors, meaning that, as onecame into the equation, the other was dropped out. To our know-ledge, no other studies have examined the association betweenIGF-I and psychosocial factors in healthy humans; however, inmale baboons a positive correlation between high social statusand IGF-I concentrations has been found (Sapolsky and Spencer,1997). The authors of that study suggested that the individualdifferences in IGF-I profiles were a consequence rather than a causeof the rank differences. It is also interesting that in GH-deficientpatients with low IGF-I, mental well-being and depressionimproves during GH treatment with its accompanying increasein IGF-I levels (Rosén
et al
., 1993).Studies have shown that IGF-I concentrations can be explained
by biological factors such as growth hormone (GH) and insulinor lifestyle factors such as nutrition (Bang and Hall, 1992). Weexamined a number of anthropometric variables including lipidconcentrations and hormones. In the older age group (60–74 years of age), higher levels of LDL-C and lower levelsof SHBG were independently associated with higher IGF-I con-centrations. The positive correlation between IGF-I and totalcholesterol on the one hand and the inverse correlation between
Table 4 Product-moment correlations between log IGF-I and clinical, psychosocial, and metabolic factors by sex
Men (n = 135) Women (n = 137)
Total Control age Total Control age
Age (years) −0·63§ – −0·67§ –Height (cm) 0·29§ 0·12 0·21† 0·07BMI (kg/m2) −0·12 0·04 −0·19† −0·00Waist /hip −0·38§ −0·02 −0·28‡ 0·03Smoking −0·06 −0·26‡ 0·08 0·03Alcohol −0·04 −0·13 0·21† 0·02Nutrition −0·10 0·07 −0·08 0·04Physical activity 0·26‡ 0·06 0·04 −0·07Systolic BP −0·30§ −0·06 −0·38§ 0·03Diastolic BP −0·36§ −0·13 −0·16* 0·16Pulmonary funct. 0·24‡ −0·07 0·49§ 0·23‡Physical health −0·35§ −0·11 −0·43§ −0·14Total cholesterol −0·14 0·20† −0·26‡ 0·21†Triglycerides −0·21† −0·05 −0·09 0·13HDL-C −0·10 −0·03 −0·20† −0·20†LDL-C −0·13 0·19 −0·21‡ 0·27‡TC/HDL −0·05 0·13 −0·04 0·30§Lipoprot(a) 0·07 0·13 0·07 0·04Glucose −0·21† −0·07 0·01 −0·00Insulin −0·18† −0·00 −0·12 −0·10Insulin/Glucose −0·11 −0·03 0·08 0·05SHBG −0·43§ −0·16 0·05 −0·11Cortisol 0·10 0·05 0·14 −0·04Testosterone 0·02 −0·15 −0·06 −0·13Education 0·12 −0·01 0·26** 0·18†Social well-being −0·03 0·08 −0·08 0·02Mental well-being 0·16* 0·12 0·01 0·07Depression −0·13* −0·10 0·09 −0·05Self-esteem 0·08 0·03 −0·00 0·11Social support 0·10 −0·00 0·02 0·11Self-rated health 0·09 −0·06 0·12 0·05Coping 0·10 0·02 0·11 0·07
†P < 0·10; ‡P < 0·05; §P < 0·01; ¶P < 0·001.

800 A.-L. Unden et al.
© 2002 Blackwell Publishing Ltd, Clinical Endocrinology, 57, 793–803
IGF-I and HDL-C, on the other, disappeared in the regressionequation. This can be explained by the strong correlation betweenthe lipids. The positive correlation between lipid and IGF-I con-centrations is not seen in patients during GH replacement, in whomtotal cholesterol and LDL-C decrease as IGF-I increases (Christet al., 1999). The observed correlation between IGF-I andimpaired lipid profiles may be clinically significant in the lightof the recent report of a higher incidence of coronary stenosisin older men with higher IGF-I levels (Ruotolo et al., 2000). Aslipid concentrations are very sensitive to diet, it is possible thatsomething about the diet in the older age group causes anincrease in lipids as well as in IGF-I, which in turn may inhibitGH secretion leading to further impaired metabolism of choles-terol. Individuals in the oldest group were born before 1936, andhad the lowest childhood living standard including possiblemalnutrition during the perinatal period, which is reflected by
lower average height. Therefore some individuals in this groupmay have been primed to lower IGF-I levels and a nutritional dietlater in life may have more negative effects on lipid profiles,insulin resistance as well as on IGF-I levels. Moreover the inversecorrelation between SHBG and IGF-I in the older age maycontribute to the higher reported risk of prostate cancer in oldermen who have high IGF-I levels (Wolk et al., 1998).
The positive correlation between pulmonary function andIGF-I levels in age groups over 44 years and the independentassociation between physical health and IGF-I in the age group45–59 is not surprising in the light of other findings showinga positive correlation between IGF-I and organ functions suchas those in the heart (Spallarossa et al., 1996; Ruotolo et al., 2000)and brain (Aleman et al., 1999), as well as findings of a positiveassociation between IGF-I and bone density (Lloyd et al., 1996).Other studies have also related low IGF-I bioavailability to organ
Table 5 Product–moment correlations between log IGF-I and clinical, psychosocial, and metabolic factors with men and women combined
Age group
18–44 (n = 113) 45–59 (n = 82) 60–74 (n = 77)
Total Control age Total Control age Total Control age
Age (years) −0·36§ – −0·15 – −0·27† –Height (cm) 0·10 0·10 0·24† 0·21* 0·16 0·15BMI (kg/m2) −0·16 −0·03 0·08 0·12 −0·03 −0·05Waist /hip −0·18 −0·01 0·06 0·06 0·13 0·12Smoking −0·09 −0·10 −0·05 −0·05 −0·19 −0·19Alcohol 0·23† 0·15 −0·17 −0·18 −0·01 −0·06Nutrition −0·08 0·05 −0·07 −0·07 0·12 0·12Physical activity 0·08 −0·02 −0·05 −0·08 0·21* 0·22*Systolic BP 0·01 0·06 0·07 0·10 −0·16 −0·09Diastolic BP −0·04 0·10 0·04 0·05 −0·07 −0·02Pulmonary funct. 0·08 0·09 0·22† 0·20* 0·26† 0·20*Physical health −0·25‡ −0·16 −0·23† −0·20* −0·04 −0·07Total cholesterol −0·06 0·15 0·14 0·18 0·25† 0·24†Triglycerides 0·11 0·19† −0·03 −0·04 −0·02 −0·02HDL-C −0·04 −0·09 −0·08 −0·07 −0·35‡ −0·32‡LDL-C −0·10 0·13 0·20* 0·23† 0·29‡ 0·29†TC/HDL 0·01 0·19† 0·11 0·11 0·38§ 0·36‡Lipoprot(a) 0·00 −0·04 0·16 0·15 0·16 0·12Glucose −0·06 −0·01 −0·02 −0·01 −0·04 −0·03Insulin 0·21† −0·15 −0·03 −0·01 0·02 0·04Insulin/Glucose 0·03 0·06 0·01 0·02 −0·02 −0·01SHBG 0·00 −0·09 −0·18 −0·15 −0·35‡ −0·31‡Cortisol 0·06 −0·05 0·07 0·06 −0·00 0·00Testosterone 0·15 0·11 −0·01 −0·02 0·05 0·06Education 0·00 −0·01 0·22† 0·22* 0·01 −0·01Social well-being 0·24† 0·25† −0·08 −0·04 −0·03 −0·00Mental well-being 0·25† 0·25‡ 0·04 0·05 0·04 0·04Depression −0·15 −0·21† 0·03 0·02 −0·09 −0·09Self-esteem 0·26† 0·26‡ 0·03 0·03 −0·01 −0·03Social support 0·29‡ 0·27‡ −0·02 −0·02 0·02 −0·02Self-rated health 0·26† 0·22† 0·08 0·11 −0·13 −0·11Coping 0·19† 0·20† 0·00 −0·00 0·02 0·02
*P < 0·10; †P < 0·05; ‡P ≤ 0·01; §P < 0·01.

IGF-I in a normal population 801
© 2002 Blackwell Publishing Ltd, Clinical Endocrinology, 57, 793–803
failure (Clauson et al., 1998; Parkhouse et al., 2000). The inde-pendent association between education and IGF-I is also in linewith this as higher education in several studies is associated withbetter health.
The positive correlation between Lp(a) and IGF-I concentra-tions can be compared to similar findings in a study of healthypostmenopausal women, treated with tamoxifen and oestrogen,where circulating levels of Lp(a) and IGF-I were strongly correl-ated (Shewmon et al., 1994). Positive correlations of Lp(a) andGH have also been reported (Laron et al., 1997).
Studies investigating the association between psychosocialand physiological factors can usually be explained by twoprimary pathways; health behaviours (e.g. a psychosocial factorinfluences smoking and smoking is associated with an adversephysiological profile); and/or neuroendocrine changes related tothe physiological arousal accompanying emotions (e.g. arousalin the sympathetic and hypotalamic pituitary systems). It isdifficult to speculate about pathways or mechanisms involvedin the presented results, particularly because of the incongruousassociation pattern. The incongruity, however, could be explainedin different ways. One explanation could be that multiple somaticfactors or ill health correlated to IGF-I in the older age groupsmask the correlation between IGF-I and well-being. Anotherexplanation could be cohort diferences in rearing conditions. Theyoungest group consists of persons below 45 years, i.e. born after1950. They were reared during a period that was economicallygood in Sweden. The middle age group, 45–59 years, was bornbetween 1935 and 1950, so their childhood were influenced bythe deprivation of the second world war. Individuals in the oldestgroup were born before 1936, and had the lowest childhood livingstandard including possible malnutrition during the perinatalperiod, which is reflected by lower average height.
The present study shows a consistent decrease in IGF-I withage in both men and women, accompanied by different associa-tion patterns relevant to disease risk. In conclusion, IGF-I levelsseem to be related to psychosocial parameters in the younger agegroup and to metabolic impairment associated with increasedcardiovascular risk in the older age. The overall impression is thatsex and age differences play an important role in IGF-I associ-ation patterns. Whether the differences are dependent on age oron cohort differences in rearing conditions is difficult to know.However, we will again stress the problem with multiple com-parisons. Thus, we cannot preclude that some of the age specificrelations could be simply due to chance. As ours is one of onlya few studies examining IGF-I in a randomly selected (non-disease) population, and one of the first to analyse associationsbetween IGF-1 and psychosocial factors, we see its primarypurpose as hypothesis generating rather than establishing ‘proof’.The association between IGF-I and psychosocial variables aswell as the influence of age and sex on the association patternneed to be further investigated.Ta
ble
6S
tepw
ise
mul
tiple
reg
ress
ion
anal
yses
with
log
IG
F-I
as
the
depe
nden
t va
riab
le
20–
44 y
ears
(n
= 1
13)
45–
59 y
ears
(n
= 8
2)60
–74
yea
rs (
n =
77)
Inde
pend
ent
vari
able
sS
td C
oeff
.S
ign
leve
lIn
depe
nden
t va
riab
les
Std
Coe
ff.
Sig
n le
vel
Inde
pend
ent
vari
able
sS
td C
oeff
.S
ign
leve
l
Age
(ye
ars)
−0·4
2‡
Age
−0·1
7ns
Age
−0·1
2ns
Tri
glyc
erid
es0·
26‡
Phy
sica
l he
alth
−0·2
3*
LD
L-C
0·31
§S
ocia
l w
ell-
bein
g0·
29‡
Lip
opro
tein
(a)
0·28
*S
HB
G−0
·25
*E
duca
tion
0·24
*E
xpla
ined
var
ianc
e, a
djus
ted
R2 (
%)
23·9
15·2
22·5
*P <
0·0
5;
†P ≤
0·0
1; ‡
P <
0·0
01.

802 A.-L. Unden et al.
© 2002 Blackwell Publishing Ltd, Clinical Endocrinology, 57, 793–803
Acknowledgements
We thank Eva-Lena Olausson, Inga-Lena Wivall, Ella Wallermanand Berit Rydlander, Karolinska Hospital, for excellent technicalassistance. The study was supported by grants from MagnusBergvalls Foundation, Novo Nordic Foundations and the SwedishDiabetes Asssociation and Swedish Medical Research Councilgrant 4224, the Swedish Council for Planning and Co-ordination ofResearch and Harald and Louise Ekman’s Research Foundation.
References
Aleman, A., Verhaar, H., De Haan, E., De Vries, W., Samson, M., Drent, M.,Van der Veen, E. & Koppeschaar, H. (1999) Insulin-like growthfactor-I and cognitive function in healthy older men. Journal ofClinical Endocrinology and Metabolism, 84, 471–475.
Bang, P., Brismar, K. & Rosenfeld, R. (1994) Increased proteolysisof insuline-like growth factor-binding protein-3 (IGFBP-3) innoninsulin-dependent diabetes mellitus serum, with elevation of a29-kilodalton (kDa) glycosylated IGFBP-3 fragment contained in theapproximately 130- to 150-kDa ternary complex. Journal of ClinicalEndocrinology and Metabolism, 75, 1119–1127.
Bang, P., Eriksson, U., Sara, V., Wavall, I.-L. & Hall, K. (1991)Comparison of acid ethanol extraction and gel filtration prior to IGF-I and IGF-II radioimmunoassays: improvement of determinationsin acid athanol extracts by use of truncated IGF-I as radioligand. ActaEndocrinologica, 124, 620–629.
Bang, P. & Hall, K. (1992) Insulin-like growth factors as endocrine andparacrine hormones. In: (ed. P. Schoefield) The Insuline-Like GrowthFactors: Structure and Biological Function, pp. 151–177. OxfordUniversity Press, Oxford.
Brismar, K., Hilding, A. & Lindgren, B. (1995) Regulation of IGFBP-Iin humans. Progress in Growth Factor Research, 6, 449–456.
Christ, E., Cummings, M., Lumb, P., Crook, M., Sonkesen, P. & Russel-Jones, D. (1999) Growth hormone (GH) replacement therapy reducesserum sialic acid concentrations in adults with GH-deficiency: adouble-blind placebo-controlled study. Clinical Endocrinology, 52,173–179.
Cigolini, M.J.S., targher, G., Deslypere, J., Ellsinger, B.J.C., Cruz, A. &Bjorntorp, P. (1995) Fasting serum insulin in relation to componentsof the metabolic syndrome in European healthy men: the EuropeanFat Distribution Study. Metabolism: Clinical and Experimental, 44,35–40.
Clauson, P., Brismar, K., Hall, K. & Grill, V. (1998) Insilin-like growthfactor-I and insulin-like growth binding protein in a representativepopulation of type 2 diabetic patients in Sweden. Scandinavian Journalof Clinical Laboratory Investigations, 58, 353–360.
Clemmons, D.R. (1998) Role of insulin-like growth binding proteins incontolling IGF actions. Molecular and Cellular Endocrinology, 140,19–24.
Derogatis, L.R., Lipman, R.S., Covi, L. & Rickles, K. (1971) Neuroticsymptom dimensions. Archives of General Psychiatry, 24, 454–464.
Fletcher, M. (1968) A colorimetric method for estimating serum trigly-cerides. Clinical Chemistry Acta, 22, 393–397.
Froesch, E., Zenobi, P. & Hussain, M. (1994) Metabolic and therapeuticeffects of insulin-like growth factor. Journal of Hormone Research,42, 66–71.
Grimberg, A. & Cohen, P. (2000) Role of insulin-like growth factors andtheir binding proteins in growth control and carciogenesis. Journal ofCellular Physiology, 183, 1–9.
Grimby, G., Wilhelmsen, L., Björnstorp, P., Saltin, B. & Tibblin, G.(1971) Habitual physical activity. Aerobic power and blood lipids. In:(eds B. Pernow & B. Saltin) Muscle Metabolism During Exercise.Plenum Press, New York.
Guler, H., Schmid, C., Zapf, J. & Froesch, E. (1989) Effects of recom-binant insulin-like groth factor on insulin secretion and real functionin normal human subjects. Proceedings of the National Academy ofSciences of the USA, 86, 2868–2872.
Hilding, A., Brismar, K.D.M., Thoren, M. & Hall, K. (1995) Altered rela-tion between circulating levels of insulin-like growth factor-bindingprotein-1 and insulin in growth hormone deficient patients and insulin-dependent diabetic patients compared ti that in healthy subjects.Journal of Clinical Endocrinology and Metabolism, 80, 2646–2652.
Hilding, A., Hall, K., Wivall-Helleryd, I.-L., Sääf, M., Melin, A.-L. &Thoren, M. (1999) Serum levels of Insulin-like growth factor I in152 Patients with growth hormone Deficiency, aged 19–82 years,in relation to those in healthy subjets. Journal of Clinical Endo-crinology and Metabolism, 84, 2013–2019.
Hong, Y., Brismar, K., Hakk, K., Pedersen, N. & de Faire, U. (1997) Asso-ciation between insulin-like growth factor-1 (IGF-1), IGF-bindingprotein-1, insulin and other metabolic measures after controlling forgenetic influences: result from middle-aged and elderly monozygotictwins. Journal of Endocrinology, 153, 251–257.
Hussain, M., Schmitz, O., Mengel, A. & Al, E. (1994) Comparison ofeffects of groth hormone and insulin-like groth factor I on substrateoxidation and on insulin sensivity in groth-hormone deficient humans.Journal of Clinical Investigations, 94, 1126–1133.
Juul, A., Bang, P., Hertel, N., Main, K., Dalgård, P., Givercman, A.,Jörgensen, K., Muller, J., Hall, K. & Skakkebaeck, N. (1994) Seruminsulin-like growth fasvtor-1 (IGF-1) in 1030 healthy children,adolecents and adults; relation to age, sex, stage of puberty, testicularsize and body mass index. Journal of Clinical Endocrinology andMetabolism, 78, 144–152.
Kitano, M., Shimizu, T., Yamazaki, Y., Umezu, Y., Arakawa, Y. &Diamon, Y. (1995) Serum insulin-like growth factor-I in normalJapanese adults. Endocrine Journal, 42, 767–770.
Landin-Wilhelmsson, K. & Lappas, G. (1994) Serum insulin-like growthfactor I in a random population of men and women: relation to age,sex, smoking habits, coffee consumption and physical activity, bloodpressure and concentrations of plasma lipids, fibrinogen, parathroidhormone and osteocalcin. Clinical Endocrinology, 41, 351–357.
Langford, K. & Miell, J. (1993) The insulin-like groth factor /bindingprotein axis: pathophysiology and therapeutic manipulation. EuropeanJournal of Clinical Investigations, 3, 98–100.
Laron, Z., Wang, X., Klinger, B., Silbergeld, A. & Wilcken, D. (1997) Growthhormone increases and insulin-like growth factor-I decrases circulatinglipoprotein (a). European Journal of Endocrinology, 136, 377–381.
Le Roith, D. (1997) Insulin-like growth factors. New England Journalof Medicine, 339, 633–640.
Lee, P.D.K., Giudice, L.C., Conover, C.A. & Powell, D.R. (1997) Insulin-like growth factor binding protein-1: recent findings and new direc-tions. Proceedings of the Society of Experimental and BiologicalMedicine, 216, 319–357.
Lloyd, M., Hart, D., Nandra, D., McAlindon, T., Wheeler, M., Doyle, D.& Spector, T. (1996) Relation between insulin-like growth factor-Iconcentrations, osteoarthritis, bone density, and fractures in thegeneral population: the Chingford study. Annals of RheumaticDisease, 55, 870–874.

IGF-I in a normal population 803
© 2002 Blackwell Publishing Ltd, Clinical Endocrinology, 57, 793–803
Minuto, F., Barreca, A., Adami, G., Fortini, P., Del Mante, P., Cella, F.,Scopinaro, N. & Giordano, G. (1989) Insulin-like growth factor-Iin human malnutrition: relationship with some body composition andnutritional parameters. Journal of Pediatric Gastroenterology andNutrition, 13, 392–396.
Montgomery, S.A. & Åsberg, M. (1979) A new depression scale designedto be sensitive to change. British Journal of Psychiatry, 134, 382–389.
Myrhed, M. (1974) Alcohol consumption in relation to factors associatedwith ischemic heart disease. Academic Thesis, Karolinska Institute,Stockholm.
Nyström, F., Öhman, P., Ekman, B., Österlund, M., Karlberg, B. &Arnqvist, H. (1997) Population-based reference values for IGF-I-binding protein-1: relation with metabolic and anthropometric variables.European Journal of Endocrinology, 136, 165–172.
Parkhouse, W., Coupland, D., Li, C. & Vanderhoek, K. (2000) IGF-Ibioavailability is increased by resistance training in older women withlow bone minaral density. Mechanisms of Ageing and Development,113, 75–83.
Pfeiffer, A. & Schatz, H. (1995) Diabetic microvascular complicationsand growth factors. Experimental and Clinical Endocrinology andDiabetes, 103, 7–14.
Ren, J., Samson, W.K. & Sowerrs, J.R. (1999) Insulin-like growth factorI as a cardiac hormone: Physiological and pathophysical implicationsin heart disease. Journal of Molecular and Cellular Cardiology, 31,2049–2061.
Rosén, T., Edén, S., Larson, G., Wilhelmsen, L. & Bengtsson, B.-Å.(1993) Cardiovascular risk factors in adult patients with growthhormone deficiency. Acta Endocrinologica, 129, 195–200.
Ruotolo, G., Båvenholm, P., Brismar, K., Eféndic, S., Ericsson, C.-G.,de Faire, U., Nilsson, J. & Hamsten, A. (2000) Serum insulin-likegrowth factor-I level is independently associated with coronary artery
disease progression in young male survivors of myocardial infarction:neneficial effects of bezafibrate treatment. Journal of the AmericanCollege of Cardiology, 35, 1097–1099.
Sapolsky, R. & Spencer, M. (1997) Insulin-like growth factor I issuppressed in socially subordinate male baboons. American Journal ofPhysiology, 273, 1346–1351.
Shewmon, D., Stock, J., Rosen, C., Heiniluoma, K., Morrison, A., Doyle, E.,Ukena, T., Weale, V. & Baker, S. (1994) Taximofen and estrogenlower circulating lipoprotein (a) in healthy postmenopausal women.Arteriosclerosis and Thrombosis, 14, 1586–1593.
Spallarossa, P., Brunelli, C., Minuto, F., Caruso, D., Battistini, M.,Caponnetto, S. & Cordera, R. (1996) Insulin-like growth factor-I andangiographically documented coronary artery diseease. AmericanJournal of Cardiology, 77, 200–202.
Tibblin, G., Tibblin, B., Peciva, S., Kullman, S. & Svärdsudd, K. (1990)The Goteborg quality of life instrument: an assessment of well-beingand symptoms among men born in 1913 and 1923. Methods andvalidity. Scandinavian Journal of Primary Health Care, 1, 33–38.
Unden, A.-L. & Elofsson, S. (2001) Health from the patient’s point ofview. How does it relate to the physician’s judgement? Family Practice,18, 174–180.
Wolk, A., Mantzoros, C., Andersson, S., Bergstrom, R., Signorello, L.,Lagiou, P., Adami, H. & Trichopoulos, D. (1998) Insulin-like growthfactor 1 and prostate cancer risk: a population-based, case-controlstudy. Journal of the National Cancer Institute, 90, 911–915.
Yamamoto, H., Sohmiya, M., Oka, N. & Kato, Y. (1991) Effects of agingand sex on plasma insulin-like growth factor I (IGF-I) levels in normaladults. Acta Endocrinologica, 124, 497–500.
Zlatkis, Z., Zak, B. & Boyle, A.J. (1953) A new method for direct deter-mination of serum cholesterol. Journal of Laboratory and ClinicalMedicine, 41, 486–492.
Copyright © 2022 FDOKUMEN