An Overview of the Impacts of Land Use Land Cover Changes ...
25
land Review An Overview of the Impacts of Land Use Land Cover Changes (1980–2014) on Urban Water Security of Kolkata Subham Mukherjee *, Wiebke Bebermeier and Brigitta Schütt Department of Physical Geography, Institute of Geographical Sciences, Freie Universität Berlin, Malteserstr. 74-100, 12249 Berlin, Germany; [email protected] (W.B.); [email protected] (B.S.) * Correspondence: [email protected]; Tel.: +49-17622589370 Received: 13 June 2018; Accepted: 27 July 2018; Published: 30 July 2018 Abstract: Urban Water Security is essential in urban planning to manage cities’ water infrastructures and strengthen their water stress resilience and adaptive capacities. Decision making, governance and socio-economic factors play important roles in achieving Urban Water Security. Kolkata is a growing megacity in a developing country, which is facing rising pressures on water-environmental provisions due to the rapid population growth and urbanization and resultant governance and infrastructural issues. This review focusses on Kolkata, which is facing critical water issues, as a case study. The study presents an overview of the urban water (in)security and its dimensions in Kolkata city, such as water consumption and distribution in the city along with the changing land use-land cover of the city area, based on the results obtained from the satellite data-based land use-land cover classification, available literature, and documents from public institutions. Keywords: population growth; land use-land cover; image classification; change detection; water security 1. Introduction Urbanization is a human-induced process and results in land use-land cover (LULC) change and concurrent alteration of the quantity and quality of surface and groundwater resources especially in the peri-urban areas [1,2]. Land use is a combined result of human activities and natural factors. Land cover, on the other hand, is either natural or the effects of land use changes due to, especially, human activities [3,4]. Changing societal needs and priorities come along with the growing number of people and housing densities [2,5] and in turn affect the environment [1]. Unplanned urbanization results in sprawled regions within and outside of the city centers; these areas usually lack basic infrastructure such as treated water supply, sanitation, and electricity [5,6]. In consequence, the resulting water insecurity in the urban and peri-urban areas is either triggered directly by population increase, demand-supply problems, problems regarding surface water bodies and availability, problems in slums regarding sanitation and hygiene or indirectly by the environmental risk related issues (such as floods) and preconditions (such as shrinkages of surface water bodies, impervious surface effect on groundwater recharge, and urban heat islands) [7]. “Water Security” is a conceptualized term, which ensures every citizen with the amount of quality water required for his or her everyday life [8]. There is no universal definition (neither measurement index) of Water Security as it varies with approaches and perceived with a different set of goals it deals with. There is, rather, a range of published definitions of water security by different government, non-government agencies, and scholars to date. Every definition is different from each other, but there are a few common factors that integrate all of them. These are the goals that drive the approach to Land 2018, 7, 91; doi:10.3390/land7030091 www.mdpi.com/journal/land
-
Upload
khangminh22 -
Category
Documents
-
view
3 -
download
0
Transcript of An Overview of the Impacts of Land Use Land Cover Changes ...

land
Review
An Overview of the Impacts of Land Use LandCover Changes (1980–2014) on Urban WaterSecurity of Kolkata
Subham Mukherjee *, Wiebke Bebermeier and Brigitta Schütt
Department of Physical Geography, Institute of Geographical Sciences, Freie Universität Berlin, Malteserstr.74-100, 12249 Berlin, Germany; [email protected] (W.B.); [email protected] (B.S.)* Correspondence: [email protected]; Tel.: +49-17622589370
Received: 13 June 2018; Accepted: 27 July 2018; Published: 30 July 2018�����������������
Abstract: Urban Water Security is essential in urban planning to manage cities’ water infrastructuresand strengthen their water stress resilience and adaptive capacities. Decision making, governance andsocio-economic factors play important roles in achieving Urban Water Security. Kolkata is a growingmegacity in a developing country, which is facing rising pressures on water-environmental provisionsdue to the rapid population growth and urbanization and resultant governance and infrastructuralissues. This review focusses on Kolkata, which is facing critical water issues, as a case study. Thestudy presents an overview of the urban water (in)security and its dimensions in Kolkata city, suchas water consumption and distribution in the city along with the changing land use-land cover of thecity area, based on the results obtained from the satellite data-based land use-land cover classification,available literature, and documents from public institutions.
Keywords: population growth; land use-land cover; image classification; change detection;water security
1. Introduction
Urbanization is a human-induced process and results in land use-land cover (LULC) change andconcurrent alteration of the quantity and quality of surface and groundwater resources especially inthe peri-urban areas [1,2]. Land use is a combined result of human activities and natural factors. Landcover, on the other hand, is either natural or the effects of land use changes due to, especially, humanactivities [3,4]. Changing societal needs and priorities come along with the growing number of peopleand housing densities [2,5] and in turn affect the environment [1]. Unplanned urbanization results insprawled regions within and outside of the city centers; these areas usually lack basic infrastructuresuch as treated water supply, sanitation, and electricity [5,6]. In consequence, the resulting waterinsecurity in the urban and peri-urban areas is either triggered directly by population increase,demand-supply problems, problems regarding surface water bodies and availability, problems inslums regarding sanitation and hygiene or indirectly by the environmental risk related issues (such asfloods) and preconditions (such as shrinkages of surface water bodies, impervious surface effect ongroundwater recharge, and urban heat islands) [7].
“Water Security” is a conceptualized term, which ensures every citizen with the amount of qualitywater required for his or her everyday life [8]. There is no universal definition (neither measurementindex) of Water Security as it varies with approaches and perceived with a different set of goals itdeals with. There is, rather, a range of published definitions of water security by different government,non-government agencies, and scholars to date. Every definition is different from each other, but thereare a few common factors that integrate all of them. These are the goals that drive the approach to
Land 2018, 7, 91; doi:10.3390/land7030091 www.mdpi.com/journal/land

Land 2018, 7, 91 2 of 25
reach water security in a region. The concept of urban water security emphasizes the availability andaccessibility of safe and enough water without harming the sustainability of ecosystems, focusing onreducing the probability or risk of ecological disaster caused by human-induced stresses. Therefore, inthis article we adapted the Sustainable Development Goal 6, which refers to clean, accessible waterfor all; however, the right to water security entitles everyone to sufficient, safe, acceptable, physicallyaccessible and affordable water for domestic uses [9]. Since the issues are huge and requires individualattention to the details, for this article, the discussion is based on only three broader aspects; i.e., waterdemand and supply, accessibility and the risks associated with flood, water-borne diseases, and wastemanagement—to get an overview of the study area in terms of water security. Water insecurity inurbanized areas in general is based on various socio-economic factors: next to uncontrolled populationgrowth, for example, it is based on poor governance and mismanagement of the water supply system.Parallel, physical processes like climate change must be considered as a catalyst. To establish asustainable urban water management system characters such as the ratio between availability andrequired amount of drinking water supply, physical and virtual water demand, and the supply ofwater are the major components that need to be considered.
New or newly emerging countries can be characterized as being in a dearth of financial potentialityto mitigate water-environmental issues. The most number of people who are affected by water relatedproblems in urban areas, such as water scarcity of required quality water, live in emerging countries [10].Gaps between national and regional policies for water result in the lack of efficient management plans.In consequence, management decisions regarding purification, distribution, and extraction facilities,and to reduce problems associated to sewage disposal and related threats to the downstream areas, aredeficient due to missing governance structures [11].
Kolkata is the capital of West Bengal state of India. Core Kolkata city spreads over around 200 km2
and has a population of 4.5 million people. The greater urban area includes 41 other cities and hostsnearly 15 million inhabitants, making it the third largest city area in India. Since 1690, the approximateyear when the British founded Kolkata, it has been expanding randomly without having a propermaster plan [12]. Besides, Kolkata is blessed ecologically because it has, “the Ganga flowing beside itswestern end, traditionally huge groundwater reserve and wide wetlands area in its eastern fringe which naturallytreats its waste water and turns that as raw water for fishery and agriculture.” [13]. Despite these advantages,the city is at present increasingly running into water insecurity.
The Ganga river system contributes significantly towards the transport of pollutants to the coastalareas of the Bay of Bengal [14,15]. The river’s poor surface water quality is closely related to itsinsufficient waste water treatment facilities [16,17]. In consequence, waterborne diseases are still animportant issue to deal with [14]. Beyond, Kolkata has recently received the ‘extreme risk’ tag as itranks 7th on the global list of cities most vulnerable to climate change [18]. It is assumed that until2025 Kolkata frequently will be hit by storms, cyclones, and hurricanes alongside extreme temperatureand rainfall events. These weather extreme events will affect directly the existing water-environmentand socio-economic activities, bringing risks to human health and eco-system health [16,19].
In this article, the linkages between LULC change and urban water security are explored forthe Kolkata Municipal Corporation (KMC) area. The focus is set on uncontrolled urbanizationprocesses and insufficient water management practices, which have their resultant combined effectson water insecurity within the KMC area. Building on land use-land cover change detections and aliterature survey, the dynamic linkage between land use-land cover change and urban water securityis overviewed. The local scale of urban water security problems within the KMC area caused by landuse-land cover changes over the last four decades and the resulting impacts (direct and indirect) onthe existing infrastructure are addressed through the review of scientific literature and reports.

Land 2018, 7, 91 3 of 25
2. Study Area
The study area encompasses the Kolkata Municipal Corporation area (KMC), located at the left(eastern) bank of the river Hooghly in the western Ganga delta (Figure 1; 22◦28′00”–22◦37′30” N88◦17′30”–88◦25′00” E). The climate of Kolkata is a tropical wet-and-dry climate (Aw according toKöppen climate classification system). The city experiences a hot pre-monsoon season from late Marchto mid-June followed by a monsoon period from mid-June till mid-September and lastly a slightlycooler dry season from mid-October until mid-March [20]. The annual temperature averages 26.8◦C with monthly mean temperatures ranging from 19 ◦C in January to 30 ◦C in May [18]. The hotpre-monsoon season in Kolkata is windy in the afternoon and often characterized by violent duststorms that are brought by the convective ‘Kal Baishakhi’ winds (Nor’westers), accompanied by spellsof thunderstorms or hailstorms and heavy rains with ice pellets or sleets. During late pre-monsoonseason (May and June) maximum temperature rises to 38 ◦C. The Monsoon season is characterized byheavy rainfall, which especially is expected in August (monthly average 306 mm). The annual rainfallaverages 1582 mm (1971–2010), comprising average monsoon rainfalls of 1182 mm (1971–2010) andaverage non-monsoon rainfall of 365 mm (1971–2010) [21]. The annual sunshine hours in Kolkataaverage 2528 h (1971–2010) with the maximum number of sunshine hours occurring in March. Kolkatais located approximately 150 km upcountry from the Bay of Bengal coast, which is still under theinfluence of sea wind movement and close enough to make it highly humid corresponding to airmoisture [20].
Land 2018, 7, x FOR PEER REVIEW 3 of 25
2. Study Area
The study area encompasses the Kolkata Municipal Corporation area (KMC), located at the left
(eastern) bank of the river Hooghly in the western Ganga delta (Figure 1; 22°28′00″–22°37′30″ N
88°17′30″–88°25′00″ E). The climate of Kolkata is a tropical wet‐and‐dry climate (Aw according to
Köppen climate classification system). The city experiences a hot pre‐monsoon season from late
March to mid‐June followed by a monsoon period from mid‐June till mid‐September and lastly a
slightly cooler dry season from mid‐October until mid‐March [20]. The annual temperature averages
26.8 °C with monthly mean temperatures ranging from 19 °C in January to 30 °C in May [18]. The hot
pre‐monsoon season in Kolkata is windy in the afternoon and often characterized by violent dust
storms that are brought by the convective ‘Kal Baishakhi’ winds (Nor’westers), accompanied by spells
of thunderstorms or hailstorms and heavy rains with ice pellets or sleets. During late pre‐monsoon
season (May and June) maximum temperature rises to 38 °C. The Monsoon season is characterized
by heavy rainfall, which especially is expected in August (monthly average 306 mm). The annual
rainfall averages 1582 mm (1971–2010), comprising average monsoon rainfalls of 1182 mm (1971–
2010) and average non‐monsoon rainfall of 365 mm (1971–2010) [21]. The annual sunshine hours in
Kolkata average 2528 h (1971–2010) with the maximum number of sunshine hours occurring in
March. Kolkata is located approximately 150 km upcountry from the Bay of Bengal coast, which is
still under the influence of sea wind movement and close enough to make it highly humid
corresponding to air moisture [20].
Figure 1. Location of Kolkata Municipal Corporation area (Source: Kolkata Municipal Corporation, 2016).
Kolkata Municipal Corporation area (KMC, area 205 Km2) forms the centroid of the Kolkata
Metropolitan Area (KMA, area 1886.67 Km2) and corresponds to the urban agglomeration of the city
of Kolkata (Figure 2). KMC currently is composed of 144 (including the newly added three) wards,
which are grouped into 16 boroughs or administrative blocks (Table 1; Figure 3) having 21 assemblies
and 3 parliamentary constituencies. Within the KMC area no so‐called “big industry” occurs; the
majority is small scale industries that are mostly spread along the banks of the river Hooghly. The
Kolkata industrial hub is a major market in eastern India. The Kolkata port functions as a major entry
point for neighboring countries like Nepal, Bangladesh, and Bhutan as well as for northeast India.
Figure 1. Location of Kolkata Municipal Corporation area (Source: Kolkata Municipal Corporation,2016).
Kolkata Municipal Corporation area (KMC, area 205 Km2) forms the centroid of the KolkataMetropolitan Area (KMA, area 1886.67 Km2) and corresponds to the urban agglomeration of the city ofKolkata (Figure 2). KMC currently is composed of 144 (including the newly added three) wards, whichare grouped into 16 boroughs or administrative blocks (Table 1; Figure 3) having 21 assemblies and 3parliamentary constituencies. Within the KMC area no so-called “big industry” occurs; the majorityis small scale industries that are mostly spread along the banks of the river Hooghly. The Kolkataindustrial hub is a major market in eastern India. The Kolkata port functions as a major entry point forneighboring countries like Nepal, Bangladesh, and Bhutan as well as for northeast India.
Land 2018, 7, 91 4 of 25Land 2018, 7, x FOR PEER REVIEW 4 of 25
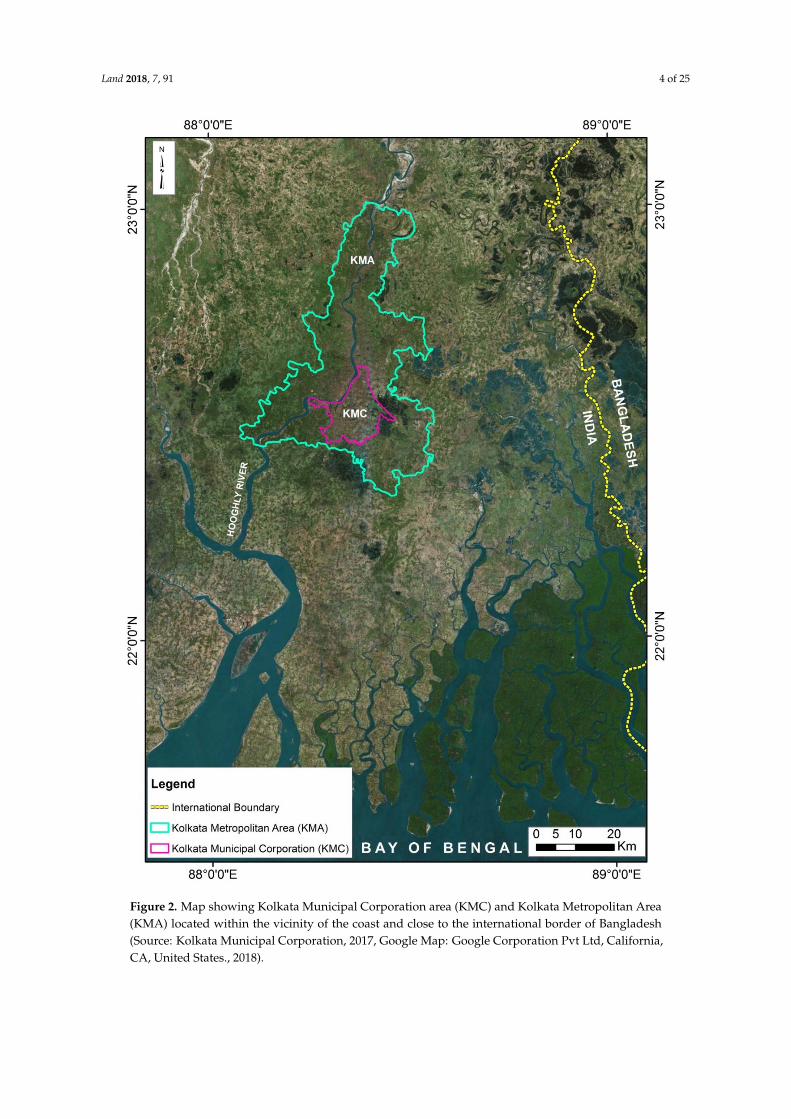
Figure 2. Map showing Kolkata Municipal Corporation area (KMC) and Kolkata Metropolitan Area
(KMA) located within the vicinity of the coast and close to the international border of Bangladesh
(Source: Kolkata Municipal Corporation, 2017, Google Map: Google Corporation Pvt Ltd, California,
CA, United States., 2018).
Figure 2. Map showing Kolkata Municipal Corporation area (KMC) and Kolkata Metropolitan Area(KMA) located within the vicinity of the coast and close to the international border of Bangladesh(Source: Kolkata Municipal Corporation, 2017, Google Map: Google Corporation Pvt Ltd, California,CA, United States., 2018).

Land 2018, 7, 91 5 of 25
Table 1. List of Boroughs and the associated wards of the Kolkata Municipal Corporation (KMC);(excluding the newly added three wards until 2016 annual report published by KMC; Kolkata MunicipalCorporation, 2016).
Borough Ward No.
I 1, 2, 3, 4, 5, 6, 7, 8 & 9II 10, 11, 12, 15, 16, 17, 18, 19 & 20III 13, 14, 29, 30, 31, 32, 33, 34 & 35IV 21, 22, 23, 24, 25, 26, 27, 28, 38 & 39V 36, 37, 40, 41, 42, 43, 44, 45, 48, 49 & 50VI 46, 47, 51, 52, 53, 54, 55, 60, 61 & 62VII 56, 57, 58, 59, 63, 64, 65, 66 & 67VIII 68, 69, 70, 72, 83, 84, 85, 86, 87, 88 & 90IX 71, 73, 74, 75, 76, 77, 78, 79, 80 & 82X 81, 89, 91, 92, 93, 94, 95, 96, 97, 98, 99 & 100XI 103, 104, 110, 111, 112, 113 & 114XII 101, 102, 105, 106, 107, 108 & 109XIII 115, 116, 117, 118, 119, 120 &122XIV 121, 127, 128, 129, 130, 131 &132XV 133, 134, 135, 136, 137, 138, 139, 140 & 141XVI 123, 124, 125, 126
Land 2018, 7, x FOR PEER REVIEW 5 of 25
Table 1. List of Boroughs and the associated wards of the Kolkata Municipal Corporation (KMC);
(excluding the newly added three wards until 2016 annual report published by KMC; Kolkata
Municipal Corporation, 2016).
Borough Ward No.
I 1, 2, 3, 4, 5, 6, 7, 8 & 9
II 10, 11, 12, 15, 16, 17, 18, 19 & 20
III 13, 14, 29, 30, 31, 32, 33, 34 & 35
IV 21, 22, 23, 24, 25, 26, 27, 28, 38 & 39
V 36, 37, 40, 41, 42, 43, 44, 45, 48, 49 & 50
VI 46, 47, 51, 52, 53, 54, 55, 60, 61 & 62
VII 56, 57, 58, 59, 63, 64, 65, 66 & 67
VIII 68, 69, 70, 72, 83, 84, 85, 86, 87, 88 & 90
IX 71, 73, 74, 75, 76, 77, 78, 79, 80 & 82
X 81, 89, 91, 92, 93, 94, 95, 96, 97, 98, 99 & 100
XI 103, 104, 110, 111, 112, 113 & 114
XII 101, 102, 105, 106, 107, 108 & 109
XIII 115, 116, 117, 118, 119, 120 &122
XIV 121, 127, 128, 129, 130, 131 &132
XV 133, 134, 135, 136, 137, 138, 139, 140 & 141
XVI 123, 124, 125, 126
Figure 3. Borough Map of Kolkata Municipal Corporation area featuring all the associated wards for
each borough (source: Kolkata Municipal Corporation, 2016).
Kolkata Municipal Corporation is in the lower deltaic plains of the Ganga‐Bhagirthi‐Hooghly
river system; i.e., the southern (Indian) part of Ganga‐Brahmaputra Delta. The down‐stream channel
of Bhagirathi Channel in the tidal stretch is called Hooghly. The elevations in this area range between
3.5 to 6.0 m above mean sea level (amsl) and relief is flat [22]. Locally low‐lying depressions such as
marshes and shallow lakes (Jhils) occur within the deltaic plain. Most of these formations represent
paleo‐river channels of the Bhagirathi. The main slope of the surface dips towards the south. Levees,
Figure 3. Borough Map of Kolkata Municipal Corporation area featuring all the associated wards foreach borough (source: Kolkata Municipal Corporation, 2016).
Kolkata Municipal Corporation is in the lower deltaic plains of the Ganga-Bhagirthi-Hooghlyriver system; i.e., the southern (Indian) part of Ganga-Brahmaputra Delta. The down-stream channelof Bhagirathi Channel in the tidal stretch is called Hooghly. The elevations in this area range between3.5 to 6.0 m above mean sea level (amsl) and relief is flat [22]. Locally low-lying depressions such asmarshes and shallow lakes (Jhils) occur within the deltaic plain. Most of these formations representpaleo-river channels of the Bhagirathi. The main slope of the surface dips towards the south. Levees,

Land 2018, 7, 91 6 of 25
inter-distributary marsh, and paleo-channels are the most important geomorphological features in thedeltaic plain. The Hooghly River and several canals like Bagjola Khal (canal) in the north and Beleiaghataand Circular Khal (canal) in the central part and Adi-Ganga canal along with Talli nala (canal) in thesouthern part of the city drain the area. Presently these waterbodies are largely silted.
The details of the Water Statistics of Kolkata Municipal Corporation (KMC) area are compiled inTable 2. The data are primarily based on Census of India [23,24].
Table 2. Water Statistics of Kolkata Municipal Corporation (KMC) [12,23–27].
Demography
Kolkata Municipal Corporation (KMC) Area (2011) 205 Km2
Population 4,496,694
Floating Population 6,000,000 Per Day
Total Water Demand (based on KMC) 925 MLD (as per KMC); 952 (as per CPHEEO)
Per Capita Demand 170 MLD
Water Supply System
Sources Hooghly River and groundwater from deep and hand tube-wells
Surface Water Contribution 89%
Groundwater Contribution 11%
Total Water Supplied 1216 MLD
Per Capita Supplied 224 LPCD
Loss due to Leakage 35%
Actual Supply (After Loss) 790 MLD
Per Capita Supply (After Loss) 145%
Population served by Water Supply System 92% [27]; 85% [12]
Per Capita Water Supply Served 134 LPCD [24]; 171 LPCD [12]
Demand-Supply Gap (After Loss) 135 MLD
Continuity of Water Supplied (in Hours) 8
Residual Pressure 3.6 PSI
Number of Water Treatment Plants 4
Designed Capacity for water Production 1787 MLD
Actual Capacity 1080 MLD
Operational Capacity for Surface Water Production 1260 MLD
Operational Capacity for Ground Water Production 114 MLD
Reservoir Capacity 256 ML
Hand Tube-wells 12,000
Large Tube-wells 400
Water Supply Distribution Pipes 5687 Km
Number of Piped Connections 245,019 [27]
Household with access to water 79%
Water Price for Domestic Usage Unbilled for up to one connection/premise additional water supply:US$0.15/m3
Water Price for Commercial, Industrial andInstitutional Usage
Flat-rate between US$11.6 and US$66 (Monthly) Additional WaterSupply: US$0.33/m3
3. Data and Methods
3.1. Data
The study is primarily based on a literature review and analysis of secondary data from varioussources including data bases available at the Kolkata Municipal Corporation. In addition, satelliteimages were analyzed to detect changes of the distribution of the major land cover classes surfacewater bodies, building area, and vegetated area since 1980 in ten-year time steps. Satellite images withtheir Date of Acquisition (DoA) applied are:
Land 2018, 7, 91 7 of 25
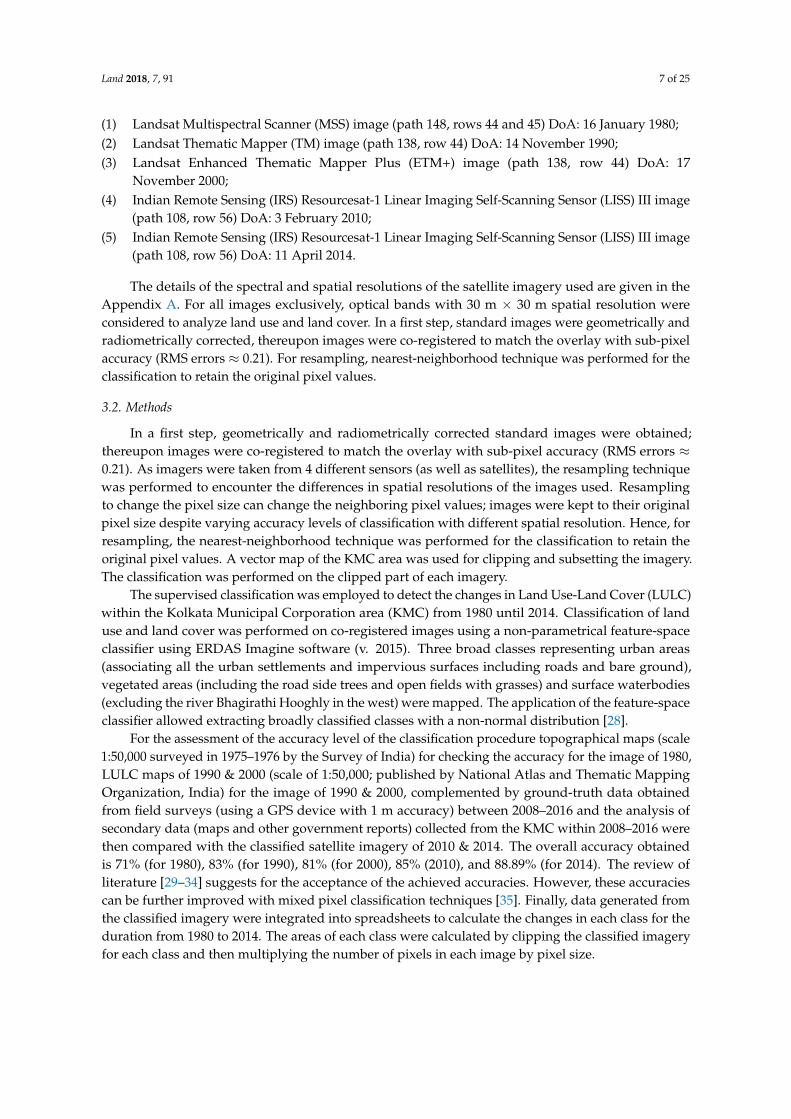
(1) Landsat Multispectral Scanner (MSS) image (path 148, rows 44 and 45) DoA: 16 January 1980;(2) Landsat Thematic Mapper (TM) image (path 138, row 44) DoA: 14 November 1990;(3) Landsat Enhanced Thematic Mapper Plus (ETM+) image (path 138, row 44) DoA: 17
November 2000;(4) Indian Remote Sensing (IRS) Resourcesat-1 Linear Imaging Self-Scanning Sensor (LISS) III image
(path 108, row 56) DoA: 3 February 2010;(5) Indian Remote Sensing (IRS) Resourcesat-1 Linear Imaging Self-Scanning Sensor (LISS) III image
(path 108, row 56) DoA: 11 April 2014.
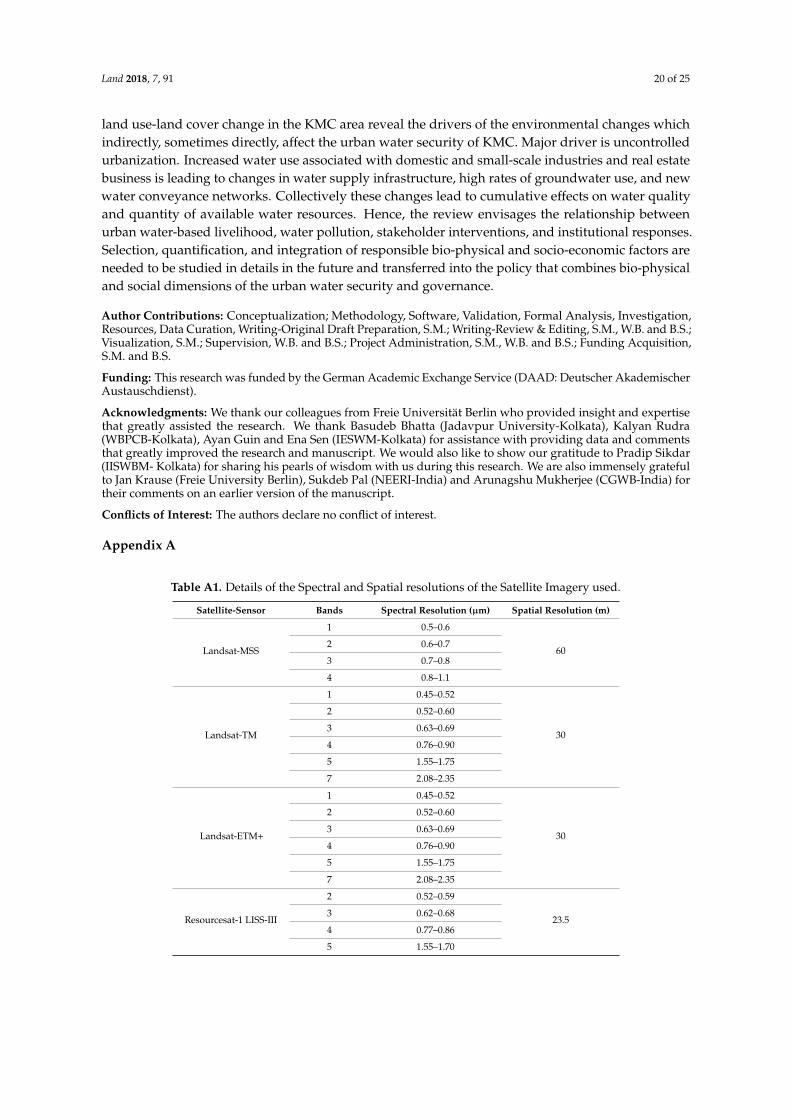
The details of the spectral and spatial resolutions of the satellite imagery used are given in theAppendix A. For all images exclusively, optical bands with 30 m × 30 m spatial resolution wereconsidered to analyze land use and land cover. In a first step, standard images were geometrically andradiometrically corrected, thereupon images were co-registered to match the overlay with sub-pixelaccuracy (RMS errors ≈ 0.21). For resampling, nearest-neighborhood technique was performed for theclassification to retain the original pixel values.
3.2. Methods
In a first step, geometrically and radiometrically corrected standard images were obtained;thereupon images were co-registered to match the overlay with sub-pixel accuracy (RMS errors ≈0.21). As imagers were taken from 4 different sensors (as well as satellites), the resampling techniquewas performed to encounter the differences in spatial resolutions of the images used. Resamplingto change the pixel size can change the neighboring pixel values; images were kept to their originalpixel size despite varying accuracy levels of classification with different spatial resolution. Hence, forresampling, the nearest-neighborhood technique was performed for the classification to retain theoriginal pixel values. A vector map of the KMC area was used for clipping and subsetting the imagery.The classification was performed on the clipped part of each imagery.
The supervised classification was employed to detect the changes in Land Use-Land Cover (LULC)within the Kolkata Municipal Corporation area (KMC) from 1980 until 2014. Classification of landuse and land cover was performed on co-registered images using a non-parametrical feature-spaceclassifier using ERDAS Imagine software (v. 2015). Three broad classes representing urban areas(associating all the urban settlements and impervious surfaces including roads and bare ground),vegetated areas (including the road side trees and open fields with grasses) and surface waterbodies(excluding the river Bhagirathi Hooghly in the west) were mapped. The application of the feature-spaceclassifier allowed extracting broadly classified classes with a non-normal distribution [28].
For the assessment of the accuracy level of the classification procedure topographical maps (scale1:50,000 surveyed in 1975–1976 by the Survey of India) for checking the accuracy for the image of 1980,LULC maps of 1990 & 2000 (scale of 1:50,000; published by National Atlas and Thematic MappingOrganization, India) for the image of 1990 & 2000, complemented by ground-truth data obtainedfrom field surveys (using a GPS device with 1 m accuracy) between 2008–2016 and the analysis ofsecondary data (maps and other government reports) collected from the KMC within 2008–2016 werethen compared with the classified satellite imagery of 2010 & 2014. The overall accuracy obtainedis 71% (for 1980), 83% (for 1990), 81% (for 2000), 85% (2010), and 88.89% (for 2014). The review ofliterature [29–34] suggests for the acceptance of the achieved accuracies. However, these accuraciescan be further improved with mixed pixel classification techniques [35]. Finally, data generated fromthe classified imagery were integrated into spreadsheets to calculate the changes in each class for theduration from 1980 to 2014. The areas of each class were calculated by clipping the classified imageryfor each class and then multiplying the number of pixels in each image by pixel size.
Land 2018, 7, 91 8 of 25
4. Land Use-Land Cover Change in Kolkata Municipal Corporation Area Since 1980
The supervised classification was applied to detect the changes in Land Use-Land Cover (LULC)within the Kolkata Municipal corporation area (KMC) since 1980 until 2014. It reveals the spatialpatterns of the city showing the changes of the three major land use classes (1) urban settlementsincluding all the sealed areas such as roads, (2) vegetation patches including roadside tress and greenfields and (3) wetlands including all the ponds, lakes, and canals. Presentation of results follows atfirst an overviewing analysis for the Kolkata Municipal Corporation area (KMC) and then continues with aborough-wise analysis for the Kolkata Municipal Corporation area (KMC) to get detailed information.
4.1. Overviewing Analysis for the Kolkata Municipal Corporation Area (KMC)
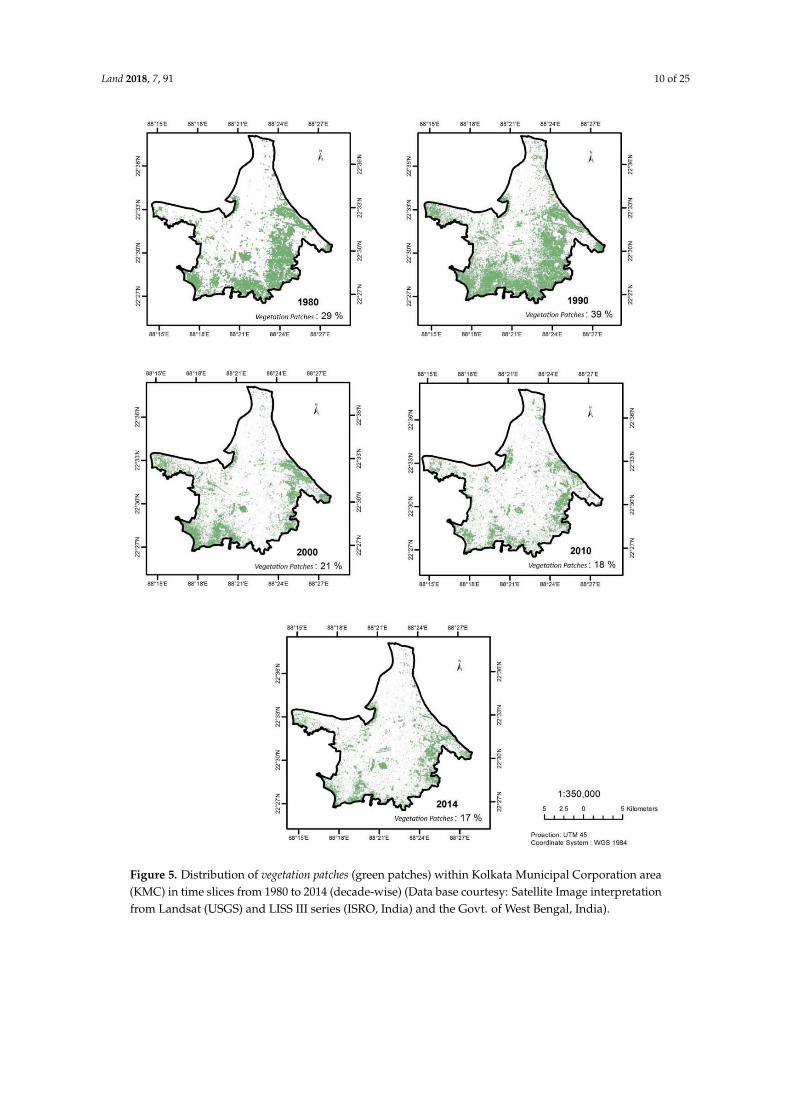
For the Kolkata Municipal Corporation area (KMC) the three major land use classes (1) urbansettlements, (2) vegetation patches, and (3) wetlands were mapped in five time slices covering the periodfrom 1980–2014. During this time the spatial patterns of these major land use classes show distinctchanges: In 1980 the urban settlements covered 49% of the total KMC area while in 2014 it almostcaptured the whole KMC area covering 79% (161.91 Km2) of the total area (Figure 4). The urbansettlements area under the KMC only slightly increased (2%) between 1980 and 1990, transformingfrom 100.17 Km2 to 103.89 Km2. Between 1990 and 2000 the urban settlements area increased abruptly,covering 71% (145.34 Km2) in 2000 followed by an additional increase of 7% until 2010 (78% or 162.08Km2 of the total area of KMC; Figure 4). Within the whole study period (1980–2014) the space occupiedby the wetlands decreased from 47.15 Km2 to 8.70 Km2 and that covered by vegetation patches from 58.60Km2 to 35.31 Km2 (Figure 5).
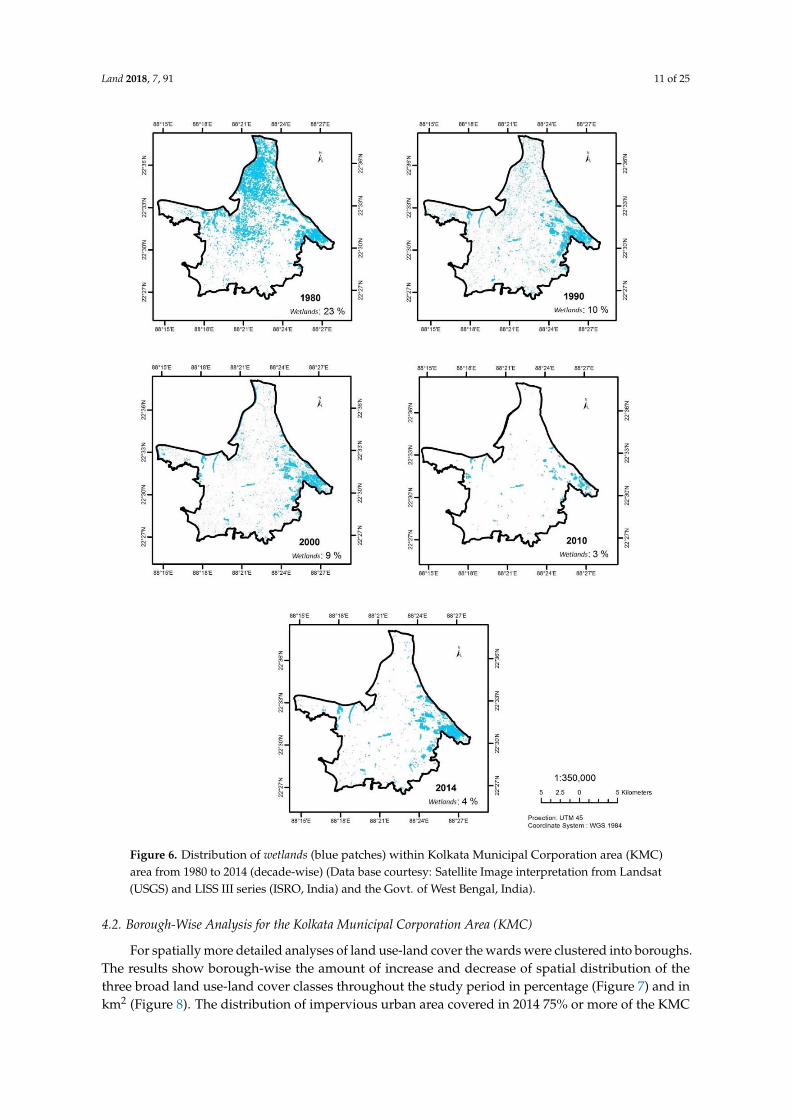
Areas of vegetation patches comprising predominantly big trees in 1980 almost covered an areaof 29% (58.60 Km2) of the total KMC area and even expanded to 39% (81.12 Km2) until 1990. Sincethen, the area covered by vegetation patches continuously shrank, covering 21% of the total KMC areain 2000 and ultimately, 17% in 2014 (Figure 5). Between 2010 and 2014 the area covered by vegetationpatches increased slightly in the eastern part of Kolkata and in some scattered parts of southern Kolkatain comparison to the other parts of the study area. Nevertheless, at the same time the areas coveredby wetlands reduced from 47.15 Km2 to 20.90 Km2 (Figure 6). This indicates that wetlands are notnecessarily transformed directly to urbanized areas but were desiccated and overgrown by vegetation.The areas covered by wetlands decreased to more than half within the whole KMC area between 1980and 1990 (23% in 1980 and 10% in 1990) (Figure 6). In the following decades the areas covered byvegetation patches as well as those covered by wetlands constantly declined. In 2014, the percentage ofareas covered by wetlands accounted only 4% (8.7 Km2) of the total KMC area which, however, was 1%more than in 2010 (7.42 Km2) (Figure 6).

Land 2018, 7, 91 9 of 25Land 2018, 7, x FOR PEER REVIEW 9 of 25
Figure 4. Distribution of urban settlements (brown patches) within Kolkata Municipal Corporation area
(KMC) in time slices from 1980 to 2014 (decade‐wise) (Data base courtesy: Satellite Image
interpretation from Landsat (USGS) and LISS III series (ISRO, India) and the Govt. of West Bengal,
India).
Figure 4. Distribution of urban settlements (brown patches) within Kolkata Municipal Corporation area(KMC) in time slices from 1980 to 2014 (decade-wise) (Data base courtesy: Satellite Image interpretationfrom Landsat (USGS) and LISS III series (ISRO, India) and the Govt. of West Bengal, India).
Land 2018, 7, 91 10 of 25Land 2018, 7, x FOR PEER REVIEW 10 of 25
Figure 5. Distribution of vegetation patches (green patches) within Kolkata Municipal Corporation area
(KMC) in time slices from 1980 to 2014 (decade‐wise) (Data base courtesy: Satellite Image
interpretation from Landsat (USGS) and LISS III series (ISRO, India) and the Govt. of West Bengal,
India).
Figure 5. Distribution of vegetation patches (green patches) within Kolkata Municipal Corporation area(KMC) in time slices from 1980 to 2014 (decade-wise) (Data base courtesy: Satellite Image interpretationfrom Landsat (USGS) and LISS III series (ISRO, India) and the Govt. of West Bengal, India).
Land 2018, 7, 91 11 of 25Land 2018, 7, x FOR PEER REVIEW 11 of 25
Figure 6. Distribution of wetlands (blue patches) within Kolkata Municipal Corporation area (KMC)
area from 1980 to 2014 (decade‐wise) (Data base courtesy: Satellite Image interpretation from Landsat
(USGS) and LISS III series (ISRO, India) and the Govt. of West Bengal, India).
4.2. Borough‐Wise Analysis for the Kolkata Municipal Corporation Area (KMC)
For spatially more detailed analyses of land use‐land cover the wards were clustered into
boroughs. The results show borough‐wise the amount of increase and decrease of spatial distribution
of the three broad land use‐land cover classes throughout the study period in percentage (Figure 7)
and in km2 (Figure 8). The distribution of impervious urban area covered in 2014 75% or more of the
KMC (Figure 7). The variations in the spread of the three major land cover classes itemized by
boroughs clearly indicates that the spread of urban settlements took place by replacing areas allocated
Figure 6. Distribution of wetlands (blue patches) within Kolkata Municipal Corporation area (KMC)area from 1980 to 2014 (decade-wise) (Data base courtesy: Satellite Image interpretation from Landsat(USGS) and LISS III series (ISRO, India) and the Govt. of West Bengal, India).
4.2. Borough-Wise Analysis for the Kolkata Municipal Corporation Area (KMC)
For spatially more detailed analyses of land use-land cover the wards were clustered into boroughs.The results show borough-wise the amount of increase and decrease of spatial distribution of thethree broad land use-land cover classes throughout the study period in percentage (Figure 7) and inkm2 (Figure 8). The distribution of impervious urban area covered in 2014 75% or more of the KMC

Land 2018, 7, 91 12 of 25
(Figure 7). The variations in the spread of the three major land cover classes itemized by boroughsclearly indicates that the spread of urban settlements took place by replacing areas allocated to vegetationpatches or wetlands. The results reveal that boroughs II, IV, V, and VI, which are mainly concentrated inthe north and center of the KMC, lost major areas of wetlands within 1980 to 2014.
Land 2018, 7, x FOR PEER REVIEW 12 of 25
to vegetation patches or wetlands. The results reveal that boroughs II, IV, V, and VI, which are mainly
concentrated in the north and center of the KMC, lost major areas of wetlands within 1980 to 2014.
Figure 7. Relative distribution of major land use‐land cover classes in Kolkata Municipal Corporation
area (KMC) showed decade‐wise since 1980. Major land use‐land cover classes are differentiated into
urban settlements, vegetation patches, and wetlands; also compare Figures 4–6. (Data base courtesy:
Satellite Image interpretation from Landsat (USGS) and LISS III series (ISRO, India) and the Govt. of
West Bengal, India).
Borough‐wise results for the first decade studied (1980–1990) (Figure 8) depict that all the
boroughs except boroughs no. VII, IX, and XII lost almost the entire wetlands areas by 2014 (Figure 8).
The most severe loss in wetlands is observed for borough II, where the area declined from 84% to 14%.
In contrast, within borough II, urban settlements increased from 16% to 84% between 1980 and 2014
(Figure 8). In the decade of 1990 to 2000, the distribution of vegetation patches and the areas covered
by wetlands declined in almost all the boroughs of KMC, but the major declines were evident in
boroughs in the central and northern part of the KMC (I, III, VII, VIII, XI and XIII) for vegetation patches
and borough II in the north of the KMC for the spread of wetlands. Within the decade from 2000 to
2010 urban settlements continued spreading within the KMC covering an area of 162.08 km2 in 2010
(2000: 145.33 km2). Concurrently, areas covered by vegetation patches continuously declined from 41.96
Km2 (2000) to 36.43 Km2 (2010). Even more pronounced the spread of wetlands declined from 18.62
Km2 (2000) and 7.42 Km2 (2010). These trends stopped or even reversed between 2000 and 2014 when
urban settlements covered 161.91 Km2 (+8% compared to 2000), areas under vegetation patches covering
35.31 Km² (−4% compared to 2000) and wetlands covered 8.70 Km2 (−5% compared to 2000) of the
KMC in 2014. These changes became particularly apparent in the southern part of the KMC (Figures
5–7), which gets especially apparent by the borough wise break down of the land use‐land cover
change (Figures 8 and 9).
Figure 7. Relative distribution of major land use-land cover classes in Kolkata Municipal Corporationarea (KMC) showed decade-wise since 1980. Major land use-land cover classes are differentiatedinto urban settlements, vegetation patches, and wetlands; also compare Figures 4–6. (Data base courtesy:Satellite Image interpretation from Landsat (USGS) and LISS III series (ISRO, India) and the Govt. ofWest Bengal, India).
Borough-wise results for the first decade studied (1980–1990) (Figure 8) depict that all the boroughsexcept boroughs no. VII, IX, and XII lost almost the entire wetlands areas by 2014 (Figure 8). The mostsevere loss in wetlands is observed for borough II, where the area declined from 84% to 14%. In contrast,within borough II, urban settlements increased from 16% to 84% between 1980 and 2014 (Figure 8). In thedecade of 1990 to 2000, the distribution of vegetation patches and the areas covered by wetlands declinedin almost all the boroughs of KMC, but the major declines were evident in boroughs in the central andnorthern part of the KMC (I, III, VII, VIII, XI and XIII) for vegetation patches and borough II in the northof the KMC for the spread of wetlands. Within the decade from 2000 to 2010 urban settlements continuedspreading within the KMC covering an area of 162.08 km2 in 2010 (2000: 145.33 km2). Concurrently,areas covered by vegetation patches continuously declined from 41.96 Km2 (2000) to 36.43 Km2 (2010).Even more pronounced the spread of wetlands declined from 18.62 Km2 (2000) and 7.42 Km2 (2010).These trends stopped or even reversed between 2000 and 2014 when urban settlements covered 161.91Km2 (+8% compared to 2000), areas under vegetation patches covering 35.31 Km2 (−4% compared to2000) and wetlands covered 8.70 Km2 (−5% compared to 2000) of the KMC in 2014. These changesbecame particularly apparent in the southern part of the KMC (Figures 5–7), which gets especiallyapparent by the borough wise break down of the land use-land cover change (Figures 8 and 9).

Land 2018, 7, 91 13 of 25Land 2018, 7, x FOR PEER REVIEW 13 of 25
Figure 8. Borough‐wise decadal distribution of the major land use‐land cover classes (km2) in Kolkata
Municipal Corporation area (KMC) decade‐wise since 1980 differentiated into (a) urban settlements
(built‐up and sealed areas), (b) vegetation patches and (c) wetlands. (Data base courtesy: Satellite Image
interpretation from Landsat (USGS) and LISS III series (ISRO, India) and the Govt. of West Bengal,
India).
Figure 8. Borough-wise decadal distribution of the major land use-land cover classes (km2) in KolkataMunicipal Corporation area (KMC) decade-wise since 1980 differentiated into (a) urban settlements(built-up and sealed areas), (b) vegetation patches and (c) wetlands. (Data base courtesy: Satellite Imageinterpretation from Landsat (USGS) and LISS III series (ISRO, India) and the Govt. of West Bengal,India).

Land 2018, 7, 91 14 of 25Land 2018, 7, x FOR PEER REVIEW 14 of 25
Figure 9. Borough wise differentiated relative distribution of major land use‐land cover classes in
Kolkata Municipal Corporation area (KMC) in 1980 and 2014. Major land use‐land cover classes are
shown differentiated by in (a) urban settlements, (b) vegetation patches, and (c) wetlands. (Data base
courtesy: Satellite Image interpretation from Landsat (USGS) and LISS III series (ISRO, India) and the
Govt. of West Bengal, India).
The relative change of the distribution of each major land use‐land cover class was calculated
dividing the difference in area coverage between 1980 and 2014 by the area covered by the respected
land use‐land cover class in 2014. The positive results of a class signify the increase whereas the
negative results indicate the decrease in areas between 1980 and 2014 (Figure 10). Areas covered by
wetlands show the highest relative decrease in distribution; in boroughs I to VI the areas under the
coverage of any lake, ponds, or other surface waterbodies in 1980 changed until 2014 either into urban
settlements or vegetation patches. The distribution of vegetation patches declined in the boroughs X, XI,
and XII between 1980 and 2014, being transformed into urban settlements. The change for the vegetation
patches were major in the boroughs of II, VI, and V. Simultaneously, a continuous and stable process
of urbanization occurred in boroughs X–XVI. Nevertheless, the areas covered by wetlands were
mainly changed in the boroughs I–VIII (Figure 10).
Figure 9. Borough wise differentiated relative distribution of major land use-land cover classes inKolkata Municipal Corporation area (KMC) in 1980 and 2014. Major land use-land cover classes areshown differentiated by in (a) urban settlements, (b) vegetation patches, and (c) wetlands. (Data basecourtesy: Satellite Image interpretation from Landsat (USGS) and LISS III series (ISRO, India) and theGovt. of West Bengal, India).
The relative change of the distribution of each major land use-land cover class was calculateddividing the difference in area coverage between 1980 and 2014 by the area covered by the respectedland use-land cover class in 2014. The positive results of a class signify the increase whereas thenegative results indicate the decrease in areas between 1980 and 2014 (Figure 10). Areas covered bywetlands show the highest relative decrease in distribution; in boroughs I to VI the areas under thecoverage of any lake, ponds, or other surface waterbodies in 1980 changed until 2014 either into urbansettlements or vegetation patches. The distribution of vegetation patches declined in the boroughs X, XI,and XII between 1980 and 2014, being transformed into urban settlements. The change for the vegetationpatches were major in the boroughs of II, VI, and V. Simultaneously, a continuous and stable process ofurbanization occurred in boroughs X–XVI. Nevertheless, the areas covered by wetlands were mainlychanged in the boroughs I–VIII (Figure 10).

Land 2018, 7, 91 15 of 25Land 2018, 7, x FOR PEER REVIEW 15 of 25
Figure 10. Borough‐wise change (%) of urban settlements, vegetation patches, and wetlands in Kolkata
Municipal Corporation area (KMC) from 1980 to 2014. (Data base courtesy: Satellite Image
interpretation from Landsat (USGS) and LISS III series (ISRO, India) and the Govt. of West Bengal,
India).
5. Water Security in Kolkata Municipal Corporation Area
Changes in land use‐land cover patterns increase pressures on water resources, which ultimately
affects the linkage between land tenure and water security [36]. This section seeks to complement the
observations on land use‐land cover change by a literature review to contribute to developing a
shared understanding of some of the core concepts related to water security in Kolkata city. Rapid
changes in land use‐land cover patterns and simultaneous insufficient water management practices
in the entire KMC area caused poor water quality [37]. Water security entails ensuring every citizen
with the amount of quality water they need to safely live their everyday life [36]. In an urbanized
area, amongst other aspects, unrestricted population growth [38,39], poor governance [40–42] and
mismanagement of the water supply system [43] as well as social inequity [44–46] can result in water
insecurity.
The nature of urbanization processes has undergone a paradigm shift since the neo‐liberal
economic reforms of 1991, which ultimately leads the process of the acquisition of land and water,
creating a potential insecurity for the urban water system in the KMC area [8,36]. In addition, parallel
physical processes like climate change accelerate the insecurity of water [47,48]. The following section
picks three major aspects of urban water security: water demand and supply, water accessibility, and
water related disasters, which include risks and environmental health.
Figure 10. Borough-wise change (%) of urban settlements, vegetation patches, and wetlands in KolkataMunicipal Corporation area (KMC) from 1980 to 2014. (Data base courtesy: Satellite Imageinterpretation from Landsat (USGS) and LISS III series (ISRO, India) and the Govt. of West Bengal,India).
5. Water Security in Kolkata Municipal Corporation Area
Changes in land use-land cover patterns increase pressures on water resources, which ultimatelyaffects the linkage between land tenure and water security [36]. This section seeks to complement theobservations on land use-land cover change by a literature review to contribute to developing a sharedunderstanding of some of the core concepts related to water security in Kolkata city. Rapid changesin land use-land cover patterns and simultaneous insufficient water management practices in theentire KMC area caused poor water quality [37]. Water security entails ensuring every citizen with theamount of quality water they need to safely live their everyday life [36]. In an urbanized area, amongstother aspects, unrestricted population growth [38,39], poor governance [40–42] and mismanagementof the water supply system [43] as well as social inequity [44–46] can result in water insecurity.
The nature of urbanization processes has undergone a paradigm shift since the neo-liberaleconomic reforms of 1991, which ultimately leads the process of the acquisition of land and water,creating a potential insecurity for the urban water system in the KMC area [8,36]. In addition, parallelphysical processes like climate change accelerate the insecurity of water [47,48]. The following sectionpicks three major aspects of urban water security: water demand and supply, water accessibility, andwater related disasters, which include risks and environmental health.
5.1. Water Demand and Supply
Time series analysis of land use-land cover change in Kolkata Municipal Corporation (KMC) areashows that Kolkata city has been transformed during the past four decades into almost a completelyurbanized area. Population growth and resulting population density (Table 3) are the most importantdrivers that act as Catalysts for urbanization. Founded by the British East India Company in the early17th century, Kolkata was the first major Asian city which evolved as a provincial city and eventuallybecame the headquarters of the British India government [49]. The amount of its population, Kolkata’simportance in trade and commerce, the varieties of employment that it offers, and the diverse natureof its inhabitants make it a cosmopolitan city in character [50].

Land 2018, 7, 91 16 of 25
Table 3. Population data of Kolkata Municipal Corporation area (KMC) from 1971 to 2011 according tothe Census of India [23].
YearsPopulation
Growth Rate (%)Total Male Female
1961 2,927,298 1,815,791 1,111,498 +8.481971 3,148,746 1,924,505 1,224,241 +7.571981 3,305,006 1,930,320 1,374,686 +4.961991 4,399,819 - - +33.122001 4,572,8976 2,500,040 2,072,836 +3.932011 4,486,679 2,362,662 2,124,017 −1.88
At the beginning of the 20th century, Kolkata was the first city in India with a population of morethan one million inhabitants. According to the 1901 census KMC area’s population totaled 933,754,while according to the 1951 census 2,698,494 inhabitants were counted and increased to 4,572,876inhabitants in 2001 [23]. Corresponding to the last Census report of India (2011), the decadal growthrate of population in the Kolkata Urban Area (including KMC) amounted 6.87% between 2001 and2011, which was far below the standard growth rate of India or West Bengal state [51]. This decliningpopulation growth rate in the KMC area has been covered up by the continually increasing populationgrowth rate of greater Kolkata agglomeration areas, especially in the peri-urban zones along the banksof river Hooghly. As per the 2011 census, the KMC area had a population of 4,496,694, of which 52.41%(54.67% in 2001) were male and 47.58% (45.33% in 2001) were female. The population density of KMCarea averaged 22,000 inhabitants per km2 (24,718 inhabitants per km2 in 2001) [23]. The populationgrowth and rigorous sprawling impacts on the changing nature of the land use-land cover withinKMC area cause an increasing demand of water in the city and impose stress on the local groundwater regime [20]. This results in increased pressure on the existing demand-supply system and basicinfrastructural functionality according to recent reports on water demand [20,52].
Rapid and uncontrolled growth of urban areas is the result of, firstly, the natural increase inpopulation, and secondly, migration into urban areas [53]. In total, migration significantly contributesto the urban growth of Kolkata [53,54]. According to the 2007–2008 census data, the migrant populationin Kolkata city amounted for 30.9% of the total KMC population; work participation rate of migrantswithin KMC (44.5%) is much higher than West Bengal (34.7%) and in India (37.3%) [52]. Althoughinsignificant, comparing to the migration of people within India, international migration (mainly,refugees and undocumented migrants during and after the Bangladesh Liberation War of 1971) alsomust be considered as a growth factor. By the beginning of the 20th century, the urbanization inKolkata took place majorly along the eastern bank of the river Hooghly (currently areas under KMCboroughs I–VII). Since the 1980s most of the surface waterbodies in the peri-urban areas of KMC wereimpoldered and sealed [20]. Table 3 reflects the total population and its decadal growth rates in theKMC area since 1961 until 2011: The population growth rate in 1961 was higher than in 1971 and1981; nevertheless, the growth rate increased and peaked in 1991. An important factor triggeringrapid urbanization is economic growth and its related development of infrastructural facilities [55,56],frequently forcing uncontrolled urban sprawl [53,57]. In general, the rapid growth of cities stressestheir capacity to provide technical infrastructure and services such as energy, education, health care,transportation, and sanitation. Since governments have less revenue to provide the basic maintenanceand provision of services, massive urban sprawl occurs, locally affecting urban ecosystem [53]. Inmany developing countries rapid urbanization and low levels of technology are expected to affectecosystem services and to put more pressure on the urban community to cope with these changes [58].Studies like [3] can be combined with the frequent LULC changes to predict the futuristic pressure onthe urbanization in accordance with water security.
KMC’s water supply system is based on both, surface and subsurface waters [59].Bhagirathi-Hooghly, a major distributary of the Ganga about 500 km in length, is the main water

Land 2018, 7, 91 17 of 25
source for the entire city’s water supply system. In 1997, the average water supply for KMC’s urbanpopulation lasted less than four hours a day [60]. In 2014, in India (data from 28 cities) daily watersupply was 3.3 h on average while the hours of supply varied from 1 h per 3 days to 18 h per day [61].In contrast, in KMC the daily water supply was still 4 h on average, while serving 81% of populationand providing an average of 123 L per capita per day [27]. It exceeds the national average of 71.2% interms of the number of the people served (Table 4) [27,62].
Leakage from piped water supply systems, mainly originating from rusted iron pipes frequentlycauses interruption of the water supply [25]. Leaky water pipes expose the drinking water tocontamination and, thus, affect the public health [63]. Leakage and cracks in the piped watersystem also might cause fecal contamination of drinking water, which turns the whole system intoinsecurity [50]. However, according to the Central Pollution Control Board of India (CPCB), Indiancities should focus on the required availability and quality of the supplied drinking water (64). In 2006and 2011, all over India the non-revenue water due to leakages, unauthorized connections, billing,and collection inefficiencies, etc., was estimated to be 40–70% of the water distributed [64–66]. ForKolkata the economic effects of water leakage can be sketched as follows: water is supplied through adistribution network of 5500 km of underground water pipes, supported by 13 pumping stations in thefour zonal mains [12]. 30–35% of the pumped water is lost during transmission either through leaks ortheft. The resulting costs of water loss are estimated to about 2.7 million rupees annually (treated at4.50 rupees per 1000 L) [67].
Table 4. Comparison between National and Municipal Urban Service Delivery Status in KolkataMunicipal Corporation [23,62].
Water Supply Sewerage
Coverage(%)
Per CapitalAmount (IPCD)
Hours(Hours/Day)
Non-RevenueWater
MeteredConnections (%)
Coverage(%)
NationalAverage 81 123 4 - 25 28
KMC 92 134 8 93 0.1 43
Groundwater, the second major source of fresh water in the KMA, gets extracted for domestic andagricultural use in large quantities in areas distant from the river [26]. Due to the hydrogeologicsituation of Kolkata city, groundwater contamination by infiltration of polluted floodwater isconstricted [20]. Nevertheless, Kolkata and the Ganga-Brahmaputra delta lie in a geological zone withnaturally occurring arsenic in deeper strata. In consequence, arsenic concentrations higher than theWHO’s recommended maximum concentrations of 10 µg·L−1 were detected in groundwater from65 of 100 sampled wards in Kolkata monitored over a twenty-year study period [68]. The naturaloccurrence of arsenic in the aquifer is exacerbated by the over-extraction of groundwater [69]. A mostrecent study shows that the groundwater extraction in the KMC area was about 32 × 104 m3 perday and significantly exceeded groundwater recharge [70]. Over-extraction of the groundwater andreduced rate of aquifer recharge also cause ground subsidence [71].
5.2. Water Accessibility
Changes in land use-land cover influence the interaction of structural and behavioral factorsassociated with technological and environmental capacity, demand-supply and social relations. As aresult, the increased physical water demand of the growing population affects the accessibility of waterfor the citizens [72]. In case of urban India, nearly 70% of the households have access to tap water, outof which 62% have access to treated tap water [25]. Correspondingly, less than 30% of Indian urbanhouseholds depend on other sources of water than tap water [23–25]. All over India less than 50% ofthe urban population has access to piped water within their premises [23]. In 2007, in the KMC areaaround 74% of the population were served with water by house connections (and public taps in caseof slum areas) and provided continuous and uninterrupted water supply of 8.3 h daily [60]; the rest of

Land 2018, 7, 91 18 of 25
the households were accessing groundwater through private pumps or wells [60]. In the census datafrom 2011 [23], the percentage of households having access to piped water within the KMA increasedto 79% [17,66].
Between 2006 and 2011 revenues from user charges covered c. 30–40% of the operation andmaintenance costs of the water supply and sanitation infrastructure within the KMC area [65,66]. TheKMC does not levy tax on drinking water for the citizens [73]. Most urban water supply operationssurvive on large operating subsidies and capital grants [66]. The policy of not pricing water fordomestic use has received the authority’s criticism as it sends the wrong signals to consumers, thuspromoting wastage [60,74]. The consequence of underpricing, coming along with KMC’s overstaffingand large amount of unaccounted water is that KMC can hardly cover maintenance costs or providecapital through tariff revenues for infrastructure improvement [26,74]. KMC’s recovery of operationalcosts with an average of 15% is one of the lowest among Indian cities [74]. According to Majumdar &Gupta (2009), the issue of water conservation within the KMC area is completely neglected, which overtime has also required a mounting of government subsidies on water [75]. An analysis of the decade(from 1992 to 2002) reports that the expenditure for water supply and sewerage increased five times,whereas revenues only doubled [75]. Additionally, there has been a sharp decline in the groundwaterlevel, especially in central to south Kolkata as well as along the Eastern Metropolitan Bypass in the eastof KMC area (Rajpur-Sonarpur areas). In both areas settling-up intensified in recent years with thenewly settled areas being only barely tapped [13]. In consequence, the wealthy residents settling inthese newly constructed multi-story apartment blocks pump their own water as they do not trust onthe quality of the water supplied by civic bodies. Groundwater pumping within KMA is increasedwherever the access to surface water is limited [13].
Slums result from uncontrolled and invariable urban sprawl in and around Kolkata city sincethe Colonial era. Kolkata’s slums are characterized by high socio-economic and ethnic disparities andaccommodate approximately one third of Kolkata‘s population, occupying about half of the Kolkatametropolitan area (KMA) [13,23,24]. Slums and squatter settlements are in general physically distinct,with tile roofed kutcha huts, often made of brick, mud, and wattle, and are poorly serviced in termsof water, sanitation, sewerage, drainage, and waste disposal [53]. Accessibility to the public watersupply is limited and is mostly only available at some few stand posts [13]; during the summer daysthe supply shortage generally increases, and water quality degrades [76]. The water supply provisionof KMC does not sufficiently cover the water demand of these slum areas with 90 L per capita per day(lpd) while the estimated water demand of KMC’s inhabitants amounts to 180 lpd [77].
Poor and inadequate living conditions and municipal services increase the chances of lethal healthand sanitation issues [78]. These problems are especially critical in slums and squatters in fringeareas [49]. Peri-urban fringe areas (e.g., newly added wards, such as 101, 141–146) are lacking access topiped water supply from the municipality. The residents must either use the groundwater throughhandheld tube wells or get access from KMC supports such as water delivery by water trucks a fewtimes a week. The increasing numbers of slum dwellers have been the key concerns for urban planningin respect to accessibility of safe drinking water and availability of adequate sanitation facilities [79].
5.3. Water Related Disasters
In Kolkata seasonal flooding and its impact on the environment affects human health and isa significant challenge. Established in the Ganga delta frequent flooding is a natural phenomenon.Urban spread and unplanned occupation of the natural drainage system is a major source for theexposure of urbanized areas to flooding. 17.3% of Kolkata’s population live in areas of high flood risk(especially in ward numbers 14, 57, 58, 63, 66, 67, 74, 80, 108, 111–115, and 122–126; Table 1) [80]. Thesehigh-risk areas are located along canals and wetland areas that originally served as by-pass or retentionareas during flooding while today most of the canals are superstructed [80]. The land use-land coverchanges observed in the class of urban settlements clearly show that urbanization processes affected thedistribution surface waterbodies during the observation period (1980–2014). It resulted in the drainage

Land 2018, 7, 91 19 of 25
of wetlands and its replacement by either compact surfaces or barren land for further development.Another reason for the shrinkage of surface waterbodies was the vanishing of the trees in the city andthe resultant increased surface runoff [80]. Consequently, the groundwater table lowered [81–84]. Withthe increasing surface runoff and due to the poor sanitation conditions in these areas contamination ofsurface waterbodies by dissolved and solid matters increased. To improve water quality, 25 sewagetreatment plants (STPS) have been installed in West Bengal under phase II of the Ganga Action Planbetween 1993 and 1996, but the capacity available is still not sufficient [85]. There are two sewagetreatment plants (Bangur and Garden Reach STPs) installed outside the KMC area receiving wastewater from the KMC area; both were underutilized due to a lack of household connections in theircatchments, as until 2006 only 17% of the population in these areas had sewer connections [85,86].Due to the insufficiency of these measures dissolved oxygen levels, measured in July 2007 by theNational River Conservation Directorate and WBPCB, pointed out unsuitable bathing conditions atall monitoring stations in Kolkata when the value of dissolved oxygen levels reached less than 4 mgO2 L−1 [85]. Beyond, the total coliform count has been rising: while the average levels of coliformsin 2001–2002 were mostly within levels deemed to be suitable for bathing (max. 500 most probablenumbers × 100 mL−1), the 2005–2006 average increased to 423,125 most probable numbers × 100mL−1 at the Howrah Monitoring Station [85]. During severe flooding, such as in September 1999, theslum areas suffered from a paucity of power supply, acute shortages of safe drinking water, out breaksof water borne diseases such as Gastro-enteritis, Typhoid, Entamoebiasis, Hepatitis etc., and a long periodof water logging [81].
Palit et al. (2012) conducted a study on the potential of different water sources, both for drinkingand domestic purposes, for diarrheal disease transmission in Kolkata’s urban slums [87]. The resultsshow a significantly higher prevalence of fecal coliforms (58%) in stored water for washing than thestored water for drinking (28%) and tap/tube well water (8%) collected [87]. Samples containingstored water for washing also had the highest non-permissible range of physico-chemical parameters.Household water containers storing water for washing were rich in fecal coliforms and residualchlorine contents. Palit et al. (2012) found less than the satisfactory level of residual chlorine (57%),TDS (37%), and pH (20%) present in almost two thirds of the samples of water stored for washing [87].
The urbanization processes in the KMC area over the past four decades went along with a declinein vegetation cover and water bodies (Figures 7 and 8). The loss of green spaces coinciding with anincrease of built-up and sealed areas affects surface temperatures and causes the development of urbanheat islands [88]. Urban heat islands in turn have effects on rainfall patterns and intensities, threatenbiodiversity, and consequently affect water security [26,88]. The eastward expansion of Kolkata hasbeen accommodated at the expense of natural ecosystems, mainly the East Kolkata Wetlands. TheBasic Development Plan for the city completely disregards the ecological sensitivity of the East KolkataWetlands and proposes to develop two major townships near them [26]. Reclamation of wetlands forother commercial usages such as garbage dumping also seems to continue unabated, according to thesame WWF India report (2011) [26]. In consequence, unplanned and rough handled socio-economicactivities in the Kolkata Metropolitan area stress water quality [26,88,89].
6. Conclusions
This review provides a qualitative snapshot on the effects of land use-land cover change andwater management strategies to urban water insecurity in Kolkata Municipal Corporation (KMC)area during the last four decades. Beyond water’s functions in the hydrological cycle, it has social,economic, and environmental values, and is essential for sustainable development. Unprecedentedpopulation growth, a changing climate, rapid urbanization, expansion of infrastructure, migration,land conversion, and pollution translate into changes in the water fluxes, water pathways, and waterstores. Population density and per capita resource use have increased dramatically over the pastfour decades in KMC area; parallel, urban ecosystems have undergone significant modifications thataffect the vitality, quality, and availability of the water resources in KMC. The trends observed in
Land 2018, 7, 91 20 of 25
land use-land cover change in the KMC area reveal the drivers of the environmental changes whichindirectly, sometimes directly, affect the urban water security of KMC. Major driver is uncontrolledurbanization. Increased water use associated with domestic and small-scale industries and real estatebusiness is leading to changes in water supply infrastructure, high rates of groundwater use, and newwater conveyance networks. Collectively these changes lead to cumulative effects on water qualityand quantity of available water resources. Hence, the review envisages the relationship betweenurban water-based livelihood, water pollution, stakeholder interventions, and institutional responses.Selection, quantification, and integration of responsible bio-physical and socio-economic factors areneeded to be studied in details in the future and transferred into the policy that combines bio-physicaland social dimensions of the urban water security and governance.
Author Contributions: Conceptualization; Methodology, Software, Validation, Formal Analysis, Investigation,Resources, Data Curation, Writing-Original Draft Preparation, S.M.; Writing-Review & Editing, S.M., W.B. and B.S.;Visualization, S.M.; Supervision, W.B. and B.S.; Project Administration, S.M., W.B. and B.S.; Funding Acquisition,S.M. and B.S.
Funding: This research was funded by the German Academic Exchange Service (DAAD: Deutscher AkademischerAustauschdienst).
Acknowledgments: We thank our colleagues from Freie Universität Berlin who provided insight and expertisethat greatly assisted the research. We thank Basudeb Bhatta (Jadavpur University-Kolkata), Kalyan Rudra(WBPCB-Kolkata), Ayan Guin and Ena Sen (IESWM-Kolkata) for assistance with providing data and commentsthat greatly improved the research and manuscript. We would also like to show our gratitude to Pradip Sikdar(IISWBM- Kolkata) for sharing his pearls of wisdom with us during this research. We are also immensely gratefulto Jan Krause (Freie University Berlin), Sukdeb Pal (NEERI-India) and Arunagshu Mukherjee (CGWB-India) fortheir comments on an earlier version of the manuscript.
Conflicts of Interest: The authors declare no conflict of interest.
Appendix A
Table A1. Details of the Spectral and Spatial resolutions of the Satellite Imagery used.
Satellite-Sensor Bands Spectral Resolution (µm) Spatial Resolution (m)
Landsat-MSS
1 0.5–0.6
602 0.6–0.7
3 0.7–0.8
4 0.8–1.1
Landsat-TM
1 0.45–0.52
30
2 0.52–0.60
3 0.63–0.69
4 0.76–0.90
5 1.55–1.75
7 2.08–2.35
Landsat-ETM+
1 0.45–0.52
30
2 0.52–0.60
3 0.63–0.69
4 0.76–0.90
5 1.55–1.75
7 2.08–2.35
Resourcesat-1 LISS-III
2 0.52–0.59
23.53 0.62–0.68
4 0.77–0.86
5 1.55–1.70

Land 2018, 7, 91 21 of 25
References
1. Mohan, M.; Pathan, S.; Narendrareddy, K.; Kandya, A.; Pandey, S. Dynamics of Urbanization and Its Impacton Land-Use/Land-Cover: A Case Study of Megacity Delhi. J. Environ. Prot. 2011, 2, 1274–1283. [CrossRef]
2. Maiti, S.; Agrawal, P.K. Environmental Degradation in the Context of Growing Urbanization: A Focus onthe Metropolitan Cities of India. J. Hum. Ecol. 2005, 17, 277–287. [CrossRef]
3. Mukhopadhaya, S. Land use and land cover change modelling using CA-Markov Case study:Deforestation Analysis of Doon Valley. J. Agroecol. Nat. Resour. Manag. 2016, 3, 1–5. Availableonline: http://www.krishisanskriti.org/vol_image/09Jun201607065902%20%20%20%20%20%20%20%20%20%20Sayan%20Mukhopadhaya%202%20%20%20%20%20%20%201-5.pdf (accessed on 3 July 2018).
4. Reveshty, M.A. The assessment and predicting of land use changes to urban area using multi-temporalsatellite imagery and GIS: A case study on Zanjan, Iran (1984–2011). J. Geogr. Inform. Syst. 2011, 3, 298–305.
5. Ramachandra, T.V.; Bharath, A.H.; Sreekantha, S. Spatial Metrics based Landscape Structure and DynamicsAssessment for an emerging Indian Megalopolis. Int. J. Adv. Res. Artif. Intell. 2012, 1, 48–57.
6. Sudhira, H.S.; Ramachandra, T.V.; Jagadish, K.S. Urban sprawl: Metrics, dynamics and modelling using GIS.Int. J. Appl. Earth Observ. Geoinform. 2004, 5, 29–39. [CrossRef]
7. Romero-Lankao, P.; Gnatz, D.M. Conceptualizing Urban Water Security in an Urbanizing World.Curr. Opin. Environ. Sustain. 2016, 21, 45–51. [CrossRef]
8. Narain, V. Peri-urbanization, Land Use Change and Water security: A New Trigger for Water Conflicts?IIM Kozhikode Soc. Manag. Rev. 2016, 5, 5–7. [CrossRef]
9. United Nations. Transforming Our World: The 2030 Agenda for Sustainable Development; United Nations: Paris,France, 2015.
10. World Health Organization (WHO). Water Supply, Sanitation and Hygiene Development; World HealthOrganization: Geneva, Switzerland, 2013; Available online: http://www.who.int/water_sanitation_health/hygiene/en/ (accessed on 21 November 2016).
11. Watkins, K. Beyond Scarcity: Power, Poverty, and the Global Water Crisis; United Nations Human DevelopmentReport: New York, NY, USA, 2006; Volume 1, p. 2.
12. Anon. 71-City Water-Excreta Survey, 2005–06; Centre for Science and Environment: New Delhi, India, 2011.13. Basu, J. Kolkata, a Water-Rich City Turning Water-Poor, The Third Pole. 2016. Available online: https:
//www.thethirdpole.net/2015/11/11/kolkata-a-water-rich-city-turning-water-poor (accessed on 24 May2016).
14. Pal, M.; Ghosh, S.; Mukhopadhyay, M.; Ghosh, M. Methyl mercury in fish—A case study on various samplescollected from Ganges River at West Bengal. Environ. Monit. Assess. 2012, 184, 3407–3414. [CrossRef][PubMed]
15. United Nations Environment Programme-DHI and UNEP. Transboundary River Basins: Status and Trends;United Nations Environment Programme (UNEP): Nairobi, Kenya, 2016.
16. Sengupta, C.; Sukumaran, D.; Barui, D.; Saha, R.; Chattopadhyay, A.; Naskar, A.; Dave, S. Water HealthStatus in Lower Reaches of River Ganga, India. Appl. Ecol. Environ. Sci. 2014, 2, 20–24.
17. Singh, R.B.; Haque, M.S.; Grover, A. Drinking water, sanitation and health in Kolkata metropolitan city:Contribution towards urban sustainability. Geogr. Environ. Sustain. 2015, 8, 64–81. [CrossRef]
18. Maplecroft. Maplecroft’s 5th Annual Climate Change and Environmental Risk Atlas; Verisk Maplecroft: Bath, UK,2016; Available online: https://maplecroft.com/about/news/ccvi_2013.html (accessed on 13 October 2016).
19. Barata, M.; Ligeti, E.; De Simone, G.; Dickinson, T.; Jack, D.; Penney, J.; Rahman, M.; Zimmerman, R. Climatechange and human health in cities. In Climate Change and Cities in First Assessment Report of the Urban ClimateChange Research Network; Rosenzweig, C., Solecki, W.D., Hammer, S.A., Mehrotra, S., Eds.; CambridgeUniversity Press: Cambridge, UK, 2011; pp. 179–213.
20. Mishra, T. Groundwater Scenario in Major Cities of India; Central Ground Water Board, Ministry of WaterResources, Government of India: New Delhi, India, 2011.
21. CSE. Kolkata Water Profile: City of Joy Weeps for Water; Centre for Science and Environment: New Delhi,India, 2015; Available online: http://www.rainwaterharvesting.org/asp/d_feedback.htm (accessed on 13October 2016).
Land 2018, 7, 91 22 of 25
22. Diptendra, D.; Chattopadhyay, B.C. Characterization of soil over Kolkata municipal area. In Proceedingsof the Indian Geotechnical Conference, Guntur, India, 17–19 December 2009; pp. 11–12. Available online:https://gndec.ac.in/~igs/ldh/conf/2009/articles/T01_03.pdf (accessed on 13 November 2017).
23. Census of India. House Listing and Housing Census Data. 2011. Available online: http://www.censusindia.gov.in/2011census/hlo/HLO_Tables.html (accessed on 4 April 2018).
24. Census of India. Rural-Urban Distribution of Population (Provisional Population Totals); Government of India:New Delhi, India, 2011.
25. Wankhade, K.; Balakrishnan, K.; Vishnu, M.J. Urban Water and Sanitation: Sustaining Policy Momentum; IndianInstitute for Human Settlements: Bangalore, India, 2014.
26. World Wildlife Fund (WWF). Big Cities Big Water Big Challenges. Water in an Urbanizing World; World WideFund for Nature, WWF: Berlin, Germany, 2011; Available online: http://www.wwf.se/source.php/1390895/Big%20Cities_Big%20Water_Big%20Challenges_2011.pdf (accessed on 21 November 2016).
27. Kolkata Municipal Corporation. Kolkata Urban Sector Investment Plan; Kolkata Municipal Corporation:Kolkata, India, 2012.
28. ERDAS. ERDAS Field Guide; ERDAS LLC; Leica Geosystems Geospatial Imaging: Norcross, GA, USA, 1999.29. Chen, C. Frontiers of Remote Sensing Information Processing; World Scientific: Singapore, 2003; p. 614.30. Ismail, M.H.; Jusoff, K. Satellite data classification accuracy assessment based from reference dataset.
Int. J. Comput. Inf. Sci. Eng. 2008, 2, 96–102. Available online: http://www.waset.org/ijcise/v2/v2-2-16.pdf(accessed on 3 July 2018).
31. Bhatta, B. Remote Sensing and GIS; Oxford University Press: New Delhi, India, 2008.32. Bhatta, B. Analysis of urban growth pattern using remote sensing and GIS: A case study of Kolkata, India.
Int. J. Remote Sens. 2009, 30, 4733–4746. [CrossRef]33. Bhatta, B. Spatio-temporal analysis to detect urban sprawl using geoinformatics: A case study of Kolkata.
In Proceedings of the 7th All India Peoples’ Technology Congress, Kolkata, India, 6–7 February 2009; Forumof Scientists, Engineers & Technologists: Kolkata, India, 2009; pp. 434–442.
34. Bhatta, B. Modelling of urban growth boundary using geoinformatics. Int. J. Digit. Earth 2009, 2, 359–381.[CrossRef]
35. Mukhopadhaya, S. Fuzzy c-means classifier with alpha-cuts in application for similarity and dissimilaritymeasures: A literature survey. J. Basic Appl. Eng. Res. 2016, 3, 2350–2377. Available online:https://www.researchgate.net/profile/Sayan_Mukhopadhaya/publication/303880512_Fuzzy_c-Means_Classifier_with_Alpha-cuts_in_Application_for_Similarity_and_Dissimilarity_Measures_A_Literature_Survey/links/575a61e908ae414b8e46052e/Fuzzy-c-Means-Classifier-with-Alpha-cuts-in-Application-for-Similarity-and-Dissimilarity-Measures-A-Literature-Survey.pdf (accessed on 3 July 2018).
36. Narain, V. Periurban Water Security in a Context of Urbanization and Climate Change: A Review of Concepts andRelationships; Peri Urban Water Security Discussion Paper Series; Paper No. 1; SaciWATERs: Hyderabad,India, 2010.
37. Rudra, K. Water Resource and Its Quality in West Bengal; West Bengal Pollution Control Board: Kolkata, India,2009.
38. Falkenmark, M.; Widstrand, C. Population and Water Resources: A Delicate Balance; Population ReferenceBureau: Washington, DC, USA, 1992.
39. Ravell, J. Population Growth, Urbanisation and Water Security: A Case Study of Greater Brisbane; WaterSupply & Urbanization: Brisbane, Australia, 2014; Available online: https://www.academia.edu/7132376/Population_growth_urbanisation_and_water_security_A_case_study_of_Greater_Brisbane (accessed on 1April 2018).
40. Bakker, K.; Morinville, C. The governance dimensions of water security: A review. Phil. Trans. R. Soc. A 2013,371, 20130116. [CrossRef] [PubMed]
41. Biggs, E.M.; Duncan, J.M.A.; Atkinson, P.M.; Dash, J. Plenty of water, not enough strategy: How inadequateaccessibility, poor governance and a volatile government can tip the balance against ensuring water security:The case of Nepal. Environ. Sci. Policy 2013, 33, 388–394. [CrossRef]
42. Cook, C.; Bakker, K. Water security: Debating an emerging paradigm. Glob. Environ. Chang. 2012, 22, 94–102.43. Piesse, M. Water Security in Urban India: Water Supply and Human Health. Future Directions International,
2015. Available online: http://futuredirections.org.au/wp-content/uploads/2015/09/Water_Security_in_Urban_India_Water_Supply_and_Human_Health.pdf (accessed on 1 April 2018).

Land 2018, 7, 91 23 of 25
44. Blanca, F.M. Water Security in an Urbanized World: An Equity Perspective. 2016. Available online: https://depositonce.tu-berlin.de/bitstream/11303/6208/3/2016_Milan.pdf (accessed on 4 June 2018).
45. Goff, M.; Crow, B. What is water equity? The unfortunate consequences of a global focus on ‘drinking water’.Water Int. 2014, 39, 159–171. [CrossRef]
46. Jepson, W.; Budds, J.; Eichelberger, L.; Harris, L.; Norman, E.; O’Reilly, K.; Pearson, A.; Shah, S.; Shinn, J.;Staddon, C.; et al. Advancing human capabilities for water security: A relational approach. Water Secur.2017, 1, 46–52. [CrossRef]
47. Bar, I.; Stang, G. Water and Insecurity in the Lavant; European Union Institute for Security Studies (EUISS):Paris, France, 2016; Available online: http://www.jstor.org/stable/resrep06914 (accessed on 1 April 2018).
48. Turral, H.; Burke, J.; Faurès, J.M. Climate Change, Water and Food Security; FAO: Rome, Italy, 2011.49. Kundu, N. Understanding Slums: Case Studies for the Global Report on Human Settlements; UN-Habitat;
Earthscan: London, UK, 2003; pp. 195–228. Available online: http://www.ucl.ac.uk/dpu-projects/Global_Report/cities/kolkata.htm (accessed on 20 October 2016).
50. Roy, J.; Chattopadhyay, S.; Mukherjee, S.; Kanjilal, M.; Samajpati, S.; Roy, S. An Economic Analysis ofDemand for Water Quality: Case of Kolkata. Econ. Polit. Wkly. 2004, 39, 186–192.
51. Yadav, V.; Bhagat, R.B. Spatial Dynamics of Population in Kolkata Urban Agglomeration. In UrbanDevelopment Challenges, Risks and Resilience in Asian Mega Cities; Springer: Tokyo, Japan, 2014; pp. 157–173.
52. Banerjee, A. Migration in Slums of Kolkata: Examining Migrants’ Labour Market Outcomes. Working Paperfor National Institute of Urban Affairs under SHRAMIC (Strengthen and Harmonize Research and Actionon Migration in Indian Context) Portal. 2016. Available online: https://www.niua.org/sites/default/files/Working_paper_FINAL_VERSION.pdf (accessed on 10 May 2018).
53. Bhatta, B. Causes and Consequences of Urban Growth and Sprawl. In Analysis of Urban Growth and Sprawlfrom Remote Sensing Data. Advances in Geographic Information Science; Springer: Berlin, Germany, 2010.
54. Bennett, A.; Hindle, J. London Review of Books: An Anthology; Verso Books: London, UK, 1996; pp. 63–70.ISBN 1-85984-121-X.
55. World Bank. World Development Report 2009: Reshaping Economic Geography; The World Bank: Washington,DC, USA, 2009; Available online: https://openknowledge.worldbank.org/handle/10986/5991 (accessed on1 June 2017).
56. Tacoli, C.; McGranahan, G.; Satterthwaite, D. Urbanisation, Rural–Urban Migration and Urban Poverty;International Institute for Environment and Development and IOM Working Paper; International Institutefor Environment and Development: London, UK, 2015.
57. Theobald, D.M. Quantifying urban and rural sprawl using the sprawl index. Presented at the AnnualConference of the Association of American Geographers, New York, NY, USA, 2 March 2001.
58. D’Souza, R.; Nagendra, H. Changes in public commons as a consequence of urbanization: The Agara Lakein Bangalore, India. Environ. Manag. 2011, 47, 840–850. Available online: https://doi.org/10.1007/s00267-011-9658-8 (accessed on 12 May 2018).
59. Bhandari, L.; Gupta, A. Inputs for Health. In India Health Report 2010; Mahal, A., Debroy, B., Bhandari, L.,Eds.; R.K. Books: New Delhi, India, 2010.
60. Asian Development Bank. Benchmarking and Data Book of Water Utilities in India; ADB: Mandaluyong,Philippines, 2007.
61. Guha, S. 24-hour water supply need not be a pipe dream in urban India. The Times of India; Delhi, India,2014. Available online: http://blogs.timesofindia.indiatimes.com/plain-speak/24-hour-water-supply-need-not-be-a-pipe-dream-in-urban-india/ (accessed on 4 November 2016).
62. National Institute of Urban Affairs (NIUA). Urban Water Supply and Sanitation in Indian Cities; NIUA: NewDelhi, India, 2015.
63. Ghosh, G.K. Water of India (Quality and Quantity); A.P.H. Publishing Corporation: New Delhi, India, 2002.64. Central Pollution Control Board. Status of Water Quality in India-2011; Ministry of Environment and Forests,
Government of India: New Delhi, India, 2013.65. World Bank. India Water Supply and Sanitation—Bridging the Gap between Infrastructure and Service; The World
Bank: Washington, DC, USA, 2006; Available online: http://web.worldbank.org/archive/website01291(accessed on 1 June 2017).

Land 2018, 7, 91 24 of 25
66. World Bank. Urban Water Supply in India; The World Bank: Washington, DC, USA, 2011; Availableonline: http://www.worldbank.org/en/news/feature/2011/09/22/urban-water-supply-india (accessedon 1 June 2017).
67. Mukherjee, J.; Ghosh, A. Water Justice City Profile: Kolkata, India; The Bartlett Development Planning Unit,University College London: London, UK, 2015.
68. Chakraborti, D.; Das, B.; Rahman, M.M.; Chowdhury, U.K.; Biswas, B.; Goswami, A.; Nayak, B.; Pal, A.;Sengupta, M.K.; Ahamed, S. Status of groundwater arsenic contamination in the state of West Bengal, India:A 20-year study report. Mol. Nutr. Food Res. 2009, 53, 542–551. [CrossRef] [PubMed]
69. Segane, R. Water Management in Mega-Cities in India: Mumbai, Delhi, Calcutta, and Chennai. Water for UrbanAreas, Challenges and Perspectives; United Nations University Press: Tokyo, Japan, 2000; In Big Cities Big WaterBig Challenges; Water in an Urbanised World, WWF Report 2011; WWF: Germany, Berlin.
70. Sahu, P.; Sikdar, P.K. Groundwater potential zoning of a peri-urban wetland of south Bengal Basin, India.Environ. Monit. Asses. 2011, 174, 119–134. [CrossRef] [PubMed]
71. Chatterjee, R.S.; Fruneau, B.; Rudnat, J.P.; Rpy, P.S.; Frison, P.L.; Lakhera, R.C.; Dadhwal, V.K.; Saha, R.Subsidence of Kolkata (Calcutta) City, India during the 1990s as observed from space by Differential SyntheticAperture Radar Interferometry (D-InSAR) technique. Remote Sens. Environ. 2006, 102, 176–185. [CrossRef]
72. Verburg, P.H.; van Eck, J.R.; de Hijs, T.C.; Dijst, M.J.; Schot, P. Determination of land use change patterns inThe Netherlands. Environ. Plan. B Plan. Des. 2004, 31, 125–150. [CrossRef]
73. Ray, S. KMC Not to Levy Water Tax. The Times of India. 2014. Available online: https://timesofindia.indiatimes.com/city/kolkata/KMC-not-to-levy-water-tax/articleshow/45626143.cms (accessed on 30January 2018).
74. McKenzie, D.; Ray, I. Urban Water Supply in India: Status, Reform Options and Possible Lessons. Water Policy2009, 11, 442–460. [CrossRef]
75. Majumdar, C.; Gupta, G. Willingness to pay and municipal water pricing in transition: A case study.J. Integr. Environ. Sci. 2009, 6, 247–260. [CrossRef]
76. Beistline, H.A. Understanding the barriers of clean water access in urban slums of Kolkata, India.Christ. J. Glob. Health 2016, 3. [CrossRef]
77. Chakrabarti, C. A Sourcebook on Environment of Kolkata; Kolkata Environment Improvement Project; KolkataMunicipal Corporation: Kolkata, India, 2013.
78. Douglas, I. The Urban Environment; Edward Arnold (Publisher) Ltd.: London, UK, 1983.79. Sau, A. A study on water supply and sanitation at a slum in Kolkata. Int. J. Med. Sci. Public Health 2017, 6,
634–638. [CrossRef]80. SAFE-IWMI. A Report on Adi Ganga & Wetlands: Heal the Broken Link for a Flood Resilient Kolkata.
In Proceedings of the Symposium to Brainstorm Solutions for Sustainable Conservation of Wetlands &Adi Ganga, Kolkata, India, 28 February 2017; Available online: http://safeinch.org/uploads/Report%20-Symposium%20on%20Adi%20Ganga%20&%20Wetlands%202017.pdf (accessed on 4 April 2018).
81. Kiran, R.; Ramachandra, T.V. Status of Wetlands in Bangalore and its Conservation aspects.ENVIS J. Hum. Settl. 1999, 16, 2–10.
82. Ali, M.; Khan, S.J.; Aslam, I.; Khan, Z. Simulation of the impacts of land-use change on surface runoff of LaiNullah Basin in Islamabad, Pakistan. Landsc. Urban Plan. 2008, 102, 271–279. [CrossRef]
83. Hagler, B. Environmental Baseline Study of Margala and Margala North Blocks; MOL Pakistan Oil and GasCompany BV: Islamabad, Pakistan, 2007.
84. Mendoza, M.E.; Granados, E.L.; Geneletti, D.; Perez-Salicrup, D.R.; Salinas, V. Analysing land cover and landuse change processes at watershed level: A multi temporal study in the Lake Cuitzeo Watershed, Mexico(1975–2003). Appl. Geogr. 2011, 31, 237–250. [CrossRef]
85. Seth, B.L. Kolkata Reconnects with Its Riverfront. Down to Earth. 2007. Available online: http://www.downtoearth.org.in/news/kolkata-reconnects-with-its-riverfront-6666 (accessed on 4 April 2018).
86. Asian Development Bank. Proposed Supplementary Loan India: Kolkata Environmental Improvement Project; ADB:Kolkata, India, 2006.
87. Palit, A.; Batabyal, P.; Kanungo, S.; Sur, D. In-house contamination of potable water in urban slum of Kolkata,India: A possible transmission route of diarrhea. Water Sci. Technol. 2012, 66, 299–303. [CrossRef] [PubMed]

Land 2018, 7, 91 25 of 25
88. Buyadi, S.N.A.; Wan Mohd, W.M.N.; Misni, A. Impact of land use changes on the surface temperaturedistribution of area surrounding the National Botanic Garden, Shah Alam. Proc. Soc. Behav. Sci. 2013, 101,516–525.
89. Haque, M.S.; Singh, R.B. Air Pollution and Human Health in Kolkata, India: A Case Study. Climate 2016,5, 77. [CrossRef]
© 2018 by the authors. Licensee MDPI, Basel, Switzerland. This article is an open accessarticle distributed under the terms and conditions of the Creative Commons Attribution(CC BY) license (http://creativecommons.org/licenses/by/4.0/).