An analysis of pavement heat flux to optimize the water efficiency of a pavement-watering method

AN OPTIMIZATION MODEL FOR PAVEMENT MAINTENANCE PLANNING AND RESOURCE ALLOCATION
Mary I. Panagopoulou Department of Civil Engineering, University of Patras, Patras 26500, Greece 00302610450133 and 00306978232722 [email protected] and [email protected] Athanasios P. Chassiakos* Department of Civil Engineering, University of Patras, Patras 26500, Greece 00302610997655 [email protected] * Corresponding author Words: 6855 (including figures)
Panagopoulou M., Chassiakos A. 2
Abstract 1 Pavement Management Systems are widely used and are continuously being improved 2 because they can lead to considerable fund savings and/or to higher levels of service of 3 road pavements. In this work, a model for pavement maintenance, rehabilitation planning 4 and optimal resource allocation is presented. The objective function aims at minimizing a 5 generalized cost parameter which includes (1) agency cost, (2) user costs (including 6 vehicle operating cost for fuel consumption, vehicle maintenance and depreciation, travel 7 delay cost, accident cost, discomfort cost) and (3) environmental cost due to pavement 8 deterioration. The maintenance and rehabilitation treatments are considered with regard to 9 their cost and effectiveness characteristics. Besides the pavement condition deterioration 10 functions, which are represented by the PSI (Present Serviceability Index), other 11 constraints of the model include budgetary availability, threshold values for the minimum 12 accepted pavement condition levels, desirable pavement condition levels, maintenance and 13 rehabilitation treatment applicability and effectiveness. Due to the size and complexity of 14 the problem, a genetic algorithm has been used as an optimization tool. The optimization 15 runs over several road sections with different traffic and pavement condition 16 characteristics and within a time span defined by the user. The budgetary or the minimum 17 accepted pavement condition constraints can be altered in order to get a Pareto-front set of 18 optimal solutions for a particular application. The application presented indicates that the 19 model provides reasonable results in terms of the appropriate selection of maintenance and 20 rehabilitation treatments and the time of application. 21 22 Keywords: Pavement Management Systems, Pavement maintenance and rehabilitation, 23 Optimization models, Genetic algorithms 24 25 26 27 28 29 30 31 32 33 34 35 36 37 38 39 40 41 42 43 44 45 46 47 48 49
Panagopoulou M., Chassiakos A. 3
INTRODUCTION 1 In recent years the focus of the transportation authorities, researchers and practitioners is 2 being shifted from the construction of new roads to the management of existing road 3 structures and especially to road pavements. Road management requires a large investment 4 in order that the public agencies maintain and manage these infrastructures effectively. 5 However, effective management would yield a safe environment for public users and 6 protection to nature. 7
Planning and managing activities for a large network of transportation 8 infrastructure is a daunting task. Many projects and interests compete for the limited 9 resources allocated to a transportation agency and infrastructure management is only one 10 of such competing interests. How much resources to allocate to transportation 11 infrastructure and how to get the best value for the allocated resources have received high 12 priority by top management officials of these agencies. The decision makers who have to 13 make these types of choices often do so based on a number of criteria. Such criteria 14 include limited budget for capital and recurrent expenditure, the need to keep the 15 transportation network open at an acceptable level of service, etc. 16
Pavement management in a broad sense includes all the activities contained in the 17 planning, design, construction and rehabilitation of a pavement. Recommendations for 18 pavement maintenance include: selection of alternative treatments, present serviceability 19 of the pavement, likely performance of alternative treatments, required life of pavement, 20 costs, effects on traffic flow, effects on road user, availability of resources. That is why 21 alternative strategies, cost and life of each strategy, and a pavement management system 22 are desirable for effective development of pavement maintenance strategies. 23
Pavement maintenance strategies are closely related to and a component of 24 pavement management systems. A Pavement Management System (PMS) is a set of 25 defined procedures for collecting, analyzing, maintaining, and reporting pavement data, to 26 assist the decision makers in finding optimum strategies for maintaining pavements in 27 serviceable condition over a given period of time for the least cost. While a PMS cannot 28 make final decisions, it can provide the basis for an informed understanding of the possible 29 consequences of alternative decisions. The main components of a PMS are the models 30 used to predict pavement performance and the approach used to select the maintenance and 31 rehabilitation strategy (taking into account the expected pavement deterioration). 32
33 BACKGROUND 34 A pavement management system is designed to provide objective information and useful 35 data for analysis so that road managers can make more consistent, cost-effective, and 36 defensible decisions related to the preservation of a pavement network. Management 37 systems were originally designed in the 1970s as a result of significant work on roadways 38 in the U.S.A. and Canada. Initially, pavement management focused on project level, 39 coordinating improvements in design, restoration, maintenance and behavior of the model 40 of the surface. Subsequently, pavement management systems expanded their use at 41 network level, participating in the design, planning and allocating resources throughout 42 the network of roadways. 43
In 1976, a pavement management system is constructed based on economic 44 analysis by linear programming (1). The system takes into account the current condition of 45 the network and the expected service life and creates a list of pavements which are 46 indentified as candidates for rehabilitation. Every pavement is forecasted and evaluated 47 with alternative strategies. Until 1982, other methods, behavior curves and mathematical 48
Panagopoulou M., Chassiakos A. 4
models are used to identify the optimal solution for pavement maintenance and 1 rehabilitation. 2
During the 1980s, and particularly after the North American Pavement 3 Management Conference, held in Toronto, Canada, in 1985, pavement management 4 systems are recognized to be a major tool to aid the road engineer. The same period, the 5 development of artificial intelligence and its application to pavement management 6 problems begin and pavement management systems use expert and/or fuzzy systems, 7 neural networks and genetic algorithms to identify the optimal solution for maintenance. In 8 particular genetic algorithms are widely used because of their capacity to deal with 9 complex engineering optimization problems, and are recognized as the most useful method 10 of artificial intelligence in Pavement Management. 11
Fwa et al. (2) develop a computer model based on genetic algorithm to solve the 12 network level pavement management problem. The user enters the objective function that 13 wishes to optimize giving the appropriate parameters and modifying slightly the code of 14 the algorithm. This model demonstrated the easy adaptation of genetic algorithms in 15 pavement management problems but was not used any further. 16
The Australian Defence Force Academy (3) develops a pavement management 17 model based on genetic algorithms which considers agency cost and user vehicle operation 18 cost for life cost analysis. The system proposes for each segment of the pavement an 19 annual maintenance cost and identifies the optimal time period for the next treatment. The 20 model can be extended to incorporate political feedback. 21
Ferreira et al. (4) introduce a system which minimizes the cost of road maintenance 22 and recommends the best pavement treatment. The system is based on a deterministic 23 model for pavement deterioration. Furthermore, the system uses a genetic algorithm and 24 exports the results on a map through GIS model. In this system, only agency cost is 25 calculated and since the programming language and the design of the system are quite 26 outdated, the system needs enough time to define the optimal solution. Morcous and 27 Lounis (5) expand the research of Fereira and his team by using probabilistic models for 28 pavement deterioration and by applying the system in bridges pavements. 29
Herabat and Tangphaisankun (6) use a genetic algorithm for the construction of a 30 pavement management system for Thailand road network. The system uses linear models 31 based on IRI (International Roughness Index) and obtains five alternative strategies for 32 pavement maintenance. The model considers traffic as the only factor to influence 33 pavement distress and identifies the optimal solution minimizing vehicle operation cost. 34
Bosurgi and Trifiro (7) develop a pavement management system based on genetic 35 algorithms which investigates the best solution for pavement maintenance with an initial 36 standard budget. The pavement performance model is linear based on PSI (Present 37 Serviceability Index). The system receives a limited number of alternative treatments and 38 does not calculate total user cost. 39
From the literature review, it is shown that genetic algorithms are widely used in 40 pavement management systems to identify the maintenance solution which minimizes 41 agency cost. Few systems deal with user costs and these consider mainly vehicle operation 42 cost. In this paper a pavement management system is developed that can be used by 43 decision makers to define the optimal solution for pavement maintenance. The system 44 (Paveman) is based on genetic algorithms and minimizes the generalized cost (agency cost, 45 user costs and environmental cost), while keeping the road condition in high levels. 46 Finally, the program, unlike previous attempts, has an unlimited number of maintenance 47 strategies and it is made in a new programming language using the latest technologies, 48 therefore achieving better computational results. 49
Panagopoulou M., Chassiakos A. 5
1
OPTIMIZATION MODEL 2 Several pavement management systems are in use by many transportation agencies. There 3 are two types of management systems, those which are driven by optimization models and 4 those which rely on expert (knowledge) systems. As transportation networks become 5 larger and larger, it becomes imperative that some form of optimization modeling is 6 needed. The majority of such optimization models are of the type where a single objective 7 is optimized. In reality however, transportation officials are faced with multiple objectives 8 or criteria that need to be traded off before a final decision is reached. 9
The model presented in this article investigates the optimal solution for a time 10 period defined by the user. The system proposes a maintenance strategy for every year of 11 the analysis period and for each pavement segment. The optimal solution must satisfy 12 three objectives: 13
• The total agency cost for all the pavement segments do not exceed the initial 14 budget which is defined by the user. 15
• The generalized maintenance cost (agency cost, user costs due to pavement 16 deterioration and cost to the environment) is minimized. 17
• Pavement condition is maintained for all segments and throughout the whole 18 analysis period in high levels. 19
20 Objective function 21 The objective function consists of two parts, the second part satisfies the first two criteria 22 from above (cost part) and the first part satisfies the third objective (pavement condition 23 part). The optimal solution maximizes the objective function, which is defined as follows: 24 25 F = max [ R + a ( M − Psiav
(S ∙ T)2 ) + b ( B−Ca
Cgen ) ] (1)
R = � 1, if Ca ≤ B 0, if Ca > 𝐵
� (2)
s = 1, . . . , S and t = 1, . . . , T (3)
M = ��mT
t=1
S
s=1
(4)
m = � 1, if Psist−Psiend
2≥ Psimin
0, if Psist−Psiend2
< Psimin�
(5)
Psiav = ��Psist − Psiend
2
T
t=1
S
s=1
(6)
Ca = �� ctr
T
t=1
S
s=1
(7)
Panagopoulou M., Chassiakos A. 6
Cgen = Cu + Cenv + Ca (8)
Cu = �� cu
T
t=1
S
s=1
(9)
Cenv = �� cenv
T
T=1
S
s=1
(10)
where F is the objective function, ctr is the treatment cost for segment s in year t, S is the 1 number of road segments, T is the number of years in the planning time-span, B is the 2 initial budget, Ca is the agency cost for all the segments in the analysis period, R is a factor 3 which increments by one unit the value of the equation if the agency cost is less than the 4 initial budget, a and b are coefficients which take values from 0 to 1 depending on the 5 weight given on each part of the objective equation (Pareto method), cu is the user cost for 6 segment s in year t, cenv is the cost to the environment for segment s in year t, Cu the total 7 user cost for all the segments in the analysis period, Cenv the total cost to the environment 8 for all the segments in the analysis period, Cgen is the generalized maintenance cost for all 9 the segments in the analysis period, Psimin is the minimum acceptable pavement condition, 10 Psist is the initial pavement condition for segment s in year t, Psiend is the final pavement 11 condition (after the treatment) for segment s in year t, Psiav is the average pavement 12 condition for all the segments in the analysis period, m is a factor which adds one unit for 13 every segment in each year of the time-span when the average pavement condition is better 14 than the minimum acceptable one and M is the sum of m for all the segments in the 15 analysis period. 16 17 Pavement condition functions 18 Pavement management systems should include modules to predict the behavior of 19 pavements. Pavement performance models employed within a PMS may be deterministic 20 or probabilistic. Deterministic models use regression equations to describe the evolution of 21 pavement condition over time, whereas probabilistic models use Markov chains for the 22 same purpose. In this paper, a deterministic model is developed because deterministic 23 models describe pavement performance in detailed, quantitative terms, with reference to 24 the different types of distresses (cracking, rutting, etc.) that characterize pavement 25 condition. 26
Since the use of distinct performance models for each distress types does not add 27 substantial value to the decision process of this system, it is decided to use a generalized 28 model for evenness, which has been developed earlier by our team (8). The model is based 29 on expert opinions and fuzzy systems considering pavement related and traffic parameters. 30 The distress index is: 31
32 DIeven = 7.584 AGE1.265 MSN-0.844 TRAF0.2185 QUA-0.253 (11) 33 34 MSN = 0.0394 (b1d1 + b2d2 + b3d3) + SNSG (12) 35 36 d1 = d11 + d12 + d13 (13) 37 38 b1 = -8 10-13 psiasphalt
2 + 10-6 psiasphalt + 0.0904 (14) 39

Panagopoulou M., Chassiakos A. 7
1 psiasphalt = 145 Easphalt (15) 2 3 b2 = 0.249 log(psibase m2) – 0.977 (16) 4 5 psibase = 145 Ebase (17) 6 7 b3 = 0.277 log(psisubbase m3) – 0.839 (18) 8 9 psisubbase = 145 Esubbase (19) 10 11 SNSG = 3.51 log(CBR m4) – 0.85 [log(CBR m4)]2 – 1.43 (20) 12 13 CBR = Esubgrade/10 (21) 14 15 TRAF = ( Q
365 ) × ( 1
n ) TR (22) 16
17 where SNSG is a parameter for the contribution of soil on structural strength of the 18 pavement, CBR is the California Bearing Ratio (%), d11 is the thickness of the asphalt 19 overlay (mm), d12 is the thickness of the binder layer (mm), d13 is the thickness of the base 20 layer (mm), d1 is the thickness of the surface layer (mm), d2 is the thickness of the base 21 (mm), d3 is the thickness of the subbase (mm), Easphalt is the modulus of elasticity of the 22 surface layer (MPa), Ebase is the modulus of elasticity of the base (MPa), Esubbase is the 23 modulus of elasticity of the subbase (MPa), Esubgrade is the modulus of elasticity of 24 subgrade (MΡa), m2 is a factor that indicates moisture to the base (%), m3 is a factor that 25 indicates moisture to the subbase (%), m4 is a factor that indicates moisture to the subgrade 26 (%), Q is the annual average traffic flow (vehicles/year), TR is the truck ratio (%), n is the 27 number of lanes of the road segment which is examined, AGE is pavement age initiating 28 from last construction (in years), MSN is a structural strength parameter, TRAF is a traffic 29 load parameter and QUA is a construction quality parameter which takes values from 0 to 30 10 (10 represents good construction quality, 0 represents bad quality). 31
The evenness index (DIeven) is a dimensionless parameter which is valued from 0 to 32 100, where 0 represents the excellent pavement condition (no distresses) and 100 33 represents the poorest pavement situation (maximum severity of distresses, pavement 34 failure). The correlation of the evenness index with the PSI (Present Serviceability Index) 35 is calculated as follows: 36 37 PCI = 100 - DIeven (values from 100 to 0) (23)38 39 PSI = PCI / 20 (24) 40
41 The present serviceability index combines information from all distress types, 42
severity, and extent into a single number. This number can be used at the network level to 43 define the pavement condition (driving quality), to identify when treatments are needed, 44 for ranking or prioritization, and as a number used to forecast pavement condition. The 45 index values from 0 (unacceptable driving quality) to 5 (excellent driving quality). PSI 46 values decrease gradually with time. The value 2.5 is usually considered as a warning level 47

Panagopoulou M., Chassiakos A. 8
for maintenance of the pavement. When PSI index values less than 2.0, the pavement 1 segment is considered in poor condition and requires immediate rehabilitation. 2
3 Agency cost 4 The maintenance of pavements can be done with various alternative treatments. The 5 treatments present a large diversity in regard to suitability of intervention, materials and 6 equipment used, and unit cost. The maintenance strategies are evaluated based on their 7 cost and effectiveness. As treatment efficiency can be considered pavement life after 8 maintenance, which depends on the treatment type and the traffic volume of the road 9 segment. As a result, it is desirable to define different lifetime for the three levels of traffic 10 flow (low, medium, high). 11
In the system developed in this work, a number of maintenance strategies are 12 considered (Figure (1)). The user is further able to add other maintenance strategies if 13 necessary. Each treatment is associated with a unit cost and an expected pavement life 14 after maintenance. Unit costs consist of expenses for materials, machinery and manpower 15 required to maintain a square meter of the pavement surface. The unit cost may be adjusted 16 by the user if necessary. 17 18 User costs 19 Traffic is directly related to the development of the national economy of a country and is 20 the main reason for pavement deterioration and its impact on the cost of users. The best 21 way to reduce the cost of users is to maintain the road at higher condition levels. Pavement 22 management systems typically optimize maintenance costs but do not compute the cost of 23 users because it is difficult to be assessed. 24
User cost consists of four main components. These components are the vehicle 25 operation cost, accident cost, travel delay cost and discomfort cost. Vehicle operation cost 26 consists of cost for fuel consumption, vehicle maintenance and depreciation. 27 28 29
30 FIGURE 1 Maintenance and Rehabilitation Strategies of the System 31
32
Panagopoulou M., Chassiakos A. 9
Vehicle operation cost 1 Vehicle operation cost is directly dependent on the smoothness of the pavement surface. 2 An important element in vehicle operation cost is the type of vehicle and for this reason 3 the cost varies depending on vehicle type (heavy vehicles or passenger cars). The cost for 4 vehicle maintenance consists of the cost for vehicle parts and the cost of labor hours for 5 maintaining a vehicle. The cost for depreciation and the cost for vehicle maintenance in 6 relation to pavement condition are calculated as follows (9): 7 8 Cdepr(PC) = (0.0052 PSI2 – 0.0368PSI + 0.1067) L (25) 9 10 Cdepr(HT) = (0.0021 PSI2 – 0.0153PSI + 0.0459) L (26) 11 12 Cparts(PC) = 1.3852
100000 e−0.699 PSI PPC L (27) 13
14 Cparts(HT) = 0.5428
100000 e−0.472 PSI PHT L (28) 15
16 Cwork(PC) = 4.563 e−0.204 PSI W L
1000 (29) 17
18 Cwork(HT) = 26.864 e−0.245PSI W L
1000 (30) 19
20 where Cdepr(PC) is the cost for depreciation of a passenger car (€/vehicle), Cdepr(HT) is the 21 cost for depreciation of a heavy vehicle (€/vehicle), PSI is the pavement condition index, L 22 is the length of the road segment (km), Cparts(PC) is the cost for parts for a passenger car 23 (€/vehicle), Cparts(HT) is the cost for parts for a heavy vehicle (€/vehicle), PPC is the average 24 price of a typical passenger car (€), PHT is the average price of a common heavy vehicle 25 (€), Cwork(PC) is the cost of labor hours for maintaining a passenger car (€/vehicle), Cwork(HT) 26 is the cost of labor hours for maintaining a heavy vehicle (€/vehicle) and W is the average 27 hourly worker salary (€/hour). 28
Fuel cost because of pavement deterioration is given as follows: 29 30
Cfuel = - L1000
[0.1548 TR × Pd + 0.0846 (1 – TR) × Pun] ln (0.2 PSI) (31) 31 32 where Cfuel is the fuel cost due to pavement deterioration (€/vehicle), TR is the truck ratio 33 (%), Pd is the average diesel price (€/lt) and Pun is the average petrol price (€/lt). 34 35 Accident cost 36 The cost of accidents is hard to assess and this is because it is difficult to value human life. 37 Accidents happen due to various causes, the most important of which are human factors, 38 while the contribution of pavement condition is not as high but also not negligible. The 39 number of accidents that may be considered as having their origin to pavement condition is 40 calculated by the following equation (10): 41 42
Εa = L16.09344
e[−4.070 + 0.655 ln � Q365�− 0.345 PSI] (32) 43
44 where Ea is the number of accidents in one year due to pavement condition 45 (accidents/year) and Q is the annual average traffic flow (vehicles/year). 46

Panagopoulou M., Chassiakos A. 10
The cost of accidents is determined by the values of the cost components of an 1 accident which are obtained in the system as shown in Figure (2). These values can be set 2 up by the user of the system if this is necessary. 3
4 Travel delay cost 5 Travel delay cost due to pavement condition may be practically considered if pavement 6 condition drops below the alarm threshold (PSI ≤ 2 ). If pavement condition varies in the 7 range 1 < PSI ≤ 2 and pavement segments are parts of urban roads, then travel delay cost is 8 negligible. Otherwise travel delay cost is calculated (on the basis of data provided in (9)) 9 as follows: 10 11 Cdelay(PC) = L ×W
0.5779 PSI2+ 40.454 PSI+31.674 (33) 12
13 Cdelay(HT) = L ×W
18.981 PSI2+ 3.5838 PSI+39.056 (34) 14
15 where Cdelay(PC) is the travel delay cost of a passenger car (€/vehicle), Cdelay(HT) is the travel 16 delay cost of a heavy vehicle (€/vehicle) and W is the average hourly worker salary 17 (€/hour). 18 19 Discomfort cost 20 Often in pavement management studies the issue of comfort and discomfort of users is not 21 taken into account, because its quantification is difficult, as it is based on subjective 22 judgment of the users. In literature there are various estimations of discomfort cost in 23 relation with vehicle speed and pavement condition. The system presented in this article 24 uses some data for discomfort cost (11). 25 26 Environment cost 27 The cost to the environment consists of the pollution cost and the cost of extra noise as a 28 result of pavement deterioration. The system includes only the pollution cost as a result of 29 the extra fuel consumption to the atmosphere due to pavement deterioration. Pollution cost 30 is calculated as follows: 31 32
33 FIGURE 2 Accident Parameter Values in the System 34
35
Panagopoulou M., Chassiakos A. 11 1 Cpol = - L
Co ×100000 [0.234 TR + 0.127 (1 - TR)] ln (0.2 PSI) (35) 2
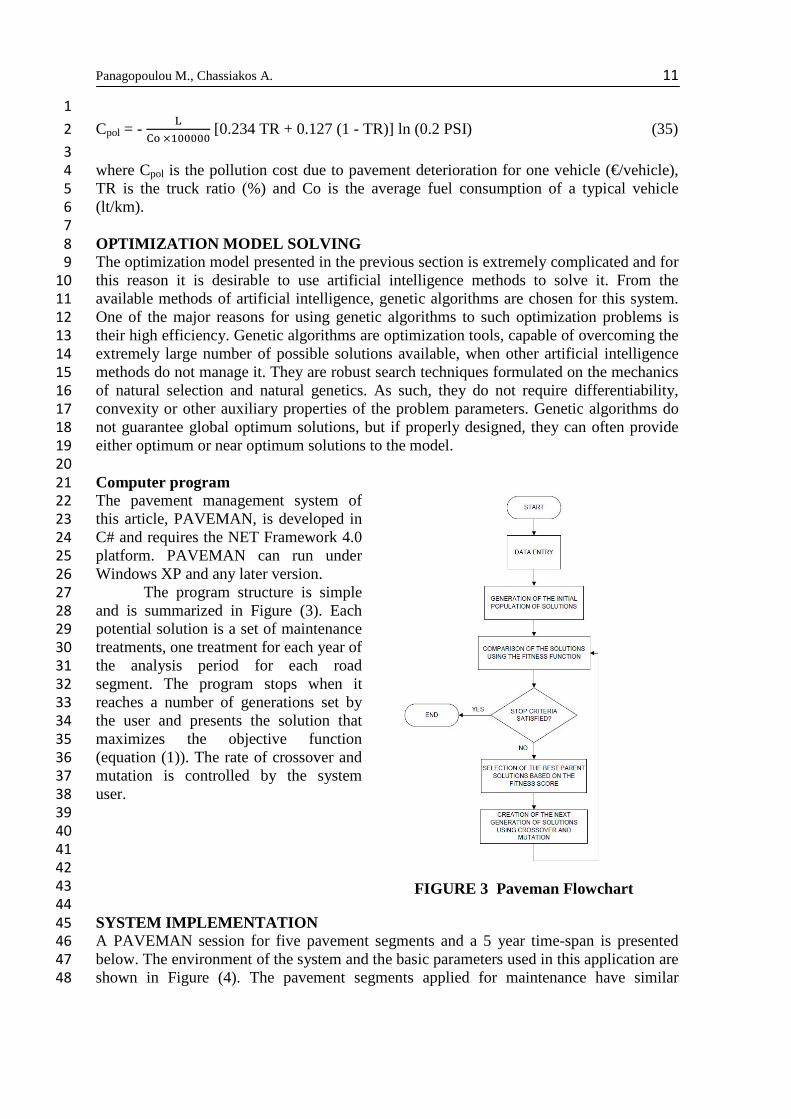
3 where Cpol is the pollution cost due to pavement deterioration for one vehicle (€/vehicle), 4 TR is the truck ratio (%) and Co is the average fuel consumption of a typical vehicle 5 (lt/km). 6 7 OPTIMIZATION MODEL SOLVING 8 The optimization model presented in the previous section is extremely complicated and for 9 this reason it is desirable to use artificial intelligence methods to solve it. From the 10 available methods of artificial intelligence, genetic algorithms are chosen for this system. 11 One of the major reasons for using genetic algorithms to such optimization problems is 12 their high efficiency. Genetic algorithms are optimization tools, capable of overcoming the 13 extremely large number of possible solutions available, when other artificial intelligence 14 methods do not manage it. They are robust search techniques formulated on the mechanics 15 of natural selection and natural genetics. As such, they do not require differentiability, 16 convexity or other auxiliary properties of the problem parameters. Genetic algorithms do 17 not guarantee global optimum solutions, but if properly designed, they can often provide 18 either optimum or near optimum solutions to the model. 19 20 Computer program 21 The pavement management system of 22 this article, PAVEMAN, is developed in 23 C# and requires the NET Framework 4.0 24 platform. PAVEMAN can run under 25 Windows XP and any later version. 26
The program structure is simple 27 and is summarized in Figure (3). Each 28 potential solution is a set of maintenance 29 treatments, one treatment for each year of 30 the analysis period for each road 31 segment. The program stops when it 32 reaches a number of generations set by 33 the user and presents the solution that 34 maximizes the objective function 35 (equation (1)). The rate of crossover and 36 mutation is controlled by the system 37 user. 38
39 40 41 42 43
44 SYSTEM IMPLEMENTATION 45 A PAVEMAN session for five pavement segments and a 5 year time-span is presented 46 below. The environment of the system and the basic parameters used in this application are 47 shown in Figure (4). The pavement segments applied for maintenance have similar 48
FIGURE 3 Paveman Flowchart

Panagopoulou M., Chassiakos A. 12 characteristics but different age (Figure (5)). Traffic flow is high in almost all pavement 1 sections (except of section 4). 2
The alternative treatments chosen for this application are five: crack filling with 3 aggregate-asphalt or other synthetic materials, local purge without squaring and laying of 4 hot or cold asphalt preceded by adhesion, milling in layers and leveling with a 4-5 cm 5 layer and then anti-slip matting, anti-slip matting and reconstruction. Finally there is 6 always the option “do nothing”. 7
The program is terminated in 10000 generations and extracts the best solution in 8 less than 2 minutes. The parameters a and b of the objective function are valued with 1, 9 indicating that both components of the objective function are equally weighted for this 10 application. 11
Tables (1) and (2) show two of the best solutions that the system produced. It is 12 observed that the fifth section, which is virtually new (2 years old), does not need any 13 maintenance since its condition is very good (PSI> 4). Particular emphasis is given in 14 sections 1 and 4 which are old. Although segment 4 is older than segment 1, the latter 15 needs the same attention because its traffic is high. 16
17
18 FIGURE 4 General Parameter Values of the Application 19
20 21
22 FIGURE 5 Pavement Segment Characteristics 23
24 25
From the two solutions it is obvious that the second is better because it results in 26 almost the same pavement condition as the first one, in quite lower agency cost, and in a 27 relatively comparable generalized cost. The objective function confirms the above 28 observations as it gets a value of 1.1979 for the second solution and 1.1951 for the first 29 one. The program proposes the second solution, but it may be useful to compare the 30

Panagopoulou M., Chassiakos A. 13 optimal result with other good solutions before making the final decision. In general, the 1 repeated application of the genetic algorithm leads to discrete solutions that form a cloud 2 of points in the decision parameter space. For instance, when comparing agency cost and 3 pavement condition, the best solutions of the program form a cloud of points around a 4 typical trade-off curve (Figure (6)). In this formation, a Pareto-front of optimal solutions 5 may be determined. 6 7 8
TABLE 1 A Solution of the System (not optimal) 9
10 11 12
TABLE 2 An Optimal Solution of the System 13
14 15
16 17
18 FIGURE 6 Total Cost and Pavement Condition of the best solutions 19
20 21 22 CONCLUSIONS 23 Nationally, pavements are deteriorating faster than they are being restored because 24 maintenance funding has not been sufficient to take care of all needs. The pavement 25 management system presented in this article aims to find optimal solutions for managing 26 pavement segments, in other words to maintain road segments above a desired pavement 27

Panagopoulou M., Chassiakos A. 14 condition threshold, minimizing the user cost and the cost to the environment without 1 exceeding the maintenance budget. 2
The optimization is developed using a genetic algorithm. The system (PAVEMAN) 3 is written in a new programming language that manages to solve large problems in a short 4 period of time. An application case study consisting of 5 pavement sections with a 5 year 5 analysis period and 5 available maintenance treatments is presented for which the system 6 reaches the optimal solution in less than two minutes. 7
The most appealing aspect of the program is its effort to calculate a generalized 8 cost parameter which includes the agency cost, the cost of users and the cost to the 9 environment due to pavement deterioration. The data and individual models used in the 10 system for calculating the generalized cost have been mostly derived from the literature. In 11 future works, these data could be better evaluated and, if necessary, new measurements 12 and experiments should be performed. Finally the optimization problem presented in this 13 article could be solved with other artificial intelligence methods and results may be 14 compared with the corresponding ones of PAVEMAN. 15
16 ACKNOWLEDGEMENTS 17 The authors thankfully acknowledge the support received from the software developers 18 Angelos Bousias and Konstantinos Bousias in developing the Paveman PMS. 19 20 REFERENCES 21
1. Hugo F., Scholtz W.J., Sinclair M., and Curtayne P.C., Management of pavement 22 rehabilitation, European Journal of Operational Research, No 42, 1998, pp. 129-23 141 24
2. Fwa T.F., Chan W.T., and Hoque K.Z., Network level programming for pavement 25 management using genetic algorithms, 4th International Conference on Managing 26 Pavements, 1998 27
3. Linard K., Application of system dynamics to pavement maintenance optimization, 28 1st Conference of Systems Thinking in Management, Geelong, Australia, 2000 29
4. Fereira A., Picado-Santos L., and Antunes A., A segment – linked optimization 30 model for deterministic pavement management systems, The International Journal 31 of Pavement Engineering, Vol. 3 (2), 2002, pp. 95-105 32
5. Morcous G., and Lounis Z., Maintenance optimization in infrastructure networks 33 using genetic algorithms, Automation in Construction, No 14, 2002, pp. 129-142 34
6. Herabat P., and Tangphaisankun A., Multi-Objective optimization model using 35 constraint-based genetic algorithms for Thailand pavement management, Journal 36 of Eastern Asia Society for Transportation Studies, Vol. 5, 2005, pp. 1137-1152 37
7. Bosurgi G., and Trifiro F., Pavement design and maintenance via genetic 38 algorithms, 4th International SIIV Congress, Palermo, Italy, 2007 39
8. Loukeri E.D., and Chassiakos A.P., Development of pavement performance models 40 using fuzzy systems, Proceedings of the 4th International Conference on 41 Engineering Computational Technology, Stirling, Scotland, 2004 42
9. Bennett C., and Greenwood I. , Modelling road user and environmental effects in 43 HDM-4, The Highway Development and Management Series, Vol. 7, 2001 44
10. Chan C., Huang B., Yan X., and Richards S., Effects of asphalt pavement 45 conditions on traffic accidents in Tennessee utilizing pavement management system 46 (PMS), Southeastern Transportation Center, 2008, University of Tennessee, 47 Knoxville 48
11. Mouratidis A. The management of roads, University Studio Press, 2008 (in Greek). 49
Copyright © 2022 FDOKUMEN