An online model composition tool for system biology models
15
SOFTWARE Open Access An online model composition tool for system biology models Sarp A Coskun 1 , A Ercument Cicek 2 , Nicola Lai 3 , Ranjan K Dash 4 , Z Meral Ozsoyoglu 1 and Gultekin Ozsoyoglu 1* Abstract Background: There are multiple representation formats for Systems Biology computational models, and the Systems Biology Markup Language (SBML) is one of the most widely used. SBML is used to capture, store, and distribute computational models by Systems Biology data sources (e.g., the BioModels Database) and researchers. Therefore, there is a need for all-in-one web-based solutions that support advance SBML functionalities such as uploading, editing, composing, visualizing, simulating, querying, and browsing computational models. Results: We present the design and implementation of the Model Composition Tool (Interface) within the PathCase- SB (PathCase Systems Biology) web portal. The tool helps users compose systems biology models to facilitate the complex process of merging systems biology models. We also present three tools that support the model composition tool, namely, (1) Model Simulation Interface that generates a visual plot of the simulation according to user’s input, (2) iModel Tool as a platform for users to upload their own models to compose, and (3) SimCom Tool that provides a side by side comparison of models being composed in the same pathway. Finally, we provide a web site that hosts BioModels Database models and a separate web site that hosts SBML Test Suite models. Conclusions: Model composition tool (and the other three tools) can be used with little or no knowledge of the SBML document structure. For this reason, students or anyone who wants to learn about systems biology will benefit from the described functionalities. SBML Test Suite models will be a nice starting point for beginners. And, for more advanced purposes, users will able to access and employ models of the BioModels Database as well. Keywords: System biology models, Simulation, Composition, ODE solver Background Systems biology researchers have built, over the years, a large number of computational biological models, and, these models are recently becoming available in web- based data repositories such as the BioModels Database [1] and CellML Model Repository [2]. These web-based data repositories store hundreds of computational models, and provide manual curations of some of the models submitted by researchers. Systems Biology Markup Language (SBML) is a stand- ard for exchanging and storing biological-biochemical models. The majority of SBML models published to date involve specific and, most of the time, small biological sub-networks of organisms. Nonetheless, creating more complete or larger models of biological networks and simulating their behavior on a wider biological network provides a better understanding of how networks inter- act with each other. With the increasing number of models being published, there is a need to (1) compose larger models out of the existing models, and (2) simu- late them on the spot, and on the web, if possible. Randhawa, R et al. [3] proposed windows-based model- ing tools to develop new models from the combination of multiple models. They define three different operators to combine SBML models, namely, Fusion, Composition, Aggregation and Flattening [4]. Partial implementations of these approaches can be found at JigCell’ s web site [5]. Other groups proposed different composition tools such as SBMLmerge [6], sematicsSBML [7], and plugins for CellDesigner [8] for SBML Levels 1 and 2. The online version of semanticSBML, the successor of SBMLmerge, allows users to combine biochemical networks with iden- tical species and/or reactions. Although the current ver- sion has limited functionality, it provides unique features * Correspondence: [email protected] 1 Electrical Engineering and Computer Science Department, Case Western Reserve University, Cleveland, OH, USA Full list of author information is available at the end of the article © 2013 Coskun et al.; licensee BioMed Central Ltd. This is an Open Access article distributed under the terms of the Creative Commons Attribution License (http://creativecommons.org/licenses/by/2.0), which permits unrestricted use, distribution, and reproduction in any medium, provided the original work is properly cited. Coskun et al. BMC Systems Biology 2013, 7:88 http://www.biomedcentral.com/1752-0509/7/88
-
Upload
independent -
Category
Documents
-
view
4 -
download
0
Transcript of An online model composition tool for system biology models
Coskun et al. BMC Systems Biology 2013, 7:88http://www.biomedcentral.com/1752-0509/7/88
SOFTWARE Open Access
An online model composition tool for systembiology modelsSarp A Coskun1, A Ercument Cicek2, Nicola Lai3, Ranjan K Dash4, Z Meral Ozsoyoglu1 and Gultekin Ozsoyoglu1*
Abstract
Background: There are multiple representation formats for Systems Biology computational models, and theSystems Biology Markup Language (SBML) is one of the most widely used. SBML is used to capture, store, anddistribute computational models by Systems Biology data sources (e.g., the BioModels Database) and researchers.Therefore, there is a need for all-in-one web-based solutions that support advance SBML functionalities such asuploading, editing, composing, visualizing, simulating, querying, and browsing computational models.
Results: We present the design and implementation of the Model Composition Tool (Interface) within the PathCase-SB (PathCase Systems Biology) web portal. The tool helps users compose systems biology models to facilitate thecomplex process of merging systems biology models. We also present three tools that support the modelcomposition tool, namely, (1) Model Simulation Interface that generates a visual plot of the simulation according touser’s input, (2) iModel Tool as a platform for users to upload their own models to compose, and (3) SimCom Toolthat provides a side by side comparison of models being composed in the same pathway. Finally, we provide aweb site that hosts BioModels Database models and a separate web site that hosts SBML Test Suite models.
Conclusions: Model composition tool (and the other three tools) can be used with little or no knowledge of theSBML document structure. For this reason, students or anyone who wants to learn about systems biology willbenefit from the described functionalities. SBML Test Suite models will be a nice starting point for beginners. And,for more advanced purposes, users will able to access and employ models of the BioModels Database as well.
Keywords: System biology models, Simulation, Composition, ODE solver
BackgroundSystems biology researchers have built, over the years, alarge number of computational biological models, and,these models are recently becoming available in web-based data repositories such as the BioModels Database[1] and CellML Model Repository [2]. These web-baseddata repositories store hundreds of computational models,and provide manual curations of some of the modelssubmitted by researchers.Systems Biology Markup Language (SBML) is a stand-
ard for exchanging and storing biological-biochemicalmodels. The majority of SBML models published to dateinvolve specific and, most of the time, small biologicalsub-networks of organisms. Nonetheless, creating morecomplete or larger models of biological networks and
* Correspondence: [email protected] Engineering and Computer Science Department, Case WesternReserve University, Cleveland, OH, USAFull list of author information is available at the end of the article
© 2013 Coskun et al.; licensee BioMed CentralCommons Attribution License (http://creativecreproduction in any medium, provided the or
simulating their behavior on a wider biological networkprovides a better understanding of how networks inter-act with each other. With the increasing number ofmodels being published, there is a need to (1) composelarger models out of the existing models, and (2) simu-late them on the spot, and on the web, if possible.Randhawa, R et al. [3] proposed windows-based model-
ing tools to develop new models from the combination ofmultiple models. They define three different operators tocombine SBML models, namely, Fusion, Composition,Aggregation and Flattening [4]. Partial implementations ofthese approaches can be found at JigCell’s web site [5].Other groups proposed different composition tools
such as SBMLmerge [6], sematicsSBML [7], and pluginsfor CellDesigner [8] for SBML Levels 1 and 2. The onlineversion of semanticSBML, the successor of SBMLmerge,allows users to combine biochemical networks with iden-tical species and/or reactions. Although the current ver-sion has limited functionality, it provides unique features
Ltd. This is an Open Access article distributed under the terms of the Creativeommons.org/licenses/by/2.0), which permits unrestricted use, distribution, andiginal work is properly cited.
Coskun et al. BMC Systems Biology 2013, 7:88 Page 2 of 15http://www.biomedcentral.com/1752-0509/7/88
to set and edit annotations of the models during the mer-ging process. Furthermore, the plugins for CellDesignerprovides a user friendly graphical interface for model com-position. However, CellDesigner is not web-based.More recently, SBML Level 3 core was released with
new specifications to enable users to perform hierarch-ical composition and exchange of SBML models [9]. Tocompose and analyze SBML models defined with differentSBML packages, there is a need for an integrated web-based environment and multiple tools, which provide:
� Advanced editing capabilities to redefine modelelements,
� Simulation (ODE solvers) to quantify biochemicaland physical processes,
� Visualization capabilities to identify metabolicnetwork characteristics, and
� Selection of different computational models from arepository database.
Towards fulfilling the above-mentioned needs, we havedeveloped an all-in-one web interface to compose newmodels from models defined in SBML format as a toolwithin PathCase-SB [10,11]. For the PathCase-SB Com-position Interface, we use an approach similar to Fusion,and employ no additional non-standard SBML syntax inthe combined model. In particular, the composed modelcontains all information of the submodels used in thecomposition process without any redundancies, althoughthe information related to the relationship betweenelements of the composed model and the submodel islost. When two models are combined, the simulationinterface is available to simulate the composed modelwithout any additional steps. As the composed modelfollows standard SBML specifications, visualization inter-face works on the composed model on the fly. Thevisualization tool uses yFiles library, which returns the lay-out to be drawn [12]. Details of the visualization interfacehave been described in Elliott et al. [13] and in Coskunet al. [11].Since the Fusion approach is not reversible, our com-
position interface provides simulation, visualization, andSBML output of models being combined to help themodeler during the composition step. A semi-automaticmatching algorithm (AutoMerge) for name overlappingin the models is used to combine the models. AutoMergeapplies a MIRIAM annotation-based [14] and exact namematching-based algorithm to merge SBML elements andprevent SBML element duplication.We have released two versions of the web site. The
first one [15] hosts BioModels Database models, and thesecond one [16] hosts SBML Test Suite models. Whilethe former one provides a system where advanced userscan merge complex models published in the BioModels
Database, the latter one provides basic models for begin-ners to practice and learn the composition process, orfor any researcher who wants to understand the specificsof the composition algorithm.The new features of the proposed Model Composition
Tool are:
� All-in-one hierarchical model composition capabilityand details of how it works.
○ Describing how each process (merging andsimulation, iteratively) is done, and○ Giving specific examples at the very end that
show how the model composition tool works.� Evaluation of the tool via models from both the
BioModels Database (as uploaded into PathCase-SBdatabase) and the SBML Test Suite.
� MIRIAM annotation-based and exact name-basedspecies/reaction/compartment matching modules.
� Discussion of the architectural advantages ofPathCase-SB as applied to the Model CompositionInterface in terms of support for multiple simulationengine use. The simulation engine (currently,RoadRunner) can easily be replaced by anothersimulation engine, so long as the new engine doesprovide a web service functionality.
� Comparison of our model composition approachwith other systems, and discussing our designdecisions.
� Introduction of our clone web-site which only hostsSBML Test Suite models. We believe that this sitemay have educational use, and may allowresearchers to experiment with the model mergingcomponent.
ImplementationIn this section we describe the details of the model com-position interface, the merge algorithm and the modelsimulation interface.
Composition interfaceIn this subsection, to illustrate and explain the interfacecomponents, we apply the model composition tool totwo sample models [17,18]. The PathCase-SB ModelComposition Interface provides a three-step model com-position process for computational models defined inSBML format. After clicking the “Compose Models” linkon the main page, the user selects two models to becombined. The models can be uploaded by the user, orselected from models stored in the PathCase-SB database.As of January 2013, there are 366 parsed SBML models onPathCase-SB database; and testing each model from thisrelatively large dataset may be time-consuming to users.To help researchers with the model selection, PathCase-SB provides extensive browsing capabilities for parsed
Coskun et al. BMC Systems Biology 2013, 7:88 Page 3 of 15http://www.biomedcentral.com/1752-0509/7/88
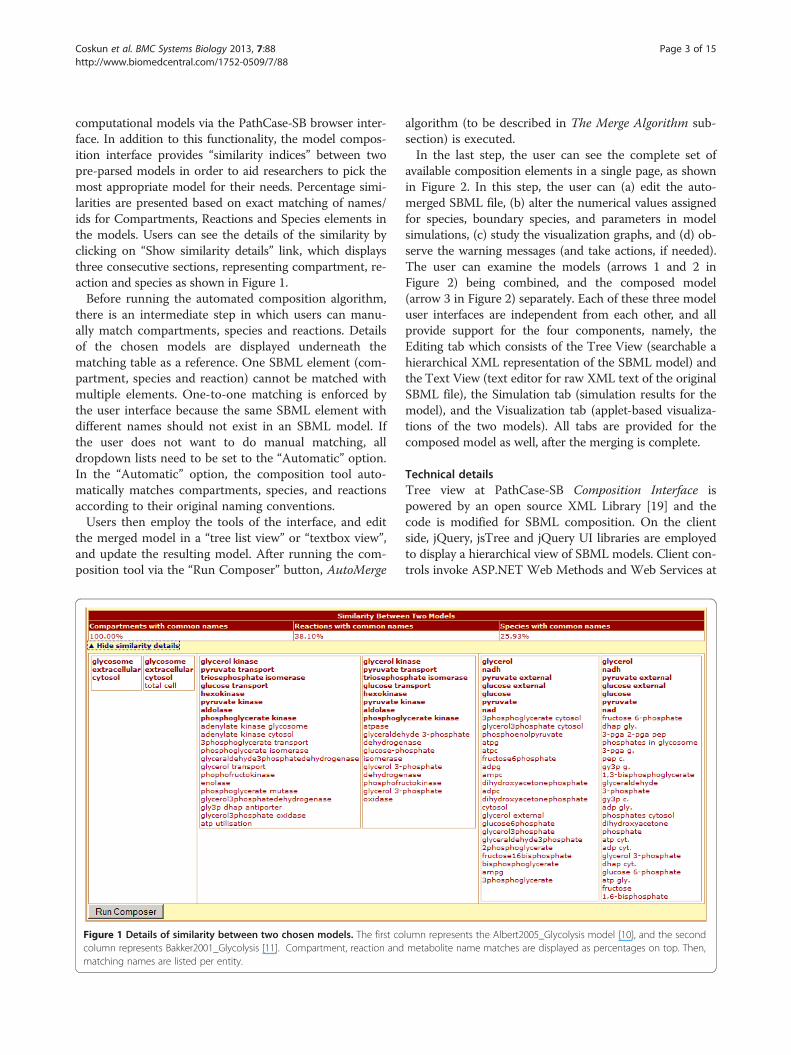
computational models via the PathCase-SB browser inter-face. In addition to this functionality, the model compos-ition interface provides “similarity indices” between twopre-parsed models in order to aid researchers to pick themost appropriate model for their needs. Percentage simi-larities are presented based on exact matching of names/ids for Compartments, Reactions and Species elements inthe models. Users can see the details of the similarity byclicking on “Show similarity details” link, which displaysthree consecutive sections, representing compartment, re-action and species as shown in Figure 1.Before running the automated composition algorithm,
there is an intermediate step in which users can manu-ally match compartments, species and reactions. Detailsof the chosen models are displayed underneath thematching table as a reference. One SBML element (com-partment, species and reaction) cannot be matched withmultiple elements. One-to-one matching is enforced bythe user interface because the same SBML element withdifferent names should not exist in an SBML model. Ifthe user does not want to do manual matching, alldropdown lists need to be set to the “Automatic” option.In the “Automatic” option, the composition tool auto-matically matches compartments, species, and reactionsaccording to their original naming conventions.Users then employ the tools of the interface, and edit
the merged model in a “tree list view” or “textbox view”,and update the resulting model. After running the com-position tool via the “Run Composer” button, AutoMerge
Figure 1 Details of similarity between two chosen models. The first cocolumn represents Bakker2001_Glycolysis [11]. Compartment, reaction andmatching names are listed per entity.
algorithm (to be described in The Merge Algorithm sub-section) is executed.In the last step, the user can see the complete set of
available composition elements in a single page, as shownin Figure 2. In this step, the user can (a) edit the auto-merged SBML file, (b) alter the numerical values assignedfor species, boundary species, and parameters in modelsimulations, (c) study the visualization graphs, and (d) ob-serve the warning messages (and take actions, if needed).The user can examine the models (arrows 1 and 2 inFigure 2) being combined, and the composed model(arrow 3 in Figure 2) separately. Each of these three modeluser interfaces are independent from each other, and allprovide support for the four components, namely, theEditing tab which consists of the Tree View (searchable ahierarchical XML representation of the SBML model) andthe Text View (text editor for raw XML text of the originalSBML file), the Simulation tab (simulation results for themodel), and the Visualization tab (applet-based visualiza-tions of the two models). All tabs are provided for thecomposed model as well, after the merging is complete.
Technical detailsTree view at PathCase-SB Composition Interface ispowered by an open source XML Library [19] and thecode is modified for SBML composition. On the clientside, jQuery, jsTree and jQuery UI libraries are employedto display a hierarchical view of SBML models. Client con-trols invoke ASP.NET Web Methods and Web Services at
lumn represents the Albert2005_Glycolysis model [10], and the secondmetabolite name matches are displayed as percentages on top. Then,
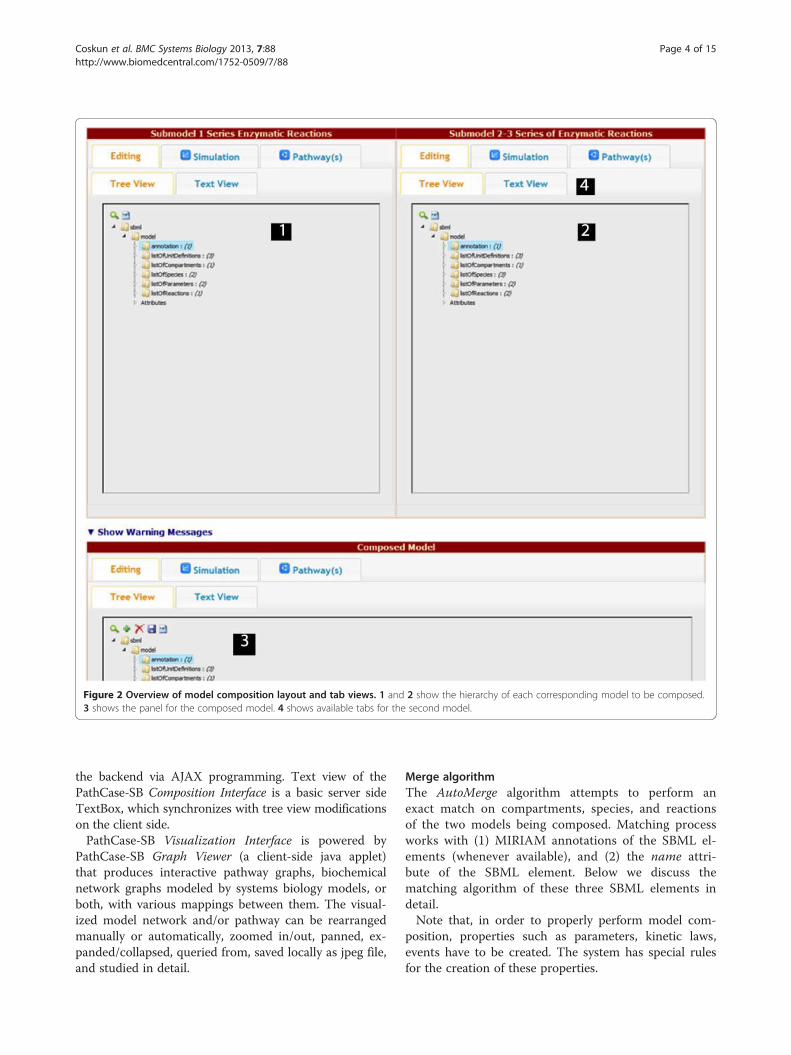
Figure 2 Overview of model composition layout and tab views. 1 and 2 show the hierarchy of each corresponding model to be composed.3 shows the panel for the composed model. 4 shows available tabs for the second model.
Coskun et al. BMC Systems Biology 2013, 7:88 Page 4 of 15http://www.biomedcentral.com/1752-0509/7/88
the backend via AJAX programming. Text view of thePathCase-SB Composition Interface is a basic server sideTextBox, which synchronizes with tree view modificationson the client side.PathCase-SB Visualization Interface is powered by
PathCase-SB Graph Viewer (a client-side java applet)that produces interactive pathway graphs, biochemicalnetwork graphs modeled by systems biology models, orboth, with various mappings between them. The visual-ized model network and/or pathway can be rearrangedmanually or automatically, zoomed in/out, panned, ex-panded/collapsed, queried from, saved locally as jpeg file,and studied in detail.
Merge algorithmThe AutoMerge algorithm attempts to perform anexact match on compartments, species, and reactionsof the two models being composed. Matching processworks with (1) MIRIAM annotations of the SBML el-ements (whenever available), and (2) the name attri-bute of the SBML element. Below we discuss thematching algorithm of these three SBML elements indetail.Note that, in order to properly perform model com-
position, properties such as parameters, kinetic laws,events have to be created. The system has special rulesfor the creation of these properties.
Coskun et al. BMC Systems Biology 2013, 7:88 Page 5 of 15http://www.biomedcentral.com/1752-0509/7/88
To compare SBML models element by element cor-rectly, models should be compatible in terms of theirSBML Levels. Otherwise, the structure and attributes ofspecific XML elements may differ in different levels[20]. AutoMerge assumes that SBML models beingcomposed are compatible and created following correctSBML guidelines.AutoMerge checks for matches in species, compartment
attributes, sboTerm attributes (if available) for species, andreactions. Details of the matching are discussed next.Compartments. A standard SBML element for a com-
partment contains id, name and, optionally, sboTermXML attributes that are used for comparison. Compart-ment matching is based on the annotation and name at-tributes is accomplished as follows:
1. If the name attribute of compartment elementsmatch or there is a shared MIRIAM annotationamong two compartment elements, merge thecompartments into one compartment via pivotingthe first model. XML elements such as name, units,size and sboTerm of the first model override theXML attributes of the second model, and theseoverwrites are displayed in the warnings section ifthe values are different.
2. Otherwise, do not merge the compartments, andadd both compartments as separate compartmentsinto the composed model definition.
Reactions. For reaction elements, attribute informationabout annotation, name, reactants and products for eachreaction of the first SBML model are compared andmatched to those of the reactions in the second SBMLmodel, in order to identify whether the two SBMLmodels share common reactions. While comparing tworeactions, AutoMerge first checks name element similar-ities, and then reactants and products of the reaction.Reaction matching is accomplished as follows.
1. Merge the two reactions (say, R1 and R2) into onewhen the following three conditions are satisfied.
a. R1 and R2 have a shared MIRIAM annotation,b. The name elements of the reaction R1 and R2 arethe same,c. The list of reactant(s) of the reaction R1 and R2
are the same,d. The list of product(s) of the reaction R1 and R2
are the same;2. Otherwise, do not merge reactions, and generate
two different reactions in the composed modeldefinition.
The composition prepends the model identifier as a pre-fix to the reaction name of the second model. Therefore,
even when the ids of the reactions are the same, they donot override each other. For instance, if reaction R1 existsas a name in both models and they do not match,AutoMerge does not change reaction name and id attri-butes of the first model, but changes the reaction nameand id attributes of the second model to id-of-model2_R1,given id-of-model2 is the identifier of model 2.In order to apply the matching rules, AutoMerge first
parses the name attribute of reaction, and then childrenXML elements of listOfReactants and listOfProductstags to find reactants and attributes, respectively.Species. Matching is based on name attribute, and
MIRIAM annotations. If the same species are namedwith the same convention or have a shared annotation,automated algorithms can easily match these two spe-cies, merge them, and the merged species entity into thecomposed model.For species, AutoMerge checks two XML attributes
while comparing them, namely, name and compartment.Species matching is accomplished as follows.
1. If both name and compartment attributes of twospecies match, or two species have a sharedannotation, merge the two species into one. Value ofthe initial concentration attribute of the first modeloverrides the second model; but, if values aredifferent in the two models then this mergeinformation is displayed in the warnings panel.
2. Otherwise, insert both species as different species,together with their compartment information, intothe composed model definition.
In order to differentiate references to different libraries,the XML specification uses namespaces defined by xmlnsattribute. While combining two models, AutoMerge cre-ates a union of available namespaces in the models beingcompared.As AutoMerge applies the above-listed rules, some
parts of SBML documents may not merge correctly. Inthat case, the model composition interface provides a listof Warning Messages. During comparison, some XMLattributes such as units, initialAmounts, and stoichiom-etry may not match even when the ids and names ofXML elements do match. When the model compositioninterface merges elements with differing attribute values,a list of warnings is displayed. In such cases when twomerged elements have different values for the sameattribute, the value in the first model is used for thecomposed model.In addition to attribute value conflicts, name conflicts
are displayed as warning messages as well. Assume tworeactions whose ids are both reaction2; and they are dif-ferent reactions. reaction2 elements will not be mergedin the composed model, but their original ids cannot be
Coskun et al. BMC Systems Biology 2013, 7:88 Page 6 of 15http://www.biomedcentral.com/1752-0509/7/88
kept in the composed model either since SBML definesid attribute as a unique identifier for each model. Forthis reason, “id-of-model2_” prefix is added to the id inthe second model, which refers to reaction2 of model 2.
Simulation interfaceThe interface (1) uses SBML files as direct input to thesimulation process, since the models are exchanged andmade available in SBML, and (2) integrates an existingstand-alone simulation engine, namely, RoadRunner [21],which is one of the sophisticated and highly-capable simu-lation engines available to the research community.There are many simulation tools for SBML documents
as covered in detail in SBML Software Matrix whichcompares SBML software [22]. Among those, some ofthe software is not free; some of them are working onlyon Windows operating system; and some of them donot provide all the capabilities needed by our interfaces.For client-based solutions, installing the correct updatesof the client software is both a time-consuming and dif-ficult task. Therefore, for easy distribution and updates,we have chosen to build a web-based solution. The webinterface is updated on the server side. Moreover, userscan access the tools from everywhere with no machine/OS compatibility issues. As of January 2013, there existsa few web-based simulation applications; but simulationediting capabilities in Reactome [23] are very limited,CytoSolve [24] cannot simulate some BioModels verifiedmodels, and maintenance of JWS Online [25] is stoppedafter 2007.For PathCase-SB, the web based simulation interface is
built and integrated to the PathCase Systems Biology website. In the simulation interface, users can re-simulate thecomputational model via:
1. Changing numerical values of parameters,2. Selecting and modifying initial concentrations or
amounts of species and boundary species,3. Choosing metabolic fluxes to plot,4. Changing start and end values of time period (time
scale is specified by the model),5. Modifying tolerance values for absolute tolerance
and/or relative tolerance,6. Changing the number of data points to plot on to
the graph (proportional to specified time period),7. Adding user generated experimental value sets, and8. Observing the results of the new simulation on the
fly.
Experimental results are manually editable on thetextbox field specified for users during the tests. Userscan find model details (such as the version of the model,notes by the author, and defined units) above the simula-tion graph.
From the simulation interface, the user can definecustom numerical values for basic simulation settings,which reside underneath the plotted graph in three col-umns. Start and end values of the time period specifythe interval that is plotted onto the simulation graph.These two integer values are in the unit of time scalespecified in the model.The “number of data points” field defines the frequency
of data points in the plot of the simulation graph. Themore the data points there are, the smoother will be thesimulation plot.The rightmost column in the basic settings contains
absolute and relative tolerance values for the simulationengine. By default, RoadRunner sets these values to 10-16
and 10-6 for absolute and relative tolerances, respectively.For these two very small floating number values, scientificnotation needs to be used to save space. These values arespecified in E notation (e.g. 1E-16, 1E-6) and saved glo-bally during user’s session.As illustrated in Figure 3, once the user expands
“Change parameters and initial concentration or amountof species” link, a list of options for available species,boundary species, parameters, and metabolic fluxes ap-pears. User can modify the parameter values from theleft column of parameters table, and also access the unitfor each value (shown next to each field in parenthesis).Once the value of the parameter is changed from thevalue specified in the model file, the original value canbe seen by going over to the specific parameter’s valuefield with mouse pointer.On the right column of the panel in Figure 3, species
and boundary species are listed with their initial concen-trations or amounts. Only those species and/or boundaryspecies for which checkboxes are checked are plotted ontothe simulation graph. At the start of the simulation inter-face, all species are unchecked; and, in the case of Figure 3,all of them are plotted to the graph. The initial concentra-tions or amounts can be changed to positive rationalnumbers only.In addition to species, boundary species and parame-
ters, users can also plot metabolic fluxes onto the simu-lation graph. The metabolic flux list resides under theparameters list, and each of these metabolic fluxes has acheckbox next to it as shown in Figure 3. Users can se-lect and deselect to show or hide the metabolic fluxeson the simulation graph.Modelers may also want to compare their data, pos-
sibly prepared after conducting lab experiments, with acurrently curated and verified model. This way, overlap-ping data points between experimental data and the ori-ginal model simulation data can be compared easily. Inthe simulation interface, users can enter experimentalvalues into a large text field by clicking the “Add/ChangeExperimental Values” link as illustrated in Figure 4.
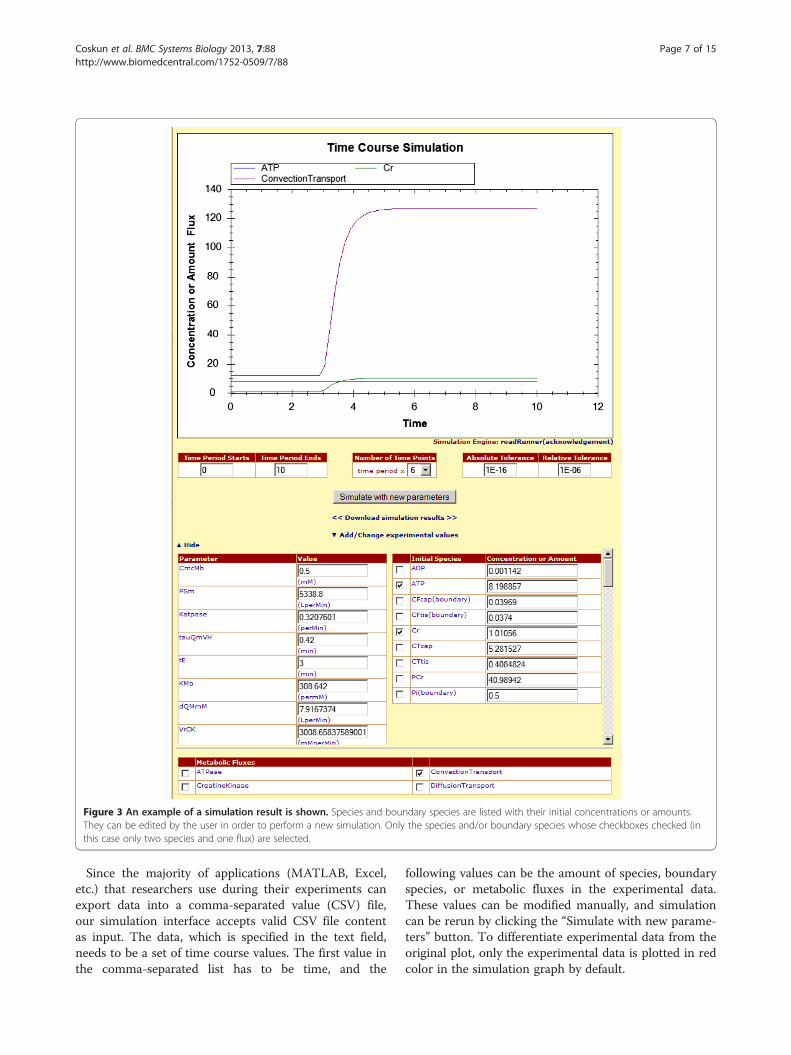
Figure 3 An example of a simulation result is shown. Species and boundary species are listed with their initial concentrations or amounts.They can be edited by the user in order to perform a new simulation. Only the species and/or boundary species whose checkboxes checked (inthis case only two species and one flux) are selected.
Coskun et al. BMC Systems Biology 2013, 7:88 Page 7 of 15http://www.biomedcentral.com/1752-0509/7/88
Since the majority of applications (MATLAB, Excel,etc.) that researchers use during their experiments canexport data into a comma-separated value (CSV) file,our simulation interface accepts valid CSV file contentas input. The data, which is specified in the text field,needs to be a set of time course values. The first value inthe comma-separated list has to be time, and the
following values can be the amount of species, boundaryspecies, or metabolic fluxes in the experimental data.These values can be modified manually, and simulationcan be rerun by clicking the “Simulate with new parame-ters” button. To differentiate experimental data from theoriginal plot, only the experimental data is plotted in redcolor in the simulation graph by default.
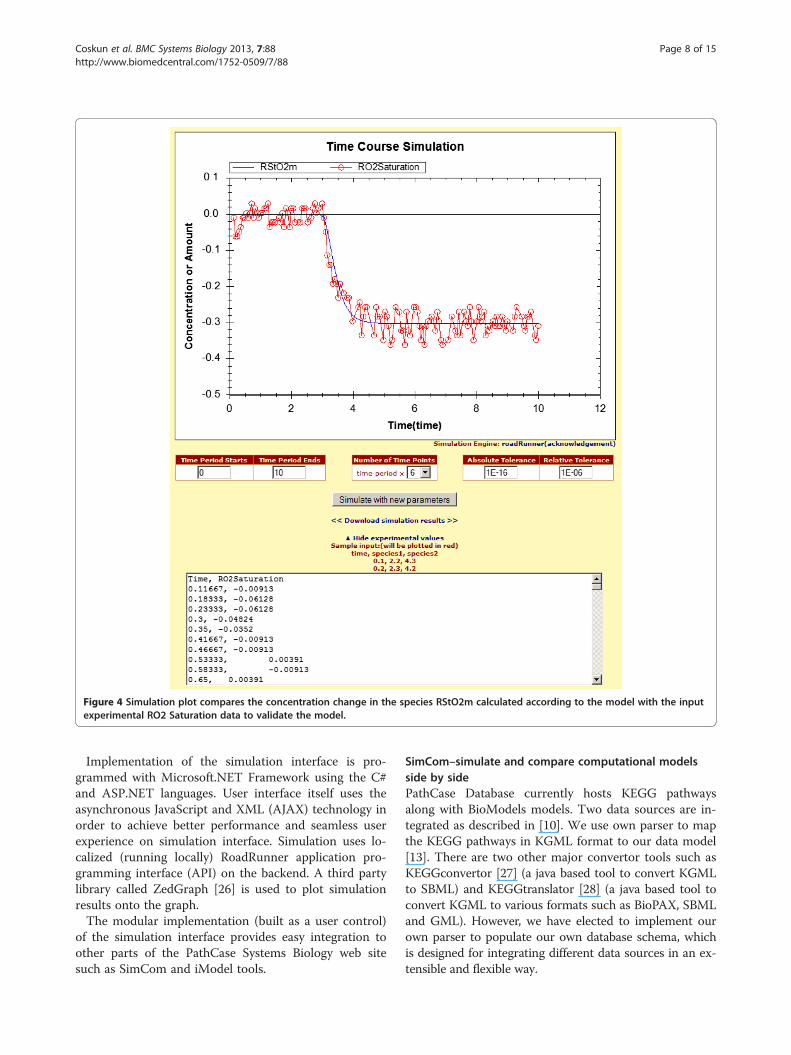
Figure 4 Simulation plot compares the concentration change in the species RStO2m calculated according to the model with the inputexperimental RO2 Saturation data to validate the model.
Coskun et al. BMC Systems Biology 2013, 7:88 Page 8 of 15http://www.biomedcentral.com/1752-0509/7/88
Implementation of the simulation interface is pro-grammed with Microsoft.NET Framework using the C#and ASP.NET languages. User interface itself uses theasynchronous JavaScript and XML (AJAX) technology inorder to achieve better performance and seamless userexperience on simulation interface. Simulation uses lo-calized (running locally) RoadRunner application pro-gramming interface (API) on the backend. A third partylibrary called ZedGraph [26] is used to plot simulationresults onto the graph.The modular implementation (built as a user control)
of the simulation interface provides easy integration toother parts of the PathCase Systems Biology web sitesuch as SimCom and iModel tools.
SimCom–simulate and compare computational modelsside by sidePathCase Database currently hosts KEGG pathwaysalong with BioModels models. Two data sources are in-tegrated as described in [10]. We use own parser to mapthe KEGG pathways in KGML format to our data model[13]. There are two other major convertor tools such asKEGGconvertor [27] (a java based tool to convert KGMLto SBML) and KEGGtranslator [28] (a java based tool toconvert KGML to various formats such as BioPAX, SBMLand GML). However, we have elected to implement ourown parser to populate our own database schema, whichis designed for integrating different data sources in an ex-tensible and flexible way.
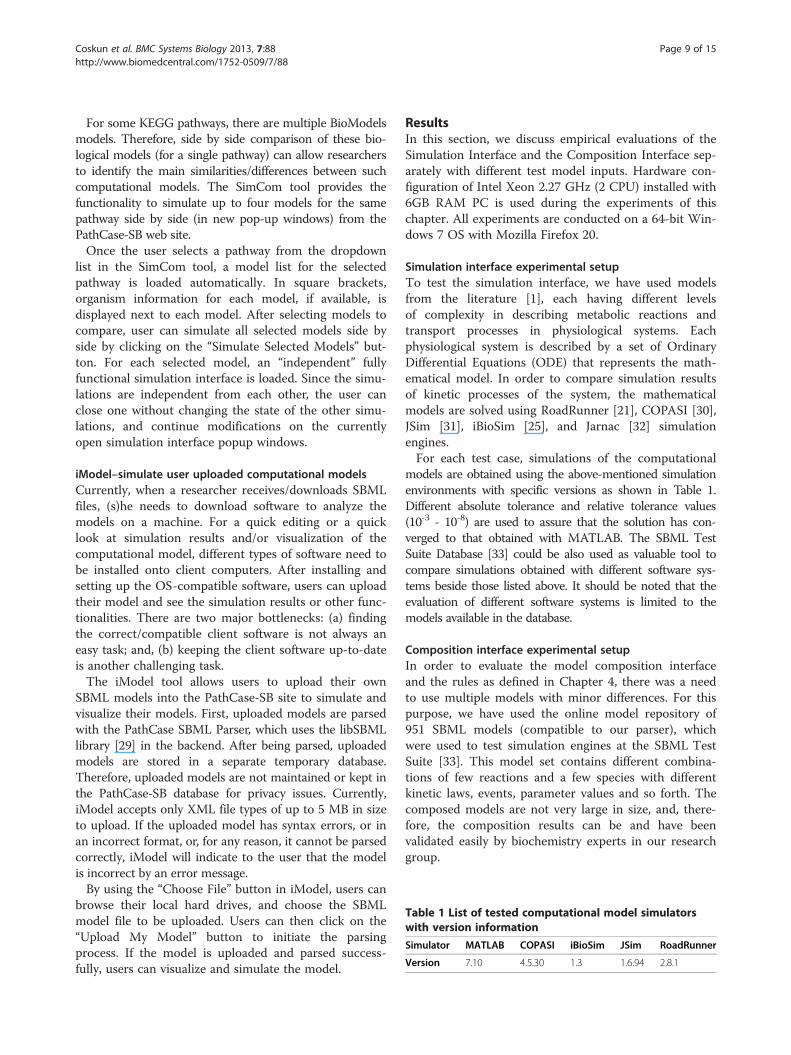
Table 1 List of tested computational model simulatorswith version information
Simulator MATLAB COPASI iBioSim JSim RoadRunner
Version 7.10 4.5.30 1.3 1.6.94 2.8.1
Coskun et al. BMC Systems Biology 2013, 7:88 Page 9 of 15http://www.biomedcentral.com/1752-0509/7/88
For some KEGG pathways, there are multiple BioModelsmodels. Therefore, side by side comparison of these bio-logical models (for a single pathway) can allow researchersto identify the main similarities/differences between suchcomputational models. The SimCom tool provides thefunctionality to simulate up to four models for the samepathway side by side (in new pop-up windows) from thePathCase-SB web site.Once the user selects a pathway from the dropdown
list in the SimCom tool, a model list for the selectedpathway is loaded automatically. In square brackets,organism information for each model, if available, isdisplayed next to each model. After selecting models tocompare, user can simulate all selected models side byside by clicking on the “Simulate Selected Models” but-ton. For each selected model, an “independent” fullyfunctional simulation interface is loaded. Since the simu-lations are independent from each other, the user canclose one without changing the state of the other simu-lations, and continue modifications on the currentlyopen simulation interface popup windows.
iModel–simulate user uploaded computational modelsCurrently, when a researcher receives/downloads SBMLfiles, (s)he needs to download software to analyze themodels on a machine. For a quick editing or a quicklook at simulation results and/or visualization of thecomputational model, different types of software need tobe installed onto client computers. After installing andsetting up the OS-compatible software, users can uploadtheir model and see the simulation results or other func-tionalities. There are two major bottlenecks: (a) findingthe correct/compatible client software is not always aneasy task; and, (b) keeping the client software up-to-dateis another challenging task.The iModel tool allows users to upload their own
SBML models into the PathCase-SB site to simulate andvisualize their models. First, uploaded models are parsedwith the PathCase SBML Parser, which uses the libSBMLlibrary [29] in the backend. After being parsed, uploadedmodels are stored in a separate temporary database.Therefore, uploaded models are not maintained or kept inthe PathCase-SB database for privacy issues. Currently,iModel accepts only XML file types of up to 5 MB in sizeto upload. If the uploaded model has syntax errors, or inan incorrect format, or, for any reason, it cannot be parsedcorrectly, iModel will indicate to the user that the modelis incorrect by an error message.By using the “Choose File” button in iModel, users can
browse their local hard drives, and choose the SBMLmodel file to be uploaded. Users can then click on the“Upload My Model” button to initiate the parsingprocess. If the model is uploaded and parsed success-fully, users can visualize and simulate the model.
ResultsIn this section, we discuss empirical evaluations of theSimulation Interface and the Composition Interface sep-arately with different test model inputs. Hardware con-figuration of Intel Xeon 2.27 GHz (2 CPU) installed with6GB RAM PC is used during the experiments of thischapter. All experiments are conducted on a 64-bit Win-dows 7 OS with Mozilla Firefox 20.
Simulation interface experimental setupTo test the simulation interface, we have used modelsfrom the literature [1], each having different levelsof complexity in describing metabolic reactions andtransport processes in physiological systems. Eachphysiological system is described by a set of OrdinaryDifferential Equations (ODE) that represents the math-ematical model. In order to compare simulation resultsof kinetic processes of the system, the mathematicalmodels are solved using RoadRunner [21], COPASI [30],JSim [31], iBioSim [25], and Jarnac [32] simulationengines.For each test case, simulations of the computational
models are obtained using the above-mentioned simulationenvironments with specific versions as shown in Table 1.Different absolute tolerance and relative tolerance values(10-3 - 10-8) are used to assure that the solution has con-verged to that obtained with MATLAB. The SBML TestSuite Database [33] could be also used as valuable tool tocompare simulations obtained with different software sys-tems beside those listed above. It should be noted that theevaluation of different software systems is limited to themodels available in the database.
Composition interface experimental setupIn order to evaluate the model composition interfaceand the rules as defined in Chapter 4, there was a needto use multiple models with minor differences. For thispurpose, we have used the online model repository of951 SBML models (compatible to our parser), whichwere used to test simulation engines at the SBML TestSuite [33]. This model set contains different combina-tions of few reactions and a few species with differentkinetic laws, events, parameter values and so forth. Thecomposed models are not very large in size, and, there-fore, the composition results can be and have beenvalidated easily by biochemistry experts in our researchgroup.
Coskun et al. BMC Systems Biology 2013, 7:88 Page 10 of 15http://www.biomedcentral.com/1752-0509/7/88
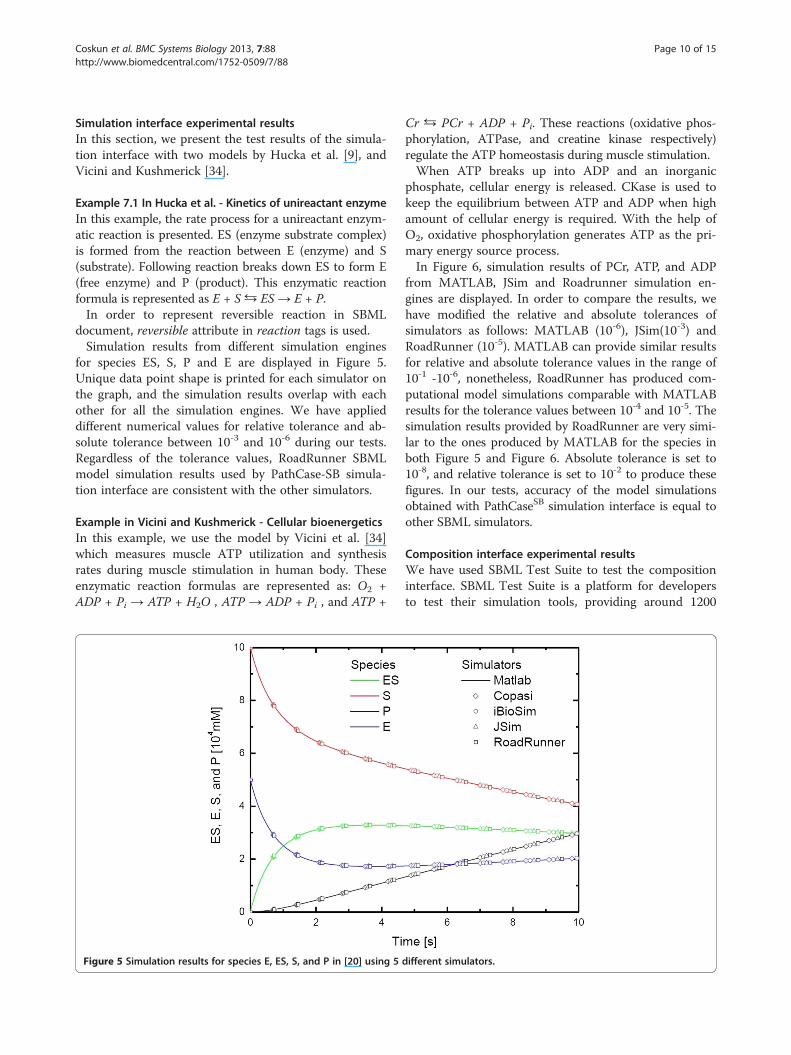
Simulation interface experimental resultsIn this section, we present the test results of the simula-tion interface with two models by Hucka et al. [9], andVicini and Kushmerick [34].
Example 7.1 In Hucka et al. - Kinetics of unireactant enzymeIn this example, the rate process for a unireactant enzym-atic reaction is presented. ES (enzyme substrate complex)is formed from the reaction between E (enzyme) and S(substrate). Following reaction breaks down ES to form E(free enzyme) and P (product). This enzymatic reactionformula is represented as E + S ⇆ ES → E + P.In order to represent reversible reaction in SBML
document, reversible attribute in reaction tags is used.Simulation results from different simulation engines
for species ES, S, P and E are displayed in Figure 5.Unique data point shape is printed for each simulator onthe graph, and the simulation results overlap with eachother for all the simulation engines. We have applieddifferent numerical values for relative tolerance and ab-solute tolerance between 10-3 and 10-6 during our tests.Regardless of the tolerance values, RoadRunner SBMLmodel simulation results used by PathCase-SB simula-tion interface are consistent with the other simulators.
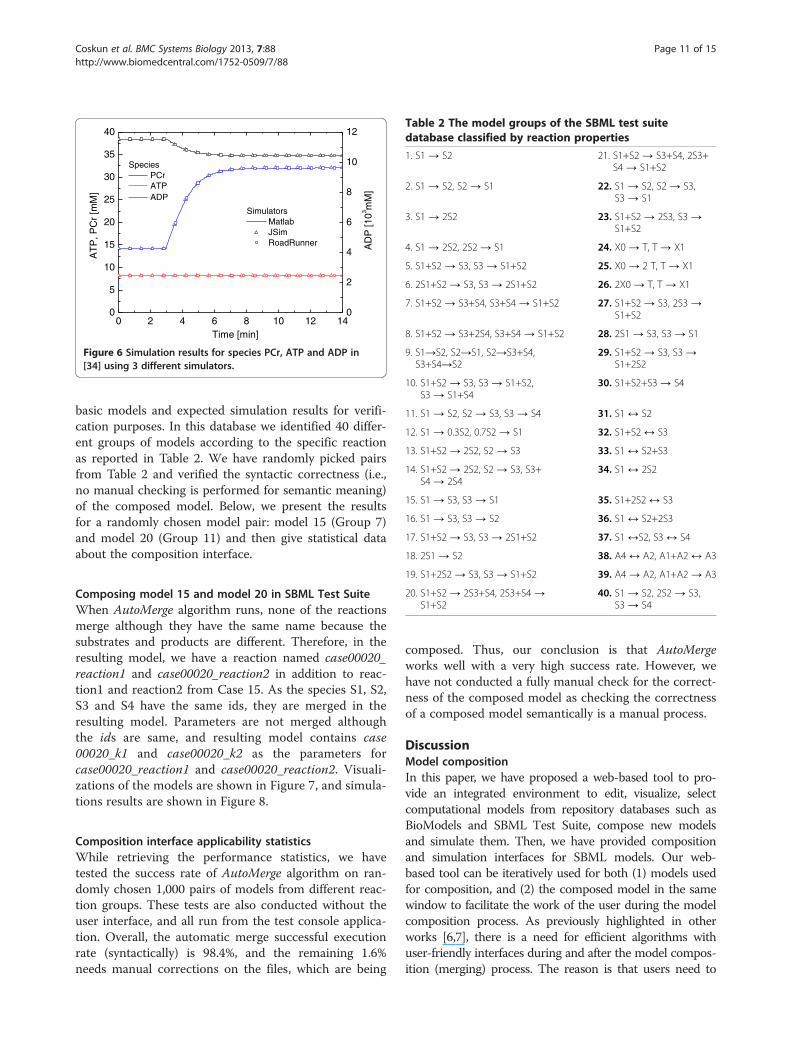
Example in Vicini and Kushmerick - Cellular bioenergeticsIn this example, we use the model by Vicini et al. [34]which measures muscle ATP utilization and synthesisrates during muscle stimulation in human body. Theseenzymatic reaction formulas are represented as: O2 +ADP + Pi → ATP + H2O , ATP → ADP + Pi , and ATP +
Figure 5 Simulation results for species E, ES, S, and P in [20] using 5
Cr ⇆ PCr + ADP + Pi. These reactions (oxidative phos-phorylation, ATPase, and creatine kinase respectively)regulate the ATP homeostasis during muscle stimulation.When ATP breaks up into ADP and an inorganic
phosphate, cellular energy is released. CKase is used tokeep the equilibrium between ATP and ADP when highamount of cellular energy is required. With the help ofO2, oxidative phosphorylation generates ATP as the pri-mary energy source process.In Figure 6, simulation results of PCr, ATP, and ADP
from MATLAB, JSim and Roadrunner simulation en-gines are displayed. In order to compare the results, wehave modified the relative and absolute tolerances ofsimulators as follows: MATLAB (10-6), JSim(10-3) andRoadRunner (10-5). MATLAB can provide similar resultsfor relative and absolute tolerance values in the range of10-1 -10-6, nonetheless, RoadRunner has produced com-putational model simulations comparable with MATLABresults for the tolerance values between 10-4 and 10-5. Thesimulation results provided by RoadRunner are very simi-lar to the ones produced by MATLAB for the species inboth Figure 5 and Figure 6. Absolute tolerance is set to10-8, and relative tolerance is set to 10-2 to produce thesefigures. In our tests, accuracy of the model simulationsobtained with PathCaseSB simulation interface is equal toother SBML simulators.
Composition interface experimental resultsWe have used SBML Test Suite to test the compositioninterface. SBML Test Suite is a platform for developersto test their simulation tools, providing around 1200
different simulators.
0 2 4 6 8 10 12 140
5
10
15
20
25
30
35
40
Simulators Matlab JSim RoadRunner
AT
P, P
Cr
[mM
]
SpeciesPCrATP
0
2
4
6
8
10
12
Time [min]
ADP
AD
P [1
03 mM
]Figure 6 Simulation results for species PCr, ATP and ADP in[34] using 3 different simulators.
Table 2 The model groups of the SBML test suitedatabase classified by reaction properties
1. S1 → S2 21. S1+S2 → S3+S4, 2S3+S4 → S1+S2
2. S1 → S2, S2 → S1 22. S1 → S2, S2 → S3,S3 → S1
3. S1 → 2S2 23. S1+S2 → 2S3, S3 →S1+S2
4. S1 → 2S2, 2S2 → S1 24. X0 → T, T → X1
5. S1+S2 → S3, S3 → S1+S2 25. X0 → 2 T, T → X1
6. 2S1+S2 → S3, S3 → 2S1+S2 26. 2X0 → T, T → X1
7. S1+S2 → S3+S4, S3+S4 → S1+S2 27. S1+S2 → S3, 2S3 →S1+S2
8. S1+S2 → S3+2S4, S3+S4 → S1+S2 28. 2S1 → S3, S3 → S1
9. S1→S2, S2→S1, S2→S3+S4,S3+S4→S2
29. S1+S2 → S3, S3 →S1+2S2
10. S1+S2 → S3, S3 → S1+S2,S3 → S1+S4
30. S1+S2+S3 → S4
11. S1 → S2, S2 → S3, S3 → S4 31. S1 ↔ S2
12. S1 → 0.3S2, 0.7S2 → S1 32. S1+S2 ↔ S3
13. S1+S2 → 2S2, S2 → S3 33. S1 ↔ S2+S3
14. S1+S2 → 2S2, S2 → S3, S3+S4 → 2S4
34. S1 ↔ 2S2
15. S1 → S3, S3 → S1 35. S1+2S2 ↔ S3
16. S1 → S3, S3 → S2 36. S1 ↔ S2+2S3
17. S1+S2 → S3, S3 → 2S1+S2 37. S1 ↔S2, S3 ↔ S4
18. 2S1 → S2 38. A4 ↔ A2, A1+A2 ↔ A3
Coskun et al. BMC Systems Biology 2013, 7:88 Page 11 of 15http://www.biomedcentral.com/1752-0509/7/88
basic models and expected simulation results for verifi-cation purposes. In this database we identified 40 differ-ent groups of models according to the specific reactionas reported in Table 2. We have randomly picked pairsfrom Table 2 and verified the syntactic correctness (i.e.,no manual checking is performed for semantic meaning)of the composed model. Below, we present the resultsfor a randomly chosen model pair: model 15 (Group 7)and model 20 (Group 11) and then give statistical dataabout the composition interface.
19. S1+2S2 → S3, S3 → S1+S2 39. A4 → A2, A1+A2 → A3
20. S1+S2 → 2S3+S4, 2S3+S4 →S1+S2
40. S1 → S2, 2S2 → S3,S3 → S4
Composing model 15 and model 20 in SBML Test SuiteWhen AutoMerge algorithm runs, none of the reactionsmerge although they have the same name because thesubstrates and products are different. Therefore, in theresulting model, we have a reaction named case00020_reaction1 and case00020_reaction2 in addition to reac-tion1 and reaction2 from Case 15. As the species S1, S2,S3 and S4 have the same ids, they are merged in theresulting model. Parameters are not merged althoughthe ids are same, and resulting model contains case00020_k1 and case00020_k2 as the parameters forcase00020_reaction1 and case00020_reaction2. Visuali-zations of the models are shown in Figure 7, and simula-tions results are shown in Figure 8.
Composition interface applicability statisticsWhile retrieving the performance statistics, we havetested the success rate of AutoMerge algorithm on ran-domly chosen 1,000 pairs of models from different reac-tion groups. These tests are also conducted without theuser interface, and all run from the test console applica-tion. Overall, the automatic merge successful executionrate (syntactically) is 98.4%, and the remaining 1.6%needs manual corrections on the files, which are being
composed. Thus, our conclusion is that AutoMergeworks well with a very high success rate. However, wehave not conducted a fully manual check for the correct-ness of the composed model as checking the correctnessof a composed model semantically is a manual process.
DiscussionModel compositionIn this paper, we have proposed a web-based tool to pro-vide an integrated environment to edit, visualize, selectcomputational models from repository databases such asBioModels and SBML Test Suite, compose new modelsand simulate them. Then, we have provided compositionand simulation interfaces for SBML models. Our web-based tool can be iteratively used for both (1) models usedfor composition, and (2) the composed model in the samewindow to facilitate the work of the user during the modelcomposition process. As previously highlighted in otherworks [6,7], there is a need for efficient algorithms withuser-friendly interfaces during and after the model compos-ition (merging) process. The reason is that users need to
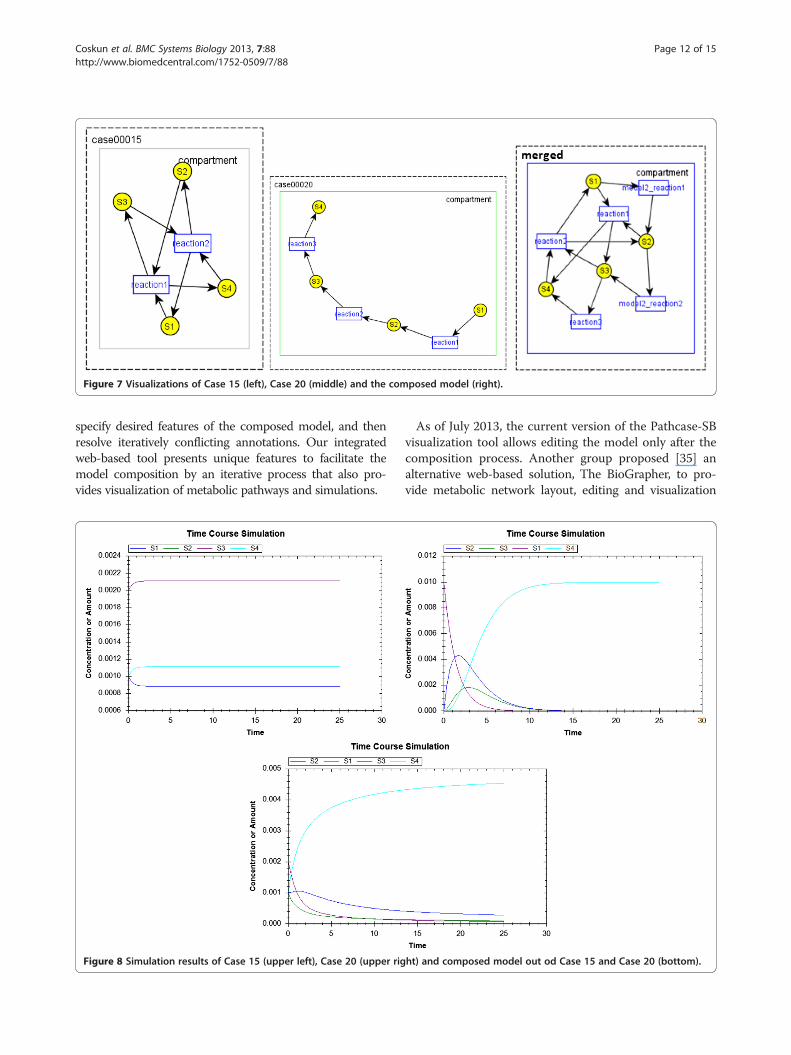
Figure 7 Visualizations of Case 15 (left), Case 20 (middle) and the composed model (right).
Coskun et al. BMC Systems Biology 2013, 7:88 Page 12 of 15http://www.biomedcentral.com/1752-0509/7/88
specify desired features of the composed model, and thenresolve iteratively conflicting annotations. Our integratedweb-based tool presents unique features to facilitate themodel composition by an iterative process that also pro-vides visualization of metabolic pathways and simulations.
Figure 8 Simulation results of Case 15 (upper left), Case 20 (upper rig
As of July 2013, the current version of the Pathcase-SBvisualization tool allows editing the model only after thecomposition process. Another group proposed [35] analternative web-based solution, The BioGrapher, to pro-vide metabolic network layout, editing and visualization
ht) and composed model out od Case 15 and Case 20 (bottom).
Coskun et al. BMC Systems Biology 2013, 7:88 Page 13 of 15http://www.biomedcentral.com/1752-0509/7/88
tool, which supports Systems Biology Graphical Notation(SBGN). However, this tools is not currently integratedinto a model composition tool. Model composition tools,such as semanticsSBML [7], has been released as an ad-vancement over their predecessor SBMLmerge [6] tohandle editing, verifying MIRIAM annotations and SBOterms in SBML models. Although it is a free softwarepackage that provides features for building, annotating,checking, and merging models, the web-based version haslimited functionality.Gennari et al. have proposed [36] a SemSim architec-
ture that supports not only annotations, but also seman-tic information of the model that could be used forcomposition especially dealing with multi-scale andmulti-domain modeling. Currently, the software SemGenallows automating annotation, composition and decom-position of SemSim model [37-39]. Although, this ap-proach is quite promising, it requires the conversion of amodel from SBML or CellML format into the SemSimformat. Our main contribution is to provide an inte-grated web-based tool to deal not only with model com-position, but also with visualization and simulation tools.
Model simulationSystems Biology Workbench (SBW) [21] provides an en-vironment where different software tools can interact witheach other over a common communication interface.SBW also provides wrapper classes for different program-ming environments, and thus can easily be ported intoPathCase environment with minimal coding require-ments. Therefore, we initially concentrated on using simu-lation tools that are compatible with the SBWenvironment. Among several alternatives, we have foundthat RoadRunner has the most robust event handling im-plementation. Hence, within SBW framework, we workedwith RoadRunner.As another alternative simulation environment, we
worked with MathSBML [40] in the Mathematica envir-onment. MathSBML is an open-source package thathouses a library of functions to parse, create, simulate, andedit SBML model files within Mathematica. MathSBMLalso fully supports events.CellDesigner [8] is a software tool which is compliant
with SBW [16], and provides both extensive modelediting and simulation features through third part toolssuch as Jarnac [32], MathSBML [40] and COPASI [30].It also has a visualization interface, so that we can visu-ally inspect the created models for correctness at thestructural level. Through MathSBML, CellDesigner sup-ports events. In the end, we decided on RoadRunner,which provides up-to-date.NET compatible wrapperclasses in its API for remote procedure calls.The composition of models from the BioModels Data-
base is currently limited to the conflicting annotations used
by users in developing their SBML models. In order toexperiment with the composition tool we provide a separ-ate site, which only hosts SBMLTest Suite models. As theyare clearly defined, and easier to understand, our clone siteis a nice source to get used to the dynamics of the mergingprocess and the algorithm. We think this feature is a nicecontribution for the teaching purposes as well.
Future workWe plan the following extensions to the Model Compos-ition Tool.Approximate and score-based name matching tech-
niques (via web services). The capability of matching (i)species, (ii) reactions, and (iii) compartments is essentialduring model comparisons prior to model composition.Currently supported exact name matching and MIRIAMannotation-based matching modules are useful, buthave limitations. Exact name matching does not per-form well, even though it is useful on SBML Test Suitemodels, as naming conventions differ among the au-thors of BioModels models. And, currently, only 16% ofmodels in PathCase-SB database (which are originallyfrom the BioModels Database) have MIRIAM annota-tions. Therefore, approximate name-matching techniquesfrom computer science, specialized for life sciences, is adesirable alternative. Towards that end, we have developedgeneral-purpose basic bio-entity matching techniques. Weare going to complete a web service functionality forapproximate name matching of species, reactions, andcompartments, to be used within the model compositiontool as an additional matching tool.Enhancing the functionality of the model composition
tool using the extensible architecture of PathCase-SB.We list four extensions.
� Support for multiple simulation engine use (via webservices). The simulation engine (currently,RoadRunner) can easily be replaced by anothersimulation engine, so long as the new engine doesprovide a web service functionality.
� Support for larger network comparisons for largermodels via web services. We are working on a webservice functionality that compares networks or sub-networks (of models).
� Support for CellML parsing via web services.PathCase-SB is designed to support modelcomposition for models designed in other formats,namely, CellML.
Improving the AutoMerge algorithm by optimizingvarious decisions it makes, such as, instead of giving thefirst model the priority, picking the entity with more in-formation (e.g., annotation), and enabling the merge ofunits and parameters.
Coskun et al. BMC Systems Biology 2013, 7:88 Page 14 of 15http://www.biomedcentral.com/1752-0509/7/88
ConclusionsPathCase systems are widely used by researchers. We ex-pect that, after the addition of new capabilities, namely,(a) Model Composition Interface and (b) Model Simula-tion Tools into PathCase-SB, the usefulness and the userbase of PathCase-SB system will increase.These new tools and interfaces can be used with little
or no knowledge of the SBML document structure. Forthis reason, students or anyone who wants to learnabout systems biology will benefit from the functional-ities such as model simulation, model composition, andpathways visualization of mathematical models.Since the whole PathCase-SB web system is integrated, in
the future, there is a need to test these tools and interfacesafter any significant system or code updates in the future.For this reason, automated integration tests are developed inC#.NET via Selenium HQ software tool [41]. These tests arerun via NUnit software [42], which checks multiple pointsof the web site, and verifies specific values on the web page.As was discussed, the AutoMerge algorithm takes care of
many issues that arise during model composition andsimulation, which the modeler does not need to deal with.Nonetheless, for many complex composition tasks, casessuch as (1) inconsistent naming convention betweenmodels, (2) special cases like removing some SBML ele-ments during the merge, or (3) special cases like addingnew SBML elements, manual intervention is required afterthe AutoMerge algorithm via the composition interface. Insummary, AutoMerge can be thought of as a preliminarystep, which solves simple merging issues while combiningmodels; and, the modeler can then manually interfere andmake changes to the composed model to ensure correct-ness. With the help of simulation tools, iModel andSimCom, simulation interface provides a sound, easy touse, pluggable, OS-independent, WYSIWYG web basedsolution for researchers to simulate computational models.Our tool supports composition and simulation of
models specified in SBML, up to SBML Level 3. Cur-rently, the PathCase-SB simulation interface uses Road-Runner as its simulation engine. RoadRunner simulatoris in active development (with issues and bugs beingsolved) and one of the most reliable simulators. None-theless, since PathCase-SB simulation interface is builton top of RoadRunner and with a well-specified andflexible connectivity, the system does have the ability toplug in another simulation engine (e.g., Jarnac, JSim,etc.) if and when it is needed in the future.
Availability and requirements
� Project name: PathCase-SB Simulation andComposition Tools
� Project home page: http://nashua.case.edu/PathwaysSB/Web (site that hosts (BioModels
models) and http://nashua.case.edu/PathwaysSBSBW/Web (site that hosts SBML TestSuite models)
� Operating system(s): Platform independent� Programming language: ASP.NET Framework using
the C#.NET language and Java for the visualizationapplet.
� Other requirements: JavaScript must be enabled inthe browser. In order to view certain portions of thesite correctly PathCase-SB need cookies enabled inthe browser. In order to view the applet, version 1.6(also known as version 6) or later of the JavaRuntime Environment must be installed on thesystem from which the viewer is accessed. If the JREis installed properly and the Graph Viewer still doesnot appear, the user should make sure that thebrowser’s security settings allow Java applets (or inthe case of Internet Explorer, ActiveX controls). Bestviewed at resolutions of 1024 × 768 pixels and up.
� Any restrictions to use by non-academics: Freelyaccessible.
Competing interestsThe authors declare that they have no competing interests.
Authors’ contributionsImplementation and Tests: SAC, Wrote Manuscript: AEC, RevisionImplementations: AEC, Supervised the Project: NL, RD, ZMO, GO. All authorsread and approved the final manuscript.
AcknowledgementsThis research has been supported by the National Science Foundation grantsDBI 0743705, DBI 0849956, CRI 0551603 and by the National Institute ofHealth grant GM088823.
Author details1Electrical Engineering and Computer Science Department, Case WesternReserve University, Cleveland, OH, USA. 2Lane Center for ComputationalBiology, Carnegie Mellon University, Pittsburgh, PA, USA. 3Department ofBiomedical Engineering, Case Western Reserve University, Cleveland, OH,USA. 4Department of Physiology, Medical College of Wisconsin, Milwaukee,WI, USA.
Received: 22 January 2013 Accepted: 21 August 2013Published: 5 September 2013
References1. BioModels database—a database of annotated published models. http://
www.ebi.ac.uk/biomodels-main. Accessed on May 19, 2013.2. Lloyd CM, Lawson JR, Hunter PJ, Nielsen PF: The CellML model repository.
Bioinformatics 2008, 24(18):2122–3.3. Randhawa R, Shaffer C, Tyson J: Fusing and composing macromolecular
regulatory network models, Proceedings of the 2007 High PerformanceComputing Symposium. Piscataway, NJ, USA: IEEE Press; 2007:337–344.
4. Randhawa R, Shaffer CA, Tyson JJ: Model aggregation: a building-blockapproach to creating large macromolecular regulatory networks.Bioinformatics 2009, 25(24):3289–95.
5. Vass M, Allen N, Shaffer CA, Ramakrishnan N, Watson LT, Tyson JJ: The JigCellmodel builder and run manager. Bioinformatics 2004, 20(18):3680–3681.
6. Schulz M, Uhlendorf J, Klipp E, Liebermeister W: SBMLmerge, a system forcombining biochemical network models. Genome Inform 2006, 17(1):62–71.
7. Krause F, Uhlendorf J, Lubitz T, Schulz M, Klipp E, Liebermeister W:Annotation and merging of SBML models with semanticSBML.Bioinformatics 2010, 26(3):421–422.
Coskun et al. BMC Systems Biology 2013, 7:88 Page 15 of 15http://www.biomedcentral.com/1752-0509/7/88
8. Funahashi A, Matsuoka Y, Jouraku A, Morohashi M, Kikuchi N, Kitano H:CellDesigner 3.5: a versatile modeling tool for biochemical networks.Proceedings of the IEEE 2008, 96(8):1254–1265.
9. Hucka M, Bergmann F, Hoops S, Keating SM, Sahle S, Wilkinson DJ: Thesystems biology markup language (SBML): language specification forlevel 3 version 1 core (release 1 candidate). http://dx.doi.org/10.1038/npre.2010.4123.1. Available from Nature Precedings 2010.
10. Coskun SA, Qi X, Cakmak A, Cheng E, Cicek AE, Yang L, Jadeja R, Dash RK,Lai N, Ozsoyoglu G, Ozsoyoglu ZM: PathCase-SB: integrating data sourcesand providing tools for systems biology research. BMC Systems Biology2012, 6(1):67.
11. Cakmak A, Qi X, Coskun SA, Das M, Cheng E, Cicek AE, Lai N, Ozsoyoglu G,Ozsoyoglu ZM: PathCase-SB architecture and database design.BMC Systems Biology 2011, 5(1):188.
12. YFiles library. http://www.yworks.com/en/products_yfiles_about.htm.13. Elliott B, Kirac M, Cakmak A, Yavas G, Mayes S, Cheng E, Wang Y, Gupta C,
Ozsoyoglu G, Ozsoyoglu ZM: PathCase: pathways database system.Bioinformatics 2008, 24(21):2526–2533.
14. Le Novère N, Finney A, Hucka M, Bhalla US, Campagne F, Collado-Vides J,Crampin EJ, Halstead M, Klipp E, Mendes P, Nielsen P, Sauro H, Shapiro BE,Snoep JL, Spence HD, Wanner BL: Minimum information requested in theannotation of biochemical models (MIRIAM). Nature Biotechnology 2005,23(12):1509–1515.
15. PathCase-SB: hosting the BioModels database models. http://nashua.case.edu/pathwayssb/web. Accessed on July 5, 2013.
16. PathCase-SB: hosting the SBML test suite models. http://nashua.case.edu/pathwayssbsbw/web. Accessed on July 5, 2013.
17. Albert MA, Haanstra JR, Hannaert V, Van Roy J, Opperdoes FR, Bakker BM,Michels PA: Experimental and in silico analyses of glycolytic flux controlin bloodstream form trypanosoma brucei. J Biol Chem 2005,280(31):28306–28315.
18. Helfert S, Estévez AM, Bakker B, Michels P, Clayton C: Roles oftriosephosphate isomerase and aerobic metabolism in trypanosomabrucei. Biochem J 2001, 357(1):117–25.
19. XML editor - a framework and developer toolkit. http://xmlwebpad.codeplex.com/. Accessed on May 19, 2013.
20. Hucka M, Finney A, Hoops S, Keating S, Le Novere N: Systems biology markuplanguage (SBML) level 2: structures and facilities for model definitions.http://hdl.nature.com/10101/npre.2007.58.1 Nature Preceedings 2007.
21. Bergmann F, Sauro H: SBW – a modular framework for systems biology.In Proceedings of the 38th conference on winter simulation. Edited by PerroneLF, Lawson BG, Liu J, Wieland FP. Monterey: Winter Simulation Conference;2006:1637–1645.
22. SBML software matrix - comparison matrix for SBML software. http://sbml.org/SBML_Software_Guide/SBML_Software_Matrix. Accessed on May19, 2013.
23. Joshi-Tope G, Gillespie M, Vastrik I, D'Eustachio P, Schmidt E, de Bono B,Jassal B, Gopinath GR, Wu GR, Matthews L, Lewis S, Birney E, Stein L:Reactome: a knowledgebase of biological pathways. Nucl Acids Res 2005,33:428–432.
24. Ayyadurai VAS, Dewey CF: CytoSolve: a scalable computational methodfor dynamic integration of multiple molecular pathway models.Cellular and Molecular Bioengineering 2011, 4:28–45.
25. Olivier BG, Snoep JL: Web-based kinetic modelling using JWS online.Bioinformatics 2004, 20:2143–2144.
26. ZedGraph 2D plotting class library for.NET. http://sourceforge.net/projects/zedgraph/. Accessed on May 19, 2013.
27. Moutselos K, Kanaris I, Chatziioannou A, Maglogiannis I, Kolisis F:KEGGconverter: a tool for the in-silico modelling of metabolic networksof the KEGG pathways database. BMC Bioinformatics 2009, 10:324.
28. Wrzodek C, Büchel F, Dräger A, Ruff M, Zell A: Precise generation ofsystems biology models from KEGG pathways. BMC Systems Biology 2013,7(1):15.
29. Bornstein BJ, Keating SM, Jouraku A, Hucka M: LibSBML: an API library forSBML. Bioinformatics 2008, 24(6):880–881.
30. Hoops S, Sahle S, Gauges R, Lee C, Pahle J, Simus N, Singhal M, Xu L,Mendes P, Kummer U: COPASI — a COmplex PAthway SImulator.Bioinformatics 2006, 22:3067–74.
31. Raymond GM, Butterworth E, Bassingthwaighte JB: JSIM: free softwarepackage for teaching phyiological modeling and research. Exper Biol2003, 280:102–107.
32. Sauro HM: Jarnac: an interactive metabolic systems language incomputation in cells. In Proceedings of an EPSRC emerging computingparadigms workshop. Edited by Bolouri H, Paton RC. Hertfordshire, UK: Dept.of Computer Science Technical Report No. 345, University of Hertfordshire;2000.
33. SBML test suite. http://sourceforge.net/projects/sbml/files/test-suite/.Accessed on July 5, 2013.
34. Vicini P, Kushmerick MJ: Cellular energetics analysis by a mathematicalmodel of energy balance: estimation of parameters in human skeletalmuscle. Am J Physiol Cell Physiol 2000, 279:213–224.
35. Krause F, Schulz M, Ripkens B, Flöttmann M, Krantz M, Klipp E, Handorf T:Biographer: web-based editing and rendering of SBGN compliantbiochemical networks. Bioinformatics 2013, 29(11):1467–1468.
36. Gennari JH, Neal ML, Carlson BE, Cook DL: Integration of multi-scalebiosimulation models via light-weight semantics. Pac Symp Biocomput2008, 13:414–425.
37. Neal ML, Gennari JH, Arts T, Cook DL: Advances in semanticrepresentation for multiscale biosimulation: a case study in mergingmodels. Pac Symp Biocomput 2009, 14:304.
38. Gennari JH, Neal ML, Galdzicki M, Cook DL: Multiple ontologies in action:composite annotations for biosimulation models. J Biomed Inform 2011,44(1):146–154.
39. Neal ML: Modular, semantics-based composition of biosimulation models.Seattle, Washington: PhD Thesis, University of Washington; 2010.
40. MathSBML. http://sbml.org/Software/MathSBML. Accessed on May 19, 2013.41. SeleniumHQ browser automation. http://docs.seleniumhq.org/.42. NUnit unit-testing framework. http://www.nunit.org/.
doi:10.1186/1752-0509-7-88Cite this article as: Coskun et al.: An online model composition tool forsystem biology models. BMC Systems Biology 2013 7:88.
Submit your next manuscript to BioMed Centraland take full advantage of:
• Convenient online submission
• Thorough peer review
• No space constraints or color figure charges
• Immediate publication on acceptance
• Inclusion in PubMed, CAS, Scopus and Google Scholar
• Research which is freely available for redistribution
Submit your manuscript at www.biomedcentral.com/submit