BIOLOGY - Hodder Education
32
Jenny Wakefield-Warren Adrian Schmit Richard Fosbery OCR A LEVEL 1 BIOLOGY Includes AS Level
-
Upload
khangminh22 -
Category
Documents
-
view
0 -
download
0
Transcript of BIOLOGY - Hodder Education
Jenny Wakefield-WarrenAdrian SchmitRichard Fosbery
OCR A LEVEL 1
BIOLOGYIncludes AS Level
Meet the demands of the new A Level specifications; popular and trusted textbooks and revision guides, innovative, flexible and interactive digital resources, topical student magazines and specialist-led CPD events will ensure you are supported in all your teaching and assessment needs.
These titles have been selected for OCR’s official endorsement process:
OCR A Level Biology Year 1 Student Book 9781471809156 March 2015 £24.99OCR A Level Biology Year 2 Student Book 9781471827082 May 2015 £24.99OCR A Level Chemistry Year 1 Student Book 9781471827068 March 2015 £24.99 OCR A Level Chemistry Year 2 Student Book 9781471827181 May 2015 £24.99
Visit www.hoddereducation.co.uk/ALevelScience/OCR to pre order or to sign up for Inspection Copies.
ALSO AVAILABLE
OCR A Level Science Dynamic Learning Dynamic Learning is an online subscription solution that supports teachers and students with high quality content and unique tools. Dynamic Learning incorporates Teaching and Learning resources, Whiteboard and Student eTextbook elements that all work together to give you the ultimate classroom and homework resource.
Pub date: March 2015
Sign up for a free 30 day trial – visit www.hoddereducation.co.uk/dynamiclearning
Student Guides Reinforce students' understanding throughout their course; clear topic summaries with sample questions and answers to improve exam technique.
Price: £9.99 per copy Pub date: Aug 2015
Student WorkbooksCreate confident, literate and well-prepared students with skills-focused, topic-specific workbooks.
Price: £5.99 per copy Pub date: May 2015
My Revision Notes Unlock your students’ full potential with these revision guides that provide both the key content they need to know and guidance on how to apply it.
Prices from £10.99 per copy Pub date: Sept 2015
To sign up for Inspection Copies visit www.hoddereducation.co.uk/ALevelScience/OCR
Biological Sciences, Chemistry and Physics Review magazines Philip Allan Magazines are the ideal resource to deepen subject knowledge and prepare students for their exams.
Visit www.hoddereducation.co.uk/magazines to find out more and to trial the archive, free for 30 days.
Philip Allan Events Ensure that you are fully prepared for the upcoming changes to the A Level specs by attending one of our 'Implementing the New Specification' courses.
For more information and to book your place visit www.philipallanupdates.co.uk
Contents
Get the most from this book
Chapter1 Cellstructure
Chapter2 Biologicalmolecules1
Chapter3 Biologicalmolecules2
Chapter4 Enzymes
Chapter5 Cellmembranes
Chapter6 Celldivision,diversityandorganization
Chapter7 Exchangesurfacesandbreathing
Chapter8 Transportinanimals
Chapter9 Transportinplants
Chapter10 Disease
Chapter11 Diseaseprevention
Chapter12 Biodiversity
Chapter13 Maintainingdiversity
Chapter14 Classification
Chapter15 Evolution
Chapter16 Exampreparation
Chapter17 Preparingforpracticalassessment
Chapter18 Mathsskills
Glossary
Index
Acknowledgements
Free online material

4
Ch
apte
r 15
Evo
luti
on
Chapter 15Evolution
Imagine that you have had a bright idea, an idea that explains everything. Now imagine that you have spent over 20 years finding evidence for your bright idea; enough evidence to convince your colleagues and the general public. You also know that many people, including some in your own family, would not like your bright idea one bit because of all the implications that it has for society. Now imagine that one morning the postman delivers a letter from across the other side of the world. You
Prior knowledgeBefore you start, make sure that you are confident in your knowledge and understanding of the following points:l Life has evolved over a very long period of time on Earth. l The evolution of new species occurs over time through natural selection. l An organism’s genotype is the genetic make-up of that organism; its
phenotype is all its physical and biochemical features.l A gene codes for the sequence of amino acids in a polypeptide. Different
alleles of a particular gene code for the same polypeptide but with slightly different sequences of amino acids.
l All individuals of the same species have the same genes, but they do not necessarily have the same alleles of those genes.
l Some aspects of phenotype are determined by genotype alone; others are determined by environment alone. Still others are determined by the interaction between genotype and environment.
l Variation (both genetic and phenotypic) exists both between species and within species.
l Mutant alleles that are present in gametes may result in new features in the phenotype of any offspring that inherit them.
l Bacteria have evolved resistance to antibiotics and some pest species have evolved resistance to pesticides.
l Adaptation is a modification to an organism that allows it to ‘fit into’ its particular habitat.
l Examples of the types of evidence that support the idea that life has evolved are fossils, comparative anatomy and molecular biology.
l Humans use selective breeding (artificial selection) to improve the plants and animals used in agriculture and horticulture.
Test yourself on prior knowledge
1 Approximately how long has life existed on planet Earth?2 Outline how natural selection acts as a mechanism for evolution.3 Explain the difference between gene and allele.4 List the causes of genetic variation in organisms that reproduce sexually.5 Explain why there is less variation in a population of eukaryotic organisms
that reproduces asexually compared with one that reproduces sexually.6 What is the difference between natural selection and selective breeding
(artificial selection)?7 Give two adaptations of plants for survival in dry habitats, such as sand dunes.

5
What is evolution?
open and read the letter to find that someone else has had exactly the same bright idea. After all the work you have done on your bright ideas, how would you feel? This is exactly what happened when the postman delivered a letter to Down House in Kent one day in early summer 1858.
Down House was the home of Charles Darwin (1809–1882), a geologist, naturalist and explorer. As the scientist on the survey ship HMS Beagle, Darwin had the good fortune to make many observations of the natural world and to collect specimens of plants, animals and fossils in South America, and crucially as it turned out, the Galápagos Islands in the Pacific, Australasia and Mauritius. His observations and tentative conclusions convinced him that species were not immutable – they changed over time. He had found enough evidence to convince himself that life evolved.
On his return from the expedition, Darwin spent many years corresponding with fellow scientists and others across the world, collecting more and more evidence, drafting his thesis and putting off the day when he would have to publish his great idea. For one thing, he was fully aware of the upheaval that publication would cause.
What is evolution?When people talk about evolution they are usually referring to two distinct ideas:
1 The general theory of evolution. This states that organisms have changed over time and continue to change. As scientists in the eighteenth and nineteenth centuries learned more about the Earth, there came a general realisation that the Earth was very old and that life had changed over time. For example, discoveries made by Mary Anning in the Jurassic rocks at Lyme Regis in Dorset showed them to be full of fossils of animals that were no longer alive; in fact, they had been extinct for millions of years.
2 The special theory that evolution occurs by the process of natural selection.
Charles Darwin collected information about many groups of organisms, most famously during his voyage around the world on HMS Beagle from 1831 to 1836. Another scientist, Alfred Russel Wallace (1823–1913), also spent many years travelling and collecting specimens, in South America and in south-east Asia. It was Wallace who had independently proposed natural selection as a way in which evolution could occur and had written that fateful letter to Darwin in 1858. A joint scientific paper proposing their theory of natural selection was presented in 1858 at the Linnaean Society in London. In November 1859, Darwin published On the Origin of Species by Means of Natural Selection, or the Preservation of Favoured Races in the Struggle for Life, to give the first edition of the book its full title. This book presented the special theory of natural selection, with much supporting evidence painstakingly amassed by Darwin over many years.
Although our ideas about natural selection have changed over the past 150 years and been much criticised or even denigrated by those who remain unconvinced, it remains the best explanation of the numerous observations made by scientists about species and how they change over time. Interestingly, in the first edition of On the Origin of Species
Figure 15.1 Charles Darwin in 1840, a few years after he returned to England following his voyage on HMS Beagle.
Figure 15.2 A statue of Alfred Russel Wallace, one of the greatest naturalists of the 19th century. This records the moment he first saw a male golden birdwing butterfly, Ornithoptera croesus, in the rainforest of Bacan Island, Indonesia. The statue stands just outside the Darwin Building at the Natural History Museum in London; if you could follow the statue’s gaze and you would see a model of the butterfly on the wall.
6
Ch
apte
r 15
Evo
luti
on
Darwin did not use the word ‘evolution’ until the last paragraph. Instead he referred to ‘descent with modification’, which is a good way to think of evolution as you read this chapter.
A central pillar of Darwin’s argument in On the Origin of Species is the variation that exists within species. He spent much of his life collecting and recording examples of this variation. We will first consider several aspects of variation, before dealing with the idea of natural selection.
VariationNo group of organisms is completely identical. Some organisms are clones – they all have the same genotype. But even if their genotypes are identical, there will still be slight differences in phenotype as a result of the different environments that they live in or the different interactions with other organisms that they have had.
Genetic variation is the variation in genotypes that exists within a species (see Chapter 12). Phenotypic variation is the variation that is visible, or detectable, within a species. We usually assume that an organism’s phenotype is its outward appearance; such things as height, mass, shape and colour. However, as we will see, an organism’s phenotype includes all aspects of its biology except its genes. Your blood group is as much a part of your phenotype as the shape of your face.
There is variation both within and between species. Interspecific variation is variation between species. This variation is used to identify different species and to classify them, as discussed in Chapter 13. Much more important for the discussion of natural selection and evolution is intraspecific variation, which is variation within species. This variation is due to genetic differences between individuals and also the effect of the environment, as well as interactions between genes and the environment. This variation is the raw material for natural selection.
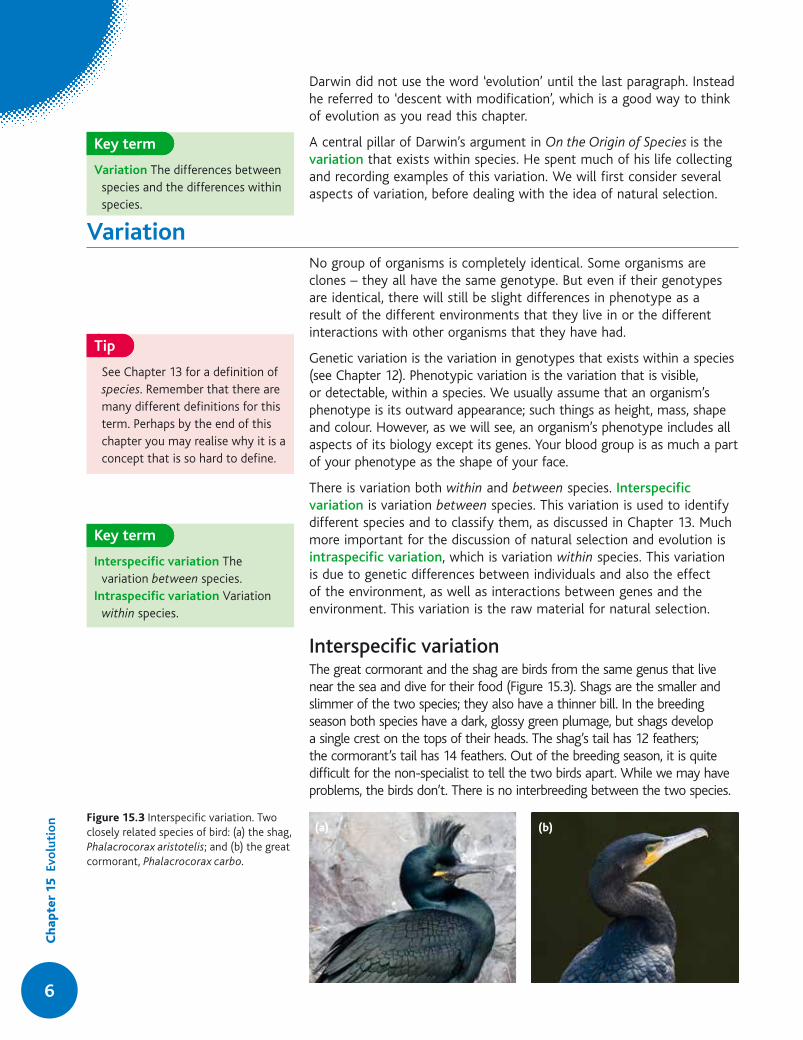
Interspecific variationThe great cormorant and the shag are birds from the same genus that live near the sea and dive for their food (Figure 15.3). Shags are the smaller and slimmer of the two species; they also have a thinner bill. In the breeding season both species have a dark, glossy green plumage, but shags develop a single crest on the tops of their heads. The shag’s tail has 12 feathers; the cormorant’s tail has 14 feathers. Out of the breeding season, it is quite difficult for the non-specialist to tell the two birds apart. While we may have problems, the birds don’t. There is no interbreeding between the two species.
Key term
Variation The differences between species and the differences within species.
Tip
See Chapter 13 for a definition of species. Remember that there are many different definitions for this term. Perhaps by the end of this chapter you may realise why it is a concept that is so hard to define.
Key term
Interspecific variation The variation between species.
Intraspecific variation Variation within species.
Figure 15.3 Interspecific variation. Two closely related species of bird: (a) the shag, Phalacrocorax aristotelis; and (b) the great cormorant, Phalacrocorax carbo.
(a) (b)
7
Variation
Not only are these two species closely related, but they tend to live in the same habitat in the same coastal areas. No two species occupy the same niche; however, they may occupy the same physical area but feed in different ways and roost in different places so that they avoid direct competition. (Exam practice question 7 on page 27 has information about how P. carbo and another related species, P. auritus, co-exist in the same areas of Nova Scotia in Canada.)
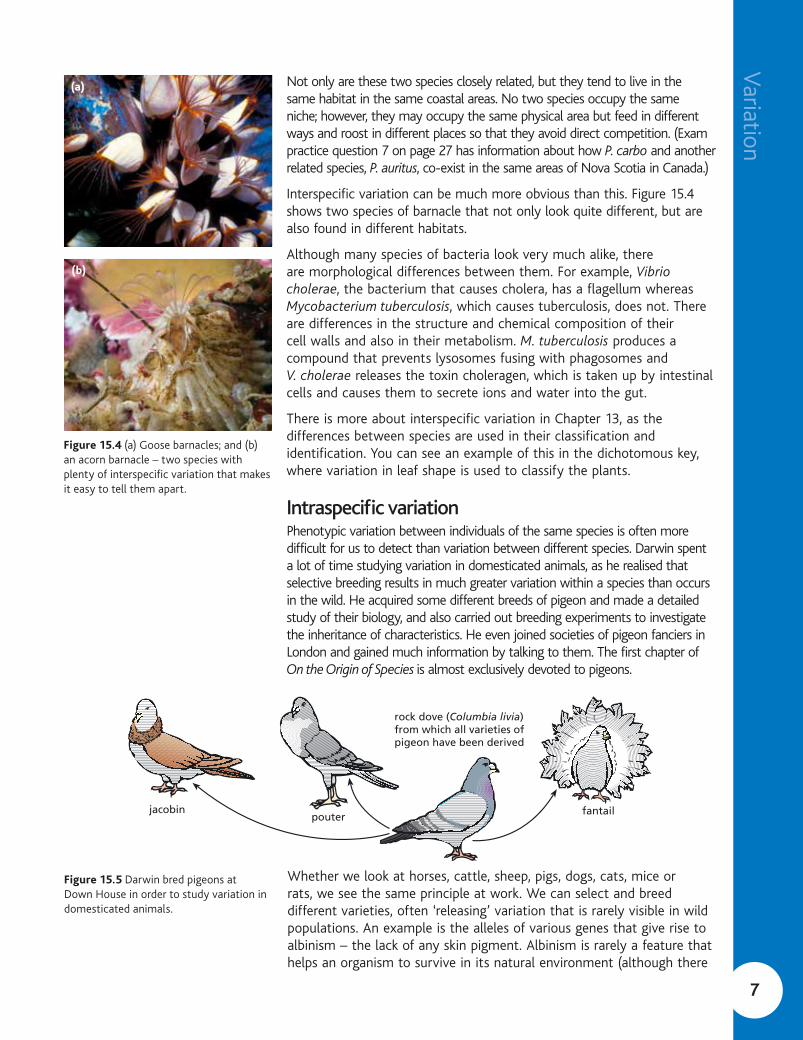
Interspecific variation can be much more obvious than this. Figure 15.4 shows two species of barnacle that not only look quite different, but are also found in different habitats.
Although many species of bacteria look very much alike, there are morphological differences between them. For example, Vibrio cholerae, the bacterium that causes cholera, has a flagellum whereas Mycobacterium tuberculosis, which causes tuberculosis, does not. There are differences in the structure and chemical composition of their cell walls and also in their metabolism. M. tuberculosis produces a compound that prevents lysosomes fusing with phagosomes and V. cholerae releases the toxin choleragen, which is taken up by intestinal cells and causes them to secrete ions and water into the gut.
There is more about interspecific variation in Chapter 13, as the differences between species are used in their classification and identification. You can see an example of this in the dichotomous key, where variation in leaf shape is used to classify the plants.
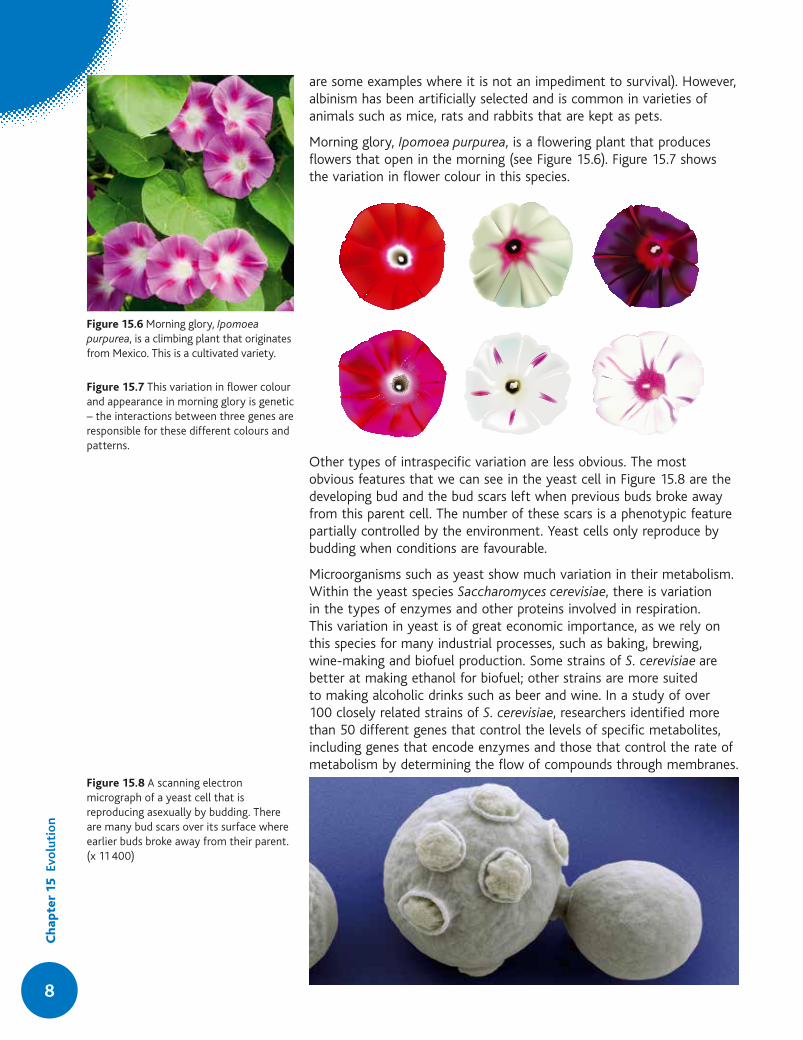
Intraspecific variationPhenotypic variation between individuals of the same species is often more difficult for us to detect than variation between different species. Darwin spent a lot of time studying variation in domesticated animals, as he realised that selective breeding results in much greater variation within a species than occurs in the wild. He acquired some different breeds of pigeon and made a detailed study of their biology, and also carried out breeding experiments to investigate the inheritance of characteristics. He even joined societies of pigeon fanciers in London and gained much information by talking to them. The first chapter of On the Origin of Species is almost exclusively devoted to pigeons.
Whether we look at horses, cattle, sheep, pigs, dogs, cats, mice or rats, we see the same principle at work. We can select and breed different varieties, often ‘releasing’ variation that is rarely visible in wild populations. An example is the alleles of various genes that give rise to albinism – the lack of any skin pigment. Albinism is rarely a feature that helps an organism to survive in its natural environment (although there
Figure 15.4 (a) Goose barnacles; and (b) an acorn barnacle – two species with plenty of interspecific variation that makes it easy to tell them apart.
Figure 15.5 Darwin bred pigeons at Down House in order to study variation in domesticated animals.
jacobinpouter fantail
rock dove (Columbia livia)from which all varieties ofpigeon have been derived
(a)
(b)
8
Ch
apte
r 15
Evo
luti
on
are some examples where it is not an impediment to survival). However, albinism has been artificially selected and is common in varieties of animals such as mice, rats and rabbits that are kept as pets.
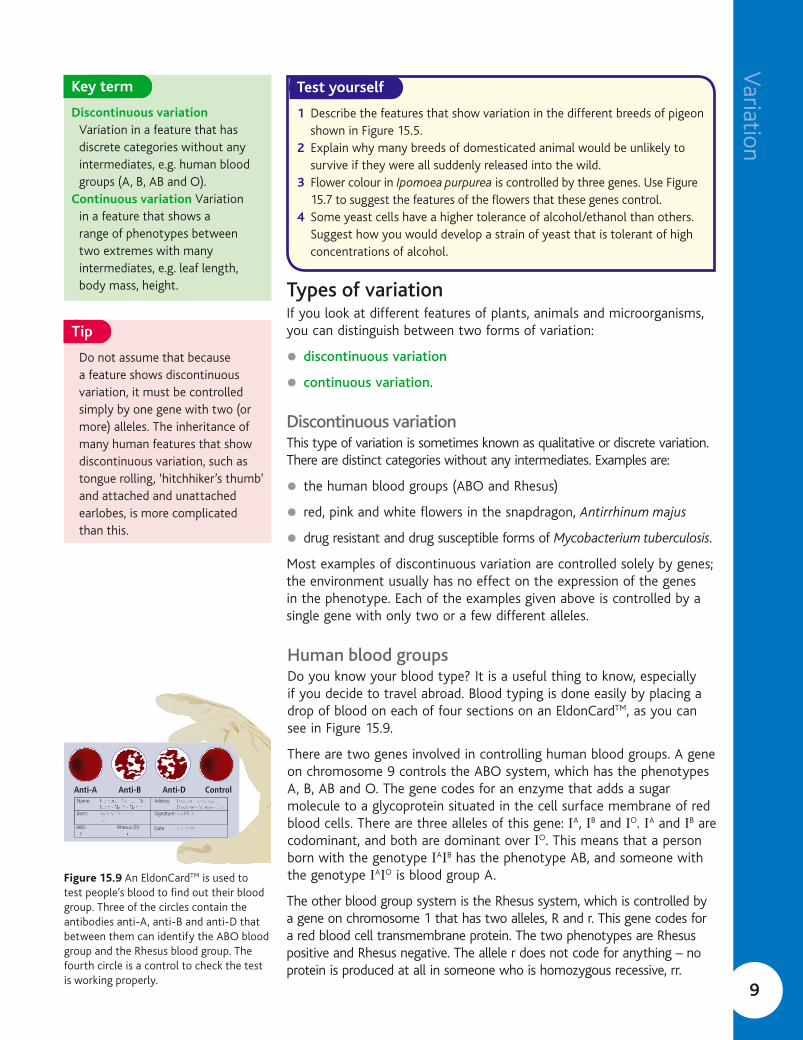
Morning glory, Ipomoea purpurea, is a flowering plant that produces flowers that open in the morning (see Figure 15.6). Figure 15.7 shows the variation in flower colour in this species.
Other types of intraspecific variation are less obvious. The most obvious features that we can see in the yeast cell in Figure 15.8 are the developing bud and the bud scars left when previous buds broke away from this parent cell. The number of these scars is a phenotypic feature partially controlled by the environment. Yeast cells only reproduce by budding when conditions are favourable.
Microorganisms such as yeast show much variation in their metabolism. Within the yeast species Saccharomyces cerevisiae, there is variation in the types of enzymes and other proteins involved in respiration. This variation in yeast is of great economic importance, as we rely on this species for many industrial processes, such as baking, brewing, wine-making and biofuel production. Some strains of S. cerevisiae are better at making ethanol for biofuel; other strains are more suited to making alcoholic drinks such as beer and wine. In a study of over 100 closely related strains of S. cerevisiae, researchers identified more than 50 different genes that control the levels of specific metabolites, including genes that encode enzymes and those that control the rate of metabolism by determining the flow of compounds through membranes.
Figure 15.6 Morning glory, Ipomoea purpurea, is a climbing plant that originates from Mexico. This is a cultivated variety.
Figure 15.7 This variation in flower colour and appearance in morning glory is genetic – the interactions between three genes are responsible for these different colours and patterns.
Figure 15.8 A scanning electron micrograph of a yeast cell that is reproducing asexually by budding. There are many bud scars over its surface where earlier buds broke away from their parent. (x 11 400)
9
Variation
Types of variationIf you look at different features of plants, animals and microorganisms, you can distinguish between two forms of variation:
l discontinuous variation
l continuous variation.
Discontinuous variationThis type of variation is sometimes known as qualitative or discrete variation. There are distinct categories without any intermediates. Examples are:
l the human blood groups (ABO and Rhesus)
l red, pink and white flowers in the snapdragon, Antirrhinum majus
l drug resistant and drug susceptible forms of Mycobacterium tuberculosis.
Most examples of discontinuous variation are controlled solely by genes; the environment usually has no effect on the expression of the genes in the phenotype. Each of the examples given above is controlled by a single gene with only two or a few different alleles.
Human blood groupsDo you know your blood type? It is a useful thing to know, especially if you decide to travel abroad. Blood typing is done easily by placing a drop of blood on each of four sections on an EldonCardTM, as you can see in Figure 15.9.
There are two genes involved in controlling human blood groups. A gene on chromosome 9 controls the ABO system, which has the phenotypes A, B, AB and O. The gene codes for an enzyme that adds a sugar molecule to a glycoprotein situated in the cell surface membrane of red blood cells. There are three alleles of this gene: IA, IB and IO. IA and IB are codominant, and both are dominant over IO. This means that a person born with the genotype IAIB has the phenotype AB, and someone with the genotype IAIO is blood group A.
The other blood group system is the Rhesus system, which is controlled by a gene on chromosome 1 that has two alleles, R and r. This gene codes for a red blood cell transmembrane protein. The two phenotypes are Rhesus positive and Rhesus negative. The allele r does not code for anything – no protein is produced at all in someone who is homozygous recessive, rr.
Test yourself
1 Describe the features that show variation in the different breeds of pigeon shown in Figure 15.5.
2 Explain why many breeds of domesticated animal would be unlikely to survive if they were all suddenly released into the wild.
3 Flower colour in Ipomoea purpurea is controlled by three genes. Use Figure 15.7 to suggest the features of the flowers that these genes control.
4 Some yeast cells have a higher tolerance of alcohol/ethanol than others. Suggest how you would develop a strain of yeast that is tolerant of high concentrations of alcohol.
Key term
Discontinuous variation Variation in a feature that has discrete categories without any intermediates, e.g. human blood groups (A, B, AB and O).
Continuous variation Variation in a feature that shows a range of phenotypes between two extremes with many intermediates, e.g. leaf length, body mass, height.
Tip
Do not assume that because a feature shows discontinuous variation, it must be controlled simply by one gene with two (or more) alleles. The inheritance of many human features that show discontinuous variation, such as tongue rolling, ‘hitchhiker’s thumb’ and attached and unattached earlobes, is more complicated than this.
Anti-ANombre - Nome - NevNom - Navn - Namn ssdass-dfd-fs-sdfdf
+B
Anti-B Anti-D ControlName:
Born: Signature:
ABO Rhesus (D) Date:
Address: Direction - Endereco - Direzione - Adresse - Cimsdsdffdfdf
25-12-84
Figure 15.9 An EldonCardTM is used to test people’s blood to find out their blood group. Three of the circles contain the antibodies anti-A, anti-B and anti-D that between them can identify the ABO blood group and the Rhesus blood group. The fourth circle is a control to check the test is working properly.
10
Ch
apte
r 15
Evo
luti
on
Continuous variationThis type of variation is sometimes known as quantitative variation. Any feature that can be measured, for example with a ruler or a balance, shows this type of variation. Examples are mass and linear measurements of organisms, such as height of plants, width of leaves and length of tails. For each feature there is a range of measurements between two extremes, with no easily identifiable intermediate groups as in discontinuous variation. Continuous variation is controlled both by genes and by the environment.
The effects of the environment are relatively easy to appreciate. The mass and height of an animal is dependent on the quantity and quality of food that it eats. An animal with many genes for ‘large size’ will not reach its genetic potential if it is starved during the time when it should be growing. Similarly, a plant that has the genotype for dwarfism is not going to grow into a tall plant, however good the growing conditions and the supply of light, water and mineral ions.
There are usually many genes that influence these features and often these genes have two or more alleles, so the genetic contribution to the variation is often complex. In a simple example, imagine that a plant has four genes, A, B, C and D, that control its height. Each gene has two alleles: Allele 1 adds 10 mm to the height and Allele 2 adds 20 mm. The alleles are co-dominant (both are expressed in a heterozygote). This means that, given good growing conditions, the heights of plants with some selected genotypes are as shown in Table 15.2.
Genes that control features in the way shown in Table 15.2 are known as polygenes. The feature, in this case height, is described as polygenic.
Data on features that show continuous variation is more complex than that for discontinuous variation. Table 15.3 shows the lengths of 50 leaves taken from a plant. The leaves were measured to the nearest millimetre.
Activity
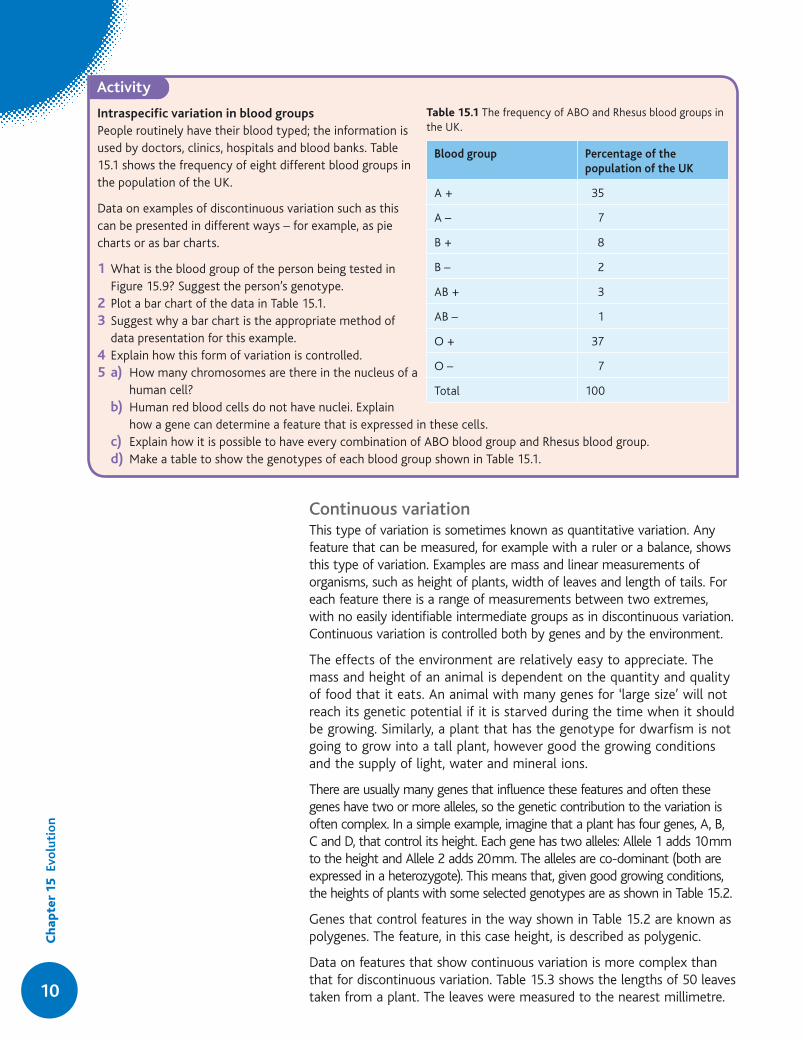
Intraspecific variation in blood groupsPeople routinely have their blood typed; the information is used by doctors, clinics, hospitals and blood banks. Table 15.1 shows the frequency of eight different blood groups in the population of the UK.
Data on examples of discontinuous variation such as this can be presented in different ways – for example, as pie charts or as bar charts.
1 What is the blood group of the person being tested in Figure 15.9? Suggest the person’s genotype.
2 Plot a bar chart of the data in Table 15.1.3 Suggest why a bar chart is the appropriate method of
data presentation for this example.4 Explain how this form of variation is controlled.5 a) How many chromosomes are there in the nucleus of a
human cell?b) Human red blood cells do not have nuclei. Explain
how a gene can determine a feature that is expressed in these cells.c) Explain how it is possible to have every combination of ABO blood group and Rhesus blood group.d) Make a table to show the genotypes of each blood group shown in Table 15.1.
Table 15.1 The frequency of ABO and Rhesus blood groups in the UK.
Blood group Percentage of the population of the UK
A + 35
A – 7
B + 8
B – 2
AB + 3
AB – 1
O + 37
O – 7
Total 100

11
Variation
Table 15.3 The lengths of 50 leaves from the same species.
Length of leaves/mm
31 39 43 12 30
26 21 37 29 32
13 22 12 28 35
26 23 27 8 34
33 21 27 31 18
19 36 25 28 24
19 24 27 30 22
17 24 25 31 23
28 25 26 31 40
22 24 25 18 24
This data does not mean much as it is. Data like this can be entered into a spreadsheet and ranked, for example in ascending order. The data needs to be organised and simplified even more to help us see any pattern. Continuous data does not fall into discrete groups as data for features that show discontinuous variation does. To organise the data, it is necessary to make some categories, known as classes.
The data can now be arranged into classes as shown in the tally table, Table 15.4.
Table 15.4 Tally table for the data in Table 15.3.
Class/mm Tally Frequency Percentage frequency
8–11 | 1 2
12–15 ||| 3 6
16–19 |||| 5 10
20–23 |||| || 7 14
24–27 |||| |||| |||| 15 30
28–31 |||| |||| 10 20
32–35 |||| 4 8
36–39 ||| 3 6
40–43 || 2 4
Total 50 50 100
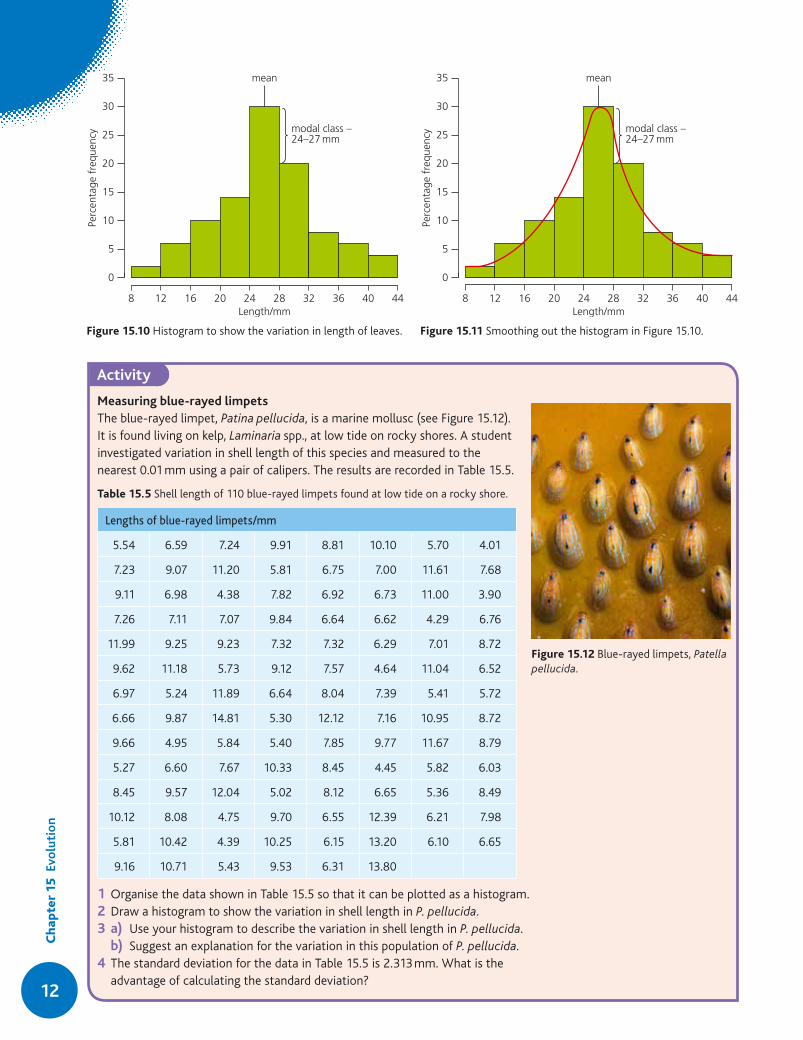
The information about variation in leaf length is now in a form that can be presented as a frequency histogram. Figure 15.10 shows a frequency histogram of the data in Table 15.4.
The data can be simplified in other ways, for example by finding different measures of ‘averageness’. These are: mean, median and mode. The most appropriate ‘averages’ for the data in Tables 15.3 and 15.4 and Figure 15.10 are mean and modal class, and these are shown on Figure 15.11.
Table 15.2 The heights of three plants, each with a different genotype (see text for details).
Genotype Phenotype: height/mm
A1A
1B
1B
1C
1C
1D
1D
1 80
A1A
1B
1B
2C
1C
2D
1D
1100
A1A
2B
1B
2C
1C
2D
1D
2120
12
Ch
apte
r 15
Evo
luti
on
Activity
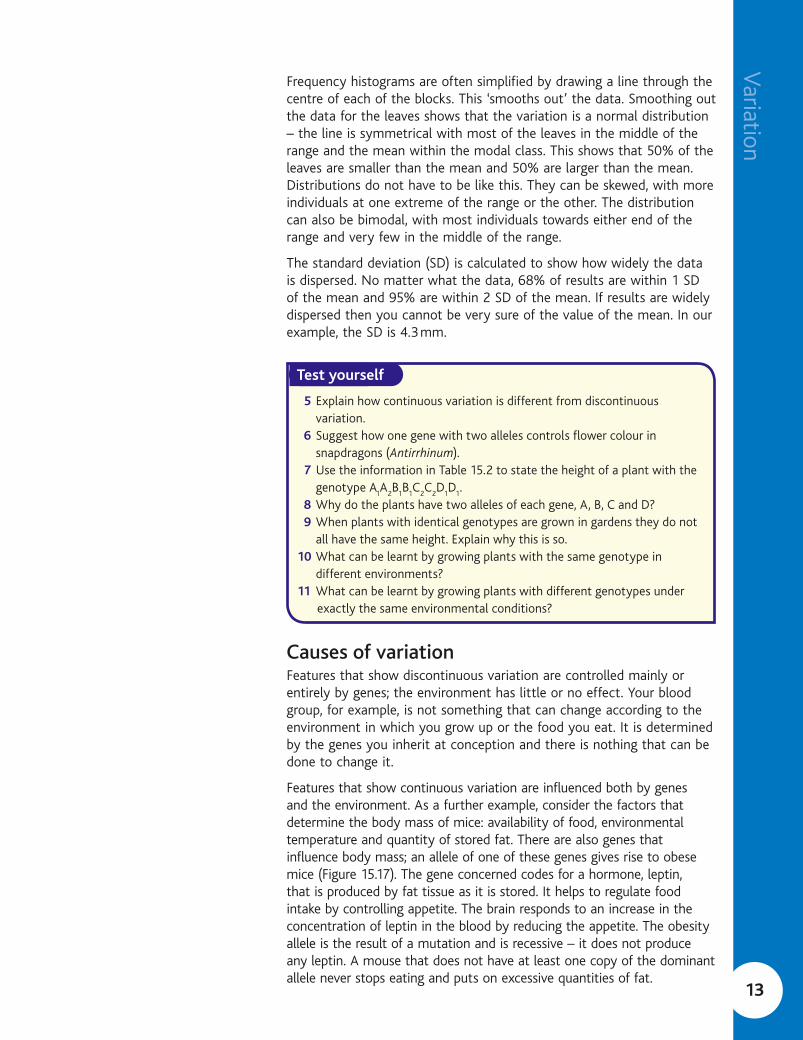
Measuring blue-rayed limpetsThe blue-rayed limpet, Patina pellucida, is a marine mollusc (see Figure 15.12). It is found living on kelp, Laminaria spp., at low tide on rocky shores. A student investigated variation in shell length of this species and measured to the nearest 0.01 mm using a pair of calipers. The results are recorded in Table 15.5.
Table 15.5 Shell length of 110 blue-rayed limpets found at low tide on a rocky shore.
Lengthsofblue-rayedlimpets/mm
5.54 6.59 7.24 9.91 8.81 10.10 5.70 4.01
7.23 9.07 11.20 5.81 6.75 7.00 11.61 7.68
9.11 6.98 4.38 7.82 6.92 6.73 11.00 3.90
7.26 7.11 7.07 9.84 6.64 6.62 4.29 6.76
11.99 9.25 9.23 7.32 7.32 6.29 7.01 8.72
9.62 11.18 5.73 9.12 7.57 4.64 11.04 6.52
6.97 5.24 11.89 6.64 8.04 7.39 5.41 5.72
6.66 9.87 14.81 5.30 12.12 7.16 10.95 8.72
9.66 4.95 5.84 5.40 7.85 9.77 11.67 8.79
5.27 6.60 7.67 10.33 8.45 4.45 5.82 6.03
8.45 9.57 12.04 5.02 8.12 6.65 5.36 8.49
10.12 8.08 4.75 9.70 6.55 12.39 6.21 7.98
5.81 10.42 4.39 10.25 6.15 13.20 6.10 6.65
9.16 10.71 5.43 9.53 6.31 13.80
1 Organise the data shown in Table 15.5 so that it can be plotted as a histogram.2 Draw a histogram to show the variation in shell length in P. pellucida.3 a) Use your histogram to describe the variation in shell length in P. pellucida.
b) Suggest an explanation for the variation in this population of P. pellucida.4 The standard deviation for the data in Table 15.5 is 2.313 mm. What is the
advantage of calculating the standard deviation?
Figure 15.12 Blue-rayed limpets, Patella pellucida.
Figure 15.10 Histogram to show the variation in length of leaves. Figure 15.11 Smoothing out the histogram in Figure 15.10.
Perc
enta
ge f
requ
ency
8 12 16 20 24Length/mm
28 32 36 40 44
mean
modal class – 24–27 mm
0
5
10
15
20
25
30
35
Perc
enta
ge f
requ
ency
8 12 16 20 24Length/mm
28 32 36 40 44
mean
modal class – 24–27 mm
0
5
10
15
20
25
30
35
13
Variation
Frequency histograms are often simplified by drawing a line through the centre of each of the blocks. This ‘smooths out’ the data. Smoothing out the data for the leaves shows that the variation is a normal distribution – the line is symmetrical with most of the leaves in the middle of the range and the mean within the modal class. This shows that 50% of the leaves are smaller than the mean and 50% are larger than the mean. Distributions do not have to be like this. They can be skewed, with more individuals at one extreme of the range or the other. The distribution can also be bimodal, with most individuals towards either end of the range and very few in the middle of the range.
The standard deviation (SD) is calculated to show how widely the data is dispersed. No matter what the data, 68% of results are within 1 SD of the mean and 95% are within 2 SD of the mean. If results are widely dispersed then you cannot be very sure of the value of the mean. In our example, the SD is 4.3 mm.
Causes of variationFeatures that show discontinuous variation are controlled mainly or entirely by genes; the environment has little or no effect. Your blood group, for example, is not something that can change according to the environment in which you grow up or the food you eat. It is determined by the genes you inherit at conception and there is nothing that can be done to change it.
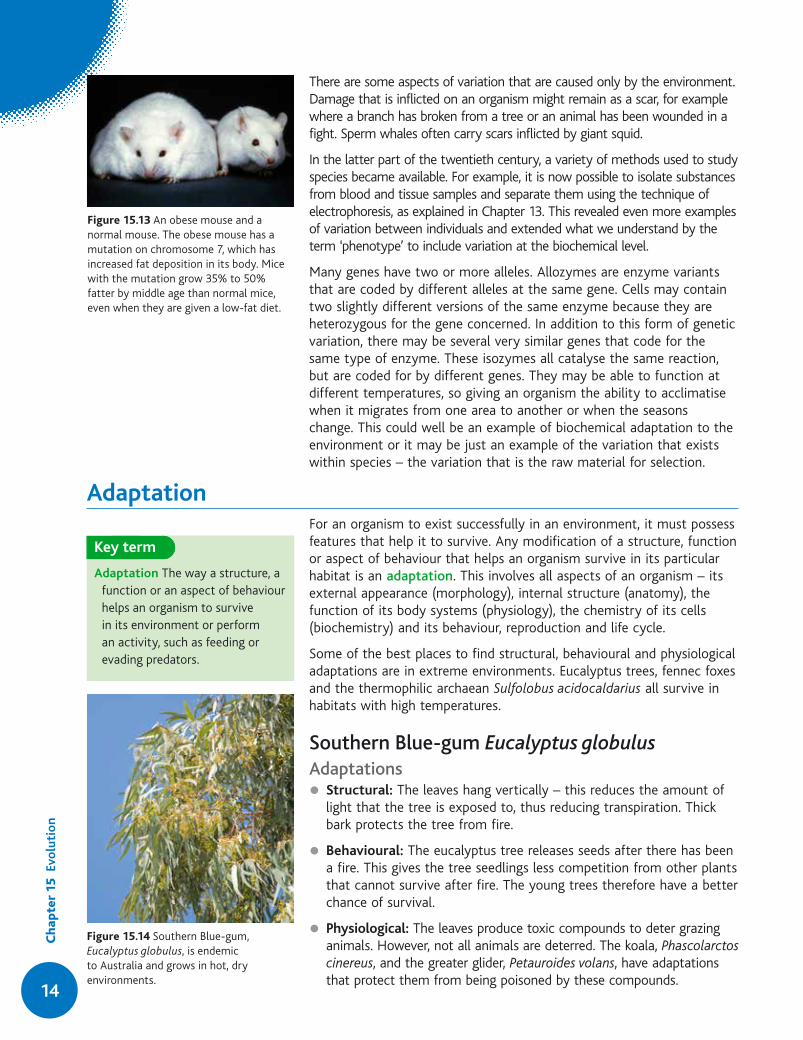
Features that show continuous variation are influenced both by genes and the environment. As a further example, consider the factors that determine the body mass of mice: availability of food, environmental temperature and quantity of stored fat. There are also genes that influence body mass; an allele of one of these genes gives rise to obese mice (Figure 15.17). The gene concerned codes for a hormone, leptin, that is produced by fat tissue as it is stored. It helps to regulate food intake by controlling appetite. The brain responds to an increase in the concentration of leptin in the blood by reducing the appetite. The obesity allele is the result of a mutation and is recessive – it does not produce any leptin. A mouse that does not have at least one copy of the dominant allele never stops eating and puts on excessive quantities of fat.
Test yourself
5 Explain how continuous variation is different from discontinuous variation.
6 Suggest how one gene with two alleles controls flower colour in snapdragons (Antirrhinum).
7 Use the information in Table 15.2 to state the height of a plant with the genotype A
1A
2B
1B
1C
2C
2D
1D
1.
8 Why do the plants have two alleles of each gene, A, B, C and D? 9 When plants with identical genotypes are grown in gardens they do not
all have the same height. Explain why this is so.10 What can be learnt by growing plants with the same genotype in
different environments?11 What can be learnt by growing plants with different genotypes under
exactly the same environmental conditions?
14
Ch
apte
r 15
Evo
luti
on
There are some aspects of variation that are caused only by the environment. Damage that is inflicted on an organism might remain as a scar, for example where a branch has broken from a tree or an animal has been wounded in a fight. Sperm whales often carry scars inflicted by giant squid.
In the latter part of the twentieth century, a variety of methods used to study species became available. For example, it is now possible to isolate substances from blood and tissue samples and separate them using the technique of electrophoresis, as explained in Chapter 13. This revealed even more examples of variation between individuals and extended what we understand by the term ‘phenotype’ to include variation at the biochemical level.
Many genes have two or more alleles. Allozymes are enzyme variants that are coded by different alleles at the same gene. Cells may contain two slightly different versions of the same enzyme because they are heterozygous for the gene concerned. In addition to this form of genetic variation, there may be several very similar genes that code for the same type of enzyme. These isozymes all catalyse the same reaction, but are coded for by different genes. They may be able to function at different temperatures, so giving an organism the ability to acclimatise when it migrates from one area to another or when the seasons change. This could well be an example of biochemical adaptation to the environment or it may be just an example of the variation that exists within species – the variation that is the raw material for selection.
AdaptationFor an organism to exist successfully in an environment, it must possess features that help it to survive. Any modification of a structure, function or aspect of behaviour that helps an organism survive in its particular habitat is an adaptation. This involves all aspects of an organism – its external appearance (morphology), internal structure (anatomy), the function of its body systems (physiology), the chemistry of its cells (biochemistry) and its behaviour, reproduction and life cycle.
Some of the best places to find structural, behavioural and physiological adaptations are in extreme environments. Eucalyptus trees, fennec foxes and the thermophilic archaean Sulfolobus acidocaldarius all survive in habitats with high temperatures.
Southern Blue-gum Eucalyptus globulusAdaptationsl Structural: The leaves hang vertically – this reduces the amount of
light that the tree is exposed to, thus reducing transpiration. Thick bark protects the tree from fire.
l Behavioural: The eucalyptus tree releases seeds after there has been a fire. This gives the tree seedlings less competition from other plants that cannot survive after fire. The young trees therefore have a better chance of survival.
l Physiological: The leaves produce toxic compounds to deter grazing animals. However, not all animals are deterred. The koala, Phascolarctos cinereus, and the greater glider, Petauroides volans, have adaptations that protect them from being poisoned by these compounds.
Figure 15.13 An obese mouse and a normal mouse. The obese mouse has a mutation on chromosome 7, which has increased fat deposition in its body. Mice with the mutation grow 35% to 50% fatter by middle age than normal mice, even when they are given a low-fat diet.
Key term
Adaptation The way a structure, a function or an aspect of behaviour helps an organism to survive in its environment or perform an activity, such as feeding or evading predators.
Figure 15.14 Southern Blue-gum, Eucalyptus globulus, is endemic to Australia and grows in hot, dry environments.
15
Adaptation
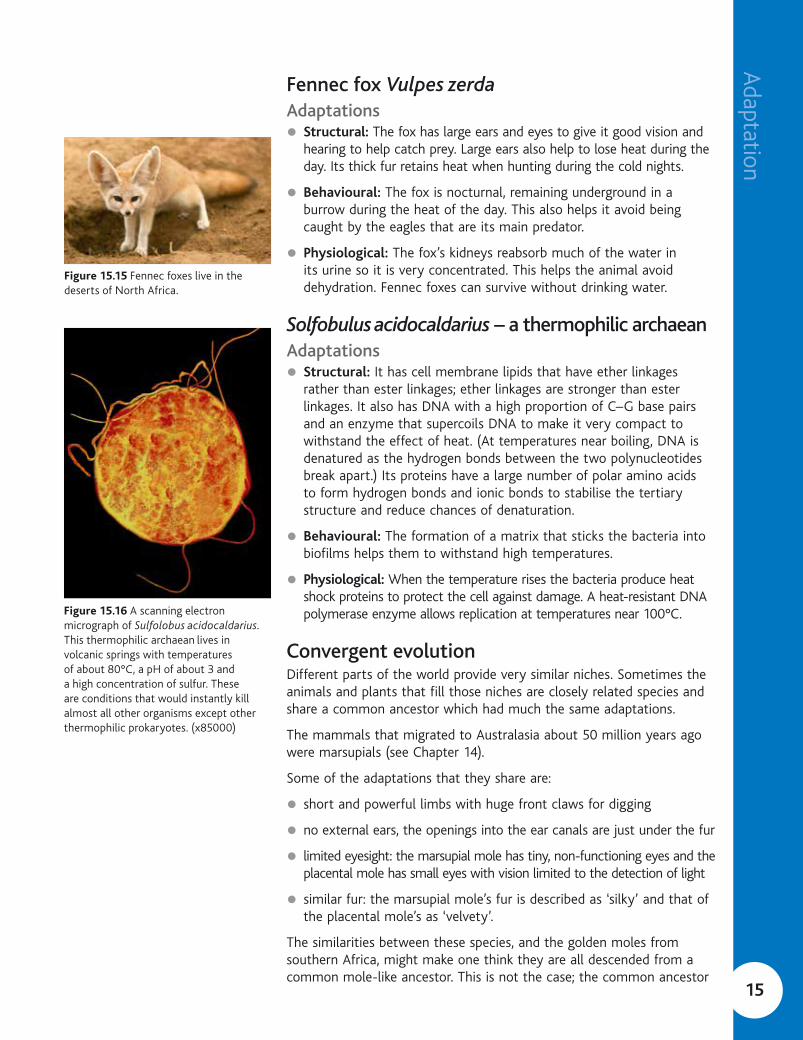
Fennec fox Vulpes zerdaAdaptationsl Structural: The fox has large ears and eyes to give it good vision and
hearing to help catch prey. Large ears also help to lose heat during the day. Its thick fur retains heat when hunting during the cold nights.
l Behavioural: The fox is nocturnal, remaining underground in a burrow during the heat of the day. This also helps it avoid being caught by the eagles that are its main predator.
l Physiological: The fox’s kidneys reabsorb much of the water in its urine so it is very concentrated. This helps the animal avoid dehydration. Fennec foxes can survive without drinking water.
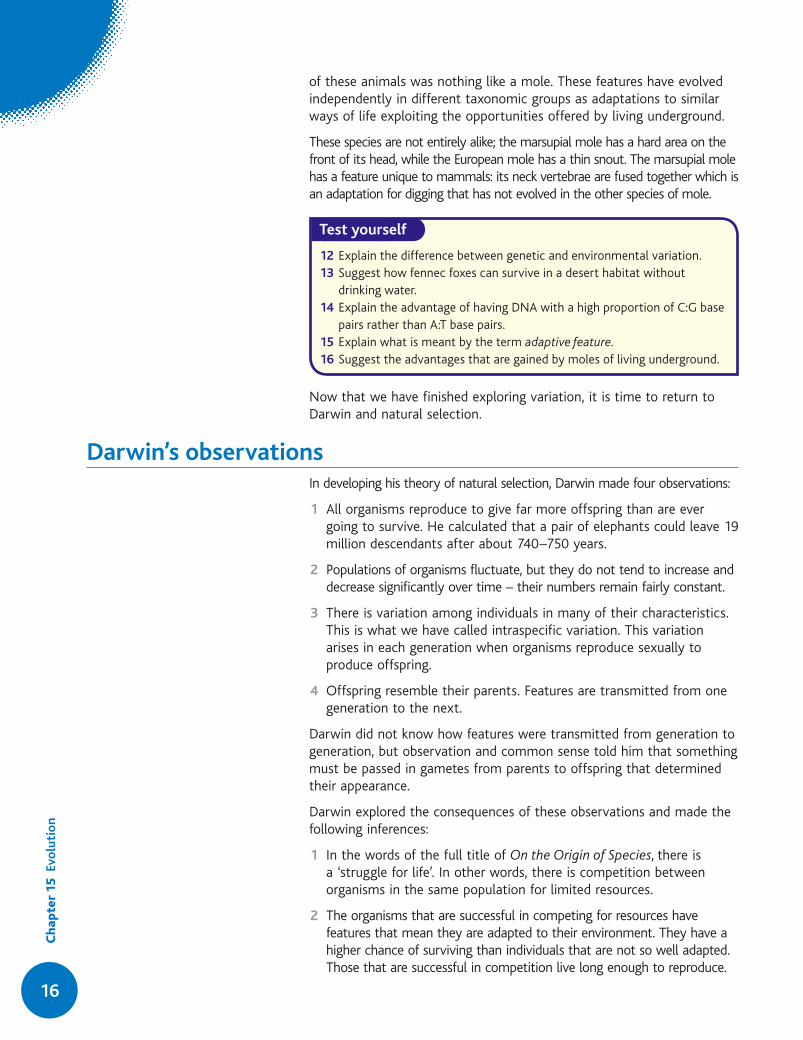
Solfobulus acidocaldarius – a thermophilic archaeanAdaptationsl Structural: It has cell membrane lipids that have ether linkages
rather than ester linkages; ether linkages are stronger than ester linkages. It also has DNA with a high proportion of C–G base pairs and an enzyme that supercoils DNA to make it very compact to withstand the effect of heat. (At temperatures near boiling, DNA is denatured as the hydrogen bonds between the two polynucleotides break apart.) Its proteins have a large number of polar amino acids to form hydrogen bonds and ionic bonds to stabilise the tertiary structure and reduce chances of denaturation.
l Behavioural: The formation of a matrix that sticks the bacteria into biofilms helps them to withstand high temperatures.
l Physiological: When the temperature rises the bacteria produce heat shock proteins to protect the cell against damage. A heat-resistant DNA polymerase enzyme allows replication at temperatures near 100°C.
Convergent evolutionDifferent parts of the world provide very similar niches. Sometimes the animals and plants that fill those niches are closely related species and share a common ancestor which had much the same adaptations.
The mammals that migrated to Australasia about 50 million years ago were marsupials (see Chapter 14).
Some of the adaptations that they share are:
l short and powerful limbs with huge front claws for digging
l no external ears, the openings into the ear canals are just under the fur
l limited eyesight: the marsupial mole has tiny, non-functioning eyes and the placental mole has small eyes with vision limited to the detection of light
l similar fur: the marsupial mole’s fur is described as ‘silky’ and that of the placental mole’s as ‘velvety’.
The similarities between these species, and the golden moles from southern Africa, might make one think they are all descended from a common mole-like ancestor. This is not the case; the common ancestor
Figure 15.15 Fennec foxes live in the deserts of North Africa.
Figure 15.16 A scanning electron micrograph of Sulfolobus acidocaldarius. This thermophilic archaean lives in volcanic springs with temperatures of about 80°C, a pH of about 3 and a high concentration of sulfur. These are conditions that would instantly kill almost all other organisms except other thermophilic prokaryotes. (x85000)
16
Ch
apte
r 15
Evo
luti
on
of these animals was nothing like a mole. These features have evolved independently in different taxonomic groups as adaptations to similar ways of life exploiting the opportunities offered by living underground.
These species are not entirely alike; the marsupial mole has a hard area on the front of its head, while the European mole has a thin snout. The marsupial mole has a feature unique to mammals: its neck vertebrae are fused together which is an adaptation for digging that has not evolved in the other species of mole.
Now that we have finished exploring variation, it is time to return to Darwin and natural selection.
Darwin’s observationsIn developing his theory of natural selection, Darwin made four observations:
1 All organisms reproduce to give far more offspring than are ever going to survive. He calculated that a pair of elephants could leave 19 million descendants after about 740–750 years.
2 Populations of organisms fluctuate, but they do not tend to increase and decrease significantly over time – their numbers remain fairly constant.
3 There is variation among individuals in many of their characteristics. This is what we have called intraspecific variation. This variation arises in each generation when organisms reproduce sexually to produce offspring.
4 Offspring resemble their parents. Features are transmitted from one generation to the next.
Darwin did not know how features were transmitted from generation to generation, but observation and common sense told him that something must be passed in gametes from parents to offspring that determined their appearance.
Darwin explored the consequences of these observations and made the following inferences:
1 In the words of the full title of On the Origin of Species, there is a ‘struggle for life’. In other words, there is competition between organisms in the same population for limited resources.
2 The organisms that are successful in competing for resources have features that mean they are adapted to their environment. They have a higher chance of surviving than individuals that are not so well adapted. Those that are successful in competition live long enough to reproduce.
Test yourself
12 Explain the difference between genetic and environmental variation.13 Suggest how fennec foxes can survive in a desert habitat without
drinking water.14 Explain the advantage of having DNA with a high proportion of C:G base
pairs rather than A:T base pairs.15 Explain what is meant by the term adaptive feature.16 Suggest the advantages that are gained by moles of living underground.

17
Darw
in’s observations
3 Organisms that reproduce pass on inherited characteristics to the next generation. This next generation contains a higher proportion of offspring from the best adapted parents than from those that are less well adapted.
4 This unequal ability of individuals to survive and reproduce leads to a gradual change in a population, with certain adaptations increasing in frequency over the generations.
CompetitionThere are finite quantities of resources for organisms. Individuals of the same species need the same resources and have similar ways of gaining them. If there are more organisms than the environment can support, many will die, so that populations remain fairly constant from generation to generation. Some of the environmental factors that control the sizes of populations of heterotrophic organisms are food, water, disease and predation. Populations of autotrophs are controlled by disease and grazing, but also by access to light, carbon dioxide, water and mineral ions. Poorly adapted organisms have a lower chance of surviving and a higher risk of dying before they have a chance to reproduce.
Darwin’s great idea cannot easily be summarised in a snappy phrase. It is often reduced to ‘survival of the fittest’, which in some people’s minds reads as ‘survival of the strongest’. This is not so; think of wily predators that not only outsmart their prey, but are better at it than others of their species. In biology, fitness is a term with a specific meaning: it
Overproduction:left unchecked the numbers oforganisms in a population wouldincrease exponentially
Intraspecific competition: competition in a populationis at its most intense betweenindividuals of the same species,as they occupy the same niche
Individuals that are successfulin competition for resourcessurvive and reproduceto leave more offspringthan those that areless successful
Population now contains ahigher proportion of individualsthat are best adapted to theenvironmental conditions
However, the environmentprovides limited resources,e.g. food, water and space,and has predators and diseases
Figure 15.17 The theory of natural selection.
Tip
As we will see, selection does not always lead to changes in frequency. Most of the time the environment does not change and selection acts to stabilise the population from generation to generation.
18
Ch
apte
r 15
Evo
luti
on
means that organisms survive to adulthood and reproduce. By this definition the fittest must be the survivors, so the phrase is meaningless. However, the big idea behind it is not.
Natural selectionThe organisms that are best adapted to gain resources, avoid catching lethal diseases and escape being eaten are likely to survive long enough to find a mate and pass on their alleles to future generations. These organisms are better adapted than others to the conditions prevailing at the time. They are selected by the environment.
When the environment is stable, natural selection acts to maintain the features of a species, but if the environment changes then selection pressures in the environment also change. This may mean that organisms with features that were previously disadvantageous are now the ones that compete well, survive and breed. The creation of variation within each generation is necessary for this to happen and for species to adapt to changing conditions. This shows that variation, adaptation and selection are important components of evolution. In a changing environment the individuals within a population that are best adapted to the new conditions have a higher chance of survival. Often they are at one extreme of the natural range of variation. For example, in cold conditions it is larger mice with a smaller surface area to volume ratio that survive (although they are not as large as the obese mouse in Figure 15.13!).
Tip
Remember that ‘survival of the fittest’ is like a catchphrase. It is far more important to explain the principles of natural selection as outlined here than to use this phrase on its own in an answer.
Key term
Natural selection The effect of environmental factors, such as competition, predation and disease, on a population such that those individuals that are best adapted to the conditions have a higher chance of surviving, reproducing and passing on their advantageous alleles. Natural selection is the main mechanism that brings about evolutionary change.
Example
The oldfield mouse, Peromyscus polionotus, lives in old, overgrown agricultural fields in the USA. These mice are dark brown in colour. Along the coasts of Florida and Alabama there are populations of this species that have colonised the light-coloured sand dunes and barrier islands. These mice are known as beach mice and they all have much lighter-coloured fur than the populations of oldfield mice that live inland.
Beach mice feed mainly at night on seeds. They also dig extensive burrows. Their main predators are owls, foxes and domestic cats. Predation experiments showed that the most conspicuously coloured mice were captured most often by owls, which are night-hunting predators.
1 Explain how beach mice are most likely to have evolved from oldfield mice.2 The different beach mice along the coasts of Florida and Alabama are
classified as subspecies of P. polionotus. a) Explain why they are classified as part of the same species as oldfield mice.b) Suggest how beach mice could evolve into a different species.
Answers1 Amongst the oldfield mice there will be variation in coat colour. Mice that
colonise the sand dunes and beaches are susceptible to predation. Night-hunting owls are more likely to catch the darker-coloured mice, as they will show up against the light-coloured sand. Mice with lighter-coloured coats are better adapted to the conditions on the beaches, as they have better camouflage than mice with darker coats. Lighter-coloured mice are therefore more likely to survive, reproduce and pass on their alleles to the next generation. This means that over time, the alleles for white, yellow or
19
Speciation
SpeciationSpeciation is the formation of new species from an existing species. There are two ways in which new species may arise:
l allopatric speciation, when populations of a species are physically separated by some geographical barrier that prevents the populations from interbreeding
l sympatric speciation, when populations of a species coexist in the same area but there is some other form of barrier to interbreeding between the populations.
For speciation to occur there needs to be some reproductive barrier between populations. Once a population becomes isolated, different selection pressures can have their effects.
Allopatric speciationPopulations of the same species may become separated by geographical barriers such as bodies of water or mountain ranges. Environmental conditions in the different areas are likely to be different, so different selection pressures exist. Over a period of time, natural selection occurs so that the populations are adapted to the different conditions. Eventually, these accumulated mutations mean that organisms from different populations cannot interbreed and produce fertile offspring and are therefore no longer the same species.
Sympatric speciationSpeciation may occur within a population, although this appears to be much rarer than allopatric speciation. When sympatric speciation occurs there is usually an abrupt change in a population, so that individuals are not able to interbreed. For example, hybridisation sometimes occurs between different species of plant. The hybrids are sterile and not able to breed with either parent. However, if the chromosome number doubles through a failure of meiosis, the hybrids may become fertile. An example of this speciation is polyploidy in cord grass, a plant that grows in salt marshes. This happened when a foreign species of cord grass, Spartina alterniflora from the East and Gulf coasts of the USA, invaded salt
light-brown coat colour become more frequent in the population. With time the population of mice living on the sand dunes will be a different colour from the inland mice.
2 a) Beach mice breed with oldfield mice to give fertile offspring. They share many features in common. The DNA of both types is very similar.
b) Beach mice could evolve into a different species if they become reproductively isolated from the oldfield mice. This could happen if there is a geographical barrier between the areas that the beach mice have colonised and the inland habitats of the oldfield mice. Within the beach mice population mutations would then occur. Some of these would be beneficial and improve the way in which the mice are adapted to their habitat. These mutations would become ‘fixed’ as a result of natural selection. Over time, more differences would accumulate so that eventually the beach mice and the oldfield mice could not interbreed.
Tip
There are many different ways to ask questions about natural selection. First, recognise that you are being asked about natural selection and then apply the points about overproduction, variation, competition, predation (as in the example), disease, survival of those best adapted, reproduction and the inheritance of alleles by the next generation.
Key term
Speciation New species arise from existing species. The process by which this happens is known as speciation.

20
Ch
apte
r 15
Evo
luti
on
marshes in Southampton Water and interbred with the native species of cord grass, S. maritima, to give a sterile hybrid known as S. townsendii. This hybrid, although sterile, was able to reproduce asexually. Then a chromosome mutation occurred that doubled its chromosome number and made it fertile, forming English cord grass, Spartina anglica. This is a distinct species because it does not interbreed with others, including S. maritima and S. alterniflora – it is reproductively isolated. This type of speciation happens in plants, but rarely in animals.
Evidence for evolutionThere are many lines of evidence that support the general theory that evolution has occurred. Some of these are:
l comparative morphology – the similarities in outward appearance of organisms; for example, all birds have beaks
l comparative anatomy – for example, the same basic pattern of bones in the limbs of all tetrapods (amphibians, reptiles, birds and mammals)
S. alterniflora (American species)2n = 62
S. maritima (European species)2n = 60
S. townsendii(sterile hybrid – reproduces by vegetative growth)
2n = 62
S. anglica(fertile – reproduces sexually and vegetatively)
2n = 124
chromosome numberdoubled – probably by failure in mitosis to separatechromosomes correctly
Figure 15.22 Sympatric speciation in cord grass. n = the haploid number of chromosomes; 2n = the diploid number. S. townsendii was sterile because the chromosomes it had inherited from S. maritima and S. alterniflora did not pair together in meiosis.
Test yourself
17 Sketch a graph to show how a population increases if there are no limiting factors.
18 What factors help a young mammal to survive?19 What factors help a young tree seedling to survive?20 A pair of small birds may have 15 young each year. Explain why so few of
them survive.21 Explain what selective advantage means.22 What is wrong with ‘the survival of the fittest’ as a strapline/slogan for
the theory of evolution by natural selection?23 The DNA in chloroplasts of S. anglica is identical to the DNA in
chloroplasts of S. alterniflora, but not to the chloroplast DNA in S. maritima. What is the significance of this discovery?

21
Evidence for evolutionl fossilised remains of organisms and other fossilised traces (such as
footprints, burrows and organic chemicals made by organisms) that are discovered in rocks
l comparative biochemistry – many biochemicals are found in all organisms, which suggests that they have a common origin; similarities and differences between proteins and DNA provide evidence for the evolutionary relationships between organisms
l classification reflects the phylogeny of groups of organisms, as discussed in Chapter 13.
There are also examples of selection in action that provide evidence for this as the mechanism for evolution (see pages 23–26).
Evidence from fossilsA fossil is the mineralised or otherwise preserved remains of an animal, plant or microorganism. Fossils may also consist of other traces of organisms, such as footprints, burrows and faeces (coprolites). Fossils are found in sedimentary rocks and chemical traces of fossils have also been detected in metamorphic rocks. The oldest fossils are those of prokaryotes, which have been found in rocks that are 3.5 billion years old. Chemical traces of prokaryotes have been found in rocks even older than this, indicating that life began as long ago as 3.9 billion years.
In the Grand Canyon in Arizona, the Colorado River has cut a deep gorge through layers of rock. At the base there are fossils of prokaryotes that are 1250 million years old. Near the top there are fossils of more recent origin, including coral and molluscs, that are 250 million years old. In the middle there are fossils of reptiles, amphibians and terrestrial plants. Fossils tell us that environments and organisms have changed over millions of years. Climbing up the Grand Canyon is like walking a timeline of life on Earth, from its simplest beginnings to the diversity of more complex forms that we have today. The rocks contain a record of the changes that have occurred over the long expanse of geological time.
There are a variety of ways in which rocks can be dated, such as by using different methods of chemical analysis and also by using fossils. By looking at the alignment of layers, or strata, of rocks, we can put fossil organisms into a sequence from oldest (lowest stratum) to youngest. This allows scientists to follow the evolution of different groups, by arranging the fossils in a sequence that reveals the changes that have happened in different lines of descent. For example, it may be possible to see that a species known only from fossils that are millions of years old has similarities with many species in existence today. It is hard to prove that this fossil species was the ancestor of present-day species, but it provides evidence for what that ancestral species would have looked like. The fossil evidence is not complete and never will be, because it is unlikely that every species has been fossilised, especially those without hard parts.
Throughout Earth’s history there have been extinction ‘events’ that have nearly wiped out most organisms – there have been seven great extinctions in the history of the Earth. But life has always recovered and many new species have evolved each time. It is thought that humans are responsible for the eighth great extinction event that is happening
Figure 15.19 Fossilised fern, Sphenopteris laurenti. This specimen dates from the Middle Coal Measures of the Carboniferous period about 300 million years ago. The frond is 90 millimetres in length.
Figure 15.20 Trilobites – animals that are only known about from fossils. They thrived for 300 million years but became extinct about 240 million years ago.
22
Ch
apte
r 15
Evo
luti
on
now. Scientists have estimated that over 99% of the species that have lived on Earth are now extinct.
Studying fossils provides evidence for the gradual change from simple life forms (Archaea and Bacteria) to more complex life forms (Eukarya) and the changes that have occurred within different groups. However, not all change is ‘simple’ to ‘complex’, as some species have lost structures over time. You can see an example of this if you compare parasitic worms with their free-living relatives. Structures such as sensory organs are redundant when living inside a host animal, so worms with reduced sense organs were the ones to survive as successful parasites.
Biologists in the nineteenth and early twentieth centuries compared the morphology and anatomy of species in order to show their evolutionary relationships. For example, the bones in the front limbs of all tetrapods (amphibians, reptiles, birds and mammals) have basically the same pattern even though there are differences between them. This indicates that these animals had a common origin. However, over the past 60 years or so a much wider range of techniques has become available to take this study of similarities and differences among organisms much further.
Evidence from biochemistry The biochemistry that you have studied (see Chapters 2 and 3) provides some evidence that all life has a common origin. Here are some pieces of evidence:
l The atoms in amino acids can be arranged to give two molecules that are mirror images of each other – so-called left-handed and right-handed molecules. All amino acids are left-handed; no right-handed amino acids exist in nature.
l There are many possible different types of amino acids, but only 20 are used to make proteins – they are the same 20 in all organisms.
l The molecule of inheritance in all cellular organisms (prokaryotes and eukaryotes) is DNA.
l The genetic code that specifies an organism’s amino acids is basically the same in all organisms.
l ATP is the universal currency for energy in the cells of all organisms.
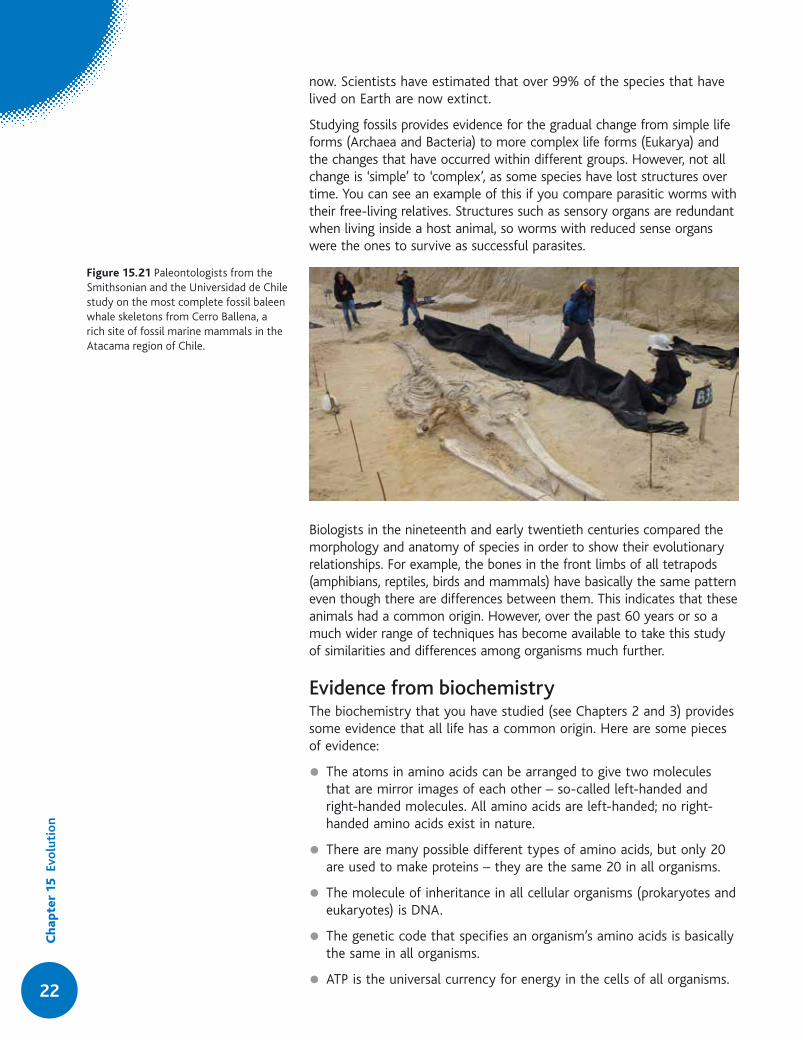
Figure 15.21 Paleontologists from the Smithsonian and the Universidad de Chile study on the most complete fossil baleen whale skeletons from Cerro Ballena, a rich site of fossil marine mammals in the Atacama region of Chile.
23
Natural selection in action
Analysis of the amino acid sequences of proteins reveals that proteins from closely related organisms are very similar. The active site of an enzyme like catalase tends to be identical whatever organism it comes from, as no other arrangement of amino acids gives the right 3D shape to fit the specific substrate. But there are unlikely to be such constraints on other parts of the molecule, and looking at enzymes from different organisms reveals differences, which become greater the less related they are (see Chapter 13).
Some enzymes perform very basic functions found throughout all life forms, such as DNA polymerase, the enzyme that repairs and copies DNA. As expected, DNA polymerase has only relatively small differences in its amino acid sequence between phyla and even between kingdoms. Significant changes in this enzyme reflect significant events in the evolutionary history of organisms.
The primary structure of proteins is determined by the sequence of bases in DNA. Data obtained from sequencing the nucleotides in DNA shows the relationship between different species. Nucleotide sequences in the genes of closely related species are found to be very similar. Similarities and differences can be used to group species, and then deciding the extent of the differences gives an idea of when speciation occurred, as described in more detail in Chapter 13.
Natural selection in actionEvolution is sometimes assumed to happen very slowly, partly because of the huge periods of time over which it has happened throughout history. However, it can actually happen relatively quickly. We have already seen one example of the evolution of a new species, Spartina anglica. The development of drug resistance in bacteria and insecticide resistance in insect pests are examples of rapid change in populations brought about by natural selection.
Drug resistanceAs we have seen in Chapter 11, antibiotics are the main group of drugs used by doctors and vets to treat bacterial diseases. Antibiotics became widespread in the late 1940s. They proved hugely successful in treating diseases such as TB. However, soon after their introduction, some antibiotics became less effective as bacteria developed antibiotic resistance. This happened because a few bacteria naturally possessed genes that helped prevent the effect of the antibiotic. For example, penicillin is effective because it prevents the growth of cell walls in some bacteria. Resistant bacteria have enzymes that can break down penicillin. When antibiotics are used, any resistant bacteria are clearly at an advantage, as they are adapted to the new conditions. The bacteria that are susceptible to the antibiotic die and the resistant bacteria survive and reproduce to pass on their genes to future generations.
There are two ways in which a bacterium gains resistance to an antibiotic:
l a gene on the chromosome may spontaneously mutate to give a form that codes for a polypeptide that is not affected by the antibiotic
l the bacterium may gain a plasmid with a gene for resistance from another bacterium.
Tip
In any discussion of evolution, whether it is the effect of natural selection on a species as described in this section, or whether it is bigger changes such as speciation, remember that variation, competition, adaptation and selection are the major themes to write about.

24
Ch
apte
r 15
Evo
luti
on
Antibiotic resistance works in a number of ways. Genes may code for enzymes that break down the antibiotic, as mentioned earlier – penicillinase is an enzyme that breaks down the antibiotic penicillin. Other resistance genes code for membrane proteins that pump out any antibiotic molecules that enter the cell. Many antibiotics work by inhibiting the action of enzymes and other proteins involved in replication, transcription and translation. Mutations may change the structure of these proteins so that there is nowhere for antibiotics to bind, protecting the bacteria from the effect of the antibiotic.
Bacteria have only one copy of each gene since they only have a single loop of double-stranded DNA. They are essentially haploid. This means that a mutant gene for antibiotic resistance will have an immediate effect on any bacterium possessing it. These individuals have a tremendous selective advantage in an environment that contains an antibiotic. Bacteria without this mutant gene will be killed, while those resistant to the antibiotic survive and reproduce. Bacteria reproduce asexually by binary fission; the DNA in the bacterial chromosome is replicated and the cell divides into two, with each daughter cell receiving a copy of the chromosome. This happens very rapidly in ideal conditions, and even if there was initially only one resistant bacterium, it might produce 10 000 million descendants within 24 hours.
When someone takes an antibiotic to treat a bacterial infection, bacteria that are susceptible to that antibiotic will die. In most cases, if the dose is followed correctly, eventually the entire population of the disease-causing bacteria will be killed. However, if the dose is not followed, perhaps because people stop taking the antibiotic when they start to feel better, then some less susceptible bacteria survive. The next time there is an infection of this strain of bacteria, the antibiotic may not be effective.
The consequences of antibiotic resistance are serious and of great concern to medical authorities. It appears that we are running out of options as far as using antibiotics to treat disease is concerned. Antibiotics must not be overused if we are to avoid resistance. Some are kept to be used as a ‘last resort’ when all others have failed. But despite this, there are now strains of bacteria that are untreatable using antibiotics.
There are various steps that can be taken to reduce cases of antibiotic resistance:
l only prescribe antibiotics when absolutely necessary and do not prescribe them for non-bacterial diseases or ‘just in case’
l ensure people finish their course of antibiotics
l rotate antibiotics so that one type is not used continuously in the treatment of specific diseases
l keep some antibiotics to use as a ‘last resort’
l invest in research to find new antibiotics.
The future for antibiotics looks grim. No new class of antibiotic has been discovered since the 1980s. Bacteria such as Mycobacterium are becoming resistant to many antibiotics and other drugs. Medical experts have warned that there may soon be no antibiotics available to treat some diseases.
25
Natural selection in action
Pesticide resistance in insectsPesticides are chemicals that kill any sort of pest, pathogenic organism or weed. We use them to control insects – both pests of crops and vectors of disease (for example, Anopheles that transmits malaria and tse-tse flies that transmit sleeping sickness).
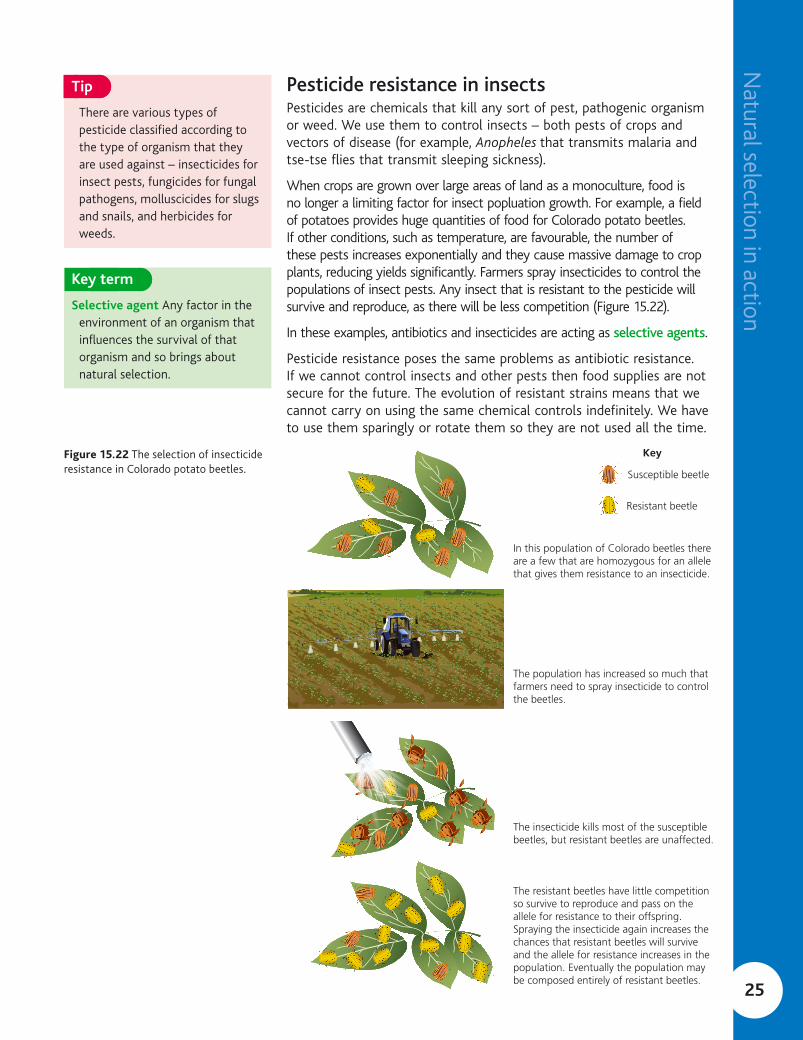
When crops are grown over large areas of land as a monoculture, food is no longer a limiting factor for insect popluation growth. For example, a field of potatoes provides huge quantities of food for Colorado potato beetles. If other conditions, such as temperature, are favourable, the number of these pests increases exponentially and they cause massive damage to crop plants, reducing yields significantly. Farmers spray insecticides to control the populations of insect pests. Any insect that is resistant to the pesticide will survive and reproduce, as there will be less competition (Figure 15.22).
In these examples, antibiotics and insecticides are acting as selective agents.
Pesticide resistance poses the same problems as antibiotic resistance. If we cannot control insects and other pests then food supplies are not secure for the future. The evolution of resistant strains means that we cannot carry on using the same chemical controls indefinitely. We have to use them sparingly or rotate them so they are not used all the time.
In this population of Colorado beetles thereare a few that are homozygous for an allelethat gives them resistance to an insecticide.
The population has increased so much thatfarmers need to spray insecticide to controlthe beetles.
The insecticide kills most of the susceptiblebeetles, but resistant beetles are unaffected.
The resistant beetles have little competitionso survive to reproduce and pass on theallele for resistance to their offspring.Spraying the insecticide again increases thechances that resistant beetles will survive and the allele for resistance increases in thepopulation. Eventually the population may be composed entirely of resistant beetles.
Susceptible beetle
Key
Resistant beetle
Figure 15.22 The selection of insecticide resistance in Colorado potato beetles.
Tip
There are various types of pesticide classified according to the type of organism that they are used against – insecticides for insect pests, fungicides for fungal pathogens, molluscicides for slugs and snails, and herbicides for weeds.
Key term
Selective agent Any factor in the environment of an organism that influences the survival of that organism and so brings about natural selection.
26
Ch
apte
r 15
Evo
luti
on
Pesticide manufacturers may advise that no more than a specified number of applications of a pesticide are used. After that the farmer or grower should switch to another type of pesticide for a while. This is intended to extend the useful life of pesticides. Two or more pesticides that kill insects in different ways may be mixed together before spraying. Using a combination of pesticides delays the time it takes for resistance to emerge and spread. Farmers are also encouraged not to apply insecticides as an insurance policy to prevent any likely invasion by pests. Instead they are advised to apply insecticides only when they know their crops are at risk.
Farmers can use other forms of pest control, such as biological control. This involves releasing or encouraging natural parasites and/or predators of the pest species. Plant breeders also continue to use selective breeding to develop new varieties of crop plants that are resistant to pests. Genetically modifying crops to make toxins that kill the pests that eat them is another strategy that is increasingly being used. Integrated pest management uses these strategies together with the limited use of pesticides as and when absolutely needed.
Example
Insecticide resistance 1 Define the term variation.2 The Colorado potato beetle, Leptinotarsa decemlineata, is a serious insect
pest of potato plants. This pest species was controlled by the insecticide DDT until the 1950s, when it gained resistance that became widespread. Since then, many types of insecticide have been used to control it but the beetle is now resistant to all of them. Some populations of beetle may not be resistant to all types of insecticide, but within the species as a whole there is resistance to all insecticides.a) Spraying with an insecticide rarely kills all the pests in a field of
potatoes. Apart from resistance, suggest why this is the case.b) Explain how resistance to an insecticide arises and spreads in Colorado
potato beetles.
Answers1 Variation is the differences between species (interspecific variation)
and the differences between individuals within a species (intraspecific variation).
2 a) Insecticides are sprayed from above so that any beetles on the underside of the leaf may not be affected. Insecticide may land on some beetles, but maybe not enough to kill them.
b) A gene mutates spontaneously to give an allele that enables a beetle to resist the insecticide. Most mutant alleles are recessive. This mutant allele may pass on for several generations before it is expressed in a beetle. If this beetle is part of a population that is sprayed with insecticide, it will not be affected and will survive. All beetles that are not homozygous recessive are susceptible and die. The resistant beetles now have much less competition for resources, especially food. They are more likely to survive to reproduce. If a resistant beetle mates with another resistant beetle (as is likely after the insecticide has been sprayed) then the next generation will all be resistant. This increases the proportion of resistant beetles in the population, making it harder to control them with the same insecticide. Natural selection has occurred. The insecticide is the selective agent.
Test yourself
24 Criticise this statement: ‘Using pesticides causes pesticide resistance in insects’.
25 Explain why antibiotic resistance and pesticide resistance are not examples of artificial selection.
26 Why is it difficult to give a satisfactory definition of the term species?

27
Exam practice questions 1 Which of the following statements is part of Darwin’s theory of natural selection?
A Asexual reproduction generates very little variation.
B Interspecific variation is used to classify organisms.
C Poorly adapted individual organisms never leave offspring.
D There is competition between individuals of the same species. (1)
2 There are many breeding pairs of birds in an area of woodland. Which of the following is not a selective agent for this population?
A the availability of nesting sites
B the number of eggs laid each breeding season
C the population of sparrowhawks that are predators of small birds
D the quantity of food available in the wood (1)
3 The smallest biological unit that evolves over time is
A a genus
B an individual organism
C a population
D a species (1)
4 Individual organisms within a population that reproduces sexually show genetic variation. The main cause of this type of variation is
A environmental change
B meiosis
C mutation
D natural selection (1)
5 Natural selection acts on
A a species
B genes and their alleles
C the genotype of an individual organism
D the phenotype of an individual organism (1)
6 Cormorants are sea birds that dive for food (see Figure 15.3). A scientist in Canada investigated the diets of two closely related species, the great cormorant and the double-crested cormorant, in waters around Nova Scotia where the two birds live in the same area. The birds catch fish and regurgitate pellets containing any hard pieces of their prey such as bone that they cannot digest. The scientist collected pellets from places where the birds roosted over several months in the summer of one year. Table 1 (on the next page) shows the different species of fish present in the pellets.
Exam practice questions

28
Ch
apte
r 15
Evo
luti
on
Table 1
Habitat of fish Prey species Numbers and percentages of fish found in pellets
Phalacrocorax carbo Phalacrocorax auritus
Numbers Percentage Numbers Percentage
open water fish Pollock 155 24.0 228 30.7
bottom- dwelling fish
cunner 269 41.7 109 14.7
cod 36 5.6 30 4.0
long-horned sculpin
40 6.2 9 1.2
short-horned sculpin
66 10.2 131 17.6
flat fish flounder 73 11.3 47 6.3
plaice 6 0.9 0 0
eel-like fish wrymouth 0 0 176 23.7
rock gunnel 0 0 13 1.7
Total 645 100 743 100
The scientist also made other observations of the birds. The observations are summarised in Table 2.
Table 2
Observations Phalacrocorax carbo Phalacrocorax auritus
Feeding areas Sea water Sea water and freshwater
Total number of fish species caught 11 16
Mean diving time/s 51.0 25.1
Mean resting time/s 13.9 10.3
Mean foraging depth/m 10.7 4.7
Range of foraging depths/m 4.6–19.8 1.5–7.9
a) i) Explain why the percentages of fish present in the pellets were calculated. (2)
ii) Suggest why the researcher collected data from regurgitated pellets. (3)
b) Suggest two limitations of the study as described above. (2)
c) Suggest three adaptations that cormorants have for catching fish. (3)
d) Use the information in Tables 1 and 2 to explain how these two very similar species coexist in the same ecosystem. (5)
7 Charles Darwin proposed the theory of natural selection as the way in which organisms evolved. He made four observations:
A Organisms have the ability to produce large numbers of offspring.
B Populations of organisms fluctuate but tend to remain fairly stable over time.
C There is variation within species.
D Offspring generally appear to be similar to their parents.
Explain the consequences of these four observations made by Darwin when proposing his theory of natural selection. You may identify the observations by the letters A to D above. (8)
29
Exam practice questions
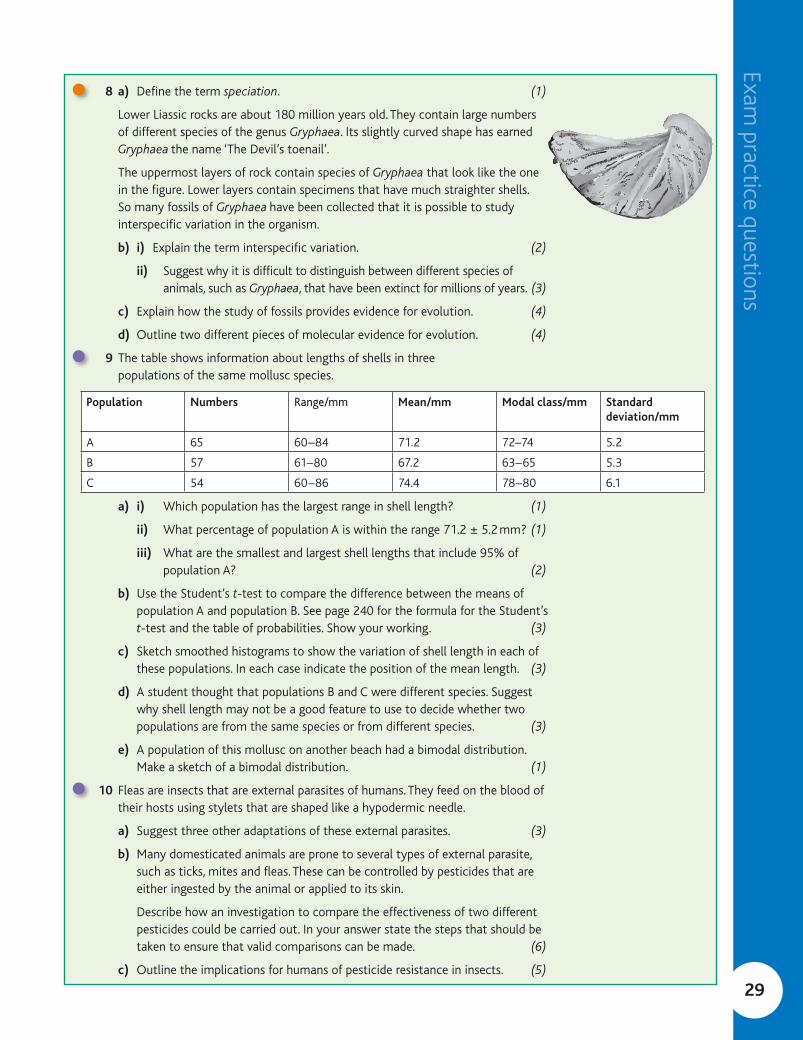
8 a) Define the term speciation. (1)
Lower Liassic rocks are about 180 million years old. They contain large numbers of different species of the genus Gryphaea. Its slightly curved shape has earned Gryphaea the name ‘The Devil’s toenail’.
The uppermost layers of rock contain species of Gryphaea that look like the one in the figure. Lower layers contain specimens that have much straighter shells. So many fossils of Gryphaea have been collected that it is possible to study interspecific variation in the organism.
b) i) Explain the term interspecific variation. (2)
ii) Suggest why it is difficult to distinguish between different species of animals, such as Gryphaea, that have been extinct for millions of years. (3)
c) Explain how the study of fossils provides evidence for evolution. (4)
d) Outline two different pieces of molecular evidence for evolution. (4)
9 The table shows information about lengths of shells in three populations of the same mollusc species.
Population Numbers Range/mm Mean/mm Modal class/mm Standard deviation/mm
A 65 60–84 71.2 72–74 5.2
B 57 61–80 67.2 63–65 5.3
C 54 60–86 74.4 78–80 6.1
a) i) Which population has the largest range in shell length? (1)
ii) What percentage of population A is within the range 71.2 ± 5.2 mm? (1)
iii) What are the smallest and largest shell lengths that include 95% of population A? (2)
b) Use the Student’s t-test to compare the difference between the means of population A and population B. See page 240 for the formula for the Student’s t-test and the table of probabilities. Show your working. (3)
c) Sketch smoothed histograms to show the variation of shell length in each of these populations. In each case indicate the position of the mean length. (3)
d) A student thought that populations B and C were different species. Suggest why shell length may not be a good feature to use to decide whether two populations are from the same species or from different species. (3)
e) A population of this mollusc on another beach had a bimodal distribution. Make a sketch of a bimodal distribution. (1)
10 Fleas are insects that are external parasites of humans. They feed on the blood of their hosts using stylets that are shaped like a hypodermic needle.
a) Suggest three other adaptations of these external parasites. (3)
b) Many domesticated animals are prone to several types of external parasite, such as ticks, mites and fleas. These can be controlled by pesticides that are either ingested by the animal or applied to its skin.
Describe how an investigation to compare the effectiveness of two different pesticides could be carried out. In your answer state the steps that should be taken to ensure that valid comparisons can be made. (6)
c) Outline the implications for humans of pesticide resistance in insects. (5)
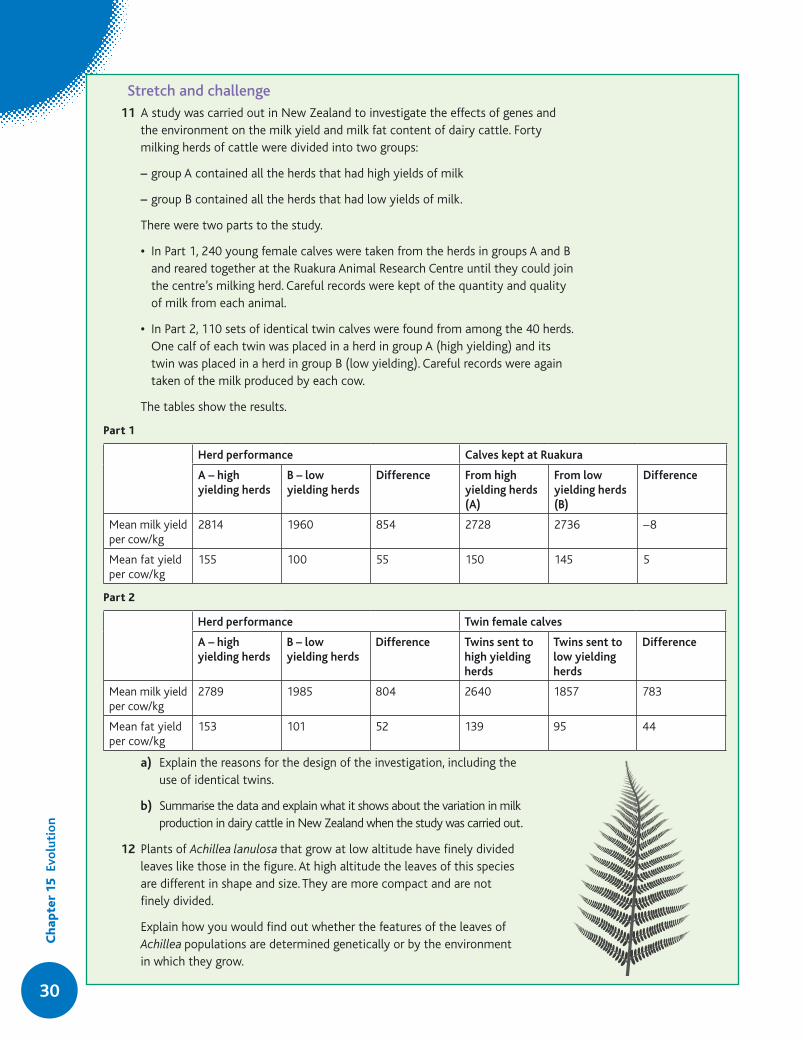
30
Ch
apte
r 15
Evo
luti
on
Stretch and challenge 11 A study was carried out in New Zealand to investigate the effects of genes and
the environment on the milk yield and milk fat content of dairy cattle. Forty milking herds of cattle were divided into two groups:
– group A contained all the herds that had high yields of milk
– group B contained all the herds that had low yields of milk.
There were two parts to the study.
• In Part 1, 240 young female calves were taken from the herds in groups A and B and reared together at the Ruakura Animal Research Centre until they could join the centre’s milking herd. Careful records were kept of the quantity and quality of milk from each animal.
• In Part 2, 110 sets of identical twin calves were found from among the 40 herds. One calf of each twin was placed in a herd in group A (high yielding) and its twin was placed in a herd in group B (low yielding). Careful records were again taken of the milk produced by each cow.
The tables show the results.
Part 1
Herd performance Calves kept at Ruakura
A – high yielding herds
B – low yielding herds
Difference From high yielding herds (A)
From low yielding herds (B)
Difference
Mean milk yield per cow/kg
2814 1960 854 2728 2736 –8
Mean fat yield per cow/kg
155 100 55 150 145 5
Part 2
Herd performance Twin female calves
A – high yielding herds
B – low yielding herds
Difference Twins sent to high yielding herds
Twins sent to low yielding herds
Difference
Mean milk yield per cow/kg
2789 1985 804 2640 1857 783
Mean fat yield per cow/kg
153 101 52 139 95 44
a) Explain the reasons for the design of the investigation, including the use of identical twins.
b) Summarise the data and explain what it shows about the variation in milk production in dairy cattle in New Zealand when the study was carried out.
12 Plants of Achillea lanulosa that grow at low altitude have finely divided leaves like those in the figure. At high altitude the leaves of this species are different in shape and size. They are more compact and are not finely divided.
Explain how you would find out whether the features of the leaves of Achillea populations are determined genetically or by the environment in which they grow.
Although every effort has been made to ensure that website addresses are correct at time of going to press, Hodder Education cannot be held responsible for the content of any website mentioned in this book. It is sometimes possible to find a relocated web page by typing in the address of the home page for a website in the URL window of your browser.
Hachette UK’s policy is to use papers that are natural, renewable and recyclable products and made from wood grown in sustainable forests. The logging and manufacturing processes are expected to conform to the environmental regulations of the country of origin.
Orders: please contact Bookpoint Ltd, 130 Milton Park, Abingdon, Oxon OX14 4SB. Telephone: +44 (0)1235 827720. Fax: +44 (0)1235 400454. Lines are open 9.00a.m.–5.00p.m., Monday to Saturday, with a 24-hour message answering service. Visit our website at www.hoddereducation.co.uk
© Jenny Wakefield-Warren, Adrian Schmit, Richard Fosbery 2015
First published in 2015 by Hodder Education,An Hachette UK Company 338 Euston RoadLondon NW1 3BH
Impression number 10 9 8 7 6 5 4 3 2 1
Year 2019 2018 2017 2016 2015
All rights reserved. Apart from any use permitted under UK copyright law, no part of this publication may be reproduced or transmitted in any form or by any means, electronic or mechanical, including photocopying and recording, or held within any information storage and retrieval system, without permission in writing from the publisher or under licence from the Copyright Licensing Agency Limited. Further details of such licences (for reprographic reproduction) may be obtained from the Copyright Licensing Agency Limited, Saffron House, 6–10 Kirby Street, London EC1N 8TS.
Cover photo © maw89 – Fotolia
Typeset in 11/13 pt Bliss Light
ISBN 9781471809156
Photo Creditsp.4 © gekaskr – Fotolia; p.5 t © Lebrecht Music and Arts Photo Library / Alamy, b © Natural History Museum, London/Science Photo Library; p.6 l © Erni – Fotolia, r © Colette – Fotolia; p.7 t © Nancy Sefton/Science Photo Library, b © Alexander Semenov/Science Photo Library; p.8 t © Donna Smith – Fotolia, b © Eye Of Science/Science Photo Library; p.12 © Paul Kay/Getty Images; p.14 t © Oak Ridge National Laboratory/US Department Of Energy/Science Photo Library, b © Tamara Kulikova – Fotolia; p.15 t © Hagit Berkovich – Fotolia, b © Dr. Terry Beveridge/Visuals Unlimited, Inc./Science Photo Library; p.21 t © Natural History Museum, London/Science Photo Library, b © gekaskr – Fotolia; p.22 © James F. Parham. Courtesy Smithsonian Institute.
32
OCR A LEVEL Biology
This sample chapter is taken from OCR A Level Biology Year 1 Student Book.
Encourage students to learn independently and build on their knowledge with this textbook that leads students seamlessly from basic biology to more complicated concepts. lBuilds experimental, analytical and evaluation skills with
activities that introduce the practicals required by OCR lPrepares students for their exams with Test Yourself Questions
throughout the book and revision tips and skills all in one chapter
lBuilds mathematical skills with guidance throughout and a dedicated ‘Maths in Biology’ chapter
lDevelops understanding with free online access to Test yourself Answers, an Extended Glossary, Learning Outcomes and Topic Summaries
ALSO AVAILABLE Dynamic Learning
OCR A Level Science Dynamic Learning Dynamic Learning is an online subscription solution that supports teachers and students with high quality content and unique tools. Dynamic Learning incorporates Teaching and Learning resources, Whiteboard and Student eTextbook elements that all work together to give you the ultimate classroom and homework resource.
Sign up for a free trial – visit: www.hoddereducation.co.uk/dynamiclearning
First teaching from September
2015
Textbook subject to change based on Ofqual feedback