An FTIR Investigation of Flanking Sequence Effects on the Structure and Flexibility of DNA Binding...
17
An FTIR Investigation of Flanking Sequence Effects on the Structure and Flexibility of DNA Binding Sites Talia R. Kahn 1,2 , Kimberly K. Fong 1 , Brian Jordan 1 , Janista C. Lek 1 , Rachel Levitan 1,3 , Patrick S. Mitchell 1,4 , Corrina Wood 1,5 , and Mary E. Hatcher 1,* 1Joint Science Department, Claremont McKenna, Pitzer and Scripps Colleges, Claremont, CA Abstract Fourier transform infrared (FTIR) spectroscopy and a library of FTIR marker bands have been used to examine the structure and relative flexibilities conferred by different flanking sequences on the EcoRI binding site. This approach allowed us to examine unique peaks and subtle changes in the spectra of d( AAAGAATTC TTT) 2 , d( TTCGAATTC GAA) 2 , and d( CGCGAATTC GCG) 2 , and thereby identify local changes in base-pairing, base-stacking, backbone conformation, glycosidic bond rotation and sugar puckering in the studied sequences. The changes in flanking sequences induce differences in the sugar puckers, glycosidic bond rotation and backbone conformations. Varying levels of local flexibility are observed within the sequences in agreement with previous biological activity assays. The results also provide supporting evidence for the presence of a splay in the G 4 -C 9 base pair of the EcoRI binding site and a potential pocket of flexibility at the G 4 cleavage site that have been proposed in the literature. In sum, we have demonstrated that FTIR is a powerful methodology for studying the effect of flanking sequences on DNA structure and flexibility, for it can provide information about the local structure of the nucleic acid and the overall relative flexibilities conferred by different flanking sequences. Keywords FTIR; DNA; backbone conformations; flexibility; indirect readout During both replication and transcription, amino acids of the protein factor involved recognize and interact electrostatically with the base pairs of the specific DNA sequence containing the recognition site (direct readout) with remarkable specificity. Upon binding of a protein in this region, a bending of the DNA occurs which enhances the stability of the complex by increasing the number of favorable contacts made between the DNA and the protein 1; 2 . The four classifications of these interactions are: (i) van der Waals interactions between aliphatic amino acids and the C5-methyl groups of thymines or the C5-hydrogen groups of cytosines, (ii) hydrogen bonds between the nucleic acids and the amide and carbonyl groups of the peptide backbone, (iii) hydrogen bonding bridges constructed with water molecules between amino acids and base-pairs 3; 4; 5 , and (iv) interlacing of amino acid side-chains between two bases 6 . Although these are the major interactions, direct contacts at the recognition site alone do not account for the conformation of the DNA-protein complex; base pairs on either side of the *Author to whom correspondence should be addressed: Mary E. Hatcher-Skeers, Ph.D. Joint Science Department The Claremont Colleges Claremont, CA 91711 Phone: (909) 607-1586 Fax: (909) 621-8588 E-mail: [email protected]. 2 Current address, University of Washington School of Medicine, Seattle, WA 3 Current address, Tulane University School of Medicine, New Orleans, LA 4 Current address, Fred Hutchinson Cancer Research Center, Seattle, WA 5 Current address, New York University School of Medicine, New York, NY NIH Public Access Author Manuscript Biochemistry. Author manuscript; available in PMC 2010 February 17. Published in final edited form as: Biochemistry. 2009 February 17; 48(6): 1315–1321. doi:10.1021/bi8015235. NIH-PA Author Manuscript NIH-PA Author Manuscript NIH-PA Author Manuscript
-
Upload
independent -
Category
Documents
-
view
3 -
download
0
Transcript of An FTIR Investigation of Flanking Sequence Effects on the Structure and Flexibility of DNA Binding...

An FTIR Investigation of Flanking Sequence Effects on theStructure and Flexibility of DNA Binding Sites
Talia R. Kahn1,2, Kimberly K. Fong1, Brian Jordan1, Janista C. Lek1, Rachel Levitan1,3,Patrick S. Mitchell1,4, Corrina Wood1,5, and Mary E. Hatcher1,*1Joint Science Department, Claremont McKenna, Pitzer and Scripps Colleges, Claremont, CA
AbstractFourier transform infrared (FTIR) spectroscopy and a library of FTIR marker bands have been usedto examine the structure and relative flexibilities conferred by different flanking sequences on theEcoRI binding site. This approach allowed us to examine unique peaks and subtle changes in thespectra of d(AAAGAATTCTTT)2, d(TTCGAATTCGAA)2, and d(CGCGAATTCGCG)2, andthereby identify local changes in base-pairing, base-stacking, backbone conformation, glycosidicbond rotation and sugar puckering in the studied sequences. The changes in flanking sequencesinduce differences in the sugar puckers, glycosidic bond rotation and backbone conformations.Varying levels of local flexibility are observed within the sequences in agreement with previousbiological activity assays. The results also provide supporting evidence for the presence of a splayin the G4-C9 base pair of the EcoRI binding site and a potential pocket of flexibility at the G4 cleavagesite that have been proposed in the literature. In sum, we have demonstrated that FTIR is a powerfulmethodology for studying the effect of flanking sequences on DNA structure and flexibility, for itcan provide information about the local structure of the nucleic acid and the overall relativeflexibilities conferred by different flanking sequences.
KeywordsFTIR; DNA; backbone conformations; flexibility; indirect readout
During both replication and transcription, amino acids of the protein factor involved recognizeand interact electrostatically with the base pairs of the specific DNA sequence containing therecognition site (direct readout) with remarkable specificity. Upon binding of a protein in thisregion, a bending of the DNA occurs which enhances the stability of the complex by increasingthe number of favorable contacts made between the DNA and the protein 1; 2. The fourclassifications of these interactions are: (i) van der Waals interactions between aliphatic aminoacids and the C5-methyl groups of thymines or the C5-hydrogen groups of cytosines, (ii)hydrogen bonds between the nucleic acids and the amide and carbonyl groups of the peptidebackbone, (iii) hydrogen bonding bridges constructed with water molecules between aminoacids and base-pairs 3; 4; 5, and (iv) interlacing of amino acid side-chains between two bases6. Although these are the major interactions, direct contacts at the recognition site alone do notaccount for the conformation of the DNA-protein complex; base pairs on either side of the
*Author to whom correspondence should be addressed: Mary E. Hatcher-Skeers, Ph.D. Joint Science Department The Claremont CollegesClaremont, CA 91711 Phone: (909) 607-1586 Fax: (909) 621-8588 E-mail: [email protected] address, University of Washington School of Medicine, Seattle, WA3Current address, Tulane University School of Medicine, New Orleans, LA4Current address, Fred Hutchinson Cancer Research Center, Seattle, WA5Current address, New York University School of Medicine, New York, NY
NIH Public AccessAuthor ManuscriptBiochemistry. Author manuscript; available in PMC 2010 February 17.
Published in final edited form as:Biochemistry. 2009 February 17; 48(6): 1315–1321. doi:10.1021/bi8015235.
NIH
-PA Author Manuscript
NIH
-PA Author Manuscript
NIH
-PA Author Manuscript

recognition site, referred to as flanking sequences, are also thought to play a role in theconformation of the DNA-protein complex (indirect readout) 1; 7; 8.
In most cases, it is necessary for the protein to distort the DNA in order to achieve the transitionstate. To compensate for the energetic costs of deformation, the DNA-protein complex maymake any modification that improves the binding free energy such as releasing water fromnon-polar surfaces and/or increasing the number of direct contacts made between the DNAand protein 9. DNA that requires less deformation to reach the conformation of the transitionstate will have a lower free energy of association 10. Similarly, sequences that have aninherently greater distortability will also have a lower binding free energy. Studies examiningthe effect of flanking sequences on DNA-protein binding have indicated that flankingsequences are involved in dynamics and confer flexibility or rigidity to a sequence 1; 7; 8;11; 12; 13; 14. Since flexible DNA has a greater distortability, it is able to compensate moreeffectively and thereby more efficiently recognize and bind proteins and drugs than a similar,but more rigid DNA sequence 15; 16.
Various methods have been commonly used to examine the effect of flanking sequences onDNA including conformational free energy calculations 8, 1H-NMR and 31P-NMR 11; 17;18, crystal structures 3,Shui, 1998 #36, restriction enzyme digests 12; 13; 19, molecular dynamicssimulations 20, UV melting 14; 19, sequence dependent anisotropic bend-ability (SDAB) 21,and CD 14; 19; 22. These techniques have revealed valuable information about the features inDNA that change when flanking sequences are modified including changes in the unwindingand overwinding of the double helix, formation of hydrogen bonds, twist and glycosidic angles,helical parameters, flexibility, and restriction endonuclease cutting rates 3; 11; 12; 20.Although these methods are highly advanced, there is some disparity with regards to whichsequences are most flexible and most rigid 11; 12; 21.
In principle, Fourier transform infrared (FTIR) spectroscopy can detect local conformationalchanges with high sensitivity 16; 23; 24. For example, FTIR has been used to study DNAstructural changes caused by CpG methylation 16 and the structural effects of G-tract length22. Since this technique is non-destructive and provides a “snapshot” of the nucleic acid'sstructure, we have chosen to apply FTIR along with a library of IR bands compiled by Banyayet al. 23 to interpret major features and changes in nucleic acid structure, conformations andconformational sub-states as a result of different flanking sequences.
MATERIALS AND METHODSSample Preparation
The DNA dodecamers studied were obtained from Alpha-DNA (Quebec, Canada). Sampleswere desalted by centrifugation in Y300 Centricons (Millipore). After desalting, samples werelyophilized overnight and stored at 4°C until analysis.
Fourier Transform Infrared (FTIR) ExperimentsSamples for FTIR analysis were prepared by diluting to a final concentration of 3.0 mM in 100mM sodium phosphate buffer (pH 7.4). Freshly made samples were used for all FTIRmeasurements. FTIR spectra were recorded at room temperature on a ZnSe crystal using aThermo Nicolet Avatar 370 ATR-FTIR spectrometer (Thermo Scientific, Massachusetts). Abackground (atmospheric plus pure buffer) was collected after which DNA samples were run.For each DNA sample, FTIR spectra were taken in triplicate to ensure reproducibility.Experiments were run with a resolution of 4 cm-1 and 512 scans. Using EZ-OMNIC software(Thermo Scientific), all DNA spectra underwent baseline correction and 15 point smoothingbefore peaks were assigned. Derivative spectra were 25 point smoothed. Final spectra were
Kahn et al. Page 2
Biochemistry. Author manuscript; available in PMC 2010 February 17.
NIH
-PA Author Manuscript
NIH
-PA Author Manuscript
NIH
-PA Author Manuscript

normalized with respect to the symmetric PO2- stretching mode appearing at 1090-1080
cm-1 25; 26. Spectral assignments were made using the Banyay et al library23. This libraryprovides wavenumber ranges of ~5-10 cm-1 for many assignments so differences less than 10cm-1 may not be significant.
31P NMR experimentsDNA samples were obtained from Alpha DNA (Montreal, Canada). These were salted with100 mM phosphate buffer at pH = 7.4 then lyophilized. The samples were re-hydrated in 98%D2O, re-lyophilized and finally dissolved in 99.9% D2O, immediately before use.
2D 1H nuclear Overhauser effect (NOESY) experiments were performed with mixing timesof 500 ms and a gradient pulse applied during the mixing time. 4096 data points were collectedin the t2 dimension and 512 increments in t1. The matrix was zero-filled to 4096 × 1024 pointsbefore double Fourier transformation. Phase sensitive 31P-1H HSQC were recorded usingEcho/Antiecho-TPPI gradient selection27; 28; 29 and decoupling during acquisition. AllHSQC were performed with 2048 points in the t2 dimension and 256 t1 increments using arelaxation delay of 4 s. The chemical shift of H2O and the center of the DNA phosphorusresonances were set as the center of HSQC and NOESY spectra. A spectral width of 9 ppmwas used for all 1D experiments and in both dimensions of the 2D experiments.
Since H2' and H2" are strongly coupled with H1', H3', H5' (sugar protons) and to the baseprotons, enabling the assignment of protons on the NOESY using a sequential walk30. Thestrong correlations between 31P and H3' and H5'/H4' then enabled us to assign the HSQC usingthe proton assignments determined from the NOESY.
%BII was determined as a function of the 31P chemical shift using a linear relationship betweenthe observed fast-exchange chemical shift and the %BII conformation 31:
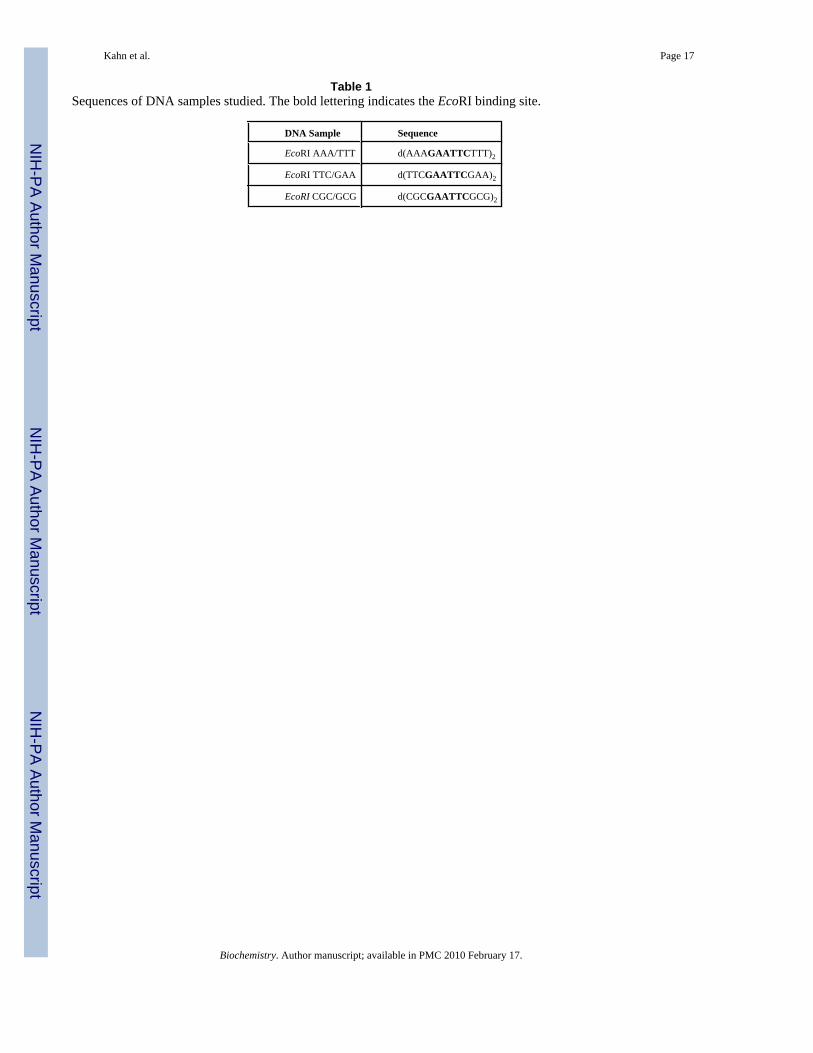
RESULTSWe studied DNA sequences containing the EcoRI binding site as this binding site has beenextensively studied by a number of techniques. In particular, we used the well-characterizedDickerson Sequence32 as a control so we can compare our results with the wealth of structuraland dynamical data available in the literature on this sequence. Flanking sequences were chosenbased on previous research on the effect of flanking sequences on DNA structure, dynamicsand protein-DNA interactions.11; 12; 18; 26 Table 1 lists the EcoRI sequences that wereexamined using FTIR. The spectral peaks were assigned using the Banyay Library of DNAinfrared bands 23.
Effect of Flanking Sequences on the Base Region (1800-1500 cm-1)Figure 1 shows the 1800-1500 cm-1 region for EcoRI binding site containing sequences. Thisregion reports on changes in the bases of nucleic acids.23 The vibrations of base-pairedpyrimidines occur between 1670-1630 cm-1. The EcoRI TTC/GAA sequence has a broad rangeof peaks within this region including distinct peaks at 1666 and 1639 cm-1. The peak at 1666cm-1 falls into the range for single stranded guanines (1673-1660 cm-1). EcoRI AAA/TTT hassimilar breadth in this region but differing intensities. EcoRI CGC/GCG has a broad peak witha clear resonance at 1645 cm-1. The strong resonance at 1645 cm-1 is indicative of singlestranded cytosines. The breadth and lack of resolution in this region for the EcoRI CGC/GCGsequence may be the result of the large number of CG base pairs in this sequence. A peak at
Kahn et al. Page 3
Biochemistry. Author manuscript; available in PMC 2010 February 17.
NIH
-PA Author Manuscript
NIH
-PA Author Manuscript
NIH
-PA Author Manuscript

between 1604-1600 cm-1 was present in all samples (although only weakly in EcoRI CGC/GCG) and is also a marker for single stranded guanines. The vibrations of base-paired cytosinesoccur at 1525 cm-1 in EcoRI TTC/GAA and shifts upfield to 1535 cm-1 in EcoRI AAA/TTT.There is a low intensity, broad resonance in this region for EcoRI CGC, again likely due to theincreased number of CG pairs. An intense peak at 1710 cm-1 is evident EcoRI AAA/TTT andEcoRI TTC/GAA, but only weakly present in EcoRI CGC/GCG. The Banyay Library attributesthis peak to guanines involved in Hoogsteen binding to a third strand, but this is unlikely inthe short DNA sequences at low concentrations studied here. Therefore, these peaks are morelikely the carbonyl stretches of bases in A-form 33.
Effect of Flanking Sequences on the Base-sugar Region (1500-1250 cm-1)The spectrum for the 1500-1250 cm-1 region demonstrating the effect of flanking sequencechanges on the glycosidic bond rotation, the backbone conformation and the sugar puckeringmodes of nucleic acids is illustrated in Figure 2. In EcoRI CGC/GCG, sugar ring vibrations ofpurines occur as a weak, broad peak centered at 1490 cm-1. This becomes two peaks at 1493and 1486 cm-1 in EcoRI TTC/GAA and weakly in EcoRI AAA/TTT. Changes in the positionof this band reflect interactions at N7 sites of purines 23. Similarly, the broad peak due to thevibrations of adenines in A-/B-form conformation at 1458 cm-1 in EcoRI CGC/GCG, splitsinto two distinct peaks at 1465 and 1458 cm-1 in EcoRI AAA/TTT. This peak shifts to 1442cm-1 in EcoRI TTC/GAA. In EcoRI AAA/TTT there is a peak at 1420 cm-1, which correspondsto S-type sugars in B-form helices; this marker is weakly present in EcoRI TTC/GAA andEcoRI CGC/GCG. A broad peak encompassing the Z-form marker at 1434-1440 cm-1 is presentin EcoRI TTC/GAA. Peaks at 1373 and 1365 cm-1 for purines in anti form are present inEcoRI AAA/TTT and a broad resonance encompassing this region is present in EcoRI TTC/GAA. A weak, broad resonance at 1371 cm-1 is present in EcoRI CGC/GCG. This shift suggestsmodified glycosidic torsion angles 16. In EcoRI AAA/TTT and EcoRI TTC/GAA, a markerfor thymines with S-type sugars and a glycosyl torsional angle χ in anti conformation is evidentat 1328 and 1323 cm-1, respectively, but absent in EcoRI CGC/GCG. A marker correspondingto C4NH2 vibrations of a cytosine occurs in all samples between 1297-1287 cm-1. The CN3Hbends of thymines with S-type sugars and anti conformations occurs in EcoRI AAA/TTT at1282 cm-1; however, this marker appears only very weakly in EcoRI TTC/GAA and not at allin EcoRI CGC/GCG.
Effect of Flanking Sequences on the sugar-phosphate Region (1250-1000 cm-1)Figure 3 illustrates marker bands between 1250-1000 cm-1 that identify changes in thebackbone conformation. All EcoRI sequences exhibited a marker at 1216 cm-1, whichcorresponds to B-form DNA. All three samples also demonstrate symmetric PO2- vibrationsthat are insensitive to the B-to-A transition between 1082-1076 cm-1. The shoulder to thissymmetric PO2- peak at 1051 cm-1 is evident in EcoRI AAA/TTT and EcoRI TTC/GAA butis subsumed into a broad resonance in EcoRI CGC/GCG. This vibration is attributed to the COstretch of the backbone and is strongly enhanced in Z-form DNA.25; 26 In EcoRI TTC/GAA,a marker for furanose vibrations in Z-DNA is evident at 1025 cm-1. Finally, all three sequenceshave a weak marker at 1172 cm-1, an A-form marker due to C3' endo/anti puckering.
Effect of Flanking Sequences on the Sugar Region (1000-800 cm-1)The effects of sugar conformation on EcoRI spectra provided in the 1000-800 cm-1 region aredepicted in Figure 4. Careful examination of this region, particularly between 900-800 cm-1,was required because important structural differences often manifested as minor spectralchanges.
To aid in characterizing peaks contributing to the broad resonances observed, second derivativespectra for this region are provided in Figure 5 16. A significant peak at 970 cm-1 correlating
Kahn et al. Page 4
Biochemistry. Author manuscript; available in PMC 2010 February 17.
NIH
-PA Author Manuscript
NIH
-PA Author Manuscript
NIH
-PA Author Manuscript

to the CC stretch of the B-form backbones is present in EcoRI AAA/TTT and EcoRI TTC/GAA. EcoRI CGC/GCG and to a much less intensity, EcoRI AAA/TTT demonstrate aresonance at 993 cm-1. The derivative spectra show that EcoRI AAA/TTT has breadth but allof its intensity is localized about the 970 cm-1 peak. EcoRI TTC/GAA has a peak at 995cm-1 and a broader one at 969 cm-1 with additional resolution.
EcoRI CGC/GCG has a narrow peak at 995 cm-1 and a broad peak at 985 cm-1. This suggestsa large variety of backbone conformations in these samples and some dynamic averagingbetween them. The backbone dynamics of the EcoRI CGC/GCG sequence have beenpreviously studied and demonstrate facile interconversion of the BI and BII states in the C3pG4and C9pG10 steps.31; 34 Figure 6 shows the %BII as a function of backbone step for eachsequence as determined by 31P NMR. This plot demonstrates that the EcoRI AAA/TTTsamples mainly BI backbone conformations across the entire sequence whereas EcoRI TTC/GAA shows steps with dramatic %BII character. This is in agreement with the FTIR datashowing a broad resonance at 970 cm-1 for EcoRI AAA/TTT and resonances at varyingbackbone conformations for EcoRI TTC/GAA. The EcoRI CGC/GCG sequence also showsvariation in backbone conformation, again agreeing with the variety and breadth of backboneresonances apparent in its FTIR spectrum.
The marker for adenine-thymine base pairs in B-form helices occurs in all samples at 928-931cm-1 (Figure 4). In addition, the deoxyribose peak at 898-893 cm-1 is evident in all samplesbut broadest in the EcoRI CGC/GCG sequence. Broad peaks centered between 839-835cm-1, arising from S-type sugar puckers, are evident in three samples. The derivative spectra(Figure 5) show an almost equal population into two S-types markers at 829 and 835 cm-1 aswell as peaks at 815 and 804 cm-1, indicative of N-type sugars in EcoRI CGC/GCG. Again,these results demonstrating varying furanaose structure and the presence of furnanosedynamics are consistent with previous studies of the furanose structure and dynamics in theEcoRI CGC/GCG sequence. 34; 35; 36 The EcoAAA/TTT and EcoRI TTC/GAA sequencesdemonstrate peaks at 846, 836 and 804 cm-1 and an O4' endo sugar puckering marker at 825cm-1.16
DISCUSSIONOur findings demonstrate that one can use FTIR and the library of infrared marker bandscompiled by Banyay et al.23 to determine the structural and dynamical changes conferred bydifferent flanking sequences. This approach allowed us to examine unique peaks and subtlechanges in the spectra of EcoRI binding sites that have been flanked by various tri- nucleotides,and thereby identify local changes in base-pairing, base-stacking, backbone conformation,glycosidic bond rotation and sugar puckering in the studied sequences. We included theanalysis of the well-studied Dickerson dodecamer in this investigation so that structuralfeatures observed via FTIR could be directly compared with previously reported NMR, X-Rayand Molecular Dynamics investigations of this sequence.
Variations in the nucleotide sequence produce different vibrations within both the direct andindirect readout regions. Based on the peak assignments in the 1800-1500 cm-1 region, mostof the nucleotides in the EcoRI sequences are double stranded. However, in all dodecamersstudied peaks between 1673-1660 and 1608-1600 cm-1, corresponding to a single strandedguanine nucleotide, are observed. These peaks are even evident in the EcoRI AAA/TTT samplethat contains only one guanine nucleotide adjacent to the EcoRI restriction endonucleasecutting site (AAAG↑AATTCTTT). This finding supports the presence of a splay in the G4-C9 base pair in the EcoRI cutting site, which was described by Drew et al. and seen in NMRand Molecular Dynamics studies 32; 35; 37 in the crystal structure of the B-form helix. Wealso observed a number of changes in base-stacking that are attributed to the identities and
Kahn et al. Page 5
Biochemistry. Author manuscript; available in PMC 2010 February 17.
NIH
-PA Author Manuscript
NIH
-PA Author Manuscript
NIH
-PA Author Manuscript

positions of the bases in the flanking sequences of these dodecamers. Moreover, they can becredited to vibrations from the flanking sequences affecting the nucleotides within theGAATTC binding site. For example, in EcoRI TTC/GAA, the vibrations of base-pairedcytosines occur at 1525 cm-1 and shift downfield to 1535 cm-1 in EcoRI AAA/TTT, a changethat may be attributed to a decrease in the percentage of cytosines in the dodecamer. This regiondoes show significant variations in the base stacking patterns of samples with different flankingsequences. This variation in base stacking as a function of flanking sequence is in agreementwith the FTIR results of Lindqvist and Graslund.22. It has been previously demonstrated thatchanges in base stacking effects are directly related to backbone conformations.38; 39; 40 Thecurrent FTIR results of the backbone resonance breadth and 31P NMR chemical shift data arethus in keeping with the variety of base stacking resonances we observe.
Changes in the endocyclic torsion angles of the furnaose ring are evident by studying the1000-800 cm-1 region of the FTIR spectra. Our results show that all sequences contain bothN-type and S-type sugars and that the S-type sugars are well resolved into C2' endo and O4'endo peaks. The EcoRI CGC/GCG sequence has broad sugar markers that demonstrate avariety of conformations in the derivative spectrum. Such furanose dynamics have beendirectly observed in the EcoRI CGC/GCG sample using solid state 2H NMR.34 All sequenceshave the B-form backbone marker at 970 cm-1 with the marker in the EcoRI TTC/GAA andEcoRI CGC/GCG sequences being broad and possessing a backbone resonance at 995 cm-1.The derivative spectra shown in Figure 5 demonstrate various backbone states in these samples.We attribute this to the presence of the BI and BII conformational substates of the backbone41; 42, The breadth of the peak in the EcoRI CGC/GCG sequence is in agreement withrecent 31P dynamic NMR results in the EcoRI CGC/GCG sequence that demonstrate facilebackbone dynamics at the C3G4 and C9G10 backbone steps.31
The region between 1250-1000 cm-1 is sensitive to vibrations along the sugar-phosphatebackbone, and these marker bands provide information about the overall conformation of thedouble helix 23. With the vibrations we observed in this region, we have been able to concludethat all EcoRI dodecamers exist predominantly in the B-form conformation as they exhibitpeaks between 1224-1221 cm-1. Notably, these peaks are broad, again suggesting the samplingof different backbone conformations. Despite the fact that the sequences all favor the B-formas their primary backbone conformation, the EcoRI AAA/TTT and TTC/AAG sequencesexhibit B-, A-, and Z-form conformation markers in the 1500-1250 cm-1 region as well as N-type sugar puckering, in the case of the EcoRI AAA/TTT sequence. A mixture of these markerscan be attributed to fraying of the helix near the ends of the sequences, since the two otherregions of interest of the spectra (1250-1000 and 1000-800 cm-1) also exhibit a dominant B-form. However, it is more likely that the flanking sequences of these dodecamers confer rigidityor flexibility to these sequences. For example, the Z-type marker at 1434-1440 cm-1 is presentin EcoRI TTC. The N-type sugar marker at 1406 cm-1 in EcoRI AAA/TTT that became muchweaker in EcoRI TTC/GAA and completely disappeared in EcoRI CGC/GCG may indicatethat EcoRI AAA/TTT and EcoRI TTC/GAA tend to exhibit more of the rigid A-form and Z-form conformations whereas EcoRI CGC/GCG primarily favors the flexible B-form. Themarker for purines in the anti conformation appears at 1373 and 1365 cm-1. The strong presenceof this peak in EcoRI AAA/TTT is likely due to the A-tract flanking sequence. The EcoRITTC/GAA sequence has a broad range of peaks in this region encompassing the syn markerat 1323 cm-1. The EcoRI CGC/GCG sequence shows far less resolution in this region, againsuggesting a more dynamic sugar ring.
Our findings suggest that the EcoRI AAA/TTT and EcoRI TTC/GAA sequences are moresimilar to each other than to the EcoRI CGC/GCG dodecamer in the 1800-1500 cm-1 and1500-1250 cm-1 base-reporting regions. The EcoRI CGC/GCG spectrum is much smootherwith broader peaks and more poorly defined marker bands than the other sequences. This
Kahn et al. Page 6
Biochemistry. Author manuscript; available in PMC 2010 February 17.
NIH
-PA Author Manuscript
NIH
-PA Author Manuscript
NIH
-PA Author Manuscript

evidence, along with the observation that local nucleotides in the rigid A-form and Z-formsoccur more frequently within the EcoRI AAA/TTT and EcoRI TTC/GAA sequences, suggeststhat EcoRI CGC/GCG is the most flexible sequence.
In fact, the FTIR regions reporting on the backbone and sugar moieties all show increasedbreadth for the EcoRI CGC/GCG sequence. This is in keeping with the previous 31P31and 2HNMR34 work on EcoRI CGC/GCG and the work of Windolph et al who demonstratedincreased cleavage rates of the K130E mutant of EcoRI on sequences with ̀ favorable' flankingsequences 12. The co-crystal structure of EcoRI bound the EcoRI CGC/GCG sequence showsthat there are no direct base contacts to the flanking sequences 43 so these sequences mustinstead modulate the DNA structure or flexibility. The Windolph study used known algorithms44; 45 to study this modulation and found that there was no real difference in the stackingenergies of their starting pool and their `best cut' or `worst cut' pools, indicating that stackingenergies are not responsible for the changes in cutting rates. However, they did demonstrateincreased flexibility of their best cut pool using the flexibility algorithms of Satchwell andTravers 46. We have shown this flexibility in the EcoRI CGC sequence using 31P31 and 2HNMR.34 Here, we directly demonstrate this increased flexibility as a function of flankingsequence using FTIR.
We have been able to conclude this using FTIR as this methodology provides a “snapshot” ofthe nucleic acid sequences where sharp resonances are the result of defined conformationswhile broad ones suggest dynamical averaging on the FTIR timescale. That flanking sequencesare able to affect a sequence's flexibility is in keeping with those of Lefebvre et al.18 who usedNMR to study the effect of modified flanking sequences on a CpG step and found that overalld(CATCGATG)2 sequence was more flexible than the d(CTTCGAAG)2 octamer. Similarly,Cordier et al.,11 who used 1H-NMR and 31P-NMR, found that A and T tracts of three basepairs on either side of the CRE sequence, d(GAAAACGTTTTC)2, induced rigidity in thissequence as compared to flexibility observed in d(ATGACGTCAT)2. This confirmation ofdiffering flexibility due to flanking sequence has important biological ramifications. It isknown from the cocrystal structure of the EcoRI restriction endonucelase in complex with itsrecognition sequence that this protein-DNA interaction utilizes an induced fit mechanism 47.The neokinks, distortions in the DNA structure upon complexation, incur an energetic cost andthis cost is presumed to vary based on surrounding sequences 9. Thus, the changes in cleavagerates observed by Windolph were suggested to be caused by altered DNA flexibility causedby flanking sequence effects. Here, we have provided direct experimental evidence supportingthat hypothesis.
In conclusion, we have shown variations in FTIR spectra that efficiently provide preliminaryinformation about the specific local structural response of the EcoRI binding sites to changesin the tri- nucleotides flanking these sites. In particular we found that different flankingsequences can (1) promote A- or Z- type structures in primarily B-form DNA sequences, (2)alter backbone and sugar conformations and (3) promote dynamical averaging of backboneand furanose conformations. While these results are consistent with previous research 11; 18,we recognize that this is an underdetermined problem and we cannot confidently identify thesource of IR band shifts. We plan to continue this investigation using our recent 31P dynamicNMR method 31 to provide the quantitative dynamic data FTIR cannot yield. However, theapplication of this method to the well-studied EcoRI CGC/GCG sequence providesconfirmation for the usefulness of FTIR in demonstrating the flexibility of the DNA backbone.In addition, by using the EcoRI CGC/GCG sequence as a control, we have demonstrated thatour FTIR results correspond to the structural features determined using other techniques.31;32; 34; 35; 48 Thus, we have shown that FTIR provides a rapid and efficient method forexamining a large number of DNA sequences in order to uncover trends and to determine whichsamples are worthy of further investigation by more quantitative techniques.
Kahn et al. Page 7
Biochemistry. Author manuscript; available in PMC 2010 February 17.
NIH
-PA Author Manuscript
NIH
-PA Author Manuscript
NIH
-PA Author Manuscript

The obvious changes in FTIR spectra caused by altering flanking sequences confirm thatflanking sequences have an important role in local structure and flexibility in DNA sequences.This is of tremendous importance because it suggests that the local environment of the DNAbinding site determines its binding affinity. Understanding this phenomenon underscores theimportant role of indirect readout in protein-DNA recognition events. 15; 16; 42
ACKNOWLEDGEMENTSThis work was supported by a grant from the NIH (1R15CA117891). The authors gratefully acknowledgeprogramming assistance from Aaron Skeers, NMR support from Professor Len Mueller and Yi Tian at UC Riversideand insightful discussions and careful editing by Diana Buckett, Stephanie McCarty and Sarah Primrose.
REFERENCES1. Grohima M. Influence of DNA stiffness in protein-DNA recognition. J Biotechnol 2005;117:137–145.
[PubMed: 15823403]2. Harrington R. DNA curving and bending in protein-DNA recognition. Mol. Microbiol 1992;6:2549–
2555. [PubMed: 1333034]3. Narayana N, Ginell SL, Russu IM, Berman HM. Crystal and molecular structure of a DNA fragment:
d(CGTGAATTCACG). Biochemistry 1991;304. Otwinowski Z, Schevitz RW, Zhang RG, Lawson CL, Joachimiak A, Marmorstein RQ, Luisi BF,
Sigler PB. Crystal structure of trp repressor/operator complex at atomic resolution. Nature1988;335:321–329. [PubMed: 3419502]
5. Shakked Z, Guzikevich-Guerstein G, F. Frolow F, D. Rabinovich D, Joachimiak A, Sigler PB.Determinants of repressor/operator recognition from the structure of the trp operator binding site.Nature 1994;368:469–473. [PubMed: 8133895]
6. Carey, M.; Smale, ST. Transcriptional Regulation in Eukaryotes: Concepts, Strategies, and Techniques.Cold Spring Harbor Laboratory Press; New York: 2000.
7. Hogan ME, Austin RH. Importance of DNA stiffness in protein-DNA binding specificity. Nature1987;329:263–266. [PubMed: 3627268]
8. Sarai A, Mazur J, Nussinov R, Jernighan RL. Sequence dependence of DNA conformation flexibility.Biochemistry 1989;28
9. Lesser DR, Kurpiewski MR, Waters T, Connolly BA, Jen-Jacobson L. Facilitated distortion of theDNA site enhances EcoRI endonuclease-DNA recognition. Biochemistry 1993;90:7548–7552.
10. Nathan D, Crothers DM. Bending and flexibility of methylated and unmethylated EcoRI DNA. J.Mol. Biol 2002;316:7–17. [PubMed: 11829499]
11. Cordier C, Marcourt L, Petitjean M, Dodin G. Conformation variation of the central CG site in d(ATGACGTCAT)2 and d(GAAAACGTTTTC)2. An NMR, molecular modeling and 3D-homologyinvestigation. Eur. J. Biochem 1999;261:722–733. [PubMed: 10215889]
12. Windolph S, Fritz A, Oelgeschlager T, Wolfes H, Alves J. Sequence context influencing cleavageactivity of the K130E mutant of restriction endonuclease EcoRI identified by a site selection assay.Biochemistry 1997;36:9478–9485. [PubMed: 9235992]
13. Riccelli PV, Vallone PM, Kashin I, Faldasz BD, Lane MJ, Benight AS. Thermodynamic,spectroscopic, and equilibrium binding studies of DNA sequence context effects in six 22-base pairdeoxyoligonucleotides. Biochem 1999;38:11197–11208. [PubMed: 10460177]
14. Qu X, Ren J, Riccellie PV, Benight AS, Chaires JB. Enthalpy/Entropy Compensation: Influence ofDNA Flanking Sequences on the binding of 7-Amino Actinomycin D to Its Primary Binding Site inShort DNA Duplexes. Biochem 2003;42:11960–11967. [PubMed: 14556627]
15. Wellenzohn B, Flader W, Winger RH, Hallbrucker A, Mayer E, Liedl KR. Complex of B-DNA withPolyamides Freezes DNA Backbone Flexibility. J. Am. Chem. Soc 2001;123:5044–5049. [PubMed:11457333]
16. Banyay M, Graslund A. Structural effects of cytosine methylation on DNA sugar pucker studied byFTIR. J. Mol. Biol 2002;324:667–676. [PubMed: 12460569]
Kahn et al. Page 8
Biochemistry. Author manuscript; available in PMC 2010 February 17.
NIH
-PA Author Manuscript
NIH
-PA Author Manuscript
NIH
-PA Author Manuscript

17. Lankas F, Sponer J, Langowski J, Cheatham TE. DNA basepair step deformability inferred frommolecular dynamics simulations. Biophys. J 2003;85:2872–2883. [PubMed: 14581192]
18. Lefebvre AOM, el Antri S, Monnot M, Lescot E, Fermandjian S. Sequence dependent effects of CpGcytosine methylation. A joint 1H-NMR and 31PNMR study. Eur. J. Biochem 1995;229:445–454.[PubMed: 7744067]
19. Vallone PM, Benight AS. Thermodynamic, Spectroscopic, and Equilibrium Binding Studies of DNASequence Context Effects in Four 40 Base Pair Deoxynucleotides. Biochem 2000;39:7835–7846.[PubMed: 10869190]
20. Siebert E, Ross JB, Osman R. Contribution of opening and bending dynamics to specific recognitionof DNA damage. J. Mol. Biol 2003;330:687–703. [PubMed: 12850140]
21. Grohima MM. Structure based sequence dependent stiffness scale for trinucleotides: A direct method.J. Biol. Phys 2000;26:43–50.
22. Lindqvist M, Graslund A. An FTIR and CD Study of the Structural Effects of G-tract Length andSequence Context on DNA Conformation in Solution. Journal of Molecular Biology 2001;314:423–432. [PubMed: 11846556]
23. Banyay M, Sakar M, Graslund A. A library of IR bands of nucleic acids in solution. Biophys. Chem2003;104:477–488. [PubMed: 12878315]
24. Pichler A, Rudisser S, Winger RH, Liedl KR, Hallbrucker A, Mayer E. The Role of Water in B-DNAsBI to BII Conformer Substates Interconversion: A Combined Study by Calorimetry, FT-IRSpectroscopy and Computer Simulation. Chem. Phys 2000;258:391–404.
25. Liquier J, Akhebat A, Taillandier E, Ceolin F, Huynh Dinh T, Igolen J. Characterization by FTIRspectroscopy of the oligoribonucleotide duplexes r(A-U)6 and r(A-U)8. Spectrochim. Acta1991;47:177–186.
26. Tsuobi, M. Application of infrared spectroscopy to structure studies of nucleic acids. In: Brame, EGJ.,editor. Applied Spectroscopy Reviews. Dekker; New York: 1969. p. 45-90.
27. Kay LE, Keifer P, Saarinen T. Pure Absorption Gradient Enhanced Heteronuclear Single QuantumCorrelation Spectroscopy with Improved Sensitivity. J. Am. Chem. Soc 1992;114:10663–10665.
28. Palmer AG, Cavanaugh J, Wright PE, Rance M. Sensitivity Improvement in Proton-Detected 2-Dimensional Heteronuclear Correlation Nmr-Spectroscopy. J. Magn. Reson 1991;93:151–170.
29. Schleucher J, Schwendinger M, Sattler M, Schmidt P, Schedletsky O, Glaser SJ, Sorensen OW,Griesinger C. A General Enhancement Scheme in Heteronuclear Multidimensional Nmr EmployingPulsed-Field Gradients. Journal of Biomolecular NNR 1994;4:301–306.
30. Wuthrich, K. NMR of Proteins and Nucleic Acids. Wiley; New York: 1986.31. Tian Y, Kayatta M, Shultis K, Gonzalez A, Mueller LJ, Hatcher ME. 31P NMR Investigation of
Backbone Dynamics in DNA Binding Sites. Journal of Physical Chemistry, B. 2008in press32. Drew HR, Wing RM, Takano T, Broka C, Tanaka S, Itakura K, Dickerson RE. Structure of a B-DNA
Dodecamer - Conformation and Dynamics .1. Proceedings of the National Academy of Sciences ofthe United States of America-Biological Sciences 1981;78:2179–2183.
33. Lee C, Cho M. Vibrational Dynamics of DNA: IV. Vibrational Spectroscopic Characteristics of A-,B-, and Z-form DNAs. J. Chem. Phys 2007;126:145102–145110. [PubMed: 17444751]
34. Hatcher ME, Mattiello DL, Meints GA, Orban J, Drobny GP. A solid-state deuterium NMR study ofthe localized dynamics at the C9pG10 step in the DNA dodecamer [d(CGCGAATTCGCG)]2. J. Am.Chem. Soc 1998;120:9850–9862.
35. Nerdal W, Hare DR, Reid BR. Solution structure of the EcoRI DNA sequence: refinement of NMR-derived distance geometry structures by NOESY spectrum back-calculations. Biochemistry1989;28:10008–10021. [PubMed: 2620059]
36. Bax A, Lerner L. Measurement of 1H-1H Coupling Constants in DNA Fragments by 2D NMR. J.Magn. Reson 1988;79:429–438.
37. Withka JM, Swaminathan S, Srinivasan J, Beveridge DL, Bolton PH. Toward a Dynamical Structureof DNA: Comparison of Theoretical and Experimental NOE Intensities. Science 255:597–599.[PubMed: 1736362]
38. Hartmann B, Piazzola D, Lavery R. BI-BII Transitions in B-DNA. Nucleic Acids Research1993;21:561–568. [PubMed: 8441668]
Kahn et al. Page 9
Biochemistry. Author manuscript; available in PMC 2010 February 17.
NIH
-PA Author Manuscript
NIH
-PA Author Manuscript
NIH
-PA Author Manuscript

39. Heddi B, Foloppe N, Hantz E, Hartmann B. The DNA structure responds differently to physiologicalconcentrations of K+ or Na+ Journal of Molecular Biology 2007;368:1403–1411. [PubMed:17395202]
40. Djuranovic D, Hartmann B. Conformational characteristics and correlations in crystal structures ofnucleic acid oligonucleotides: Evidence for sub-states. Journal of Biomolecular Structure &Dynamics 2003;20:771–788. [PubMed: 12744707]
41. Rudisser S, Hallbrucker A, Mayer E. B-DNA's Conformational Substates Revealed by FourierTransform Infrared Difference Spectroscopy. J. Am. Chem. Soc 1997;119:12251–12256.
42. Flader W, Wellensohn B, Winger RH, Hallbrucker A, Mayer E, Liedl KR. B1->BII SubstateTransitions Induce Changes in the Hydration of B-DNA, Potentially Mediating Signal Transductionfrom the Minor to Major Groove. J. Phys. Chem 2001;105:10379–10387.
43. Kim Y, Grable JC, Love R, Greene PJ, Rosenberg JM. Science 1990;249:1307–1309. [PubMed:2399465]
44. Santa Lucia J, Allawi HT, Senevirante PA. Biochemistry 1996;35:3555–2562. [PubMed: 8639506]45. Delcourt SG, Blake RD. J. Biol. Chem 1991;266:15160–15169. [PubMed: 1869547]46. Satchwell SC, Travers AA. EMBO J 1989;8:229–238. [PubMed: 2714251]47. McClarin JA, Frederick CA, Wang BC, Boyer HW, Grable JC, Rosenberg JM. Science
1986;234:1526–1541. [PubMed: 3024321]48. Shui XQ, McFail-Isom L, Hu GG, Williams LD. The B-DNA dodecamer at high resolution reveals
a spine of water on sodium. Biochemistry 1998;37:8341–8355. [PubMed: 9622486]
Kahn et al. Page 10
Biochemistry. Author manuscript; available in PMC 2010 February 17.
NIH
-PA Author Manuscript
NIH
-PA Author Manuscript
NIH
-PA Author Manuscript

Figure 1.Spectra for the 1800-1500 cm-1 in-plane base vibrations; EcoRI AAA/TTT (top), EcoRI TTC/GAA (middle), and EcoRI CGC/GCG (bottom).
Kahn et al. Page 11
Biochemistry. Author manuscript; available in PMC 2010 February 17.
NIH
-PA Author Manuscript
NIH
-PA Author Manuscript
NIH
-PA Author Manuscript

Figure 2.Spectra for the 1500-1250 cm-1 base-sugar vibrations; EcoRI AAA/TTT (top), EcoRI TTC/GAA (middle) and EcoRI CGC/GCG (bottom).
Kahn et al. Page 12
Biochemistry. Author manuscript; available in PMC 2010 February 17.
NIH
-PA Author Manuscript
NIH
-PA Author Manuscript
NIH
-PA Author Manuscript

Figure 3.Spectra for the 1250-1000 cm-1 sugar-phosphate vibrations; EcoRI AAA/TTT (top), EcoRITTC/GAA (middle) and EcoRI CGC/GCG (bottom).
Kahn et al. Page 13
Biochemistry. Author manuscript; available in PMC 2010 February 17.
NIH
-PA Author Manuscript
NIH
-PA Author Manuscript
NIH
-PA Author Manuscript

Figure 4.Spectra for the 1000-800 cm-1 sugar vibrations; EcoRI AAA/TTT (top), EcoRI TTC/GAA(middle), and EcoRI CGC/GCG (bottom).
Kahn et al. Page 14
Biochemistry. Author manuscript; available in PMC 2010 February 17.
NIH
-PA Author Manuscript
NIH
-PA Author Manuscript
NIH
-PA Author Manuscript

Figure 5.The second derivative spectra of the FTIR region reporting on the backbone and sugarconformations. EcoRI AAA/TTT (top), EcoRI TTC/GAA (middle) and EcoRI CGC/GCG(bottom).
Kahn et al. Page 15
Biochemistry. Author manuscript; available in PMC 2010 February 17.
NIH
-PA Author Manuscript
NIH
-PA Author Manuscript
NIH
-PA Author Manuscript
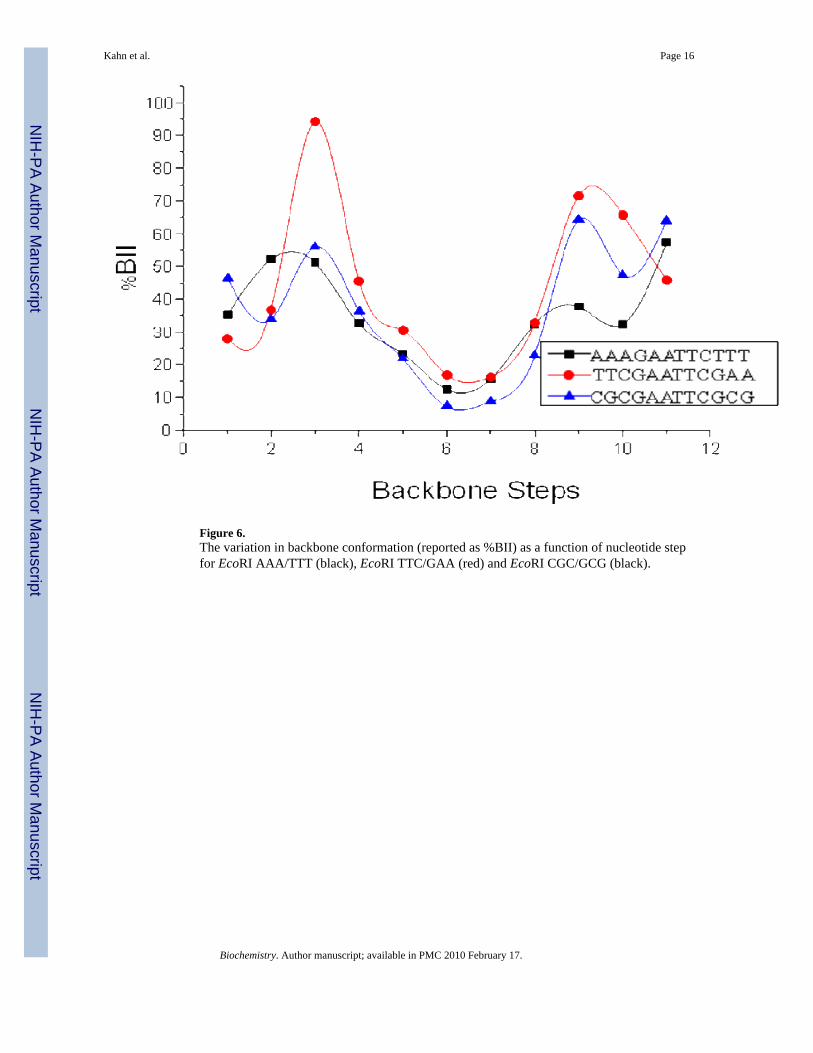
Figure 6.The variation in backbone conformation (reported as %BII) as a function of nucleotide stepfor EcoRI AAA/TTT (black), EcoRI TTC/GAA (red) and EcoRI CGC/GCG (black).
Kahn et al. Page 16
Biochemistry. Author manuscript; available in PMC 2010 February 17.
NIH
-PA Author Manuscript
NIH
-PA Author Manuscript
NIH
-PA Author Manuscript
NIH
-PA Author Manuscript
NIH
-PA Author Manuscript
NIH
-PA Author Manuscript
Kahn et al. Page 17
Table 1Sequences of DNA samples studied. The bold lettering indicates the EcoRI binding site.
DNA Sample Sequence
EcoRI AAA/TTT d(AAAGAATTCTTT)2
EcoRI TTC/GAA d(TTCGAATTCGAA)2
EcoRI CGC/GCG d(CGCGAATTCGCG)2
Biochemistry. Author manuscript; available in PMC 2010 February 17.