Sourcing and Scaling University RDM Services. The Realities ...
Upload
khangminh22Category
view
0download
0
Determinants of Sourcing Flexibility and its Impact on Performance
Stephan M. Wagner* Chair of Logistics Management
Department of Management, Technology, and Economics Swiss Federal Institute of Technology Zurich
Weinbergstrasse 56/58, 8092 Zurich, Switzerland Phone: +41 44 632 3259 Fax: +41 44 632 1526
Email: [email protected]
Pan Theo Grosse-Ruyken Credit Suisse AG
Paradeplatz 8, 8001 Zürich, Switzerland Email: [email protected]
Feryal Erhun Cambridge Judge Business School
University of Cambridge Trumpington Street, Cambridge CB2 1AG, UK
Email: [email protected]
Submitted to: International Journal of Production Economics
Manuscript # IJPE-D-16-01562R3 (3rd revision)
August 4, 2018 * Corresponding author. Acknowledgements: We thank the editor for his guidance throughout the review process and the three anonymous reviewers for their constructive feedback on earlier versions of this article. We also acknowledge the partial financial support for this study by the Kühne Foundation.

1
Determinants of Sourcing Flexibility and its Impact on Performance Abstract
Sourcing flexibility is an increasingly important building block of supply chain flexibility. Our
study which is grounded in information processing theory argues that two mechanisms can
support firms in building up sourcing flexibility. Based on a survey of 336 manufacturing firms
from Europe and the U.S. and using partial least squares (PLS) modeling as well as
hierarchical regression analysis, we show that supplier evaluation and selection, and the
integration of information systems at the buyer-supplier interface are positively related to
sourcing flexibility. Sourcing flexibility, in turn, is curvilinearly related to delivery
performance. Finally, delivery performance positively influences the product’s financial
performance. The strong associations between sourcing flexibility, delivery performance, and
product financial performance underscore that sourcing flexibility merits the attention of
supply chain managers during supplier selection and purchasing decisions.
Keywords: Supply chain management, Purchasing, Flexibility, Information processing theory (IPT),
Survey research.

2
1. Introduction
Manufacturing firms increasingly outsource production activities to their suppliers. As a result, the
average cost of purchased materials, components, and services across manufacturing firms
frequently exceeds 60%–80% of the total cost of operations (Khan K and Pillania 2008; van Weele
2014). Despite its many advantages, outsourcing increases the firm’s dependence on external
sources of supply and adds complexity in the upstream supply chain (Pawar and Rogers 2013),
which constrains a firm’s ability to effectively serve its customer base. Sourcing flexibility, i.e. the
capability of the buying firm and its processes to respond or react rapidly to changing supply
requirements, plays a key role in managing challenges due to dependence and complexity, and is
therefore an important trait for firms to adequately meet their customer demands.
There is evidence that firms can reap tangible benefits through sourcing flexibility (e.g., by
reducing stock-outs and inventory in their supply chains, shortening lead times, increasing quality
of their products, etc.). By practicing sourcing flexibility, the Spanish fashion retailer Zara is for
example able to limit its sales at markdown prices to 15%–20% of the total sales, compared to
30%–40% for its European and U.S. peers (Hausman and Thorbeck 2010). Recently, Intel has
benefited “hundreds of millions of dollars in documented cost savings and at least $2 billion in
revenue upside for one manufacturing process transition” (Kempf et al. 2013, pp. 75-76) by
adapting a flexible sourcing structure for its capital equipment procurement (Peng, Erhun, Hertzler,
and Kempf 2012). However, despite such promising examples, the link between sourcing flexibility
and a firm’s supply chain and product success, as well as the determinants of sourcing flexibility
have yet to be established empirically on a broader scale.
Drawing on primary data obtained from manufacturing firms our research uses partial least
squares (PLS) modeling and hierarchical regression analysis to test a model that answers the
following research questions: First, what are determinants of sourcing flexibility? Second, what is

3
the right level of sourcing flexibility in firms’ supply chains? Third, what is the impact of sourcing
flexibility on downstream-facing performance (i.e., delivery performance) and product financial
performance?
The remainder of the paper is organized as follows. Section 2 provides an overview of related
work. In Section 3, we introduce information processing theory (IPT) as the theoretical basis for our
study. Furthermore, we present our conceptual model and develop our hypotheses. In Section 4, we
present the methods, discuss the process of data collection, and detail the constructs used for the
study. In Section 5, we assess the measurement models and in Section 6, we test the structural
relationships and present the results of the hypothesis tests. We conclude in Section 7 with a
discussion of research and managerial implications, limitations, and an outlook for future research.
2. Related literature
The research in this study is related to and expands prior studies on supply chain flexibility, with
sourcing flexibility being a key component of supply chain flexibility (Pujawan 2004; Swafford,
Ghosh, and Murthy 2006). Therefore, we will briefly discuss previous work that is most closely
related to our contribution.
In their comprehensive literature review1, Seebacher and Winkler (2013) remark that research
on supply chain flexibility deals with “the issue of rapidly reconfiguring and aligning the supply
chain and its entities according to changing requirements in a cost efficient way” (p. 3416), and that
this research “is also characterised by a vast variety of different supply chain flexibility dimensions
and types” (p. 3417). Two typical characterizations for supply chain flexibility can be found in
Swafford, Ghosh, and Murthy (2006) who considered the components procurement/sourcing
1 Other reviews of the supply chain flexibility literature can be found in Fayezi, Zutshi, and O’Loughlin (2016), More
and Babu (2009), Singh and Acharya (2013), Stevenson and Spring (2007), and Tiwari, Tiwari, and Samuel (2015).

4
flexibility, manufacturing flexibility, and distribution/logistics flexibility, and in Moon, Yi, and
Ngai (2012) who distinguished between sourcing flexibility, operating system flexibility,
distribution flexibility, and information system flexibility. These and similar characterizations have
in common that they consider downstream-facing, internal, and upstream-facing dimensions.
Although many studies have captured the importance of supply chain flexibility (e.g., Graves
and Tomlin 2003; Malhotra and Mackelprang 2012; Sánchez and Pérez 2005; Stevenson and Spring
2007; Wang and Wei 2007), far less attention has been given to sourcing flexibility. There is
existing work in the literature that recognizes the influence of sourcing practices on manufacturing
flexibility (Jack and Raturi 2002; Narasimhan and Das 2000). However, with a few exceptions (e.g.,
Mendonça Tachizawa and Giménez Thomsen 2007; Gosling, Purvis and Naim 2010; Purvis,
Gosling and Naim 2014; Sreedevi and Saranga 2017), sourcing flexibility and its determinants and
outcomes have rarely been focal to a study.
Recognizing that the level of outsourcing has increased and that the supplier capabilities have
become critically important (Schoenherr et al. 2012), supply chain flexibility (at the “sink” as called
in the network design literature; Snyder, Scaparra, Daskin, and Church 2014) can only be achieved
if flexibility is already ensured in the upstream supply chain (at the “source”). Therefore, authors
such as Mendonça Tachizawa and Giménez Thomsen (2007), Gosling, Purvis and Naim (2010), and
Purvis, Gosling, and Naim (2014) have focused their studies on the dimensions “improved supplier
responsiveness” and “flexible sourcing”, respectively “vendor flexibility” and “sourcing flexibility”.
Following this research stream, the goal of our study is to further explore the role of sourcing
flexibility and to empirically investigate the impact of sourcing flexibility on delivery performance
and the product’s financial performance.
Sourcing flexibility is the upstream-facing component of a flexible supply chain and has been
defined by Swafford, Ghosh, and Murthy (2006, p. 174) as “the availability of a range of options

5
and the ability of the purchasing process to effectively exploit them so as to respond to changing
requirements related to the supply of purchased components,” and similarly by Yi, Ngai, and Moon
(2011, p. 274) “as the availability of sources of qualified materials and services, and the ability to
implement effective purchasing processes to respond to changing requirements.” Following these
definitions, we consider sourcing flexibility as a capability of the buying firm and its processes to
respond or react rapidly to changing supply requirements. It goes far beyond having access to
sufficient capacity on the supply market and at suppliers in order to cope with demand volatility or
sudden increases in the volume of materials required. Sourcing flexibility exists when a firm’s
suppliers’ are able to produce a broad variety of products if necessary, to mix different items into a
delivery load, to deliver materials in various speed options, and to respond quickly to changes in
required delivery quantities and/or delivery times (Chiang, Kocabasoglu-Hillmer, and Suresh 2012;
Mendonça Tachizawa and Giménez Thomsen 2007; Suarez, Cusumano, and Fine, 1996). In
essence, sourcing flexibility is concerned with the ability of the firm to alter types,
volumes/quantities, lead times, and delivery dates of materials and products needed from suppliers
to satisfy customer demands.
Sourcing flexibility has many advantages. It helps the buying firm to reduce their backorders,
and to respond to and buffer against variations in demand and seasonal fluctuations, particularly in
complex supply chains (Beamon 1999; Tang and Tomlin 2008). The right level of sourcing
flexibility also increases the ability to respond to and accommodate periods of supply uncertainties
(Pei, Simchi-Levi, and Tunca 2011; Tang and Tomlin 2008). Overall, the firm becomes more
customer oriented and can create better value for the customer with sourcing flexibility, and as a
result customers experience a better service (Zokaei and Hines 2007).
While in the literature the notion that “the greater the flexibility, the better the performance”
(Swamidass and Newell 1987, p. 512) is oftentimes intuitively assumed, prior studies have been

6
unable to find conclusive results on the link between various building blocks of supply chain
flexibility (including sourcing flexibility) and performance (Fantazy, Kumar, and Kumar 2009;
Pagell and Krause 2004) and some even discovered “the possible negative consequences of being
flexible” (Manders, Caniëls and Ghijsen 2016, p. 190). As such, More and Babu (2009, p. 40) state
that, in the literature, “the empirical justification of the benefits of implementing flexible supply
chains is rare and in-depth empirical studies are lacking” and call for additional investigation.
Similarly, Tiwari, Tiwari, and Samuel (2015, p. 783) believe that empirical research on supply
chain flexibility “does not seem sufficient. Therefore, there is a need to conduct several more
empirical researches … to create proper insight, awareness and understanding of the flexibility … to
harness potential benefits.” Our empirical study of the impact of sourcing flexibility on delivery and
product financial performance responds to these calls.
3. Theory and development of hypotheses
3.1. Theory and conceptual model
Sourcing flexibility is needed in order to cope with supply uncertainties. Information processing
theory (IPT) recognizes that firms are open social systems that face uncertainty (in our case supply
uncertainty) to which they need to respond (Galbraith 1974; Tushman and Nadler 1978).
Uncertainty creates information processing requirements, meaning that firms must build up
information processing capacities that help them to gather and process more information to match
extensive information processing requirements and subsequently achieve an envisioned outcome.
-------------------------------------- Insert Figure 1 about here
--------------------------------------
IPT proposes two strategies to increase information processing capacities in order to match
high information processing requirements (1) lateral relations and (2) information systems

7
(Tushman and Nadler 1978) – in our model represented by supplier evaluation and selection,
respectively information systems integration (Figure 1). From an information processing
perspective, the higher the information processing capacities, the better the buying firm will be
equipped to cope with supply uncertainty and to build up and capitalize on sourcing flexibility.
IPT originated in organization theory (Galbraith 1973; Tushman and Nadler 1978) and more
recently has been applied in operations, supply chain management and purchasing studies. Scholars
investigated, for example, various information processing alternatives for coping with uncertainty
and complexity in a manufacturing environment (Flynn and Flynn 1999), the role of information
processing in a supply chain on supply chain outcomes (Hult, Ketchen, and Slater 2004), the link
between supply chain and supply chain information systems strategies and performance (Qrunfleh
and Tarafdar 2014), information processing capacities of ERP systems for facilitating
manufacturing–marketing integration (Gattiker 2007), information processing needs and responses
of firms subsequent to a supply chain disruption (Bode, Wagner, Petersen, and Ellram 2011), the
relationship between product customization and necessary information processing capacities for
order management in make-to-order manufacturing (Tenhiälä and Ketokivi 2012), how information
processing can be reduced through slack resources and how this influences the relationship between
supply disruptions caused by supply base complexity and plant performance (Brandon-Jones,
Squire, and Van Rossenberg 2015), the effect of internal, cross-functional integration on financial
performance contingent upon the span of the supply chain processes (Swink and Schoenherr 2015),
and how supply chain sustainability related uncertainties create information processing needs
(Busse, Meinlschmidt, and Foerstl 2017). Very close to our context, IPT was used in the
procurement environment to study configurations of buyer-supplier relationships (e.g., Bensaou and
Venkatraman 1995; Premkumar, Ramamurthy, and Saunders 2005), approaches buying firms can
apply to manage interfaces between suppliers involved in NPD (Hong and Hartley 2011), and the

8
influence of supplier integration on planning comprehensiveness (Srinivasan and Swink 2005).
Finally, IPT as an ‘external grand theory’ has recently been recommended for grounding purchasing
and supply management research (Spina, Caniato, Luzzini, and Ronchi 2016). Taken together, IPT
is a suitable and applicable theoretical underpinning for our study.
While the studies mentioned above have either emphasized information processing
requirements, information processing capacities, or both, our research focuses on information
processing capacities and investigates how the two mechanisms proposed by IPT, which firms can
apply to increase their information processing capacities, relate to sourcing flexibility.
3.2. Hypotheses
Next, we develop the four hypotheses embedded in our conceptual model in more detail.
Supplier evaluation and selection and sourcing flexibility: Firms can increase their information
processing capacity through lateral relations by communicating with and obtaining information
from exchange partners (Galbraith 1974; Tushman and Nadler 1978). In our context, buying firms
engage with suppliers and apply supplier evaluation procedures as a sourcing practice to establish
lateral relations (Zhou 2013) in order to assess the expected performance of suppliers (prior to
supplier selection), to compare potential suppliers along various criteria, and to subsequently use
this information to select a particular supplier (e.g., Chen, Lin, and Huang 2006; Ho, Xu, and Dey
2010; Vokurka, Choobineh, and Vadi 1996). These supplier evaluation procedures help to satisfy
information processing requirements that exist for choosing the most suitable suppliers. In our
research, supplier evaluation and selection concerns the importance that a firm assigns to the
various criteria used for assessing and choosing suppliers as “a critical step in developing and
managing an effective and efficient supply chain” (Wu and Blackhurst 2009, p. 4593).

9
The supplier evaluation and selection criteria regularly include – but are not limited to – cost,
quality, delivery, innovation, or flexibility (Krause, Pagell, and Curkovic 2001). Supplier evaluation
and selection building on a set of criteria will result in the selection of appropriate and well-
performing suppliers. Previous research has shown that firms which implement supplier evaluation
and selection procedures and emphasize, for instance, product cost, product quality, product
availability, delivery reliability, and product performance when selecting suppliers have higher
performing suppliers, and ultimately a higher manufacturing and overall firm performance (e.g.,
Kannan and Tan 2006; Koufteros, Vickery, and Dröge 2012; Vonderembse and Tracey 1999).
Engineering and electronics company Bosch, for example, emphasizes its customers’
expectations concerning flexibility. Therefore, from the suppliers it selects, Bosch also requests
flexibility in terms of the contract, delivery service, call-offs and capacity reserves in ongoing
production as well as in the start-up and phase-out phases (Bosch 2016). Emphasizing supplier
evaluation and selection criteria along several attributes in the supplier evaluation and selection
process helps to configure a strong supplier base. The buying firm will generally end up with
suppliers that perform better and more specifically are also able to support the buying firm’s
sourcing flexibility. High-performing suppliers will perform well along several dimensions, and if
the buying firm is meticulous in its supplier selection decision, the selected suppliers will also be
able to more easily adjust manufacturing schedules and capacities, or to accept changes of delivery
quantities and times, hence, reinforcing the buying firm’s sourcing flexibility. Therefore, we
propose the following hypothesis:
H1: Supplier evaluation and selection is positively related to sourcing flexibility.
Information systems integration and sourcing flexibility: A second mechanism through which
firms can increase their information processing capacity is through “formal information and

10
communication systems” (Tushman and Nadler 1978, p. 618). Tushman (1978) argues that, in case
of uncertainty (in our case supply uncertainty), it is critical that organizations are equipped to collect
and handle “technical and market sources of uncertainty” (p. 625). In our context, buying firms use
integrated internal and inter-organizational information systems to obtain and process information
to support them in enhancing sourcing flexibility in order to deal with uncertainty (Gattiker 2007).
In our research, information systems integration is the organizational and technical implementation
of information systems with the „goal of greater efficiency, effectiveness and competitiveness“
(Wainwright and Waring 2004, p. 329) in a firm’s supply chain.
IT is an important organizational resource, and the integration of information and
communication technologies is needed to support boundary-spanning activities (Yao, Dresner, and
Palmer 2009). Information systems integration across organizational boundaries can occur at
multiple process and functional levels and encompasses the sharing of purchasing-related
information within the buying firm, as well as databases and the integration of IT systems between
suppliers and the buying firm for sharing operating and planning information.
Bosch uses SupplyOn for cross-company cooperation and as a uniform interface to its
suppliers for sourcing or EDI exchange, and suppliers to be selected are required to join the
SupplyOn platform (Bosch 2016). Information systems integration across organizational boundaries
can allow firms to increase visibility, improve coordination, and shorten response times (Clemons,
Reddi, and Row 1993; Hill and Scudder 2002; Holland and Lockett 1997; Saeed, Malhotra, and
Grover 2005; Saraf, Langdon, and Gosain 2007). Information systems integration is associated with
the effective management of buyer-supplier relationships with benefits for the buyer and the
supplier (e.g., Frohlich and Westbrook 2001; Sanders 2005). Paulraj, Lado, and Chen (2008, p. 50)
observe that “operational efficiency, quality, flexibility, and customer responsiveness” can be
improved, hence, pointing out that integration also fosters flexibility and responsiveness. Both intra-

11
and inter-firm information sharing are key in enabling a firm to act and react quickly and more
efficiently, and thus decrease demand distortion and reduce lead times (Lee, Padmanabhan, and
Whang 1997). A suitable level of information systems integration is therefore necessary to ensure
smooth flows of materials along the value chain and to improve sourcing flexibility. Thus, we
hypothesize:
H2: Information systems integration is positively related to sourcing flexibility.
Sourcing flexibility and delivery performance: The benefits of a supply chain’s sourcing flexibility
can be reaped downstream in the supply chain and are reflected in high delivery performance.
Delivery performance is defined as the degree to which the customer-facing supply chain is able to
meet end-customer requirements, and is the result of the supply chain’s ability to respond quickly
and effectively to a changing marketplace (Chopra and Meindl 2016; Lee 2004). Bosch emphasizes
its customers’ high expectations concerning flexibility, and that Bosch’s logistics function as well
Bosch’s suppliers therefore had to become more customer-focused and flexible in the delivery of
products (Bosch 2016).
A firm’s supply chain will be able to better meet customer demands in product delivery if the
products can be manufactured or assembled flexibly, and hence if the input materials are also
sourced flexibly. Sourcing flexibility improves an organization’s responsiveness and customer
satisfaction by enabling the supply chain managers to, for instance, adapt the product mix, product
quantities, and delivery schedules to short-term requirements from the manufacturing operations or
from outside customers (Narasimhan, Jayaram, and Carter 2001). In isolation, higher sourcing
flexibility will also result in higher delivery performance.
However, extant research posits that the relationship between supply chain flexibility and
performance is not linear (Tang and Tomlin 2008). Sourcing flexibility comes at a cost (Manders,
12
Caniëls, and Ghijsen 2016). Interactions between greater sourcing flexibility and increased costs of
this flexibility can lead to unexpected trade-offs. The higher the costs for implementing sourcing
flexibility, the higher the costs in the upstream supply chain. Given limited supply chain budgets,
higher costs in the upstream supply chain might prevent a firm from investing resources in the
downstream side for improving logistics and delivery service. Therefore, the benefits of increased
sourcing flexibility as argued above might turn negative once costs for implementing sourcing
flexibility are too high (Manders, Caniëls, and Ghijsen 2016) and come at the expense of lower
investments in the downstream side of the supply chain.
From another perspective, not all downstream supply chains will require high responsiveness
and hence high sourcing flexibility. When demand uncertainty is high, high sourcing flexibility may
indeed be the best option to enhance delivery performance and to satisfy customer requirements. In
contrast, when customer demands are stable and predictable, firms may achieve adequate delivery
performance with lower levels of flexibility, and are consequently not investing in sourcing
flexibility. That is, both extremes of sourcing flexibility, when matched with the appropriate setting,
may lead to improved delivery performance. In sum, we hypothesize:
H3: Sourcing flexibility is curvilinearly related (U-shaped) to delivery performance.
Delivery performance and product financial performance: There are many well publicized
financial performance failures due to supply chain problems, for example American Biophysics
launch of its Mosquito Magnet (Schneider and Hall 2011), 2007 Mattel toy recall (Tse and Tan
2011), 2009 peanut products recall in the U.S. (Hora, Bapuji, and Roth 2011), and delays Boeing
experienced during the introduction of its 787 Dreamliner series (Sodhi and Tang 2012). These
examples underline the financial implications of supply chain management practices.

13
Several studies have shown that good performance in providing a service and delivering a
product in the downstream supply chain to customers has positive financial implications for firms
delivering that service. For example, customer service – which includes delivery speed, delivery
responsiveness, or delivery dependability – is positively related to the firm’s/business unit’s return-
on-assets, return-on-investment and return-on-sales (Vickery, Jayaram, Droge, and Calantone
2003). Likewise, logistics performance and efficiency, which includes order cycle times, fill rates or
on-time shipments, has a strong positive impact on the organizational performance of the business
unit (e.g., market share, sales growth, return-on-sales, or return on assets) (Fugate, Mentzer, and
Stank 2010). These studies relate the service performance of supply chains to the financial
performance of a firm or business unit.
We are also interested in financial performance. However, unlike previous supply chain
management studies that focus on the overall firm performance (e.g., Ellinger et al. 2011; Murray,
Kotabe, and Wildt 1995), we are interested in understanding the impact of the delivery performance
on the business performance of the product, which we call “product financial performance” (Song,
Song, and Di Benedetto 2011, p. 99) and define as a product’s competitive sales and profitability
performance. With weak delivery performance for its products, companies such as electric vehicle
manufacturer Tesla with its Model 3 or aircraft manufacturer Airbus with its A400M aircraft
experienced lower product growth and profitability than what could have been achieved with better
delivery performance (Boudette 2018; Clark 2010).
In addition to the assessment of a product itself (i.e., its features, innovativeness, quality, etc.),
customers will continue to buy or increase spend for products where the delivery of the product also
meets or exceeds their expectations. Short delivery lead times and a high delivery reliability, as well
as a high overall satisfaction of the customer with a logistics service will result in retention or even
expansion of customer business (Davis-Sramek, Mentzer, and Stank 2008), and ultimately have a
14
positive impact on a product’s financial performance. The better the delivery performance, the
better the involved products will penetrate the market. Therefore, we posit that delivery
performance positively affects product financial performance in terms of sales growth, market
share, and profitability.
H4: Delivery performance is positively related to product financial performance.
4. Methodology
4.1. Data collection and sample
To obtain the data needed for testing our model and hypotheses, we contacted 1,834 operations
managers and executives (as apparent from their areas of responsibility and job titles) at 1,000 large
manufacturing firms in the UK, France, Germany, Austria, Switzerland, and the United States
(Wagner, Grosse-Ruyken, and Erhun, 2012). Potential respondents were contacted through an initial
mailing and if necessary through a second mailing or a follow-up phone call (Dillman, Smyth, and
Christian 2009). We obtained a total of 336 usable responses with a response rate of 18.3%.
The firms represented in the sample came from a diverse set of industries and the number of
employees ranges from less than 100 to 450,000 (mean 17,438). This heterogeneity suggests that
systematic biases are not likely to be present. The respondents are managers or executives, such as
VPs or department heads, and the majority of the respondents describe their area of responsibility as
supply chain management (37%) or general management (26%), followed by logistics (18%),
purchasing (10%), and manufacturing (8%). On average, the respondents have worked in
purchasing, logistics, supply chain, production, or related fields for 13.4 years, have been in their
current positions for 4.4 years and have been with their firms for 10 years. The work experience,
firm tenure, hierarchical levels and areas of responsibility of the respondents suggests that they have
a boundary-spanning view of their firms’ supply chains (upstream and downstream) and that they

15
are familiar with the main product lines of their firms. They demonstrate very good knowledge of
the underlying main product lines, including the structure and supplier base of those product lines.
A more detailed breakdown of the sample and informants can be found in Appendix A-1.
Prior to data collection, a questionnaire was drafted in English and pretested with managers
and academics who reviewed the questionnaire items for readability, ambiguity, and completeness
and assessed whether individual items are suitable measures of their respective constructs (Dillman,
Smyth, and Christian 2009; Hensley 1999; Wacker 2004). Only some minor adjustments were made
to the survey. Subsequently, native speakers translated the English questionnaire into German and
French; back-translation into English ensured similarity of meaning and semantic equivalence
(Schaffer and Riordan 2003).
We addressed the concern of non-response bias in two ways (Wagner and Kemmerling 2010).
We first applied the wave analysis procedure by organizing the data set into two groups of equal
size; one group with earlier respondents and one group with later respondents. To identify potential
dissimilarities between the two groups, we performed tests on the groups’ responses for differences
among the items of the constructs used in our model, firm sizes and industry clusters. The test
statistics did not reveal any statistically significant differences between early and late respondents.
Second, we called a sample of non-respondents with the request to complete the survey. The
comparison of the data obtained from 52 non-respondents with the data of the respondents did also
not reveal any significant differences. In sum, our data is without substantive non-response bias and
representative.
To examine the potential for common method bias, Harman’s one-factor test was applied. All
20 items in the reflective constructs (see Section 4.2) were subjected to a principal component factor
analysis using the Kaiser-criterion which yielded five factors with the first factor accounting for
19.6% of the cumulative variance explained by the five factors (59.9%). As such, several factors
16
emerged and no factor accounts for the majority of the covariance, suggesting the absence of a
significant common method bias effect (Podsakoff and Organ 1986).
4.2. Measures
The respondent had to choose the firm’s main product line and answer all questions for this main
product line, which is the level of analysis in our research.
Independent and dependent variables: To generate our constructs and facilitate our analysis, we
rely on measures that are largely based on existing scales provided in the literature. The measures
for the five constructs – supplier evaluation and selection, information systems integration, sourcing
flexibility, delivery performance, and product financial performance – are summarized in Appendix
A-2.
A buying firm’s supplier evaluation and selection is often based on a number of criteria (Hsu,
Kannan, Leong, and Tan 2006). In addition to cost, quality, and service as frequently and
consistently used competitive priorities in operations (Boyer and Lewis 2002; Ward, McCreery,
Ritzman, and Sharma 1998) and criteria for supplier selection (Luzzini, Caniato, and Spina 2014;
Kannan and Tan 2002), we added innovation as a fourth criterion for three reasons: First,
information processing capacity through lateral relations is particularly “appropriate for information
which is less quantifiable” (Tushman and Nadler 1978, pp. 618-619), which is the case for
innovation. Second, innovation was identified as an augmenting competitive priority of operations
(Krause, Pagell, and Curkovic 2001; Kroes and Ghosh 2010). Third, innovation generally became
more central to supplier evaluation and selection (Yan and Dooley 2014). An average of four
indicators in formative outer model specifications per construct was also found for PLS research
published in top-tier journals (Hair, Sarstedt, Ringle, and Mena 2012). We tapped whether the

17
buying firm considers these four criteria as important for their supplier evaluation and selection for
the firm’s main product line.
The information systems integration measure captures the extent to which the information
systems of an organization are integrated, enabling a firm to enhance efficiencies of boundary-
spanning activities. Communication frequency, intensity, and integration build stronger buyer-
supplier partnerships, increase channel effectiveness and efficiency, and ensure that there are no
information delays (Anand and Goyal 2009; Croson and Donohue 2003; Mohr and Nevin 1990).
Information systems integration enables each channel entity to be informed immediately by
providing accurate, thorough, and timely information about current and expected conditions. In our
survey, we built on the scale used by Rodrigues, Stank, and Lynch (2004), rephrased the items and
finally considered four items to tap whether the firms (1) share intra-firm information and data
access; (2) integrate operating and planning databases across applications; (3) share inter-firm
information and data access; and (4) maintain integrated database and access methods to facilitate
information sharing.
The sourcing flexibility measure assesses the ability of a firm’s purchasing organization and
processes to react rapidly to changing supply requirements. It also covers the extent to which a firm
can tap into suppliers’ ability to deal with volume requirements, changes in part specifications, and
the quantity and timing of orders in response to the uncertainty in material requirements. We have
chosen five items of Swafford, Ghosh, and Murthy (2006) and Narasimhan and Das (1999) and
slightly rephrased them to operationalize the sourcing flexibility measure.
We adopted and expanded the delivery performance measure as proposed by Power,
Schoenherr and Samson (2010) and Malhotra and Mackelprang (2012) to reflect the customer-
facing performance in meeting end-customer requirements, expressed in product availability,

18
delivery reliability, ability to meet the quantities demanded by customers, and customers’
satisfaction with the delivery.
Finally, the product financial performance measure was taken from Joshi and Sharma (2004)
and captures the performance of the main product line’s product relative to the main competitor in
terms of growth, market share, and profitability (Song, Song, and Di Benedetto 2011).
Control variables: We included several control variables in our model in order to eliminate
potentially confounding effects of undesirable variation. First, the competitive intensity faced by the
firm might reduce its ability to invest in information processing capacities and sourcing flexibility,
and can generally impact market success and profitability. We captured competitive intensity with
four items proposed by Jaworski and Kohli (1993) by asking the respondents for the intensity of
rivalry among firms in the industry. Second, firm size is an important structural variable. Larger
firms might have more financial resources, and might generally have stronger market positions and
therefore might be more profitable. Smaller firms, in contrast, might be more innovative, and
therefore more profitable. We measured firm size by a single item asking respondents for the
number of employees at their firm; we double-checked the responses against secondary data from
Bloomberg. Third, we eliminated country effects. Not only the performance of the buying firm, but
also the performance of the suppliers might vary from country to country due to different structural
and economic conditions. We employed the approach recommended by Cohen, Cohen, West, and
Aiken (2003, pp. 303-307) and coded the responses from France as the variable “Country France,”
from the German-speaking countries as the variable “Country Germany,” and from the UK as the
variable “Country UK.” Finally, we used responses from the U.S. as the baseline.
19
4.3. Analytic method
For assessing the measurement models and the linear structural relationships (H1, H2, and H4), we
applied variance-based partial least squares (PLS) modeling. The commonly employed covariance-
based structural equation modeling approach aims to maximize the fit of the overall model, allows
for the assessment of overall model fit, can compare a theoretical model with a perfectly fitting
model and can evaluate alternative models. It is the preferred method for testing and confirming
complex theory (Reinartz, Haenlein, and Henseler 2009). In contrast, the PLS modeling approach
aims to maximize the explained variance when the independent variables are approximated as linear
combinations of the dependent variables. It is suitable for exploring, extending and testing structural
relationships and prediction (Hair, Ringle, and Sarstedt 2011), and for “predicting key target
constructs or identifying key ‘driver’ constructs” (Hair, Ringle, and Sarstedt 2011, p. 144). Among
others, we want to predict the level of sourcing flexibility and its influence on performance.
Similarly, Peng and Lai (2012) emphasize the applicability of PLS when relationships that have not
been well understood should be investigated. In our case, we aim to explore the role of the scarcely
understood and empirically not examined concept of sourcing flexibility. Furthermore, PLS
modeling is also appropriate because our model consists of a series of dependence relationships, and
contains both, reflective and formative constructs (Esposito Vinzi, Chin, Henseler, and Wang 2010;
Hair, Hult, Ringle, and Sarstedt 2014; Peng and Lai 2012). The software SmartPLS 2.0 M3 was
used for the PLS analysis.
For assessing the curvilinear (i.e., quadratic) structural relationship (H3), we conducted
hierarchical regression analysis (Cohen, Cohen, West, and Aiken 2003) with IBM SPSS Statistics
23.
5. Assessment of the measurement models
20
Before testing the structural relationships, we assessed the validity and reliability of the
measurement models, in which reflective and formative constructs must be assessed separately
(Chin 1998; Götz, Liehr-Gobbers, and Krafft 2010; Hulland 1999). The descriptive statistics (means
and standard deviations) for all constructs of our research model are provided in Table 1.
-------------------------------------- Insert Table 1 about here
--------------------------------------
Reflective measurement models: The measures for the five reflective constructs (information
systems integration, sourcing flexibility, delivery performance, product financial performance, and
competitive intensity) are largely based on existing perceptual scales, i.e., evidence of content
validity has been previously provided. Based on the principal component analysis, Table 2 shows
that all indicators are significantly (p < 0.001) related to their respective construct, and that the
factor loadings for most indicators are larger than 0.70. For three indicators the loading is slightly
smaller (0.653 for SF1, 0.662 for DP1, and 0.687 for CI3), but still well above the threshold of 0.4
or 0.5 recommended for dropping an item (Hulland 1999). Also, each indicator loads more strongly
on the respective construct than on any other construct, and the AVE (average variance extracted) of
each construct is above the threshold of 0.5 (Fornell and Larcker 1981), together indicating
convergent validity. The AVE of all reflective constructs is higher than the squared correlations
with the other constructs (Table 2), establishing discriminant validity. Construct reliability was
assessed with Cronbach’s (1951) alpha and Fornell and Larcker’s (1981) composite reliability
measure. All values were above or very close (Cronbach’s alpha for ‘competitive intensity’) to the
threshold of 0.70 for good reliability (Hair, Black, Babin, and Anderson 2010). In sum, the
reflective constructs show satisfactory levels of validity and reliability.
-------------------------------------- Insert Table 2 about here
--------------------------------------
21
Formative measurement model: The measures for the formative construct (supplier evaluation and
selection) are appropriate and valid since the performance and capabilities of a supplier in terms of
cost, quality, service, and innovativeness capture the entire scope of the latent variable and the
construct’s domain of interest (Diamantopoulos and Siguaw 2006). They are also derived from the
literature, in sum, providing evidence for content validity. As opposed to items measuring reflective
constructs that should be highly correlated, there are no expectations on items in formative
constructs; they can have positive, negative, or zero correlations (Bollen and Lennox 1991).
Therefore, the traditional measures of item and factor reliability and the assumption of
unidimensionality do not apply (Chin 1998). The factor weights for the formative measurement
model obtained from the PLS analysis are depicted in Table 3. Except for the item ‘service’ (SES3),
all t-values obtained from 5,000 bootstrap samples are within acceptable limits (i.e. p < 0.01 or p <
0.05). To not compromise on the generality of our modeling (including the measurement approach),
we retain the SES3 item even though it does not contribute substantially to the measurement of
supplier evaluation and selection. With variance inflation factors all below 5, whereby the condition
indices below 30, multicollinearity of our formative indicators was not a serious problem (Hair,
Black, Babin, and Anderson 2010). In sum, the formative construct also shows satisfactory levels of
validity and reliability.
-------------------------------------- Insert Table 3 about here
--------------------------------------
6. Assessment of the structural relationships and results
We analyzed the hypothesized linear relationships between supplier evaluation and selection criteria
and sourcing flexibility (H1), information systems integration and sourcing flexibility (H2), and
delivery performance and product financial performance (H4); and the hypothesized curvilinear

22
relationship between sourcing flexibility and delivery performance (H3). In this section, we provide
the details of our analysis.
The PLS analysis was used to test H1, H2, and H4. For PLS models, no overall fit indices can
be reported. Instead, the quality of the structural model was assessed as recommended in the
literature (Götz, Liehr-Gobbers, and Krafft 2010; Hair, Black, Babin, and Anderson 2010; Hulland
1999). The PLS analysis’ main objective is to maximize the variance explained in all endogenous
variables. Therefore, to judge the quality of the PLS model one has to examine the coefficients of
determination (R2) for the endogenous variables. To assess the predictive relevance of the
endogenous variables in our PLS model, we calculated the Stone-Geisser test criterion Q2. When Q2
is larger than zero, the model is considered to have predictive validity. With the effect size f2 we
evaluated whether the impact of a particular independent latent variable on a dependent latent
variable has substantive impact. We calculated the statistical significance level of the parameter
estimates using 5,000 bootstrapping runs. Table 5 includes the quality criteria R2, Q2, f2 as well as
the standardized coefficients β and t-values.
The results show that each endogenous variable has a significant impact (p < 0.001) on its
associated exogenous variables, providing support for hypotheses H1 (β = 0.361), H2 (β = 0.189),
and H4 (β = 0.301). Since our endogenous variables are only explained by one respectively two
exogenous variables, the R2 values are acceptable; likewise are the f2 values. All Q2 values are
larger than zero.
Hierarchical regression analysis as proposed by Cohen, Cohen, West, and Aiken (2003) was
used to test the quadratic effect hypothesized in H3. For the analysis, regression-weighted composite
scores from the PLS analysis were formed for the three reflective variables (delivery performance,
sourcing flexibility, competitive intensity). The independent variables (except the dummy variables)
were standardized, and the quadratic term was created by multiplying the standardized variable

23
score. With delivery performance as dependent variable, Model 1 includes the controls as
independent variables. In Model 2 the linear and in Model 3 the squared term of sourcing flexibility
was added. Table 4 shows that by adding the squared term of sourcing flexibility, a significantly
higher variance can be explained (R2 change = 0.136; R2 = 0.254). The effect size f2 equals 0.184.
The curvilinear effect demonstrates a U-shaped relationship between sourcing flexibility and
delivery performance, supporting H3 (β = 0.383; p < 0.001).
-------------------------------------- Insert Table 4 about here
--------------------------------------
Table 5 summarizes the results of the hypotheses tests, including the quality criteria,
coefficients and t-values from the PLS analysis and hierarchical regression analysis.
-------------------------------------- Insert Table 5 about here
--------------------------------------
7. Discussion of implications and conclusion
7.1. Research implications
In this article, we develop theoretical arguments and present empirical validation of determinants
and consequences of sourcing flexibility, which is an important component of flexible supply
chains. To the best of our knowledge, this study is the first in the literature that (1) provides
evidence that sourcing flexibility is curvilinearly related to delivery performance, (2) shows the
impact on product financial performance, and (3) studies the role of two important determinants of
sourcing flexibility. Our research has several broader implications for theory and the operations and
supply chain literature.
Our study provides a novel “cross-firm setting” of IPT which so far “primarily focuses on the
firms’ internal organization” (Bode, Wagner, Petersen, and Ellram 2011, p. 835), hence, it adds to

24
the limited existing inter-organizational literature (e.g. Bode, Wagner, Petersen, and Ellram 2011;
Hult, Ketchen, and Slater 2004). It derives two approaches how firms can build up information
processing capacities through lateral relations and information systems (Tushman and Nadler 1978).
It also establishes that sourcing flexibility has extensive information processing requirements and
that supplier evaluation and selection, and information systems integration are means to establish
matching information processing capacities (Galbraith 1974). Our research sheds light on Tushman
and Nadler’s (1978, p. 619) proposition that “high performing organizations are those which match
capacity to requirements. Mismatch in capacity and requirements should be associated with lower
organizational performance.”
Prior purchasing research employing IPT was limited to supplier integration as a means of
establishing lateral relations (e.g., Srinivasan and Swink 2005; Swink and Schoenherr 2015), which
is only applicable once supplier relationships are established. In our research we add supplier
evaluation and selection as a means to establish lateral relationships. Going forward, combining
supplier evaluation and selection with supplier integration activities might result in more effective
lateral relationships in order to increase information processing capacities.
While Kim and Chai (2017) recently showed that information sharing in supply chains,
including integrated information systems within the firm and throughout the supply chain, or
information sharing with customers and suppliers, is a determinant of supply chain agility, we more
specifically establish that information systems integration is a determinant of sourcing flexibility.
Our study refines earlier observations concerning the impact of sourcing flexibility on
delivery performance. While Kumar, Singh and Kumar (2017, p. 345) observed that “[i]ntegrated-
sourcing flexibility in supply chain management improves the organization’s ability to deliver
products and services in a timely and effective manner,” our study for the first time empirically
shows that greater sourcing flexibility does not enhance delivery performance per se. Instead, the

25
curvilinear relationship between sourcing flexibility and delivery performance underlines that firms
should choose between either low or high levels of sourcing flexibility, otherwise they may hinder
the delivery performance in their downstream supply chain. That is, both extremes of sourcing
flexibility, when matched with the appropriate setting, lead to improved delivery performance. This
curvilinear relationship is evidence to operations and supply chain management for the “stuck in the
middle” phenomenon, which has been observed in the strategy and organization literature (e.g.,
Bouquet, Crane, and Deutsch 2009; Dess and Davis 1984).
Our study also adds in other respect to the operations and supply chain management literature.
First, we supplement the concept of supply chain flexibility, which dominates the literature (e.g.,
Graves and Tomlin 2003; Wang and Wei 2007), by deliberately studying determinants and
consequences of sourcing flexibility. As such, our study emphasizes that sourcing flexibility is a
critical component for achieving supply chain flexibility. Second, previous studies have tried to
analyze whether positive linear relationships between manufacturing and/or supply chain flexibility
and performance exist (e.g., Fantazy, Kumar, and Kumar 2009; Pagell and Krause 2004; Swamidass
and Newell 1987), but were not always able to confirm this intuitive expectation. We expand this
stream of research and provide empirical evidence for analytical models that already challenged the
linearity of the flexibility–performance link (Tang and Tomlin 2008) by showing that there might
be a turning point were higher levels of flexibility impede performance. Third, previous supply
chain management studies focus on the overall firm or business unit performance of supply chain
management practices (e.g., Ellinger et al. 2011; Vickery, Jayaram, Droge, and Calantone 2003;
Wagner, Grosse-Ruyken, and Erhun 2012). In contrast, we show how sourcing flexibility relates to
the delivery performance and financial performance of products.

26
7.2. Managerial implications
Firms and managers can benefit from understanding the consequences of sourcing flexibility, as
well as from its determinants. First, the curvilinear relationship between sourcing flexibility and
delivery performance suggests that firms can realize superior performance both with rigid and
flexible sourcing of materials and products (in terms of product quantities, product mix, delivery
schedules, etc.); i.e., by aiming for either low or high levels of sourcing flexibility – while medium
levels of sourcing flexibility are undesirable. That means, a hesitant or cautious approach is not
recommended. Instead, supply chain managers should decide to either invest intensively in sourcing
flexibility, or to not invest at all. When they opt for the former (i.e., high sourcing flexibility), they
must select suppliers which are able to vary production volumes, have access capacity, and are able
to adjust their logistics service to comply with short-term product mix and delivery volume changes.
A broader implication might be to use local instead of global supply sources, since local suppliers
are likely to have shorter delivery times. When supply chain managers opt for the latter (i.e., low
sourcing flexibility), they should not enter into contracts with suppliers that would allow them
greater flexibility but come at higher costs. Instead, they should invest the saved money in
improving the firm’s downstream supply chain and delivery system.
The second consequence of the right level of sourcing flexibility, namely product financial
performance – which emerges from high delivery performance – shows that firms should pay
attention to sourcing flexibility since this will have tangible financial implications. Hence, along
with incentives for cost and price reductions, supply chain managers should also be given goals and
incentives for actively managing sourcing flexibility, which seems largely neglected today.
Third, supplier evaluation and selection as an important determinant of sourcing flexibility
underlines where buying firms need to build up capabilities when aiming for high sourcing
flexibility. Supply chain managers should generally promote a stronger evaluation of suppliers

27
along several criteria when faced with the task to select a (new) supplier. Consequently, firms
requiring higher levels of responsiveness must put more emphasis on rigorous supplier evaluation
and selection along with a broad and balanced set of criteria.
Fourth, to increase sourcing flexibility firms should undertake investments in the
improvement of their information systems used in purchasing. Such systems and processes should
involve databases to predict demand volatilities, to determine consequences for suppliers, and to
regularly and frequently share forecasting and planning information with suppliers. Consequently,
firms requiring higher levels of responsiveness must integrate their information systems with
suppliers and customers in the supply chain. Recent developments in digitization and big data
analytics can be fruitful areas to invest in order to foster sourcing flexibility (e.g., Sanders 2016).
7.3. Limitations and future research directions
We encountered certain limitations that are common in survey-based research. First, due to the
challenge of generating an even larger sample, we used the same data for measurement validation
and for testing the hypotheses, a compromise which is commonly accepted (e.g., Pagell and Krause
2004; Swafford, Ghosh, and Murthy 2006). Second, we did not collect data from multiple key
informants for assessing the construct items (i.e., to establish inter-rater reliability) (Wagner, Rau,
and Lindemann 2010). However, given the background and experience of the respondents and the
negative outcome of the common method bias test, we believe that this is not problematic. Third,
the performance measures solely rely on self-reported measures. Although, it is suggested that many
perceptual measures of organizational performance are comparable to objective measures (e.g.,
Dess and Robinson 1984), future research could augment our model with performance measures
from secondary data sources. Fourth, with our cross-sectional – as opposed to longitudinal –
research design, we cannot establish causality or comment on the evolution of the variables over

28
time. Fifth, measurement equivalence can be an issue in cross-national research (e.g., Malhotra and
Sharma 2008; Rungtusanatham, Ng, Zhao, and Lee 2008). We were not able to conduct a
measurement equivalence assessment using either a multi-country CFA or the generalizability
theory approach – which would be preferable – because the samples from France and the UK are
too small for such an analysis. However, we lessened this limitation by controlling for country
effects.
Future research could also expand our conceptual model and include other or additional
variables of interest in order to answer additional interesting questions. First, we focused on
sourcing flexibility. However, logistics flexibility and/or manufacturing flexibility might also have
explanatory power in terms of delivery performance and product financial performance, and could
be added in future studies. Second, future research could add other operational performance
outcomes – in addition to delivery performance – that might be influenced by sourcing flexibility
and that might impact product financial performance. Such additional variables would increase the
level of explained variance in product financial performance. Third, the ability of the buying firm to
ask for such flexibility from its suppliers will depend on power–dependence considerations in the
buyer-supplier relationship, the attractiveness of the buying firm’s business for the supplier, the
remuneration of the supplier for being flexible, or other incentives that can be given to the supplier.
This is of great interest, and we encourage the conceptualization and data collection on the buyer-
supplier dyad to shed light on such determinants of sourcing flexibility. Fourth, future research
could expand our model and add environmental uncertainty and demand uncertainty as additional
variables. Such variables would help to better understand the influence of sourcing flexibility under
different environmental conditions.
Despite its limitations and unanswered questions, our study is, to the best of our knowledge,
the first to establish the curvilinear relationship between sourcing flexibility and delivery

29
performance and to shed light on the determinants and outcomes of sourcing flexibility. In light of
the substantial amount of business outsourced to suppliers in today’s supply chains, the results of
this study should urge managers to take sourcing flexibility more frequently into account when
making supplier evaluation, selection and sourcing decisions. At the very least, it also should
stimulate future research for the investigated links.

30
References
Anand, K., Goyal, M. (2009). Strategic information management under leakage in a supply chain. Management Science, 55(3), 438-452.
Beamon, B.M. (1999). Measuring supply chain performance. International Journal of Operations & Production Management, 19(3), 275-292.
Bensaou, B.M., Venkatraman, V.N. (1995). Configurations of interorganizational relationships: A comparison between US and Japanese automakers. Management Science, 41(9), 1471-1492.
Bode, C., Wagner, S.M., Petersen, K.J., Ellram, L.M. (2011). Understanding responses to supply chain disruptions: Insights from information processing and resource dependence perspectives. Academy of Management Journal, 54(4), 833-856.
Bollen, K.A., Lennox, R. (1991). Conventional wisdom on measurement: A structural equation perspective. Psychological Bulletin, 110(2), 305-314.
Bosch (2016). Logistics supplier manual (Version 4.0). Stuttgart: Robert Bosch GmbH. Boudette, N.E. (2018). Tesla says production of new mass-market car is lagging. The New York
Times, January 2, 2018, p. 4. Bouquet, C., Crane A., Deutsch, Y. (2009). The trouble with being average. MIT Sloan
Management Review, 50(3), 79-80. Boyer, K.K., Lewis, M.W. (2002). Competitive priorities: Investigating the need for trade-offs in
operations strategy. Production and Operations Management, 11(1), 9-20. Brandon-Jones, E., Squire, B., Van Rossenberg, Y.G.T. (2015). The impact of supply base
complexity on disruptions and performance: The moderating effects of slack and visibility. International Journal of Production Research, 53(22), 6903-6918.
Busse, C., Meinlschmidt, J., Foerstl, K. (2017). Managing information processing needs in global supply chains: A prerequisite to sustainable supply chain management. Journal of Supply Chain Management, 53(1), 87-113.
Chen, C.-T., Lin, C.-T., Huang, S.-F. (2006). A fuzzy approach for supplier evaluation and selection in supply chain management. International Journal of Production Economics, 102(2), 289-301.
Chiang, C.-Y., Kocabasoglu-Hillmer, C., Suresh, N. (2012). An empirical investigation of the impact of strategic sourcing and flexibility on firm’s supply chain agility. International Journal of Operations & Production Management, 32(1), 49-78.
Chin, W.W. (1998). The partial least squares approach for structural equation modeling. In G.A. Marcoulides, (Ed.), Modern methods for business research. Mahwah, NJ: Lawrence Erlbaum Associates, 295-336.
Chopra, S., Meindl, P. (2016). Supply chain management: Strategy, planning, and operation (6th ed.). Harlow, UK: Pearson Education.
Clark, N. (2010). EADS adds write-off for A400M. The International Herald Tribune, March 6, 2010, p. 10.
Clemons, E.K., Reddi, S.P., Row, M.C. (1993). The impact of information technology on the organization activity: The move to the middle hypothesis. Journal of Management Information Systems, 10(2), 9-35.
Cohen, J., Cohen, P., West, S.G., Aiken, L.S. (2003), Applied multiple regression/correlation analysis for the behavioral sciences (3rd ed.). Hillsdale, NJ: Erlbaum.
31
Cronbach, L.J. (1951). Coefficient alpha and the internal structure of tests. Psychometrika, 16(3), 297-334.
Croson, R., Donohue, K. (2003). Impact of POS data sharing on supply chain management: An experimental study. Production and Operations Management, 12(1), 1-11.
Davis-Sramek, B., Mentzer, J.T., Stank, T.P. (2008). Creating consumer durable retailer customer loyalty through order fulfillment service operations. Journal of Operations Management 26(6), 781-797.
Dess, G.G., Davis, P.S. (1984). Porter’s (1980) generic strategies as determinants of strategic group membership and organizational performance. Academy of Management Journal, 27(3), 467-488.
Dess, G.G., Robinson Jr., R.B. (1984). Measuring organizational performance in the absence of objective measures: The case of the privately-held firm and conglomerate business unit. Strategic Management Journal, 5(3), 265-273.
Diamantopoulos, A., Siguaw, J.A. (2006). Formative versus reflective indicators in organizational measure development: A comparison and empirical illustration. British Journal of Management, 17(4), 263-282.
Dillman, D.A., Smyth, J.D., Christian, L.M. (2009). Internet, mail, and mixed-mode surveys: The tailored design method (3rd ed.). Hoboken, NJ: John Wiley & Sons.
Ellinger, A.E., Natarajarathinam, M., Adams, F.G., Gray, J.B., Hofman, D., O’Marah, K. (2011). Supply chain management competency and firm financial success. Journal of Business Logistics, 32(3), 214-226.
Esposito Vinzi, V., Chin, W.W., Henseler, J., Wang, H. (2010) (Eds.). Handbook of partial least squares: Concepts, methods and applications (Springer handbooks of computational statistics). Berlin: Springer.
Fantazy, K.A., Kumar, V., Kumar, U. (2009). An empirical study of the relationships among strategy, flexibility, and performance in the supply chain context. Supply Chain Management: An International Journal, 14(3), 177-188.
Fayezi, S., Zutshi, A., O’Loughlin, A. (2016). Understanding and development of supply chain agility and flexibility: A structured literature review. International Journal of Management Reviews, in press.
Flynn, B., Flynn, E. (1999). Information-processing alternative for coping with manufacturing environment complexity. Decision Sciences, 30(4), 1021-1052.
Fornell, C., Larcker, D.F. (1981). Evaluating structural equation models with unobservable variables and measurement error. Journal of Marketing Research, 18(1), 39-50.
Frohlich, M.T., Westbrook, R. (2001). Arcs of integration: An international study of supply chain strategies. Journal of Operations Management, 19(2), 185-200.
Fugate, B.S., Mentzer, J.T., Stank, T.P. (2010). Logistics performance: Efficiency, effectiveness and differentiation. Journal of Business Logistics, 31(1), 43-62.
Galbraith, J.R. (1973). Designing complex organizations. Reading, MA: Addison-Wes1ey. Galbraith, J.R. (1974). Organization design: An information processing view. Interfaces, 4(3), 28-
36. Gattiker, T.F. (2007). Enterprise resource planning (ERP) systems and manufacturing-marketing
interface: An information-processing theory view. International Journal of Production Research, 45(13), 2895-2917.
32
Gosling, J., Purvis, L., Naim, M.M. (2010). Supply chain flexibility as a determinant of supplier selection. International Journal of Production Economics, 128(1), 11-21.
Götz, O., Liehr-Gobbers, K., Krafft, M. (2010). Evaluation of structural equation models using the partial least squares (PLS) approach. In: V. Esposito Vinzi, W.W. Chin, J. Henseler, H. Wang (Eds.), Handbook of partial least squares: Concepts, methods and applications (Springer handbooks of computational statistics). Berlin: Springer, 691-711.
Graves, S.C., Tomlin, B.T. (2003). Process flexibility in supply chains. Management Science 49(7), 907-919.
Hair, J.F. Jr., Black, W.C., Babin, B., Anderson, R.E. (2010). Multivariate data analysis (7th ed.). Upper Saddle River, NJ: Prentice Hall.
Hair, J.F. Jr., Hult, G.T.M., Ringle, C., Sarstedt, M. (2014). A primer on partial least squares structural equation modeling (PLS-SEM). Thousand Oaks, CA: Sage Publications.
Hair, J.F. Jr., Sarstedt, M., Ringle, C.M., Mena, J.A. (2012). An assessment of the use of partial least squares structural equation modeling in marketing research. Journal of the Academy of Marketing Science, 40(3), 414-433.
Hair, J.F., Ringle, C.M., Sarstedt, M. (2011). PLS-SEM: Indeed a silver bullet. Journal of Marketing Theory and Practice, 19(2), 139-152.
Hausman, W.H., Thorbeck, J.S. (2010). Fast fashion: Quantifying the benefits. In: T.C.E. Cheng, T.-M. Choi (Eds.). Innovative quick response programs in logistics and supply chain management (International handbooks on information systems book series). New York: Springer, 315-329.
Hensley, R.L. (1999). A review of operations management studies using scale development techniques. Journal of Operations Management, 17(3), 343-358.
Hill, C.A., Scudder, G.D. (2002). The use of electronic data interchange for supply chain coordination in the food industry. Journal of Operations Management, 20(4), 375-387.
Ho, W., Xu, X., Dey, P. K. (2010). Multi-criteria decision making approaches for supplier evaluation and selection: A literature review. European Journal of Operational Research, 202(1), 16-24.
Holland, C.P., Lockett, G. (1997). Mixed mode network structures: The strategic use of electronic communication by organizations. Organization Science, 8(5), 475-488.
Hong, Y., Hartley, J.L. (2011). Managing the supplier-supplier interface in product development: The moderating role of technological newness. Journal of Supply Chain Management, 47(3), 43-62.
Hora, M., Bapuji, H., Roth, A.V. (2011). Safety hazard and time to recall: The role of recall strategy, product defect type, and supply chain player in the U.S. toy industry. Journal of Operations Management, 29(7-8), 766-777.
Hsu, C.-C., Kannan, V.R., Leong, G.K., Tan, K.-C. (2006). Supplier selection construct: Instrument development and validation. International Journal of Logistics Management, 17(2), 213-239.
Hulland, J. (1999). Use of partial least squares (PLS) in strategic management research: A review of four recent studies. Strategic Management Journal, 20(2), 195-204.
Hult, G.T.M., Ketchen, D.J. Jr., Slater, S.F. (2004). Information processing, knowledge development, and strategic supply chain performance. Academy of Management Journal, 47(2), April, 241-253.

33
Jack, E., Raturi, A. (2002). Sources of volume flexibility and their impact on performance. Journal of Operations Management, 20(5), 519-548.
Jaworski, B.J., Kohli, A.K. (1993). Market orientation: Antecedents and consequences. Journal of Marketing, 57(3), 53-70.
Joshi, A.W., Sharma, S. (2004). Customer knowledge development: Antecedents and impact on new product performance. Journal of Marketing, 68(4), 47-59.
Kannan, V.R., Tan, K.C. (2002). Supplier selection and assessment: Their impact on business performance. Journal of Supply Chain Management, 38(3), 11-21.
Kannan, V.R., Tan, K.C. (2006). Buyer-supplier relationships: The impact of supplier selection and buyer-supplier engagement on relationship and firm performance. International Journal of Physical Distribution & Logistics Management, 36(10), 755-775.
Kempf, K.G., Erhun, F., Hertzler, E.F., Rosenberg, T.R., Peng, C. (2013). Optimizing capital investment decisions at Intel Corporation. Interfaces, 43(1), 62-78.
Khan K, A., Pillania, R.K. (2008). Strategic sourcing for supply chain agility and firms’ performance: A study of Indian manufacturing sector. Management Decision, 46(10), 1508-1530.
Kim, M., Chai, S. (2017). The impact of supplier innovativeness, information sharing and strategic sourcing on improving supply chain agility: Global supply chain perspective. International Journal of Production Economics, 187, 42-52.
Koufteros, X., Vickery, S.K., Dröge, C. (2012). The effects of strategic supplier selection on buyer competitive performance in matched domains: Does supplier integration mediate the relationships? Journal of Supply Chain Management, 48(2), 93-115.
Krause, D.R., Pagell, M., Curkovic, S. (2001). Toward a measure of competitive priorities for purchasing. Journal of Operations Management 19(4), 497-512.
Kroes, J.R., Ghosh, S. (2010). Outsourcing congruence with competitive priorities: Impact on supply chain and firm performance. Journal of Operations Management, 28(2), 124-143.
Kumar, P., Singh, R.K., Kumar, R. (2017). An integrated framework of interpretive structural modeling and graph theory matrix approach to fix the agility index of an automobile manufacturing organization. International Journal of System Assurance Engineering and Management, 8(Supplement 1), 342-352.
Lee, H.L. (2004). The triple-A supply chain. Harvard Business Review, 82(1), 102-112. Lee, H.L., Padmanabhan, P., Whang, S. (1997). Bullwhip effect in a supply chain. MIT Sloan
Management Review, 38(4), 93-102. Luzzini, D., Caniato, F., Spina, G. (2014). Designing vendor evaluation systems: An empirical
analysis. Journal of Purchasing & Supply Management, 20(2), 113-129. Malhotra, M.K., Mackelprang, A.W. (2012). Are internal manufacturing and external supply chain
flexibilities complementary capabilities? Journal of Operations Management, 30(3), 180-200. Malhotra, M.K., Sharma, S. (2008). Measurement equivalence using generalizability theory: An
examination of manufacturing flexibility dimensions. Decision Sciences, 39(4), 643-669. Manders, J.H.M., Caniëls, M.C.J., Ghijsen, P.W.T. (2016). Exploring supply chain flexibility in a
FMCG food supply chain. Journal of Purchasing & Supply Management, 22(3), 181-195. Mendonça Tachizawa, M., Giménez Thomsen, C. (2007). Drivers and sources of supply flexibility:
An exploratory study. International Journal of Operations & Production Management, 27(10), 1115-1136.

34
Mohr, J.J., Nevin, J.R. (1990). Communication strategies in marketing channels: A theoretical perspective. Journal of Marketing, 54(4), 36-51.
Moon, K.K.-L., Yi, C.Y., Ngai, E.W.T. (2012). An instrument for measuring supply chain flexibility for the textile and clothing companies. European Journal of Operational Research 222(2), 191-203.
More, D., Babu, A.S. (2009). Supply chain flexibility: A state-of-the-art survey. International Journal of Services and Operations Management, 5(1), 29-65.
Murray, J.Y., Kotabe, M., Wildt, A.R. (1995). Strategic and financial performance implications of global sourcing strategy: A contingency analysis. Journal of International Business Studies, 26(1), 181-202.
Narasimhan, R., Das, A. (1999). An empirical investigation of the contribution of strategic sourcing to manufacturing flexibilities and performance. Decision Sciences, 30(3), 683-718.
Narasimhan, R., Das, A. (2000). An empirical examination of sourcing’s role in developing manufacturing flexibilities. International Journal of Production Research, 38(4), 875-893.
Narasimhan, R., Jayaram, J., Carter, J.R. (2001). An empirical examination of the underlying dimensions of purchasing competence. Production and Operations Management, 10(1), 1-15.
Pagell, M., Krause, D.R. (2004). Re-exploring the relationship between flexibility and the external environment. Journal of Operations Management, 21(6), 629-649.
Paulraj, A., Lado, A.A., Chen, I.J. (2008). Inter-organizational communication as a relational competency: Antecedents and performance outcomes in collaborative buyer-supplier relationships. Journal of Operations Management, 26(1), 45-64.
Pawar, K., Rogers, H. (2013). Contextualising the holistic cost of uncertainty in outsourcing manufacturing supply chains. Production Planning & Control, 24(7), 607-620.
Pei, P.P.-E., Simchi-Levi, D., Tunca, T.I. (2011). Sourcing flexibility, spot trading, and procurement contract structure. Operations Research, 59(3), 578-601.
Peng, C., Erhun, F., Hertzler, E.F., Kempf, K.G. (2012). Capacity planning in the semiconductor industry: Dual-mode procurement with options. Manufacturing & Service Operations Management, 14(2), 170-185.
Peng, D.X., Lai, F. (2012). Using partial least squares in operations management research: A practical guideline and summary of past research. Journal of Operations Management, 30(6), 467-480.
Podsakoff, P.M., Organ, D.W. (1986). Self-reports in organizational research: Problems and prospects. Journal of Management, 12(4), 531-544.
Power, D., Schoenherr, T., Samson, D. (2010). The cultural characteristic of individualism/collectivism: A comparative study of implications for investment in operations between emerging Asian and industrialized Western countries. Journal of Operations Management, 28(3), 206-222.
Premkumar, G., Ramamurthy, K., Saunders, C.S. (2005). Information processing view of organizations: An exploratory examination of fit in the context of interorganizational relationships. Journal of Management Information Systems, 22(1), 257-294.
Pujawan, I.N. (2004). Assessing supply chain flexibility: A conceptual framework and case study. International Journal of Integrated Supply Management, 1(1), 79-97.

35
Purvis, L., Gosling, J., Naim, M.M. (2014). The development of a lean, agile and leagile supply network taxonomy based on differing types of flexibility. International Journal of Production Economics, 151, 100-111.
Qrunfleh, S., Tarafdar, M. (2014). Supply chain information systems strategy: Impacts on supply chain performance and firm performance. International Journal of Production Economics, 147, Part B, 340-350.
Reinartz, W., Haenlein, M., Henseler, J. (2009). An empirical comparison of the efficacy of covariance-based and variance-based SEM. International Journal of Research in Marketing, 26(4), 332-344.
Rodrigues, A.M., Stank, T.P., Lynch, D.F. (2004). Linking strategy, structure, process, and performance in integrated logistics. Journal of Business Logistics, 25(2), 65-94.
Rungtusanatham, M., Ng, C.H., Zhao, X., Lee, T.S. (2008). Pooling data across transparently different groups of key informants: Measurement equivalence and survey research. Decision Sciences, 39(1) 115-145.
Saeed, K.A., Malhotra, M.K., Grover, V. (2005). Examining the impact of interorganizational systems on process efficiency and sourcing leverage in buyer-supplier dyads. Decision Sciences, 36(3), 365-396.
Sánchez, A.M., Pérez, M.P. (2005). Supply chain flexibility and firm performance: A conceptual model and empirical study in the automotive industry. International Journal of Operations & Production Management, 25(7), 681-700.
Sanders, N.R. (2005). IT alignment in supply chain relationships: A study of supplier benefits. Journal of Supply Chain Management, 41(2), 4-13.
Sanders, N.R. (2016). How to use big data to drive your supply chain. California Management Review, 58(3), 26-48.
Saraf, N., Langdon, C.S., Gosain, S. (2007). IS application capabilities and relational value in inter-firm partnerships. Information Systems Research, 18(3), 320-339.
Schaffer, B.S., Riordan, C.M. (2003). A review of cross-cultural methodologies for organizational research: A best-practices approach. Organizational Research Methods, 6(2), 169-215.
Schneider, J., Hall, J. (2011). Why most product launches fail. Harvard Business Review, 89(4), 21-23.
Schoenherr, T., Modi, S.B., Benton, W.C., Carter, C.R., Choi, T.Y., Larson, P.D., Leenders, M.R., Mabert, V.A., Narasimhan, R., Wagner, S.M. (2012). Research opportunities in purchasing and supply management. International Journal of Production Research, 50(16), 4556-4579.
Seebacher, G., Winkler, H. (2013). A citation analysis of the research on manufacturing and supply chain flexibility. International Journal of Production Research, 51(11), 3415-3427.
Singh, R., Acharya, P. (2013). Supply chain flexibility: A frame work of research dimensions. Global Journal of Flexible Systems Management, 14(3), 157-166.
Snyder, L.V., Scaparra, M.P., Daskin, M.S., Church, R.L. (2014). Planning for disruptions in supply chain networks. In INFORMS Tutorials in Operations Research, October 2014, 234-257.
Sodhi, M.S., Tang, C.S. (2012). Application: Mitigating new product development risks – The case of the Boeing 787 Dreamliner. In M.S. Sodhi, C.S. Tang, (Eds.), Managing supply chain risk (International series in operations research & management science, Vol. 172). New York, NY: Springer, 161-179.

36
Song, L.Z., Song, M., Di Benedetto, C.A. (2011). Resources, supplier investment, product launch advantages, and first product performance. Journal of Operations Management, 29(1-2), 86-104.
Spina, G., Caniato, F., Luzzini, D., Ronchi, S. (2016). Assessing the use of external grand theories in purchasing and supply management research. Journal of Purchasing & Supply Management, 22(1), 18-30.
Sreedevi, R., Saranga, H. (2017). Uncertainty and supply chain risk: The moderating role of supply chain flexibility in risk mitigation. International Journal of Production Economics, 193, 332-342.
Srinivasan, R., Swink, M. (2005). Leveraging supply chain integration through planning comprehensiveness: An organizational information processing theory perspective. Decision Sciences, 46(5), 823-861.
Stevenson, M., Spring, M. (2007). Flexibility from a supply chain perspective: Definition and review. International Journal of Operations & Production Management, 27(7), 685-713.
Suarez, F.F., Cusumano, M.A., Fine, C.H. (1996). An empirical study of manufacturing flexibility in printed circuit board assembly. Operations Research, 44(l), 223-240.
Swafford, P.M., Ghosh, S., Murthy, N. (2006). Antecedents of supply chain agility of a firm: Scale development and model testing. Journal of Operations Management, 24(2), 170-188.
Swamidass, P.M., Newell, W.T. (1987). Manufacturing strategy, environmental uncertainty and performance: A path analytic model. Management Science, 33(4), 509-524.
Swink, M., Schoenherr, T. (2015). The effects of cross-functional integration on profitability, process efficiency, and asset productivity. Journal of Business Logistics, 36(1), 69-87.
Tang, C.S., Tomlin, B.T. (2008). The power of flexibility for mitigating supply chain risks. International Journal of Production Economics, 116(1), 12-27.
Tenhiälä, A., Ketokivi, M. (2012). Order management in the customization-responsiveness squeeze. Decision Sciences, 43(1), 173-206.
Tiwari, A.K., Tiwari, A., Samuel, C. (2015). Supply chain flexibility: A comprehensive review. Management Research Review, 38(8), 767-792.
Tse, Y.K., Tan, K.H. (2011). Managing product quality risk in a multi-tier global supply chain. International Journal of Production Research, 49(1), 139-158.
Tushman, M.L. (1978). Technical communication in R&D laboratories: The impact of project work characteristics. Academy of Management Journal, 21(4), 624-645.
Tushman, M.L., Nadler, D.A. (1978). Information processing as an integrating concept in organizational design. Academy of Management Review, 3(3), 613-624.
van Weele, A.J. (2014). Purchasing and supply chain management: Analysis, strategy, planning and practice (6th ed.). Andover: Cengage Learning.
Vickery, S.K, Jayaram, J., Droge, C, Calantone, R. (2003). The effects of an integrative supply chain strategy on customer service and financial performance: An analysis of direct versus indirect relationships. Journal of Operations Management, 21(5), 523-539.
Vokurka, R.J., Choobineh, J., Vadi, L. (1996). A prototype expert system for the evaluation and selection of potential suppliers. International Journal of Operations and Production Management, 16(12), 106-127.

37
Vonderembse, M.A., Tracey, M. (1999). The impact of supplier selection criteria and supplier involvement on manufacturing performance. Journal of Supply Chain Management, 35(2), 33-39.
Wacker, J.G. (2004). A theory of formal conceptual definitions: Developing theory-building measurement instruments. Journal of Operations Management, 22(6), 629-650.
Wagner, S.M., Grosse-Ruyken, P.T., Erhun, F. (2012). The link between supply chain fit and financial performance of the firm. Journal of Operations Management, 30(4), 340-353.
Wagner, S.M., Kemmerling, R. (2010). Handling nonresponse in logistics research. Journal of Business Logistics, 31(2), 357-381.
Wagner, S.M., Rau, C., Lindemann, E. (2010). Multiple informant methodology: A critical review and recommendations. Sociological Methods & Research, 38(4), 582-618.
Wainwright, D., Waring, T. (2004). Three domains for implementing integrated information systems: redressing the balance between technology, strategic and organisational analysis. International Journal of Information Management, 24(4), 329-346.
Wang, E.T.G., Wei, H.-L. (2007). Interorganizational governance value creation: Coordinating for information visibility and flexibility in supply chains. Decision Sciences, 38(4), 647-674.
Ward, P.T., McCreery, J.K., Ritzman, L.P., Sharma, D. (1998). Competitive priorities in operations management. Decision Sciences, 29(4), 1035-1046.
Wu, T., Blackhurst, J. (2009). Supplier evaluation and selection: An augmented DEA approach, International Journal of Production Research, 47(16), 4593-4608.
Yan, T., Dooley, K. (2014). Buyer-supplier collaboration quality in new product development projects. Journal of Supply Chain Management, 50(2), 59-83.
Yao, Y., Dresner, M. Palmer, J.W. (2009). Impact of boundary-spanning information technology and position in chain and firm performance. Journal of Supply Chain Management, 45(4), 3-16.
Yi, C.Y., Ngai, E.W.T., Moon, K.K.-L. (2011). Supply chain flexibility in an uncertain environment: Exploratory findings from five case studies. Supply Chain Management: An International Journal, 16(4), 271-283.
Zhou, H. (2013). An empirical test of the information processing theory. In: J. Wang (Ed.), Management innovations for intelligent supply chains. Hershey, PA: Business Science Reference, 66-81.
Zokaei, K., Hines, P. (2007). Achieving consumer focus in supply chains. International Journal of Physical Distribution & Logistics Management, 37(3), 223-247.

38
FIGURES
Figure 1. Conceptual model
Note. (+) indicates a positive relationship and (U) refers to a curvilinear (U-shaped) relationship. TABLES
Table 1. Descriptive statistics and correlations
Mean SD (1) (2) (3) (4) (5) (6) (7) (8) (9) (10) (1) SES 4.03 0.59 n/a 0.115 0.182 0.002 0.003 0.024 0.000 0.018 0.009 0.003 (2) ISI 3.62 0.81 0.338 0.690 0.104 0.000 0.005 0.014 0.014 0.000 0.020 0.013 (3) SF 2.97 0.66 0.427 0.322 0.517 0.042 0.002 0.015 0.000 0.000 0.010 0.001 (4) DP 3.53 0.59 -0.045 -0.021 -0.206 0.598 0.117 0.041 0.000 0.051 0.003 0.003 (5) PFP 3.46 0.70 0.053 0.074 -0.043 0.342 0.632 0.047 0.003 0.012 0.001 0.000 (6) CI 3.48 0.77 0.156 0.117 0.121 -0.202 -0.216 0.509 0.005 0.003 0.002 0.006 (7) FS 17,881 45,769 0.004 0.119 -0.012 0.002 0.057 0.072 1.000 0.002 0.006 0.006 (8) C-F n/a n/a -0.134 0.003 0.010 -0.226 -0.110 0.056 0.046 1.000 0.134 0.009 (9) C-G n/a n/a 0.094 0.142 0.101 0.058 0.028 -0.042 0.079 -0.367 1.000 0.046 (10) C-UK n/a n/a 0.058 -0.113 -0.031 -0.052 -0.001 -0.076 -0.080 -0.097 -0.214 1.000
Note. N = 336; Pearson correlation coefficients are below the diagonal; diagonal contains AVE values (in bold); squared correlations (shared variance) are above the diagonal (in italics).
Abbreviations: SES: Supplier evaluation and selection, ISI: Information systems integration, SF: Sourcing flexibility, DP: Delivery performance, PFP: Product financial performance, CI: Competitive intensity, FS: Firm size, C-F: Country France, C-G: German-speaking countries, C-UK: Country UK.
Supplier evaluation
and selectionDelivery
performance
Product financial
performanceInformation systems
integration
Sourcing flexibility
H2 (+)
H1 (+)
H4 (+)H3 (U)
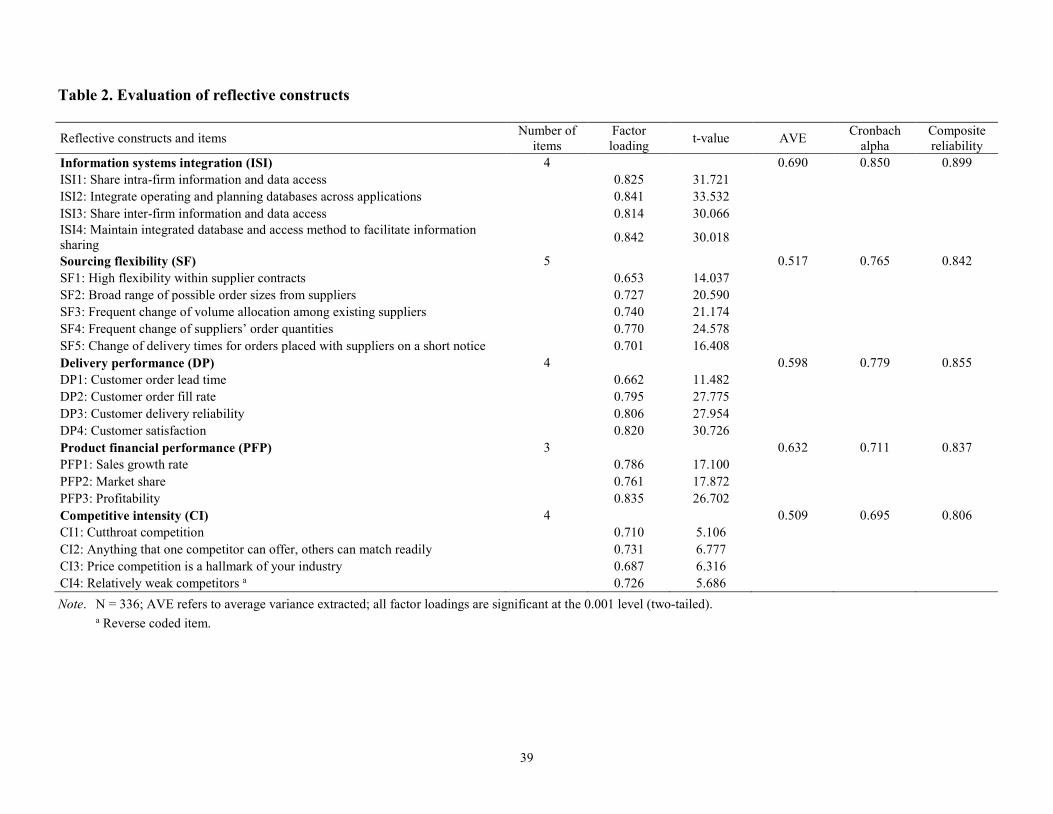
39
Table 2. Evaluation of reflective constructs
Reflective constructs and items Number of items
Factor loading t-value AVE Cronbach
alpha Composite reliability
Information systems integration (ISI) 4 0.690 0.850 0.899 ISI1: Share intra-firm information and data access 0.825 31.721 ISI2: Integrate operating and planning databases across applications 0.841 33.532 ISI3: Share inter-firm information and data access 0.814 30.066 ISI4: Maintain integrated database and access method to facilitate information sharing 0.842 30.018
Sourcing flexibility (SF) 5 0.517 0.765 0.842 SF1: High flexibility within supplier contracts 0.653 14.037 SF2: Broad range of possible order sizes from suppliers 0.727 20.590 SF3: Frequent change of volume allocation among existing suppliers 0.740 21.174 SF4: Frequent change of suppliers’ order quantities 0.770 24.578 SF5: Change of delivery times for orders placed with suppliers on a short notice 0.701 16.408 Delivery performance (DP) 4 0.598 0.779 0.855 DP1: Customer order lead time 0.662 11.482 DP2: Customer order fill rate 0.795 27.775 DP3: Customer delivery reliability 0.806 27.954 DP4: Customer satisfaction 0.820 30.726 Product financial performance (PFP) 3 0.632 0.711 0.837 PFP1: Sales growth rate 0.786 17.100 PFP2: Market share 0.761 17.872 PFP3: Profitability 0.835 26.702 Competitive intensity (CI) 4 0.509 0.695 0.806 CI1: Cutthroat competition 0.710 5.106 CI2: Anything that one competitor can offer, others can match readily 0.731 6.777 CI3: Price competition is a hallmark of your industry 0.687 6.316 CI4: Relatively weak competitors a 0.726 5.686 Note. N = 336; AVE refers to average variance extracted; all factor loadings are significant at the 0.001 level (two-tailed). a Reverse coded item.

40
Table 3. Evaluation of formative construct
Formative construct and items Number of items Factor weight t-value
Variance inflation
factor (VIF)
Condition index
Supplier evaluation and selection (SES) 4 SES1: Cost 0.762 9.064 1.070 8.477 SES2: Quality 0.308 2.271 1.379 12.030 SES3: Service -0.043 0.310 1.407 16.053 SES4: Innovativeness 0.387 3.165 1.166 21.670
Note. N = 336. Table 4. Results of the hierarchical regression analysis
Independent variables Dependent variable: Delivery performance Model 1 Model 2 Model 3 β SE β SE β SE Control variables Competitive intensity -0.177 *** (0.032) -0.152 ** (0.031) -0.166 *** (0.029) Firm size 0.030 (0.032) 0.023 (0.031) 0.050 (0.029) Country France -0.412 *** (0.098) -0.396 *** (0.097) -0.323 *** (0.090) Country Germany -0.076 (0.071) -0.048 (0.070) -0.054 (0.064) Country UK -0.274 † (0.145) -0.270 † (0.143) -0.225 † (0.132) Sourcing flexibility -0.177 *** (0.031) -0.089 † (0.030) (Sourcing flexibility)2 0.383 *** (0.024) R2 0.087 0.117 0.254 R2 change 0.087 *** 0.030 *** 0.136 *** F 6.298 *** 7.284 *** 15.929 ***
Note. N = 336; reported estimates β refer to standardized (except for dummy variables) regression coefficients; standard errors SE in parentheses. *** Significant at the 0.001 level; ** Significant at the 0.01 level; * Significant at the 0.05 level; † Significant at the 0.1 level.
Table 5. Summary of quality criteria, coefficients and t-values of hypotheses
Structural relationships R2 Q2 f2 β t-value Support of hypothesis
Supplier evaluation and selection Sourcing
flexibility a 0.230 0.117 0.138 0.361*** 6.652 H1: yes
Information systems integration Sourcing
flexibility a 0.038 0.189*** 3.531 H2: yes
(Sourcing flexibility)2 Delivery
performance b 0.254 n/a 0.184 0.383*** 7.744 H3: yes
Delivery performance Product financial
performance a 0.130 0.080 0.149 0.301*** 6.067 H4: yes
Note. N = 336; *** Significant at the 0.001 level. a From PLS analysis. b From hierarchical regression analysis.

APPENDIX
A-1. Sample description
Industry sector n % Aerospace & defense 25 7.4 Automotive & parts 33 9.8 Chemicals 24 7.1 Construction & materials 20 6.0 Electricity 5 1.5 Electronic & electrical equipment 29 8.6 Food & beverages 25 7.4 Forestry & paper 7 2.1 Household goods & personal goods 31 9.2 Industrial metals 13 3.9 Machinery & plant construction 28 8.3 Medical equipment 11 3.3 Mining 4 1.2 Oil & gas 8 2.4 Pharmaceuticals & biotechnology 12 3.6 Technology hardware & equipment 21 6.2 Textiles & apparel 14 4.2 Others 8 2.4 n/a 18 5.4 Number of employees n % <100 29 8.6 100-499 42 12.5 500-999 27 8.0 1,000-4,999 60 17.9 5,000-9,999 43 12.8 > 10,000 133 39.6 n/a 2 0.6 Country n % France 48 14.3 Germany/Austria/Switzerland 150 44.6 UK 18 5.4 USA 120 35.7 Respondent job titles n % CxO/Vice president 62 18.4 Director/Department head 154 45.8 Manager 96 28.6 Team leader 19 5.7 Others 5 1.5 Respondent areas of responsibility n % Supply chain management 124 36.9 General management 89 26.5 Logistics 59 17.6 Purchasing 32 9.5 Production/manufacturing 27 8.0 Others 5 1.5
Note. N = 336.

A-2. Constructs and questionnaire items
Supplier evaluation and selection (adapted from Hsu, Kannan, Leong, and Tan, 2006; Krause, Pagell, and Curkovic, 2001), (scale anchors 1 = “not important at all” – 5 = “extremely important”). Please indicate the importance of the following criteria for the evaluation and selection of suppliers for the main product line: Cost Quality Service Innovativeness Information systems integration (adapted from Rodrigues, Stank, and Lynch (2004), (scale anchors 1 = “not important at all” – 5 = “extremely important”). Please indicate the information system-related strategic supply chain priorities for the main product line: Share intra-firm information and data access Integrate operating and planning databases across applications Share inter-firm information and data access Maintain integrated database and access method to facilitate information sharing Sourcing flexibility (adapted from Swafford, Ghosh, and Murthy, 2006; Narasimhan and Das 1999), (scale anchors 1 = “not important at all” – 5 = “extremely important”). Please indicate the sourcing-related strategic supply chain priorities for the main product line: High flexibility within supplier contracts Broad range of possible order sizes from suppliers Frequent change of volume allocation among existing suppliers Frequent change of suppliers’ order quantities Change of delivery times for orders placed with suppliers on a short notice Delivery performance (adapted from Malhotra and Mackelprang, 2012; Power, Schoenherr, and Samson, 2010), (scale anchors 1 = “much worse” – 5 = “much better”). Relative to the comparable products of your main competitor, please indicate the supply chain performance of the main product line: Customer order lead time Customer order fill rate Customer delivery reliability Customer satisfaction Product financial performance (adopted from Joshi and Sharma, 2004; Song, Song, and Di Benedetto, 2011). Relative to the comparable products of your main competitor, please indicate the performance of the main product line: Sales growth rate (scale anchors 1 = “much slower growth rate” – 5 = “much faster growth rate”) Market share (scale anchors 1 = “much lower market share” – 5 = “much greater market share”) Profitability (scale anchors 1 = “much less profitable” – 5 = “much more profitable”) Competitive intensity (adapted from Jaworski and Kohli 1993), (scale anchors 1 = “strongly disagree” – 5 = “strongly agree”). Please indicate the competitive intensity of the main product line: Cutthroat competition Anything that one competitor can offer, others can match readily Price competition is a hallmark of your industry Relatively weak competitors a Note. Unit of analysis is the main product line defined as the current sales (revenue) driver of the firm; all items were
measured on five-point Likert-type rating scales. a Reverse coded item.
Copyright © 2022 FDOKUMEN