
Conformational Flexibility, UV−Induced Decarbonylation, and FTIR Spectra of 1Phenyl1,2...
11
Conformational Flexibility, UV-Induced Decarbonylation, and FTIR Spectra of 1-Phenyl-1,2 Propanedione in Solid Xenon and in the Low Temperature Amorphous Phase Susy Lopes, ² Andrea Go ´ mez-Zavaglia, ²,‡ Leszek Lapinski, § and Rui Fausto* ,² Department of Chemistry, UniVersity of Coimbra, P-3004-535 Coimbra, Portugal, Faculdad de Farmacia y Bioquı ´mica, UniVersidad de Buenos Aires, Junı ´n 956, 1113 Buenos Aires, Argentina, and Institute of Physics of the Polish Academy of Sciences, Al. Lotnikow 32/46, 02-668 Warsaw, Poland ReceiVed: December 15, 2004; In Final Form: March 14, 2005 1-Phenyl-1,2-propanedione has been isolated in low-temperature xenon matrixes and studied by FTIR spectroscopy, supported by DFT(B3LYP)/6-311++G(d,p) calculations. In good agreement with previous electron diffraction data [Shen, Q.; Hagen, K. J. Phys. Chem. 1993, 97, 985], the calculations predicted the existence of only one stable conformation for the compound, in which the OdCsCdO dihedral angle is 135.6°. On the other hand, the experimental data clearly reveals that, in the as-deposited xenon matrixes (T ) 20 K), there is a distribution of molecules with different OdCsCdO dihedral angles around the equilibrium value. This distribution results from the efficient trapping of the conformational distribution existing in the gas phase, prior to deposition, which is determined by the low frequency, large amplitude torsional vibration around the C-C central bond. Upon annealing to higher temperatures (T ∼ 45 K), the initially trapped conformational distribution can be modified in a certain degree, favoring more polar structures (corresponding to smaller OdCsCdO dihedral angles), as a result of the interactions with the matrix media. Irradiation of the matrix with UV light (λ > 235 nm) led to decarbonylation of the compound, with generation of acetophenone and carbon monoxide, with an almost complete consumption of the reagent after 1100 min of irradiation (k ) 2.8 × 10 -2 min. -1 ). Aggregation of the compound resulting from the matrix warming was also investigated, providing useful information for interpretation of the spectroscopic data obtained for the low-temperature amorphous state of the neat compound. Introduction R-Dicarbonyl compounds have been the subject of extensive research due to their important applications. 1-4 1-Phenyl-1,2- propanedione (PPD) receives practical use as photosensitizer for photopolymerization of visible light-cured dental resin composites 5-7 and as photoinitiator for the photo-cross-linking of waterborne latex paints, 8 being also a common reactant in asymmetric synthesis. 9-27 Enantioselective hydrogenation of PPD has been used for production of R-hydroxy carbonyl compounds and diols, 9-27 which are utilized in the synthesis of many biologically relevant substances, such as, for example, ephedrine and pseudoephedrine. 28-30 The conditions to carry out this reaction have been the matter of several reports: it has been performed using heterogeneous catalysis in different solvents, oxygenation conditions and in the presence or absence of ultrasonic irradiation, 9-21 by using bakers yeast as reducing agent, 22-25 pollarographically, 26 and metabolically in vivo. 27 PPD has also been used, together with methylguanidine, as reagents to produce 4H-imidazole rings. 31 From a more fundamental point of view, R-dicarbonyl compounds have deserved much attention due to the photo- rotamerism they frequently exhibit. 32-37 These compounds have been found to be considerably flexible, and the large amplitude, low-frequency vibrational mode associated with the OdC-Cd O torsional coordinate has been shown to influence significantly their physicochemical properties. 38-42 In a large number of R-dicarbonyl compounds, a long wavelength n-π* transition occurs at λ max in the range 420-500 nm for both cis and trans coplanar dicarbonyl arrangements, shifting to substantially higher energies (λ max < 400 nm) whenever the intercarbonyl dihedral angle deviates significantly from the planarity. 32,43-47 Benzil [C 6 H 5 C(dO)C(dO)C 6 H 5 ; 1,2-diphenyl-ethanedione] and PPD are examples of simple R-dicarbonyl compounds showing this characteristic behavior. 36,37,39-42,47 In a spectroscopic study on PPD and other propanediones, Arnett et al. 37 demonstrated that excitation of propanedione molecules with an OdCsCd O planar conformation is more efficient in the induction of luminescence than excitation of twisted species. Since all known R-dicarbonyls emit only from the planar (or nearly planar) dicarbonyl geometric configurations, those authors concluded that a twisted OdCsCdO angle favors energy dissipation processes depopulating S 1 and T 1 states. These processes are responsible for the weak luminescence of the twisted com- pounds. 37 Experimental structural studies on PPD have been carried out only for the compound in the gaseous phase, by electron diffraction. 43 According to the electron diffraction analysis, PPD is a nonplanar molecule with the OdCsCdO torsional angle of 129.9° and the phenyl ring nearly coplanar with the vicinal carbonyl group. No evidence of presence in the gaseous phase of a second conformer was found. Comparison of the OdCs CdO torsion angle in diacetyl (CH 3 COCOCH 3 ; 2,3-butane- dione: 180° 38,49 ), benzil (106.6° 39,50 ), and PPD (129.9° 43 ) clearly demonstrates that the presence of a phenyl group destabilizes * Corresponding author. E-mail: [email protected]. ² University of Coimbra. ‡ Universidad de Buenos Aires. § Institute of Physics of the Polish Academy of Sciences. 5560 J. Phys. Chem. A 2005, 109, 5560-5570 10.1021/jp044287o CCC: $30.25 © 2005 American Chemical Society Published on Web 06/07/2005
Transcript of Conformational Flexibility, UV−Induced Decarbonylation, and FTIR Spectra of 1Phenyl1,2...
Conformational Flexibility, UV -Induced Decarbonylation, and FTIR Spectra of1-Phenyl-1,2 Propanedione in Solid Xenon and in the Low Temperature Amorphous Phase
Susy Lopes,† Andrea Gomez-Zavaglia,†,‡ Leszek Lapinski,§ and Rui Fausto*,†
Department of Chemistry, UniVersity of Coimbra, P-3004-535 Coimbra, Portugal, Faculdad de Farmacia yBioquımica, UniVersidad de Buenos Aires, Junı´n 956, 1113 Buenos Aires, Argentina, and Institute of Physics ofthe Polish Academy of Sciences, Al. Lotnikow 32/46, 02-668 Warsaw, Poland
ReceiVed: December 15, 2004; In Final Form: March 14, 2005
1-Phenyl-1,2-propanedione has been isolated in low-temperature xenon matrixes and studied by FTIRspectroscopy, supported by DFT(B3LYP)/6-311++G(d,p) calculations. In good agreement with previouselectron diffraction data [Shen, Q.; Hagen, K.J. Phys. Chem.1993, 97, 985], the calculations predicted theexistence of only one stable conformation for the compound, in which the OdCsCdO dihedral angle is135.6°. On the other hand, the experimental data clearly reveals that, in the as-deposited xenon matrixes(T ) 20 K), there is a distribution of molecules with different OdCsCdO dihedral angles around theequilibrium value. This distribution results from the efficient trapping of the conformational distribution existingin the gas phase, prior to deposition, which is determined by the low frequency, large amplitude torsionalvibration around the C-C central bond. Upon annealing to higher temperatures (T ∼ 45 K), the initiallytrapped conformational distribution can be modified in a certain degree, favoring more polar structures(corresponding to smaller OdCsCdO dihedral angles), as a result of the interactions with the matrix media.Irradiation of the matrix with UV light (λ > 235 nm) led to decarbonylation of the compound, with generationof acetophenone and carbon monoxide, with an almost complete consumption of the reagent after 1100 minof irradiation (k ) 2.8× 10⁻² min.-1). Aggregation of the compound resulting from the matrix warming wasalso investigated, providing useful information for interpretation of the spectroscopic data obtained for thelow-temperature amorphous state of the neat compound.
Introduction
R-Dicarbonyl compounds have been the subject of extensiveresearch due to their important applications.1-4 1-Phenyl-1,2-propanedione (PPD) receives practical use as photosensitizerfor photopolymerization of visible light-cured dental resincomposites5-7 and as photoinitiator for the photo-cross-linkingof waterborne latex paints,8 being also a common reactant inasymmetric synthesis.9-27 Enantioselective hydrogenation ofPPD has been used for production ofR-hydroxy carbonylcompounds and diols,9-27 which are utilized in the synthesis ofmany biologically relevant substances, such as, for example,ephedrine and pseudoephedrine.28-30 The conditions to carryout this reaction have been the matter of several reports: it hasbeen performed using heterogeneous catalysis in differentsolvents, oxygenation conditions and in the presence or absenceof ultrasonic irradiation,9-21 by using bakers yeast as reducingagent,22-25 pollarographically,26 and metabolically in vivo.27
PPD has also been used, together with methylguanidine, asreagents to produce 4H-imidazole rings.31
From a more fundamental point of view,R-dicarbonylcompounds have deserved much attention due to the photo-rotamerism they frequently exhibit.32-37 These compounds havebeen found to be considerably flexible, and the large amplitude,low-frequency vibrational mode associated with the OdC-CdO torsional coordinate has been shown to influence significantly
their physicochemical properties.38-42 In a large number ofR-dicarbonyl compounds, a long wavelength n-π* transitionoccurs atλmax in the range 420-500 nm for both cis and transcoplanar dicarbonyl arrangements, shifting to substantiallyhigher energies (λmax < 400 nm) whenever the intercarbonyldihedral angle deviates significantly from the planarity.32,43-47
Benzil [C6H5C(dO)C(dO)C6H5; 1,2-diphenyl-ethanedione] andPPD are examples of simpleR-dicarbonyl compounds showingthis characteristic behavior.36,37,39-42,47In a spectroscopic studyon PPD and other propanediones, Arnett et al.37 demonstratedthat excitation of propanedione molecules with an OdCsCdO planar conformation is more efficient in the induction ofluminescence than excitation of twisted species. Since all knownR-dicarbonyls emit only from the planar (or nearly planar)dicarbonyl geometric configurations, those authors concludedthat a twisted OdCsCdO angle favors energy dissipationprocesses depopulating S1 and T1 states. These processes areresponsible for the weak luminescence of the twisted com-pounds.37
Experimental structural studies on PPD have been carried outonly for the compound in the gaseous phase, by electrondiffraction.43 According to the electron diffraction analysis, PPDis a nonplanar molecule with the OdCsCdO torsional angleof 129.9° and the phenyl ring nearly coplanar with the vicinalcarbonyl group. No evidence of presence in the gaseous phaseof a second conformer was found. Comparison of the OdCsCdO torsion angle in diacetyl (CH3COCOCH3; 2,3-butane-dione: 180°38,49), benzil (106.6°39,50), and PPD (129.9°43) clearlydemonstrates that the presence of a phenyl group destabilizes
* Corresponding author. E-mail: [email protected].† University of Coimbra.‡ Universidad de Buenos Aires.§ Institute of Physics of the Polish Academy of Sciences.
5560 J. Phys. Chem. A2005,109,5560-5570
10.1021/jp044287o CCC: $30.25 © 2005 American Chemical SocietyPublished on Web 06/07/2005
the planar anti form (OdCsCdO angle equals to 180°), becauseof the steric hindrance between this group and the carbonylmoiety.
Structure of PPD molecules in a vacuum and in differentsolvents was also studied previously by quantum chemicalcalculations at both HF/6-31+G(d,p) and DFT(B3LYP)/6-31+G(d,p) levels of theory.9,10 These theoretical studies pre-dicted values for the OdCsCdO dihedral angle in theminimum energy conformation of PPD ranging from 120.1°(DFT(B3LYP)/6-31+G(d,p) in methanol) to 154.0° (DFT-(B3LYP)/6-31+G(d,p) in a vacuum). To our knowledge, noother calculations on this compound were reported hitherto.
Previous studies carried out in our laboratory have demon-strated that the movement along the low frequency, largeamplitudeτÃdCsCdO torsional coordinate in both benzil anddiacetyl is strongly influenced by temperature and phase andextremely sensitive to the chemical environment. These proper-ties are of particular importance in determining the conforma-tional, structural, and vibrational features of these two molecules,including their excited state conformational preferences.38,39Theinvestigation of PPD (OdCsCdO moiety bounded to onemethyl and one phenyl group), which represents an intermediatespecies between diacetyl (OdCsCdO bounded to two methylgroups) and benzil (OdCsCdO bounded to two phenyl groups)appears as a natural development of our studies on the structureand spectroscopic properties of simpleR-dicarbonyl compounds.Thus, in the present study, we applied the same methodologyused in our previous studies on diacetyl and benzil38,39 to theinvestigation of PPD. The compound, in both the low-temper-ature neat solid state and isolated in low-temperature inertmatrixes, was studied by FTIR spectroscopy. Advantage is takenof the unique characteristics of FTIR matrix-isolation spectros-copy, such as high intrinsic spectral resolution and highsensitivity to conformational changes. The interpretation of theexperimental results is supported by extensive high-leveltheoretical calculations.
Results of in situ irradiation of the matrixes with UV light(λ > 235 nm), leading to photodegradation of the compoundwith evolution of carbon monoxide, were also investigated, aswell as aggregation of the compound resulting from the matrixwarming. These latter provide useful information for interpreta-tion of the spectroscopic data obtained for the low-temperatureamorphous state of the neat compound. Note that suppliers alertthat the hazardous decomposition of PPD can produce carbonmonoxide, but there are no available data regarding ecotoxicityand environmental fate of PPD. Due to the dangerous effectsof carbon monoxide on human and animal health,51-54 the studyof the decomposition reactions of PPD, under adequate experi-mental conditions, appeared to be essential for optimization ofits manipulation and successful practical applications. Thematrix-isolation spectroscopy is certainly an adequate methodto attain this goal, because no strong interactions between thecompound and the inert matrix are expected. In addition, thecircumstance that the photochemical processes in a matrix areconfined to the matrix cage preclude the undesirable side-reactions that can easily occur under other experimental condi-tions.
Materials and Methods
Infrared Spectroscopy. The sample of 1-phenyl-1,2-pro-panedione (99% purity) was obtained from Aldrich.
The IR spectra were recorded with 0.5 cm-1 spectralresolution using a Mattson (Infinity 60AR Series) FourierTransform infrared spectrometer, equipped with a deuterated
triglycine sulfate (DTGS) detector and a Ge/KBr beam splitter.Necessary modifications of the sample compartment of thespectrometer were done in order to accommodate the cryostathead and allow purging of the instrument by a stream ofpretreated dry air to remove water vapors and CO2. The liquidsample of PPD was placed in a specially designed doublytermostattable Knudsen cell.55 Matrixes were prepared by co-deposition of PPD vapors coming out of the Knudsen cell andlarge excess of the matrix gas (xenon, 99.995%, obtained fromAir Liquide) onto the CsI substrate of the cryostat (APDCryogenics, model DE-202A), cooled to 20 K. To avoidassociation during deposition, the sample was kept into a water:acetone 2:1 cryogenic mixture (temperature) 243 K), whereasthe temperature of the vapors of the compound before depositionwas, in all experiments, 298 K. After depositing the compound,annealing of the matrixes was performed up to 70 K.
The low temperature solid amorphous layer was prepared inthe same way as matrixes but with the flux of matrix gas cutoff. The layer was then allowed to anneal at slowly increasingtemperature up to 215 K. After the temperature exceeded 215K, the crystallization of the amorphous layer occurred. Subse-quently, the CsI substrate was cooled back to 9 K, and spectrumof the crystalline phase was collected.
Irradiation of the matrixes was undertaken through the outerKBr window of the cryostat (λ > 235 nm), with unfiltered lightfrom a 150 W xenon arc lamp (Osram XBO 150W/CR OFR).
Computational Methodology. The quantum chemicalcal-culations were performed with Gaussian 98 (revision A.9)program56 at the DFT level of theory, using the triple-ú6-311++G(d,p) basis set and the three-parameter densityfunctional abbreviated as B3LYP, which includes Becke’sgradient exchange correction57 and the Lee, Yang, and Parrcorrelation functional.58
Geometrical parameters of the considered conformations wereoptimized using the geometry direct inversion of the invariantsubspace (GDIIS) method.59 To assist the analysis of theexperimental spectra, vibrational frequencies and IR intensitieswere also calculated at the same level of approximation. Thecomputed harmonic frequencies were scaled down by a singlefactor (0.978) to correct them for the effects of basis setlimitations, the neglected part of electron correlation, andanharmonicity effects. Relaxed potential energy torsional profileswere also obtained at the same level of theory. In thesecalculations, all geometrical parameters except the OdCsCdO torsional angle (fixed at a given value, using increments of30°) were optimized. The energy-weighted average OdCsCdO dihedral angles and dipole moments, at a given temperature,were estimated using a simple classical model that takes intoconsideration all significantly populated conformations differingin the OdCsCdO torsional angle. The applied procedurefollows the method previously described by Go´mez-Zavagliaand Fausto.38 Normal coordinate analysis was undertaken in theinternal coordinates space, as described by Schachtschneider,60
using the program BALGA and the optimized geometries andharmonic force constants resulting from the DFT(B3LYP)/6-311++G(d,p) calculations.
Results and Discussion
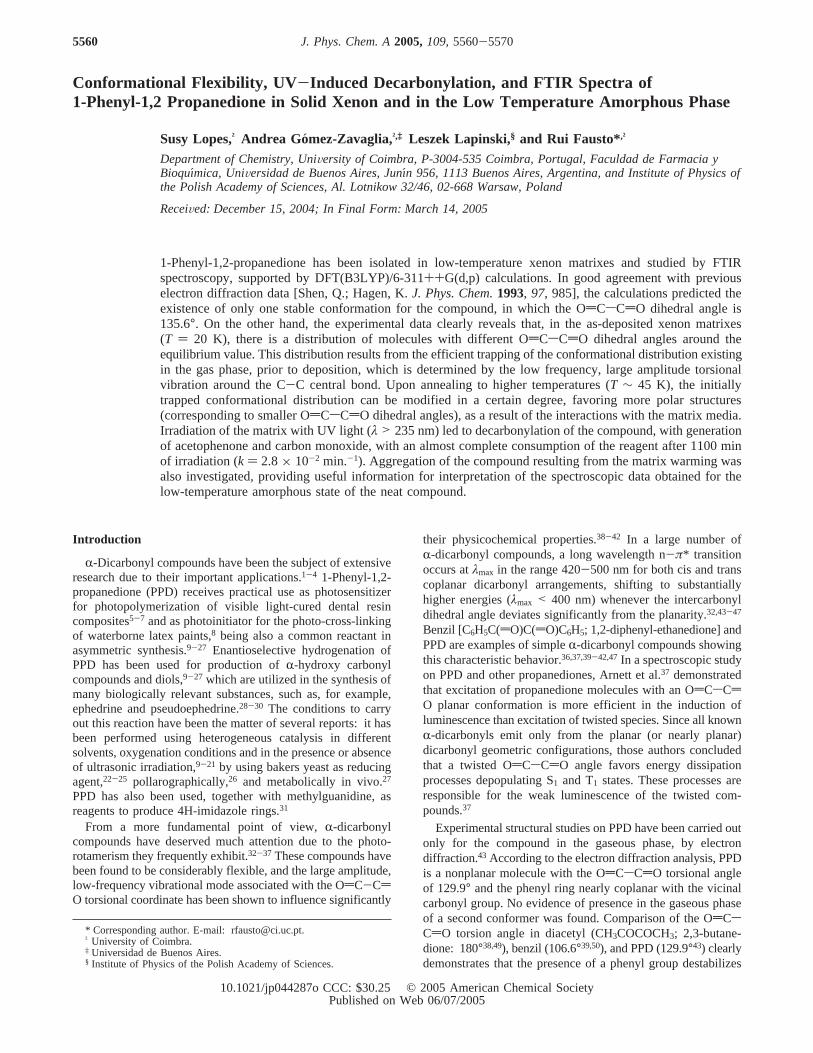
Geometries and Energies.The optimized geometry of PPDis displayed in Figure 1. In agreement with the available electrondiffraction results,43 the calculations performed in this studypredicted the existence of only one stable conformation for thecompound, in which the OdCsCdO dihedral angle is 135.6°(C1 symmetry point group). The calculated bond lengths and
1-Phenyl-1,2 Propanedione in Solid Xenon J. Phys. Chem. A, Vol. 109, No. 25, 20055561
angles are given in Table S1 (Supporting Information), togetherwith the previously obtained electron diffraction data43 and lowerlevel DFT(B3LYP)/6-31+G(d,p) theoretical results.9 As it canbe seen, the three sets of data show a good general agreement,though the agreement between the present calculations and theexperimental results is much better than that between the lowerlevel calculations reported by Toukoniitty et al.9 and theexperiment in what concerns the OdCsCdO dihedral angle(experimental: 129.9°; present calculations: 135.6°; previousDFT(B3LYP)/ 6-31+G(d,p) theoretical results: 154.0°).
It is interesting to compare the relative values of the differentC-C bond lengths in the PPD molecule. As expected, the C-Cbonds of the aromatic ring are the shortest ones, with bondlengths ranging from 138.8 to 140.5 pm (in the electrondiffraction study, all C-C aromatic bonds were assumed to beequal43). Among them, the two bonds located closer to theOdCsCdO moiety were predicted as being the longest ones(C5sC6d 140.5 pm; C5sC10d 140.3 pm). The C1-C5 bond,connecting the OdCsCdO group to the phenyl ring, was foundto be shorter than C3-C16, which links the OdCsCdO andCH3 groups (148.7 vs. 150.6 pm; see Table S1), in consonancewith the existence in the molecule of some degree ofπ-delo-calization involving the OdCsCdO and phenyl groups (hy-perconjugation between the methyl and OdCsCdO groupsshall also be operating,61,62 but this effect is certainly lessimportant in structural terms than the OdCsCdO/phenylconjugation). Note that the C1-C5 and C3-C16 bond lengths inPPD were estimated to be as long as the equivalent distancesin benzil (148.7 pm39) and diacetyl (150.5 pm38) predicted atthe same level of theory. The longest C-C bond in the moleculeis the central intercarbonyl C-C bond, which is 155.0 pm long,i.e., it has a bond length characteristic of a typical nonconjugatedC-C single bond. This result follows the same trend alreadynoticed for both diacetyl and benzil,38,39and confirms once againthe fact that theπ-conjugation between the two carbonyl groupsin the OdC-CdO fragment is minimal, the dominant forcesdetermining the intercarbonyl C-C bond length being thoseassociated with the repulsions between the positively chargedcarbonyl carbon atoms (acting essentially through theσ-electronsystem). This is also in agreement with the experimentalobservations that show both the large conformational flexibilityaround the C-C intercarbonyl bond inR-dicarbonyls (clearlyrevealing that the contribution of double bond character isminimal) and the relative facility of these molecules to suffercleavage of this bond [e.g., the bond energies of C-Cintercarbonyl bond in diacetyl and benzil are only ca. 280 kJmol-1, which is quite a small value in comparison, for instance,with the bond energies of the CH3-C bond in acetone and
acetophenone (ca. 320 and 360 kJ mol-1, respectively) or C-Cbond in ethane (376.0 kJ mol-1)].38,39,63-71
Since PPD represents an intermediate species betweendiacetyl and benzil, it is also interesting to compare the lengthof the C-C central bond in these compounds: 155.7, 155.0,and 154.4 pm, respectively, for diacetyl,38 PPD, and benzil.39
The C-C bond length in PPD is intermediate between diacetyland benzil; that is, the results are consistent with those extractedfrom the electron distribution population analysis, whichindicates that theσ-electron population at the carbonyl carbonatom is lower (i.e., the positive charge on the carbon atom islarger) when it is directly bound to a methyl than to a phenylgroup. Hence, theσ-electron system repulsion between thecarbonyl carbon atoms decreases in the order diacetyl/PPD/benzil, justifying the observed relative intercarbonyl C-Cdistances in the three molecules.
The calculated relative values for the C1sC3dO4/C3sC1dO2 and C3-C1-C5/C1-C3-C16 pairs of angles in PPD do alsodeserve here an additional comment. In each pair of angles, thefirst angle is connected with the phenyl group, whereas thesecond is connected with the methyl group (see Figure 1). Thecalculated values for these angles are 120.3°/116.5° and 120.7°/115.7°; that is, the angles associated with the phenyl group aresystematically larger than those associated with the methylgroup. This trend is a direct consequence of the more pro-nounced repulsions between the bigger phenyl group and thecarbonyl group in theâ-position to the phenyl moiety (C3dO4)in comparison to those between the methyl and the correspond-ing â-carbonyl (C1dO2). It is worth mentioning that the patternexhibited by the electron diffraction data concerning these anglesis different, with the C1-C3-C16 angle being the largest angle.Indeed, this angle differs by ca. 6° from the calculated value(121.4° vs 115.7°). Such a pattern is, however, difficult to justify,and with all probability, the experimental value for the C1-C3-C16 is in error.
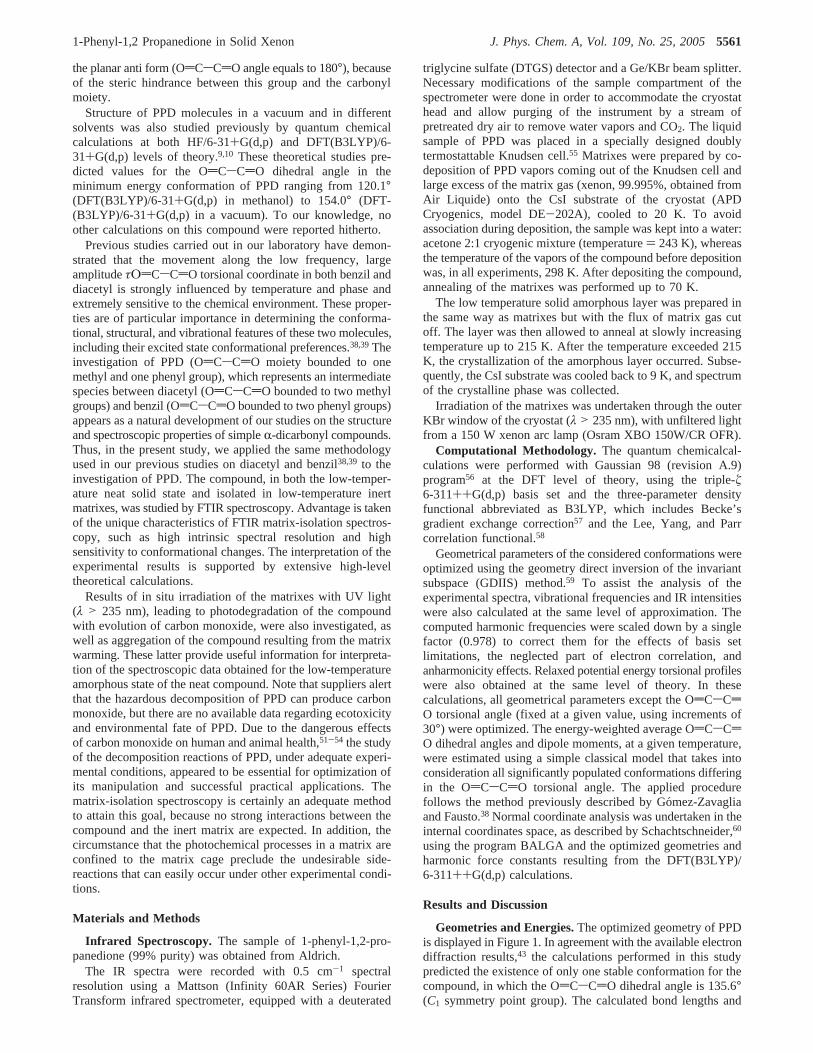
The potential energy profile obtained at the DFT(B3LYP)/6-311++G(d,p) level for the internal rotation around the centralC-C bond in PPD is shown in Figure 2a. Two energy barriersseparate the symmetry-equivalent minima. The barrier withmaximum at the cis OdCsCdO conformation is as high as36.4 kJ mol-1, whereas that corresponding to the trans confor-mation is only 3.3 kJ mol-1. This large difference in the energybarriers could be easily anticipated, since for the cis conforma-tion the conjugated effect of the repulsions between the phenyland the methyl groups, in one side of the molecule, and betweenthe oxygen lone electron pairs, in the other side, stronglydestabilizes this conformation. On the other hand, for the transconformation, the steric repulsions (phenyl‚‚‚O4dC3 andmethyl‚‚‚O2dC1) are partially compensated by the favorableelectrostatic attractive forces between the interacting groups inboth sides of the molecule.
From Figure 2a, it can also be concluded that around theminimum energy conformation the potential energy grows fasterchanging the OdCsCdO dihedral toward the cis conformationthan in the direction of the trans conformation (for example,upon internal rotation in the direction of the cis conformation,a relative energy equal to that of the trans conformation isattained for a OdCsCdO dihedral angle of ca. 106°; that is,the changes in the dihedral angle counted from the equilibriumgeometry correspond then to ca. 29° and 45°, respectivelymoving toward the cis and trans structure). Assuming a modelwhere the large amplitude, low-frequency torsion around thecentral C-C bond is treated classically, and calculating thenumber of molecules of PPD with a given conformation around
Figure 1. Minimum energy conformation of PPD (C1 symmetry;OdCsCdO dihedral angle: 135.6°) with atom numbering.
5562 J. Phys. Chem. A, Vol. 109, No. 25, 2005 Lopes et al.
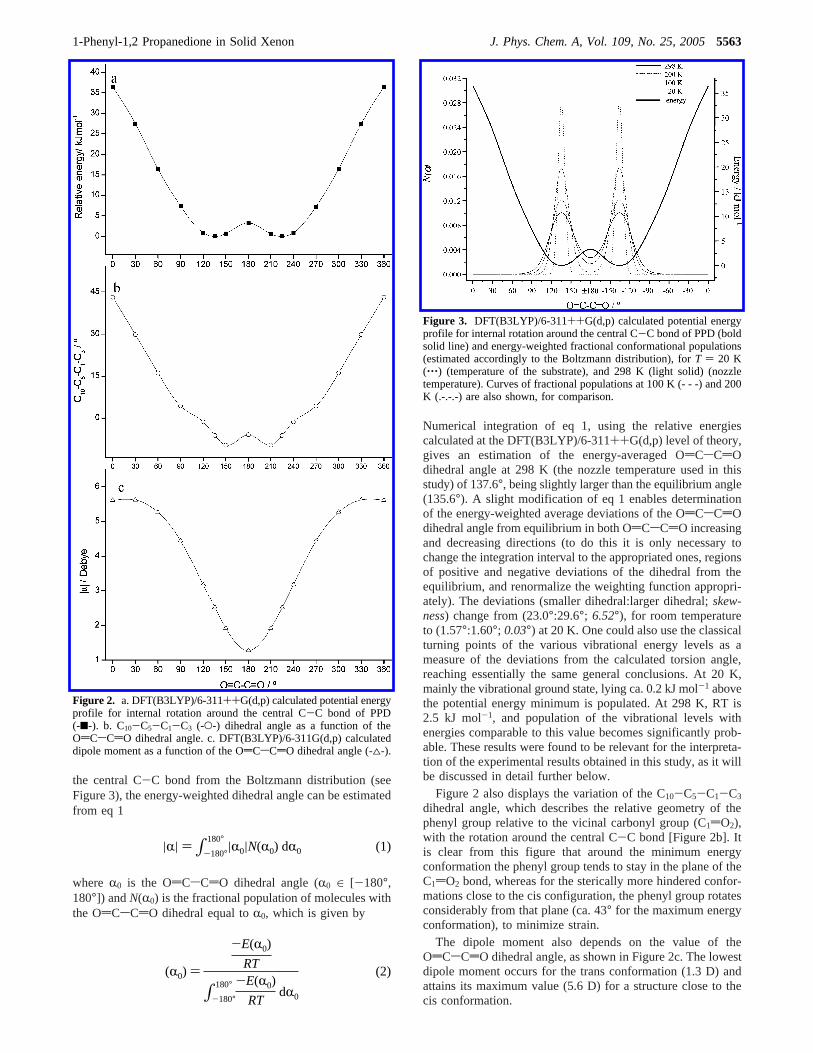
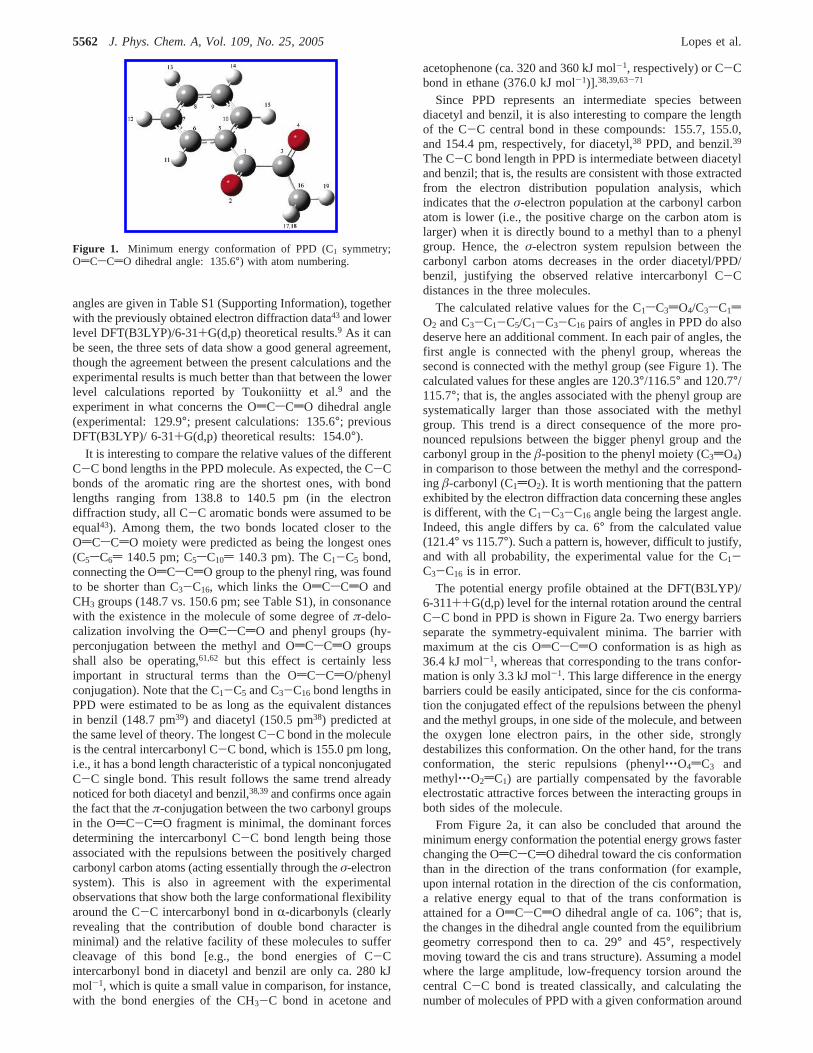
the central C-C bond from the Boltzmann distribution (seeFigure 3), the energy-weighted dihedral angle can be estimatedfrom eq 1
where R0 is the OdCsCdO dihedral angle (R0 ∈ [-180°,180°]) andN(R0) is the fractional population of molecules withthe OdCsCdO dihedral equal toR0, which is given by
Numerical integration of eq 1, using the relative energiescalculated at the DFT(B3LYP)/6-311++G(d,p) level of theory,gives an estimation of the energy-averaged OdCsCdOdihedral angle at 298 K (the nozzle temperature used in thisstudy) of 137.6°, being slightly larger than the equilibrium angle(135.6°). A slight modification of eq 1 enables determinationof the energy-weighted average deviations of the OdCsCdOdihedral angle from equilibrium in both OdCsCdO increasingand decreasing directions (to do this it is only necessary tochange the integration interval to the appropriated ones, regionsof positive and negative deviations of the dihedral from theequilibrium, and renormalize the weighting function appropri-ately). The deviations (smaller dihedral:larger dihedral;skew-ness) change from (23.0°:29.6°; 6.52°), for room temperatureto (1.57°:1.60°; 0.03°) at 20 K. One could also use the classicalturning points of the various vibrational energy levels as ameasure of the deviations from the calculated torsion angle,reaching essentially the same general conclusions. At 20 K,mainly the vibrational ground state, lying ca. 0.2 kJ mol-1 abovethe potential energy minimum is populated. At 298 K, RT is2.5 kJ mol-1, and population of the vibrational levels withenergies comparable to this value becomes significantly prob-able. These results were found to be relevant for the interpreta-tion of the experimental results obtained in this study, as it willbe discussed in detail further below.
Figure 2 also displays the variation of the C10-C5-C1-C3
dihedral angle, which describes the relative geometry of thephenyl group relative to the vicinal carbonyl group (C1dO2),with the rotation around the central C-C bond [Figure 2b]. Itis clear from this figure that around the minimum energyconformation the phenyl group tends to stay in the plane of theC1dO2 bond, whereas for the sterically more hindered confor-mations close to the cis configuration, the phenyl group rotatesconsiderably from that plane (ca. 43° for the maximum energyconformation), to minimize strain.
The dipole moment also depends on the value of theOdCsCdO dihedral angle, as shown in Figure 2c. The lowestdipole moment occurs for the trans conformation (1.3 D) andattains its maximum value (5.6 D) for a structure close to thecis conformation.
Figure 2. a. DFT(B3LYP)/6-311++G(d,p) calculated potential energyprofile for internal rotation around the central C-C bond of PPD(-9-). b. C10-C5-C1-C3 (-O-) dihedral angle as a function of theOdCsCdO dihedral angle. c. DFT(B3LYP)/6-311G(d,p) calculateddipole moment as a function of the OdCsCdO dihedral angle (-4-).
Figure 3. DFT(B3LYP)/6-311++G(d,p) calculated potential energyprofile for internal rotation around the central C-C bond of PPD (boldsolid line) and energy-weighted fractional conformational populations(estimated accordingly to the Boltzmann distribution), forT ) 20 K(‚‚‚) (temperature of the substrate), and 298 K (light solid) (nozzletemperature). Curves of fractional populations at 100 K (- - -) and 200K (.-.-.-) are also shown, for comparison.
|R| ) ∫-180°
180° |R0|N(R0) dR0 (1)
(R0) )
-E(R0)
RT
∫-180°
180° -E(R0)
RTdR0
(2)
1-Phenyl-1,2 Propanedione in Solid Xenon J. Phys. Chem. A, Vol. 109, No. 25, 20055563
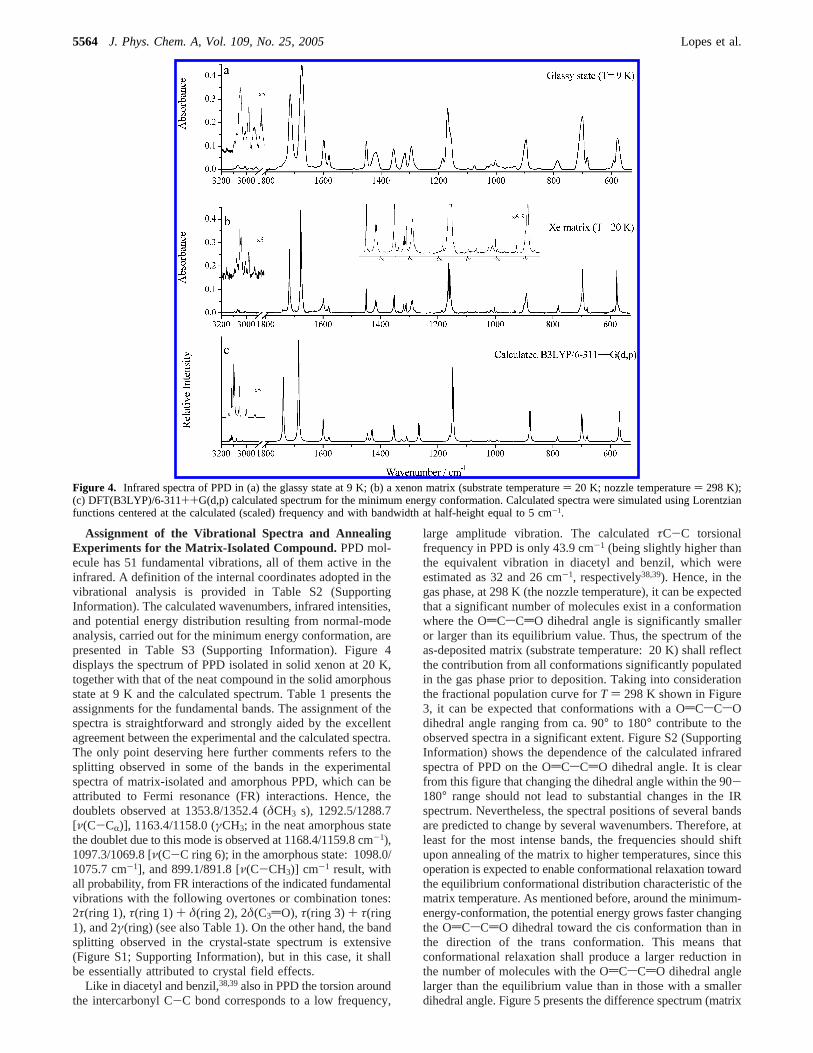
Assignment of the Vibrational Spectra and AnnealingExperiments for the Matrix-Isolated Compound. PPD mol-ecule has 51 fundamental vibrations, all of them active in theinfrared. A definition of the internal coordinates adopted in thevibrational analysis is provided in Table S2 (SupportingInformation). The calculated wavenumbers, infrared intensities,and potential energy distribution resulting from normal-modeanalysis, carried out for the minimum energy conformation, arepresented in Table S3 (Supporting Information). Figure 4displays the spectrum of PPD isolated in solid xenon at 20 K,together with that of the neat compound in the solid amorphousstate at 9 K and the calculated spectrum. Table 1 presents theassignments for the fundamental bands. The assignment of thespectra is straightforward and strongly aided by the excellentagreement between the experimental and the calculated spectra.The only point deserving here further comments refers to thesplitting observed in some of the bands in the experimentalspectra of matrix-isolated and amorphous PPD, which can beattributed to Fermi resonance (FR) interactions. Hence, thedoublets observed at 1353.8/1352.4 (δCH3 s), 1292.5/1288.7[ν(C-CR)], 1163.4/1158.0 (γCH3; in the neat amorphous statethe doublet due to this mode is observed at 1168.4/1159.8 cm-1),1097.3/1069.8 [ν(C-C ring 6); in the amorphous state: 1098.0/1075.7 cm-1], and 899.1/891.8 [ν(C-CH3)] cm-1 result, withall probability, from FR interactions of the indicated fundamentalvibrations with the following overtones or combination tones:2τ(ring 1),τ(ring 1) + δ(ring 2), 2δ(C3dO), τ(ring 3) + τ(ring1), and 2γ(ring) (see also Table 1). On the other hand, the bandsplitting observed in the crystal-state spectrum is extensive(Figure S1; Supporting Information), but in this case, it shallbe essentially attributed to crystal field effects.
Like in diacetyl and benzil,38,39also in PPD the torsion aroundthe intercarbonyl C-C bond corresponds to a low frequency,
large amplitude vibration. The calculatedτC-C torsionalfrequency in PPD is only 43.9 cm-1 (being slightly higher thanthe equivalent vibration in diacetyl and benzil, which wereestimated as 32 and 26 cm-1, respectively38,39). Hence, in thegas phase, at 298 K (the nozzle temperature), it can be expectedthat a significant number of molecules exist in a conformationwhere the OdCsCdO dihedral angle is significantly smalleror larger than its equilibrium value. Thus, the spectrum of theas-deposited matrix (substrate temperature: 20 K) shall reflectthe contribution from all conformations significantly populatedin the gas phase prior to deposition. Taking into considerationthe fractional population curve forT ) 298 K shown in Figure3, it can be expected that conformations with a OdCsCsOdihedral angle ranging from ca. 90° to 180° contribute to theobserved spectra in a significant extent. Figure S2 (SupportingInformation) shows the dependence of the calculated infraredspectra of PPD on the OdCsCdO dihedral angle. It is clearfrom this figure that changing the dihedral angle within the 90-180° range should not lead to substantial changes in the IRspectrum. Nevertheless, the spectral positions of several bandsare predicted to change by several wavenumbers. Therefore, atleast for the most intense bands, the frequencies should shiftupon annealing of the matrix to higher temperatures, since thisoperation is expected to enable conformational relaxation towardthe equilibrium conformational distribution characteristic of thematrix temperature. As mentioned before, around the minimum-energy-conformation, the potential energy grows faster changingthe OdCsCdO dihedral toward the cis conformation than inthe direction of the trans conformation. This means thatconformational relaxation shall produce a larger reduction inthe number of molecules with the OdCsCdO dihedral anglelarger than the equilibrium value than in those with a smallerdihedral angle. Figure 5 presents the difference spectrum (matrix
Figure 4. Infrared spectra of PPD in (a) the glassy state at 9 K; (b) a xenon matrix (substrate temperature) 20 K; nozzle temperature) 298 K);(c) DFT(B3LYP)/6-311++G(d,p) calculated spectrum for the minimum energy conformation. Calculated spectra were simulated using Lorentzianfunctions centered at the calculated (scaled) frequency and with bandwidth at half-height equal to 5 cm-1.
5564 J. Phys. Chem. A, Vol. 109, No. 25, 2005 Lopes et al.
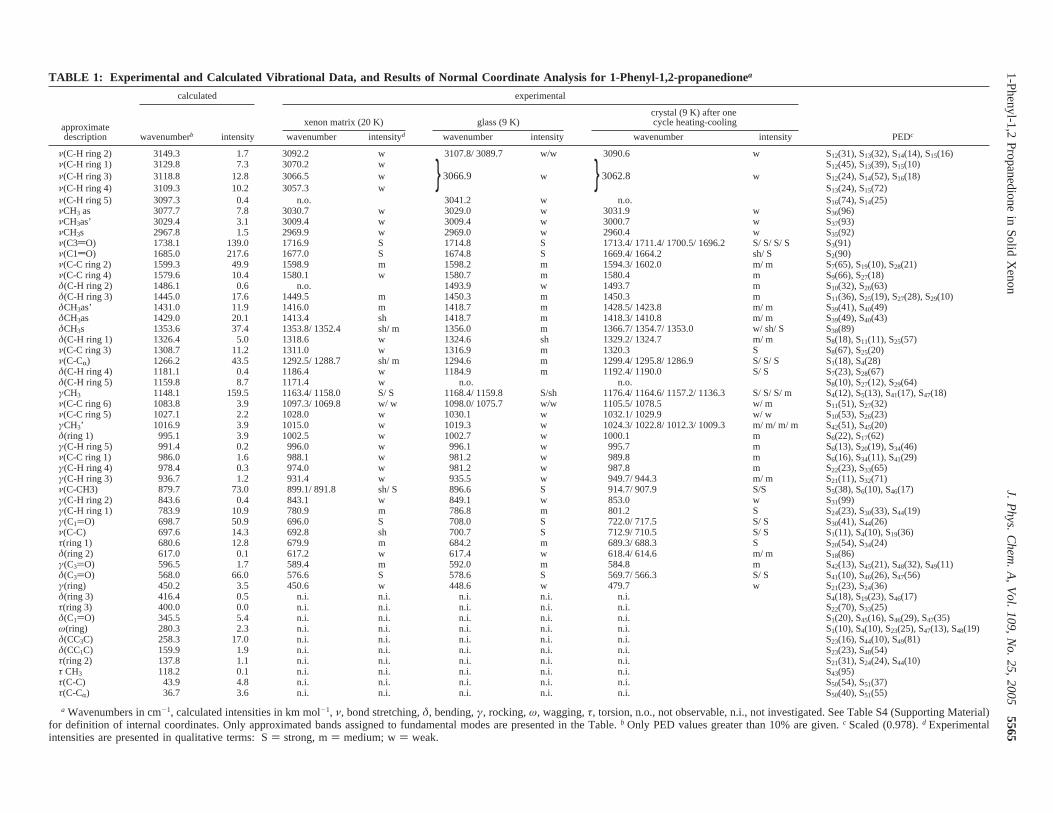
TABLE 1: Experimental and Calculated Vibrational Data, and Results of Normal Coordinate Analysis for 1-Phenyl-1,2-propanedionea
calculated experimental
xenon matrix (20 K) glass (9 K)crystal (9 K) after onecycle heating-coolingapproximate
description wavenumberb intensity wavenumber intensityd wavenumber intensity wavenumber intensity PEDc
ν(C-H ring 2) 3149.3 1.7 3092.2 w 3107.8/ 3089.7 w/w 3090.6 w S12(31), S13(32), S14(14), S15(16)ν(C-H ring 1) 3129.8 7.3 3070.2 w }3066.9 }3062.8
S12(45), S13(39), S15(10)ν(C-H ring 3) 3118.8 12.8 3066.5 w w w S12(24), S14(52), S16(18)ν(C-H ring 4) 3109.3 10.2 3057.3 w S13(24), S15(72)ν(C-H ring 5) 3097.3 0.4 n.o. 3041.2 w n.o. S16(74), S14(25)νCH3 as 3077.7 7.8 3030.7 w 3029.0 w 3031.9 w S36(96)νCH3as’ 3029.4 3.1 3009.4 w 3009.4 w 3000.7 w S37(93)νCH3s 2967.8 1.5 2969.9 w 2969.0 w 2960.4 w S35(92)ν(C3dO) 1738.1 139.0 1716.9 S 1714.8 S 1713.4/ 1711.4/ 1700.5/ 1696.2 S/ S/ S/ S S3(91)ν(C1dO) 1685.0 217.6 1677.0 S 1674.8 S 1669.4/ 1664.2 sh/ S S2(90)ν(C-C ring 2) 1599.3 49.9 1598.9 m 1598.2 m 1594.3/ 1602.0 m/ m S7(65), S19(10), S28(21)ν(C-C ring 4) 1579.6 10.4 1580.1 w 1580.7 m 1580.4 m S9(66), S27(18)δ(C-H ring 2) 1486.1 0.6 n.o. 1493.9 w 1493.7 m S10(32), S26(63)δ(C-H ring 3) 1445.0 17.6 1449.5 m 1450.3 m 1450.3 m S11(36), S25(19), S27(28), S29(10)δCH3as’ 1431.0 11.9 1416.0 m 1418.7 m 1428.5/ 1423.8 m/ m S39(41), S40(49)δCH3as 1429.0 20.1 1413.4 sh 1418.7 m 1418.3/ 1410.8 m/ m S39(49), S40(43)δCH3s 1353.6 37.4 1353.8/ 1352.4 sh/ m 1356.0 m 1366.7/ 1354.7/ 1353.0 w/ sh/ S S38(89)δ(C-H ring 1) 1326.4 5.0 1318.6 w 1324.6 sh 1329.2/ 1324.7 m/ m S8(18), S11(11), S25(57)ν(C-C ring 3) 1308.7 11.2 1311.0 w 1316.9 m 1320.3 S S8(67), S25(20)ν(C-CR) 1266.2 43.5 1292.5/ 1288.7 sh/ m 1294.6 m 1299.4/ 1295.8/ 1286.9 S/ S/ S S1(18), S4(28)δ(C-H ring 4) 1181.1 0.4 1186.4 w 1184.9 m 1192.4/ 1190.0 S/ S S7(23), S28(67)δ(C-H ring 5) 1159.8 8.7 1171.4 w n.o. n.o. S8(10), S27(12), S29(64)γCH3 1148.1 159.5 1163.4/ 1158.0 S/ S 1168.4/ 1159.8 S/sh 1176.4/ 1164.6/ 1157.2/ 1136.3 S/ S/ S/ m S4(12), S5(13), S41(17), S47(18)ν(C-C ring 6) 1083.8 3.9 1097.3/ 1069.8 w/ w 1098.0/ 1075.7 w/w 1105.5/ 1078.5 w/ m S11(51), S27(32)ν(C-C ring 5) 1027.1 2.2 1028.0 w 1030.1 w 1032.1/ 1029.9 w/ w S10(53), S26(23)γCH3’ 1016.9 3.9 1015.0 w 1019.3 w 1024.3/ 1022.8/ 1012.3/ 1009.3 m/ m/ m/ m S42(51), S45(20)δ(ring 1) 995.1 3.9 1002.5 w 1002.7 w 1000.1 m S6(22), S17(62)γ(C-H ring 5) 991.4 0.2 996.0 w 996.1 w 995.7 m S6(13), S20(19), S34(46)ν(C-C ring 1) 986.0 1.6 988.1 w 981.2 w 989.8 m S6(16), S34(11), S41(29)γ(C-H ring 4) 978.4 0.3 974.0 w 981.2 w 987.8 m S22(23), S33(65)γ(C-H ring 3) 936.7 1.2 931.4 w 935.5 w 949.7/ 944.3 m/ m S21(11), S32(71)ν(C-CH3) 879.7 73.0 899.1/ 891.8 sh/ S 896.6 S 914.7/ 907.9 S/S S5(38), S6(10), S46(17)γ(C-H ring 2) 843.6 0.4 843.1 w 849.1 w 853.0 w S31(99)γ(C-H ring 1) 783.9 10.9 780.9 m 786.8 m 801.2 S S24(23), S30(33), S44(19)γ(C1)O) 698.7 50.9 696.0 S 708.0 S 722.0/ 717.5 S/ S S30(41), S44(26)ν(C-C) 697.6 14.3 692.8 sh 700.7 S 712.9/ 710.5 S/ S S1(11), S4(10), S19(36)τ(ring 1) 680.6 12.8 679.9 m 684.2 m 689.3/ 688.3 S S20(54), S34(24)δ(ring 2) 617.0 0.1 617.2 w 617.4 w 618.4/ 614.6 m/ m S18(86)γ(C3)O) 596.5 1.7 589.4 m 592.0 m 584.8 m S42(13), S45(21), S48(32), S49(11)δ(C3)O) 568.0 66.0 576.6 S 578.6 S 569.7/ 566.3 S/ S S41(10), S46(26), S47(56)γ(ring) 450.2 3.5 450.6 w 448.6 w 479.7 w S21(23), S24(36)δ(ring 3) 416.4 0.5 n.i. n.i. n.i. n.i. n.i. S4(18), S19(23), S46(17)τ(ring 3) 400.0 0.0 n.i. n.i. n.i. n.i. n.i. S22(70), S33(25)δ(C1)O) 345.5 5.4 n.i. n.i. n.i. n.i. n.i. S1(20), S45(16), S46(29), S47(35)ω(ring) 280.3 2.3 n.i. n.i. n.i. n.i. n.i. S1(10), S4(10), S23(25), S47(13), S48(19)δ(CC3C) 258.3 17.0 n.i. n.i. n.i. n.i. n.i. S23(16), S44(10), S49(81)δ(CC1C) 159.9 1.9 n.i. n.i. n.i. n.i. n.i. S23(23), S48(54)τ(ring 2) 137.8 1.1 n.i. n.i. n.i. n.i. n.i. S21(31), S24(24), S44(10)τ CH3 118.2 0.1 n.i. n.i. n.i. n.i. n.i. S43(95)τ(C-C) 43.9 4.8 n.i. n.i. n.i. n.i. n.i. S50(54), S51(37)τ(C-CR) 36.7 3.6 n.i. n.i. n.i. n.i. n.i. S50(40), S51(55)
a Wavenumbers in cm-1, calculated intensities in km mol-1, ν, bond stretching,δ, bending,γ, rocking,ω, wagging,τ, torsion, n.o., not observable, n.i., not investigated. See Table S4 (Supporting Material)for definition of internal coordinates. Only approximated bands assigned to fundamental modes are presented in the Table.b Only PED values greater than 10% are given.c Scaled (0.978).d Experimentalintensities are presented in qualitative terms: S) strong, m) medium; w) weak.
1-Phenyl-1,2
Propanedione
inS
olidX
enonJ.
Ph
ys.C
he
m.
A,
Vo
l.1
09
,N
o.
25
,2
00
55565
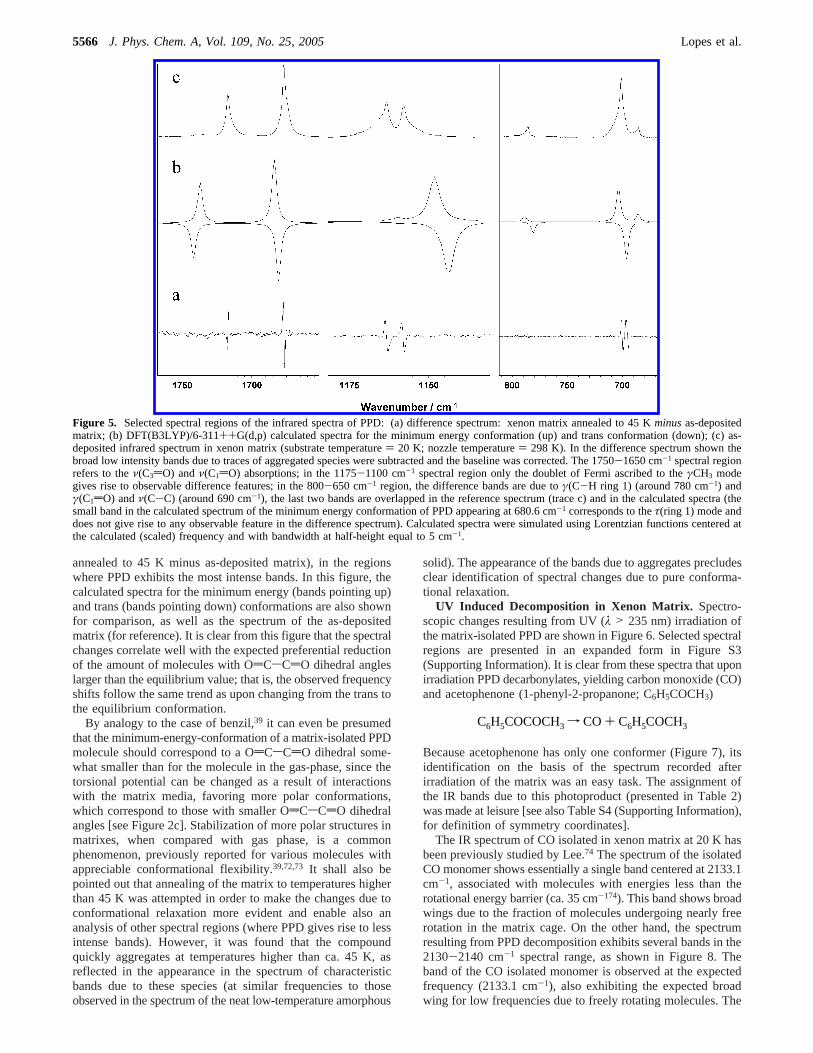
annealed to 45 K minus as-deposited matrix), in the regionswhere PPD exhibits the most intense bands. In this figure, thecalculated spectra for the minimum energy (bands pointing up)and trans (bands pointing down) conformations are also shownfor comparison, as well as the spectrum of the as-depositedmatrix (for reference). It is clear from this figure that the spectralchanges correlate well with the expected preferential reductionof the amount of molecules with OdCsCdO dihedral angleslarger than the equilibrium value; that is, the observed frequencyshifts follow the same trend as upon changing from the trans tothe equilibrium conformation.
By analogy to the case of benzil,39 it can even be presumedthat the minimum-energy-conformation of a matrix-isolated PPDmolecule should correspond to a OdCsCdO dihedral some-what smaller than for the molecule in the gas-phase, since thetorsional potential can be changed as a result of interactionswith the matrix media, favoring more polar conformations,which correspond to those with smaller OdCsCdO dihedralangles [see Figure 2c]. Stabilization of more polar structures inmatrixes, when compared with gas phase, is a commonphenomenon, previously reported for various molecules withappreciable conformational flexibility.39,72,73 It shall also bepointed out that annealing of the matrix to temperatures higherthan 45 K was attempted in order to make the changes due toconformational relaxation more evident and enable also ananalysis of other spectral regions (where PPD gives rise to lessintense bands). However, it was found that the compoundquickly aggregates at temperatures higher than ca. 45 K, asreflected in the appearance in the spectrum of characteristicbands due to these species (at similar frequencies to thoseobserved in the spectrum of the neat low-temperature amorphous
solid). The appearance of the bands due to aggregates precludesclear identification of spectral changes due to pure conforma-tional relaxation.
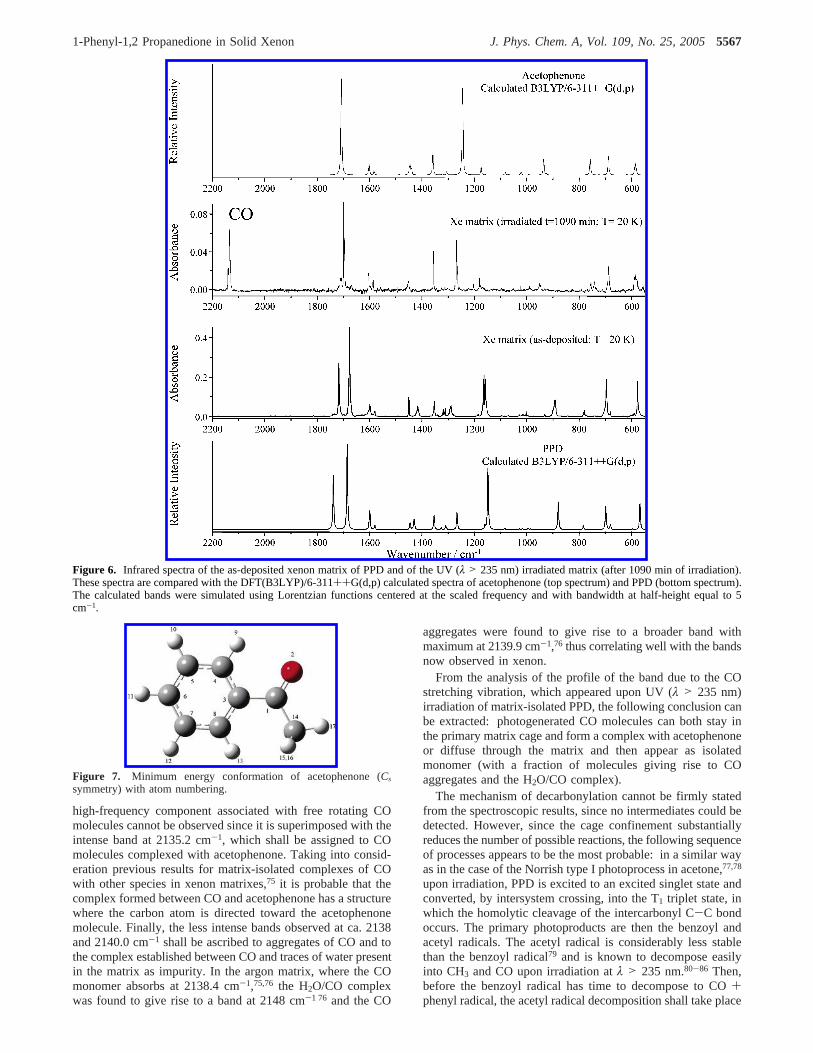
UV Induced Decomposition in Xenon Matrix. Spectro-scopic changes resulting from UV (λ > 235 nm) irradiation ofthe matrix-isolated PPD are shown in Figure 6. Selected spectralregions are presented in an expanded form in Figure S3(Supporting Information). It is clear from these spectra that uponirradiation PPD decarbonylates, yielding carbon monoxide (CO)and acetophenone (1-phenyl-2-propanone; C6H5COCH3)
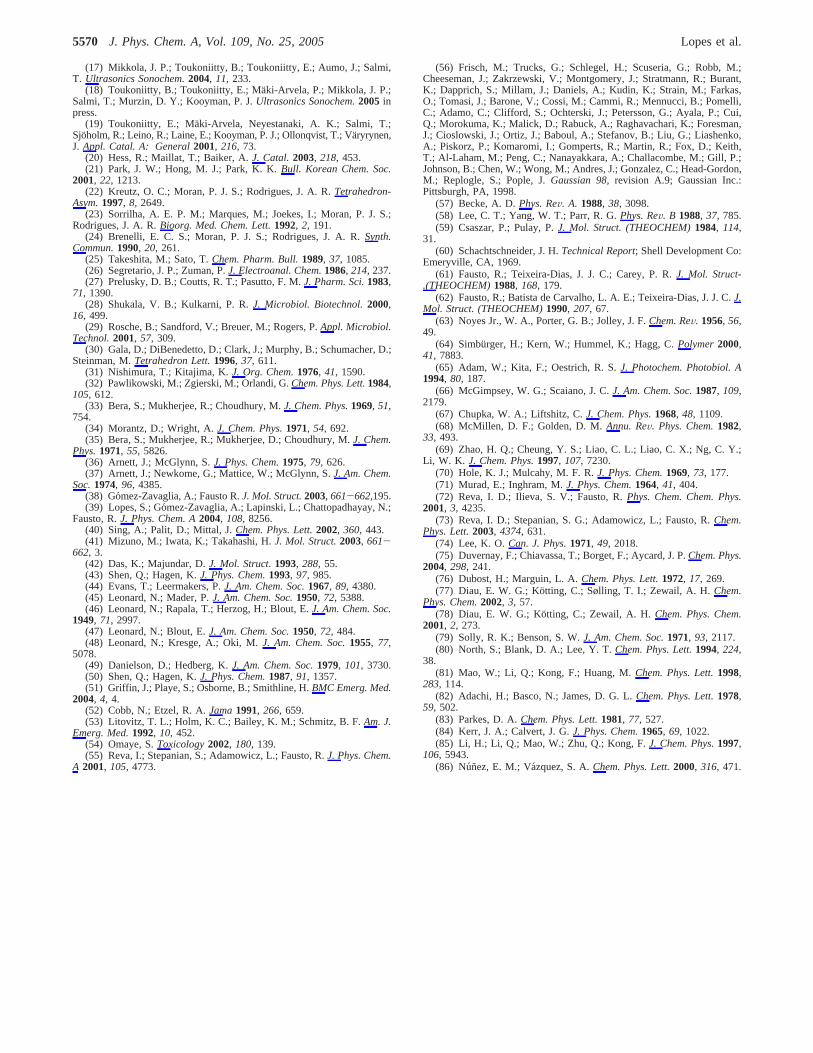
Because acetophenone has only one conformer (Figure 7), itsidentification on the basis of the spectrum recorded afterirradiation of the matrix was an easy task. The assignment ofthe IR bands due to this photoproduct (presented in Table 2)was made at leisure [see also Table S4 (Supporting Information),for definition of symmetry coordinates].
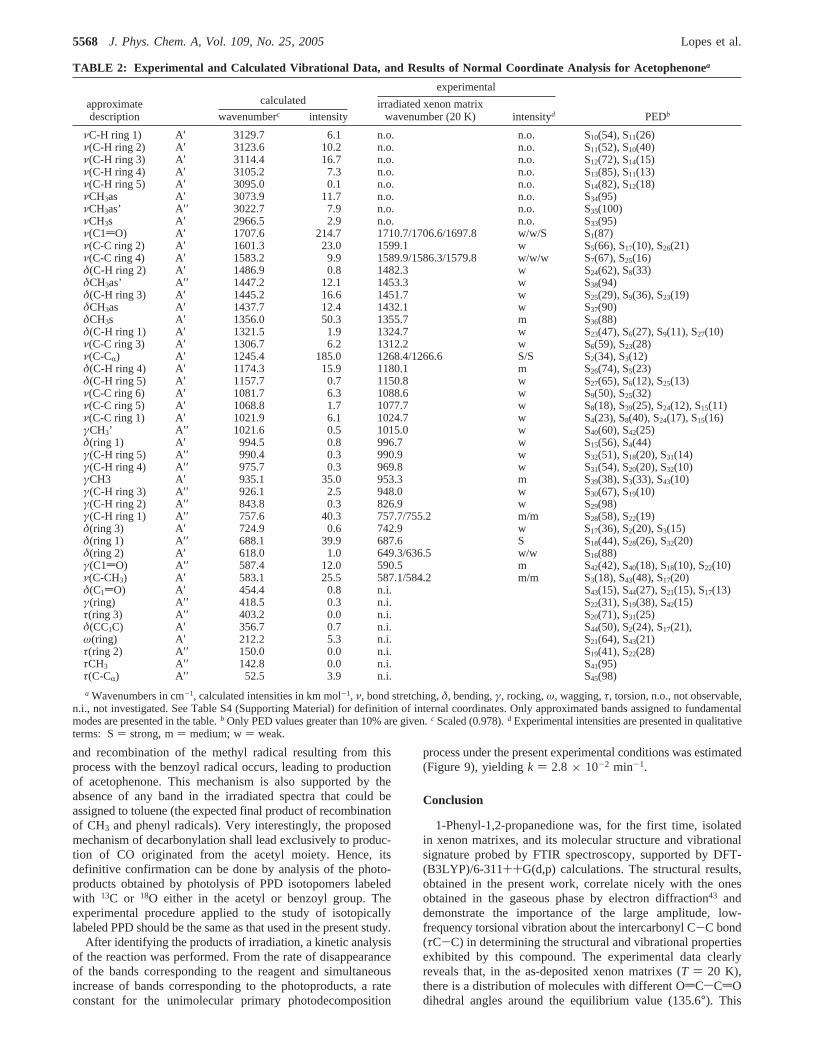
The IR spectrum of CO isolated in xenon matrix at 20 K hasbeen previously studied by Lee.74 The spectrum of the isolatedCO monomer shows essentially a single band centered at 2133.1cm-1, associated with molecules with energies less than therotational energy barrier (ca. 35 cm-174). This band shows broadwings due to the fraction of molecules undergoing nearly freerotation in the matrix cage. On the other hand, the spectrumresulting from PPD decomposition exhibits several bands in the2130-2140 cm-1 spectral range, as shown in Figure 8. Theband of the CO isolated monomer is observed at the expectedfrequency (2133.1 cm-1), also exhibiting the expected broadwing for low frequencies due to freely rotating molecules. The
Figure 5. Selected spectral regions of the infrared spectra of PPD: (a) difference spectrum: xenon matrix annealed to 45 Kminusas-depositedmatrix; (b) DFT(B3LYP)/6-311++G(d,p) calculated spectra for the minimum energy conformation (up) and trans conformation (down); (c) as-deposited infrared spectrum in xenon matrix (substrate temperature) 20 K; nozzle temperature) 298 K). In the difference spectrum shown thebroad low intensity bands due to traces of aggregated species were subtracted and the baseline was corrected. The 1750-1650 cm-1 spectral regionrefers to theν(C3dO) andν(C1dO) absorptions; in the 1175-1100 cm-1 spectral region only the doublet of Fermi ascribed to theγCH3 modegives rise to observable difference features; in the 800-650 cm-1 region, the difference bands are due toγ(C-H ring 1) (around 780 cm-1) andγ(C1dO) andν(C-C) (around 690 cm-1), the last two bands are overlapped in the reference spectrum (trace c) and in the calculated spectra (thesmall band in the calculated spectrum of the minimum energy conformation of PPD appearing at 680.6 cm-1 corresponds to theτ(ring 1) mode anddoes not give rise to any observable feature in the difference spectrum). Calculated spectra were simulated using Lorentzian functions centered atthe calculated (scaled) frequency and with bandwidth at half-height equal to 5 cm-1.
C6H5COCOCH3 f CO + C6H5COCH3
5566 J. Phys. Chem. A, Vol. 109, No. 25, 2005 Lopes et al.
high-frequency component associated with free rotating COmolecules cannot be observed since it is superimposed with theintense band at 2135.2 cm-1, which shall be assigned to COmolecules complexed with acetophenone. Taking into consid-eration previous results for matrix-isolated complexes of COwith other species in xenon matrixes,75 it is probable that thecomplex formed between CO and acetophenone has a structurewhere the carbon atom is directed toward the acetophenonemolecule. Finally, the less intense bands observed at ca. 2138and 2140.0 cm-1 shall be ascribed to aggregates of CO and tothe complex established between CO and traces of water presentin the matrix as impurity. In the argon matrix, where the COmonomer absorbs at 2138.4 cm-1,75,76 the H2O/CO complexwas found to give rise to a band at 2148 cm-1 76 and the CO
aggregates were found to give rise to a broader band withmaximum at 2139.9 cm-1,76 thus correlating well with the bandsnow observed in xenon.
From the analysis of the profile of the band due to the COstretching vibration, which appeared upon UV (λ > 235 nm)irradiation of matrix-isolated PPD, the following conclusion canbe extracted: photogenerated CO molecules can both stay inthe primary matrix cage and form a complex with acetophenoneor diffuse through the matrix and then appear as isolatedmonomer (with a fraction of molecules giving rise to COaggregates and the H2O/CO complex).
The mechanism of decarbonylation cannot be firmly statedfrom the spectroscopic results, since no intermediates could bedetected. However, since the cage confinement substantiallyreduces the number of possible reactions, the following sequenceof processes appears to be the most probable: in a similar wayas in the case of the Norrish type I photoprocess in acetone,77,78
upon irradiation, PPD is excited to an excited singlet state andconverted, by intersystem crossing, into the T1 triplet state, inwhich the homolytic cleavage of the intercarbonyl C-C bondoccurs. The primary photoproducts are then the benzoyl andacetyl radicals. The acetyl radical is considerably less stablethan the benzoyl radical79 and is known to decompose easilyinto CH3 and CO upon irradiation atλ > 235 nm.80-86 Then,before the benzoyl radical has time to decompose to CO+phenyl radical, the acetyl radical decomposition shall take place
Figure 6. Infrared spectra of the as-deposited xenon matrix of PPD and of the UV (λ > 235 nm) irradiated matrix (after 1090 min of irradiation).These spectra are compared with the DFT(B3LYP)/6-311++G(d,p) calculated spectra of acetophenone (top spectrum) and PPD (bottom spectrum).The calculated bands were simulated using Lorentzian functions centered at the scaled frequency and with bandwidth at half-height equal to 5cm-1.
Figure 7. Minimum energy conformation of acetophenone (Cs
symmetry) with atom numbering.
1-Phenyl-1,2 Propanedione in Solid Xenon J. Phys. Chem. A, Vol. 109, No. 25, 20055567
and recombination of the methyl radical resulting from thisprocess with the benzoyl radical occurs, leading to productionof acetophenone. This mechanism is also supported by theabsence of any band in the irradiated spectra that could beassigned to toluene (the expected final product of recombinationof CH3 and phenyl radicals). Very interestingly, the proposedmechanism of decarbonylation shall lead exclusively to produc-tion of CO originated from the acetyl moiety. Hence, itsdefinitive confirmation can be done by analysis of the photo-products obtained by photolysis of PPD isotopomers labeledwith 13C or 18O either in the acetyl or benzoyl group. Theexperimental procedure applied to the study of isotopicallylabeled PPD should be the same as that used in the present study.
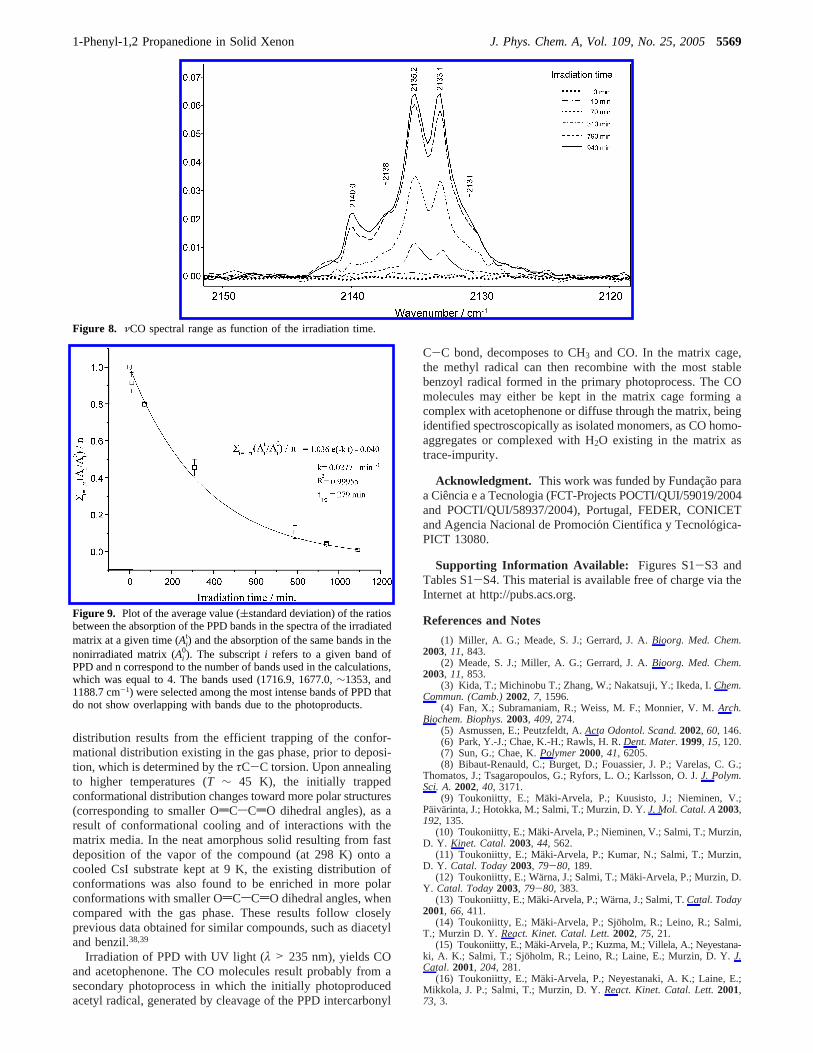
After identifying the products of irradiation, a kinetic analysisof the reaction was performed. From the rate of disappearanceof the bands corresponding to the reagent and simultaneousincrease of bands corresponding to the photoproducts, a rateconstant for the unimolecular primary photodecomposition
process under the present experimental conditions was estimated(Figure 9), yieldingk ) 2.8 × 10⁻² min-1.
Conclusion
1-Phenyl-1,2-propanedione was, for the first time, isolatedin xenon matrixes, and its molecular structure and vibrationalsignature probed by FTIR spectroscopy, supported by DFT-(B3LYP)/6-311++G(d,p) calculations. The structural results,obtained in the present work, correlate nicely with the onesobtained in the gaseous phase by electron diffraction43 anddemonstrate the importance of the large amplitude, low-frequency torsional vibration about the intercarbonyl C-C bond(τC-C) in determining the structural and vibrational propertiesexhibited by this compound. The experimental data clearlyreveals that, in the as-deposited xenon matrixes (T ) 20 K),there is a distribution of molecules with different OdCsCdOdihedral angles around the equilibrium value (135.6°). This
TABLE 2: Experimental and Calculated Vibrational Data, and Results of Normal Coordinate Analysis for Acetophenonea
experimentalcalculatedapproximate
description wavenumberc intensityirradiated xenon matrix
wavenumber (20 K) intensityd PEDb
νC-H ring 1) A′ 3129.7 6.1 n.o. n.o. S10(54), S11(26)ν(C-H ring 2) A′ 3123.6 10.2 n.o. n.o. S11(52), S10(40)ν(C-H ring 3) A′ 3114.4 16.7 n.o. n.o. S12(72), S14(15)ν(C-H ring 4) A′ 3105.2 7.3 n.o. n.o. S13(85), S11(13)ν(C-H ring 5) A′ 3095.0 0.1 n.o. n.o. S14(82), S12(18)νCH3as A′ 3073.9 11.7 n.o. n.o. S34(95)νCH3as’ A′′ 3022.7 7.9 n.o. n.o. S35(100)νCH3s A′ 2966.5 2.9 n.o. n.o. S33(95)ν(C1dO) A′ 1707.6 214.7 1710.7/1706.6/1697.8 w/w/S S1(87)ν(C-C ring 2) A′ 1601.3 23.0 1599.1 w S5(66), S17(10), S26(21)ν(C-C ring 4) A′ 1583.2 9.9 1589.9/1586.3/1579.8 w/w/w S7(67), S25(16)δ(C-H ring 2) A′ 1486.9 0.8 1482.3 w S24(62), S8(33)δCH3as’ A′′ 1447.2 12.1 1453.3 w S38(94)δ(C-H ring 3) A′ 1445.2 16.6 1451.7 w S25(29), S9(36), S23(19)δCH3as A′ 1437.7 12.4 1432.1 w S37(90)δCH3s A′ 1356.0 50.3 1355.7 m S36(88)δ(C-H ring 1) A′ 1321.5 1.9 1324.7 w S23(47), S6(27), S9(11), S27(10)ν(C-C ring 3) A′ 1306.7 6.2 1312.2 w S6(59), S23(28)ν(C-CR) A′ 1245.4 185.0 1268.4/1266.6 S/S S2(34), S3(12)δ(C-H ring 4) A′ 1174.3 15.9 1180.1 m S26(74), S5(23)δ(C-H ring 5) A′ 1157.7 0.7 1150.8 w S27(65), S6(12), S25(13)ν(C-C ring 6) A′ 1081.7 6.3 1088.6 w S9(50), S25(32)ν(C-C ring 5) A′ 1068.8 1.7 1077.7 w S8(18), S39(25), S24(12), S15(11)ν(C-C ring 1) A′ 1021.9 6.1 1024.7 w S4(23), S8(40), S24(17), S15(16)γCH3’ A ′′ 1021.6 0.5 1015.0 w S40(60), S42(25)δ(ring 1) A′ 994.5 0.8 996.7 w S15(56), S4(44)γ(C-H ring 5) A′′ 990.4 0.3 990.9 w S32(51), S18(20), S31(14)γ(C-H ring 4) A′′ 975.7 0.3 969.8 w S31(54), S20(20), S32(10)γCH3 A′ 935.1 35.0 953.3 m S39(38), S3(33), S43(10)γ(C-H ring 3) A′′ 926.1 2.5 948.0 w S30(67), S19(10)γ(C-H ring 2) A′′ 843.8 0.3 826.9 w S29(98)γ(C-H ring 1) A′′ 757.6 40.3 757.7/755.2 m/m S28(58), S22(19)δ(ring 3) A′ 724.9 0.6 742.9 w S17(36), S2(20), S3(15)δ(ring 1) A′′ 688.1 39.9 687.6 S S18(44), S28(26), S32(20)δ(ring 2) A′ 618.0 1.0 649.3/636.5 w/w S16(88)γ(C1dO) A′′ 587.4 12.0 590.5 m S42(42), S40(18), S18(10), S22(10)ν(C-CH3) A′ 583.1 25.5 587.1/584.2 m/m S3(18), S43(48), S17(20)δ(C1dO) A′ 454.4 0.8 n.i. S43(15), S44(27), S21(15), S17(13)γ(ring) A′′ 418.5 0.3 n.i. S22(31), S19(38), S42(15)τ(ring 3) A′′ 403.2 0.0 n.i. S20(71), S31(25)δ(CC1C) A′ 356.7 0.7 n.i. S44(50), S2(24), S17(21),ω(ring) A′ 212.2 5.3 n.i. S21(64), S43(21)τ(ring 2) A′′ 150.0 0.0 n.i. S19(41), S22(28)τCH3 A′′ 142.8 0.0 n.i. S41(95)τ(C-CR) A′′ 52.5 3.9 n.i. S45(98)
a Wavenumbers in cm-1, calculated intensities in km mol-1, ν, bond stretching,δ, bending,γ, rocking,ω, wagging,τ, torsion, n.o., not observable,n.i., not investigated. See Table S4 (Supporting Material) for definition of internal coordinates. Only approximated bands assigned to fundamentalmodes are presented in the table.b Only PED values greater than 10% are given.c Scaled (0.978).d Experimental intensities are presented in qualitativeterms: S) strong, m) medium; w) weak.
5568 J. Phys. Chem. A, Vol. 109, No. 25, 2005 Lopes et al.
distribution results from the efficient trapping of the confor-mational distribution existing in the gas phase, prior to deposi-tion, which is determined by theτC-C torsion. Upon annealingto higher temperatures (T ∼ 45 K), the initially trappedconformational distribution changes toward more polar structures(corresponding to smaller OdCsCdO dihedral angles), as aresult of conformational cooling and of interactions with thematrix media. In the neat amorphous solid resulting from fastdeposition of the vapor of the compound (at 298 K) onto acooled CsI substrate kept at 9 K, the existing distribution ofconformations was also found to be enriched in more polarconformations with smaller OdCsCdO dihedral angles, whencompared with the gas phase. These results follow closelyprevious data obtained for similar compounds, such as diacetyland benzil.38,39
Irradiation of PPD with UV light (λ > 235 nm), yields COand acetophenone. The CO molecules result probably from asecondary photoprocess in which the initially photoproducedacetyl radical, generated by cleavage of the PPD intercarbonyl
C-C bond, decomposes to CH3 and CO. In the matrix cage,the methyl radical can then recombine with the most stablebenzoyl radical formed in the primary photoprocess. The COmolecules may either be kept in the matrix cage forming acomplex with acetophenone or diffuse through the matrix, beingidentified spectroscopically as isolated monomers, as CO homo-aggregates or complexed with H2O existing in the matrix astrace-impurity.
Acknowledgment. This work was funded by Fundac¸ao paraa Ciencia e a Tecnologia (FCT-Projects POCTI/QUI/59019/2004and POCTI/QUI/58937/2004), Portugal, FEDER, CONICETand Agencia Nacional de Promocio´n Cientıfica y Tecnologica-PICT 13080.
Supporting Information Available: Figures S1-S3 andTables S1-S4. This material is available free of charge via theInternet at http://pubs.acs.org.
References and Notes
(1) Miller, A. G.; Meade, S. J.; Gerrard, J. A.Bioorg. Med. Chem.2003, 11, 843.
(2) Meade, S. J.; Miller, A. G.; Gerrard, J. A.Bioorg. Med. Chem.2003, 11, 853.
(3) Kida, T.; Michinobu T.; Zhang, W.; Nakatsuji, Y.; Ikeda, I.Chem.Commun. (Camb.)2002, 7, 1596.
(4) Fan, X.; Subramaniam, R.; Weiss, M. F.; Monnier, V. M.Arch.Biochem. Biophys.2003, 409,274.
(5) Asmussen, E.; Peutzfeldt, A.Acta Odontol. Scand.2002, 60, 146.(6) Park, Y.-J.; Chae, K.-H.; Rawls, H. R.Dent. Mater.1999, 15, 120.(7) Sun, G.; Chae, K.Polymer2000, 41, 6205.(8) Bibaut-Renauld, C.; Burget, D.; Fouassier, J. P.; Varelas, C. G.;
Thomatos, J.; Tsagaropoulos, G.; Ryfors, L. O.; Karlsson, O. J.J. Polym.Sci. A.2002, 40, 3171.
(9) Toukoniitty, E.; Maki-Arvela, P.; Kuusisto, J.; Nieminen, V.;Paivarinta, J.; Hotokka, M.; Salmi, T.; Murzin, D. Y.J. Mol. Catal. A2003,192, 135.
(10) Toukoniitty, E.; Maki-Arvela, P.; Nieminen, V.; Salmi, T.; Murzin,D. Y. Kinet. Catal.2003, 44, 562.
(11) Toukoniitty, E.; Maki-Arvela, P.; Kumar, N.; Salmi, T.; Murzin,D. Y. Catal. Today2003, 79-80, 189.
(12) Toukoniitty, E.; Wa¨rna, J.; Salmi, T.; Ma¨ki-Arvela, P.; Murzin, D.Y. Catal. Today2003, 79-80, 383.
(13) Toukoniitty, E.; Maki-Arvela, P.; Warna, J.; Salmi, T.Catal. Today2001, 66, 411.
(14) Toukoniitty, E.; Maki-Arvela, P.; Sjoholm, R.; Leino, R.; Salmi,T.; Murzin D. Y. React. Kinet. Catal. Lett.2002, 75, 21.
(15) Toukoniitty, E.; Maki-Arvela, P.; Kuzma, M.; Villela, A.; Neyestana-ki, A. K.; Salmi, T.; Sjoholm, R.; Leino, R.; Laine, E.; Murzin, D. Y.J.Catal. 2001, 204, 281.
(16) Toukoniitty, E.; Maki-Arvela, P.; Neyestanaki, A. K.; Laine, E.;Mikkola, J. P.; Salmi, T.; Murzin, D. Y.React. Kinet. Catal. Lett.2001,73, 3.
Figure 8. νCO spectral range as function of the irradiation time.
Figure 9. Plot of the average value ((standard deviation) of the ratiosbetween the absorption of the PPD bands in the spectra of the irradiatedmatrix at a given time (Ai
t) and the absorption of the same bands in thenonirradiated matrix (Ai
0). The subscripti refers to a given band ofPPD and n correspond to the number of bands used in the calculations,which was equal to 4. The bands used (1716.9, 1677.0,∼1353, and1188.7 cm-1) were selected among the most intense bands of PPD thatdo not show overlapping with bands due to the photoproducts.
1-Phenyl-1,2 Propanedione in Solid Xenon J. Phys. Chem. A, Vol. 109, No. 25, 20055569
(17) Mikkola, J. P.; Toukoniitty, B.; Toukoniitty, E.; Aumo, J.; Salmi,T. Ultrasonics Sonochem.2004, 11, 233.
(18) Toukoniitty, B.; Toukoniitty, E.; Ma¨ki-Arvela, P.; Mikkola, J. P.;Salmi, T.; Murzin, D. Y.; Kooyman, P. J.Ultrasonics Sonochem.2005 inpress.
(19) Toukoniitty, E.; Maki-Arvela, Neyestanaki, A. K.; Salmi, T.;Sjoholm, R.; Leino, R.; Laine, E.; Kooyman, P. J.; Ollonqvist, T.; Va¨ryrynen,J. Appl. Catal. A: General2001, 216, 73.
(20) Hess, R.; Maillat, T.; Baiker, A.J. Catal.2003, 218, 453.(21) Park, J. W.; Hong, M. J.; Park, K. K.Bull. Korean Chem. Soc.
2001, 22, 1213.(22) Kreutz, O. C.; Moran, P. J. S.; Rodrigues, J. A. R.Tetrahedron-
Asym.1997, 8, 2649.(23) Sorrilha, A. E. P. M.; Marques, M.; Joekes, I.; Moran, P. J. S.;
Rodrigues, J. A. R.Bioorg. Med. Chem. Lett.1992, 2, 191.(24) Brenelli, E. C. S.; Moran, P. J. S.; Rodrigues, J. A. R.Synth.
Commun.1990, 20, 261.(25) Takeshita, M.; Sato, T.Chem. Pharm. Bull.1989, 37, 1085.(26) Segretario, J. P.; Zuman, P.J. Electroanal. Chem.1986, 214,237.(27) Prelusky, D. B.; Coutts, R. T.; Pasutto, F. M.J. Pharm. Sci.1983,
71, 1390.(28) Shukala, V. B.; Kulkarni, P. R.J. Microbiol. Biotechnol.2000,
16, 499.(29) Rosche, B.; Sandford, V.; Breuer, M.; Rogers, P.Appl. Microbiol.
Technol.2001, 57, 309.(30) Gala, D.; DiBenedetto, D.; Clark, J.; Murphy, B.; Schumacher, D.;
Steinman, M.Tetrahedron Lett.1996, 37, 611.(31) Nishimura, T.; Kitajima, K.J. Org. Chem.1976, 41, 1590.(32) Pawlikowski, M.; Zgierski, M.; Orlandi, G.Chem. Phys. Lett.1984,
105,612.(33) Bera, S.; Mukherjee, R.; Choudhury, M.J. Chem. Phys.1969, 51,
754.(34) Morantz, D.; Wright, A.J. Chem. Phys.1971, 54, 692.(35) Bera, S.; Mukherjee, R.; Mukherjee, D.; Choudhury, M.J. Chem.
Phys.1971, 55, 5826.(36) Arnett, J.; McGlynn, S.J. Phys. Chem.1975, 79, 626.(37) Arnett, J.; Newkome, G.; Mattice, W.; McGlynn, S.J. Am. Chem.
Soc.1974, 96, 4385.(38) Gomez-Zavaglia, A.; Fausto R.J. Mol. Struct.2003, 661-662,195.(39) Lopes, S.; Go´mez-Zavaglia, A.; Lapinski, L.; Chattopadhayay, N.;
Fausto, R.J. Phys. Chem. A2004, 108, 8256.(40) Sing, A.; Palit, D.; Mittal, J.Chem. Phys. Lett.2002, 360, 443.(41) Mizuno, M.; Iwata, K.; Takahashi, H.J. Mol. Struct.2003, 661-
662, 3.(42) Das, K.; Majundar, D.J. Mol. Struct. 1993, 288, 55.(43) Shen, Q.; Hagen, K.J. Phys. Chem.1993, 97, 985.(44) Evans, T.; Leermakers, P.J. Am. Chem. Soc.1967, 89, 4380.(45) Leonard, N.; Mader, P.J. Am. Chem. Soc.1950, 72, 5388.(46) Leonard, N.; Rapala, T.; Herzog, H.; Blout, E.J. Am. Chem. Soc.
1949, 71, 2997.(47) Leonard, N.; Blout, E.J. Am. Chem. Soc.1950, 72, 484.(48) Leonard, N.; Kresge, A.; Oki, M.J. Am. Chem. Soc.1955, 77,
5078.(49) Danielson, D.; Hedberg, K.J. Am. Chem. Soc.1979, 101, 3730.(50) Shen, Q.; Hagen, K.J. Phys. Chem.1987, 91, 1357.(51) Griffin, J.; Playe, S.; Osborne, B.; Smithline, H.BMC Emerg. Med.
2004, 4, 4.(52) Cobb, N.; Etzel, R. A.Jama1991, 266, 659.(53) Litovitz, T. L.; Holm, K. C.; Bailey, K. M.; Schmitz, B. F.Am. J.
Emerg. Med.1992, 10, 452.(54) Omaye, S.Toxicology2002, 180, 139.(55) Reva, I.; Stepanian, S.; Adamowicz, L.; Fausto, R.J. Phys. Chem.
A 2001, 105, 4773.
(56) Frisch, M.; Trucks, G.; Schlegel, H.; Scuseria, G.; Robb, M.;Cheeseman, J.; Zakrzewski, V.; Montgomery, J.; Stratmann, R.; Burant,K.; Dapprich, S.; Millam, J.; Daniels, A.; Kudin, K.; Strain, M.; Farkas,O.; Tomasi, J.; Barone, V.; Cossi, M.; Cammi, R.; Mennucci, B.; Pomelli,C.; Adamo, C.; Clifford, S.; Ochterski, J.; Petersson, G.; Ayala, P.; Cui,Q.; Morokuma, K.; Malick, D.; Rabuck, A.; Raghavachari, K.; Foresman,J.; Cioslowski, J.; Ortiz, J.; Baboul, A.; Stefanov, B.; Liu, G.; Liashenko,A.; Piskorz, P.; Komaromi, I.; Gomperts, R.; Martin, R.; Fox, D.; Keith,T.; Al-Laham, M.; Peng, C.; Nanayakkara, A.; Challacombe, M.; Gill, P.;Johnson, B.; Chen, W.; Wong, M.; Andres, J.; Gonzalez, C.; Head-Gordon,M.; Replogle, S.; Pople, J.Gaussian 98, revision A.9; Gaussian Inc.:Pittsburgh, PA, 1998.
(57) Becke, A. D.Phys. ReV. A. 1988, 38, 3098.(58) Lee, C. T.; Yang, W. T.; Parr, R. G.Phys. ReV. B 1988, 37, 785.(59) Csaszar, P.; Pulay, P.J. Mol. Struct. (THEOCHEM)1984, 114,
31.(60) Schachtschneider, J. H.Technical Report; Shell Development Co:
Emeryville, CA, 1969.(61) Fausto, R.; Teixeira-Dias, J. J. C.; Carey, P. R.J. Mol. Struct-
.(THEOCHEM)1988, 168, 179.(62) Fausto, R.; Batista de Carvalho, L. A. E.; Teixeira-Dias, J. J. C.J.
Mol. Struct. (THEOCHEM)1990, 207, 67.(63) Noyes Jr., W. A., Porter, G. B.; Jolley, J. F.Chem. ReV. 1956, 56,
49.(64) Simburger, H.; Kern, W.; Hummel, K.; Hagg, C.Polymer2000,
41, 7883.(65) Adam, W.; Kita, F.; Oestrich, R. S.J. Photochem. Photobiol. A
1994, 80, 187.(66) McGimpsey, W. G.; Scaiano, J. C.J. Am. Chem. Soc.1987, 109,
2179.(67) Chupka, W. A.; Liftshitz, C.J. Chem. Phys.1968, 48, 1109.(68) McMillen, D. F.; Golden, D. M.Annu. ReV. Phys. Chem.1982,
33, 493.(69) Zhao, H. Q.; Cheung, Y. S.; Liao, C. L.; Liao, C. X.; Ng, C. Y.;
Li, W. K. J. Chem. Phys.1997, 107, 7230.(70) Hole, K. J.; Mulcahy, M. F. R.J. Phys. Chem.1969, 73, 177.(71) Murad, E.; Inghram, M.J. Phys. Chem.1964, 41, 404.(72) Reva, I. D.; Ilieva, S. V.; Fausto, R.Phys. Chem. Chem. Phys.
2001, 3, 4235.(73) Reva, I. D.; Stepanian, S. G.; Adamowicz, L.; Fausto, R.Chem.
Phys. Lett.2003, 4374, 631.(74) Lee, K. O.Can. J. Phys.1971, 49, 2018.(75) Duvernay, F.; Chiavassa, T.; Borget, F.; Aycard, J. P.Chem. Phys.
2004, 298, 241.(76) Dubost, H.; Marguin, L. A.Chem. Phys. Lett.1972, 17, 269.(77) Diau, E. W. G.; Ko¨tting, C.; Sølling, T. I.; Zewail, A. H.Chem.
Phys. Chem.2002, 3, 57.(78) Diau, E. W. G.; Ko¨tting, C.; Zewail, A. H.Chem. Phys. Chem.
2001, 2, 273.(79) Solly, R. K.; Benson, S. W.J. Am. Chem. Soc.1971, 93, 2117.(80) North, S.; Blank, D. A.; Lee, Y. T.Chem. Phys. Lett.1994, 224,
38.(81) Mao, W.; Li, Q.; Kong, F.; Huang, M.Chem. Phys. Lett.1998,
283, 114.(82) Adachi, H.; Basco, N.; James, D. G. L.Chem. Phys. Lett.1978,
59, 502.(83) Parkes, D. A.Chem. Phys. Lett.1981, 77, 527.(84) Kerr, J. A.; Calvert, J. G.J. Phys. Chem.1965, 69, 1022.(85) Li, H.; Li, Q.; Mao, W.; Zhu, Q.; Kong, F.J. Chem. Phys.1997,
106, 5943.(86) Nunez, E. M.; Vazquez, S. A.Chem. Phys. Lett.2000, 316, 471.
5570 J. Phys. Chem. A, Vol. 109, No. 25, 2005 Lopes et al.