
An Empirical Investigation of the True and Fair Override
49
Rock Center for Corporate Governance Stanford University Working Paper Series No. 44 London Business School Accounting Subject Area Working Paper No. ACCT031 Cass Business School Research Paper An Empirical Investigation of the True and Fair Override Gilad Livne City University London - Sir John Cass Business School Maureen F. McNichols Stanford University
-
Upload
independent -
Category
Documents
-
view
0 -
download
0
Transcript of An Empirical Investigation of the True and Fair Override
Rock Center for Corporate Governance
Stanford University Working Paper Series No. 44
London Business School
Accounting Subject Area Working Paper No. ACCT031
Cass Business School Research Paper
An Empirical Investigation of the True
and Fair Override
Gilad Livne
City University London - Sir John Cass Business School
Maureen F. McNichols Stanford University
An Empirical Investigation of the True and Fair Override
in the United Kingdom
Gilad Livne
Cass Business School
106 Bunhill Row
London EC1Y 8TZ
T +44 (0) 20 7040 5192
Maureen McNichols*
Graduate School of Business
Stanford University
Stanford CA 94305
650-723-0833
fmcnich@ stanford.edu
Current draft: July 23, 2008
*Corresponding author
We thank an anonymous referee, Stefan Ost, Sanjay Pareek, David Parkington, Amit Shanker
and Mike Staunton of London Share Price Database for their help with data collection, and
Qintao Fan and Yulin Long for their excellent research assistance. We also thank Mary Barth,
Bill Beaver, Robert Bushman, Elroy Dimson, Chris Higson, Steve Monahan, Dennis Oswald,
Peter Pope, L. Shivakumar, Martin Walker (the Editor), Terry Warfield, as well as seminar
participants at the American Accounting Association 2002 Annual Meeting, 2nd ESRC/CAIR
Conference Manchester University, HKUST Summer Symposium, INSEAD, London Business
School, Summer Camp of Stanford University, Tel Aviv University, University of California, at
Berkeley, University of Wisconsin, Madison and Warwick University, for many helpful
comments. Gilad Livne gratefully acknowledges the financial support of the Leverhulme Trust,
UK, and the London Business School, and the Accounting faculty of Stanford University for
their kind hospitality during summer of 2002. Maureen McNichols gratefully acknowledges the
support of the Stanford Graduate School of Business.
ABSTRACT
The True and Fair View concept requires companies to depart from GAAP or the law if
necessary to present a true and fair view of the corporation‟s financial affairs. We analyze UK
public companies invoking a true and fair override to assess whether overrides are associated
with weakened performance, earnings quality and informativeness. We find quantified overrides
increase income and equity significantly, and firms that invoke more costly overrides report
weaker performance. We also find that firms invoking the most costly overrides have less
informative financial statements than control firms, and lower earnings quality. In contrast,
firms invoking less costly overrides do not exhibit weaker performance, less informative
financial statements or weaker earnings quality. These findings are relevant for the debate on
principle- vs. rules-based accounting.
Keywords: principles- vs. rules-based accounting, earnings quality, informativeness of financial
statements, true and fair override.
JEL Classification Codes: M41
1
1. Introduction
This paper provides evidence on the use of the true and fair view (hereafter TFV)
override by UK companies. UK rules, the first International Accounting Standards (IAS 1,
2003) and legal requirements in the European Union require that public companies provide a true
and fair view of their financial affairs in the financial statements. Conceptually the notion of
TFV goes beyond conformity with GAAP in that it provides a reporting entity the option to
depart from the letter of the law or a promulgated accounting standard in certain circumstances.
Availing this option to firms entails the risk that increasing the set of accounting reporting
choices applied reduces the comparability and quality of corporate financial reports. On the
other hand, this option could enhance financial reporting if application of existing rules leads to
misleading financial reports. The use of broad principles to grant managers considerable
reporting flexibility has been advocated by some as superior to the philosophy of creating a
dense web of rigid and highly detailed reporting requirements. However, not all agree with that
view, especially US regulators and standard setters.
The debate on principle-based vs. rules-based accounting systems has come recently to
the fore in the wake of Enron and other well-known accounting scandals. Against this
background, the FASB and the SEC studied the issue of principles vs. rules-based reporting.
(e.g., FASB, 2002). The SEC has long questioned overrides of accounting standards, as is
evident from its policy to “challenge the basis on which such an override has been used and the
basis on which the auditors have given an unqualified report” in the case of UK firms listed in
the US (see SEC 2001). The SEC objects to the possibility of an override due to the concern that

2
the override requirement may lead to reduced comparability and transparency, and may be used
to mask poor financial performance or deteriorating asset quality.1
Our study provides evidence pertaining to this debate because it examines the nature of
overrides in a more principles-based accounting system, the UK. We postulate that invoking an
override is a result of cost-benefit analysis carried out by managers of reporting entities.
Specifically, we argue that there may be costs associated with an override, which are increasing
in the authoritative support for the accounting treatment subject to override. For example, a
departure from UK GAAP likely involves considerable costs because it increases the probability
of conflict with auditors and directors, potential intervention of regulatory bodies, and litigation
as well as criticism by various market participants (e.g., Jack, 1994, Brandt et al., 1997, and
Hines et al., 2001). The benefits to reporting managers may include attaining certain reporting
objectives, such as satisfying debt covenants. Therefore, overrides of GAAP are likely to be
invoked only when the resulting net benefits are sufficiently high.
We use data from the UK to examine this issue, given its long history with the true and
fair view requirement and the influence of UK standard-setters on shaping IAS. We find that the
vast majority of our sample involves overrides of lesser authoritative rules, such as an override of
the Companies Act to invoke GAAP. However, 19% of our sample observations involve an
override of UK GAAP. This relatively small number of cases suggests that either UK firms are
discouraged to override principles with more authoritative support, that circumstances giving rise
to GAAP overrides that are solely aimed at providing better information to investors are rare,
and/or that UK GAAP already provides sufficient flexibility.
Our primary goal is to investigate whether more costly overrides are associated with
weaker financial performance. We find that firms invoking what we hypothesize are more costly
1 See SEC Concept Release: International Accounting Standards 34-42430, Section IV.A.2 (dated 2/18/2000).
3
overrides tend to exhibit weaker financial performance and lower interest coverage. Moreover,
firms overriding GAAP exhibit a decline in performance in the first year of the override. If
overrides are invoked to present a true and fair view, one would expect them to be invoked by
successful firms as well as firms experiencing financial difficulties. These findings suggest that
the more costly overrides are not consistent with the spirit of true and fair presentation. On the
other hand, for firms invoking more “mechanical” and less costly overrides, such as non-
depreciation of investment properties we do not find evidence of weaker earnings or greater debt.
A secondary goal of this paper is to assess the valuation implications of earnings and
book values of override firms. Prior research (e.g., Ohlson, 1995) suggests that greater earnings
persistence should lead to higher coefficients on earnings and lower coefficients on book value
of equity in valuation models. If overrides represent manipulations that are transitory in nature,
we would expect to find lower (higher) coefficients on earnings (book value) for override firms
than control firms. We provide evidence that the earnings persistence of override firms is lower
than that of control firms for some costly overrides. We also find that companies that choose to
override GAAP with the most costly overrides provide less informative financial statements.
Taken as a whole, the evidence provided in this paper indicates that UK companies have
used the TFV override in well-defined circumstances. However, overrides that require
considerable managerial discretion tend to be invoked in less favorable circumstances,
suggesting the possibility that some firms invoke an override to mask weaker financial
performance. Consistent with this, the earnings of override firms are not more persistent than the
earnings of control firms.
The plan of the paper is as follows. Section 2 provides some background information on
the practice of true and fair override in the UK and European Union that is useful for the debate
4
about its admissibility. Section 3 develops the theory and main hypotheses examined in the
paper. Section 4 describes the data and procedures used in data collection. Section 5 reports the
main empirical findings and Section 6 concludes.
2. Background to the Debate on the True and Fair Override
The concept of true and fair view first appeared in the United Kingdom in the Joint Stock
Companies Registration and Regulation Act of 1844 (McGregor, 1992).2 The UK Companies
Act (1985) requires that financial statements „give a true and fair view.‟ Specifically, the
Companies Act (1985) requires that if, owing to special circumstances, compliance with the Act
would prevent compliance with true and fair presentation, the directors shall depart from the
requirement of the Act and quantify the effect of the departure.3
The concept of true and fair also shows up in a number of professional pronouncements.
At the broadest level, the ASB‟s (1993) Forward to Accounting Standards states that „the Board
envisages that only in exceptional circumstances will departure from the requirements of an
accounting standard be necessary in order for financial statements to give a true and fair view.‟
The specific disclosure requirements first appeared in UITF Abstract 7 (ASB, 1992) and later
incorporated into FRS 18 (ASB, 2000). In contrast to the Act, FRS 18 allows for the possibility
that some departures cannot be quantified.
While there is ambiguity regarding the exact meaning of the words „true‟ and „fair‟, the
legal view is that
the courts will treat compliance with accepted accounting principles as prima facie
evidence that the accounts are true and fair. Equally, deviation from accepted principles
will be prima facie evidence that they are not. Accounts which depart from the standard
2 Given that the UK is a common law country, it is quite plausible that this concept was used in practice well before
it was incorporated into this Act. 3 Nobes and Parker (1991) document that most of their sample directors were willing to depart from the details of
the law or a standard. This requirement also exists, or used to exist, in Australia, New Zealand and Singapore, as
well as in EU nations.
5
without adequate justification or explanation may be held not to be true and fair‟ (Lord
Justice Hoffmann (1983) and Hon. Mrs. Justice Arden (1984), as cited by Davies et al.
(1999) p. 8).
IAS 1, issued by the International Accounting Standards Board and amended in
December 2003, contains similar requirements for an override to those in the UK, though it
requires that financial statements “present fairly” a company‟s financial position, financial
performance and cash flows (paragraph 13). The Financial Reporting Council (the UK regulator
overseeing the ASB) has confirmed that following the adoption of IAS and “fair presentation” in
the EU, the concept of “true and fair view” remains a cornerstone of financial reporting and
auditing in the UK (FRC, 2005).
3. Theory and Hypotheses Development
3.1 FLEXIBLE VS. RIGID REPORTING REQUIREMENTS
Generally, a more flexible accounting system may be superior to a system in which the
set of accounting procedures is restricted if managers use the flexibility to provide better
information to investors or to improve contracting. For example, allowing non-GAAP reporting
can increase the value of the firm while reducing contract-negotiating and duplicate bookkeeping
costs (Leftwich, 1983). On the other hand, a flexible approach may be abused by self-interested
managers, resulting in dead-weight costs (Watts and Zimmerman, 1990). In particular, allowing
flexibility may allow opportunistic managers to portray the firm‟s financial performance as
stronger than would be shown with less flexible reporting, leading to lower earnings quality and
lessened informativeness of the financial statements.
6
3.2 DETERRENTS TO THE ABUSE OF FLEXIBLE REPORTING RULES
Three forces can deter managers from abusing reporting flexibility available to them.
First, anticipating potential abuse on the part of managers, shareholders and other contracting
parties can include clauses that impose penalties for invoking undesired TFV overrides.
However, such contracts may not be available in firms where management can set self-serving
terms in the contracts (Bebchuk, et al., 2002), and contract terms may be incomplete because it is
not possible to anticipate all possibilities for self-serving behavior (Watts and Zimmerman,
1990).
Second, a country‟s enforcement mechanisms and legal framework can deter
opportunistic reporting. Flexible accounting coupled with incomplete contracts may result in
many disputes between the reporting entity and third parties being referred to regulators or a
court of law. However, to paraphrase La Porta, et al. (1998, p. 1121), in an environment of
perfect judicial enforcement, reporting flexibility may be advantageous to investors because they
can appeal to a court if they fear being misled by managers. In contrast, when the courts have
limited discretion and enforcement power or litigation is costly, simple and restrictive sets of
rules also known as bright-line rules, for which violations are easy to judge, may be superior.
Third, the firm‟s governance system, including its directors and auditors, can deter
managers from abusing reporting rules. In the presence of strong oversight by the audit
committee and a professional body of auditors, managers face the requirement that any departure
from GAAP or the Act is either required or approved by the external auditor. An override may
be required if the auditor believes that following form will contrast with the need to follow
substance. Alternatively, in cases where the management-initiated override is not warranted, the
directors and auditors should deter managers from misreporting.
7
In summary, when recognition or disclosure rules are very flexible and deterrence
mechanisms are weak, opportunistic reporting can emerge. On the other hand, if rules are too
rigid and deviation from promulgated rules is very costly, firms may be unwilling to depart from
rules to provide financial statements that give a true and fair view.
3.3 SPECIFIC COSTS ASSOCIATED WITH TFV OVERRIDES IN THE UNITED KINGDOM
When a company invokes an override, it is likely to draw attention from various
interested parties, which in turn may involve costs. In particular, the company may be
investigated by the Financial Reporting Review Panel (FRRP), an affiliate of the ASB, which has
statutory powers to investigate whether annual reports comply with the Companies Act and
GAAP.4 It has been widely perceived in the UK that the FRRP has been an effective deterrent
mechanism against unreasonable violations of GAAP and the CA.5 Benston, et al. (2006) report
that about 20-30 per cent of cases before the FRRP arose from a TFV override, and that the
majority of these overrides were rejected because they were not compelling. Additional costs
may involve conflicts with auditors, scrutiny by analysts and institutional investors. It is
important to note, however, that such costs may not be present in other jurisdictions.6
In what follows we develop and order four categories of TFV overrides according to the
relation between the type of override and potential costs that the TFV firm may incur. The four
categories are as follows:
4 Peasnell, et al. (2001) find that 43 firms judged by the Panel during 1990-1999 to have issued defective statements
tend to exhibit weaker performance than size- industry- and time-matched control. They suggest that this may be
attributable to the higher likelihood that weak firms are referred to the Panel by disaffected shareholders. 5 For example, see Sykes, as quoted by Quick (2001), and Alexander and Archer (2003).
6 In Australia and New Zealand, it was felt that the override was used to avoid complying with GAAP. As a result,
the ability to invoke an override in these countries was removed in the 1990s (see McGregor, 1992, and Kirk, 2006,
for a review of the TFV override in these countries). The recent case of Societe Generale in France raises this
question as well. Hughes (2008)
8
1. Accounting standards, or similar pronouncements, prescribe one method, which
contradicts the Companies Act (CA) and thus require an override.
2. Accounting standards, or similar pronouncements, allow some choice but effectively
prefer a particular method in most cases. The preferred choice is consistent with the
CA. Thus, not following the preferred method also contradicts the CA, and hence
requires an override.
3. Accounting standards, or similar pronouncements, are silent on a particular issue, but
not the CA. Not following the CA requires an override. Note that in the absence of a
promulgated standard, the CA may be regarded as GAAP.
4. Accounting standards or similar pronouncements require a certain method, which is
overridden.
All else equal, the first category is expected to occur most frequently, because the
presumed superiority of GAAP triggers a “mechanical” override of the Companies Act,
suggesting little cost to invoking the override. In fact, due to the presumed supremacy of GAAP
over the CA, mechanical overrides may be costly to avoid.
The fourth category regards departures from generally accepted accounting rules. Under
the maintained presumption that following accounting standards is consistent with TFV, any
departure from GAAP is likely to be regarded as the most costly. This is particularly true if the
override is opportunistic and hence less defensible. Thus, a departure under this category is
expected to occur in a small number of cases in which managers deem the benefits from the
departure to be quite high and in excess of costs.
9
We expect that the second and third categories have greater cost than the first category
and less than the fourth category but their relative ordering is ambiguous. Thus, our numbering
of these categories is for convenience in reference and is not ordinal. The second category
involves situations where an accounting standard offers a choice, but expresses some preference
for one choice over the others. If not following the preferred option given in the standard
involves some kind of penalty, or unwarranted exposure, firms may be hesitant to depart from
the preferred choice unless the benefits outweigh the costs.
The third category involves cases where there are no specific rules except those required
by the CA. In the absence of promulgated standards, one can argue that the CA effectively
becomes GAAP. We do not expect this to occur at a high rate because accounting standards are
more comprehensive than the CA. Furthermore, to the extent that the CA is regarded as
authoritative, firms are less likely to depart from its requirements for opportunistic purposes due
to potential cost.7
3.4 HYPOTHESIS DEVELOPMENT
Our primary hypothesis is motivated by the previous discussion of costs and benefits of
invoking an override. Experience with the TFV override in Australia and New Zealand suggests
that management may exploit greater flexibility in financial reporting to influence the
perceptions of various parties as to the firms‟ status and performance. Relatedly, firms
experiencing weaker financial performance may be more likely to use the TFV override option to
avoid covenant violations, as suggested by the debt covenant hypothesis.8 Thus, in a reporting
system featuring an override, firms may exercise this discretion to improve reported performance
7 It is possible that matters that are not covered by UK GAAP are covered by IAS or US GAAP thus providing
support for the override. However, TFV firms in our sample do not typically make reference to other GAAP. (We
thank Mary Barth for pointing this out to us.) 8 See Dichev and Skinner (2002) for evidence from private lending in the U. S. that firms manipulate earnings to
avoid violating debt covenants.
10
and thereby avoid violating debt covenants. A competing alternative, which represents the view
in the UK Cook (1997), is that firms are motivated to override, and auditors provide approval, to
achieve better accounting treatment (e.g., the override is „corrective‟).9 Implicit in this view is
the high regard paid to specific UK institutions, such as the FRRP and the audit profession. Such
institutions may have played a smaller role in other jurisdictions with the resulting abuse of the
TFV requirement. In such a case, we would not expect weaker performance for UK override
firms. We expect that our ability to discriminate between these hypotheses is greatest for the
most costly overrides, where the offsetting benefits are the greatest. However, the extent to
which institutional forces deter firms from invoking an override to avoid a valid standard is an
empirical question, so our first hypothesis is two-sided. Stated in null form:
Hypothesis 1: Firms that invoke more costly overrides experience similar financial performance
and debt contracts to otherwise similar firms that do not invoke an override.
We supplement our primary investigation with evidence on the valuation implications of
overrides. While it is possible that an override is invoked solely to increase reported income or
influence contract outcomes, such as violation of debt covenants, it is not clear how the exercise
of such discretion will affect earnings quality. Moreover, firms may want to use an override as a
means of providing better information absent any other motivation. For example, an override
may result in greater earnings persistence (i.e., greater quality).10
Managers may be motivated to
do so because of the beneficial effect on the firm‟s cost of capital (Botosan, 1997).
Alternatively, depending on the principle adopted, an override could result in less information to
9 Relatedly, Oswald (2007) finds evidence consistent with this view in the context of R&D. In contrast, Feltham et
al. (2007) examine the relation between leverage and accounting choice and show that firms with poorer
performance have incentives to lower the precision of accounting earnings to avoid violation of debt covenants and
detection of bias. 10
Prior literature has viewed earnings persistence as an important aspect of earnings quality (e.g., Dechow and
Schrand, 2004)
11
investors, as some regulators fear and consistent with Ewert and Wagenhofer (2005). Similar to
our first hypothesis, the second hypothesis is two-sided. Stated in null form:
Hypothesis 2: The financial statements of TFV firms are as informative as the financial
statements of otherwise similar firms that do not invoke an override.
4. Data
To identify firms invoking an override during the 1998-2002 period, we searched the
Lexis-Nexis UK annual reports database using key words “true and fair view,” “override” and
“departure.”11
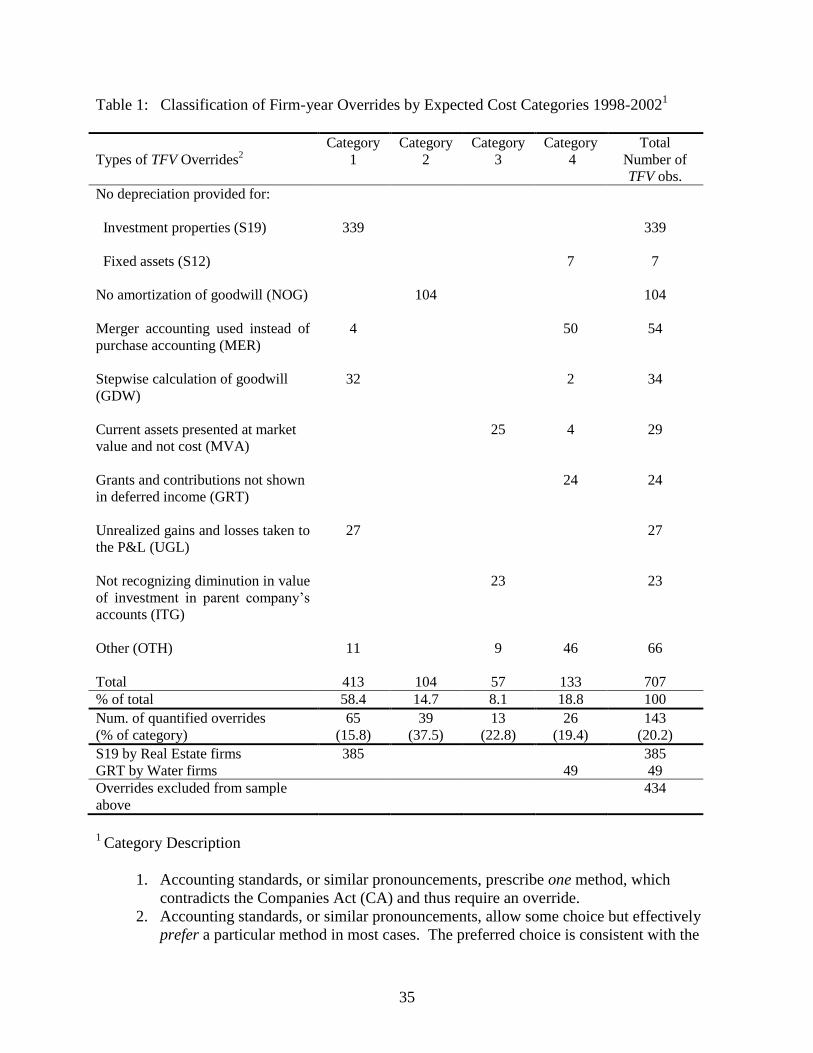
As reported in Table 1, this search resulted in a sample of 1,141 firm-year
observations over the five years. Since in any given year, multiple overrides can be invoked by a
single company, we include in Table 1 only the highest override category in any given year. As
discussed below, we exclude 434 observations because they represent industry-wide practice,
which prevents us from finding a suitable control sample. The final sample thus involves 707
firm-year observations that represent overrides invoked by 307 firms.
Financial data were obtained from Datastream whereas share price data and market
values of equity were obtained from the London Share Price Database (LSPD). Auditor identity
and auditor‟s opinion were collected from Worldscope. We collected a control sample of
industry and size-matched firms for all override firms except those in the real estate and water
industries invoking industry-wide overrides. That is, the sample of 707 firm-year observations
excludes 434 overrides that are industry-wide practice (e.g., depreciation in the real-estate
industry) and hence no matched sample could be constructed. More specifically, we matched
each TFV firm with the firm from the same three digit SIC code with the closest market value at
11
One limitation of this search procedure is that it is possible that an override occurred but the reporting company
did not formulate it as such in the annual report (i.e., does not explicitly use any of the above terms). However, we
take some assurance that our search was effective from the fact that we identified a large number of overrides that
were separately provided to us by David Tonkin of Company Reporting.
12
the beginning of the TFV firm‟s fiscal year. Whenever the closest market value differed by more
than 20%, a new search was conducted at the two digit SIC code and, if necessary, at the one
digit SIC code. A control firm is used only for one TFV firm in any given year.12
We also require availability of share price data in the fourth month after the end of the
fiscal year because public firms are required to file preliminary reports with the London Stock
Exchange within 120 days from the fiscal year-end and many file the full report within three
months. To verify the adequacy of the matching procedure, we verified that the difference in the
mean and median market value is not significantly different from zero. The use of a matched
sample provides assurance that our comparisons are not affected by cross-sectional variations in
industry-specific factors or firm size, which may capture political cost considerations or other
factors that are not central to our analysis. In addition, within-industry matching works to
mitigate the possibility that a TFV firm and a control firm face fundamentally different
circumstances, which prompt one company to invoke an override because existing rules are
inappropriate for these circumstances.13
5. Empirical procedures and findings
5.1 TYPES OF OVERRIDES
All the override disclosures identified in our search were carefully read and analyzed and
then classified into nine major types of overrides according to the underlying accounting
12
An alternative matching procedure could involve identification of control firms facing similar circumstances that
can potentially give rise to a specific override (e.g., acquisitions of subsidiaries involving recognition of similar
goodwill). The primary reason we did not follow this procedure is that the heterogeneity of override types in the
sample would require substantial judgment on the part of the researcher to identify similar circumstances for control
firms. Second, matching beyond industry and market cap is likely to greatly constrain the size of the control sample. 13
Relatedly, the IASB now employs in IAS 1 the (rebuttable) presumption that compliance with GAAP would not
be misleading if other firms in similar circumstances follow GAAP. In this context, firms within the same industry
as the overriding firm may be presumed to be facing similar circumstances.
13
treatment affected by the override. We then further assign each of the override types to one of the
four cost categories discussed above. Table 1 presents these override types, classified by cost
category, in descending order of frequency. It also shows how many overrides were quantified
in each cost category. The appendix presents further details regarding the expected effect of
each override type on the financial statements. As can be seen from Table 1, Category 1
overrides comprise the majority of the sample, and the rate of occurrence is substantially lower
for Category 4 than for Category 1. Also, the total number of overrides under Categories 2 and 3
(161 observations) is lower than that under Category 1, but higher than that for Category 4. The
most common override type is non-depreciation of investment properties, which is required by
GAAP but disallowed by the Companies Act. Hence this type is a Category 1 override. The
second most frequent override type is non-amortization of goodwill. While UK GAAP allows
for non-amortization, the relevant standard (FRS 10, ASB 1997) does not favor it and,
furthermore, requires annual impairment reviews that have been perceived as costly.14
As non-
amortization of goodwill also stands in contrast to the CA, it is classified as Category 2.
As Table 1 indicates, seemingly similar override types may relate to more than one
category. This is because each case is individually analyzed to determine the rule that was
departed from. Thus, for example, in the case of piecemeal calculation of goodwill, two cases
were found to violate GAAP while the other 32 cases were consistent with GAAP, but
inconsistent with the CA.
The findings in Table 1 show that Category 1 overrides are the most common, and
Category 4 overrides (outright departures from UK GAAP) are much less common. However,
14
The intention of the ASB might have been to encourage non-amortization, but as Davies et al. (1999, p. 769)
comment, “The implication of the ASB‟s definition [of goodwill] encourages the view that the life is normally
indefinite, and not just in exceptional cases….In practice, the impairment test has been seen to be very onerous, and
this has been a powerful disincentive for companies to argue that the life of the goodwill will exceed 20 years.”
14
Category 4 includes 133 firm-year observations invoked by 68 firms in our 5-year sample period,
suggesting that overriding GAAP is a non-negligible phenomenon.
5.2 FIRM PERFORMANCE BY TYPE OF OVERRIDE
In this section, we describe several analyses that provide evidence on whether firms that
invoke TFV overrides are doing so to report more favorable performance (Hypothesis 1). If
firms invoke overrides solely because they want to increase their reported income, or avoid
violation of debt covenants, we would expect to see significant differences in pre-override
performance or debt-related financial indicators between override and control sample firms. On
the other hand, if firms invoke overrides to increase the informativeness of their financial
statements, we would not expect TFV firms to exhibit weaker indicators before the effect of the
override.
First, we examine the annual effect of overrides on income and the cumulative effect on
equity for the subsample of firms that disclose these amounts. The Companies Act and UK
GAAP require that firms invoking a TFV override disclose the particulars of any departure, the
reasons for it and its effect, where the effect is quantified if possible. As reported in Table 1,
only a small number of companies actually quantify the effect of their override. In some cases,
this occurs because a firm would not be able to characterize what number it would have reported,
as in the case of adopting merger (pooling) accounting instead of purchase accounting in
acquisition of a subsidiary In other cases, such as non-depreciation of investment properties,
quantification would require that the firm calculate the depreciation amount it would have
recorded, which is arbitrary if the firm views the asset as having an indefinite life.15
We expect
15 This view is questioned by Company Reporting, a leading UK publication that critically focuses on reporting
practices by listed companies:
Claiming that the effect of an override is not quantifiable is common practice amongst companies
not depreciating investment properties; although we have some difficulty in understanding why
15
that the median income and equity effects of an override are significantly positive if firms invoke
overrides opportunistically. If overrides are not income and equity-increasing, on average, it
seems less likely that they are invoked for opportunistic reasons. However, we note that because
only a fraction of firms quantify their override effects, the median for the sample as a whole may
differ from the median for the sample that disclosed the magnitude of the effects on income and
equity. Furthermore, our tests that the median effect is positive are less powerful than they
would be if based on a larger sample.
Second, we compare the characteristics of TFV firms to a control sample of industry and
size-matched firms. We test whether firms that invoke overrides are less profitable and
financially weaker than firms that do not. It should be noted that to the extent an override is
successful in masking poor performance or financial position, we are less likely to find evidence
supporting opportunistic behavior in measures based on net income. To mitigate potential
effects of overrides on profits, assets and equity, we use two measures to assess underlying
performance before the effect of an override: OPINC, the ratio of operating income before
depreciation and amortization to sales, and CFOTOS, the ratio of cash from operations to sales.
In addition, to assess the tightness of debt covenants before the effect of overrides, we use
DETOFIX, debt to gross book value of tangible fixed assets, and INTCV, the interest coverage
ratio. 16
Note that if contracts regularly contain clauses to undo the effect of overrides, we would
not expect to find an association between debt levels and the occurrence of overrides. Thus,
they are unable to calculate something like two per cent of the carrying value. In contrast, the
remaining … companies tend to state the accounting treatment adopted and why, but often neglect
to mention the requirement from which they are departing or the quantitative effect of that
departure. (Company Reporting, 2000)
16
Beneish and Press (1993) demonstrate that technical violation of accounting-based debt covenants is costly. In
addition, most of the violations in their sample are with respect to tangible net worth. Our focus on fixed tangible
assets in the calculation of DETOFIX thus captures lenders‟ preference for using tangible assets in debt covenants.

16
finding such an association would suggest either contracting parties agree not to undo overrides
or did not originally anticipate them.
To give a comprehensive overview of the results of these tests, we begin by presenting
the findings for the entire sample of firm-years invoking any category of override. Table 2
presents descriptive statistics on several variables for both the TFV and the control samples.17
We calculate the Wilcoxon matched pair signed rank Z-statistic for the median difference in the
firm-specific means of the TFV and control samples, and report the results under the Z heading.
The advantage of this approach is that it is less susceptible to cross-sectional dependence in the
TFV sample. It also mitigates the influence of outliers.
Consistent with the theoretical considerations discussed earlier in the paper, we group the
variables into five categories: override effects, descriptive measures, performance measures, debt
contracting and market-related variables.18
The first category includes the override effects on
equity and income, on a percentage basis, for the subsample of firm-years in which the amount
of the effect was disclosed.19
The mean (median) increase in equity is 5.9% (1.2%) and the mean
(median) effect on income is 9.6% (2.3%). However, only the median effect for equity is
significantly positive with probability value less than 0.001. These findings thus provide some
support for the notion that firms invoking overrides tend to adopt income- and equity-increasing
accounting choices.
The second category includes descriptive measures, and indicates that TFV firms report
SALES (total turnover), INCOME (net income), ASSETS (total assets) and EQUITY (total
17
To ensure that the means reported are not unduly influenced by extreme observations, we exclude observations
with ratios greater than the 99th
percentile or less than the 1st percentile.
18 We also looked at corporate governance variables, such as the number of external directors and the size of the
board. However, we did not find significant differences between TFV firms and control firms. Thus, for brevity, we
do not tabulate the findings of these analyses. 19
The number of quantification observations in Table 2 is fewer than in Table1 due to lack of availability of profit
or equity data or negative values for these amounts.
17
shareholders‟ funds) that are not significantly greater than those of the control group. Turning to
performance measures, we observe that the net profit margin, NETPRO, is not significantly
different for the TFV and control samples. However, TFV firms have significantly lower
depreciation to sales, DTOS, which is not surprising given the large frequency of overrides that
result in non-depreciation of investment properties. The difference in the two measures of pre-
override profitability, CFOTOS and OPINC, are insignificant.
Under the hypothesis that TFV firms are motivated to override accounting rules to avoid
violating a debt covenant, one might expect DETOFIX to be higher for TFV firms. We find that
the median debt to gross fixed assets is indeed greater for TFV firms, suggesting that for the
sample as a whole, concern over leverage ratios may have motivated them to override asset-
reducing standards. Because we measure DETOFIX using gross fixed assets, this measure is not
affected by non-depreciation overrides. Alternatively, INTCV likely reflects the effects of any
income-increasing overrides and here we do not find a significant difference between TFV and
control firms for the entire sample.
Market-based variables comprise the final category of variables in Table 2. The ratio of
book to market value as measured four months after fiscal year-end, BM4M, is significantly
greater for override firms. The ratio of earnings to price, again measured four months after fiscal
year-end, EP4M, is not significantly different. These findings suggest that the market discounts
the equity of TFV firms relative to that of control firms and therefore that investors at least
partially adjust for the financial statement effects of the override.20
In summary, we do not find a significant difference between the pre-override profitability
of TFV firms and those of a size- and industry-matched sample. This may be due, at least in part,
20
It is interesting to note that the mean and median market-to-book ratios of override firms are closer to 1, which
one would expect if their accounting more fully captured their value.
18
to the fact that most of the overrides in Table 2 are mechanical. Nonetheless, we do find that
TFV firms have higher debt to fixed assets, suggesting that a motive for override may be related
to debt contracts.
It is important to recognize that the findings presented in Table 2 reflect the aggregation
of diverse override types. We therefore examine three subsamples, with an aim to understanding
whether differences in performance and debt contracting are observed where the overrides
involve the greatest discretion and are most costly.
The first subsample we examine is that of firms invoking an override to avoid amortizing
goodwill, which we also refer to as the nonamortization of goodwill (NOG) subsample. This
override is conjectured to be costly because it is not the preferred method in FRS 10 and its
implementation involves real costs to review for impairment. As such, it is a Category 2
override, implying that we expect differences in financial performance or position to be more
pronounced than the overall sample. Put differently, firms overriding the principle of amortizing
goodwill may be exercising greater discretion than firms who override the depreciation of
investment property, as FRS 10 indicates that goodwill may have an indefinite useful life in
exceptional cases.
The second subsample we examine is category 4 overrides, firms that override UK
GAAP, which we refer to as the true GAAP override sample. We expect these to be the most
costly overrides and to involve the greatest discretion. The third subsample we examine, the S19
subsample, includes Category 1 overrides of the Companies Act requirement that all fixed assets
of finite life be depreciated, in order to follow the UK GAAP (SSAP 19) requirement that
investment assets be carried at fair value. Because the override is invoked to follow a more
19
authoritative standard, we would not expect to see differences in performance, debt contracts or
governance between firms invoking this override and the control sample.
The results for the non-amortization of goodwill subsample, reported in Table 3, indicate
that firms quantifying the magnitude of their override significantly increase reported income and
shareholders‟ equity by not amortizing goodwill. They also exhibit weaker performance than
that of industry- and size-matched control sample firms. Specifically, OPINC, the ratio of
operating income before depreciation and amortization to sales, and CFOTOS, the ratio of cash
from operations to sales are significantly lower for non-amortizing TFV firms than for control
firms. However, reported net income, net margin, return on equity and return on assets are not
significantly lower, consistent with the income-increasing effect of the override. Second, these
TFV firms have recognized significantly more goodwill than control firms, and due to the
override, report lower amortization as a percent of sales than control firms. This is clearly
reflected in the ratio of ending balance of goodwill and intangible assets to total assets,
GWTOASS, and in new goodwill capitalized during the year, PGWTOASS.21
The picture that
emerges for firms not amortizing goodwill is that they experience profitability before the
override that is lower than the control sample, and which may further deteriorate in the future
should they amortize the large amount of newly recognized goodwill. Third, these firms have a
significantly lower interest coverage ratio. Bearing in mind the lower cash generation, this
suggests that potential concern for violating debt covenants may have motivated the choice not to
amortize goodwill. Finally, investors do not appear to discount the book value or earnings of
these firms relative to the control sample, suggesting that investors view the reported numbers as
comparable to those of firms that did not invoke an override.
21
This finding is consistent with Aboody et al. (2000) who find that acquiring firms‟ tendency to use pooling
methods increases in the step-ups to targets‟ net assets.

20
Our third analysis focuses on overrides of GAAP (Category 4), which we hypothesize
involve the highest cost. We expect to see significant differences in performance relative to
control firms if the higher cost of these departures is offset by greater benefits from reporting the
alternative financial statement amounts. As noted in Table 1, during 1998-2002 we find 133
firm-year observations of GAAP overrides. Given the considerable concern that the SEC and
various commentators have expressed regarding granting managers the ability to depart from
GAAP as well as the lack of sufficient evidence on such departures, we augmented our search to
encompass the nine-year period of 1994-2002. This procedure gives us a larger sample and
longer time series to examine factors associated with GAAP overrides: the resulting subsample
has 203 firm-years.22
Table 4 provides the comparison that pertains to the augmented subsample of GAAP
overrides. Due to limits on data availability, the number of observations for variables other than
override effects varies from 91 to 151 depending on the specific variable. For the subset of firms
that quantified the effect of their override, we find that the equity and income effects are not
significantly different from zero. Firms overriding GAAP are significantly less profitable after
the override than their respective control firms, as reflected in lower net margin and return on
equity, though cash from operations to sales and operating income to sales are not significantly
lower. Consistent with the lower level of reported profitability, interest coverage is also
significantly lower. However, we do not find a higher level of debt to fixed assets for TFV firms.
These findings provide support for the hypothesis that firms overriding GAAP are experiencing
weaker performance or have a greater incentive to raise earnings for debt contracts.
22
The main override types here are as follows: 57 overrides concern violation of requirements of FRS 6 merger
accounting (MER), 21 departures from the requirements of SSAP 4 (GRT), 16 departure from the requirement of
SSAP 12 to depreciate fixed assets (S12), 14 depart from FRS 9 accounting for associates and joint ventures, 13
overrides of SSAP 9 GAAP concerning current assets (MVA), 13 depart from GAAP concerning presentation
matters, 12 of FRS 4, accounting of capital instruments and 10 of FRS 1 presentation of the cash flow statement.
21
In our next subsample analysis, we examine overrides that can be regarded as
“mechanical” in that they represent an accounting treatment that is consistent with GAAP but is
in contrast to the requirements of the Companies Act (i.e., Category 1). This subsample
comprises non-depreciation of investment properties (by non real-estate firms) and is presented
in Table 5. We are interested in this subsample as a benchmark to the analysis of the more costly
overrides, since we do not expect to find significant differences for mechanical overrides. The
median income effect of this override is significantly positive for the subset of firms that
quantified their effects, though none of these overriding firms quantified the equity effect.
However, the net profit margin for TFV firms is not greater than that of control firms. Consistent
with the override, TFV firms report significantly lower depreciation to sales relative to control
firms. Adjusting for depreciation however, the profitability of TFV and control firms seems to
be similar, as OPINC and CFOTOS are not significantly different between TFV and control
firms. The interest coverage ratio is insignificantly different for TFV firms and the debt to fixed
assets ratio, DETOFIX, is significantly lower, suggesting that debt covenants are not tighter for
TFV firms. Lastly, earnings to price, EP4M, is significantly higher for the override sample than
the control sample, indicating that the market at least partially adjusts for the difference in
depreciation and its implications for reported income and book value of equity. The overall
evidence thus seems to support the claim that non-depreciation of investment properties is
mechanical in nature and not an opportunistic accounting choice, consistent with our prediction
for a Category 1 override.23
The previously reported tests are based on a comparison of the TFV firms to industry and
size-matched control firms. The next set of tests examines the change in performance of TFV
23
Note that while the override itself is “mechanical” (all investment properties should not be depreciated under
GAAP), managers‟ identification of certain assets as investment properties may be opportunistic.
22
firms in the year they first adopted an override relative to the prior year. To the extent that
overrides are undertaken to increase income or equity, we would expect to find first-time
adoptions associated with worsening financial conditions. We therefore use the TFV firm in the
year prior to the first override as the control. We present results on the descriptive and
performance-related variables for the sample as a whole, and for the subsample of GAAP
overrides.
The left side of Table 6 presents the findings for the overrides for which we could
identify the first year of the override from the firm‟s financial statements and collect relevant
data for the prior year. The findings indicate that the changes in sales, assets and equity,
SALES, ASSETS and EQUITY, respectively, are all significantly positive, whereas the
change in income, INCOME, is not significantly positive. Consistent with this, the change in
scaled profitability measures, NETPRO, NETROE, and TURNOVER are all significantly
negative. However, the change in our measures of profitability before the effect of the override,
CFOTOS and OPINC, are not significantly negative. The debt contracting variables indicate
a marginally significant increase in debt to fixed assets and a statistically insignificant decline in
interest coverage. Finally, the change in the book-to-market and earnings to price ratios are
significantly positive, consistent with investors discounting book value of equity and earnings,
respectively, in the year of the override, relative to the prior year.
The right side of Table 6 presents the findings for the GAAP override subsample.
Similar to the sample as a whole, the change in scaled profitability measures, NETPRO, and
TURNOVER are significantly negative. In contrast to the entire sample, however, CFOTOS
and OPINC are negative, though CFOTOS is marginally significant. The changes in the debt
contracting variables and the market-based variables are not significantly different from zero.
23
Taken along with the findings in Table 4, the findings suggest that eroding performance may
have contributed to the decision to override GAAP.
Taken as a whole, the findings thus far suggest that firms invoking the more costly
overrides are experiencing weaker profitability. Firms invoking an override to avoid amortizing
goodwill have significantly lower pre-override profitability. Firms invoking an override of UK
GAAP have lower post-override profitability and experienced a significant decline in
profitability in the year of adoption.24
Such firms may also be concerned about violating debt
covenants, such as those based on interest coverage. An interpretation of these results is that in
the UK‟s environment, which is characterized by principle-based rules coupled with significant
deterrents to abuse, some companies would nevertheless be motivated to take advantage of the
TFV requirement. However, this in itself does not imply that with more rigid requirements (i.e.,
a rules-based environment) the frequency and magnitude of accounting manipulations in the UK
would have been lower.
5.3 IMPLICATIONS OF OVERRIDES FOR EARNINGS QUALITY AND INFORMATIVENESS
Our next analysis examines whether investors view TFV firms‟ financial statements as
less informative than those of control firms (Hypothesis 2). In the first set of tests, we focus on
one dimension of informativeness, the explanatory power of reported book value and earnings
per share for share prices. Following Joos and Lang (1994), we assess informativeness by the
adjusted R2 from the regression of share price on reported book value and earnings per share.
25
24
Peasnell, et al. (2005) find that the likelihood of UK managers making income-increasing abnormal accruals
during 1993-1996 to avoid reporting losses and earnings reductions is negatively related to the proportion of
outsiders on the board. 25
Following Barth and Clinch (2001), we examine the sensitivity of our findings to level and deflated regressions.
The untabulated findings are consistent with the estimation results for the deflated regressions we report.
24
Our tests use Ohlson‟s (1995) model relating stock prices to earnings and book values.26
He notes that his model can be interpreted as a weighted average of earnings and book value-
based valuation models. In his model, lower persistence of earnings will be captured by a lower
coefficient on income and a higher coefficient on book value of equity. We separately examine
this relation for positive and negative earnings, given the prior evidence by Hayn (1995) that
negative earnings are of lower persistence.
The estimation equation is
0 1 2 3 4P BV BV NI NI
(1)
where P is the stock price per share measured 4 months after fiscal yearend; BV is the book value
of equity per share; BV is the book value of equity per share times an indicator variable equal to
1 (0) if net earnings per share are negative (non-negative), NI is reported net earnings per share,
and NI is reported net earnings per share times an indicator variable equal to 1 (0) if net earnings
per share are negative (non-negative). We include BVandNI
because the coefficient on net
income is likely lower for reported losses, and the coefficient on book value of equity is likely
higher.27
We expect that 1 > 0, 2 > 0, 3 > 0 and 4 < 0. We estimate equation (1) for the
override and control samples separately, and test for differences in the R2
of the two
subsamples.28
26
For a related empirical application, see Ghosh, et al. (2005). 27
We also estimated a specification permitting a different slope coefficient on book value of equity for loss vs.
profitable firms. Although the coefficient on book value of equity changes, the overall explanatory power remains
similar and the pattern of explanatory power across subsamples is unaffected. We therefore tabulate the simpler
model. 28
Brown, et al. (1999) argue that scale effects in levels regressions increase R2, and this effect increases in the scale
factor‟s coefficient of variation. As a result, comparing R2 across samples is invalid unless the scale effect is
accounted for. They propose calculating the regression coefficient of variation to assess the potential impact of
scale effects. Because the control sample firms are matched to the TFV firms based on size and industry, we control
directly for scale. However, to ensure that these controls are effective, we examine the coefficients of variation to
draw inferences from R2s that are robust to the scale effect. We also applied the approach recommended by Gu
(2002) and find that none of our conclusions are affected.
25
We examine whether more costly overrides (NOG and GAAP) involve a loss of
informativeness. We compare these results to those of the “mechanical override” subsample, for
which we would not expect less informative financial statements. The bottom two rows of Table
7 show the R2 for the override and control subsamples. For the full sample of overrides from
1998-2002, the R2 is 0.65 for the TFV firms, in contrast to 0.47 for the control firms. These
findings indicate that earnings and book value do not have less explanatory power for the share
prices of override firms than for those of control firms. In addition, the untabulated coefficient
of variation is higher for the control sample, so the higher R2
is not due to scale. For the NOG
subsample, we find that both the TFV and control sample regressions have R2‟s of 0.67. Because
the coefficient of variation for the control sample is higher, these findings suggest that the
explanatory power of book value of equity and income for share prices of the override sample is
not less than for the control sample.
The results of the market-based tests for the GAAP overrides subsample are in contrast to
the previous findings. They indicate that the explanatory power of the book value of equity and
income for variation in GAAP override firm share prices is lower than for the control sample.
The coefficient of variation is higher for the override sample however, so the scale effect is not
inducing this finding. Given the findings in Tables 4 and 6, this is also consistent with the view
that GAAP overrides are invoked to mask deteriorating performance in the financial statements.
Finally, we estimate equation (1) for the subsample of firms that do not depreciate
investment properties, a treatment that is consistent with GAAP but inconsistent with the
Companies Act. To the extent that these are merely mechanical overrides, we do not expect to
find similar results to GAAP overrides. Indeed, for this sample, the R2 comparison suggests that
the book value of equity and income reported by override firms have greater explanatory power
26
for share prices than those reported by control firms. The coefficient of variation is greater for
the control sample, again indicating that scale bias is not inducing this result. This finding may
be explained, at least in part, by the fact that firms invoking S19 also annually revalue their
investment properties. Prior literature (e.g., Aboody et al., 1999) suggests that revaluations are
informative, implying that our results may reflect the greater informativeness of revalued
properties.
Our second set of tests of H2 focus on the coefficients on earnings and book values, to
examine whether TFV firms‟ earnings are perceived by investors as less persistent than those of
control firms. This test pools the control and TFV samples, but allows the coefficients to vary
between control and TFV firms. Specifically, we estimate an augmented version of Equation 1:
0 1 1 2 3 4 5 6
7 8
* *
* *
P TFV BV BV N I N I BV TFV BV TFV
N I TFV N I TFV
(2)
where TFV is an indicator variable assuming the value of one if the observation is for a TFV
firm, and zero otherwise.29
We test whether the persistence of earnings, as reflected in stock
prices, differs between TFV firms and control firms. Specifically, if the earnings of TFV firms
are artificially increased by the override and therefore are less persistent, we would expect 7 < 0
and 5 >0. By introducing the interaction variable NI *TFV in (2), we can also examine whether
investors perceive differences in the persistence of negative income, and whether investors
perceive differences in such persistence between TFV and control firms.
The results of this analysis are reported in Table 7. For the entire sample, the evidence
indicates differential weights on income and book value of equity between profit and loss firms.
Consistent with the prediction that losses are less persistent, the incremental coefficient on N I
29
The coefficients for this model are equivalent to those obtained in equation (1) but this specification allows for
direct tests of the difference in coefficients in earnings and book value between the override and control samples.
27
is negative and statistically significant (4 = -6.38, t = -6.74) and the incremental coefficient on
B V E , book value of equity for loss firms, is positive and statistically significant (2 = 0.43, t =
3.36). This finding also largely holds for the coefficients on the three subsamples: the coefficient
on negative net income is negative and significant for all three subsamples and the coefficient on
book value for negative income firms is positive and significant for the NOG and GAAP
override samples, though not for the S19 overrides.
As for the persistence of TFV firm earnings, we find that for profitable firms, the
incremental coefficient on TFV earnings, 7, is positive and statistically significant (7 = 2.81, t =
4.01). This finding indicates that investors perceive these firms to have greater earnings quality
than profitable control firms. Consistent with this, the incremental coefficient on book value of
equity of TFV firms, 5, is negative and significant (5 = -0.24, t = -3.19), indicating a lower
weight on equity in the valuation of TFV firms. For loss firms, the findings indicate an
insignificant incremental coefficient on the book value of equity of TFV firms, (5 = -0.04, t = -
0.25) and a significantly lower coefficient on the earnings of TFV loss firms, consistent with
these TFV firms having less earnings persistence. A substantially similar pattern is observed for
the S19 subsample as well.
In the GAAP override subsample, the findings do not indicate any difference in the
persistence of profit between control and TFV firms. However, 6, the coefficient on book value
for loss firms, BV-, is significantly smaller for override firms than control firms, consistent with
their financial statements being less informative overall. In addition, the coefficient on earnings
for loss firms is marginally significantly negative, suggesting less persistent earnings for loss
firms. These findings suggest that the lesser informativeness of GAAP override firms observed
in the R2 test is due to the firms earning losses.

28
In contrast to the findings for the GAAP override sample, the NOG subsample exhibits
offsetting effects on the persistence of profit and loss override firms, consistent with the finding
of similar R2 „s overall for both the NOG and control samples. For the S19 sample, as mentioned
above, we obtain qualitatively similar findings to those for the sample as a whole.
To summarize, the stock price-based tests indicate that the financial statements of firms
invoking the most costly overrides, the GAAP overrides, have lower explanatory power than
those of their control sample. This finding is in contrast to the findings for firms invoking the
NOG or S19 overrides, and for the override sample as a whole. The coefficient estimates
indicate that the weaker explanatory power of GAAP override firms is due to the market
discounting both the book value and earnings of GAAP override firms with losses. Our findings
therefore suggest investors at least partially discount earnings and book value of the override
firms where strategic use of overrides is most likely. In contrast, for the S19 sample, consistent
with our finding little support that firms invoke these opportunistically, investors view their
earnings as more persistent.
6. Conclusions and TFV under IAS so far
The true and fair view (TFV) concept allows companies to depart from the letter of the
law or a promulgated accounting standard in certain circumstances. The true and fair override
provides a rich and unexplored context for studying how firms exercise discretion over
accounting principles and their motives for exercising this discretion. In addition, this context
allows one to test whether such flexibility is informative and potentially provide insights into the
decades-long debate regarding trade-offs between flexible and rigid accounting rules.
29
We postulate that the incidence of a particular override is negatively related to the
strength of the authoritative support for the principle from which the reporting firm departs. This
is because the greater the support for the standard, the larger the cost of the departure. Our
findings are consistent with this conjecture in that overrides hypothesized to be costly are less
frequent than those hypothesized to be less costly.
We find that firms overriding principles with greater authoritative standing to avoid
amortizing goodwill have experienced weaker performance than industry and size-matched
firms. We find that firms overriding UK GAAP exhibit weaker profitability and experienced a
decline in pre-override profitability in the year the override was first adopted. The finding that
more costly overrides are invoked by firms with weaker financial performance suggests that UK
managers have used the flexibility available to them for reasons not intended by the rules.
Additional evidence suggests firms invoking an override of GAAP provide less informative
financial statements.
In conclusion, this paper contributes to the literature along several dimensions. The
paper‟s analysis helps to assess whether UK companies have taken advantage of the TFV
override to mask unfavorable performance or financial position. This evidence may be useful in
the current debate on whether accounting rules in the US should be more flexible. It also
provides evidence that may be useful to the ongoing deliberations by the SEC as to whether to
allow US firms to follow IAS, and to international accounting researchers who are interested in
the issue of harmonization and the effects of IAS.
In assessing the strength of our results and their applicability to other contexts, four
caveats are in order. First, one should bear in mind that departures from UK GAAP may not be
the same departures US firms or firms from any other country would take. Second, the reporting
30
practices that result in any country are a consequence of their standards, legal environment and
the manner in which standards are enforced, as the Australian experience demonstrated. Given
that the UK is at the high end of the range of enforcement of accounting standards, override
behavior in other countries might differ significantly from the behavior documented in the UK.
Third, only a small fraction of the overrides in our sample are quantified. It is possible that with
greater disclosures one could assess more accurately the effect on revenues, expenses, assets and
liabilities. It remains an open question whether the effect we have documented is representative.
If invoking firms tend to withhold information when the effect is large, our analysis may
underestimate the average impact. Fourth and finally, since 2005, UK companies report under
IAS rules. To the best of our knowledge, the TFV override has been used in only three cases,
two involving an override of pension accounting and the third involving recognition of trading
losses. It remains to be seen whether overrides of IAS GAAP will occur with any frequency, and
if so, whether similar factors to those documented here will motivate them.
31
REFERENCES
Aboody, D., M. Barth and R. Kasznik (1999), „Revaluations of Fixed Assets and Future Firm
Performance: Evidence from the UK‟. Journal of Accounting and Economics, Vol.26, Nos.1-3
(January), pp. 149-178.
Aboody, D., R. Kasznik and M. Williams (2000), „Purchase versus Pooling in Stock-for-Stock
Acquisitions: Why Do Firms Care?‟, Journal of Accounting and Economics, Vol.29, No.3
(June), pp. 261-286.
Accounting Standard Board (ASB) (1992), True and Fair Override Disclosures. UITF Abstract
7. London: ASB.
Accounting Standard Board (ASB) (1993), Forward to Accounting Standards. London: ASB.
Accounting Standard Board (ASB) (1997), Goodwill and Intangible Assets. FRS 10. London:
ASB.
Accounting Standard Board (ASB) (2000), Accounting Policies. FRS 18. London: ASB.
Alexander, D., and S. Archer (2003), “On Economic Reality, Representational Faithfulness and
the „True and Fair Override‟”. Accounting and Business Research, Vol.33, No.1, pp. 3-17.
Barth, M., and G. Clinch (2001), ‟Scale Effects in Capital Markets-Based Accounting Research.‟
Working Paper (Graduate School of Business, Stanford University).
Bebchuk, L. A., J. M. Fried and D. I. Walker (2002), „Managerial Power and Rent Extraction in
the Design of Executive Compensation‟. The University of Chicago Law Review, Vol.69, No.3
(Summer), pp. 751-846.
Beneish, M. D. and E. Press (1993), „Cost of Technical Violation of Accounting-Based Debt
Covenants‟. The Accounting Review, Vol.68, No.2 (April), pp. 233-257.
Benston, G., M. Bromwich and A. Wagenhofer (2006), „Principles- Versus Rules-Based
Accounting Standards: The FASB‟s Standard Setting Strategy‟. Abacus, Vol.42, No.2 (June), pp.
165-188.
Botosan, C. (1997), „Disclosure Level and the Cost of Equity Capital‟. The Accounting Review,
Vol.72, No.3 (July), pp. 323-349.
Brandt. R., S. Fearnley, T. Hines and V. Beattie (1997), „The Financial Reporting Review Panel:
An Analysis of its Activities‟. ICAEW, Financial Reporting Today: Current and Emerging
Issues, 1998. (London: Accountancy Books).
32
Brown, S., K. Lo, and T. Lys (1999), „Use of R2 in Accounting Research: Measuring Changes in
Value Relevance over the Last Four Decades‟. Journal of Accounting and Economics, Vol.28,
No.2 (December), pp. 83-115.
Company Reporting (2000), „Issue of the Month: The True and Fair Override‟. Company
Reporting, Vol.121, pp. 3-32.
Cook, A. (1997), „Requirement for a True and Fair View – a UK Standard-setter‟s Perspective‟.
The European Accounting Review, Vol.6, No. 4 (December), pp. 693-709.
Davies, M., R. Paterson and A. Wilson (1999), in Butterworths Tolley and Ernst & Young (eds.),
UK GAAP (sixth edition) (Croydon, Surrey: Tolley Publishing Co. Ltd).
Dechow, P. M. and C. M. Schrand (2004), „Earnings Quality’. (United States: Research
Foundation of CFA Institute)..
Dichev, I., and D. Skinner (2002), „Large-sample Evidence on the Debt Covenant Hypothesis‟.
Journal of Accounting Research, Vol.40, No.4 (September), pp. 1091-1123.
Ewert, R, and A. Wagenhofer (2005), „Economic Effects of Tightening Accounting Standards to
Restrict Earnings Management‟. The Accounting Review, Vol.80, No.4 (October), pp. 1101-
1124.
Feltham, G., S. Robb and P. Zhang (2007), „Precision in Accounting Information, Financial
Leverage and the Value of Equity.‟ Journal of Business Finance & Accounting, Vol.34, Nos.7 &
8 (September/October), pp. 1099-1122.
Financial Accounting Standards Board (FASB) (2002), „Proposal for a Principles-Based
Approach to U.S. Standard Setting‟. No. 1125-001, (October 21, 2002).
Financial Reporting Council (2005), „The Implications of New Accounting and Auditing
Standards For The “True and Fair View” and Auditors’ Responsibilities.‟ FRN PN 119 (August
9, 2005).
Ghosh, A., Z. Gu and P. C. Jain (2005), „Sustained Earnings and Revenue Growth, Earnings
Quality, and Earnings Response Coefficients‟. Review of Accounting Studies, Vol.10, No.1
(March), pp. 33-57.
Gu, Z. (2007), „Across-sample Incomparability of R2‟s and Additional Evidence on Value
Relevance Changes Over Time‟. Journal of Business Finance and Accounting, Vol.34, Nos.7-8
(September/October), pp. 1073-1098.
Hayn, C. (1995), „The Information Content of Losses‟. Journal of Accounting and Economics,
Vol.20, No. 2 (September), pp. 123-153.
33
Hines, T., K. McBride, S. Fearnley and R. Brandt (2001), „We‟re Off to See the Wizard: An
Evaluation of Directors‟ and Auditors‟ Experiences with the Financial Reporting Review Panel‟.
Accounting, Auditing and Accountability Journal, Vol.14, No.1, pp. 53-84.
Hughes, J. (2008), „SocGen Accounting Prompts Queries‟. Financial Times [London (UK)], 11
March 2008, p. 22.
International Accounting Standard 1 (2003), Presentation of Financial Statements, (London:
International Accounting Standard Board).
Jack, A. (1994), „A Review of the New Financial Reporting Structures” in L. Skerratand D.
Tonkin (eds.), Financial Reporting 1993-1994: A Survey of U.K. Reporting Practice (London:
Institute of Chartered Accountants in England and Wales), pp. 33-51.
Joos, P. and L. Lang (1994), „The Effects of Accounting Diversity: Evidence from the European
Union.‟. Journal of Accounting Research, Vol.32, No.3 (Supplement), pp. 141-168. Kirk, N.
(2006), „Perceptions of the True and Fair View Concept: An Empirical Investigation‟. Abacus,
Vol.42, No.2 (June), pp. 205-235.
La Porta, R., F. Lopez-de-Silanes and A. Shleifer(1998), „Law and Finance‟. Journal of Political
Economy, Vol.106, No.6 (December), pp. 1113-1155.
Leftwich, R. (1983), „Accounting Information in Private Markets: Evidence from Private
Lending Agreements‟. The Accounting Review, Vol.58, No.1 (January), pp. 23-42.
McGregor, W. (1992), „True and Fair View – An Accounting Anachronism‟. Australian
Accountant, Vol.62, No.1 (February), pp. 68-71.
Nobes, C. W. and R. H. Parker (1991), “„True and Fair‟: A Survey of UK Financial Directors”.
Journal of Business Finance and Accounting, Vol.18, No.3 (April), pp. 359-375.
Ohlson, J. A. (1995), „Earnings, Book Values, and Dividends in Equity Valuation‟.
Contemporary Accounting Research, Vol.11, No.2 (Spring), pp. 661-687.
Oswald, D. R. (2008), „The Determinants and Value Relevance of the Choice of Accounting for
Research and Development Expenditures in the United Kingdom‟. Journal of Business Finance
& Accounting, Vol.35, Nos.1-2 (January/March), pp.1-24.
Peasnell, K., P. Pope and S. Young (2001), „The Characteristics of Firms Subject to Adverse
Rulings by the Financial Reporting Review Panel‟. Accounting and Business Research, Vol.31,
No.4 (Autumn), pp. 291-311.
Peasnell, K., P. Pope and S. Young (2005), „Board Monitoring and Earnings Management: Do
Outside Directors Influence Abnormal Accruals?‟. Journal of Business, Finance and Accounting,
Vol.32, No.32 (September/October), pp. 1311-1346.
34
Quick, C. (2001), „Is Big Brother Watching You?‟. The Times (London), 15 March 2001.
U. S. Securities and Exchange Commission (2000), „Concept Release: International Accounting
Standards‟. Release No. 34-42430, Section IV.A.2, 18 February 2000, p. 7.
U. S. Securities and Exchange Commission. (2001), „Division of Corporation Finance:
International Financial Reporting and Disclosure Issues’. 1 May 2001.
http://www.sec.gov/divisions/corpfin/internatl/issues0501.htm
Watts, R. and J.L. Zimmerman (1990), „Positive Accounting Theory: A Ten Year Perspective‟.
The Accounting Review, Vol.65, No.1 (January), pp. 131-156.
35
Table 1: Classification of Firm-year Overrides by Expected Cost Categories 1998-20021
Types of TFV Overrides2
Category
1
Category
2
Category
3
Category
4
Total
Number of
TFV obs.
No depreciation provided for:
Investment properties (S19) 339 339
Fixed assets (S12) 7 7
No amortization of goodwill (NOG) 104 104
Merger accounting used instead of
purchase accounting (MER)
4 50 54
Stepwise calculation of goodwill
(GDW)
32 2 34
Current assets presented at market
value and not cost (MVA)
25 4 29
Grants and contributions not shown
in deferred income (GRT)
24 24
Unrealized gains and losses taken to
the P&L (UGL)
27 27
Not recognizing diminution in value
of investment in parent company‟s
accounts (ITG)
23 23
Other (OTH) 11 9 46 66
Total 413 104 57 133 707
% of total 58.4 14.7 8.1 18.8 100
Num. of quantified overrides
(% of category)
65
(15.8)
39
(37.5)
13
(22.8)
26
(19.4)
143
(20.2)
S19 by Real Estate firms 385 385
GRT by Water firms 49 49
Overrides excluded from sample
above
434
1
Category Description
1. Accounting standards, or similar pronouncements, prescribe one method, which
contradicts the Companies Act (CA) and thus require an override.
2. Accounting standards, or similar pronouncements, allow some choice but effectively
prefer a particular method in most cases. The preferred choice is consistent with the
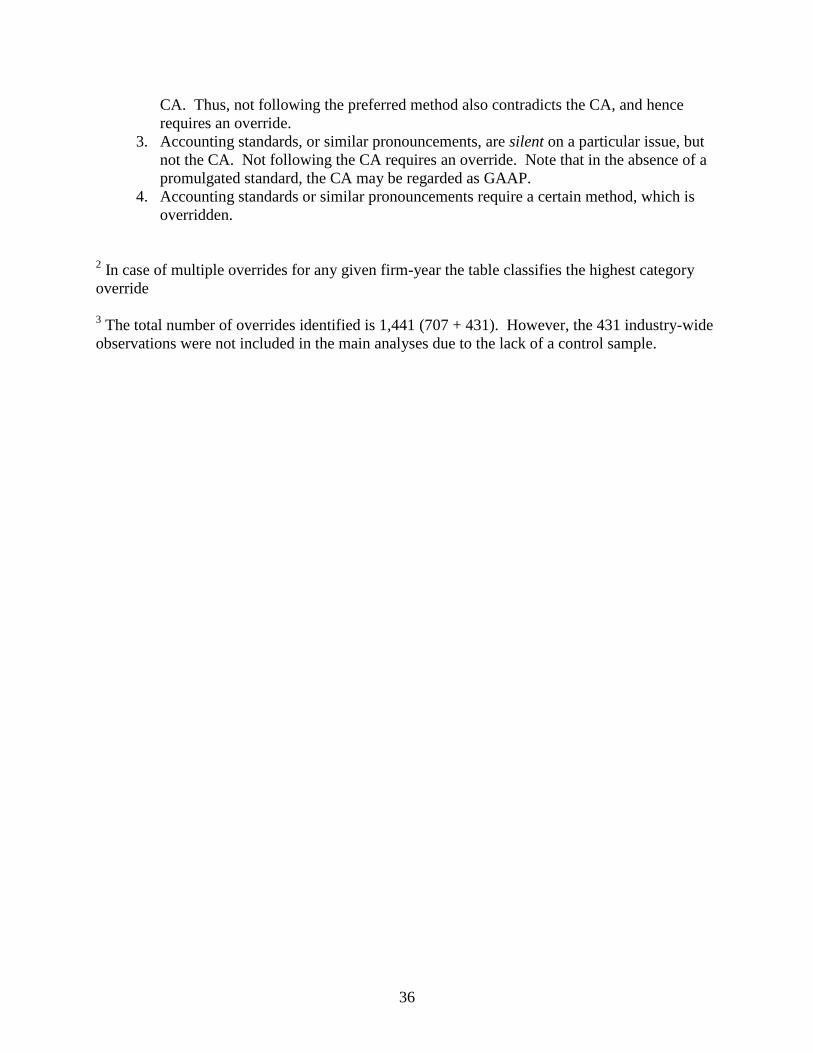
36
CA. Thus, not following the preferred method also contradicts the CA, and hence
requires an override.
3. Accounting standards, or similar pronouncements, are silent on a particular issue, but
not the CA. Not following the CA requires an override. Note that in the absence of a
promulgated standard, the CA may be regarded as GAAP.
4. Accounting standards or similar pronouncements require a certain method, which is
overridden.
2 In case of multiple overrides for any given firm-year the table classifies the highest category
override
3 The total number of overrides identified is 1,441 (707 + 431). However, the 431 industry-wide
observations were not included in the main analyses due to the lack of a control sample.
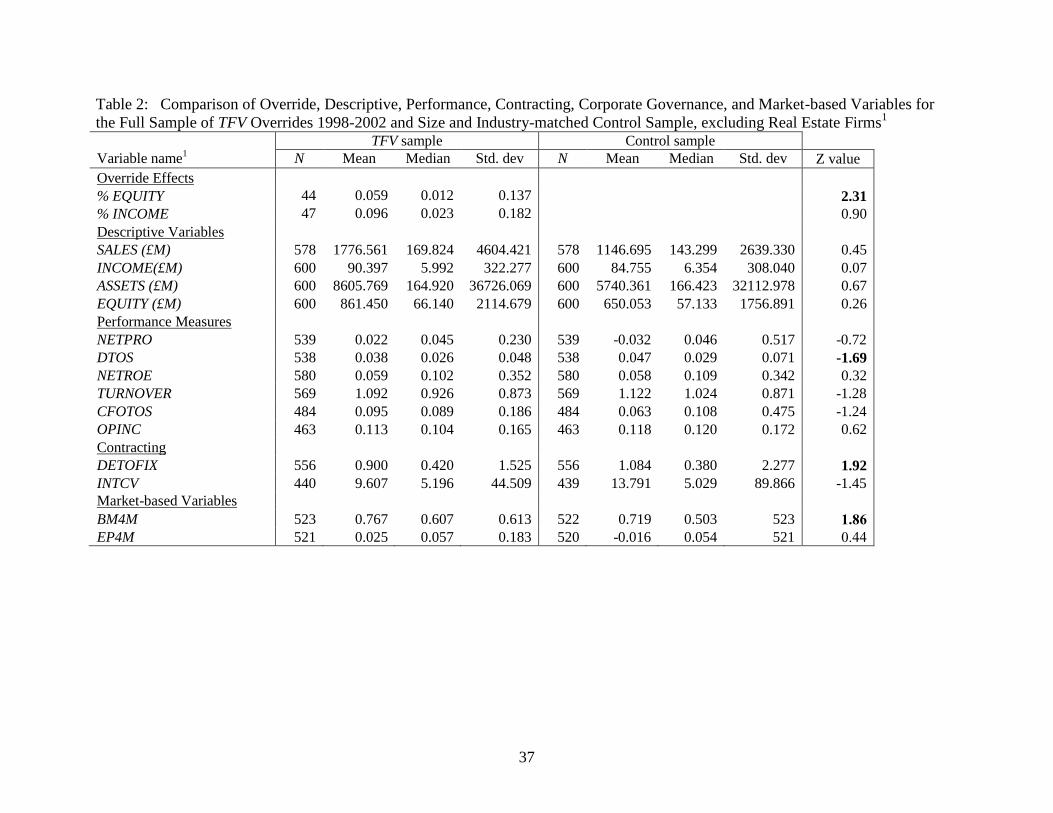
37
Table 2: Comparison of Override, Descriptive, Performance, Contracting, Corporate Governance, and Market-based Variables for
the Full Sample of TFV Overrides 1998-2002 and Size and Industry-matched Control Sample, excluding Real Estate Firms1
TFV sample Control sample
Variable name1
N Mean Median Std. dev N Mean Median Std. dev Z value
Override Effects
% EQUITY 44 0.059 0.012 0.137 2.31
% INCOME 47 0.096 0.023 0.182 0.90
Descriptive Variables
SALES (£M) 578 1776.561 169.824 4604.421 578 1146.695 143.299 2639.330 0.45
INCOME(£M) 600 90.397 5.992 322.277 600 84.755 6.354 308.040 0.07
ASSETS (£M) 600 8605.769 164.920 36726.069 600 5740.361 166.423 32112.978 0.67
EQUITY (£M) 600 861.450 66.140 2114.679 600 650.053 57.133 1756.891 0.26
Performance Measures
NETPRO 539 0.022 0.045 0.230 539 -0.032 0.046 0.517 -0.72
DTOS 538 0.038 0.026 0.048 538 0.047 0.029 0.071 -1.69
NETROE 580 0.059 0.102 0.352 580 0.058 0.109 0.342 0.32
TURNOVER 569 1.092 0.926 0.873 569 1.122 1.024 0.871 -1.28
CFOTOS 484 0.095 0.089 0.186 484 0.063 0.108 0.475 -1.24
OPINC 463 0.113 0.104 0.165 463 0.118 0.120 0.172 0.62
Contracting
DETOFIX 556 0.900 0.420 1.525 556 1.084 0.380 2.277 1.92
INTCV 440 9.607 5.196 44.509 439 13.791 5.029 89.866 -1.45
Market-based Variables
BM4M 523 0.767 0.607 0.613 522 0.719 0.503 523 1.86
EP4M 521 0.025 0.057 0.183 520 -0.016 0.054 521 0.44
38
1 Variable definitions:
Override Effects
%EQUITY– Cumulative effect of override on equity/total equity
%INCOME – Effect of override on income/income, for firm-years with positive income.
Performance Measures
NETPRO – Net profit/sales
DTOS – Depreciation expense/sales
NETROE – Net profit/total equity
TURNOVER – Sales/total assets
CFOTOS – Cash flow from operations/sales
OPINC – Pretax income from operations before depreciation and amortization/sales
Contracting
DETOFIX – Total debt/gross tangible fixed assets
INTCV- Interest coverage ratio, measured as pretax income before interest/ (capitalized interest + interest expense)
Goodwill Related
GWTOASS – Goodwill and other intangibles/total assets
AMTOSALE – Amortization expense/sales
PGWTOASS – Goodwill capitalized during the year
Market-based Variables
BM4M – Book value of equity-to-market value of equity, at four months after end-of-year
EP4M – Earnings-price ratio based on the share price four months after year-end
The z-statistics indicate whether the median override effect is greater than zero, and whether the median of all other variables is
greater for the override sample than for the control sample. Z is based on the mean value of all observations available for any
individual firm. A z-statistic is printed in bold type if it is significant with a probability value less than 0.05.
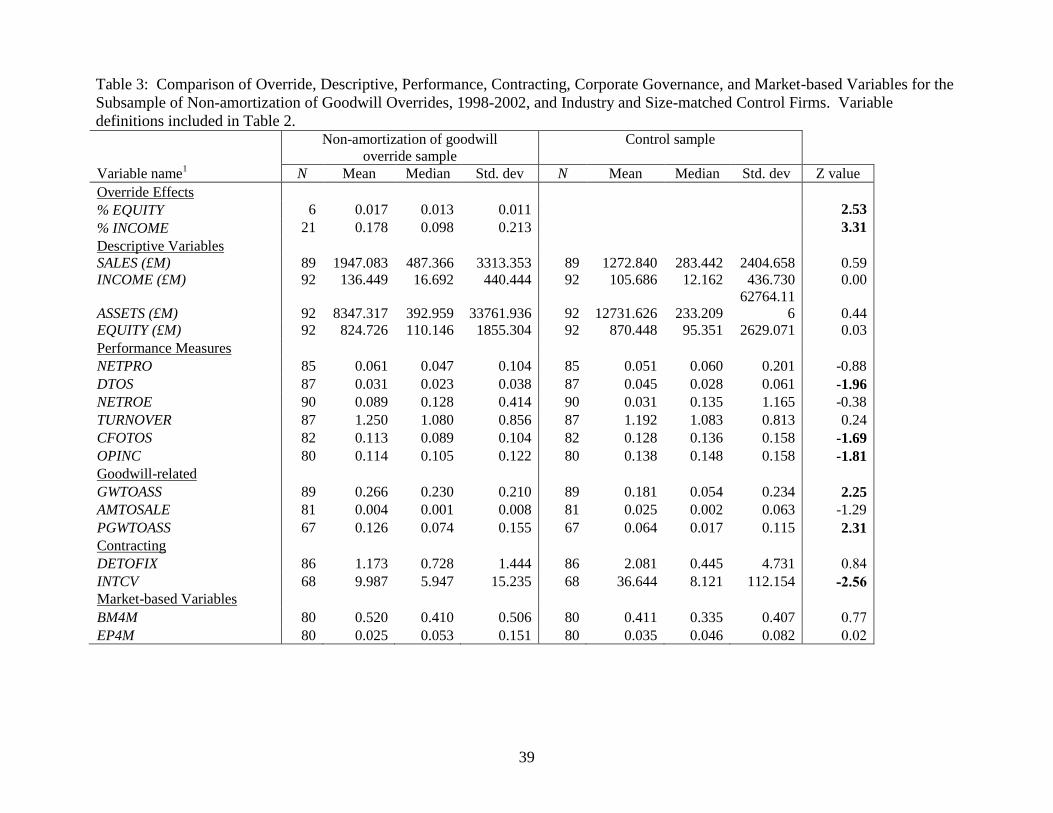
39
Table 3: Comparison of Override, Descriptive, Performance, Contracting, Corporate Governance, and Market-based Variables for the
Subsample of Non-amortization of Goodwill Overrides, 1998-2002, and Industry and Size-matched Control Firms. Variable
definitions included in Table 2.
Non-amortization of goodwill
override sample
Control sample
Variable name1
N Mean Median Std. dev N Mean Median Std. dev Z value
Override Effects
% EQUITY 6 0.017 0.013 0.011 2.53
% INCOME 21 0.178 0.098 0.213 3.31
Descriptive Variables
SALES (£M) 89 1947.083 487.366 3313.353 89 1272.840 283.442 2404.658 0.59
INCOME (£M) 92 136.449 16.692 440.444 92 105.686 12.162 436.730 0.00
ASSETS (£M) 92 8347.317 392.959 33761.936 92 12731.626 233.209
62764.11
6 0.44
EQUITY (£M) 92 824.726 110.146 1855.304 92 870.448 95.351 2629.071 0.03
Performance Measures
NETPRO 85 0.061 0.047 0.104 85 0.051 0.060 0.201 -0.88
DTOS 87 0.031 0.023 0.038 87 0.045 0.028 0.061 -1.96
NETROE 90 0.089 0.128 0.414 90 0.031 0.135 1.165 -0.38
TURNOVER 87 1.250 1.080 0.856 87 1.192 1.083 0.813 0.24
CFOTOS 82 0.113 0.089 0.104 82 0.128 0.136 0.158 -1.69
OPINC 80 0.114 0.105 0.122 80 0.138 0.148 0.158 -1.81
Goodwill-related
GWTOASS 89 0.266 0.230 0.210 89 0.181 0.054 0.234 2.25
AMTOSALE 81 0.004 0.001 0.008 81 0.025 0.002 0.063 -1.29
PGWTOASS 67 0.126 0.074 0.155 67 0.064 0.017 0.115 2.31
Contracting
DETOFIX 86 1.173 0.728 1.444 86 2.081 0.445 4.731 0.84
INTCV 68 9.987 5.947 15.235 68 36.644 8.121 112.154 -2.56
Market-based Variables
BM4M 80 0.520 0.410 0.506 80 0.411 0.335 0.407 0.77
EP4M 80 0.025 0.053 0.151 80 0.035 0.046 0.082 0.02
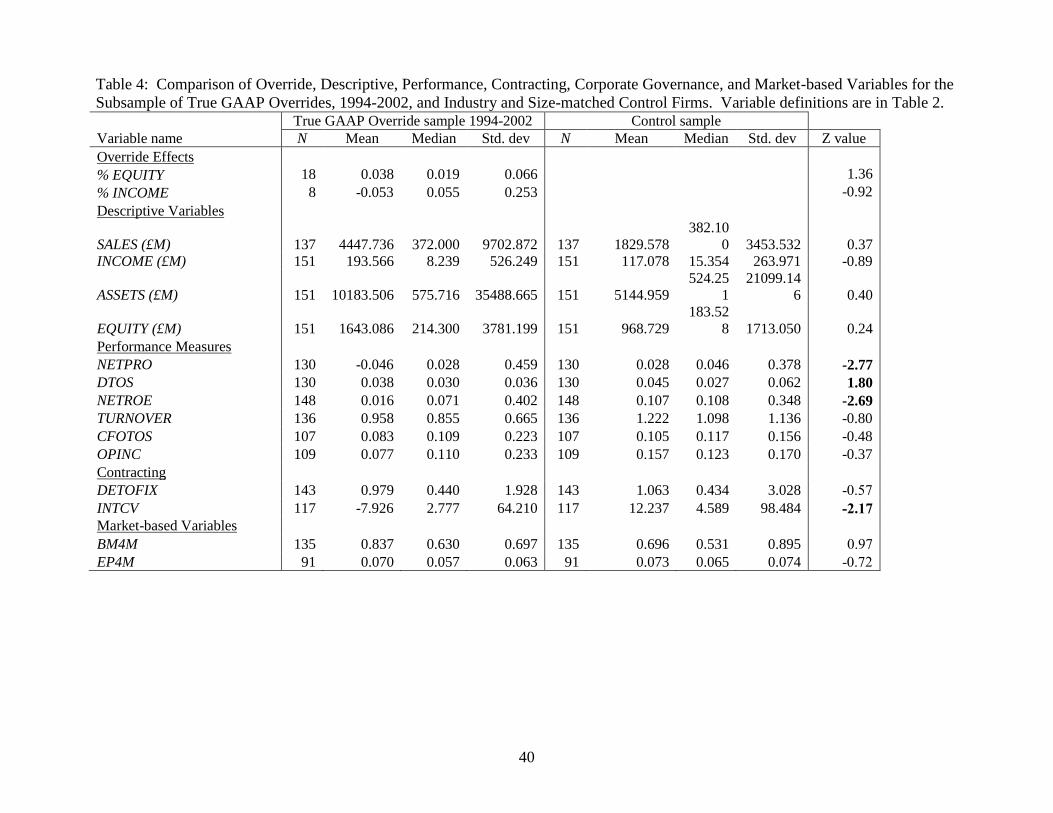
40
Table 4: Comparison of Override, Descriptive, Performance, Contracting, Corporate Governance, and Market-based Variables for the
Subsample of True GAAP Overrides, 1994-2002, and Industry and Size-matched Control Firms. Variable definitions are in Table 2.
True GAAP Override sample 1994-2002 Control sample
Variable name
N Mean Median Std. dev N Mean Median Std. dev Z value
Override Effects
% EQUITY 18 0.038 0.019 0.066 1.36
% INCOME 8 -0.053 0.055 0.253 -0.92
Descriptive Variables
SALES (£M) 137 4447.736 372.000 9702.872 137 1829.578
382.10
0 3453.532 0.37
INCOME (£M) 151 193.566 8.239 526.249 151 117.078 15.354 263.971 -0.89
ASSETS (£M) 151 10183.506 575.716 35488.665 151 5144.959
524.25
1
21099.14
6 0.40
EQUITY (£M) 151 1643.086 214.300 3781.199 151 968.729
183.52
8 1713.050 0.24
Performance Measures
NETPRO 130 -0.046 0.028 0.459 130 0.028 0.046 0.378 -2.77
DTOS 130 0.038 0.030 0.036 130 0.045 0.027 0.062 1.80
NETROE 148 0.016 0.071 0.402 148 0.107 0.108 0.348 -2.69
TURNOVER 136 0.958 0.855 0.665 136 1.222 1.098 1.136 -0.80
CFOTOS 107 0.083 0.109 0.223 107 0.105 0.117 0.156 -0.48
OPINC 109 0.077 0.110 0.233 109 0.157 0.123 0.170 -0.37
Contracting
DETOFIX 143 0.979 0.440 1.928 143 1.063 0.434 3.028 -0.57
INTCV 117 -7.926 2.777 64.210 117 12.237 4.589 98.484 -2.17
Market-based Variables
BM4M 135 0.837 0.630 0.697 135 0.696 0.531 0.895 0.97
EP4M 91 0.070 0.057 0.063 91 0.073 0.065 0.074 -0.72
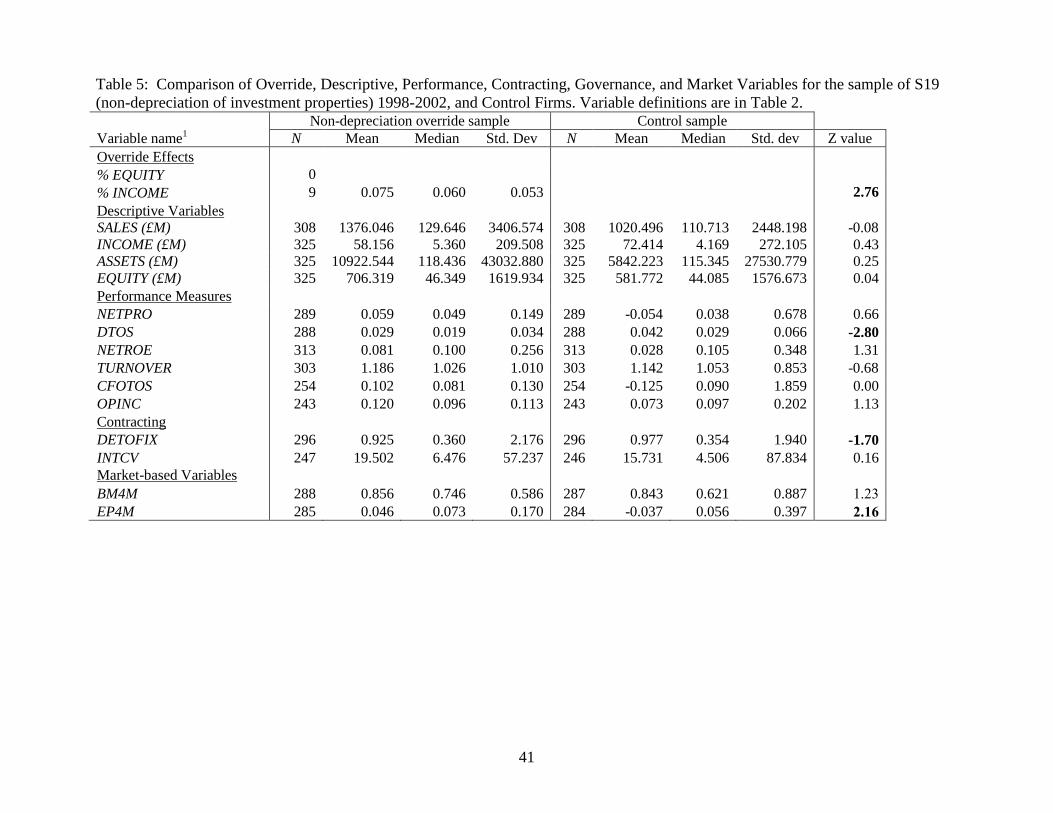
41
Table 5: Comparison of Override, Descriptive, Performance, Contracting, Governance, and Market Variables for the sample of S19
(non-depreciation of investment properties) 1998-2002, and Control Firms. Variable definitions are in Table 2.
Non-depreciation override sample Control sample
Variable name1
N Mean Median Std. Dev N Mean Median Std. dev Z value
Override Effects
% EQUITY 0
% INCOME 9 0.075 0.060 0.053 2.76
Descriptive Variables
SALES (£M) 308 1376.046 129.646 3406.574 308 1020.496 110.713 2448.198 -0.08
INCOME (£M) 325 58.156 5.360 209.508 325 72.414 4.169 272.105 0.43
ASSETS (£M) 325 10922.544 118.436 43032.880 325 5842.223 115.345 27530.779 0.25
EQUITY (£M) 325 706.319 46.349 1619.934 325 581.772 44.085 1576.673 0.04
Performance Measures
NETPRO 289 0.059 0.049 0.149 289 -0.054 0.038 0.678 0.66
DTOS 288 0.029 0.019 0.034 288 0.042 0.029 0.066 -2.80
NETROE 313 0.081 0.100 0.256 313 0.028 0.105 0.348 1.31
TURNOVER 303 1.186 1.026 1.010 303 1.142 1.053 0.853 -0.68
CFOTOS 254 0.102 0.081 0.130 254 -0.125 0.090 1.859 0.00
OPINC 243 0.120 0.096 0.113 243 0.073 0.097 0.202 1.13
Contracting
DETOFIX 296 0.925 0.360 2.176 296 0.977 0.354 1.940 -1.70
INTCV 247 19.502 6.476 57.237 246 15.731 4.506 87.834 0.16
Market-based Variables
BM4M 288 0.856 0.746 0.586 287 0.843 0.621 0.887 1.23
EP4M 285 0.046 0.073 0.170 284 -0.037 0.056 0.397 2.16

42
Table 6: Analysis of Differences between First Year of Override and the Prior Year for Descriptive, Performance, Contracting, and
Market Variables. Positive (negative) value implies year of override higher (lower) than prior year.
Entire sample 1998-2002 GAAP override sample 1994-2002
Variable name1
N Mean Median Std. Dev Z
Value
N Mean Median Std. dev Z Value
Descriptive Variables
SALES (£M) 224 185023.12 6539.50 1299122.72 3.83 46 225275.81 9 2513000 0.03
INCOME (£M) ) 225 -35424.28 218.00 461337.72 0.17 46 -63903.12 -1094 323494 -1.01
ASSETS (£M) ) 225 1476257.49 14212.00 16431363.20 3.96
46
4720054.8
7 4682 35601056 2.04
EQUITY (£M) ) 225 -15166.39 4458.00 2049770.24 4.25 46 -75410.83 4359.5 3902808 0.73
Performance Measures
NETPRO 207 -0.022 -0.006 0.166 -2.62 41 -0.125 -0.028 0.274 -3.03
DTOS 213 0.042 0.001 0.429 3.30 41 0.027 0.01 0.067 3.70
NETROE 196 -0.047 -0.010 0.273 -2.73 37 -0.025 -0.046 0.293 -1.31
TURNOVER 224 -0.106 -0.011 0.529 -2.47 46 -0.154 -0.038 0.559 -1.95
CFOTOS 199 -0.028 -0.009 0.247 -0.51 43 -0.071 -0.024 0.522 -1.63
OPINC 166 -0.002 0.001 0.095 0.21 37 -0.082 -0.015 0.266 -1.88
Contracting
DETOFIX 221 0.414 0.013 13.244 1.65 25 0.005 -0.005 0.243 -0.30
INTCV 173 -0.343 -0.145 11.43 -0.97 23 0.72 -0.804 6.149 -0.42
Market-based Variables
BM4M 206 0.168 0.057 0.567 4.25 42 0.129 0.031 0.435 1.29
EP4M 155 -0.006 0.008 0.266 2.99 25 0.007 -0.001 0.139 0.02
Variable definitions:
Performance Measures
NETPRO – Change in net profit/sales in the first year of the override relative to the prior year.
DTOS – Change in depreciation expense/sales in the first year of the override relative to the prior year.
NETROE – Change in net profit/total equity in the first year of the override relative to the prior year.
TURNOVER – Change in sales/total assets in the first year of the override relative to the prior year.
CFOTOS – Change in cash flow from operations/sales in the first year of the override relative to the prior year.
OPINC – Change in pretax income from operations before depreciation and amortization/sales in the first year of the override
relative to the prior year.
Contracting
DETOFIX – Change in total debt/gross tangible fixed assets in the first year of the override relative to the prior year.
43
INTCV- Change in interest coverage ratio, measured as pretax income before interest/ (capitalized interest + interest expense) relative
to the prior year.
Market-based Variables
BM4M – Change in the ratio of book value of equity-to-market value of equity (measured at four months after end-of-year), in the
first year of the override relative to the prior year.
EP4M – Change in the earnings-price ratio based on the share price four months after year-end relative to the prior year.
Each of the above measures is included only once for each firm. The z-statistic indicates whether the median of the variables is
greater for the override sample than for the control sample. A z-statistic is printed in bold type if it is significant with a probability
value less than 0.05.
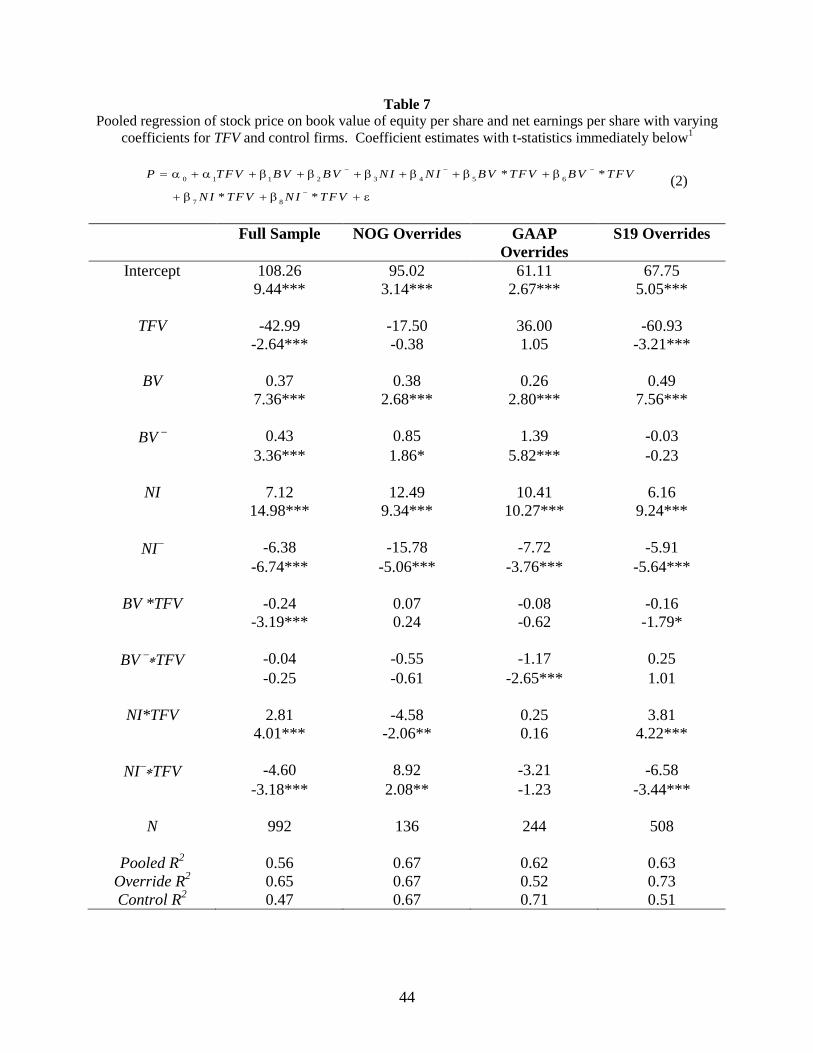
44
Table 7
Pooled regression of stock price on book value of equity per share and net earnings per share with varying
coefficients for TFV and control firms. Coefficient estimates with t-statistics immediately below1
0 1 1 2 3 4 5 6
7 8
* *
* *
P TFV BV BV N I N I BV TFV BV TFV
N I TFV N I TFV
(2)
Full Sample NOG Overrides GAAP
Overrides
S19 Overrides
Intercept 108.26 95.02 61.11 67.75
9.44*** 3.14*** 2.67*** 5.05***
TFV -42.99 -17.50 36.00 -60.93
-2.64*** -0.38 1.05 -3.21***
BV 0.37 0.38 0.26 0.49
7.36*** 2.68*** 2.80*** 7.56***
BV
0.43 0.85 1.39 -0.03
3.36*** 1.86* 5.82*** -0.23
NI 7.12 12.49 10.41 6.16
14.98*** 9.34*** 10.27*** 9.24***
NI -6.38 -15.78 -7.72 -5.91
-6.74*** -5.06*** -3.76*** -5.64***
BV *TFV -0.24 0.07 -0.08 -0.16
-3.19*** 0.24 -0.62 -1.79*
BVTFV -0.04 -0.55 -1.17 0.25
-0.25 -0.61 -2.65*** 1.01
NI*TFV 2.81 -4.58 0.25 3.81
4.01*** -2.06** 0.16 4.22***
NITFV -4.60 8.92 -3.21 -6.58
-3.18*** 2.08** -1.23 -3.44***
N 992 136 244 508
Pooled R2
0.56 0.67 0.62 0.63
Override R2 0.65 0.67 0.52 0.73
Control R2 0.47 0.67 0.71 0.51
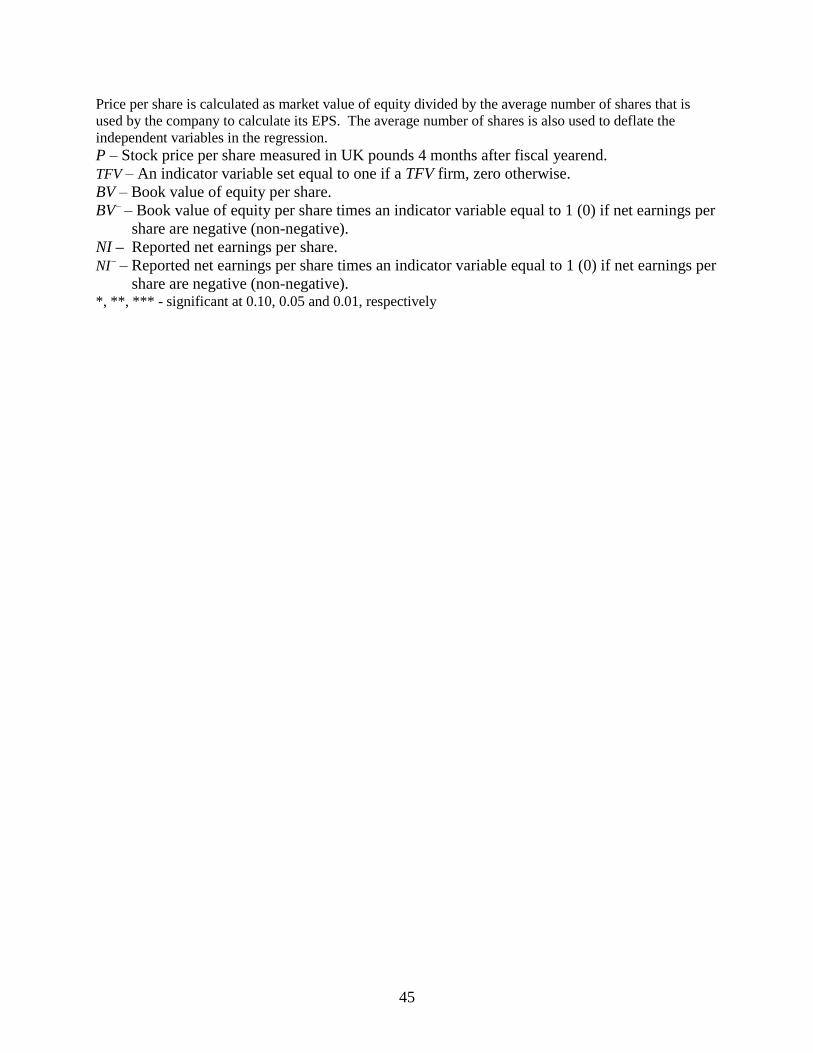
45
Price per share is calculated as market value of equity divided by the average number of shares that is
used by the company to calculate its EPS. The average number of shares is also used to deflate the
independent variables in the regression.
P – Stock price per share measured in UK pounds 4 months after fiscal yearend.
TFV – An indicator variable set equal to one if a TFV firm, zero otherwise.
BV – Book value of equity per share.
BV – Book value of equity per share times an indicator variable equal to 1 (0) if net earnings per
share are negative (non-negative).
NI – Reported net earnings per share.
NI – Reported net earnings per share times an indicator variable equal to 1 (0) if net earnings per
share are negative (non-negative). *, **, *** - significant at 0.10, 0.05 and 0.01, respectively
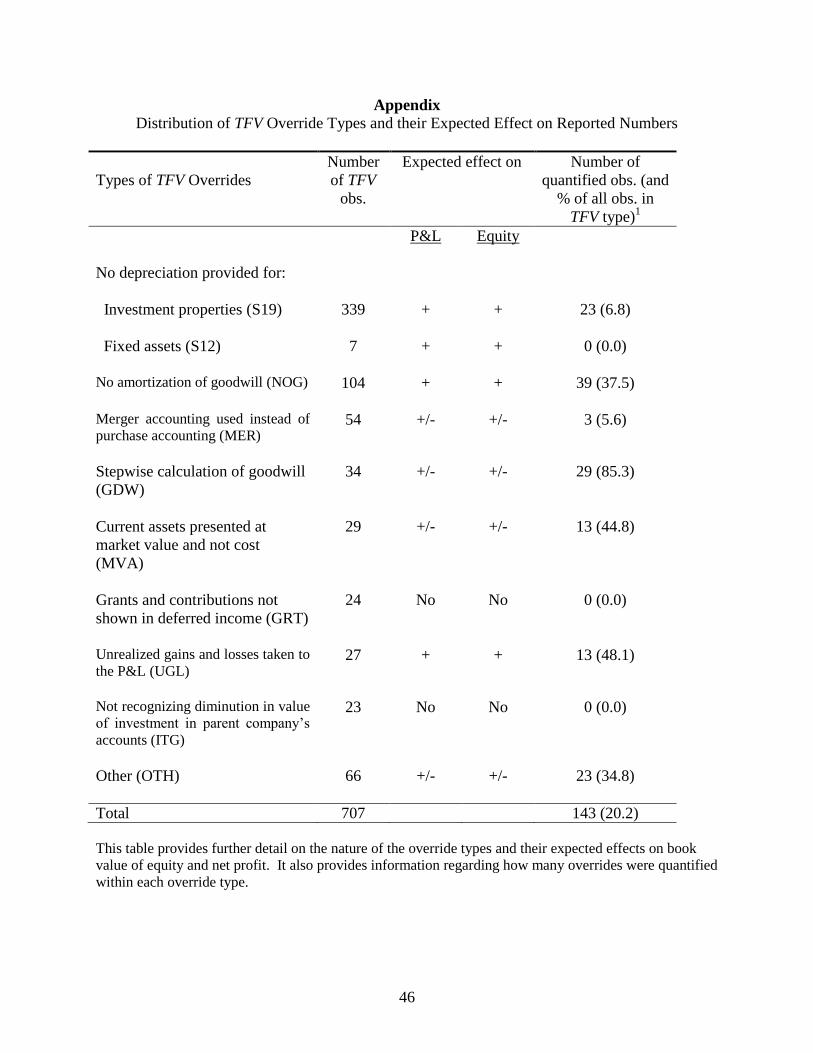
46
Appendix
Distribution of TFV Override Types and their Expected Effect on Reported Numbers
Types of TFV Overrides
Number
of TFV
obs.
Expected effect on Number of
quantified obs. (and
% of all obs. in
TFV type)1
P&L Equity
No depreciation provided for:
Investment properties (S19) 339 + + 23 (6.8)
Fixed assets (S12) 7 + + 0 (0.0)
No amortization of goodwill (NOG) 104 + + 39 (37.5)
Merger accounting used instead of
purchase accounting (MER)
54 +/- +/- 3 (5.6)
Stepwise calculation of goodwill
(GDW)
34 +/- +/- 29 (85.3)
Current assets presented at
market value and not cost
(MVA)
29 +/- +/- 13 (44.8)
Grants and contributions not
shown in deferred income (GRT)
24 No No 0 (0.0)
Unrealized gains and losses taken to
the P&L (UGL)
27 + + 13 (48.1)
Not recognizing diminution in value
of investment in parent company‟s
accounts (ITG)
23 No No 0 (0.0)
Other (OTH) 66 +/- +/- 23 (34.8)
Total 707 143 (20.2)
This table provides further detail on the nature of the override types and their expected effects on book
value of equity and net profit. It also provides information regarding how many overrides were quantified
within each override type.