Permian fauna of the Krkonoše Piedmont Basin (Bohemian Massif, Central Europe)
AN ASSESSMENT OF FISH COMMUNITIES ALONGA PIEDMONT RIVER RECEIVING ORGANIC POLLUTION
(ACONQUIJA MOUNTAINS, ARGENTINA).
Evaluación de las comunidades de peces a lo largo de un ríopiedemonte que recibe contaminación orgánica
(Montañas de Aconquija, Argentina).
LUIS FERNÁNDEZ1,2; JOSÉ A. BECHARA3
1 CONICET, Instituto Fundacion Miguel Lillo; Miguel Lillo 251, 4000Tucumán, Argentina.2 IBIGEO, Instituto de Bio y Geociencias Museo Ciencias Naturales deSalta, Mendoza 2, 4400 Salta, Argentina. [email protected] Instituto de Ictiología del Nordeste. Facultad de Ciencias Veterinarias,Universidad Nacional del Nordeste y Consejo Nacional deInvestigaciones Científicas y Técnicas. Sargento Cabral 2139. 3400Corrientes. Argentina (deceased in March 8, 2008).
Presentado 12 de mayo de 2009, aceptado 17 de septiembre de 2009, correcciones 22 de octubre de 2009.
ABSTRACT
The relationships between fish assemblage structure and environmental variables along apollution gradient in the Medina River were analyzed over a year in four sampling sites (S1-S4). The river flows in a mountain-plain transition and is affected by several small townwastewater and sugar cane industries effluents. Environmental variables were divided intwo sets, hereafter named “pollution” and “natural”. The first set included water qualityvariables modified by anthropogenic activities such as D.O. (Dissolved Oxygen), C.O.D.(Chemical Demand Oxygen), and dissolved ion concentrations. Natural variables includedaltitude, position, and time of the year. The upstream site (S1) had the lowest speciesrichness and C.P.U.E. (catch per unit of effort). The number of species and density increaseddownriver (S2-S3). S1 was inhabited by an invertivore species (Trichomycterus corduvensis) thathas low tolerance to adverse environmental conditions, and has high D.O. requirements.S4 sustained the most tolerant and abundant species (Otocinclus vittatus, Corydoras paleatus),which endure the lowest D.O. and the highest C.O.D. A Canonical Correspondence Analysisfor natural variables showed a significant gradient of species composition related to altitudeand discharge. Water quality degradation by sugar cane factories and urban development,coupled with natural climatic, topographic and hydrological factors explained a significantamount of spatial and temporal variation in fish community structure (�48%). Natural andpollution variables shared about 15% of total variance. However, pollution variables werenot significant after partitioning out the effects of natural variables. Natural variabilityremained significant after removal of pollution effects.
Key words: organic pollution, river gradients, Neotropical fish, canonical analyses,environmental factors.
Acta biol. Colomb., Vol. 15 N.º 2, 2010 79 - 100

RESUMEN
Las relaciones entre la estructura de una comunidad de peces y variables ambientales alo largo de un gradiente de polución en el Río Medina fue analizado por un año en cuatrositios muestreados (S1-S4). El río corre en una transición de montaña-llanura y esafectado por descargas de efluentes de pueblos e ingenios azucareros. Las variablesambientales fueron divididas en dos grupos, denominados “polución” y “natural”. Elprimer conjunto incluyó variables de calidad de agua modificadas por actividadesantropogénicas tales como D.O. (Oxígeno Disuelto), C.O.D. (Demanda Química deOxígeno), y concentración de iones disueltos. Las variables naturales incluidas fueronaltitud, ubicación, y tiempo del año. Río arriba (S1) tuvo la más baja riqueza de especiesy C.P.U.E. (Captura Por Unidad de Esfuerzo); pero río abajo incrementa el número deespecies y densidad (S2-S3). S1 estaba habitado por especies invertívoras (Trichomycteruscorduvensis), teniendo baja tolerancia a condiciones ambientales y altos requerimientosde D.O. S4 tuvo las especies más tolerantes y abundantes (Otocinclus vittatus, Corydoraspaleatus), soportando los más bajos D.O. y los más elevados C.O.D. Un Análisis de Co-rrespondencia Canónico mostró un gradiente en la composición de especies relacionadoa altitud y descarga para las variables naturales. La degradación de la calidad del aguapor ingenios azucareros y efluentes urbanos, con factores climáticos naturales, topo-gráfico e hidrológico explicaron la variación espacial y temporal de la estructura decomunidad de peces (=48%). Variables naturales y contaminación compartieron el 15%de la varianza total. Sin embargo, las variables de contaminación no fueron significatesdespués de la partición de los efectos de las variables natural, pero la variabilidad naturalpermaneció significativa después de remover los efectos de polución.
Palabras clave: contaminación orgánica, gradientes de río, peces neotropicales, análisiscanónicos, factores ambientales.
INTRODUCTION
Urbanization often results in habitat degradation in streams and rivers, contributing todecreased ecological health in many watersheds around the globe. This is an acceleratingprocess, because it is expected that by 2025, perhaps 60% of people globally and 83% inEurope and the Americas will live in cities (Morley and Karr, 2002). Overexploitation andenvironmental pollution of rivers, caused by increasing human populations, are among themain reasons of decline in fish assemblages (Mercado-Silva et al., 2003).Beginning around 1900 and greatly increasing during the last 20 years, fish communitystructure has been employed to measure relative ecosystem health (Simon, 1998). Avariety of quantitative indices can be used to define specific biological criteria, includingindicator species or guilds, species richness, weighted diversity indexes, and similarityindices. In addition, the sentinel species approach has been used under the assumptionthat the morphological or life history characteristics of two species provide goodindication of the condition of the whole environment (Kovacs et al., 2002; Davies andJackson, 2006, Rodriguez-Olarte et al., 2006). Also useful are the Index of Well-Being,multivariate ordination and classification, and the Index of Biotic Integrity (Simon,1998; Doberstein et al., 2000; Morley and Karr, 2002).
80 Artículo - Evaluación de las comunidades de peces a lo largo de un río piedemonte que recibe contaminación orgánica (Montañas de Aconquija, Argentina). Fernández, Bechara.

Several studies have documented changes in fish spatial distribution as a result ofpollution plumes and sewage outfalls, as well as non-point source effects such asagricultural runoff, siltation, and cultural eutrophication (Allan et al., 2001, Meade, 2004;Mol and Ouboter, 2004; Wright and Flecker, 2004; Scott, 2006; Allan et al., 2006). Amonitoring approach, integrating fish assemblage structure and other biological indicatorinformation that reflect the integrity of the water resource directly, along with waterchemistry, physical habitat, toxicity testing, landscape, as well as complementarymonitoring is central to accurately defining today’s varied and complex environmentalproblems (Yoder and Smith, 1999).Analyses of ecological patterns generally aim to understand the functioning of ecologicalsystems and fish-habitat relationships (Schlosser, 1987; Poizat and Pont, 1996). Severalecologists have used canonical multivariate analyses to identify and interpret statisticallysignificant patterns in fish assemblage structure as they relate to environmentalconditions (Rodriguez and Lewis, 1997; Maret, 1999; Bechara et al., 2000; Winemilleret al., 2000; Petry et al., 2003; Vila-Gispert et al., 2003). In Argentina, few attempts havebeen made to quantify the impact of human activities on the biological status of fishresources in freshwaters, such as Menni et al., 1984, Menni et al., 1996, Miquelarena etal., 1990, Bistoni et al., 1999, Bechara et al., 2000 and Hued and Bistoni, 2005. Moreover, longitudinal patterns in community structure are a trait common to all riversand the relative role of upstream versus downstream process has important implicationsfor the management and conservation of Andean rivers (Allan et al., 2006). Several riversthat drain the Andean region are affected by human pollution (Fernández, 2005). Forexample, Domínguez and Fernández, 1998, mentioned that the Medina and Chico riversare polluted by sugar cane factory activity and sewage. According to those authors, inthe Medina River, total and coliform bacteria had low values during spring and summerperiods, while on autumn and winter they increased to levels that threatened humanhealth (Domínguez and Fernández, 1998). As a consequence, anthropogenic andnatural effects may be confounded along the watershed and it may be difficult todiscriminate them when analyzing factors affecting fish communities. Partial CanonicalCorrespondence Analysis (PCCA) combined with variance partitioning techniques maybe useful tool to generate hypotheses concerning the influence of different sets ofvariables (Borcard et al., 1992, ter Braak and Smilauer, 1998) on community structure.This technique has been applied with success in a large variety of environments andtaxonomic groups (Magnan et al., 1994; Bechara et al., 2000; Cottenie et al., 2003;Halpern et al., 2006).The objective of the present study was to assess the ecological conditions and mainstructural patterns of fish communities as related to natural spatio-temporal gradientsand anthropogenic effects in the vicinity of industries (i.e., sugar cane factories) andsmall towns located along the Medina River in Tucumán Province, Argentina, by usingthree complementary approaches. First, the study focused on species richness, catchper unit of effort (C.P.U.E.), and guilds along the longitudinal gradient of the river. Thesecond approach involved characterization of spatial and temporal variability of thefish community structure as related to pollution and natural physical variables. Finally,we deconstructed the relative contribution of natural variables respective to waterquality variables anthropogenically altered in explaining fish community structure.
Acta biol. Colomb., Vol. 15 N.º 2, 2010 81

MATERIAL AND METHODS
STUDY AREA
The Medina River (Fig. 1) originates in the Aconquija Mountains (Cochuna and Cañasrivers) at an altitude of 660 m above sea level (a.s.l.) and flows in a northwestern-southeastern direction into the Río Hondo Reservoir together with other three majorrivers: Marapa, Gastona, and Salí. The upper portion of those rivers, up to about 400m asl, runs along a subtropical montane cloud forest, known as Yungas. The MedinaRiver is 123 km in length with a 2,348.3 km2 drainage area, and 18.05 m3/s mean flowat the mouth into the Río Hondo reservoir (Domínguez and Fernández, 1998). Amarked seasonality in precipitation regime usually occurs. There is a strong contrastbetween the warmer half-year (October-March) with frequent thunderstorms, and thecooler half-year (April-September) when only 20 percent of the annual rainfall occurs(Hunzinger, 1995). During the winter, some months are completely rainless. Normally,short and intense rains (November and March) affect a limited area, while long durationand low intensity precipitation (May and September) affects a large area (Hunzinger,1995). The mountain receives more than 1,500 mm of precipitation per year, in contrastwith the 600 mm in the plains. As a consequence, the river usually supports heavy floodsduring the late spring and late summer, adding to the snow melt from the AconquijaMountains in the spring. During the driest period in the rest of the years the watercourseusually flows at low levels. The main pollution inputs to the river include runoff fromagricultural activities, sugar cane processing effluents, and sewage outflows from severalsmall towns. The continuity of the river reach is not interrupted by dams permanentlyblocking the flow, but water diversion for agriculture and industry is a common practice,reducing annual average discharge downriver and probably affecting the natural thermalregime, particularly in sites S2-S3 (Table 1).
Fig. 1. Map of Tucumán Province showing the sampling sitesalong Medina River: 1. Dique Villa Lola (S1); 2. Aguilares(S3); 3. La Trinidad (S3); 4. Monteagudo (S4).
82 Artículo - Evaluación de las comunidades de peces a lo largo de un río piedemonte que recibe contaminación orgánica (Montañas de Aconquija, Argentina). Fernández, Bechara.
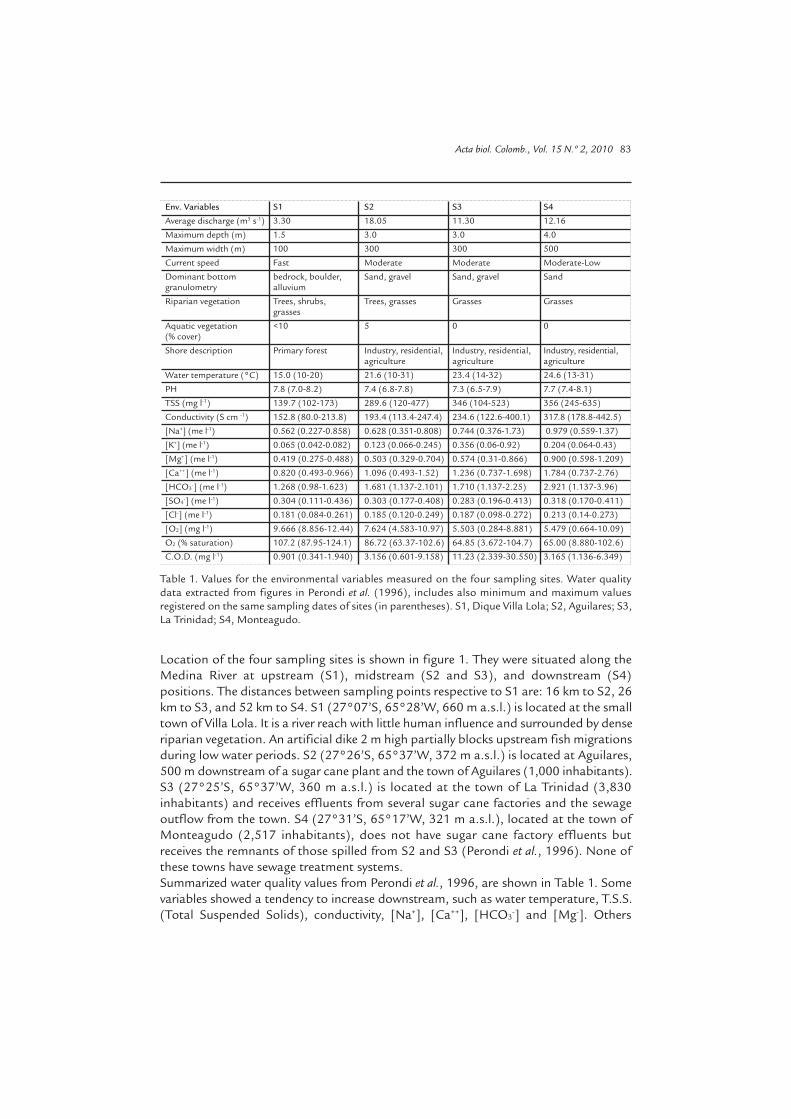
Env. Variables S1 S2 S3 S4Average discharge (m3 s-1) 3.30 18.05 11.30 12.16Maximum depth (m) 1.5 3.0 3.0 4.0Maximum width (m) 100 300 300 500Current speed Fast Moderate Moderate Moderate-LowDominant bottom bedrock, boulder, Sand, gravel Sand, gravel Sandgranulometry alluviumRiparian vegetation Trees, shrubs, Trees, grasses Grasses Grasses grassesAquatic vegetation <10 5 0 0(% cover)Shore description Primary forest Industry, residential, Industry, residential, Industry, residential, agriculture agriculture agricultureWater temperature (°C) 15.0 (10-20) 21.6 (10-31) 23.4 (14-32) 24.6 (13-31)PH 7.8 (7.0-8.2) 7.4 (6.8-7.8) 7.3 (6.5-7.9) 7.7 (7.4-8.1)TSS (mg l-1) 139.7 (102-173) 289.6 (120-477) 346 (104-523) 356 (245-635)Conductivity (S cm -1) 152.8 (80.0-213.8) 193.4 (113.4-247.4) 234.6 (122.6-400.1) 317.8 (178.8-442.5)[Na+] (me l-1) 0.562 (0.227-0.858) 0.628 (0.351-0.808) 0.744 (0.376-1.73) 0.979 (0.559-1.37)[K+] (me l-1) 0.065 (0.042-0.082) 0.123 (0.066-0.245) 0.356 (0.06-0.92) 0.204 (0.064-0.43)[Mg+] (me l-1) 0.419 (0.275-0.488) 0.503 (0.329-0.704) 0.574 (0.31-0.866) 0.900 (0.598-1.209)[Ca++] (me l-1) 0.820 (0.493-0.966) 1.096 (0.493-1.52) 1.236 (0.737-1.698) 1.784 (0.737-2.76)[HCO3
-] (me l-1) 1.268 (0.98-1.623) 1.681 (1.137-2.101) 1.710 (1.137-2.25) 2.921 (1.137-3.96)[SO4
-] (me l-1) 0.304 (0.111-0.436) 0.303 (0.177-0.408) 0.283 (0.196-0.413) 0.318 (0.170-0.411)[Cl-] (me l-1) 0.181 (0.084-0.261) 0.185 (0.120-0.249) 0.187 (0.098-0.272) 0.213 (0.14-0.273)[O2] (mg l-1) 9.666 (8.856-12.44) 7.624 (4.583-10.97) 5.503 (0.284-8.881) 5.479 (0.664-10.09)O2 (% saturation) 107.2 (87.95-124.1) 86.72 (63.37-102.6) 64.85 (3.672-104.7) 65.00 (8.880-102.6)C.O.D. (mg l-1) 0.901 (0.341-1.940) 3.156 (0.601-9.158) 11.23 (2.339-30.550) 3.165 (1.136-6.349)
Table 1. Values for the environmental variables measured on the four sampling sites. Water qualitydata extracted from figures in Perondi et al. (1996), includes also minimum and maximum valuesregistered on the same sampling dates of sites (in parentheses). S1, Dique Villa Lola; S2, Aguilares; S3,La Trinidad; S4, Monteagudo.
Location of the four sampling sites is shown in figure 1. They were situated along theMedina River at upstream (S1), midstream (S2 and S3), and downstream (S4)positions. The distances between sampling points respective to S1 are: 16 km to S2, 26km to S3, and 52 km to S4. S1 (27°07’S, 65°28’W, 660 m a.s.l.) is located at the smalltown of Villa Lola. It is a river reach with little human influence and surrounded by denseriparian vegetation. An artificial dike 2 m high partially blocks upstream fish migrationsduring low water periods. S2 (27°26’S, 65°37’W, 372 m a.s.l.) is located at Aguilares,500 m downstream of a sugar cane plant and the town of Aguilares (1,000 inhabitants).S3 (27°25’S, 65°37’W, 360 m a.s.l.) is located at the town of La Trinidad (3,830inhabitants) and receives effluents from several sugar cane factories and the sewageoutflow from the town. S4 (27°31’S, 65°17’W, 321 m a.s.l.), located at the town ofMonteagudo (2,517 inhabitants), does not have sugar cane factory effluents butreceives the remnants of those spilled from S2 and S3 (Perondi et al., 1996). None ofthese towns have sewage treatment systems.Summarized water quality values from Perondi et al., 1996, are shown in Table 1. Somevariables showed a tendency to increase downstream, such as water temperature, T.S.S.(Total Suspended Solids), conductivity, [Na+], [Ca++], [HCO3
-] and [Mg-]. Others
Acta biol. Colomb., Vol. 15 N.º 2, 2010 83

decreased downriver, such as [SO4-] and D.O. (Dissolved Oxygen). In contrast, C.O.D.
(Chemical Demand Oxygen) and [K-] rose steadily to S3, and then declined. pH was higherat S1, decreased at S2 and S3 and rose again at S4. At S3 and S4, very low values of D.O.occurred during winter or early spring months, periods which also exhibited the highestC.O.D. values. Oxygen supersaturation occurred in summer samples, mainly in S1 and S2.
DATA COLLECTION
Physical and chemical variables of the river. Monthly sampling was carried out betweenAugust 1992 and August 1993. Sampling was performed at three locations below (S2,S3 and S4) and one location above (S1) the discharge of sugar cane industries andsewage outflows from the small towns. Logistical problems, heavy rains and river floodsprecluded sampling during August and December 1992 and March and May 1993.Data on environmental variables were obtained from Perondi et al., 1996, who reportedwater quality values corresponding to the same sampling sites and dates (Table 1).Variables included water temperature, pH, Total Suspended Solids , conductivity, anionand cation concentrations (Na+, K+, Ca++, Mg++, HCO3
-, Cl-, and SO4-), D.O. (in mg/l and% saturation) and C.O.D., the latter employed as an indicator of total dissolved organicmatter. Other environmental variables such as depth, channel width, vegetation andbottom granulometry were obtained by the authors by direct measurement in the fieldor visual inspection. Average discharge values were obtained from “Estaciones de Aforo deAgua y Energía Eléctrica” from Provincial Government.
FISH SAMPLING
Each of the four sites was sampled by the same crew along a 200 m shoreline on onemargin of the river using dip nets 60 cm long and 40 cm wide, and nylon beach seines3 m length and 1 m high (2 mm mesh opening screen) at a maximum depth of 60 cm.The surveys, using all sampling gear, were conducted for approximately 50 minutes ateach site. The techniques were slightly different according to the substrates. In thepresence of large boulders such as at S1, the use of beach seines was restricted to openalluvium or bedrock sectors.Captured fishes were fixed in formalin and later preserved in 70% ethanol for storage andidentification. Results were recorded as presence-absence and number of specimenscaptured per unit effort (CPUE). This later variable was estimated as the total number offish caught in 50 minutes, by pooling the two mentioned sampling devices. Voucherspecimens of the 22 species found were preserved at Museo de Ciencias Naturales, UniversidadNacional de Salta, Argentina (MCNI 1351-1368, 1373-1379 and 1381-1388).Fish species were classified in feeding guilds and habitat types using available information.In some species (Heptapterus mustelinus, Trichomycterus barbouri, T. corduvensis and Characidiumcf. zebra), between 10 and 25 stomach contents were analyzed, and fish species wereclassified in one of the following feeding guilds: algivore, herbivore, omnivore, piscivore, orinvertivore. Data on the diet composition for others species were obtained from Casatti andCastro, 1998, Castro and Casatti, 1997, Costa, 1987, Ferriz, 1998, Fernández, 2000, Horeauet al., 1998, Lima-Junior and Goitein, 2003, and Merona and Rankin-de-Merona, 2004. Fish were classified by habitat use according to different authors (Casatti et al., 2001;Peretti and Fatima Andrian, 2004; Pouilly et al., 2004). The following categories were
84 Artículo - Evaluación de las comunidades de peces a lo largo de un río piedemonte que recibe contaminación orgánica (Montañas de Aconquija, Argentina). Fernández, Bechara.

established: benthic, mid-water, surface, riffle, and pool. The number of species andpercentage contribution per feeding guild and habitat use was determined for every siteby pooling all collections.
STATISTICAL ANALYSES
To quantify resemblance in species composition between sites, we employed the Jaccardindex of similarity based on presence-absence data (Legendre and Legendre, 1998).Species from all sampling dates were pooled.Canonical correspondence analysis (CCA; ter Braak, 1986) was carried out to detect themain ecological patterns of variation in species assemblages that can be significantlyexplained by the available environmental variables. This multivariate statistical approachalways takes into account species relative abundance even if data are in absolute values.The species data matrix consisted in 31 sampling units and the CPUE of 12 selectedspecies from the 22 recorded (Table 2). The following rare species, that appeared onlyonce in the sampler, were not included in the analysis due to the sensitivity of themethod to outliers: Astyanax rutilus, A. abramis, Bryconamericus iheringi, Cheirodon interruptus,Eigenmannia trilineata, Hoplosternum littorale, Cichlasoma dimerus, Cyphocharax spilotus,Pimelodella laticeps and Trichomycterus barbouri. This elimination of rare species resultedin five empty CPUE samples which had to be deleted from the matrix to perform CCA.As a result, data matrices consisted of 32 sampling units instead of the original 36.In a first step, two different CCA were performed: (1) using the “pollution” data matrix,that consisted in 14 water quality variables as described above (Table 1). For the sake ofsimplicity we will refer to these data as “pollution variables” [P] in these data. To achievea better fit of environmental variables and species data, the later were transformed tonatural log (x+1). Some environmental variables that did not conform to normality weretransformed to natural log (x+1) (C.O.D.), squared root (TSS) or exponential of 2.5(D.O.); (2) another CCA was carried out employing “natural” variables of the river suchas substrate, position in the longitudinal gradient, altitude, vegetation, width, depth, andcurrent speed. For the sake of simplicity we will refer as natural variables [N] in these data.Vegetation cover was coded as a dummy variable for each category, coding them as “1”when present and “0” when absent (Legendre and Legendre, 1998). Sampling date inmonths was coded as an ordinal index from 1 (January) to 12 (December) and wasincluded as a natural variable to account for temporal trends along the study periodfollowing Magnan et al., 1994. Substrate was also coded as an ordinal index, taking intoaccount grain size, from the largest (boulders; coded 3) to the smallest (sand; coded 1). Statistical analyses were done with CANOCO Version 4.0 (ter Braak and Smilauer, 1998).Environmental variables were selected using forward stepwise procedures as implementedin CANOCO at P<0.15, so as to reduce the chances of artificial increase in explainedvariance as well as multicolinearity. This cut-off point allowed keeping variance inflationfactor (VIF) for all selected environmental variables below 5. Downweighting of rarespecies as implemented in CANOCO 4.0 was also applied to reduce the excessiveinfluence of species having high densities and low frequency of occurrence.Since pollution variables may be confounded with natural variables, we decomposed thetotal variability in fish community structure explained by these two different sets of datausing the technique of Borcard et al., 1992. The procedure consisted in the following steps:
Acta biol. Colomb., Vol. 15 N.º 2, 2010 85

86 Artículo - Evaluación de las comunidades de peces a lo largo de un río piedemonte que recibe contaminación orgánica (Montañas de Aconquija, Argentina). Fernández, Bechara.
Spec
ies
Acr
onym
s
S
1
S2
S
3
S4
Fee
ding
gro
up
H
abita
t
R
iffle
/Poo
lA
crob
ryco
n ta
rijae
Fow
ler 1
941
Acr
tar
-
1
4
18
7
Inve
rtiv
ore
Mid
-wat
er
Riff
leA
stya
nax
asun
cione
nsis
Ger
y 19
72
Ast
asu
-
8
1
6
56
O
mni
vore
M
id-w
ater
R
iffle
Ast
yana
x ru
tilus
(Jen
yns
1982
)
A
st ru
t
-
-
2
1
Inve
rtiv
ore
Mid
-wat
er
Riff
leA
stya
nax
abra
mis
(Jen
yns
1842
)
Ast
abr
-
-
-
1
Inve
rtiv
ore
Mid
-wat
er
Riff
leBr
ycon
amer
icus i
herin
gi(B
oule
nger
188
7)
B
ry ih
e
1
-
-
-
Inve
rtiv
ore
Mid
-wat
er
Riff
leCi
chla
som
a di
mer
us(H
ecke
l 184
0)
C
ic d
im
-
-
2
-
Om
nivo
re
Mid
-wat
er
Poo
lCo
rydo
ras p
alea
tus(
Jeny
ns 1
842)
C
or p
al
-
3
5
7
D
etrit
ivor
e
B
enth
ic
R
iffle
Cyph
ocha
rax
spilo
tusV
ari 1
987
Cyp
spi
-
-
-
4
Det
ritiv
ore
Mid
-wat
er
Riff
leCh
arac
idiu
mcf
. zeb
raEi
genm
ann
1909
C
ha z
eb
5
16
3
2
In
vert
ivor
e
B
enth
ic
R
iffle
Chei
rodo
n in
terr
uptu
s(Je
nyns
184
2)
Che
int
-
-
3
-
O
mni
vore
M
id-w
ater
R
iffle
Eige
nman
nia
trili
neat
a(V
alen
cien
nes
1842
)
Eig
tri
-
-
1
-
Inve
rtiv
ore
Mid
-wat
er
Poo
lH
epta
pter
us m
uste
linus
(Val
enci
enne
s 18
42)
H
ep m
us
5
1
8
3
-
In
vert
ivor
e
B
enth
ic
R
iffle
Hop
lost
ernu
m li
ttora
leH
anco
ck 1
828
Hop
lit
-
-
3
-
In
vert
ivor
e
B
enth
ic
R
iffle
Hyp
osto
mus
cord
ovae
(Gun
ther
188
0)
H
yp c
or
3
29
7
3
A
lgiv
ore
Bent
hic
Riff
leJe
nyns
ia m
ultid
enta
ta(J
enyn
s 18
42)
J
en m
ul
-
4
-
-
Om
nivo
re
Sur
face
Poo
lRi
nelo
ricar
ia ca
tam
arce
nsis
(Ber
g 18
95)
R
in c
ar
1
33
7
1
A
lgiv
ore
Bent
hic
Riff
leO
dont
ostil
be m
icroc
epha
laEi
genm
ann
1907
O
do m
ic
-
7
1
3
49
O
mni
vore
M
id-w
ater
R
iffle
Oto
cinclu
s vitt
atus
Reg
an 1
904
Oto
vit
-
3
3
6
294
A
lgiv
ore
Bent
hic
Riff
lePi
mel
odel
la la
ticep
sEig
enm
ann
1917
Pi
m la
t
-
2
2
1
In
vert
ivor
e
B
enth
ic
R
iffle
Pim
elod
us a
lbica
ns(V
alen
cien
nes
1840
)
Pim
alb
-
-
1
-
Pi
sciv
ore
B
enth
ic
R
iffle
Trich
omyc
teru
s cor
duve
nsis
Wey
enbe
rgh
1877
Tr
i cor
2
8
11-
-
-
In
vert
ivor
e
B
enth
ic
R
iffle
Trich
omyc
teru
s bar
bour
i(Ei
genm
ann
1911
)
Tri
bar
-
1
1
-
Inve
rtiv
ore
Ben
thic
Riff
leTo
tal a
bund
ance
44
149
123
4
26
-
-
-To
tal n
umbe
r of s
peci
es
6
13
1
5
13
-
-
-
Tabl
e 2.
Lis
t of s
peci
es a
nd a
vera
ge c
aptu
re p
er u
nit e
ffor
t (C
PUE,
50
min
utes
sam
plin
g) a
t the
four
diff
eren
t loc
atio
ns w
ith it
s co
rres
pond
ing
clas
sific
atio
nof
feed
ing
and
habi
tat g
uild
s. S
1, D
ique
Vill
a Lo
la; S
2, A
guila
res;
S3,
La
Trin
idad
; S4,
Mon
teag
udo.
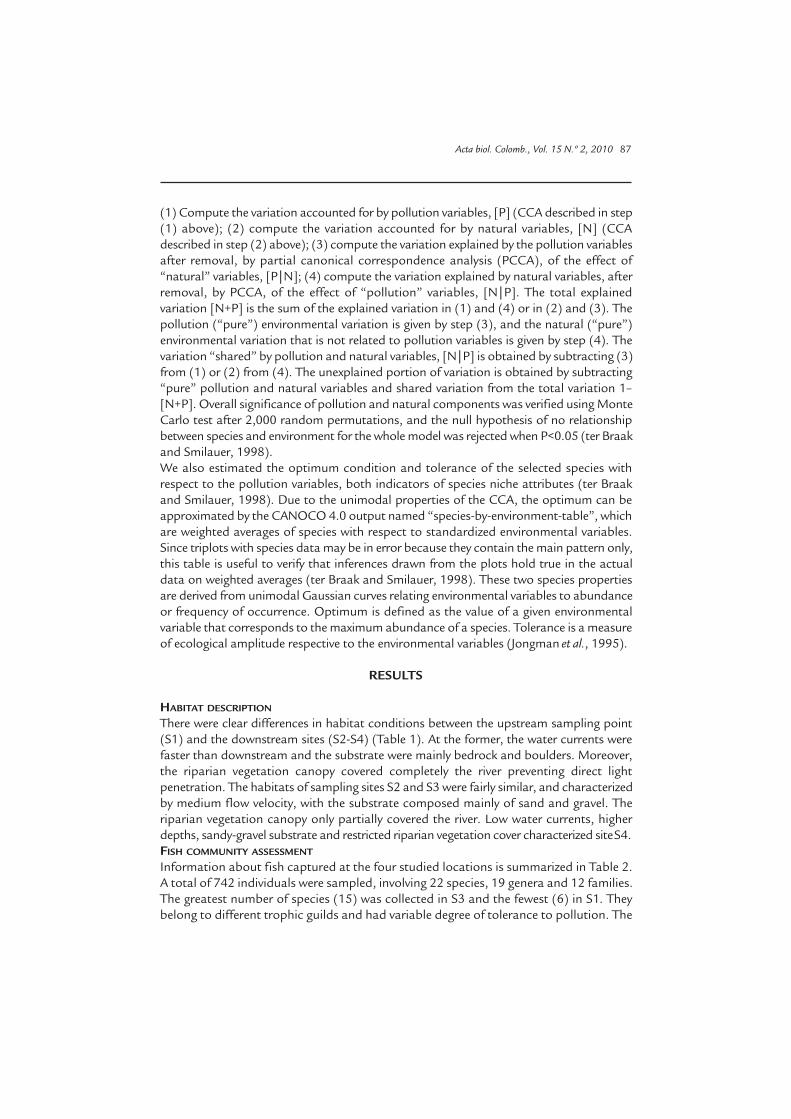
(1) Compute the variation accounted for by pollution variables, [P] (CCA described in step(1) above); (2) compute the variation accounted for by natural variables, [N] (CCAdescribed in step (2) above); (3) compute the variation explained by the pollution variablesafter removal, by partial canonical correspondence analysis (PCCA), of the effect of“natural” variables, [P|N]; (4) compute the variation explained by natural variables, afterremoval, by PCCA, of the effect of “pollution” variables, [N|P]. The total explainedvariation [N+P] is the sum of the explained variation in (1) and (4) or in (2) and (3). Thepollution (“pure”) environmental variation is given by step (3), and the natural (“pure”)environmental variation that is not related to pollution variables is given by step (4). Thevariation “shared” by pollution and natural variables, [N|P] is obtained by subtracting (3)from (1) or (2) from (4). The unexplained portion of variation is obtained by subtracting“pure” pollution and natural variables and shared variation from the total variation 1–[N+P]. Overall significance of pollution and natural components was verified using MonteCarlo test after 2,000 random permutations, and the null hypothesis of no relationshipbetween species and environment for the whole model was rejected when P<0.05 (ter Braakand Smilauer, 1998).We also estimated the optimum condition and tolerance of the selected species withrespect to the pollution variables, both indicators of species niche attributes (ter Braakand Smilauer, 1998). Due to the unimodal properties of the CCA, the optimum can beapproximated by the CANOCO 4.0 output named “species-by-environment-table”, whichare weighted averages of species with respect to standardized environmental variables.Since triplots with species data may be in error because they contain the main pattern only,this table is useful to verify that inferences drawn from the plots hold true in the actualdata on weighted averages (ter Braak and Smilauer, 1998). These two species propertiesare derived from unimodal Gaussian curves relating environmental variables to abundanceor frequency of occurrence. Optimum is defined as the value of a given environmentalvariable that corresponds to the maximum abundance of a species. Tolerance is a measureof ecological amplitude respective to the environmental variables (Jongman et al., 1995).
RESULTS
HABITAT DESCRIPTION
There were clear differences in habitat conditions between the upstream sampling point(S1) and the downstream sites (S2-S4) (Table 1). At the former, the water currents werefaster than downstream and the substrate were mainly bedrock and boulders. Moreover,the riparian vegetation canopy covered completely the river preventing direct lightpenetration. The habitats of sampling sites S2 and S3 were fairly similar, and characterizedby medium flow velocity, with the substrate composed mainly of sand and gravel. Theriparian vegetation canopy only partially covered the river. Low water currents, higherdepths, sandy-gravel substrate and restricted riparian vegetation cover characterized siteS4.FISH COMMUNITY ASSESSMENT
Information about fish captured at the four studied locations is summarized in Table 2.A total of 742 individuals were sampled, involving 22 species, 19 genera and 12 families.The greatest number of species (15) was collected in S3 and the fewest (6) in S1. Theybelong to different trophic guilds and had variable degree of tolerance to pollution. The
Acta biol. Colomb., Vol. 15 N.º 2, 2010 87

Site
s/
A
cr
A
st
B
ry
C
ic
C
or
C
ha
C
he
C
yp
H
ep
Hop
Hyp
Jen
Rin
Odo
Oto
Pim
P
im
Tr
ic
S
item
onth
t
ar
asu
ihe
dim
pal
z
eb
i
nt
s
pi
m
us
lit
c
or
m
ul
ca
r
m
ic
v
it
alb
lat
cor
.
Tot
alS1
Se
-
-
-
-
-
1
-
-
-
-
-
-
-
-
-
-
-
2
3S1
Oc
-
-
-
-
-
-
-
-
-
-
-
-
-
-
-
-
-
6
6
S1 N
o
-
-
-
-
-
-
-
-
2
-
-
-
-
-
-
-
-
4
6S1
Ja
-
-
1
-
-
1
-
-
3
-
-
-
1
-
-
-
-
9
15
S1 F
e
-
-
-
-
-
1
-
-
-
-
3
-
-
-
-
-
-
6
10
S1 A
p
-
-
-
-
-
1
-
-
-
-
-
-
-
-
-
-
-
1
2
S1 Jn
-
-
-
-
-
1
-
-
-
-
-
-
-
-
-
-
-
-
1S2
Se
1
1
-
-
-
-
-
-
-
-
-
-
-
1
-
1
-
3
7S2
Oc
-
-
-
-
-
2
-
-
-
-
-
1
-
-
-
-
-
7
10
S2 N
o
-
-
-
-
-
1
-
-
-
-
5
-
-
-
-
-
-
-
6S2
Ja
-
-
-
-
-
-
-
-
-
-
7
3
5
-
2
-
-
2
1
9S2
Fe
3
-
-
-
-
-
-
-
3
-
14
-
12
-
-
1
-
-
33S2
Ap
10
5
-
-
-
3
-
-
1
-
-
-
3
6
-
-
-
-
2
8S2
Ju
-
-
-
-
1
1
0
-
-
4
-
-
-
5
-
-
-
-
-
20S2
Jl
-
2
-
-
1
-
-
-
4
-
1
-
5
-
1
-
-
-
14
S2 A
u
-
-
-
-
1
-
-
-
6
-
2
-
3
-
-
-
-
-
12S3
Se
10
-
-
-
-
-
-
-
-
-
-
-
-
-
2
-
-
-
12
S3 Ja
-
-
-
-
-
-
1
-
-
-
6
-
1
5
-
1
-
-
14
S3 F
e
6
7
-
-
-
-
-
-
2
-
1
-
6
5
5
1
-
-
33S3
Ap
2
3
-
-
-
3
-
-
-
-
-
-
-
2
12
-
-
-
22S3
Ju
-
5
-
1
-
-
-
-
1
-
-
-
-
1
7
-
1
-
16
S3 Jl
-
1
-
-
5
-
-
-
-
-
-
-
-
-
10
-
-
-
16
S3 A
u
-
-
-
-
-
-
-
-
-
-
-
-
-
-
-
-
-
1
1S4
Se
-
-
-
-
-
-
-
-
-
-
-
-
-
-
44
-
-
-
4
4S4
Oc
-
-
-
-
-
-
-
-
-
-
-
-
-
-
74
-
-
-
74
S4 N
o
-
-
-
-
1
-
-
-
-
8
-
-
-
-
27
-
-
-
3
6S4
Ja
5
-
-
-
-
-
-
-
-
-
1
-
-
-
-
-
-
-
6
S4 F
e
1
5
-
-
-
1
-
-
-
-
2
-
1
3
5
-
-
-
1
8S4
Ap
-
7
-
-
1
1
-
2
-
-
-
-
-
40
48
-
-
-
99
S4 Ju
-
2
4
-
-
5
-
-
-
-
-
-
-
-
4
8
3
-
-
-
116
S4 Jl
1
2
-
-
-
-
-
-
-
-
-
-
-
-
9
-
-
-
1
2S4
Au
-
1
8
-
-
-
-
-
-
-
-
-
-
-
2
4
1
-
-
25
Tabl
e 3.
Site
by
mon
th C
PUE
valu
es o
f spe
cies
and
sam
ples
sel
ecte
d fo
r CC
A. A
cron
yms
of s
peci
es a
s in
Tab
le 2
. Mon
ths
and
site
s as
in F
ig. 2
.
88 Artículo - Evaluación de las comunidades de peces a lo largo de un río piedemonte que recibe contaminación orgánica (Montañas de Aconquija, Argentina). Fernández, Bechara.

genus Trichomycterus was only found in the two uppermost sites. Two species (Characidiumcf. zebra and Hypostomus cordovae) were captured at all four sampling locations. Eightother species (Acrobrycon tarijae, Astyanax asuncionensis, Corydoras paleatus, Heptapterusmustelinus, Rineloricaria catamarcensis, Odontostilbe microcephala, Otocinclus vittatus andPimelodella laticeps) were found at least at three of the four sites. In general, the speciescaptured in most sites were also more abundant in number (CPUE, Tables 2 and 3).Maximum CPUE values occurred during summer months in S1, but during summer andautumn in S2 and S3 and spring and autumn in S4. High summer values in S1 weremainly due to increased densities of Trichomycterus corduvensis. At S3 and S4, high CPUEvalues were related to the growing downstream abundance of Astyanax asuncionensis,Odontostilbe microcephala and Otocinclus vittatus. High summer and autumn values at S2were chiefly due to Hypostomus cordovae and Rineloricaria catamarcensis and in lesser extentto Acrobrycon tarijae and Characidium cf. zebra.S1 had the highest similarity with S2, and shared Heptapterus, Cheirodon, andTrichomycterus (Table 4). Species in common and similarity with the other two sitesdeclined markedly downstream. In contrast, the three downstream sites had muchhigher and comparable levels of similarity in species presence-absence. S2 differed fromS3 (nearly 10 km below) by the presence of Jenynsia and the absence of Cichlasoma,Cheirodon, Eigenmannia and Pimelodus. Site S4 differed from S2 and S3 by the presence ofCyphocharax and Hoplosternum (Table 2).
Sites S1 S2 S3 S4S1 1.00 4 3 2S2 0.49 1.00 10 9S3 0.32 0.80 1.00 10S4 0.23 0.78 0.80 1.00
Table 4. Matrix of resemblance among sampling sites. Lower portion shows Jaccard presence-absencesimilarity index and upper triangle shows number of common species.
The guilds with the greatest variation among sites included omnivores and invertivores,while piscivores were rare or absent (Table 5). The invertivores were indicators of moredistant and less degraded environments, and were proportionally more important at S1.At S2 there were still more species of invertivores compared with S3 downstream. At S4the percentage of omnivores was higher than the other three locations. Regardinghabitat guilds, the number of benthic species was high in all sites (Table 2) and at S3and S4 the midwater species raised in number, in relation to increasing depth and lowerwater speeds (Table 1).
Sites Invertivores Omnivores Detritivores Algivores PiscivoresS1 91 - - 9 -S2 42 13 2 43 -S3 27 28 4 40 1S4 3 24 3 70 -
Table 5. Average percentage composition of the different trophic levels at the four sampling locationsbased on relative abundance data, all dates pooled.
Acta biol. Colomb., Vol. 15 N.º 2, 2010 89
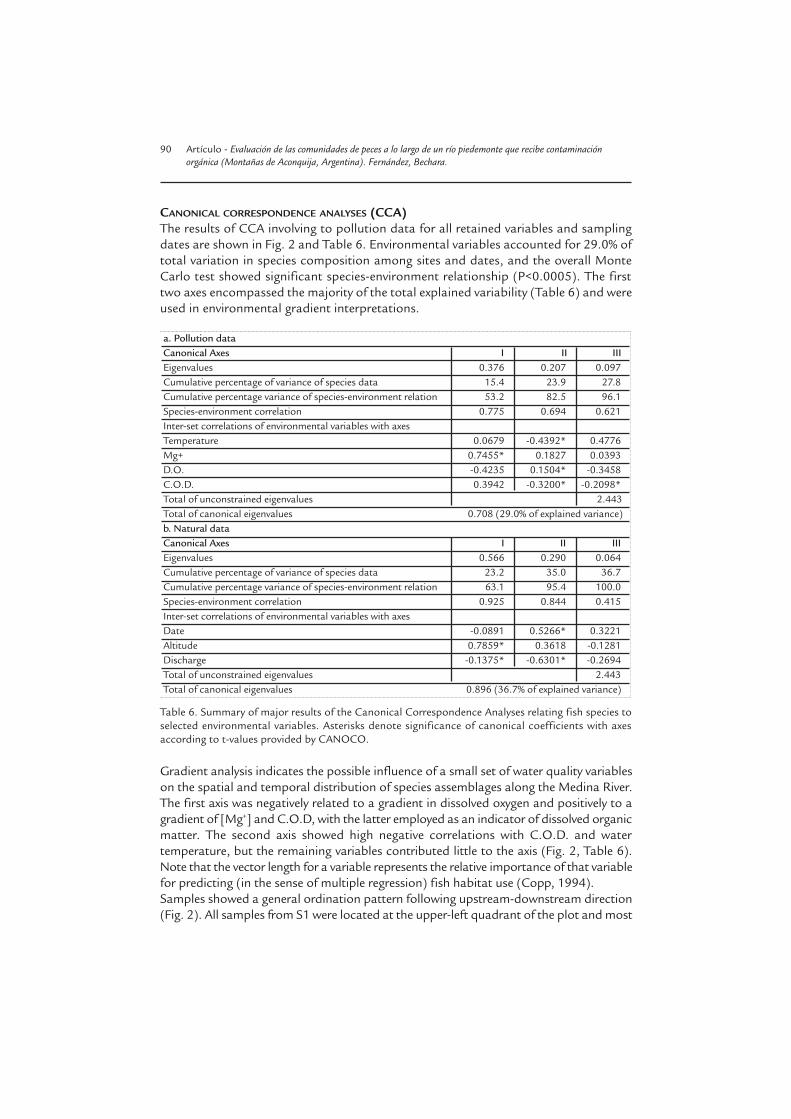
CANONICAL CORRESPONDENCE ANALYSES (CCA)The results of CCA involving to pollution data for all retained variables and samplingdates are shown in Fig. 2 and Table 6. Environmental variables accounted for 29.0% oftotal variation in species composition among sites and dates, and the overall MonteCarlo test showed significant species-environment relationship (P<0.0005). The firsttwo axes encompassed the majority of the total explained variability (Table 6) and wereused in environmental gradient interpretations.
a. Pollution dataCanonical Axes I II IIIEigenvalues 0.376 0.207 0.097Cumulative percentage of variance of species data 15.4 23.9 27.8Cumulative percentage variance of species-environment relation 53.2 82.5 96.1Species-environment correlation 0.775 0.694 0.621Inter-set correlations of environmental variables with axesTemperature 0.0679 -0.4392* 0.4776Mg+ 0.7455* 0.1827 0.0393D.O. -0.4235 0.1504* -0.3458C.O.D. 0.3942 -0.3200* -0.2098*Total of unconstrained eigenvalues 2.443Total of canonical eigenvalues 0.708 (29.0% of explained variance)b. Natural dataCanonical Axes I II IIIEigenvalues 0.566 0.290 0.064Cumulative percentage of variance of species data 23.2 35.0 36.7Cumulative percentage variance of species-environment relation 63.1 95.4 100.0Species-environment correlation 0.925 0.844 0.415Inter-set correlations of environmental variables with axesDate -0.0891 0.5266* 0.3221Altitude 0.7859* 0.3618 -0.1281Discharge -0.1375* -0.6301* -0.2694Total of unconstrained eigenvalues 2.443Total of canonical eigenvalues 0.896 (36.7% of explained variance)
Table 6. Summary of major results of the Canonical Correspondence Analyses relating fish species toselected environmental variables. Asterisks denote significance of canonical coefficients with axesaccording to t-values provided by CANOCO.
Gradient analysis indicates the possible influence of a small set of water quality variableson the spatial and temporal distribution of species assemblages along the Medina River.The first axis was negatively related to a gradient in dissolved oxygen and positively to agradient of [Mg+] and C.O.D, with the latter employed as an indicator of dissolved organicmatter. The second axis showed high negative correlations with C.O.D. and watertemperature, but the remaining variables contributed little to the axis (Fig. 2, Table 6).Note that the vector length for a variable represents the relative importance of that variablefor predicting (in the sense of multiple regression) fish habitat use (Copp, 1994).Samples showed a general ordination pattern following upstream-downstream direction(Fig. 2). All samples from S1 were located at the upper-left quadrant of the plot and most
90 Artículo - Evaluación de las comunidades de peces a lo largo de un río piedemonte que recibe contaminación orgánica (Montañas de Aconquija, Argentina). Fernández, Bechara.

samples of S4 on the upper-right side. Samples from S2 and S3 were placed in-between.However, temporal and spatial variability were confounded to a certain degree along thetwo canonical axes. Indeed, samples from all sites were closer in September, January andFebruary, when they were located mostly toward the lower portion of the diagram,indicating higher temperatures and medium to high D.O. values. In contrast, most winterand spring samples from S1 were generally placed toward the upper-left side of the plot,while the winter and early-spring samples of the remaining sites tended to be placedtoward the right side, indicating different seasonal responses of fish communities inrelation to contrasted water quality conditions. Samples from this later site also exhibiteda less marked temporal variability when compared to the remaining sites. Changes in[Mg+] similarly followed a wet-dry seasonal pattern from left to right along the first axis.Species locations in ordination diagrams represent the registered optima in relation toenvironmental variables along the first two axes. In addition, the species plotted nearthe center of diagram are more likely to be abundant in a wider range of habitat types(Fig. 2). Trichomycterus corduvensis and Characidium cf. zebra exhibited a preference for thehighest D.O. levels, and the lowest temperatures and C.O.D. (Fig. 2, Table 6), beingfrequent and abundant in more pristine lotic habitats (S1-S2). As a consequence, thesespecies were found to co-occur more often than expected simply by random process inboth sites. Other species required high oxygen levels, but were also more tolerant towarmer temperatures or higher C.O.D. levels, such as Heptapterus mustelinus andRineloricaria catamarcensis.
Acta biol. Colomb., Vol. 15 N.º 2, 2010 91
Fig. 2. Triplot of axes 1 and 2 of the Canonical Correspondence Analysis (CCA) on pollution data. Seeabbreviations of species in Table 2 . Abbreviation of months are: Ja: January, Fe: February, Ap: April;Jn: June, Jl: July; Au: August; Se: September, Oc: October, No: November. Arrows indicate the followingenvironmental variables: Temp: water temperature, C.O.D.: Chemical Oxygen Demand; D.O.: %saturation of dissolved oxygen, Mg+: Magnesium concentration in me/l.

Some species (Otocinclus vittatus, Corydoras paleatus, Acrobrycon tarijae and Astyanaxasuncionensis) were found in higher relative abundance in more polluted conditions. Theyinhabited waters having the lowest D.O. and the highest C.O.D. Other species might beconsidered intermediate in environmental preference, such as Jenynsia multidentata,Hypostomus cordovae, and Odontostilbe microcephala.Species found more frequently in the more pristine habitats had generally the lowesttolerance, including Characidium cf. zebra, Heptapterus mustelinus, Trichomycterus corduvensis,and Rineloricaria catamarcensis. The most tolerant species were Otocinclus vittatus, Corydoraspaleatus and Astyanax asuncionensis, which were found in a wide range of water qualityconditions (Table 7). Some species exhibited intermediate tolerance in spite of beingcommon at more degraded habitats. These include Acrobrycon tarijae and Pimelodusalbicans which also seem to prefer higher water temperatures.
Temp. (°C) [Mg+] [D.O.] C.O.D. ToleranceMean 21.384 0.605 7.569 2.753 —Acrobrycon tarijae 24.970 0.526 7.001 3.592 96.789Astyanax asuncionensis 20.037 0.706 7.387 3.373 106.541Corydoras paleatus 17.008 0.773 7.516 4.514 123.526Characidium cf. zebra 16.841 0.482 9.219 1.473 78.746Heptapterus mustelinus 19.017 0.481 8.327 2.758 78.481Hypostomus cordovae 25.142 0.459 7.761 2.552 65.023Jenynsia multidentata 24.333 0.423 7.851 1.671 104.970Rineloricaria catamarcensis 21.229 0.452 8.320 2.760 77.564Odontostilbe microcephala 22.119 0.590 7.808 2.528 91.957Otocinclus vittatus 22.303 0.822 6.362 3.328 116.607Pimelodus albicans 27.200 0.526 6.190 3.446 89.722Trichomycterus corduvensis 19.328 0.437 8.354 1.238 82.194
Table 7. Environment-by-species table showing weighted means of environmental factors, fish toleranceand weighted averages of fish species with respect to the four variables retained (óptima). Original datawere back-transformed from CANOCO outputs (ter Braak and Smilauer, 1998).
Results of the CCA involving natural data for all retained variables and sampling datesare shown in Table 6 and Figure 3. Selected environmental variables accounted for36.7% of total variation in species composition among sites and dates, with the overallMonte Carlo test showed significant species-environment relationship (P<0.0005). Thefirst two axes encompassed a large proportion of total explained variability (Fig. 3, Table6) and were employed in interpretations of environmental gradients. The first axis waspositively related to a gradient of altitude and negatively to a gradient of discharge. Thesecond axis was negatively related with discharge and positively with time of the year;the remaining variable contributed little to the axis (Fig. 3, Table 6). In a manner similarto that of the previously shown pollution plot (Fig. 2), samples exhibited an ordinationpattern in upstream-downstream sense along the first axis, but in this case it followedan altitudinal gradient, which also explained the influence of variables excluded from themodel to avoid artificial over explanation, such as position along the river, decreasingcurrent speed, decreasing bottom substrate size, decreasing riparian cover, among
92 Artículo - Evaluación de las comunidades de peces a lo largo de un río piedemonte que recibe contaminación orgánica (Montañas de Aconquija, Argentina). Fernández, Bechara.

others (Table 1). In that manner, S1 samples appear grouped to the upper-right sectorof the axis I and S3-S4 are placed closely on the opposite side, but with a largeroccurrence in the discharge gradient. S2 appears intermediate at similar distances fromthe previous sites along this first Axis. Axis II explains mainly temporal variability, whichis similar for all sites, with samples ordered nearly in parallel with that axis from spring(larger month numbers, 10-11) on the upper side, followed by autumn-winter samples(intermediate month numbers, 4-9), and finishing with summer samples (inferior monthnumbers, 1-2) in the lower portion.
Figure 3. Triplot of axes 1 and 2 of the Canonical Correspondence Analysis (CCA) on natural data. Seeabbreviations of species and months in Table 2. Site symbols are as in Fig. 2 (Site 1= black circles, Site2= black triangles, Site 3= grey squares, Site 4= grey diamonds).
In terms of species locations along the altitudinal gradient, there was a prevalence ofTrichomycterus corduvensis in the uppermost site (S1), followed by Characidium cf. zebra andHeptapterus mustelinus at lower altitudes (S1-S2) (Fig. 3). Hypostomus cordovae, Rineloricariacatamarcensis and Jenynsia multidentata were common in S2 at intermediate altitudinallevels. The remaining species were mainly related to S3 and S4 at the lowest altitudes.Along the second canonical axis, H. cordovae, R. catamarcensis and J. multidentata werecommon in summer samples of higher discharge sites. T. corduvensis and Otocinclus vittatuswere located at opposite sides of the gradient, being typical of spring-autumn and lowor intermediate discharge levels.
Acta biol. Colomb., Vol. 15 N.º 2, 2010 93

VARIANCE DECOMPOSITION
As depicted in Table 8, there was a significant relationship between pollution [P] andnatural [N] variables within the fish community structure. However, the pollutioncomponent of the total variability was not significant after partialling-out the naturaleffects [P|N]. In contrast, natural effects remained significant after the removal ofpollution effects [N|P]. Together, the two sets of variables explained a relatively largeproportion of the total variability (�48%), and also shared an important proportion oftotal variance (�15%).
Variation Variance Explained (%) P[N+P] 48.1 0.0005[P] 29.0 0.005[N] 36.7 0.005[P|N] 11.4 0.175[N|P] 21.4 0.005[N�P] 15.3 -1-[N+P] 51.9 -
Table 8. Variance decomposition and associated P values of the pollution [P] and natural [N] datamatrices. Components of variation: [N+P]=total variation explained by Natural and Pollution variables;[P]= variation explained by Pollution variables; [N]= variation explained by Natural variables; [P|N]=pure pollution variation; [N|P]= pure natural variation; [N���P]= Explained Natural variation in speciesdata that is shared by Pollution data, and 1-[N+P]= unexplained variation.
DISCUSSION
Based on our results, a seasonally variable longitudinal pattern of species compositionoccurs from the uppermost to the lowermost locations, as evidenced by the significanceof “pure” natural variables in variance decomposition, suggesting the importance ofaltitude and its correlated variables, and to a lesser extent seasonal variation, in controllingfish assemblage structure. As showed by Hoeinghaus et al., 2004, compositional changesalong a river continuum have been in general characterized as distinct faunal assemblages,with additions of species by environmental complexity and connectivity that increaseddownstream. Several studies conducted on Neotropical rivers and streams over the lasttwo decades have found significant patterns of fish assemblage differentiation alonglongitudinal gradients (Ibarra and Stewart, 1989; da Silva Abes and Agostinho, 2001;Hoeinghaus et al., 2004; Gerhard et al., 2004; Fialho et al., 2007; Suarez and PetrereJunior, 2006, 2007). Our analyses examined fish assemblage composition along the upper S1 (piedmont)and lower S2-S4 (llanos) sections. The upstream site (S1) had lower species richness,and species number increased downriver and that number remained fairly constant afterS2. It may reflect in part the longest distance to the sources of colonization, and theincreasing difficulty for upstream migration due to natural obstacles at higher altitudes,as well as artificial obstructions and pollution plumes. At the basin scale, Olden et al.,2001, found that connectivity was a major factor explaining species composition in fishcommunities along a network of lakes connected by streams on the Canadian Shield.
94 Artículo - Evaluación de las comunidades de peces a lo largo de un río piedemonte que recibe contaminación orgánica (Montañas de Aconquija, Argentina). Fernández, Bechara.

Suárez and Petrere Júnior, 2007),found that the most important variable explainingvariation in fish community structure along a tributary of the Paraná River in Brazil wasaltitude, with little contribution of temporal variability.We observed the highest species richness in the middle region (S3). These finding arein contrast to previous longitudinal gradient studies that generally have describedpatterns of increase in species richness in lower river stretches in Neotropical rivers(Videla and Bistoni, 1999; Bistoni and Hued, 2002; Hoeinghaus et al., 2004). The slightdecrease in species richness in the lower most site (S4), contrary to the expected rise dueto higher connectivity may reflect sampling error, but could also reflect an increasingeffect of organic pollution downriver, as evidenced by lowest D.O. and highest C.O.D.values. The oxygen concentration decrease and organic matter increase during low waterperiods may explain part of the longitudinal differentiation, because they were variableswith high correlations along the first and second axis of pollution CCA and havepotentially a major influence on species composition, due to its physiological role ongrowth and survival. This assumption is however, tentative because the “pure” pollutioneffect was not significant, due in part to the large proportion of that effect shared withnatural variability. For example, the first axis appears as a pollution gradient separatingupstream from downstream sites, but in fact it is more likely an altitudinal gradient, towhich pollution variables are correlated (Perondi et al., 1996). Similarly, the second axisin the pollution CCA shows temperature variations related mainly to water temperaturethat in the natural CCA is chiefly temporal variability. In fact, Pearson linear correlationsbetween scorers of the first and second axes of the two CCA were both highly significant(r=0.76 and r=0.54; respectively, P<0.001; n=31).The seasonal variability in longitudinal patterns was apparent when comparing winteragainst spring–summer samples. In this later seasons, when discharge increased, and sugarcane factories activity ceased, a recovery in river water quality was reflected by a largerresemblance among fish assemblages from different sites. Species that characterized thewinter samples of the lower most site (S4, Astyanax asuncionensis, Otocinclus vittatus, Corydoraspaleatus) were also the most tolerant to a wide range of variation of pollution indicatingvariables (Fig. 2, Table 7). S3 and S4 also had the largest number of omnivorous species.In contrast, most samples from S1 and some months in S2 were characterized by specieswith lower tolerance, these being mostly benthic invertivores (Characidium cf. zebra,Trichomycterus corduvensis, and Heptapterus mustelinus). In addition, S1 had lower watertemperature, which may have limited the range expansion of some Neotropical speciesupstream, a long with connectivity. This fact can also explain the presence of the threelatter species which had the lowest optima for temperature (Table 7). In contrast, somespecies were more common during spring-summer at low altitude sites, preferring highertemperatures, such as Pimelodus albicans, a migratory species probably moving downstreamfor reproduction, as well as Acrobrycon tarijae (Table 6).In addition, some of the observed differences in species assemblage composition alongthe longitudinal gradient of the Medina River probably reflected local physical habitatfeatures. Hoeinghaus et al., 2004, found that depth was the most important habitatvariable related to fish assemblage composition in Neotropical streams from Venezuela.Several species of invertivore catfishes (e.g., genus Trichomycterus), are typical of the morerhytronic sectors, potentially due to their better adaptations to lotic habitats, but
Acta biol. Colomb., Vol. 15 N.º 2, 2010 95

coupled with the supply of trophic resources according to their feeding habits, as wellas the lower abundance of predators (Habit et al., 2005). Other authors also found arelationship between physical habitat features and fish community structure. Ibarraand Stewart, 1989, Da Silva Abes and Agostinho, 2001, found greatest speciesassemblage turnover along a longitudinal gradient in association with major changes insubstrate composition (i.e., absence of rock/cobble in lower stretches). Also, the habitatcomplexity downstream supplies a wider variety of hiding places for fish. In streams of the upper Paraguay River, Valerio et al., 2007, proposed that water velocitywas the most important descriptor of community composition, followed by streamwidth, altitude, water conductivity, and stream depth. The water velocity of a streammay be also a factor hidden in our sample ordination, since a gradient of decreasingwater velocity downstream was detected, with a concomitant increase of mid-waterspecies. Hypostomus also occurred at higher densities over the predominant pebble andgravel substrates that are typical of fast-flowing lotic habitats. Although Trichomycterus wasoriginally considered to be exclusively rheophilous, its juveniles were observed almostentirely in the absence of water currents and in shallow waters along marginal standingwaters (LF, pers. obs.). In streams of the Colombian Andes, Chará et al., 2006, foundonly small individuals of Trichomycterus sp. in shallow waters during the day, areasnormally avoided by juveniles and adults. According to Schlosser, 1987, environmentalfeatures of the dike fields (slow currents, high temperatures, and sand) make themsuitable as nurseries for riverine fish and beaches may provide protection againstswimming predators just as shallow raceways do in streams. In summary, the main findings of the present study suggest that in spite of water qualitydegradation by sugar cane factories and urban development, natural variability stillexplained a major and significant amount of spatial and temporal variation in fishcommunity along the river continuum. Organic pollution effects during droughts generatedlow oxygen concentrations, favoring the predominance of the most tolerant species in thetwo lower most sites and probably modified the expected increase in species richnessdownriver. Summer and spring floods improved water quality, thereby allowing the recoveryof the fish fauna in polluted reaches. The pristine upstream site had lesser environmentalvariability and supported lower species richness, with a community composed mainly byinvertivores with reduced tolerance and with higher dissolved oxygen requirements.Therefore, a suitable management strategy for reducing pollution effects in rivers affectedby sugar cane factories might be limiting waste discharge to high flow periods (December-March) when the natural purifying capacity of the rivers would be at its maximum.
ACKNOWLEDGEMENTS
We thank E. Domínguez, F. Cruz, and H. Fernández for comments on previous drafts ofthe manuscript. Funding for surveys were provided by Universidad Nacional de Tucumán:“Proyecto CIUNT 2005-2008, Estructura y funcionamiento de un río subtropical demontaña: Cuenca Río Lules, 26G/309”. L. Fernández was supported by a KalbfleischPostdoctoral Fellowship at the American Museum of Natural History, New York. Hospitalitywas provided by A. Bobadilla, S. Schneider, F. Lobo, G. Gonzo, and S. Valdecantos. Thispaper benefited from comments and suggestions of M. Stiassny and C. Ferraris, Jr.
96 Artículo - Evaluación de las comunidades de peces a lo largo de un río piedemonte que recibe contaminación orgánica (Montañas de Aconquija, Argentina). Fernández, Bechara.

BIBLIOGRAPHY
ALLAN JD, BRENNER AJ, ERAZO J, FERNANDEZ L, FLECKER AS, et al. Land use inwatersheds of the Venezuelan Andes: a comparative analysis. Conserv Biol. 2001;16: 527-538.
ALLAN JD, FLECKER AS, SEGNINI S, TAPHORN DC, SOKOL E, KLING GW.Limnology of Andean piedmont rivers of Venezuela. J N Am Benthol Soc. 2006;25:66-81.
BECHARA JA, ROUX JP, SÁNCHEZ S, TERRAES JC, DOMITROVIC HA. Fishcommunity variation below Yacyretá Dam (Paraná River, Argentina): the relativecontribution of microhabitat, hydrology and limnology. Acta Limnol Bras. 2000;12:23-38.
BISTONI MA, HUED AC. Patterns of fish species richness in rivers of the centralregion of Argentina. Braz J Biol. 2002;62:753-764.
BISTONI MA, HUED AC, VIDELA MM, SAGREtti L. Efectos de la calidad delagua sobre las comunidades ícticas de la región central de Argentina. Rev Chil Hist Nat.1999;72:325-335.
BORCARD DP, LEGENDRE P, DRAPEAU P. Partialling out the spatialcomponent of ecological variation. Ecology. 1992;73:1045-1055.
CASATTI L, CASTRO RMC. A fish community of the São Francisco Riverheadwaters riffles, southeastern Brazil. Ichthyol Explor Fres. 1998;9:229-242.
CASATTI L, LANGEANI F, CASTRO RMC. Peixes de riacho do parque estadualMorro Do Diabo Bacia do Alto Río Paraná, SP. Biota Neotropica. 2001;http://www.biotaneotropica.org.br/v2n2/pt/abstract/inventory+BN00201122001.
CASTRO RMC, CASATTI L. The fish fauna from a small forest stream of theupper Paraná River basin Southeastern Brasil. Ichthyol Explor Fres. 1997;7:337-352.
CHARÁ JD, BAIRD DJ, TELFER TC, RUBIO EA. Feeding ecology and habitatpreferences of the catfish genus Trichomycterus in low-order streams of the ColombianAndes. J Fish Biol. 2006;68:1026-1040.
COPP GH, GUTI G, ROVNY B, CERNY J. Hierarchical analysis of habitat use by0+ juvenile fish in Hungarian/Slovak flood plain of the Danube River. Env Biol Fish.1994;40:329-348.
COSTA WJEM. Feeding habits of a fish community in a tropical coastal stream,Río Mato Grosso, Brazil. Stud Neotrop Fauna E. 1987;22:145-153.
COTTENIE K, MICHELS E, NUYTTEN N, DE MEESTEr L. ZooplanktonMetacommunity Structure: Regional Vs. Local Processes in highly interconnected ponds.Ecology. 2003;84:991-1000.
DA SILVA ABES S, AGOSTINHO AA. Spatial patterns in fish distributions andstructure of the ichthyocenosis in the Agua Nanci stream, upper Paraná River basin,Brazil. Hydrobiologia. 2001;445:217-227.
DAVIES SP, JACKSON SK. The biological condition gradient: a descriptive modelfor interpreting change in aquatic ecosystems. Ecol Appl. 2006;16:1251-1266.
DOMÍNGUEZ E, FERNÁNDEZ HR. Calidad de los ríos de la cuenca del Salí(Tucumán, Argentina) medida por un índice biótico. Fundación Miguel Lillo, serie con-servación de la naturaleza. Tucumán, Argentina; 1998.
DOBERSTEIN CP, KARR JR, CONQUEST LL. The effect of fixed-countsubsampling on macroinvertebrate biomonitoring in small streams. Freshwater Biol.2000;44:355-371.
Acta biol. Colomb., Vol. 15 N.º 2, 2010 97
FERNÁNDEZ L. Redescription of the teleost Trichomycterus barbouri (Eigenmann,1911) occurrence in Argentina and comparison with related species (Ostariophysi:Siluriformes: Trichomycteridae). Stud Neotrop Fauna E. 2000;35:27-33.
FERNÁNDEZ L. Risk of extinction of a rare catfish of Andean groundwater andits priority for conservation. Ambio. 2005;34:69-70.
FERRIZ RA. Alimentación de Trichomycterus corduvense Weyenbergh, 1879(Teleostei: Trichomycteridae) en dos ríos serranos de San Luis, Argentina. Revista MuseoArgentino de Ciencias Naturales “Bernardino Rivadavia”. 1998;8:43-49.
FIALHO AP, OLIVEIRA LG, TEJERINA-GARRO FL, GOMES LC. Fish assemblagestructure in tributaries of the Meia Ponte River Goias, Brazil. Neotrop Ichthyol.2007;5:53-60.
GERHARD P, MORAES R, MOLANDER S. Stream fish communities and theirassociations to habitat variables in a rain forest reserve in southeastern Brazil. Env BiolFish. 2004;71:321-340.
HABIT E, VICTORIANO P, CAMPOS H. Ecología trófica y aspectosreproductivos de Trichomycterus areolatus (Pisces, Trichomycteridae) en ambientes lóticosartificiales. Rev Biol Trop. 2005;53:195-210.
HALPERN B, COTTENIE K, BROITMAN B. Strong Top-Down control inSouthern California kelp forest ecosystems. Science. 2006;312:1230-1232.
HOEINGHAUS D, WINEMILLER KO, TAPHORN DC. Compositional change infish assemblages along the Andean piedmont-Llanos floodplain gradient of the ríoPortuguesa, Venezuela. Neotrop Ichthyol. 2004;2:85-92.
HOREAU V, CERDAN P, CHAMPEAU A, RICHARD S. Importance of aquaticinvertebrates in the diet of rapids-dwelling fish in the Sinnamary river French Guiana. JTrop Ecol. 1998;14:851-864.
HUED AC, BISTONI MA. Development and validation of a Biotic Index forevaluation of environmental quality in the central region of Argentina. Hidrobiología.2005;543:279-298.
HUNZINGER H. La precipitación Horizontal: su importancia para el bosque y anivel de cuenca en la sierra de San Javier, Tucumán. Argentina. In: Brown A, Grau D,editors. Investigación, conservación, y desarrollo en las selvas subtropicales de montaña.Proyecto de Desarrollo Agroforestal / LIEY 1995. Universidad Nacional Tucumán,Tucumán, Argentina; 1995. p. 53-58.
IBARRA M, STEWART DJ. Longitudinal zonation of sandy beach fishes in theNapo River basin, eastern Ecuador. Copeia. 1989;(2):364-381.
JONGMAN RHG, TER BRAAK CJF, VAN TONGEREN OFR. Editors. Data analysisin community and landscape ecology. Cambridge University Press, UK; 1995. p. 299.
KOVACS TG, MARTEL PH, VOSS RH. Assessing the biological status of fish ina river receiving pulp and paper mill effluents. Environ Pollut. 2002;118:123-140.
LEGENDRE P, LEGENDRE L. Numerical Ecology. Second English Edition.Elsevier, Amsterdam, Holland; 1998.
LIMA-JUNIOR SE, GOITEIN R. Ontogenetic diet shifts of a Neotropical catfish,Pimelodus maculatus (Siluriformes, Pimelodidae): An ecomorphological approach. EnvBiol Fish. 2003;68:73-79.
MAGNAN P, RODRIGUEZ MA, LEGENDRE P, LACASSE S. Dietary variation in
98 Artículo - Evaluación de las comunidades de peces a lo largo de un río piedemonte que recibe contaminación orgánica (Montañas de Aconquija, Argentina). Fernández, Bechara.

a freshwater fish species: Relative contributions of biotic interactions, abiotic factors,and spatial structure. Can J Fish Aquat Sci. 1994;51:2856-2865.
MARET TR. Characteristics of fish assemblages and environmental conditions instreams of the upper Snake River basin in eastern Idaho and western Wyoming. In:Simon TP, editors. Assessing the sustainability and biological integrity of water resourcesusing fish communities. CRC Press, Boca Raton Florida; 1999. p. 273-299.
MEADE R. Fish and invertebrate recolonization in a Missouri Prairie stream afteran acute pollution event. N Am J Fish Manage. 2004;24:7-19.
MERCADO-SILVA N, LYONS JD, MALDONADO GS, NAVA MM. Validation ofa fish-based index of biotic integrity for streams and rivers of central México. Rev FishBiol Fisher. 2003;12:179-191.
MENNI RC, LOPEZ HL, CASCIOTTA JR, MIQUELARENA AM. Ictiología de lasáreas serranas de Córdoba y San Luis (Argentina). Biología Acuática. 1984;5:1-63.
MENNI RC, GÓMEZ SE, ARMENGOL FL. Subtle relationships: freshwater fishesand water chemistry in southern South America. Hidrobiología. 1996;328:173-197.
MERCADO-SILVA N, LYONS JD, MALDONADO GS, MEDINA NAVA M.Validation of a fish-based index of biotic integrity for streams and rivers of centralMéxico. Fish Biology and Fisheries. 2003;12:179-191.
MERONA B, RANKIN-DE-MERONA J. Food resource partitioning in a fishcommunity of the central Amazon floodplain. Neotrop Ichthyol. 2004;2:75-84.
MIQUELARENA AM, MENNI RC, LOPEZ HL, CASCIOTTA JR. Ichthyologicaland limnological observations on the Salí river basin (Tucumán, Argentina). IchthyolExplor Fres. 1990;1:269-276.
MOL JH, OUBOTER PE. Downstream effects of erosion from small-scale goldmining on the instream habitat and fish community of a small Neotropical rainforeststream. Conser Biol. 2004;18:201-214.
MORLEY SA, KARR JR. Assessing and restoring the health of urban streams in thePuget Sound Basin. Conser Biol. 2002;16:1498-1509.
OLDEN JD, JACKSON DA, PERES-NETO PR. Spatial isolation and fishcommunities in drainage lakes. Oecologia. 2001;127:572-585.
PERETTI D, DE FATIMA ANDRIAN I. Trophic structure of fish assemblages in fivepermanent lagoons of the high Paraná River floodplain, Brazil. Env Biol Fish.2004;71:95-103.
PERONDI ME, GALINDO MC, VECE MB, APELLA MC, HIDALGO M. Releva-miento de variables fisicoquímicas en el río Medina, Provincia de Tucumán. Serie mono-gráfica y didáctica n.° 31, Fac. Cs. Ns. e IML, UNT. Tucumán, Argentina. 1996. p. 25.
PETRY P, BAYLEY PB, MARKLE DF. Relationships between fish assemblages,macrophytes and environmental gradients in the Amazon River floodplain. J Fish Biol.2003;63:547-579.
POIZAT G, PONT D. Multi-scale approach to species-habitat relationships:juvenile fish in a large river section. Freshwater Biol. 1996;36:611-622.
POUILLY M, YUNOKI T, ROSALES C, TORRES L. Trophic structure of fish assemblagesfrom Mamore river floodplain lakes (Bolivia). Ecol Freshw Fish. 2004;13:245-257.
RODRIGUEZ MA, LEWIS Jr WM. Structure of fish assemblages along environmentalgradients in floodplain lakes of the Orinoco river. Ecol Monogr. 1997;67:109-128.
Acta biol. Colomb., Vol. 15 N.º 2, 2010 99

RODRIGUEZ-OLARTE D, AMARO A, CORONEL J, TAPHORN BDC. Integrityof fluvial fish communities is subject to environmental gradients in mountain streams,Sierra de Aroa, north Caribbean coast, Venezuela. Neotrop Ichthyol. 2006;4:319-328.
SCHLOSSER IJ. The role of predation in age- and size-related habitat use bystream fishes. Ecology. 1987;68:651-659.
SCOTT MC. Winners and losers among stream fishes in relation to land use legaciesand urban development in the southeastern US. Biol Conserv. 2006;127:301-309.
SIMON TP. Modification of an index of biotic integrity and development ofreference conditions expectations for dunal, palustrine wetland fish communities alongthe southern shore of Lake Michigan. Aquat Ecosyst Health. 1998;1:49-62.
SUAREZ YR, PETRERE JUNIOR M. Gradientes de diversidade nas comunidadesde peixes da bacia do río Iguatemi, Mato Grosso do Sul, Brasil. Iheringia Ser Zool.2006;96:197-204.
SUAREZ YR, PETRERE JUNIOR M. Environmental factors predicting fishcommunity structure in two neotropical rivers in Brazil. Neotrop Ichthyol. 2007;5:61-68.
TER BRAAK CJF. Canonical correspondence analysis, a new eigenvectortechnique for multivariate direct gradient analysis. Ecology. 1986;67:60-72.
TER BRAAK CJF, SMILAUER P. CANOCO reference Manual and User’s guide toCanoco for Windows. Software for Canonical Community Ordination (version 4).Microcomputer Power. Ithaca, NY, USA. 1998. p. 352.
VALERIO SB, SUAREZ YR, FELIPE TRA, TONDATO KK, XIMENES LQL.Organization patterns of headwaters-stream fish communities in the Upper Paraguay-Paraná basins. Hydrobiologia. 2007;583:241-250.
VIDELA MM, BISTONI MA. Composición y estructura de la comunidad íctica deun río serrano a lo largo de un gradiente altitudinal. Iheringia, Ser Zool. 1999;87:171-180.
VILA-GISPERT A, MORENO-AMICH R, GARCIA-BERTHOU E. Gradients of life-history variation: an intercontinental comparison of fishes. Rev Fish Biol Fisher.2003;12:417-427.
WINEMILLER KO, TARIM S, SHORMANN D, COTNER JB. Fish assemblagestructure in relation to environmental variation among Brazos river oxbow lakes. T AmFish Soc. 2000;129:451-468.
WRIGHT JP, FLECKER AS. Deforesting the riverscape: the effects of wood onfish diversity in a Venezuelan piedmont stream. Biol Conserv. 2004;120:439-447.
YODER CO, SMITH MA. Using fish assemblages in a state biological assessmentand criteria program: essential concepts and considerations. In: Simon TP editors.Assessing the sustainability and biological integrity of water resources using fishcommunities. Published CRC Press, Boca Raton Florida, US; 1999. p. 17-56.
100 Artículo - Evaluación de las comunidades de peces a lo largo de un río piedemonte que recibe contaminación orgánica (Montañas de Aconquija, Argentina). Fernández, Bechara.
Copyright © 2022 FDOKUMEN