Morphogenesis of the foetal membranes and placentation in ...

A
MD
a
ARRAA
KPFFS
mcotCdhvBtTrfiotpot8sP
1d
Biomedical Signal Processing and Control 5 (2010) 131–141
Contents lists available at ScienceDirect
Biomedical Signal Processing and Control
journa l homepage: www.e lsev ier .com/ locate /bspc
n algorithm for FHR estimation from foetal phonocardiographic signals
. Ruffo, M. Cesarelli, M. Romano, P. Bifulco ∗, A. Fratiniepartment of Biomedical, Electronic and Telecommunication Engineering, University “Federico II”, via Claudio 21, 80125 Naples, Italy
r t i c l e i n f o
rticle history:eceived 13 October 2009eceived in revised form 3 February 2010ccepted 5 February 2010vailable online 28 March 2010
eywords:assive foetal monitoringoetal phonocardiographyirst foetal heart sound detectionignal processing
a b s t r a c t
The long-term foetal surveillance is often to be recommended. Hence, the fully non-invasive acousticrecording, through maternal abdomen, represents a valuable alternative to the ultrasonic cardiotocogra-phy. Unfortunately, the recorded heart sound signal is heavily loaded by noise, thus the determination ofthe foetal heart rate raises serious signal processing issues. In this paper, we present a new algorithm forfoetal heart rate estimation from foetal phonocardiographic recordings. A filtering is employed as a firststep of the algorithm to reduce the background noise. A block for first heart sounds enhancing is thenused to further reduce other components of foetal heart sound signals. A complex logic block, guidedby a number of rules concerning foetal heart beat regularity, is proposed as a successive block, for thedetection of most probable first heart sounds from several candidates. A final block is used for exact firstheart sound timing and in turn foetal heart rate estimation. Filtering and enhancing blocks are actuallyimplemented by means of different techniques, so that different processing paths are proposed. Fur-thermore, a reliability index is introduced to quantify the consistency of the estimated foetal heart rateand, based on statistic parameters; [,] a software quality index is designed to indicate the most reliableanalysis procedure (that is, combining the best processing path and the most accurate time mark of the
first heart sound, provides the lowest estimation errors). The algorithm performances have been testedon phonocardiographic signals recorded in a local gynaecology private practice from a sample group ofabout 50 pregnant women. Phonocardiographic signals have been recorded simultaneously to ultrasoniccardiotocographic signals in order to compare the two foetal heart rate series (the one estimated by ouralgorithm and the other provided by cardiotocographic device). Our results show that the proposed algo-rithm, in particular some analysis procedures, provides reliable foetal heart rate signals, very close to thereference cardiotocographic reAbbreviations: %H, % of high RI values; %L, % of low RI values; %M, % ofedium RI values; ADC, analog to digital converter; AP, analysis procedure; CTG,
ardiotocography/cardiotocographic signal; DS, differences series (bpm, differencesf corresponding samples of FHR–FHS and FHR-CTG series); FD, fiducial degree (ofhe detected beats); FECG, foetal electrocardiography; FHR, foetal heart rate; FHR-TG, FHR recorded by means of CTG; FHR–FHS, FHR estimated from FHS by theeveloped algorithm; FHS, foetal heart sounds; FIR, finite impulse response; HT,igh amplitude threshold (50% of mean value of maximum amplitudes of the pre-ious 8 recognized beats); LP, output of B3 blocks (envelope or low-pass filtering of3 outputs); LT, low amplitude threshold (30% of mean value of maximum ampli-udes of the previous 8 recognized beats); M, LP mean value within the time interval; M− , fifth order median value computed on the five previous FHR samples (withespect to the sample in analysis); M+, fifth order median value computed on theve following FHR samples (with respect to the sample in analysis); M1, time markf S1: maximum of the selected LP peak; M2, time mark of S1: centre of gravity ofhe rectified signal tract of filtering block output, corresponding to the selected LPeak; M3, time mark of S1: maximum of the central peak of the rectified signal tractf filtering block output, corresponding to the selected LP peak; ME, mean value ofhe mean absolute values of all DS; MEAN, inter-distance mean value computed onbeats previous the beat in analysis; PCG, phonocardiography/phonocardiographic
ignal; Pi, positions of probable beats in the time interval T; PP, processing paths;RI, linear combination of %H, %M and %L; PSD, power spectral density; QS, quality
746-8094/$ – see front matter © 2010 Elsevier Ltd. All rights reserved.oi:10.1016/j.bspc.2010.02.002
cordings.© 2010 Elsevier Ltd. All rights reserved.
1. Introduction
In industrialized countries, all pregnant women periodicallytake pregnancy and foetal well-being controls. The most impor-tant aim of foetal surveillance is to avoid intrauterine death orpermanent damages to the foetus. Hence, to collect reliable infor-mation about the foetus’ health, also to correctly and promptly plan
successive diagnostic tests, is very important.Monitoring the variations in foetal heart rate (FHR) providesup-to-date information about the general foetus’ well-being. Inthe last trimester of pregnancy, the widespread diagnostic tool is
signal (of FHS signal tract); RI, reliability index (associated to the FHR values); RMS,root mean square; RR, series of beat to beat inter-distances; S1, first foetal heartsound; S2, second foetal heart sound; SD, mean value of the standard deviation ofall DS; SNR, signal to noise ratio; SQI, software quality index; T, current time inter-val of analysis (equal to T0 + 0.65 × MEAN, T0 + 1.35 × MEAN); T0, position of the lastrecognized beat; TEO, Teager energy operator; TH, local amplitude threshold (equalto 1.2 × M); UC, uterine contractions.
∗ Corresponding author. Tel.: +39 0817683794; fax: +39 0817683804.E-mail address: [email protected] (P. Bifulco).
1 rocess
uattuvdirneaFtdTs
dicimmC
rottbaiIftptcti
mts
•
•••••
rsp
drcimpt
32 M. Ruffo et al. / Biomedical Signal P
ltrasonographic Doppler cardiotocography (CTG). It combines FHRnd uterine contractions (UC) signal recordings. In this technique,o record FHR, an ultrasound transducer sends ultrasound waveshrough the maternal abdominal surface towards the foetus. Itssefulness is without doubt [1,2]. Since the 1970s FHR has been uni-ersally accepted as one of the most information-rich non-invasiveiagnostic tests for prenatal monitoring and it is largely adopted
n everyday clinical practice. However, some limitations are stillelated to this technique [2–4]. The correct and complete CTG sig-al interpretation is difficult even if computerized systems aremployed. Some pathologies and anomalies of cardiac functionalityre not detectable. Moreover, although frequent and/or long-termHR monitoring is recommendable, mainly in risky pregnancies,here is no strong evidence if long applications of ultrasound irra-iations can be taken as absolutely harmless for the foetus [5].herefore, in the last years, many efforts have been paid by thecientific community to find a suitable alternative.
For example magneto-cardiography has been proposed but itoes still remain a research tool and is currently little used in clin-
cal routine because of its complexity, cumbersome sensors andosts [6–8]. Foetal ECG (FECG) [9,10] has also been deeply stud-ed, but its recording through multiple electrodes placed on the
aternal abdomen makes it difficult to obtain high quality signals;oreover, the automated evaluation of FECG is less accurate than
TG [11].A valuable alternative can be offered by foetal phonocardiog-
aphy (PCG). This technique performs a recording of UC by meansf a usual pressure transducer and a passive (no energy beam isransmitted to the foetus), fully non-invasive and low cost acous-ic recording of foetal heart sounds (FHS) [11–14]. This signal cane captured by placing a small acoustic sensor on the mother’sbdomen without the use of gel and, if appropriately recorded,t is a very useful sensitive signal in providing clinical indication.ndeed the functional integrity of the heart, the detection of cardiacunctionality anomalies, such as murmur, split effect, extra sys-ole, bigeminal/trigeminal atrial contraction can be detected. Suchhenomena are not obtainable with the traditional Doppler CTGechnique or other methods [15]. However, a crucial point is theorrect recognizing of FHS associated to each foetal heart beat andhen the reconstruction of the FHR signal (let us use indifferently,n the following, signal or series).
This is not an easy task since the acoustic signal recorded on theaternal abdominal surface is faint and greatly noisy. In particular,
he analysis of heart sounds, measured on the maternal abdominalurface, is complicated by the following main factors [11,14,16]:
foetal signal depends on the position of the foetus, so its intensityvaries in time,acoustic noise produced by the foetal movements,maternal digestive sounds,sounds of maternal heart activity,maternal respiratory sounds, andexternal noise.
The above interferences are non-stationary and have to beemoved from a non-stationary signal, i.e. foetal heart soundsignal. Thus, the determination of the FHR raises serious signalrocessing issues.
The majority of the early works in the area of foetal phonocar-iographic monitoring were centred on sensor development. Moreecent studies focused on FHR estimation and different signal pro-
essing algorithms were developed to perform foetal heartbeatsdentification. However, except for some studies, the proposedethods have the main purpose of detecting occurrences, notrecise locations, of the heart sounds. Moreover, no detailed quanti-ative results assessing the reliability of the proposed methods were
ing and Control 5 (2010) 131–141
given, and completely dependable results were not yet obtained[11,12,14,17,18].
In this paper a new algorithm for FHR estimation from acousticphonocardiographic signals is presented. The algorithm was basedon a “logic block” for reliable detection of heartbeats. Owing to theextremely noisy nature of PCG signals, different filtering and sig-nal enhancement techniques were applied, so that different signalprocessing paths (PP) were implemented. The performances of thedifferent paths were tested comparing the estimated FHR signalswith those of simultaneously recorded CTG (currently consideredreference technique), in order to identify the most reliable path.
Our results showed that it is possible to obtain reliable FHRseries, very close to CTG recordings, employing a multi-step algo-rithm.
Techniques here tested but not judged to be good enough forFHR estimation are documented in this paper in order to help us inpreventing useless duplication of tested strategies.
2. Materials and methods
A. Patients’ selection and equipment
PCG signals were recorded from pregnant women, during thelast month of their singleton physiological pregnancies (34–40weeks of gestation). At the moment, we recorded about 100 signalslasting 20 min.
We used a portable phonocardiograph, “Fetaphon Home”,equipped with a microphone for FHS recording along with a tra-ditional pressure probe for UC recording. The phonocardiographicdevice digitized audio signals by using a sampling frequency of333 Hz and 8-bits ADC.
The measurements were carried out simultaneously withDoppler cardiotocographic recordings (by means of HP or Soni-caid cardiotocographs) for further comparisons and assessments,during the daily clinical practice.
Simultaneous location of both CTG and PCG probes, on thematernal abdomen, is difficult. Thus, recorded PCG and CTG sig-nals often showed a very lower SNR (with respect to either PCGor CTG recording). Hence, before performing signal processing, wevisually inspected recordings in order to select only those whereboth signals showed an acceptable SNR. We chose 34 couples ofPCG and CTG signals.
All the processing was developed off-line using Matlab version7.0.
B. Algorithm description
In FHS signals first and second foetal heart sounds (S1 andS2, respectively), shaped as bursts, can be recognized. S1 (closureof mitral and tricuspid valves) is considered a good time indica-tor of heart beat, because of both its high energy with respectto the other portions of the FHS, and less morphologic variability[10,19].
The developed algorithm was basically designed on S1 enhance-ment and detection. A logic block, based on mathematical rulesmainly concerning mean heart beat characteristics, described indetail in the following B4 (“Logic block”), chose S1 among several“candidates”. Finally, a post-processing block determined the timeposition of S1. The flow chart in Fig. 1 represents the main steps ofthe signal processing.
Filtering and first foetal heart sound enhancement blocks wereimplemented using different techniques (below summarized andexplained in detail in the following sections).
The filtering block was implemented by means of matched filterwith a template of S1 (chosen by the operator by selecting the start
M. Ruffo et al. / Biomedical Signal Processing and Control 5 (2010) 131–141 133
Fi
ac
ia(n
ba
r
B
qpisde
B
md
Bua
(
y
wtoat
tisnutc
Biiss
different techniques, described in detail in the following sections.
B3.1. Teager energy operator (TEO). TEO is a nonlinear time oper-ator, defined in both the continuous and discrete time-domain,which has the property of identifying signal tracts of local high
Table 1Chosen central frequency of the variable band-pass filter corresponding to eachconsidered gestational age.
Week of gestation Central frequency
34 53.55 Hz35 45.44 Hz
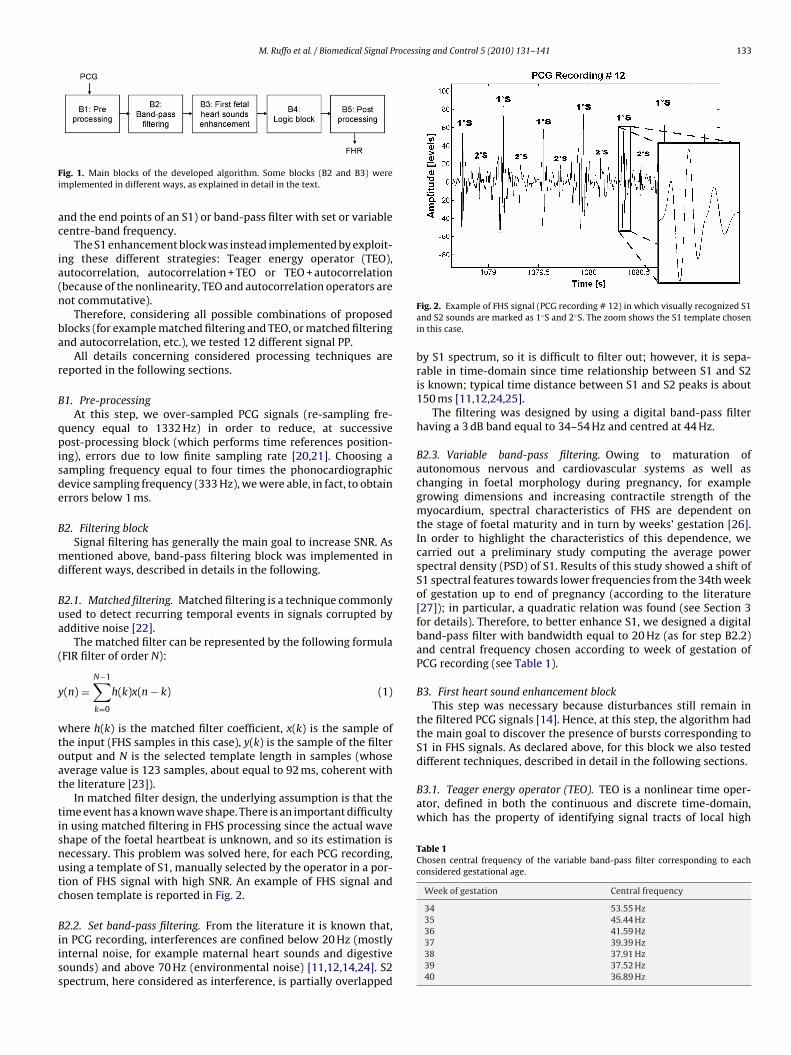
ig. 1. Main blocks of the developed algorithm. Some blocks (B2 and B3) weremplemented in different ways, as explained in detail in the text.
nd the end points of an S1) or band-pass filter with set or variableentre-band frequency.
The S1 enhancement block was instead implemented by exploit-ng these different strategies: Teager energy operator (TEO),utocorrelation, autocorrelation + TEO or TEO + autocorrelationbecause of the nonlinearity, TEO and autocorrelation operators areot commutative).
Therefore, considering all possible combinations of proposedlocks (for example matched filtering and TEO, or matched filteringnd autocorrelation, etc.), we tested 12 different signal PP.
All details concerning considered processing techniques areeported in the following sections.
1. Pre-processingAt this step, we over-sampled PCG signals (re-sampling fre-
uency equal to 1332 Hz) in order to reduce, at successiveost-processing block (which performs time references position-
ng), errors due to low finite sampling rate [20,21]. Choosing aampling frequency equal to four times the phonocardiographicevice sampling frequency (333 Hz), we were able, in fact, to obtainrrors below 1 ms.
2. Filtering blockSignal filtering has generally the main goal to increase SNR. As
entioned above, band-pass filtering block was implemented inifferent ways, described in details in the following.
2.1. Matched filtering. Matched filtering is a technique commonlysed to detect recurring temporal events in signals corrupted bydditive noise [22].
The matched filter can be represented by the following formulaFIR filter of order N):
(n) =N−1∑
k=0
h(k)x(n − k) (1)
here h(k) is the matched filter coefficient, x(k) is the sample ofhe input (FHS samples in this case), y(k) is the sample of the filterutput and N is the selected template length in samples (whoseverage value is 123 samples, about equal to 92 ms, coherent withhe literature [23]).
In matched filter design, the underlying assumption is that theime event has a known wave shape. There is an important difficultyn using matched filtering in FHS processing since the actual wavehape of the foetal heartbeat is unknown, and so its estimation isecessary. This problem was solved here, for each PCG recording,sing a template of S1, manually selected by the operator in a por-ion of FHS signal with high SNR. An example of FHS signal andhosen template is reported in Fig. 2.
2.2. Set band-pass filtering. From the literature it is known that,n PCG recording, interferences are confined below 20 Hz (mostlynternal noise, for example maternal heart sounds and digestiveounds) and above 70 Hz (environmental noise) [11,12,14,24]. S2pectrum, here considered as interference, is partially overlapped
Fig. 2. Example of FHS signal (PCG recording # 12) in which visually recognized S1and S2 sounds are marked as 1◦S and 2◦S. The zoom shows the S1 template chosenin this case.
by S1 spectrum, so it is difficult to filter out; however, it is sepa-rable in time-domain since time relationship between S1 and S2is known; typical time distance between S1 and S2 peaks is about150 ms [11,12,24,25].
The filtering was designed by using a digital band-pass filterhaving a 3 dB band equal to 34–54 Hz and centred at 44 Hz.
B2.3. Variable band-pass filtering. Owing to maturation ofautonomous nervous and cardiovascular systems as well aschanging in foetal morphology during pregnancy, for examplegrowing dimensions and increasing contractile strength of themyocardium, spectral characteristics of FHS are dependent onthe stage of foetal maturity and in turn by weeks’ gestation [26].In order to highlight the characteristics of this dependence, wecarried out a preliminary study computing the average powerspectral density (PSD) of S1. Results of this study showed a shift ofS1 spectral features towards lower frequencies from the 34th weekof gestation up to end of pregnancy (according to the literature[27]); in particular, a quadratic relation was found (see Section 3for details). Therefore, to better enhance S1, we designed a digitalband-pass filter with bandwidth equal to 20 Hz (as for step B2.2)and central frequency chosen according to week of gestation ofPCG recording (see Table 1).
B3. First heart sound enhancement blockThis step was necessary because disturbances still remain in
the filtered PCG signals [14]. Hence, at this step, the algorithm hadthe main goal to discover the presence of bursts corresponding toS1 in FHS signals. As declared above, for this block we also tested
36 41.59 Hz37 39.39 Hz38 37.91 Hz39 37.52 Hz40 36.89 Hz
134 M. Ruffo et al. / Biomedical Signal Processing and Control 5 (2010) 131–141
F1t
ew
t
E
wxt
p3
Bitbntwf
R
ws
bsepf
Bte
afo
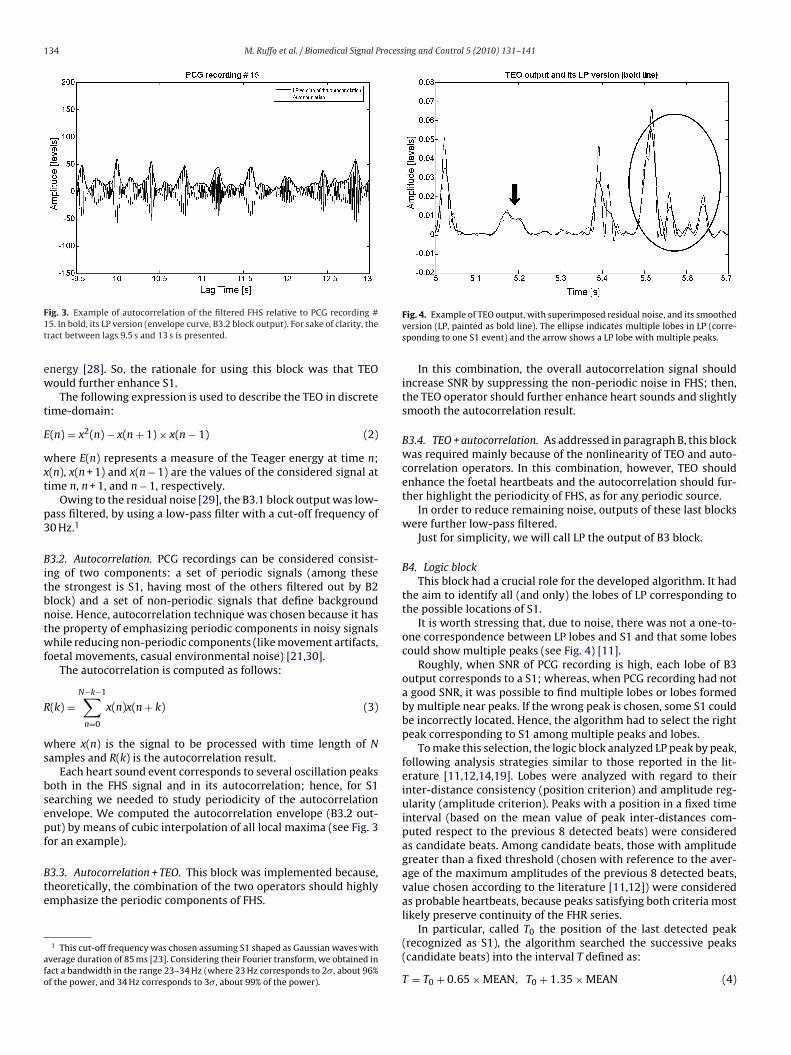
ig. 3. Example of autocorrelation of the filtered FHS relative to PCG recording #5. In bold, its LP version (envelope curve, B3.2 block output). For sake of clarity, theract between lags 9.5 s and 13 s is presented.
nergy [28]. So, the rationale for using this block was that TEOould further enhance S1.
The following expression is used to describe the TEO in discreteime-domain:
(n) = x2(n) − x(n + 1) × x(n − 1) (2)
here E(n) represents a measure of the Teager energy at time n;(n), x(n + 1) and x(n − 1) are the values of the considered signal atime n, n + 1, and n − 1, respectively.
Owing to the residual noise [29], the B3.1 block output was low-ass filtered, by using a low-pass filter with a cut-off frequency of0 Hz.1
3.2. Autocorrelation. PCG recordings can be considered consist-ng of two components: a set of periodic signals (among thesehe strongest is S1, having most of the others filtered out by B2lock) and a set of non-periodic signals that define backgroundoise. Hence, autocorrelation technique was chosen because it hashe property of emphasizing periodic components in noisy signalshile reducing non-periodic components (like movement artifacts,
oetal movements, casual environmental noise) [21,30].The autocorrelation is computed as follows:
(k) =N−k−1∑
n=0
x(n)x(n + k) (3)
here x(n) is the signal to be processed with time length of Namples and R(k) is the autocorrelation result.
Each heart sound event corresponds to several oscillation peaksoth in the FHS signal and in its autocorrelation; hence, for S1earching we needed to study periodicity of the autocorrelationnvelope. We computed the autocorrelation envelope (B3.2 out-ut) by means of cubic interpolation of all local maxima (see Fig. 3or an example).
3.3. Autocorrelation + TEO. This block was implemented because,heoretically, the combination of the two operators should highlymphasize the periodic components of FHS.
1 This cut-off frequency was chosen assuming S1 shaped as Gaussian waves withverage duration of 85 ms [23]. Considering their Fourier transform, we obtained inact a bandwidth in the range 23–34 Hz (where 23 Hz corresponds to 2�, about 96%f the power, and 34 Hz corresponds to 3�, about 99% of the power).
Fig. 4. Example of TEO output, with superimposed residual noise, and its smoothedversion (LP, painted as bold line). The ellipse indicates multiple lobes in LP (corre-sponding to one S1 event) and the arrow shows a LP lobe with multiple peaks.
In this combination, the overall autocorrelation signal shouldincrease SNR by suppressing the non-periodic noise in FHS; then,the TEO operator should further enhance heart sounds and slightlysmooth the autocorrelation result.
B3.4. TEO + autocorrelation. As addressed in paragraph B, this blockwas required mainly because of the nonlinearity of TEO and auto-correlation operators. In this combination, however, TEO shouldenhance the foetal heartbeats and the autocorrelation should fur-ther highlight the periodicity of FHS, as for any periodic source.
In order to reduce remaining noise, outputs of these last blockswere further low-pass filtered.
Just for simplicity, we will call LP the output of B3 block.
B4. Logic blockThis block had a crucial role for the developed algorithm. It had
the aim to identify all (and only) the lobes of LP corresponding tothe possible locations of S1.
It is worth stressing that, due to noise, there was not a one-to-one correspondence between LP lobes and S1 and that some lobescould show multiple peaks (see Fig. 4) [11].
Roughly, when SNR of PCG recording is high, each lobe of B3output corresponds to a S1; whereas, when PCG recording had nota good SNR, it was possible to find multiple lobes or lobes formedby multiple near peaks. If the wrong peak is chosen, some S1 couldbe incorrectly located. Hence, the algorithm had to select the rightpeak corresponding to S1 among multiple peaks and lobes.
To make this selection, the logic block analyzed LP peak by peak,following analysis strategies similar to those reported in the lit-erature [11,12,14,19]. Lobes were analyzed with regard to theirinter-distance consistency (position criterion) and amplitude reg-ularity (amplitude criterion). Peaks with a position in a fixed timeinterval (based on the mean value of peak inter-distances com-puted respect to the previous 8 detected beats) were consideredas candidate beats. Among candidate beats, those with amplitudegreater than a fixed threshold (chosen with reference to the aver-age of the maximum amplitudes of the previous 8 detected beats,value chosen according to the literature [11,12]) were consideredas probable heartbeats, because peaks satisfying both criteria mostlikely preserve continuity of the FHR series.
In particular, called T0 the position of the last detected peak(recognized as S1), the algorithm searched the successive peaks(candidate beats) into the interval T defined as:
T = T0 + 0.65 × MEAN, T0 + 1.35 × MEAN (4)
M. Ruffo et al. / Biomedical Signal Processing and Control 5 (2010) 131–141 135
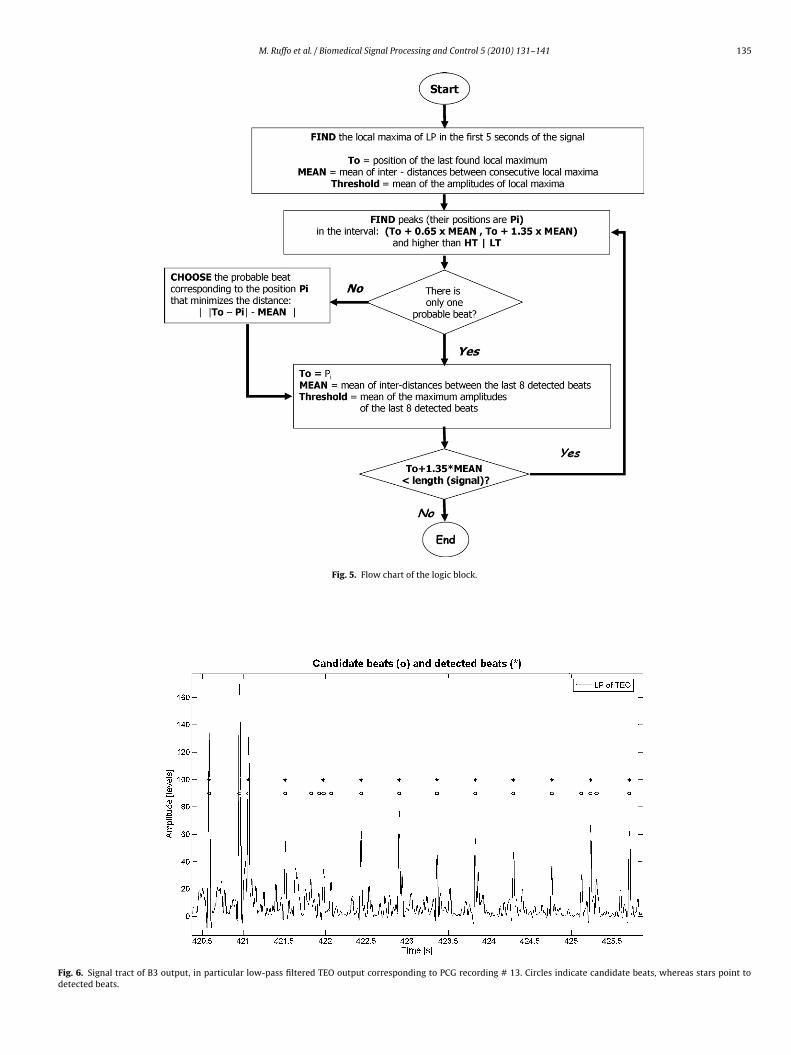
Fig. 5. Flow chart of the logic block.
Fig. 6. Signal tract of B3 output, in particular low-pass filtered TEO output corresponding to PCG recording # 13. Circles indicate candidate beats, whereas stars point todetected beats.
1 rocessing and Control 5 (2010) 131–141
wpwaot1
Thdhfatt
atec
roc
stap
ap
rp
pLr(mvat
anw
B
Si
Bcesg
pimrc
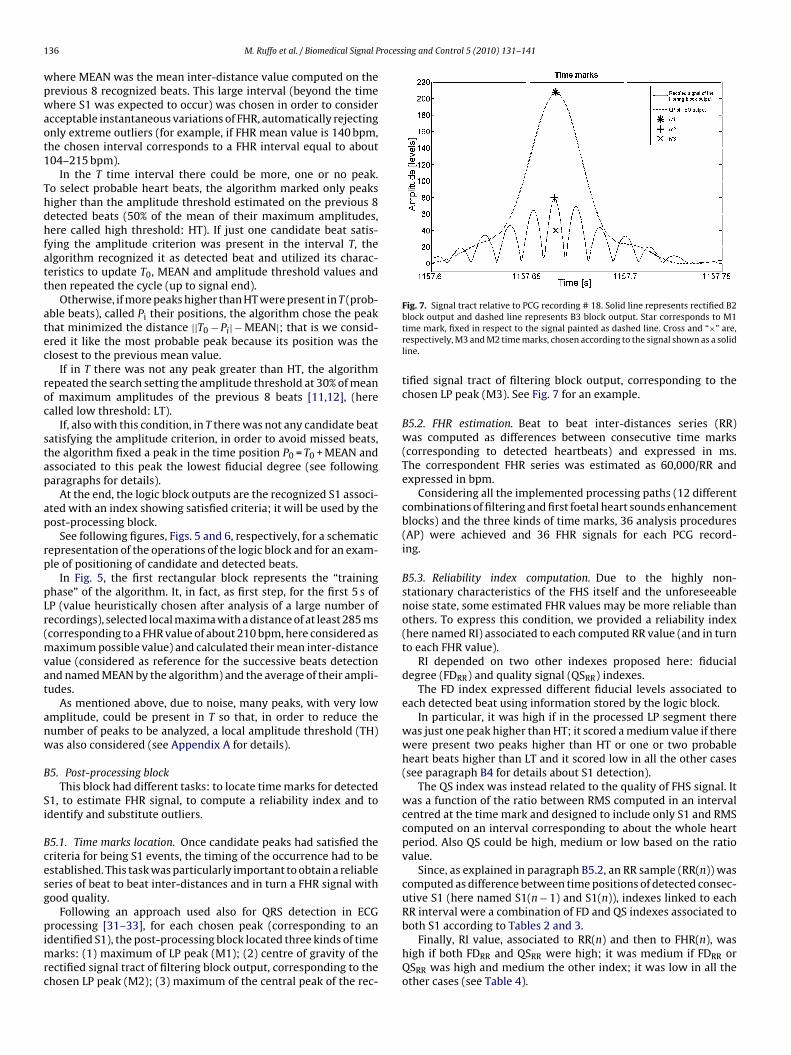
Fig. 7. Signal tract relative to PCG recording # 18. Solid line represents rectified B2
36 M. Ruffo et al. / Biomedical Signal P
here MEAN was the mean inter-distance value computed on therevious 8 recognized beats. This large interval (beyond the timehere S1 was expected to occur) was chosen in order to consider
cceptable instantaneous variations of FHR, automatically rejectingnly extreme outliers (for example, if FHR mean value is 140 bpm,he chosen interval corresponds to a FHR interval equal to about04–215 bpm).
In the T time interval there could be more, one or no peak.o select probable heart beats, the algorithm marked only peaksigher than the amplitude threshold estimated on the previous 8etected beats (50% of the mean of their maximum amplitudes,ere called high threshold: HT). If just one candidate beat satis-
ying the amplitude criterion was present in the interval T, thelgorithm recognized it as detected beat and utilized its charac-eristics to update T0, MEAN and amplitude threshold values andhen repeated the cycle (up to signal end).
Otherwise, if more peaks higher than HT were present in T (prob-ble beats), called Pi their positions, the algorithm chose the peakhat minimized the distance ||T0 − Pi| − MEAN|; that is we consid-red it like the most probable peak because its position was thelosest to the previous mean value.
If in T there was not any peak greater than HT, the algorithmepeated the search setting the amplitude threshold at 30% of meanf maximum amplitudes of the previous 8 beats [11,12], (herealled low threshold: LT).
If, also with this condition, in T there was not any candidate beatatisfying the amplitude criterion, in order to avoid missed beats,he algorithm fixed a peak in the time position P0 = T0 + MEAN andssociated to this peak the lowest fiducial degree (see followingaragraphs for details).
At the end, the logic block outputs are the recognized S1 associ-ted with an index showing satisfied criteria; it will be used by theost-processing block.
See following figures, Figs. 5 and 6, respectively, for a schematicepresentation of the operations of the logic block and for an exam-le of positioning of candidate and detected beats.
In Fig. 5, the first rectangular block represents the “traininghase” of the algorithm. It, in fact, as first step, for the first 5 s ofP (value heuristically chosen after analysis of a large number ofecordings), selected local maxima with a distance of at least 285 mscorresponding to a FHR value of about 210 bpm, here considered as
aximum possible value) and calculated their mean inter-distancealue (considered as reference for the successive beats detectionnd named MEAN by the algorithm) and the average of their ampli-udes.
As mentioned above, due to noise, many peaks, with very lowmplitude, could be present in T so that, in order to reduce theumber of peaks to be analyzed, a local amplitude threshold (TH)as also considered (see Appendix A for details).
5. Post-processing blockThis block had different tasks: to locate time marks for detected
1, to estimate FHR signal, to compute a reliability index and todentify and substitute outliers.
5.1. Time marks location. Once candidate peaks had satisfied theriteria for being S1 events, the timing of the occurrence had to bestablished. This task was particularly important to obtain a reliableeries of beat to beat inter-distances and in turn a FHR signal withood quality.
Following an approach used also for QRS detection in ECG
rocessing [31–33], for each chosen peak (corresponding to andentified S1), the post-processing block located three kinds of timearks: (1) maximum of LP peak (M1); (2) centre of gravity of the
ectified signal tract of filtering block output, corresponding to thehosen LP peak (M2); (3) maximum of the central peak of the rec-
block output and dashed line represents B3 block output. Star corresponds to M1time mark, fixed in respect to the signal painted as dashed line. Cross and “×” are,respectively, M3 and M2 time marks, chosen according to the signal shown as a solidline.
tified signal tract of filtering block output, corresponding to thechosen LP peak (M3). See Fig. 7 for an example.
B5.2. FHR estimation. Beat to beat inter-distances series (RR)was computed as differences between consecutive time marks(corresponding to detected heartbeats) and expressed in ms.The correspondent FHR series was estimated as 60,000/RR andexpressed in bpm.
Considering all the implemented processing paths (12 differentcombinations of filtering and first foetal heart sounds enhancementblocks) and the three kinds of time marks, 36 analysis procedures(AP) were achieved and 36 FHR signals for each PCG record-ing.
B5.3. Reliability index computation. Due to the highly non-stationary characteristics of the FHS itself and the unforeseeablenoise state, some estimated FHR values may be more reliable thanothers. To express this condition, we provided a reliability index(here named RI) associated to each computed RR value (and in turnto each FHR value).
RI depended on two other indexes proposed here: fiducialdegree (FDRR) and quality signal (QSRR) indexes.
The FD index expressed different fiducial levels associated toeach detected beat using information stored by the logic block.
In particular, it was high if in the processed LP segment therewas just one peak higher than HT; it scored a medium value if therewere present two peaks higher than HT or one or two probableheart beats higher than LT and it scored low in all the other cases(see paragraph B4 for details about S1 detection).
The QS index was instead related to the quality of FHS signal. Itwas a function of the ratio between RMS computed in an intervalcentred at the time mark and designed to include only S1 and RMScomputed on an interval corresponding to about the whole heartperiod. Also QS could be high, medium or low based on the ratiovalue.
Since, as explained in paragraph B5.2, an RR sample (RR(n)) wascomputed as difference between time positions of detected consec-utive S1 (here named S1(n − 1) and S1(n)), indexes linked to eachRR interval were a combination of FD and QS indexes associated to
both S1 according to Tables 2 and 3.Finally, RI value, associated to RR(n) and then to FHR(n), washigh if both FDRR and QSRR were high; it was medium if FDRR orQSRR was high and medium the other index; it was low in all theother cases (see Table 4).
M. Ruffo et al. / Biomedical Signal Processing and Control 5 (2010) 131–141 137
Table 2An RR interval was computed as difference between time positions of consecu-tive detected S1; so, for each RR value, FDRR was computed as combination of FDassociated to previous and current S1 (respectively, FDS1(n − 1) and FDS1(n)).
FDRR FDS1(n − 1)
High Medium Low
FDS1(n) High High Medium LowMedium Medium Medium LowLow Low Low Low
Table 3An RR interval was computed as difference between time positions of consecu-tive detected S1; so, for each RR value, QSRR was computed as combination of QSassociated to previous and current S1 (respectively, QSS1(n − 1) and or QSS1(n)).
QSRR QSS1(n-1)
High Medium Low
QSS1(n) High High Medium LowMedium Medium Medium LowLow Low Low Low
Table 4Computation of RI associated to each RR value in base on FDRR and QSRR indexes.
RI QSRR
High Medium Low
FDRR High High Medium Low
Borsr
tuftq
ow
tapfio
cvFm
abMpcs
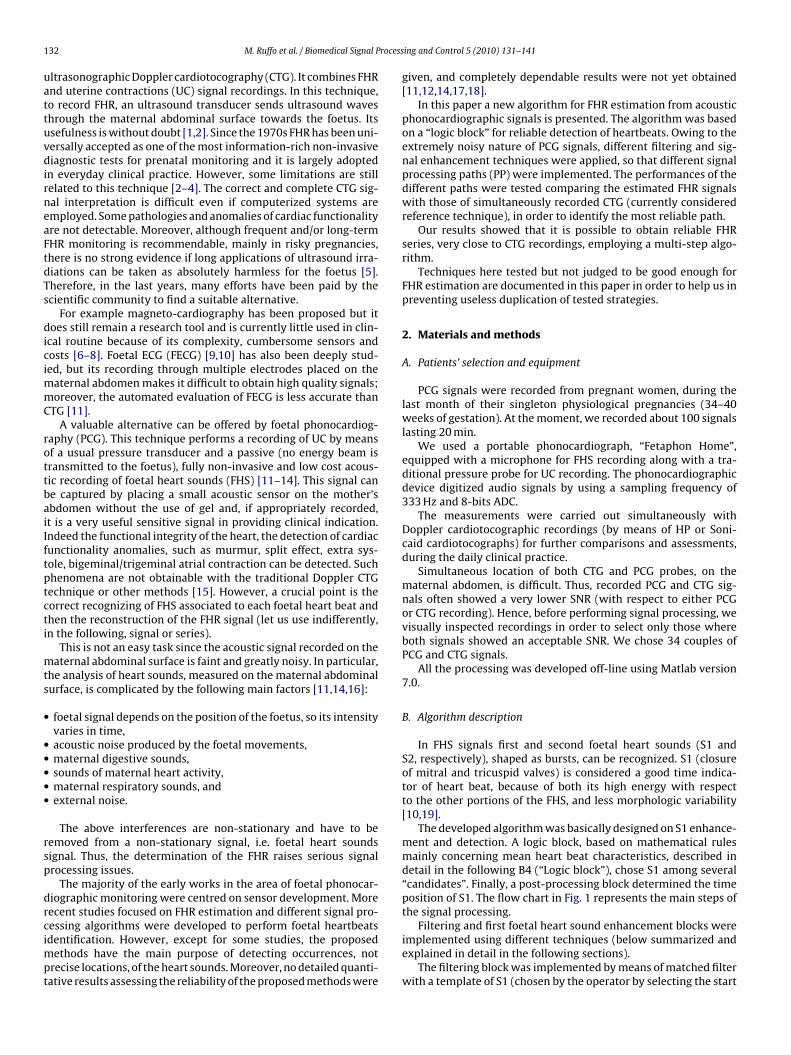
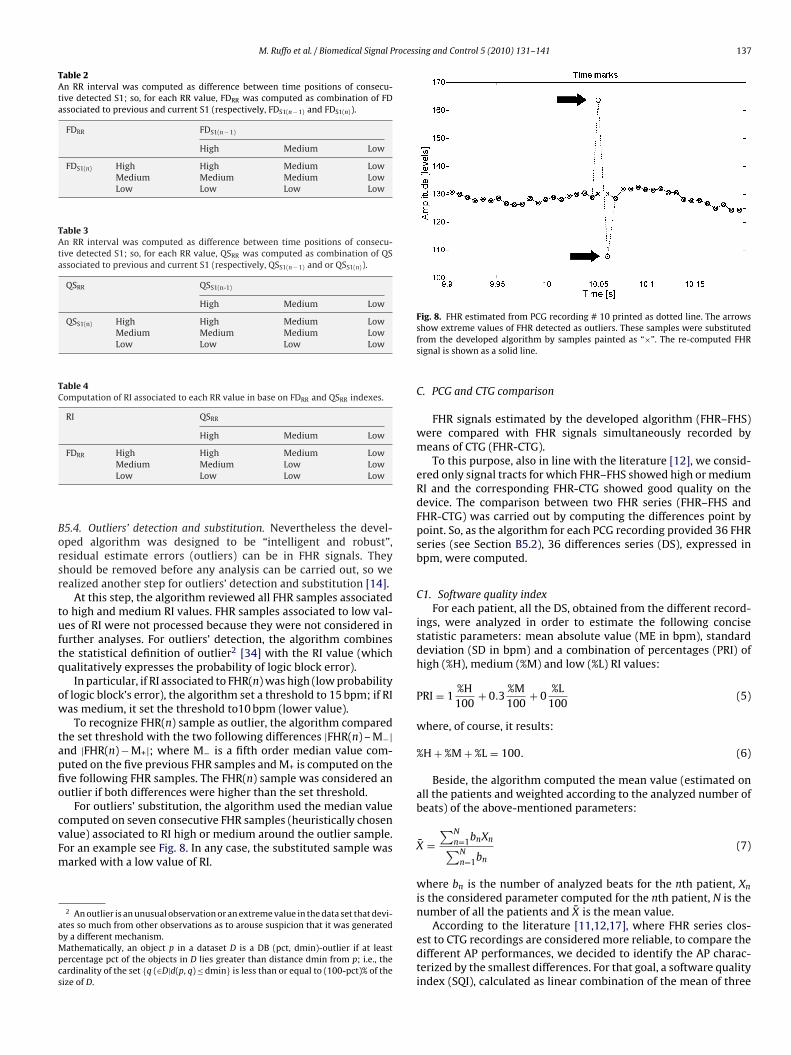
Fig. 8. FHR estimated from PCG recording # 10 printed as dotted line. The arrows
Medium Medium Low LowLow Low Low Low
5.4. Outliers’ detection and substitution. Nevertheless the devel-ped algorithm was designed to be “intelligent and robust”,esidual estimate errors (outliers) can be in FHR signals. Theyhould be removed before any analysis can be carried out, so weealized another step for outliers’ detection and substitution [14].
At this step, the algorithm reviewed all FHR samples associatedo high and medium RI values. FHR samples associated to low val-es of RI were not processed because they were not considered inurther analyses. For outliers’ detection, the algorithm combineshe statistical definition of outlier2 [34] with the RI value (whichualitatively expresses the probability of logic block error).
In particular, if RI associated to FHR(n) was high (low probabilityf logic block’s error), the algorithm set a threshold to 15 bpm; if RIas medium, it set the threshold to10 bpm (lower value).
To recognize FHR(n) sample as outlier, the algorithm comparedhe set threshold with the two following differences |FHR(n) – M−|nd |FHR(n) − M+|; where M− is a fifth order median value com-uted on the five previous FHR samples and M+ is computed on theve following FHR samples. The FHR(n) sample was considered anutlier if both differences were higher than the set threshold.
For outliers’ substitution, the algorithm used the median valueomputed on seven consecutive FHR samples (heuristically chosenalue) associated to RI high or medium around the outlier sample.or an example see Fig. 8. In any case, the substituted sample was
arked with a low value of RI.2 An outlier is an unusual observation or an extreme value in the data set that devi-tes so much from other observations as to arouse suspicion that it was generatedy a different mechanism.athematically, an object p in a dataset D is a DB (pct, dmin)-outlier if at least
ercentage pct of the objects in D lies greater than distance dmin from p; i.e., theardinality of the set {q (∈D|d(p, q) ≤ dmin} is less than or equal to (100-pct)% of theize of D.
show extreme values of FHR detected as outliers. These samples were substitutedfrom the developed algorithm by samples painted as “×”. The re-computed FHRsignal is shown as a solid line.
C. PCG and CTG comparison
FHR signals estimated by the developed algorithm (FHR–FHS)were compared with FHR signals simultaneously recorded bymeans of CTG (FHR-CTG).
To this purpose, also in line with the literature [12], we consid-ered only signal tracts for which FHR–FHS showed high or mediumRI and the corresponding FHR-CTG showed good quality on thedevice. The comparison between two FHR series (FHR–FHS andFHR-CTG) was carried out by computing the differences point bypoint. So, as the algorithm for each PCG recording provided 36 FHRseries (see Section B5.2), 36 differences series (DS), expressed inbpm, were computed.
C1. Software quality indexFor each patient, all the DS, obtained from the different record-
ings, were analyzed in order to estimate the following concisestatistic parameters: mean absolute value (ME in bpm), standarddeviation (SD in bpm) and a combination of percentages (PRI) ofhigh (%H), medium (%M) and low (%L) RI values:
PRI = 1%H100
+ 0.3%M100
+ 0%L
100(5)
where, of course, it results:
%H + %M + %L = 100. (6)
Beside, the algorithm computed the mean value (estimated onall the patients and weighted according to the analyzed number ofbeats) of the above-mentioned parameters:
X̄ =∑N
n=1bnXn∑N
n=1bn
(7)
where bn is the number of analyzed beats for the nth patient, Xn
is the considered parameter computed for the nth patient, N is thenumber of all the patients and X̄ is the mean value.
According to the literature [11,12,17], where FHR series clos-
est to CTG recordings are considered more reliable, to compare thedifferent AP performances, we decided to identify the AP charac-terized by the smallest differences. For that goal, a software qualityindex (SQI), calculated as linear combination of the mean of three
138 M. Ruffo et al. / Biomedical Signal Processing and Control 5 (2010) 131–141
Table 5Coefficients imposed to the linear transformations applied to the chosen parameters.
ME SD %H/100 %M/100
ki −0.4 −0.5 1 0.3ai 1.2 2 0 0
Table 6Selected ranges of variability were [0.5, 3] for ME and [2,4] for SD. Values outside ofthese ranges were saturated at 0 and 1 values.
s
S
irs
3
wgSuamF
[vap
ewwp3k
atr
twbcttAwcFwa%b
Fig. 9. Quadratic relationship between the frequency corresponding to the peak ofthe average PSD of S1 and gestational age. A high correlation coefficient (R2) wasfound.
Table 7Obtained SQI values for all the DS. In the second column, a numerical code cor-responds to each AP: the first number represents the filtering block (1 = matchedfilter with manual template, 2 = set band-pass filter, 3 = variable band-pass filter);the second, the first heart sound enhancement block (1 = TEO, 2 = autocorrelation,3 = autocorrelation + TEO, 4 = TEO + autocorrelation), and the third, the kind of timemark (1 = M1, 2 = M2, 3 = M3).
AP ME SD PRI SQI
1 1.1.1 0.30 2.72 0.71 2.352 1.1.2 0.30 3.20 0.71 2.123 1.1.3 0.34 3.95 0.71 1.74
4 1.2.1 0.96 5.24 0.18 1.005 1.2.2 0.79 5.35 0.18 1.066 1.2.3 3.69 8.85 0.18 0.187 1.3.1 0.79 5.02 0.17 1.068 1.3.2 0.63 5.22 0.17 1.129 1.3.3 3.53 8.95 0.17 0.17
10 1.4.1 0.80 3.79 0.34 1.3311 1.4.2 0.78 3.61 0.34 1.4312 1.4.3 0.79 4.43 0.34 1.23
13 2.1.1 0.33 3.31 0.69 2.0414 2.1.2 0.33 3.55 0.69 1.9215 2.1.3 0.52 4.49 0.69 1.68
Saturation level 0 1
ME ≥3 ≤0.5SD ≥4 ≤2
tatistic parameters (ME, SD, PRI), was introduced:
QI =3∑
i=1
Si =3∑
i=1
(kiX̄i + ai) (8)
For each mean parameter X̄ , a linear transformation wasmposed to obtain values between 0 and 1; ki and ai values wereeported in Table 5. Values out of a pre-selected range wereaturated.3 The saturation levels were reported in Table 6.
. Results
About band-pass filter with variable centre-band frequency,e analyzed 35 PCG recordings (five for each considered weeks’
estation). We manually selected ten S1 templates (with highNR) in each recording and computed their PSD. Then, we eval-ated the average of the 50 PSD obtained for each gestationalge. The correlation between the frequency corresponding to theaximum value of PSD and week of gestation was shown in
ig. 9.As regards to the assessment of algorithm performances
assessment], we analyzed 34 PCG recordings. After discardingalues with low RI, we analyzed signal tracts lasted 8 min onverage, so that, for each DS, more than 30,000 beats were com-ared.
For a schematic representation of the obtained results (Table 7),ach AP was identified by means of a three-number code,here the first number represents B2 block (1 = matched filterith manual template, 2 = set band-pass filter, 3 = variable band-ass filter); the second, B3 block (1 = TEO, 2 = autocorrelation,= autocorrelation + TEO, 4 = TEO + autocorrelation); the third, theind of time mark (1 = M1, 2 = M2, 3 = M3).
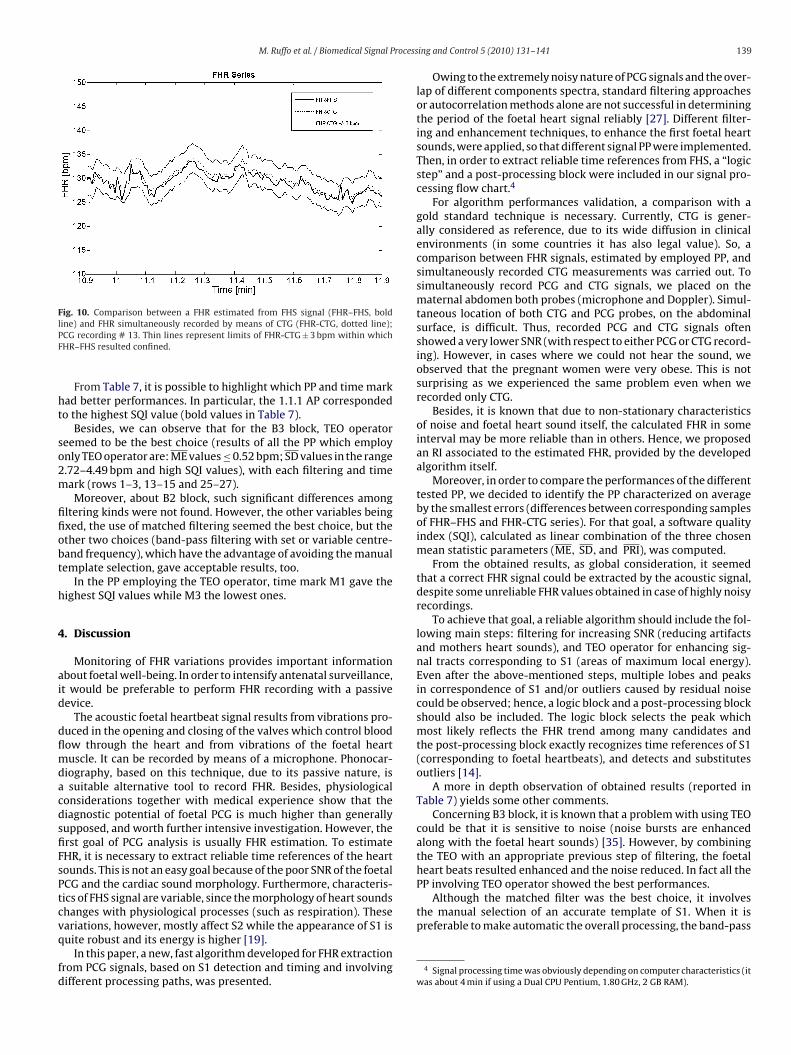
The analysis of the DS indicated that some AP was able to provideFHR series very similar (almost all confined between ±3 bpm) to
hat provided by a commercial US cardiotocographic device, cur-ently employed in clinical routine (see Fig. 10 for an example).
3 Concerning ME values, we considered that a value higher than 3 bpm yieldsoo low AP performances, with respect to software described in the literature, thuse set the corresponding SQI score to 0; while a value lower than 0.5 bpm would
ecome comparable to CTG resolution, and in turn very satisfying, so we set theorresponding SQI score at its maximum hypothesized (1). ki and ai values (respec-ively equal to −0.4 and 1.2) are the parameters necessary to obtain a line linkinghe two chosen points in a SQI Vs ME graph.bout SD, we heuristically set its possible range of variability, by considering inhich cases AP performances could be considered acceptable (most of SD samples
onfined in a fixed interval).inally, concerning percentages of RI values, we made these assumptions: weanted to obtain the maximum SQI score in case %H = 100 (ki = 1); for providinghigher robustness to the algorithm, we wanted a much lower SQI score in caseM = 100 (ki = 0.3) and we wanted SQI = 0 if %L = 100 (ki = 0). It results always ai = 0ecause minimum values of %H/100 and %L/100 are 0.
16 2.2.1 1.04 6.44 0.14 0.9317 2.2.2 0.97 6.45 0.14 0.9518 2.2.3 6.00 11.41 0.14 0.1419 2.3.1 1.01 6.32 0.13 0.9320 2.3.2 0.80 6.32 0.13 1.0121 2.3.3 5.34 11.37 0.13 0.1322 2.4.1 1.01 4.07 0.35 1.1523 2.4.2 1.00 3.96 0.35 1.1724 2.4.3 0.99 4.63 0.35 1.16
25 3.1.1 0.30 3.37 0.71 2.0226 3.1.2 0.29 3.64 0.71 1.8927 3.1.3 0.34 4.46 0.71 1.71
28 3.2.1 1.05 6.20 0.15 0.9329 3.2.2 0.86 6.29 0.15 1.0130 3.2.3 5.24 11.09 0.15 0.1531 3.3.1 0.91 6.10 0.13 0.9732 3.3.2 0.96 6.10 0.13 0.9533 3.3.3 5.12 11.56 0.13 0.1334 3.4.1 0.95 3.97 0.37 1.2035 3.4.2 0.90 3.84 0.37 1.2936 3.4.3 0.95 4.56 0.37 1.18
M. Ruffo et al. / Biomedical Signal Process
Fig. 10. Comparison between a FHR estimated from FHS signal (FHR–FHS, boldlPF
ht
so2m
fifiobt
h
4
aid
dflmdacdsfiFsPtcvq
fd
PP involving TEO operator showed the best performances.Although the matched filter was the best choice, it involves
the manual selection of an accurate template of S1. When it ispreferable to make automatic the overall processing, the band-pass
ine) and FHR simultaneously recorded by means of CTG (FHR-CTG, dotted line);CG recording # 13. Thin lines represent limits of FHR-CTG ± 3 bpm within whichHR–FHS resulted confined.
From Table 7, it is possible to highlight which PP and time markad better performances. In particular, the 1.1.1 AP correspondedo the highest SQI value (bold values in Table 7).
Besides, we can observe that for the B3 block, TEO operatoreemed to be the best choice (results of all the PP which employnly TEO operator are: ME values ≤ 0.52 bpm; SD values in the range.72–4.49 bpm and high SQI values), with each filtering and timeark (rows 1–3, 13–15 and 25–27).Moreover, about B2 block, such significant differences among
ltering kinds were not found. However, the other variables beingxed, the use of matched filtering seemed the best choice, but thether two choices (band-pass filtering with set or variable centre-and frequency), which have the advantage of avoiding the manualemplate selection, gave acceptable results, too.
In the PP employing the TEO operator, time mark M1 gave theighest SQI values while M3 the lowest ones.
. Discussion
Monitoring of FHR variations provides important informationbout foetal well-being. In order to intensify antenatal surveillance,t would be preferable to perform FHR recording with a passiveevice.
The acoustic foetal heartbeat signal results from vibrations pro-uced in the opening and closing of the valves which control bloodow through the heart and from vibrations of the foetal heartuscle. It can be recorded by means of a microphone. Phonocar-
iography, based on this technique, due to its passive nature, issuitable alternative tool to record FHR. Besides, physiological
onsiderations together with medical experience show that theiagnostic potential of foetal PCG is much higher than generallyupposed, and worth further intensive investigation. However, therst goal of PCG analysis is usually FHR estimation. To estimateHR, it is necessary to extract reliable time references of the heartounds. This is not an easy goal because of the poor SNR of the foetalCG and the cardiac sound morphology. Furthermore, characteris-ics of FHS signal are variable, since the morphology of heart soundshanges with physiological processes (such as respiration). Theseariations, however, mostly affect S2 while the appearance of S1 is
uite robust and its energy is higher [19].In this paper, a new, fast algorithm developed for FHR extractionrom PCG signals, based on S1 detection and timing and involvingifferent processing paths, was presented.
ing and Control 5 (2010) 131–141 139
Owing to the extremely noisy nature of PCG signals and the over-lap of different components spectra, standard filtering approachesor autocorrelation methods alone are not successful in determiningthe period of the foetal heart signal reliably [27]. Different filter-ing and enhancement techniques, to enhance the first foetal heartsounds, were applied, so that different signal PP were implemented.Then, in order to extract reliable time references from FHS, a “logicstep” and a post-processing block were included in our signal pro-cessing flow chart.4
For algorithm performances validation, a comparison with agold standard technique is necessary. Currently, CTG is gener-ally considered as reference, due to its wide diffusion in clinicalenvironments (in some countries it has also legal value). So, acomparison between FHR signals, estimated by employed PP, andsimultaneously recorded CTG measurements was carried out. Tosimultaneously record PCG and CTG signals, we placed on thematernal abdomen both probes (microphone and Doppler). Simul-taneous location of both CTG and PCG probes, on the abdominalsurface, is difficult. Thus, recorded PCG and CTG signals oftenshowed a very lower SNR (with respect to either PCG or CTG record-ing). However, in cases where we could not hear the sound, weobserved that the pregnant women were very obese. This is notsurprising as we experienced the same problem even when werecorded only CTG.
Besides, it is known that due to non-stationary characteristicsof noise and foetal heart sound itself, the calculated FHR in someinterval may be more reliable than in others. Hence, we proposedan RI associated to the estimated FHR, provided by the developedalgorithm itself.
Moreover, in order to compare the performances of the differenttested PP, we decided to identify the PP characterized on averageby the smallest errors (differences between corresponding samplesof FHR–FHS and FHR-CTG series). For that goal, a software qualityindex (SQI), calculated as linear combination of the three chosenmean statistic parameters (ME, SD, and PRI), was computed.
From the obtained results, as global consideration, it seemedthat a correct FHR signal could be extracted by the acoustic signal,despite some unreliable FHR values obtained in case of highly noisyrecordings.
To achieve that goal, a reliable algorithm should include the fol-lowing main steps: filtering for increasing SNR (reducing artifactsand mothers heart sounds), and TEO operator for enhancing sig-nal tracts corresponding to S1 (areas of maximum local energy).Even after the above-mentioned steps, multiple lobes and peaksin correspondence of S1 and/or outliers caused by residual noisecould be observed; hence, a logic block and a post-processing blockshould also be included. The logic block selects the peak whichmost likely reflects the FHR trend among many candidates andthe post-processing block exactly recognizes time references of S1(corresponding to foetal heartbeats), and detects and substitutesoutliers [14].
A more in depth observation of obtained results (reported inTable 7) yields some other comments.
Concerning B3 block, it is known that a problem with using TEOcould be that it is sensitive to noise (noise bursts are enhancedalong with the foetal heart sounds) [35]. However, by combiningthe TEO with an appropriate previous step of filtering, the foetalheart beats resulted enhanced and the noise reduced. In fact all the
4 Signal processing time was obviously depending on computer characteristics (itwas about 4 min if using a Dual CPU Pentium, 1.80 GHz, 2 GB RAM).
1 rocessing and Control 5 (2010) 131–141
fisT
rvo3pht
tbiPon
ttD1
emiuv
sau
awh
5
ar
pse
mocd
A
a
A
bc
c
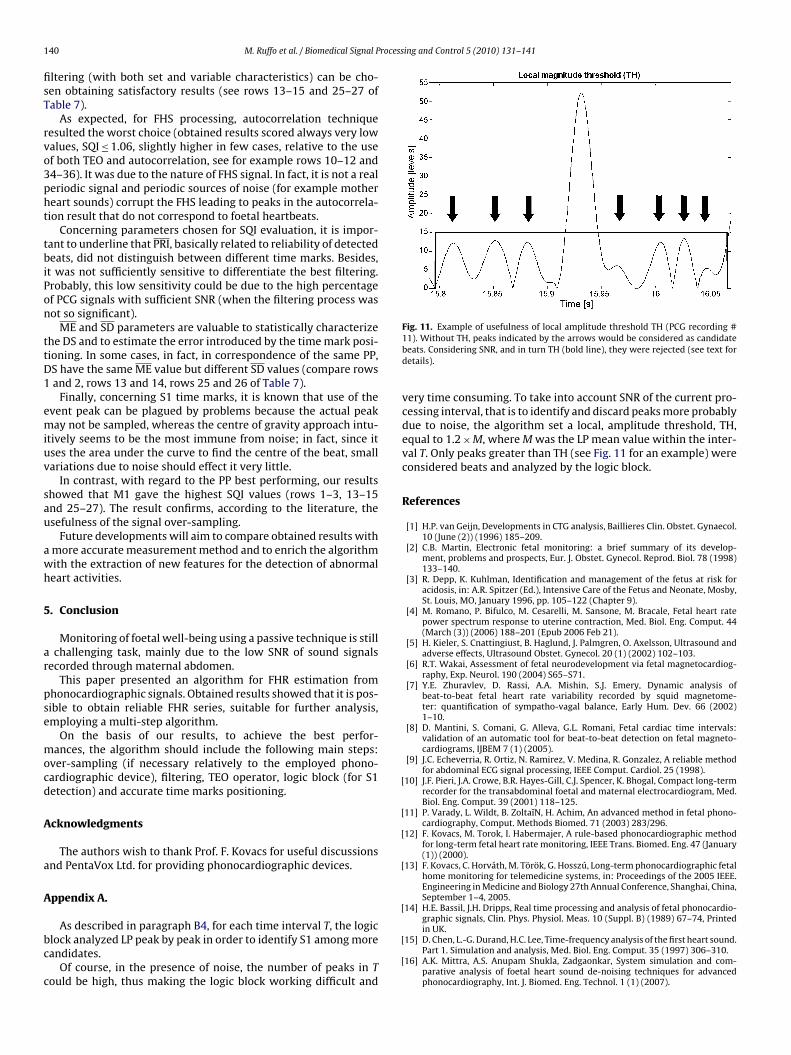
Fig. 11. Example of usefulness of local amplitude threshold TH (PCG recording #
[
[
[
[
[
40 M. Ruffo et al. / Biomedical Signal P
ltering (with both set and variable characteristics) can be cho-en obtaining satisfactory results (see rows 13–15 and 25–27 ofable 7).
As expected, for FHS processing, autocorrelation techniqueesulted the worst choice (obtained results scored always very lowalues, SQI ≤ 1.06, slightly higher in few cases, relative to the usef both TEO and autocorrelation, see for example rows 10–12 and4–36). It was due to the nature of FHS signal. In fact, it is not a realeriodic signal and periodic sources of noise (for example mothereart sounds) corrupt the FHS leading to peaks in the autocorrela-ion result that do not correspond to foetal heartbeats.
Concerning parameters chosen for SQI evaluation, it is impor-ant to underline that PRI, basically related to reliability of detectedeats, did not distinguish between different time marks. Besides,
t was not sufficiently sensitive to differentiate the best filtering.robably, this low sensitivity could be due to the high percentagef PCG signals with sufficient SNR (when the filtering process wasot so significant).
ME and SD parameters are valuable to statistically characterizehe DS and to estimate the error introduced by the time mark posi-ioning. In some cases, in fact, in correspondence of the same PP,S have the same ME value but different SD values (compare rowsand 2, rows 13 and 14, rows 25 and 26 of Table 7).
Finally, concerning S1 time marks, it is known that use of thevent peak can be plagued by problems because the actual peakay not be sampled, whereas the centre of gravity approach intu-
tively seems to be the most immune from noise; in fact, since itses the area under the curve to find the centre of the beat, smallariations due to noise should effect it very little.
In contrast, with regard to the PP best performing, our resultshowed that M1 gave the highest SQI values (rows 1–3, 13–15nd 25–27). The result confirms, according to the literature, thesefulness of the signal over-sampling.
Future developments will aim to compare obtained results withmore accurate measurement method and to enrich the algorithmith the extraction of new features for the detection of abnormaleart activities.
. Conclusion
Monitoring of foetal well-being using a passive technique is stillchallenging task, mainly due to the low SNR of sound signals
ecorded through maternal abdomen.This paper presented an algorithm for FHR estimation from
honocardiographic signals. Obtained results showed that it is pos-ible to obtain reliable FHR series, suitable for further analysis,mploying a multi-step algorithm.
On the basis of our results, to achieve the best perfor-ances, the algorithm should include the following main steps:
ver-sampling (if necessary relatively to the employed phono-ardiographic device), filtering, TEO operator, logic block (for S1etection) and accurate time marks positioning.
cknowledgments
The authors wish to thank Prof. F. Kovacs for useful discussionsnd PentaVox Ltd. for providing phonocardiographic devices.
ppendix A.
As described in paragraph B4, for each time interval T, the logiclock analyzed LP peak by peak in order to identify S1 among moreandidates.
Of course, in the presence of noise, the number of peaks in Tould be high, thus making the logic block working difficult and
[
[
11). Without TH, peaks indicated by the arrows would be considered as candidatebeats. Considering SNR, and in turn TH (bold line), they were rejected (see text fordetails).
very time consuming. To take into account SNR of the current pro-cessing interval, that is to identify and discard peaks more probablydue to noise, the algorithm set a local, amplitude threshold, TH,equal to 1.2 × M, where M was the LP mean value within the inter-val T. Only peaks greater than TH (see Fig. 11 for an example) wereconsidered beats and analyzed by the logic block.
References
[1] H.P. van Geijn, Developments in CTG analysis, Baillieres Clin. Obstet. Gynaecol.10 (June (2)) (1996) 185–209.
[2] C.B. Martin, Electronic fetal monitoring: a brief summary of its develop-ment, problems and prospects, Eur. J. Obstet. Gynecol. Reprod. Biol. 78 (1998)133–140.
[3] R. Depp, K. Kuhlman, Identification and management of the fetus at risk foracidosis, in: A.R. Spitzer (Ed.), Intensive Care of the Fetus and Neonate, Mosby,St. Louis, MO, January 1996, pp. 105–122 (Chapter 9).
[4] M. Romano, P. Bifulco, M. Cesarelli, M. Sansone, M. Bracale, Fetal heart ratepower spectrum response to uterine contraction, Med. Biol. Eng. Comput. 44(March (3)) (2006) 188–201 (Epub 2006 Feb 21).
[5] H. Kieler, S. Cnattingiust, B. Haglund, J. Palmgren, O. Axelsson, Ultrasound andadverse effects, Ultrasound Obstet. Gynecol. 20 (1) (2002) 102–103.
[6] R.T. Wakai, Assessment of fetal neurodevelopment via fetal magnetocardiog-raphy, Exp. Neurol. 190 (2004) S65–S71.
[7] Y.E. Zhuravlev, D. Rassi, A.A. Mishin, S.J. Emery, Dynamic analysis ofbeat-to-beat fetal heart rate variability recorded by squid magnetome-ter: quantification of sympatho-vagal balance, Early Hum. Dev. 66 (2002)1–10.
[8] D. Mantini, S. Comani, G. Alleva, G.L. Romani, Fetal cardiac time intervals:validation of an automatic tool for beat-to-beat detection on fetal magneto-cardiograms, IJBEM 7 (1) (2005).
[9] J.C. Echeverria, R. Ortiz, N. Ramirez, V. Medina, R. Gonzalez, A reliable methodfor abdominal ECG signal processing, IEEE Comput. Cardiol. 25 (1998).
10] J.F. Pieri, J.A. Crowe, B.R. Hayes-Gill, C.J. Spencer, K. Bhogal, Compact long-termrecorder for the transabdominal foetal and maternal electrocardiogram, Med.Biol. Eng. Comput. 39 (2001) 118–125.
11] P. Varady, L. Wildt, B. Zoltaı̌N, H. Achim, An advanced method in fetal phono-cardiography, Comput. Methods Biomed. 71 (2003) 283/296.
12] F. Kovacs, M. Torok, I. Habermajer, A rule-based phonocardiographic methodfor long-term fetal heart rate monitoring, IEEE Trans. Biomed. Eng. 47 (January(1)) (2000).
13] F. Kovacs, C. Horváth, M. Török, G. Hosszú, Long-term phonocardiographic fetalhome monitoring for telemedicine systems, in: Proceedings of the 2005 IEEE.Engineering in Medicine and Biology 27th Annual Conference, Shanghai, China,September 1–4, 2005.
14] H.E. Bassil, J.H. Dripps, Real time processing and analysis of fetal phonocardio-graphic signals, Clin. Phys. Physiol. Meas. 10 (Suppl. B) (1989) 67–74, Printed
in UK.15] D. Chen, L.-G. Durand, H.C. Lee, Time-frequency analysis of the first heart sound.Part 1. Simulation and analysis, Med. Biol. Eng. Comput. 35 (1997) 306–310.
16] A.K. Mittra, A.S. Anupam Shukla, Zadgaonkar, System simulation and com-parative analysis of foetal heart sound de-noising techniques for advancedphonocardiography, Int. J. Biomed. Eng. Technol. 1 (1) (2007).

rocess
[
[
[
[
[
[
[
[
[
[
[
[
[
[
[
[
[
[34] M.M. Breunig, H.-P. Kriegel, R.T. Ng, J. Sander, LOF: identifying density-based
M. Ruffo et al. / Biomedical Signal P
17] J. Chen, K. Phua, Y. Song, L. Shue, Fetal heart signal monitoring with confidencefactor, in: IEEE International Conference on Multimedia and Expo, 2006, ICMEpp. 1937–1940.
18] M. Moghavvemi, B.H. Tan, S.Y. Tan, A non-invasive PC-based measurement offetal phonocardiography, Sens. Actuators A 107 (2003) 96–103.
19] C. Ahlstrom, T. Lanne, P. Ask, A. Johansson, A method for accurate localizationof the first heart sound and possible applications, Physiol. Meas. 29 (2008)417–428.
20] M. Merri, D.C. Farden, J.G. Mottley, E.L. Titlebaum, Sampling frequency of theelectrocardiogram for spectral analysis of the heart rate variability, IEEE Trans.Biomed. Eng. 37 (January (1)) (1990) 99–106.
21] J.G. Proakis, D.G. Manolakis, Digital Signal Processing—Principles, Algorithms,and Applications, 3rd ed., Prentice Hall, 1996.
22] A. Bruce Carlson, Paul B. Crilly, Janet C. Rutledge, Communication Systems.An Introduction to Signals and Noise in Electrical Communication, 4th ed.,McGraw-Hill Higher Education, 2002.
23] A.A. Luisada, F. Mendoza, M.M. Alimurung, The duration of normal heart sounds,Br. Heart J. 11 (January (1)) (1949) 41–47.
24] A.K. Mittra, N.K. Choudhary, A.S. Zadgaonkar, Development of an artificialwomb for acoustical simulation of mother’s abdomen, Int. J. Biomed. Eng. Tech-
nol. 1 (3) (2008).25] A. Jimenez, Mr Ortiz, M. Pena, S. Charleston, R. Gonzalez, A. Aljama, S. Car-rasco, Performance of a method to generate fetal cardiotachograms using fetalphonocardiography, Comput. Cardiol. 28 (2001) 453–456.
26] H. Matsui, H. Gardiner, Current aspects of fetal cardiovascular function, FetalMatern. Med. Rev. 19 (1) (2008) 61–84, Cambridge University Press.
[
ing and Control 5 (2010) 131–141 141
27] J. Nagel, New diagnostic and technical aspects of fetal phonocardiography, Eur.J. Obstet. Gynecol. Reprod. Biol. 23 (1986) 295–303, Elsevier.
28] J.F. Kaiser, Some useful properties of Teager’s energy operators, in: Acoustics,Speech, and Signal Processing. 1993 IEEE International Conference on, 1993,ICASSP-93, vol. 3, 1993, pp. 149–152.
29] J.F. Kaiser, On a simple algorithm to calculate the ‘energy’ of a signal, in: Proc.IEEE ICASSP-90, Albuquerque, New Mexico, April, 1990, pp. 381–384.
30] A. Jimenez-Canas, C. Fernandez-Castellanos, V. Castro-Castillo, A. Ruiz-Toledo,A. Sotomayor-Ortega, Implementation of real time autocorrelation methodemploying the DS87C550 microcontroller, J. Appl. Res. Technol. 1 (April (1))(2005).
31] B.-U. Köhler, C. Hennig, R. Orglmeister, The principles of Software QRS detec-tion, IEEE Eng. Med. Biol. (January–February) (2002).
32] R. Bailon, S. Olmos, P. Serrano, J. Garcıa, P. Laguna, Robust measure ofST/HR hysteresis in stress test ECG recordings, Comput. Cardiol. 29 (2002)329–332.
33] P. Rozentryt, J. Leski, J. Sroczynski, E. Czogala, A new beat-by-beat spectrotem-poral analysis of variability in ECG morphology, Med. Sci. Monit. 5 (4) (1999)777–785.
local outliers, in: Proc. ACM SIGMOD 2000 Int. Conf. On Management of Data,Dallas, TX, 2000.
35] X. Li, P. Zhou, A.S. Aruin, Teager–Kaiser energy operation of surface EMGimproves muscle activity onset detection, Ann. Biomed. Eng. 35 (September(9)) (2007) 1532–1538.
Copyright © 2022 FDOKUMEN