An adaptive order-statistics filter for SAR images
10
This article was downloaded by: [Consiglio Nazionale delle Ricerche], [Ms S. Paloscia] On: 25 October 2013, At: 09:28 Publisher: Taylor & Francis Informa Ltd Registered in England and Wales Registered Number: 1072954 Registered office: Mortimer House, 37-41 Mortimer Street, London W1T 3JH, UK International Journal of Remote Sensing Publication details, including instructions for authors and subscription information: http://www.tandfonline.com/loi/tres20 An adaptive order-statistics filter for SAR images L. ALPARONE a , S. BARONTI b , R. CARL[Agrave] b & C. PUGLISI c a Dipartimento di Ingegneria Elettronica , University of Florence , via di S. Marta 3, Florence, I-50139, Italy b Istituto di Ricerca sulle Onde Elettromagnetiche ‘Nello Carrara’, CNR — National Research Council of Italy , via Panciatichi 64, Florence, I-50127, Italy c Italian Foreign Office (MAE) , via Cocchi 4, Florence, I-50131|Italy Published online: 27 Apr 2007. To cite this article: L. ALPARONE , S. BARONTI , R. CARL[Agrave] & C. PUGLISI (1996) An adaptive order-statistics filter for SAR images, International Journal of Remote Sensing, 17:7, 1357-1365, DOI: 10.1080/01431169608948708 To link to this article: http://dx.doi.org/10.1080/01431169608948708 PLEASE SCROLL DOWN FOR ARTICLE Taylor & Francis makes every effort to ensure the accuracy of all the information (the “Content”) contained in the publications on our platform. However, Taylor & Francis, our agents, and our licensors make no representations or warranties whatsoever as to the accuracy, completeness, or suitability for any purpose of the Content. Any opinions and views expressed in this publication are the opinions and views of the authors, and are not the views of or endorsed by Taylor & Francis. The accuracy of the Content should not be relied upon and should be independently verified with primary sources of information. Taylor and Francis shall not be liable for any losses, actions, claims, proceedings, demands, costs, expenses, damages, and other liabilities whatsoever or howsoever caused arising directly or indirectly in connection with, in relation to or arising out of the use of the Content. This article may be used for research, teaching, and private study purposes. Any substantial or systematic reproduction, redistribution, reselling, loan, sub-licensing, systematic supply, or distribution in any form to anyone is expressly forbidden. Terms & Conditions of access and use can be found at http:// www.tandfonline.com/page/terms-and-conditions
Transcript of An adaptive order-statistics filter for SAR images
This article was downloaded by: [Consiglio Nazionale delle Ricerche], [Ms S. Paloscia]On: 25 October 2013, At: 09:28Publisher: Taylor & FrancisInforma Ltd Registered in England and Wales Registered Number: 1072954 Registered office: Mortimer House,37-41 Mortimer Street, London W1T 3JH, UK
International Journal of Remote SensingPublication details, including instructions for authors and subscription information:http://www.tandfonline.com/loi/tres20
An adaptive order-statistics filter for SAR imagesL. ALPARONE a , S. BARONTI b , R. CARL[Agrave] b & C. PUGLISI ca Dipartimento di Ingegneria Elettronica , University of Florence , via di S. Marta 3,Florence, I-50139, Italyb Istituto di Ricerca sulle Onde Elettromagnetiche ‘Nello Carrara’, CNR — National ResearchCouncil of Italy , via Panciatichi 64, Florence, I-50127, Italyc Italian Foreign Office (MAE) , via Cocchi 4, Florence, I-50131|ItalyPublished online: 27 Apr 2007.
To cite this article: L. ALPARONE , S. BARONTI , R. CARL[Agrave] & C. PUGLISI (1996) An adaptive order-statistics filter forSAR images, International Journal of Remote Sensing, 17:7, 1357-1365, DOI: 10.1080/01431169608948708
To link to this article: http://dx.doi.org/10.1080/01431169608948708
PLEASE SCROLL DOWN FOR ARTICLE
Taylor & Francis makes every effort to ensure the accuracy of all the information (the “Content”) containedin the publications on our platform. However, Taylor & Francis, our agents, and our licensors make norepresentations or warranties whatsoever as to the accuracy, completeness, or suitability for any purpose of theContent. Any opinions and views expressed in this publication are the opinions and views of the authors, andare not the views of or endorsed by Taylor & Francis. The accuracy of the Content should not be relied upon andshould be independently verified with primary sources of information. Taylor and Francis shall not be liable forany losses, actions, claims, proceedings, demands, costs, expenses, damages, and other liabilities whatsoeveror howsoever caused arising directly or indirectly in connection with, in relation to or arising out of the use ofthe Content.
This article may be used for research, teaching, and private study purposes. Any substantial or systematicreproduction, redistribution, reselling, loan, sub-licensing, systematic supply, or distribution in anyform to anyone is expressly forbidden. Terms & Conditions of access and use can be found at http://www.tandfonline.com/page/terms-and-conditions

INT. 1. REMOTE SENSING, 1996, VOL. 17, No.7, 1357-1365
An adaptive order-statistics filter for SAR images
L. ALPARONE
Dipartimento di Ingegneria Elettronica, University of Florence,via di S. Marta 3, 1-50139 Florence, Italy
S. BARONTIt, R. CARLA
Istituto di Ricerca sulle Onde Elettromagnetiche 'Nello Carrara', CNR National Research Council of Italy, via Panciatichi 64, 1-50127 Florence, Italy
and C. PUGLISIt
Italian Foreign Office (MAE), via Cocchi 4, 1-50131 Florence, Italy
(Received 6 February 1995; in final form 1 September 1995)
Abstract. An algorithm based on local order statistics is proposed for adaptivereduction of speckle noise in synthetic aperture radar (SAR) images. A selectivesmoothing is obtained by replacing a pixel value belonging to either of the tailsof the local histogram by its percentile, whose area is adaptively defined by aGaussian function of the Local Variation Coefficient. The filter can fit the actualnoise level and preserves structures, textures, and point targets, as well as thelocal mean without introducing any blur on the edges, mostly due to its closureproperty. Comparisons with algorithms suitable for speckle smoothing are performed on true SAR images and show selective signal-to-noise ratio (SNR)enhancements.
1. IntroductionSynthetic aperture radar (SAR) images affected by speckle noise require specific
processing as literature reports (Lee et al. 1994). A general approach to noisereduction is based on modelling: multiplicative and generally signal-dependent noisemodels are widely used for SAR (Goodman 1976). Stationarity hypotheses areusually made on the noise, but are seldom satisfied by the signal (Kuan et al. 1985,Lopes et al. 1990). The assumption of suitable models of noise and signal may beuseful for restoration (Frost et al. 1982, Oliver 1991). However, some hypothesesmay be far from being verified, thus leading to unsatisfactory results. Hence, algorithms that are not based on specific models can be effective for a wide class ofproblems. This approach is typical of nonlinear filters, which exploit local statisticsand/or geometric features.
Rank and order statistics filters (Pitas and Venetsanopoulos 1992) are based onthe local grey level histogram: a pixel value is exchanged with a linear or nonlinearcombination of values corresponding to predefined order ranks, i.e., positions within
t Corresponding author.:j: On leave from Istituto Agronomico per I'Oltremare (lAO).
0143-1161/96 $12.00 © 1996 Taylor & Francis Ltd
Dow
nloa
ded
by [
Con
sigl
io N
azio
nale
del
le R
icer
che]
, [M
s S.
Pal
osci
a] a
t 09:
28 2
5 O
ctob
er 2
013

1358 L. Alparone et al.
the local histogram. Smoothing effects are easily produced, e.g., by replacing thecentral pixel of the window with the median, as for a 2-D median filter.
A different approach is followed by geometric filter (Crimmins 1985, Lee et al.1994), that locally processes images on the basis of the shape of the grey-levelfunction. Filtering is achieved by iterating sequences of pairs of complementaryconvex-hull operations along the eight-neighbour directions.
Some adaptive filters (Frost et al. 1982, Kuan et al. 1985) are based on the sameprinciple of the optimum estimation: once a minimum mean square error (MMSE)solution is obtained, work parameters are estimated from the local signal statistics.Improvements to the basic schemes have been introduced (Lee 1981, Lopes et al.1990) to smooth homogeneous areas simultaneously preserving edges. Other algorithms take advantage of both local statistics and geometry. The Lee's sigma filterconsiders local averages on a grey-level interval whose extent is constrained by thenoise standard deviation. A recent variant copes better with speckle statistics,resulting in unbiased response and total rejection of noisy spikes (Alparone et al.1995). The Edge Preserving Smoothing (EPS) algorithm (Nagao and Matsuyama1979) involves nine partially overlapped sub-windows surrounding the current pixelwithin a 5 x 5 sliding window; the pixel level is set to the average of the sub-windowwhose variance is the lowest.
The algorithm reported here is a further development of an order-statistics filter(Alparone et al. 1992) in which smoothing can be tuned to the noise variance throughthe Local Variation Coefficient (LVC).
Although excellent results of despeckle and segmentation are obtained by the useof simulated annealing techniques (White 1994) which iteratively yield an estimate,starting from a model of image inhomogeneity based on connectivity constraints,their complexity and massive computational demand prevent their use in simplereal-time applications, which is peculiar to all of the schemes surveyed.
2. The adaptive order-statistics filter for SAR imagesThe algorithm is based on local order statistics (Pitas and Venetsanopoulos 1992)
and adaptively generalizes the concept of 2-D median filtering, analogously to theCentre-Weighted Median filter (CWM) (Ko and Lee 1991). An adaptivity functionis tailored to the local statistics of SAR speckle, with a percentile notation enablingthe development of a modified scheme with unbiased filtering capability.
Let U(i, j)} denote a digital image. On a sliding window of predefined odd sizeIII x /I centred on each pixel of coordinates (i, j) compute the local histogram H =
{H(k), k = 0, I, ... , Lmax }, where Lmax is the full-scale value, i.e., Lmax = 255 for 8-bitword-length), the local grey-level standard deviation s(i, j) and mean /l(i, j), and theirratio LVC(i, j), locally measuring the Variation Coefficient.
Two values AL(i, j) and AR(i, j), complementary in the range 0-7-1 (i.e., AL(i, j) =
I - AR(i, j)) and defining the areas of the tails of the PDF (i.e., normalized H), arederived from LVC(i, j), thus resulting to be adaptive. p,.(i, j) and PR(i, j) are definedas Ac and AR-percentiles, by the following constraints:
CDF[PIJi,j)-I] ~AL(i,j)<CDF[PIJi,j)] }
CDF[PR(i, j) - I] < AR(i, j) ~ CDF[PR(i, j)]
where CDF(l) denotes the local Cumulative Distribution Function,
I I
CDF(l) g -- I H(k) 1= 0, ... , Lma xmXllk~O
(I)
(2)
Dow
nloa
ded
by [
Con
sigl
io N
azio
nale
del
le R
icer
che]
, [M
s S.
Pal
osci
a] a
t 09:
28 2
5 O
ctob
er 2
013

Adaptive order-statistics filter for SAR images
The output value g(i, j) is defined according to the following decision rule:
g(i, j) = median {PL(i, j),f(i, j), PR(i, j)}
1359
(3)
With reference to figure I, equation (3) states that a pixel is replaced by the left(right) percentile, if its value is lower (greater) than the percentile itself. If symmetricalpercentiles are taken, the heaviest smoothing results when AL(i, j) = AR(i, j) = 0'5;Pdi, j) = PR(i, j) = m(i, j), where m(i, j) denotes the local median, and the schemebecomes a median filter. Conversely, the greatest preservation is achieved when bothAL(i, j) = 0 and AR(i, j) = I; hence, PL(i, j) equals the local minimum, and PR(i, j) themaximum: according to equation (3), the pixel at (i, j) is unchanged in value.
The above scheme may be regarded as equivalent to a CWM filter, in which thevalue of the central pixel of the local window is given an integer odd weight w (i.e.,replicated w- I times) when computing H. The relationship between wand A L , A R ,
for an odd m x n window, is given by
AL=mxn-w =~(I__w ))2mxn 2 mxn
A R= I-AL=~(l+~)2 m x n
(4)
with I :;;; w :;;; m x n. If w = I, CWM becomes a median filter. When w> I, the centralpixel is more likely to become the median than the others, resulting in greater detailpreservation. The scheme shares the property of closure with order-statistics filters,i.e., the set of the output belongs to that of the input, thus providing greater edgepreservation capability than do other nonlinear filters (Pitas and Venetsanopoulos1992).
When processing SAR images, the filter should strongly smooth speckle inhomogeneous areas (low LVq, whereas on edges, built-up areas and point targets(high LVq, in which the speckle is not fully developed (Goodman 1976, Lopes et al.1990), the pixel value should be left unchanged; in intermediate cases, the filtershould steadily decrease its effect for increasing LVe.
We have found that an adaptivity function of type single-sided Gaussian with
p(f)
P P fL R
Figure l. Definitions of percentiles PL and PR' Solid curve (local PDF) encloses unitary area.Shaded areas on left and right measure A L and 1- A R , respectively.
Dow
nloa
ded
by [
Con
sigl
io N
azio
nale
del
le R
icer
che]
, [M
s S.
Pal
osci
a] a
t 09:
28 2
5 O
ctob
er 2
013

1360 L. A Iparone et al.
shape factor a, performs better than a negative exponential (single-sided Laplacian),as well as the hyperbolic function that CWM filter borrows from MMSE filters(Kuan et al. 1985). Since a2 defines the strength of smoothing, it may be related tothe variance of speckle noise a~; taking a peak amplitude of e/2 and clipping theresults to 0,5, to prevent the two percentiles from being swapped, yields
(5)
If a is chosen equal to au, the algorithm behaves like a median filter in uniformareas, where LYC approximates the standard deviation of the speckle noise. In anycase, the smoothing effect may be increased and decreased along with a as in a linearGaussian-shaped filter, thus making the algorithm easily fit noisy images (Lee 1981,Frost et al. 1982, Kuan et al. 1985, Lopes et al. 1990, Ko and Lee 1991).
AR(i, j) may be symmetrically obtained as I - AL(i, j); hence, PL(i, j) and PR(i, j)are found to be the corresponding symmetric percentiles, according to equation (1).The average level is maintained when the level changes are statistically balanced,which happens if the local histogram is symmetric around its mean. However, thisdoes not usually happen in SAR images, especially for a small number of looks(Ulaby et al. 1986, Lee et al. 1994). In fact,f(i, j) may be replaced by either Pdi, j)or PR(i, j) according to the decision rule stated in equation (3). If PR(i, j) - f(i, j) islikely to be on average larger than f(i, j) - Pdi, j), then the output image will resultin being darker, as it has been verified in practice when dealing with SAR images.
In order to prevent this drawback, Adi, j) and AR(i, j) are empirically correctedfor the asymmetry of the histogram, by the difference between local mean andmedian, normalized to the full scale value:
(. .) /1(i, j) - m(i, j)
a I, ] =Lm ax
(6)
hence, the corrected percentile areas become
Adi,j)=AL(i,j)[1 +a(i,j)] }(7)
AR(i, j) = [1 - Adi, j)] [I - a(i, j)]
with A/.(i,j) given by equation (5). The Adi,j) and AR(i,j) provided by equation (7)are actually used in equation (1) to retrieve Pdi, j) and PR(i, j), with the result beingapproximately balanced around the local mean. Notice that the original CWM filter,although adaptively varying the central weight with a law borrowed from Kuan'sfilter, i.e., tuning its percentiles, does not allow any correction of the response bias.
3. Evaluation criteriaMany algorithms have been specifically proposed for speckle reduction in SAR
images and some of the most widely used have been reviewed (Lee et al. 1994). Twovariants of Lee's filter (Lee 1981, Kuan et al. 1985), are the most effective. Kuan'sfilter and two other adaptive filters, namely the geometric (Crimmins 1985) and theEPS (Nagao and Matsuyama 1979) filters, have been compared with the schemedescribed in §2, which will be referred to as Adaptive Percentile Clipping (APe)filter. Also median filter has been considered, because of its large diffusion andaffinity with APC due to its closure. Comparisons have been carried out accordingto signal-to-noise ratio (SNR) enhancement, and visual interpretation.
Dow
nloa
ded
by [
Con
sigl
io N
azio
nale
del
le R
icer
che]
, [M
s S.
Pal
osci
a] a
t 09:
28 2
5 O
ctob
er 2
013
Adaptive order-statistics filter for SAR images 1361
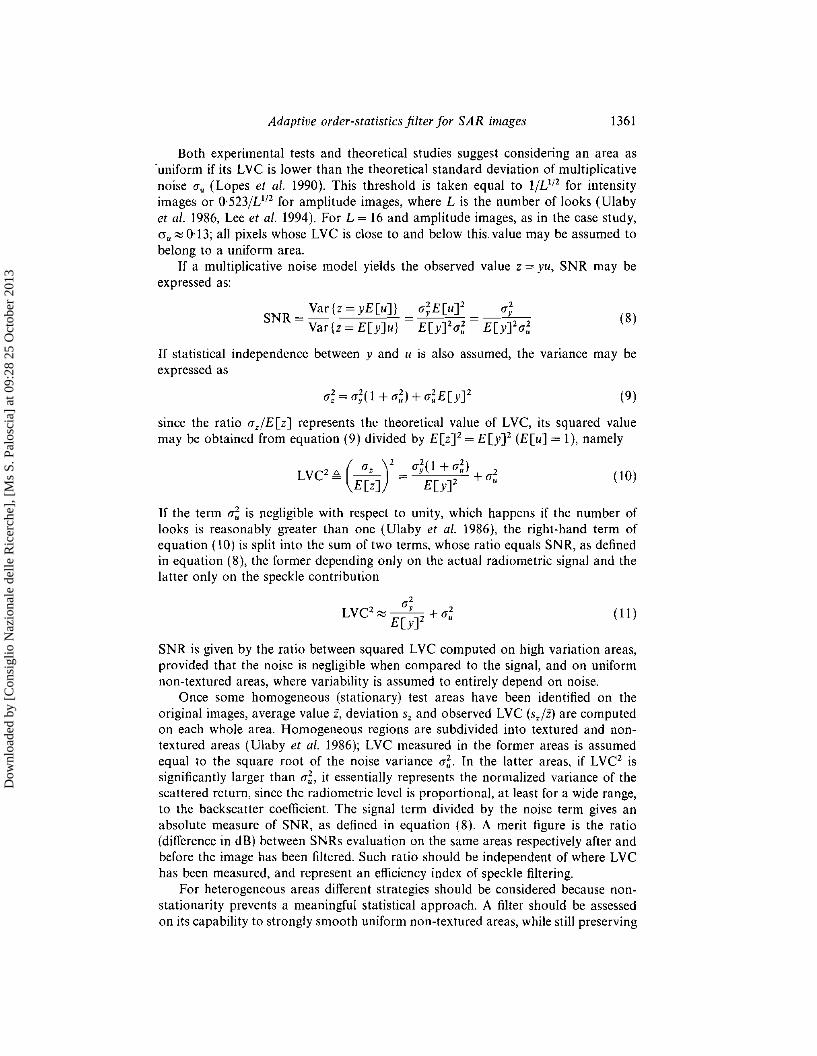
Both experimental tests and theoretical studies suggest considering an area as·uniform if its LVe is lower than the theoretical standard deviation of multiplicativenoise CTu (Lopes et al. 1990). This threshold is taken equal to 1/L'12 for intensityimages or 0·523/L1
/2 for amplitude images, where L is the number of looks (Ulaby
et al. 1986, Lee et al. 1994). For L = 16 and amplitude images, as in the case study,c; ""0·13; all pixels whose LVe is close to and below this. value may be assumed tobelong to a uniform area.
If a multiplicative noise model yields the observed value z = yu, SNR may beexpressed as:
Var {z = yE[u]}SNR=
Var{z=E[y]u}
,,;E[U]2
E[y]2,,~(8)
If statistical independence between y and u is also assumed, the variance may beexpressed as
(9)
(10)
since the ratio CTz/E[z] represents the theoretical value of LVe, its squared valuemay be obtained from equation (9) divided by E[Z]2 = E[y]2 (E[u] = 1), namely
LVe2~ (~)2 = CT;(1 + ,,~) + ,,2E[z] E[y]2 u
If the term ,,~ is negligible with respect to unity, which happens if the number oflooks is reasonably greater than one (Ulaby et al. 1986), the right-hand term ofequation (10) is split into the sum of two terms, whose ratio equals SNR, as definedin equation (8), the former depending only on the actual radiometric signal and thelatter only on the speckle contribution
(11 )
SNR is given by the ratio between squared LVe computed on high variation areas,provided that the noise is negligible when compared to the signal, and on uniformnon-textured areas, where variability is assumed to entirely depend on noise.
Once some homogeneous (stationary) test areas have been identified on theoriginal images, average value Z, deviation s, and observed Lve (s,/z) are computedon each whole area. Homogeneous regions are subdivided into textured and nontextured areas (Ulaby et al. 1986); LVe measured in the former areas is assumedequal to the square root of the noise variance ,,~. In the latter areas, if LVe2 issignificantly larger than ,,~, it essentially represents the normalized variance of thescattered return, since the radiometric level is proportional, at least for a wide range,to the backscatter coefficient. The signal term divided by the noise term gives anabsolute measure of SNR, as defined in equation (8). A merit figure is the ratio(difference in dB) between SNRs evaluation on the same areas respectively after andbefore the image has been filtered. Such ratio should be independent of where LVehas been measured, and represent an efficiency index of speckle filtering.
For heterogeneous areas different strategies should be considered because nonstationarity prevents a meaningful statistical approach. A filter should be assessedon its capability to strongly smooth uniform non-textured areas, while still preserving
Dow
nloa
ded
by [
Con
sigl
io N
azio
nale
del
le R
icer
che]
, [M
s S.
Pal
osci
a] a
t 09:
28 2
5 O
ctob
er 2
013

1362 L. Alparone et al.
(12)
significant features such as point targets, textures, field borders, networks andman-made structures; blurring and deformations should be avoided.
Percentage variations of LVC (t1LVC%) between original and filtered images,measured in homogeneous (non-textured and textured) areas and locally in heterogeneous zones, has also been considered to evaluate the photointerpretability ofimages after being filtered. t1LVC% is defined as
LVC ' - LVCr,(t1LVC% £ on. 1 t X 100LVCo.; .
and should be large on uniform areas, but close to zero where features are to bepreserved.
4. Experimental results and comparisonsThe APC algorithm has been applied to images synthesized from polarimetric
SAR data of the Montespertoli test site in Italy, collected during NASA/JPLMultisensor Aircraft Campaign (MAC 91). Despite of the 16-look processing, speckleis apparent especially in uniform regions.
Although polarimetric SAR has been employed mainly for the availability ofground truth data that enable SNR measurements significant in a heterogeneousenvironment, the authors would like to stress that the aim of this paper is not toexploit polarimetric information in the design of a specific algorithm, an approachmostly suited in the recent literature, as reported (Lee et al. 1994), but to develop areal-time, general purpose processing tool to deal with images affected by multiplicative noise with speckle statistics. Besides, the use of images with a relatively lowamount of speckle is dictated by the assumption of estimating true SNR values forLYC, which holds for a.;«. 1, as shown in § 3.
In order to measure the parameters defined in § 3, training areas, representingthe classes of woodland, vineyard, erbaceous crop and urban, have been selectedbased on ground truth data. Local average and LVC have been measured for eachclass on the original data.
Filtering has been specified by the following work parameters for each scheme.Median: 2 iterations on a 3 x 3 window (an intermediate effect between the weaksmoothing of a single 3 x 3 iteration, and the heavy detail smear of a single 5 x 5iteration). EPS: one iteration on the prefixed 5 x 5 window. Geometric: 2 iterationson the prefixed 3 x 3 window for reasonable smoothing of both dark and brightareas. Kuan and APC: one iteration on a 7 x 7 window, as commonly used (Kuanet al. 1985, Lopes et al. 1990, Lee et al. 1994), with an assumed noise variancea~ = 0·017 (au 0:::; 0'13), theoretically concerning l6-look images. Adaptive schemes,like Kuan's and APC, ruled by a parameter a related to the local statistics, shouldnot be iterated without reducing a at each step, and possibly also the window size,to prevent avalanche smoothing effects. When the noise level is moderate, a singleapplication performs better, at least visually, than two or more iterations. Instead,when dealing with extremely noisy images (simulated single and 4-100k images),the requested smoothing should be better shared among multiple iterations, withprogressively reduced a.
Figure 2 (a)-(f) show a 512 x 512 detail of the original L-VV image (a); themedian (h), EPS (c), geometric (d), Kuan (e), and APC (f) filtered versions.Photointerpretation substantially confirms that the APC, Kuan's, and geometricfilters are the most promising: speckle is strongly smoothed in uniform areas, whereas
Dow
nloa
ded
by [
Con
sigl
io N
azio
nale
del
le R
icer
che]
, [M
s S.
Pal
osci
a] a
t 09:
28 2
5 O
ctob
er 2
013

Adaptive order-statistics filter for SAR images 1363
(a)
(e)
(e)
(b)
(J)
If)
Figure 2. Original L-band VV-polarization SAR image (a); and processed versions: median3 x 3, two iterations (b); EPS (e); geometric, two iterations (d); Kuan (e) and APe (f)both 7 x 7 with (j2 = 0·017.
structured areas, edges and point targets are preserved. L band has been chosen fordisplay because our image appears to be more textured in L band, due to vegetation.Nevertheless, APC and Kuan perform somewhat better in both bands preventingblur, that is evident for median. EPS does not preserve highly structured areas andthin contours, due to the anisotropy of its response.
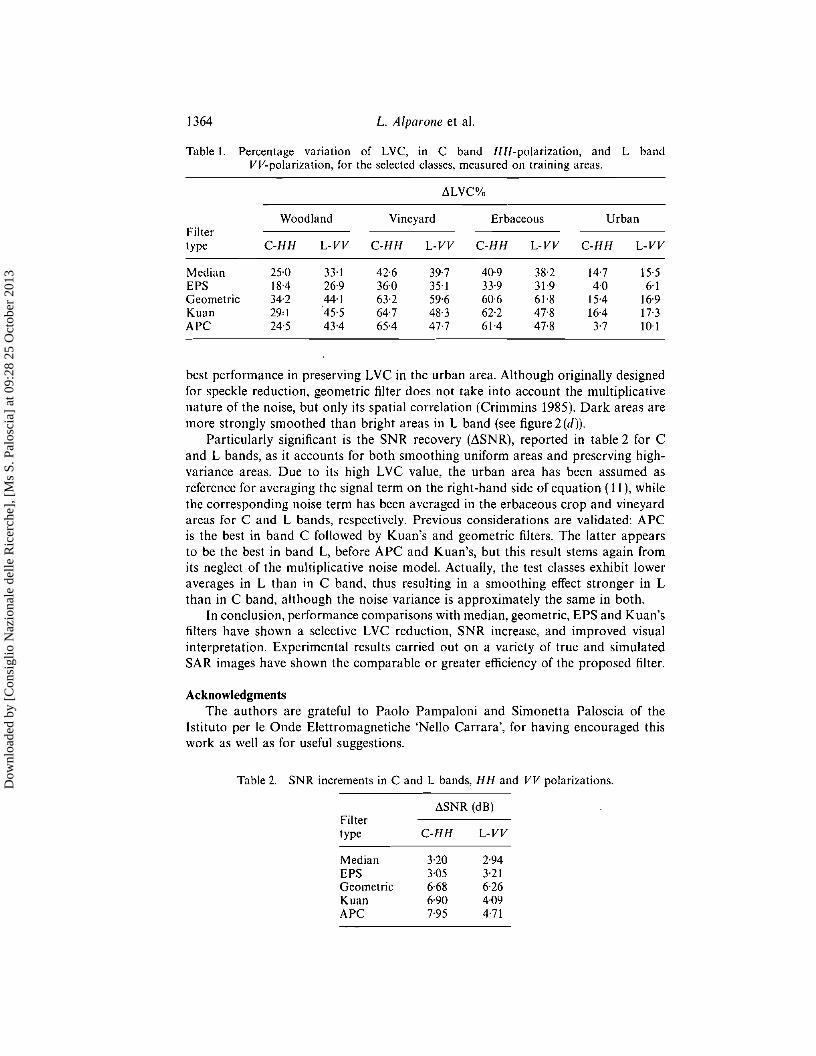
The ~LVC% defined in equation (12), estimated on the training areas in C andL bands, is reported in table 1, for the five filters. The geometric, Kuan's and APCfilters act correctly on uniform areas by strongly reducing LVC; APC obtains the
Dow
nloa
ded
by [
Con
sigl
io N
azio
nale
del
le R
icer
che]
, [M
s S.
Pal
osci
a] a
t 09:
28 2
5 O
ctob
er 2
013
1364 L. Alparone et al.
Table I. Percentage variation of LVC, in C band H H-polarization, and L bandVV-polarization, for the selected classes, measured on training areas.
best performance in preserving LYC in the urban area. Although originally designedfor speckle reduction, geometric filter does not take into account the multiplicativenature of the noise, but only its spatial correlation (Crimmins 1985). Dark areas aremore strongly smoothed than bright areas in L band (see figure 2 (d)).
Particularly significant is the SNR recovery (.1.SNR), reported in table 2 for Cand L bands, as it accounts for both smoothing uniform areas and preserving highvariance areas. Due to its high LYC value, the urban area has been assumed asreference for averaging the signal term on the right-hand side of equation (11), whilethe corresponding noise term has been averaged in the erbaceous crop and vineyardareas for C and L bands, respectively. Previous considerations are validated: APCis the best in band C followed by Kuan's and geometric filters. The latter appearsto be the best in band L, before APC and Kuan's, but this result stems again fromits neglect of the multiplicative noise model. Actually, the test classes exhibit loweraverages in L than in C band, thus resulting in a smoothing effect stronger in Lthan in C band, although the noise variance is approximately the same in both.
In conclusion, performance comparisons with median, geometric, EPS and Kuan'sfilters have shown a selective LVC reduction, SNR increase, and improved visualinterpretation. Experimental results carried out on a variety of true and simulatedSAR images have shown the comparable or greater efficiency of the proposed filter.
AcknowledgmentsThe authors are grateful to Paolo Pampaloni and Simonetta Paloscia of the
Istituto per Ie Onde Elettromagnetiche 'Nello Carrara', for having encouraged thiswork as well as for useful suggestions.
Table 2. SNR increments in C and L bands, HHand VV polarizations.
i1SNR (dB)Filtertype C-HH L-VV
Median 3-20 2·94EPS 3·05 3·21Geometric 6·68 6·26Kuan 6·90 4·09APC 7-95 4·71
Dow
nloa
ded
by [
Con
sigl
io N
azio
nale
del
le R
icer
che]
, [M
s S.
Pal
osci
a] a
t 09:
28 2
5 O
ctob
er 2
013

Adaptive order-statistics filter for SAR images 1365
ReferencesALPARONE, L., BARONTI, S., CARLA, R., and PUGLISI, C, 1992, A new adaptive digital filter
for SAR images: test of performance for land and crop classification on Montespertoliarea. Proceedings of the International Geoscience and Remote Sensing Symposium(/GARSS'92), Houston, TX, May 1992 (Piscataway, NJ: I.E.E.E.), pp. 899-901.
ALPARONE, L., BARONTI, S., and GARZELLI, A., 1995, A hybrid sigma filter for unbiased edgepreserving speckle reduction. Proceedings of the International Geoscience and RemoteSensing Symposium (/GARSS'95), Florence, Italy, 10-14 July 1995 (Piscataway, NJ:I.E.E.E.), pp. 1409-1411.
CRIMMINS, T. R., 1985, Geometric filter for speckle reduction. Applied Optics, 24,1438-1441FROST, V. S., STILES, J. A., SHANMUGAN, K. S., and HOLTZMAN, J. C, 1982, A model for
radar images and its application to adaptive digital filtering of multiplicative noise.lEE.£. Transactions on Pattern Analysis and Machine Intelligence, 4, 157-165.
GOODMAN J. W., 1976, Some fundamental properties of speckle. Journal of the Optical Societyof America, 66, 1145-1150.
Ko, S. J., and LEE, Y. H., 1991, Center-weighted median filters and their applications toimage enhancement. I.£.E.E. Transactions on Circuits and Systems, 38, 984-993.
KUAN, D. T., SAWCHUCK, A. A., STRAJ','D, T. C, and CHAVEL, P., 1985, Adaptive noisesmoothing filter for images with signal-dependent noise. IEEE Transactions onPattern Analysis and Machine Intelligence, 7, 165-177.
LEE, J. S., 1981, Refined filtering of image noise using local statistics. Computer Vision Graphicsand Image Processing, 15, 380-389.
LEE, J. S., JURKEVICH, L, DEWAELE, P., WAMBACQ, P., and OOSTERLINCK, A., 1994, Specklefiltering of synthetic aperture radar images: a review. Remote Sensing Reviews, 8,313-340.
LOPES, A., TOUZI, R., and NEZRY, E., 1990, Adaptive speckle filters and scene heterogeneity.IEEE Transactions on Geoscience and Remote Sensing, 28, 992-1000.
NAGAO, M., and MATSUYAMA, T., 1979, Edge preserving smoothing. Computer Vision Graphicsand Image Processing, 9, 394-407.
OLIVER, C J., 1991, Information from SAR images. Journal of Physics D: Applied Physics, 24,1493-1514.
PITAS, L, and VENETSANOPOULOS, A. N., 1992, Order statistics in digital image processing.Proceedings of the IEEE, 80, 1893-1921.
ULABY, F. T., KOUYATE, F., BRISCO, B., and LEE WILLIAMS, T. H., 1986, Textural informationin SAR images. IEEE Transactions on Geoscience and Remote Sensing, 24, 235-245.
.WHITE, R. G., 1994, Cross-section estimation by simulated annealing. Proceedings of theInternational Geoscience and Remote Sensing Symposium (IGARSS'94), Pasadena, CA,8-12 August 1994 (Piscataway, NJ: LE.E.E.), pp. 2188-2190.
Dow
nloa
ded
by [
Con
sigl
io N
azio
nale
del
le R
icer
che]
, [M
s S.
Pal
osci
a] a
t 09:
28 2
5 O
ctob
er 2
013