An accounting system to support process improvements
27
doi:10.3926/jiem.2010.v3n3.p576-602 JIEM, 2010 – 3(3): 576-602 – Online ISSN: 2013-0953 Print ISSN: 2013-8423 An accounting system to support process improvements: transition to lean accounting 576 P. Ruiz de Arbulo-López; J. Fortuny-Santos An accounting system to support process improvements: Transition to lean accounting Patxi Ruiz de Arbulo-López 1 , Jordi Fortuny-Santos 2 1 Universidad del País Vasco (SPAIN); 2 Universitat Politecnica de Catalunya (SPAIN) [email protected] ; [email protected] Received February 2010 Accepted November 2010 Abstract: From the last two decades of the 20th Century on, many companies have adopted production strategies that could be termed “lean manufacturing”. Lean team leaders state that traditional costing systems fail to properly assess their operational improvements and therefore ask for new cost accounting methods. The search for a new accounting paradigm has led to important applied research and several accounting methods. In this paper we are going to show the state of the art in costing techniques used in companies that adopt lean manufacturing practices and we will be presenting an additional costing method, based on Activity-Based Costing, intended to cast light on the operational improvements achieved in companies that are just starting a maturity path towards lean manufacturing. This article examines how the approach is applied in the context of a manufacturing company. Keywords: lean manufacturing, lean accounting, Activity-Based Costing 1 New cost accounting paradigms The first objective of this paper is to present state-of-the-art uses of costing techniques to assess process improvements. Companies adopt lean manufacturing strategies (Sugimori, Kusunoki, Cho, & Uchikawa, 1977; Womack & Jones, 1996) in search of improvements in productivity, quality, flexibility, delivery speed and cost (Womack, Jones, & Ross, 1990; Sriparavastu & Gupta, 1997). However, those
-
Upload
khangminh22 -
Category
Documents
-
view
0 -
download
0
Transcript of An accounting system to support process improvements

doi:10.3926/jiem.2010.v3n3.p576-602 JIEM, 2010 – 3(3): 576-602 – Online ISSN: 2013-0953
Print ISSN: 2013-8423
An accounting system to support process improvements: transition to lean accounting 576
P. Ruiz de Arbulo-López; J. Fortuny-Santos
An accounting system to support process improvements:
Transition to lean accounting
Patxi Ruiz de Arbulo-López1, Jordi Fortuny-Santos2
1Universidad del País Vasco (SPAIN); 2Universitat Politecnica de Catalunya (SPAIN)
[email protected]; [email protected]
Received February 2010 Accepted November 2010
Abstract: From the last two decades of the 20th Century on, many companies have
adopted production strategies that could be termed “lean manufacturing”. Lean team
leaders state that traditional costing systems fail to properly assess their operational
improvements and therefore ask for new cost accounting methods. The search for a new
accounting paradigm has led to important applied research and several accounting
methods. In this paper we are going to show the state of the art in costing techniques used
in companies that adopt lean manufacturing practices and we will be presenting an
additional costing method, based on Activity-Based Costing, intended to cast light on the
operational improvements achieved in companies that are just starting a maturity path
towards lean manufacturing. This article examines how the approach is applied in the
context of a manufacturing company.
Keywords: lean manufacturing, lean accounting, Activity-Based Costing
1 New cost accounting paradigms
The first objective of this paper is to present state-of-the-art uses of costing
techniques to assess process improvements. Companies adopt lean manufacturing
strategies (Sugimori, Kusunoki, Cho, & Uchikawa, 1977; Womack & Jones, 1996)
in search of improvements in productivity, quality, flexibility, delivery speed and
cost (Womack, Jones, & Ross, 1990; Sriparavastu & Gupta, 1997). However, those

doi:10.3926/jiem.2010.v3n3.p576-602 JIEM, 2010 – 3(3): 576-602 – Online ISSN: 2013-0953
Print ISSN: 2013-8423
An accounting system to support process improvements: transition to lean accounting 577
P. Ruiz de Arbulo-López; J. Fortuny-Santos
companies may find that lean practices lead to operational improvements but they
do not “hit the bottom-line” because there are neither short-term financial benefits
nor product cost reductions. This fact can act as a disincentive to change the
production system (Ahlström & Karlsson, 1996). In The Goal (Goldratt & Cox,
1986) there is an example of the fact that a simple manufacturing improvement
based on the reduction of the transfer batch size between workstations leads to an
apparent increase in per unit product cost (Equation 1) even though the plant
operating cost (operating expense according to Goldratt) has not gone up. This is
only true while there is unused capacity, but the costing system ignores whether
there is or not and assumes that extra work always needs extra labor).
𝐶𝑜𝑠𝑡𝑝𝑒𝑟 𝑢𝑛𝑖𝑡 = 𝑆𝑒𝑡𝑢𝑝 𝑡𝑖𝑚𝑒𝐵𝑎𝑡𝑐ℎ 𝑠𝑖𝑧𝑒 + 𝑝𝑟𝑜𝑐𝑒𝑠𝑠 𝑡𝑖𝑚𝑒 · 𝐿𝑎𝑏𝑜𝑟 𝑟𝑎𝑡𝑒 · (1 + 𝑜𝑣𝑒𝑟ℎ𝑒𝑎𝑑 𝑎𝑝𝑝𝑜𝑟𝑡𝑖𝑜𝑛𝑚𝑒𝑛𝑡)
Equation 1. “The influence of batch size on the cost of pieces according to traditional cost
accounting”. Based on Goldratt and Cox (1986)
In consequence, Goldratt and Cox (1986) state that cost accounting is the number
one enemy of productivity and they put forward their own accounting approach
termed throughput accounting.
In a similar way, a reduction in inventories of finished products results in an
increase in costs and therefore in a reduction of profit. Table 1 shows such a
situation. Till period n - 1, the company produces in order to meet warehouse
inventory needs. In period n, with the same sales figures, manufacturing is
adjusted to net demand and, by the end of the period, the warehouse is empty. In
that period, manufacturing capacity is not used to the full, and fixed production
costs are the same as in previous periods. In consequence, the cost of the product
apparently increases. According to cost reports such as Table 1, transition to lean
manufacturing yields an increase in product cost, a reduction in productivity, a
diminution in a current asset (inventories), and a reduction in profit (or even
financial losses). In this example, incurred fixed production costs (wages) are
allocated to products; if a predetermined rate was used, the cost of the products
would not be different from the one in period n. The under absorbed incurred cost
would be considered as the cost of unused capacity and the final profit would be
500: In order to get rid of inventories, workers have produced less and a part of
the incurred (fixed) cost has not yielded any earnings.

doi:10.3926/jiem.2010.v3n3.p576-602 JIEM, 2010 – 3(3): 576-602 – Online ISSN: 2013-0953
Print ISSN: 2013-8423
An accounting system to support process improvements: transition to lean accounting 578
P. Ruiz de Arbulo-López; J. Fortuny-Santos
In period n + 1, keeping production adjusted to demand, transitory costs caused
by misused capacity cease and the company returns to financial benefits, but in the
meantime, people responsible for the transition to lean manufacturing have to
justify the results to their managers (Olivella, 2008).
Term n-1 n n+1 Initial inventory position (pieces) 50 50 0
Production (pieces) 100 50 *** 100 *** Sales volume (pieces) 100 100 100
Final inventory position (pieces) 50 0 *** 0 *** Production capacity
(pieces/period) 100 100 100
Average variable production cost (€/piece)
20 20 20
Fixed production costs (€/period) 1000 1000 1000 Average fixed production cost
(€/piece) 10 20 10
Average production cost (€/piece)
30 40 30
Average price (€/piece) 60 60 60 Total production cost(€) 3000 2000 3000
Sales revenue (€) 6000 6000 6000 Cost of goods sold (€) * 3000 1500 + 2000 3000
Initial inventory (€) 1500 1500 0 Final inventory (€) 1500 0 0
Margin (€) 3000 2500 3000 Overhead** (€) 2000 2000 2000
Profit (€) 1000 500 1000 * Assuming a FIFO inventory management system.
** The cost of holding inventories is not considered. It would decrease from period n on.
*** Production is adjusted to demand in order to not keep inventories.
Table 1. “Calculation of the production cost after and before production adjusted to demand”.
Based on Olivella (2008)
Likewise, companies that have implemented lean manufacturing to a large extent
find that traditional managerial accounting systems do not provide the information
that managers need to make decisions (Harman & Peterson, 1990).
It is not that traditional cost accounting is wrong. Standard costing was created in
times when companies operated in a stable environment and used mass production
techniques such as large batch sizes. The most important cost was direct labor and
therefore other costs were allocated as a percentage of labor cost. The principles of
lean manufacturing are quite different since they are oriented to competitive and
changing environments, where suppliers must quickly adapt to their clients,
without costly inventories that could soon become obsolete and therefore
unsalable, thus using one-piece-flow plant layouts. Besides, labor cost is currently
a small percentage of the total cost.

doi:10.3926/jiem.2010.v3n3.p576-602 JIEM, 2010 – 3(3): 576-602 – Online ISSN: 2013-0953
Print ISSN: 2013-8423
An accounting system to support process improvements: transition to lean accounting 579
P. Ruiz de Arbulo-López; J. Fortuny-Santos
The aim of standard costing does not depend on the production system, but the
way information on costs is generated does (Tatikonda, 1988). This statement is
not new: without a standardized production system as described by authors like
Taylor or Ford, in the early days of the Twentieth Century, standard costing would
be meaningless because each product would be different (Cooper, 2000).
Overproduction and work in process inventories have so far been considered a
valuable asset, but lean philosophy considers them a waste (unnecessary
consumption of resources). Traditional cost accounting and parameters like
machine utilization or productivity per employee lead to decisions against lean
philosophy, because, in order to achieve a minimum cost, they endorse that every
section in the factory has to produce as much as possible, in large production runs
and therefore keeping all sorts of inventories. Lean manufacturing focuses on
manufacturing only what the customers really buy, and tries to reduce inventories,
reduce cycle time and eradicate all the operations that do not add value to the
products (Ward & Graves, 2004).
Besides, accounting was created to provide financial information, not to support
ongoing improvement (Harman, 1992). Harman and Peterson (1990) and Hyer
and Wemmerlöv (2002) list some of the problems of traditional accounting
techniques:
• Overhead cost allocation policies are not always reasonable. For example,
overhead costs are allocated on the basis of direct labor costs, even though
currently labor cost is a small percentage of the production (Blanco, 1988).
According to Berliner and Brimson (1988) this does not seem logical. Errors
in calculating labor costs are amplified.
• The recording of depreciation does not match actual asset deterioration
because it is an uneven process. Assets are not appraised every year to
determine their value.
• Efficiency metrics refer to internal issues that try to keep people and
machines busy. They do not measure customer-related aspects (on-time
delivery, quality…).
• The aim is to reach the standard cost, not to improve the process.

doi:10.3926/jiem.2010.v3n3.p576-602 JIEM, 2010 – 3(3): 576-602 – Online ISSN: 2013-0953
Print ISSN: 2013-8423
An accounting system to support process improvements: transition to lean accounting 580
P. Ruiz de Arbulo-López; J. Fortuny-Santos
• Inventories are an asset. The cost of holding items in stocks is not
calculated. Traditional inventory control is not concerned with minimizing
the cost of inventory. It strives to avoid inventory stock-out.
• The aim of cost accounting is to know the exact cost of a product, but
changes in demand make changes in production cost because of average
fixed costs (fixed cost over the number of units that are produced).
• Managers claim that they use costing to make decisions on issues like price,
on order profitability or on outsourcing. On one hand, companies cannot
price a product on the basis of the cost. The price is fixed by the client or
there is a market price that the company must obey. Usually, an
approximate cost is enough. The decision on whether to outsource or
manufacture something is tricky. When a company decides to outsource
part of its process, many fixed costs do not disappear - surely those fixed
costs are included in the standard cost of the product and are the cause for
deciding to outsource it.
A lean company cannot neglect the legally mandatory set of financial statements
but may look for an accounting system that is capable of measuring operational
improvements and allows the company to keep operational and financial control of
the business.
Harman (1992) sums up possible accounting practices for companies which can be
described as completely lean (Cuatrecasas, 2006):
• Since in lean companies raw material and work-in-process inventories are
lower than in traditional companies and their fluctuations over time are also
lower because of the way lean schedules production, it is not important to
keep a detailed track of the inventories. They can be estimated.
• Overhead costs must not be employed to assess the goodness of the
production process. However, people responsible for such costs must
manage them.
• Purchases and pay slips can be used to calculate costs. Purchases are
adjusted to consumption and because of practices such as long term
partnership; prices do not change very often so there is no need to keep

doi:10.3926/jiem.2010.v3n3.p576-602 JIEM, 2010 – 3(3): 576-602 – Online ISSN: 2013-0953
Print ISSN: 2013-8423
An accounting system to support process improvements: transition to lean accounting 581
P. Ruiz de Arbulo-López; J. Fortuny-Santos
track of their changes. If production is adjusted to demand, pay slips equal
labor costs for the produced and sold goods.
• Reports on the performance of single employees or departments are not
needed anymore. Production is adjusted to demand so no one tries to do
more or less work. Less non-value- added paperwork is necessary.
• Overhead costs can be allocated on labor and material cost together, not
just labor. Material cost is probably more accurate. Depreciation can be
allocated on the basis of the number of hours that the machines have been
in use. However, the aim is to cut overhead cost, not to discuss allocation
methods.
The need to review cost accounting arose in the 1980s and originated different
research papers (Kaplan, 1983, 1984, 1985, 1986, 1987, 1988, 1989; Johnson &
Kaplan, 1987; Cooper & Kaplan, 1988). The problem of the lack of adaptation of
costing systems to lean manufacturing lasts till the present day (Ward, Crute,
Tomkins, & Graves, 2004; DeLuzio, 2006).
In the early days of the 21st Century, some accounting methods termed as Lean
Accounting were presented, mainly removed from academic research journals -
Except Huntzinger and Kennedy (2005) and Maskell and Kennedy (2007)-. Those
methods can be used by companies in their maturity path towards lean
manufacturing (Maskell & Baggaley, 2004). Those methods, according to the
principles of lean manufacturing, focus on metrics in search of simplicity (Martínez
& Pérez, 2001). Indicators can be controlled visually and they supply useful and
frequent information in order to improve processes.
Lean accounting techniques emerged in the United States. In Japan, where lean
manufacturing first emerged (Tatikonda, 1988), companies use other methods
such as kaizen costing or target costing (Williamson, 1997; Huntzinger, 2007).
The first answer to the problem of the lack of valid costing methods for new
production paradigms was Activity-Based Costing. It was developed in 1986, on
the basis of the early work done at General Electric (Johnson, 1992).
Currently many companies find that overhead costs are much more important than
direct cost. ABC costing was designed to reduce the distortion caused by traditional

doi:10.3926/jiem.2010.v3n3.p576-602 JIEM, 2010 – 3(3): 576-602 – Online ISSN: 2013-0953
Print ISSN: 2013-8423
An accounting system to support process improvements: transition to lean accounting 582
P. Ruiz de Arbulo-López; J. Fortuny-Santos
costing systems. It has allowed a major advance in cost accounting since costs can
be allocated to the activities that cause them (Tirado, 2003), and then to object
costs (products, clients, etc). In literature there is much evidence of companies
that use ABC as a tool to rank their opportunities to reduce costs (Jenson,
Brackner, & Skousen, 1996; Crute, Ward, Brown, & Graves, 2003; Ward, Crute,
Tomkins, & Graves, 2003) and well-known companies continue to implement ABC
costing as a tool to support continuous improvement (Balada, 1994) and to gain
competitiveness (Tamarit & Ripoll, 2006).
ABC is related to full-costing methods and therefore it is very different from lean
accounting, but ABC allows tracking of waste of resources which is one of the
pillars of lean manufacturing, and in consequence, ABC costing can be used in a
company independently of whether it follows the principles of lean management or
not.
ABC costing has been defended by international authors (Cooper, 1994, 1996) and
by specialists in lean manufacturing (Cuatrecasas, 2000). Kaplan and Cooper
(1998) suggest that ABC can show which improvement efforts should be given the
highest priority, and help justify improvement actions from the point of view of
costs while keeping track of the operational benefits. Cooper (1996) points out that
ABC can be compatible with lean manufacturing because it shows the causes of the
costs and therefore it makes it possible to redesign the processes.
As in other case based topics, unfavorable opinions have also arisen (Anderson,
1995; Dhavale, 1996) because the system is complex, and upkeeping it requires a
lot of data collection. Grasso (2005) points out that lean companies do not use ABC
costing. Data collection work is a non-value-added activity and therefore it has to
be avoided from the point of view of lean management (Dhavale, 1996; Plenert,
1999). Hyer and Wemmerlöv (2002) found that Activity-Based Costing can even
have a boomerang effect when applied to cellular manufacturing. Huntzinger
(2007) does not accept that ABC can currently solve the problems caused by
traditional cost accounting in lean factories, because ABC operates as a full costing
method. Kaplan and Anderson (2004) admit that Activity-Based Costing is very
complicated and they put forward a simplification termed time driven ABC to adjust
the accounting system to new manufacturing paradigms.

doi:10.3926/jiem.2010.v3n3.p576-602 JIEM, 2010 – 3(3): 576-602 – Online ISSN: 2013-0953
Print ISSN: 2013-8423
An accounting system to support process improvements: transition to lean accounting 583
P. Ruiz de Arbulo-López; J. Fortuny-Santos
There is controversy about the advantages and drawbacks of ABC, like between
direct costing and full costing, but since direct costing has not replaced full costing
and both methods coexist (a recent discussion can be found in Argilés (2007)), we
believe, like Banker, Barhand and Chen (2008), that companies that are starting
advanced manufacturing practices such as the transition towards lean
manufacturing can take advantage of some features of ABC, and therefore we
developed a costing method for such environments.
2 A method to start the transition towards lean manufacturing
Maskell and Baggaley (2004) suggest that the transition towards lean accounting
must be carried out in a gradual way, embodying new tools as the company
introduces lean production techniques throughout its facilities. Harman (1992)
suggests that the company must not wait until the lean transformation is complete
to implement an accounting system that can make controlling the improvements
easier. In the same way, Harman (1992) admits that in the transition it is still
necessary to allocate costs to products.
For these reasons we present a practical framework to be used when starting lean
manufacturing practices:
• It is based on traditional accounting practices and therefore it is easy for
accountants to understand, while avoiding an outright rejection.
• It is based on Activity-Based Costing so it can help the company monitor
operational improvements and discover the sources of waste. It is not
necessary that the whole company adopts an ABC system, which could be
costly and take long. It is only a way to control the areas in transition
towards lean manufacturing.
• It can be used in companies that still do not have either a global lean layout
or stable lean practices and therefore cannot use advanced lean accounting
techniques such as value stream costing.
This method has been developed with the intention of taking the initial steps
towards lean manufacturing easier, because other accounting systems, broadly
doi:10.3926/jiem.2010.v3n3.p576-602 JIEM, 2010 – 3(3): 576-602 – Online ISSN: 2013-0953
Print ISSN: 2013-8423
An accounting system to support process improvements: transition to lean accounting 584
P. Ruiz de Arbulo-López; J. Fortuny-Santos
termed as lean accounting, only seem to be useful when the company has reached
a certain degree of maturity in lean manufacturing (Ruiz de Arbulo, 2005).
Taking into account the advantages and disadvantages of Activity-Based Costing
that have been discussed before, our method includes technical ratios for the
expense entries of the activities (Baguer & Zarraga, 2002) and aligns with current
methodologies for the implementation of efficient production processes from the
client’s point of view, such as lean manufacturing (Ruiz de Arbulo, 2007).
It is not necessary to substitute, throughout the company, traditional accounting
practices with our method or ABC. The company may want to use our ABC-based
costing approach only for tracking the improvements in the transition towards lean
manufacturing and, as the company advances, it will be able to implement other
lean accounting techniques.
Our costing method can include:
• Changes in plant layout
• Changes in handling between operations
• Reductions in production run size in order to adjust to production, avoiding
inventories of finished products
• Reductions in transfer lot size
• Other changes that make production more efficient and adjusted to demand
Expected cost entries are:
• Cost of raw materials and purchased components (Crm)
• Cost of activities that add value to the product (Cva)
• Cost of internal transportation (Ctran)
• Setup cost (Cset)
• Cost of work in process inventory (Cwip)
• Cost of wait time (Cwait)

doi:10.3926/jiem.2010.v3n3.p576-602 JIEM, 2010 – 3(3): 576-602 – Online ISSN: 2013-0953
Print ISSN: 2013-8423
An accounting system to support process improvements: transition to lean accounting 585
P. Ruiz de Arbulo-López; J. Fortuny-Santos
Even companies that use Activity-Based Costing calculate the final cost of the
product as the summation of the costs of every single production step but, in
practice, some costs such as the wait times are not considered. Since wait times
and inventories are two types of “muda” that conceal deficiencies in processes
(Ohno, 1988), their existence and their cost should not be ignored. Our method
calculates the costs of wait time and the costs of work in process inventory. In
consequence, when a new production method cuts inventories or wait times, it
affects the production cost.
2.1 Steps of the process
Our costing method can be divided into steps:
Step 1. Analysis of the process and its activities
In Activity-Based Costing, activities are main or auxiliary tasks that when
performed incur in a cost. It is necessary to know the production process in some
detail in order to discover its activities. Activities can then be listed and classified:
• Activities that add value to the product (in a manufacturing company, they
are operations that transform the product) or value-added activities.
• Activities that do not add value to the product from the point of view of the
customer (non-value-added activities) but are currently necessary. For
instance, to set a machine up, to control the production process, etc.
• Waste. Activities that do not add value to the product and are not
necessary. They can be eliminated.
Step 2. Determination of cost drivers
For every activity it is necessary to have at least one cost driver. It is a measure to
allocate costs, and therefore drivers must be chosen on the basis of a cause and
effect relation. The greater the number of drivers there are, the more complex the
system.
It is necessary to keep in mind the different sources of cost that each activity
involves. The most common are materials (Resources that the activities consume
in order to achieve their purposes), energy and equipment depreciation.
doi:10.3926/jiem.2010.v3n3.p576-602 JIEM, 2010 – 3(3): 576-602 – Online ISSN: 2013-0953
Print ISSN: 2013-8423
An accounting system to support process improvements: transition to lean accounting 586
P. Ruiz de Arbulo-López; J. Fortuny-Santos
Step 3. Cost per driver
When cost drivers have been selected and the different sources of cost have been
considered, the cost per driver is calculated.
Step 4. Cost of raw materials and purchased components (Crm)
Here we consider the amount of raw materials and components that are present in
a unit of finished product. The total quantity includes the design values plus a
percentage to include defects and losses in order to match current consumption of
resources. Their cost is the acquisition price.
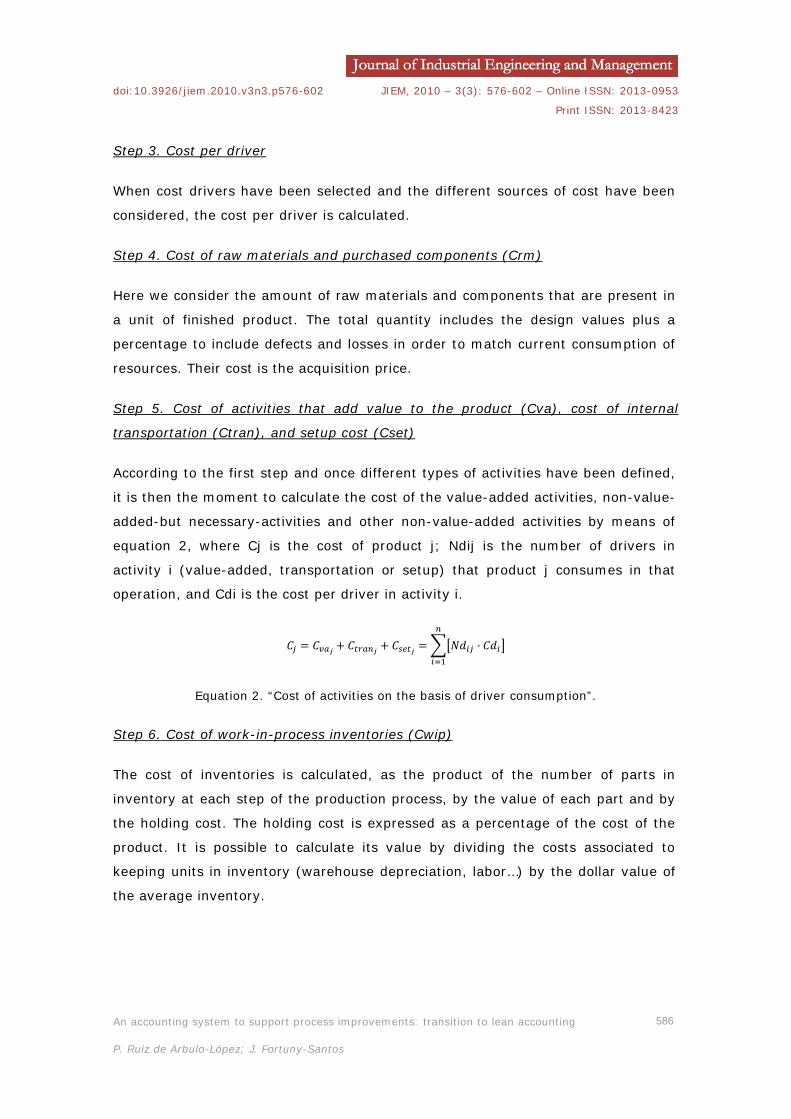
Step 5. Cost of activities that add value to the product (Cva), cost of internal
transportation (Ctran), and setup cost (Cset)
According to the first step and once different types of activities have been defined,
it is then the moment to calculate the cost of the value-added activities, non-value-
added-but necessary-activities and other non-value-added activities by means of
equation 2, where Cj is the cost of product j; Ndij is the number of drivers in
activity i (value-added, transportation or setup) that product j consumes in that
operation, and Cdi is the cost per driver in activity i.
𝐶𝑗 = 𝐶𝑣𝑎𝑗 + 𝐶𝑡𝑟𝑎𝑛𝑗 + 𝐶𝑠𝑒𝑡𝑗 = 𝑁𝑑𝑖𝑗 · 𝐶𝑑𝑖𝑛
𝑖=1
Equation 2. “Cost of activities on the basis of driver consumption”.
Step 6. Cost of work-in-process inventories (Cwip)
The cost of inventories is calculated, as the product of the number of parts in
inventory at each step of the production process, by the value of each part and by
the holding cost. The holding cost is expressed as a percentage of the cost of the
product. It is possible to calculate its value by dividing the costs associated to
keeping units in inventory (warehouse depreciation, labor…) by the dollar value of
the average inventory.

doi:10.3926/jiem.2010.v3n3.p576-602 JIEM, 2010 – 3(3): 576-602 – Online ISSN: 2013-0953
Print ISSN: 2013-8423
An accounting system to support process improvements: transition to lean accounting 587
P. Ruiz de Arbulo-López; J. Fortuny-Santos
Step 7. Cost of wait time between processes (Cwait)
Finally, the cost of waiting between processes is calculated. Different operations in
the production process have different production rhythms. That unbalance makes
parts wait between operations. Also some machines remain idle because when they
finish processing a part, a new one has not arrived yet from the previous
operation. This time spent waiting is considered “muda”, but traditional accounting
does not take it into account. To calculate this cost, it is necessary to know the
wait time in each operation. In equation 3, twait ij represents the total wait time
time in activity i –for all units of product j-. CdFi is the cost of one driver of activity
i when it is idle. Nj is the number of units of production j that are produced.
𝐶𝑤𝑎𝑖𝑡 (𝑓𝑜𝑟 𝑒𝑎𝑐ℎ 𝑢𝑛𝑖𝑡 𝑜𝑓 𝑝𝑟𝑜𝑑𝑢𝑐𝑡 𝑗) = 𝑡𝑤𝑎𝑖𝑡 𝑖𝑗 · 𝐶𝑑𝐹𝑖
𝑁𝑗
𝑛
𝑖=1
Equation 3. “Cost of wait time”.
3 A case study
In order to step by step illustrate the use of the costing method and the output
produced, we will next present a case study taken from a company that assembles
computer peripherals. From a traditional batch-and-queue production process, this
company has started to adopt lean practices in order to improve its efficiency.
Namely, this case study presents an improvement in the assembly line balancing
(initial values show a hard unbalance) in order to make one-piece-flow possible,
which is a typical feature of lean manufacturing. Table 2 shows, for the initial
situation, the different steps in the production process, the number of
workstations (one for initial cleaning, three in the assembly process and one for the
final packaging) and the cycle time for each workstation.
Phase Work post Cycle time (s) Cleaning C1 180
Assembling
A1 300 A2 500 A3 820
Packaging P1 200
Table 2. “Description of the production process (initial method)”.

doi:10.3926/jiem.2010.v3n3.p576-602 JIEM, 2010 – 3(3): 576-602 – Online ISSN: 2013-0953
Print ISSN: 2013-8423
An accounting system to support process improvements: transition to lean accounting 588
P. Ruiz de Arbulo-López; J. Fortuny-Santos
3.1 Evaluation of the initial situation
The initial situation can be evaluated through some key parameters that have to be
calculated. Changes in the values of these parameters will be used as indicators of
the results of the improvements implemented on the production line.
Monitoring parameters can be obtained from direct observation on the shop floor –
plus some calculations- or by means of simulation as stated by Cuatrecasas (2003,
2006) who uses an Operation-Time chart.
The main key parameters are:
• Process cycle time: this is the time elapsed between the production of two
consecutive transfer lots.
• Manufacturing Lead time: this is the time necessary to manufacture the
units in a production run.
• Lead time for the first unit: this is the time necessary to manufacture the
first unit in a production run.
• Lead time for the last unit: this measures the time the last transfer lot is in
process.
• In-process inventory (WIP): the greatest number of partially completed
goods, parts or sub-assemblies that are in the different stages of the
production process.
Table 3 shows the values of the different key parameters for the initial layout of
the system and a production of 170 units per week.
Cycle time (s)
Total Lead time (s)
Lead time 1st part (s)
Lead time last part (s)
Max WIP (pieces)
Capacity (parts/h)
820 140,580 (39.05 hours)
2,000 110,160 (30.60 hours)
136 4.39
Table 3. “Key metrics for the initial production process”.

doi:10.3926/jiem.2010.v3n3.p576-602 JIEM, 2010 – 3(3): 576-602 – Online ISSN: 2013-0953
Print ISSN: 2013-8423
An accounting system to support process improvements: transition to lean accounting 589
P. Ruiz de Arbulo-López; J. Fortuny-Santos
3.2 Improvements in the production process
In the initial implementation of the production process, parts move forward with an
uneven flow due to the unbalance among workstations which causes bottlenecks
and work-in-process inventories. Although it is out of the scope of this work, let us
remark that in order to improve the line balancing, it would be necessary to
reassign tasks among employees by breaking down tasks into work elements that
can then be grouped in blocks with a similar cycle time (Cuatrecasas, 1996, 2003).
The way some tasks are performed may have to be redefined too. Let us assume
that figure 1 shows the new assignment of tasks to workstations after the line
balancing.
Figure 1. “Cycle time for every work post before the line balancing”.
After the line is balanced, key parameters are calculated for the new layout (Table
4) by means of simulation because the new process has not been implemented yet.
Manufacturing lean time decreases by 32.5 per cent (this means a better service
for customers), in-process inventory moves down from 136 to 118 pieces (it is a
reduction in “muda” and in money invested); cycle time decreases around 33 per
cent (reduction in “muda” and gain in speed) and total wait time also decreases to
43.3 per cent, which represents an increase in capacity.
Cycle time (s)
Total Lead time (s)
Lead time 1st part (s)
Lead time last part (s)
Max WIP (pieces)
Capacity (parts/h)
550 94,950 (26.38 hours)
2,000 64,530 (17.93 hours)
118 6.54
Table 4. “Key metrics after balancing the production line”.
3.3 Costing the improvement
By knowing the key parameters of the process before and after the line balancing,
it is possible to calculate the cost of products in each situation by means of the
methodology discussed in this paper. The necessary steps to calculate the cost are:
Post: C1
T1 =180 s
Post: A1
T2 =520 s
Post: A2
T3 =550 s
Post: A3
T4 =550 s
Post: P1
T5 =200 s
doi:10.3926/jiem.2010.v3n3.p576-602 JIEM, 2010 – 3(3): 576-602 – Online ISSN: 2013-0953
Print ISSN: 2013-8423
An accounting system to support process improvements: transition to lean accounting 590
P. Ruiz de Arbulo-López; J. Fortuny-Santos
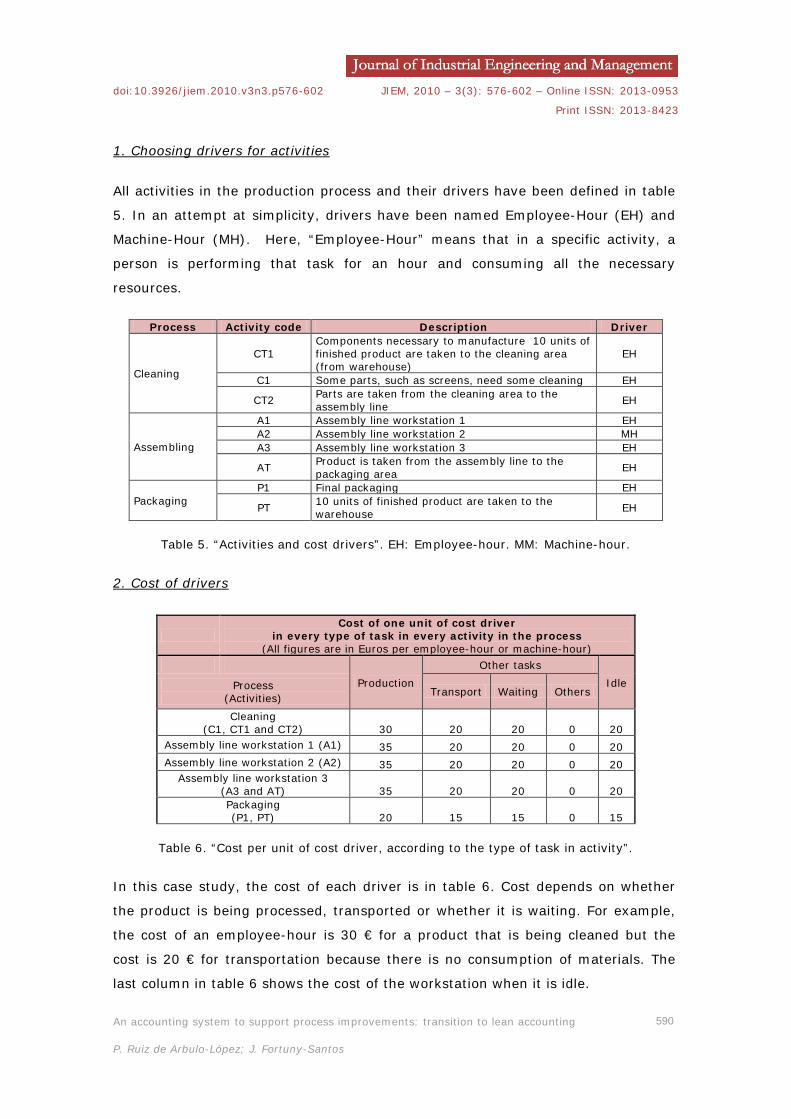
1. Choosing drivers for activities
All activities in the production process and their drivers have been defined in table
5. In an attempt at simplicity, drivers have been named Employee-Hour (EH) and
Machine-Hour (MH). Here, “Employee-Hour” means that in a specific activity, a
person is performing that task for an hour and consuming all the necessary
resources.
Process Activity code Description Driver
Cleaning
CT1 Components necessary to manufacture 10 units of finished product are taken to the cleaning area (from warehouse)
EH
C1 Some parts, such as screens, need some cleaning EH
CT2 Parts are taken from the cleaning area to the assembly line EH
Assembling
A1 Assembly line workstation 1 EH A2 Assembly line workstation 2 MH A3 Assembly line workstation 3 EH
AT Product is taken from the assembly line to the packaging area EH
Packaging P1 Final packaging EH
PT 10 units of finished product are taken to the warehouse EH
Table 5. “Activities and cost drivers”. EH: Employee-hour. MM: Machine-hour.
2. Cost of drivers
Cost of one unit of cost driver
in every type of task in every activity in the process (All figures are in Euros per employee-hour or machine-hour)
Production
Other tasks Idle Process
(Activities) Transport Waiting Others
Cleaning (C1, CT1 and CT2) 30 20 20 0 20
Assembly line workstation 1 (A1) 35 20 20 0 20 Assembly line workstation 2 (A2) 35 20 20 0 20
Assembly line workstation 3 (A3 and AT) 35 20 20 0 20 Packaging (P1, PT) 20 15 15 0 15
Table 6. “Cost per unit of cost driver, according to the type of task in activity”.
In this case study, the cost of each driver is in table 6. Cost depends on whether
the product is being processed, transported or whether it is waiting. For example,
the cost of an employee-hour is 30 € for a product that is being cleaned but the
cost is 20 € for transportation because there is no consumption of materials. The
last column in table 6 shows the cost of the workstation when it is idle.

doi:10.3926/jiem.2010.v3n3.p576-602 JIEM, 2010 – 3(3): 576-602 – Online ISSN: 2013-0953
Print ISSN: 2013-8423
An accounting system to support process improvements: transition to lean accounting 591
P. Ruiz de Arbulo-López; J. Fortuny-Santos
3. Cost of raw materials and components
The cost of raw materials and purchased components has been quantified as 10.50
€ per unit of finished product (Table 7). In the attempt at simplicity seen in the
example, it is admitted that the value of the coefficient Krm that marks up the
consumption of raw materials due to the existence of scrap in raw materials is one.
Otherwise, the real consumption of raw materials would be greater than what was
theoretically necessary.
Calculation of the cost of raw materials and purchased components
Code Description Purchased by
Cost (€/unit of material)
UM/UF Krm UM’/UF Crm (€/ufp)
A Component A Units 2.00 1 1 1 2.00 B Material B Units 5.50 1 1 1 5.50 C Element C Units 3.00 1 1 1 3.00
Total cost of raw materials and purchased parts in 1 unit of finished product 10.50 UM/UF: Quantity of each material that is necessary (in theory) for each unit of finished product.
Krm: Scrap in raw materials (It might increase the consumption of raw materials).
UM´/UF: Quantity of each material that is necessary (in practice) for each unit of finished product. It
is UM/UF times Krm.
Crm: Cost of raw materials and purchased parts per unit of finished product (ufp).
Table 7. “Cost of materials and parts”.
4. Cost of work-in-process inventories
In lean accounting it is necessary to calculate the cost of holding in-process
inventories because they are considered to be a waste of resources and therefore
must be avoided. In the methodology presented in this paper the cost is calculated
in equation 4. The maximal quantity of units in process (WIPmax) is taken from
tables 3 and 4. According to Cuatrecasas (2003), it is possible to assume that the
average value is half the maximal value. Although WIP is made up of
heterogeneous items (at different stages of the process) they are quantified at the
production cost (CP) (see table 9). The company decides an ad valorem interest
rate (r) in order to meet financial and logistic costs of holding one unit per year. In
our example, inventory holding costs equal one half (50 percent) of the inventory
value each year. Table 8 shows the calculation of holding inventories (CWIP) per
unit of manufactured product in a period (Θ), with a weekly production (N) of 170
units, as stated before.

doi:10.3926/jiem.2010.v3n3.p576-602 JIEM, 2010 – 3(3): 576-602 – Online ISSN: 2013-0953
Print ISSN: 2013-8423
An accounting system to support process improvements: transition to lean accounting 592
P. Ruiz de Arbulo-López; J. Fortuny-Santos
𝐶𝑊𝐼𝑃𝜃 =𝑊𝐼𝑃𝑚𝑎𝑥
2 · 𝐶𝑃 · 𝑟 · 𝜃𝑁
Equation 4. “Cost of holding inventories of in-process materials”.
Case WIP max
(pieces)
Average WIP
(pieces)
Production cost
(€/unit)
Rate r (%)
Time (years)
Production run
(units)
Cost Cwip
(€/ufp)* Before
balancing 136 68 31.40 50% 1/50 170 0.13
After balancing 118 59 30.30 50% 1/50 170 0.10
* In Euros per unit of finished product (ufp)
Table 8. “Calculation of the in-process inventory and its cost”.
5. Calculating the cost of production
From the description of the initial process (see table 2 and figure 1) and its key
metrics (Table 3 and table 4), following the steps of the costing method (Tables 5,
6 and 7) and solving equations 2 and 3, it is possible to quantify the cost of
production according to table 9. The cost of holding inventories (Equation 4 and
table 8) is then added. Again in this example, the coefficient that measures the
occurrence of defective parts (Kd) is set to 1. A greater value of this coefficient
would increase the quantity of resources necessary to get a valid unit of finished
product, therefore increasing the production cost.
3.4 Improvements according to the pre-ABC costing
From an operational point of view, thanks to a better line balancing, the average
capacity of the line has improved from 4.39 parts per hour to 6.55 parts per hour
and work conditions have improved because the quantity of work at each post is
similar, workers have to wait less, the products flow though the stations, and work-
in-process inventory has decreased. But if the company used a full costing system,
although the cost of each operation would be different due to the new use of labor
at each post, there would be no change in the final cost, as shown in table 10.
In the current period (and in the next ones if the company takes no action), the
burden is the same (because the same labor is used in the factory) despite the fact
that the process is now better executed. Cost can be attributed to products and
then there will be no change (as shown in table 10). In traditional cost accounting,
rational apportionment of fixed cost may be used, so a part of the cost may be

doi:10.3926/jiem.2010.v3n3.p576-602 JIEM, 2010 – 3(3): 576-602 – Online ISSN: 2013-0953
Print ISSN: 2013-8423
An accounting system to support process improvements: transition to lean accounting 593
P. Ruiz de Arbulo-López; J. Fortuny-Santos
considered the cost of unused capacity. In that case (Table 11) the cost of the
products would be lower but the company would still bear the rest of the burden.
Operation Cost driver
Cost (€/unit
of driver)
Before balancing the process After balancing the process
Time for this element
(s)
Consumption of drivers
I’/UFP = Kd · I/UFP
**
Cost (€/unit of finished product)
Time for this
element (s)
Consumption of drivers I’/UFP =
Kd · I/UFP **
Cost (€/unit of finished product)
CT EH 20 10 0.0028 0.0556 10 0.0028 0.0556 C1 EH 30 160 0.0444 1.3333 160 0.0444 1.3333 CT EH 20 10 0.0028 0.0556 10 0.0028 0.0556
Wait A1
20 180 Average on 170 units
0.0059 180 Average on 170 units
0.0059
A1 EH 35 300 0.0833 2.9167 520 0.1444 5.0556 Wait A2
20 480 Average on 170 units
0.0157 700 Average on 170 units
0.0229
A2 MH 35 500 0.1389 4.8611 550 0.1528 5.3472 Wait A3
20 980 Average on 170 units
0.0320 1,250 Average on 170 units
0.0408
A3 EH 35 810 0.2250 7.8750 540 0.1500 5.2500 AT EH 20 10 0.0028 0.0556 10 0.0028 0.0556
Wait P1
15 106,580 Average on 170 units
2.6123 60,950 Average on 170 units
1.4939
P1 EH 20 180 0.0500 1.0000 180 0.0500 1.0000 PT EH 15 20 0.0056 0.0833 20 0.0056 0.0833 Cost of activities *
In production processes 20.90 19.80
Cost of raw materials Crm (Table 7) * 10.50 10.50
Total cost of production CP * 31.40 30.30
Cost of in-process inventories Cwip
(Table 8) * 0.13 0.10
Total cost of the product * 31.53 30.40 * In Euros per unit of finished product
** Quantity of cost driver consumed by the activity per unit of finished product. The empirical quantity
I’ equals the theoretical quantity I because the coefficient Kd that takes into account the production of
defectives is set to 1 (no defectives).
Table 9. “Calculation of the production cost, according to the costing method based on ABC”.
FULL COSTING
Before line balancing After line balancing
Fixed cost
Variable cost
Total cost
Cost per unit
Fixed cost
Variable cost
Total cost
Cost per unit
(€) (€) (€) (€/unit) (€) (€) (€) (€/unit) Material 10,50 10,50
C 780,00 75,56 855,56 5,03 780,00 75,56 855,56 5,03 A1 780,00 212,50 992,50 5,84 780,00 368,33 1148,33 6,75 A2 780,00 354,17 1134,17 6,67 780,00 389,58 1169,58 6,88 A3 780,00 573,75 1353,75 7,96 780,00 382,50 1162,50 6,84 P 585,00 42,50 627,50 3,69 585,00 42,50 627,50 3,69
Total cost 4963,47 39,70 4963,47 39,70
Table 10. “Calculation of the production cost, according to Full costing”. Variable cost is
calculated on the average time devoted to each part before and after balancing the line.

doi:10.3926/jiem.2010.v3n3.p576-602 JIEM, 2010 – 3(3): 576-602 – Online ISSN: 2013-0953
Print ISSN: 2013-8423
An accounting system to support process improvements: transition to lean accounting 594
P. Ruiz de Arbulo-López; J. Fortuny-Santos
While in table 2 there is a reduction in production, in tables 9 and 10 the number of
parts assembled is the same as usual, so in practice the company would probably
fail to appreciate the change in capacity and therefore would never consider table
11. In future periods, the company may be able to adjust the amount of labor or
may produce more (if demand increases), but in the present, accounting is not
able to anticipate future profits (Olivella, 2008).
APPORTIONMENT
After line balancing
Fixed cost
Variable cost
Total cost
Cost per unit
(€) (€) (€) (€/unit) Material 10,50
C 519,44 75,56 595,00 3,50 A1 519,44 368,33 887,78 5,22 A2 519,44 389,58 909,03 5,35 A3 519,44 382,50 901,94 5,31 P 389,58 42,50 432,08 2,54
Total cost 3725,83 32,42
Table 11. “Calculation of the production cost when apportionment is used”.
4 Conclusions
There is evidence in literature that the adoption of the lean manufacturing
paradigm brings about improvements in productivity, quality and delivery figures.
In consequence, many companies implement lean manufacturing techniques.
These companies hope that lean techniques will bring better operational
performance that can be measured as a decrease in cost. However, while
operational improvements are evident sometimes they do not seem to lead to
reduced costs. Since this seemed strange, it was discovered that traditional costing
methods were not suitable for lean production.
This is because cost accounting was created to support mass production, just like
other performance indicators such as machine utilization, which are based on the
paradigm of mass production. This paradigm fixes the behavior which is good, and
which actions are wrong in order to adapt to a certain environment. The paradigm
of lean production is completely different and was created to face a very different
environment; conventional cost accounting cannot meet the requirements of lean
manufacturing and discourages lean implementations.

doi:10.3926/jiem.2010.v3n3.p576-602 JIEM, 2010 – 3(3): 576-602 – Online ISSN: 2013-0953
Print ISSN: 2013-8423
An accounting system to support process improvements: transition to lean accounting 595
P. Ruiz de Arbulo-López; J. Fortuny-Santos
The example in table 1 showed that the adoption of certain manufacturing
practices, despite their operational advantages, may convey, at least in the short
run, costs (instead of cutting them) and losses that may discourage managers. If
rational apportionment of fixed cost is used, it is possible to better understand the
causes of the cost and not to allocate it to products; however, the final result is the
same.
Changes towards lean manufacturing such as cellular manufacturing make cost
management easier because each product (or family) has a distinct flow and there
are not many variations from time to time in the production process. There are
also not many units in inventory. This allows some simplifications that have been
termed lean accounting.
However, there is no agreement on how accounting practices should be adopted
and developed to support lean manufacturing. There is no relevant academic
literature on this topic.
Lean accounting is suitable for companies that have implemented lean
manufacturing to a certain extent. The company may then implement further lean
accounting techniques along with new lean manufacturing practices, but there is no
“non traditional” accounting method for companies that have just started the
transformation to lean manufacturing. For this reason, this paper presents an
accounting method based on Activity-Based Costing that can calculate the cost of
products, the cost of waste (such as waiting) and the savings of operational
improvements.
ABC has been chosen because that method came about in order to support
companies that did not fit the mass production paradigm. Although ABC consumes
many resources for data collection (and this is contrary to the principles of lean
management), it includes the concept of production flow and helps reveal sources
of waste (activities that can be considered a waste of resources) and its effect
(cost) on products. Its ideas are of flow, waste reduction, ongoing improvement
and target cost which are central to the paradigm of lean manufacturing.
Moreover, although it is possible, it is not necessary to change the whole current
costing system if the company does not feel confident doing so. Our method can
be used just to evaluate the improvements on the areas that are implementing

doi:10.3926/jiem.2010.v3n3.p576-602 JIEM, 2010 – 3(3): 576-602 – Online ISSN: 2013-0953
Print ISSN: 2013-8423
An accounting system to support process improvements: transition to lean accounting 596
P. Ruiz de Arbulo-López; J. Fortuny-Santos
aspects of lean manufacturing. Once the implementation of lean manufacturing
progresses, other lean accounting techniques may be implemented.
The application of our costing method has been presented by means of a simple
example. Without being foreign to traditional costing (similar to time-driven ABC
because drivers are based on time), it has shown the cost of the activities, its
effect on the product and the savings conveyed by the operational improvement.
With the help of the costing method presented in this paper, the operational
improvement is related to an improved cost.
Table 9 shows a comparison between the cost of the product in the initial situation
and once the process is more efficient. After balancing the production process, the
cost of value added and transportation activities has not changed because the time
of the operations is the same, as well as the cost of the drivers. However, the cost
of wait time and the cost of holding inventories have diminished because these are
the main improvements introduced by a line balancing.
In many companies, traditional accounting does not consider such costs and
therefore the improvement would be irrelevant from the point of view of cost (as
seen in Table 10). The capacity has increased, and in the future it can be very
positive for the company, but accounting does not measure future profits. If the
company uses apportionment of costs, then part of the cost can be described as
the cost of unused capacity and not be allocated to products; but since capacity is
measured in volume and the production of parts in our example is the same as
usual, the company would probably never notice a change in capacity or cost.
References
Ahlström, P., & Karlsson, C. (1996). Change processes towards lean production:
the role of the management accounting system. International journal of
operations & production management, 16(11), 42-56.
doi:10.1108/01443579610131447
Anderson, S. W. (1995). A Framework for Assessing Cost Management Systems:
The Case of Activity Based Costing Implementation at General Motors, 1986-
1993. Journal of Management Accounting Research, 7(Fall), 1-51.

doi:10.3926/jiem.2010.v3n3.p576-602 JIEM, 2010 – 3(3): 576-602 – Online ISSN: 2013-0953
Print ISSN: 2013-8423
An accounting system to support process improvements: transition to lean accounting 597
P. Ruiz de Arbulo-López; J. Fortuny-Santos
Argilés Bosch, J. M. (2007). Análisis del comportamiento de los resultados en “full”
y “direct costing”. Cuadernos de CC.EE y EE., 53, 107-133.
Baguer, A., & Zárraga, M. (2002). Dirige. Manual de conceptos prácticos y
necesarios para la gestión empresarial. Madrid: Ed. Diaz de Santos.
Balada Ortega, T. (1994). El rediseño de procesos en el contexto de la contabilidad
de gestión: prácticas y experiencias en Ford España S.A., In J. Lizcano
(coordinator), Elementos de Contabilidad de Gestión. Madrid: Ediciones Asociación
Española de Contabilidad y Administración de Empresas.
Banker, R. D., Bardhan, I.R., & Chen, T.Y. (2008). The role of manufacturing
practices in mediating the impact the impact of activity-based costing on plant
performance. Accounting, organizations and society, 3, 1-19.
doi:10.1016/j.aos.2006.12.001
Berliner, C., & Brimson, J.A. (1988). Cost management for today’s advanced
manufacturing: The CAM-I conceptual design. Boston: Harvard Business School
Press.
Blanco Ibarra, F. (1988). Curso de contabilidad analítica. Bilbao: Ediciones Deusto.
Cooper, R. (1994). The role of Activity-based system in supporting the transition to
the lean enterprise". Advances in Management Accounting; Research annual, 3,
1-24.
Cooper, R. (1996). Activity-based costing and the lean enterprise. Journal of Cost
Management (Winter), 6-14.
Cooper, R. (2000). Cost management: from Frederick Taylor to the present. Journal
of Cost Management, (September/October), 4-9.
Cooper, R., & Kaplan, R.S. (1988). Measure costs right: make the right decisions.
Harvard Business Review, (September-October), 96-103.
Crute, V., Ward, Y., Brown, S., & Graves, A. (2003). Implementing Lean in
Aerospace – challenging the assumptions and understanding the challenges.
Technovation, (23) 917-928.
doi:10.1016/S0166-4972(03)00081-6

doi:10.3926/jiem.2010.v3n3.p576-602 JIEM, 2010 – 3(3): 576-602 – Online ISSN: 2013-0953
Print ISSN: 2013-8423
An accounting system to support process improvements: transition to lean accounting 598
P. Ruiz de Arbulo-López; J. Fortuny-Santos
Cuatrecasas Arbós, L. (1996). Diseño de procesos de producción flexible. Madrid:
TGP-Productivity Press.
Cuatrecasas Arbós, L. (2000). Organización de la producción y dirección de
operaciones. Sistemas actuales de gestión eficiente y competitiva. Madrid: Ed.
Centro de estudios Ramón Areces.
Cuatrecasas Arbós, L. (2003). Gestión competitiva de stocks y procesos de
producción. Barcelona: Ed. Gestión 2000.
Cuatrecasas Arbós, L. (2006). Claves de Lean Management. Barcelona: Ed. Gestión
2000.
DeLuzio, M.C. (2006). Accounting for lean - Conventional accounting must adapt to
accommodate the lean movement. Manufacturing engineering, 137(6), 83.
Dhavale, D.G. (1996). Performance Measures for Cell Manufacturing and /Focused
Factory Systems. Journal of Cost Management, 10(1), 59-69.
Goldratt, E. M., & Cox, J. (1986). The Goal: A process of ongoing improvement.
New York: North River Press.
Grasso, L.P. (2005). Are ABC and RCA accounting systems compatible with lean
management. Management accounting quarterly, 7(1), 12-27.
Harman, R. L. (1992). Reinventing the factory II. Managing the world class factory.
New York: The Free Press, New York.
Harman R. L., & Peterson, L.D. (1990). Reinventing the Factory: Productivity
Breakthroughs in Manufacturing Today. New York: The Free Press.
Hyer, N. L., & Wemmerlöv, U. (2002). Reorganizing the factory: competing through
cellular manufacturing. Portland: Productivity Press.
Huntzinger, J. R. (2007). Lean cost management: accounting for lean by
establishing flow. San Francisco: J. Ross Publishing.
Huntzinger, J., & Kennedy, F.A. (2005). Lean accounting: measuring and managing
the value stream. Journal of cost management, 19(5), 31-38.

doi:10.3926/jiem.2010.v3n3.p576-602 JIEM, 2010 – 3(3): 576-602 – Online ISSN: 2013-0953
Print ISSN: 2013-8423
An accounting system to support process improvements: transition to lean accounting 599
P. Ruiz de Arbulo-López; J. Fortuny-Santos
Jenson, R., Brackner, J., & Skousen, C. (1996). Management accounting in support
of manufacturing excellence. Montvale: Institute of Management Accountants.
Johnson, H.T., & Kaplan, R.S. (1987). Relevance Lost- The rise and fall of
management accounting. Boston: Harvard Business School Press.
Johnson, H.T. (1992). Relevance Regained: from ttop-down control to bottom-up
empowerment. New York: The Free Press Business.
Kaplan, R. S. (1983). Measuring manufacturing performance: a new challenge for
managerial accounting research. The accounting review, 58(4), 686-705.
Kaplan, R. S. (1984). Yesterday’s accounting undermines production. Harvard
Business Review, 62(July-August), 95-101.
Kaplan, R.S. (1985). Una contabilidad anticuada puede socavar la producción.
Harvard Deusto Business Review, (23), 125–134.
Kaplan, R.S. (1986). Accounting lag: The obsolescence of cost accounting systems.
California Management Review, 18(2), 174-199.
Kaplan, R.S. (1987). Regaining Relevance. In R. Capettine, R. & D.K. Clancy (Ed.),
Cost Accounting, Robotics, and the New Manufacturing Environment. Sarasota:
American Accounting Association.
Kaplan, R.S. (1988). One cost system isn't enough. Harvard Business Review
66(January-February), 61- 66.
Kaplan, R.S. (1989). Limitations of Cost Accounting in Advanced Manufacturing
Environments. Colloquium. Cambridge (MA.): Harvard Business School,
Cambridge.
Kaplan, R.S, & Anderson, S.R. (2004). Time driven activity-based costing. Harvard
Business Review, 82(11), 131-138.
Kaplan R.S., & Cooper, R. (1998). Cost and Effect. Boston: Harvard Business
School Press.
Martínez Sánchez, A., & Pérez Pérez, M. (2001). Lean indicators and manufacturing
strategies. International Journal of Operations & Production Management, 21(11),

doi:10.3926/jiem.2010.v3n3.p576-602 JIEM, 2010 – 3(3): 576-602 – Online ISSN: 2013-0953
Print ISSN: 2013-8423
An accounting system to support process improvements: transition to lean accounting 600
P. Ruiz de Arbulo-López; J. Fortuny-Santos
1433-1451.
doi:10.1108/01443570110407436
Maskell, B.H., & Baggaley, B. (2004). Practical lean accounting. A proven system
for measuring and managing the lean enterprise. New York: Productivity Press.
Maskell, B.H., & Kennedy, F.A. (2007). Why Do We Need Lean Accounting and How
Does It Work? The Journal of Corporate Accounting & Finance, (March/April), 59-
73.
doi:10.1002/jcaf.20293
Ohno, T. (1988). Toyota Production System: Beyond Large-Scale Production.
Cambridge (MA.): Productivity Press.
Olivella Nadal, J. (2008): Los beneficios de las empresas durante la implantación
del lean. Retrieved August 29th, 2009, from
http://www.institutolean.org/articulos/articulos_ilm_0803_olivella.pdf.
Plenert, G. (1999). The new manufacturing-accounting interface. Industrial
management and data systems, 99(1), 25-32.
doi:10.1108/02635579910249891
Ruiz de Arbulo López, P. (2005). Un nuevo modelo de gestión de costes para
avanzar hacia la producción lean (Doctoral dissertation). Universidad del País
Vasco.
Ruiz de Arbulo López, P. (2007). La gestión de costes en lean manufacturing. La
Coruña: NetBiblo.
Sriparavastu, L., & Gupta, T. (1997). An empirical study of just-in-time and total
quality management principles implementation in manufacturing firms in the USA.
International Journal of Operations & Production Management, 17(12), 1215-
1232.
doi:10.1108/01443579710182954
Sugimori, Y., Kusunoki, K., Cho, F., & Uchikawa, S (1977). Toyota production
system and Kanban system. Materialization of just-in-time and respect-for-human
system. International Journal of Production Research, 15(6), 553-564.
doi:10.1080/00207547708943149

doi:10.3926/jiem.2010.v3n3.p576-602 JIEM, 2010 – 3(3): 576-602 – Online ISSN: 2013-0953
Print ISSN: 2013-8423
An accounting system to support process improvements: transition to lean accounting 601
P. Ruiz de Arbulo-López; J. Fortuny-Santos
Tamarit Aznar, M.C., & Ripoll Feliu, V.M. (2006). Implantación del ABC/ABM en
RENFE. Revista de contabilidad y dirección, (3), 197-208.
Tatikonda, M. V. (1988). Just-in-time and modern manufacturing environments:
implications for cost accounting. Production and inventory management journal,
(First quarter), 1-5.
Tirado Valencia, P. (2003). Gestión de costes y mejora continua. Los sistemas de
costes y de gestión basados en las actividades (ABC-ABM). Bilbao: Ed. Desclée de
Brouwer.
Ward, Y., & Graves, A. (2004). A new cost manufacturing and accounting approach
for lean enterprises. (Working paper series, 5). University of Bath School of
management.
Ward, Y., Crute, V., Tomkins, C., & Graves, A. (2003). Cost management and
accounting methods to support lean aerospace enterprises. A UK Lean Aerospace
initiative Report, University of Bath.
Ward, Y., Crute, V., Tomkins, C., & Graves, A. (2004). Costing for Competitiveness:
Cost Management and Accounting for Lean Enterprises. Society of British
Aerospace Companies Publication.
Williamson, A. (1997). Target and kaizen costing. Manufacturing engineer, 76(1),
22–24.
Womack, J. P., & Jones, D. T. (1996). Lean thinking: banish waste and create
wealth in your corporation. New York: The Free Press.
Womack J. P., Jones D.T., & Ross, D. (1990). The machine that changed the world.
New York: The Free Press.

doi:10.3926/jiem.2010.v3n3.p576-602 JIEM, 2010 – 3(3): 576-602 – Online ISSN: 2013-0953
Print ISSN: 2013-8423
An accounting system to support process improvements: transition to lean accounting 602
P. Ruiz de Arbulo-López; J. Fortuny-Santos
Journal of Industrial Engineering and Management, 2010 (www.jiem.org)
Article's contents are provided on a Attribution-Non Commercial 3.0 Creative commons license. Readers are allowed to copy, distribute and communicate article's contents, provided the author's and Journal of Industrial
Engineering and Management's names are included. It must not be used for commercial purposes. To see the complete license contents, please visit http://creativecommons.org/licenses/by-nc/3.0/.