Allocation of quality control stations in multistage manufacturing ...
17
Accepted Manuscript Survey Allocation of quality control stations in multistage manufacturing systems Ali G. Shetwan, Valentin I. Vitanov, Benny Tjahjono PII: S0360-8352(11)00010-6 DOI: 10.1016/j.cie.2010.12.022 Reference: CAIE 2894 To appear in: Computers & Industrial Engineering Received Date: 6 October 2009 Revised Date: 2 October 2010 Accepted Date: 25 December 2010 Please cite this article as: Shetwan, A.G., Vitanov, V.I., Tjahjono, B., Allocation of quality control stations in multistage manufacturing systems, Computers & Industrial Engineering (2011), doi: 10.1016/j.cie.2010.12.022 This is a PDF file of an unedited manuscript that has been accepted for publication. As a service to our customers we are providing this early version of the manuscript. The manuscript will undergo copyediting, typesetting, and review of the resulting proof before it is published in its final form. Please note that during the production process errors may be discovered which could affect the content, and all legal disclaimers that apply to the journal pertain.
-
Upload
khangminh22 -
Category
Documents
-
view
0 -
download
0
Transcript of Allocation of quality control stations in multistage manufacturing ...

Accepted Manuscript
Survey
Allocation of quality control stations in multistage manufacturing systems
Ali G. Shetwan, Valentin I. Vitanov, Benny Tjahjono
PII: S0360-8352(11)00010-6
DOI: 10.1016/j.cie.2010.12.022
Reference: CAIE 2894
To appear in: Computers & Industrial Engineering
Received Date: 6 October 2009
Revised Date: 2 October 2010
Accepted Date: 25 December 2010
Please cite this article as: Shetwan, A.G., Vitanov, V.I., Tjahjono, B., Allocation of quality control stations in
multistage manufacturing systems, Computers & Industrial Engineering (2011), doi: 10.1016/j.cie.2010.12.022
This is a PDF file of an unedited manuscript that has been accepted for publication. As a service to our customers
we are providing this early version of the manuscript. The manuscript will undergo copyediting, typesetting, and
review of the resulting proof before it is published in its final form. Please note that during the production process
errors may be discovered which could affect the content, and all legal disclaimers that apply to the journal pertain.
li2106
Text Box
Computers & Industrial Engineering, Volume 60, Issue 4, May 2011, Pages 473–484

Allocation of quality control stations in multistage manufacturing systems
Ali G. Shetwan∗1 Valentin I. Vitanov1, Benny Tjahjono2
1School of Engineering, Durham University, South Road
Durham, DH1 3LE, UK.
2School of Applied Sciences, Cranfield University, Cranfield Bedfordshire, MK43 0AL, UK
Allocation of quality control stations in multistage manufacturing systems
Abstract The allocation of quality control stations (AQCs) in multi-stage manufacturing systems has been studied extensively over the last fifty years. The objective of this paper is to review the existing approaches, propose a classification of the available models in terms of the type of manufacturing system that they refer to and the applied solution methods, and then examine the effectiveness of the inspection strategies by developing appropriate generalised algorithm and software tool. The review firstly revealed that the inspection allocation problem has been studied comprehensively using variety of analytical and Monte Carlo simulation methods rather than combination of both simulation techniques in a simulation-optimisation framework. Secondly a large proportion of the papers focus on several work stations representing part of a manufacturing line without attempting to solve the global optimisation problem which lead to solutions based on complete enumeration that are known to be computationally ineffective when the number of workstations increase. The developed simulation program demonstrated that methods determining the position of inspection by using complete enumeration method (EM) are of limited use in the majority of manufacturing situations when the number of workstations exceeds eighteen. This led to the development of a heuristic algorithm the performance of which was compared with the complete enumeration algorithm. It was found that heuristic method can derive an acceptable solution significantly faster. At present authors continue to develop heuristic algorithms for the AQCs problem and methaheuristics using biologically inspired techniques. Keywords: Manufacturing; Quality; Resources Allocation; Inspection Optimisation.
1. Introduction
The quality management policies in the majority of companies evolve continuously over a number of years by focusing on quality issues that are critical at any given instant of time. This approach usually focuses on particular critical operations and does not take into account the need for global analysis of quality problems within a manufacturing system. As a result quality policies
∗Corresponding author:
Tel: + 44(0)191 334 2377 Fax: +44(0)191 334 2390 E-mail addresses: [email protected]; [email protected]

tend not fully utilise the available financial, human and equipment resources. Furthermore, in the current economic situation, the reduction of waste becomes of paramount importance because the increase in the product cost affects the overall competitiveness of the products. This paper targets specifically waste resulting from unidentified defective items being processed unnecessarily during manufacturing operations. The solution of inspection effort allocation issues needs to adopt the corresponding utility strategies. Such strategies aim to allocate an economically appropriate level of inspection effort by striking a balance among the different cost components connected with inspection, scrap, repair and replacement due to quality failure, and/or the warranty penalty in the case where a nonconforming product has been shipped to customers. Inspection-oriented strategy focuses on optimization that minimizes the expected total manufacturing cost, maximizes the quality and is capable of delivering the demanded quantities of the product. The expected total cost consists of the manufacturing cost, inspection cost, internal failure cost and external failure cost. The general problem of allocation of quality control stations (AQCs) in manufacturing systems can be divided into two sub-problem categories aiming to answer the following research questions: (1) If the requested quality level, production volume and product costs are fixed what is the optimal number of inspection stations for a manufacturing process? (2) If the number of inspection stations is fixed for a particular process where the optimal places to position are them in order to optimise the quality, cost, and delivery manufacturing attributes? The objective of this paper is to present an overview on how these questions have been answered and to examine the inspection strategies by developing the appropriate algorithm and software tool. 2. Inspection allocation problem
2.1. Problem background
The procedure of making decisions of whether or not to inspect a final or semi-finished product at every processing workstation is shown schematically in Figure 1. It is assumed that if inspection is performed after every workstation, then the scrap and rework costs will stay at a minimum level. These savings have to be considered against the inspection costs which include equipment, staff, time, shop floor space and increase the number of works in process. Therefore, if these in-process inspections are performed too often unnecessary, costs will incur. In a practical setting usually the expectation is that manufacturing processes at each work station are capable of achieving the required quality tolerances for 99.97% of the items which is the 3� level when the process is on target Montgomery (1997).
Input
Inspection Station - Fixed and Variable cost - Inspection errors. - Type of inspection.
Workstation (i+1)
Workstation station (i)
Conforming?
Nonconforming product
Replace / downgrade product
Rework/Repair
Scrap
Re-inspection If necessary
Inspect
No
Yes
Yes
No
Output
Lost production cost
Output IS n
WS n
WS 1 IS 1 IS 2
WS 3
Input WS 2

It is possible that a shift of up to 1.5� from the target quality level may occur undetected subject to the quality procedure which may lead to drop in quality level down to 93.3% and when such situation occurs our inspection stations have to be positioned in a way that will minimise the overall lost of profit. If the shift is larger than that we consider that the problem is not any longer a quality monitoring but a manufacturing issue that has to be fixed by different means. The purpose of the inspection allocation strategy is to allocate an economically appropriate level of inspection activity by determining the correct balance among different cost components indicated above. 2.2. Structure of the line Products are often processed through multi-stage production systems, where incoming raw materials are transformed into the finished products in a chain of different processing stages. There are several types of production systems such as: (i) serial systems; (ii) assembly systems; and (iii) non-serial systems. In a serial production system, the raw materials pass through a sequence of processing workstation to the final products (see Shiau (2002) and VanVolsem et al. (2007)) whereas in an assembly system, at a certain stage the product may be fixed or assembled with products from other processing lines, (see Penn and Raviv (2007) and Deliman and Feldman (1996)). A system that is neither serial nor non assembly falls into category of non-serial system, (see Taneja and Viswanadham (1994) and Emmons and Rabinowitz (2002)). However, it is more difficult to determine undetected defects in assembly system than in serial line. The difficulty arises due to assembly stages at which multiple serial lines join to form a single serial line. At such assembly stages, the number of undetected defective output flow items of the assembly stage entering the assembly line stage depends on the proportion of defective items leaving all series lines to that assembly stage. 2.3. Inspection time In the reviewed papers, inspection time plays a major role to the total manufacturing costs. Longer inspection times obviously strain the inspection capacity which may cause increased inspection errors. Saxena et al. (1990) explained this by using a simulation model to examine the performance of five inspection stations on the basis of job completion time in serial production systems under different operating conditions. They found that inspection time was the most influential factor for the selection of a particular heuristics rule. The vast majority of the papers were assumed that the inspection time for each inspection station can be represented by the inspection cost (see Shiau (2002), Shiau et al. (2007), Penn and Raviv (2007), Shiau (2003a) and Shiau (2003b)), just to name a few. Indeed only one paper in the optimisation techniques (Lee and Unnikrishnan (1998)) used inspection time as constraint to the objective function of the total cost. They found that by considering inspection time as constraint, the number of inspection plans can be reduced. 2.4. Repair of defects As illustrated in Figure 1, during the inspection, once an item does not confirm to the specifications certain actions will be taken to repair, replace or simply scrap it. However, defective

products, when allowed to pass through the production stream, might cause time delay and become costly to repair at a later stage of operation. To account for this in a model, some researchers have assigned a reparability level for defects. For example Hsu (1984) and Chen et al. (1998) have assumed deterministic assignment of reparability; and Narahari and Khan (1996) and Barad (1990) have adopted a probabilistic approach which assumes that a defect is repairable with a given probability. The repair occurs only when every nonconforming predefined quality of a product is larger than the specification limit. In the absence of both repairable and replacement, the production volume in the model will shrink as a result of inspection. In real life without replacement or repair larger lot sizes have to be introduced in order to meet production plans and to avoid delivery delays. 2.5. Nonconforming products Products may become nonconforming because of improper performance of a processing operation. The chance that a unit will become nonconforming at a given stage is referred to as the nonconforming processing rate for the stage, and may be constant or variable, and may alternate between an acceptable level and an out-of control level. A given processing stage may cause a single type of nonconformity or multiple types. In the inspection station allocation, the majority of the reviewed papers have assumed that each workstation may have a specific probability of producing defective parts. Products considered being nonconforming and subsequently removed from the production flow may have some or no salvage value at all. The salvage value represents the revenue generated by selling the rejected items as scrap or lower grade products (see Eppen and Hurst (1974)). They assumed that a unit rejected by inspection, whether good or defective, is always removed because it incurs a salvage cost which might be negative. 2.6. Inspection capability During the inspection operation two types of error may be generated by the inspection procedure: type-I error and type- II error. The type-I error refers to as a rejection a good items and is also known as the producer risk, whereas type- II error refers to as the acceptance of a non-conformance items and is also known as the consumer risk. The type II error is usually more serious. Not all the authors have considered both types of error. Rebello et al. (1995) and Tannock (1997) have only considered one of the two types and other authors have simply assumed a perfect inspection (e.g.Narahari and Khan (1996) and Penn and Raviv (2008)). 3. Modelling features An inspection quality allocation problem is usually solved through an optimization formulation. In this section, types of cost components have been considered will be discussed followed by the solution approach proposed by the researchers. Table 1 presents a summary of the classifications where each publication is represented by the first author’s name followed by a two-digit publication year in order to conserve space. In order to recognise the type of manufacturing and inspection system a publication considered, the information under different categories will be selected. For example, Peters and Williams (1984) considered a serial system, inspection is therefore assumed to be error free. In their paper, inspection cost was assumed to be fixed and variable. Some of the publications appear in multiple categories because they consider multiple scenarios in a production system. For example, Penn and Raviv (2007), has used the dynamic programming technique and branch and bound method to solve their model. 3.1. Cost components The manufacturing cost of a product is one of the major factors under consideration. The usual requirement is that the products to be manufactured at an acceptable quality level and minimum costs. Perhaps for that reason, the majority of the researchers chose to focus on specific cost components related to quality failures (internal failure cost and external failure cost). The internal failure costs incur inside the company, such as the costs of reworking, scrapping and replacement. The external failure costs incur after the goods are shipped to customers, for example the costs of
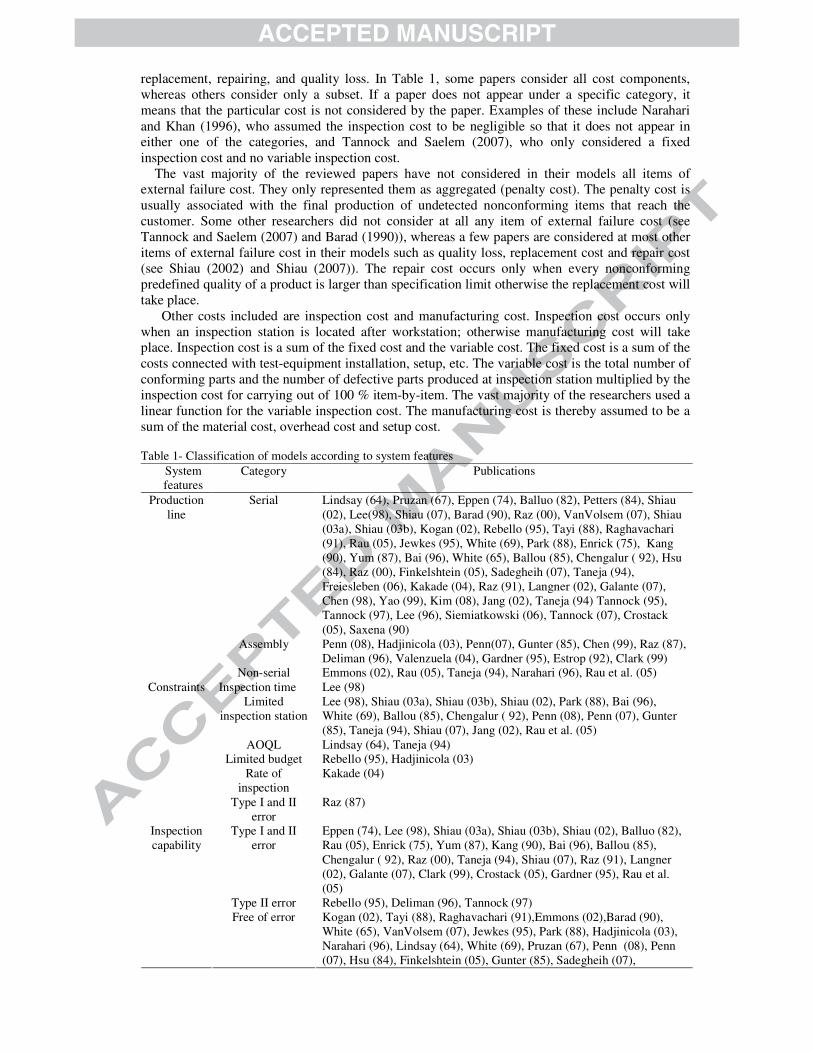
replacement, repairing, and quality loss. In Table 1, some papers consider all cost components, whereas others consider only a subset. If a paper does not appear under a specific category, it means that the particular cost is not considered by the paper. Examples of these include Narahari and Khan (1996), who assumed the inspection cost to be negligible so that it does not appear in either one of the categories, and Tannock and Saelem (2007), who only considered a fixed inspection cost and no variable inspection cost. The vast majority of the reviewed papers have not considered in their models all items of external failure cost. They only represented them as aggregated (penalty cost). The penalty cost is usually associated with the final production of undetected nonconforming items that reach the customer. Some other researchers did not consider at all any item of external failure cost (see Tannock and Saelem (2007) and Barad (1990)), whereas a few papers are considered at most other items of external failure cost in their models such as quality loss, replacement cost and repair cost (see Shiau (2002) and Shiau (2007)). The repair cost occurs only when every nonconforming predefined quality of a product is larger than specification limit otherwise the replacement cost will take place. Other costs included are inspection cost and manufacturing cost. Inspection cost occurs only when an inspection station is located after workstation; otherwise manufacturing cost will take place. Inspection cost is a sum of the fixed cost and the variable cost. The fixed cost is a sum of the costs connected with test-equipment installation, setup, etc. The variable cost is the total number of conforming parts and the number of defective parts produced at inspection station multiplied by the inspection cost for carrying out of 100 % item-by-item. The vast majority of the researchers used a linear function for the variable inspection cost. The manufacturing cost is thereby assumed to be a sum of the material cost, overhead cost and setup cost. Table 1- Classification of models according to system features
System features
Category Publications
Serial Lindsay (64), Pruzan (67), Eppen (74), Balluo (82), Petters (84), Shiau (02), Lee(98), Shiau (07), Barad (90), Raz (00), VanVolsem (07), Shiau (03a), Shiau (03b), Kogan (02), Rebello (95), Tayi (88), Raghavachari (91), Rau (05), Jewkes (95), White (69), Park (88), Enrick (75), Kang (90), Yum (87), Bai (96), White (65), Ballou (85), Chengalur ( 92), Hsu (84), Raz (00), Finkelshtein (05), Sadegheih (07), Taneja (94), Freiesleben (06), Kakade (04), Raz (91), Langner (02), Galante (07), Chen (98), Yao (99), Kim (08), Jang (02), Taneja (94) Tannock (95), Tannock (97), Lee (96), Siemiatkowski (06), Tannock (07), Crostack (05), Saxena (90)
Assembly Penn (08), Hadjinicola (03), Penn(07), Gunter (85), Chen (99), Raz (87), Deliman (96), Valenzuela (04), Gardner (95), Estrop (92), Clark (99)
Production line
Non-serial Emmons (02), Rau (05), Taneja (94), Narahari (96), Rau et al. (05) Inspection time Lee (98)
Limited inspection station
Lee (98), Shiau (03a), Shiau (03b), Shiau (02), Park (88), Bai (96), White (69), Ballou (85), Chengalur ( 92), Penn (08), Penn (07), Gunter (85), Taneja (94), Shiau (07), Jang (02), Rau et al. (05)
AOQL Lindsay (64), Taneja (94) Limited budget Rebello (95), Hadjinicola (03)
Rate of inspection
Kakade (04)
Constraints
Type I and II error
Raz (87)
Type I and II error
Eppen (74), Lee (98), Shiau (03a), Shiau (03b), Shiau (02), Balluo (82), Rau (05), Enrick (75), Yum (87), Kang (90), Bai (96), Ballou (85), Chengalur ( 92), Raz (00), Taneja (94), Shiau (07), Raz (91), Langner (02), Galante (07), Clark (99), Crostack (05), Gardner (95), Rau et al. (05)
Type II error Rebello (95), Deliman (96), Tannock (97)
Inspection capability
Free of error Kogan (02), Tayi (88), Raghavachari (91),Emmons (02),Barad (90), White (65), VanVolsem (07), Jewkes (95), Park (88), Hadjinicola (03), Narahari (96), Lindsay (64), White (69), Pruzan (67), Penn (08), Penn (07), Hsu (84), Finkelshtein (05), Gunter (85), Sadegheih (07),

Freiesleben (06), Chen (98), Kakade (04), Chen (99), Yao (99), Kim (08), Jang (02), Petters (84),Valenzuela (04), Saxena (90), Estrop (92), Tannock (95), Lee (96),Siemiatkowski (06),Tannock (07)
3.2. Solution approaches In the inspection allocation problems, the most common treatment that the models are developed with objective of minimising the expected total cost per unit produced. The total cost includes some or all of the following costs: internal failure cost and external failure cost, inspection cost, and manufacturing cost. Table 1(continued) shows these costs regarding to each paper. However, not all the papers try to minimise the total cost. As shown in Table 2, a few papers (see for example Rebello et al. (1995) and Valenzuela et al. (2004)) have decided to maximise the production capacity. This usually occurs when an inspection scheduling problem and the allocation problem is concurrently considered (Mandroli et al. (2006)). Constraints that were used by the researchers in the optimization of an inspection are mostly related to the characteristics of the manufacturing system such as the structure of the system, the type of defect and the type of inspection. As shown in Table 1 not all the surveyed papers have addressed the constraints. Limited number of inspection station has considered by most of the researchers, and some other authors have addressed average of outgoing quality level (AOQL) and rate of inspection. Table 1-Classification of models according to system features (continued)
System features
Category Publications
Rework/Repair Eppen (74), Lee (98), Shiau (03a), Shiau (02), Kogan (02), Rebello (95), Rau(05), Barad (90), VanVolsem (07), Jewkes (95), Park (88), Enrick (75), Hadjinicola (03), Kang (90), Yum (87), Narahari (96), Bai (96), White (69), Raz (00), Finkelshtein (05), Taneja (94), Shiau (07), Freiesleben (06), Kakade (04), Raz (91), Langner (02), Galante (07), Chen (99), Deliman (96), Chen (98), Yao (99), Kim (08), Jang (02), Petters (84), Valenzuela (04), Tannock (95), Tannock (97), Tannock (07), Crostack (05), Saxena (90), Clark (99), Rau et al. (05)
Replace Shiau (03a), Shiau (03b), Shiau (02), Rebello (95), Barad (90), VanVolsem (07), White (69), Yum (87), White (65), Hsu (84), Clark (99)
Internal failure cost
Scrap Eppen (74), Lee (98), Shiau (03a), Shiau (03b), Shiau (02), Kogan (02), Rebello (95), Balluo (82), Tayi (88), Raghavachari (91), Rau (05), Barad (90), Park (88), Hadjinicola (03), Kang (90), Yum (87), Narahari (96), Lindsay (64), White (69), Chengalur (92), Hsu (84), Raz (00), Finkelshtein (05), Gunter (85), Sadegheih (07), Taneja (94), Shiau (07), Freiesleben (06), Raz (91), Langner (02), Galante (07), Chen (99), Raz (87), Deliman (96), Kim (08), Petters (84), Tannock (07), Gardner (95), Estrop (92), Clark (99), Lee (96), Tannock (95), Tannock (97), Siemiatkowski (06), Crostack (05), Saxena (90), Rau et al. (05)
Replacement Lee (98), Shiau (07), Shiau (02), Shiau (03b) Repair Lee (98), Shiau (07), Shiau (02), Shiau (03b)
Quality loss Shiau (07), Shiau (02), Shiau (03b)
External failure cost
Penalty Petters (84), Balluo (82), Penn (07), Raz (00), VanVolsem (07), Rau (05), Kogan (02), Rebello (95), Tayi (88), Raghavachari (91), Rau (05), Jewkes (95), Kang (90), Bai (96), White (69), Pruzan (67), Ballou (85), Penn (07), Chengalur ( 92), Penn (08), Raz (00), Finkelshtein (05), Taneja (94), Kakade (04), Raz (91), Galante (07), Deliman (96), Chen (98), Yao (99), Valenzuela (04), Rau et al. (05)
Fixed Balluo (82), Tayi (88), Park (88), Ballou (85), Chengalur ( 92), Raz (00), Chen (99), Jang (02), Tannock (07), Gardner (95), Estrop (92), Clark (99)
Inspection cost
Variable Rebello (95), Rau (05), Emmons (02), Barad (90), VanVolsem (07), Jewkes (95), Park (88), Enrick (75), Hadjinicola (03), Yum (87), Lindsay (64), White (65), Hsu (84), Sadegheih (07), Taneja (94), Shiau (07), Kakade (04), Raz (91), Langner (02), Galante (07), Raz (87), Deliman (96), Chen (98), Yao (99), Valenzuela (04), Lee (96), Tannock (95), Tannock (97), Siemiatkowski (06)

The most common approach used by researchers was the dynamic programming (DP) technique because of the multistage arrangement of a manufacturing system that is well described by stages and states of the DP models (Mandroli et al. (2006)). Some previous publications presented an interesting remark. For example, Lee and Unnikrishnan (1998) and Shiau (2002, 2007) have pointed out that the DP approach employed in previous methodologies becomes quite impractical as the set of possible combinations grows exponentially. However, they do not provide any material evidence to prove their remark. Nonlinear programming also has been studied extensively because of the nature of the inspection allocation problem function in which some of the decision variables can only have integer values for example whether or not to inspect at workstation and the serial number of the inspection stations. Other techniques included genetic algorithm and simulated annealing (see Table 2 for more detail). In surveys conducted by Raz (1986), Menipaz (1978) and Mandroli et al. (2006) the numerical optimisation techniques have been identified as important. Therefore, they did not cover simulation publications which are related to allocation of inspection station problem. In this paper, Monte Carlo simulation methods have been extensively studied. The majority of simulation papers considered in this review focused on simple processes in order to simplify their models. For example, a single process issue was investigated by Clark and Tannock (1999) and Estrop et al. (1992). Most of the simulation papers attempted to answer the second of the research questions. They examined the performance of inspection station allocation through heuristics rules on the basis of the parameters considered in serial production systems under different operating conditions (see for example Saxena et al. (1990), Lee and Chen (1996), Siemiatkowski and Przybylski (2006) and Gardner et al. (1995)). The review has concluded that the following mathematical methods were used out of 62 papers 29% dynamic programming, 22% nonlinear programming, 10% genetic algorithm, 6% branch and bound, 6% Markov decision, 5% simulated annealing, 3% zero one Integer programming and 2% each of linear programming, Tabu search and expert system. Also the review has shown that 16% out of 63 papers have used Monte Carlo simulation technique. Table 2- Classification of models according to solution approach
System Features
Category Publication
Dynamic Programming Eppen (74), Lindsay (64), Pruzan (67), Petters (84), White (69), Enrick (75), Bai (96), White (65), Penn (08), Hsu (84), Raz (00), Finkelshtein (05), Gunter (85), Yao (99), Chen (98), Chengalur (92), Raghavachari (91), Penn (07)
Nonlinear Programming
Ballou (85), Narahari (96), Jewkes (95), Lee (98), Hadjinicola (03), Shiau (03a), Shiau (03b), Shiau (02), Barad (90), Rau et al. (05), Rau (05), Ballou (82), Emmons (02), Kogan (02)
Genetic Algorithm Galante (07), Freiesleben (06), Shiau (07), Taneja (94), Sadegheih (07), Van Volsem (07)
Branch and Bound Penn (07), Langner (02), Raz (91), Raz (87) Markov Decision Jang (02), Kim (08), Tayi (88), Deliman (96)
Simulated Annealing Chen (99), Kakade (04), Sadegheih (07)
Solution Approach
Optimisation
Zero One Integer Park (88), Yum (87)
Fixed and variable
Raghavachari (91), Kang (90), Bai (96), White (69), Penn(07), Pruzan (67), Penn (08), Finkelshtein (05), Gunter (85), Freiesleben (06), Petters (84), Crostack (05), Saxena (90), Rau et al. (05)
Manufacturing cost Tayi (88), Raghavachari (91), Emmons (02), Barad (90), Park (88), Enrick (75), Hadjinicola (03), Kang (90), Yum (87), White (69), Pruzan (67), Penn (08), Ballou (85), Chengalur ( 92), Penn(07), Hsu (84), Finkelshtein (05), Taneja (94), Shiau (07), Freiesleben (06), Langner (02), Galante (07), Chen (99), Deliman (96), Kim (08), Jang (02), Petters (84), Valenzuela (04) Clark (99), Crostack (05), Gardner (95), Saxena (90), Estrop (92), Lee (96), Siemiatkowski (06), Tannock (07)

Programming Tabu Search Valenzuela (04)
Expert System Kang (90) Linear Programming Rebello (95)
Minimum Total Cost
Eppen (74), Lindsay (64), Shiau (03a), Shiau (03b), Shiau (02), Tayi (88), Raghavachari (91), Rau et al. (05), Rau (05), Barad (90), VanVolsem (07), Jewkes (95), Narahari (96), Bai (96), Ballou (85), Chengalur (92), Raz (00), Taneja (94), Shiau (07), Freiesleben (06), Kakade (04), Raz (91), Langner (02), Galante (07), Chen (99), Chen (98), Yao (99), Jang (02), Kim (08)
Objective Function
Maximum Profit
Rebello (95), Hadjinicola (03), Penn (08), Penn (07), Valenzuela (04)
Monte Carlo Simulation Technique Tannock (95), Tannock (97), Lee (96), Siemiatkowski (06) Tannock (07), Saxena (90), Gardner (95), Clark (99), Estrop (92), Crostack (05)
4. Model formulation
4.1. Model description
To examine the inspection allocation problem, a serial multistage manufacturing system has been studied. Figure 2 illustrates the characteristics of the type of multistage system under consideration as follows:
1. The system is considered to be made up of 10 workstations arranged serially and parts are entering the system in batches.
2. Each workstation has a specific probability of producing defective parts. 3. A 100% inspection screen is applied to all parts processed in workstation if an inspection
station is performed after it in the sequence. 4. The system has limited number of inspection stations (e.g. five stations). Each inspection
station can be assigned to perform inspection operation for one or more workstations. 5. The selection of an inspection station is subjected to a time constraint. 6. Rework items may be incurring defects in the subsequent reworking process. 7. Only one final product is considered in the system. 8. Nonconforming items can either be scrapped or sent for rework. At each inspection station
there is exists a specific probability of selecting nonconforming items for rework. 9. Two types of inspection errors are considered in the system. A type I error involves the
classification of a conforming unit (CU) as a nonconforming unit (NCU), and a type II error means the classification of an NCU as a CU.
4.1. Description of indices
m: Refers to the inspection station assigned;
WS IS Workstation Possible inspection station
Figure 2 Serial manufacturing processes with inspection stations
Non-conformed
WS i WS i+1 IS i IS i+1 Output
Conformed
Scraped Rework
Input
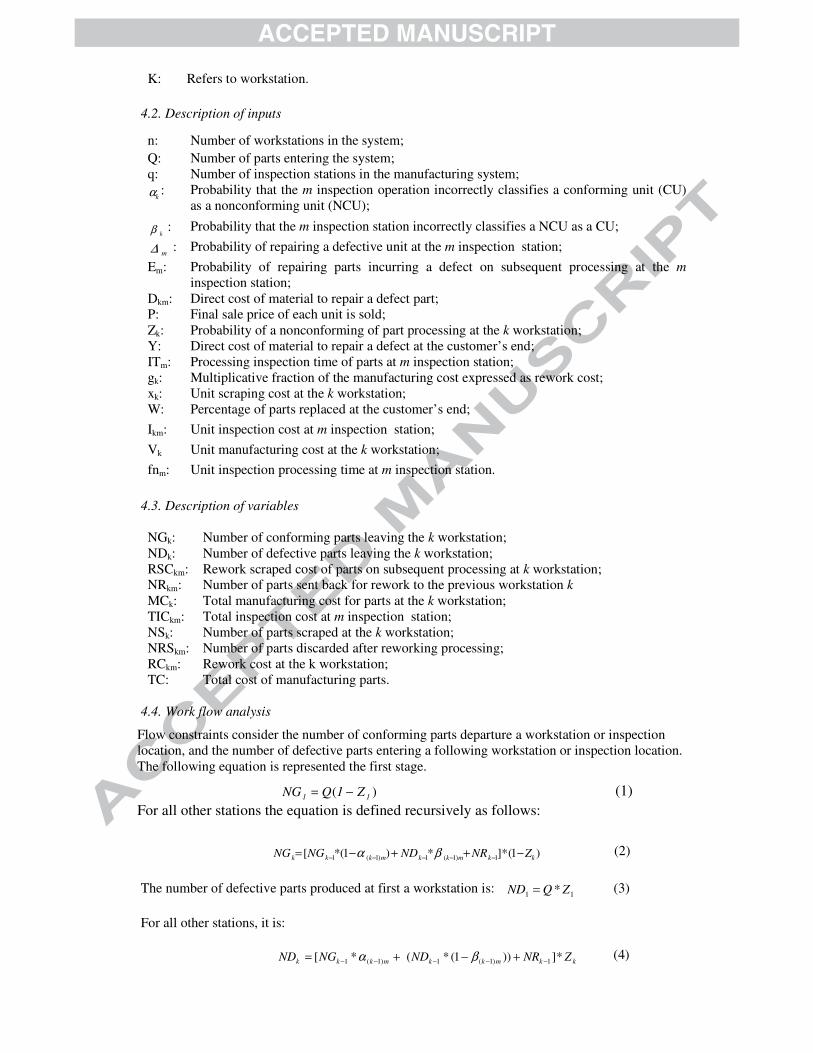
K: Refers to workstation.
4.2. Description of inputs
n: Number of workstations in the system; Q: Number of parts entering the system; q: Number of inspection stations in the manufacturing system;
kα : Probability that the m inspection operation incorrectly classifies a conforming unit (CU) as a nonconforming unit (NCU);
kβ : Probability that the m inspection station incorrectly classifies a NCU as a CU;
m∆ : Probability of repairing a defective unit at the m inspection station; Em: Probability of repairing parts incurring a defect on subsequent processing at the m
inspection station; Dkm: Direct cost of material to repair a defect part; P: Final sale price of each unit is sold; Zk: Probability of a nonconforming of part processing at the k workstation; Y: Direct cost of material to repair a defect at the customer’s end; ITm: Processing inspection time of parts at m inspection station; gk: Multiplicative fraction of the manufacturing cost expressed as rework cost; xk: Unit scraping cost at the k workstation; W: Percentage of parts replaced at the customer’s end; Ikm: Unit inspection cost at m inspection station; Vk Unit manufacturing cost at the k workstation; fnm: Unit inspection processing time at m inspection station.
4.3. Description of variables NGk: Number of conforming parts leaving the k workstation; NDk: Number of defective parts leaving the k workstation; RSCkm: Rework scraped cost of parts on subsequent processing at k workstation; NRkm: Number of parts sent back for rework to the previous workstation k MCk: Total manufacturing cost for parts at the k workstation; TICkm: Total inspection cost at m inspection station; NSk: Number of parts scraped at the k workstation; NRSkm: Number of parts discarded after reworking processing; RCkm: Rework cost at the k workstation; TC: Total cost of manufacturing parts.
4.4. Work flow analysis
Flow constraints consider the number of conforming parts departure a workstation or inspection location, and the number of defective parts entering a following workstation or inspection location. The following equation is represented the first stage.
)( 11 Z1QNG −= (1) For all other stations the equation is defined recursively as follows:
)1(*]*)1(*[ 1)1(1)1(1 kkmkkmkkk ZNRNDNGNG −++−= −−−−− βα (2)
The number of defective parts produced at first a workstation is: 11 * ZQND = (3) For all other stations, it is:
kkmkkmkkk ZNRNDNGND *]))1(*(*[ 1)1(1)1(1 −−−−− +−+= βα (4)

The number of parts classified as defective by inspection station m after workstation k but can be repaired is given by: )(* kmkkmkk 1NDNGNR βα −+= (5)
5. Cost model analysis
5.1. Expected manufacturing cost
This cost is assumed to be a sum of the material cost, overhead cost, and setup cost. The number of parts processed at station k is the sum of the number of parts correctly classified as conforming parts flowing into station k from the earlier process station and the number of defective parts incorrectly classified as conforming parts flowing into station k from the previous process station. Hence, the manufacturing cost (MCk) is defined as follows: k1k1k1k1kk VND1NGMC *]*)(*[ −−−− +−= βα (6) In the case where no inspection station is performed, 1−kα = 0 and 1−kβ = 1. Thus:
kkkk VNDNGMC *][ 11 −− += (7)
5.2. Expected inspection cost
Inspection cost is consists of sum of the fixed cost and variable cost. The fixed cost is sum of the costs connected with test-equipment installation, setup, calibration, etc. The variable cost is the total number of conforming parts and the number of defective parts produced at station k multiplied by the inspection cost for carrying out of 100 % item-by-item inspection of incoming batches. Therefore, the total inspection cost is given by: kmkkkmkm INDNGFCTIC *)][( ++= (8) 5.3. Internal failure cost The internal failure cost is the sum of reworking cost and scrap cost. � Reworking cost This is the cost of reworking a nonconforming part identified at an inspection station. At each inspection station the nonconforming parts can be scrapped, sent back for repair or incorrectly classified as conformed parts. The number of parts as nonconforming but repairable are given by:
mkmkkmkkm 1NDNGNR ∆βα *)](*[ −+= (9)
Then the rework cost is: )*(*)( kkkmkm VgNRRC = (10)
The rework parts may be incurred defects on subsequent processing as they did in the original process.
kkmkm NRNRS Ε*= (11)
� Scrap cost
This expression represents the number of non-repairable items produced at k station on detection subsequent m inspection stage.
)(* kmkkmkk 1NDNGNS βα −+= (12)
The scrap cost is: kkkm xNSSC *= (13)
Also the scrap cost that may result from a subsequent reworking process is given by:

kkmkm xNRSRSC *= (14) Then the internal failure cost is given by:
kmkmkmkm RCRSCSCIFC ++= (15)
5.4. External failure cost
This is the cost incurred after the products have been sold to customers. Examples include the cost of replacement and repair. External failure cost (EFC), is the sum of the product of the number of defective parts replaced at the customer’s end (W * kND ), the sale price (P) of the part and the sum of the product of the number of defective parts repaired at the customer’s end (1 - W) and the direct cost of materials to repair a defective unit (Y).
Υ**)(** kk NDW1PNDWEFC −+= (16)
The inspection screen is applied to all parts processed in workstation if an inspection operation is performed, otherwise:
kmI = kα = m∆ = 0 and kβ = 1.0
The total cost (TC) of processing and inspection of Q parts in an n-stage serial manufacturing system is given by the following equation:
)(1�
=
+++=n
kkmkk EFCICMCIFCTC (17)
The sum of the total cost of processing and inspecting the parts produced in the manufacturing system is expressed as the total system cost TC. The objective function for the inspection station allocation and assignment problem for a manufacturing system producing parts is expressed as follows: �
=
=n
1k
TCTCMinimise (18)
In this paper, the objective function is constrained by time of inspection to reduce number of inspection plans and to maintain the nominal production rate. General time equation involves inspecting all parts plus set-up time at inspection station m in the manufacturing system. The constraints are the following:
mmkkm tssfnNDNGIT ++≤ *][ (19)
�=
≤n
kk NIq
1
(20)
Equation (20) shows that there is limited number of inspection stations. The allocation of quality inspection station problem grows exponentially with the number of workstations. For example, in a 21 workstation, there are more than 2,000,000 (M=2n) ways to locate inspection positions and select a capable inspection station. Assume C consists of all assignment location combinations, then: )],...,...),...(,...,...),...(,...,...[( 111111 nMkmMnmkmmnk XXXXXXXXXC = If workstation k should be screened by an inspection station m, then Xkm=1, otherwise Xkm= 0. A possible allocation plan among the lowest expected sum cost can then be determined after reconsidering every assignment location combination. As shown in Figure 3 the processing time to solve the problem exponentially grows with increased number of workstation (WS). The experimental data were approximated using exponential regression model which has shown correlation r = 0.99 and the coefficient of the determination is r2 = 0.99 see equation (21).
)87.0(0003.0 WSeTime = (21)
For example, using equation (21), the duration of computation for 20 workstations is expected to be 180 hours. Therefore, it is impractical to allocate inspection places by using EM. In order to find a
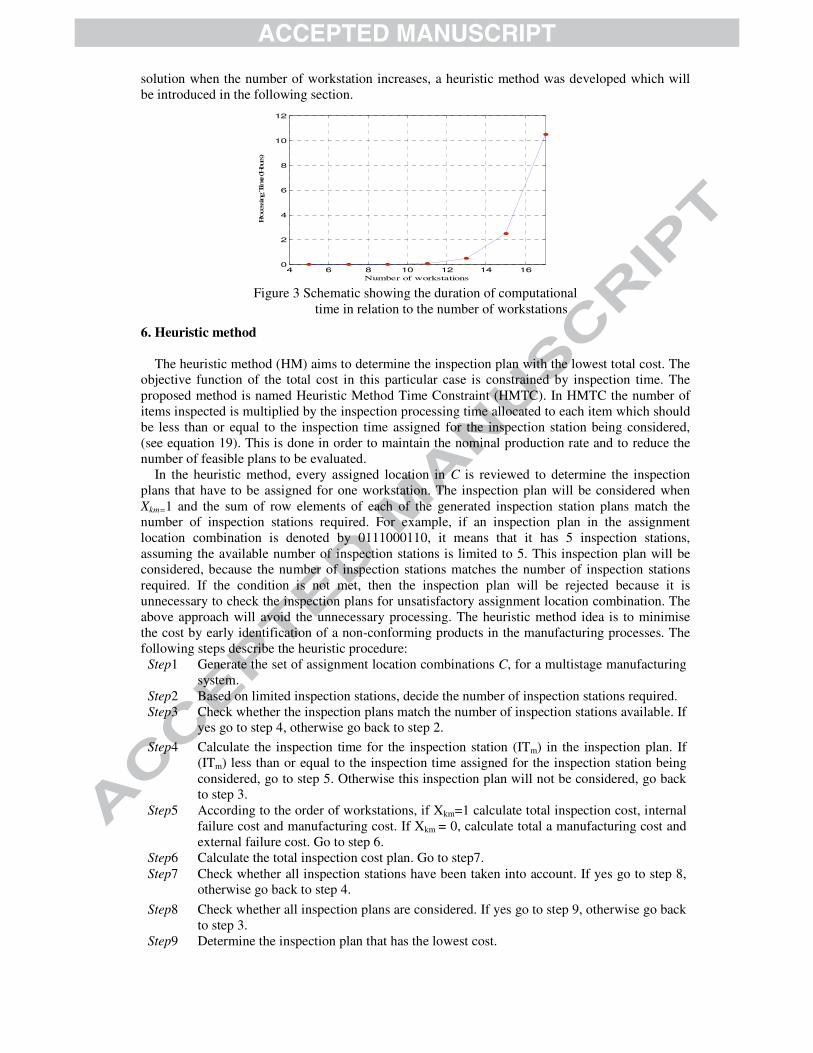
solution when the number of workstation increases, a heuristic method was developed which will be introduced in the following section.
4 6 8 10 12 14 160
2
4
6
8
10
12
Number of workstations
Proc
essing
Tim
e (H
ours)
Figure 3 Schematic showing the duration of computational
time in relation to the number of workstations
6. Heuristic method The heuristic method (HM) aims to determine the inspection plan with the lowest total cost. The objective function of the total cost in this particular case is constrained by inspection time. The proposed method is named Heuristic Method Time Constraint (HMTC). In HMTC the number of items inspected is multiplied by the inspection processing time allocated to each item which should be less than or equal to the inspection time assigned for the inspection station being considered, (see equation 19). This is done in order to maintain the nominal production rate and to reduce the number of feasible plans to be evaluated. In the heuristic method, every assigned location in C is reviewed to determine the inspection plans that have to be assigned for one workstation. The inspection plan will be considered when Xkm=1 and the sum of row elements of each of the generated inspection station plans match the number of inspection stations required. For example, if an inspection plan in the assignment location combination is denoted by 0111000110, it means that it has 5 inspection stations, assuming the available number of inspection stations is limited to 5. This inspection plan will be considered, because the number of inspection stations matches the number of inspection stations required. If the condition is not met, then the inspection plan will be rejected because it is unnecessary to check the inspection plans for unsatisfactory assignment location combination. The above approach will avoid the unnecessary processing. The heuristic method idea is to minimise the cost by early identification of a non-conforming products in the manufacturing processes. The following steps describe the heuristic procedure:
Step1 Generate the set of assignment location combinations C, for a multistage manufacturing system.
Step2 Based on limited inspection stations, decide the number of inspection stations required. Step3 Check whether the inspection plans match the number of inspection stations available. If
yes go to step 4, otherwise go back to step 2. Step4 Calculate the inspection time for the inspection station (ITm) in the inspection plan. If
(ITm) less than or equal to the inspection time assigned for the inspection station being considered, go to step 5. Otherwise this inspection plan will not be considered, go back to step 3.
Step5 According to the order of workstations, if Xkm=1 calculate total inspection cost, internal failure cost and manufacturing cost. If Xkm = 0, calculate total a manufacturing cost and external failure cost. Go to step 6.
Step6 Calculate the total inspection cost plan. Go to step7. Step7 Check whether all inspection stations have been taken into account. If yes go to step 8,
otherwise go back to step 4. Step8 Check whether all inspection plans are considered. If yes go to step 9, otherwise go back
to step 3. Step9 Determine the inspection plan that has the lowest cost.

7. Case study and discussion
The following simulation experiment was conducted when measuring the time used by the heuristic method to find the best positions for inspection stations. A multistage manufacturing system model with 10 workstations with different parameters arranged in a serial manner was used to allocate 5 inspection stations as shown in Table 3. The batch size used in the experiment was 100. The parameters were randomly generated using a uniform random number generator to evaluate the processing time efficiency. It was found that the heuristic method (HM) and the one with time constraint (HMTC) have better processing time efficiency than that in the EM. Table 3- Performance parameters
Performance parameters
Range
fnm 4-7 Vk 85-180 Zk 0.09-0.18 Ikm 60-120
kα 0.03-0.07 kβ 0.03-0.07 k∆ 0.05-0.09
xk 85-120 Table 4 shows that HMTC can reduce the number of inspection plans down to 88.57% whereas HM can reduce them down to 75.39%. Table 4 shows that the HMTC and HM can produce the optimal solution. However, the cost deviation respectively is only 0.03 and 0.01. On the other hand, the HM still has a bigger savings (75.63%) in terms of processing time than that of the HMTC. Therefore, it can be concluded that the HM can be applied when multistage manufacturing system incorporates more workstations. Table 4 - Performance of the HM in comparison to EM
A
Method
Number of
inspection plans
considered
Time processing (seconds)
Reducing inspection
plans
Saving Time %
Total cost
Cost deviation
100)1( −BA
HM HMTC
HM 252 31.2 75.39% 75.63% 367126 EM 0.03 0.01
HMTC
117
36.1
88.57%
71.80%
362619 HM
EM
1024
128
355589
B
HMTC
8. Conclusions 1. There is a need for a generalised (composite) model addressing all the similar inspection
allocation scenarios. The model can serve as a methaheuristic that will be used to select an appropriate heuristic or algorithm for the solution of a particular of allocation of quality control stations (AQCs) problem.
2. The simulation experiment has shown that computational time increases significantly when the number of workstations is more than 20.
3. The majority of the papers reviewed in this research analytical consider models with limited number of work stations between 3 and 5 which is insufficient in practical situations.
4. The review shown that the inspection allocation problem has been studied comprehensively using variety of analytical and Monte Carlo simulation methods rather than combination of both simulation techniques in a simulation-optimisation framework.
References

Bai, D. & Yun, H. (1996). Optimal allocation of inspection effort in a serial multi-stage production system, Computers Industrial Engineering, 30(3), 387-396.
Ballou, D.P., & Pazer, H.L. (1982). The impact of inspector fallibility on the inspection policy in serial production systems, Management Science, 28(4), 387-399.
Ballou, D.P., & Pazer, H.L. (1985). Process improvement versus enhanced inspection in optimised systems, International Journal of Production Research, 23(6), 1233-1245.
Barad, M. (1990). A break even quality level a approach to location of inspection station in a multi-stage production process, International Journal of Production Research, 28(1), 29-45.
Chen, J.D. Yao, D., & Zheng, S. (1998). Quality control for products supplied with warranty, Operations Research, 46(1), 107-115.
Chen, T. (1999). Quantitative selection of inspection plans. MSc. thesis. Massachusetts, Massachusetts Institute of Technology.
Chengalur, I.N., Ballou, D.P., & Pazer, H.L. (1992). Dynamically determined optimal inspection strategies for serial production process, International Journal of Production Research, 30(1), 169-187.
Clark, H.J., & Tannock, J.D.T. (1999). The development and implementation of a simulation tool for the assessment of quality economics within a cell-based manufacturing company, International Journal of Production Research, 37(5), 979-95.
Crostack, H., Höfling, M., & Liangsiri, J. (2005). Simulation in quality management an approach to improve inspection planning, Acta Polytechnica, 45(3), 10-16.
Deliman, C.N., & Feldman, M.R. (1996). Optimization of process improvement and inspection location for serial manufacturing, International Journal of Production Research, 34(2), 395-405.
Emmons, H. & Rabinowitz, G. (2002). Inspection allocation for multistage deteriorating production systems, IIE Transactions, 34,1034-1041.
Enrick, N.L. (1975). Towards optimization of inspection allocation Part I and II, Industrial Management, 17(4), 7–11.
Eppen, G.D., & Hurst, G.E. (1974). Optimal location of inspection station in a multi-stage production process, Management Science, 20(8), 1194-1200.
Estrop, S.J., Kaye, M.M., & Nevell, T.G. (1992). The use of computer simulation in implementing a manufacturing process quality modelling system, International Journal of Quality and Reliability Management, 9(7), 7-16.
Finkelshtein, A., Herer, T.Y., Raz, T., & Ben-gal, I. (2005). Economic optimization of off-line inspection in a process subject to failure and recovery, IIE Transactions, 37, 995–1009.
Freiesleben, J. (2006). Costs and benefits of inspection systems and optimal inspection allocation for uniform defect propensity, International Journal of Quality & Reliability Management, 23(5), 547-563.
Galante, G. & Passannanti, G. (2007). Integrated approach to part scheduling and inspection policies for a job shop manufacturing system, International Journal of Production Research, 45(22), 5177-5198.
Gardner, L.L., Grant, M.E., & Rolston, L.J. (1995). Using simulation to assess costs of quality, in Alexopoulos, C. Kang, K. Lilegdon, R. and Goldsman, D. (Eds), Proceedings of the Winter Simulation Conference, Arlington, VA, IEEE Press, Piscataway, NJ, 945-951
Gunter, I.S., & Swanson, A.L, (1985). Inspector location in convergent production units, International Journal of Production Research, 23(6), 1153-1169.
Hadjinicola, C.G., & Soteriou, C.A. (2003). Reducing the cost of defects in multistage production systems: a budget allocation perspective, European Journal of Operational Research, 145(3), 621–634.
Hsu, S.J. (1984). A hybrid inspection system for the multistage production process, International Journal of Production Research, 22(1), 63-69.
Jang, W., & Shanthikumar, J.G. (2002). Stochastic allocation of inspection capacity to competitive processes, Naval Research Logistics, 49(1), 78-94.
Jewkes, M.E. (1995). Optimal inspection effort and scheduling for a manufacturing process with repair, European Journal of Operational Research, 85(2), 340-351.
Kakade, V., Valenzuela, J., & Smith, J. (2004). An optimization model for selective inspection in serial manufacturing systems, International Journal of production Research, 42(18), 3891-3909.
Kang, KS., Ebeling, A.K., & La, S. (1990). The optimal location of inspection stations using a rule-based methodology, Computer and Industrial Engineering, 19(1-4), 272-275.
Kim, J., & Gershwin, B.S. (2008). Analysis of long flow lines with quality and operational failures, IIE Transactions, 40, 284–296.
Kogan, K., & Raz, T. (2002). Optimal allocation of inspection effort over a finite planning horizon, IIE Transactions, 34, 515-527.
Langner, A., Montgomery, D., & Carlyle, W. (2002). Solving a multi-stage partial inspection problem using genetic algorithms, International Journal of Production Research, 40(8), 1923-1940.
Lee, J., & Chen, F.F. (1996). Inspection sequencing and part scheduling for flexible manufacturing systems, European Journal of Operational Research, 95(2), 344–355.
Lee, J. and Unnikrishnan, S. (1998). Planning quality inspection operations in multistage manufacturing systems with inspection errors, International Journal of Production Research, 36(1), 141-155.

Lindsay, G.F., & Bishop, A.B. (1964). Allocation of screening inspection effort a dynamic programming approach, Management Science, 10(2), 342-352.
Mandroli, S. Shrivastava, K. and Ding, Y. (2006). A survey of inspection strategy and sensor distribution studies indiscrete-part manufacturing processes, IIE Transactions, 38, 309-328.
Menipaz, E. (1978). A taxonomy of economically based quality control procedures, International Journal of Production Research, 16 (2), 153–167.
Montgomery, D.C. (1997). Introduction to statistical quality control, 3rd ed., New York, John Wiley & Sons. Narahari, Y., & Khan, L.M. (1996). Modelling re-entrant manufacturing systems with inspection stations,
Journal of Manufacturing Systems, 15(6), 367–378. Park, H.Y., Park, H.E., & Ntuen, A.C. (1988). A study for optimal inspection policies in a flexible
manufacturing cell, Computer and Industrial Engineering, 15(1-4), 307-314. Penn, M., & Raviv, T. (2007). Optimising the quality control station configuration, Naval Research
Logistics, 54(3), 301-314. Penn, M., & Raviv, T. (2008). A polynomial time algorithm for solving a quality control station
configuration problem, Discrete Applied Mathematics, 156(4), 412-419. Peters, M.H., & Williams, W.W. (1984) Location of quality inspection stations: an experimental assessment
of five normative heuristics, Decision Sciences, 15(3), 389-408. Pruzan, P.M., & Jackson, J.T.R. (1967). A dynamic programming application in production line inspection,
Techno-metrics, 9(1), 73-81. Raghavachari, M., & Tayi, G. (1991). Inspection configuration and reprocessing decisions in serial
production systems, International Journal of Production Research, 29(5), 897-911. Rau, H., & Chu, YH. (2005). Inspection allocation planning with two types of workstation WVD and WAD,
International Journal of Advanced Manufacturing Technology, 25(9), 947-953. Rau, H. Chu, YH., & Cho, KH. (2005). Layer modelling for the inspection allocation problem in re-entrant
production systems, International Journal of Production Research, 43(17), 3633-3655. Raz, T. (1986). A survey of models for allocating inspection effort in multistage production system, Journal
of Quality Technology, 18(4), 239-247. Raz, T., & Bricker, D. (1987). Sequencing of imperfect inspection operation subject to constraints on the
quality of accepted and rejected units, International Journal of Production Research, 25(6), 809-821. Raz, T., Herer, Y.T., & Grosfeld-Nir, A. (2000). Economic optimization of off-line inspection, IIE
Transactions, 32, 205–217. Raz, T., & Kaspi, M. (1991). Location and sequencing of imperfect inspection in serial multi-stage
production systems, International Journal of Production Research, 29(8), 1645-1659. Rebello, R., Agnetis, A., & Mirchandani, P.B. (1995). Specialized inspection problems in serial production
systems, European Journal of Operational Research, 80(2), 277-296. Sadegheih, A. (2007). Sequence optimization and design of allocation using GA and SA, Applied
Mathematics and Computation, 186(2), 1723-1730. Saxena, S., Chang, C.M., Chow, H.B., & Lee, J. (1990). Evaluation of heuristics for inspection station
allocation in serial production systems, Proceedings of the 1990 Winter Simulation Conference, 919-922.
Siemiatkowski, M., & Przybylski, W. (2006). Simulation studies of process flow with in-line part inspection in machining cells, Journal of Materials Processing Technology, 171(1), 27–34.
Shiau, YR. (2002). Inspection resource assignment in a multi-stage manufacturing system with an inspection error model, International Journal of Production Research, 40(8), 1787-1806.
Shiau, YR. (2003a). Inspection allocation planning for a multiple quality characteristics advanced manufacturing technology, International Journal of Advanced Manufacturing Technology, 21(7), 494-500.
Shiau, YR. (2003b). Quick decision-making support for inspection allocation planning with rapidly changing customer requirements, International Journal of Advanced Manufacturing Technology, 22(9-10), 633-640.
Shiau, YR., Lin, MH., & Chung, WC. (2007). Concurrent process inspection planning for a customized manufacturing system based on genetic algorithm, International Journal Advanced manufacturing Technology, 33(7-8), 746-755.
Taneja, M. & Viswanadham, N. Inspection allocation in manufacturing systems a genetic algorithm approach In Proceedings of the 1994 IEEE California International Conference on Robotics and Automation, (San Diego, California, 8-13 May). 3537-3542.
Tannock, J.D.T. (1995). Choice of inspection strategy using quality simulation, International Journal of Quality & Reliability Management, 12(6), 75-84.
Tannock, J.D.T. (1997). An economic comparison of inspection and control charting using simulation, International Journal of Quality & Reliability Management, 14(7), 687-99.
Tannock, J. and Saelem, S. (2007). Manufacturing disruption costs due to quality loss, International Journal of Quality & Reliability Management, 24(3), 263-278.
Tayi, G.K., & Ballou, D.P. (1988). An integrated production inventory model with reprocessing and inspection, International Journal of production Research, 26(8), 1299-1315.
Valenzuela, F.J., Smith, S.J., & Evans, S.J. (2004). Allocating solder-paste printing inspection in high volume electronics manufacturing, IIE Transactions, 36, 1171–181.
Van Volsem, S., Dullaert, W., & Van landeghem, H. (2007). An evolutionary algorithm and discrete event simulation for optimising inspection strategies for multi-stage processes, European Journal of Operational Research, 179(3), 621-633.
White, L.S. (1965). The analysis of a simple class of multi-stage inspection plans, Management Science, 12, (9), 685-693.
White, L.S. (1969). Shortest route models for the allocation of inspection effort on production line, Management Science, 15(5), 249-259.
Yao, D.D., & Zheng, S. (1999). Sequential inspection under capacity constraints, Operations Research, 47(3), 410-422.
Yum, J.B., & McDowell, D.E. (1987). Optimal inspection policies in serial production system including scrap rework and repair: An MILP approach, International Journal of Production Research, 25(10), 1451-1464.