Aix Marseille Université
224
Aix Marseille Universit´ e Th` ese de Doctorat ED352 Physique et Sciences de la Mati` ere Centre Interdisciplinaire de Nanoscience de Marseille (CINaM)/AMU-CNRS, UMR 7325 Th` ese pr´ esent´ ee pour obtenir le grade universitaire de docteur Discipline : Biophysique Ranime Alameddine Nanostructuration bio-chimique de substrats mous pour l’´ etude de l’adh´ esion et de la m´ ecanique cellulaire. Nano-patterning soft substrates with bio-chemically contrasted nano-dots to study cell adhesion and mechanics. Soutenue le 09/12/2016 devant le jury : Composition du Jury: Manuel Thery CEA Rapporteur Christophe Vieu Universit´ e de Toulouse Rapporteur Helene Delanoe Ayari ILM Membre de jury Olivier Margeat CINaM Membre de jury Rudolf Merkel IHRS BioSoft Membre de jury Anne Charrier CINaM Directrice de th` ese Kheya Sengupta CINaM Directrice de th` ese
-
Upload
khangminh22 -
Category
Documents
-
view
0 -
download
0
Transcript of Aix Marseille Université

Aix Marseille Universite
These de Doctorat
ED352 Physique et Sciences de la Matiere
Centre Interdisciplinaire de Nanoscience de Marseille (CINaM)/AMU-CNRS, UMR 7325
These presentee pour obtenir le grade universitaire de docteur
Discipline : Biophysique
Ranime Alameddine
Nanostructuration bio-chimique de substrats mous pour l’etude de
l’adhesion et de la mecanique cellulaire.
Nano-patterning soft substrates with bio-chemically contrasted
nano-dots to study cell adhesion and mechanics.
Soutenue le 09/12/2016 devant le jury :
Composition du Jury:
Manuel Thery CEA Rapporteur
Christophe Vieu Universite de Toulouse Rapporteur
Helene Delanoe Ayari ILM Membre de jury
Olivier Margeat CINaM Membre de jury
Rudolf Merkel IHRS BioSoft Membre de jury
Anne Charrier CINaM Directrice de these
Kheya Sengupta CINaM Directrice de these

Cette oeuvre est mise a disposition selon les termes de la Licence Creative Commons Attri-
bution - Pas d’Utilisation Commerciale - Pas de Modification 3.0 France.

Resume
Durant les dernieres decennies, de plus en plus de types de cellules se sont revelees capables de
sonder leur environnement mecanique par l’application de forces par l’intermediaire de proteines
d’adhesion sur leur surface. Ce phenomene appele “Mecanosensing” est lie a l’adhesion et
la mecanique cellulaire, et est souvent etudie grace a l’interaction des cellules avec des sub-
strats artificiels. Mecanosensing devient un domaine de recherche en pleine emergence, grace
au developpement de techniques experimentales permettant de changer l’elasticite de la matrice
et de mesurer precisement les interactions cellules-substrats. Dans des etudes distinctes, les
technologies de bio-nanostructuration ont fourni des outils pour mimer l’etat physiologique et
pathologique des cellules ainsi que pour les manipuler. Des surfaces chimiquement structurees
avec une repartition des ligands specifiques ont montre une forte influence sur l’adhesion et la
mecanique cellulaire. Cependant, la relation entre les deux phenomenes n’a pas ete beaucoup
exploree, en partie parce que la fonctionnalisation de substrats mous s’est revelee etre un defi
technique.
Pour resoudre ce probleme, nous avons developpe une technique simple et rentable nommee “re-
verse contact printing”, afin de fabriquer des plots de proteines sub-microniques sur un elastomere
d’elasticite controlee, le polydimethylsiloxane (PDMS). Pour cela, des substrats de verre sont
d’abord chimiquement fonctionnalises par des molecules arrangees de facon controlee sur la sur-
face (proteines), en utilisant la technique de colloidal bead self-assembly. Le motif est ensuite
transfere sur la surface d’une couche de PDMS uniforme supportee sur une lame de verre en
amenant les deux surfaces en contact. Apres separation, le motif de proteines est transfere a la
surface du PDMS. La technique a ete validee pour differents types de proteines (Bovine serum
albumine (BSA), biotine-BSA et neutravidine), ainsi que pour differents types de PDMS (Sylgard
184, Q gel 920 et CY52-276) d’elasticite allant de 3 kPa a 7 MPa. Mon travail de these a focalise
sur la standardisation et la comprehension du procede de transfert. Nous avons montre que le
greffage d’une espece moleculaire, telle qu’un fluorophore, sur la proteine a transferer, ainsi que
la nature chimique de la surface du PDMS peuvent influencer fortement le succes du transfert.
Le degre d’hydrophobicite, ainsi que la presence de groupes ioniques a la fois sur l’elastomere
et la proteine sont des facteurs moleculaires importants qui regissent le transfert. A l’aide de
mesures de forces realisees par AFM nous avons mesure l’elasticite du PDMS, ainsi que les forces
de cohesion et d’adhesion effectives impliquees dans le processus. Nous avons identifie que la
reussite du reverse contact printing technique est facilitee par le greffage de groupes chimiques
3

appropries sur la proteine, et depend du traitement de la surface du PDMS ainsi que de son
elasticite. Nous avons egalement etudie l’adhesion cellulaire avec des lymphocytes-T sur des
surfaces de PDMS d’elasticite variable. Nous avons montre que contrairement a la plupart des
autres types de cellules, les cellules-T s’etalent davantage sur substrat mou (5 et 140 kPa) que
sur dur (2 MPa), sur la gamme de durete etudiee. Finalement nous avons realise des experiences
pilotes d’adhesion cellulaire sur PDMS structure, que nous comparons a d’autres realisees sur du
verre structure et sur surfaces de PDMS fonctionnalisees de maniere homogene.

Abstract
In the past decade, more and more types of cells have been shown to be capable of probing the
mechanics of their environment by application of forces through adhesion proteins on their sur-
face. This phenomenon called “Mechanosensing”, is related to cell adhesion and mechanics, and
is often studied through interaction of cells with well-defined artificial substrates. Mechanosens-
ing is becoming a growing domain of research, thanks to the development of novel techniques
where the substrate elasticity can be changed, and the cell-substrate forces can be exactly mea-
sured. In separate studies, bio-nanopatterning technology have delivered tools to closely mimic
the physiological and pathological state of cell as well as to manipulate it. Chemically patterned
surfaces with spatial ligand distribution strongly influences cell adhesion and mechanics. How-
ever, the cross-talk between the two phenomena has not been much explored, partly because
patterned functionalization of soft substrates is a current engineering challenge.
To address this issue, we developed a simple and cost effective technique named “reverse contact
printing” for fabrication of nanometric protein patches on PDMS (polydimethylsiloxane) elas-
tomer of controlled elasticity. Glass substrates are first chemically patterned with large coverage
of nano-scale protein dots via colloidal bead self-assembly. The pattern is then transferred to
the surface of a flat PDMS layer supported on a glass cover-slide by bringing the surfaces in
to conformal contact. After separation, the protein pattern is transferred to the PDMS sur-
face. The technique was validated for different types of proteins (Bovine serum albumin (BSA),
biotin-BSA and neutravidin), and for different types of PDMS (Sylgard 184, CY52-276 and Q gel
920), of elasticity ranging from 3kPa to 7MPa. My PhD work mainly consisted of deciphering
the molecular mechanism that underlie this technique. We have shown that the rate of trans-
fer crucially depends on the molecular groups on the protein, and on the nature of the PDMS
surface. The degree of hydrophobicity as well as presence of ionic groups on both the elastomer
and the protein are important molecular factors that govern the transfer. We used atomic force
microscopy (AFM) force measurements to measure PDMS elasticity, as well as protein-substrate
interactions to understand the molecular mechanism governing the transfer process. We have
identified that a successful reverse transfer is facilitated by the grafting of appropriate chemical
groups on the protein, and depends on the PDMS surface treatment and elasticity. In addition,
we studied adhesion and mechanics of T- lymphocytes on PDMS of varying elasticity. We found
that surprisingly, T-lymphocytes spread more on softer (5 and 140 kPa) than on harder (2 MPa)
PDMS. In on-going pilot experiments, cells on patterned soft PDMS are compared to those on
5

patterned glass or homogeneous PDMS surfaces.
Remerciements
Je remercie avant tout la France pour la grande opportunite qu’elle m’a offerte de poursuivre
mes etudes et realiser ma vie; ce pays qui offre la culture, des possibilites d’etudes et de travail,
plus que n’importe quel autre pays au monde.
Je tiens a remercier tous ceux qui m’ont aide dans la realisation de ma these. Il me serait
impossible de terminer cette phase de ma vie sans le soutien et l’amitie de tous les gens que j’ai
rencontre le long du chemin.
Je tiens a remercier Claude Henry et Frederic Fages, de m’avoir accepte au sein de leur lab-
oratoire, et qui m’ont fourni une atmosphere amicale, cooperative et riche en savoir scientifique.
Je remercie egalement les directeurs de l’ecole doctorale, Mossadek Talby et Conrad Becker.
Je tiens a remercier les membres du jury, Dr. Helene Ayari Delanoe, Dr. Olivier Margeat,
Pr. Rudolf Merkel, Dr. Manuel Thery et Pr. Chritophe Vieu pour leur interet dans mon travail.
Des remerciements pour tous les collaborateurs qui ont contribue a la realisation de mon
travail de these: Pierre Henri Puech et Laurent Limozin pour les mesures d’elasticite cellulaire,
Nathalie Ferte pour les mesures d’angle de contact, Igor Ozerov, Frederic Bedu ainsi que Romain
Jeanette pour l’aide technique en salle blanche.
Je serais negligente si je ne remerciait pas Delphine Simon, Valerie Juvenal et Michele Francia
pour leur assistance si necessaire aux taches administratives. De meme Bruno Gely qui a fourni
un soutien immediat pour tous les problemes informatiques que nous avons rencontre.
Des remerciements tous particuliers a Fuwei Pi, pour ses conseils, pour toutes les discussions
scientifiques que nous avons echange ensemble et pour son amitie. J’ai gagne beaucoup de ses
connaissances et sa curiosite scientifique.
Un grand merci a Astrid Wahl pour son aide precieuse pour les experiences avec les cellules,
pour les nombreuses discussions, pour partager genereusement et avec patience ses connaissances
ainsi que pour sa belle amitie.
Je voudrais egalement remercier Kaoutar Bouzalmate, que j’ai eu l’occasion de diriger et qui
sans relache et avec beaucoup d’enthousiasme a aborde un projet difficile au cours de plusieurs
mois.
Mes meilleurs remerciements a mes amis et collegues Emmanuelle, Scott, Ahmad, Pierre,
Aya, Priya, Arif, Cecile, Jack, et Kamel pour la recherche que nous avons fait ensemble, pour
des temps extraordinaires. C’etait un grand plaisir de les rencontrer tous.
Merci Evelyne pour ton beau sourire, et pour la musique que nous avons partage ensemble.
Je tiens a remercier tous les membres du laboratoire avec qui j’ai discute et echange des
7

moments etonnants: Emmanuelle Helfer, Annie Viallat, Sebastien Lavandier, Didier Tonneau,
Dominique Chatain, Carole Fauquet, Thomas Leoni, Victoria Tishkova et Daniel Campese.
Je voudrais egalement remercier le departement de chimie. Mes remerciements speciaux sont
dedies a Gilles Quelever et Olivier Margeat, qui m’ont initie au metier d’enseignant, et partage
avec moi leurs experiences.
Je suis chanceuse d’avoir rencontre Herve et Michelle Dallaporta. Avec eux je me suis sentie
comme avec une seconde famille. Je tiens a les remercier profondement pour leur hospitalite,
chaleur, amour et leur tendresse.
Je suis profondement reconnaissante a ma famille. D’abord et avant tout, je voudrais re-
mercier maman et papa, pour leurs amour infini et pour leurs sacrifices. Ils ont ete toujours fiers
de moi pour chaque pas et chaque choix que j’ai pu faire. Je remercie aussi ma sœur et mes
freres qui ont toujours cru en moi et m’ont toujours pousse a aller plus haut.
Finalement, un profond merci pour mes directrices de these, Kheya Sengupta et Anne Char-
rier. Je vous remercie pour l’aide que vous m’avez apporte dans la construction de cette these et
de ma vie, pour vos soins, attentions, temps, chaleur, encouragement et votre longue patience.
Vous vous etes comportees comme mes propres sœurs. Vous serez pour toujours inoubliable. Je
vous serez reconnaissante pour toute ma vie.

Contents
1 Introduction 23
1.1 Cells . . . . . . . . . . . . . . . . . . . . . . . . . . . . . . . . . . . . . . . . . . . 24
1.1.1 General concepts . . . . . . . . . . . . . . . . . . . . . . . . . . . . . . . . 24
1.1.2 Cell Adhesion . . . . . . . . . . . . . . . . . . . . . . . . . . . . . . . . . . 26
1.1.3 Surface Roughness Effect on Cell Adhesion . . . . . . . . . . . . . . . . . 29
1.1.4 Cells Adhesion on Chemically Patterned Substrates . . . . . . . . . . . . 29
1.1.5 Cell Mechanics . . . . . . . . . . . . . . . . . . . . . . . . . . . . . . . . . 32
1.2 Immune Cells . . . . . . . . . . . . . . . . . . . . . . . . . . . . . . . . . . . . . . 35
1.2.1 The Immune System . . . . . . . . . . . . . . . . . . . . . . . . . . . . . . 35
1.2.2 Antigen Presenting Cell . . . . . . . . . . . . . . . . . . . . . . . . . . . . 36
1.2.3 T-Lymphocytes . . . . . . . . . . . . . . . . . . . . . . . . . . . . . . . . . 38
1.2.4 T lymphocyte/APC interface . . . . . . . . . . . . . . . . . . . . . . . . . 39
1.3 Technology for fabrication of biomimetic surfaces . . . . . . . . . . . . . . . . . . 41
1.3.1 Protein Adsorption to Biomaterials . . . . . . . . . . . . . . . . . . . . . . 41
1.3.2 Chemical Patterning . . . . . . . . . . . . . . . . . . . . . . . . . . . . . . 41
1.3.3 Soft substrates . . . . . . . . . . . . . . . . . . . . . . . . . . . . . . . . . 54
1.3.4 Polymers . . . . . . . . . . . . . . . . . . . . . . . . . . . . . . . . . . . . 54
1.4 Thesis outline . . . . . . . . . . . . . . . . . . . . . . . . . . . . . . . . . . . . . . 57
2 Materials and Methods 59
2.1 Glass substrates . . . . . . . . . . . . . . . . . . . . . . . . . . . . . . . . . . . . 60
2.2 Organosilanes . . . . . . . . . . . . . . . . . . . . . . . . . . . . . . . . . . . . . . 60
2.3 Silicon elastomers/gels . . . . . . . . . . . . . . . . . . . . . . . . . . . . . . . . . 62
2.3.1 Chemistry of PDMS . . . . . . . . . . . . . . . . . . . . . . . . . . . . . . 62
2.3.2 Preparation of the PDMS layers . . . . . . . . . . . . . . . . . . . . . . . 64
2.3.3 Chemical Structure of PDMS . . . . . . . . . . . . . . . . . . . . . . . . . 65
2.3.4 Plasma treatment of PDMS . . . . . . . . . . . . . . . . . . . . . . . . . . 66
2.3.5 PDMS thickness measurement . . . . . . . . . . . . . . . . . . . . . . . . 67
2.3.6 PDMS contact angle measurement . . . . . . . . . . . . . . . . . . . . . . 67
2.4 Poloxamer . . . . . . . . . . . . . . . . . . . . . . . . . . . . . . . . . . . . . . . . 68
2.5 Proteins and fluorophores . . . . . . . . . . . . . . . . . . . . . . . . . . . . . . . 69
2.5.1 Bovine Serum Albumin (BSA) . . . . . . . . . . . . . . . . . . . . . . . . 70
9

2.5.2 Neutravidin-Biotin interaction . . . . . . . . . . . . . . . . . . . . . . . . 70
2.5.3 Anti-CD3 . . . . . . . . . . . . . . . . . . . . . . . . . . . . . . . . . . . . 70
2.5.4 Fluorophores . . . . . . . . . . . . . . . . . . . . . . . . . . . . . . . . . . 71
2.5.5 Fluorofores used . . . . . . . . . . . . . . . . . . . . . . . . . . . . . . . . 72
2.5.6 Fluorophore Coupling . . . . . . . . . . . . . . . . . . . . . . . . . . . . . 74
2.6 Substrates for Cell experiments . . . . . . . . . . . . . . . . . . . . . . . . . . . . 76
2.6.1 Positive control . . . . . . . . . . . . . . . . . . . . . . . . . . . . . . . . . 76
2.6.2 Negative Control . . . . . . . . . . . . . . . . . . . . . . . . . . . . . . . . 76
2.7 Cell Experiments . . . . . . . . . . . . . . . . . . . . . . . . . . . . . . . . . . . . 77
2.7.1 Chamber used for cell experiment . . . . . . . . . . . . . . . . . . . . . . 77
2.7.2 Cell culture and splitting . . . . . . . . . . . . . . . . . . . . . . . . . . . 78
2.7.3 Cell Preparation . . . . . . . . . . . . . . . . . . . . . . . . . . . . . . . . 78
2.7.4 Cell fixation . . . . . . . . . . . . . . . . . . . . . . . . . . . . . . . . . . . 78
2.7.5 Post-fixation labeling . . . . . . . . . . . . . . . . . . . . . . . . . . . . . . 78
2.8 Force Measurement using Atomic Force Microscopy and Spectroscopy . . . . . . 79
2.8.1 AFM Force Spectroscopy . . . . . . . . . . . . . . . . . . . . . . . . . . . 79
2.8.2 Calibration of the cantilever deflection . . . . . . . . . . . . . . . . . . . . 81
2.8.3 Calibration of the Cantilever Spring Constant . . . . . . . . . . . . . . . 82
2.8.4 Force Measurements . . . . . . . . . . . . . . . . . . . . . . . . . . . . . . 84
2.8.5 Young Modulus determination . . . . . . . . . . . . . . . . . . . . . . . . 85
2.8.6 Pull-off force measurements . . . . . . . . . . . . . . . . . . . . . . . . . . 87
2.8.7 Cell elasticity measurements . . . . . . . . . . . . . . . . . . . . . . . . . . 89
2.8.8 Imaging with Atomic force microscopy . . . . . . . . . . . . . . . . . . . . 89
2.9 Optical Microscopy . . . . . . . . . . . . . . . . . . . . . . . . . . . . . . . . . . . 89
2.9.1 Epi-Fluorescence . . . . . . . . . . . . . . . . . . . . . . . . . . . . . . . . 89
2.9.2 Total internal reflection fluorescence Microscopy (TIRF-M) . . . . . . . . 91
2.9.3 Reflection Interference contrast Microscopy (RICM) . . . . . . . . . . . . 93
2.10 Image analysis . . . . . . . . . . . . . . . . . . . . . . . . . . . . . . . . . . . . . 95
2.10.1 Analysis of the protein nano-dots images . . . . . . . . . . . . . . . . . . . 95
2.10.2 Analyses of cell adhesion area . . . . . . . . . . . . . . . . . . . . . . . . . 97
3 Patterning Protocol 99
3.1 Fabrication of pattern on glass master . . . . . . . . . . . . . . . . . . . . . . . . 101
3.1.1 Fabrication of the colloidal bead mask . . . . . . . . . . . . . . . . . . . . 102
3.1.2 Silanization with PFOTS via Vapor Deposition . . . . . . . . . . . . . . . 103
3.1.3 Pluronic grafting and protein patterning . . . . . . . . . . . . . . . . . . . 106
3.1.4 The use of the protein patterned glass substrates . . . . . . . . . . . . . . 110
3.2 Patterning PDMS by Reverse Contact Printing . . . . . . . . . . . . . . . . . . . 110
3.2.1 Preparation of the PDMS layer . . . . . . . . . . . . . . . . . . . . . . . . 110
3.2.2 Surface modification of PDMS . . . . . . . . . . . . . . . . . . . . . . . . 110
3.2.3 Transfer . . . . . . . . . . . . . . . . . . . . . . . . . . . . . . . . . . . . . 111
3.2.4 PDMS controls for T-cell study . . . . . . . . . . . . . . . . . . . . . . . . 112

4 Characterization and Mechanism of the transfer process 113
4.1 Characterization of PDMS substrates . . . . . . . . . . . . . . . . . . . . . . . . . 114
4.1.1 Contact angle measurement on PDMS . . . . . . . . . . . . . . . . . . . . 114
4.1.2 Elasticity measurement . . . . . . . . . . . . . . . . . . . . . . . . . . . . 116
4.1.3 Visco-elastic behavior of PDMS . . . . . . . . . . . . . . . . . . . . . . . . 119
4.2 Observation and characterization of fluorescent protein nano-dots on glass and
PDMS substrates . . . . . . . . . . . . . . . . . . . . . . . . . . . . . . . . . . . . 121
4.2.1 Characterization of nano-patterned glass substrates . . . . . . . . . . . . 121
4.2.2 Transfer of protein nano-patterns from glass to native PDMS surface. . . 125
4.2.3 Transfer of protein nano-patterns from glass to plasma treated PDMS surface135
4.2.4 Transfer of protein nano-patterns from glass to functionalised PDMS surface139
4.3 Transfer on hard and soft Sylgard . . . . . . . . . . . . . . . . . . . . . . . . . . 142
4.4 Poloxamer influence on the transfer and the contrast . . . . . . . . . . . . . . . . 143
4.5 Understanding the transfer process . . . . . . . . . . . . . . . . . . . . . . . . . . 145
4.5.1 Effect of tip functionalization on tip/substrate interaction . . . . . . . . . 145
4.5.2 Pull-off force measurements of fluorescent bBSA on different surfaces . . . 146
4.6 Mecanism of Transfer . . . . . . . . . . . . . . . . . . . . . . . . . . . . . . . . . 152
5 Cells on homogeneous and patterned PDMS 155
5.1 T-Cell on homogeneously functionalized PDMS substrates . . . . . . . . . . . . . 156
5.1.1 Effect of PDMS Elasticity on cellular Adhesion . . . . . . . . . . . . . . . 157
5.1.2 Actin Cytoskeleton organisation, TCR and ZAP-70 distribution . . . . . . 158
5.1.3 Cell elasticity measurements . . . . . . . . . . . . . . . . . . . . . . . . . . 160
5.2 T-Cell ON Patterned Substrate . . . . . . . . . . . . . . . . . . . . . . . . . . . . 162
5.2.1 Average Cell Density . . . . . . . . . . . . . . . . . . . . . . . . . . . . . . 163
5.2.2 Cell Adhesion Area . . . . . . . . . . . . . . . . . . . . . . . . . . . . . . . 164
5.2.3 Actin cytoskeleton and TCR distribution . . . . . . . . . . . . . . . . . . 165
5.3 Discussion . . . . . . . . . . . . . . . . . . . . . . . . . . . . . . . . . . . . . . . . 168
6 Conclusion 171
7 Summary In French 177
7.1 Protocole de transfert . . . . . . . . . . . . . . . . . . . . . . . . . . . . . . . . . 179
7.1.1 Fabrication du pattern de proteine sur verre . . . . . . . . . . . . . . . . . 180
7.1.2 Transfert du pattern sur PDMS . . . . . . . . . . . . . . . . . . . . . . . . 181
7.2 Caracterisation et mecanisme du transfert. . . . . . . . . . . . . . . . . . . . . . . 182
7.2.1 Caracterisation des substrats de PDMS . . . . . . . . . . . . . . . . . . . 182
7.2.2 Observation et caracterisation de pattern de BSA-biotine fluorescent sur
des substrats en verre ou en PDMS . . . . . . . . . . . . . . . . . . . . . . 183
7.2.3 Comprehension du processus de transfert . . . . . . . . . . . . . . . . . . 186
7.3 Cellules sur PDMS fonctionnalise d’une facon homogene ou patterne . . . . . . . 189
7.4 Conclusion . . . . . . . . . . . . . . . . . . . . . . . . . . . . . . . . . . . . . . . 191

A Annexes 197
A.1 Protocols . . . . . . . . . . . . . . . . . . . . . . . . . . . . . . . . . . . . . . . . 197
A.1.1 PDMS Sample Preparation . . . . . . . . . . . . . . . . . . . . . . . . . . 197
Bibliography . . . . . . . . . . . . . . . . . . . . . . . . . . . . . . . . . . . . . . . . . 198

List of Figures
1.1 Schematic representation of the main structural element of a single animal cell. . 24
1.2 Fluid mosaic model of the plasma membrane. . . . . . . . . . . . . . . . . . . . . 25
1.3 Changes in protein conformation and its affect on hydrophilic and hydrophobic
surfaces. . . . . . . . . . . . . . . . . . . . . . . . . . . . . . . . . . . . . . . . . . 28
1.4 Effect of surface structuring on cells. . . . . . . . . . . . . . . . . . . . . . . . . . 30
1.5 Cell-ECM contact area versus cell spreading as a regulator of cell fate. . . . . . . 31
1.6 Schematic representation of different setups for traction force microscopy. . . . . 33
1.7 Scanning electron micrograph image of a rat embryonic fibroblast cell (REF 52)
trying to hang and pull on a micropillar substrate. . . . . . . . . . . . . . . . . . 34
1.8 Antigens are presented on MHC proteins. . . . . . . . . . . . . . . . . . . . . . . 37
1.9 Storage modulus for human monocytes (M), dendritic cells (DC) and macrophages
(MPH). . . . . . . . . . . . . . . . . . . . . . . . . . . . . . . . . . . . . . . . . . 37
1.10 Schematic structure of the αβ TCR complex. . . . . . . . . . . . . . . . . . . . . 38
1.11 Interaction T-cell/APC and immunological synapse formation. . . . . . . . . . . 39
1.12 Interaction between a T-lymphocyte and an APC resulting in the immunologycal
synapse formation. . . . . . . . . . . . . . . . . . . . . . . . . . . . . . . . . . . 40
1.13 Photolitography using positive and negative photoresist. . . . . . . . . . . . . . 43
1.14 Overview of soft lithography process. . . . . . . . . . . . . . . . . . . . . . . . . 44
1.15 Schematic representation of the microcontact printing process. . . . . . . . . . . 46
1.16 Schematic representation of SAM. . . . . . . . . . . . . . . . . . . . . . . . . . . 47
1.17 Schematic representation of NIL process. . . . . . . . . . . . . . . . . . . . . . . 48
1.18 Fabrication of the nanoscale bioarrays chips. . . . . . . . . . . . . . . . . . . . . 49
1.19 Schematic illustration of dip-pen nanolithography. . . . . . . . . . . . . . . . . . 50
1.20 SEM images of micellar monolayer (a-d) and Au nanoclusters arrays after hydrogen
plasma treatments of the corresponding monomicellar films (e-g), prepared from
different block copolymers. . . . . . . . . . . . . . . . . . . . . . . . . . . . . . . 51
1.21 Electroless deposition strategy to increase the nanoparticle sizes. . . . . . . . . . 52
1.22 Schematic illustration of nanosphere lithography. . . . . . . . . . . . . . . . . . . 53
2.1 Silane as a coupling agent. . . . . . . . . . . . . . . . . . . . . . . . . . . . . . . . 60
2.2 Chemical structure of 1H, 1H, 2H, 2H PerFluoroOctyl-TriChloroSilane (PFOTCS). 61
13

2.3 Schematic representation of the reaction between silanol groups of an hydrophilic
glass substrates and trichloro-silane groups of PFOTCS (R= CF3(CF2)5CH2CH2). 61
2.4 Chemical structure of APTES. . . . . . . . . . . . . . . . . . . . . . . . . . . . . 62
2.5 Chemical structure of a siloxane unit. . . . . . . . . . . . . . . . . . . . . . . . . 62
2.6 PDMS chemical formula. . . . . . . . . . . . . . . . . . . . . . . . . . . . . . . . . 63
2.7 Reaction scheme for platinium catalysed PDMS curing. . . . . . . . . . . . . . . 63
2.8 Schematic representation of the spin coating process. . . . . . . . . . . . . . . . . 64
2.9 Chemical structure of different silicone material. . . . . . . . . . . . . . . . . . . 66
2.10 Surface modification of PDMS with plasma treatment. . . . . . . . . . . . . . . . 67
2.11 Chemical structure of Pluronic. . . . . . . . . . . . . . . . . . . . . . . . . . . . . 69
2.12 Principle of fluorescence. . . . . . . . . . . . . . . . . . . . . . . . . . . . . . . . . 71
2.13 Chemical structure of atto 488 dye. . . . . . . . . . . . . . . . . . . . . . . . . . . 72
2.14 Chemical structure of Texas Red dye. . . . . . . . . . . . . . . . . . . . . . . . . 73
2.15 Chemical structure of FITC dye. . . . . . . . . . . . . . . . . . . . . . . . . . . . 73
2.16 NHS ester reaction scheme for chemical conjugation to a primary amine. . . . . . 74
2.17 Illustration of fluorescent labeling of biotin-BSA protein using Atto 488 or TR dye. 75
2.18 Chamber used for cell experiments. . . . . . . . . . . . . . . . . . . . . . . . . . . 77
2.19 Schematic of an Atomic force microscopy system . . . . . . . . . . . . . . . . . . 80
2.20 A typical AFM force-distance curve. . . . . . . . . . . . . . . . . . . . . . . . . . 81
2.21 Calibration against reference cantilever. . . . . . . . . . . . . . . . . . . . . . . . 83
2.22 cantilever alignment. . . . . . . . . . . . . . . . . . . . . . . . . . . . . . . . . . . 83
2.23 Thermal noise analysis. . . . . . . . . . . . . . . . . . . . . . . . . . . . . . . . . 84
2.24 Interaction forces for the Hertz and JKR model. . . . . . . . . . . . . . . . . . . 86
2.25 Principle of pull-off force measurements . . . . . . . . . . . . . . . . . . . . . . . 88
2.26 A simple epi-fluorescence system. . . . . . . . . . . . . . . . . . . . . . . . . . . . 90
2.27 Representation of light propagating through two transparent media with different
refractive indices. . . . . . . . . . . . . . . . . . . . . . . . . . . . . . . . . . . . 92
2.28 Typical experimental set-up and optical path for a standard RIC microscope. . . 94
2.29 Schematic representation of the RICM working principles. . . . . . . . . . . . . . 94
2.30 Manual characterization of the protein nano-dots. . . . . . . . . . . . . . . . . . . 96
2.31 Segmentation of the dots and building of the median dot for quantification of the
dot characteristics. . . . . . . . . . . . . . . . . . . . . . . . . . . . . . . . . . . . 97
2.32 Steps involved in automatic calculation of cell adhesion area. . . . . . . . . . . . 98
3.1 Schematic representation of the fabrication of protein nano-patterns on glass and
soft substrates. . . . . . . . . . . . . . . . . . . . . . . . . . . . . . . . . . . . . . 101
3.2 Steps of the colloidal bead self-assembly on glass substrate. . . . . . . . . . . . . 102
3.3 Optical microscopy (transmission bright-field) image of 2µm silica colloidal bead
mask on glass substrate . . . . . . . . . . . . . . . . . . . . . . . . . . . . . . . . 103
3.4 Schematic set-up of silanization procedure. . . . . . . . . . . . . . . . . . . . . . 104
3.5 Water contact angle measurements on glass substrates. . . . . . . . . . . . . . . . 104
3.6 AFM imaging and analysis, corresponding to the grafting of PFOTCS. . . . . . . 106

3.7 Epi-fluorescence images of protein pattern (Nav-TR) on glass substrate. . . . . . 107
3.8 Epi-fluorescence images of proteins on glass substrate without the pluronic grafting
step. . . . . . . . . . . . . . . . . . . . . . . . . . . . . . . . . . . . . . . . . . . . 107
3.9 AFM images corresponding to the grafting of pluronic on the PFOTCS layer. . . 108
3.10 AFM images corresponding to the protein grafting step. . . . . . . . . . . . . . . 109
3.11 Schematic representation of PDMS surface modification. . . . . . . . . . . . . . . 111
4.1 Droplet contact angle on different PDMS substrate. . . . . . . . . . . . . . . . . 115
4.2 A typical force versus displacement curve on the PDMS (CY (1:1)) surface. . . . 117
4.3 Force-distance curves on glass and different PDMS substrates. . . . . . . . . . . . 118
4.4 Influence of indentation rate on elastic modulus of different PDMS substrates. . . 120
4.5 Force-distance curves on CY (1:2). . . . . . . . . . . . . . . . . . . . . . . . . . . 121
4.6 Epi-fluorescence images of fluorescent bBSA nano-patterns on glass substrates. . 122
4.7 Scatter-dot plots of width and contrast from epi-fluorescence images of fluorescent
bBSA patterns on glass. . . . . . . . . . . . . . . . . . . . . . . . . . . . . . . . . 123
4.8 bBSA patterns functionalized with Nav-TR on glass. . . . . . . . . . . . . . . . . 124
4.9 Anti-CD3 dots on glass. . . . . . . . . . . . . . . . . . . . . . . . . . . . . . . . . 125
4.10 Epi-fluorescence images of nano-patterns of bBSA labeled with TR or Atto 488
on glass or native Sylgard or Q Gel. . . . . . . . . . . . . . . . . . . . . . . . . . 126
4.11 Transfer of bBSA-Atto on Sylgard imaged with two different camera settings. . . 126
4.12 Quantification of fluorescent bBSA nano-dots from epi-fluorescence images in terms
of dot size and contrast before and after the transfer from glass to PDMS. . . . . 127
4.13 Transfer ratio of fluorescent bBSA on native PDMS. . . . . . . . . . . . . . . . . 129
4.14 Fluorescence intensity of fluorescent bBSA dots before and after transfer from
glass to PDMS. . . . . . . . . . . . . . . . . . . . . . . . . . . . . . . . . . . . . . 129
4.15 Nav-dyelight dots. . . . . . . . . . . . . . . . . . . . . . . . . . . . . . . . . . . . 130
4.16 Scatter-dot plots of width and contrast from epi-fluorescence images of bBSA-TR
patterns on Q Gel. . . . . . . . . . . . . . . . . . . . . . . . . . . . . . . . . . . . 131
4.17 Nav-TR pattern on PDMS revealing the quality of the transfer of non fluorescent
bBSA. . . . . . . . . . . . . . . . . . . . . . . . . . . . . . . . . . . . . . . . . . . 132
4.18 Epi-fluorescence images of Nav-TR pattern on glass and the corresponding pattern
on Q Gel. . . . . . . . . . . . . . . . . . . . . . . . . . . . . . . . . . . . . . . . . 133
4.19 Quantification of the epi-fluorescence images of the Nav-TR patterns obtained on
glass and after transfer to Q Gel, in terms of width and contrast. . . . . . . . . 133
4.20 Epi-fluorescence images of Nav-TR attached to a pattern of non-fluorescent bBSA
on glass and the corresponding pattern after transfer to Q Gel. . . . . . . . . . . 134
4.21 Epi-fluorescence images of nano-patterns of bBSA conjugated to TR or Atto 488
on glass and plasma treated Sylgard or Q Gel PDMS. . . . . . . . . . . . . . . . 135
4.22 Quantification of fluorescent bBSA nano-dots from epi-fluorescence images in terms
of dot size and contrast before and after the transfer from glass to plasma treated
PDMS. . . . . . . . . . . . . . . . . . . . . . . . . . . . . . . . . . . . . . . . . . . 136
4.23 Transfer ratio of fluorescent bBSA transferred to plasma treated PDMS. . . . . . 137

4.24 Fluorescence intensity of fluorescent bBSA dots before and after transfer from
glass to plasma treated PDMS . . . . . . . . . . . . . . . . . . . . . . . . . . . . 138
4.25 Nav-dyelight dots. . . . . . . . . . . . . . . . . . . . . . . . . . . . . . . . . . . . 138
4.26 Epi-fluorescence images of BSA-FITC transfere from glass to plasma treated Q Gel.139
4.27 Epi-fluorescence images of Nav-TR transfered from glass to functionalized PDMS. 139
4.28 Quantification of Nav-TR nano-dots from epi-fluorescence images in terms of dot
size and contrast before and after the transfer from glass to glu CY. . . . . . . . 140
4.29 Anti-CD3 on glu CY. . . . . . . . . . . . . . . . . . . . . . . . . . . . . . . . . . . 140
4.30 Epi-fluorescence images of Nav-TR pattern on glu CY revealing the low quality
transfer of non-fluorescent bBSA. . . . . . . . . . . . . . . . . . . . . . . . . . . . 141
4.31 Epi-fluorescence images of Nav-TR pattern revealing the quality of bBSA pattern
on glass, and after transfer of the ensemble to the surface of functionalized PDMS. 141
4.32 Comparison of the transfer on hard Sylgard (2 MPa) and soft Sylgard (5 kPa). . 142
4.33 Contrast of Nav-TR nano-dots pattern on glass fabricated with different pluronic
types and concentrations. . . . . . . . . . . . . . . . . . . . . . . . . . . . . . . . 143
4.34 Epi-fluorescence images of neutravidin transfered to native or glu Q Gel from a
glass master fabricated with different pluronic type and/or concentrations. . . . . 144
4.35 AFM measurement conducted on glass and Sylgard after each AFM tip-functionalization
step. . . . . . . . . . . . . . . . . . . . . . . . . . . . . . . . . . . . . . . . . . . . 146
4.36 Schematic representation of the reverse contact printing process. . . . . . . . . . 147
4.37 Repersentative force-curves of the interaction between fluorescent bBSA tip and
fluorescent bBSA adsorbed on glass surface. . . . . . . . . . . . . . . . . . . . . . 148
4.38 Force curves of the interaction between fluorescent bBSA and native Sylgard. . . 149
4.39 Force curves of the interaction between fluorescent bBSA and bare cleaned glass
or p Sylgard. . . . . . . . . . . . . . . . . . . . . . . . . . . . . . . . . . . . . . . 150
4.40 Chemical formula of Atto 488 and Texas red dyes. . . . . . . . . . . . . . . . . . 153
5.1 Scatter dot plots of cell adhesion area determined from segmentation of RICM
images of cells adhering on three different types of PDMS with varying elasticity. 158
5.2 Cell adhesion area of cells adhering on different PDMS substrates of varying elas-
ticity. . . . . . . . . . . . . . . . . . . . . . . . . . . . . . . . . . . . . . . . . . . 159
5.3 BF, RICM and TIRF-M images of cell spreading on CY with varying elasticity. . 160
5.4 BF, RICM and TIRF-M images of cell spreading on Sylgard with varying elasticity.161
5.5 BF, RICM and TIRF-M images of cell spreading on Q Gel with varying elasticity. 161
5.6 Cell elasticity as a function of substrte elasticity or cell adhesion area. . . . . . . 162
5.7 Average T-cell density on three different Q gel substrates. . . . . . . . . . . . . . 164
5.8 Cell adhesion area determined from segmentation of RICM images of T-cells ad-
hering on different substrates. . . . . . . . . . . . . . . . . . . . . . . . . . . . . . 165
5.9 T-cells adhered to different surfaces, observed after 30 minutes of spreading fol-
lowed by fixation. . . . . . . . . . . . . . . . . . . . . . . . . . . . . . . . . . . . . 166
6.1 Graphical representation of the reverse contact printing technique. . . . . . . . . 173

7.1 Representation schematique des etapes de la fabrication des plots de proteines sur
un substrat en verre et leur transfert sur un substrat mou. . . . . . . . . . . . . . 179
7.2 Image d’epi-fluorescence representant un pattern de proteines (Nav-TR) sur sub-
strat en verre. . . . . . . . . . . . . . . . . . . . . . . . . . . . . . . . . . . . . . . 180
7.3 Image AFM en mode tapping a l’air pour suivre les etapes de greffage de molecules
lors de la fabrication du pattern sur substrat en verre. . . . . . . . . . . . . . . . 181
7.4 Images d’epi-fluorescence de pattern de bBSA marque soit avec TR soit avec Atto
488, sur verre et sur Sylgard ou Q Gel natif. . . . . . . . . . . . . . . . . . . . . 183
7.5 Transfert de bBSA-Atto sur Sylgard image avec deux parametres differents de la
camera. . . . . . . . . . . . . . . . . . . . . . . . . . . . . . . . . . . . . . . . . . 184
7.6 Images d’epi-fluorescence de pattern de bBSA marque soit avec TR soit avec Atto
488, sur verre et sur Sylgard ou Q Gel traite par plasma oxygene. . . . . . . . . . 184
7.7 Analyse des images d’epi-fluorescence correspondant au transfert de bBSA fluo-
rescent du verre a differents substrats de PDMS. . . . . . . . . . . . . . . . . . . 185
7.8 Courbes de forces correspondantes a l’interaction entre bBSA fluorescente et une
surface de verre propre ou de Sylgard traite par plasma oxygene. . . . . . . . . . 187
7.9 Aire d’adhesion de cellules adherentes sur des substrats de PDMS de differentes
elasticites. . . . . . . . . . . . . . . . . . . . . . . . . . . . . . . . . . . . . . . . . 190
7.10 Cellules-T adherentes sur elastomere mou (Q Gel 20 kPa), patterne avec des anti-
corps d’anti-CD3. Les cellules sont observees apres 30 minutes d’etalement suivit
de fixation. . . . . . . . . . . . . . . . . . . . . . . . . . . . . . . . . . . . . . . . 191


List of Tables
2.1 Typical properties of the three PDMS types. . . . . . . . . . . . . . . . . . . . . 66
2.2 Summary table of different PDMS layer preparation and the corresponding thickness. 68
2.3 Different types of poloxamer and their concentrations, used in this project. . . . 69
2.4 Abbreviations list of the different proteins. . . . . . . . . . . . . . . . . . . . . . . 70
2.5 Results of UV absorbance measurements. . . . . . . . . . . . . . . . . . . . . . . 76
2.6 Hertz and JKR model. . . . . . . . . . . . . . . . . . . . . . . . . . . . . . . . . . 87
2.7 Filter cubes used during imaging with epi-fluorescence microscope. . . . . . . . . 91
2.8 Filter cubes used during imaging with TIRF microscope. . . . . . . . . . . . . . . 93
4.1 Water contact angle measurements of different native and plasma treated PDMS
samples. . . . . . . . . . . . . . . . . . . . . . . . . . . . . . . . . . . . . . . . . . 114
4.2 Elasticity measured from AFM force curves. . . . . . . . . . . . . . . . . . . . . . 119
4.3 Summary table of bBSA-Atto and bBSA-TR dot size on glass and after transfer
to native Sylgard or Q gel. . . . . . . . . . . . . . . . . . . . . . . . . . . . . . . . 127
4.4 Summary table of bBSA-Atto and bBSA-TR dot contrast on glass and after trans-
fer to native Sylgard or Q Gel. . . . . . . . . . . . . . . . . . . . . . . . . . . . . 128
4.5 Summary table of transfer ratio from inside the dots, of bBSA-Atto and bBSA-TR
on native PDMS. . . . . . . . . . . . . . . . . . . . . . . . . . . . . . . . . . . . . 128
4.6 Summary table of transfer ratio from outside the dots, of bBSA-Atto and bBSA-
TR on native PDMS. . . . . . . . . . . . . . . . . . . . . . . . . . . . . . . . . . . 128
4.7 Summary table of bBSA-Atto and bBSA-TR dot size on glass and after transfer
to plasma treated Sylgard or Q Gel. . . . . . . . . . . . . . . . . . . . . . . . . . 136
4.8 Summary table of bBSA-Atto and bBSA-TR contrast on glass and after transfer
to plasma treated Sylgard or Q Gel. . . . . . . . . . . . . . . . . . . . . . . . . . 136
4.9 Summary table of transfer ratio from inside the dots, of bBSA-Atto and bBSA-TR
transferred to plasma treated PDMS. . . . . . . . . . . . . . . . . . . . . . . . . . 136
4.10 Summary table of transfer ratio outside (pluronic covered zones) the dots, of
bBSA-Atto and bBSA-TR transferred to plasma treated PDMS. . . . . . . . . . 137
4.11 Different types of poloxamer and their concentrations, used in this project. . . . 144
4.12 Adhesion force measurements. . . . . . . . . . . . . . . . . . . . . . . . . . . . . . 149
4.13 Dissipation energy measurements. . . . . . . . . . . . . . . . . . . . . . . . . . . . 150
19

LIST OF TABLES
4.14 Summary table of transfer ratio (Tr ratio), width and contrast of different protein
transferred from glass to different PDMS surface. . . . . . . . . . . . . . . . . . . 151
4.15 Protein Pattern Transfer from glass to different PDMS surfaces. . . . . . . . . . . 153
5.1 Summary table of PDMS used for cell studies and their relative elasticity. . . . . 156
5.2 Cell elasticity and adhesion area on different substrates. . . . . . . . . . . . . . . 162
7.1 Elasticite des differents PDMS mesures a partir des courbes de forces d’AFM. . . 182
7.2 Mesure de l’angle de contact de l’eau pour differents substrats de PDMS avant et
apres traitement par plasma oxygene. . . . . . . . . . . . . . . . . . . . . . . . . 182
7.3 Mesure des forces d’adhesion. . . . . . . . . . . . . . . . . . . . . . . . . . . . . . 187
20

List of Materials
• Glass cover slides : thickness = 170 microns, 24 x 24 mm, Assistant, Karl Hecht KG,
Germany.
• Hellmanex III : Sigma Aldrich,France.
• Silica colloidal beads:
- 2µm diameter,Polysctiences, Inc., Germany.
- Microspheres-Nanospheres, Corpuscular, New-York.
• 1H,1H,2H,2H PerFluoroOctyl-TriChloroSilane (PFOTCS): Sigma Aldrich, France.
• 3-AminoPropy-TriEthoxySilane (APTES): Sigma Aldrich, France.
• CY 52-276 A and B: Dow Corning, Toray, Tokyo, Japan.
• Sylgard 184 A and B: Dow Corning, USA.
• Q Gel 920 A and B: Quantum Silicones, LLC Richmond VA.
• Pluronic F-68: Life technology, France.
• Pluronic F-108: Sigma Aldrich, France.
• Pluronic F-127: Sigma Aldrich, France.
• Bovine Serum Albumin (BSA): Sigma Aldrich, France.
• Albumin from Bovine Serum, fluorescein isothiocyanate conjugated (BSA-FITC): Life Tech-
nologies, France.
• Albumin from Bovine Serum, Texas Red conjugated (BSA-TR): Life Technologies, France.
• Albumin from Bovine Serum, biotin conjugate (bBSA): Sigma Aldrich, France.
• NeutrAvidin, biotin-binding Protein (Nav): ThermoFisher Scientific, France.
• Neutravidin, Texas Red conjugated (Nav-TR): Invitrogen , USA.
• NeutrAvidin, fluorescein isothiocyanate conjugated (Nav-FITC): Sigma Aldrich, France.
• Neutravidin, DyLight conjugate (Nav-Dylight): Life Technology, France.
• Mono-biotinylated anti-CD3 (Ortho-clone OKT3, Janssen-Cilag, USA) conjugated to ATTO
647 (Life Technology).
• Anti-CD3 multi-biotinylated mouse anti-human Clon: UCHT1 Beckman Coulter, France.
• Texas Red-X protein Labelling Kit: T-10244, Thermo fisher Scientific, France.
• Atto 488 protein labeling Kit: 38371, Sigma Aldrich, France.
• RPMI complete medium supplemented with 10% Fetal Bovine Serum and 1% GlutaMAX
:Invitrogen.
• Phosphate buffer saline (PBS): Sigma Aldrich, France.
• Paraformaldehyde: Merck, France.
21

LIST OF TABLES
• Glutaraldhehyde: Sygma Aldrich, France.
• Phalloidin rhodamine labeled (dissolved in DMSO): Sigma-Aldrich, France.
• Phalloidin FITC labeled (dissolved in methanol): Life technologies, France.
• Triton X-100: Sigma, France.
• FITC fluorescently labeled mouse anti-human Anti-Vβ8 TCR:BD Bioscience, France.
• 6 µm spherical tips: SQUBE surface science support, Germany.
• 3-(2-Aminoethylamino)propyl]trimethoxysilane: Sigma Aldrich, France.
22

Chapter 1
Introduction
23

CHAPTER 1. INTRODUCTION
1.1 Cells
1.1.1 General concepts
In 1665, the term “cell” was given by Robert Hooke, in a biological context, to describe the
microscopic structure of cork. Since then, technology has given us an increasingly complex view
of the basic unit of life [1]. Cells are the building blocks of all living things. It is the basic
structural, functional and biological unit of all known living organisms, and is capable of per-
forming life functioning. It consists of a concentrated aqueous solution enclosed by a membrane
and filled with biomolecules such as proteins and nucleic acids [1]. Cells size can vary between 1
micrometer and hundreds of micrometer in diameter. In spite of being small, a single cell is very
complicated and is composed of biological structures, with sizes down to the nanometer scale
(Figure 1.1). In fact, a cell is hierarchically complex, taking for example a DNA double helix,
within the cell is approximately 10 nanometers (nm) wide, whereas the cellular organelle, called
the nucleus, that encloses this DNA can be approximately 1000 times bigger (about 10 µm).
Considering the complexity of a cell, we will describe some of its major components, essential
for our study here, namely, the cell membrane, the cytoskeleton, and the extracellular matrix.
Figure 1.1 – Schematic representation of the main structural element of a singleanimal cell. Adapted from [2].
The cell membrane
The cell membrane or the plasma membrane, which is 3-9 nm thick [3][4][5], surrounds all living
cells, and is, arguably, its most important organelle. It encloses and defines the cell. It acts as
a boundary, holding the cell constituents together and regulating the passage of material into
and out of the cell. All cell membranes have two major constituents, lipids and proteins. Ac-
24

CHAPTER 1. INTRODUCTION
cording to the “fluid-mosaic model” theory [6] (Figure 1.2), the plasma membrane is composed
of a double layer of lipids which are fluid like organic oil, at body temperature, and where many
diverse protein are embedded, while other simply adhere to its surface giving the membrane the
look of a mosaic. While the lipids conserve the bilayer structure of the membrane, the proteins
carry out the vast diversity of the membrane functions. In fact, proteins on the outside surface of
the cell membrane can act as receptors by having specific binding sites where hormones or other
chemicals can bind. The proteins that span the membrane are usually involved in transporting
substances across the membrane, and the proteins on the inside surface of the cell membranes
are often attached to the cytoskeleton, and are involved in maintaining the cell shape, or in cell
motility. This binding then triggers other events in the cell. They may also be involved in cell
recognition and signaling. The cell membrane is of a key importance in the cell adhesion process.
The cell membrane carries the cell adhesion molecules (CAMs), that mediate binding interaction
at the extracellular surface, and determine the specificity cell-cell and cell-extra cellular matrix
(ECM) recognition. More detail will be elucidated in the cell adhesion section (section 1.1.2).
Recent advances have shown that the membrane is more heterogeneous and dynamic than what
was visualized in the fluid-mosaic model, but the basic structural notions remain.
Figure 1.2 – Fluid mosaic model of the plasma membrane. Adapted from [7].
The cytoskeleton
The cytoskeleton is an interconnected network of filamentous polymers and regulatory proteins
located in the cell cytoplasm, which influences the capacity of the cell to resist deformation, to
change shape during movement and to transport intracellular cargo [8]. It organizes the con-
tents of the cell; connects the cell physically and biochemically to the external environment; and
generates coordinated forces that enable the cell to move and change shape. These constitute
the key important functions of the cytoskeleton (see, for example [9] and references there in).
The cytoskeleton is built on a framework of three types of protein filaments, that constitute the
cytoskeletal polymers and control the shape and mechanics of cells. They are: the microtubules,
25

CHAPTER 1. INTRODUCTION
the actin filaments, and the intermediate filaments [1].
Here, we shall focus on actin filaments also known as microfilaments. They are two-stranded
helical polymers of the protein actin. They are the thinnest filaments of the cytoskeleton. They
appear as semi-flexible structures, much less rigid than microtubules, with a diameter of 5–9
nm. Depending on their association with different actin-binding proteins, they can be organized
into a variety of linear bundles, two-dimensional networks, and three-dimensional gels. They can
serve in a variety of functions in the cell such as cell-cell communications, filopodial protrusions,
cell locomotion and changes in cell shape. Although actin filaments are dispersed throughout
the cell, they are most highly concentrated in the cortex, just beneath the plasma membrane.
This gives them the capacity of force generation when their growing end pushes against the cell
membrane. Actin structure and dynamics closely associated with cell adhesion and mechanics,
and is then important for this thesis.
The extracellular matrix
The extracellular matrix (ECM) constitutes an ensemble of extracellular molecules secreted by
cells. It dispenses structural and biochemical support to the neighboring cells [10]. The extracel-
lular matrix fills the spaces between cells and binds cells and tissues together. The composition
of ECM varies between multicellular structures. However, the common functions of the ECM
include cell adhesion, cell-to-cell communication and differentiation [11]. The major components
of the ECM are water, proteins and polysaccharides. Each tissue has an ECM with a unique
composition and topology that is generated during tissue development through a dynamic and
reciprocal, biochemical and biophysical dialog between the various cellular components (e.g.
epithelial, fibroblast, adipocyte, endothelial elements) and the evolving cellular and protein mi-
croenvironment. Indeed, the physical, topological, and biochemical composition of the ECM is
not only tissue-specific, but is also markedly heterogeneous. In the context of adhesion, ECM
receptors, such as integrins, mediate cell adhesion to the ECM [12][13]. Adhesion molecules
couple the cytoskeleton to the ECM. Adhesion is also often linked to cell migration through the
ECM [14][15].
1.1.2 Cell Adhesion
Tissues are viscoelastic and are made up of cells and ECM. The cells that make up tissues are
adherent, attached to some combination of their neighboring cells and surrounding ECM. Many
cell types require adhesion for survival [16][17][18]. Cell adhesion is the process by which cells
interact and attach to a surface, substrate or another cell, mediated by interactions between
molecules of the cell surface, the cell adhesion molecules (CAMs). Also known as adhesion re-
ceptors, CAMs, are proteins capable of binding to their counterpart in the extra cellular matrix
or on a neighboring cell. Integrin binding to fibronectin is a prime example [19]. In connective
tissue cells, through the binding, transient focal complexes are formed. If presented with proper
ligands, focal complexes mature into focal adhesions [20] [21], which are micrometer size com-
26
CHAPTER 1. INTRODUCTION
plexes of proteins anchoring the cell cytoskeleton to the ECM via integrins, and are considered as
important transducers of physical cues [22]. In fact, focal adhesions arise from integrin clusters
that allow the assembly of the F-actin cytoskeleton and the generation of tension, resulting in
cell spreading. The study of the transition from focal complex to focal adhesion, in an artificial
system, requires spatial as well as chemical specificity. However, all cell types do not form focal
adhesions to adhere. The example of T-cells will be discussed in section 1.2.3.
Cell adhesion plays an important role in cell growth, migration and differentiation. It is also
involved in embryogenesis, maintenance of tissues integrity, immune response and cancer metas-
tasis [23]. When a cell adheres and grows on a substrate, it senses, interprets, integrates, and
responds to multiple chemical and physical features of the underlying adhesive substrate such
as, the surface chemical composition, the wettability [24], the density and organization of the
specific ECM protein [25], the topography [26], the roughness [27] and the stiffness [28].
In this section we will start by presenting general trends regarding the effect of roughness and
surface wettability on cell spreading. Following that, we will present examples on the study of
cell adhesion on micro and nano features and thus the influence of the substrate topography and
the organization of the specific ECM proteins on cell adhesion.
1.1.2.1 Surface Wettability Effect on Cell Adhesion
Surface wettability (also referred to as hydrophobicity/hydrophilicity) is one of the most impor-
tant factors affecting the cell response to implants (see for example [29], and references therein).
Typically, when a surface is put in contact with a biological fluid or cell medium, before the
cells have the time to arrive, the material surface is already coated with a monolayer of proteins.
Hence, the cells do not “see” the material but see instead a dynamic layer of proteins. Since
wettability affects protein adsorption [30] and since the presence of proteins allows cells to adhere
to surfaces, wettability also affects cell adhesion [24][31]. However, observations regarding the
effects of surface wettability on protein adhesion have not always been consistent.
In solution, proteins interact with water molecules, and tend to create a folded structure in
order to lower the entropic penalty caused by the interaction between their hydrophobic side
chains and water [32]. Generally, beside some exceptions [33], hydrophobic surfaces tend to ad-
sorb more proteins, while hydrophilic surfaces tend to resist protein adsorption. This is because
strong hydrophobic interaction is thermodynamically favorable for the proteins on hydrophobic
surface, due to the large number of non polar and hydrophobic amino acids, generally occupying
the interior of the protein folded structure, and also present in 40 to 50 % on the accessible
area of the protein structure. This is in direct contrast to the large energy barrier created on
the hydrophilic surface arising from strongly bound water molecules on the hydrophilic surface,
thus leading to competition between water molecules and proteins, and resulting in decreased
protein adsorption and conformational change. The process of adhesion of proteins to surfaces,
induces conformational changes and reorientation of the proteins. Surface chemistry and wetta-
27
CHAPTER 1. INTRODUCTION
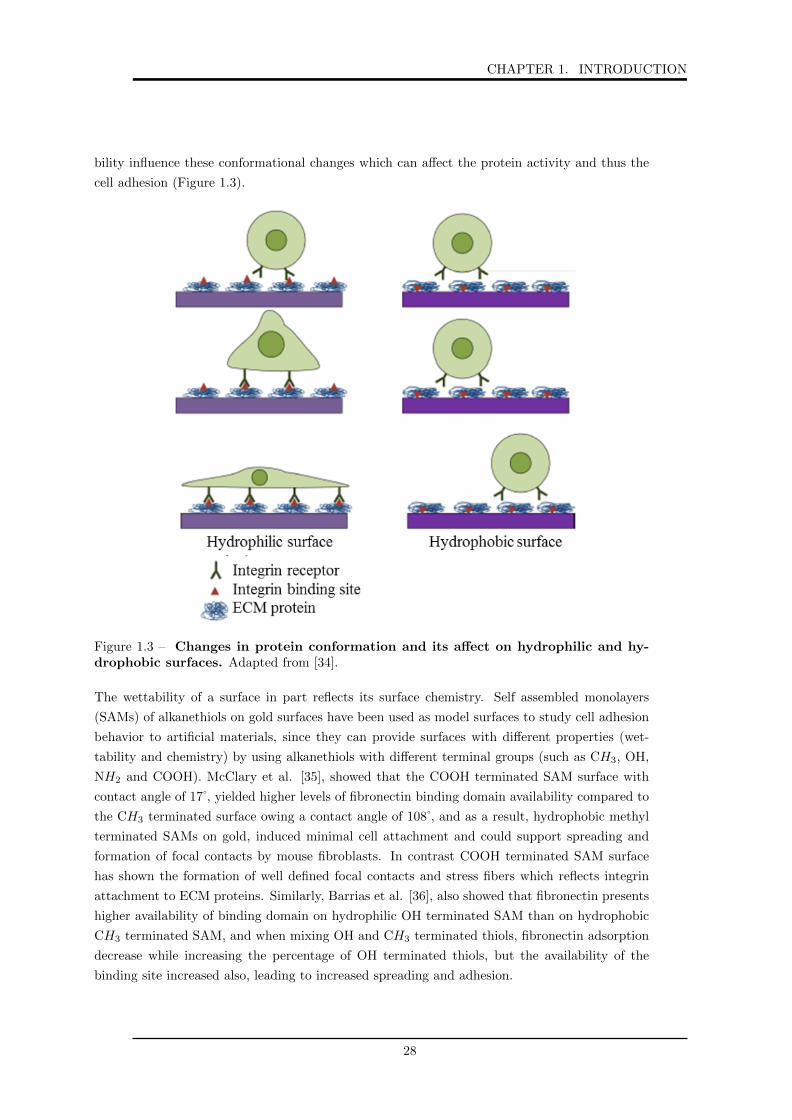
bility influence these conformational changes which can affect the protein activity and thus the
cell adhesion (Figure 1.3).
Figure 1.3 – Changes in protein conformation and its affect on hydrophilic and hy-drophobic surfaces. Adapted from [34].
The wettability of a surface in part reflects its surface chemistry. Self assembled monolayers
(SAMs) of alkanethiols on gold surfaces have been used as model surfaces to study cell adhesion
behavior to artificial materials, since they can provide surfaces with different properties (wet-
tability and chemistry) by using alkanethiols with different terminal groups (such as CH3, OH,
NH2 and COOH). McClary et al. [35], showed that the COOH terminated SAM surface with
contact angle of 17 , yielded higher levels of fibronectin binding domain availability compared to
the CH3 terminated surface owing a contact angle of 108 , and as a result, hydrophobic methyl
terminated SAMs on gold, induced minimal cell attachment and could support spreading and
formation of focal contacts by mouse fibroblasts. In contrast COOH terminated SAM surface
has shown the formation of well defined focal contacts and stress fibers which reflects integrin
attachment to ECM proteins. Similarly, Barrias et al. [36], also showed that fibronectin presents
higher availability of binding domain on hydrophilic OH terminated SAM than on hydrophobic
CH3 terminated SAM, and when mixing OH and CH3 terminated thiols, fibronectin adsorption
decrease while increasing the percentage of OH terminated thiols, but the availability of the
binding site increased also, leading to increased spreading and adhesion.
28

CHAPTER 1. INTRODUCTION
The effect of surface wettability on cell adhesion is not limited to SAMs and was also stud-
ied on polymer surfaces. Some studies have shown that the increasing of hydrophilic properties
of polymers leads to increased cell spreading and adhesion [24], in contrast other studies report
that the highest rate of cell adhesion and proliferation is observed on substrates with hydrophobic
surfaces [37], or substrate with intermediate contact angle [38][39]. Polystyrene for example, has
a hydrophobic surface, and showed an incapacity of many cell to spread and adhere. Decreasing
its hydrophilicity by acid treatment or exposing to high energy ionizing radiation, leads to an
increase in cell adhesion [40]. In contrast, polyethylene glycol, known for its high hydrophilicity,
shows a low protein adsorption to its surface, and can not promote cell adhesion [41]. Mixing
it with other more hydrophobic material was needed to decrease its hydrophilicity and thus,
increase cell adhesion [42].
1.1.3 Surface Roughness Effect on Cell Adhesion
During cell-material interaction, the cells modify their behavior according to the surface char-
acteristics of the material. In their natural environment, cells are exposed to many different
types of surfaces, some of which are be rough, while others are smoother. Since the effect of
surface topography on cell morphology is the consequence of the process of interaction between
the extra-cellular matrix proteins adsorbed on the surface of the material, and related cell adhe-
sion molecules, the surface roughness is an important factor in the study of cell adhesion. Often,
it was demonstrated that an increase in surface roughness provides an increase in cell adhesion
on both polymers [27][43] and metals [44]. Research has shown that surfaces with more topo-
graphical features and roughness will have more exposed area for protein to interact with [45].
Some other reports, suggested that an increase in surface roughness promotes higher availability
of protein binding sites [46]. And some other associated the increase in roughness to the increase
in hydrophobicity and thus, to the increase in cell adhesion. The response of cells to roughness
depend on the cell type, cells are thought to respond better to surfaces which mimic their phys-
iological environment. Rat osteoblast and human foetal osteoblastic cells, for example, showed
increase spreading on rough surfaces in comparison with smooth one [47] [48]. Human osteoblas-
tic cloned cells showed a decrease in proliferation rate in response to surface roughness [49]. It
was also reported that rat cells generally follow surface orientation, while human osteoblasts do
not follow any surface orientation [50]. Recently, studies on the influence of nano-structures were
conducted [26][51], considering the fact that the natural environment of the cell, the ECM, is a
nano-structured substrate [52][26]. It was shown that cells do respond to nano-topography [52].
1.1.4 Cells Adhesion on Chemically Patterned Substrates
The importance of adhesion geometry for the life and death of cells was first demonstrated in
the early 1997, where Chen et al. used substrates that contained extracellular matrix-coated ad-
hesive islands of decreasing size, to grow cells (Figure 1.4). They showed that cells shifted from
growth to apoptosis on this substrates. They also demonstrated that cells vary their shape while
29

CHAPTER 1. INTRODUCTION
maintaining the total cell-ECM contact area constant, by decreasing the size and the spacing
between the focal adhesion points (Figure 1.5) [53].
Figure 1.4 – Effect of surface structuring on cells. (A) Different sized square-shapedadhesive islands. (B) Final shapes of endothelial cells adhered to fibronectin coated islands.Cells were seen to adapt their shape and size to that of the adhesive islands. Adapted from [53].
Following this study, the location of focal adhesion (micrometer size complexes), began to be
studied on surfaces patterned with microscopic islands of adhesion protein, to which the cells
subsequently adhere [54]. Since then micro-patterning has been used extensively to investigate
the sensitivity and response of a cell to specific micro-environmental cues [55] and has become a
powerful tool to influence the behavior of cells [52].
Numerous studies have been done to investigate influence of micro-structure substrates on cellular
processes. Thery et al. have used microcontact printing to finely control the spatial distribution
of the ECM on the substrate. They demonstrated that HeLa cells, dividing on fibronectin coated
micropatterns, orient their spindle relative to the pattern geometry [56]. In a following report,
they studied the orientation of the mitotic spindle in HeLa cells on various fibronectin micropat-
terns. They demonstrated that by regulating torques that act on the spindle, the geometry of
the adhesive pattern sets up the distribution of cortical cues that control spindle orientation
[57]. Baily and colleague used micro-patterned substrates to study the regulation of protrusion
shape during chemotactic responses of mammalian carcinoma cells. They plated rat mammary
30

CHAPTER 1. INTRODUCTION
Figure 1.5 – Cell-ECM contact area versus cell spreading as a regulator of cell fate.(A) Substrates used to explore the shape variation of the cell independently of the cell-ECMcontact area. (B) Phase contrast images of cell spreading on the patterns shown in (A). (C)Immunofluorescence staining of fibronectin or vinculin for cell spreading on micropatterned sub-strates. Adapted from [53].
carcinoma cells on gold coated glass cover-slips having 10 µm wide adhesive lanes. They saw that
the cell attached only to the adhesive lanes, but lamellipod extension could occur independently
of any contact with the substrate [58].
Spatz and co-workers, were the first to report one of the nano-structuring technique, so called
block copolymer micelles nanolithography (BCML), which can lead to single integrin clustering
in adhesion dependent cell [59][60]. Their method is based on the fabrication of hexagonal pat-
terns of gold nanodots on a glass slide. The gold particles are separated by polyethylene glycol
molecules (PEG) passivating the free glass and preventing nonspecific cell adhesion. The use of
the hydrophilic PEG proves the importance of surface wettability on cell adhesion explained in
section 1.1.2.1. Several studies using the BCMl have demonstrated a critical spacing of 50-70 nm,
beyond which cells no longer recognize individual ligands as being clustered. Arnold et al. [51],
for example, used this technique to design nano-patterned adhesive surfaces of gold nano-dots
coated with RGD peptide, where the distance RGD-to-RGD could be precisely set. They demon-
strated that a distance ≥ 70 nm between the dots leads to limited cell attachment and spreading
and also reduces the formation of focal adhesion and actin stress fiber. In contrast a distance
of ≤ 60 nm allows effective adhesion. In a related study, Elisabetta Ada Cavalcanti-Adam et al.
wanted to see the extent to which cell spreading kinetics and adhesion stability depend on RGD
ligand spacing [13]. They saw, that cells on substrate with 60 nm spacing RGD nano-pattern,
reach a maximum spreading within 1-2 h after plating and are hardly migrating, comparably to
cells on homogeneously coated RGD surfaces. In contrast, cells on 108 nm spaced nano-pattern,
shows reduce spreading but enhanced motility. Other studies, such as the one done by Niepel et
al. [61], used nano-sphere lithography to vary the size and distance of gold nano-structures on
silicon to guide size and spacing of focal adhesion in fibroblast, in order to regulate their adhesion
31

CHAPTER 1. INTRODUCTION
and growth.
Micro-nano fabrication techniques have delivered tools to closely mimic the physiological and
pathological states of the cell. These techniques offer easy ways to modulate the topography and
density of the ECM proteins to control the local chemical environment for cell adhesion. Such
techniques have become essential in the domain of cellular adhesion studies and will be discussed
in section 1.3.
1.1.5 Cell Mechanics
Cellular signaling within living organisms is sustained by chemical and mechanical interactions
mediated through a complex machinery involving the cytoskeleton, the cell membrane, and the
macromolecules composing the extracellular matrix. All these elements associated with the forces
generated by the cell and its surroundings play in concert to create dynamic materials with vis-
coelastic properties unique to each tissue. While historically, there has been significant attention
on chemical regulators within the ECM, and their influence in cell fate was largely demonstrated,
the role of mechanical environment was less well known.
In the recent years, it has become increasingly evident that the cellular response to environ-
mental signals goes far beyond the ability of the cell to sense surface chemistry, and thus there
has been focus on the cell environment mechanical properties, the spatial organization and the
topographical data. Hence, it is now said that “cells in vivo, are organized into tissues and organs
that reside in complex mechanical environment” [62]. At the cellular level, this mechanical envi-
ronment consists of internal and external forces generated by, and applied to the cell. Further,
the relative stiffness of the ECM is an important mechanical parameter for cell functions and
behavior. All these factors were found to be essential in maintaining cell health and integrity
[62][63] .
Mechanical forces are shown to play a major role in a wide range of biological and pathogenic
processes [64][65], and mechanobiology is becoming an emerging field in biomedical research. A
wide number of experiments were reported, on the capacity of the cells to sense the mechani-
cal properties of their environment, called mechanosensing, by applying forces through adhesion
proteins on their surface, and traducing the force into biochemical signals in response. It is now
well recognized that cells respond actively to the stiffness of their underlying substrate. Hence,
the study of cells on planar substrates are usually performed with non adhesive polyacrilamide
(PAA) or polydimethylsiloxane (PDMS) coated with ECM proteins or ligands such as RGD.
Pelham and Wang in 1997, reported that the stiffness of PAA gels regulates focal adhesion
formation and migration of cultured rat epithelial cells and 3T3 fibroblasts. They demonstrated
a faster migration of cells on stiff substrates [66]. To sense the stiffness, cells generate and trans-
mit forces to their substrate. It is in fact in the 1980’s that the first experiments showing the
ability of cells to sense the mechanical properties of their environment were conducted, and when
32
CHAPTER 1. INTRODUCTION
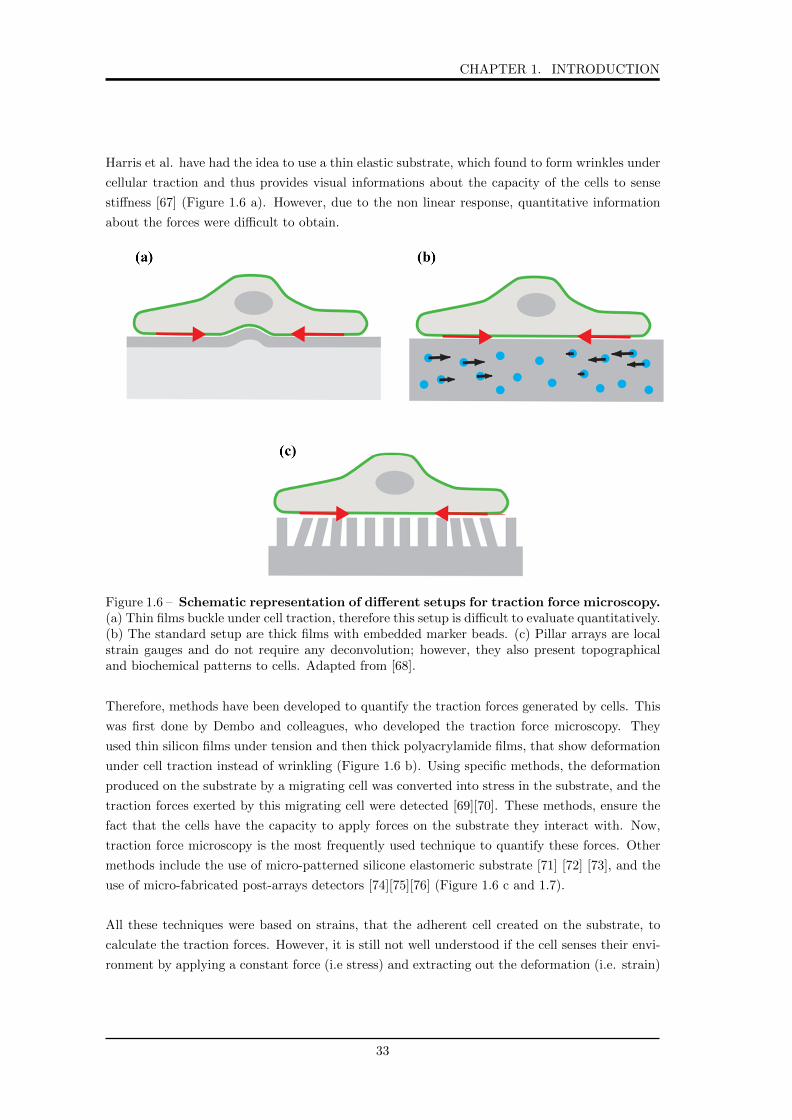
Harris et al. have had the idea to use a thin elastic substrate, which found to form wrinkles under
cellular traction and thus provides visual informations about the capacity of the cells to sense
stiffness [67] (Figure 1.6 a). However, due to the non linear response, quantitative information
about the forces were difficult to obtain.
Figure 1.6 – Schematic representation of different setups for traction force microscopy.(a) Thin films buckle under cell traction, therefore this setup is difficult to evaluate quantitatively.(b) The standard setup are thick films with embedded marker beads. (c) Pillar arrays are localstrain gauges and do not require any deconvolution; however, they also present topographicaland biochemical patterns to cells. Adapted from [68].
Therefore, methods have been developed to quantify the traction forces generated by cells. This
was first done by Dembo and colleagues, who developed the traction force microscopy. They
used thin silicon films under tension and then thick polyacrylamide films, that show deformation
under cell traction instead of wrinkling (Figure 1.6 b). Using specific methods, the deformation
produced on the substrate by a migrating cell was converted into stress in the substrate, and the
traction forces exerted by this migrating cell were detected [69][70]. These methods, ensure the
fact that the cells have the capacity to apply forces on the substrate they interact with. Now,
traction force microscopy is the most frequently used technique to quantify these forces. Other
methods include the use of micro-patterned silicone elastomeric substrate [71] [72] [73], and the
use of micro-fabricated post-arrays detectors [74][75][76] (Figure 1.6 c and 1.7).
All these techniques were based on strains, that the adherent cell created on the substrate, to
calculate the traction forces. However, it is still not well understood if the cell senses their envi-
ronment by applying a constant force (i.e stress) and extracting out the deformation (i.e. strain)
33

CHAPTER 1. INTRODUCTION
Figure 1.7 – Scanning electron micrograph image of a rat embryonic fibroblast cell(REF 52) trying to hang and pull on a micropillar substrate. Scale bare: 15 µm.Adapted from [77].
or vice versa. Theoretical models suggest that cells may maintain either an optimal stress or
an optimal strain by readjusting their cytoskeleton organization and their contractile activity
[78]. Recent traction force measurements on fibroblast cells on PAA gels with stiffness ranging
from 6 to 110 kPa, suggested that cells switch from maintaining a constant strain on soft gels to
maintaining a constant stress on stiffer substrates [79] [80]. However, whatever the experiment,
care needs to be taken to choose the correct functionalization of the surface. In fact, the distance
between anchoring points can influence cell fate [81], and if the ligands were not well attached
to the substrate surface, cells risk pulling them out [79]. Furthermore, the thickness of the gel
needs to be carefully chosen, since cells can sense the underlying stiff glass, if the gel is too thin
[82].
The mechanical environment is now well recognized as an important factor in cell biology stud-
ies. Principally the matrix stiffness is shown to be a relevant parameter that modulates cell
responses such as differentiation, adhesion, morphology, spreading and migration and even stiff-
ness of the cell itself. Engler and colleagues, demonstrated that mesenchymal stem cells under
stimulation, plated on chemically similar soft and stiff substrates, can differentiate into neurones
and osteoblasts respectively [83]. Recent studies showed that stem cells can even remember the
mechanical history of their environment [84]. Missirlis and Spatz demonstrated that fibroblast
migration is regulated by the substrate elasticity, for hydrogel coated with ECM protein (fi-
bronectin and vinculin). The cell migration is slower but more persistent on the stiffer substrate
[85]. In contrast, Pelham and Wang demonstrated that fibroblasts migrate faster on stiff sub-
strate [66]. Solon et al. showed that fibroblast cells increase their internal stiffness until they
match that of their substrate [28]. Levental et al. showed that epithelial cells cultured on soft
substrates appear softer than those grown on hard substrates [86]. Engler et al. have demon-
34

CHAPTER 1. INTRODUCTION
strated that cell differentiation can be tuned by substrate stiffness [87].
We have discussed the importance of matrix mechanics, and specially the matrix stiffness on
individual cellular behavior and function. It was suggested that cells on substrates with the
same stiffness as their native tissue environment adopt their physiologically relevant morphology
[88]. Cells begin to behave abnormally, as the matrix stiffness deviates from some optimal stiff-
ness range [63], thus, any modification or abnormal changes of matrix stiffness can contribute to
the progression of various disease including cancer and fibrosis [89] [90]. Finally it is important
to note that not all cell types are sensitive to substrate stiffness, and not all mechanosensitive
cell types respond similarly to changes in stiffness. This can probably be related to the fact that
the elastic modulus of each tissue is different, thus the response of the cell to the effective range
of substrate elasticity depend on the tissue type from which the cell is derived [28].
1.2 Immune Cells
1.2.1 The Immune System
Because the human body provides an ideal environment for many microbes, that try to break
in, through dermal contact, ingestion and inhalation. The immune system, which is a network
of cells, tissue and organs, works to keep out these foreign invaders, or failing that, to seek out
and destroy them. Another important activity of the immune system is to rid the body of its
own cells that have become damaged or are abnormal. The immune system is typically divided
into two categories: the innate immunity and the adaptive immunity.
Innate immunity, is the nonspecific and abrupt first response of defense that come into play
immediately or within hours of an antigen appearance in the body [91]. It includes skin, chem-
icals in the blood, and immune system cells (e.g. neutrophils, macrophages and natural killer
cells etc) that attack foreign cells in the body [92].
The adaptive immunity is unique in its specificity for distinct pathogens, it is able to create
immunological memory and is more complex. Antigen presenting cells (APC) such as dendritic
cells, B cells and macrophages are required for foreign antigen presentation. Following the antigen
presentation, foreign pathogen are eliminated via antibody response from the humoral immune
system (mediated by antibodies produced by B lymphocytes), or activation of effector cells (me-
diated by T-lymohocytes) [93].
The cross-talk between the innate and adaptive immune system contributes to an efficient recog-
nition and clearance of pathogens, but dysfunctions of the immune system can lead to harmful
immunologic responses including allergy, autoimmunity, and allograft rejection [94].
35

CHAPTER 1. INTRODUCTION
1.2.2 Antigen Presenting Cell
Cellular immune response is mediated by capturing, processing and presenting antigens for recog-
nition by certain lymphocytes such as T-cells. Antigen presenting cells (APC) are the cells that
perform these functions. Classical APCs include dendritic cells, macrophages and B cells. These
cells are equipped with costimulatory molecules that allow for optimal signaling by T-Cells. They
are strategically located in the T-cell-dependent areas of lymphoid tissues [95]. Their size varies
between 15 and 30 µm. Either by phagocytosis or by receptor mediated endocytosis, they inter-
nalize very efficiently the antigen and proceed it into peptide fragments [96]. These fragments
are then transported to the surface of the APC, where they bind to the major histocompatibility
complex (MHC) molecules, forming the peptide MHC complex (pMHC). The MHC is responsible
for displaying the antigen fragments at the surface of the APC cell, to be therefore recognized
by the appropriate T-cells (Figure 1.8). The MHC is a set of cell surface proteins called the
MHC proteins, which serve to enable the individual’s immune system to distinguish its cells
from foreign cells. This function of the immune system is called self-versus-nonself recognition.
Antigen presentation allows for specificity of adaptive immunity and can contribute to immune
responses against both intracellular and extracellular pathogens. It is also involved in defense
against tumors. Actually, to target malignant cells, several cancer therapies involve the creation
of artificial APCs. Some artificial APCs are derived from human cells; others are acellular, con-
taining MHC proteins, co-stimulatory molecules and the necessary peptides [97][98].
Recent studies on APCs, have demonstrated that the pMHC of an infected cell presents clus-
tered structure of 200-900 nm diameter, which are maintained for hours after their delivery to
the plasma membrane of the cell, and prior to their contact with T-cell [100]. This finding was
then expanded by showing that pMHC clustering also occur on professional APCs, such as the
dendritic cells, and more importantly, by showing that cognate pMHC complexes are indeed
contacting each other, forming a supra-molecular cluster [101].
In separate studies, focus has been on the visco-elastic properties of different APCs including,
monocytes (M), dendritic cells (DC) and macrophages (MPH), untreated (Figure 1.9) and sub-
jected to inflammatory conditions. The results shows that the viscoelastic properties, changes
among different APC (M, storage modulus of 520 +90/-80 Pa; DC, 440 +110/-90 Pa; and MPH,
900 +110/-100 Pa), and also upon inflammatory treatments (storage moduli ranging from 190
Pa to 1450 Pa). These changes has been shown to correlate with changes in the composition and
activity of the cell actomyosin cytoskeleton [103].
These findings accentuate the need to take into account the two discussed aspects of the APC:
the rigidity and the presence of ligands in the form of clusters, when designing an artificial APC.
36

CHAPTER 1. INTRODUCTION
Figure 1.8 – Antigens are presented on MHC proteins. (a) MHC proteins at the surfaceof an antigen presenting cell. (b) Foreign microbes having antigens on its surface. (c) T-cells canbind to antigens only after the antigens are processed and complexed with MHC proteins on thesurface of an antigen presenting cell. Adapted from [99]
Figure 1.9 – Storage modulus for human monocytes (M), dendritic cells (DC) andmacrophages (MPH). The storage modulus is a measure of the stiffness of a viscoelasticmaterial and is proportional to the energy stored. “It is roughly equal to the elastic modulus fora single, rapid stress at low load and reversible deformation” [102]. **p < 0.01; N= number ofcells tested, from at least three different donors. Adapted from [103].
37

CHAPTER 1. INTRODUCTION
1.2.3 T-Lymphocytes
The adaptive immunity defense mechanisms involve the action of lymphocytes cells, B and T
lymphocytes. B-lymphocytes or B-cells (so called because they mature in the bone marrow),
direct the humoral response, by secreting proteins called antibodies, which bind to and eliminate
extracellular microbes. T lymphocytes or T-cells (which mature in the thymus) direct the cell
mediated response and function mainly to identify and combat microbes that have learned to
live inside cells (where they are inaccessible to antibodies). Depending on the subtype, T-cells,
may play an important role in activating other kind of immune cells, destructing cells that have
internalized pathogens, and preserving memory of an attacking pathogen.
1.2.3.1 T-Cell Receptor
The T-cell receptor or TCR is a molecule found on the surface of a T-cell. It is responsible
for recognizing fragments of antigen as peptides bound to MHC molecules (pMHC). TCR is
an heterodimers composed of two disulfide-linked polypeptide chains either α and β or γ and
δ chains. The co-receptor known as CD4 is associated with the helper T-cell receptor (these
cells can thus be indicated as CD4+) and interacts only with the MHC-II proteins of another
lymphocyte (Jurkat cell line used in this thesis is a CD4+ cell line). The TCR associates with
another cell surface molecule, cluster of differentiation 3 (CD3). CD3 consists of protein complex
and is composed of four distinct chains CD3γ chain, CD3δ chain and two CD3ε chains. These
chains associate with the TCR and the ζ-chain (zeta-chain) to generate an activation signal in
T lymphocytes. The TCR, ζ-chain, and CD3 molecules together constitute the TCR complex
(Figure 1.10).
Figure 1.10 – Schematic structure of the αβ TCR complex. A schematic drawing of aTCR, showing the TCRαβ chains linked by a dilsulfide bond (black). Accessory CD3 moleculesand the ζ-chains that mediate the signal transduction [104].
38

CHAPTER 1. INTRODUCTION
1.2.3.2 Interaction T-cell/APC
T-cells are highly migratory cells. They circulate through the blood, lymph and peripheral
lymphoid organs [105]. Their size is about 10 µm. While migrating, the antigen receptors
(TCRs) of T-cells search for membrane MHC protein that are bound to peptides derived from
infection, pathogens or cellular transformation. The TCR comes in millions of slightly different
forms, only one unique form will bind to a given kind of pMHC. Upon detection and recognition
of such specific pMHC complex, the T-cell is arrested and forms a tight contact with the APC,
with the help of stronger bonds between the LFA-1 (Lymphocyte function-associated antigen
1) on the T-cell and ICAM-1 (Intercellular Adhesion Molecule 1) on the APC (Figure 1.11),
resulting, in the formation of the so-called immune synapse (IS) (Figure1.12), and activation of
the T-Cell [106][107]. The activation occur only when the pMHC is recognized as “non-self”
by the TCR. The interaction between TCR and pMHC triggers the IS formation. As a result,
assembly of signaling, adhesive and scaffolding molecules at the cell contact zone is formed [108].
Any abnormalities affecting the synapse formation have a major impact on the immune system
regulation and activation leading to immunological related pathologies such as T-cell lymphoma
[107][109].
Figure 1.11 – Interaction T-cell/APC and immunological synapse formation. LFA-1on the surface of T-cell binds with ICAM-1 expressed on APC, allowing the interaction of TCRwith pMHC. Adapted from [110]
1.2.4 T lymphocyte/APC interface
While migrating in the secondary lymphoid organs, T-cells scan the surface of APCs for the
presence of rare specific peptides on MHC complexes [105]. The contact surface at which T-cells
recognize and activate in response to the pMHC complex is known as the immunological synapse
or immune synapse. The concept of the immunological synapse goes back to the early 1980s; the
name was chosen by M.Norcross to describe the specific T-cell/APC interaction in analogy to a
neurological synapse or neuronal connections [111]. A mature IS was first imaged in T-cell/B-cell
interaction [112], and soon after in T-cell/Supported Lipid Bilayer (SLB) interaction [108]. It
has a bull’s eye structure, that consists of three zones of concentric regions called supramolecular
39

CHAPTER 1. INTRODUCTION
activation cluster (SMAC). Each is enriched in different cell-surface and cytoplasmic molecules.
However, the current view is that micro-clusters (µ-clusters) of molecules, rather than the IS
itself is the key to T-cell activation.
Figure 1.12 – Interaction between a T-lymphocyte and an APC resulting in the im-munologycal synapse formation. A merge between an electron micrograph and a live-cell flu-orescence micrograph to show the immunological synapse formation. It is indicated by the bull’s-eye pattern of adhesion molecules (LFA-1/ICAM-1, red) and antigen receptors (TCR/pMHC,green) at the interface between a T lymphocyte (purple) and an APC (dark green). Adaptedfrom [108].
Clustering and reorganization of membrane proteins, at the adhesive interface of a T-cell inter-
acting with antigen presenting cells is seen to have a lot of influence on cell behavior including
activation and signaling [108][113][114][115]. TCR and the integrins αLβ2 (LFA-1) at the in-
terface of a T-cell adhering to an activating surface, are now well known to form µ-clusters
[109][116][117]. In fact, thanks to hybrid systems of interaction between T-cell and SLB acting
as surrogate APC [108], it was shown that the TCR µ-clusters migrate towards the center in
an actin dependent manner [117][118], and form the central supramolecular activation cluster
(cSMAC). Signaling molecules including ZAP-70 (receptor kinase involved in signaling), are also
shown to form µ-clusters [119][120], which may colocalize with the TCR µ-clusters. Recently, it
was found that micron or nano scale aggregates of TCR maybe pre-clustered on the membrane
of T-cell [121][122]. Conversely, as discussed in section 1.2.2, the pMHC complex at the surface
of APC is also clustered on the plasma membrane, prior the contact with T-cell [100] [101].
Therefore, it is relevant to study the adhesion and spreading of T cells on chemically contrasted
substrates presenting micron and sub-micron scale clusters of ligands against the TCR complex.
Tissue cells are sensitive, on one hand to the stiffness of their environment and on the other
hand also to the presentation of ligands in the form of clusters (see section 1.1.5 and 1.1.3).
Interestingly, unlike the cells discussed before, the behavior of T-cells does not depend on the
ligand spacing but on the ligand density [123] [124] [125]. Also there is contradictory report in
40

CHAPTER 1. INTRODUCTION
the literature on the behavior of T cells on soft substrates. Naive Mouse T-cells on polyacry-
lamide gels (PAA) with elasticity ranging from 10 kPa to 200 kPa are more activated on stiffer
substrates [126]. In contrast, human T-cells on silicone rubber (PDMS) with stiffness ranging
from 100 kPa to 5000 kPa show the opposite trend [127]. Recently it was shown that forces of
about 100 pN can be exerted through the TCR complex [128] and preliminary evidence suggests
that on PAA at least, more force is exerted on harder substrates [129]. However, the precise
mechanisms of mechano-sensitivity of T cells are still not well established, and the development
of soft patterned substrates is a requirement to further explore this phenomenon.
1.3 Technology for fabrication of biomimetic surfaces
1.3.1 Protein Adsorption to Biomaterials
Most of biological applications including tissue engineering, implemented devices, and cell based
sensors and biosensors, employ the interaction of biological systems with synthetic material sur-
faces. The immobilization of active biomolecules or cells is required for biological studies, such
as cell adhesion, cell proliferation and bio-molecular recognition. Protein adsorption phenomena
is the first step in the acute biological response to artificial materials [130] [131]. However, due
to the complexity and diversity of the interactions involved, the adsorption processes are com-
plicated and difficult to predict and to control. In fact, protein is a complex molecule composed
of sequences of amino acid chains that interact with each other to give the three dimensional
structure of the protein, that determine its activity. Each amino acid contributes to the chemical
and physical properties of the protein and thus to their adsorption properties. Proteins were
described to have four different levels of structure (primary, secondary, tertiary and quaternary
structure), multiple interaction sites and charged domains. They are also known to tend to
denature and often attach with a random orientation on the surface. Certainly, a controlled
orientation is required to ensure a correct interaction with other biomolecules or cells. Thus, the
functional domain of the bounded protein must be located in a way that allows the interaction.
In fact, the interaction of proteins with a solid surface, depends on several parameters including
the chemical and physical properties of both the protein (protein size, concentration, charge and
hydrophibicity distribution etc) and the material surfaces (e.g. hydrophilicity/hydrophobicity,
chemical composition, surface charge, surface topography etc).
The main mechanisms of protein immobilization on a surface includes covalent binding to a
functional surface and physical adsorption to a solid surface. Both strategies have been em-
ployed for bio-functionalization of surfaces.
1.3.2 Chemical Patterning
Micro/nano fabrication techniques were originally developed to manufacture integrated circuits
[132] [133], but their applications are increasing in other fields including biology, biotechnology
and biomedical science and engineering [134][135][136]. In the field of cell biology, combined
41

CHAPTER 1. INTRODUCTION
with surface chemistry and material science knowledge, micro/nano fabrication techniques have
provided new tools to further explore and guide cellular processes such as adhesion, spread-
ing, motility, and proliferation and thus explore the interaction of cells with their environment
[135][137]. A wide number of techniques have been developed for producing patterned surfaces
at the micro and nano scales. This techniques can be generally classified into two distinct ap-
proaches; “top-down” and “bottom-up” methods according to the process involved in creating
the patterned surface [136] [137]. The top-down approach produces micro/nano scaled structures
with specific shapes and characteristics starting from larger dimension [136], a simple way to il-
lustrate a top-down method is to think of “carving a statue out of a large block of marble” [138].
This approach includes various methods of lithography (e.g. photolithography, colloidal lithog-
raphy, nanoimprint lithography block copolymer lithography etc) [139]. In contrast, the bottom
up, works in the opposite direction. It relies on assembling smaller building blocks into larger
entities. The method resembles “building with Lego bricks” [138]. It includes methods such as
chemical vapor deposition, sol-gel synthesis and molecular self-assembly (see, for example, [136]
and references there in).
It is also relevant to note that patterning processes can be divided into serial and parallel tech-
niques. In serial techniques, the patterning is performed by step by step processes, which reduce
the writing speed (the area that can be exposed per unit time), and may be very long and
costly. In contrast, in parallel techniques, a complete fabrication process is used to pattern large
areas. Writing speed and resolution (i.e. the size of the smallest pattern feature that can be
fabricated), are two important parameters characterizing the patterning techniques, which very
often, are hard to reconcile, since the methods with very high resolution involve very slow writing
speeds [140].
This section will be dedicated to describing the major fabrication techniques for preparing micro
and nano patterns used in the field of cell biology and biophysics.
1.3.2.1 Photolitography
Traditionally, photolithography was used in the semiconducter industry for patterning metal in
electronic microcircuits. Later, it was extensively used for patterning proteins and cells. To
create a pattern on the surface of a substrate, photolithography requires the use of a photoac-
tive polymer, a photoresist. Two standard type of photolitography exists: positive and negative
(Figure 1.13).
In both cases it consists on the following steps: the substrate is coated by a photoresist (light
sensitive organic polymer, such as PMMA or SU-8) on the surface, and then exposed to ultravi-
olet light through a mask containing the desired pattern.
For a positive resist, the area exposed to light will break down and be washed away and for
a negative one, the opposite will happen. A negative resist is more resistant to solvent since it
42

CHAPTER 1. INTRODUCTION
Figure 1.13 – Photolitography using positive and negative photoresist. Adapted from[141].
will be cross-linked. After developing, the pattern remains on the surface and the photoresist
can act as mask or master for patterning material of interest. The photoresist is then removed
to expose the remaining areas. This technique was extensively used to create cell adhesive and
cell resistant micropatterns, for example by patterning amine terminated alkyl-silanes on a glass
surface through the photoresist mask, than the non-amine coated surface, created after removing
the photoresist, is backfilled with a cell repelling material such as methyl terminated alkyl silanes
[142].
Protein patterns were also generated by photolithography, by immobilizing proteins on thiol
terminated siloxane films that have been patterned by irradiation with UV light [143], and by
covalently linking protein to photosensitive group [144]. Further, thin gold layers have been pho-
tolithographically patterned onto glass surfaces then the gold patterns were reacted with amine
terminated alkyl-thiols, and the glass background with PEG-silanes [145].
In cell and protein patterning technologies, photolithography has become a dominating technique
[146]. However this approach generally suffers from the need for clean-room based facilities which
are expensive and/or inaccessible for many researchers. Photolithography by itself is also not
well suited for introducing either chemical functionalities which may denature and deactivate
biomolecules, or delicate ligands required for bio-specific adsorption onto surfaces. It also cannot
be used to pattern non-plannar substrates. Photolithography can be used to produce patterns
43
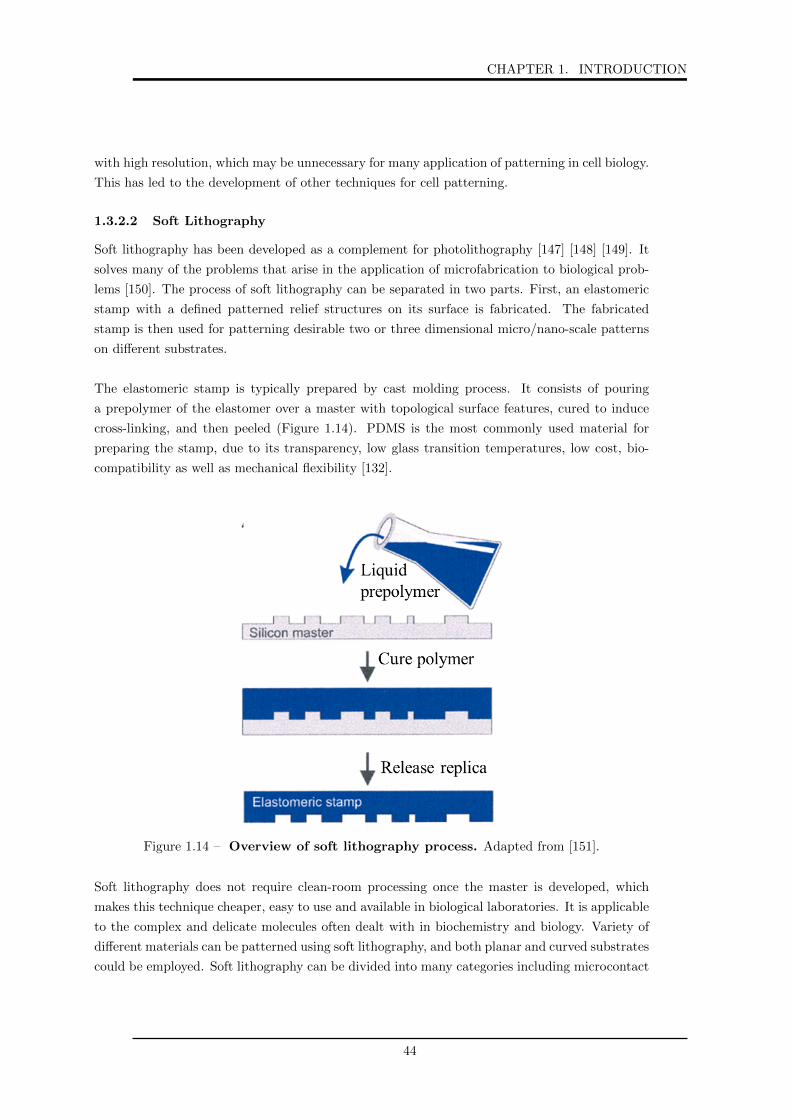
CHAPTER 1. INTRODUCTION
with high resolution, which may be unnecessary for many application of patterning in cell biology.
This has led to the development of other techniques for cell patterning.
1.3.2.2 Soft Lithography
Soft lithography has been developed as a complement for photolithography [147] [148] [149]. It
solves many of the problems that arise in the application of microfabrication to biological prob-
lems [150]. The process of soft lithography can be separated in two parts. First, an elastomeric
stamp with a defined patterned relief structures on its surface is fabricated. The fabricated
stamp is then used for patterning desirable two or three dimensional micro/nano-scale patterns
on different substrates.
The elastomeric stamp is typically prepared by cast molding process. It consists of pouring
a prepolymer of the elastomer over a master with topological surface features, cured to induce
cross-linking, and then peeled (Figure 1.14). PDMS is the most commonly used material for
preparing the stamp, due to its transparency, low glass transition temperatures, low cost, bio-
compatibility as well as mechanical flexibility [132].
Figure 1.14 – Overview of soft lithography process. Adapted from [151].
Soft lithography does not require clean-room processing once the master is developed, which
makes this technique cheaper, easy to use and available in biological laboratories. It is applicable
to the complex and delicate molecules often dealt with in biochemistry and biology. Variety of
different materials can be patterned using soft lithography, and both planar and curved substrates
could be employed. Soft lithography can be divided into many categories including microcontact
44

CHAPTER 1. INTRODUCTION
printing, microfluidic patterning and stencil patterning.
1.3.2.3 Micro/Nano Contact Printing
Microcontact printing (µCP) was invented by the Whitesides group in 1993 [152] [133] [153]. It
is a form of soft lithographic techniques. It transfers molecules to glass or gold surfaces using
elastomeric stamps structured at micro or nano-scale. µCP is now an ubiquitous tool in different
types of biological studies [153] [154] [53] [155] [133]. It consists of two consecutive steps: inking
and printing. First, a silicon rubber stamp, is coated with a thin layer of material known as ink
(such as proteins or alkanethiol), then the coated ink is dried by compressed nitrogen or air and
transferred to another surface by conformal contact between the two surfaces [133] [132] [156].
Often the non-coated regions of the substrate are backfilled with another molecule. The advan-
tages of this technique include its cost effectiveness, relatively simple fabrication process, ease of
use, the possibility to pattern large area and high versatility [157] [55] [158]. Thus, it has been
used to pattern a wide variety of materials, including colloid crystals [159], thermoplastics [160],
biomolecules [53] [151] [161], metal [162], polyelectrolytes [163] and semiconductor nanoparticles
[164].
In particular, µCP of proteins has helped the advancement of tissue constructs [166], biosensors
[154] and cell biology research [167] [168]. Bernard et al. first used µCP to pattern proteins using
an elastomeric stamp made of PDMS [169]. Since then, patterning proteins using these kind of
stamps has become of interest in cell biology studies. One important particularity in µCP is the
limited diffusion of proteins following the adsorption due to the absence of a viscous liquid ink
during the printing [161]. This makes the proteins behave as globular particles immobilized on
the stamp after adsorption and thus, transferred with good accuracy [170]. But one drawback
of the method is that the protein is dried before stamping which may denature the protein.
The mechanism of transfer of the protein from the stamp to the substrate is still debated. Tan
et al. found that as expected, microcontact printing of proteins occurs from low to high energy
surface. In fact, they demonstrated that the transfer efficacy diminishes with the decreasing of
the surface energy [171]. This was later confirmed by Kaufman et al. who found, using various
stamp materials and surfaces, that transfer of protein must occur from low to high energy sur-
faces [170]. Following that, Ricoult et al. introduced the humidified microcontact printing which
can transfer proteins adsorbed onto a stamp to both low energy and high energy surfaces due
to the water vapor diffusing through the stamp. More studies are still needed to understand the
molecular factors governing the transfer in proteins µCP.
µCP techniques, and their offshoots depend on the high affinity of the ink molecules for the
target surface [172]. The transfer of molecules from the stamp to the substrate using µCP re-
quires a higher attractive interaction of the molecules with the substrate than with stamp. The
resolution obtained by microcontact printing is limited by diffusion of the printed molecules,
both before and after contact (the ink tend to run), but also by the deformation and distortion
45

CHAPTER 1. INTRODUCTION
Figure 1.15 – Schematic representation of the microcontact printing process. Adaptedfrom [165].
suffered by the elastomeric stamp which limit the smallest feature size [173]. Thus, one of the
major challenges for µCP was to achieve the capability to print with high resolution, i.e. with
lateral dimension lower than 100 nm. This was achieved by improving the stability of the PDMS,
by fixing a stiff backplane to the stamp or by changing the chemical formulation of the stamp
itself, in order to obtain a harder polymer. With these modification, it is now possible to print
features as small as 50 nm [174] [138]. Hence, this technique has now been extended to the
nano-scale and is called nano-contact printing [175] [176] [177].
µCP was historically associated with stamping self assemble monolayers (SAMs). SAM are
ordered molecular assemblies formed spontaneously on surfaces by adsorption from a solution
or gaz phase, and are organized into more or less, large ordered domains [178]. In some cases
molecules that form the monolayers do not interact strongly with the substrate, but in other
cases, the molecules consists of a head group that has a high affinity to the substrate and an-
46

CHAPTER 1. INTRODUCTION
chors the molecule to it [178]. In the latter case, the “head groups” assemble together on the
substrate, while the “tail groups” assemble far from the substrate (Figure 1.16). The nature of
Figure 1.16 – Schematic representation of SAM. Shaded circle indicates chemisorbing headgroup and open circle end group, which can be chosen from variety of chemical functionalities.Adapted from [179].
the head group determines largely the properties of surfaces covered with the SAMs.
The adsorption of alkanethiols on gold, silver, copper, etc, form the most studied class of SAMs
[180]. Besides, silane-based molecules, such as tricholorsilane and tetramethylsilane, can react
with hydroxyl group on a substrate [181]. SAMs have been used as model surfaces studies in-
volving biological components, since they can provide a range of chemical functionality at their
interface with aqueous solution. Furthermore, by integrating with µCP, SAMs could be easily
patterned with features down to 100 nm in size [178] [152], which enables selective immobilization
of proteins and cells on substrate. Patterns of SAMs are created by printing either alkylsilane or
hydrophobic alkanthiols onto a substrate. Hydrophilic molecules, such as silanated polyethylene
glycol, are used to coat the remaining bare substrate in order to produce a bioinert SAM sur-
rounding the hydrophobic areas. Proteins are then adsorbed to the hydrophobic regions creating
protein patterns for cell studies [182].
1.3.2.4 Nanoimprint Lithography
Nanoimprint lithography (NIL) is an important top-down lithographic method for advanced
nanostructure fabrication, it is based on the mechanical embossing principle. The concept of
NIL is to use a hard master with 3D nanostructure to mould another material, which assumes
its reverse 3D structure [138].
Two basic steps are required: in the first step a nanostructured mold is pressed into a thin
resist (usually a heat or UV exposure curable monomer or a polymeric material) cast on a sub-
strate. The mold is then removed (the adhesion of the resist with the template can be controlled
by choosing the desired properties of the resist). The nanostructures are therefore duplicated in
the resist which creates a thickness contrast pattern. The second step consists in removing the
47
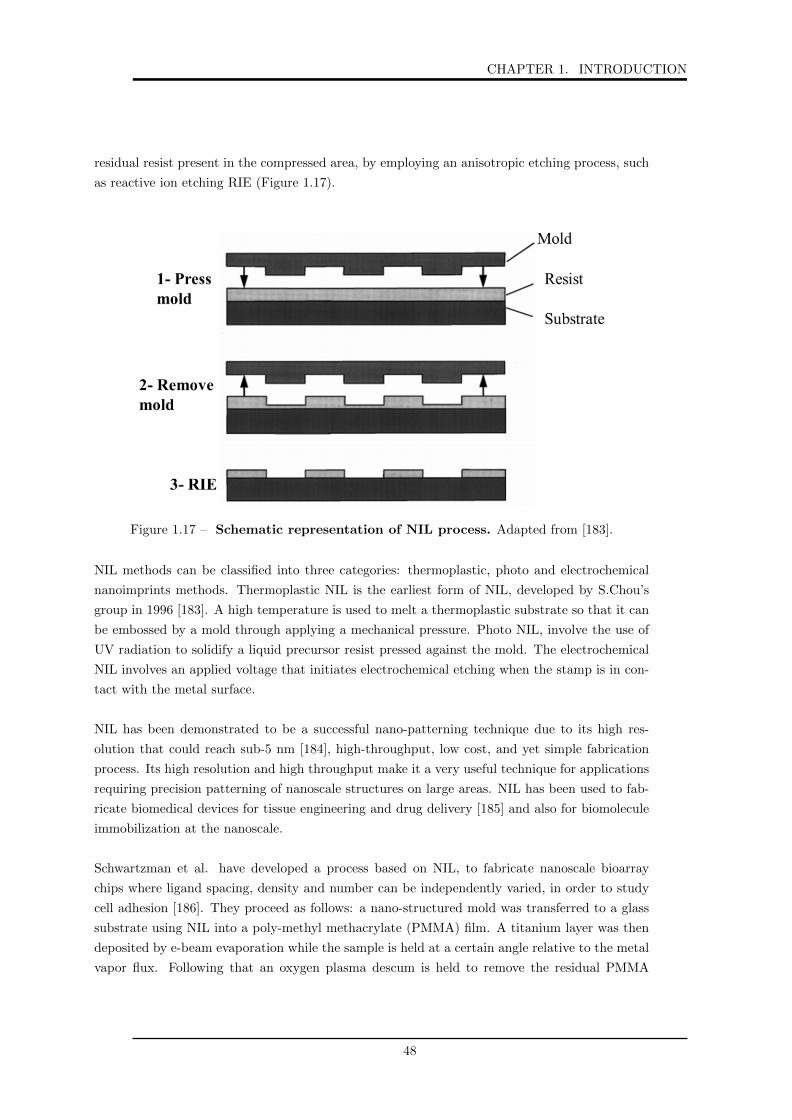
CHAPTER 1. INTRODUCTION
residual resist present in the compressed area, by employing an anisotropic etching process, such
as reactive ion etching RIE (Figure 1.17).
Figure 1.17 – Schematic representation of NIL process. Adapted from [183].
NIL methods can be classified into three categories: thermoplastic, photo and electrochemical
nanoimprints methods. Thermoplastic NIL is the earliest form of NIL, developed by S.Chou’s
group in 1996 [183]. A high temperature is used to melt a thermoplastic substrate so that it can
be embossed by a mold through applying a mechanical pressure. Photo NIL, involve the use of
UV radiation to solidify a liquid precursor resist pressed against the mold. The electrochemical
NIL involves an applied voltage that initiates electrochemical etching when the stamp is in con-
tact with the metal surface.
NIL has been demonstrated to be a successful nano-patterning technique due to its high res-
olution that could reach sub-5 nm [184], high-throughput, low cost, and yet simple fabrication
process. Its high resolution and high throughput make it a very useful technique for applications
requiring precision patterning of nanoscale structures on large areas. NIL has been used to fab-
ricate biomedical devices for tissue engineering and drug delivery [185] and also for biomolecule
immobilization at the nanoscale.
Schwartzman et al. have developed a process based on NIL, to fabricate nanoscale bioarray
chips where ligand spacing, density and number can be independently varied, in order to study
cell adhesion [186]. They proceed as follows: a nano-structured mold was transferred to a glass
substrate using NIL into a poly-methyl methacrylate (PMMA) film. A titanium layer was then
deposited by e-beam evaporation while the sample is held at a certain angle relative to the metal
vapor flux. Following that an oxygen plasma descum is held to remove the residual PMMA
48

CHAPTER 1. INTRODUCTION
Figure 1.18 – Fabrication of the nanoscale bioarrays chips. (a) Schematic fabricationof AuPd nanodot arrays. (b-d) SEM of arrays of sub-10 nm functionalized nanodots arrangedin dimers, trimers and extended hexagons. (e) Biofunctionalisation scheme of AuPd nanodots.Adapted from [186].
left after the imprint step. As a result, a robust motif for the definition of the final pattern
is obtained. Following that, a thin film of AuPd is deposited by e-beam evaporation, followed
by lift off done by immersion in boiling acetone. Finally a thermal annealing step is added to
transform the size and the shape of the patterned AuPd dots (Figure 1.18 a). Scanning electron
microscopy (SEM) of the pattern obtained at the end of the process is shown in figure 1.18
b-d. The AuPd nanodots pattern were then functionalized with a mixed monolayer of thiolated
polyethylene glycol (PEG) and thiolated PEG-biotin, and the surrounding bare glass was passi-
vated with PEG silane against non specific binding of proteins. Finally the protein of interest are
bounded to the biotin (Figure 1.18 e) [187][186]. This present a successful strategies for creating
biochemically funtionalized nanodots, with a high and accurate resolution for biological studies.
However, it relies on the functionalization of gold nanodots and thus is limited by the biochem-
istry and optical properties of gold which make difficult the use of advance optical imaging such
as total internal reflection fluorescence microscopy (TIRFM) and reflection interference contrast
49

CHAPTER 1. INTRODUCTION
microscopy (RICM) [124].
1.3.2.5 Dip-Pen Nanolithography
Dip-pen nanolithography (DPN) is a scanning probe based lithography technique developed by
Mirkin’s group in 1999 where it was used for transferring thiol molecules to a freshly prepared
gold surface [188]. DPN can be used to deposit molecules and materials on surfaces with sub-50
nm resolution. This technique relies on using an ink coated atomic force microscope (AFM) tip,
to “write” patterns directly on different substrates with a variety of materials including polymer
[189], proteins [190], DNA [191], peptides [192], bacteria [193] and so on. The AFM probe is
coated with a thin film of the material of interest by immersing the cantilever in a solution or
by evaporation. The material molecules are then deposited onto a substrate surface during the
contact between the coated tip and the substrate (Figure 1.19).
Figure 1.19 – Schematic illustration of dip-pen nanolithography. Adapted from [194].
The process of DPN is highly influenced by several parameters including: environmental condi-
tions (i.e. humidity and temperature), chemical and physical properties of substrate surface (e.g.
roughness, grain size), the reactivity of the ink with the substrate and tip coating procedures.
The transport of ink-molecules, as well as the contrast of the AFM image are regulated by the
surface roughness.
DPN is considered as one of the most flexible methods in terms of choice of molecules and
surfaces [195], and has been successfully used in various applications including biosensor, and
few cell biology studies such as cell signaling, activation, adhesion and migration [196] [195] [197].
However, even after massive parallelization [188] [190], DPN remains a time-consuming technique
for extensive use in biology laboratory, and requires the use of specialized facilities and inks with
special properties.
1.3.2.6 Block Copolymer Micelles Nanolithography
Block copolymer micelles nanolithography (BCML), is a straightforward strategy to generate
periodic nano-scale structures over large areas or “structures where nanometer-sized objects are
separated by nanoscopic length scales” [198]. A block copolymer molecule contains two or more
polymer chains (blocks) attached by a covalent bond. Di-block copolymers consist of two polymer
50
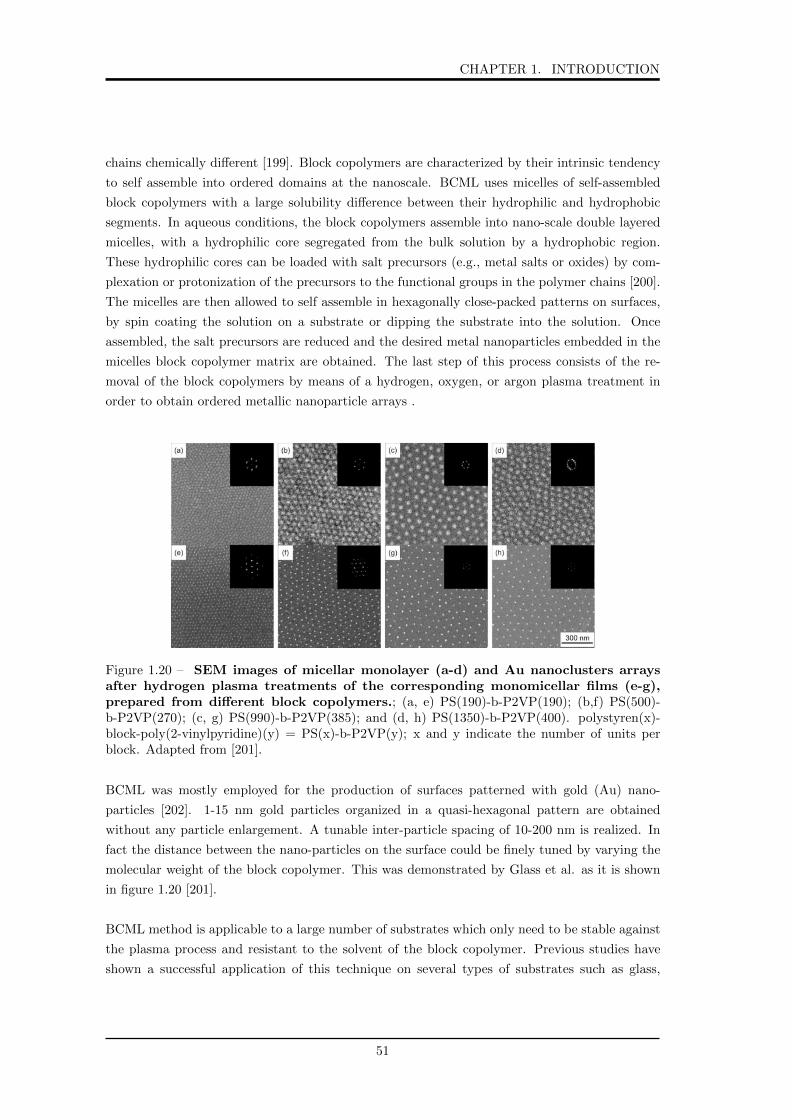
CHAPTER 1. INTRODUCTION
chains chemically different [199]. Block copolymers are characterized by their intrinsic tendency
to self assemble into ordered domains at the nanoscale. BCML uses micelles of self-assembled
block copolymers with a large solubility difference between their hydrophilic and hydrophobic
segments. In aqueous conditions, the block copolymers assemble into nano-scale double layered
micelles, with a hydrophilic core segregated from the bulk solution by a hydrophobic region.
These hydrophilic cores can be loaded with salt precursors (e.g., metal salts or oxides) by com-
plexation or protonization of the precursors to the functional groups in the polymer chains [200].
The micelles are then allowed to self assemble in hexagonally close-packed patterns on surfaces,
by spin coating the solution on a substrate or dipping the substrate into the solution. Once
assembled, the salt precursors are reduced and the desired metal nanoparticles embedded in the
micelles block copolymer matrix are obtained. The last step of this process consists of the re-
moval of the block copolymers by means of a hydrogen, oxygen, or argon plasma treatment in
order to obtain ordered metallic nanoparticle arrays .
Figure 1.20 – SEM images of micellar monolayer (a-d) and Au nanoclusters arraysafter hydrogen plasma treatments of the corresponding monomicellar films (e-g),prepared from different block copolymers.; (a, e) PS(190)-b-P2VP(190); (b,f) PS(500)-b-P2VP(270); (c, g) PS(990)-b-P2VP(385); and (d, h) PS(1350)-b-P2VP(400). polystyren(x)-block-poly(2-vinylpyridine)(y) = PS(x)-b-P2VP(y); x and y indicate the number of units perblock. Adapted from [201].
BCML was mostly employed for the production of surfaces patterned with gold (Au) nano-
particles [202]. 1-15 nm gold particles organized in a quasi-hexagonal pattern are obtained
without any particle enlargement. A tunable inter-particle spacing of 10-200 nm is realized. In
fact the distance between the nano-particles on the surface could be finely tuned by varying the
molecular weight of the block copolymer. This was demonstrated by Glass et al. as it is shown
in figure 1.20 [201].
BCML method is applicable to a large number of substrates which only need to be stable against
the plasma process and resistant to the solvent of the block copolymer. Previous studies have
shown a successful application of this technique on several types of substrates such as glass,
51
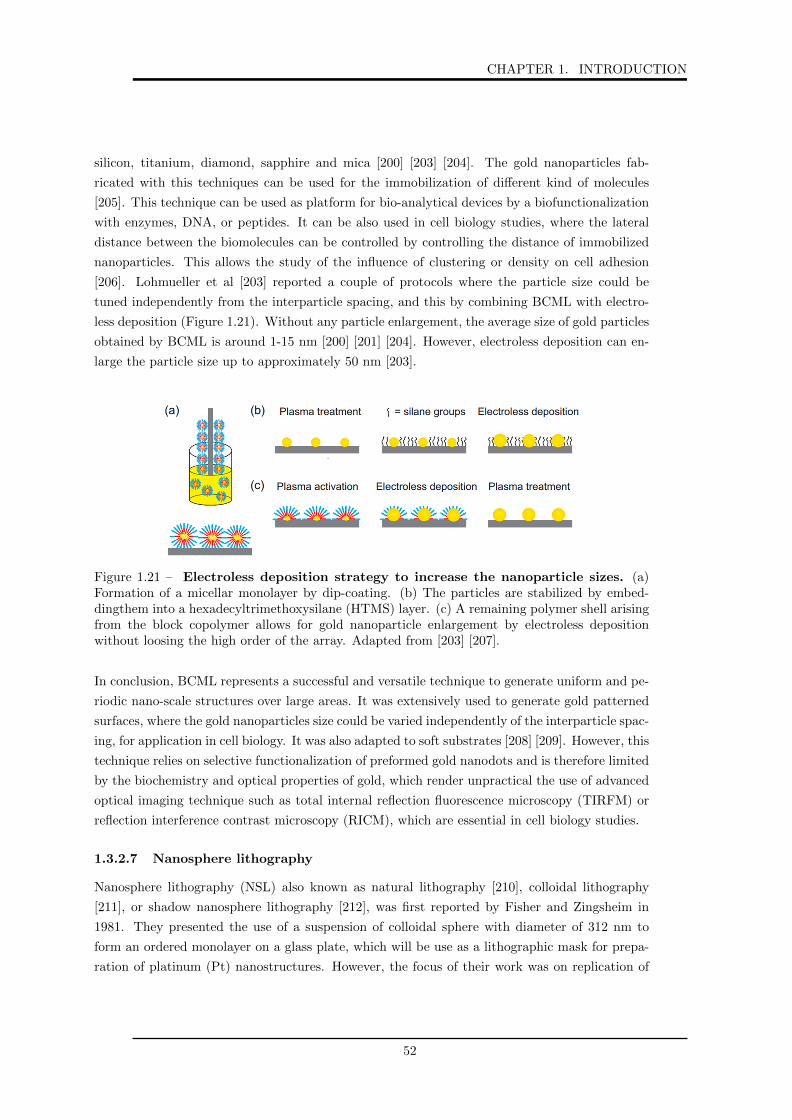
CHAPTER 1. INTRODUCTION
silicon, titanium, diamond, sapphire and mica [200] [203] [204]. The gold nanoparticles fab-
ricated with this techniques can be used for the immobilization of different kind of molecules
[205]. This technique can be used as platform for bio-analytical devices by a biofunctionalization
with enzymes, DNA, or peptides. It can be also used in cell biology studies, where the lateral
distance between the biomolecules can be controlled by controlling the distance of immobilized
nanoparticles. This allows the study of the influence of clustering or density on cell adhesion
[206]. Lohmueller et al [203] reported a couple of protocols where the particle size could be
tuned independently from the interparticle spacing, and this by combining BCML with electro-
less deposition (Figure 1.21). Without any particle enlargement, the average size of gold particles
obtained by BCML is around 1-15 nm [200] [201] [204]. However, electroless deposition can en-
large the particle size up to approximately 50 nm [203].
Figure 1.21 – Electroless deposition strategy to increase the nanoparticle sizes. (a)Formation of a micellar monolayer by dip-coating. (b) The particles are stabilized by embed-dingthem into a hexadecyltrimethoxysilane (HTMS) layer. (c) A remaining polymer shell arisingfrom the block copolymer allows for gold nanoparticle enlargement by electroless depositionwithout loosing the high order of the array. Adapted from [203] [207].
In conclusion, BCML represents a successful and versatile technique to generate uniform and pe-
riodic nano-scale structures over large areas. It was extensively used to generate gold patterned
surfaces, where the gold nanoparticles size could be varied independently of the interparticle spac-
ing, for application in cell biology. It was also adapted to soft substrates [208] [209]. However, this
technique relies on selective functionalization of preformed gold nanodots and is therefore limited
by the biochemistry and optical properties of gold, which render unpractical the use of advanced
optical imaging technique such as total internal reflection fluorescence microscopy (TIRFM) or
reflection interference contrast microscopy (RICM), which are essential in cell biology studies.
1.3.2.7 Nanosphere lithography
Nanosphere lithography (NSL) also known as natural lithography [210], colloidal lithography
[211], or shadow nanosphere lithography [212], was first reported by Fisher and Zingsheim in
1981. They presented the use of a suspension of colloidal sphere with diameter of 312 nm to
form an ordered monolayer on a glass plate, which will be use as a lithographic mask for prepa-
ration of platinum (Pt) nanostructures. However, the focus of their work was on replication of
52

CHAPTER 1. INTRODUCTION
submicroscopic patterns using visible light, and not realization of lithographic colloidal masks
[213]. One year later, Deckman and Dunsmuir extended the idea of this technique and showed
that a monolayer of nanospheres can be used both as a “deposit material” or as a “lithographic
mask” [210]. Since the pioneering works of Fisher et al. and Deckman et al., new approaches
have been developped to improve the NSL method, in order to fabricate colloidal masks with
better quality and more sophisticated nanostructures depending on application.
Figure 1.22 – Schematic illustration of nanosphere lithography. (a) Cleaning of thesubstrate and deposition of the colloidal suspension. (b) Self assembly of the colloidal suspensionon the substrate. (c) Deposition of the material of interest. (d) Removal of the spheres. Adaptedfrom [214].
Using this technique, regular and homogeneous arrays of nanoparticles are produced. The pro-
cess begins with self assembly of a nanosphere mask (e.g polystyrene or silica) onto a substrate,
followed, upon drying, by deposition of a material(s) through the holes of the ordered nanosphere
mask. The mask is then removed by sonication in an adequate solvent or by stripping. An array
of ordered nanodots on the surface of the substrate is formed. The supporting substrate under-
neath the nanospheres could be glass, mica, silica and copper, and the deposited material could
be noble metal, semiconductor materials, magnetic materials, polymers and proteins.
53

CHAPTER 1. INTRODUCTION
The nanosphere diameter determines the size and inter-spacing distance of the NSL produced
nanoparticles, thus the dot size could not be varied independently of the dot spacing, which in
cellular study is an important requirement. To overcome this problem, a suggestion was the heat
treatment of polystyrene beads [215] [216], but this process was difficult to control and till now
no biological studies were reported using this process. Another suggestion was to use reactive ion
etching in order to reduce the bead size, but the defect of this strategy is that it is applicable for
areas of few tens of microns only [211]. Following that Pi and colleagues, reported a NL based
technique, creating nanodots whose size could be tuned independently of the spacing, and used
this strategy to pattern glass as well as soft PDMS (the method will be explained in more details
in section 1.3.4.2.3).
NSL has been shown to be a powerful process with a wide potential of interest for the field
of nano and microfabrication, it is an effective technique for high throughput fabrication of
various arrays of periodic structures.
1.3.3 Soft substrates
1.3.4 Polymers
Polymers are substances whose molecules have high molar masses and are composed of a large
number of small repeating units (called monomers). Monomers are usually connected by covalent
chemical bonds and have a wide range of physical and chemical properties. Polymers properties
can be easily tailored for specific technological and scientific applications, they can be also easily
fabricated in a variety of shapes. This gives the polymers an advantage over ceramics and metals
for use as biomaterials. The microscopic properties of polymers are specially related to their
microstructure and to the physical arrangement of the repeating units along the backbone of the
chain. Thus polymeric materials could fall into linear, branched or cross-linked architectures.
Polymers could be produced with a wide range of physical and chemical properties which make
them good materials for choice in biological applications.
1.3.4.1 Hydrogels
Hydrogels are popular materials for biological applications since they exhibit properties like that
of natural soft tissue and have tunable properties. The first application of hydrogel in the medi-
cal sector was published in 1960, when Wichterle and Lim introduced the hydrophilic networks
of cross-linked poly(2-hydroxyethyl methacrylate) (pHEMA) as soft contact lens material [217].
Since then, hydrogels were considered as promising biomaterials for application in biomedical sec-
tors. The most frequent definition for hydrogels was given by Peppas, according to, hydrogels are
three dimensional, hydrophilic, polymeric networks capable of imbibing large amounts of water or
biological fluids which make them resemble to a large extent, biological tissues. Their polymeric
networks are comprised of homopolymer or copolymers that are insoluble due to the presence
of physical cross-links (chain entanglements or crystallites), or chemical cross-links (tie-points,
junctions), or association bonds including hydrogen bonds or strong van der Waals interactions
54

CHAPTER 1. INTRODUCTION
between chains [218].
Hydrogels can be separated into two groups based on their natural or synthetic origins. The
hydrogel technology may be applied to biomedical implants [219] , tissue engineering [220], di-
agnostics [221], food additives [222], drug delivery systems [223], barrier materials to regulate
biological adhesion [224] and contact lenses [225].
In the context of cell biology, forming hydrogels typically involves either encapsulation of vi-
able cells within the material or fabrication of substrates using molds that are later seeded with
cells. Hydrogel formation involves the transition of liquid precursor solutions into solid materials,
which can be achieved using either physical (noncovalent) or chemical (covalent) crosslinking to
assemble the hydrogel components [226]. The mechanical stiffness of hydrogels was used in sev-
eral biological applications including apoptosis, proliferation, differentiation, cell adhesion and
traction force. Therefore, the creation of hydrogel system with varying stiffness was desirable
to provide suitable mechanical environment for different cell types, and to extend the study of
substrate elasticity effect on cells. The advantage of these gels include the fact that they produce
a linear deformation in response to a wide range of stress and show a rapid and complete recovery
on removal of the stress. In addition the rigidity of the gels can be easily manipulated by vary-
ing the concentration of the bis-acrylamide crosslinker. Polyacrylamide hydrogels are clear and
non-fluorescent, which facilitate microscopic visualization of cellular processes. Furthermore, it is
possible to covalently link proteins of interest to the otherwise nonadhesive substrate surface. PA
have been widely used to create substrates with elastic moduli in the range of 0.1 kPa to 100 kPa,
covering the range of many types of soft tissues in the body [83] [66] [227] [228] [229]. PA gels
were also used to measure the intracellular traction forces of cells. In such technique fluorescent
beads- embedded polyacrylamide gels, and the cultured cells on the substrate generated traction
forces that deformed the gel structure. The deformation are then detected by the movement of
the embedded beads. Even though this technique improved our knowledge of traction response in
cells, it could not determine the location and direction of point forces, and the magnitude of the
force which was difficult to calculate [67] [230]. These limitations were overcome by use of high
density elastomeric micropost force sensor. This opened a route to experimentally investigate
the force transmitted by the cell to its environment [231] [232] [233] [234].
1.3.4.2 Elastomers
The different elastomers, natural and synthetic, could be produced with a wide range of chemical,
physical and mechanical properties (stiffness, strength, heat resistance, density) and even price,
which allows for great selection and matching of elastomer structural and mechanical properties
for scientific and technological applications. For biological applications, polydimiethylsiloxane
(PDMS), organosilicone elastomer, has been extensively used as a material to study cell behavior
because of its biocompatibility and the tunable mechanical properties that cover a wide range of
biological tissue stiffness [235] [236].
55

CHAPTER 1. INTRODUCTION
1.3.4.2.1 Polydimethylsiloxane (PDMS)
PDMS is an elastomeric compound, easy to deform and release from features of a mold without
damage. PDMS is used to reproduce with high fidelity microfluidic channels or other features
with micron scale dimensions [237] and can even form structures which feature sizes down to 100
nm [152] [238] [239], for example for molds and stamps for nano-imprint lithography [149] [240].
It offers a long list of beneficial properties. It is a material that is fairly inexpensive, optically
transparent, non toxic, permeable to gases, durable, non fluorescent, biocompatible, chemically
inert, easy to mold into (sub)micrometer features, can easily bond to itself or to glass and have a
high modulus of elasticity [241] [242] [243]. Unsurprisingly therefore, PDMS is a widely used ma-
terial in multiple fields of applications including microfluidics [244][241] [245], biomaterials [246],
tissue engineering [152], and medical applications as intraocular lenses, breast implants and car-
diac valves. Besides its well-known superior elasticity and flexibility in mechanical applications,
it is the biocompatible material aspect of PDMS which makes it attractive as a substrate for cell
arrays fabrication [247] and fundamental cellular studies [235] [127], that is of most interest in
this work.
1.3.4.2.2 Surface Modification of PDMS
Despite the many advantages that PDMS present for cell biology studies, including deforma-
bility and permeability of gas, using PDMS in biology studies can present problems. In fact,
PDMS is known to be extremely hydrophobic and chemically inert, due to the closely packed
methyl groups on its surface. Thus, its use in biology is limited, since most of biological ex-
periments are performed in aqueous media. Moreover cell adhesion is inhibited on hydrophobic
materials which limit the use of PDMS in devices which are dependent on adherent cells [248]. To
overcome this limitations, biologically active PDMS were created by modification of its surface
through passive coating or covalent linkages.
Passive coating technique modify PDMS surface by depositing materials such as protein, lipid
bilayers and polyelectrolytes [163]. The deposition techniques include chemical vapor deposition
[249], Langmuir-blodgett film formation and diffusion from solutions. Passive coating is simple
and quick, however it relies on weak physical interactions to adhere the material of interest to
the PDMS surface, which make the coating unstable and easily damaged. Covalent modification
could improve these difficulties and increase the stability of the coatings. Covalent coating in-
clude silanization, to create covalently linked coating, by first oxidizing the PDMS surface than
exposing it to a chemical silanizing agent [250].
1.3.4.2.3 Nano-patterning of soft substrates
Hard surfaces like glass or silicon are mechanically very different from the physiological state
of cells. Therefore, chemically patterning soft substrates is generating a lot of interest in the
domain of cell biology, to create surfaces that better mimic the real environment of the cell.
But so far, to our knowledge there is only one available technique to do so. This technique is
56

CHAPTER 1. INTRODUCTION
based on patterning soft hydrogels by employing BCML (see section 1.3.2.6) for the production
of surface patterned with gold nanoparticles on a solid template, then transferring the pattern
to a polymeric hydrogel [208] [209] [251] [252]. These nanoparticles are used for immobilization
of active biomolecules. However, this technique is limited by the optics and chemistry of gold, as
well as being applicable only to hydrogels. In our group, Pi and colleagues, reported a NL based
technique, creating nanodots whose size could be tuned independently of the spacing, and used
this strategy to pattern glass as well as soft elastomer (PDMS). They proceeded as follows: a
primary silica bead mask was self-assembled on an hydrophilic glass substrate, resulting in two
dimensional monolayer of colloidal beads, then a secondary aluminum mask was deposited by
sputtering, resulting after removing of the beads, a well defined array of pits giving access to
the glass substrate for further deposition. They observed that by tuning the thickness of the
deposited aluminum layer, the later size of the pits could be tunned. The resulting substrate
was further bio-functionalized with proteins and used to study T-cell adhesion or to transfer the
protein pattern to the surface of soft PDMS elastomer by contact printing [253]. This technique
removes the constraint of using gold particles, and provides a powerful tool for cell biology studies.
The strategy demonstrated by Pi et al. is the starting point of this thesis.
1.4 Thesis outline
Studies have demonstrated that cells are mechanosensitive, behaving differently on stiff or soft
substrates. It was also shown that cells are able to respond to the nanoscale organization of
active biomolecules. To enable systematic inquiry into this, micro/nano fabrication method-
ologies have become key methods to design model substrates that mimic spatial aspects of the
cell microenvironment, and permit a deep study into cell behaviors including cell adhesion and
mechanics. However, there is only one unique study reported in literature where cell behavior on
soft patterned substrate could be explored [13]. Here rat embryonic fibroblast cells (REF52) were
imaged in epi-fluorescence on substrates with varying ligand clustering and elasticity, showing
that for the considered cell type and parameter range, increasing ligand clustering and increasing
stiffness tends to influence adhesion in a similar manner.
The aim of this thesis was to develop elastomer substrates with both controlled elasticity and
chemical patterning, and to explore T-cell adhesion and activation on these substrates.
The thesis is presented in six chapters which are organizing as follows:
Chapter one is dedicated to the “state of the art and literature review”.
Chapter two describes the materials, methods, and protocols used and developed in this work.
Chapter 3 presents a step by step description of the printing technique that I developed. It
consists of reverse transfer of protein patterns adsorbed onto a glass surface to a variety of soft
elastomer surfaces with different elasticity.
Chapter 4 reports the efficiency of the patterning method. First, the elasticity of the elastomer
is characterized using force measurements carried out with atomic force microscopy. Then the
transfer of different proteins to a variety of silicone based elastomer surfaces is characterized
in terms of dot size, contrast and transfer ratio. The chapter ends by proposing a molecular
57

CHAPTER 1. INTRODUCTION
mechanism governing the protein transfer, based on quantifying the effective force of adhesion
of the protein on glass and PDMS using AFM force curves.
Chapter 5 concerns T-cell responses to homogeneously functionalized and patterned soft sub-
strates. Parameters such as cell adhesion area, actin cytoskeleton organization, and TCR and
ZAP-70 distribution are studied.
Chapter 6 concludes the manuscript with a summary of the thesis. It highlights the main points
of the project, and includes a discussion on the limitation of the patterning technique that I
developed and possible routes for improvements as well as suggested directions for future work.
58

Chapter 2
Materials and Methods
59
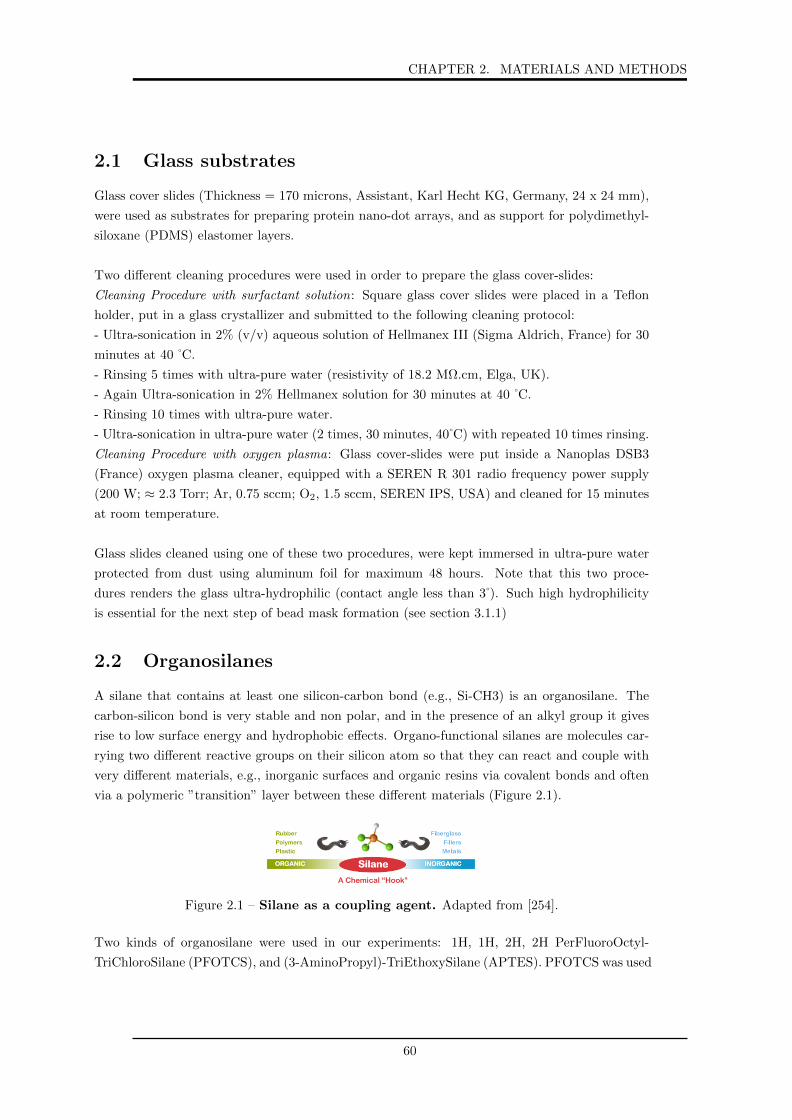
CHAPTER 2. MATERIALS AND METHODS
2.1 Glass substrates
Glass cover slides (Thickness = 170 microns, Assistant, Karl Hecht KG, Germany, 24 x 24 mm),
were used as substrates for preparing protein nano-dot arrays, and as support for polydimethyl-
siloxane (PDMS) elastomer layers.
Two different cleaning procedures were used in order to prepare the glass cover-slides:
Cleaning Procedure with surfactant solution: Square glass cover slides were placed in a Teflon
holder, put in a glass crystallizer and submitted to the following cleaning protocol:
- Ultra-sonication in 2% (v/v) aqueous solution of Hellmanex III (Sigma Aldrich, France) for 30
minutes at 40 C.
- Rinsing 5 times with ultra-pure water (resistivity of 18.2 MΩ.cm, Elga, UK).
- Again Ultra-sonication in 2% Hellmanex solution for 30 minutes at 40 C.
- Rinsing 10 times with ultra-pure water.
- Ultra-sonication in ultra-pure water (2 times, 30 minutes, 40 C) with repeated 10 times rinsing.
Cleaning Procedure with oxygen plasma: Glass cover-slides were put inside a Nanoplas DSB3
(France) oxygen plasma cleaner, equipped with a SEREN R 301 radio frequency power supply
(200 W; ≈ 2.3 Torr; Ar, 0.75 sccm; O2, 1.5 sccm, SEREN IPS, USA) and cleaned for 15 minutes
at room temperature.
Glass slides cleaned using one of these two procedures, were kept immersed in ultra-pure water
protected from dust using aluminum foil for maximum 48 hours. Note that this two proce-
dures renders the glass ultra-hydrophilic (contact angle less than 3 ). Such high hydrophilicity
is essential for the next step of bead mask formation (see section 3.1.1)
2.2 Organosilanes
A silane that contains at least one silicon-carbon bond (e.g., Si-CH3) is an organosilane. The
carbon-silicon bond is very stable and non polar, and in the presence of an alkyl group it gives
rise to low surface energy and hydrophobic effects. Organo-functional silanes are molecules car-
rying two different reactive groups on their silicon atom so that they can react and couple with
very different materials, e.g., inorganic surfaces and organic resins via covalent bonds and often
via a polymeric ”transition” layer between these different materials (Figure 2.1).
Figure 2.1 – Silane as a coupling agent. Adapted from [254].
Two kinds of organosilane were used in our experiments: 1H, 1H, 2H, 2H PerFluoroOctyl-
TriChloroSilane (PFOTCS), and (3-AminoPropyl)-TriEthoxySilane (APTES). PFOTCS was used
60

CHAPTER 2. MATERIALS AND METHODS
as a hydrophobic place-holder to graft a passifying polymer. APTES was used as certain kinds
of functionalization of elastomers. The two silane were purchased from Sigma Aldrich, France.
1H, 1H, 2H, 2H PerFluoroOctyl-TriChloroSilane (PFOTCS)
Figure 2.2 – Chemical structure of 1H, 1H, 2H, 2H PerFluoroOctyl-TriChloroSilane(PFOTCS). Source: Sigma Aldrich.
PFOTCS is a liquid chemical with molecular formula CF3(CF2)5CH2CH2SiCl3 (Figure 2.2), its
molecules form self-assembled monolayers. It was used due to its capacity to anchors on oxide
surfaces with its trichloro-silane group, and therefore to reacts with free silanol groups on the
surface of the hydrophilic glass cover-slides, forming a regular covalent bond with a low interfacial
free energy due to its heavy fluorinated tail group (Figure 2.3).
Figure 2.3 – Schematic representation of the reaction between silanol groupsof an hydrophilic glass substrates and trichloro-silane groups of PFOTCS (R=CF3(CF2)5CH2CH2). Adapted from [255].
(3-AminoPropyl)-TriEthoxySilane (APTES)
APTES is an amino-silane frequently used in the process of silanization, the functionalization of
surfaces with alkoxy-silane molecules. It is a silane coupling reagent with 3-aminopropyl group
at one end, which terminates in a primary amine and silane reactive portion on another end with
tri-ethoxy group (Figure 2.4). The chemical formula of APTES is (H2N(CH2)3Si(OC2H5)3),
with molecular weight 221.37g/mol, it is a clear liquid with density 0.946 g/mL at 25 C [256].
APTES was used to incorporate amine functionality at the polydimethylsiloxane (PDMS) sur-
face. This opens a route for facile functionalization of the modified PDMS surface with small
organic molecules or biomolecules (such as proteins). The interest of the APTES molecule is
that it can bind to the substrate forming a covalent bond, and can be bio- functionalized at the
same time.
61

CHAPTER 2. MATERIALS AND METHODS
Figure 2.4 – Chemical structure of APTES. Source: Sigma Aldrich.
2.3 Silicon elastomers/gels
Polymers are substances whose molecules have high molar masses, and are composed of a large
number of small repeating units (called monomers) that can be linked together to form long
chains, or macromolecules. Silicones are macromolecules comprised of a polymer backbone of
alternating silicon and oxygen atoms, siloxane bonds (Figure 2.5), with organic side groups, such
as methyl, phenyl or vinyl, attached to silicon. The number of repeating units, can range from
zero to several thousand. By adjusting -Si-O- chain lengths, the functionality of the side groups
and the cross-linking between molecular chains, silicones can be synthesized into an almost infinite
variety of materials, each with unique chemical properties and performance characteristics.
Figure 2.5 – Chemical structure of a siloxane unit. Adapted from [257]
2.3.1 Chemistry of PDMS
PDMS belongs to the family of silicones polymers. Silicones have a Si-O-Si backbone to which,
different organic groups can be attached through Si-C linkage giving silicones the general formula
[−OSiR′R−]n (where R and R’ refers to the organic side groups and n is an integer denoting
the number of repeating units). The presence of both the organic groups attached to an in-
organic backbone gives silicone unique properties [258]. The Si-O bond renders silicones to be
highly flexible material because of its long bond length, and a long bond angle that allows for
ease changes in conformation. PDMS trimethylsiloxy terminated, are the most common type of
silicone polymers, they have two methyl groups attached to each silicone atom, the structure is
shown in figure 2.6.
PDMS is available commercially as two-part base/current agent kit, forming an elastomeric ma-
terial after cross-linking. Sylgard 184 A and B is the most common silicone used in research and
industry. Sylgard 184 silicon networks are prepared via hydrosilylation reactions between vinyl
62

CHAPTER 2. MATERIALS AND METHODS
Figure 2.6 – PDMS chemical formula. n is the number of repeating monomer [SiO(CH3)2]Adapted from [259].
groups in the base, and Si-H groups in the cross-linkers, and this in the presence of a platinum
catalyst, which results in Si-C bond as shown in figure 2.7.
Figure 2.7 – Reaction scheme for platinum catalyzed PDMS curing. Adapted from[260].
The mixture of the two products will causes a cross-linking reaction that leads to obtain solid
PDMS. This cross-linking reaction will starts immediately after mixing the two components to-
gether. It can take place also at room temperature, but elevated temperature accelerates the
process. Because of the multiple reaction sites on both of the base and the cross-linker, a three
dimensional polymeric network is formed during cross-linking (see figure 2.7). Moreover, the
elasticity of cross-linked PDMS can be modulated by changing the mixing ratio of the base and
curring agent.
The majority of silicone elastomers, including Sylgard incorporate fillers, which acts to reinforce
the cross-linked matrix. The addition of this reinforcing fillers reduces silicones stickiness, in-
creases its hardness and enhances its mechanical strength [259].
Among silicones materials, we used in this research project, polydimethylsiloxane, also known as
PDMS, silicon rubber or Dimethicone.
Three different types of PDMS were used, they can be classified into two category:
63

CHAPTER 2. MATERIALS AND METHODS
Silicone elastomers:
- Sylgard 184 A and B (Dow Corning, USA), called Sylgard.
Silicone Gels:
- Q Gel 920 A and B (Quantum Silicones, USA), called Q Gel.
- CY 52-276 A and B (Dow Corning, Tokyo, Japan), called CY.
Silicone elastomers are cross-linked linear silicone fluids or gums with a three dimensional struc-
ture. They contain reinforcing fillers that interact with the base polymer to increase the strength
of the elastomer, and also extending fillers that help reduce the material cost. Instead, sili-
cone gels are essentially lightly cross-linked silicone fluids, and as silicone elastomers, they have a
three-dimensional structure. However, silicone gels have fewer reactive sites and higher molecular
weight starting material which allows for more entanglement, and contrary to silicone elastomers
they do not contain fillers.
2.3.2 Preparation of the PDMS layers
PDMS layer was prepared using the spin coating method, which is a common method to pro-
duce a thin, uniform polymer film on a planar substrate. In the spin coating process, a certain
amount of the polymer solution is deposited on the substrate, and the substrate is then acceler-
ated rapidly to the desired rotation rate. Liquid flows radially, owing to the action of centrifugal
force, and the excess is ejected off the edge of the substrate [261]. Final film thickness and other
properties depends on the nature of the polymer (viscosity, drying rate, surface tension, etc.),
and the parameters chosen for the spin process. Factors such as final rotational speed, accelera-
tion, and fume exhaust contribute to define the properties of the coated films. Here a POLOS,
single substrate spin coater, Spin 150i/200i was used at a typical speed of 2000 rpm and for 60
seconds. The PDMS layer is subsequently backed at an appropriate temperature on a hot plate
for a certain duration.
Figure 2.8 – Schematic representation of the spin coating process. (a)The substrateis fixed on a holder (chuck), well-centered on it, and a drop of the polymer is dispensed inthe middle of the substrate. (b) The substrate is spun at a constant speed. (c) Centripetalacceleration causes the resin to spread up to, and eventually off, the edge of the substrate leavinga thin film of resin on the surface.
64

CHAPTER 2. MATERIALS AND METHODS
The specific protocols are as follows:
CY:
- Base and curing agent, part A and B, were mixed in a 1:1 ratio by mass.
- The mixture was kept for some minutes at room temperature until the bubbles disappeared.
- ' 2ml portion of the liquid silicone mixture was dispensed on a glass substrate cleaned by
hellmanex cleaning procedure (see section 2.1) using a plastic pipette.
- Spin coating was carried out at 2000 rpm for 60 seconds.
- The samples were then cured at 100 C for 20 minutes.
Sylgard:
- Base and curing agent, part A and B, were mixed in a 10:1, 35:1 or 58:1 ratio by mass.
- The mixture was kept for 30 minutes in a vacuum desiccator in order to eliminate bubbles.
- ' 2ml portion of the liquid silicone mixture was dispensed on a glass substrate cleaned by
hellmanex cleaning procedure (see section 2.1) using a plastic pipette.
- Spin coating was carried out at 2000 rpm for 60 seconds using a spin coater.
- The samples were then cured at 125 C for 20 minutes
Q Gel:
- Base and curing agent, part A and B, were mixed in a 1:2 or 1:0.95 ratio by mass.
- The mixture was kept for some minutes at room temperature until the bubbles disappeared.
- ' 2ml portion of the liquid silicone mixture was dispensed on a glass substrate cleaned by
hellmanex cleaning procedure (see section 2.1) using a plastic pipette.
- The sample was cured at 100 C for 2 hours.
Following these procedure, a PDMS layer, supported on a glass substrate was obtained. The
thickness was measured to be between 5 and 9 µm depending on the type of the PDMS used and
the mixing ratio (see section 2.3.5).
Note that it is important to use a clean glass cover-slides for PDMS deposition, because small
air bubbles are sometimes produced at the boundary between cover-slides and silicones in case of
imperfect cleaning of the cover-slide. The procedure to produce glass supported PDMS substrate
is described, step by step, in Appendix A.1.1.
2.3.3 Chemical Structure of PDMS
Sylgard 184 is the most common liquid silicone used in research and industry. It is a poly-
dimethyl based silicone material (Figure 2.9 a), which contains reinforcing fillers (e.g, silica) that
interacts with the base polymer and increase the strength of the material [262]. This gives the
Sylgard a wide range of elasticity when changing base to cross-linker ratio. In comparison with
Sylgard, the Q gel is a polydimethyl, methyl-phenyl based material (Figure 2.9 b) and has 5.5%
phenyl polymer in its chain. In fact, the ratio of methyl to phenyl groups in the polymer control
the refractive index in the range of nD = 1.4 to 1.6 [263]. For Q Gel it’s 1.49 [264]. CY is a
polydimethyl based material, which contains no additive or fillers, but includes low molecular
siloxane D4-D10 (cyclic poly-dimethylsiloxane polymers) (Figure 2.9 c) [265] that gives it the
65
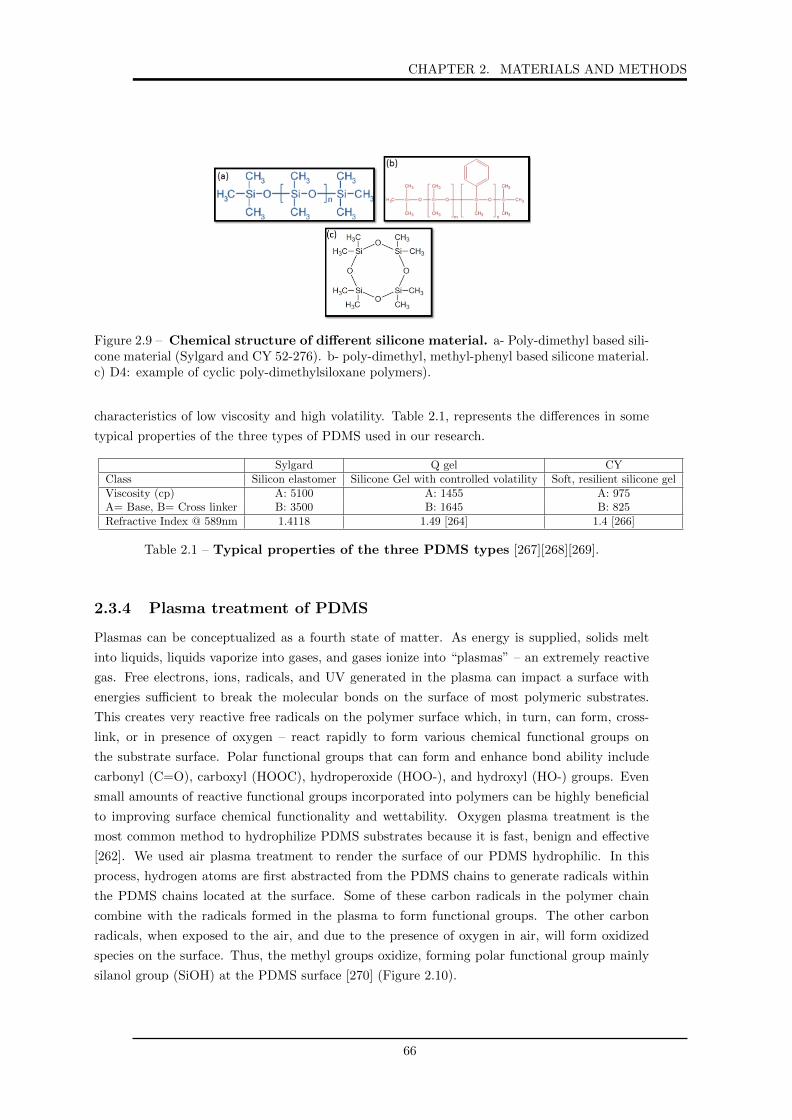
CHAPTER 2. MATERIALS AND METHODS
Figure 2.9 – Chemical structure of different silicone material. a- Poly-dimethyl based sili-cone material (Sylgard and CY 52-276). b- poly-dimethyl, methyl-phenyl based silicone material.c) D4: example of cyclic poly-dimethylsiloxane polymers).
characteristics of low viscosity and high volatility. Table 2.1, represents the differences in some
typical properties of the three types of PDMS used in our research.
Sylgard Q gel CYClass Silicon elastomer Silicone Gel with controlled volatility Soft, resilient silicone gelViscosity (cp) A: 5100 A: 1455 A: 975A= Base, B= Cross linker B: 3500 B: 1645 B: 825Refractive Index @ 589nm 1.4118 1.49 [264] 1.4 [266]
Table 2.1 – Typical properties of the three PDMS types [267][268][269].
2.3.4 Plasma treatment of PDMS
Plasmas can be conceptualized as a fourth state of matter. As energy is supplied, solids melt
into liquids, liquids vaporize into gases, and gases ionize into “plasmas” – an extremely reactive
gas. Free electrons, ions, radicals, and UV generated in the plasma can impact a surface with
energies sufficient to break the molecular bonds on the surface of most polymeric substrates.
This creates very reactive free radicals on the polymer surface which, in turn, can form, cross-
link, or in presence of oxygen – react rapidly to form various chemical functional groups on
the substrate surface. Polar functional groups that can form and enhance bond ability include
carbonyl (C=O), carboxyl (HOOC), hydroperoxide (HOO-), and hydroxyl (HO-) groups. Even
small amounts of reactive functional groups incorporated into polymers can be highly beneficial
to improving surface chemical functionality and wettability. Oxygen plasma treatment is the
most common method to hydrophilize PDMS substrates because it is fast, benign and effective
[262]. We used air plasma treatment to render the surface of our PDMS hydrophilic. In this
process, hydrogen atoms are first abstracted from the PDMS chains to generate radicals within
the PDMS chains located at the surface. Some of these carbon radicals in the polymer chain
combine with the radicals formed in the plasma to form functional groups. The other carbon
radicals, when exposed to the air, and due to the presence of oxygen in air, will form oxidized
species on the surface. Thus, the methyl groups oxidize, forming polar functional group mainly
silanol group (SiOH) at the PDMS surface [270] (Figure 2.10).
66

CHAPTER 2. MATERIALS AND METHODS
Figure 2.10 – Surface modification of PDMS with plasma treatment. Silanol groupsSiOH are introduced at the surface of the PDMS rendiring it hydrophilic.
However plasma treatment of PDMS, presents two main drawbacks, hydrophobic recovery and
surface cracks. A lot of studies have documented the hydrophobic recovery mechanism. These
studies shows that the recovery mechanisms include reorientation of the polar groups from the sur-
face to the bulk, condensation of surface silanols groups, diffusion of pre-existing low-molecular-
weight (LMW) species from the bulk to the surface [271] [272] and also that the recovery rate
is affected by storage condition such as temperature, humidity, incomplete cross-linking and the
solvent use for the storage.
In our experiment, all PDMS samples subjected to plasma treatment, were oxidized using a Har-
rick plasma cleaner (Harrick scientific products), with pressure of 2.6 Torr, and 30 W power for
15 seconds. This conditions showed no cracks on the PDMS surface. The plasma treated PDMS
substrates were used directly after the treatment to prevent the hydrophobic recovery and to
take advantage of the hydrophilicity. The plasma treated PDMS substrates are either used as
target substrate for the contact printing or further chemically functionalized with APTES and
glutaradehyde (see section 3.2.2.1).
2.3.5 PDMS thickness measurement
PDMS thickness was measured using a Dektat XT, Bruker profilometer equipped with a stylus
of 12.5 µm radius of curvature. Profilometer drags a diamond stylus, with a diameter of a few
micrometers, laterally across a sample while maintaining a constant force. The stylus moves up
and down with changing topography; this movement is recorded and used to determine surface
height variations. In our experiments, PDMS sample was prepared as described in section 2.3.2,
then gently scratched with a pair of tweezers and the height of the profile was measured across
the scratch, leading to the measurement of PDMS thickness.
2.3.6 PDMS contact angle measurement
Contact angle measurements were done to characterize the hydrophobic/ hydrophilic properties
of the surface of different types of PDMS substrates. Sessile drop method was used to measure
67

CHAPTER 2. MATERIALS AND METHODS
PDMS Type Mixing Ratio Curing temperature Curing Time Thickness(W/W) ( C) (min) (µm)
Sylgard10:1 9 ± 135:1 125 20 8 ± 0.358:1 8 ± 0.1
CY 1:1 100 20 8 ± 1Q Gel 1:2 100 60 8 ± 0.8
Table 2.2 – Summary table of different PDMS layer preparation and the correspondingthickness. Thickness value are averages of thickness measurements done on at least 2 samplesand at least three scratches on each sample.
the contact angle, it is based on the investigation of the shape of a liquid drop lying on the solid
surface. The image of the drop is then analyzed and thus the contact angle is determined. An
optical contact angle measuring instrument (OCA20, Data physics instrument GmbH, Germany)
was used to perform the measurements. Water was always used as measuring liquid. In fact, a
water droplet of 5 or 1µL, in the case of native or plasma treated PDMS respectively, was placed
on the surface of the sample and the focused drop was analyzed after ± 10 seconds with the aid
of DataPhysics SCA 20 software. Measurements were executed on three samples, and at least
on three different regions for each sample. The average value was used as result, the standard
deviation as error. All contact angle measurements were performed 30 minutes after the surface
treatment.
In our study, the glass supported PDMS substrates were first characterized by AFM to me-
chanically determine the stiffness (see section 2.8.1), and then were used for reverse contact
printing of proteins patterns(see section 3.2.3), or were further homogeneously functionalized
with proteins for the study of T-cells adhesion (see section 2.6).
2.4 Poloxamer
A copolymer is a type of polymer where two or more different monomer subunits are linked to-
gether to form a polymer chain. The copolymer material used in this research project is a polox-
amer known by the trade name Pluronic. Pluronic is a nonionic tri-block copolymer in the form
of white, waxy, free-flowing granules that are practically odorless and tasteless [273]. Chemically,
Pluronic is α-Hydro-ω-hydroxy poly(oxyethylene)x - poly(oxypropylene)ypoly(oxyethylene)x
block copolymer. It consists of two hydrophilic ethylene oxide chains (PEO) that sandwiched
one hydrophobic propylene oxide chain (PPO) [274]. The chemical structure is given below
(Figure 2.11):
At low concentration (10−4 - 10−5 %), Pluronic form mono-molecular micelles, but higher con-
centrations result in multi-molecular aggregates consisting of a hydrophobic central core with
their hydrophilic polyoxyethylene chains facing the external medium [273].
In this research project three types of Pluronic were used:
68
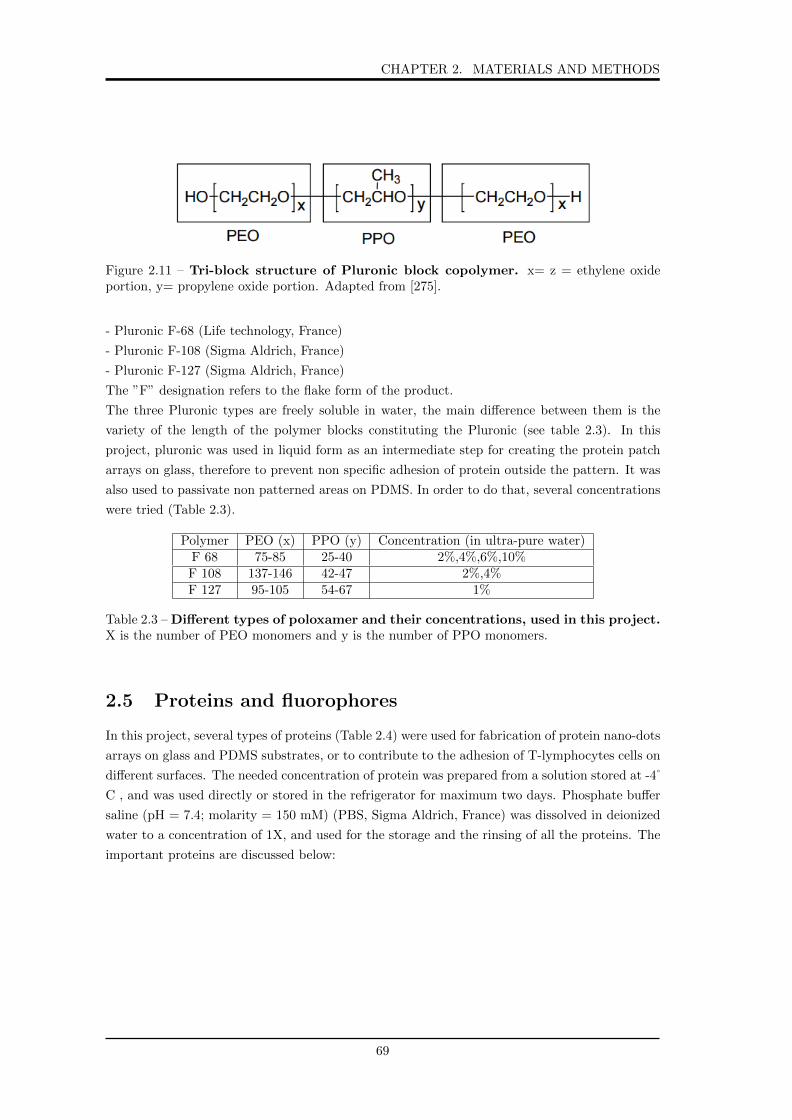
CHAPTER 2. MATERIALS AND METHODS
Figure 2.11 – Tri-block structure of Pluronic block copolymer. x= z = ethylene oxideportion, y= propylene oxide portion. Adapted from [275].
- Pluronic F-68 (Life technology, France)
- Pluronic F-108 (Sigma Aldrich, France)
- Pluronic F-127 (Sigma Aldrich, France)
The ”F” designation refers to the flake form of the product.
The three Pluronic types are freely soluble in water, the main difference between them is the
variety of the length of the polymer blocks constituting the Pluronic (see table 2.3). In this
project, pluronic was used in liquid form as an intermediate step for creating the protein patch
arrays on glass, therefore to prevent non specific adhesion of protein outside the pattern. It was
also used to passivate non patterned areas on PDMS. In order to do that, several concentrations
were tried (Table 2.3).
Polymer PEO (x) PPO (y) Concentration (in ultra-pure water)F 68 75-85 25-40 2%,4%,6%,10%F 108 137-146 42-47 2%,4%F 127 95-105 54-67 1%
Table 2.3 – Different types of poloxamer and their concentrations, used in this project.X is the number of PEO monomers and y is the number of PPO monomers.
2.5 Proteins and fluorophores
In this project, several types of proteins (Table 2.4) were used for fabrication of protein nano-dots
arrays on glass and PDMS substrates, or to contribute to the adhesion of T-lymphocytes cells on
different surfaces. The needed concentration of protein was prepared from a solution stored at -4
C , and was used directly or stored in the refrigerator for maximum two days. Phosphate buffer
saline (pH = 7.4; molarity = 150 mM) (PBS, Sigma Aldrich, France) was dissolved in deionized
water to a concentration of 1X, and used for the storage and the rinsing of all the proteins. The
important proteins are discussed below:
69

CHAPTER 2. MATERIALS AND METHODS
BSA Bovine serum albuminbBSA Bovine serum albumin coupled to biotin
BSA-TR Bovine serum albumin texas-red conjugated
BSA-FITC Bovine serum albumin fluorescein isothiocyanate conjugated
Nav Neutravidin (un-conjugated)
Nav-TR Neutravidin texas-red conjugated
Nav-FITC Neutravidin fluorescein isothiocyanate conjugated
Nav-dylight Neutravidin dylight conjugated
Anti-CD3 Anti-cluster of differentiation 3
bBSA-TR biotin-bovin serum albumin, texas red conjugated
bBSA-Atto biotin-bovin serum albumin, Atto 488 conjugated
Table 2.4 – Abbreviations list of the different proteins.
2.5.1 Bovine Serum Albumin (BSA)
Bovine serum albumin (BSA) is often used as blocking reagent for cell and other proteins types.
It is a molecule whose advantages are to be passive, functional, robust, stable and easy to deposit
in micro-contact printing and has no negative effect in many biochemical reactions. Here we used:
- Un-conjugated bovine serum albumin (BSA).
- BSA coupled to fluorescein isothiocyanate (BSA-FITC).
- BSA coupled to texas-red (BSA-TR).
- BSA coupled to biotin (bBSA).
All the types of BSA proteins used were purchased from Sigma Aldrich, France, and used either
as is or, for bBSA, was conjugated to a dye (see section 2.5.6.1).
2.5.2 Neutravidin-Biotin interaction
Biotin is a relatively small molecule (244.3 Daltons), that can be conjugated to many proteins
(such as BSA) without significantly altering their biological activity. The highly specific inter-
actions of biotin with biotin-binding proteins make it a useful tool in assay systems designed to
detect and target biological analytes. During our study, we choose to use neutravidin (Nav) as
a biotin binging protein. Several forms of neutravidin were employed:
- Un-conjugated neutrAvidin (Nav, ThermoFisher scientific, France).
- Neutravidin, Texas Red conjugated (Nav-TR, Invitrogen, USA).
- NeutrAvidin, Fluorescein isothiocyanate conjugated (Nav-FITC, Sigma Aldrich, France).
- Neutravidin, Dylight conjugated (Nav-Dylight, Life technology, France).
2.5.3 Anti-CD3
Anti-CD3 is a monoclonal antibody that binds to the CD3 moiety on the surface of T-Cells.
Biotinylated anti-CD3 was used in order to bind to the neutravidin via the biotin, and to further
target the TCR complex. Two types of anti-CD3 were employed:
70

CHAPTER 2. MATERIALS AND METHODS
- Mono-biotinylated anti-CD3 (Ortho-clone OKT3, Janssen-Cilag, USA) conjugated to ATTO
647 (Life Technology). (For more detail about the process of biotinilation and Atto 647 labelling
see ref [276]).
- Multi-biotinylated anti-CD3, mouse anti-human Clone (UCHT1 Beckman Coulter, France)
2.5.4 Fluorophores
Fluorophores, fluorescent probes or simply dyes are the category of molecules capable of under-
going electronic transitions that ultimately result in fluorescence. Fluorescence is the result of
a three-stage process that occurs in a fluorophore molecule. This process is illustrated by the
simple electronic-state diagram (Jablonski diagram) shown in Figure 2.12.
A photon of energy hνEX is supplied from an external source such as an incandescent lamp or
Figure 2.12 – Principle of fluorescence. A- Jablonsky diagram; B- General diagram of theexcitation (blue) and emission (red) spectra for a fluorophore. Adapted from [277]
a laser and absorbed by the fluorophore, creating an excited electronic singlet state (S1’).
The excited state exists for a finite time (typically 1–10 nanoseconds). During this time, the
fluorophore undergoes conformational changes and is also subject to a multitude of possible in-
teractions with its molecular environment.The energy of S1’ is partially dissipated, yielding a
relaxed singlet excited state (S1) from which fluorescence emission originates. However, not all
the molecules initially excited by absorption (Stage 1) return to the ground state (S0) by fluores-
cence emission, other processes may also depopulate S1. The fluorescence quantum yield, which
is the ratio of the number of fluorescence photons emitted (Stage 3) to the number of photons
71

CHAPTER 2. MATERIALS AND METHODS
absorbed (Stage 1), is a measure of the relative extent to which these processes occur.
Finally, a photon of energy hνEM is emitted, returning the fluorophore to its ground state S0.
Due to energy dissipation during the excited-state lifetime, the energy of this photon is lower,
and therefore of longer wavelength, than the excitation photon hνEX . The excitation and pho-
ton emission from a fluorophore is cyclical, and until the fluorophore is irreversibly damaged
(photo-bleached), it can be repeatedly excited. Because fluorophores can there for emit numer-
ous photons through this cycle of excitation and emission, fluorescent molecules are used for a
broad range of research application. In our experiments, we used several flurophores including
Atto 488, Texas Red (TR), Dylight 647 (dylight), Fluorescein Isothiocyanate (FITC), Alexa
Fluor 647, Rhodamine and Atto 647 (see details in section 2.5.5).
2.5.5 Fluorofores used
In our experiments, we used several organic dyes to visualize proteins. BSA and Nav were bought
in a labeled state, anti-CD3 labeled with biotin and Atto 647 was a gift from Rjat Varma, and
bBSA was labeled in house. Here, i will describe the two dyes used for in home labeling.
2.5.5.1 Atto 488 dye
Figure 2.13 – Chemical structure of atto 488 dye, adapted from [278].
Atto 488 dye (Figure 2.13) is characterized by its excellent water solubility, strong absorption,
high fluorescence yield, very little aggregation, net charge of -1 and exceptional thermal and
photo-stability [279]. It has a maximum absorption at 501 nm and emission maximum of 523
nm. The presence of free carboxy groups can let us bind it to amino group of the bBSA via
N-hydroxysuccinimidyl-esters (NHS) (more details in section 2.5.6.1).
2.5.5.2 Texas red dye (TR).
Texas red dye (Figure 2.14) is a red fluorescent dye, it fluoresces at about 615 nm and the
peak of its absorption spectrum is at 589 nm. It is commonly used conjugated to antibodies
and proteins for cellular imaging applications. It dissolves very well in water as well as other
polar solvents, e.g., dimethylformamide, acetonitrile. It is usually a mixture of two monosulfonyl
chlorides as seen in figure 2.14, or with the SO3 and SO2Cl groups exchanged. TR can be easily
bought in a form of NHS-esters. It is activated with sulfonyl chloride for covalent attachment to
72

CHAPTER 2. MATERIALS AND METHODS
Figure 2.14 – Chemical structure of Texas Red dye, adapted from [280].
primary amines of antibodies, protein and other molecules (more details in section 2.5.6.1). In
our experiments, TR was used to visualize BSA and Nav and also, for in home labeling of bBSA.
2.5.5.3 Other Dyes
Other fluorophores such as fluorescein isothiocyanate (FITC), Atto 647, alexa fluor 647 (alexa
647) and rhodamine were also employed in our study.
FITC (Figure 2.15) is a derivative fluorescein, one of the most popular fluorochrome ever designed,
and has enjoyed extensive application in immuno-fluorescence labeling. FITC has excitation and
emission spectrum peak wavelengths of approximately 495 nm/519 nm, and like most of the flu-
orochromes, it is prone to photo-bleaching. Due to this problem, derivative of fluorescein such as
alexa fluor 488 have been tailored for various chemical and biological applications where greater
photostability, higher fluorescence intensity, or different attachment groups are needed. In our
experiments, FITC was used to visualize BSA and Nav, and also to label actin in the cells.
Alexa 647 is a bright, far-red-fluorescent dye, it absorbs light maximally at 650 nm and fluoresce
Figure 2.15 – Chemical structure of FITC dye, adapted from [281].
with a peak around 665 nm. Alexa 647 dye, is characterized by high fluorescence quantum yield
and high photostability, which allow detection of low-abundance biological structures with great
sensitivity. Here, Alexa 647 was used to label ZAP-70
Atto 647 belongs to a new generation of fluorescent labels for the red spectral region. It absorbs
73

CHAPTER 2. MATERIALS AND METHODS
at 645 nm and fluoresce at 669 nm. It is characterized by strong absorption, excellent fluores-
cence quantum yield, good solubility high photostability, it is a cationic dye that carries a net
electrical charge of +1 after coupling to a substrate. It is specially used in the area of life science,
for labeling , e.g. of DNA, RNA and proteins. In our project, atto 647 dye was used labeled to
anti-CD3.
Rhodamines dyes are supplements to fluoresceins, as they offer longer wavelength emission max-
ima and provide opportunities for multicolor labeling or staining. Rhodamines exhibit higher
photostability than fluorescein. Here rhodamine was used attached to phalloidin, to label actin
in the cell.
2.5.6 Fluorophore Coupling
2.5.6.1 Labeling protocol of BSA biotin conjugated with fluorophores.
Bovine Serum Albumin (BSA) coupled to biotin was labeled either with TR or Atto 488 dye
using a fast and easy Protein Labeling kit (Texas Red-X protein Labeling Kit, T-10244, Thermo
fisher Scientific France or Atto 488 protein labeling Kit, Sigma, France).
The two dyes have a succinimidyl ester (NHS-ester) moiety that reacts efficiently with primary
amines of proteins to form stable dye–protein conjugates (Figure 2.16).
Figure 2.16 – NHS ester reaction scheme for chemical conjugation to a primary amine.(R) represents a labeling reagent or one end of a cross linker having the NHS ester reactive group;(P) represents a protein or other molecule that contains the target functional group (i.e., primaryamine). Adapted from [282].
The labeling protocol can be summarized in three steps (Figure 2.17):
Step 1: Protein Preparation
A solution of 2 mg/ml of bBSA in PBS buffer is prepared.
Step 2: Labeling Reaction
- Sodium bicarbonate, pH∼8.3 is added to the protein solution in order to raise the pH of the
reaction mixture. NHS reacts efficiently at pH 7.5 - 8.5.
- In case of TR dye, addition of DMSO (dimethylsulfoxide) to the vial containing the reactive dye
is required, in order to help dissolve the hydrophobic TR reactive dye into the aqueous protein
solution, thereby increasing the efficiency of the reaction.
- The protein solution is transferred to the vial of the reactive dye.
- The reaction mixture is stored at room temperature.
Step 3: Purification of the labeled Protein
74

CHAPTER 2. MATERIALS AND METHODS
A gel filtration column is used in order to achieve good separation of the protein-dye-conjugate
from excess free dye. Solvent flow in the column is achieved by gravity only, there’s no need to
apply pressure.
Figure 2.17 – Illustration of fluorescent labeling of biotin-BSA protein using Atto 488 or TR dye[283].
2.5.6.2 Determination of the degree of labeling
An Ultra violet spectrophotometer (UV/VIS spectrophotometer: Varian, Cary 5000, UV-VIS-
NIR) was used to measure the absorbance of the conjugates, in order to calculate the degree of
labeling (Dye/Protein ratio; D/P), and the labeled protein concentration.
The conjugate solution was diluted in PBS buffer so that the maximum absorbance measure is
between 0.5 and 1 A.U.
The absorbance of the conjugate solution was measured at the wavelength maximum of the
protein (λP ) and of the dye (λD).
The D/P molar ratio is then calculated as follow:
D/P =AλD × εP
[AλP − (AλD × CF )]× εD(2.1)
The final protein concentration can be calculated as follows:
CP (mg/mL) =AλP − (CF ×AλD)
εP×MWP ×Dilutionfactor (2.2)
75

CHAPTER 2. MATERIALS AND METHODS
AλD: Absorbance (A) of the dye solution measured at the wavelength maximum (λD) for the
dye molecule.
AλP : Absorbance (A) of the protein solution measured at the wavelength maximum (λP = 280
nm) for the protein molecule.
εP : molar extinction coefficient of the protein at 280 nm (M−1.cm−1); e.g. the molar extinction
coefficient of bBSA is 44973.11.
CF: Correction factor; adjusts for the amount of absorbance at 280 nm caused by the dye.
εD: molar extinction coefficient of the dye at λD [M−1.cm−1]; e.g., the molar extinction coeffi-
cient of Atto 488 is 90000 at 498 nm, and 80000 for the TR dye at 595 nm).
MWP : molecular weight of the protein (66.430 g/mol for biotin-BSA).
In our experiments, the protein-dye conjugate was diluted 1/10 in phosphate buffer saline. The
value of the obtained absorbance, the calculated protein concentration and D/P molar ratio are
resumed in table 2.5.
Dye λD (nm) εD CF AλP (A.U.) AλD (A.U.) CP (mg/mL) D/PAtto 488 498 90000 0.1 0.124 0.496 0.27 3.34
TR (first batch) 595 80000 0.18 0.154 0.36 0.68 2.31TR (first batch) 595 80000 0.18 0.154 0.29 1.58
Table 2.5 – Results of UV absorbance measurements.
2.6 Substrates for Cell experiments
2.6.1 Positive control
PDMS supported on a square glass cover-slide was prepared as described in section 2.3.2, placed
inside a home made round chamber (Figure 2.18) and functionalized as follows:
- Incubate 800 µl of bBSA at a concentration of 100 µg/ml in PBS on the PDMS sample for 2
hours at room temperature (RT)(in the case of CY and Q gel) or at 37 C (in the case of Sylgard).
- Rinse 5 times with PBS.
- Functionalize with 800 µl of Nav-TR at a concentration of 4 µg/ml in PBS, for 45 minutes at
RT.
- Again rinse 5 times with PBS.
- Incubate 800 µl of multi-biotinylated anti-CD3 at a concentration of 2 µg/ml in PBS for 45
minutes at RT.
- Rinse five times with PBS.
2.6.2 Negative Control
Negative controls were performed for homogeneously functionalized and patterned substrates,
in order to determine weather cells adhere only in presence of specific ligands or adhered to
76

CHAPTER 2. MATERIALS AND METHODS
substrates via unspecific interactions.
For homogeneously functionalized substrates, negative control was performed as follows:
- Incubate 800 µl of bBSA at a concentration of 100 µg/ml in PBS, on the PDMS substrate
(prepared as describe in section 2.3.2) for 2 hours, at room temperature (RT)(in the case of CY
and Q gel) or at 37 C (in the case of Sylgard).
- Rinse 5 times with PBS.
- Functionalize with 800 µl of Nav-TR at a concentration of 4µg/ml in PBS, for 45 minutes at
RT.
- Rinse 5 times with PBS (0.1% BSA).
2.7 Cell Experiments
The cells used here are Jurkat T-cells (Clone E6-1, ATCC). Jurkat is an immortalized line of
human T lymphocyte cells. It was demonstrated that signaling requirement for Jurkat T-cells
was fulfilled by ligation of the TCR with CD3 antibodies, and that the CD3 subunits mediated
signal transduction across the plasma membrane, thus the study of Jurkat T-cell activation could
be done using anti-CD3 monoclonal antibodies instead of using a cognate antigens.
2.7.1 Chamber used for cell experiment
For cells, round, home made chambers (Figure 2.18), cleaned with surfactant cleaning procedure
(see section 2.1) were used. These chambers were designed to facilitate and optimize substrate
functionalization steps, cell fixation and labeling, and can be easily manipulated on the micro-
scope.
Figure 2.18 – Chamber used for cell experiments. A- Unmounted home made open chamber.B- Upper view of mounted chamber. C- Side view of mounted chamber.
77

CHAPTER 2. MATERIALS AND METHODS
2.7.2 Cell culture and splitting
Jurkat E6 T-lymphocytes were cultivated in RPMI complete medium supplemented with 10%
Fetal Bovine Serum and 1% GlutaMAX (Invitrogen). Splitting is realized every two days in
order to let the cell concentration quadruple between two splits, and last splitting was done 24
hours before experiments to ensure a concentration of 0.6 million cells/ml at the moment of the
experiment.
2.7.3 Cell Preparation
Prior to any experiment, the observation media consisting of PBS + 0.1% BSA is heated in a
water bath to 37 C. 1 ml of the cell were taken out from the culture flask using a serological
pipette, placed in an eppendorf tube, and centrifuged at 1600 rpm during 4 minutes. Supernatant
is removed and the cell pellet is suspended in PBS + BSA 0.1% at 37 C, 5% CO2.
The steps required for the deposition of the cells on the substrate of interest, are as follow:
- Place the substrate inside a home-made round chamber.
- Rinse five times with the pre-heated observation medium (PBS + 1% BSA).
- Add 800 µl of the observation medium.
- Place the chamber in a water bath at 37 C, for 15 minutes so that it takes the temperature of
the cell.
- Take out the chamber from the incubator.
- Remove 400 µl of the observation medium from the chamber.
- Add 200 µl of cells to the chamber.
- Incubate the sample containing the cells for 20 minutes (on controls) or 30 minutes (on pat-
terned PDMS), at 37 C, 5% CO2 in order to let the cells adhere to the substrate.
2.7.4 Cell fixation
2% paraformaldehyde (Merck, France) in PBS solution is pre-heated to 37 C, and is gently
introduced into the chamber (care should be taken to minimize detachment). The sample is then
incubated during 15 minutes at 37 C, and washed carefully 10 times with PBS.
2.7.5 Post-fixation labeling
2.7.5.1 Actin labeling
The actin marking was done using phalloidin fluorescently labelled with:
1- Rhodamine (dissolved in DMSO, Sigma-Aldrich, France), by incubation of the cells, directly
after the fixation step, with 20µg/ml of phalloidin rhodamin conjugated, for 30 minutes at room
temperature and then washing 10 times with PBS.
2-FITC (dissolved in methanol, Life Technologies, France). In this case, after the fixation step,
78

CHAPTER 2. MATERIALS AND METHODS
and before the labeling, an additional step is required. It consists on incubating the cells in 0.1
% Triton X-100 (Sigma, France) for 4 minutes in order to permeabilize the cell membrane, then
to wash 5 times with PBS. Next, the labeling can take place by incubating the cell with 20 µg/ml
of Phalloidin-FITC conjugated, during 20 minutes at room temperature, then rinsing 10 times
with PBS.
2.7.5.2 TCR labeling
Before labeling the TCR, and after cell fixation a blocking step is required to prevent any non
specific adhesion of the marker. In order to do that, the substrate is incubated with 500µg/ml of
BSA at 4 C overnight (or two hours at room temperature). After this step, cells are incubated,
during 30 minutes at room temperature, with FITC fluorescently labeled mouse anti-human
Anti-Vβ8 TCR, (5 µg/ml) (BD Bioscience, France), then washed 10 times with PBS.
2.7.5.3 Phosphorylated ZAP-70 labelling
After the step of cells fixation, and before labeling the ZAP-70, two additional steps were required.
First, blocking step as in the case of TCR (incubation with 500µg/ml of BSA at 4 C overnight
(or two hours at room temperature), then a membrane permeabilization step which consists on
incubation of the sample in 0.1% Triton X-100 for 4 minutes. Finally, the cover-slides were
incubated in 0.03 µg/ml of Alexa-Fluor 647 Mouse Anti-ZAP70 (PY319)/Syk (PY352) Clone
17A/P-ZAP70 (RUO) overnight at 4 C and washed 10 times with PBS.
2.8 Force Measurement using Atomic Force Microscopy
and Spectroscopy
Atomic force microscopy (AFM) was invented in 1986 by Binnig, Gerber and Quate [284] to
broaden the usefulness of its precursor scanning tunneling microscopy (STM) [285] to insulating
samples. The AFM is best known for its ability to create three-dimensional images with resolution
down to the nanometer and Angstrom scales, which has made it an essential tool for imaging
surfaces in applications ranging from semiconductor processing to cell biology. In addition to
this topographical imaging, another major application of AFM is force spectroscopy, it is able
to exert and measure forces on the order of pico-newtons. This features provides the ability to
probe nano-mechanical and other fundamental properties of sample surfaces, including obtaining
a local adhesive or elastic properties of a surface, measuring modulus variation across a sample
surface and probing molecular interactions [286]. Figure 2.19 shows a schematic of an AFM
system with its general components and their functions.
2.8.1 AFM Force Spectroscopy
AFM Force spectroscopy involves the direct measurement of forces between the tip and the sam-
ple surface as a function of the distance between the two. The result is called a force-distance
curve. The deflection of the cantilever is monitored as the tip (or the sample) is moved towards
79

CHAPTER 2. MATERIALS AND METHODS
Figure 2.19 – Schematic of an atomic force microscopy system. The atomic force micro-scope senses the physical properties of a sample by passing a sharp probe on a cantilever overthe sample, and detecting deflections in the cantilever using reflections from a laser beam. From[287].
and away from the sample (or the tip), and then is plotted as a function of piezoelectric displace-
ment which gives the force-distance curve. This technique can be used to measure the long range
attractive or repulsive forces between the tip and the sample surface, elucidating local chemical
and mechanical properties of the sample surface such as adhesion, elasticity, dissipation energy
due to material deformation and, bond rupture forces could be measured.
To help examine the basics of AFM force measurements, figure 2.20 shows a typical “force-versus-
distance” curve or force curve, for short:
The horizontal axis (X-axis) is the vertical distance moved by the sample stage.
The vertical axis (Y-axis) is the deflection of the cantilever as the sample surface is moved to-
wards the tip, contacts and pushes against the tip and then away from the tip.
The black curve is the approach cycle and the red curve is the retract cycle.
The different sections of the curves are defined as follows:
a-b: The surface approaches the cantilever, initially the forces are too small to give a measurable
deflection of the cantilever, and the cantilever remains in its undisturbed position. Therefore the
curve is flat.
b-c: The attractive forces (usually Van der Waals, and capillary forces in air) overcome the
cantilever spring constant and the tip jumps into contact with the surface. The cantilever is
deflected downwards and the force is negative.
c-e: The sample surface continues to approach the tip, until the tip is in contact with the surface
(point d: the cantilever is not deflected, and the force is zero). As the sample surface is brought
80

CHAPTER 2. MATERIALS AND METHODS
Figure 2.20 – A typical AFM force-distance curve. The curve depict the interaction of theAFM tip with the sample surface. A single approach(black) - retract(red) cycle of the AFM tipis recorded as a deflection voltage against piezo position. Adapted from [288].
closer to the tip, the force exerted by the tip on the surface will increase which will lead to a
deflection of the cantilever and/or an indentation of the tip into the surface in the case where
the cantilever is sufficiently stiff.
e-g: The cantilever is withdrawn, adhesion or bonds formed during contact with the surface
cause the tip to adhere to the sample(f-g).
g-h: The spring force of the cantilever overcomes the adhesion forces and the cantilever pulls-off.
h-i: The cantilever is moved upwards to its undeflected or non-contact position.
2.8.2 Calibration of the cantilever deflection
In the experimental measurement, the force distance curve is given in term of cantilever deflection
in Ampere (A) versus piezo displacement in meter (m) (Figure2.20). It is important to convert the
cantilever deflection from (A) to (m) and then to unit of force in order to be able to determine the
young modulus of the sample of interest (in our case: PDMS). To do that, a force curve between
a cantilever and a bare hard substrate is recorded. Therefore, the deflection will be equal to
the displacement, and the slope of the recorded curve will give us the deflection sensitivity
(measurement of the deflection of the tip in meters for a given displacement of the cantilever).
81

CHAPTER 2. MATERIALS AND METHODS
The deflection of the cantilever in m is then determined as follow:
δc(m) = α× δc(A) (2.3)
where δc is the deflection of the cantilever and α is the deflection sensitivity.
2.8.3 Calibration of the Cantilever Spring Constant
After calculating the sensitivity, it is relevant to determine the exact value of the cantilever
spring constant. In fact, the cantilever spring constants can vary greatly from the values quoted
by their manufacturers. The manufacturers often specify the spring constant in a wide range
that may span values up to four times smaller and four times larger than the nominal value.
This is because the techniques used to fabricate the probes can result in substantially different
cantilever dimensions, especially thickness, from wafer to wafer and smaller variations within a
single wafer, which demonstrate the need for independent calibrations. A number of ways to
calibrate AFM cantilevers have been described in the literature: Thermal noise method [289],
calculation from cantilever geometry [290], added mass method [291], calibration using a refer-
ence cantilever [292] and more on. Each of this method is subject to some limitations, and if
experiments are compared where different methods are used, differences of maybe 10-20% can be
expected. In our study, we applied the calibration against a reference cantilever or the thermal
noise method.
2.8.3.1 Calibration using reference Cantilever
In this method of calibration, a lever of known spring constant (reference cantilever) attached
to a sample substrate is mounted on the piezoelectric translator and the unknown cantilever is
mounted as normal in the AFM. The cantilevers are approached to each other so that they just
overlap at the end, and a force curve is performed. If Zc is the deflection of the cantilever and
Zp is the height position of the piezoelectric translator (Figure 2.21) (the zero is when the tip
of the cantilever just touches the reference cantilever and the cantilevers are not yet deflected)
then the spring constant is given by:
Kc = krZp − ZcZc
= kr1− Zc/ZpZc/Zp
(2.4)
Here Kr is the spring constant of the reference cantilever and kc is the spring constant of the
cantilever needed to be calibrated. Practically, Zc/Zp is the slope of the force curve obtained on
the reference cantilever in the contact regime [293].
Difficulties with this method include the fact that reference levers with spring constants near
that of the cantilever to be calibrated must be available. It is obviously also essential that the
spring constant of the reference levers is well determined, and care must be taken to position the
AFM cantilever so that it contacts the end of the reference lever, therefore the AFM must be
82

CHAPTER 2. MATERIALS AND METHODS
Figure 2.21 – Calibration against reference cantilever. The unknown spring constant ofa cantilever can be determined by pressing it against a reference cantilever (on the right) andmeasuring its deflection Zc for a given movement of the piezoelectric translator Zp [293].
equipped with good optical imaging system, so that the cantilevers can be well aligned (Figure
2.22).
Figure 2.22 – Cantilever alignment. Alignment of the AFM cantilever against the referencecantilever. From [294]
2.8.3.2 Calibration using thermal noise method
Cantilevers are susceptible to fluctuate because of the thermal vibrations from the environment.
The thermal noise method is based on measuring this free fluctuations of the cantilever. There-
fore, the thermal environment of the cantilever is known, and the deflection of the cantilever
can be measured accurately, so the balance between them can be used to calculate the spring
constant. In our study, the root mean square of the thermal deflection (RMS) was used for the
calibration of the spring constant. For this, the cantilever is suspended away from any solid
surface, and a time interval of the deflection signal is registered with the laser ON and with the
laser OFF (Figure 2.23). The noise power that is related to thermal noise is given by [295]:
(Uth)2 =< UON2(t) >rms − < UOFF
2(t) >rms= RMSOFF −RMSON (2.5)
The reason to acquire data with the laser off is to estimate and subtract electronic noise that
is not related to the thermal noise of the cantilever motion. Without substraction, it will be
implicitly assumed that all measured noise (that is, also electronic noise) is thermal noise.
The thermal noise method appeals to the equipartition theorem, which states that the energy in
any free mode of a system has to be equal to the thermal energy due to the absolute temperature
83

CHAPTER 2. MATERIALS AND METHODS
Figure 2.23 – Thermal noise analysis.
of the system, 1/2 KBT, where KB is the Boltzmann constant. The measured energy in the
resonance is given by the spring constant and the average value of the vertical deflection of the
cantilever, here Zc.1
2KBT =
1
2Kc < Zc
2 > (2.6)
The cantilever elastic constant can then be determined as:
Kc =KBT
< Zc2 >
(2.7)
The value of < Zc2 > can be measured from the Lorentz fit to the frequency spectrum by moni-
toring the deflection over time and extrapolating the root mean square (RMS) of this deviation.
The primary advantage of the thermal noise method is easy to use, fast, can be made in air
or in liquid and actually in-situ during an experiment. The thermal noise method is limited by
the sensitivity of the device used to measure the noise in the deflection signal (stiffer cantilever
suffer less thermal vibration), and its main drawback is the need of spatial correction factors to
take care of special effects from the shape of the cantilever, details of the hydrodynamic damping
etc. These factors could shift the accuracy of the spring constant value from 5 to 10% . Despite
that, this method remains the best so far.
2.8.4 Force Measurements
In our study, force measurements using AFM were performed in order to determine the sur-
face elastic modulus of cross-linked PDMS samples, to quantify the physiochemical interactions
of proteins adhered to different substrates (glass and PDMS substrates), and to measure cell
elasticity.
84

CHAPTER 2. MATERIALS AND METHODS
2.8.4.1 Elastic modulus of polymers
The traction or compression elastic modulus, which is also known as Young’s modulus , is one of
the most important materials properties. It is a number that measures an object or substance’s
resistance to being deformed (elongated or compressed) elastically when a force is applied to it.
For an ideal elastic solid, Hooke’s law expresses the Young’s modulus, E, as:
E =σ
ε(2.8)
Here, σ is the Stress and ε is the strain. The stress is the force causing the deformation divided
by the area to which the force is applied and the strain is the ratio of the change in some
length parameter caused by the deformation to the original value of the length parameter that
is: ε = (L−L0)L0 . It is easy to understand that for the same strain, the larger the stress is, the
stiffer the material is the larger the Young’s modulus is. According to Hook’s law, the elastic
modulus is then the slope of the stress–strain curve of an object in the elastic deformation re-
gion and is specific for the material under investigation. In force measurement curves, Young’s
modulus is related to the elastic deformation of the sample in the contact regime during loading
and unloading, and the stiffness of the sample is related to its Young’s modulus by:
Ks =3
2aEtot (2.9)
with1
Etot=
3
4(1− νs2
Es) + (
1− νt2
Et) (2.10)
Where νs, Es, νt, Et are the Poisson’s ratio and the Young’s moduli of sample and tip, respec-
tively. Etot is the reduced Young’s modulus, and a is the tip–sample contact radius.
In most cases, the tip is much stiffer than the sample, therefore the deformation of the tip can
be neglected and the stiffness Ks can be approximated by:
Ks =dP
dh= 2a[
Es1− νs2
] (2.11)
with P the loading force and h the deformation of the sample under the tip (indentation).
2.8.5 Young Modulus determination
AFM measurements imply nano-metric contact area (Ac) between the AFM probe and the stud-
ied samples, although Ac value cannot be measured directly by any imaging technique. Nev-
ertheless, an accurate knowledge of the Ac value is extremely important if quantitative nano-
mechanical parameters such as young’s modulus are to be measured from experimental data.
Several contact mechanics models, can be successfully applied to describe the elastic deforma-
tion, as a function of the nature of the sample (i.e. metals, organic bilayers, ceramics, polymers,
and others) and the geometry of the tip (define the contact area) [296]. In our study, PDMS
samples are homogeneous and have absolute elastic behavior. And the tips we are using have
spherical geometry, and there diameter was verified by scanning electron microscopy. Thus, two
85

CHAPTER 2. MATERIALS AND METHODS
models have been chosen to be used:
- Hertz model
- JKR model
The Hertz model was developed in 1881 by Heinrich Hertz [297]. It provides with a calcu-
lated contact area (Ac) value, it considers both the tip and the sample as two spheres of radius
R1 and R2 (R2 → ∞; as the substrate is a flat surface), that when in contact will create a
stress that deform the sample. It assumes only that the deformation of the sample is elastic, and
depends on the young’s moduli of the materials; thus, it does not model the inter-penetration
between surfaces during the indentation process nor any adhesion force (Fa) acting between the
surface and the AFM tip [296] or any visco-elasticity properties. The interaction force is sketched
in Figure 2.24 A.
Figure 2.24 – Interaction forces for A- Hertz, B- JKR model. Hertz model does notconsider any adhesion forces as both surfaces(tip and the sample) come closer. JKR modelincludes short range adhesion which is a function of the strength of the adhesion work per unitof area necessary to separate the two surface in contact, W [296].
When the maximum adhesive (pull-off) force (Fad) is large enough in comparison with the
maximum force (Fmax) applied during loading, Hertzian analysis is no longer valid and mod-
els for adhesive contact of spheres should be invoked. These models include the JKR (John-
son–Kendall–Roberts – 1964-1971) model which is an extension of the Hertz model taking into
account adhesive forces. This model applies to tips with large curvature radius and small stiff-
ness (systems strongly adhesive). It accounts for the influence of Van der Waals forces within
the contact zone, considers that the work per unit of area (W) (Figure 2.24 B) is necessary to
separate the tip and the surface of study, and also that the attractive forces only take place when
the two surfaces are in contact and no effect is noticed by the tip as it approaches the sample
[296]. The model is applied to the retract curve only, and is valid only when the surface is much
softer than the tip (assumption Esurface < Etip).
Table 2.6 summarizes the relation between the contact radius a, the sample deformation δ, and
the adhesion force Fad for a spherical tip on a flat surface according to the Hertz and JKR
theories. The young modulus of the sample can be calculated using these models by fitting the
86

CHAPTER 2. MATERIALS AND METHODS
force curve (force vs tip-sample separation) using E as a fit parameter.
Hertz JKR
a 3√
RFEtot
3√
REtot
(F + 3πRW +√
6πRWF + (3πRW )2)
δ a2
R = ( F 2
RE2tot
)1/3 a2
R −23
√6πWaEtot
Fad 0 3πRW2
Table 2.6 – Relation between the contact radius a, the sample deformation δ, and theadhesion force Fad for a spherical tip on a flat surface according to the Hertz andJKR theories.R is the tip radius and W is the adhesion work per unit area. R is the radius ofthe spherical tip, F is the force exerted by the tip on the surface, and Etot is the reduced Young’smodulus defined in equation 2.5 [293].
In the course of this work, elasticity measurements were performed using AFM (NTEGRA sys-
tem, NT-MDT,Russia) at room temperature in water. Spherical tips of spring constant stated
between 0.02-0.77 N/m (SQUBE surface science support, Germany) were employed with diam-
eter d= 6 µm. The colloidal cantilevers were, cleaned with oxygen plasma (10 W, 2 minutes)
before utilization and functionalized with [3-(2-Aminoethylamino)propyl]trimethoxysilane from
a gas phase for 15 minutes. The cantilever were then individually calibrated against a reference
cantilever, owing a spring constant of 0.35 N/m. At least three samples were tested for each type
of substrate and 100 curves were recorded at different locations for each sample, at minimum
4 distinct regions at the sample surface and under the same conditions. The AFM data were
collected in term of tip deflection versus piezo-displacement and were analyzed using self-written
routines in IGOR-Pro (Wavemetrics, USA), were they are converted to force (nanonewtons) ver-
sus tip-sample separation (nanometers), in order to apply the Hertz or JKR model for spherical
indentation, and determine the young modulus. The final value of the young modulus, for each
sample was obtained from the average of all the curves.
2.8.6 Pull-off force measurements
Pull-off force measurements were performed to determine the interaction between protein (BSA-
biotin) and different PDMS and glass substrates. To do that, the AFM tip was first functionalized
with the protein of interest, then a force curve was recorded (Figure 2.25). During the force mea-
surement cycle, the tip is brought downward to the surface (approach trace) at constant velocity
until it contacts and exerts a positive load on the surface, then it is retracted and moves back to
its original position. During this retraction, a downward peak may occur in the retraction curve
that indicates adhesion between the tip and the sample. The pull-off force was calculated as the
difference between the initial position of the tip and the point where the tip is detached from the
sample (Figure 2.25).
87

CHAPTER 2. MATERIALS AND METHODS
Figure 2.25 – Principle of pull-off force measurements A- Schematic representation of thefunctionalization of the AFM cantilever tip with the protein of interest (fluorescent bBSA). B-Representative curve of force versus distance of separation between the protein tip and the surfaceof interest during advance and retraction. Adapted from [298].
2.8.6.1 Functionalization of the AFM tip
To perform force measurements, the tips were functionalized with the protein of interest as fol-
lows; they were first cleaned/oxidized using an oxygen plasma (10 W, 2 minutes), after which
they were functionalized with APTES from a gaz phase for 30 minutes at 70 C. The amino-
silanized tips were then activated by incubating in 0.5% v/v solution of glutaraldhehyde in water
for 15 minutes at room temperature, and then carefully rinsed with ultra-pure water. The tips
were then finally incubated in a solution of 50 µg/ml of the protein of interest (bBSA-atto or
bBSA-TR) for 15 minutes, and rinsed with PBS to remove excess of protein. A schematic rep-
resentation of the AFM cantilever tip functionalization is shown in figure 2.25 A.
Here, pull-off force measurements were performed using AFM (NTEGRA system, NT-MDT,Russia)
at room temperature in air or in water. Spherical tips of spring constant stated between 0.02-0.77
N/m (SQUBE surface science support, Germany) were employed with diameter d= 6 µm. The
colloidal cantilevers were individually calibrated using the thermal noise method. At least two
samples were measured, and 100 curves were recorded at different locations for each sample at
2 distinct regions and under the same conditions. The AFM data were collected in term of tip
deflection versus piezo-displacement and were analyzed using self-written routines in IGOR-Pro
(Wavemetrics, USA), were they are converted to force (nanonewtons) versus tip sample separa-
tion (nanometers) in order to obtain the pull-off force. The final value of the pull-off force for
each sample was obtained from the average of all the curves.
88

CHAPTER 2. MATERIALS AND METHODS
2.8.7 Cell elasticity measurements
AFM force measurements for cell elasticity, were conducted using a JPK Nanowizard atomic-
force microscope (JPK Instruments, Berlin) on top of an Axiovert 200 inverted microscope (Carl
Zeiss, Jena). The AFM head is equipped with a 15 µm z-ange linearized piezoelectric ceramic
scanner and an infra-red laser. The set-up was used in closed loop, constant height feedback
mode. Spherical tips of spring constant stated between 0.02-0.77 N/m and diameter d= 6µm
(SQUBE surface science support, Germany) were employed. The cantilever was mounted and
aligned on the AFM head, and the petri dish containing the adherent cells was placed on the
AFM stage, and force measurements were conducted for 15 minutes at room temperature, before
cell fixation. The sensibility and spring constant of each cantilever were calibrated prior to each
experiment using built-in routines on the JPK software (the sensitivity is calculated by fitting
a force curve taken on a hard substrate within the linear contact part, and the spring constant
is determined using the thermal noise method). Once the calibration is complete, the desired
set point force (the force to be applied to the sample) is entered. The approach and retraction
speed were set to 2 µm/s and the maximum indenting force was set to 1 nN to avoid damage to
cells. At least 3 force curves were collected for each cell, and at least 10 cells were measured for
each sample. The recorded force-distance curve collected during indentation were fitted to Hertz
model, using JPK SPM Data Processing 5.0.69 software, to extract information about the local
elastic modulus of the cell. All operations were applied to the retraction curve since it normally
contains no interaction like adhesion that make a determination of the contact point impossible.
2.8.8 Imaging with Atomic force microscopy
AFM imaging were carried out in tapping mode, in air and at room temperature, using NTEGRA
system (NT-MDT, Russia). Silicon tips, NCSC 35 MicroMash, Bulgaria with a typical frequency
of 120 KHz and less than 10 nm tip radius were used for imaging funtionalized glass substrates,
and CSC 37 MicroMash, Bulgaria, with a typical frequency of 21 KHz,a spring constant stated
between 0.35-1.2 N/m and less than 10 nm tip radius were used to image funtionalized PDMS
substrates. Images were analyzed using NTEGRA Imaging analysis software packages (Nova 1.1)
and were flattened in the scanning direction following standard practice.
2.9 Optical Microscopy
Different types of optical microscopy were used to both image and characterize patterns and
to image cells. These include fluorescence based techniques; epi-fluorescence and total internal
reflection fluorescence microscopy (TIRF-M), and a reflection based technique; reflection inter-
ference contrast Microscopy (RICM).
2.9.1 Epi-Fluorescence
Fluorescence microscopy is a special form of light microscopy that uses high intensity light source
which excites a fluorescent species in a sample of interest. This fluorescent species in turn emits
89
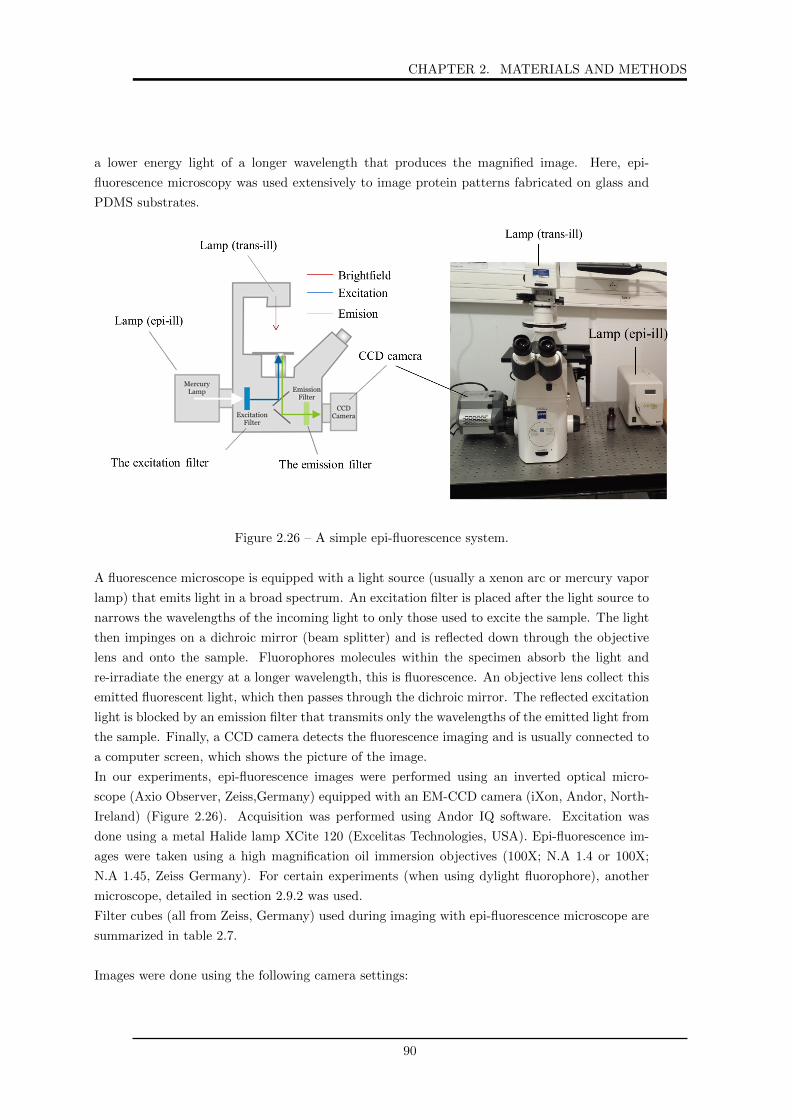
CHAPTER 2. MATERIALS AND METHODS
a lower energy light of a longer wavelength that produces the magnified image. Here, epi-
fluorescence microscopy was used extensively to image protein patterns fabricated on glass and
PDMS substrates.
Figure 2.26 – A simple epi-fluorescence system.
A fluorescence microscope is equipped with a light source (usually a xenon arc or mercury vapor
lamp) that emits light in a broad spectrum. An excitation filter is placed after the light source to
narrows the wavelengths of the incoming light to only those used to excite the sample. The light
then impinges on a dichroic mirror (beam splitter) and is reflected down through the objective
lens and onto the sample. Fluorophores molecules within the specimen absorb the light and
re-irradiate the energy at a longer wavelength, this is fluorescence. An objective lens collect this
emitted fluorescent light, which then passes through the dichroic mirror. The reflected excitation
light is blocked by an emission filter that transmits only the wavelengths of the emitted light from
the sample. Finally, a CCD camera detects the fluorescence imaging and is usually connected to
a computer screen, which shows the picture of the image.
In our experiments, epi-fluorescence images were performed using an inverted optical micro-
scope (Axio Observer, Zeiss,Germany) equipped with an EM-CCD camera (iXon, Andor, North-
Ireland) (Figure 2.26). Acquisition was performed using Andor IQ software. Excitation was
done using a metal Halide lamp XCite 120 (Excelitas Technologies, USA). Epi-fluorescence im-
ages were taken using a high magnification oil immersion objectives (100X; N.A 1.4 or 100X;
N.A 1.45, Zeiss Germany). For certain experiments (when using dylight fluorophore), another
microscope, detailed in section 2.9.2 was used.
Filter cubes (all from Zeiss, Germany) used during imaging with epi-fluorescence microscope are
summarized in table 2.7.
Images were done using the following camera settings:
90

CHAPTER 2. MATERIALS AND METHODS
Fluorophore Filter set Excitation (nm) Beam splitter (nm) Emission (nm)FITC and Atto 488 17 485 510 515/65
44 475 500 530/50Texas red 45 560 585 630/75
76 561 578 608Atto 647 77 642 659 688
Table 2.7 – Filter cubes used during imaging with epi-fluorescence microscope.
1- For atto 488, FITC or TR dyes:
- Exposure time: 310 ms.
- Electronic gain: 2 or 50.
- Pre-Amp gain: 2.
- Pixel size: 0.08 µm.
2- For atto 647 dye:
- Exposure time: 200 ms.
- Electronic gain: 37.
- Pre-Amp gain: 4 .
- Pixel size: 0.08 µm.
2.9.2 Total internal reflection fluorescence Microscopy (TIRF-M)
Total internal reflection fluorescence (TIRF) is a special technique in fluorescence microscopy
developed by Daniel Axelrod at the University of Michigan, Ann Arbor in the early 1980s [299].
TIRF allows us to excite fluorophores in an aqueous or cellular environment very near a solid sur-
face (within ≤ 100 nm) without exciting fluorescence from regions farther from the surface [300].
TIRF is based on the surface-associated evanescent electromagnetic field that is created when
light is internally reflected at a planar interface between two materials with different refractive
indices.
2.9.2.1 Physical basis of TIRF
When light passes through the interface of two transparent media with different refractive indices,
it is be partially refracted and partially reflected (Figure 2.27, light blue and yellow). Above a
certain angle of incidence, the so-called critical angle, the light is completely reflected and a
phenomenon called total internal reflection (TIR) occurs (Figure 2.27 blue and gray). TIR can
only be observed if the light travels from a medium with a higher refractive index (n1) (e.g.
glass, n = 1.52) to a medium with a lower refractive index (n2) (e.g. aqueous medium, n = 1.33)
[299][301][302]. The critical angle ( θc) of incident light, at which total internal reflection occurs,
can be determined by Snell’s law:
θc = sin−1(n2n1
) (2.12)
91
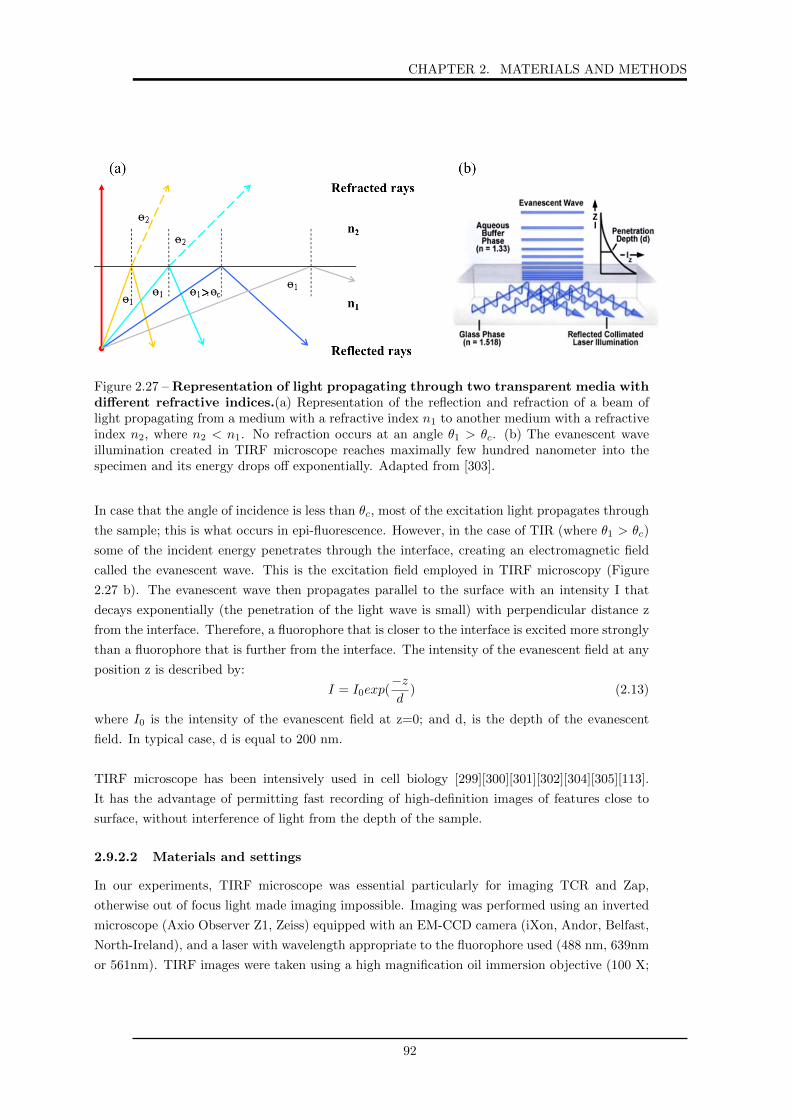
CHAPTER 2. MATERIALS AND METHODS
Figure 2.27 – Representation of light propagating through two transparent media withdifferent refractive indices.(a) Representation of the reflection and refraction of a beam oflight propagating from a medium with a refractive index n1 to another medium with a refractiveindex n2, where n2 < n1. No refraction occurs at an angle θ1 > θc. (b) The evanescent waveillumination created in TIRF microscope reaches maximally few hundred nanometer into thespecimen and its energy drops off exponentially. Adapted from [303].
In case that the angle of incidence is less than θc, most of the excitation light propagates through
the sample; this is what occurs in epi-fluorescence. However, in the case of TIR (where θ1 > θc)
some of the incident energy penetrates through the interface, creating an electromagnetic field
called the evanescent wave. This is the excitation field employed in TIRF microscopy (Figure
2.27 b). The evanescent wave then propagates parallel to the surface with an intensity I that
decays exponentially (the penetration of the light wave is small) with perpendicular distance z
from the interface. Therefore, a fluorophore that is closer to the interface is excited more strongly
than a fluorophore that is further from the interface. The intensity of the evanescent field at any
position z is described by:
I = I0exp(−zd
) (2.13)
where I0 is the intensity of the evanescent field at z=0; and d, is the depth of the evanescent
field. In typical case, d is equal to 200 nm.
TIRF microscope has been intensively used in cell biology [299][300][301][302][304][305][113].
It has the advantage of permitting fast recording of high-definition images of features close to
surface, without interference of light from the depth of the sample.
2.9.2.2 Materials and settings
In our experiments, TIRF microscope was essential particularly for imaging TCR and Zap,
otherwise out of focus light made imaging impossible. Imaging was performed using an inverted
microscope (Axio Observer Z1, Zeiss) equipped with an EM-CCD camera (iXon, Andor, Belfast,
North-Ireland), and a laser with wavelength appropriate to the fluorophore used (488 nm, 639nm
or 561nm). TIRF images were taken using a high magnification oil immersion objective (100 X;
92

CHAPTER 2. MATERIALS AND METHODS
N.A 1.45; Zeiss, Germany). Filter cubes (all from Zeiss, Germany) used during imaging with
TIRF microscope are summarized in table 2.8:
Fluorophore Filter set Excitation (nm) Beam splitter (nm) Emission (nm)FITC 17 485 510 515/65Rhodamine 76 HE 561 578 608Alexa fluor 647 77 HE 642 659 688
Table 2.8 – Filter cubes used during imaging with TIRF microscope.
2.9.3 Reflection Interference contrast Microscopy (RICM)
Currently, RICM is probably the most widely used non-fluorescent technique for imaging cell/substrate
contacts. It is an interferometric technique that allows the determination of the vertical distance
and of the contact area between the interfaces. RICM was initially devised by Adam Curtis
in 1960, to study the interaction of cells with a glass substrate under water by using an op-
tical microscope [306]. He named this technique ”interference reflection microscopy” (IRM).
Later, in the 1980’s Sackmann and co-workers started applying the closely related technique of
”Reflection Interference Contrast Microscopy” or RICM and demonstrated that the distances
between a planar transparent substrate and optically well defined objects, like a colloidal bead
or model membranes for example, hovering over the substrate can be well quantified by RICM
[307][308][309]. The main advantage of RICM rely on the simplicity of the set up, as it can be
implemented with relative ease and very little investment on a standard inverted microscope and
specially, it does not require labeling of the sample.
2.9.3.1 Experimental Setup
A standard version of a RICM set-up consists of a light source, an inverted microscope equipped
with an antiflex objective and a CCD camera. The optical configuration of the microscope for
obtaining the RICM images is illustrated in figure 2.28. The incident light from a high pressure
partially coherent mercury lamp, passes through a filter, a field diaphragm (FD), an aperture
diaphragm (AD) that allows variation of the illuminating numerical aperture, and a polarizer,
in order to produce monochromatic, linearly polarized incident light. The main beam splitter
reflects this light, through the objective, and then through a quarter-wave retardation plate. This
optical system converts the light from linearly polarized into circularly polarized light which is
subsequently transmitted and reflected by the glass substrate and the object. The reflected light
beam passes the quarter wave plate a second time, and becomes linearly polarized, with a switch
on its direction of 90 with respect to the incident light. The change on the light direction allows
to separate the reflected light by the samples from the stray light reflected on the components of
the microscope, by means of crossed analyzer located in front of the detector. Finally, the CCD
camera captures the image that represents the periodic variation of the intensity.
93

CHAPTER 2. MATERIALS AND METHODS
Figure 2.28 – Typical experimental set-up and optical path for a standard RIC mi-croscope. AD: aperture diaphragm; FD: field diaphragm; QWP: quarter-wave plate; SRM:semi-reflecting mirror; P: polarizer; A: analyzer. The circular zoom illustrates the polarizationof light with the antiflex method [310].
Figure 2.29 – Schematic representation of the RICM working principle. I0 is the incidentlight, I1 and I2 are the reflected lights, h is the distance between the interacting surfaces and n0,n1 and n2 are the refractive indexes.
2.9.3.2 Working principle
The working principle of RICM based on the interference of light reflected from different in-
terfaces, is shown in figure 2.29. If we consider, a monochromatic incident ray I0, that passes
through a glass substrate having a refractive index n0, then enters a medium having a refractive
index n1, will be reflected at the glass/medium interface to give rise to a transmitted ray I1. It
will then be reflected at the surface of an object of refractive index n2, to give rise to the ray
I2. Rays I1 and I2 interact to create an interference image. The intensity at a given position in
the image depends on the separation (h) between the two surfaces (the glass substrate and the
object).
Initially, RICM suffered from some limitations, namely low contrast images caused by stray re-
flections (which come from outside of the test region, blur the fringes and make them difficult to
94

CHAPTER 2. MATERIALS AND METHODS
analyze), unwanted interference with reflections from the cell dorsal membrane and ambiguity
between refractive index and substrate separation.These problems were later addressed by using
polarization to eliminate unwanted reflections [311], employing a high illumination numerical
aperture (NA) to defocus dorsal membrane reflections [312] and by illuminating with two dif-
ferent wavelengths [313] respectively. The approach suggested by Ploem (1975) [311] has been
widely adopted, and antiflex objective lenses based on his technique are commercially available.
We used RICM principally to characterize cell adhesion area. In order to form an image of
the attached cell, the linearly polarized incident light will be reflected by the glass surface, and
then travel into the cell to be reflected by the cell membrane. When the membrane is close
to the glass, the reflected light from the glass is shifted by half of a wavelength, so that light
reflected from the membrane will have a phase shift compared to the reflected light from the
glass phase and therefore interference occurs which results in a dark pixel in the final image.
Instead, when the membrane is not attached to the glass, the reflection from the membrane has
a smaller phase shift compared to the reflected light from the glass, and therefore they won’t
cause interference, which results in a bright pixel in the image. We can conclude that, if a cell
adheres to the substrate at its periphery, there will be a difference in contrast between the part
of the cell that adheres to the substrate (dark pixel) and the part that is not adhering (bright
pixel). More the distance between the cell membrane and the substrate decreases, the intensity
of the light increases and the pixel in the image is darker. In our study, cells were imaged using
the same set up as for epi-fluorescence imaging (see section 2.9.1) in addition with a pre-filters
(green 436 ± 17; blue 546 ± 11 nm), and cube composed of two polarizer perpendicularly ori-
ented and a dichroic mirror. Objectives used were custom antiflex oil objectives with 100X; 1.46
NA or standard antiflex oil objective 63X; 1.25 NA (Zeiss, Germany), both of which include a
built-in quarter-wave plate (QWP) located in front of the front lens (Zoom in Figure 2.28). The
microscope was equipped with a motorized aperture diaphragm. Images were recorded with EM-
CCD camera (iXon, Andor, Belfast, North- Ireland). Acquisition was performed using software
Zen (Zeiss). Saved images were opened and processed with Image J/Fiji using macros written
in-house (see section 2.10.2).
2.10 Image analysis
2.10.1 Analysis of the protein nano-dots images
Epi- fluo images of protein nano-dots on glass and PDMS substrates were analyzed manually or
automatically, using a self-written macros in Fiji [S3]/imageJ v1.49d [314] and Igor Pro (Wave-
Matrix,USA) software packages. The analysis performed to determine the lateral size of the
protein nano-dots, the distance between the dots, the intensity inside and outside the dots, and
also to estimate the contrast and the transfer efficiency.
95

CHAPTER 2. MATERIALS AND METHODS
2.10.1.1 Manual Analysis
To characterize the protein nano-dots islands, a radial profile of intensity representing the fluo-
rescent intensity of the dots is realized (Figure 2.30). For this, a line is drawn through several
dots of proteins aligned in the image field (Figure 2.30 white line in a), and an intensity profile
corresponding to the drawn line is represented (Figure 2.30 b). From this intensity profile, several
parameters are determined:
- The distance between two protein nano-dots array which was estimated from the distance be-
tween two peaks in the corresponding intensity profile.
- The lateral size or the width of the proteins dot expressed in terms of the diameter of the
protein dot, was taken to be the full width at half-maximum of the peaks intensity value.
- The fluorescence intensity inside (Imax) and outside the dots (Imin), were estimated respectively
from the peak of the intensity value for each dot, and the baseline around each dot (Figure2.30
b).
Figure 2.30 – Manual characterization of the protein nano-dots. (a) Epi fluorescence imageof the proteins nano-dots pattern; inset display Fourier transforms of the image to emphasize theordering of the lattice. (b) Intensity profile of the line drawn in (a); FWHM is the full width athalf maximum, d is the distance between the dots.
2.10.1.2 Automatical Analysis
Each image field, containing hundreds of dots was segmented into appropriately sized windows
around each dot and a median dot was constructed (Figure 2.31). The dot size was defined as
the full width at half maximum (FWHM) of the intensity profile of the median dot.
The contrast which is a measure of the amount of protein in a dot as compared to outside the
96

CHAPTER 2. MATERIALS AND METHODS
Figure 2.31 – Segmentation of the dots and building of the median dot for quantifica-tion of the dot characteristics. (a) Raw image with a zoom on a centered hexagonal unit. (b)Green ROIs segmenting the dots obtained by automated intensity thresholding. (c) The mediandot obtained for the field. (d) Radial intensity profile of the median dot, indicating the full widthat half maximum (FWHM) and the maximum intensity (Imax).
dot was also calculated, for this, the peak of the intensity profile (Imax) and the base-line around
each profile (Imin) was calculated for each median dot and the contrast was defined as follow:
Contrast =Imax − IminImax + Imin
(2.14)
The transfer ratio was calculated (separately for inside and outside) to estimate the transfer
efficiency, and was defined as follows:
TransferRatioinside(TR) =Imax(elastomer)
Imax(glass)(2.15)
TransferRatiooutside(TR) =Imin(elastomer)
Imin(glass)(2.16)
2.10.2 Analyses of cell adhesion area
Cell adhesion area was analyzed based on RICM images of cells adhered on different surfaces, and
using image J/Fiji macro written in house. The macro is based on applying a spatial variance
filter with a radius of 8 pixels, followed by a thresholding step, which determines the cell contour
and provides an accurate measurement of the contact area. The variance in intensity in the
97

CHAPTER 2. MATERIALS AND METHODS
feature-less background is much lower then the variance with and around the image of the cell.
Thus a variance threshold can successfully identify the presence of a cell.
Figure 2.32 – Steps involved in automatic calculation of cell adhesion area. (a) Thebasic RICM image from which the cell-substrate contact region will be segmented. (b) Thresholddetermining the cell area. (c) Identification of the cell boundary. (d) Superposition of the initialRICM image and the cell boundary identified in (c).
98

Chapter 3
Patterning Protocol
99

CHAPTER 3. PATTERNING PROTOCOL
Abbreviations list of the protein and the PDMS used:
BSA Bovine serum albumin
bBSA Bovine serum albumin coupled to biotin
BSA-TR Bovine serum albumin texas-red conjugated
BSA-FITC Bovine serum albumin fluorescein isothiocyanate conjugated
Nav Neutravidin (un-conjugated)
Nav-TR Neutravidin texas-red conjugated
Nav-FITC Neutravidin fluorescein isothiocyanate conjugated
Nav-dylight Neutravidin dylight conjugated
Anti-CD3 Anti-cluster of differentiation 3
bBSA-TR biotin-bovin serum albumin, texas red conjugated
bBSA-Atto biotin-bovin serum albumin, Atto 488 conjugated
Sylgard Sylgard 184 A and B
Q Gel Q Gel 920 A and B
CY CY 52-276 A and B
p Sylgard Sylgard after curing exposed to plasma
p Q Gel Q Gel after curing exposed to plasma
p CY CY after curing exposed to plasma
glu CY CY after curing chemically treated with a process involving glutaraldhehyde
glu Q Gel Q Gel after curing chemically treated with a process involving glutaraldhehyde
100
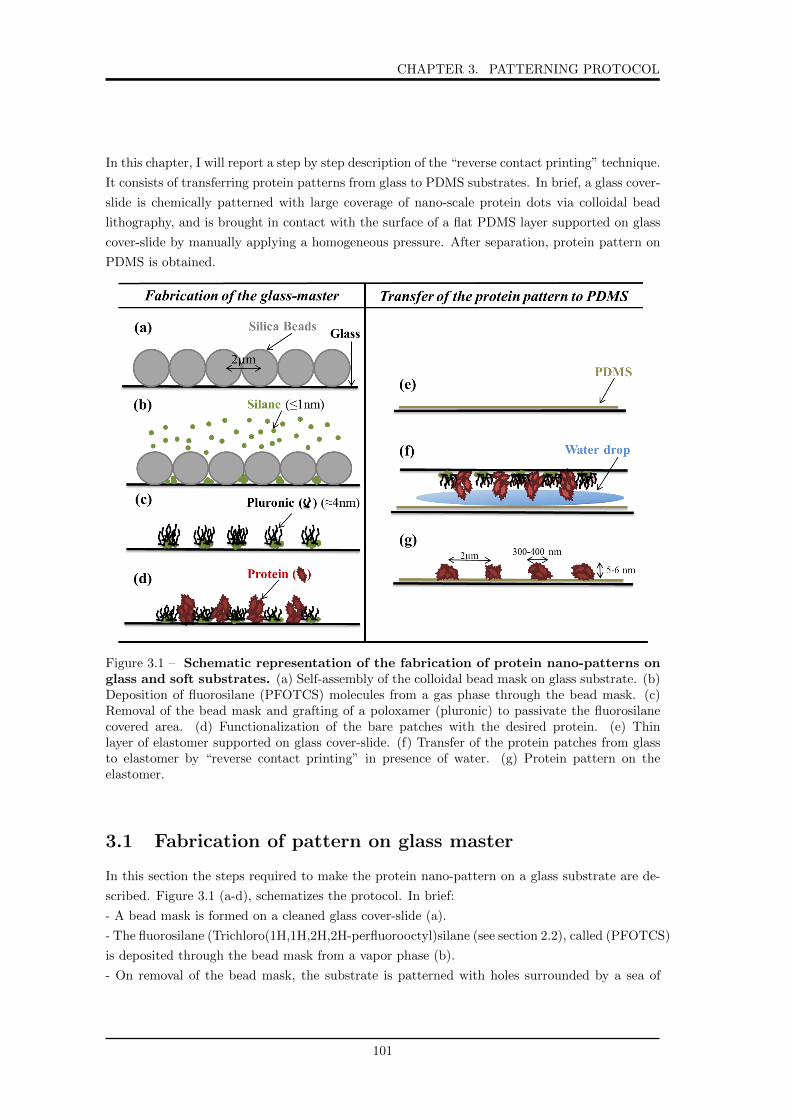
CHAPTER 3. PATTERNING PROTOCOL
In this chapter, I will report a step by step description of the “reverse contact printing” technique.
It consists of transferring protein patterns from glass to PDMS substrates. In brief, a glass cover-
slide is chemically patterned with large coverage of nano-scale protein dots via colloidal bead
lithography, and is brought in contact with the surface of a flat PDMS layer supported on glass
cover-slide by manually applying a homogeneous pressure. After separation, protein pattern on
PDMS is obtained.
Figure 3.1 – Schematic representation of the fabrication of protein nano-patterns onglass and soft substrates. (a) Self-assembly of the colloidal bead mask on glass substrate. (b)Deposition of fluorosilane (PFOTCS) molecules from a gas phase through the bead mask. (c)Removal of the bead mask and grafting of a poloxamer (pluronic) to passivate the fluorosilanecovered area. (d) Functionalization of the bare patches with the desired protein. (e) Thinlayer of elastomer supported on glass cover-slide. (f) Transfer of the protein patches from glassto elastomer by “reverse contact printing” in presence of water. (g) Protein pattern on theelastomer.
3.1 Fabrication of pattern on glass master
In this section the steps required to make the protein nano-pattern on a glass substrate are de-
scribed. Figure 3.1 (a-d), schematizes the protocol. In brief:
- A bead mask is formed on a cleaned glass cover-slide (a).
- The fluorosilane (Trichloro(1H,1H,2H,2H-perfluorooctyl)silane (see section 2.2), called (PFOTCS)
is deposited through the bead mask from a vapor phase (b).
- On removal of the bead mask, the substrate is patterned with holes surrounded by a sea of
101

CHAPTER 3. PATTERNING PROTOCOL
hydrophobic silane, which is then passivated with pluronic (see section 2.4) (c).
- The holes are filled with the protein of interest (d).
3.1.1 Fabrication of the colloidal bead mask
Suspension of silica colloidal bead micro-spheres with 2µm diameter was concentrated into 2:1
(v/v) with ultra-pure water and washed as follow:
- 1 ml of the bead suspension was placed in centrifuge tube.
- The tube containing the beads was centrifuged at 2000 rpm for 4 minutes to clear the super-
natant.
- The supernatant were removed and discarded from the tube.
- The beads were resuspended in water and vortexed to re-disperse.
- This steps were repeated 6 times.
- The beads were cleaned and ready to be used.
Figure 3.2 – Steps of the colloidal bead self-assembly on glass substrate. In step (1) aglass cover-slide is set at a controlled angle. In steps (2) and (3); a drop of the beads suspensionis allowed to spread on the glass cover slide until it attends the bottom of the slide. In step (4)the edge angle of the glass cover-slide is decreased [215].
A glass platform with edge angle of 4 was placed on a standard laboratory work bench under
ambient conditions. Then, a glass cover-slide, washed as described in section 2.1, was set on the
platform at an angle of 13 . A 80 to 100 µl drop of washed silica suspension is allowed to spread
on the cleaned glass substrate under gravity. When the spreading front of the suspension reaches
the bottom of the glass cover-slide, we decrease the edge angle of the glass cover-slide to 4 , and
we turn the glass cover-slide 90 from its position, every 10 seconds, 4 times. This is done to
facilitate uniform spreading and prevents formation of multilayers or clusters. Decreasing the
102

CHAPTER 3. PATTERNING PROTOCOL
edge angle and turning the glass cover-slide cause a back flow of the suspension which carries
some of the beads and fill the defects formed during the first step. The slide is then kept on
a plane surface for around 45 minutes, at room temperature to let the water evaporate. After
drying, a large coverage area of ordered array of beads with a characteristic distance between
neighboring beads (corresponding to the diameter of the beads) is generated. Figure 3.2 shows
the steps of the colloidal bead self-assembly on the glass substrate.
The quality of the monolayer in terms of uniformity and the area covered, is influenced by the
following factors:
- The hydrophilicity of the glass substrate which enables the liquid drop of beads to spread due
to the high surface energy.
- The concentration and the volume of the micro-spheres suspension, which play a key role for
particle absorption before draining and prevent formation of multilayers of beads after drying.
Figure 3.3 shows an example of the bead mask obtained, visualized with optical microscopy
in transmitted light, using a 100X, 1.4 N.A. oil objective.
Figure 3.3 – Optical microscopy (transmission bright-field) image of 2 µm silica col-loidal bead mask on glass substrate. Inset displays the Fourier transform of the image toemphasize the ordering of the lattice.
3.1.2 Silanization with PFOTS via Vapor Deposition
The colloidal bead monolayer served as a mask to deposit organosilane molecules on the glass
cover-slide from a vapor phase. The silanization procedure was done with PFOTS by vapor phase
deposition (VPD). High quality monolayers are known to be easier achieved by this technique in
comparison from a solution [315]. This can be done by increasing the percent partial pressure
of the organosilane within a closed system, achieved either by heating a closed container or by
lowering the base pressure using a vacuum pump with an open source of the liquid organosilane
inside. The organosilane is then deposited via chemisorption.
The VPD was performed as follows (Figure 3.4):
103

CHAPTER 3. PATTERNING PROTOCOL
Figure 3.4 – Schematic set-up of silanization procedure. Vapor phase deposition of PFOTSby increasing the percent partial pressure of the organosilane within a close chamber (desiccator).
- Around 200 µl of PFOTS was placed in a petri dish in the bottom of the desiccator under the
sample holder.
- The substrates with the bead monolayer were put on the sample holder.
- The desiccator was closed and connected to a vacuum pump.
- The system was pumped to approximately 100 mTorr, for around 30 minutes.
- The pump was shut, retaining the vacuum inside the desiccator.
- The system was placed on a hot plate and heated for one hour at 35 C, to maintain a constant
temperature during deposition.
- The desiccator chamber was opened, and the silanized substrates were stored in a clean envi-
ronment until the next step.
Figure 3.5 – Water contact angle measurements on glass substrates. (A) After cleaningwith surfactant (before the silanization step). (B) After silanization with PFOTCS.
During the process of chemisorption, the trichloro-silane group of PFOTS reacts with trace
amount of water to form intermediate silanol groups, which then react with the free hydroxyl
groups on the glass surface, to covalently immobilize the organosilane. As a consequence of the
104

CHAPTER 3. PATTERNING PROTOCOL
successful deposition of PFOTCS on the glass, the surface becomes hydrophobic, due to the
presence of the heavy fluorinated tail group of the PFOTS (see section 2.2). This was tested by
measuring the contact angle of a droplet of water on the silanized glass cover slide. Figure 3.5
(B) shows that the cover slide was rendered hydrophobic with a contact angle ' 95 . After the
deposition of PFOTCS, the colloidal bead mask was removed by ultrasonic agitation of the glass
cover-slide in water for 3 seconds, and the success of the silanization step was characterized at
the molecular level, by imaging the glass substrate (after the removal of beads), using tapping
mode AFM in air.
Figure 3.6 (a,c), shows the topography of the PFOTCS structures presenting nearly perfect
ring shape with a spacing of 1.9 ± 0.1 µm between two rings corresponding to the size of the
beads used (2 µm). Figure 3.6 (b,d), shows a zoom on a single ring and the corresponding height
profile showing a distance of 250 ± 20 nm between the two peaks. These images show that the
silane is preferentially grafted in a form of multi-layers along the line of contact between the
bead and the glass cover-slide, thus forming rings. It is also expected to be grafted everywhere
outside the ring (as indicated by the shading in figure 3.6 d) though the thin layer outside the
ring is not clearly detectable here.
105

CHAPTER 3. PATTERNING PROTOCOL
Figure 3.6 – AFM imaging and analysis, corresponding to the grafting of PFOTCS.(a) Tapping mode AFM image (in air) after PFOTCS grafting. (b) Zoom-in image of a singlecircle. (c,d) Corresponding height profile of the line drawn in a and b respectively.
3.1.3 Pluronic grafting and protein patterning
At the step of beads removal, the substrate is patterned with holes to the bare glass surrounded
by a sea of PFOTCS. To proceed further with the functionalization, pluronic chains are grafted
to PFOTCS, by incubating the silanized glass cover-slide in 1 ml of pluronic F68 10%, for one
hour at room temperature, then rinsing three times with PBS solution. The pluronic copolymer
will adsorb on the surface by interaction between its middle apolar polypropylene oxide segments
(PPO) and the hydrophobic fluorinated tail group of the silane (PFOTCS). The polyethylene
oxide segments (PEO) of the pluronic interact with water molecules and extend to the bulk
aqueous solution. Pluronic will therefore acts as a blocking agent to reduce or eliminate non
specific protein binding in the subsequent step of protein adsorption. The adsorption of pluronic
to the chemically nano-patterned substrate produced defined regions with protein-adhesive and
protein-rejecting characters. The protein repellent properties of pluronic have been reported in
a number of studies [316] [317].
To demonstrate this concept, we functionalized the glass cover-slide, after the pluronic depo-
106

CHAPTER 3. PATTERNING PROTOCOL
sition, with Nav-TR. Thus, it was incubated in 300 µl of 4 µg/ml Nav-TR for 30 minutes at
room temperature, then rinsed 10 times with PBS. The protein molecules were directly adsorbed
only on patches of bare glass corresponding to the contact sites of the micro-spheres in the orig-
inal mask, thus forming an array of well organized protein patches corresponding to the original
pattern of the silica beads micro-spheres. This can be seen in figure 3.7 a, which is an epi-
fluorescence image of the Nav-TR pattern on glass. The white dots are the proteins and the
black background corresponds to the pluronic. We can see from the intensity profile in figure
3.7 b, a distance of 1.89 ± 0.09 µm between two peaks, corresponding to the distance separating
two dots of proteins, and matching well the diameter of the colloidal beads used (2 µm). We can
also determine from the intensity profile, the proteins dot size, here 450 ± 40 µm as calculated
from the full width at the half maximum of the intensity trace.
Figure 3.7 – Epi-fluorescence images of protein pattern (Nav-TR) on glass substrate.a- Epi-fluorescence image. b- Corresponding intensity profile of the line drawn in a. Inset displaythe Fourier transform indicating the ordering of the pattern.
Figure 3.8 – Epi-fluorescence images of proteins (Nav-TR) without the pluronic graft-ing step. a- Epi-fluorescence image. b- Corresponding intensity profile of the line drawn in a.Inset display the Fourier transform indicating the ordering of the pattern.
In a separate experiment, the success of the pluronic binding step was tested. For this, all the
steps of the protocol from the beads spreading to the functionalization with protein (Nav-TR),
107

CHAPTER 3. PATTERNING PROTOCOL
were repeated, but this time without the pluronic grafting step. We obtain an inverted protein
pattern (the protein molecules are everywhere on the silanized glass but not in the holes) as is
seen from the epi-fluorescence image in figure 3.8. In fact, proteins are known to easily adsorb to
hydrophobic surfaces. In the absence of pluronic, the presence of the fluorinated tail of the silane
in between the holes, offers an hydrophobic surface attracting the proteins. In fact, the amount
of protein going to the hydrophilic surface is much less then the massive amount going to the
hydrophobic zones. Therefore, the hydrophilic dots look dark in a sea of bright background.
Figure 3.9 – AFM images corresponding to the grafting of pluronic on the PFOTCSlayer. (a) Tapping mode AFM image (in air) after pluronic grafting. (b) Zoom-in image of asingle circle. (c) Corresponding height profile of the line drawn in b. (d) Tapping mode AFMimage (in water) after the pluronic grafting step.
To characterize the binding of pluronic at the molecular scale, AFM images in air were effectu-
ated after the pluronic grafting step (Figure 3.9). Figure 3.9 (a,b), shows the presence of the
ring shapes with a distance of 1.85 ± 0.1 µm corresponding to the pitch of PFOTCS ring array,
and also to the diameter of the beads used (2 µm). The relative elevation of the area outside
the ring (shading in figure 3.9 c) indicates successful pluronic grafting. The diameter of a single
108

CHAPTER 3. PATTERNING PROTOCOL
ring is measured to be 240 ± 30 nm (Figure 3.9 c), and is in correlation with that found after
the silanization step (250 ± 20 nm, Figure 3.6 d).
The pluronic grafting step was also imaged in water (Figure 3.6 d). The image shows per-
fect circular holes. No ring shape is observed as compared with the image taken in air.
Figure 3.10 – AFM images corresponding to the protein grafting step. (a) Tappingmode AFM image (in air) after protein grafting. (b) Zoom-in image of a single patch. (c)Corresponding profile of the line drawn in b. Black line indicates the protein level, and blackdashed line the height of pluronic grafted on PFOTCS.
Finally, the final step of the Nav-TR protein grafting was also imaged with AFM in air (Figure
3.10). The elevation of the level of the interior of the ring (shading in figure 3.10 c) indicates
successful grafting. First, the height profile represented in figure 3.10 (c), shows a lateral size of
the protein equal 250 ± 30 nm, measured as the distance between the two edges of the protein
patch, and corresponds to the diameter of the protein. The black dashed line indicates the height
of pluronic grafted on PFOTCS, and the black line indicates the Nav protein grafted on glass.
The technique of fabrication of the protein nano-pattern on glass substrates was validated for
109

CHAPTER 3. PATTERNING PROTOCOL
several types of proteins (BSA-FITC, BSA-TR, bBSA, Nav-TR, Nav-FITC, fibronectin, bBSA-
TR, bBSA-Atto), and for different types of pluronic (F-127, F-108 and F-68) used at various
concentration (see section 4.4).
3.1.4 The use of the protein patterned glass substrates
The protein patterned glass substrates fabricated as described above, were either functionalized
for experiments on T-cell adhesion (section3.1.4.1) or used as master for transfer of the pattern
to the surface of elastomer (PDMS) substrate (section 3.2).
3.1.4.1 Functionalization of the protein patterned glass for T-Cell experiments
The protein patterned glass substrates were further used as support for experiments on T-
lymphocytes adhesion. For that, glass patterned with bBSA-TR was fabricated as described
in section 3.1, rinsed several times with PBS to eliminate excess of protein, then functionalized
with 800 µL of non-fluorescent Nav at a concentration of 4 µg/ml for 30 minutes at room tem-
perature, followed by 10 times washing with PBS, and incubation in 800 µl of 2 µg/ml anti-CD3
multi-biotinylated for 30 minutes at room temperature, and finally, thoroughly rinsed with PBS.
3.2 Patterning PDMS by Reverse Contact Printing
In this section, we will trace the “reverse contact printing” mechanism, consisting of the transfer
of the protein nano-pattern created on glass (as described section 3.1), to the surface of native or
functionalized silicone PDMS elastomer. We will start by describing the preparation of the PDMS
substrate, followed by its surface modification. We will then report the transfer mechanism, and
finally the functionalisation of the patterned PDMS substrate for experiments on T-cell.
3.2.1 Preparation of the PDMS layer
The various steps for obtaining the PDMS layer are described in detail in section 2.3 and ap-
pendix A.1. In brief a cleaned glass substrate is coated with a thin layer of PDMS by spin coating,
and then cured appropriately. The thickness of the PDMS layer depends on the PDMS type and
mixing ratio of the base and curing agent constituting the PDMS. We obtained a thickness of 8
± 1 µm (Table 2.2). The PDMS substrates are used either native or in a certain experiments
functionalized, as target surface for the protein transfer. Three types of PDMS were used, CY,
Sylgard and Q gel (see section 2.3 for details).
3.2.2 Surface modification of PDMS
In some experiments, PDMS was oxidized by oxygen plasma treatment (see section 2.3.4) and
either used directly or was subjected to a chemical treatment following the plasma.
110

CHAPTER 3. PATTERNING PROTOCOL
3.2.2.1 Chemical treatment
In some experiments, PDMS substrate was chemically funtionalized in order to create an attrac-
tive surface for the proteins where strong and stable covalent linkage of the protein to the PDMS
surface can be induced. For this, PDMS substrate was activated by oxygen plasma as described
in section 2.3.4, creating free hydroxyl (OH) groups on its surface. The oxidized PDMS was
then treated for 10 minutes with 10% (v/v) solution of APTES in absolute ethanol. Finally, the
APTES treated PDMS was rinsed with 96% ethanol, dried, and functionalized with 8% (v/v)
solution of glutaraldhehyde (called Glu) (1.06g/mL) in ultra-pure water, for one hour at room
temperature, carefully rinsed using MQ water. In fact, APTES will bound to free OH groups
on the PDMS, leaving primary amine (NH2) groups on the surface. Glutaraldehyde is then
subsequently used to reacts with the surface amine group, yielding an imine linkage (C=N) with
one end aldehyde group in glutaraldehyde. The other end aldehyde group will reacts with the
amine group in the protein by elimination of a water molecule (Figure 3.11). Surface treatment
Figure 3.11 – Schematic representation of PDMS surface modification. Oxidized PDMSsurface is chemically silanized with APTES, and then activated with glutaraldhehyde for subse-quent functionalization with protein. Adapted from [318].
of PDMS with APTES and Glu was frequently reported [39][318][319][320]. It was demonstrated
that this functionalization reduces the hydrophobicity of the native PDMS, minimizes the direct
and weak interactions of proteins with the PDMS surface and overcomes the steric hindrance
from the vicinity of the support, which is essential for stronger protein attachment.
3.2.3 Transfer
The protein patterned glass cover-slides described in section 3.1, were used as “masters” to trans-
fer the protein patches to the surface of a thin layer of PDMS . The printing of the pattern from
the glass to the PDMS substrate was performed in two steps (Figure 3.1 e-g):
111

CHAPTER 3. PATTERNING PROTOCOL
- The patterned glass was brought in contact with the PDMS substrate wetted by a thin water
layer, through adding a drop of water onto the PDMS surface (more details in section 4.2.2.3).
When the two substrate in contact, a manual moderate pressure was applied. The pressure was
seen to be robust and not very sensitive since the mechanism was tried by several experimenter.
- The two surfaces were left in contact overnight and separated the following day.
After separation, the protein pattern was transfered to the PDMS surface, and epi-fluorescence
images were done to asses the quality of the transfer.
Different types of proteins (Nav-TR, bBSA, BSA-FITC, bBSA-TR, bBSA-Atto 488; see list
of abbreviation at the beginning of chapter 3) were transfered to different PDMS substrates, the
mechanism and the conditions governing the transfer will be depicted in the chapter 4.
3.2.4 PDMS controls for T-cell study
In addition to patterned PDMS, the followin substrates were used as controls for cell studies.
Positive Control (POS)
The patterned PDMS substrates were further used as support for pilot experiments on T-
lymphocytes adhesion. For that, PDMS patterned with bBSA-TR was fabricated as described
in section 3.2.3, then incubated in 800 µl of pluronic F-127 1% (v/v) in water for 30 minutes at
room temperature in order to block unspecific protein adhesion. It was then rinsed three times
with PBS, functionalized with 800 µL of Nav-dyelight or non-fluorescent Nav at a concentration
of 4 µg/ml for 30 minutes at room temperature, followed by 10 times washing with PBS, and
incubation in 800 µl of 2 µg/ml anti-CD3 multi-biotinylated for 30 minutes at room temperature,
and finally, thoroughly rinsed with PBS.
Negative Control(NEG)
For patterned substrates, negative control was performed as follows:
- Incubate 800 µl of F 127 1% on the native PDMS substrate for one hour at RT.
- Rinse 5 times with PBS.
112

Chapter 4
Characterization and Mechanism
of the transfer process
113

CHAPTER 4. CHARACTERIZATION AND MECHANISM OF THE TRANSFERPROCESS
In the previous chapter, I introduced the reverse contact printing protocol, which can transfer
pattern of proteins adsorbed onto a glass surface to a variety of PDMS surfaces. To further inves-
tigate the efficiency of the patterning technique that I developed, I will begin by characterizing
the different PDMS substrates used in this protocol, in term of chemical structure, wettability
and elasticity. Then I will describe the transfer of different proteins on a variety of PDMS sub-
strates in terms of dot size, contrast (before and after the transfer) and transfer ratio. I will
finish by proposing a molecular mechanism governing the protein transfer.
4.1 Characterization of PDMS substrates
As I already presented in section 2.3 and 3.2, various types of PDMS materials with great
variability in surface properties (Sylgard 184, Q Gel 920 and CY 52-276), were used in this work.
This section will be dedicated to describe the differences between this three types of PDMS in
terms of wettability and elasticity.
4.1.1 Contact angle measurement on PDMS
Contact angle of a water droplet on PDMS was measured 30 minutes after substrate preparation,
with the sessile drop method (see section 2.3.6). Table 4.1 summarizes the water contact angle
values obtained for the different samples.
The water contact angle of the different native PDMS substrates were 104 , 116 and 122 for
Sylgard, Q Gel and CY respectively (Figure 4.1 a-c). Therefore PDMS can be considered as
having an hydrophobic surface. The CY shows the highest contact angle.
Native Plasma treatedSylgard (10:1) 104 ± 4 3 ± 1
Q Gel (1:2) 116 ± 4 35 ± 6CY(1:1) 122 ± 3 13 ±3
Table 4.1 – Water contact angle measurements of different native and plasma treatedPDMS samples.
Contact angle measurements were also done following the surface modification of the PDMS
substrates with oxygen plasma (see section 2.3.4). Measurements show a decrease in the contact
angle value as follows, 3 , 35 and 13 for Sylgard, Q Gel and CY respectively (Figure 4.1 d-f).
This can be related to the fact that during oxygen plasma treatment, methyl groups at the
surface of PDMS are removed and replaced by chemical species like hydroxyl groups, which are
negatively charged dipoles producing an hydrophilic behavior of the surface (see section 2.3.4).
Given that, water is a dipole with certain affinity to the hydroxyl groups and therefore the drop
formed on the modified PDMS surfaces exhibits a smaller contact angle [321].
4.1.1.1 Interpretation
Given the differences in the composition of the different PDMS types (CY, Q Gel and Sylgard)
elucidated in section 2.3.3, we hypothesize that the increased contact angle of the native Q Gel
114

CHAPTER 4. CHARACTERIZATION AND MECHANISM OF THE TRANSFERPROCESS
Figure 4.1 – Droplet contact angle on different PDMS substrates. On native (a-c), andplasma treated (30W, 15 seconds) (d-f), sylgard, Q Gel and CY respectively.
(116 ± 4) in comparison with the native Sylgard (104 ± 4) noticed in section 4.1.1, is due to the
presence of phenyl groups in the Q Gel chains. This groups are non polar hydrophobic groups.
The contact angle obtained for the plasma treated Q Gel (35 ± 6), corresponding to the highest
hydrophobicity among all the treated PDMS studied, can be attributed to the fact that the
phenyl groups present in the Q Gel tend to resist oxidation [322]. Finally, in the case of CY
(122 ± 3), which is more hydrophobic than the Sylgard (104 ± 4), it needs more plasma power
for the same exposure time or vice-versa, to obtain a wettability compared to the plasma treated
Sylgard. However, for the same plasma power and exposure time, plasma treated CY exhibit a
higher contact angle in comparison with the treated Sylagrd.
115

CHAPTER 4. CHARACTERIZATION AND MECHANISM OF THE TRANSFERPROCESS
4.1.2 Elasticity measurement
AFM nano-indentation experiments were performed on the different PDMS substrates under
water. All the values reported are averages from measurements done on at least three samples
for each type of substrate, and 100 curves were recorded at different locations for each sample,
at minimum 4 distinct regions at the sample surface and under the same conditions, in order to
determine the Young’s modulus. The data obtained from the nano-indentation experiments were
fitted with the Hertz (in case of no adhesion) or JKR (in case of adhesion) model (see section
2.8.5). The contact point was chosen to be at zero distance from the sample, thus, the point
where the force begins to increase.
4.1.2.1 Indentation Depth
One of the major problem for elasticity measurement in the case of a soft and thin sample is that
the AFM tip can largely compress the sample, and “feel” the underlying stiff substrate. Conse-
quently, the extracted Young’s modulus is increased and the sample appears stiffer than it is in
reality. To elucidate this problem, force-distance curves were recorded at different indentation
depth in the PDMS sample.
Figure 4.2 A represent a typical force curve registered on the CY (1:1) PDMS. We observe
that the loading and unloading curves are perfectly superimposed, indicating an elastic behav-
ior. Using Hertz Model for data fitting, the elasticity of the PDMS sample was calculated at
different indentation depth, and a graph of elastic modulus versus indentation depth was pro-
duced (Figure 4.2 B). From this graph, we could identify a plateau region where elasticity values
remained relatively constant. We observe that when the indentation depth is a small fraction
of the PDMS film thickness, being 8 µm, the Young’s modulus is relatively low. As the in-
dentation depth increases, the measured Young’s modulus also increases, due to the increasing
influence of the very stiff glass substrate (E ∼ GPa) supporting the PDMS layer, which starts
to couple in mechanically and affects the measurements. Thus, we note a constant value from
initial tip-sample contact until 500 nm depth, followed by an increase of the Young’s modulus
30 times greater for indentations between 500 nm and 3 µm, to attain a value 103 times greater
for indentations above 50% of the film thickness (data not shown in the figure). To minimize the
influence of the glass substrate, only the portion of the indentation curve, up to 500 nm was used
for the analysis (note that in the field of nano-indentation, it is common practice to assume that
indentations which are less than 10% of the film thickness are mostly independent of substrate
influences). The value measured at this indentations matches, what was previously reported for
this type of PDMS [266][323][324]. As the constant region was obtained for indentation ≤ 500
nm, all measurements in this project were done for a maximum indentation of 500 nm.
116

CHAPTER 4. CHARACTERIZATION AND MECHANISM OF THE TRANSFERPROCESS
Figure 4.2 – A typical force versus displacement curve on the PDMS (CY52-276 (1:1))surface. a- Force-distance curve showing a loading and unloading curves perfectly superimposed,the black lines on the curve indicate the value of the indentation depth were the Young’s moduluswas measured. b- Effect of indentation depth on Young’s modulus calculation. In this example,a plateau region of reliable elasticity values is present between 100 nm and 500 nm depth, andthe final indentation depth is 4 µm.
4.1.2.2 Surface Stiffness of PDMS
The elastic response of a material is its ability to recover its initial shape following mechanical
deformation. From the contact regime of a force-displacement curve, it is possible to draw in-
formations about the elastic behavior of the material. For an ideal elastic material, during the
advance, the tip deforms the sample by a depth of δ, the sample then regains its shape during
the retract, exerting on the tip the same force.
Figure 4.3 (a), shows a force curve recorded on glass substrate used as a sample with “infi-
nite hardness” to calibrate the AFM. The sharp transition observed in the curve indicates that
a clean AFM tip (here, silica colloidal tip) is approaching a clean support (here glass), and that
both the materials are mechanically stiff. We also see that the loading and unloading curves
are atop of each other, with no hysteresis, which means that the AFM system has been set up
properly, and the AFM tip and sample are not contaminated.
117

CHAPTER 4. CHARACTERIZATION AND MECHANISM OF THE TRANSFERPROCESS
Figure 4.3 – Force-distance curves on glass and different PDMS substrates. Forcecurves on (a): Glass. (b-d): native Q Gel, Sylgard and CY respectively, (e-g): Plasma treatedQ Gel, Sylgard and CY. The blue curves represent the fit curves. Note the differences in scalebetween the curves.
Figure 4.3 (b-g) shows, force curves recorded on different native and plasma treated PDMS sam-
118
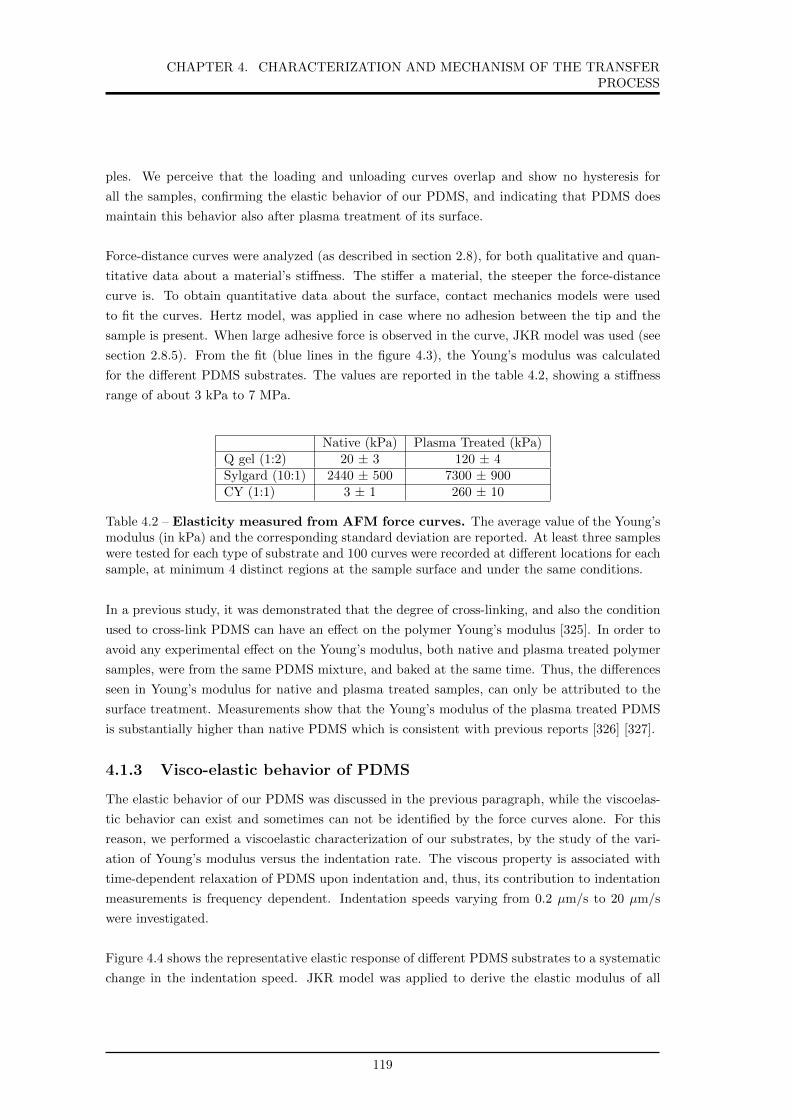
CHAPTER 4. CHARACTERIZATION AND MECHANISM OF THE TRANSFERPROCESS
ples. We perceive that the loading and unloading curves overlap and show no hysteresis for
all the samples, confirming the elastic behavior of our PDMS, and indicating that PDMS does
maintain this behavior also after plasma treatment of its surface.
Force-distance curves were analyzed (as described in section 2.8), for both qualitative and quan-
titative data about a material’s stiffness. The stiffer a material, the steeper the force-distance
curve is. To obtain quantitative data about the surface, contact mechanics models were used
to fit the curves. Hertz model, was applied in case where no adhesion between the tip and the
sample is present. When large adhesive force is observed in the curve, JKR model was used (see
section 2.8.5). From the fit (blue lines in the figure 4.3), the Young’s modulus was calculated
for the different PDMS substrates. The values are reported in the table 4.2, showing a stiffness
range of about 3 kPa to 7 MPa.
Native (kPa) Plasma Treated (kPa)Q gel (1:2) 20 ± 3 120 ± 4Sylgard (10:1) 2440 ± 500 7300 ± 900CY (1:1) 3 ± 1 260 ± 10
Table 4.2 – Elasticity measured from AFM force curves. The average value of the Young’smodulus (in kPa) and the corresponding standard deviation are reported. At least three sampleswere tested for each type of substrate and 100 curves were recorded at different locations for eachsample, at minimum 4 distinct regions at the sample surface and under the same conditions.
In a previous study, it was demonstrated that the degree of cross-linking, and also the condition
used to cross-link PDMS can have an effect on the polymer Young’s modulus [325]. In order to
avoid any experimental effect on the Young’s modulus, both native and plasma treated polymer
samples, were from the same PDMS mixture, and baked at the same time. Thus, the differences
seen in Young’s modulus for native and plasma treated samples, can only be attributed to the
surface treatment. Measurements show that the Young’s modulus of the plasma treated PDMS
is substantially higher than native PDMS which is consistent with previous reports [326] [327].
4.1.3 Visco-elastic behavior of PDMS
The elastic behavior of our PDMS was discussed in the previous paragraph, while the viscoelas-
tic behavior can exist and sometimes can not be identified by the force curves alone. For this
reason, we performed a viscoelastic characterization of our substrates, by the study of the vari-
ation of Young’s modulus versus the indentation rate. The viscous property is associated with
time-dependent relaxation of PDMS upon indentation and, thus, its contribution to indentation
measurements is frequency dependent. Indentation speeds varying from 0.2 µm/s to 20 µm/s
were investigated.
Figure 4.4 shows the representative elastic response of different PDMS substrates to a systematic
change in the indentation speed. JKR model was applied to derive the elastic modulus of all
119
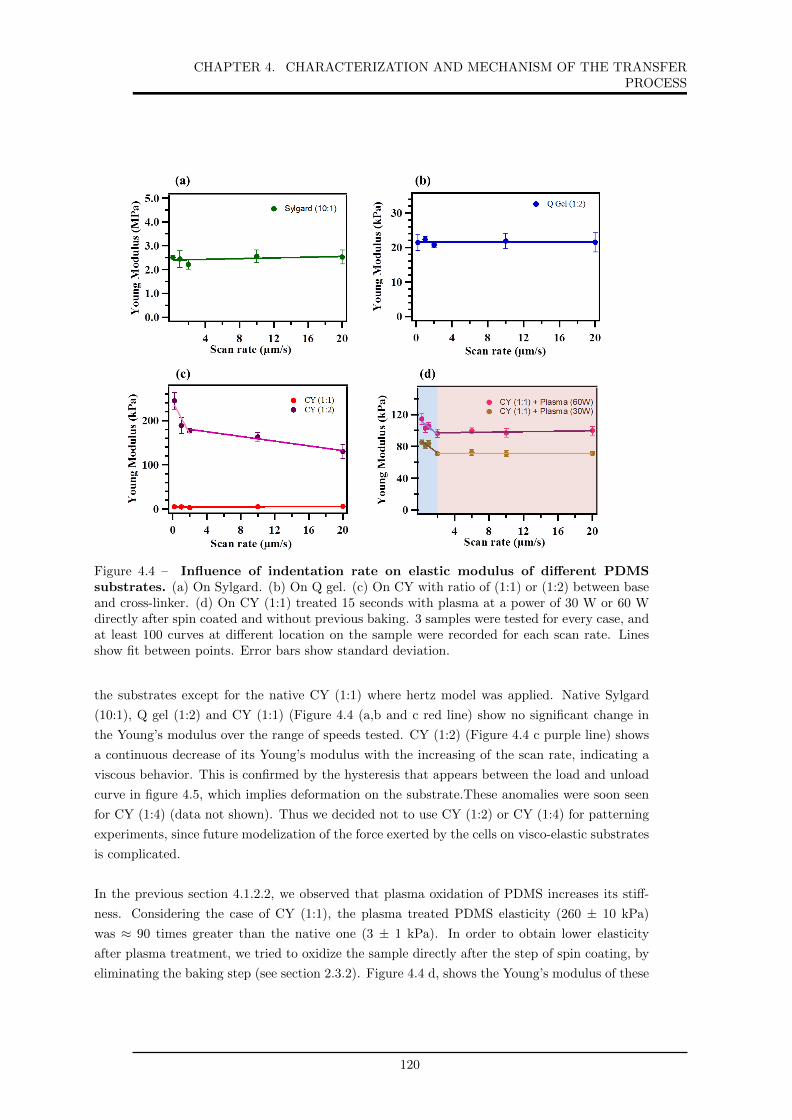
CHAPTER 4. CHARACTERIZATION AND MECHANISM OF THE TRANSFERPROCESS
Figure 4.4 – Influence of indentation rate on elastic modulus of different PDMSsubstrates. (a) On Sylgard. (b) On Q gel. (c) On CY with ratio of (1:1) or (1:2) between baseand cross-linker. (d) On CY (1:1) treated 15 seconds with plasma at a power of 30 W or 60 Wdirectly after spin coated and without previous baking. 3 samples were tested for every case, andat least 100 curves at different location on the sample were recorded for each scan rate. Linesshow fit between points. Error bars show standard deviation.
the substrates except for the native CY (1:1) where hertz model was applied. Native Sylgard
(10:1), Q gel (1:2) and CY (1:1) (Figure 4.4 (a,b and c red line) show no significant change in
the Young’s modulus over the range of speeds tested. CY (1:2) (Figure 4.4 c purple line) shows
a continuous decrease of its Young’s modulus with the increasing of the scan rate, indicating a
viscous behavior. This is confirmed by the hysteresis that appears between the load and unload
curve in figure 4.5, which implies deformation on the substrate.These anomalies were soon seen
for CY (1:4) (data not shown). Thus we decided not to use CY (1:2) or CY (1:4) for patterning
experiments, since future modelization of the force exerted by the cells on visco-elastic substrates
is complicated.
In the previous section 4.1.2.2, we observed that plasma oxidation of PDMS increases its stiff-
ness. Considering the case of CY (1:1), the plasma treated PDMS elasticity (260 ± 10 kPa)
was ≈ 90 times greater than the native one (3 ± 1 kPa). In order to obtain lower elasticity
after plasma treatment, we tried to oxidize the sample directly after the step of spin coating, by
eliminating the baking step (see section 2.3.2). Figure 4.4 d, shows the Young’s modulus of these
120

CHAPTER 4. CHARACTERIZATION AND MECHANISM OF THE TRANSFERPROCESS
Figure 4.5 – Force-distance curves on CY (1:2).
kind of substrates as a function of scan rate variation. We observe for scan rate < 2 µm/s, the
Young’s modulus decreases with the decreasing of the scan rate, showing a viscous behavior (as
indicated by blue shading in figure 4.4 d). For scan rate > 2 µm/s, no significant modifications
of the Young’s modulus with the increasing of the scan rate (brown shading in figure 4.4 d).
We think that the plasma treatment did not permits a total cross-linking of the PDMS. We de-
cided to not use this technique, because a deeper study of the mechanism was felt to be necessary.
From these results, we concluded that indentation speed did not affect the resulting values
of elasticity over the range tested (for all the substrates except for the CY (1:2) and CY (1:4)
(results not shown)). As the smallest standard deviation in of Young’s modulus was observed for
a scan rate of 2 µm/sec, this was selected as the indentation speed for all the AFM measurements
reported henceforth.
4.2 Observation and characterization of fluorescent pro-
tein nano-dots on glass and PDMS substrates
This section will be dedicated to the observation of different types of fluorescent protein patterns
on glass, and after transfer to different PDMS surfaces, using epi-fluorescence microscopy. This
will be followed by quantification and characterization of the pattern transfer in terms of dot
size, contrast and transfer ratio.
4.2.1 Characterization of nano-patterned glass substrates
biotin BSA (bBSA) protein, in its original state or labeled either with Atto 488 or Texas Red
dyes (henceforth called: bBSA, bBSA-Atto and bBSA-TR respectively); fluorescent BSA (BSA-
TR or BSA-FITC) and fluorescent neutravidin (Nav-TR) proteins, were used to pattern glass
121

CHAPTER 4. CHARACTERIZATION AND MECHANISM OF THE TRANSFERPROCESS
substrates as describes in section 3.1. In this section, I report the characterization of fluorescent
bBSA patterns fabricated on glass in terms of width and contrast.
4.2.1.1 Patterning glass with bBSA proteins
Figure 4.6 – Epi-fluorescence images of fluorescent bBSA nano-patterns on glass sub-strates. (a) bBSA-Atto. (b) bBSA-TR. Fluorescent bBSA dots formed an uniform array withhexagonal lattice. Insets display Fourier transforms of the corresponding images to emphasizethe ordering of the lattice.
Fluorescent bBSA patterns were fabricated on glass using the protocol described in section 3.1.
Figure 4.6 shows epi-fluorescence images of bBSA-Atto and bBSA-TR patterns on glass. The flu-
orescent bBSA patterns are shown to form regular arrays with a hexagon lattice. Epi-fluorescence
images are characterized in terms of width and contrast. For that, each image field containing
hundreds of dots, is segmented into appropriately sized windows around each dot and a median
dot is constructed (see section 2.10.1.2). The scatter dot plot represented in figure 4.7, shows the
width and contrast of 10 median dots for each sample. The size of the dots is expressed as the
full width at half maximum of the intensity profile of the median dot. The contrast is defined as
indicated in equation 4.1:Imax − IminImax + Imin
(4.1)
Imax being the peak of the intensity profile for each median dot and Imin the baseline around
each profile (see section 2.10.1.2).
We observe that the width of bBSA-Atto does not vary inside a sample, the best standard
deviation (sd) being for sample 3 (± 12) and the worst for sample 5 (± 35), however a slight
variation is observed between samples with a cumulated standard deviation of ± 56. In the case
of bBSA-TR, we also remark very low variation of the width inside a sample with the lowest
sd being for sample 3 (± 14) and the highest for sample 1 (± 38). A slight variation between
122

CHAPTER 4. CHARACTERIZATION AND MECHANISM OF THE TRANSFERPROCESS
Figure 4.7 – Scatter-dot plots of width (a) and contrast (b) from epi-fluorescenceimages of fluorescent bBSA patterns on glass. At least 10 median dots for each sample,and 6 samples for each case are presented. Bar = median value.
samples is remarked, with cumulated sd = ± 59.
The contrast is seen to be stable inside a sample, for both bBSA-Atto and bBSA-TR, with
the highest sd being of a value of ± 0.077 for sample 6 and ± 0.076 for sample 5; for bBSA-Atto
and bBSA-TR respectively. The cumulated sd being of ± 0.06 for bBSA-Atto and ± 0.15 for
bBSA-TR.
The glass cover-slides patterned with bBSA, were either functionalized with fluorescent neu-
travidin and used as masters for patterning-functionalization of PDMS substrates (see section
4.2.1.2), or served as support for experiments on T-cell adhesion (see section 4.2.1.3).
4.2.1.2 Functionalization of the bBSA patterned glass for transfer
The glass patterned with bBSA were functionalized with 300 µl of 4 µg/ml of fluorescent neu-
travidin (Nav-TR) for 30 minutes, rinsed with PBS, then transfered to the surface of native (see
section 4.2.2.4) or functionalized (see section 4.2.4.2) PDMS. Figure 4.8 shows neutravidin pat-
terns on glass attached either to a bBSA-Atto pattern, or to a pattern of non-fluorescent bBSA
123

CHAPTER 4. CHARACTERIZATION AND MECHANISM OF THE TRANSFERPROCESS
Figure 4.8 – bBSA patterns functionalized with Nav-TR on glass. Dots of bBSA : (a)non fluorescent (cannot be imaged without any fluorophore attached), (b) labeled with Atto 488(bBSA-Atto). Functionalization of the non fluorescent and Atto labeled bBSA dots with Nav-TR(c,d respectively). Insets display Fourier transforms of the corresponding images to emphasizethe ordering of the lattice.
on glass.
124

CHAPTER 4. CHARACTERIZATION AND MECHANISM OF THE TRANSFERPROCESS
4.2.1.3 Functionalization of the bBSA patterned glass for T-cell experiments
The bBSA patterned glass slides were used as support for experiments on T-cell adhesion. For
this, bBSA glass patterns were functionalized with Nav-TR, which in turn were incubated with
anti-CD3. The anti-CD3 is expected to bind strongly and uniformly to the neutravidin, and we
ascertained that, indeed it is patterned similarly to the underlying neutravidin dots (Figure 4.9).
Figure 4.9 – Anti-CD3 dots on glass. Neutravidin dots were functionalized with fluores-cent labeled anti-CD3. The sample were imaged using epi-fluorescence microscopy in the Alexa488 channel for neutravidin (green dots) and the Atto 647 channel for anti-CD3 (red dots).The composite image shows good correspondence between the two channels as indicated by thepreponderance of yellow.
4.2.2 Transfer of protein nano-patterns from glass to native PDMS
surface.
This section will be devoted to the characterization of the transfer of different fluorescent protein
nano-patterns from glass to untreated PDMS surfaces.
4.2.2.1 Transfer of bBSA
bBSA functionalized either with Atto 488 (bBSA-Atto) or with TR (bBSA-TR) patterned on
glass substrates as described in section 3.1, were transferred to the surface of one of two different
PDMS substrates: Q Gel (20 kPa) or Sylgard (2 MPa) using the reverse contact printing proto-
col.
To verify the successful transfer, the nano-patterned surfaces were imaged, then characterized
by epi-fluorescence microscopy. Figure 4.10 shows epi-fluorescence images of the patterns before
and after transfer to PDMS. Visual inspection of the images shows that bBSA-Atto failed to
transfer to Sylgard (Figure 4.10 a,b), however the pattern exists but is so feeble that it can
not be detected without amplification of camera gain settings (Figure 4.11). A good transfer is
observed on Q Gel (Figure 4.10 c,d), the protein pattern was found to be similar to the one on
glass. In the case of bBSA-TR, successful transfer is observed on both Sylgard (Figure 4.10 e,f)
125

CHAPTER 4. CHARACTERIZATION AND MECHANISM OF THE TRANSFERPROCESS
Figure 4.10 – Epi-fluorescence images of nano-patterns of bBSA labeled with TR orAtto 488 on glass or native Sylgard or Q Gel. (a,c) bBSA-Atto on glass before transfer,(b,d) the same transferred to native Sylgard and Q Gel respectively, (e,g) bBSA-TR on glassbefore transfer, (f,h) the same transferred to native Sylgard and Q Gel respectively. Insets displayFourier transforms of the corresponding images to emphasize the ordering of the lattice. Carewas taken to ensure same camera and image display conditions for all images.
Figure 4.11 – Transfer of bBSA-Atto on Sylgard imaged with two different camerasettings. Before and after amplification of the camera gain settings (a, b respectively). Imagereproduced in figure 4.10 b.
and Q Gel (Figure 4.10 g,h).
Insets in figure 4.10, refer to Fast Fourier transforms (FFT) of the pattern images, showing
the ordering of the lattice. We observe that FFT’s of the dots for all glass and PDMS images
exhibit several diffraction orders indicating that spatial ordering is long range.
The dots are characterized locally by quantification of the epi-fluorescence images in terms of
dot size or width and, contrast. As discussed in section 2.10.1, in order to obtain the width
and the contrast, first, a median dot is constructed, to obtain a typical dot for every type of
patterned surface. Then the width of the dot is expressed as the full width at half maximum
126

CHAPTER 4. CHARACTERIZATION AND MECHANISM OF THE TRANSFERPROCESS
Figure 4.12 – Quantification of fluorescent bBSA nano-dots from epi-fluorescenceimages in terms of dot size and contrast before and after the transfer from glass toPDMS. Values are medians and error bars are median absolute deviation, both averaged overat least 3 independent samples, 6 fields for each sample, and hundreds of dots for each field.(A) Dot-size (FWHM of the intensity profile). (B) Contrast of the dots with respect to thebackground.
Glass Sylgard Glass Q GelbBSA-Atto 364 ± 27 353 ± 55 364.7 ± 28 329 ± 82bBSA-TR 396 ± 27 377 ± 13 404.5 ± 26.6 349 ± 27
Table 4.3 – Summary table of bBSA-Atto and bBSA-TR dot size on glass and aftertransfer to native Sylgard or Q gel.
of the intensity profile of the median dot, and the contrast is defined as described in section
4.2.1.1 or equation 4.1. All the values presented in this study represent the average of differ-
ent fields and samples of the median value in each fields. At least, 3 independent samples for
each case, 6 fields for each sample, and hundreds of dots in each field are used for the calculations.
Figure 4.12 A, shows the width of bBSA-Atto dots to be 364 ± 27; 353 ± 55 and 329 ±82 on glass, Sylgard and Q Gel respectively, and in the case of bBSA-TR dots to be, 400 ± 27;
377 ± 13 and 349 ± 27 on glass, Sylgard and Q Gel respectively (Table 4.3). These measurements
imply that for both bBSA-Atto and bBSA-TR the dot size is conserved after transfer, onto both
untreated Sylgard and Q Gel.
Figure 4.12 B, shows the contrast of the dot, which is a measure of the amount of protein in a
dot as compared to outside the dot. The contrast was calculated for the dots on glass and after
127

CHAPTER 4. CHARACTERIZATION AND MECHANISM OF THE TRANSFERPROCESS
Glass Sylgard Glass Q GelbBSA-Atto 0.39 ± 0.04 ≈ 0 0.47 ± 0.11 0.16 ± 0.041bBSA-TR 0.58 ± 0.055 0.49 ± 0.08 0.61 ± 0.07 0.59 ± 0.054
Table 4.4 – Summary table of bBSA-Atto and bBSA-TR dot contrast on glass andafter transfer to native Sylgard or Q Gel.
the transfer to PDMS. We observe a decrease of the contrast for all the cases, implying that the
amount of protein transferred from within the dots is not identical to the transfer outside the
dots. In fact, for bBSA-Atto on Sylgard, the contrast is ≈ 0, which confirms that no transfer
occurs. For transfer to Q Gel a decrease of 65 % is noticed for the contrast after transfer. In the
case of bBSA-TR a decrease of 15% is observed for the contrast after transfer to Sylgard and for
3% after transfer to Q Gel (Table 4.4). This measurements confirm the success of the transfer
in all the cases except for bBSA-Atto on Sylgard, and the best transfer being for bBSA-TR on
Q Gel (Table 4.4).
Another way to characterize the transfer, is the determination of the transfer ratio, which
is calculated as Imax(elastomer)/ Imax(glass); and corresponds to the quantification of the
amount of transfer of protein molecules inside the dots, irrespective of the transfer outside, or
Imin(elastomer)/ Imin(glass); and corresponds to the quantification of the amount of transfer
of protein molecules outside the dots (in the region passivated with pluronic), irrespective of the
transfer inside.
Figure 4.13 shows the transfer ratio of fluorescent bBSA on untreated Sylgard (2 MPa) and
Q Gel (20 kPa), from inside (A) and outside (B) the dots. As we already noticed, no transfer
occurs for bBSA-Atto on Sylgard, instead a transfer ratio of ≈ 0.38 ± 0.03 is observed for bBSA-
Atto on Q Gel. In the case of bBSA-TR transfer occurs on both Sylgard and Q Gel. The best
transfer being for bBSA-TR on Q Gel ≈ 0.6 ± 0.14 (Table 4.5). Table 4.6 shows the amount of
proteins transfered from the region passivated with pluronic.
Sylgard Q GelbBSA-Atto ≈ 0 0.38 ± 0.03bBSA-TR 0.31 ± 0.066 0.6 ± 0.14
Table 4.5 – Summary table of transfer ratio from inside the dots, of bBSA-Atto andbBSA-TR on native PDMS.
Sylgard Q GelbBSA-Atto ≈ 0 0.8 ± 0.018bBSA-TR 0.57 ± 0.033 0.6 ± 0.06
Table 4.6 – Summary table of transfer ratio from outside the dots, of bBSA-Atto andbBSA-TR on native PDMS.
128

CHAPTER 4. CHARACTERIZATION AND MECHANISM OF THE TRANSFERPROCESS
Figure 4.13 – Transfer Ratio of fluorescent bBSA on native PDMS. Transfer ratio insidea dot (A), and outside the dots (pluronic covered zones) (B).
Figure 4.14 – Fluorescence intensity of fluorescent bBSA dots before and after trans-fer from glass to PDMS. Bars represent the peaks of the intensity profile Imax (red andblue bars) and the baseline around each profile Imin (black framed bars). Note that the bBSA-TR patterns on glass (red and blue dashed bars), were fabricated from two different batches ofbBSA-TR which explains the difference in the intensity observed.
Figure 4.14 shows the averaged fluorescence intensity inside the dots, Imax, and outside the
dots, in the region passivated with the pluronic, Imin, before and after transfer from glass to
PDMS. The fluorescence intensity is correlated with the quantity of proteins bound to the sub-
strate. In the ideal case, there should be no proteins adsorbed in the passivated region and even if
there is some protein adsorbed, their should be no transfered to the PDMS, which is not the case.
129

CHAPTER 4. CHARACTERIZATION AND MECHANISM OF THE TRANSFERPROCESS
We observe, for bBSA-Atto, the amount of proteins outside the dots is 0.3 times the amount
inside the dots for the glass substrates, this amount increase to 0.7 on Q gel substrates. This
means that the amount of protein transfered from the outside of the dots was higher than that
transfered from within the dots. When observing bBSA-TR on glass substrates, the amount of
protein outside the dots is 0.2 times that of inside the dots, for Sylgard it is 0.35 and for Q gel
0.22. We can conclude that better patterns are obtained for bBSA-TR, on both glass and PDMS
substrates. In fact, the presence of proteins outside the dots, could be due to unspecific inter-
action coming from the presence of multilayers of beads, instead of mono-layers, formed during
the self-assembled beads mono-layers deposition step. The multilayers will prevent the silane to
deposit on the bare cleaned glass during the second step of silanization. This will influence the
grafting of pluronic and open a route to unspecific deposition of proteins. We can also note that
the amount of protein absorbed and transferred depends strongly on the quality of the pluronic
layer (see section 4.4).
4.2.2.1.1 Functionalization of bBSA-TR PDMS pattern for Cell experiments
Since the best transfer to native PDMS, was observed for bBSA-TR on Q Gel, it was further
functionalized with fluorescent neutravidin and then with anti-CD3 as describe in section 3.2.4,
to be further used for T-Cell experiments. Figure 4.15 shows fluorescent Nav patterned similarly
to the underlying bBSA-TR dots.
Figure 4.15 – Nav-dyelight dots. bBSA-TR dots were functionalized with fluorescent labeledneutravidin. The sample was imaged using epi-fluorescence microscopy in the Alexa 488 chan-nel for bBSA-TR (green dots) and the atto 647 channel for fluorescent neutravidin (red dots).The composite image shows good correspondence between the two channels as indicated by thepreponderance of yellow.
4.2.2.1.2 General characterization of bBSA-TR pattern on Q gel
We also studied, the variation of the width and contrast for bBSA-TR pattern on Q Gel,
inside the same sample and between different samples (Figure 4.16). We observe that the width
varies slightly inside a sample, the highest standard deviation being observed for sample 1 (sd =
± 19.86) and the lowest for sample 6 (sd = ± 9). A negligible width variation between samples
130

CHAPTER 4. CHARACTERIZATION AND MECHANISM OF THE TRANSFERPROCESS
Figure 4.16 – Scatter-dot plots of width (A), and contrast (B) from epi-fluorescenceimages of bBSA-TR patterns on Q Gel. At least 6 median dots for each sample arepresented. Bar = median value.
is noticed (sd = ± 11.5). For the contrast, variations are presented inside a same sample and
also between samples. Sample 3, shows the highest standard deviation being ± 0.07 and the best
sample was sample 6 where sd decrease to ± 0.028. The sd between samples was ± 0.1. This
variation of contrast is related to the quality of the glass master before the transfer. Thus, when
fabricating the glass master, the first step of beads deposition is a very delicate step, where in
some cases during deposition, multi-layers of beads can form instead of mono-layers, and this
can create unspecific binding of proteins outside the holes in some regions of the sample as was
explained in section 4.2.2.1, which are then transferred to the PDMS creating variation in the
contrast.
4.2.2.1.3 Transfer of non fluorescent bBSA
bBSA (not conjugated to any fluorophore), was transfered to native Q Gel and CY PDMS.
Since its presence can not be directly imaged in fluorescence microscopy, due to the absence of
an attached fluorophore, it needs to be revealed by functionalization with fluorescent neutravidin
after the transfer to the PDMS surface (see section 3.2.4). Therefore the characterization of
bBSA in terms of width, contrast and transfer ratio, in this case, is not possible.
131

CHAPTER 4. CHARACTERIZATION AND MECHANISM OF THE TRANSFERPROCESS
Figure 4.17 – Nav-TR pattern on PDMS revealing the quality of the transfer of nonfluorescent bBSA. (a) On CY, (b) on Q gel.
Figure 4.17 shows Nav-TR on CY and Q Gel. bBSA transfered to the surface of CY PDMS
failed, no pattern was observed after functionalization with Nav-TR. On Q Gel, possible transfer
is revealed with the presence of Nav-TR pattern, however the transfer was not reproducible, one
sample out of five tried, shows a pattern on not more than 20% of the sample surface.
4.2.2.2 Transfer of Texas Red labeled neutravidin
Neutravidin Texas Red (Nav-TR) nano-patterns were created on glass substrate, and transfered
to the surface of Q gel with and without adding a drop of water during the transfer step (see
section 3.2.3). Well organized neutravidin patterns were observed on glass (Figure 4.18 a-c) be-
fore the transfer. However, when no water is added during the transfer, Nav-TR showed changes
in shape in 70% of the samples (Figure 4.18 d) after transfer to Q Gel, and the rest 30 % gave
acceptable patterns (Figure 4.18 e). Instead when a drop of water is added, a successful transfer
is observed in all the cases (Figure 4.18 f).
Quantification of the epi-fluorescence images of the neutravidin patterns showing conformational
changes after transfer to Q gel are reported in Figure 4.19. The parameters here are averages
calculated from 6 samples with at least 5 fields each, and hundreds of dots in each field. An
increase in the dot size is noticed, passing from 406 ± 30 on glass to 536 ± 85 on Q Gel
(p<0.001) (Figure 4.19 a). The contrast decreases from 0.55 ± 0.14 on glass to 0.2 ± 0.05
on Q gel (Figure 4.19 b). Finally, the transfer ratio calculate from the fluorescence intensity
(Figure 4.19 c), as Imax(QGel)/Imax(glass), was around 0.24 ± 0.06. The contrast and transfer
ratio measurement prove that the transfer works reasonably. These kind of patterns were also
obtained on Sylgard (2 MPa) and CY (1 kPa) (data not shown). However, Nav patterns on
native PDMS were not further used for cell experiments, because subsequent functionalization
with a biotinylated protein (anti-CD3), after a pluronic blocking step failed. We think, this is
due to the fact that neutravidin was not anymore functional due to drying.
132

CHAPTER 4. CHARACTERIZATION AND MECHANISM OF THE TRANSFERPROCESS
Figure 4.18 – Epi-fluorescence images of Nav-TR pattern on glass (a-c) and the cor-responding pattern on Q Gel (d-f). Insets display Fourier transforms of the correspondingimages to emphasize the ordering of the lattice.
Figure 4.19 – Quantification of the epi-fluorescence images of the Nav-TR patternsobtained on glass and after transfer to Q Gel, in terms of width and contrast.(a) Dot-size (FWHM of the intensity profile). (b) Contrast of the dots with respect to the background.(c) Fluorescence intensity of the Nav-TR dots, represented as the peak of the intensity profileImax (blue framed bars) and the baseline around each profile Imin (black framed bars) on glassand after transfer to PDMS.
133

CHAPTER 4. CHARACTERIZATION AND MECHANISM OF THE TRANSFERPROCESS
4.2.2.3 Effect of adding a water layer between the two surface in contact during
the transfer
Micro-contact printing of protein has been always shown to take place when transferring from a
low free energy hydrophobic surface (usually PDMS), to a high energy hydrophilic surface (usually
a cleaned glass surface) [328]. This was characterized by Tan et al. who found that, transfer
efficacy decreases as the free energy of the surface diminishes, and fails completely on low energy
hydrophobic surfaces [171]. This constituted one of the limitations of the micro-contact printing
technique. Later on, Ricoult and colleagues introduced the humidified micro-contact printing
technique based on adding water in proximity to proteins adsorbed on hydrophilized stamps,
and showed that the printing of proteins on both high (hydrophilic) and low (hydrophobic)
energy surfaces is enabled by the water vapor diffusing through the stamp. To explain that,
they used a molecular simulation of a RGD peptides which was sandwiched between low energy
PDMS and SiO2. They found that in the absence of water, a close interaction takes place between
RGD and both PDMS and SiO2. When water molecules are included, they are trapped between
the peptide and SiO2 and prevent the adhesion of the peptide to the SiO2 [161]. Based on this
findings, we found that working in wet condition during the transfer of the protein patterns from
the glass master to the PDMS is important for the success of this step.
4.2.2.4 Transfer of bBSA functionalized with Texas Red labeled neutravidin
Non fluorescent bBSA patterns on glass, were functionalized with Nav-TR as described in section
4.2.1.2, and transfered to the surface of native Q gel. The pattern was correctly transfered as seen
in the epi-fluorescence images (Figure 4.20). However, further functionalization of the pattern
with a biotinylated protein, failed. We think that during the transfer from glass to the PDMS
substrate, the Nav-TR was physically attached to the PDMS exposing the bBSA to the surface,
which explain the unsuccessful binding of the biotinylated protein.
Figure 4.20 – Epi-fluorescence images of Nav-TR attached to a pattern of non-fluorescent bBSA on glass (a) and the corresponding pattern after transfer to QGel (b). Insets display Fourier transforms of the corresponding images to emphasize the order-ing of the lattice.
134

CHAPTER 4. CHARACTERIZATION AND MECHANISM OF THE TRANSFERPROCESS
4.2.2.5 Transfer of fluorescent BSA
Patterns of BSA (non-biotinylated) conjugated to fluorescein isothiocyanate (called BSA-FITC)
or to Texas Red (called BSA-TR) were fabricated on glass and transferred to the surface of
untreated PDMS. In the case of BSA-FITC, no transfer occurs. In the case of BSA-TR, good
transfer was observed on Sylgard and Q Gel PDMS. The transfer was successful for three different
Sylgard stiffness 30 kPa, 140 kPa and 3 MPa [215], and for 20 kPa Q Gel.
4.2.3 Transfer of protein nano-patterns from glass to plasma treated
PDMS surface
Sylgard (10:1) with an elasticity of 2 MPa and Q Gel (1:2) 20 kPa, were treated with plasma as
described in section 2.3.4. Following the plasma treatment, the elasticity of the PDMS increased,
becoming 7 MPa for the Sylgard and 120 kPa for Q Gel (details in section 4.1.2.2). The plasma
treated PDMS’s will be called p Sylgard and p Q Gel.
Figure 4.21 – Epi-fluorescence images of nano-patterns of bBSA conjugated to TR orAtto 488 on glass and plasma treated Sylgard or Q Gel PDMS. (a,c) bBSA-Atto on glassbefore transfer, (b,d) the same transferred to p Sylgard and p Q Gel respectively. (e,g) bBSA-TRon glass before transfer, (f,h) the same transferred to p Sylgard and p Q Gel respectively. Insetsdisplay Fourier transforms of the corresponding images to emphasize the ordering of the lattice.Care was taken to ensure same camera and image display conditions for all images.
Looking over the epi-fluorescence images (Figure 4.21), we observe that both bBSA-Atto and
bBSA-TR transferred well on p Sylgard and p Q Gel. The dot size and contrast calculated
as described in section 4.2.2.1, are reported in figure 4.22 and tables 4.7, 4.8. The parameters
presented are averages calculated from at least 3 samples, with at least 6 fields each and hundreds
of dots in each fields. We notice a slight increase of the dot size, for both bBSA-Atto and bBSA-
TR after the transfer to the plasma treated PDMS. This increase was shown to be statistically
135

CHAPTER 4. CHARACTERIZATION AND MECHANISM OF THE TRANSFERPROCESS
Figure 4.22 – Quantification of fluorescent bBSA nano-dots from the epi-fluorescenceimages in terms of dot size and contrast before and after the transfer from glassto plasma treated PDMS. Values are medians and error bars are median absolute deviation,both averaged over at least 3 independent samples, 6 fields for each sample, and hundreds ofdots for each field. (A) Dot-size (FWHM of the intensity profile). (B) Contrast of the dots withrespect to the background.
Glass p Sylgard Glass p Q GelbBSA-Atto 380 ± 28 448 ± 29 467 ± 32 526 ± 101bBSA-TR 377 ± 19 465 ± 25 411 ± 28 451 ± 86
Table 4.7 – Summary table of bBSA-Atto and bBSA-TR dot size on glass and aftertransfer to plasma treated Sylgard or Q Gel.
Glass p Sylgard Glass p Q GelbBSA-Atto 0.46 ± 0.05 0.26 ± 0.09 0.46 ± 0.18 0.16 ± 0.06bBSA-TR 0.67 ± 0.06 0.37 ± 0.044 0.44 ± 0.29 0.25 ± 0.024
Table 4.8 – Summary table of bBSA-Atto and bBSA-TR contrast on glass and aftertransfer to plasma treated Sylgard or Q Gel.
p Sylgard p Q GelbBSA-Atto 0.6 ± 0.056 0.46 ± 0.048bBSA-TR 0.36 ± 0.042 0.33 ± 0.044
Table 4.9 – Summary table of transfer ratio inside the dots, of bBSA-Atto and bBSA-TR transferred to plasma treated PDMS.
significant (T-test: p<0.001) (Figure 4.22 A, table 4.7).
The contrast, is systematically diminished upon transfer. The best contrast after transfer is
shown to be for bBSA-TR on p Sylgard (0.37 ± 0.044). Contrast measurements confirm the
136

CHAPTER 4. CHARACTERIZATION AND MECHANISM OF THE TRANSFERPROCESS
Figure 4.23 – Transfer ratio of fluorescent bBSA inside the dots(A), and outside (B)the dots.
p Sylgard p Q GelbBSA-Atto 1 ± 0.035 0.86 ± 0.027bBSA-TR 0.88 ± 0.082 0.62 ± 0.046
Table 4.10 – Summary table of transfer ratio outside (pluronic covered zones) thedots, of bBSA-Atto and bBSA-TR transferred to plasma treated PDMS.
success of the transfer for all the cases (Table 4.8). The transfer ratio was also calculated
as described in section 4.2.2.1. Figure 4.23 shows the transfer ratio of fluorescent bBSA on p
Sylgard and p Q Gel, from inside (A) and outside (B) the dots. The transfer is seen to be better
for bBSA-Atto on p Sylgard and p Q Gel, being respectively 0.6 ± 0.056 and 0.46 ± 0.048, than
for bBSA-TR being 0.36 ± 0.042 on p Sylgard and 0.33 ± 0.044 on p Q Gel (table 4.9). Table
4.10 shows the amount of proteins transferred from the region passivated with pluronic.
Figure 4.24 shows the averaged fluorescence intensity inside the dots (Imax), and outside the
dots, in the region passivated with pluronic (Imin), before and after transfer from glass to the
plasma treated PDMS. As we already discussed in section 4.2.2.1, there should be no proteins
adsorbed in the passivated region and even if there is some, there should be no transferred to
the PDMS, which is not the case.
137

CHAPTER 4. CHARACTERIZATION AND MECHANISM OF THE TRANSFERPROCESS
Figure 4.24 – Fluorescence intensity of fluorescent bBSA dots before and after trans-fer from glass to plasma treated PDMS. Bars represent the peaks of the intensity profile,Imax (yellow and green framed bars), and the baseline around each profile, Imin (black framedbars).
4.2.3.1 Functionalization of bBSA-Atto PDMS pattern for cell experiments
Since the best transfer to plasma treated PDMS, was observed for bBSA-Atto on p Q Gel, it
was further functionalized with fluorescent neutravidin and then with anti-CD3 as describe in
section 3.2.4 to be further used for T-Cell experiments. Figure 4.25 shows successful binding of
Nav on bBSA-Atto.
Figure 4.25 – Nav-dyelight dots. bBSA-Atto dots were functionalized with fluorescent labeledneutravidin. The sample were imaged using epi-fluorescence microscopy in the Alexa 488 channelfor bBSA-Atto (blue dots) and the atto 647 channel for neutravidin (red dots). The compositeimage shows good correspondence between the two channels as indicated by the preponderanceof pink.
4.2.3.2 Transfer of fluorescent BSA
BSA (non- biotinylated) labeled with FITC (BSA-FITC) was transfered to the surface of plasma
treated Q gel. The transfer works properly with a transfer ratio of 0.57 (Figure 4.26).
138

CHAPTER 4. CHARACTERIZATION AND MECHANISM OF THE TRANSFERPROCESS
Figure 4.26 – Epi-fluorescence images of BSA-FITC transfered from glass (a) toplasma treated Q Gel (b). Insets display Fourier transforms.
4.2.4 Transfer of protein nano-patterns from glass to functionalised
PDMS surface
In separate experiments, plasma treated CY and Q Gel PDMS elastomer (p CY and p Q Gel),
were functionalized with APTES and glutaraldhehyde as described in section 3.2.2.1 (henceforth
we will be calling them glu CY and glu Q Gel). Different proteins were transfered to their surface.
4.2.4.1 Transfer of Nav-TR
Nav-TR patterns were allowed to transfer to functionalized PDMS (glu CY and glu Q gel) using
the reverse contact printing protocol. Observation of the epi fluorescence images (Figure 4.27),
show that the Nav-TR nano-dots were readily transfered to the surface of the elastomer.
Figure 4.27 – Epi-fluorescence images of Nav-TR transfered from glass to functional-ized PDMS. (a,b) Images on glass. (c,d) Images on glu CY and glu Q gel respectively. Insetsdisplay Fourier transforms.
139

CHAPTER 4. CHARACTERIZATION AND MECHANISM OF THE TRANSFERPROCESS
Width and contrast were calculated to characterize the pattern (Figure 4.28). Dot size seems to
not change after the transfer (495 ± 58), and the contrast shows a decrease from 0.45 ± 0.1 on
glass to 0.25 ± 0.1 on glu CY. Transfer ratio inside the dots was also measured and calculated
to be 0.39 ± 0.24. After the transfer, glu CY Nav patterned was homogeneously functionalized
with anti-CD3 for further use for T-Cell spreading experiments (Figure 4.29).
Figure 4.28 – Quantification of Nav-TR nano-dots from epi-fluorescence images interms of dot size and contrast before and after the transfer from glass to glu CY.Values are medians and error bars are median absolute deviation, both averaged over 5 indepen-dent samples, each with at least 5 fields containing hundreds of dots. (a) Dot-size (FWHM ofthe intensity profile). (b) Contrast of the Nav-TR nano-dots on glass and glu CY with respectto the background.
Figure 4.29 – Anti-CD3 on Glu CY. Neutravidin dots were functionalized homogeneouslywith fluorescent labeled anti-CD3. The samples were imaged using epi-fluorescence microscopyin the Alexa 488 channel for neutravidin (green dots), and the atto 647 channel for anti-CD3(red). The co-localization is not satisfactory.
4.2.4.2 Transfer of other proteins
4.2.4.2.1 Transfer of bBSA
Non fluorescent bBSA patterns on glass were transfered to the surface of glu CY and glu Q
140

CHAPTER 4. CHARACTERIZATION AND MECHANISM OF THE TRANSFERPROCESS
Gel. A very low and unreliable transfer was observed after revealing the pattern by function-
alization with Nav-TR (Figure 4.30). However, when patterns of bBSA are functionalized with
Nav-TR on glass and then transfered to the surface of functionalized PDMS, the transfer worked
easily (Figure 4.31). We think that during the transfer, the Nav-TR was physically attached to
the PDMS exposing the bBSA to the surface.
Figure 4.30 – Epi-fluorescence images of Nav-TR pattern on glu CY revealing thelow quality transfer of non-fluorescent bBSA.
Figure 4.31 – Epi-fluorescence images of Nav-TR pattern revealing the quality ofbBSA pattern on glass (a,b) and after transfer of the ensemble to the surface offunctionalized PDMS, glu CY and glu Q Gel(c,d respectively).
141

CHAPTER 4. CHARACTERIZATION AND MECHANISM OF THE TRANSFERPROCESS
4.2.4.2.2 Transfer of BSA-FITC
BSA-FITC failed to transfer to any of the glu functionalized PDMS.
4.3 Transfer on hard and soft Sylgard
Next, we tested the technique of reverse transfer on softer PDMS and explore the influence of
stiffness on the quality of transfer.
Figure 4.32 – Comparison of the transfer on hard Sylgard (2 MPa) and soft Sylgard(5 kPa). (a,b) Epi-fluorescence images of bBSA-TR on Sylgard 2 MPa and 5kPa respectively.care was taken to ensure same camera and image display conditions for all images. (c) Dot size(FWHM of the intensity profile). (d) Contrast of the bBSA-TR on glass and PDMS with respectto the background. (e) Transfer ratio of bBSA-TR on Sylgard 2 MPa and 5 kPa.
Figure 4.32 shows successful transfer of bBSA-TR on both 2 MPa and 5 kPa Sylgard. No
variation in the dot size was observed before and after the transfer. The contrast shows a
decrease when transfer to 2 MPa Sylgard and an increase when transfer to soft Sylgard, which
means that in the case of the soft Sylgard, the amount of protein transferred from outside of the
dots was negligible to that transfered from within the dots. Better transfer ratio was obtained
for soft Sylgard (0.52 ± 0.07) when comparing with the hard one (0.31 ± 0.066).
142
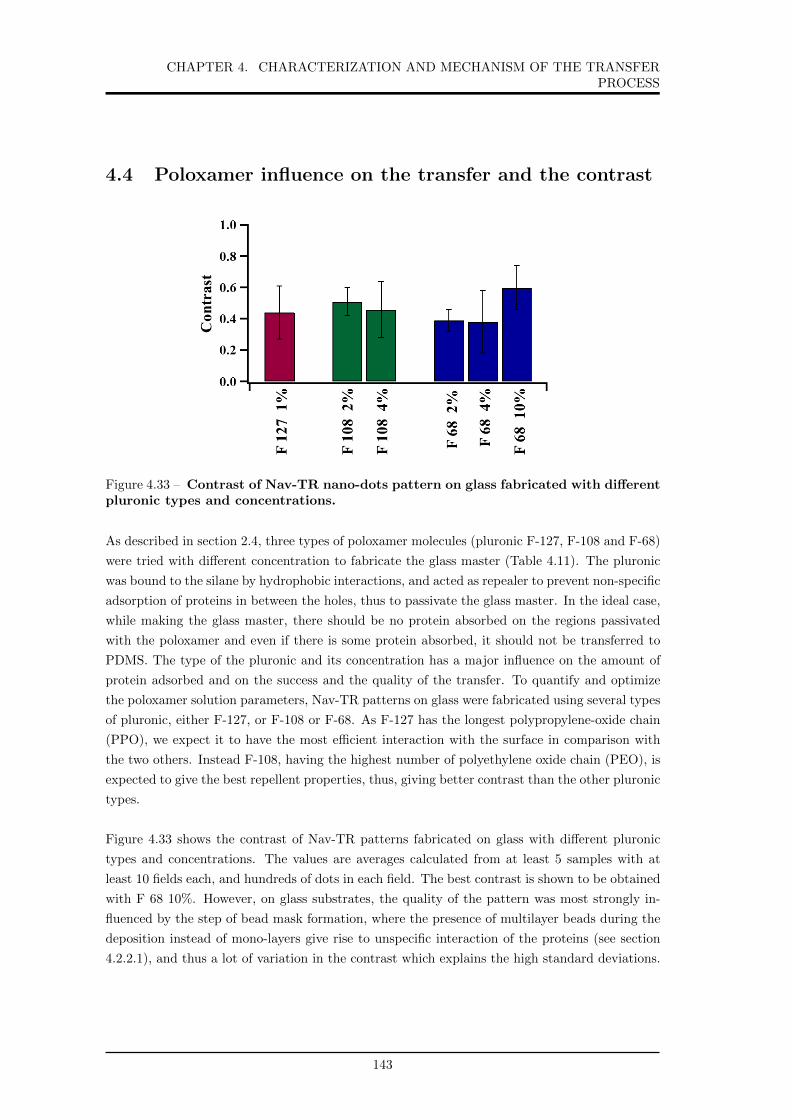
CHAPTER 4. CHARACTERIZATION AND MECHANISM OF THE TRANSFERPROCESS
4.4 Poloxamer influence on the transfer and the contrast
Figure 4.33 – Contrast of Nav-TR nano-dots pattern on glass fabricated with differentpluronic types and concentrations.
As described in section 2.4, three types of poloxamer molecules (pluronic F-127, F-108 and F-68)
were tried with different concentration to fabricate the glass master (Table 4.11). The pluronic
was bound to the silane by hydrophobic interactions, and acted as repealer to prevent non-specific
adsorption of proteins in between the holes, thus to passivate the glass master. In the ideal case,
while making the glass master, there should be no protein absorbed on the regions passivated
with the poloxamer and even if there is some protein absorbed, it should not be transferred to
PDMS. The type of the pluronic and its concentration has a major influence on the amount of
protein adsorbed and on the success and the quality of the transfer. To quantify and optimize
the poloxamer solution parameters, Nav-TR patterns on glass were fabricated using several types
of pluronic, either F-127, or F-108 or F-68. As F-127 has the longest polypropylene-oxide chain
(PPO), we expect it to have the most efficient interaction with the surface in comparison with
the two others. Instead F-108, having the highest number of polyethylene oxide chain (PEO), is
expected to give the best repellent properties, thus, giving better contrast than the other pluronic
types.
Figure 4.33 shows the contrast of Nav-TR patterns fabricated on glass with different pluronic
types and concentrations. The values are averages calculated from at least 5 samples with at
least 10 fields each, and hundreds of dots in each field. The best contrast is shown to be obtained
with F 68 10%. However, on glass substrates, the quality of the pattern was most strongly in-
fluenced by the step of bead mask formation, where the presence of multilayer beads during the
deposition instead of mono-layers give rise to unspecific interaction of the proteins (see section
4.2.2.1), and thus a lot of variation in the contrast which explains the high standard deviations.
143

CHAPTER 4. CHARACTERIZATION AND MECHANISM OF THE TRANSFERPROCESS
Polymer PEO (x) PPO (y) Concentration (in ultra-pure water)F-68 75-85 25-40 2%,4%,6%,10%F-108 137-146 42-47 2%,4%F-127 95-105 54-67 1%
Table 4.11 – Different types of poloxamer and their concentrations, used in thisproject. X is the number of PEO monomers and y is the number of PPO monomers.
To study the influence of the pluronic type on the transfer, the Nav patterns fabricated on glass,
were transfered to the surface of native or glu Q Gel. Figure 4.34, shows that when using the
F-127 1% or F-108 2%, 4% and 6%, for the fabrication of the glass master, no or very low transfer
was observed on native Q Gel, we think, this is due to the length of the PEO chain that was
higher than that of the protein on the glass master, which prevented the possibility of the protein
to interact with the PDMS surface. In the case of F 68 2%, 6% and 10%, the transfer is seen to
be achieved easily, but the contrast was dependent on the concentration of the pluronic, better
contrast is obtained when increasing the concentration. When transfer to glu Q gel, the type of
pluronic did not affect the transfer. Protein patterns where obtained on the PDMS, both when
using the F-127 and F-68. This can be due to the presence of the glutaraldhehyde on the Q
gel surface, that create a very attractive surface to the proteins. Finally, the pluronic F-68 with
a concentration of 10 % was chosen to be used for the fabrication of the pattern on the glass
master.
Figure 4.34 – Epi-fluorescence images of neutravidin transfered to native or glu Q Gelafter a glass master fabricated with different pluronic type and/or concentrations.Finally, the pluronic F-68 with a concentration of 10 % was chosen to be used for the fabricationof the pattern on the glass master. Insets display Fourier transforms of the corresponding images.Care was taken to ensure same camera and image display conditions for all images.
144

CHAPTER 4. CHARACTERIZATION AND MECHANISM OF THE TRANSFERPROCESS
4.5 Understanding the transfer process
In order to understand the molecular factors governing the transfer process, we quantified the
effective force of adhesion of the protein to glass and elastomer using atomic force microscopy.
We used an AFM cantilever with a 6 µm spherical tip attached to its end. The proteins, either
bBSA-Atto or bBSA-TR were covalently bound to the AFM tip. The protein covered tip was
approached to touch a test surface which was either bare clean glass, or bare elastomer (native
Sylgard or p Sylgard), or glass coated with the same protein (for protein-protein cohesion force-
measurements), then force-distance curves were recorded. Since we are interested in the protein
adhesion to different surfaces, we focused on the pull-off force curve of each force measurement
(for more details about the measurements see section 2.8.6). All measurements were conducted
in water, at room temperature.
4.5.1 Effect of tip functionalization on tip/substrate interaction
Fluorescent bBSA was covalently linked to the AFM tip using a procedure involving glutarald-
hehyde as a cross-linking agent (see section 2.8.6.1). Figure 4.35 a, summarizes the tip func-
tionalization procedure steps. Prior to start measuring the interaction between the protein and
the substrates, force measurements were performed after each functionalization step of the AFM
tip to asses the involvement of the introduced functional groups on the interaction between the
tip and the substrate surface. First, hydroxyl groups (-OH) following the plasma treatment of
the tip, second NH+3 coming from the amino-silanization step with APTES , finally carbonyl
groups C=O for the glutaraldhehyde treated tip. Plasma treated silicon oxide (SiO) tip, shows
large adhesion with the cleaned bare glass (Figure 4.35 b), this can be due to hydrogen bonding
between oxygen atoms on the SiO tip and hydroxyl groups on the bare cleaned glass surface.
The APTES treated tip, terminated with protonated NH+3 group at neutral pH, shows attraction
during approach, followed by tip-surface adhesion when retraction of the tip from the surface
(Figure 4.35 c). The observed attraction can be explained by the electrostatic interaction between
the positively charged tip and the negatively charged surface. The glutaraldhehyde treated tip,
bearing carbonyl groups shows small adhesion with the hydrophilic glass surface (Figure 4.35
d). Finally, the bBSA-TR functionalized tip shows at the retraction curve multiple adhesion
peaks (Figure 4.35 e). These initial force measurements were important, to confirm the protein
interaction with the substrate surface, which will be discussed in more details below. The same
measurements were also conducted on native Sylgard (Figure 4.35 g). The curves show that
Sylgard have very strong non specific interactions with the AFM tip, which makes these mea-
surements not amenable to interpretation.
At least two samples were tested for every step, and 100 curves were recorded at different position
for each sample at two distinct regions and under the same conditions. The force curves (b-e) in
figure 4.35, shows one typical curve for the ensemble of the force curves acquired, and the curves
in (f) and (g) shows the superposition of 100 curves recorded on a region of a typical sample.
145

CHAPTER 4. CHARACTERIZATION AND MECHANISM OF THE TRANSFERPROCESS
Figure 4.35 – AFM measurement conducted on glass and Sylgard after each AFM tip-functionalization step. (a) Schematic of procedure for protein functionalization of the AFMtip. (b-e) Force-curves conducted on bare cleaned glass at plasma treatment of the tip (step 1,red curve), amino-silanization with APTES (step 2, blue curve), glutaraldhehyde treatment (step3, green curve), and final coupling of the protein, here bBSA-TR (step 4, yellow curves). (f)Overlay of 100 force-distance curves conducted on glass at step 1-3 of the tip-functionalisation.(g) Overlay of 100 force-distance curves conducted on native Sylgard after amino-silanization withAPTES (dark blue curve), glutaraldhehyde treatment (dark green curve) and protein coupling(dark yellow curve).
4.5.2 Pull-off force measurements of fluorescent bBSA on different sur-
faces
Depending on the interaction strength between the protein multilayers (called Fprt−prt), glass-
protein layer (called Fg−prt) and PDMS-protein layer (called FPDMS−prt) (figure 4.36), the
transfer will or not occurs. Three different cases are possible:
1- If the glass-protein layer interaction (Fg−prt) is larger than PDMS-protein layer interaction
(FPDMS−prt), the proteins will stay on the glass substrate.
2- If the glass-protein layer interaction (Fg−prt) is smaller than PDMS-protein layer interaction
(FPDMS−prt), and the cohesion proteins-proteins (Fprt−prt) is larger than the glass-protein layer
interaction (Fg−prt) interaction, the proteins will transfer by peeling from the glass substrate.
3- If the glass-protein layer interaction (Fg−prt) is smaller than PDMS-protein layer interaction
146

CHAPTER 4. CHARACTERIZATION AND MECHANISM OF THE TRANSFERPROCESS
Figure 4.36 – Schematic representation of the reverse contact printing process.
(FPDMS−prt), and the cohesion proteins-protein (Fprt−prt) is smaller than the glass-protein layer
interaction (Fg−prt), just the top layers of the protein on the glass substrate will transfer to the
PDMS surface.
In the following, force-curves were obtained in water, to quantify the cohesion force between
layers of fluorescent bBSA and the interaction between glass-proteins layer (Fg−prt) and PDMS-
proteins layer (FPDMS−prt).
4.5.2.1 Protein-Protein interactions
AFM was used to measure the adhesion force between layer of fluorescent bBSA (either bBSA-
Atto or bBSA-TR) immobilized on the AFM tip and fluorescent bBSA adsorbed on a glass
surface. During AFM force measurements, the protein-coated cantilever is approached toward
and then, after contact, retracted away from the substrate. The approach portion of the force
curve gives informations about the attraction or the affinity that has the protein for the surface,
the retraction portion represents, the pull-off force required to separate layers of proteins after
contact.
Figure 4.37 shows representative curves of the force (nN) versus the relative distance of sep-
aration (nm) during the approach and retract of the fluorescent bBSA tip to the fluorescent
bBSA coated surface. We observe, no attractive or repulsive interactions during the approach
for both bBSA-Atto and bBSA-TR (Figure 4.37). The retraction curves corresponding to the
pull-off forces seen in the figure, shows the breaking of the binding interaction between several
proteins layers. After analysis of numerous force curves, the magnitude of the pull-off force for
bBSA-Atto layers is found to be 9.5 ± 5 nN and for bBSA-TR, 4.6 ± 2.8 nN. Thus the force
required to separate layers of bBSA-Atto is higher that that required to separate bBSA-TR lay-
ers. The dissipation energy, determined as the area between the approach and retract curves
calculated to be 11 ± 8 10−16 N.m for bBSA-Atto and 8.6 ± 7 10−16 N.m for bBSA-TR.
147

CHAPTER 4. CHARACTERIZATION AND MECHANISM OF THE TRANSFERPROCESS
Figure 4.37 – Representative force-curves of the interactions between fluorescentbBSA tip and fluorescent bBSA adsorbed on glass surface. (a) bBSA-Atto. (b) bBSA-TR.
4.5.2.2 Protein-Substrate interactions
AFM force measurements, between the fluorescent bBSA coated tip and different substrates were
carried out. During the measurements, the fluorescent bBSA functionalized tip, is brought re-
peatedly into contact with the substrate to initiate binding and the fluorescent bBSA/surface
adhesion forces acting on the tip are detected as the tip is withdrawn from the substrate surface.
Before each touch-down, the tip is displaced laterally by 2 µm. Typically, the initial 10 to 20
curves were non-reproducible and we interpret this as steps where protein layers were repeatedly
transferred from the tip to the surface. Indeed, post experiment inspection of the surface with
optical fluorescence microscopy clearly shows foot-print of the tip with diminishing fluorescence
intensity. After these initial steps, the curves become highly reproducible and no more protein
foot-prints are detectable on the surface. These curves are recorded for analysis. Overlay of
100 curves of force (nN) versus the relative distance of separation (nm) for fluorescent bBSA
interacting with native Sylgard (Figure 4.38), bare cleaned glass (Figure 4.39 a,b) and plasma
treated Sylgard (Figure 4.39 c,d) are shown.
Native Sylgard turned out to have a very strong non-specific adhesion with the tip function-
alized either with bBSA-Atto or bBSA-TR (Figure 4.38), probably, this is due to van der Wall’s
interactions. These measurements were not amenable to interpretation.
In the case where the tip is functionalized with bBSA-Atto, interacts with a bare glass surface
(Figure 4.39 a). On the approach curve, a repulsion is detectable, probably due to the negative
charge on both the molecule and the bare glass. First, a soft contact is detectable before the
hard contact with glass (slope vertical) is discerned. This is possibly due to formation of protein
multilayers on the tip, which nevertheless are not shed on contact as verified with the procedure
above. The adhesion force is determined from the retraction curve. When the tip is function-
alized with bBSA-TR and interacts with a bare glass surface (Figure 4.39 b). On the approach
curve, an attractive interaction is present and on contact, as expected for a monolayer of protein,
148

CHAPTER 4. CHARACTERIZATION AND MECHANISM OF THE TRANSFERPROCESS
a slope corresponding to a hard surface is seen. As before, the adhesion force is determined from
the retraction curve. For a tip is functionalized with bBSA-Atto in contact with pPD surface
(Figure 4.39 c). Features are present on both the approach and the retraction curves, which
we interpret as corresponding to collective adhesion/de-adhesion of a protein-covered region on
the tip (which is a bead and therefore presents a large surface). As before, the adhesion force
is determined from the entire retraction curve, ignoring the fine features. Adhesion is strong.
Finally, when the tip is functionalized with bBSA-TR is in contact with pPD surface. Unlike
the previous case, fine features are absent and the adhesion is weak, as determined form the
retraction curve.
The adhesion forces calculated for bBSA-Atto and bBSA-TR with bare cleaned glass surface
and plasma treated Sylgard are summarized in table 4.12. The largest pull-off force and hence
strength of adhesion was observed between bBSA-Atto and p Sylgard (12.8 ± 1.7 nN), while less
adhesion was observed between bBSA-TR and p Sylgard (5.1 ± 0.6 nN). Instead, bBSA-Atto
and bBSA-TR show similar adhesion on bare cleaned glass ( 2.3 ± 0.8 nN and 2.7 ± 0.8 nN
respectively). Dissipation energies were calculated as the area between the retract and advance
curves. The values are shown in table 4.13.
Figure 4.38 – Force curves of the interaction between fluorescent bBSA and nativeSylgard. (a) bBSA-Atto. (b) bBSA-TR.
Fprt−prt (nN) Fg−prt (nN) FpSylgard−prt (nN)bBSA-Atto 9.5 ± 5 2.3 ± 0.8 12.8±1.7bBSA-TR 4.6 ± 2.8 2.7±0.8 5.1±0.6
Table 4.12 – Adhesion force measurements. Each value is an average of 100 force curvesatdifferent location for each sample, at three distinct regions and for at least three different samples.Errors are standard deviations.
149

CHAPTER 4. CHARACTERIZATION AND MECHANISM OF THE TRANSFERPROCESS
Figure 4.39 – Force curves of the interaction between fluorescent bBSA and barecleaned glass or p Sylgard. bBSA-Atto and bBSA-TR adhesion to : bare clean glass (a,brespectively), plasma treated Sylgard (c,d respectively). Red lines are overlay of 100 force curves,each at a different spot on the surface, and the blue lines are the median force curves.
Eprt−prt Eg−prt EpSylgard−prtbBSA-Atto 11±8 0.35 ± 0.13 1.85±0.26bBSA-TR 8.6 ±7 0.78±0.44 1.3±0.13
Table 4.13 – Dissipation energy measurements. Each value is an average of 100 force curvesat different location for each sample, at three distinct regions and for at least three differentsamples. Errors are standard deviations. The value are in N.m 10−16.
150

CHAPTER 4. CHARACTERIZATION AND MECHANISM OF THE TRANSFERPROCESS
Pro
tein
PD
MS
surf
ace
(Ela
stic
ity)
Wid
th(n
m)
Contr
ast
Tr
rati
oin
sid
eT
rra
tio
ou
tsid
eG
lass
PD
MS
Gla
ssP
DM
Sb
BS
A-A
tto
Sylg
ard
(2M
Pa)
364±
27
353±
55
0.3
9±
0.0
4≈
0≈
0≈
0b
BS
A-A
tto
QG
el(2
0kP
a)36
5±
28
329±
82
0.4
7±
0.1
10.1
6±
0.0
41
0.3
8±
0.0
30.8±
0.0
18
bB
SA
-TR
Sylg
ard
(2M
Pa)
396±
7377±
13
0.5
8±
0.0
55
0.4
9±
0.0
80.3
1±
0.0
66
0.5
7±
0.0
33
bB
SA
-TR
Sylg
ard
(5kP
a)47
2±
61
486±
100
0.3
5±
0.0
70.5±
0.1
60.5
2±
0.0
7b
BS
A-T
RQ
Gel
(20
kP
a)40
4.5±
26.6
349±
27
0.6
1±
0.0
70.5
9±
0.0
54
0.6±
0.1
40.6±
0.0
6b
BS
A-A
tto
pS
ylg
ard
(7M
Pa)
380.
44±
27.6
447.7±
29
0.4
6±
0.0
50.2
6±
0.0
90.6±
0.0
56
1b
BS
A-A
tto
pQ
Gel
(120
kP
a)46
7±
32
526±
101
0.4
6±
0.1
80.1
6±
0.0
60.4
6±
0.0
48
0.8
6±
0.0
27
bB
SA
-TR
pS
ylg
ard
(7M
Pa)
377.
14±
19
465.3
4±
25
0.6
7±
0.0
60.3
7±
0.0
44
0.3
6±
0.0
42
0.8
8±
0.0
82
bB
SA
-TR
pQ
Gel
(120
kP
a)41
0.8±
28
451±
86
0.4
4±
0.2
90.2
5±
0.0
24
0.3
3±
0.0
44
0.6
2±
0.0
46
Nav
-TR
QG
el(2
0kP
a)40
6±
30
536±
85
0.5
5±
0.1
40.2±
0.0
50.2
4±
0.0
6N
av-T
Rgl
uQ
Gel
482±
33
495±
58
0.4
5±
0.1
0.2
5±
0.1
0.3
9±
0.2
4
Tab
le4.
14–
Su
mm
ary
tab
leof
tran
sfer
rati
o(T
rra
tio),
wid
than
dcontr
ast
of
diff
ere
nt
pro
tein
str
an
sferr
ed
from
gla
ssto
dif
-fe
rent
PD
MS
surf
aces.
Flu
ores
cent
bB
SA
tran
sfer
edto
nati
veP
DM
S(r
edro
ws)
,an
dto
pla
sma
trea
ted
PD
MS
(blu
ero
ws)
.N
av-T
Rtr
an
sfer
(gre
enro
ws)
.T
rra
tio
insi
de:
tran
sfer
rati
oof
pro
tein
sfr
om
the
insi
de
of
the
dot.
Tr
rati
oou
tsid
e:tr
an
sfer
rati
oof
pro
tein
sfr
om
the
regio
ns
pas
siva
ted
wit
hp
luro
nic
.p
Sylg
ard
:p
lasm
atr
eate
dsy
lgard
,p
Qgel
:pla
sma
trea
ted
QG
el(s
eese
ctio
n2.3
.4).
QG
el+
pla
sma+
AP
TE
S+
Glu
:Q
Gel
chem
ical
lytr
eate
das
des
crib
edin
sect
ion
3.2.
2.1.
151

CHAPTER 4. CHARACTERIZATION AND MECHANISM OF THE TRANSFERPROCESS
4.6 Mecanism of Transfer
The reverse contact printing technique developed in this study is characterized by direct printing
of proteins from glass to a PDMS based polymer surface. To establish the technique, we char-
acterized the transfer in terms of width, contrast and transfer ratio based on epi-fluorescence
images of the protein patterns before and after the transfer (Table 4.14). We selected bBSA
protein coupled to two different fluorophore either Atto 488 or Texas Red as a model for a
detailed evaluation of the printed structures. We also demonstrated the versatility of our tech-
nique by printing different types of protein onto different PDMS surfaces and elasticity. Since
understanding the transfer mechanism is essential to further develop the technique, we show
that the success of reverse contact crucially depends on molecular parameters. The transfer can
be strongly influenced by chemical modification of the core protein and/or the PDMS surface,
and can be predicted from measuring the forces of adhesion and cohesion using atomic force
microscopy. We show that the degree of hydrophobicity as well as the presence of ionic groups
on both the PDMS and the protein are important molecular factors that govern the transfer.
AFM force measurements are done to understand the molecular factors that determine the
transfer ratio. They provide information about the protein adhesion to different substrates
and specifically, can give quantitative information on the magnitude of the adhesion forces. The
adhesion force between the protein and the substrate surface is measured from the pull-off force
of the retract curve, and is determined as the force required to mechanically detach the ad-
hered protein from the surface. This measurements were difficult to be conducted on native Q
gel PDMS, probably due to its extreme softness, and they show very strong non specific adhe-
sion when interacting with native Sylgard (see section 4.5.2.2). These measurements were not
amenable to explanation. However, force-curves could be consistently measured and interpreted
for p Sylgard and bare cleaned glass.
Figure 4.39 shows the comparison of adhesion forces obtained for fluorescent bBSA tip interacting
with a bare cleaned glass and fluorescent bBSA tip interacting with plasma treated Sylgard. A
clear separation between the data of this two groups is observed. During the measurements, we
used the same source of the AFM cantilever and the fluorescent bBSA, which indicates that the
differences observed in the measured adhesion forces for this two groups, is due to the interaction
between the proteins and the different surfaces, not to the interaction between the AFM tip and
the proteins.
As seen in Table 4.12, we notice for both bBSA-Atto and bBSA-TR, the force required to
separate a protein layer from glass (Fg−prt) is less than that required to pull apart two layers of
protein (Fprt−prt). The dissipation energy goes into the same direction (Table 4.13). Therefore
the protein multi-layers present on the dots on the glass master are transferred to the elastomer
probably by peeling from glass instead of only the top most layer peeling off.
Comparing the adhesion forces of bBSA-TR and bBSA-Atto, we see that the latter has a stronger
152

CHAPTER 4. CHARACTERIZATION AND MECHANISM OF THE TRANSFERPROCESS
interaction with p Sylgard; 12.8 ± 1.7 nN versus 5.1 ± 0.6 for bBSA-TR (Table 4.12). This is
consistent with the higher transfer ratio being 0.6 ± 0.056 for bBSA-Atto, and 0.36 ± 0.042 for
bBSA-TR (Table 4.14). From the molecular structure of Atto and TR (Figure 4.40), we expect
TR to be more hydrophobic than Atto, the latter having a net negative charge and an isolated
primary amine group that is prone to losing an anion. Therefore, the difference in the inter-
action of the two species with p Sylgard may be attributed to hydrophobic/hydrophilic forces.
We can also notice when looking on the force measurement curves in Figure 4.39, an attraction
of bBSA-Atto to the surface of p Sylgard in the approach curve, versus a slight repulsion from
the surface for bBSA-TR (Figure 4.39 c,d respectively). This means that bBSA-Atto has more
propensity to the p Sylgard than bBSA-TR.
Similar reasoning can be perused for all the transfer process reported in section 4.2. Table
4.15, represents a summary of section 4.2 describing the success or failing of the transfer of pro-
teins to the different PDMS substrates.
Figure 4.40 – Chemical formula of Atto 488 and Texas red dyes. Adapted from [278][280].
Q Gel p Q Gel glu Q Gel Sylgard p Sylgard CY glu CYbBSA-TR ok ok NA ok ok NA NAbBSA-Atto ok ok NA X ok NA NAbBSA ok (very low) NA X NA NA X XBSA-FITC X ok X X NA X XNav-TR ok NA ok ok NA ok okBSA-TR ok NA NA ok [215] NA NA NA
Table 4.15 – Protein Pattern Transfer from glass to different PDMS surfaces. Xindicates that no transfer occurs, NA indicates data not available and ok refer to success of thetransfer.
As can be expected, lack of strong adhesion between the hydrophillic bBSA-Atto and the hy-
drophobic Sylgard is observed, which means that hydrophobic interaction does not play a major
role in bBSA-Atto interactions. The transfer to Sylgard is so feeble and can not be detected with
the standard camera settings, it can be detected with higher camera amplification (Figure 4.11) .
Furthermore, Sylgard is known to be slightly negatively charged in aqueous solution at neutral pH
153

CHAPTER 4. CHARACTERIZATION AND MECHANISM OF THE TRANSFERPROCESS
[329], resulting in a additional electrostatic repulsion towards the negatively charged bBSA-Atto.
When in contact with Q Gel surface, bBSA-Atto does transfer to some extent (Transfer ra-
tio = 0.38 ± 0.03). In fact, Q Gel is more hydrophobic than Sylgard as judged by contact angle
measurements (116 ± 4; 104 ± 4 for Q Gel and Sylgard respectively) and has phenyl groups
in its chain which are not present for Sylgard. Thus, We can explain the success of transfer
of bBSA-Atto to native Q Gel by noting that bBSA-Atto has many aromatic groups that may
chemically interact with the phenyl groups on Q gel forming a π − π interaction.
When looking on the transfer of bBSA-TR, we see that it transfers well on both hydropho-
bic native Sylgard and Q Gel, with transfer being better on the latter, Transfer ratio = 0.31
± 0.067, 0.6 ± 0.14 on Sylgard and Q Gel respectively (Table 4.14). Hydrophobic interaction
plays a central role in the transfer of bBSA-TR to Sylgard and Q Gel. Moreover, texas red dye
holds more aromatic group than Atto (Figure 4.40), which explains its stronger interaction with
Q gel. This is proved by the higher transfer ratio of bBSA-TR with Q Gel (0.6 ± 0.14) than that
of bBSA-Atto (0.38 ± 0.03). Consistent with this, BSA (non biotinylated) conjugated to FITC
dye (BSA-FITC) supposed to be hydrophilic, shows a good transfer to p Sylgard with a transfer
ratio of 0.58, and fails to transfer to native Sylgard. BSA (non-biotinylated) conjugated to texas
red dye (BSA-TR) shows successful transfer to native Sylgard.
The transfer of bBSA not conjugated to any fluorophore, can not be directly tested due to
the absence of fluorophore (section 4.2.2.1), thus the transfer ratio of bBSA can not be reported.
Its presence was revealed by functionalization with fluorescent neutravidin to asses the quality
of the pattern. The experiments show that bBSA failed to transfer to CY, and have a very
unreliable transfer to Q Gel. We can conclude that bBSA probably expose its hydrophilic groups
when adsorbed to glass.
To confirm the general hypothesis that the inclusion of the texas red dye renders the protein
more amenable to transfer on hydrophobic untreated elastomers, we checked that Nav-TR trans-
ferred well on all the elastomers studied here (Table 4.15). However, probably due to drying, the
transferred neutravidin was not functional and failed to bind to a biotinylated protein.
In a related set of experiments we functionalized the plasma treated elastomer surface (p CY
and p Q gel) with APTES ((3-Aminopropyl)triethoxysilane) and glutaraldehyde, which is known
to render the surface hydrophobic and support strong and stable covalent linkage of the protein
[318] [319][39]. The hydrophobic Nav-TR, transfered well on this type of surface, but hydrophilic
bBSA and BSA-FITC showed a very low transfer, demonstrating that even when covalent bonds
are eventually formed, the initial transfer is governed by physico-chemical affinity.
154
Chapter 5
Cells on homogeneous and
patterned PDMS
155

CHAPTER 5. CELLS ON HOMOGENEOUS AND PATTERNED PDMS
This chapter deals with the response of T-cells to soft substrates. In section 1.1.5, the response of
cells to soft substrates is discussed. Cells like fibroblasts, epithelial cells or myocytes adhere and
spread more on harder than on softer substrates [66][28][330][331]. For T-cells however, there are
very few studies and the evidence is contradictory. Using naive mouse T-cells on polyacrylamide
(PAA) gels with elasticity ranging from 10 kPa to 200 kPa, shows that cells are more activated
on stiffer substrates [126]. However experiments using the human cell line Jurkat on silicone
rubber (PDMS) with stiffness ranging from 100 kPa to 5000 kPa, show the opposite trend [127].
In terms of force application, Bashour et al. show that forces of about 100 pN can be exerted
through the TCR complex [128], and preliminary evidence suggested that on PAA at least, more
force is exerted on harder substrates [129]. In all these experiments, the adhesion was fully
or partly mediated by the TCR complex. Recently, it was shown that indeed the anti-CD3
domain of the TCR complex mediates mechano-sensing in T-cells [332] [333] [334]. Here, we
shall first explore the interaction of Jurkat cells with PDMS of different stiffness and covered
with anti-CD31. Next, we shall choose one elasticity and explore the behavior of Jurkat T-cells
on patterned PDMS .
5.1 T-Cell on homogeneously functionalized PDMS sub-
strates
In this section, we describe the adhesion of T-cells to homogeneously functionalized PDMS.
PDMS was chosen as substrate of interest based on the ability to readily modulate its elastic
modulus. Several types of PDMS were used to achieve the experiments, which together cover
the elastic modulus range from 1 kPa to 40 MPa. Table 5.1 summarizes all the PDMS used for
these experiments and their relative elastic Modulus.
PDMS Type Base:current agent; Ratio Elasticity (kPa)1:1 3 ± 1
CY 1:2 300 ± 1501:4 40000 ± 800010:1 2440 ± 500
Sylgard 35:1 130 ± 9 [71]58:1 5 [335]
Q Gel 1:2 20 ± 31:1.1 3.7 [264]
Table 5.1 – Summary table of PDMS used for cell studies and their relative elasticity.The PDMS elasticity were either calculated from AFM force measurements (section 2.8.5), ortaken from references indicated between bracket.
The different PDMS substrates were prepared as described in section 2.3.2, and biotinylated
anti-CD3 was adsorbed to the surface of the PDMS after functionalization steps with bBSA
and Nav (see section 2.6). This provides a system for activation of T-cells on substrates with
1This part of the work was done in close collaboration with Astrid Wahl.
156
CHAPTER 5. CELLS ON HOMOGENEOUS AND PATTERNED PDMS
varying elastic modulus. Cell adhesion area, actin organization, TCR and ZAP-70 distribution
were studied on the different PDMS.
Prior to each experiment, quantitative measurements of adsorbed Nav-TR were done. The
measurements indicate that the per-area amount of Nav-TR adsorbed onto PDMS substrates was
20 to 30 molecules/µm2, as verified by relative fluorescence intensity. This amount is equivalent
for all substrates, and independent of the substrate rigidity.
5.1.1 Effect of PDMS Elasticity on cellular Adhesion
We examined the contact area of Jurkat T-cells adhered to different types of PDMS with varying
elasticity. Cells were allowed to interact with the different substrates for 20 minutes and were
imaged with RICM (as explained in section 2.9.3), to determine the region of contact between the
proximal surface of the cell and the substrate surface. The region of contact is called the contact
zone, and the area of this zone is called the contact area and is a measure of cell spreading.
Note that the cell membrane in the contact zone, may not be tightly adhered everywhere, but we
consider that it potentially interacts closely with the substrate. The cell contact area is seen to
be dependent on the elasticity of the PDMS, and the extent of cell spreading is quantified using
a macro written in-house in ImageJ/Fiji (see section 2.10.2).
Figure 5.1 shows the adhesion area of cells on CY, Sylgard and Q gel of varying elasticity.
In the case of CY, the cells adhering on the soft 3 kPa CY occupied 1.8 times larger area than
cells adhering to the CY with a medium elasticity of 300 kPa, and 3.5 times larger area than
those adhering to the hard CY owing an elasticity of 40 MPa (Figure 5.1 A). However, as we
discussed in section 4.1.3, the CY (1:2; 300 kPa) and the CY (1:4; 40 MPa) show a viscoelastic
behavior, and therefore we subsequently decided to not consider these two types of PDMS.
Cells adhering on Sylgard with varying elasticity show similar behavior as that of CY; the
cell adhesion area decreases with increasing stiffness of the substrate: 330 ± 130 µm2 for soft
(5 kPa), 270 ± 110 µm2 for the medium (140 kPa) and 200 ± 90 µm2 for the hard Sylgard (2
MPa) (Figure 5.1 B).
Finally, on the third type of PDMS, Q Gel (1:2/ 20 kPa), cells show an adhesion area of 300 ±110 µm2 (Figure 5.1 C). Measurements on softer Q gel (1:1.1), with an elasticity of 3.7 kPa, show
a higher adhesion area comparable to that on Sylgard 5 kPa and CY 3 kPa (data not shown).
We can hypothesize that cell adhesion is independent of the type of PDMS used, therefore of
the chemical composition of the PDMS. It however depends on the substrate elasticity. Cells are
seen to spread more on softer than on harder substrates when the cell-substrate interaction is
mediated via the T-cell receptor. Figure 5.2 B shows a nearly similar spreading area on 3 and 5
kPa PDMS, this area decreases simultaneously when passing to the 20 kPa, 140 kPa and 2 MPa
PDMS.
157

CHAPTER 5. CELLS ON HOMOGENEOUS AND PATTERNED PDMS
Figure 5.1 – Scatter dot plots of cell adhesion area determined from segmentationof RICM images of cells adhering on three different types of PDMS with varyingelasticity. (A) On CY. (B) On Sylgard. (C) On Q Gel. The results of three independentexperiments (with at least 30 cells) were pooled for each condition. Bar= median value. ***: P< 0.01.
5.1.2 Actin Cytoskeleton organisation, TCR and ZAP-70 distribution
Actin organization, TCR and ZAP-70 distribution were evaluated for cell spreading on different
PDMS with varying elasticity. For this, cells were allowed to interact with the different substrates
for 20 minutes, fixed and then labeled. FITC-conjugated phalloidin was used for actin cytoskele-
ton staining, TCR molecules were revealed by labeling with a fluorescent antibody against the
β chain of the TCR molecules (anti human anti-Vβ8 TCR) and finally Alexa-Fluor 647 mouse
anti ZAP-70 was used for labeling the ZAP-70 signaling kinase.
5.1.2.1 Actin Organisation
The architecture of actin cytoskeleton was imaged with TIRF-M on different substrates with
varying elasticity. Visual inspection of the images shows an actin organization, which is depleted
at the center and enriched at the periphery, independent of substrate rigidity (Figure 5.3-5.5).
Cells spreading on CY (1:1; 3 kPa) and (1:2; 300 kPa) show strong enrichment of actin at the
periphery of the contact zone, concomitant with a depletion at the center (Figure 5.3). This is
also observed for cell spreading on Sylgard where a peripheral distribution of actin is noticed on
the 2 MPa, 140 kPa and 5 kPa Sylgard (Figure 5.4). Similarly, cell spreading on Q Gel shows
158

CHAPTER 5. CELLS ON HOMOGENEOUS AND PATTERNED PDMS
Figure 5.2 – Cell adhesion area of cells adhering on different PDMS substrates ofvarying elasticity.. (A) Bright-field (BF) and RICM images of cell spreading on PDMS ofvarying elasticity. Scale bar: 4 µm. (B) Mean cell adhesion area calculated from RICM images,error bar = standard deviation. ***: P < 0.01, ** P < 0.05.
actin located at the periphery (Figure 5.5). Structures resembling to lamellipod are observed
on the different substrates, specially dominant on Q Gel, where they may be present along with
filopodial structures.
5.1.2.2 TCR and ZAP-70 distribution
TCR and ZAP-70 distribution were imaged in TIRF-M for cell spreading on the different sub-
strates (Figure 5.3-5.5). Visual inspection of the images shows TCR is distributed uniformly on
all the different substrates. Individual µ-clusters are not detectable. Following the TCR distri-
bution, we looked into the organization of the ZAP-70 which is one of the first molecules to be
recruited by the TCR complex following activation. ZAP-70 is seen to be distributed homoge-
neously on the different substrates, similarly to the TCR and independently of the PDMS rigidity
(Figure 5.3, 5.4). Nevertheless, we can note that the ZAP-70 distribution is more clustered than
that of the TCR demonstrating the recruitment of ZAP-70 in form of clusters at the membrane.
159
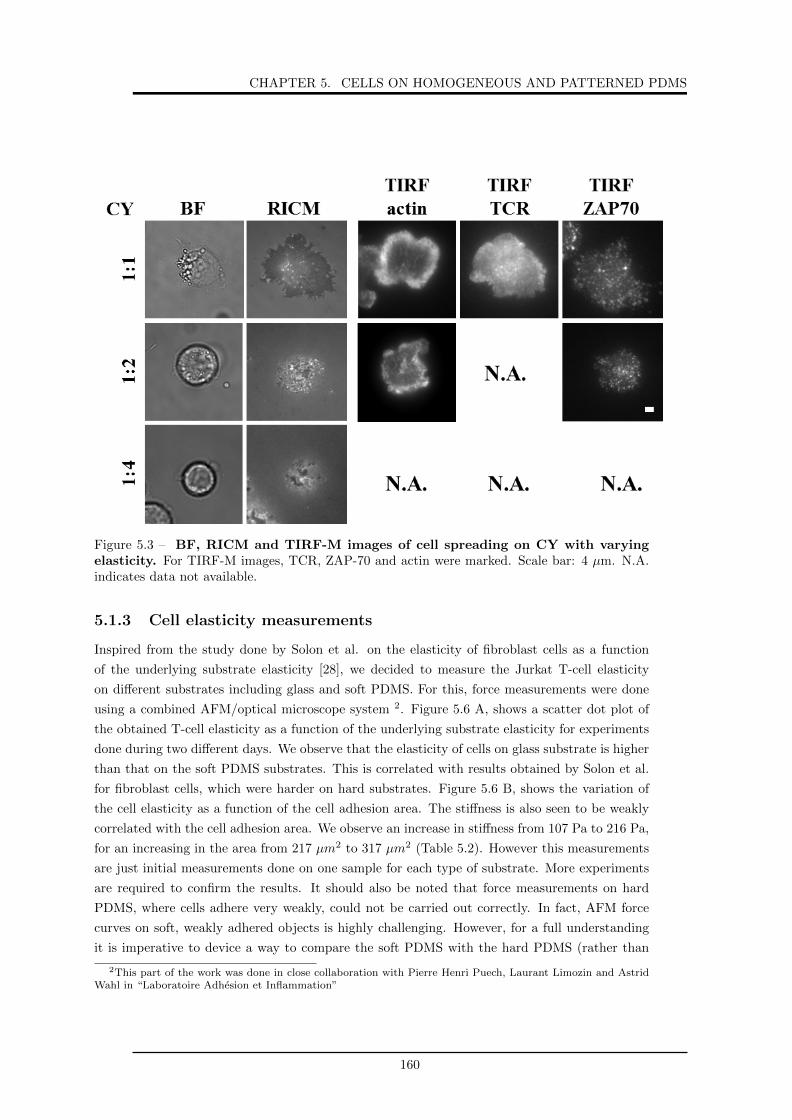
CHAPTER 5. CELLS ON HOMOGENEOUS AND PATTERNED PDMS
Figure 5.3 – BF, RICM and TIRF-M images of cell spreading on CY with varyingelasticity. For TIRF-M images, TCR, ZAP-70 and actin were marked. Scale bar: 4 µm. N.A.indicates data not available.
5.1.3 Cell elasticity measurements
Inspired from the study done by Solon et al. on the elasticity of fibroblast cells as a function
of the underlying substrate elasticity [28], we decided to measure the Jurkat T-cell elasticity
on different substrates including glass and soft PDMS. For this, force measurements were done
using a combined AFM/optical microscope system 2. Figure 5.6 A, shows a scatter dot plot of
the obtained T-cell elasticity as a function of the underlying substrate elasticity for experiments
done during two different days. We observe that the elasticity of cells on glass substrate is higher
than that on the soft PDMS substrates. This is correlated with results obtained by Solon et al.
for fibroblast cells, which were harder on hard substrates. Figure 5.6 B, shows the variation of
the cell elasticity as a function of the cell adhesion area. The stiffness is also seen to be weakly
correlated with the cell adhesion area. We observe an increase in stiffness from 107 Pa to 216 Pa,
for an increasing in the area from 217 µm2 to 317 µm2 (Table 5.2). However this measurements
are just initial measurements done on one sample for each type of substrate. More experiments
are required to confirm the results. It should also be noted that force measurements on hard
PDMS, where cells adhere very weakly, could not be carried out correctly. In fact, AFM force
curves on soft, weakly adhered objects is highly challenging. However, for a full understanding
it is imperative to device a way to compare the soft PDMS with the hard PDMS (rather than
2This part of the work was done in close collaboration with Pierre Henri Puech, Laurant Limozin and AstridWahl in “Laboratoire Adhesion et Inflammation”
160

CHAPTER 5. CELLS ON HOMOGENEOUS AND PATTERNED PDMS
Figure 5.4 – BF, RICM and TIRF-M images of cell spreading on Sylgard with varyingelasticity. For TIRF-M images, TCR, ZAP-70 and actin were marked. Scale bar: 4 µm. N.A.indicates data not available.
Figure 5.5 – BF, RICM and TIRF-M images of cell spreading on Q Gel with varyingelasticity. For TIRF-M images, TCR, ZAP-70 and actin were marked. Scale bar: 4 µm.
glass). Our new experiments with optical tweezers3 point to a promising alternative for such
mechanical measurements.
3This part of the work was done in close collaboration with Pierre Henri Puech, Laurant Limozin and AstridWahl in “Laboratoire Adhesion et Inflammation”
161

CHAPTER 5. CELLS ON HOMOGENEOUS AND PATTERNED PDMS
Figure 5.6 – Cell elasticity as a function of substrate elasticity or cell adhesion area.(A) Cell elasticity as a function of substrate elasticity. The data in abscissa are represented asfollows: type of the substrate (elasticity) date of the experiment. Each point is the mean stiffnessof a single cell plotted against the underlying substrate. Bar = mean value. (B) Cell elasticityas a function of cell adhesion area.
Substrate (elasticity) date of the experiment: year/month/day Cell elasticity (Pa) Cell adhesion area (µm2)Glass (∼ GPa) 151103 216 ± 42 317 ± 92
Sylgard (30 kPa) 151103 159 ± 99 300 ± 66Sylgard (30 kPa) 150923 107 ± 31 217 ± 72Q Gel (20 kPa) 150923 118 ± 31 262 ± 53
Table 5.2 – Cell elasticity and adhesion area on different substrates. Values are averagesfor measurements done on at least 10 cells.
5.2 T-Cell ON Patterned Substrate
PDMS substrates were often used, micropatterned with ECM proteins in order to control cell
adhesion and interaction [336]. However, patterning soft substrates such as gels, with an elastic
modulus < 100 kPa, presents an engineering challenge. This kind of substrates are shown to be
difficult to pattern with techniques such as microcontact-printing without requiring additional
fabrication steps [337, 158]. Here, we were able to pattern soft PDMS substrates (elasticity < 50
kPa) with different kinds of proteins at it was seen in chapters 3 and 4.
The patterned substrates are used as support for experiments on T-cells. Since Q gel (20 kPa)
patterned with bBSA-TR shows better transfer ratio (0.6 ± 0.14) in comparison with the one
patterned with bBSA-atto (0.4 ± 0.03) (see section 4.2.2.1), we chose to use it as system of
choice to study the influence of such patterns on T-cell behavior, and their compatibility with
advanced optical imaging (RICM and TIRF-M). For this, bBSA-TR patterned Q gel 20 kPa
substrate is subsequently functionalized with fluorescent neutravidin, after a blocking step with
pluronic F-127, then further incubated with biotinylated anti-CD3 (see section 3.2.4), which will
specifically bound to the neutravidin and targets the TCR at the same time. This substrate
162

CHAPTER 5. CELLS ON HOMOGENEOUS AND PATTERNED PDMS
will be called soft pattern/pluronic. We should note that the PDMS surface maintains the
patterned proteins over a prolonged period (several days), even though the proteins were not
covalently linked to the PDMS.
In addition to bBSA-TR patterned Q Gel substrate, four different substrates were used:
1- Positive control, called POS, composed of Q gel 20 kPa substrate with homogeneous ligand
distribution without patterning (section 2.6.1).
2- bBSA-TR patterned Q gel substrate functionalized with non fluorescent bBSA outside the
dots (after patterning the Q gel surface with bBSA-TR, non fluorescent bBSA was added all
over the surface). This substrate shows therefore homogeneous distribution of ligands similar to
the positive control. It will be called soft pseudo-pattern/bBSA.
3- Glass substrate patterned with anti-CD3 in a sea of pluronic acid as described in section
3.1.4.1. It will be called glass pattern/pluronic.
4- Negative control, called NEG, composed of Q gel 20 kPa substrate functionalized with pluronic
F-127.
Cells were allowed to interact with these substrates, were then fixed after spreading, stained,
observed and, imaged with RICM and TIRF-M.
The objective of this part is to compare cell adhesion on homogeneously functionalized and
patterned soft Q Gel substrates, and also to compare the difference of cell behavior on glass
patterned substrates and Q gel patterned substrates. Four major cell parameters are analyzed
using the different substrates described above. These parameters include, average cell density,
cell adhesion, actin cytoskeleton organization and overall TCR distribution.
5.2.1 Average Cell Density
The average density of cell on Q gel substrates was determined by enumerating the number of
cells in a field view (Figure 5.7, a-c) divided to the total surface of the field selected (Figure
5.7, d). At least 25 fields view are analyzed for each sample case. As expected, the cell density
on POS substrate (0.25 ± 0.15/1000 µm2) was higher than the soft pattern/pluronic (0.2 ±0.08/1000 µm2). In fact, on POS substrate, anti-CD3 is distributed homogeneously all over the
substrate which allow an effective adhesion thanks to TCR/anti-CD3 interaction.
The highest cell density was observed for the soft pseudo-pattern/bBSA (0.4 ± 0.2/1000 µm2).
Here, non fluorescent bBSA was added to the substrate, covering all its surface, in addition to
the bBSA-TR already present in a form of pattern. Thus, neutravidin and anti-CD3 should be
distributed all over the surface. Therefore a surface similar to the positive control should be
created with a higher ligand density than that of the POS and soft pattern/pluronic substrates.
This could explain the higher cell density for soft pseudo-pattern/bBSA in comparison with the
latter substrates.
The soft pattern/pluronic substrate, shows as expected, the lowest cell density (0.2 ± 0.08/1000
µm2). Here, neutravidin and anti-CD3 are grafted only on the bBSA-TR dots, forming a regular
163

CHAPTER 5. CELLS ON HOMOGENEOUS AND PATTERNED PDMS
Figure 5.7 – Average T-cell density on three different substrates. (a) On homogeneoussubstrate. (b) On soft pseudo-pattern/bBSA substrate. (c) On soft pattern/pluronic substrate.(d) T-cell distribution per 1000 µm2.
array of anti-CD3 pattern, separated by a sea of pluronic acid. Thus the ligand distribution here
is lower than that of the POS and soft pseudo-pattern/bBSA substrates, which explains a lower
cell adhesion mediated by the TCR/anti-CD3 interaction.
5.2.2 Cell Adhesion Area
Cells were allowed to interact with the different substrates, for 20 minutes on controls and 30
minutes on patterns (section 2.7.3), due to the slower dynamics of spreading on the patterns as
compared to homogeneously coated substrates [113]. The cell is at its peak spread area at thirty
minutes. The cells where then imaged with RICM, and the cell adhesion area was determined
using a macro written in-house in ImageJ/Fiji (see section 2.10.2).
As described in section 5.1.1, the contact zone is imaged with RICM, and the contact area is
quantified. Previous studies have demonstrated that the cell contact area depends strongly on
the ligand density [113]. This was also observed in our experiments, where cells tend to spread
better on substrates with higher ligand density. Quantification of the contact area (Figure 5.8)
shows that the adhesion area on POS substrates (300 ± 20 µm2) was similar to that for the soft
pseudo-pattern/bBSA substrates (290 ± 35 µm2). As expected, the soft pattern/pluronic sub-
strates shows an adhesion area of cells (195 ± 20 µm2) lower than the two previous substrates.
The NEG control shows few cells adhering to the substrate with an adhesion area of 70 ± 40
164

CHAPTER 5. CELLS ON HOMOGENEOUS AND PATTERNED PDMS
Figure 5.8 – Cell adhesion area determined from segmentation of RICM images ofT-cells adhering on different substrates. (A) Examples of RICM images of cells spreadingon different substrates. Scale bar = 4 µm. (B) Scatter dot plot of cell adhesion area on differentsubstrates, bar = median value. (C) Mean cell adhesion area calculated from RICM images,error bar = standard deviation. At least two independent experiments were used for each caseand at least 30 cells for each experiment.
µm2, which confirms the repealing property of the pluronic and preventing cell adhesion.
When comparing the cell adhesion area on Q gel soft pattern/pluronic (195 ± 20 µm2) to that
of glass pattern/pluronic (280 ± 25 µm2), we observe that it is higher on the latter. This can be
explained by the greater ligand density on glass pattern/pluronic, seen that after the transfer of
the protein from the glass pattern to the PDMS, the ligands density on PDMS is lower.
5.2.3 Actin cytoskeleton and TCR distribution
The influence of patterning soft substrates on actin organization and TCR distribution of T-cell
is evaluated, and is compared with results obtained on homogeneously functionalized soft Q Gel
substrate and glass patterned substrate. For this, cells are allowed to interact with the different
substrates, fixed and then either labeled with phalloidine conjugated fluorescein, in order to
mark the actin; or labeled with a fluorescent antibody against the β chain of the TCR molecules
165

CHAPTER 5. CELLS ON HOMOGENEOUS AND PATTERNED PDMS
(anti-human anti-Vβ8 TCR).
Figure 5.9 – T-cells adhered to different surfaces, observed after 30 minutes of spread-ing followed by fixation. (a-d) Examples of RICM images of cells adhering on different sub-strates. (e-h) TIRF-M of actin organisation on different substrates. Insets corresponds pattern(left) and RICM (right). Scale bar = 4 µm. (i-k) Epi-fluorescence images of bBSA-TR patterns.(l-o) TCR distribution on different substrates. Note that arrows point to TCR micro-clustersand corresponding anti-CD3 dot in the underlying pattern. Scale bar = 4 µm.
5.2.3.1 Actin Organisation
The architecture of the actin cytoskeleton was imaged with TIRF-M and observed on different
substrates functionalized with anti-CD3 (Figure 5.9 e-h). Visual inspection of the images, shows
on POS substrates, a strong enrichment in actin at the periphery of the contact zone, concomitant
with a depletion at the center (Figure 5.9 e). On soft pseudo-pattern/bBSA substrates, the actin
166

CHAPTER 5. CELLS ON HOMOGENEOUS AND PATTERNED PDMS
shows also a peripheral distribution (Figure 5.9 f). Similarly, on the Q gel soft pattern/pluronic
actin array was located at the periphery, and structures resembling to lamellipodia and filopodia
are observed (Figure 5.9 g). We can conclude that actin cytoskeleton was similarly organized on
patterned and homogeneously functionalized Q gel substrates. However, structures resembling
to lamellipodes were seen for POS and soft pseudo-pattern/bBSA substrates while filopodial and
lamellipodial resembling structures were equally observed on soft pattern/pluronic.
When comparing the Q gel soft pattern/pluronic (Figure 5.9 g) and the glass pattern/pluronic
(Figure 5.9 h), the actin cytoskeleton is distributed at the periphery of the contact zone for both
of them.
Previous studies realized in our group on T-cell interacting with glass substrates patterned with
anti-CD3 in a sea of polyethylene-glycol coupled to poly-L-Lysin (PEGPLL) as a passivating
material, have shown different behavior of the actin cytoskeleton organisation [253]. On these
kind of substrates, we observed that T-cells presented a patterned actin distribution. Thus, the
actin was colocalized with anti-CD3 proteins dots instead of a peripheral organization. In the
current experiments, when using pluronic acid as a passivating material, actin did not appears
to follows the structure of the pattern, instead it was similar to the experiment on POS substrate.
The mechanism of actin ring configuration in activated T-cells is still not fully understood.
It has been reported in the literature for T-cells on anti-CD3 covered glass as well as on glass
supported lipid bilayers (SLBs) carrying ligands of TCR as well as integrins. Here we observe the
ring structure for all the substrates studied, which include the soft POS, patterned and pseudo-
patterned, as well as glass patterned substrates. Specifically for the last case, based on previous
studies [253], we had expected a different organization. The chemical differences between the
previous experiments and current one was the use of pluronic acid instead of PEGPLL. Our char-
acterization shows that more molecules of anti-CD3 are absorbed between the dots for pluronic
case as compared to the PEGPLL case. This may explain why actin is in ring shape.
5.2.3.2 TCR distribution
The distribution of TCR was imaged in TIRF microscope on the different kinds of substrates
(Figure 5.9 l-o). As expected, the images of soft POS and soft pseudo-pattern/bBSA substrates,
show a homogeneous distribution of the TCR all over the contact zone (Figure 5.9 l,m). However,
on the soft pattern/pluronic substrate, the TCR-microclusters partly co-localize with the under-
lying protein dots and seem to have nearly the same size (Figure 5.9 j,n). This was also observed
on the glass pattern/pluronic substrate, with a slightly more pronounced co-localization (Figure
5.9 k,o). Thus a significant difference is established between the patterned and the homogeneous
substrates. As expected TCR tended to be distributed uniformly following the homogeneous anti-
CD3 ligands underneath (Figure 5.9 l,m), but when ligands were mainly concentrated within the
dots on the pattern, TCR clusters were formed and seemed to partly co-localize with the dots
(Figure 5.9 n,o). We can conclude that patterned substrates, which aimed to mimic the TCR
ligands, naturally organized in clusters on APC surface, the TCR-microclusters distribution fol-
167

CHAPTER 5. CELLS ON HOMOGENEOUS AND PATTERNED PDMS
lowing the dots, might be similar to the microclusters formation in physiological state.
5.3 Discussion
The ECM is a diverse and instructional material that is critical to cell behavior and tissue func-
tion. It was reported that cells sense and respond to ECM elasticity and topography. However
most previous reports have looked separately at these factors. In this study, surfaces with tun-
able elasticity were created, and were either functionalized homogeneously with specific protein
targeting the T-cell receptor complex (anti-CD3), or imparted with controlled chemical features
conjugated to anti-CD3, in order to decipher the role of substrate elasticity and/or patterning
on T-cell adhesion and activation process.
Previous studies on T-cells spreading on planar glass surfaces, patterned or not, have shown
that unlike other reported cell types (e.g. fibroblasts) where adhesion is modulated by the spac-
ing between integrin ligands, globally T-lymphocytes adhesion depends on overall average surface
density of the bioactive molecule. In case of patterned surfaces, the specific pattern distribution
does strongly influence the local molecular distribution on the cell surface, as well as the archi-
tecture of the actin cytoskeleton. Following these findings, we were interested to develop a soft
environment that mimics the mechanical properties of the in vivo cell-cell interaction, to see if
the results obtained on hard glass substrates were also applicable for soft environment.
For this, we studied the behavior of T-cells on substrates with varying elasticity patterned or
homogeneously functionalized with anti-CD3. We selected PDMS as material for our study, due
to its biocompatibility, surface hydrophobicity, stability and facility to modulate its mechanical
properties through variation of base to cross-linker ratio. We used three types of PDMS ma-
terials, CY , Sylgard and Q gel which together cover the elastic modulus range from 3 KPa to
2 MPa. Planar layer of PDMS supported on a glass substrate were fabricated and functional-
ized homogeneously, or patterned with anti-CD3 after functionalization steps with bBSA and
Nav. T-cells were then allowed to interact with the surface for 20 minutes on homogeneously
functionalized substrates and 30 minutes on patterned substrates. They were then fixed and
labeled appropriately. Our main interest was to study the cell adhesion from quantification of
the adhesion area. The other aspects under study were the actin cytoskeleton organization and
distribution of the TCR and of a receptor kinase involved in the signaling (ZAP-70).
On homogeneously functionalized PDMS substrates, we demonstrated comparable amount of
Nav adsorption to the surface, independently of the type of PDMS used and its elasticity. In
general, protein adsorption to a surface is highly dependent upon both the hydrophibicity and
electrostatic properties of the surface [338]. Since PDMS is known to be highly hydrophobic
facilitated the protein adsorption to its surface.
We found that unlike other cell types, such as fibroblasts [28], T-cells spread more on soft PDMS
168

CHAPTER 5. CELLS ON HOMOGENEOUS AND PATTERNED PDMS
substrates (Young’s modulus 5, 20 or 150 kPa), than on hard ones (2 MPa). We showed that on
hard PDMS, the cell barely adhered whereas on soft PDMS substrates, a considerable adhesion
is observed. Interestingly, on glass substrates (Young’s modulus ≈ GPa), the cell adhere very
well too. This results are in agreement with previous report which demonstrated that T-cells are
more activated on softer PDMS (100 kPa), since they produce more interleukin-2 (IL-2) [127].
The results we obtained on patterned soft substrates (20 kPa) are consistent with this, since
cells were seen to adhere well with an adhesion area of 195 ± 20 µm2. The differences in area
between homogeneously functionalized and patterned soft substrates could be attributed to the
differences in the average ligand density, as was demonstrated for glass substrates [123]. Negative
controls consisting of soft substrates with pluronic acid, show barely adhered cells. This confirms
the repulsive property of the pluronic acid.
Cell elasticity measurements were done on glass and soft PDMS, and show as expected, a higher
cell elasticity on hard glass than that on soft PDMS. However the results could not be conclusive
because force measurements on hard PDMS , where cells adhere very weakly could not be carried
out correctly.
Studies concerning the distribution of cell surface TCR molecules on glass substrates, show
a random distribution on homogeneously coated anti-CD3 substrates [113] [117], while a specific
rearrangement following the underlying antibody pattern is observed on patterned substrates
[253]. Here, the same results were obtained on homogeneously coated PDMS substrates. Thus,
we observed TCR molecules and even ZAP-70 homogeneously distributed on the PDMS sub-
strates, independently of the elasticity. However, small population of sub-micron clusters are
observed, whose are more significant for ZAP-70 than for the TCR demonstrating the recruit-
ment of ZAP-70 in form of clusters at the membrane. In the case of patterned glass substrates,
TCR is observed to partly co-localize with the underlying anti-CD3 dots. Thus, we reproduce
the previous results concerning the TCR on patterned glass. Even though, we have to note the
difference between our patterned substrates and the previous reported one, regarding the block-
ing material used for fabrication of the pattern. In the previous work, the space between the
dots was filled with a di-block copolymer, poly-L-lysin/poly ethylene glycol (PEGPLL), whereas
here, it is filled with the tri-block copolymer pluronic.
Our first results concerning the TCR on patterned soft PDMS substrates (20 kPa), show only a
partial co-localization.
It is well known that actin cytoskeleton structure is related to cell adhesion mechanics, and
many proteins involved in TCR and co-stimulatory receptor signal transduction interact directly
or indirectly with the actin cytoskeleton. However, unlike the more frequently studied integrin
mediated adhesion, the connection between the ligand molecule and actin is not clear for TCR.
On homogeneously functionalized glass, actin architecture was observed to have a peripheral ring
organization [108][113][117]. This was also the case on our PDMS substrates, where a strong en-
richment in actin at the periphery of the contact zone is seen independently of the substrate
169

CHAPTER 5. CELLS ON HOMOGENEOUS AND PATTERNED PDMS
rigidity. While on patterned glass fabricated with PEGPLL as repellent material, a partial co-
localization with the dots is seen [253], on our patterned soft PDMS substrates a peripheral ring
organization is still always observed. We have to note that this was also reproduced on patterned
glass using pluronic as a repellent material, which raises the question about the role of pluronic
versus PEGPLL. It may be speculated that either pluronic is not as efficient as the other polymer
in passivating the glass, or that the height of the two polymers on the glass are different and
that may influence actin organization. In general, many questions still remain open on how the
organization of the actin cytoskeleton impact the distribution and formation of the TCR micron
cluster and vice versa. The current results add to the debate.
170

Chapter 6
Conclusion
171

CHAPTER 6. CONCLUSION
Hard surfaces like glass and silicon are mechanically very different from the physiological envi-
ronment of cells. For this reason, there is a great current interest in the cell biology domain,
for the fabrication of patterned soft substrates, providing a surface that better mimics the real
environment of the cell. So far, there is only one available technique to do so. It is based on
patterning soft hydrogels using gold nanoparticles. However, this technique requires specialized
chemistry and is limited by the chemical and optical properties of gold, as well as the mechanics
of hydrogels. The overall aim of this thesis was to propose a novel approach to generate protein
patterns over large area of soft elastomer, in order to explore cell responses, specially cell adhe-
sion, activation and mechanics.
To do so, I developed the reverse contact printing technique (RCP), based on patterning glass
substrates with nano-scale protein islands which are further transfered to the surface of a soft
polydimethylsiloxane elastomer (PDMS) substrate by a simple physical contact (Figure 6.1).
Different types of PDMS with different chemical properties (Sylgard, CY, and Q Gel) were
used, in their native form or were functionalized, and were characterized in terms of wettabil-
ity and elasticity. Contact angle measurements show that in their native forms, the elastomers
could be classified in order of hydrophobicity as CY > Q Gel > Sylgard, and following plasma
treatment as p Q Gel > p CY > p Sylgard.
Elasticity measurements were performed using force measurements with atomic force microscopy,
for native and plasma treated PDMS. The measurements show an increasing of PDMS stiffness
following the plasma treatment. Overall, a range of Young’s Moduli, from 3 kPa to 7 MPa were
explored.
The RCP technique was validated for different types of proteins including BSA (un-conjugated or
fluorescently labeled), biotin-BSA (bBSA, un-conjugated or fluorescently labeled), neutravidin
Texas-red conjugated (Nav-TR), and fibronectin labeled with fluorescein isothiocyanate. The
success of the transfer was also validated for different PDMS surfaces, native, plasma treated or
chemically functionalized with a process involving the use of glutaraldhehyde. We also showed
that a slightly different technique, involving the use of aluminum as place holder, can be used to
create the glass-master [253]. This shows that RCP is a highly versatile, facile and reproducible
method, for sub-micropatterning surfaces.
The quality of the patterns was characterized in terms of dot size and contrast on glass be-
fore the transfer and on PDMS after the transfer. The transfer ratio was also calculated. The
results show that the success of the transfer was strongly influenced by the chemical nature of
the fluorophore grafted to the protein, and/or the elastomer surface, and can be predicted from
measuring the forces of adhesion and cohesion using atomic force microscopy (AFM). The degree
of hydrophobicity, as well as the presence of ionic groups on both the PDMS and the protein are
also important molecular factors governing the transfer.
172

CHAPTER 6. CONCLUSION
Figure 6.1 – Graphical representation of the reverse contact printing technique.
To understand this factors, I quantified the effective force of adhesion, as well as the adhesive
energy of the protein on glass and PDMS using AFM force curves of the interaction between
the protein functionalized tip and the different surfaces. Sylgard PDMS was chosen for these
measurements. The measurement on native Sylgard were not amenable to interpretation since
strong non specific adhesions were present. However, these measurements were conducted and
interpreted on plasma treated Sylgard and clean bare glass. They show that the nature of
the grafted fluorophore influence the transfer, the detailed protocol and mechanism is summa-
rized in ref [339] (submitted). This was also proved by the higher transfer ratio obtained when
transferring bBSA-TR in comparison to that obtained for bBSA-Atto (noting that TR is more
hydrophobic than Atto). To confirm this finding, Nav-TR was transfered to the surface of native
PDMS. Successful transfer was obtained on all the surfaces. We should note that in contrast to
fluorescently labeled bBSA, Nav-TR could not be further functionalized after direct transfer to
PDMS. We think that this is probably because it was denaturated due to drying.
In another set of experiments, proteins were transferred to the surface of PDMS chemically
treated with a process involving the use of glutaraldhehyde. This process is known to render the
surface hydrophobic and to support strong and stable covalent linkage of proteins. Hydropho-
bic Nav-TR were seen to transfer well, but hydrophilic bBSA and BSA-FITC failed to transfer.
These findings argue the fact that even when covalent bonds are formed, the initial transfer is
governed by physico-chemical affinity.
Separately, the influence of substrate elasticity on cell adhesion and activation was studied for
Jurkat T-cell line. For this, different PDMS substrates with elasticity ranging from 3 kPa to 2
MPa, were prepared and homogeneously functionalized with specific ligands targeting the CD3
domain of the TCR complex. Following that, cells were allowed to interact with these substrates.
173

CHAPTER 6. CONCLUSION
We found that contrary to other cell types, T-cells adhesion increases with decreasing elastic-
ity. Thus, cells are found to have a considerable adhesion on soft substrate whereas they barely
adhere on hard substrates. However, we found that elasticity seems to not influence actin or-
ganization which is seen to have the common peripheral organization. The distribution of TCR
molecules and ZAP-70 was also independent from the elasticity. TCR and ZAP-70 were found to
be homogeneously distributed on the different substrates, with a small population of sub-micron
clusters observed. This study demonstrates that our PDMS support adhesion and that T-cell
adhesion is sensitive to the differences in substrates elastic moduli.
Cell elasticity measurements were also done for T-Cells using force measurements with atomic
force microscopy. Initial results show an elasticity for cell spreading on glass substrates higher
than that corresponding to cell spreading on soft PDMS substrate. As well as a correlation
between cell elasticity and cell adhesion area is observed. However, it should be noted that force
measurements on hard PDMS, where cells adhere very weakly, could note be carried out cor-
rectly. In fact, force measurements on soft, weakly adhering objects are challenging. However,
for a full understanding it is imperative to device a way to compare the soft with the hard PDMS
(rather than glass). For this, optical tweezers measurements are in progress. The first results
show a similar cell elasticity on hard and soft PDMS substrates.
To elucidate that our RCP approach could potentially be applied for cell studies, we choose the Q
Gel (20 kPa) patterned with bBSA-TR as a model substrate. Next, the patterned soft substrate
was functionalized with Nav and anti-CD3 after a pluronic blocking step. Thus, substrates with
anti-CD3 pattern motifs, targeting the CD3 domain of the TCR complex are obtained. T-cells
were then allowed to interact with these patterns, and also with a pseudo-pattern constituted of
fluorescent dots but with presence of equivalent non-fluorescent protein outside the dots, which
make the substrate, at the chemical level, almost equivalent to the positive control. Cell adhesion
area, actin cytoskeleton organization and TCR distribution were the parameters under study on
these substrates. Cells were seen to adhere well on the patterned soft Q Gel substrate, which
is consistent with the previous elucidated results showing a considerable adhesion of cell on ho-
mogeneously functionalized soft substrates. However, the ring structure of actin cytoskeleton is
still persistent. The TCR distribution shows a partial co-localization with the underlying pattern.
Overall, the proposed technique of RCP is a facile, inexpensive, efficient and flexible nano-
fabrication technique that can be accessible for chemist as well as biologist. It allows patterning
of proteins over a variety of biocompatible substrates via a relatively simple processing route,
and could eventually be used with any cell type. Moreover, since the PDMS elastomers used in
this technique are characterized by high refractive indexes, ranging from 1.41 for Sylgard, 1.4 for
CY and 1.49 for Q Gel, they represent excellent compatibility with surface sensitive microscopy,
total internal reflection fluorescence microscopy (TIRF-M), reflection interference contrast mi-
croscoy (RICM) and super resolution, the first two techniques were demonstrated by me in ref
[253]. The fabricated substrates could be expected to be used for traction force microscopy
174

CHAPTER 6. CONCLUSION
in order to combine patterning and cell mechanics. RCP can covers a wide range of physi-
ologically relevant stiffness to extend our understanding for cell mechanics and holds potential
to be further developed and used to increase our knowledge of fundamental cell biology processes.
The problems and limitations of RCP also need to be taken into consideration. In fact, in
some cases, as it was seen for BSA labeled with FITC, the success of the transfer required
plasma treatment of the PDMS surface. This treatment increases the PDMS elasticity, changes
its surface chemistry and can form cracks at the PDMS surface if care is not taken during the
plasma treatment. Another drawback that should be ameliorated, is the protein transfer from
outside the dots which influences the contrast of the pattern and may also affect the cell response.
Another limitation of this technique is related to the limited range of PDMS elasticity. We have
to note also that this technique is not usable with hydrogels at least for now.
Future work that might be done, consists in optimizing structural parameters such as the lateral
size of the dots and the inter-spacing which is possible by changing the size of the beads used for
the fabrication of the glass master. We could also try to ameliorate the contrast of the PDMS
pattern, thus decrease the transfer outside the dots, by trying several blocking reagent. Also we
should increase the range of PDMS stiffness to which the pattern could be transfered. Finally
we also aim at recording the dynamics of cell adhesion, measure cell elasticity with AFM, and
set up traction force microscopy to measure forces exerted by cells, in order to explore the effect
of patterning versus elasticity on cell mechanics.
175

CHAPTER 6. CONCLUSION
176

Chapter 7
Summary In French
177

CHAPTER 7. SUMMARY IN FRENCH
Durant les dernieres decennies, de plus en plus de types de cellules se sont revelees capables de
sonder leur environnement mecanique par l’application de forces par l’intermediaire de proteines
d’adhesion sur leur surface. Ce phenomene appele “Mecanosensing” est lie a l’adhesion et
la mecanique cellulaire, et est souvent etudie grace a l’interaction des cellules avec des sub-
strats artificiels. Mecanosensing devient un domaine de recherche en pleine emergence, grace
au developpement de techniques experimentales permettant de changer l’elasticite de la matrice
et de mesurer precisement les interactions cellules-substrats. Dans des etudes distinctes, les
technologies de bio-nanostructuration ont fourni des outils pour mimer l’etat physiologique et
pathologique des cellules ainsi que pour les manipuler. Des surfaces chimiquement structurees
avec une repartition des ligands specifiques ont montre une forte influence sur l’adhesion et la
mecanique cellulaire. Cependant, la relation entre les deux phenomenes n’a pas ete beaucoup
exploree, en partie parce que la fonctionnalisation de substrats mous s’est revelee etre un defi
technique.
Dans ce but, nous visons dans ce projet le developpement d’une technique de structuration
de substrats mous pour des applications dans le contexte de la biologie cellulaire et principale-
ment dans le contexte des lymphocytes. Parmi les techniques de structuration les plus connus,
on note la technique de microcontact printing developpee par Georges Whitesides en 1993 [153].
Elle utilise un tampon en elastomere avec un motif de structure en relief, permettant le transfert
de molecules a la surface de substrats en verre ou en or par exemple. Cette technique est actuelle-
ment un outil indispensable pour la structuration de substrats en verre avec des proteines pour
des etudes cellulaires. Elle est connue pour son processus de fabrication simple et la facilite de
son utilisation. Toutefois, vu que les cellules vivantes sont mecaniquement sensibles, l’elaboration
d’une technique pour patterner des substrats mous est un besoin en pleine croissance.
Separement, des etudes ont montre que les cellules ne repondent pas uniquement a la nature
biochimique des proteines qui sont presentes sur la surface, mais aussi a la facon dont ces
molecules sont organisees et presentees aux cellules. Les cellules du tissu conjonctif, comme les fi-
broblastes, se sont trouvees incapable d’adherer, de s’etaler, de proliferer ou encore de croıtre sur
des substrats patternes par des molecules uniques de ligand separees par une distance superieur
a 100 nm. De maniere surprenante, le comportement des lymphocytes s’est revele different, et
depend non seulement de la distance entre les ligands, mais aussi de la densite moyenne de ces
derniers.
Les etudes des lymphocytes-T sur substrats mous sont interessantes a cause des resultats con-
tradictoires reportes sur leur adhesion et activation sur de tels substrats, mais aussi a cause de
leur sensibilite mecanique qui, est-elle meme tres interessante. En effet il a ete montre que la
capacite des lymphocytes a reconnaitre un antigene depend de leur sensibilite mecanique et que
les domaines CD3 du complexe recepteur des cellules T (TCR) est implique dans cette sensibilite.
Le but de cette these est de fabriquer des substrats mous chimiquement structures avec des
plots de proteines, et dont l’elasticite peut etre facilement controlee afin de faire des etudes
plus approfondies sur l’adhesion et l’activation cellulaire avec des lymphocytes-T. La these est
178

CHAPTER 7. SUMMARY IN FRENCH
presentee en quatre chapitres principaux. Le premier chapitre montre une description detaillee
de la technique d’impression que j’ai developpee. Le second, rapporte l’efficacite de la methode
d’impression et propose un mecanisme moleculaire qui regit le transfert. Le troisieme, concerne
l’etude de la reponse des lymphocytes-T a des surfaces d’elastomeres mous fonctionnalises d’une
facon homogene ou patterne. Des parametres comme l’aire d’adhesion cellulaire, l’organisation
du cytosquelette d’actine et la distribution du TCR et ZAP-70 sont etudies. Le dernier chapitre
conclut le manuscrit tout en evoquant les principaux points du projet ainsi que les limitations et
les perspectives futures.
7.1 Protocole de transfert
Figure 7.1 – Representation schematique des etapes de la fabrication des plots deproteines sur un substrat en verre et leur transfert sur un substrat mou. (a) Auto-assemblage du masque de billes colloıdales en silice sur substrat en verre. (b) Deposition demolecules de fluorosilane (PFOTCS) a partir d’une phase gazeuse a travers le masque de billes.(c) Retrait des billes par ultra-sons et greffage d’un poloxamer (pluronic) afin de passiver la zonecouverte de fluorosilane. (d) Incubation de la proteine. (e) Couche mince d’elastomere (PDMS)supportee sur une lamelle en verre. (f) Transfert des plots de proteines du verre a la surface del’elastomere en presence d’une goutte d’eau. (g) Pattern de proteines a la surface du PDMS.
La technique de “reverse contact printing” que nous avons developpee, est schematisee dans la
figure 7.1. Elle est composee de deux parties. La premiere consiste a fabriquer des plots de
proteines (pattern de proteines) submicroniques sur un substrat en verre, suivi dans la seconde
partie de leur transfert sur un substrat de polydimethylsiloxane (PDMS) en presence d’une goutte
179

CHAPTER 7. SUMMARY IN FRENCH
d’eau.
7.1.1 Fabrication du pattern de proteine sur verre
Le protocole de la fabrication du pattern de proteines sur un substrat en verre se divise en cinq
etapes:
1- Une lamelle de verre lavee selon le protocole decrit precedemment (section 2.1) est posee selon
un angle de 13 . Un volume de 80 a 100 µl de billes lavees y sont deposees puis laissees sur une
surface plane afin que l’eau s’evapore (Figure 7.1 a).
2- Un depot de Trichloro (1H,1H,2H,2H-perfluorooctyl) silane (PFOTCS) est effectue sur le verre,
a travers le masque de billes par evaporation sous vide a 35 C pendant une heure dans un dess-
iccateur (Figure 7.1 b). Durant ce processus le fluorosilane est immobilise de facon covalente a
la surface du verre. Le masque de billes est ensuite enleve par ultrasons dans de l’eau. A ce
stade une couche de silane hydrophobe est obtenue sous forme d’un pattern separe par des trous
exposant la surface du verre. La reussite de cette etape est testee par la mesure de l’angle de
contact d’une goutte d’eau sur la lamelle de verre silanisee qui montre que la surface est devenue
hydrophobe avec un angle de contact de 80 .
3- Les regions hydrophobes (silanisees) sont passivees par l’adsorption d’un poloxamer a trois
block; le pluronic (Figure 7.1 c). En effet, le pluronic s’adsorbe a la surface du verre par interac-
tion entre sa partie centrale apolaire hydrophobe (poly(oxyde de propylene)) et les groupements
hydrophobes fluores du silane. Par contre, les deux parties externes hydrophiles du pluronic
(poly(oxyde d’ethylene)), vont etre exposees a la surface permettant ainsi de diminuer ou limiter
une fixation non specifique des proteines.
4- Les trous exposant la surface du verre sont remplis avec la proteine de choix (Figure 7.1 d).
Suite a ses etapes, une lamelle de verre chimiquement patternee avec des plots de proteines
est obtenue (Figure 7.2).
Figure 7.2 – Image d’epi-fluorescence representant un pattern de proteines (Nav-TR)sur substrat en verre. a- Image d’epi-fluorescence. b- Profil d’intensite correspondant a laligne tracee en (a). L’insert dans (a) represente la transformation de Fourrier rapide indiquantl’organisation ordonnee du pattern.
Toutes les etapes de la fabrication du nanopattern sur verre a partir du greffage du fluorosilane
180

CHAPTER 7. SUMMARY IN FRENCH
jusqu’a la fonctionnalisation avec la proteine, ont ete verifiees par imagerie avec le microscope a
force atomique (Figure 7.3).
Figure 7.3 – Image AFM en mode tapping a l’air pour suivre les etapes de greffage demolecules lors de la fabrication du pattern sur substrat en verre. (a-c) Image AFM suitea l’etape de deposition du fluorosilane, Zoom-in et profil en z de la ligne tracee en (b). Commeprevu la distance entre deux cercles est de 2 µm. Le PFOTCS est preferentiellement absorbeau niveau du bord des cercles, ce qui se traduit par la formation des anneaux. Il est egalementprevu d’etre absorbe partout a l’exterieur des anneaux (comme indique par les zones colores envert). A note que la couche mince en dehors des anneaux n’est pas clairement detectable ici.(d-e) Image AFM suite a l’etape du greffage du pluronic sur le fluorosilane. L’elevation relativede la hauteur de la zone a l’exterieur des anneaux (zones colorees en bleu) indique la reussite del’adsorption du pluronic. (g-i) Image AFM correspondant au greffage des proteines. L’elevationdu niveau a l’interieur des anneaux (Zone colorees en rouge) indique la presence des proteines.Le diametre de l’anneau est mesure a environ 250 nm. A note que cette mesure presente unesous-estimation de la taille des plots.
7.1.2 Transfert du pattern sur PDMS
Une couche mince uniforme d’elastomere, supportee sur une lamelle de verre plate est fabriquee
par enduction centrifuge. Un recuit du substrat est ensuite effectue a une temperature precise
pour augmenter la vitesse de la reticulation de l’elastomere. Le polydimethylsiloxane ou PDMS
181

CHAPTER 7. SUMMARY IN FRENCH
a ete choisi comme elastomere de choix.
Pour effectuer le transfert, la surface du PDMS est mise en contact physique avec la surface du
verre patternee en presence d’une goutte d’eau. En effet des etudes precedentes ont montre que
la presence de l’eau facilite le transfert [161]. Une legere pression est appliquee manuellement
pour assurer un contact conforme. Les deux surfaces sont laissees en contact pour la nuit, et
sont soigneusement separees le jour suivant. Apres separation, le pattern de proteines est bien
transfere a la surface du PDMS.
7.2 Caracterisation et mecanisme du transfert.
7.2.1 Caracterisation des substrats de PDMS
Trois differents types de PDMS ont ete utilises; le sylgard 184, le Q Gel 920 et le CY 52-276. Les
trois sont des polymeres a base de dimethylsiloxane. Le Q Gel, possede en plus des groupements
methyl-phenyles et des polymeres de phenyles. Les PDMS ont ete utilises directement apres
recuit, ou ont subi un traitement par plasma oxygene afin d’augmenter leur energie de surface et
donc, les rendre hydrophile.
Des mesures de force realisees a l’aide d’un microscope a force atomique (AFM) ont ete effectuees
afin de determiner l’elasticite des differents substrats de PDMS. Les mesures de forces montrent
une gamme d’elasticite de PDMS allant de 3 kPa a 7 MPa (Table 7.1). Des mesures d’angle de
contact ont ete aussi effectuees afin de caracteriser la surface des PDMS en termes de mouillabilite
(Tableau 7.2).
Native (kPa) Plasma Treated (kPa)Q gel (1:2) 20 ± 3 120 ± 4Sylgard (10:1) 2440 ± 500 7300 ± 900CY (1:1) 3 ± 1 260 ± 10
Table 7.1 – Elasticite des differents PDMS mesures a partir des courbes de forcesd’AFM. La valeur moyenne du module de Young (en kPa) et les ecart-type correspondants sontindiques. Au moins trois echantillons ont ete testes pour chaque type de substrat et 100 courbesont ete enregistrees a differents endroits pour chaque echantillon, en au moins 4 regions distinctesa la surface de l’echantillon et ceci dans les memes conditions.
Native Plasma treatedSylgard (10:1) 104 ± 4 3 ± 1
Q Gel (1:2) 116 ± 4 35 ± 6CY(1:1) 122 ± 3 13 ±3
Table 7.2 – Mesure de l’angle de contact de l’eau pour differents substrats de PDMSavant et apres traitement par plasma oxygene.
182

CHAPTER 7. SUMMARY IN FRENCH
7.2.2 Observation et caracterisation de pattern de BSA-biotine fluo-
rescent sur des substrats en verre ou en PDMS
Les proteines de bovine serum albumine attachees a de la biotine (bBSA), sont marquees avec du
fluorophore, le Texas Red ou l’Atto 488 (indiquees respectivement par bBSA-TR et bBSA-atto
488). Ces proteines ont ete utilisees comme proteines de choix pour la fabrication du pattern
sur substrats en verre, suivi par leur transfert sur PDMS natif ou ayant subi un traitement de
surface par plasma oxygene.
Les proteines bBSA-TR ou bBSA-Atto ont ete transferees a la surface de deux types de PDMS
differents; Sylgard 184 et Q gel 920, qui sont soit dans leur etat natif (Q Gel (20 kPa), Sylgard
(2 MPa)), ou ayant subi un traitement de surface par plasma oxygene (p Q Gel (120 kPa), p Syl-
gard (7 MPa)). Les substrats patternes ont ete images a l’aide d’un microscope a epi-fluorescence
avant et apres le transfert (Figure 7.4, 7.6 ).
Figure 7.4 – Images d’epi-fluorescence de pattern de bBSA marque soit avec TR soitavec Atto 488, sur verre et sur Sylgard ou Q Gel natif. Pattern de bBSA-Atto sur verreavant transfert (a, c), le meme pattern transfere sur Sylgard et Q gel respectivement (b, d).Pattern de bBSA-TR sur verre avant transfert (e, g), le meme pattern transfere sur Sylgard et Qgel respectivement (f, h). Les images inserees representent la transformation de Fourrier rapideindiquant l’organisation ordonnee du pattern. A noter que toutes les images ont ete prises avecle meme parametre de la camera.
L’observation des images montrent que la bBSA-Atto s’est bien transferee sur le Q Gel (Figure
7.4 d), mais pas sur le Sylgard (Figure 7.4 b). En effet, le pattern de bBSA-Atto sur Sylgard ne
peut etre detecte que par amplification des parametres de la camera (Figure 7.5). Par contre, la
bBSA-TR s’est bien transferee sur les deux PDMS (Figure 7.4 f, h). Neanmoins, les deux especes
moleculaires montrent un bon transfert sur p Sylgard et p Q gel (Figure 7.6).
183

CHAPTER 7. SUMMARY IN FRENCH
Figure 7.5 – Transfert de bBSA-Atto sur Sylgard image avec deux parametresdifferents de la camera. Avant et apres amplification des parametres de gain de la camera (a,b respectivement).
Figure 7.6 – Images d’epi-fluorescence de pattern de bBSA marque soit avec TR soitavec Atto 488, sur verre et sur Sylgard ou Q Gel traite par plasma oxygene. Patternde bBSA-Atto sur verre avant transfert (a, c), le meme pattern transfere sur p Sylgard et p Qgel respectivement (b, d). Pattern de bBSA-TR sur verre avant transfert (e, g), le meme patterntransfere sur p Sylgard et p Q gel respectivement (f, h). Les images inserees representent latransformation de Fourrier rapide indiquant l’organisation ordonnee du pattern. A noter quetous les images ont ete prises avec le meme parametre de la camera.
Les differents patterns ont ete caracterises avant et apres le transfert en termes de taille des
agregats, contraste et rapport de transfert.
Afin de determiner la taille des agregats, un agregat median est construit pour chaque type
de surface patternee. Ensuite un profil d’intensite de l’agregat median est trace. Sa taille est
determine en mesurant la largeur du pic a mi-hauteur.
Le contraste correspond a la mesure de la quantite de proteines dans un agregat, par rapport
a celle a l’exterieur de l’agregat. Il est definit par l’equation 7.1:
Contrast =Imax − IminImax + Imin
(7.1)
184
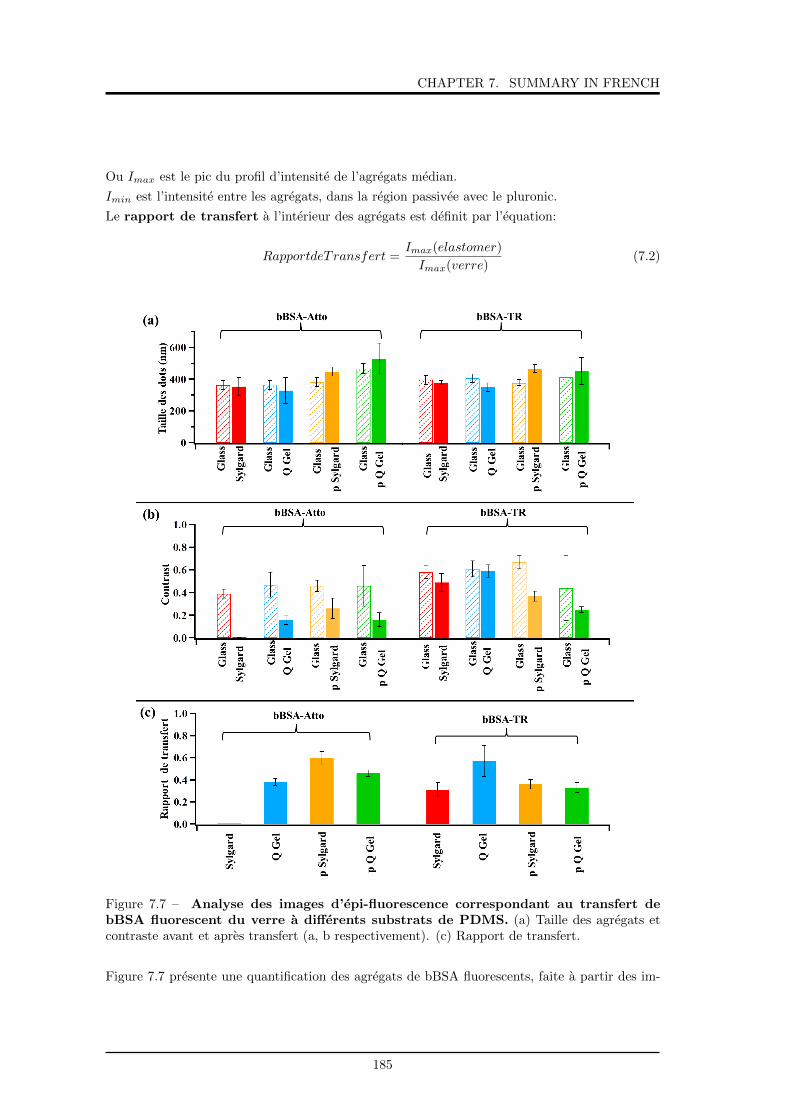
CHAPTER 7. SUMMARY IN FRENCH
Ou Imax est le pic du profil d’intensite de l’agregats median.
Imin est l’intensite entre les agregats, dans la region passivee avec le pluronic.
Le rapport de transfert a l’interieur des agregats est definit par l’equation:
RapportdeTransfert =Imax(elastomer)
Imax(verre)(7.2)
Figure 7.7 – Analyse des images d’epi-fluorescence correspondant au transfert debBSA fluorescent du verre a differents substrats de PDMS. (a) Taille des agregats etcontraste avant et apres transfert (a, b respectivement). (c) Rapport de transfert.
Figure 7.7 presente une quantification des agregats de bBSA fluorescents, faite a partir des im-
185

CHAPTER 7. SUMMARY IN FRENCH
ages d’epi-fluorescence avant et apres le transfert du verre au PDMS. Toutes les valeurs obtenues
representent une moyenne d’au moins 6 agregats medians pour chaque echantillon, obtenu sur
des endroits distincts de l’echantillon. Au moins trois echantillons differents ont ete caracterises
pour chaque cas.
On observe que la taille des agregats est pratiquement conservee avant et apres transfert
des proteines du verre au PDMS dans leurs etats natifs, que ce soit pour le Sylgard ou pour le Q
gel. Par contre une legere augmentation de la taille des dots est remarquee apres transfert sur p
Sygard et p Q Gel (T-test < 0.001) (Figure 7.7 a).
Le contraste diminue systematiquement apres le transfert que ce soit sur du PDMS natif ou
traite par plasma oxygene (Figure 7.7 b). Ceci indique que la quantite de proteines transferee
a l’interieur des agregats et differente de celle transferee a l’exterieur des agregats. Dans le cas
ideal, lors de la fabrication du pattern sur verre, il ne faudrait aucune adsorption de proteines
dans les zones passivees avec le pluronic. Dans le cas ou cela arrivent, il ne faut pas qu’ils se
transferent sur le PDMS. Ce n’est pas notre cas ici.
Les mesures de contraste confirment que le transfert a bien reussit dans tous les cas sauf dans le
cas de bBSA-Atto sur Sylgard.
Le rapport de transfert a aussi ete calcule afin de caracteriser le transfert. Des rapports vari-
ant entre 0 et 0.6 sont obtenus. Le meilleur transfert sur PDMS non traite etant pour bBSA-TR
sur Q Gel (0.6 ± 0.14), et sur PDMS traite par oxygene plasma pour bBSA-Atto sur p Sylgard
(0.6 ± 0.056). Les rapports de transfert montrent bien que la nature chimique du fluorophore
attache a la proteine, le type du PDMS, et le traitement de surface de ce dernier influent sur la
reussite du transfert.
7.2.3 Comprehension du processus de transfert
Afin de comprendre les facteurs moleculaires qui regissent le transfert, des mesures de forces par
AFM ont ete realisees. Ces mesures permettent de quantifier les forces d’adhesion et de cohesion
effectives impliquees dans le processus. Afin de pouvoir realiser ces mesures, la pointe d’AFM
a ete d’abord fonctionnalisee d’une facon covalente avec la proteine. Elle est ensuite approchee
de la surface du substrat, qui est soit une lamelle en verre propre, soit une lamelle de verre
fonctionnalisee avec la proteine, soit du PDMS natif ou traite par plasma oxygene. La pointe est
ensuite retiree loin de la surface, et les courbes de forces sont enregistrees. La courbe de recul
est analysee afin d’extraire les forces d’adhesion entre la proteine et les differents substrats, ou
les forces de cohesion proteine-proteine. Ce type de mesure a ete difficile a realiser sur du Q Gel
du fait de sa souplesse. Ainsi que les mesures sur du Sylgard natif, montrent de fortes adhesion
non specifiques avec la bille. Ces mesures n’ont donc pas ete exploitees. Alors que les mesures
realisees sur du Sylgard traite par plasma oxygene ou sur des lamelles de verre propre ont bien
ete realisees et traitees (Figure 7.8).
Le tableau 7.3 resume les forces d’adhesion des proteines avec la surface de p Sylgard (nommee
186
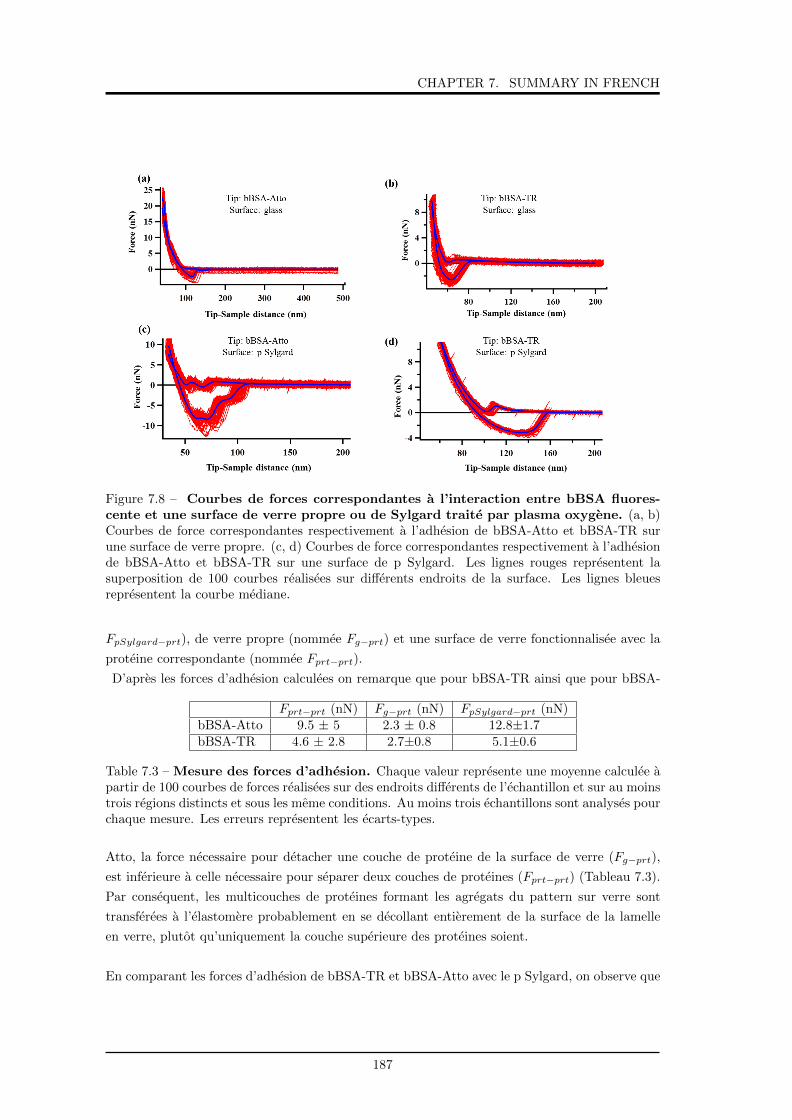
CHAPTER 7. SUMMARY IN FRENCH
Figure 7.8 – Courbes de forces correspondantes a l’interaction entre bBSA fluores-cente et une surface de verre propre ou de Sylgard traite par plasma oxygene. (a, b)Courbes de force correspondantes respectivement a l’adhesion de bBSA-Atto et bBSA-TR surune surface de verre propre. (c, d) Courbes de force correspondantes respectivement a l’adhesionde bBSA-Atto et bBSA-TR sur une surface de p Sylgard. Les lignes rouges representent lasuperposition de 100 courbes realisees sur differents endroits de la surface. Les lignes bleuesrepresentent la courbe mediane.
FpSylgard−prt), de verre propre (nommee Fg−prt) et une surface de verre fonctionnalisee avec la
proteine correspondante (nommee Fprt−prt).
D’apres les forces d’adhesion calculees on remarque que pour bBSA-TR ainsi que pour bBSA-
Fprt−prt (nN) Fg−prt (nN) FpSylgard−prt (nN)bBSA-Atto 9.5 ± 5 2.3 ± 0.8 12.8±1.7bBSA-TR 4.6 ± 2.8 2.7±0.8 5.1±0.6
Table 7.3 – Mesure des forces d’adhesion. Chaque valeur represente une moyenne calculee apartir de 100 courbes de forces realisees sur des endroits differents de l’echantillon et sur au moinstrois regions distincts et sous les meme conditions. Au moins trois echantillons sont analyses pourchaque mesure. Les erreurs representent les ecarts-types.
Atto, la force necessaire pour detacher une couche de proteine de la surface de verre (Fg−prt),
est inferieure a celle necessaire pour separer deux couches de proteines (Fprt−prt) (Tableau 7.3).
Par consequent, les multicouches de proteines formant les agregats du pattern sur verre sont
transferees a l’elastomere probablement en se decollant entierement de la surface de la lamelle
en verre, plutot qu’uniquement la couche superieure des proteines soient.
En comparant les forces d’adhesion de bBSA-TR et bBSA-Atto avec le p Sylgard, on observe que
187

CHAPTER 7. SUMMARY IN FRENCH
bBSA-Atto presente une plus forte interaction avec le p Sylgard (12.8 ± 1.7 nN pou bBSA-Atto
et 5.1 ± 0.6 pour bBSA-TR) (Table 7.3). Ceci est consistant avec le rapport de transfert plus
eleve pour ce dernier (0.6 ± 0.056 et 0.36 ± 0.042 pour bBSA-Atto et bBSA-TR respectivement).
D’apres la structure moleculaire d’Atto et de TR, nous attendons que TR soit plus hydrophobe
qu’Atto vu que ce dernier possede une charge nette negative et un groupement amine capable de
perdre un anion. Par consequence, la difference d’interaction des deux especes avec le p Sylgard
peut etre attribuee a des forces hydrophobes/hydrophiles. Ce meme raisonnement peut etre
utilise pour expliquer les autres transferts evoques dans les figures 7.4 et 7.6.
On observe que le transfert de bBSA-Atto sur Sylgard hydrophobe a echoue. Le transfert etait
trop faible et ne pouvait etre detecte que par amplification des parametres de la camera (Figure
7.5). De plus le Sylgard est connu pour avoir une legere charge negative en solution aqueuse et
a pH neutre [329], ce qui resulte en une repulsion electrostatique envers la bBSA-Atto qui elle,
possede une charge negative.
Par contre le transfert de bBSA-Atto a la surface du Q gel est reussi (rapport de transfert
= 0.38 ± 0.03). A note que ce dernier est plus hydrophobe que le Sylgard d’apres les mesures
d’angle de contact, et possede en plus, des groupements phenyles dans sa chaine. Ainsi, on peut
expliquer la reussite du transfert de bBSA-Atto sur Q gel par la formation d’interaction π-π
entre les groupements aromatiques de bBSA-Atto et les groupements phenyles du Q gel.
Dans le cas de bBSA-TR, le transfert est reussi a la fois sur Sylgard et sur Q gel, avec un rapport
de transfert plus eleve pour ce dernier (Rapport de transfert = 0.6 ± 0.14 et 0.31 ± 0.067 sur
Q gel et Sylgard respectivement). Les interactions hydrophobes jouent un role central dans le
transfert de bBSA-TR sur Sylgard et Q gel natifs. De plus, on note que TR possede plus de
groupement aromatique dans sa chaine que Atto, ce qui explique sa plus forte interaction avec
le Q gel. Ceci est aussi confirme par le rapport de transfert plus eleve pour bBSA-TR sur Q gel
(0.6 ± 0.14) que celui de bBSA-Atto (0.38 ± 0.03). Consistent avec ces resultats, la BSA non
biotinylee, et marquee avec un fluorophore hydrophile (BSA-FITC) se transfere bien a la surface
de p Sylgard avec un rapport de transfert de 0.58, par contre son transfert sur du Sylgard natif
ne reussit pas. D’autre part, la BSA non biotinylee et marquee avec TR (BSA-TR), se transfere
bien a la surface du Sylgard natif.
Nous avons aussi essaye de transferer de la bBSA non marque avec de fluorophore. Les resultats
montrent que le transfert echoue que ce soit sur le PDMS de type CY ou Q Gel. On peut alors
conclure que la bBSA expose son groupement hydrophile quand elle est adsorbee sur le verre.
Pour confirmer notre hypothese que le marquage de la proteine avec le TR comme fluorophore,
augmente la possibilite de transfert de cette derniere a la surface du PDMS hydrophobe non
traite, on a essaye de transferer la neutravidin marque avec texas red (Nav-TR). Le transfert
reussi sur les differents types de PDMS. Neanmoins, probablement a cause du sechage, on n’a
pas reussi a fonctionnalise la neutravidin transferee, avec une proteine biotinylee.
188

CHAPTER 7. SUMMARY IN FRENCH
Dans un autre ensemble d’experiences, nous avons fonctionnalise la surface du PDMS traite
par plasma oxygene avec de l’APTES ((3-aminopropyl)triethoxysilne) et de la glutaraldhehyde.
Ce traitement est connu pour rendre la surface hydrophobe et permettre des liaisons covalentes
stable avec la proteine [39] [318][319]. Le transfert de Nav-TR sur ce type de surface est bien
reussit, par contre le transfert de bBSA et du BSA-FITC est trop faible et presque inapercu.
Ceci montre que meme quand des liaisons covalentes peuvent etre formees, le transfert initial est
regi par l’affinite physico-chimique.
7.3 Cellules sur PDMS fonctionnalise d’une facon homogene
ou patterne
Il a ete montre que les cellules ont la capacite de sonder leur environnement mecanique et aussi to-
pographique. Or, la plupart des etudes faites dans ce domaine ont regarde separement l’influence
de ces facteurs sur le comportement cellulaire. Dans ce projet, nous avons choisi les lymphocytes-
T de type Jurkat afin d’etudier l’influence de ces deux facteurs sur le comportement de ces derniers
et specialement sur leur adhesion et leur activation.
Des etudes precedentes faites sur des lymphocytes-T adherentes sur une surface de verre plane,
patternee ou homogene, ont montrees que contrairement a d’autres types de cellules (par exemple
les fibroblastes), ou l’adhesion est modulee par l’espacement entre les ligands d’integrines, pour
les cellules T, elle depend de la densite moyenne globale des molecules bioactive presentes sur
la surface. Dans le cas de substrats patternes, la distribution specifique du pattern influence
fortement la distribution locale des molecules a la surface de la cellule. Vu ces decouvertes, nous
avons ete interesse par le developpement de substrats mous qui miment les proprietes mecaniques
in-vivo des interactions cellule-cellule, dans le but de voir si les resultats obtenus sur des substrats
en verre durs peuvent etre aussi appliques pour des environnements mous.
Pour cela, nous avons commence par l’etude de l’adhesion des cellules-T sur des substrats
d’elasticite controlee fonctionnalises de facon homogene avec des anticorps specifiques qui ciblent
la molecule CD3 du complexe TCR (anti-CD3). Puis, sur des substrats de PDMS mous (Q Gel
20 kPa) patternes avec ce meme anticorps.
Nos resultats sur les substrats mous homogenes ont montre que contrairement a d’autres types de
cellules, comme les fibroblastes par exemple [28], les cellules T s’etalent d’avantage sur substrats
mous (module de Young: 5, 20 ou 150 kPa) que sur substrats durs (module de Young: 2 MPa)
(Figure 7.9). En effet, nous avons vu que sur du PDMS dur, les cellules adherent a peine alors
que sur des substrats de PDMS mou, une adhesion considerable est observee. De maniere sur-
prenante, sur des substrats en verre (Module de Young: ≈ GPa), les cellules presentent aussi une
forte adhesion. Ces resultats sont en accord avec des resultats precedents qui montrent que les
cellules T sont plus activees sur du PDMS mou (100 kPa), vu qu’elle sont capables de produire
plus d’interlukin-2 [127]. Ces resultats sont aussi en accord avec ceux obtenus sur les substrats
mous patternes qui ont aussi montres une aire d’adhesion elevee pour les cellules.
189

CHAPTER 7. SUMMARY IN FRENCH
Figure 7.9 – Aire d’adhesion de cellules adherentes sur des substrats de PDMS dedifferentes elasticites. (A) Images en Bright-field (BF) et en RICM de cellules qui s’etalentsur differents substrats de PDMS d’elasticite varies. Barre d’echelle: 4 µm. (B) L’aire d’adhesionmoyen des cellules calcules a partir d’image de RICM, barre d’erreur = ecarts-type. ***: P <0.01, ** P < 0.001.
Des etudes sur la distribution de TCR et de ZAP-70 (proteine kinase qui joue un role dans la
signalisation), ainsi que sur l’organisation du cytosquelette d’actine ont ete menees. Les resultats
montrent que sur des substrats de PDMS fonctionnalises d’une facon homogene, une distribu-
tion homogene des molecules de TCR et de ZAP-70 est observee et ceci independamment de
l’elasticite du PDMS. Le cytosquelette d’actine se presente sous forme d’anneau. Ces resultats
sont en accord avec ceux obtenus pour des cellules-T qui s’etalent sur des substrats en verre
fonctionnalise d’une facon homogene.
Sur les substrats de Q gel 20 kPa patternes, on observe que le cytosquelette d’actine des cellules
conservent sa forme en anneau. Des clusters de TCR sont detectables et co-localisent partielle-
ment avec les agregats d’anti-CD3.
Dans des etudes separees des mesures de forces par AFM ont ete faites afin de mesurer l’elasticite
des cellules sur des substrats en verre ou en PDMS mou. Comme prevu, les resultats montrent
que l’elasticite des cellules sur du verre est plus elevee que celle sur PDMS. Cependant, ces
resultats n’ont pas ete concluante, parce que nous n’avons pas pu faire correctement les mesures
190

CHAPTER 7. SUMMARY IN FRENCH
Figure 7.10 – Cellules-T adherentes sur elastomere mou (Q Gel 20 kPa) patterne avecdes anticorps d’anti-CD3. Les cellules sont observees apres 30 minutes d’etalementsuivit de fixation. (a) Image en RICM montrant une topographie plane de la membranecellulaire dans la zone de contact. (b) Image en TIRF montrant une organisation en anneaudu cytosquelette d’actine. (c) Image en TIRF du TCR sur la surface de la cellule. (d) Imaged’epi-fluorescence des dots d’anti-CD3. Les fleches dans (c) et (d) indiquent une co-localisationpartielle du TCR avec les dots d’anti-CD3.
de force sur du PDMS dur, ou les cellules adherent tres faiblement.
7.4 Conclusion
Nous avons developpe dans ce projet une technique simple, facile, peu couteuse et rentable que
nous avons nomme “reverse contact printing” permettant de structurer des substrats en verre
avec des plots de proteines submicroniques et de les transferees sur des substrats d’elastomere
mou (PDMS) par un simple contact physique.
Nous avons montre que notre technique peut etre appliquee pour differents types de proteines,
y compris, la Bovine serum albumine (BSA), la biotine-BSA et la neutravidine. Nous avons
aussi montre la reussite du transfert sur differents types de PDMS (Sylgard 184, Q gel 920 et
CY52-276) d’elasticite allant de 3 kPa a 7 MPa.
Nous avons cherche a standardiser et comprendre le processus de transfert en montrant que le
greffage d’une espece moleculaire, telle qu’un fluorophore, sur la proteine a transferer, ainsi que
la nature chimique de la surface du PDMS peuvent influencer fortement le succes du transfert.
Le degre d’hydrophobicite, ainsi que la presence de groupes ioniques a la fois sur l’elastomere et
la proteine sont des facteurs moleculaires importants qui regissent le transfert.
A l’aide de mesures de forces realisees par AFM nous avons mesure l’elasticite du PDMS, ainsi
que les forces de cohesion et d’adhesion effectives impliquees dans le processus. Nous avons
identifie que la reussite du reverse contact printing technique est facilitee par le greffage de
groupes chimiques appropries sur la proteine, et depend du traitement de la surface du PDMS
ainsi que de son elasticite.
D’autres parts, nous avons etudie l’adhesion cellulaire avec des lymphocytes-T sur des surfaces
de PDMS d’elasticite variable. Nous avons montre que contrairement a la plupart d’autres types
191

CHAPTER 7. SUMMARY IN FRENCH
de cellules, les cellules-T s’etalent davantage sur substrat mou (5 et 140 kPa) que sur dur (2
MPa), sur la gamme de durete etudiee.
Finalement nous avons realise des experiences pilotes d’adhesion cellulaire sur PDMS structure,
que nous avons compare a d’autres realisees sur du verre structure et sur surfaces de PDMS
fonctionnalisees de maniere homogene.
Dans la suite, nous visons a utiliser des techniques bien adaptees dans le but de mesurer les forces
exercees par les cellules sur nos substrats.
192

Abbreviations List
µ-clusters micro-clusters
µCP Microcontact printing
Anti-CD3 Anti-cluster of differentiation 3
APC Antigen Presenting Cell
APTES (3-AminoPropyl)-TriEthoxySilane
bBSA Bovine serum albumin coupled to biotin
bBSA-Atto biotin-bovin serum albumin, Atto 488 conjugated
bBSA-TR biotin-bovin serum albumin, texas red conjugated
BCML Block Copolymer Micelles Nanolithography
BF Bright-field
BSA Bovine serum albumin
BSA-FITC Bovine serum albumin fluorescein isothiocyanate conjugated
BSA-TR Bovine serum albumin texas-red conjugated
CAMs Cell adhesion molecules
CD3 Cluster of differentiation 3
CD3 cluster of differentiation 3
CY CY 52-276 A and B
DPN Dip-pen nanolithography
ECM Extra Cellular Matrix
Glu Glutaraldhehyde
glu CY CY after curing chemically treated with a process involving glutaraldhehyde
193

CHAPTER 7. SUMMARY IN FRENCH
glu Q gel Q Gel after curing chemically treated with a process involving glutaraldhehyde
ICAM-1 Intercellular Adhesion Molecule 1
IS Immune synapse
LFA-1 Lymphocyte function-associated antigen 1
MHC Major Histocompatibility Complex
Nav Neutravidin (un-conjugated)
Nav-dylight Neutravidin dylight conjugated
Nav-FITC Neutravidin fluorescein isothiocyanate conjugated
Nav-TR Neutravidin texas-red conjugated
NIL Nanoimprint lithography
NSL Nanosphere lithography
p CY CY after curing exposed to plasma
p Q Gel Q Gel after curing exposed to plasma
p Sylgard Sylgard after curing exposed to plasma
PAA Polyacrilamide
PBS Phosphate buffer saline
PEG Polyethylene glycol
PEGPLL Polyethylene-glycol coupled to poly-L-Lysin
PEO Polyethylene oxide
PFOTCS 1H, 1H, 2H, 2H PerFluoroOctyl-TriChloroSilane
pMHC peptide MHC complex
PPO Polypropylene oxide
Q Gel Q Gel 920 A and B
RICM Reflection interference contrast microscopy
RIE Reactive ion etching
SAM Self-assembled monolayer
SLB Supported lipid bilayer
SMAC supramolecular activation cluster
194

CHAPTER 7. SUMMARY IN FRENCH
Sylgard Sylgard 184 A and B
T-Cell T lymphocytes cell
TCR T-cell receptor
TIRF-M Total internal reflection fluorescence microscopy
195

CHAPTER 7. SUMMARY IN FRENCH
196

Appendix A
Annexes
A.1 Protocols
A.1.1 PDMS Sample Preparation
In this appendix, we will be describing step by step the technique of creating PDMS layer on
clean glass substrate. It involves the following steps:
1- A plastic petri dish is placed on a digital analytical balance, and the balance is tared.
2- A certain mass of Part A (base) of the PDMS is poured in the petri dish using a plastic
pipette, the balance is tared again and another mass of the part B (current agent) is then added
to the part A using another clean plastic pipette. The mass of the A and B part depend of the
ratio A to B of the PDMS that we want to prepare (e.g. to prepare Q gel with A to B ratio =
1/2, we need for every 1 gramme of the part A, 2 grammes of the part B). This step define the
cross-linking degree.
3- The solution is mixed, in order to spread homogeneously, the curring agent in the base.
4- The bubbles formed during the mixing step, are eliminated.
This step depend on the type of the PDMS that we are preparing, in the case of Q Gel and
CY PDMS ,the petri dish filled with the mixture solution is kept for some minutes at room
temperature until the bubbles disappear. In the case of Sylgard, the sample need to be kept in
a vacuum desiccator for around 30 minutes to eliminate the bubbles.
5- At this point, the mixture is ready to use. A glass substrate cleaned using the surfactant
cleaning procedure (see section 2.1.1) is fixed on the spin coater holder (chuck) and well centered
on this holder.
6- 2 ml of the polymer mixture is dispensed in the middle of the substrate using a plastic pipette.
7- The substrate is spinned at 2000 rpm for 60s with an acceleration of 300 rpm/s.
8- The polymer solution will flows radially, owing to the action of centrifugal force, and the excess
is ejected off the edge of the substrate.
9- The substrate is cured on a hot plate for a certain time and a certain temperature depending
on the PDMS type that we are preparing (Table 2.2). Curing the substrate is not mandatory
but is required in order to decrease the polymerization time.
197

APPENDIX A. ANNEXES
198

Bibliography
[1] B. Alberts, D. Bray, K. Hopkin, A. Johnson, J. Lewis, M. Raff, K. Roberts, and P. Walter,
Essential cell biology. Garland Science, 2013.
[2] “Cell structure 1: Basics of cellular structures and functions.” http://
biologicalphysics.iop.org/cws/article/lectures/52854.
[3] G. Karp, “The structure and function of the plasma membrane,” Cell and Molecular Bi-
ology: Concepts and Experiments, 3rd edn. New York: John Wiley and Sons, pp. 122–82,
2002.
[4] R. A. Freitas, Nanomedicine, volume I: basic capabilities. Landes Bioscience Georgetown,
TX, 1999.
[5] A. Chen and V. T. Moy, “Cross-linking of cell surface receptors enhances cooperativity of
molecular adhesion,” Biophysical Journal, vol. 78, no. 6, pp. 2814–2820, 2000.
[6] S. Singer and G. L. Nicolson, “The fluid mosaic model of the structure of cell membranes,”
Membranes and Viruses in Immunopathology; Day, SB, Good, RA, Eds, pp. 7–47, 1972.
[7] “Cell membrane.” http://aisdvs.aldine.k12.tx.us/mod/book/view.php?id=179201.
[8] B. Alberts, A. Johnson, J. Lewis, M. Raff, K. Roberts, and P. Walter, “Cell junctions, cell
adhesion, and the extracellular matrix,” 2002.
[9] D. A. Fletcher and R. D. Mullins, “Cell mechanics and the cytoskeleton,” Nature, vol. 463,
no. 7280, pp. 485–492, 2010.
[10] G. Michel, T. Tonon, D. Scornet, J. M. Cock, and B. Kloareg, “The cell wall polysaccharide
metabolism of the brown alga ectocarpus siliculosus. insights into the evolution of extra-
cellular matrix polysaccharides in eukaryotes,” New Phytologist, vol. 188, no. 1, pp. 82–97,
2010.
[11] M. Abedin and N. King, “Diverse evolutionary paths to cell adhesion,” Trends in cell
biology, vol. 20, no. 12, pp. 734–742, 2010.
[12] D. S. Harburger and D. A. Calderwood, “Integrin signalling at a glance,” Journal of cell
science, vol. 122, no. 2, pp. 159–163, 2009.
199

BIBLIOGRAPHY
[13] E. A. Cavalcanti-Adam, T. Volberg, A. Micoulet, H. Kessler, B. Geiger, and J. P. Spatz,
“Cell spreading and focal adhesion dynamics are regulated by spacing of integrin ligands,”
Biophysical journal, vol. 92, no. 8, pp. 2964–2974, 2007.
[14] H. Delanoe-Ayari, J. Rieu, and M. Sano, “4d traction force microscopy reveals asymmetric
cortical forces in migrating dictyostelium cells,” Physical Review Letters, vol. 105, no. 24,
p. 248103, 2010.
[15] S. Schmidt and P. Friedl, “Interstitial cell migration: integrin-dependent and alternative
adhesion mechanisms,” Cell and tissue research, vol. 339, no. 1, pp. 83–92, 2010.
[16] W. Walz, The neuronal environment: brain homeostasis in health and disease. Springer
Science & Business Media, 2001.
[17] R. Merkel, N. Kirchgeßner, C. M. Cesa, and B. Hoffmann, “Cell force microscopy on elastic
layers of finite thickness,” Biophysical journal, vol. 93, no. 9, pp. 3314–3323, 2007.
[18] R. G. Wells, “The role of matrix stiffness in regulating cell behavior,” Hepatology, vol. 47,
no. 4, pp. 1394–1400, 2008.
[19] S. Johansson, G. Svineng, K. Wennerberg, A. Armulik, and L. Lohikangas, “Fibronectin-
integrin interactions,” Front Biosci, vol. 2, pp. d126–d146, 1997.
[20] B. Geiger, J. P. Spatz, and A. D. Bershadsky, “Environmental sensing through focal adhe-
sions,” Nature reviews Molecular cell biology, vol. 10, no. 1, pp. 21–33, 2009.
[21] M. D. Mager, V. LaPointe, and M. M. Stevens, “Exploring and exploiting chemistry at the
cell surface,” Nature Chemistry, vol. 3, no. 8, pp. 582–589, 2011.
[22] S. W. Moore, P. Roca-Cusachs, and M. P. Sheetz, “Stretchy proteins on stretchy substrates:
the important elements of integrin-mediated rigidity sensing,” Developmental cell, vol. 19,
no. 2, pp. 194–206, 2010.
[23] A. A. Khalili and M. R. Ahmad, “A review of cell adhesion studies for biomedical and bio-
logical applications,” International journal of molecular sciences, vol. 16, no. 8, pp. 18149–
18184, 2015.
[24] J. H. Lee and H. B. Lee, “A wettability gradient as a tool to study protein adsorption
and cell adhesion on polymer surfaces,” Journal of Biomaterials Science, Polymer Edition,
vol. 4, no. 5, pp. 467–481, 1993.
[25] G. Maheshwari, A. Wells, L. G. Griffith, and D. A. Lauffenburger, “Biophysical integration
of effects of epidermal growth factor and fibronectin on fibroblast migration,” Biophysical
Journal, vol. 76, no. 5, pp. 2814–2823, 1999.
[26] A. Curtis, B. Casey, J. Gallagher, D. Pasqui, M. Wood, and C. Wilkinson, “Substratum
nanotopography and the adhesion of biological cells. are symmetry or regularity of nanoto-
pography important?,” Biophysical chemistry, vol. 94, no. 3, pp. 275–283, 2001.
200
BIBLIOGRAPHY
[27] K. Anselme, “Osteoblast adhesion on biomaterials,” Biomaterials, vol. 21, no. 7, pp. 667–
681, 2000.
[28] J. Solon, I. Levental, K. Sengupta, P. C. Georges, and P. A. Janmey, “Fibroblast adaptation
and stiffness matching to soft elastic substrates,” Biophysical journal, vol. 93, no. 12,
pp. 4453–4461, 2007.
[29] L.-C. Xu and C. A. Siedlecki, “Effects of surface wettability and contact time on protein
adhesion to biomaterial surfaces,” Biomaterials, vol. 28, no. 22, pp. 3273–3283, 2007.
[30] A. Sethuraman, M. Han, R. S. Kane, and G. Belfort, “Effect of surface wettability on the
adhesion of proteins,” Langmuir, vol. 20, no. 18, pp. 7779–7788, 2004.
[31] G. Altankov and T. Groth, “Reorganization of substratum-bound fibronectin on hy-
drophilic and hydrophobic materials is related to biocompatibility,” Journal of Materials
Science: Materials in Medicine, vol. 5, no. 9-10, pp. 732–737, 1994.
[32] C. A. Haynes and W. Norde, “Globular proteins at solid/liquid interfaces,” Colloids and
Surfaces B: Biointerfaces, vol. 2, no. 6, pp. 517–566, 1994.
[33] M. S. Wang, L. B. Palmer, J. D. Schwartz, and A. Razatos, “Evaluating protein attraction
and adhesion to biomaterials with the atomic force microscope,” Langmuir, vol. 20, no. 18,
pp. 7753–7759, 2004.
[34] J. M. Dechene, Surface Modifications of Poly (dimethylsiloxane) for Biological Application
of Microfluidic Devices. PhD thesis, The University of Western Ontario, 2010.
[35] K. B. McClary, T. Ugarova, and D. W. Grainger, “Modulating fibroblast adhesion, spread-
ing, and proliferation using self-assembled monolayer films of alkylthiolates on gold,” Jour-
nal of biomedical materials research, vol. 50, no. 3, pp. 428–439, 2000.
[36] C. C. Barrias, M. C. L. Martins, G. Almeida-Porada, M. A. Barbosa, and P. L. Granja,
“The correlation between the adsorption of adhesive proteins and cell behaviour on
hydroxyl-methyl mixed self-assembled monolayers,” Biomaterials, vol. 30, no. 3, pp. 307–
316, 2009.
[37] Y.-W. Wang, Q. Wu, and G.-Q. Chen, “Reduced mouse fibroblast cell growth by increased
hydrophilicity of microbial polyhydroxyalkanoates via hyaluronan coating,” Biomaterials,
vol. 24, no. 25, pp. 4621–4629, 2003.
[38] D. P. Dowling, I. S. Miller, M. Ardhaoui, and W. M. Gallagher, “Effect of surface wettability
and topography on the adhesion of osteosarcoma cells on plasma-modified polystyrene,”
Journal of biomaterials applications, 2010.
[39] S. Kuddannaya, Y. J. Chuah, M. H. A. Lee, N. V. Menon, Y. Kang, and Y. Zhang,
“Surface chemical modification of poly (dimethylsiloxane) for the enhanced adhesion and
proliferation of mesenchymal stem cells,” ACS applied materials & interfaces, vol. 5, no. 19,
pp. 9777–9784, 2013.
201

BIBLIOGRAPHY
[40] B. A. Dalton, C. D. McFarland, T. R. Gengenbach, H. J. Griesser, and J. G. Steele,
“Polymer surface chemistry and bone cell migration,” Journal of Biomaterials Science,
Polymer Edition, vol. 9, no. 8, pp. 781–799, 1998.
[41] Z. Yang, J. A. Galloway, and H. Yu, “Protein interactions with poly (ethylene glycol) self-
assembled monolayers on glass substrates: diffusion and adsorption,” Langmuir, vol. 15,
no. 24, pp. 8405–8411, 1999.
[42] E. Tziampazis, J. Kohn, and P. V. Moghe, “Peg-variant biomaterials as selectively adhesive
protein templates: model surfaces for controlled cell adhesion and migration,” Biomaterials,
vol. 21, no. 5, pp. 511–520, 2000.
[43] D. D. Deligianni, N. D. Katsala, P. G. Koutsoukos, and Y. F. Missirlis, “Effect of surface
roughness of hydroxyapatite on human bone marrow cell adhesion, proliferation, differen-
tiation and detachment strength,” Biomaterials, vol. 22, no. 1, pp. 87–96, 2000.
[44] B. D. Boyan, T. W. Hummert, D. D. Dean, and Z. Schwartz, “Role of material surfaces
in regulating bone and cartilage cell response,” Biomaterials, vol. 17, no. 2, pp. 137–146,
1996.
[45] K. C. Dee, D. A. Puleo, and R. Bizios, An introduction to tissue-biomaterial interactions.
John Wiley & Sons, 2003.
[46] E. C. Martınez, J. C. R. Hernandez, M. Machado, J. F. Mano, J. L. G. Ribelles, M. M.
Pradas, and M. S. Sanchez, “Human chondrocyte morphology, its dedifferentiation, and
fibronectin conformation on different plla microtopographies,” Tissue Engineering Part A,
vol. 14, no. 10, pp. 1751–1762, 2008.
[47] K. Hatano, H. Inoue, T. Kojo, T. Matsunaga, T. Tsujisawa, C. Uchiyama, and Y. Uchida,
“Effect of surface roughness on proliferation and alkaline phosphatase expression of rat
calvarial cells cultured on polystyrene,” Bone, vol. 25, no. 4, pp. 439–445, 1999.
[48] J. Y. Lim, J. C. Hansen, C. A. Siedlecki, J. Runt, and H. J. Donahue, “Human foetal
osteoblastic cell response to polymer-demixed nanotopographic interfaces,” Journal of the
Royal Society Interface, vol. 2, no. 2, pp. 97–108, 2005.
[49] J. Martin, Z. Schwartz, T. Hummert, D. Schraub, J. Simpson, J. Lankford, D. Dean,
D. Cochran, and B. Boyan, “Effect of titanium surface roughness on proliferation, differen-
tiation, and protein synthesis of human osteoblast-like cells (mg63),” Journal of biomedical
materials research, vol. 29, no. 3, pp. 389–401, 1995.
[50] K. Anselme, P. Linez, M. Bigerelle, D. Le Maguer, A. Le Maguer, P. Hardouin, H. Hilde-
brand, A. Iost, and J. Leroy, “The relative influence of the topography and chemistry of
tial6v4 surfaces on osteoblastic cell behaviour,” Biomaterials, vol. 21, no. 15, pp. 1567–
1577, 2000.
202

BIBLIOGRAPHY
[51] M. Arnold, E. A. Cavalcanti-Adam, R. Glass, J. Blummel, W. Eck, M. Kantlehner,
H. Kessler, and J. P. Spatz, “Activation of integrin function by nanopatterned adhesive
interfaces,” ChemPhysChem, vol. 5, no. 3, pp. 383–388, 2004.
[52] A. Curtis and C. Wilkinson, “Topographical control of cells,” Biomaterials, vol. 18, no. 24,
pp. 1573–1583, 1997.
[53] C. S. Chen, M. Mrksich, S. Huang, G. M. Whitesides, and D. E. Ingber, “Geometric control
of cell life and death,” Science, vol. 276, no. 5317, pp. 1425–1428, 1997.
[54] M. Arnold, M. Schwieder, J. Blummel, E. A. Cavalcanti-Adam, M. Lopez-Garcia,
H. Kessler, B. Geiger, and J. P. Spatz, “Cell interactions with hierarchically structured
nano-patterned adhesive surfaces,” Soft Matter, vol. 5, no. 1, pp. 72–77, 2009.
[55] M. Thery, “Micropatterning as a tool to decipher cell morphogenesis and functions,” J Cell
Sci, vol. 123, no. 24, pp. 4201–4213, 2010.
[56] M. Thery, V. Racine, A. Pepin, M. Piel, Y. Chen, J.-B. Sibarita, and M. Bornens, “The
extracellular matrix guides the orientation of the cell division axis,” Nature cell biology,
vol. 7, no. 10, pp. 947–953, 2005.
[57] M. Thery, A. Jimenez-Dalmaroni, V. Racine, M. Bornens, and F. Julicher, “Experimental
and theoretical study of mitotic spindle orientation,” Nature, vol. 447, no. 7143, pp. 493–
496, 2007.
[58] M. Bailly, L. Yan, G. M. Whitesides, J. S. Condeelis, and J. E. Segall, “Regulation of pro-
trusion shape and adhesion to the substratum during chemotactic responses of mammalian
carcinoma cells,” Experimental cell research, vol. 241, no. 2, pp. 285–299, 1998.
[59] R. Glass, M. Moller, and J. P. Spatz, “Block copolymer micelle nanolithography,” Nan-
otechnology, vol. 14, no. 10, p. 1153, 2003.
[60] C. Selhuber-Unkel, T. Erdmann, M. Lopez-Garcia, H. Kessler, U. Schwarz, and J. Spatz,
“Cell adhesion strength is controlled by intermolecular spacing of adhesion receptors,”
Biophysical Journal, vol. 98, no. 4, pp. 543–551, 2010.
[61] M. S. Niepel, B. Fuhrmann, H. S. Leipner, and T. Groth, “Nanoscaled surface patterns
influence adhesion and growth of human dermal fibroblasts,” Langmuir, vol. 29, no. 43,
pp. 13278–13290, 2013.
[62] B. N. Mason, J. P. Califano, and C. A. Reinhart-King, “Matrix stiffness: A regulator
of cellular behavior and tissue formation,” in Engineering Biomaterials for Regenerative
Medicine, pp. 19–37, Springer, 2012.
[63] P. A. Janmey, J. P. Winer, M. E. Murray, and Q. Wen, “The hard life of soft cells,” Cell
motility and the cytoskeleton, vol. 66, no. 8, pp. 597–605, 2009.
203

BIBLIOGRAPHY
[64] V. Vogel and M. Sheetz, “Local force and geometry sensing regulate cell functions,” Nature
reviews Molecular cell biology, vol. 7, no. 4, pp. 265–275, 2006.
[65] D. Ingber, “Mechanobiology and diseases of mechanotransduction,” Annals of medicine,
vol. 35, no. 8, pp. 564–577, 2003.
[66] R. J. Pelham and Y.-l. Wang, “Cell locomotion and focal adhesions are regulated by
substrate flexibility,” Proceedings of the National Academy of Sciences, vol. 94, no. 25,
pp. 13661–13665, 1997.
[67] A. K. Harris, P. Wild, D. Stopak, et al., “Silicone rubber substrata: a new wrinkle in the
study of cell locomotion,” Science, vol. 208, no. 4440, pp. 177–179, 1980.
[68] U. S. Schwarz and J. R. Soine, “Traction force microscopy on soft elastic substrates: a
guide to recent computational advances,” Biochimica et Biophysica Acta (BBA)-Molecular
Cell Research, vol. 1853, no. 11, pp. 3095–3104, 2015.
[69] M. Dembo, T. Oliver, A. Ishihara, and K. Jacobson, “Imaging the traction stresses exerted
by locomoting cells with the elastic substratum method,” Biophysical journal, vol. 70, no. 4,
pp. 2008–2022, 1996.
[70] M. Dembo and Y.-L. Wang, “Stresses at the cell-to-substrate interface during locomotion
of fibroblasts,” Biophysical journal, vol. 76, no. 4, pp. 2307–2316, 1999.
[71] C. M. Cesa, N. Kirchgeßner, D. Mayer, U. S. Schwarz, B. Hoffmann, and R. Merkel,
“Micropatterned silicone elastomer substrates for high resolution analysis of cellular force
patterns,” Review of scientific instruments, vol. 78, no. 3, p. 034301, 2007.
[72] J. R. Soine, N. Hersch, G. Dreissen, N. Hampe, B. Hoffmann, R. Merkel, and U. S.
Schwarz, “Measuring cellular traction forces on non-planar substrates,” arXiv preprint
arXiv:1605.08373, 2016.
[73] N. Q. Balaban, U. S. Schwarz, D. Riveline, P. Goichberg, G. Tzur, I. Sabanay, D. Mahalu,
S. Safran, A. Bershadsky, L. Addadi, et al., “Force and focal adhesion assembly: a close
relationship studied using elastic micropatterned substrates,” Nature cell biology, vol. 3,
no. 5, pp. 466–472, 2001.
[74] N. J. Sniadecki and C. S. Chen, “Microfabricated silicone elastomeric post arrays for mea-
suring traction forces of adherent cells,” Methods in cell biology, vol. 83, pp. 313–328, 2007.
[75] S. Ghassemi, G. Meacci, S. Liu, A. A. Gondarenko, A. Mathur, P. Roca-Cusachs, M. P.
Sheetz, and J. Hone, “Cells test substrate rigidity by local contractions on submicrometer
pillars,” Proceedings of the National Academy of Sciences, vol. 109, no. 14, pp. 5328–5333,
2012.
[76] O. Du Roure, A. Saez, A. Buguin, R. H. Austin, P. Chavrier, P. Siberzan, and B. Ladoux,
“Force mapping in epithelial cell migration,” Proceedings of the National Academy of Sci-
ences of the United States of America, vol. 102, no. 7, pp. 2390–2395, 2005.
204

BIBLIOGRAPHY
[77] L. Trichet, J. Le Digabel, R. J. Hawkins, S. R. K. Vedula, M. Gupta, C. Ribrault, P. Hersen,
R. Voituriez, and B. Ladoux, “Evidence of a large-scale mechanosensing mechanism for
cellular adaptation to substrate stiffness,” Proceedings of the National Academy of Sciences,
vol. 109, no. 18, pp. 6933–6938, 2012.
[78] R. De, A. Zemel, and S. A. Safran, “Do cells sense stress or strain? measurement of cellular
orientation can provide a clue,” Biophysical journal, vol. 94, no. 5, pp. L29–L31, 2008.
[79] A. K. Yip, K. Iwasaki, C. Ursekar, H. Machiyama, M. Saxena, H. Chen, I. Harada, K.-H.
Chiam, and Y. Sawada, “Cellular response to substrate rigidity is governed by either stress
or strain,” Biophysical journal, vol. 104, no. 1, pp. 19–29, 2013.
[80] K. A. Jansen, D. M. Donato, H. E. Balcioglu, T. Schmidt, E. H. Danen, and G. H. Koen-
derink, “A guide to mechanobiology: where biology and physics meet,” Biochimica et
Biophysica Acta (BBA)-Molecular Cell Research, vol. 1853, no. 11, pp. 3043–3052, 2015.
[81] B. Trappmann, J. E. Gautrot, J. T. Connelly, D. G. Strange, Y. Li, M. L. Oyen, M. A. C.
Stuart, H. Boehm, B. Li, V. Vogel, et al., “Extracellular-matrix tethering regulates stem-
cell fate,” Nature materials, vol. 11, no. 7, pp. 642–649, 2012.
[82] A. Buxboim, K. Rajagopal, B. Andre’EX, and D. E. Discher, “How deeply cells feel:
methods for thin gels,” Journal of Physics: Condensed Matter, vol. 22, no. 19, p. 194116,
2010.
[83] A. J. Engler, S. Sen, H. L. Sweeney, and D. E. Discher, “Matrix elasticity directs stem cell
lineage specification,” Cell, vol. 126, no. 4, pp. 677–689, 2006.
[84] C. Yang, M. W. Tibbitt, L. Basta, and K. S. Anseth, “Mechanical memory and dosing
influence stem cell fate,” Nature materials, vol. 13, no. 6, p. 645, 2014.
[85] D. Missirlis and J. P. Spatz, “Combined effects of peg hydrogel elasticity and cell-adhesive
coating on fibroblast adhesion and persistent migration,” Biomacromolecules, vol. 15, no. 1,
pp. 195–205, 2013.
[86] I. Levental, P. C. Georges, and P. A. Janmey, “Soft biological materials and their impact
on cell function,” Soft Matter, vol. 3, no. 3, pp. 299–306, 2007.
[87] A. J. Engler, M. A. Griffin, S. Sen, C. G. Bonnemann, H. L. Sweeney, and D. E. Discher,
“Myotubes differentiate optimally on substrates with tissue-like stiffness pathological im-
plications for soft or stiff microenvironments,” The Journal of cell biology, vol. 166, no. 6,
pp. 877–887, 2004.
[88] A. J. Engler, C. Carag-Krieger, C. P. Johnson, M. Raab, H.-Y. Tang, D. W. Speicher,
J. W. Sanger, J. M. Sanger, and D. E. Discher, “Embryonic cardiomyocytes beat best on a
matrix with heart-like elasticity: scar-like rigidity inhibits beating,” Journal of cell science,
vol. 121, no. 22, pp. 3794–3802, 2008.
205

BIBLIOGRAPHY
[89] M. R. Ng and J. S. Brugge, “A stiff blow from the stroma: collagen crosslinking drives
tumor progression,” Cancer cell, vol. 16, no. 6, pp. 455–457, 2009.
[90] R. G. Wells, “Cellular sources of extracellular matrix in hepatic fibrosis,” Clinics in liver
disease, vol. 12, no. 4, pp. 759–768, 2008.
[91] C. A. Janeway, P. Travers, M. Walport, and M. J. Shlomchik, Immunobiology: the immune
system in health and disease, vol. 1. Current Biology, 1997.
[92] K. D. Elgert, Immunology: understanding the immune system. John Wiley & Sons, 2009.
[93] B. H. Rimawi, “Infectious comorbidities encountered in obstetrics and neonatology,”
OMICS Group eBooks. Foster city, California, USA, 2014.
[94] R. Clark and T. Kupper, “Old meets new: the interaction between innate and adaptive
immunity,” Journal of investigative dermatology, vol. 125, no. 4, pp. 629–637, 2005.
[95] J. Sprent, “Antigen-presenting cells: professionals and amateurs,” Current Biology, vol. 5,
no. 10, pp. 1095–1097, 1995.
[96] T. Kambayashi and T. M. Laufer, “Atypical mhc class ii-expressing antigen-presenting
cells: can anything replace a dendritic cell?,” Nature Reviews Immunology, vol. 14, no. 11,
pp. 719–730, 2014.
[97] M. O. Butler and N. Hirano, “Human cell-based artificial antigen-presenting cells for cancer
immunotherapy,” Immunological reviews, vol. 257, no. 1, pp. 191–209, 2014.
[98] L. J. Eggermont, L. E. Paulis, J. Tel, and C. G. Figdor, “Towards efficient cancer im-
munotherapy: advances in developing artificial antigen-presenting cells,” Trends in biotech-
nology, vol. 32, no. 9, pp. 456–465, 2014.
[99] “Immune system.” http://slideplayer.com/slide/10780579/. Accessed june 5, 2016.
[100] X. Lu, J. S. Gibbs, H. D. Hickman, A. David, B. P. Dolan, Y. Jin, D. M. Kranz, J. R.
Bennink, J. W. Yewdell, and R. Varma, “Endogenous viral antigen processing generates
peptide-specific mhc class i cell-surface clusters,” Proceedings of the National Academy of
Sciences, vol. 109, no. 38, pp. 15407–15412, 2012.
[101] M. Ferez, M. Castro, B. Alarcon, and H. M. van Santen, “Cognate peptide–mhc complexes
are expressed as tightly apposed nanoclusters in virus-infected cells to allow tcr crosslink-
ing,” The Journal of Immunology, vol. 192, no. 1, pp. 52–58, 2014.
[102] K. P. Menard, Dynamic mechanical analysis: a practical introduction. CRC press, 2008.
[103] N. Bufi, M. Saitakis, S. Dogniaux, O. Buschinger, A. Bohineust, A. Richert, M. Mau-
rin, C. Hivroz, and A. Asnacios, “Human primary immune cells exhibit distinct mechan-
ical properties that are modified by inflammation,” Biophysical journal, vol. 108, no. 9,
pp. 2181–2190, 2015.
206

BIBLIOGRAPHY
[104] “T-cells.” https://www.studyblue.com/notes/note/n/exam-1-tables-and-diagrams/
deck/3727242. Accessed june 5, 2016.
[105] M. J. Miller, A. S. Hejazi, S. H. Wei, M. D. Cahalan, and I. Parker, “T cell repertoire
scanning is promoted by dynamic dendritic cell behavior and random t cell motility in
the lymph node,” Proceedings of the National Academy of Sciences of the United States of
America, vol. 101, no. 4, pp. 998–1003, 2004.
[106] J. Delon and R. N. Germain, “Information transfer at the immunological synapse,” Current
Biology, vol. 10, no. 24, pp. R923–R933, 2000.
[107] D. R. Fooksman, S. Vardhana, G. Vasiliver-Shamis, J. Liese, D. Blair, J. Waite, C. Sac-
ristan, G. Victora, A. Zanin-Zhorov, and M. L. Dustin, “Functional anatomy of t cell
activation and synapse formation,” Annual review of immunology, vol. 28, p. 79, 2010.
[108] A. Grakoui, S. K. Bromley, C. Sumen, M. M. Davis, A. S. Shaw, P. M. Allen, and M. L.
Dustin, “The immunological synapse: a molecular machine controlling t cell activation,”
Science, vol. 285, no. 5425, pp. 221–227, 1999.
[109] M. L. Dustin and J. T. Groves, “Receptor signaling clusters in the immune synapse,”
Annual review of biophysics, vol. 41, p. 543, 2012.
[110] C. P. Semba and T. R. Gadek, “Development of lifitegrast: a novel t-cell inhibitor for the
treatment of dry eye disease,” Clinical Ophthalmology (Auckland, NZ), vol. 10, p. 1083,
2016.
[111] M. Norcross, “A synaptic basis for t-lymphocyte activation,” in Annales de l’Institut Pas-
teur/Immunologie, vol. 135, pp. 113–134, Elsevier, 1984.
[112] C. R. Monks, B. A. Freiberg, H. Kupfer, N. Sciaky, and A. Kupfer, “Three-dimensional
segregation of supramolecular activation clusters in t cells,” Nature, vol. 395, no. 6697,
pp. 82–86, 1998.
[113] P. Dillard, R. Varma, K. Sengupta, and L. Limozin, “Ligand-mediated friction determines
morphodynamics of spreading t cells,” Biophysical journal, vol. 107, no. 11, pp. 2629–2638,
2014.
[114] J. T. Groves, N. Ulman, and S. G. Boxer, “Micropatterning fluid lipid bilayers on solid
supports,” Science, vol. 275, no. 5300, pp. 651–653, 1997.
[115] K. D. Mossman, G. Campi, J. T. Groves, and M. L. Dustin, “Altered tcr signaling from
geometrically repatterned immunological synapses,” Science, vol. 310, no. 5751, pp. 1191–
1193, 2005.
[116] G. Campi, R. Varma, and M. L. Dustin, “Actin and agonist mhc–peptide complex–
dependent t cell receptor microclusters as scaffolds for signaling,” The Journal of experi-
mental medicine, vol. 202, no. 8, pp. 1031–1036, 2005.
207

BIBLIOGRAPHY
[117] Y. Kaizuka, A. D. Douglass, R. Varma, M. L. Dustin, and R. D. Vale, “Mechanisms for
segregating t cell receptor and adhesion molecules during immunological synapse forma-
tion in jurkat t cells,” Proceedings of the National Academy of Sciences, vol. 104, no. 51,
pp. 20296–20301, 2007.
[118] R. Varma, G. Campi, T. Yokosuka, T. Saito, and M. L. Dustin, “T cell receptor-proximal
signals are sustained in peripheral microclusters and terminated in the central supramolec-
ular activation cluster,” Immunity, vol. 25, no. 1, pp. 117–127, 2006.
[119] T. Yokosuka, K. Sakata-Sogawa, W. Kobayashi, M. Hiroshima, A. Hashimoto-Tane,
M. Tokunaga, M. L. Dustin, and T. Saito, “Newly generated t cell receptor microclus-
ters initiate and sustain t cell activation by recruitment of zap70 and slp-76,” Nature
immunology, vol. 6, no. 12, pp. 1253–1262, 2005.
[120] S. C. Bunnell, “Multiple microclusters: diverse compartments within the immune synapse,”
in Immunological Synapse, pp. 123–154, Springer, 2010.
[121] K. Beck-Garcıa, E. Beck-Garcıa, S. Bohler, C. Zorzin, E. Sezgin, I. Levental, B. Alarcon,
and W. W. Schamel, “Nanoclusters of the resting t cell antigen receptor (tcr) localize
to non-raft domains,” Biochimica et Biophysica Acta (BBA)-Molecular Cell Research,
vol. 1853, no. 4, pp. 802–809, 2015.
[122] T. J. Crites, K. Padhan, J. Muller, M. Krogsgaard, P. R. Gudla, S. J. Lockett, and
R. Varma, “Tcr microclusters pre-exist and contain molecules necessary for tcr signal trans-
duction,” The Journal of Immunology, vol. 193, no. 1, pp. 56–67, 2014.
[123] P. Dillard, F. Pi, A. C. Lellouch, L. Limozin, and K. Sengupta, “Nano-clustering of ligands
on surrogate antigen presenting cells modulates t cell membrane adhesion and organiza-
tion,” Integrative Biology, vol. 8, no. 3, pp. 287–301, 2016.
[124] J. Deeg, M. Axmann, J. Matic, A. Liapis, D. Depoil, J. Afrose, S. Curado, M. L. Dustin,
and J. P. Spatz, “T cell activation is determined by the number of presented antigens,”
Nano letters, vol. 13, no. 11, pp. 5619–5626, 2013.
[125] J. Matic, J. Deeg, A. Scheffold, I. Goldstein, and J. P. Spatz, “Fine tuning and efficient t cell
activation with stimulatory acd3 nanoarrays,” Nano letters, vol. 13, no. 11, pp. 5090–5097,
2013.
[126] E. Judokusumo, E. Tabdanov, S. Kumari, M. L. Dustin, and L. C. Kam, “Mechanosensing
in t lymphocyte activation,” Biophysical journal, vol. 102, no. 2, pp. L5–L7, 2012.
[127] R. S. O’Connor, X. Hao, K. Shen, K. Bashour, T. Akimova, W. W. Hancock, L. C. Kam,
and M. C. Milone, “Substrate rigidity regulates human t cell activation and proliferation,”
The Journal of Immunology, vol. 189, no. 3, pp. 1330–1339, 2012.
[128] K. T. Bashour, A. Gondarenko, H. Chen, K. Shen, X. Liu, M. Huse, J. C. Hone, and L. C.
Kam, “Cd28 and cd3 have complementary roles in t-cell traction forces,” Proceedings of
the National Academy of Sciences, vol. 111, no. 6, pp. 2241–2246, 2014.
208

BIBLIOGRAPHY
[129] K. L. Hui, L. Balagopalan, L. E. Samelson, and A. Upadhyaya, “Cytoskeletal forces during
signaling activation in jurkat t-cells,” Molecular biology of the cell, vol. 26, no. 4, pp. 685–
695, 2015.
[130] H. Chen, L. Yuan, W. Song, Z. Wu, and D. Li, “Biocompatible polymer materials: role of
protein–surface interactions,” Progress in Polymer Science, vol. 33, no. 11, pp. 1059–1087,
2008.
[131] E. A. Vogler, “Protein adsorption in three dimensions,” Biomaterials, vol. 33, no. 5,
pp. 1201–1237, 2012.
[132] G. M. Whitesides, E. Ostuni, S. Takayama, X. Jiang, and D. E. Ingber, “Soft lithography in
biology and biochemistry,” Annual review of biomedical engineering, vol. 3, no. 1, pp. 335–
373, 2001.
[133] S. A. Ruiz and C. S. Chen, “Microcontact printing: a tool to pattern,” Soft Matter, vol. 3,
no. 2, pp. 168–177, 2007.
[134] J. J. Moon, B. Huang, and D. J. Irvine, “Engineering nano-and microparticles to tune
immunity,” Advanced materials, vol. 24, no. 28, pp. 3724–3746, 2012.
[135] I. Platzman, K. M. Gadomska, J.-W. Janiesch, I. Louban, E. A. Cavalcanti-Adam, and J. P.
Spatz, “Soft/elastic nanopatterned biointerfaces in the service of cell biology.,” Methods in
cell biology, vol. 119, pp. 237–260, 2013.
[136] A. Biswas, I. S. Bayer, A. S. Biris, T. Wang, E. Dervishi, and F. Faupel, “Advances
in top–down and bottom–up surface nanofabrication: Techniques, applications & future
prospects,” Advances in colloid and interface science, vol. 170, no. 1, pp. 2–27, 2012.
[137] D. Falconnet, G. Csucs, H. M. Grandin, and M. Textor, “Surface engineering approaches to
micropattern surfaces for cell-based assays,” Biomaterials, vol. 27, no. 16, pp. 3044–3063,
2006.
[138] L. Filipponi, D. Sutherland, and I. N. Center, “Nanoyou teachers training kit in nanotech-
nologies,” European Commision Document, Denmark, 2010.
[139] P. Rodgers, “Nanofabrication: Top down, bottom up,” Nature Nanotechnology, DOI,
vol. 10, 2006.
[140] M. J. P. Roldan, Chemical patterning of surfaces for the development of biofunctional
interfaces. PhD thesis, Universidad Autonoma de Madrid, 2011.
[141] “Photolithography.” http://cnx.org/contents/KZdIG-zX@2/
Composition-and-Photochemical-. Accessed August 19, 2016.
[142] B. Spargo, M. Testoff, T. Nielsen, D. Stenger, J. Hickman, and A. Rudolph, “Spatially
controlled adhesion, spreading, and differentiation of endothelial cells on self-assembled
molecular monolayers,” Proceedings of the National Academy of Sciences, vol. 91, no. 23,
pp. 11070–11074, 1994.
209

BIBLIOGRAPHY
[143] S. K. Bhatia, J. J. Hickman, and F. S. Ligler, “New approach to producing patterned
biomolecular assemblies,” Journal of the American Chemical Society, vol. 114, no. 11,
pp. 4432–4433, 1992.
[144] T. Matsuda, K. Inoue, and N. Tani, “Control of cell arrangement,” Apr. 13 1993. US
Patent 5,202,227.
[145] M. Veiseh, B. T. Wickes, D. G. Castner, and M. Zhang, “Guided cell patterning on gold–
silicon dioxide substrates by surface molecular engineering,” Biomaterials, vol. 25, no. 16,
pp. 3315–3324, 2004.
[146] F. Yap and Y. Zhang, “Protein and cell micropatterning and its integration with mi-
cro/nanoparticles assembly,” Biosensors and Bioelectronics, vol. 22, no. 6, pp. 775–788,
2007.
[147] G. M. Whitesides and A. D. Stroock, “Flexible methods for microfluidics,” Phys. Today,
vol. 54, no. 6, pp. 42–48, 2001.
[148] H. Schmid and B. Michel, “Siloxane polymers for high-resolution, high-accuracy soft lithog-
raphy,” Macromolecules, vol. 33, no. 8, pp. 3042–3049, 2000.
[149] T. W. Odom, J. C. Love, D. B. Wolfe, K. E. Paul, and G. M. Whitesides, “Improved
pattern transfer in soft lithography using composite stamps,” Langmuir, vol. 18, no. 13,
pp. 5314–5320, 2002.
[150] X. Jiang, S. Takayama, R. G. Chapman, R. S. Kane, and G. M. Whitesides, “Micro-scale
patterning of cells and their environment,” 2007.
[151] A. Bernard, J. P. Renault, B. Michel, H. R. Bosshard, E. Delamarche, et al., “Microcontact
printing of proteins,” Advanced Materials, vol. 12, no. 14, pp. 1067–1070, 2000.
[152] Y. Xia and G. M. Whitesides, “Soft lithography,” Annual review of materials science,
vol. 28, no. 1, pp. 153–184, 1998.
[153] A. Kumar and G. M. Whitesides, “Features of gold having micrometer to centimeter di-
mensions can be formed through a combination of stamping with an elastomeric stamp and
an alkanethiol “ink”followed by chemical etching,” Applied Physics Letters, vol. 63, no. 14,
pp. 2002–2004, 1993.
[154] M. Mrksich and G. M. Whitesides, “Patterning self-assembled monolayers using microcon-
tact printing: a new technology for biosensors?,” Trends in biotechnology, vol. 13, no. 6,
pp. 228–235, 1995.
[155] M. Geissler, A. Bernard, A. Bietsch, H. Schmid, B. Michel, and E. Delamarche,
“Microcontact-printing chemical patterns with flat stamps,” Journal of the American
Chemical Society, vol. 122, no. 26, pp. 6303–6304, 2000.
210

BIBLIOGRAPHY
[156] L. Filipponi, P. Livingston, O. Kaspar, V. Tokarova, and D. V. Nicolau, “Protein patterning
by microcontact printing using pyramidal pdms stamps,” Biomedical microdevices, vol. 18,
no. 1, pp. 1–7, 2016.
[157] N. Hampe, T. Jonas, B. Wolters, N. Hersch, B. Hoffmann, and R. Merkel, “Defined 2-d
microtissues on soft elastomeric silicone rubber using lift-off epoxy-membranes for biome-
chanical analyses,” Soft matter, vol. 10, no. 14, pp. 2431–2443, 2014.
[158] A. Perl, D. N. Reinhoudt, and J. Huskens, “Microcontact printing: limitations and achieve-
ments,” Advanced Materials, vol. 21, no. 22, pp. 2257–2268, 2009.
[159] X. Yan, J. Yao, G. Lu, X. Chen, K. Zhang, and B. Yang, “Microcontact printing of colloidal
crystals,” Journal of the American Chemical Society, vol. 126, no. 34, pp. 10510–10511,
2004.
[160] D. Trimbach, K. Feldman, N. D. Spencer, D. J. Broer, and C. W. Bastiaansen, “Block
copolymer thermoplastic elastomers for microcontact printing,” Langmuir, vol. 19, no. 26,
pp. 10957–10961, 2003.
[161] S. G. Ricoult, A. Sanati Nezhad, M. Knapp-Mohammady, T. E. Kennedy, and D. Juncker,
“Humidified microcontact printing of proteins: universal patterning of proteins on both
low and high energy surfaces,” Langmuir, vol. 30, no. 40, pp. 12002–12010, 2014.
[162] P. C. Hidber, W. Helbig, E. Kim, and G. M. Whitesides, “Microcontact printing of pal-
ladium colloids: micron-scale patterning by electroless deposition of copper,” Langmuir,
vol. 12, no. 5, pp. 1375–1380, 1996.
[163] M. Gai, J. Frueh, A. Girard-Egrot, S. Rebaud, B. Doumeche, and Q. He, “Micro-contact
printing of pem thin films: effect of line tension and surface energies,” RSC Advances,
vol. 5, no. 64, pp. 51891–51899, 2015.
[164] A. Alexanian, A. Yeremyan, and G. Pluzian, “Possibility of self-induced transparency in
multi-layer semiconductor heterostructure placed in a quantizing magnetic field,” Interna-
tional Journal of Infrared and Millimeter Waves, vol. 21, no. 11, pp. 1851–1857, 2000.
[165] Z. Wang, Development of microcontact printing techniques for fabricating functional mi-
cropatterns and microparticles for biomedical applications. PhD thesis, THE FLORIDA
STATE UNIVERSITY, 2015.
[166] S. Bhatia, U. Balis, M. Yarmush, and M. Toner, “Effect of cell–cell interactions in preser-
vation of cellular phenotype: cocultivation of hepatocytes and nonparenchymal cells,” The
FASEB Journal, vol. 13, no. 14, pp. 1883–1900, 1999.
[167] H.-D. Kim and S. R. Peyton, “Bio-inspired materials for parsing matrix physicochemical
control of cell migration: a review,” Integrative biology, vol. 4, no. 1, pp. 37–52, 2012.
211

BIBLIOGRAPHY
[168] C. S. Chen, M. Mrksich, S. Huang, G. M. Whitesides, and D. E. Ingber, “Micropatterned
surfaces for control of cell shape, position, and function,” Biotechnology progress, vol. 14,
no. 3, pp. 356–363, 1998.
[169] A. Bernard, E. Delamarche, H. Schmid, B. Michel, H. R. Bosshard, and H. Biebuyck,
“Printing patterns of proteins,” Langmuir, vol. 14, no. 9, pp. 2225–2229, 1998.
[170] J. Renault, A. Bernard, A. Bietsch, B. Michel, H. Bosshard, E. Delamarche, M. Kreiter,
B. Hecht, and U. Wild, “Fabricating arrays of single protein molecules on glass using
microcontact printing,” The Journal of Physical Chemistry B, vol. 107, no. 3, pp. 703–711,
2003.
[171] J. L. Tan, J. Tien, and C. S. Chen, “Microcontact printing of proteins on mixed self-
assembled monolayers,” Langmuir, vol. 18, no. 2, pp. 519–523, 2002.
[172] R. S. Kane, S. Takayama, E. Ostuni, D. E. Ingber, and G. M. Whitesides, “Patterning
proteins and cells using soft lithography,” Biomaterials, vol. 20, no. 23, pp. 2363–2376,
1999.
[173] Y. Chen and A. Pepin, “Emerging nanolithographic methods,” in Nanoscience, pp. 157–
175, Springer, 2007.
[174] B. Michel, A. Bernard, A. Bietsch, E. Delamarche, M. Geissler, D. Juncker, H. Kind, J.-P.
Renault, H. Rothuizen, H. Schmid, et al., “Printing meets lithography: soft approaches
to high-resolution patterning,” IBM Journal of Research and Development, vol. 45, no. 5,
pp. 697–719, 2001.
[175] A. Cerf, X. Dollat, J. Chalmeau, A. Coutable, and C. Vieu, “A versatile method for
generating single dna molecule patterns: Through the combination of directed capillary as-
sembly and (micro/nano) contact printing,” Journal of Materials Research, vol. 26, no. 02,
pp. 336–346, 2011.
[176] S. G. Ricoult, M. Pla-Roca, R. Safavieh, G. M. Lopez-Ayon, P. Grutter, T. E. Kennedy,
and D. Juncker, “Large dynamic range digital nanodot gradients of biomolecules made by
low-cost nanocontact printing for cell haptotaxis,” Small, vol. 9, no. 19, pp. 3308–3313,
2013.
[177] H. Tran, K. L. Killops, and L. M. Campos, “Advancements and challenges of patterning
biomolecules with sub-50 nm features,” Soft Matter, vol. 9, no. 29, pp. 6578–6586, 2013.
[178] J. C. Love, L. A. Estroff, J. K. Kriebel, R. G. Nuzzo, and G. M. Whitesides, “Self-assembled
monolayers of thiolates on metals as a form of nanotechnology,” Chemical reviews, vol. 105,
no. 4, pp. 1103–1170, 2005.
[179] F. Schreiber, “Structure and growth of self-assembling monolayers,” Progress in surface
science, vol. 65, no. 5, pp. 151–257, 2000.
212

BIBLIOGRAPHY
[180] P. E. Laibinis, G. M. Whitesides, D. L. Allara, Y. T. Tao, A. N. Parikh, and R. G.
Nuzzo, “Comparison of the structures and wetting properties of self-assembled monolayers
of n-alkanethiols on the coinage metal surfaces, copper, silver, and gold,” Journal of the
American Chemical Society, vol. 113, no. 19, pp. 7152–7167, 1991.
[181] A. Ulman, “Formation and structure of self-assembled monolayers,” Chemical reviews,
vol. 96, no. 4, pp. 1533–1554, 1996.
[182] Y. Arima and H. Iwata, “Effect of wettability and surface functional groups on protein
adsorption and cell adhesion using well-defined mixed self-assembled monolayers,” Bioma-
terials, vol. 28, no. 20, pp. 3074–3082, 2007.
[183] S. Y. Chou, P. R. Krauss, and P. J. Renstrom, “Nanoimprint lithography,” Journal of
Vacuum Science & Technology B, vol. 14, no. 6, pp. 4129–4133, 1996.
[184] F. Hua, Y. Sun, A. Gaur, M. A. Meitl, L. Bilhaut, L. Rotkina, J. Wang, P. Geil, M. Shim,
J. A. Rogers, et al., “Polymer imprint lithography with molecular-scale resolution,” Nano
letters, vol. 4, no. 12, pp. 2467–2471, 2004.
[185] L. J. Guo, “Recent progress in nanoimprint technology and its applications,” Journal of
Physics D: Applied Physics, vol. 37, no. 11, p. R123, 2004.
[186] M. Schvartzman, M. Palma, J. Sable, J. Abramson, X. Hu, M. P. Sheetz, and S. J. Wind,
“Nanolithographic control of the spatial organization of cellular adhesion receptors at the
single-molecule level,” Nano letters, vol. 11, no. 3, pp. 1306–1312, 2011.
[187] M. Schvartzman, K. Nguyen, M. Palma, J. Abramson, J. Sable, J. Hone, M. Sheetz, and
S. Wind, “Fabrication of nanoscale bioarrays for the study of cytoskeletal protein binding
interactions using nanoimprint lithography,” Journal of Vacuum Science & Technology B,
vol. 27, no. 1, pp. 61–65, 2009.
[188] R. D. Piner, J. Zhu, F. Xu, S. Hong, and C. A. Mirkin, “” dip-pen” nanolithography,”
science, vol. 283, no. 5402, pp. 661–663, 1999.
[189] F. Huo, Z. Zheng, G. Zheng, L. R. Giam, H. Zhang, and C. A. Mirkin, “Polymer pen
lithography,” Science, vol. 321, no. 5896, pp. 1658–1660, 2008.
[190] K.-B. Lee, S.-J. Park, C. A. Mirkin, J. C. Smith, and M. Mrksich, “Protein nanoarrays
generated by dip-pen nanolithography,” Science, vol. 295, no. 5560, pp. 1702–1705, 2002.
[191] S.-W. Chung, D. S. Ginger, M. W. Morales, Z. Zhang, V. Chandrasekhar, M. A. Ratner,
and C. A. Mirkin, “Top-down meets bottom-up: Dip-pen nanolithography and dna-directed
assembly of nanoscale electrical circuits,” small, vol. 1, no. 1, pp. 64–69, 2005.
[192] R. Sistiabudi and A. Ivanisevic, “Dip-pen nanolithography of bioactive peptides on
collagen-terminated retinal membrane,” Advanced Materials, vol. 20, no. 19, pp. 3678–
3681, 2008.
213

BIBLIOGRAPHY
[193] S. Rozhok, C. K.-F. Shen, P.-L. H. Littler, Z. Fan, C. Liu, C. A. Mirkin, and R. C. Holz,
“Methods for fabricating microarrays of motile bacteria,” Small, vol. 1, no. 4, pp. 445–451,
2005.
[194] A. Pimpin and W. Srituravanich, “Review on micro-and nanolithography techniques and
their applications,” Engineering Journal, vol. 16, no. 1, pp. 37–56, 2011.
[195] J.-R. Li, L. Shi, Z. Deng, S. H. Lo, and G.-y. Liu, “Nanostructures of designed geometry
and functionality enable regulation of cellular signaling processes,” Biochemistry, vol. 51,
no. 30, pp. 5876–5893, 2012.
[196] Z. Deng, I.-C. Weng, J.-R. Li, H.-Y. Chen, F.-T. Liu, and G.-y. Liu, “Engineered nanos-
tructures of antigen provide an effective means for regulating mast cell activation,” ACS
nano, vol. 5, no. 11, pp. 8672–8683, 2011.
[197] A. Pulsipher and M. N. Yousaf, “Surface chemistry and cell biological tools for the analysis
of cell adhesion and migration,” ChemBioChem, vol. 11, no. 6, pp. 745–753, 2010.
[198] J. P. Spatz, “Nano-and micropatterning by organic–inorganic templating of hierarchical
self-assembled structures,” Angewandte Chemie International Edition, vol. 41, no. 18,
pp. 3359–3362, 2002.
[199] M. Park, C. Harrison, P. M. Chaikin, R. A. Register, and D. H. Adamson, “Block copolymer
lithography: periodic arrays of˜ 1011 holes in 1 square centimeter,” Science, vol. 276,
no. 5317, pp. 1401–1404, 1997.
[200] G. Kastle, H.-G. Boyen, F. Weigl, G. Lengl, T. Herzog, P. Ziemann, S. Riethmuller,
O. Mayer, C. Hartmann, J. P. Spatz, et al., “Micellar nanoreactors—preparation and
characterization of hexagonally ordered arrays of metallic nanodots,” Advanced Functional
Materials, vol. 13, no. 11, pp. 853–861, 2003.
[201] R. Glass, M. Arnold, J. Bluemmel, A. Kueller, M. Moeller, and J. P. Spatz, “Micro-
nanostructured interfaces fabricated by the use of inorganic block copolymer micellar mono-
layers as negative resist for electron-beam lithography,” Advanced Functional Materials,
vol. 13, no. 7, pp. 569–575, 2003.
[202] J. P. Spatz, A. Roescher, S. Sheiko, G. Krausch, and M. Moller, “Noble metal loaded block
lonomers: micelle organization, adsorption of free chains and formation of thin films,”
Advanced Materials, vol. 7, no. 8, pp. 731–735, 1995.
[203] T. Lohmueller, E. Bock, and J. P. Spatz, “Synthesis of quasi-hexagonal ordered arrays of
metallic nanoparticles with tuneable particle size,” Advanced Materials, vol. 20, no. 12,
pp. 2297–2302, 2008.
[204] J. P. Spatz, S. Mossmer, C. Hartmann, M. Moller, T. Herzog, M. Krieger, H.-G. Boyen,
P. Ziemann, and B. Kabius, “Ordered deposition of inorganic clusters from micellar block
copolymer films,” Langmuir, vol. 16, no. 2, pp. 407–415, 2000.
214

BIBLIOGRAPHY
[205] Y. Cao, R. Jin, and C. A. Mirkin, “Dna-modified core-shell ag/au nanoparticles,” Journal
of the American Chemical Society, vol. 123, no. 32, pp. 7961–7962, 2001.
[206] M. Arnold, V. C. Hirschfeld-Warneken, T. Lohmuuller, P. Heil, J. Bluummel, E. A.
Cavalcanti-Adam, M. Lopez-Garcıa, P. Walther, H. Kessler, B. Geiger, et al., “Induc-
tion of cell polarization and migration by a gradient of nanoscale variations in adhesive
ligand spacing,” Nano letters, vol. 8, no. 7, pp. 2063–2069, 2008.
[207] L. Purwaningsih, “Fabrication of nano-structured materials and their applications,” tech.
rep., Lehrstuhl fur Textilchemie und Makromolekulare Chemie, 2011.
[208] S. V. Graeter, J. Huang, N. Perschmann, M. Lopez-Garcıa, H. Kessler, J. Ding, and J. P.
Spatz, “Mimicking cellular environments by nanostructured soft interfaces,” Nano letters,
vol. 7, no. 5, pp. 1413–1418, 2007.
[209] D. Aydin, I. Louban, N. Perschmann, J. Blummel, T. Lohmuller, E. A. Cavalcanti-Adam,
T. L. Haas, H. Walczak, H. Kessler, R. Fiammengo, et al., “Polymeric substrates with tun-
able elasticity and nanoscopically controlled biomolecule presentation,” Langmuir, vol. 26,
no. 19, pp. 15472–15480, 2010.
[210] H. Deckman and J. Dunsmuir, “Natural lithography,” Applied Physics Letters, vol. 41,
no. 4, pp. 377–379, 1982.
[211] S.-M. Yang, S. G. Jang, D.-G. Choi, S. Kim, and H. K. Yu, “Nanomachining by colloidal
lithography,” small, vol. 2, no. 4, pp. 458–475, 2006.
[212] A. Kosiorek, W. Kandulski, H. Glaczynska, and M. Giersig, “Fabrication of nanoscale rings,
dots, and rods by combining shadow nanosphere lithography and annealed polystyrene
nanosphere masks,” Small, vol. 1, no. 4, pp. 439–444, 2005.
[213] U. C. Fischer and H. Zingsheim, “Submicroscopic pattern replication with visible light,”
Journal of Vacuum Science & Technology, vol. 19, no. 4, pp. 881–885, 1981.
[214] P. Colson, C. Henrist, and R. Cloots, “Nanosphere lithography: a powerful method for the
controlled manufacturing of nanomaterials,” Journal of Nanomaterials, vol. 2013, p. 21,
2013.
[215] F. Pi, P. Dillard, L. Limozin, A. Charrier, and K. Sengupta, “Nanometric protein-patch
arrays on glass and polydimethylsiloxane for cell adhesion studies,” Nano letters, vol. 13,
no. 7, pp. 3372–3378, 2013.
[216] Z. R. Taylor, J. C. Keay, E. S. Sanchez, M. B. Johnson, and D. W. Schmidtke, “Indepen-
dently controlling protein dot size and spacing in particle lithography,” Langmuir, vol. 28,
no. 25, pp. 9656–9663, 2012.
[217] O. Wichterle and D. Lim, “Hydrophilic gels for biological use,” 1960.
215

BIBLIOGRAPHY
[218] N. Peppas, P. Bures, W. Leobandung, and H. Ichikawa, “Hydrogels in pharmaceutical
formulations,” European journal of pharmaceutics and biopharmaceutics, vol. 50, no. 1,
pp. 27–46, 2000.
[219] P. H. Corkhill, C. J. Hamilton, and B. J. Tighe, “Synthetic hydrogels vi. hydrogel com-
posites as wound dressings and implant materials,” Biomaterials, vol. 10, no. 1, pp. 3–10,
1989.
[220] K. Y. Lee and D. J. Mooney, “Hydrogels for tissue engineering,” Chemical reviews, vol. 101,
no. 7, pp. 1869–1880, 2001.
[221] K. N. Plunkett and J. S. Moore, “Patterned dual ph-responsive core-shell hydrogels with
controllable swelling kinetics and volumes,” Langmuir, vol. 20, no. 16, pp. 6535–6537, 2004.
[222] X. Chen, B. Martin, T. Neubauer, R. Linhardt, J. Dordick, and D. Rethwisch, “Enzymatic
and chemoenzymatic approaches to synthesis of sugar-based polymer and hydrogels,” Car-
bohydrate Polymers, vol. 28, no. 1, pp. 15–21, 1995.
[223] S. W. Kim, Y. H. Bae, and T. Okano, “Hydrogels: swelling, drug loading, and release,”
Pharmaceutical Research, vol. 9, no. 3, pp. 283–290, 1992.
[224] S. L. Bennett, D. A. Melanson, D. F. Torchiana, D. M. Wiseman, and A. S. Sawhney, “Next-
generation hydrogel films as tissue sealants and adhesion barriers,” Journal of cardiac
surgery, vol. 18, no. 6, pp. 494–499, 2003.
[225] V. Compan, A. Andrio, A. Lopez-Alemany, E. Riande, and M. Refojo, “Oxygen permeabil-
ity of hydrogel contact lenses with organosilicon moieties,” Biomaterials, vol. 23, no. 13,
pp. 2767–2772, 2002.
[226] S. R. Caliari and J. A. Burdick, “A practical guide to hydrogels for cell culture,” Nature
methods, vol. 13, no. 5, pp. 405–414, 2016.
[227] Y.-L. Wang and R. J. Pelham, “Preparation of a flexible, porous polyacrylamide substrate
for mechanical studies of cultured cells,” Methods in enzymology, vol. 298, pp. 489–496,
1998.
[228] F. Chowdhury, Y. Li, Y.-C. Poh, T. Yokohama-Tamaki, N. Wang, and T. S. Tanaka, “Soft
substrates promote homogeneous self-renewal of embryonic stem cells via downregulating
cell-matrix tractions,” PloS one, vol. 5, no. 12, p. e15655, 2010.
[229] O. Shebanova and D. A. Hammer, “Biochemical and mechanical extracellular matrix prop-
erties dictate mammary epithelial cell motility and assembly,” Biotechnology journal, vol. 7,
no. 3, pp. 397–408, 2012.
[230] K. A. Beningo, C.-M. Lo, and Y.-L. Wang, “Flexible polyacrylamide substrata for the
analysis of mechanical interactions at cell-substratum adhesions,” Methods in cell biology,
vol. 69, pp. 325–339, 2002.
216

BIBLIOGRAPHY
[231] N. J. Sniadecki, A. Anguelouch, M. T. Yang, C. M. Lamb, Z. Liu, S. B. Kirschner, Y. Liu,
D. H. Reich, and C. S. Chen, “Magnetic microposts as an approach to apply forces to living
cells,” Proceedings of the National Academy of Sciences, vol. 104, no. 37, pp. 14553–14558,
2007.
[232] A. Saez, A. Buguin, P. Silberzan, and B. Ladoux, “Is the mechanical activity of epithelial
cells controlled by deformations or forces?,” Biophysical journal, vol. 89, no. 6, pp. L52–L54,
2005.
[233] Y. Zhao and X. Zhang, “Adaptation of flexible polymer fabrication to cellular mechanics
study,” Applied Physics Letters, vol. 87, no. 14, p. 144101, 2005.
[234] B. G. Ricart, M. T. Yang, C. A. Hunter, C. S. Chen, and D. A. Hammer, “Measuring
traction forces of motile dendritic cells on micropost arrays,” Biophysical journal, vol. 101,
no. 11, pp. 2620–2628, 2011.
[235] E. K. Yim, R. M. Reano, S. W. Pang, A. F. Yee, C. S. Chen, and K. W. Leong,
“Nanopattern-induced changes in morphology and motility of smooth muscle cells,” Bio-
materials, vol. 26, no. 26, pp. 5405–5413, 2005.
[236] M. Murrell, R. Kamm, and P. Matsudaira, “Substrate viscosity enhances correlation in
epithelial sheet movement,” Biophysical journal, vol. 101, no. 2, pp. 297–306, 2011.
[237] H.-j. Song, G.-l. Ming, and M.-m. Poo, “camp-induced switching in turning direction of
nerve growth cones,” Nature, vol. 388, no. 6639, pp. 275–279, 1997.
[238] A. Folch, A. Ayon, O. Hurtado, M. Schmidt, and M. Toner, “Molding of deep polydimethyl-
siloxane microstructures for microfluidics and biological applications,” Journal of Biome-
chanical Engineering, vol. 121, no. 1, pp. 28–34, 1999.
[239] J. C. McDonald, M. L. Chabinyc, S. J. Metallo, J. R. Anderson, A. D. Stroock, and
G. M. Whitesides, “Prototyping of microfluidic devices in poly (dimethylsiloxane) using
solid-object printing,” Analytical chemistry, vol. 74, no. 7, pp. 1537–1545, 2002.
[240] L. Malaquin, F. Carcenac, C. Vieu, and M. Mauzac, “Using polydimethylsiloxane as a
thermocurable resist for a soft imprint lithography process,” Microelectronic engineering,
vol. 61, pp. 379–384, 2002.
[241] J. Zhou, A. V. Ellis, and N. H. Voelcker, “Recent developments in pdms surface modifica-
tion for microfluidic devices,” Electrophoresis, vol. 31, no. 1, pp. 2–16, 2010.
[242] J. Li, M. Wang, and Y. Shen, “Chemical modification on top of nanotopography to enhance
surface properties of pdms,” Surface and Coatings Technology, vol. 206, no. 8, pp. 2161–
2167, 2012.
[243] J. C. McDonald and G. M. Whitesides, “Poly (dimethylsiloxane) as a material for fabri-
cating microfluidic devices,” Accounts of chemical research, vol. 35, no. 7, pp. 491–499,
2002.
217
BIBLIOGRAPHY
[244] I. Wong and C.-M. Ho, “Surface molecular property modifications for poly (dimethyl-
siloxane)(pdms) based microfluidic devices,” Microfluidics and nanofluidics, vol. 7, no. 3,
pp. 291–306, 2009.
[245] R. D. Lovchik, H. Wolf, and E. Delamarche, “High-grade optical polydimethylsiloxane for
microfluidic applications,” Biomedical microdevices, vol. 13, no. 6, pp. 1027–1032, 2011.
[246] M. C. Jo and R. Guldiken, “Effects of polydimethylsiloxane (pdms) microchannels on
surface acoustic wave-based microfluidic devices,” Microelectronic Engineering, vol. 113,
pp. 98–104, 2014.
[247] A. Tserepi, E. Gogolides, K. Tsougeni, V. Constantoudis, and E. S. Valamontes, “Tailoring
the surface topography and wetting properties of oxygen-plasma treated polydimethylsilox-
ane,” Journal of applied physics, vol. 98, no. 11, p. 113502, 2005.
[248] D. C. Duffy, J. C. McDonald, O. J. Schueller, and G. M. Whitesides, “Rapid prototyping
of microfluidic systems in poly (dimethylsiloxane),” Analytical chemistry, vol. 70, no. 23,
pp. 4974–4984, 1998.
[249] J. Lahann, M. Balcells, H. Lu, T. Rodon, K. F. Jensen, and R. Langer, “Reactive poly-
mer coatings: a first step toward surface engineering of microfluidic devices,” Analytical
chemistry, vol. 75, no. 9, pp. 2117–2122, 2003.
[250] H. Makamba, J. H. Kim, K. Lim, N. Park, and J. H. Hahn, “Surface modification of poly
(dimethylsiloxane) microchannels,” Electrophoresis, vol. 24, no. 21, pp. 3607–3619, 2003.
[251] K. Ye, X. Wang, L. Cao, S. Li, Z. Li, L. Yu, and J. Ding, “Matrix stiffness and nanoscale
spatial organization of cell-adhesive ligands direct stem cell fate,” Nano letters, vol. 15,
no. 7, pp. 4720–4729, 2015.
[252] P. Liu, J. Sun, J. Huang, R. Peng, J. Tang, and J. Ding, “Fabrication of micropatterns of
nanoarrays on a polymeric gel surface,” Nanoscale, vol. 2, no. 1, pp. 122–127, 2010.
[253] F. Pi, P. Dillard, R. Alameddine, E. Benard, A. Wahl, I. Ozerov, A. Charrier, L. Limozin,
and K. Sengupta, “Size-tunable organic nanodot arrays: A versatile platform for manipu-
lating and imaging cells,” Nano letters, vol. 15, no. 8, pp. 5178–5184, 2015.
[254] “Silane chemistry.” http://www.dowcorning.com/content/discover/discoverchem/
silanes.aspx/. Accessed june 5, 2016.
[255] J. R. Cox, L. A. Ferris, and V. R. Thalladi, “Selective growth of a stable drug polymorph by
suppressing the nucleation of corresponding metastable polymorphs,” Angewandte Chemie
International Edition, vol. 46, no. 23, pp. 4333–4336, 2007.
[256] N. S. K. Gunda, M. Singh, L. Norman, K. Kaur, and S. K. Mitra, “Optimization and char-
acterization of biomolecule immobilization on silicon substrates using (3-aminopropyl) tri-
ethoxysilane (aptes) and glutaraldehyde linker,” Applied Surface Science, vol. 305, pp. 522–
530, 2014.
218
BIBLIOGRAPHY
[257] “siloxane.” https://en.wikipedia.org/wiki/Siloxane.
[258] A. Colas, “Silicones: Preparation, properties and performance,” Dow Corning, Life Sci-
ences, 2005.
[259] A. Colas and J. Curtis, “Silicone biomaterials: history and chemistry,” Biomaterials sci-
ence: An introduction to materials in medicine, vol. 2, pp. 80–85, 2004.
[260] F. Wisser, B. Schumm, G. Mondin, J. Grothe, and S. Kaskel, “Precursor strategies for
metallic nano-and micropatterns using soft lithography,” Journal of Materials Chemistry
C, vol. 3, no. 12, pp. 2717–2731, 2015.
[261] D. B. Hall, P. Underhill, and J. M. Torkelson, “Spin coating of thin and ultrathin polymer
films,” Polymer Engineering & Science, vol. 38, no. 12, pp. 2039–2045, 1998.
[262] L. Nguyen, M. Hang, W. Wang, Y. Tian, L. Wang, T. J. McCarthy, and W. Chen, “Simple
and improved approaches to long-lasting, hydrophilic silicones derived from commercially
available precursors,” ACS applied materials & interfaces, vol. 6, no. 24, pp. 22876–22883,
2014.
[263] “Silicone materials for optical applications.” http://www.dowcorning.com.cn/zh_CN/
content/publishedlit/75-1007-01_single.pdf. Accessed july 10, 2016.
[264] E. Gutierrez, E. Tkachenko, A. Besser, P. Sundd, K. Ley, G. Danuser, M. H. Ginsberg, and
A. Groisman, “High refractive index silicone gels for simultaneous total internal reflection
fluorescence and traction force microscopy of adherent cells,” PLoS One, vol. 6, no. 9,
p. e23807, 2011.
[265] “Dow corning cy52-276, product inormation..” http://DOW_CORNING_ELECTRONICS_FT_
CY52-276%20(2).pdf.
[266] Y. Iwadate and S. Yumura, “Molecular dynamics and forces of a motile cell simultaneously
visualized by tirf and force microscopies,” Biotechniques, vol. 44, no. 6, pp. 739–50, 2008.
[267] “Sylgard 184 silicone elastomer.” http://www.dowcorning.com/DataFiles/
090276fe80190b08.pdf. Accessed september 11, 2016.
[268] http://www.quantumsilicones.com/wp-content/uploads/2012/02/QGel-9204.pdf.
[269] http://www.dowcorning.com/applications/search/default.aspx?R=1709EN.
[270] S. H. Tan, N.-T. Nguyen, Y. C. Chua, and T. G. Kang, “Oxygen plasma treatment for
reducing hydrophobicity of a sealed polydimethylsiloxane microchannel,” Biomicrofluidics,
vol. 4, no. 3, p. 032204, 2010.
[271] M. Morra, E. Occhiello, R. Marola, F. Garbassi, P. Humphrey, and D. Johnson, “On the
aging of oxygen plasma-treated polydimethylsiloxane surfaces,” Journal of Colloid and
Interface Science, vol. 137, no. 1, pp. 11–24, 1990.
219
BIBLIOGRAPHY
[272] A. Toth, I. Bertoti, M. Blazso, G. Banhegyi, A. Bognar, and P. Szaplonczay, “Oxidative
damage and recovery of silicone rubber surfaces. i. x-ray photoelectron spectroscopic study,”
Journal of applied polymer science, vol. 52, no. 9, pp. 1293–1307, 1994.
[273] J. J. Escobar-Chavez, M. Lopez-Cervantes, A. Naik, Y. Kalia, D. Quintanar-Guerrero,
and A. Ganem-Quintanar, “Applications of thermo-reversible pluronic f-127 gels in phar-
maceutical formulations,” Journal of Pharmacy & Pharmaceutical Sciences, vol. 9, no. 3,
pp. 339–58, 2006.
[274] D. R. Devi, P. Sandhya, and B. V. Hari, “Poloxamer: A novel functional molecule for drug
delivery and gene therapy,” J. Pharm. Sci. Res, vol. 5, pp. 159–165, 2013.
[275] C.-Z. Sun, C.-T. Lu, Y.-Z. Zhao, P. Guo, J.-L. Tian, L. Zhang, X.-K. Li, H.-F. Lv, D.-
D. Dai, and X. Li, “Characterization of the doxorubicin-pluronic f68 conjugate micelles
and their effect on doxorubicin resistant human erythroleukemic cancer cells,” Journal of
Nanomedicine & Nanotechnology, vol. 2011, 2012.
[276] P. Dillard, Impact de la presentation des ligands sur la biophysique de l’adhesion des lym-
phocytes T. PhD thesis, Aix-Marseille, 2014.
[277] “Principles of fluorescence.” http://www.blizard.qmul.ac.uk/flow-cytometry/
what-is-flow-cytometry/principles-of-fluorescence.html.
[278] “Fluorescent labels and dyes.” http://www.atto-tec.com/index.php?id=222&L=1.
[279] “Primary antibody fluorescent conjugates.” https://www.biomol.com/
primary-antibody-conjugates.html?id=1288.
[280] “Texas reds.” https://fr.wikipedia.org/wiki/Texas_Red.
[281] “Fluorescein.” http://www.wikiwand.com/en/Fluorescein.
[282] “Amine-reactive crosslinker chemistry.” https://www.thermofisher.com/fr/
fr/home/life-science/protein-biology/protein-biology-learning-center/
protein-biology-resource-library/pierce-protein-methods/
amine-reactive-crosslinker-chemistry.html.
[283] “Fluorecent labelling of proteins..” http://www.sigmaaldrich.com/life-science/learning-
center/biofiles/biofiles-5-2/protein-labeling.html.
[284] G. Binnig, C. F. Quate, and C. Gerber, “Atomic force microscope,” Physical review letters,
vol. 56, no. 9, p. 930, 1986.
[285] G. Binnig, H. Rohrer, C. Gerber, and E. Weibel, “Tunneling through a controllable vacuum
gap,” Applied Physics Letters, vol. 40, no. 2, pp. 178–180, 1982.
[286] J. A. Last, P. Russell, P. F. Nealey, and C. J. Murphy, “The applications of atomic force
microscopy to vision science,” Investigative ophthalmology & visual science, vol. 51, no. 12,
pp. 6083–6094, 2010.
220

BIBLIOGRAPHY
[287] “Atomic force microscopy..” http://lnf-wiki.eecs.umich.edu/wiki/Atomic_force_
microscopy.
[288] F. L. Leite, C. C. Bueno, A. L. Da Roz, E. C. Ziemath, and O. N. Oliveira, “Theo-
retical models for surface forces and adhesion and their measurement using atomic force
microscopy,” International journal of molecular sciences, vol. 13, no. 10, pp. 12773–12856,
2012.
[289] H.-J. Butt and M. Jaschke, “Calculation of thermal noise in atomic force microscopy,”
Nanotechnology, vol. 6, no. 1, p. 1, 1995.
[290] C. A. Clifford and M. P. Seah, “The determination of atomic force microscope cantilever
spring constants via dimensional methods for nanomechanical analysis,” Nanotechnology,
vol. 16, no. 9, p. 1666, 2005.
[291] J. Cleveland, S. Manne, D. Bocek, and P. Hansma, “A nondestructive method for determin-
ing the spring constant of cantilevers for scanning force microscopy,” Review of Scientific
Instruments, vol. 64, no. 2, pp. 403–405, 1993.
[292] A. Torii, M. Sasaki, K. Hane, and S. Okuma, “A method for determining the spring constant
of cantilevers for atomic force microscopy,” Measurement Science and Technology, vol. 7,
no. 2, p. 179, 1996.
[293] H.-J. Butt, B. Cappella, and M. Kappl, “Force measurements with the atomic force micro-
scope: Technique, interpretation and applications,” Surface science reports, vol. 59, no. 1,
pp. 1–152, 2005.
[294] “Summary note: Force spectroscopy measurement and processing..” file:///C:/Users/
rara/Downloads/jpk-note-force-spectroscopy%20(3).pdf.
[295] J. F. G. Martınez, I. Nieto-Carvajal, and J. Colchero, “Calibration of oscillation amplitude
in dynamic scanning force microscopy,” Nanotechnology, vol. 24, no. 18, p. 185701, 2013.
[296] J. J Roa, G. Oncins, J. Diaz, F. Sanz, and M. Segarra, “Calculation of young’s modulus
value by means of afm,” Recent patents on nanotechnology, vol. 5, no. 1, pp. 27–36, 2011.
[297] H. Hertz, “On the contact of elastic solids,” J. reine angew. Math, vol. 92, no. 110, pp. 156–
171, 1881.
[298] F. Variola, “Atomic force microscopy in biomaterials surface science,” Physical Chemistry
Chemical Physics, vol. 17, no. 5, pp. 2950–2959, 2015.
[299] D. Axelrod, “Cell-substrate contacts illuminated by total internal reflection fluorescence.,”
The Journal of cell biology, vol. 89, no. 1, pp. 141–145, 1981.
[300] D. Axelrod, “Total internal reflection fluorescence microscopy in cell biology,” Traffic, vol. 2,
no. 11, pp. 764–774, 2001.
221

BIBLIOGRAPHY
[301] A. L. Mattheyses, S. M. Simon, and J. Z. Rappoport, “Imaging with total internal reflection
fluorescence microscopy for the cell biologist,” J Cell Sci, vol. 123, no. 21, pp. 3621–3628,
2010.
[302] J. S. Burmeister, L. A. Olivier, W. Reichert, and G. A. Truskey, “Application of total inter-
nal reflection fluorescence microscopy to study cell adhesion to biomaterials,” Biomaterials,
vol. 19, no. 4, pp. 307–325, 1998.
[303] “Introduction and theoritical aspects to tirf microscope..” http://www.olympusmicro.
com/primer/techniques/fluorescence/tirf/tirfintro.html.
[304] N. L. Thompson and B. C. Lagerholm, “Total internal reflection fluorescence: applications
in cellular biophysics,” Current opinion in biotechnology, vol. 8, no. 1, pp. 58–64, 1997.
[305] U. Silvan, J. Hyotyla, H.-G. Mannherz, P. Ringler, S. A. Muller, U. Aebi, T. Maier, and C.-
A. Schoenenberger, “Contributions of the lower dimer to supramolecular actin patterning
revealed by tirf microscopy,” Journal of structural biology, 2016.
[306] A. Curtis, “The mechanism of adhesion of cells to glass a study by interference reflection
microscopy,” The Journal of cell biology, vol. 20, no. 2, pp. 199–215, 1964.
[307] M. Kuhner and E. Sackmann, “Ultrathin hydrated dextran films grafted on glass: prepa-
ration and characterization of structural, viscous, and elastic properties by quantitative
microinterferometry,” Langmuir, vol. 12, no. 20, pp. 4866–4876, 1996.
[308] J. Radler and E. Sackmann, “Imaging optical thicknesses and separation distances of phos-
pholipid vesicles at solid surfaces,” Journal de Physique II, vol. 3, no. 5, pp. 727–748, 1993.
[309] J. Schilling, K. Sengupta, S. Goennenwein, A. R. Bausch, and E. Sackmann, “Absolute
interfacial distance measurements by dual-wavelength reflection interference contrast mi-
croscopy,” Physical Review E, vol. 69, no. 2, p. 021901, 2004.
[310] L. Limozin and K. Sengupta, “Quantitative reflection interference contrast microscopy
(ricm) in soft matter and cell adhesion,” ChemPhysChem, vol. 10, no. 16, pp. 2752–2768,
2009.
[311] J. Ploem, Reflection-contrast microscopy as a tool for investigation of the attachment of
living cells to a glass surface. Blackwell, Oxford, 1975.
[312] L. Lochner and C. Izzard, “Dynamic aspects of cell-substrate contact in fibroblast motility,”
in JOURNAL OF CELL BIOLOGY, vol. 59, pp. A199–A199, ROCKEFELLER UNIV
PRESS 1114 FIRST AVE, 4TH FL, NEW YORK, NY 10021 USA, 1973.
[313] J. Bereiter-Hahn, C. H. Fox, and B. Thorell, “Quantitative reflection contrast microscopy
of living cells.,” The Journal of cell biology, vol. 82, no. 3, pp. 767–779, 1979.
[314] C. A. Schneider, W. S. Rasband, K. W. Eliceiri, et al., “Nih image to imagej: 25 years of
image analysis,” Nat methods, vol. 9, no. 7, pp. 671–675, 2012.
222

BIBLIOGRAPHY
[315] G.-Y. Jung, Z. Li, W. Wu, Y. Chen, D. L. Olynick, S.-Y. Wang, W. M. Tong, and R. S.
Williams, “Vapor-phase self-assembled monolayer for improved mold release in nanoimprint
lithography,” Langmuir, vol. 21, no. 4, pp. 1158–1161, 2005.
[316] Y.-C. Tai, P. Joshi, J. McGuire, and J. A. Neff, “Nisin adsorption to hydrophobic surfaces
coated with the peo–ppo–peo triblock surfactant pluronic R© f108,” Journal of colloid and
interface science, vol. 322, no. 1, pp. 112–118, 2008.
[317] J. H. Lee, J. Kopecek, and J. D. Andrade, “Protein-resistant surfaces prepared by peo-
containing block copolymer surfactants,” Journal of biomedical materials research, vol. 23,
no. 3, pp. 351–368, 1989.
[318] L. M. Lee, R. L. Heimark, R. Guzman, J. C. Baygents, and Y. Zohar, “Low melting point
agarose as a protection layer in photolithographic patterning of aligned binary proteins,”
Lab on a Chip, vol. 6, no. 8, pp. 1080–1085, 2006.
[319] C.-H. Chao, K.-L. Li, C.-S. Wu, C.-C. Lee, H.-P. Chiang, Y.-S. Yang, T.-M. Pan, F.-H.
Ko, et al., “Surface effect of assembling enzyme and modulation of surface enzyme activity
with electric potential stress,” Int. J. Electrochem. Sci, vol. 7, pp. 5100–5114, 2012.
[320] V. Pinto, G. Minas, and M. Correia-Neves, “Pdms biofunctionalization study for the de-
velopment of a microfluidic device: Application to salivary cortisol,” in Bioengineering
(ENBENG), 2015 IEEE 4th Portuguese Meeting on, pp. 1–5, IEEE, 2015.
[321] J. Juarez-Moreno, A. Avila-Ortega, A. Oliva, F. Aviles, and J. Cauich-Rodrıguez, “Effect
of wettability and surface roughness on the adhesion properties of collagen on pdms films
treated by capacitively coupled oxygen plasma,” Applied Surface Science, vol. 349, pp. 763–
773, 2015.
[322] E. G. Rochow, An introduction chemistry of the silicones. Read Books Ltd, 2013.
[323] R. W. Style, R. Boltyanskiy, G. K. German, C. Hyland, C. W. MacMinn, A. F. Mertz, L. A.
Wilen, Y. Xu, and E. R. Dufresne, “Traction force microscopy in physics and biology,” Soft
matter, vol. 10, no. 23, pp. 4047–4055, 2014.
[324] R. W. Style, C. Hyland, R. Boltyanskiy, J. S. Wettlaufer, and E. R. Dufresne, “Surface
tension and contact with soft elastic solids,” Nature communications, vol. 4, 2013.
[325] D. Fuard, T. Tzvetkova-Chevolleau, S. Decossas, P. Tracqui, and P. Schiavone, “Opti-
mization of poly-di-methyl-siloxane (pdms) substrates for studying cellular adhesion and
motility,” Microelectronic Engineering, vol. 85, no. 5, pp. 1289–1293, 2008.
[326] G. Bar, L. Delineau, A. Hafele, and M.-H. Whangbo, “Investigation of the stiffness change
in, the indentation force and the hydrophobic recovery of plasma-oxidized polydimethyl-
siloxane surfaces by tapping mode atomic force microscopy,” Polymer, vol. 42, no. 8,
pp. 3627–3632, 2001.
223

BIBLIOGRAPHY
[327] S. Befahy, P. Lipnik, T. Pardoen, C. Nascimento, B. Patris, P. Bertrand, and S. Yunus,
“Thickness and elastic modulus of plasma treated pdms silica-like surface layer,” Langmuir,
vol. 26, no. 5, pp. 3372–3375, 2009.
[328] T. Kaufmann and B. J. Ravoo, “Stamps, inks and substrates: polymers in microcontact
printing,” Polymer Chemistry, vol. 1, no. 4, pp. 371–387, 2010.
[329] Y. Kazoe and Y. Sato, “Effect of ion motion on zeta-potential distribution at microchannel
wall obtained from nanoscale laser-induced fluorescence,” Analytical chemistry, vol. 79,
no. 17, pp. 6727–6733, 2007.
[330] J. Li, D. Han, and Y.-P. Zhao, “Kinetic behaviour of the cells touching substrate: the
interfacial stiffness guides cell spreading,” Scientific reports, vol. 4, p. 3910, 2014.
[331] N. Hersch, B. Wolters, G. Dreissen, R. Springer, N. Kirchgeßner, R. Merkel, and B. Hoff-
mann, “The constant beat: cardiomyocytes adapt their forces by equal contraction upon
environmental stiffening,” Biology open, vol. 2, no. 3, pp. 351–361, 2013.
[332] S. T. Kim, M. Touma, K. Takeuchi, Z.-Y. J. Sun, V. P. Dave, D. J. Kappes, G. Wagner, and
E. L. Reinherz, “Distinctive cd3 heterodimeric ectodomain topologies maximize antigen-
triggered activation of αβ t cell receptors,” The Journal of Immunology, vol. 185, no. 5,
pp. 2951–2959, 2010.
[333] S. T. Kim, K. Takeuchi, Z.-Y. J. Sun, M. Touma, C. E. Castro, A. Fahmy, M. J. Lang,
G. Wagner, and E. L. Reinherz, “The αβ t cell receptor is an anisotropic mechanosensor,”
Journal of Biological Chemistry, vol. 284, no. 45, pp. 31028–31037, 2009.
[334] S. T. Kim, Y. Shin, K. Brazin, R. J. Mallis, J. Sun, G. Wagner, M. Lang, and E. L. Reinherz,
“Tcr mechanobiology: torques and tunable structures linked to early t cell signaling,”
Frontiers in immunology, vol. 3, p. 76, 2012.
[335] M. Ochsner, M. R. Dusseiller, H. M. Grandin, S. Luna-Morris, M. Textor, V. Vogel, and
M. L. Smith, “Micro-well arrays for 3d shape control and high resolution analysis of single
cells,” Lab on a Chip, vol. 7, no. 8, pp. 1074–1077, 2007.
[336] A. Ranjan and T. J. Webster, “Increased endothelial cell adhesion and elongation on
micron-patterned nano-rough poly (dimethylsiloxane) films,” Nanotechnology, vol. 20,
no. 30, p. 305102, 2009.
[337] H. Yu, S. Xiong, C. Y. Tay, W. S. Leong, and L. P. Tan, “A novel and simple microcon-
tact printing technique for tacky, soft substrates and/or complex surfaces in soft tissue
engineering,” Acta biomaterialia, vol. 8, no. 3, pp. 1267–1272, 2012.
[338] D. R. Schmidt, H. Waldeck, and W. J. Kao, “Protein adsorption to biomaterials,” in
Biological interactions on materials surfaces, pp. 1–18, Springer, 2009.
[339] F. P. K. B. L. L. A. C. Ranime Alameddine, Astrid Wahl and K. Sengupta, “Reverse
contact printing of protein patterns for cell mechanotransduction studies,”
224