Airport noise exposure and the postnatal growth of children
10
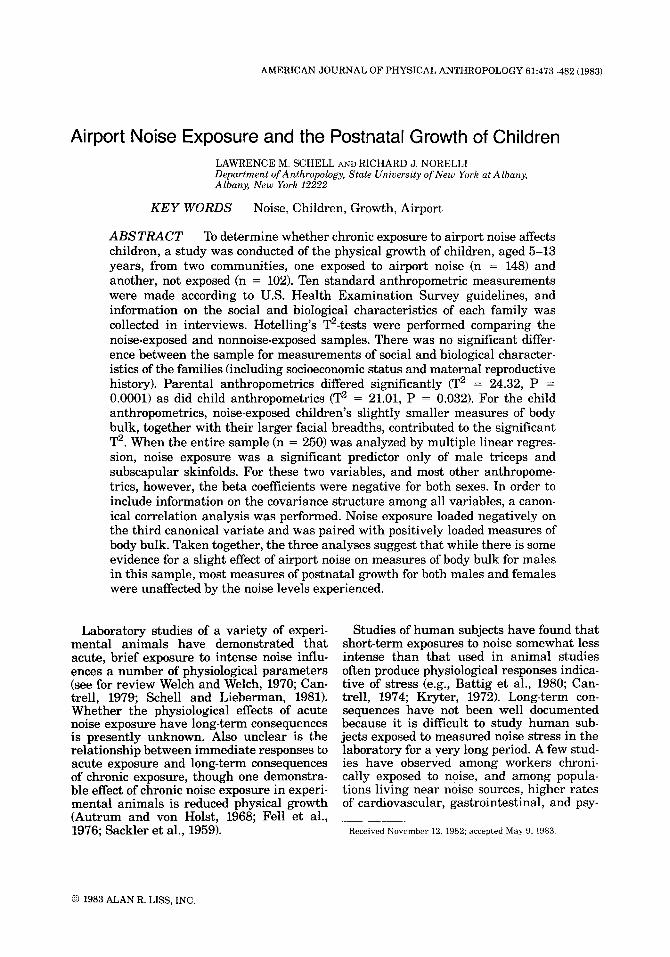
AMERICAN JOURNAL OF PHYSICAL ANTHROPOLOGY 61:473-482 (1983) Airport Noise Exposure and the Postnatal Growth of Children LAWRENCE M. SCHELL AND RICHARD J. NORELLI Department ofAnthropology, State University of New York at Alhany, Albany, New York 12222 KEY WORDS Noise, Children, Growth, Airport ABSTRACT To determine whether chronic exposure to airport noise affects children, a study was conducted of the physical growth of children, aged 5-13 years, from two communities, one exposed to airport noise (n = 148) and another, not exposed (n = 102). Ten standard anthropometric measurements were made according to U.S. Health Examination Survey guidelines, and information on the social and biological characteristics of each family was collected in interviews. Hotelling’s T2-tests were performed comparing the noise-exposed and nonnoise-exposed samples. There was no significant differ- ence between the sample for measurements of social and biological character- istics of the families (including socioeconomic status and maternal reproductive history). Parental anthropometrics differed significantly (T2 = 24.32, P = 0.0001) as did child anthropometrics (T2 = 21.01, P = 0.032). For the child anthropometrics, noise-exposed children’s slightly smaller measures of body bulk, together with their larger facial breadths, contributed to the significant T2. When the entire sample (n = 250) was analyzed by multiple linear regres- sion, noise exposure was a significant predictor only of male triceps and subscapular skinfolds. For these two variables, and most other anthropome- trics, however, the beta coeficients were negative for both sexes. In order to include information on the covariance structure among all variables, a canon- ical correlation analysis was performed. Noise exposure loaded negatively on the third canonical variate and was paired with positively loaded measures of body bulk. Taken together, the three analyses suggest that while there is some evidence for a slight effect of airport noise on measures of body bulk for males in this sample, most measures of postnatal growth for both males and females were unaffected by the noise levels experienced. Laboratory studies of a variety of experi- mental animals have demonstrated that acute, brief exposure to intense noise influ- ences a number of physiological parameters (see for review Welch and Welch, 1970; Can- trell, 1979; Schell and Lieberman, 1981). Whether the physiological effects of acute noise exposure have long-term consequences is presently unknown. Also unclear is the relationship between immediate responses to acute exposure and long-term consequences of chronic exposure, though one demonstra- ble effect of chronic noise exposure in experi- mental animals is reduced physical growth (Autrum and von Holst, 1968; Fell et al., 1976; Sackler et al., 1959). Studies of human subjects have found that short-term exposures to noise somewhat less intense than that used in animal studies often produce physiological responses indica- tive of stress (e.g., Battig et al., 1980; Can- trell, 1974; Kryter, 1972). Long-term con- sequences have not been well documented because it is difficult to study human sub- jects exposed to measured noise stress in the laboratory for a very long period. A few stud- ies have observed among workers chroni- cally exposed to noise, and among popula- tions living near noise sources, higher rates of cardiovascular, gastrointestinal, and psy- Received November 12, 1982; accepted May 9, 1983 0 1983 ALAN R. LISS. INC
Transcript of Airport noise exposure and the postnatal growth of children
AMERICAN JOURNAL OF PHYSICAL ANTHROPOLOGY 61:473-482 (1983)
Airport Noise Exposure and the Postnatal Growth of Children LAWRENCE M. SCHELL AND RICHARD J. NORELLI Department ofAnthropology, State University of New York at Alhany, Albany, New York 12222
KEY WORDS Noise, Children, Growth, Airport
ABSTRACT To determine whether chronic exposure to airport noise affects children, a study was conducted of the physical growth of children, aged 5-13 years, from two communities, one exposed to airport noise (n = 148) and another, not exposed (n = 102). Ten standard anthropometric measurements were made according to U.S. Health Examination Survey guidelines, and information on the social and biological characteristics of each family was collected in interviews. Hotelling’s T2-tests were performed comparing the noise-exposed and nonnoise-exposed samples. There was no significant differ- ence between the sample for measurements of social and biological character- istics of the families (including socioeconomic status and maternal reproductive history). Parental anthropometrics differed significantly (T2 = 24.32, P = 0.0001) as did child anthropometrics (T2 = 21.01, P = 0.032). For the child anthropometrics, noise-exposed children’s slightly smaller measures of body bulk, together with their larger facial breadths, contributed to the significant T2. When the entire sample (n = 250) was analyzed by multiple linear regres- sion, noise exposure was a significant predictor only of male triceps and subscapular skinfolds. For these two variables, and most other anthropome- trics, however, the beta coeficients were negative for both sexes. In order to include information on the covariance structure among all variables, a canon- ical correlation analysis was performed. Noise exposure loaded negatively on the third canonical variate and was paired with positively loaded measures of body bulk. Taken together, the three analyses suggest that while there is some evidence for a slight effect of airport noise on measures of body bulk for males in this sample, most measures of postnatal growth for both males and females were unaffected by the noise levels experienced.
Laboratory studies of a variety of experi- mental animals have demonstrated that acute, brief exposure to intense noise influ- ences a number of physiological parameters (see for review Welch and Welch, 1970; Can- trell, 1979; Schell and Lieberman, 1981). Whether the physiological effects of acute noise exposure have long-term consequences is presently unknown. Also unclear is the relationship between immediate responses to acute exposure and long-term consequences of chronic exposure, though one demonstra- ble effect of chronic noise exposure in experi- mental animals is reduced physical growth (Autrum and von Holst, 1968; Fell et al., 1976; Sackler et al., 1959).
Studies of human subjects have found that short-term exposures to noise somewhat less intense than that used in animal studies often produce physiological responses indica- tive of stress (e.g., Battig et al., 1980; Can- trell, 1974; Kryter, 1972). Long-term con- sequences have not been well documented because it is difficult to study human sub- jects exposed to measured noise stress in the laboratory for a very long period. A few stud- ies have observed among workers chroni- cally exposed to noise, and among popula- tions living near noise sources, higher rates of cardiovascular, gastrointestinal, and psy-
Received November 12, 1982; accepted May 9, 1983
0 1983 ALAN R. LISS. INC
474 L.M. SCHELL AND R.J. NORELLI
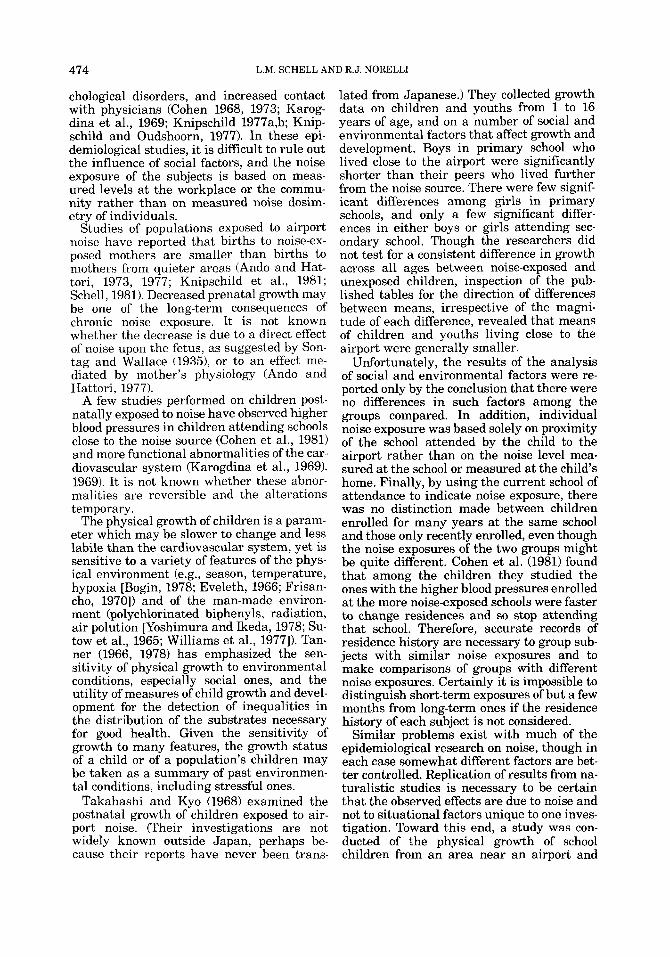
chological disorders, and increased contact with physicians (Cohen 1968, 1973; Karog- dina et al., 1969; Knipschild 1977a,b; Knip- schild and Oudshoorn, 1977). In these epi- demiological studies, it is difficult to rule out the influence of social factors, and the noise exposure of the subjects is based on meas- ured levels at the workplace or the commu- nity rather than on measured noise dosim- etry of individuals.
Studies of populations exposed to airport noise have reported that births to noise-ex- posed mothers are smaller than births to mothers from quieter areas (Ando and Hat- tori, 1973, 1977; Knipschild et al., 1981; Schell, 1981). Decreased prenatal growth may be one of the long-term consequences of chronic noise exposure. It is not known whether the decrease is due to a direct effect of noise upon the fetus, as suggested by Son- tag and Wallace (1935), or to an effect me- diated by mother’s physiology (Ando and Hattori, 1977).
A few studies performed on children post- natally exposed to noise have observed higher blood pressures in children attending schools close to the noise source (Cohen et al., 1981) and more functional abnormalities of the car- diovascular system (Karogdina et al., 1969). 1969). It is not known whether these abnor- malities are reversible and the alterations temporary.
The physical growth of children is a param- eter which may be slower to change and less labile than the cardiovascular system, yet is sensitive to a variety of features of the phys- ical environment (e.g., season, temperature, hypoxia [Bogin, 1978; Eveleth, 1966; Frisan- cho, 19701) and of the man-made environ- ment (polychlorinated biphenyls, radiation, air polution [Yoshimura and Ikeda, 1978; Su- tow et al., 1965; Williams et al., 19771). Tan- ner (1966, 1978) has emphasized the sen- sitivity of physical growth to environmental conditions, especially social ones, and the utility of measures of child growth and devel- opment for the detection of inequalities in the distribution of the substrates necessary for good health. Given the sensitivity of growth to many features, the growth status of a child or of a population’s children may be taken as a summary of past environmen- tal conditions, including stressful ones.
Takahashi and Kyo (1968) examined the postnatal growth of children exposed to air- port noise. (Their investigations are not widely known outside Japan, perhaps be- cause their reports have never been trans-
lated from Japanese.) They collected growth data on children and youths from 1 to 16 years of age, and on a number of social and environmental factors that affect growth and development. Boys in primary school who lived close to the airport were significantly shorter than their peers who lived further from the noise source. There were few signif- icant differences among girls in primary schools, and only a few significant differ- ences in either boys or girls attending sec- ondary school. Though the researchers did not test for a consistent difference in growth across all ages between noise-exposed and unexposed children, inspection of the pub- lished tables for the direction of differences between means, irrespective of the magni- tude of each difference, revealed that means of children and youths living close to the airport were generally smaller.
Unfortunately, the results of the analysis of social and environmental factors were re- ported only by the conclusion that there were no differences in such factors among the groups compared. In addition, individual noise exposure was based solely on proximity of the school attended by the child to the airport rather than on the noise level mea- sured at the school or measured at the child’s home. Finally, by using the current school of attendance to indicate noise exposure, there was no distinction made between children enrolled for many years at the same school and those only recently enrolled, even though the noise exposures of the two groups might be quite different. Cohen et al. (1981) found that among the children they studied the ones with the higher blood pressures enrolled at the more noise-exposed schools were faster to change residences and so stop attending that school. Therefore, accurate records of residence history are necessary to group sub- jects with similar noise exposures and to make comparisons of groups with different noise exposures. Certainly it is impossible to distinguish short-term exposures of but a few months from long-term ones if the residence history of each subject is not considered.
Similar problems exist with much of the epidemiological research on noise, though in each case somewhat different factors are bet- ter controlled. Replication of results from na- turalistic studies is necessary to be certain that the observed effects are due to noise and not to situational factors unique to one inves- tigation. Toward this end, a study was con- ducted of the physical growth of school children from an area near an airport and
AIRPORT NOISE AND POSTNATAL GROWTH IN CHILDREN 475
where measured noise levels indicated that airplane traffic substantially influences the noise level. Based on previous research, we hypothesize that the growth of children from the most noiseexposed area will be less than the growth of children from the quieter or control area. The null hypothesis is tested with a variety of statistical techniques that are suitable for an analysis of the complex interrelationships among physical growth, noise exposure, and a variety of family social and biological characteristics.
MATERIALS AND METHODS Subjects
The sample of children aged 5 through 12 years (n = 250) was drawn from two neigh- boring communities in the eastern United States. Nearly all families with a child in either community’s local primary school re- ceived a request to participate in the study and 244 families and their children coopera- ted in all phases of data collection.
The sample is nearly evenly divided by sex and community within each age group. From 6 through 11 years, the age groups are simi- lar in size but, the 5- and 12-year-olds to- gether compose only 4% of the sample. Most of the children were born between 1973 and 1967, years that coincide closely with the community noise measurement studies de- scribed below. Only children who had lived in the communities for 50% or more of their lives were included in the sample.
Data Sources Data were collected from three sources:
from an interview with the family, from an anthropometric examination of the child con- ducted after the interview, and from pub- lished descriptions of noise levels. Interviews were arranged for families with a child at- tending one of the two public elementary schools in the subject communities. The in- terview was conducted at the family’s home in all but a few cases, and usually the child’s mother spoke for the family. In the interview a detailed residence history was obtained providing addresses and dates of residences for the subject child. Mother’s birthdate and reproductive history were obtained, includ- ing occurrences of miscarriages, stillbirths, and births during previous marriages. Infor- mation on mother’s and father’s highest com- pleted year of education, birthplaces, and present occupations also was obtained. Fam- ily income was given as the figure reported to the U.S. Department of Internal Revenue
in 1977, rounded to the nearest thousand. Each parent was asked for current height and weight. (Reported height and weight bears a very close resemblance to measured height and weight according to Steward et al., 1980.) In addition, the birthplaces of the child’s grandparents were collected, as were the country or countries of each family’s eth- nic identification. (Although the names of four countries were recorded for each family, these names did not have to be of different nations: a family which felt itself ethnically half-German and half-Irish would have named Germany twice and Ireland twice.)
The growth examination was conducted within a few days of the child’s birthday. All examinations were conducted in the elemen- tary school attended by the child, and all examinations were performed during the af- ternoon, even those examinations performed when the school was not in session. The an- thropometrist provided each child with cloth- ing that was lightweight and which allowed access to measurement landmarks. Using the techniques employed by anthropometrists for the U.S. Health Examination Survey, the fol- lowing measurements were made: stature, weight, triceps and subscapular skinfolds, upper arm circumference, bigonial and bizy- gomatic breadths, bicristal and biacromial breadths, and sitting height. All measure- ments were made by one anthropometrist (L.M.S.), and on most occasions an assistant was present to check measurement position and to record the information. Examination of intraobserver error revealed that the tech- nical error or measurement was comparable to or less than that found in HES reports (e.g., National Center for Health Statistics, 1972).
An estimate of airport noise exposure was calculated for each child in the study. Noise is measured on the decibel scale. In this log- arithmic scale a change from 60 decibels to 90 decibels equals a 1,000-fold change in sound energy. In mundane terms, a 60-deci- be1 sound is often produced by normal con- versation, while a 90 decibel sound may be experienced on a subway. To measure sound as the human ear perceives it, the higher frequencies are weighted more heavily. This weighted scale is referred to as the A scale, and decibels measured on the A scale as dBA. (For a more complete description of this topic see Bragdon, 1971.)
The estimate of child’s airport-noise expo- sure was based upon the noise level at their residence. There are, of course, other sources
476 L.M. SCHELL AND R.J. NORELLI
of noise than that produced by airplane traffic. In this study these sources are as- sumed to be randomly distributed through the sample, and we follow the usual strategy in epidemiological research on noise effects, which is to compare groups of individuals exposed to like amounts of sound from a sin- gle measured source (Ando and Hattori, 1973, 1977; Cohen et al., 1981; Knipschild, 1977a; Knipschild and Oudshoorn, 1977, Knipschild et al., 1981). The estimates of noise levels for residences in the noise-exposed community were taken from the noise level contour map (during takeoffs) developed by Bragdon (1971, page 148). Since some people moved within the noise-exposed community, an average airport noise exposure was calculated. The individual’s noise levels from all residences were averaged, weighing each residence’s noise level by the individual’s length of stay at that residence. For time spent a t resi- dences outside of the community, a value of 53 dBA was used in the calculation of airport noise exposure since this is the level com- monly experienced there when plane traffic is light or absent. The affect of this assump- tion is minimized by excluding from the sam- ple those children who lived outside of the subject communities for most of their lives (50% or more) and so for whom the noise estimate was in large part based on the as- sumed value of 53 dBA.
Communities: Noise level characterization The two subject communities, called Air-
port City and Residentia in this report, are located near a large international airport that serves a metropolitan area of over 4 million people. Airport City is adjacent to the airport, the southern boundary of its residen- tial area lying but three fourths of a mile from the runway used by jet planes. Residen- tia is further from the airport, lying north of Airport City. Its homes are between 2.5 and 3.75 miles from the runway. In 1975 there were approximately 400 air-carrier move- ments per day at the airport. Most of these were jet aircraft movements which used the runway near Airport City.
Noise levels in Airport City have been measured twice. In 1967 Bragdon (1971) measured levels in Airport City, and he iden- tified major noise sources there. In 1975 Glaser and Kauders (1975) measured noise levels a t the sites in Airport City that Brag- don had used in 1967. (For a detailed descrip- tion of measurement methodology, the reader should consult these primary sources.) These
studies are useful for assessing changes in noise levels during the 8-year period betwen 1968 and 1975 when most of the sample of children involved in this study were growing.
Bragdon measured noise levels at several locations in Airport City during jetcraft land- ings and takeoffs, and during periods he des- ignated as high, medium, and low mobility, based upon the amount of transportation traffic present. In general, locations in the southern portions of Airport City recorded the highest noise levels from airport traffic, with peak levels a t or over 100 dBA. The station furthest from the runway recorded peaks of about 70 dBA. During periods of little airport traffic (Bragdon’s mean of me- dium mobility period measurements), noise levels ranged from 50 to 56 dBA (Bragdon, 1971). In the study by Glaser and Kauders (1975) ambient noise levels were measured at the same locations Bragdon used, but the measurement techniques varied slightly from Bragdon’s. Glaser and Kauders believe that Bragdon’s peak noise levels during the pe- riods of high traffic mobility are comparable to the now-standard Lol measurement (the noise level exceeded only 1% of the time dur- ing which measurements were made). Their comparison of their Lol values with Brag- don’s high mobility period peak levels shows that noise levels have decreased but not sub- stantially so. Both studies show that the southern part of Airport City, lying closest to the runway, is exposed to the greatest levels of noise: Bragdon’s peak levels during high mobility periods, his measurements during airplane takeoffs and landings, and Glaser and Kauder’s Lol values are all highest at the southern measuring stations. At the same time, both studies agree that locations in northern Airport City, where it is closest to Residentia (the control community), are relatively quiet and are least affected by air- port noise.
Noise levels in Residentia are not notice- ably changed by aircraft takeoffs and land- ings. Under uncommon meteorological con- ditions, jet traffic may be routed in a circle which may partly cross over Residentia and raise noise levels there, but this is rare. Aircraft traffic should not be considered as a significant contributor to noise levels in Re- sidentia. Though noise levels seem low, it is not possible to state with authority the exact noise levels there. Since noise levels have not been measured by the Environmental Pro- tection Agency or any other group trained and equipped to measure noise levels, for the
AIRPORT NOISE AND POSTNATAL GROWTH IN CHILDREN 477
purpose of this study the level of 53 dBA was chosen to represent noise levels in Residen- tia. This choice is based on the assumption that noise levels in Residentia are similar to those in Airport City when airplane traffic is not passing overhead. The level of 53 dBA was selected because it is the midpoint of the range of Bragdon’s means for all measuring stations in Airport City during the period of medium mobility, a period not substantially affected by airplane traffic.
Communities: Social characteristics The families of the subjects from the two
communities had an average income in 1977 of $17,044, and parents averaged just over 12 years of education. More than half (57%) of the fathers were craftsmen, operators, labor- ers, transport equipment operators, or ser- vice personnel, rather than sales, clerical, managerial, or professional and technical workers. The most frequent occupation given by mothers was houseperson (55%) with cler- ical work given next most often (23%). Five of the fathers (2%) and two of the mothers (1%) were unemployed when these data were collected. Most parents (66% of the fathers and 70% of the mothers) were born in the nearby metropolis or the neighboring subur- ban county. Only 19% of the fathers and 12% of the mothers were born outside of the state, and only 4% of the fathers and 2% of the mothers were born outside the United States. Most families claimed an ethnic identifica- tion with countries from northwestern Eu- rope or with the British Isles and Canada (78%). The nations most often identified were Germany, Ireland, England, and Italy. There were no families or children of non-European background.
Discussions with local school administra- tors indicated that the two communities were rather similar in terms of social characteris- tics. To verify this impression and to insure comparability of the children’s growth in both samples, a preliminary comparison of some social characteristics was performed. The comparison was made only for those characteristics that were operationalized as nonparametric variables. Other social and biological characteristics of the subject fami- lies that are operationalized as interval or ratio scale data are handled with multivar- iate statistical techniques.
Consistently nonsignificant chi-squares were obtained in the comparison of the two communities for the distribution of mothers’ occupations (x2 = 0.11), fathers’ occupations
(x2 = 3.81, mothers’ birthplaces (x2 = 0.64), fathers’ birthplaces ( x 2 = 1.811, and families’ ethnic background(s) ( x 2 = 1.91). Further- more, similar tests of the distributions of these characteristics within Airport City were also not significant. These preliminary comparisons suggest that further comparison of the two communities in terms of noise exposure and child growth will not be con- founded by the distributions of these social characteristics since they are distributed randomly between the communities and within the most noise-exposed community. (Additional details regarding these prelimi- nary comparisons may be obtained from Schell [19801.)
Statistical techniques Ideally, the appropriate statistical test of
the hypothesis of an effect of noise on growth would consider the highly intercorrelated structure of the dependent variables, control for the interrelated independent variables (for example, mother’s height and weight) and would specify the effect of noise on indi- vidual anthropometric variables. There is no single statistical test that can do all three. However, there are three tests which taken together may yield a thorough evaluation of the hypothesis. Hotelling’s T2 is applied in order to consider concurrently the effects of airport noise exposure upon all ten anthro- pometric variables, and upon several mea- sures of the biocultural environment of the children. While no single anthropometric variable may show a significant difference in group means between the noise-exposed and nonnoise-exposed sample, the multivariate T2 method might identify a significant differ- ence between the groups. Multiple linear regression analysis is also applied in order to determine if a relationship exists between individual growth variables and acute air- port noise exposure after removing the ef- fects of the potentially confounding variables of parental anthropometry, and the social and biological characteristics of the child’s fam- ily. Multiple regression analysis indicates whether noise is related to any of the mea- sures of growth, but it cannot fully consider the covariance structure among the depen- dent variables.
This covariance among the dependent vari- ables argues against the interpretability of 20 regression models (ten anthropometric vari- ables by two sexes) each utilizing a single dependent variable. Through canonical cor- relation analysis it is possible to examine the
478 L.M. SCHELL AND R.J. NORELLI
strength of association between a set of inde- pendent variables and a set of dependent var- iables (Van de Geer, 1971). Here canonical correlation analyzes simultaneously the in- terrelationships among the set of ten anthro- pometric (dependent) variables and the set of independent variables (the parental anthro- pometry, and the social and biological fami- lial characteristics). (Canonical correlation, to be interpretable, requires that the variables be logically assigned to either independent or dependent sets. This is done in Table 1.)
SPSS subprogram CANCORR (Nie et al., 1975; Version H) was used to construct the linear composites and the canonical correla- tions between them. Following Levine (19771, SPSS program PEARSON CORR was used to produce the canonical structure correla- tions needed for interpretation. Measures of redundancy and trace were computed by hand (see Levine, 1977 and Alpert and Peter- son, 1971 for computational procedures).
Interpretation of the relative contributions of each variable in the canonical variates is possible by analyzing the canonical loadings (also referred to as a structure correlation) (Hair et al., 1979). Structure correlations were chosen for interpretation since “. . . the weights only indicate the direct contribution of the original variables to the calculation of the variates and since the effects of the cor- relations among the variables and the resul- tant indirect contributions may not be readily apparent” (Levine, 1977). These structure cor- relations can be interpreted as a factor load- ings, allowing the assessment of the relative contribution of the original variables to each linear composite (Hair et al., 1979).
RESULTS
The variables within each of the three sub- sets (child anthropometry, parental anthro- pometry, and social and biological characteristics of the family) are analyzed
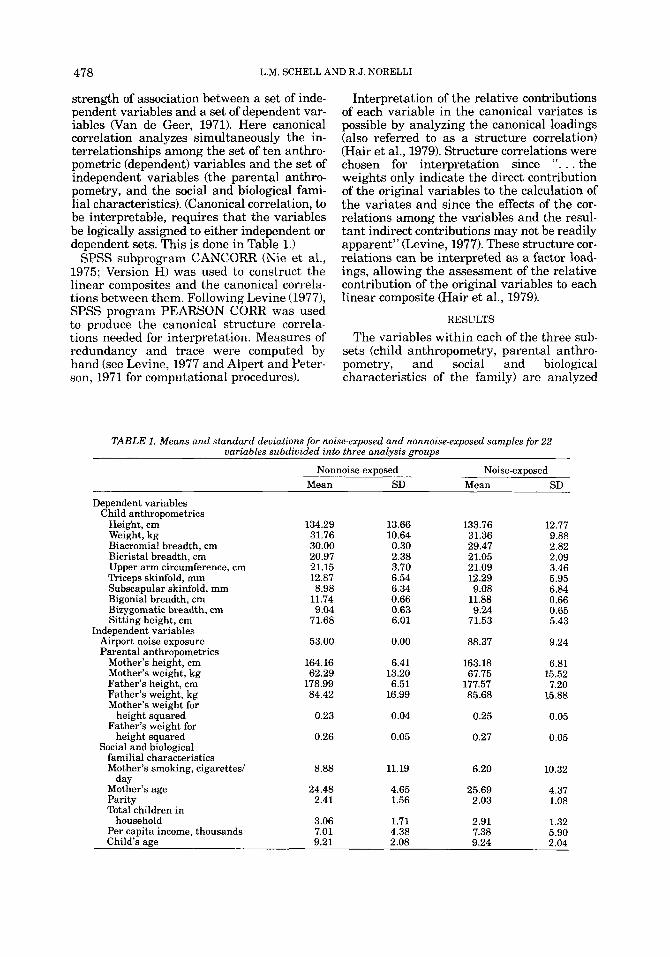
TABLE 1. Means and standard deviations for noise-exposed and nonnoiseexposed samples for 22 variables subdivided into three analysis groups
Nonnoise-exposed Noise-exposed Mean SD Mean SD
Dependent variables Child anthropometrics
Height, cm Weight, kg Biacromial breadth, cm Bicristal breadth, cm Upper arm circumference, cm Triceps skinfold, mm Subscapular skinfold, mm Bigonial breadth, cm Bizygomatic breadth, cm Sitting height, cm
Independent variables Airport noise exposure Parental anthropometrics
Mother’s height, cm Mother’s weight, kg Father’s height, cm Father’s weight, kg Mother’s weight for
height squared Father’s weight for
height squared Social and biological
familial characteristics Mother’s smoking, cigarettes/
Mother’s age Parity Total children in
Per capita income, thousands Child’s aee
day
household
134.29 31.76 30.00 20.97 21.15 12.87 8.98
11.74 9.04
71.68
53.00
164.16 62.29
178.99 84.42
0.23
0.26
8.88
24.48 2.41
3.06 7.01 9.21
13.66 10.64 0.30 2.38 3.70 6.54 6.34 0.66 0.63 6.01
0.00
6.41 13.20 6.51
16.99
0.04
0.05
11.19
4.65 1.56
1.71 4.38 2.08
133.76 31.36 29.47 21.05 21.09 12.29 9.08
11.88 9.24
71.53
88.37
163.18 67.75
177.57 85.68
0.25
0.27
6.20
25.69 2.03
2.91 7.38 9.24
12.77 9.88 2.82 2.09 3.46 5.95 6.84 0.66 0.65 5.43
9.24
6.81 15.52 7.20
15.88
0.05
0.05
10.32
4.37 1.08
1.32 5.90 2.04
AIRPORT NOISE AND POSTNATAL GROWTH IN CHILDREN 479
TABLE 2. Hotelling’s values for three subsets
T2 F p n
dichotomized on noise exposure
Child anthropometry 21.01 2.02 0.032 10,238 Parental anthropometry 24.53 3.99 0.001 6,240 Other measures of social-
economic status 10.96 1.79 0.102 6,241
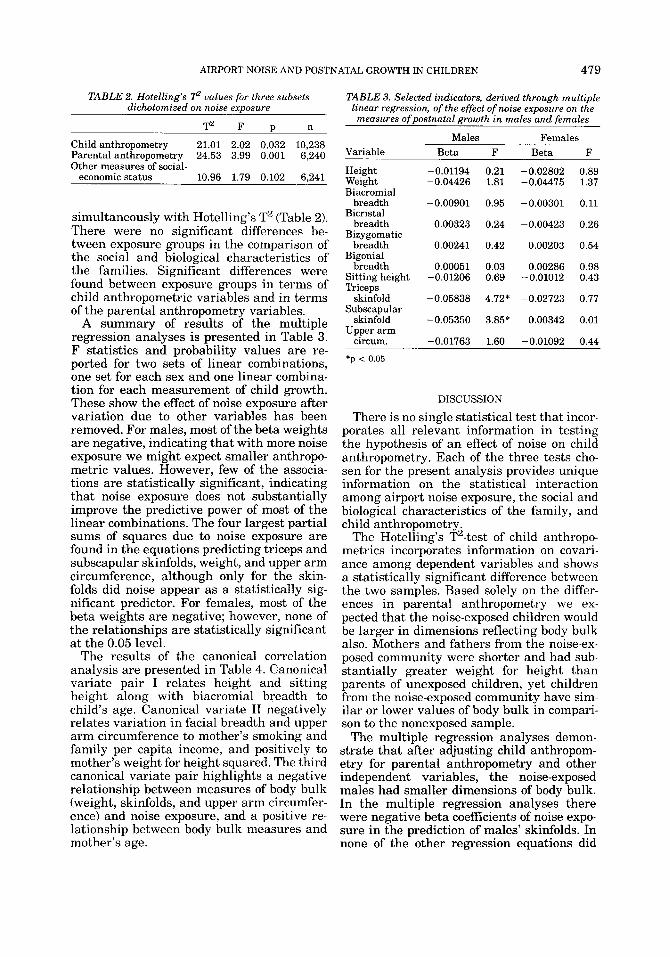
simultaneously with Hotelling’s T’ (Table 2). There were no significant differences be- tween exposure groups in the comparison of the social and biological characteristics of the families. Significant differences were found between exposure groups in terms of child anthropometric variables and in terms of the parental anthropometry variables.
A summary of results of the multiple regression analyses is presented in Table 3. F statistics and probability values are re- ported for two sets of linear combinations, one set for each sex and one linear combina- tion for each measurement of child growth. These show the effect of noise exposure after variation due to other variables has been removed. For males, most of the beta weights are negative, indicating that with more noise exposure we might expect smaller anthropo- metric values. However, few of the associa- tions are statistically significant, indicating that noise exposure does not substantially improve the predictive power of most of the linear combinations. The four largest partial sums of squares due to noise exposure are found in the equations predicting triceps and subscapular skinfolds, weight, and upper arm circumference, although only for the skin- folds did noise appear as a statistically sig- nificant predictor. For females, most of the beta weights are negative; however, none of the relationships are statistically significant a t the 0.05 level.
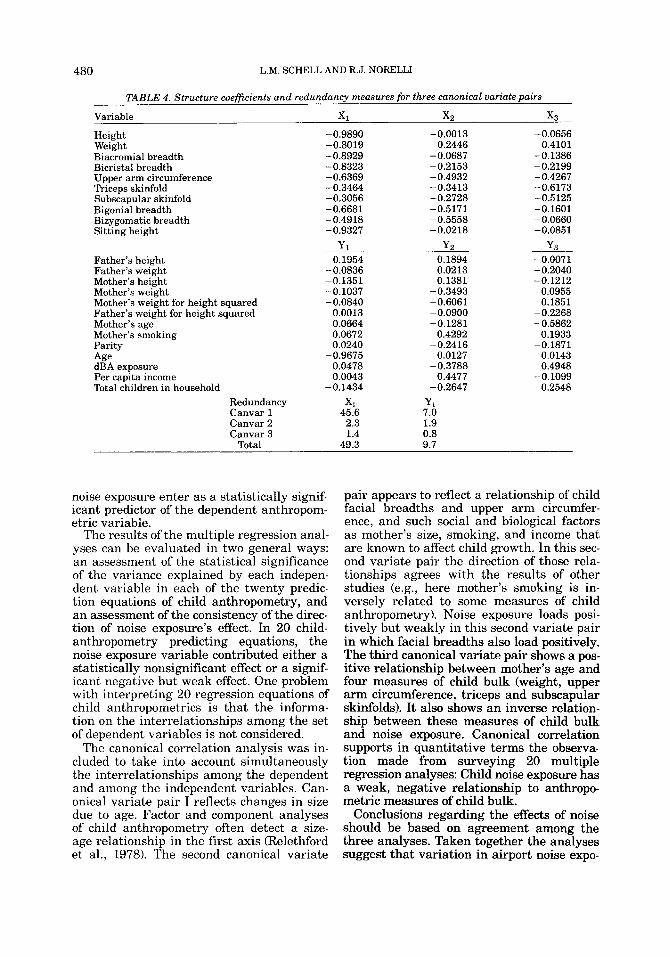
The results of the canonical correlation analysis are presented in Table 4. Canonical variate pair I relates height and sitting height along with biacromial breadth to child’s age. Canonical variate I1 negatively relates variation in facial breadth and upper arm circumference to mother’s smoking and family per capita income, and positively to mother’s weight for height squared. The third canonical variate pair highlights a negative relationship between measures of body bulk (weight, skinfolds, and upper arm circumfer- ence) and noise exposure, and a positive re- lationship between body bulk measures and mother’s age.
TABLE 3. Selected indicators, derived through multiple linear regression, of the effect of noise exposure on the measures of Dostnatal growth in males and females
Males Females Variable Beta F Beta F
Height -0.01194 0.21 -0.02802 0.89 Weight -0.04426 1.81 -0.04475 1.37
breadth -0.00901 0.95 -0.00301 0.11
breadth 0.00323 0.24 -0.00423 0.26
Biacromial
Bicristal
Bizygomatic breadth 0.00241 0.42 0.00203 0.54
Bigonial breadth 0.00051 0.03 0.00286 0.98
Sitting height -0.01206 0.69 -0.01012 0.43 Triceps -
Subscapular
Upper arm
*p < 0.05
skinfold -0.05838 4.72* -0.02723 0.77
skinfold -0.05350 3.85* 0.00342 0.01
circum. -0.01763 1.60 -0.01092 0.44
DISCUSSION
There is no single statistical test that incor- porates all relevant information in testing the hypothesis of an effect of noise on child anthropometry. Each of the three tests cho- sen for the present analysis provides unique information on the statistical interaction among airport noise exposure, the social and biological characteristics of the family, and child anthropometry.
The Hotelling’s T2-test of child anthropo- metrics incorporates information on covari- ance among dependent variables and shows a statistically significant difference between the two samples. Based solely on the differ- ences in parental anthropometry we ex- pected that the noise-exposed children would be larger in dimensions reflecting body bulk also. Mothers and fathers from the noise-ex- posed community were shorter and had sub- stantially greater weight for height than parents of unexposed children, yet children from the noise-exposed community have sim- ilar or lower values of body bulk in compari- son to the nonexposed sample.
The multiple regression analyses demon- strate that after adjusting child anthropom- etry for parental anthropometry and other independent variables, the noise-exposed males had smaller dimensions of body bulk. In the multiple regression analyses there were negative beta coefficients of noise expo- sure in the prediction of males’ skinfolds. In none of the other regression equations did
480 L.M. SCHELL AND R.J. NORELLI
TABLE 4. Structure coefficients and redundancy measures for three canonical variate pairs
Variable XI x 2 x 3
Height -0.9890 -0.0013 -0.0656 -0.4101 Weight -0.8019 -0.2446
Biacromial breadth -0.8929 -0.0687 -0.1386 Bicristal breadth -0.8323 -0.2153 -0.2199 Upper arm circumference -0.6369 -0.4932 -0.4267 Triceps skinfold -0.3464 -0.3413 -0.6173 Subscapular skinfold -0.3056 -0.2728 -0.5125 Bigonial breadth -0.6681 -0.5171 -0.1601 Bizygomatic breadth -0.4918 -0.5558 -0.0660 Sitting height -0.9327 -0.0218 -0.0851
Y1 y 2 y 3
Father’s height -0.1954 0.1894 - 0.007 1 -0.2040 Father’s weight -0.0836 0.0213
Mother’s weight -0.1037 -0.3493 0.0955 Mother’s weight for height squared -0.0840 -0.6061 0.1851
Mother’s height -0.1351 0.1381 -0.1212
Father’s weight for height squared 0.0013 -0.0900 -0.2268 Mother’s age 0.0664 -0.1281 -0.5862
-0.1871 Parity 0.0240 -0.2416 Mother’s smoking 0.0672 0.4292 0.1933
Age -0.9675 0.0127 0.0143 dBA exposure 0.0478 -0.3788 0.4948 Per capita income 0.0043 0.4477 -0,1099 Total children in household -0.1434 -0.2647 0.2548
Redundancy Xi Yi Canvar 1 45.6 7.0 Canvar 2 2.3 1.9 Canvar 3 1.4 0.8
Total 49.3 9.7
noise exposure enter as a statistically signif- icant predictor of the dependent anthropom- etric variable.
The results of the multiple regression anal- yses can be evaluated in two general ways: an assessment of the statistical significance of the variance explained by each indepen- dent variable in each of the twenty predic- tion equations of child anthropometry, and an assessment of the consistency of the direc- tion of noise exposure7s effect. In 20 child- anthropometry predicting equations, the noise exposure variable contributed either a statistically nonsignificant effect or a signif- icant negative but weak effect. One problem with interpreting 20 regression equations of child anthropometrics is that the informa- tion on the interrelationships among the set of dependent variables is not considered.
The canonical correlation analysis was in- cluded to take into account simultaneously the interrelationships among the dependent and among the independent variables. Can- onical variate pair I reflects changes in size due to age. Factor and component analyses of child anthropometry often detect a size- age relationship in the first axis (Relethford et al., 1978). The second canonical variate
pair appears to reflect a relationship of child facial breadths and upper arm circumfer- ence, and such social and biological factors as mother’s size, smoking, and income that are known to affect child growth. In this sec- ond variate pair the direction of those rela- tionships agrees with the results of other studies (e.g., here mother’s smoking is in- versely related to some measures of child anthropometry). Noise exposure loads posi- tively but weakly in this second variate pair in which facial breadths also load positively. The third canonical variate pair shows a pos- itive relationship between mother’s age and four measures of child bulk (weight, upper arm circumference, triceps and subscapular skinfolds). It also shows an inverse relation- ship between these measures of child bulk and noise exposure. Canonical correlation supports in quantitative terms the observa- tion made from surveying 20 multiple regression analyses: Child noise exposure has a weak, negative relationship to anthropo- metric measures of child bulk.
Conclusions regarding the effects of noise should be based on agreement among the three analyses. Taken together the analyses suggest that variation in airport noise expo-
AIRPORT NOISE AND POSTNATAL GROWTH IN CHILDREN 481
sure bears only a weak relationship to but a few anthropometric measurements of noise- exposed children. None of the measurements of height or breadth showed any relation to noise exposure. Those measurements that bore the greatest relationship to airport noise exposure were measurements of child bulk, particularly adiposity, and the relationships were always negative.
These results do not compieteiy agree with the many studies that have reported detri- mental effects of noise on human birth weights and on the postnatal growth of labo- ratory animals (Ando and Hattori, 1973; Knipschild et al., 1981; Iturrian and Fink, 1968; Fell et al., 1976; Autrum and von Holst, 1968). In comparison to the only other study of human postnatal growth (Takahashi and Kyo, 19681, the results of the present investi- gation agree in direction (negative when an effect is present), strength (usually weak or not present), and in being more evident among males. However, in the previous work on Japanese children measurements of fat- ness were not made, and significant differ- ences were observed in comparisons of weight, and to a lesser extent in height, pa- rameters not noticeably affected in this in- vestigation.
Two features of the present study that bear upon the comparison to previous work are the consideration of the social characteristics of the sample families, and of the variability in noise exposure within the exposed sample. Some studies of human populations have not considered the socioeconomic characteristics of the subjects in detail, nor considered the contribution of parental anthropometry to the differences observed in birth weight or postnatal growth between exposed and unex- posed samples. As a result, some studies have been criticized for confusing socioeconomic effects with effects of noise exposure. (This criticism has been leveled most recently by Frerichs et al. [1980] toward the research by Meecham and Shaw [1979] into mortality rates in Los Angeles county.) While it may be impossible to remove the effects of all con- founding factors in a study relating growth to a single environmental variable, the pres- ent study may be less open to the usual crit- icism of ignoring the population’s social characteristics and parental anthropometry. Information on these variables was included in some of the statistical analyses of noise’s effect and in the interpretation of between- sample differences in child anthropometry. Therefore, the results from the present study
may not agree with previous ones because of the integration of social and biological fac- tors achieved in the present analyses.
The degree of quantification of airport noise exposure for individual subjects also differs between the present and previous investiga- tions. In previous studies of the effects of airport noise, all subjects living close to an airport are grouped together. When children are grouped on the basis of current residence vis-a-vis a noise source, new arrivals are grouped with long-term residents even though their respective noise exposure from only this one source may be quite different. In the present study, airport noise exposure was individually estimated for each child based on information about their length of stay at each residence in the study area. Con- sequently, it is known that within the sam- ple of noise-exposed children there exists a large range of noise exposures, a range equivalent in sound energy to the difference between the means for the exposed and unex- posed groups. During airplane takeoffs, some children’s homes are exposed to 104 dBA while others to less than 75 dBA, a difference of nearly 1,000 times in the intensity of noise. Grouping these children together in contrast with nonexposed children may hide a rela- tionship between noise and physical growth that might exist only along a range from high to very high exposures. Interestingly, the results that most strongly indicate an effect of noise were the regression analyses in which the analytic model considers indi- vidual differences in exposure. The sugges- tion is that low and moderate exposures to noise do not have an effect on growth while the effect of the severe, rare exposures needs further investigation.
In summary, the present study suggests that exposure to airport noise has little effect on most measures of postnatal growth even after considering potentially confounding so- cial and biological characteristics of the sam- ple families. When individual differences in aircraft noise exposure are considered, there is some indication that only the most severe exposures (i.e., from residences where levels exceed 100 dBA during takeoffs) may have any affect at all. Further research should, therefore, focus attention on the effects of severe exposure.
ACKNOWLEDGMENTS
We wish to thank the people of Airport City and Residentia for their cooperation in this project and Dr. Richard Wilkinson for his
482 L.M. SCHELL AND R.J. NORELLI
helpful comments on the manuscript. This research was supported by Public Health Service grant HD11542 and the Research Foundation of the State University of New York.
LITERATURE CITED
Alpert MI, Peterson RA (1971) On the interpretation of canonical analysis. J. Marketing Res. 7%-70.
Ando Y, Hattori H (1973) Statistical studies on the ef- fects of intense noise during human fetal life. J. Sound Vib. 27t101-110.
Ando Y, Hattori H (1977) Effects of noise on human placental lactogen (HPLI levels in maternal plasma. Br. J. Obstet. Gynecol. 84t115-118.
Antrum H, von Holst D (1968) Social stress in the Tree Shrew (Tupaia glisJ and its effect on growth, body weight and reproduction. Z. Vergl. Physiol. 58t347- 355.
Battig K, Zeier H, Muller R, Buzzi R (1980) A field study of the vegetative effects of aircraft noise. Arch. Envi- ion. Health 35228-235.
Bogin B (1978) Seasonal pattern in the rate of growth in height of children living in Guatemala. Am. J. Phys. Anthropol. 49t205-210.
Bragdon, CR (1971) Noise Pollution. Philadelphia: Uni- versity of Pennsylvania Press.
Cantrell RW (1974) Prolonged exposure to intermittent noise: audiometric biochemical, motor, psychological and sleep effects. Largyngoscope 84:l-55 (10, part 2)
Cantrell RW (1979) Physiological effects of noise. Otolar- gyngol. Clin. North Am. 12.537-549.
Cohen A (1968) Noise effects on health, productivity and well-being. Trans. NY Acad. Sci. 30t910-918.
Cohen A (1973) Industrial noise and medical absence, and accident record data on exposed workers. In United States Environmental Protection Agency (ed): Proceed- ings of the International Congress on Noise as a Public Health Problem. Washington: U S . Government Print- ing Office, pp. 431439.
Cohen S, Krantz DS, Evans GW, Stokola D (1981) Car- diovascular and behavioral effects of community noise. Am. Sci. 69528-535.
Eveleth P (1966) The effect of climate upon gowth . Ann. N.Y. Acad. Sci. 134t750-759.
Fell R, Ellis C, Griffith D (1976) Thyroid response to acoustic stimulation. Environ. Res. 12t208-213.
Frerichs RR, Beeman BL, Coulson AH (1980) Los Ange- les airport noise and mortality-faulty analysis and public policy. Am. J. Public Health 70:357-362.
Frisancho AR (1970) Developmental responses to high altitude hypoxia. Am. J. Phys. Anthropol. 32t401-408.
Glaser ER, Kauders RM (1975) A Resurvey and a New Baseline of Community Noise in Southwest Philadel- phia and Vicinity. Paper presented at the 1975 Na- tional Noise and Vibration Conference, Atlanta, GA.
Hair JF, Anderson RE, Tatham RL, Grablowsky BJ (1979) Multivariate Data Analysis with Readings. Tulsa: P.P.C.
Iturrian WE, Fink GB (1968) Effect of noise in the ani- mal house on seizure susceptibility and growth of mice. Lab. Anim. Care 18557-560.
Karagodina IL, Soldatkina SA, Vinokur IL, Klimukhin AA (1969) Effect of aircraft noise on the population near airports. Hygiene Sanitation 341182-187.
Knipschild P (1977a) Medical effects of aircraft noise: General practice survey. Int. Arch. Occup. Environ. Health 40:191-196.
[suppl. 11.
Knipschild P (1977b) Medical effects of aircraft noise: Community cardiovascular survey. Int. Arch. Occup. Environ. Health 40:185-190.
Knipschild P, Meijer H, Salle H (1981) Aircraft noise and birth weight. Int. Arch. Occup. Environ. Health 48t131- 136.
Knipschild P, Oudschoorn N (1977) Medical effects of aircraft noise: drug survey. Int. Arch. Occup. Environ. Health 4Ot197-200.
Kryter KD (1972) Non-auditory effects of environmental noise. Am. J. Public Health 62t389-398.
Levine MS (1977) Canonical Analysis and Factor Com- parison. Sage University Paper on Quantitative Appli- cations in the Social Sciences, 07-006. Beverly Hills: Sage.
Meecham WC, Shaw N (1979) Effects of jet noise on mortality rates. Br. J. Audiol. 13t77-80.
National Center for Health Statistics (1972) Skinfold thicknesses of children 6-11 vears. U.S. Pub. Health Ser. Pub. No. 73-1602, S e r i e s l l , No. 20. Washington: U S . Govt. Print. Off.
Nie NH, Hull CH, Jenkins JG, Steinbrenner K, Brent DH (1975) SPSS: Statistical Package for the Social Sciences, 2nd Ed. New York: McGraw-Hill.
Relethford JH, Lees FC, Byard PJ (1978) The use of principle components in the analysis of cross-sectional growth data. Hum. Biol. 50:461-475.
Sackler A, Weltman A, Bradshaw M, Jutshuk P (1959) Endocrine changes due to auditory stress. Acta Endo- crinol. 31:405-418.
Schell LM (1980) Environmental Noise and the Prenatal and Postnatal Growth of Children. Ph.D. Dissertation. Ann Arbor: University Microfilms.
Schell LM (1981) Enviromental noise and human pre- natal growth. Am. J. Phys. Anthropol. 56t63-70.
Schell LM, Lieberman LS (1981) Noise stress and cancer. In K Bammer and BN Newberry (edsl: Stress and Cancer. Toronto: Hogrefe, pp. 202-232.
Sontag LW, Wallace RF (1935) The movement response of the human fetus to sound stimuli. Child Dev. 6t253- 258.
Steward AL, Brook RH, Kane RL (1980) Conceptualiza- tion and measurement of health habits for adults in the health insurance study: Vol. 11, Overweight. Rand: Santa Monica, CA.
Sutow WW, Conrad RA, Griffith KM (1965) Growth sta- tus of children exposed to fallout radiation on Marshall Islands. Pediatrics 36t721-731.
Takahashi I, Kyo S (1968) Studies on the differences in adaptabilities to the noise environment in sexes and growing processes. J. Anthropol. SOC. Nippon. 76:34-51.
Tanner J (1966) Growth and physique in different popu- lations of mankind. In P Baker and JS Weiner (eds): The Biology of Human Adaptability. London: Oxford University Press, pp. 45-66.
Tanner J M (1978) A concise history of growth studies from Buffon to Boas. In F Falkner and JM Tanner (eds): Human Growth 3: Neurobiology and Nutrition. New York: Plenum, pp. 515-593.
Van de Geer J (1971) Introduction to Multivariate Anal- ysis for the Social Sciences. San Francisco: Freeman.
Welch BL, Welch AM (1970) Physiological Effects of Noise. New York: Plenum.
Williams LM, Spence A, Tideman SC (1977) Implications of the observed effect of air pollution on birth weight. SOC. Bid. 24t1-9.
Yoshimura T, Ikeda M (1978) Growth of school children with polychlorinated biphenyl poisoning or yusho. En- viron. Res. 17t416-425.