Airfoil Design Outline of this Chapter History of Airfoil Development ...
10
Airfoil Design Outline of this Chapter The chapter is divided into several sections. The first of these consist of an introduction to airfoils: some history and basic ideas. The latter sections deal with simple results that relate the airfoil geometry to its basic aerodynamic characteristics. The latter sections deal with the process of airfoil design. History of Airfoil Development The earliest serious work on the development of airfoil sections began in the late 1800's. Although it was known that flat plates would produce lift when set at an angle of incidence, some suspected that shapes with curvature, that more closely resembled bird wings would produce more lift or do so more efficiently. H.F. Phillips patented a series of airfoil shapes in 1884 after testing them in one of the earliest wind tunnels in which "artificial currents of air (were) produced from induction by a steam jet in a wooden trunk or conduit." Octave Chanute writes in 1893, "...it seems very desirable that further scientific experiments be be made on concavo-convex surfaces of varying shapes, for it is not impossible that the difference between success and failure of a proposed flying machine will depend upon the sustaining effect between a plane surface and one properly curved to get a maximum of 'lift'." At nearly the same time Otto Lilienthal had similar ideas. After carefully measuring the shapes of bird wings, he tested the airfoils below (reproduced from his 1894 book, "Bird Flight as the Basis of Aviation") on a 7m diameter "whirling machine". Lilienthal believed that the key to successful flight was wing curvature or camber. He also experimented with different nose radii and thickness distributions.
-
Upload
khangminh22 -
Category
Documents
-
view
0 -
download
0
Transcript of Airfoil Design Outline of this Chapter History of Airfoil Development ...
Airfoil Design
Outline of this Chapter
The chapter is divided into several sections. The first of these consist of an introduction to airfoils: some
history and basic ideas. The latter sections deal with simple results that relate the airfoil geometry to its
basic aerodynamic characteristics. The latter sections deal with the process of airfoil design.
History of Airfoil Development
The earliest serious work on the development of airfoil
sections began in the late 1800's. Although it was known
that flat plates would produce lift when set at an angle of
incidence, some suspected that shapes with curvature,
that more closely resembled bird wings would produce
more lift or do so more efficiently. H.F. Phillips patented
a series of airfoil shapes in 1884 after testing them in
one of the earliest wind tunnels in which "artificial
currents of air (were) produced from induction by a
steam jet in a wooden trunk or conduit." Octave Chanute
writes in 1893, "...it seems very desirable that further
scientific experiments be be made on concavo-convex
surfaces of varying shapes, for it is not impossible that
the difference between success and failure of a proposed
flying machine will depend upon the sustaining effect
between a plane surface and one properly curved to get a
maximum of 'lift'."
At nearly the same time Otto Lilienthal had similar ideas. After
carefully measuring the shapes of bird wings, he tested the
airfoils below (reproduced from his 1894 book, "Bird Flight as
the Basis of Aviation") on a 7m diameter "whirling machine".
Lilienthal believed that the key to successful flight was wing
curvature or camber. He also experimented with different nose
radii and thickness distributions.
Airfoils used by the Wright Brothers closely resembled Lilienthal's sections: thin and highly cambered.
This was quite possibly because early tests of airfoil sections were done at extremely low Reynolds
number, where such sections behave much better than thicker ones. The erroneous belief that efficient
airfoils had to be thin and highly cambered was one reason that some of the first airplanes were biplanes.
The use of such sections gradually diminished over the next decade.
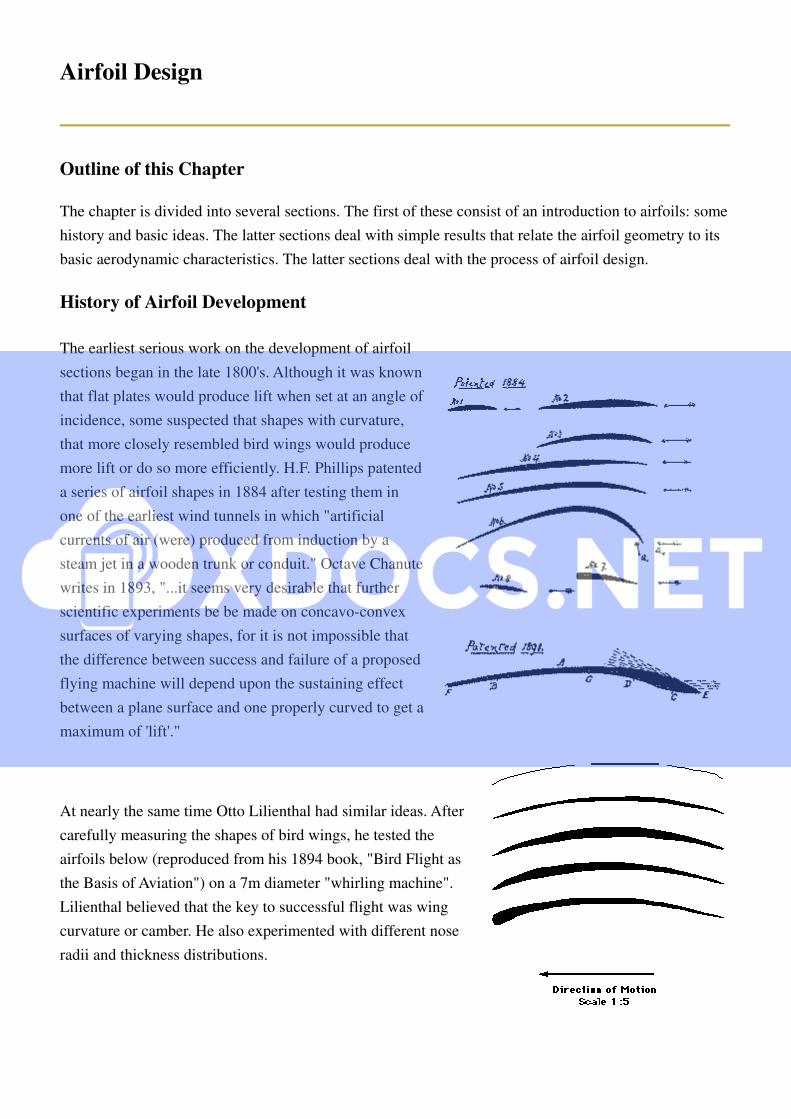
A wide range of airfoils were developed, based primarily on trial and error. Some of the more successful
sections such as the Clark Y and Gottingen 398 were used as the basis for a family of sections tested by
the NACA in the early 1920's.
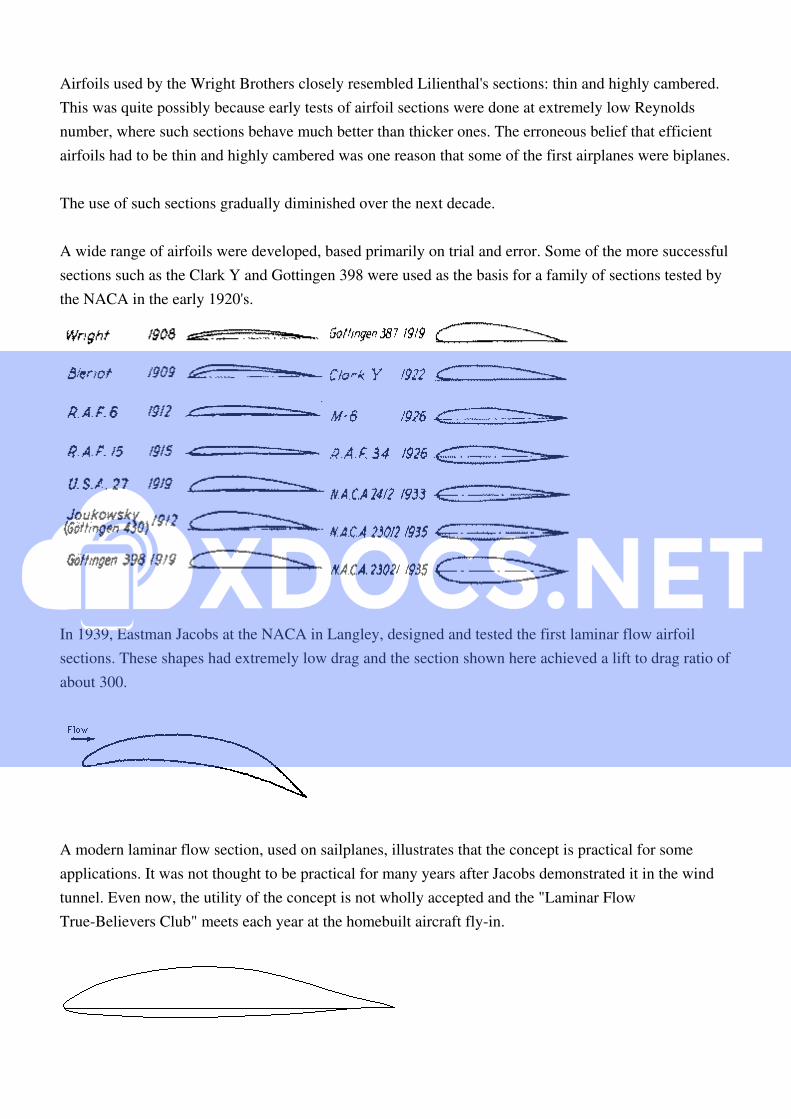
In 1939, Eastman Jacobs at the NACA in Langley, designed and tested the first laminar flow airfoil
sections. These shapes had extremely low drag and the section shown here achieved a lift to drag ratio of
about 300.
A modern laminar flow section, used on sailplanes, illustrates that the concept is practical for some
applications. It was not thought to be practical for many years after Jacobs demonstrated it in the wind
tunnel. Even now, the utility of the concept is not wholly accepted and the "Laminar Flow
True-Believers Club" meets each year at the homebuilt aircraft fly-in.
One of the reasons that modern airfoils look quite different from one another and designers have not
settled on the one best airfoil is that the flow conditions and design goals change from one application to
the next. On the right are some airfoils designed for low Reynolds numbers.
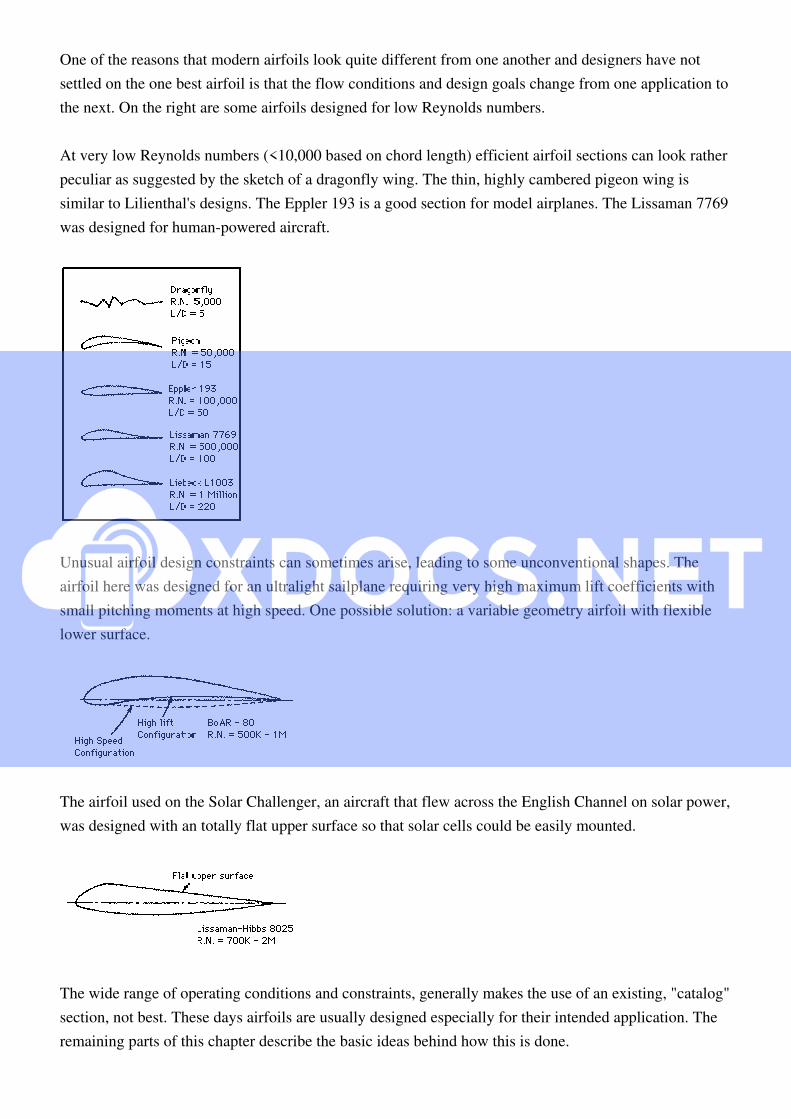
At very low Reynolds numbers (<10,000 based on chord length) efficient airfoil sections can look rather
peculiar as suggested by the sketch of a dragonfly wing. The thin, highly cambered pigeon wing is
similar to Lilienthal's designs. The Eppler 193 is a good section for model airplanes. The Lissaman 7769
was designed for human-powered aircraft.
Unusual airfoil design constraints can sometimes arise, leading to some unconventional shapes. The
airfoil here was designed for an ultralight sailplane requiring very high maximum lift coefficients with
small pitching moments at high speed. One possible solution: a variable geometry airfoil with flexible
lower surface.
The airfoil used on the Solar Challenger, an aircraft that flew across the English Channel on solar power,
was designed with an totally flat upper surface so that solar cells could be easily mounted.
The wide range of operating conditions and constraints, generally makes the use of an existing, "catalog"
section, not best. These days airfoils are usually designed especially for their intended application. The
remaining parts of this chapter describe the basic ideas behind how this is done.

Airfoil Geometry
Airfoil geometry can be characterized by the coordinates of the upper and lower surface. It is often
summarized by a few parameters such as: maximum thickness, maximum camber, position of max
thickness, position of max camber, and nose radius. One can generate a reasonable airfoil section given
these parameters. This was done by Eastman Jacobs in the early 1930's to create a family of airfoils
known as the NACA Sections.
The NACA 4 digit and 5 digit airfoils were created by superimposing a simple meanline shape with a
thickness distribution that was obtained by fitting a couple of popular airfoils of the time:
+- y = (t/0.2) * (.2969*x0.5
- .126*x - .3537*x2 + .2843*x
3 - .1015*x
4)
The camberline of 4-digit sections was defined as a parabola from the leading edge to the position of
maximum camber, then another parabola back to the trailing edge.
NACA 4-Digit Series:
4 4 1 2
max camber position max thickness
in % chord of max camber in % of chord
in 1/10 of c
After the 4-digit sections came the 5-digit sections such as the famous NACA 23012. These sections had
the same thickness distribution, but used a camberline with more curvature near the nose. A cubic was
faired into a straight line for the 5-digit sections.
NACA 5-Digit Series:
2 3 0 1 2
approx max position max thickness

camber of max camber in % of chord
in % chord in 2/100 of c
The 6-series of NACA airfoils departed from this simply-defined family. These sections were generated
from a more or less prescribed pressure distribution and were meant to achieve some laminar flow.
NACA 6-Digit Series:
6 3, 2 - 2 1 2
Six- location half width ideal Cl max thickness
Series of min Cp of low drag in tenths in % of chord
in 1/10 chord bucket in 1/10 of Cl
After the six-series sections, airfoil design became much more specialized for the particular application.
Airfoils with good transonic performance, good maximum lift capability, very thick sections, very low
drag sections are now designed for each use. Often a wing design begins with the definition of several
airfoil sections and then the entire geometry is modified based on its 3-dimensional characteristics.
Airfoil Pressure Distributions
The aerodynamic performance of airfoil sections can be studied most easily by reference to the
distribution of pressure over the airfoil. This distribution is usually expressed in terms of the pressure
coefficient:
Cp is the difference between local static pressure and freestream static pressure, non-dimensionalized by
the freestream dynamic pressure.
What does an airfoil pressure distribution look like? We generally plot Cp vs. x/c.
x/c varies from 0 at the leading edge to 1.0 at the trailing edge. Cp is plotted "upside-down" with
negative values (suction), higher on the plot. (This is done so that the upper surface of a conventional
lifting airfoil corresponds to the upper curve.)
The Cp starts from about 1.0 at the stagnation point near the leading edge...
It rises rapidly (pressure decreases) on both the upper and lower surfaces...
...and finally recovers to a small positive value of Cp near the trailing edge.
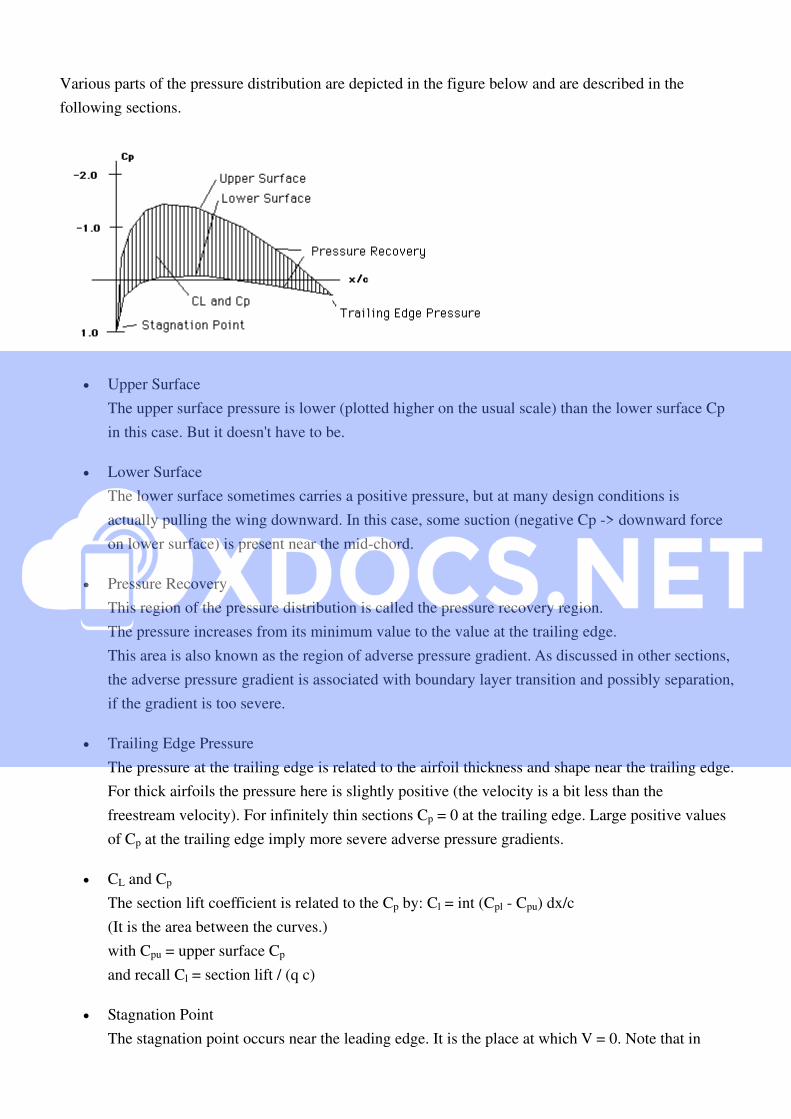
Various parts of the pressure distribution are depicted in the figure below and are described in the
following sections.
• Upper Surface
The upper surface pressure is lower (plotted higher on the usual scale) than the lower surface Cp
in this case. But it doesn't have to be.
• Lower Surface
The lower surface sometimes carries a positive pressure, but at many design conditions is
actually pulling the wing downward. In this case, some suction (negative Cp -> downward force
on lower surface) is present near the mid-chord.
• Pressure Recovery
This region of the pressure distribution is called the pressure recovery region.
The pressure increases from its minimum value to the value at the trailing edge.
This area is also known as the region of adverse pressure gradient. As discussed in other sections,
the adverse pressure gradient is associated with boundary layer transition and possibly separation,
if the gradient is too severe.
• Trailing Edge Pressure
The pressure at the trailing edge is related to the airfoil thickness and shape near the trailing edge.
For thick airfoils the pressure here is slightly positive (the velocity is a bit less than the
freestream velocity). For infinitely thin sections Cp = 0 at the trailing edge. Large positive values
of Cp at the trailing edge imply more severe adverse pressure gradients.
• CL and Cp
The section lift coefficient is related to the Cp by: Cl = int (Cpl - Cpu) dx/c
(It is the area between the curves.)
with Cpu = upper surface Cp
and recall Cl = section lift / (q c)
• Stagnation Point
The stagnation point occurs near the leading edge. It is the place at which V = 0. Note that in
incompressible flow Cp = 1.0 at this point. In compressible flow it may be somewhat larger.
We can get a more intuitive picture of the pressure distribution by looking at some examples and this is
done in some of the following sections in this chapter.
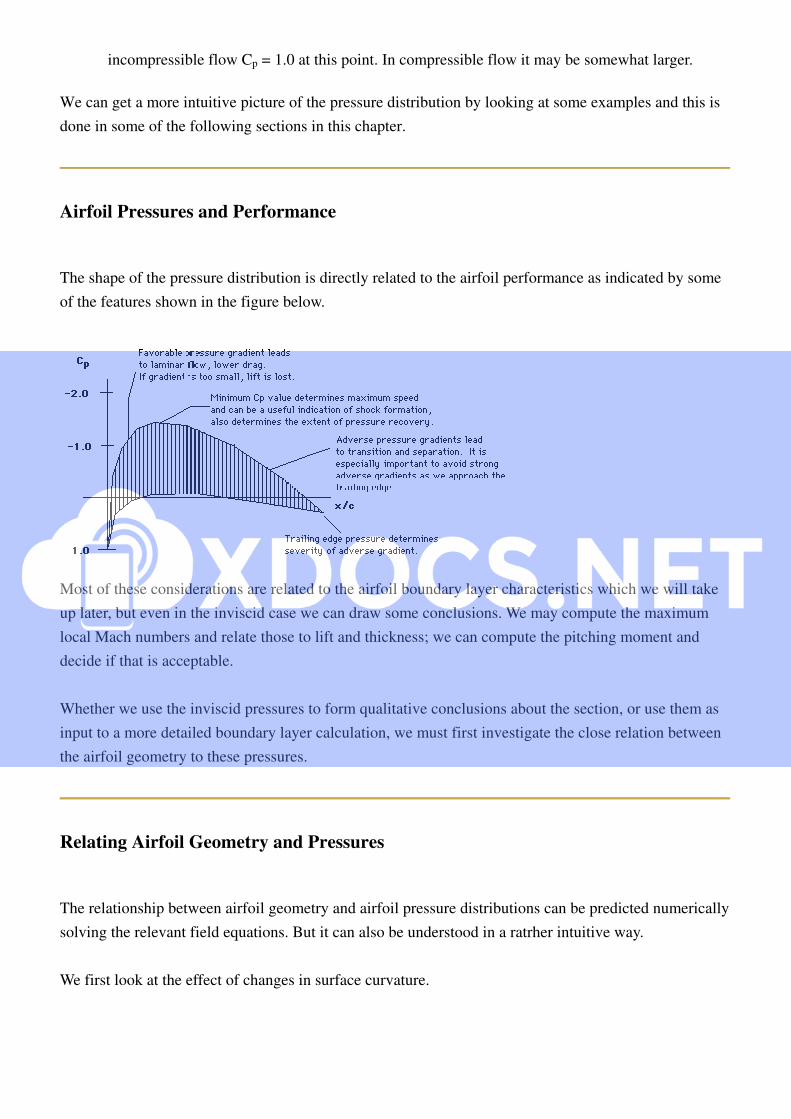
Airfoil Pressures and Performance
The shape of the pressure distribution is directly related to the airfoil performance as indicated by some
of the features shown in the figure below.
Most of these considerations are related to the airfoil boundary layer characteristics which we will take
up later, but even in the inviscid case we can draw some conclusions. We may compute the maximum
local Mach numbers and relate those to lift and thickness; we can compute the pitching moment and
decide if that is acceptable.
Whether we use the inviscid pressures to form qualitative conclusions about the section, or use them as
input to a more detailed boundary layer calculation, we must first investigate the close relation between
the airfoil geometry to these pressures.
Relating Airfoil Geometry and Pressures
The relationship between airfoil geometry and airfoil pressure distributions can be predicted numerically
solving the relevant field equations. But it can also be understood in a ratrher intuitive way.
We first look at the effect of changes in surface curvature.
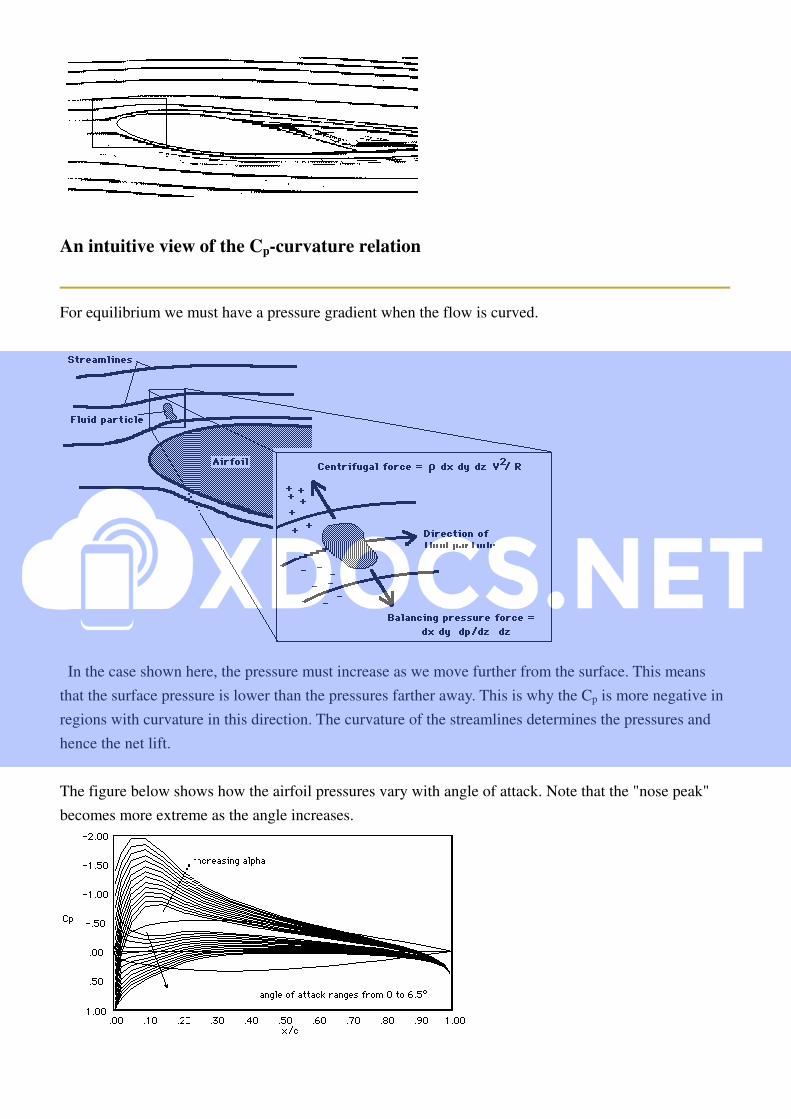
An intuitive view of the Cp-curvature relation
For equilibrium we must have a pressure gradient when the flow is curved.
In the case shown here, the pressure must increase as we move further from the surface. This means
that the surface pressure is lower than the pressures farther away. This is why the Cp is more negative in
regions with curvature in this direction. The curvature of the streamlines determines the pressures and
hence the net lift.
The figure below shows how the airfoil pressures vary with angle of attack. Note that the "nose peak"
becomes more extreme as the angle increases.
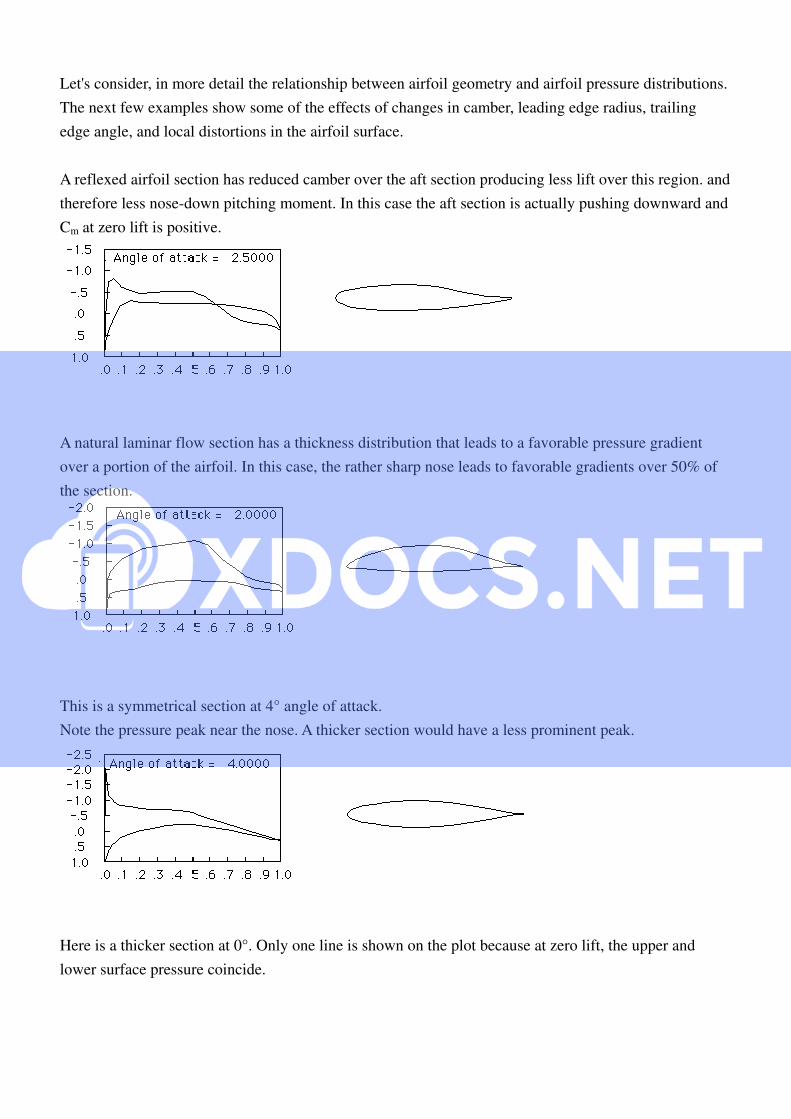
Let's consider, in more detail the relationship between airfoil geometry and airfoil pressure distributions.
The next few examples show some of the effects of changes in camber, leading edge radius, trailing
edge angle, and local distortions in the airfoil surface.
A reflexed airfoil section has reduced camber over the aft section producing less lift over this region. and
therefore less nose-down pitching moment. In this case the aft section is actually pushing downward and
Cm at zero lift is positive.
A natural laminar flow section has a thickness distribution that leads to a favorable pressure gradient
over a portion of the airfoil. In this case, the rather sharp nose leads to favorable gradients over 50% of
the section.
This is a symmetrical section at 4° angle of attack.
Note the pressure peak near the nose. A thicker section would have a less prominent peak.
Here is a thicker section at 0°. Only one line is shown on the plot because at zero lift, the upper and
lower surface pressure coincide.
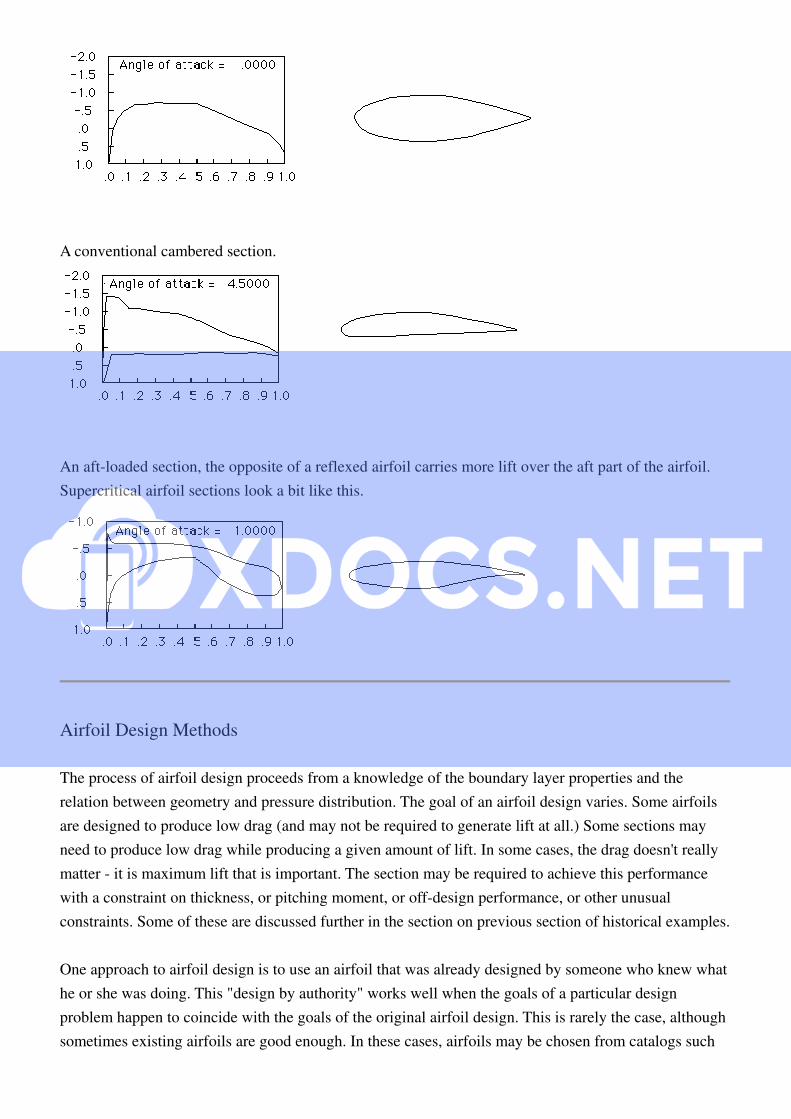
A conventional cambered section.
An aft-loaded section, the opposite of a reflexed airfoil carries more lift over the aft part of the airfoil.
Supercritical airfoil sections look a bit like this.
Airfoil Design Methods
The process of airfoil design proceeds from a knowledge of the boundary layer properties and the
relation between geometry and pressure distribution. The goal of an airfoil design varies. Some airfoils
are designed to produce low drag (and may not be required to generate lift at all.) Some sections may
need to produce low drag while producing a given amount of lift. In some cases, the drag doesn't really
matter - it is maximum lift that is important. The section may be required to achieve this performance
with a constraint on thickness, or pitching moment, or off-design performance, or other unusual
constraints. Some of these are discussed further in the section on previous section of historical examples.
One approach to airfoil design is to use an airfoil that was already designed by someone who knew what
he or she was doing. This "design by authority" works well when the goals of a particular design
problem happen to coincide with the goals of the original airfoil design. This is rarely the case, although
sometimes existing airfoils are good enough. In these cases, airfoils may be chosen from catalogs such