Airfoil Design Outline of this Chapter History of Airfoil Development
Upload
khangminh22Category
view
2download
0
American Institute of Aeronautics and Astronautics1
An overview of NACA 6-digit airfoil series characteristicswith reference to airfoils for large wind turbine blades.
W.A. Timmer1
Delft University Wind Energy Research Institute, DUWIND, The Netherlands
[Abstract] This paper investigates the NACA 63 and 64 6-digit series of airfoils tested inthe NACA LTPT in view to verify the RFOIL calculated airfoil characteristics for highReynolds numbers. Some anomalies in the zero-lift angles of 15% and 18% thick airfoilsfrom these series are identified, both in the airfoil clean case and in case of wrap-aroundroughness. It is found that RFOIL predicts the maximum lift coefficient at a Reynoldsnumber of 3 million well, but consistently under predicts the Cl,max for Reynolds numbers of6 and 9 million. It is, however, based on other comparisons at high Reynolds numbersunclear if this is due to an inability of the prediction code or to a deviation in the test results.The drag coefficient is under predicted with about 9% for a wide range of airfoils andReynolds numbers. Due to wrap-around roughness the maximum lift coefficient decreaseswith 18% to 20%.
Nomenclatureα = angle of attack (degr.)Cl = lift coefficientCl,i = design lift coefficientCl,max = maximum lift coefficientCd = drag coefficientc = airfoil chordi = indication of design liftM = Mach numbern = amplification factor in RFOILRe = Reynolds number
I. IntroductionIn the beginning of the revival of wind energy as an energy source in the seventies of the last century, NACAairfoils were adopted for wind turbine blades as a result of the availability of two-dimensional aerodynamic
characteristics, even for airfoils with a fairly large relative thickness. The NACA four and five-digit series were lateron abandoned for their sensitivity to roughness, but airfoils from the NACA 63 and 64 six-digit series are still beingused in wind turbine blades today.
Since the seventies special wind turbine dedicated airfoil designs have found their way to blade and turbinemanufacturers. Many of these designs were experimentally verified in wind tunnels up to Reynolds numbers of 3 to4 million.
With the present trend towards very large turbines the Reynolds numbers have grown to about 10 million.Testing at these high Reynolds numbers is very expensive since this requires a large atmospheric tunnel, a pressuretunnel or a cryogenic tunnel. For all three types of facilities a fairly expensive model is needed as well. This leads tothe situation that little experimental data is available for existing wind turbine dedicated airfoils at Reynoldsnumbers higher than 4 million. Blade designers now have to rely on the predictive value of airfoil analysis codessuch as XFOIL or Navier-Stokes solvers.Since the NACA airfoils we are discussing here were tested at Reynolds numbers up to 9 million these data can beused to verify the accuracy of the prediction codes and even a renewed interest for these airfoils may be noticedamong wind turbine blade manufacturers.
1 Assistant professor, TU Delft, Faculty of Aerospace Engineering, Kluyverweg 1, 2629HS Delft, The Netherlands
I
47th AIAA Aerospace Sciences Meeting Including The New Horizons Forum and Aerospace Exposition5 - 8 January 2009, Orlando, Florida
AIAA 2009-268
Copyright © 2009 by the American Institute of Aeronautics and Astronautics, Inc. All rights reserved.

American Institute of Aeronautics and Astronautics2
The design and testing of the NACA airfoils some 70 years ago was a tremendous effort and rendered valuableinformation to many aerodynamicists world wide. However, when using it for verification, we have to take a closerlook at the various test results. It appears that some anomalies in the data can be detected, which invites us tocritically investigate all the relevant data.In this paper the accuracy of these NACA measurements will be discussed and comparisons will be made withcalculations and data from other facilities.
II. Measurements in the Langley LTPT
A. ModelsThe measurements of the well known NACA airfoils1 were performed in the Langley low-turbulence pressure
tunnel. This is a pressure tunnel with a contraction ratio of 20:1 and a test section of 3x7.5 feet (0.914 m x 2.29 m).The two feet (0.61 m) chord models were made of laminated mahogany. The model surface was painted withlacquer and sanded with no. 400 carborundum paper. The models completely spanned the three feet test sectionwidth. The maximum test section velocity at atmospheric pressure was about 130 m/s. The measurements had amaximum Mach number of 0.17.The airfoils considered here are airfoils from the 63 and 64 series designed in the forties of the last century. Theshape of these airfoils is formed by the various thickness distributions and fractions of the a=1 camber line.
B. Test setupThe lift coefficient was determined using the difference of the pressure reaction upon the tunnel floor and
ceiling. To this end pressure orifices are located over a length of 13 feet (3.96 m) on both floor and ceiling. Sincethis does not cover the entire pressure footprint of the model (which theoretically extends to infinity both upstreamand downstream of the model) a lift efficiency factor was calculated which gives the ratio of measured lift to theactual lift, depending on the basic mean-line loading of the airfoil.The drag coefficient was determined by integrating the total pressure loss in the wake, measured with a rake.Assuming the static pressure is constant across the wake and assuming the variation of the total pressure in the wakecan be represented by a normal probability curve, the uncorrected drag was calculated using the static pressurecoefficient and the maximum total pressure loss in the wake.
C. Wind tunnel wall correctionsTo the lift and drag coefficients the basic corrections for blockage and lift interference have been applied, as givenby Allen & Vincenti 2.
Re = 3.0x10⁶
-1.0
-0.5
0.0
0.5
1.0
1.5
0.000 0.008 0.016 0.024cd
cl
-1.0
-0.5
0.0
0.5
1.0
1.5
-10 0 10 20α (o)
cl
NACA 63-618
NACA 63-418
NACA 63-218
NACA 63-018
Figure 1. The effect of camber on the characteristics of an 18% thick airfoil from the NACA 63 6-digit seriesat a Reynolds number of 3x10⁶. For clarity the indices in the airfoil designations have been omitted.
American Institute of Aeronautics and Astronautics3
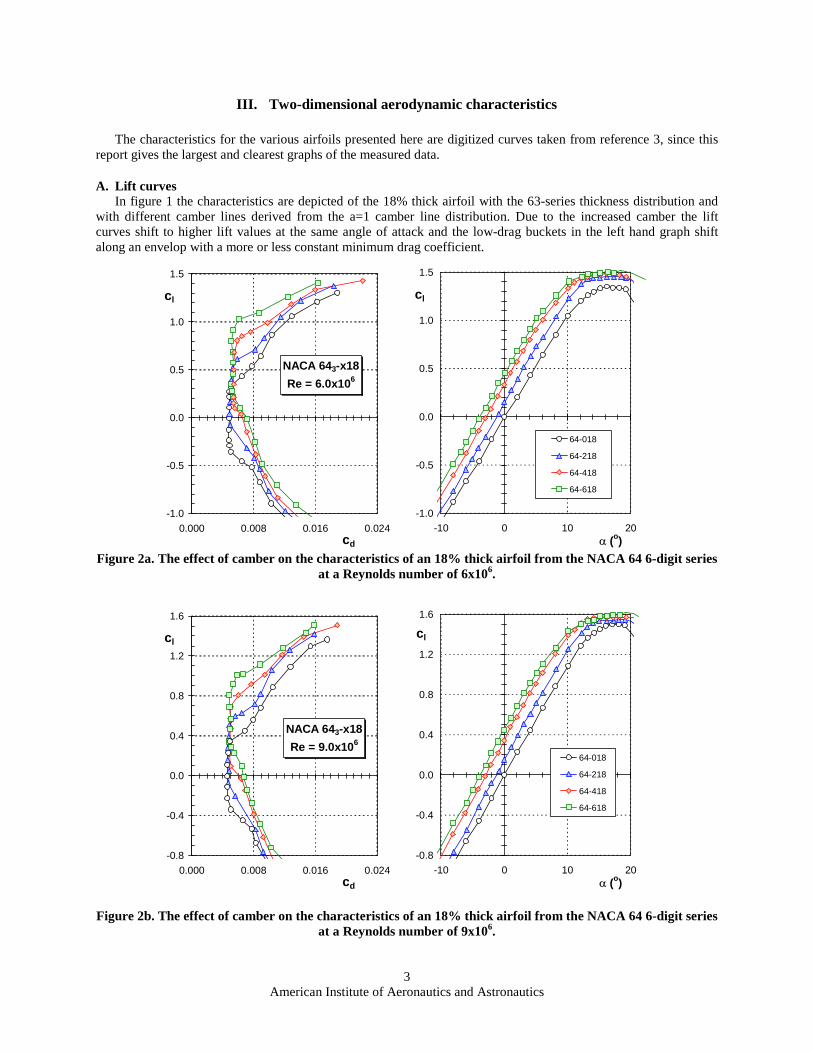
III. Two-dimensional aerodynamic characteristics
The characteristics for the various airfoils presented here are digitized curves taken from reference 3, since thisreport gives the largest and clearest graphs of the measured data.
A. Lift curvesIn figure 1 the characteristics are depicted of the 18% thick airfoil with the 63-series thickness distribution and
with different camber lines derived from the a=1 camber line distribution. Due to the increased camber the liftcurves shift to higher lift values at the same angle of attack and the low-drag buckets in the left hand graph shiftalong an envelop with a more or less constant minimum drag coefficient.
NACA 643-x18
Re = 6.0x10⁶
-1.0
-0.5
0.0
0.5
1.0
1.5
0.000 0.008 0.016 0.024cd
cl
-1.0
-0.5
0.0
0.5
1.0
1.5
-10 0 10 20α (o)
cl
64-018
64-218
64-418
64-618
Figure 2a. The effect of camber on the characteristics of an 18% thick airfoil from the NACA 64 6-digit seriesat a Reynolds number of 6x10⁶.
NACA 643-x18
Re = 9.0x10⁶
-0.8
-0.4
0.0
0.4
0.8
1.2
1.6
0.000 0.008 0.016 0.024cd
cl
-0.8
-0.4
0.0
0.4
0.8
1.2
1.6
-10 0 10 20α (o)
cl
64-018
64-218
64-418
64-618
Figure 2b. The effect of camber on the characteristics of an 18% thick airfoil from the NACA 64 6-digit seriesat a Reynolds number of 9x10⁶.

American Institute of Aeronautics and Astronautics4
The graphs in the figures 2a and 2b show basically the same aerodynamic behavior as in figure 1, now for the 18%thick airfoil from the NACA 64 series. However the lift curves are not equally spaced. If we study this in terms ofthe zero-lift angle of attack (see figure 3) we see a distinct difference in values for the different design liftcoefficients. Also plotted in the graph are the calculated values using RFOIL4, a modified version of XFOIL and ameasured value from reference 5. The RFOIL calculations were performed with a non-linear amplification scheme,which has an effect on the drag coefficient at the upper end of the low-drag region and consequently on thepredicted maximum lift-drag ratio of the airfoil.
NACA 643-x18
Re=6x10⁶
-5
-4
-3
-2
-1
0
1
0 0.1 0.2 0.3 0.4 0.5 0.6 0.7
Design lift coefficient, Cl,iZ
ero-
lifta
ngle
(deg
rees
)
Inviscid
RFOIL
NACA
Ref. 5
Figure 3. The zero-lift angle for an 18% thick airfoil from the NACA 64 series with different design liftcoefficients. Re=6x10⁶.
It must be noted that what here is called design lift coefficient differs from the commonly used definition, being thelift coefficient at which the maximum lift-drag ratio occurs. Here the design lift coefficient is derived from thefraction of the unit camber line and roughly gives the middle of the low-drag bucket.Since the thickness distribution of the airfoils is the same and the camber line is formed by taking fractions of thesame unit camber line the zero-lift angles essentially form a straight line. This is true for the inviscid values, but alsofor the angles calculated with RFOIL. The boundary-layer thickness de-cambers the airfoil, giving zero-lift anglescloser to zero relative to the inviscid values. Since with increasing camber the upper surface adverse pressuregradients increase, giving thicker boundary layers, the distance between the inviscid and viscid curves grows withincreasing Cl,i. Figure 3 shows that the measured zero-lift angle of NACA 64-618 is too small (about 0.4 degrees)compared to the theoretical value. As this difference occurs at every Reynolds number tested, it is most likelycaused by the orientation of the model in the test section. Figure 4 shows the measured lift curve corrected with -0.4degrees relative to RFOIL calculation.
NACA 643-618
Re = 6.0x10⁶
-1.2
-0.8
-0.4
0.0
0.4
0.8
1.2
1.6
0.000 0.005 0.010 0.015 0.020
cd
cl
-1.2
-0.8
-0.4
0.0
0.4
0.8
1.2
1.6
-20 -15 -10 -5 0 5 10 15 20
α (o)
cl
NACA-0.4 degr.
RFOIL
Figure 4. The measured performance of airfoil NACA 643-618 at Re=6x10⁶ relative to the calculations aftermodification of the zero-lift angle with -0.4 degrees.

American Institute of Aeronautics and Astronautics5
B. Definition of airfoil chord.Another possible source for differences between theoretical zero-lift values and the measurements is the
definition of the chord. In the NACA tradition the shape of the airfoil is the result of a camber line combined with athickness distribution. In figure 5 the procedure is made visible, apart from the insertion of a nose circle to define thenose region with more points. With this scheme it is likely that the airfoil leading edge projects forward of the y-
axis. The airfoil should be redefined, with the chord now connecting the leading edge and the trailing edge (thelongest distance).Reference 2 refers to the chord as being the original x-axis for the camber distribution. Would this definition bemaintained in the wind tunnel than the zero-lift angle would be different relative to the redefined airfoil shape on thelongest distance. On the other hand, if the unmodified originally calculated coordinates would be fed to a programlike XFOIL, the characteristics are calculated relative to the original chord. Since the original chord for the camberline is hard to find in the actual wind tunnel model, it is assumed that all measurements are performed relative to theright (longest) chord.
NACA 632-615
Re = 6.0x10⁶
-0.8
-0.4
0.0
0.4
0.8
1.2
1.6
0.000 0.008 0.016 0.024cd
cl
-0.8
-0.4
0.0
0.4
0.8
1.2
1.6
-10 0 10 20α (o)
cl
Roughness off
Roughness on
Figure 6. The effect of wrap-around roughness on the characteristics of airfoil NACA 632-615 at Re=6x10⁶.
-7.5
-5
-2.5
0
2.5
5
7.5
-5 0 5 10 15x (%)
y (%)
Yt (thickness ordinate)
x
ϕ
xu=x- yt*sinϕxL=x+yt*cosϕ
camberline
Figure 5. The NACA-procedure to establish the airfoil co-ordinates

American Institute of Aeronautics and Astronautics6
C. Zero-lift angle in relation to roughness.Figure 6 depicts the characteristics of the NACA 632-615 airfoil with and without NACA standard roughness.According to this graph up to 8 degrees angle of attack the airfoil shows improved lift performance due to wrap-around roughness. Unfortunately this can not be true. Figure 7 provides a closer look at the zero-lift angles relativeto those for 15% thick airfoils from the 63-series with different design lift coefficients.
NACA 63-x15Re=6x10⁶
-5
-4
-3
-2
-1
0
1
0 0.1 0.2 0.3 0.4 0.5 0.6 0.7
Design lift coefficient, Cl,iZ
ero-
lifta
ngle
(deg
rees
)
Roughness
Clean
RFOIL
Figure 7. The effect of wrap-around roughness on the zero-lift angles for 15% thick airfoils in theNACA 63-series
The figure shows the trend in zero-lift angles and clearly the ones for a design lift coefficient of 0.6 do not followthe trend lines.In the roughness off case the zero-lift angle should lie around -4.27o while -3.44o was measured. In the roughsituation -4.78o was measured, whereas the trend line indicates a value of -3.75o.
NACA 632-615
Re = 6.0x10⁶
-0.8
-0.4
0.0
0.4
0.8
1.2
1.6
0.000 0.008 0.016 0.024cd
cl
-0.8
-0.4
0.0
0.4
0.8
1.2
1.6
-10 0 10 20α (o)
cl
Roughness on
Roughness off
RFOIL
Figure 8. The clean and rough performance of airfoil NACA 63-615 after modification of the zero-lift angles.RFOIL calculations with n=9

American Institute of Aeronautics and Astronautics7
Figure 8 depicts the situation after modification of the zero-lift angles. Also in the graph the RFOIL calculatedperformance of the airfoil. The picture shows a good match of the theoretical and experimental lift curves and theexpected lower calculated drag coefficient (about 9% to 10%) in the airfoil smooth configuration.
NACA 643-018
Re = 6.0x10⁶
0.0
0.5
1.0
1.5
0.000 0.008 0.016 0.024cd
cl
0.0
0.5
1.0
1.5
0 8 16 24α (o)
cl
RFOIL
positive angles
negative angles
Figure 9. The difference between the lift and drag coefficients of a symmetric airfoil at positive and negativeangles of attack.
D. Maximum lift valuesThe maximum lift coefficient is important in view of the maximum static loads on the blade. The experimental
value of Cl,max depends on the tunnel test section turbulence, the model blockage in terms of the model chord -tunnel height ratio in combination with the wind tunnel wall correction scheme and the accuracy and state of thewind tunnel model. As an example figure 9 gives the measured performance of the airfoil NACA 643-018 at aReynolds number of 6x10⁶. The figure demonstrates a clear difference in the experimental maximum lift coefficientswhereas one would expect the lift curves for the positive and negative angles of this symmetric airfoil to coincide.The lift curve in the graph has been corrected for a 0.11 degrees zero lift angle offset. In general these differencescan be attributed to differences in the model upper and lower surface contours (especially in the leading edge region)or an aberration in the angle of attack setting mechanism.
1.3
1.4
1.5
1.6
1.7
0 0.1 0.2 0.3 0.4 0.5 0.6 0.7
Design lift coefficient
Max
imu
mlif
tco
effi
cien
t
NACA Re=6x10E6RFOIL Re=6x10E6NACA Re=9x10E6RFOIL Re=9x10E6
negative angles
positive angles
NACA 64-i18
Figure 10. The measured and calculated maximum lift coefficients for 18% thick airfoils from theNACA 64 6-digit series. RFOIL calculations with n=9

American Institute of Aeronautics and Astronautics8
In this case there is a 0.09 difference in value of the maximum lift coefficients. Without any additional informationone would not know what value to pick, the more since the calculated curve gives a value more or less in betweenthe two values, albeit at a different angle of incidence.
The next picture shows us that the most likely value in this case is the one from the negative angles of attack. Figure10 gives the measured and RFOIL calculated maximum lift coefficients for the NACA 64-i18 series at the Reynoldsnumbers of 6x10⁶ and 9x10⁶. The calculated values are consistently lower with a 3.5% difference at a Reynoldsnumber of 6x10⁶. For the higher Reynolds number the difference between calculated and experimental maximum liftcoefficient increases with increasing design lift coefficient to about 6.5 % for the NACA 64-618. Adversely, figure 4shows an over prediction of the maximum lift coefficient at negative angles.
In the public domain no experimental data can be found to compare with the LTPT measurements at these highReynolds numbers. For Re=3x10⁶ data from the low-speed wind tunnel in Stuttgart, Germany can be used 6. Figure11 shows the lift curves of three NACA airfoils from the 63 series measured in both wind tunnels. In the Germanwind tunnel the lift was also derived from the wall pressures. The Stuttgart maximum lift coefficients appear to beconsistently lower, for the non-symmetric airfoils about 6.5% compared to the LTPT data. The RFOIL calculationsmatch the LTPT maximum lift well at Re=3x10⁶.
(a) (b) (c)
Figure 11. A comparison of NACA-airfoil lift measurements in the LTPT and the low-speed tunnel of theIAG Stuttgart 6. Re=3x10⁶.
Comparing the RFOIL calculations with the LTPT measurements, it seems that, with respect to the maximum liftcoefficient, the predictive value of the calculations for this type of airfoils decreases with increasing Reynoldsnumber. As mentioned before, there are little data available to serve as a check. Measurements coming closest arethe ones performed in the cryogenic wind tunnel of the DNW-KKK in Cologne, Germany 7 on the 30% thick airfoilDU 97-W-300Mod. Figure 12 shows the maximum lift coefficients of this airfoil measured up to a Reynolds numberof 10x106 at various Mach numbers. Also in the graph the calculated maximum lift coefficients at two distinctvalues of the amplification factor n, to show the difference for a situation with increased turbulence (n=5), since thecooling of the tunnel gas necessary to reach the high Reynolds numbers induces a higher turbulence intensity. Themodification to the base airfoil consisted of a reduction of the trailing edge thickness from 1.74% c to 0.49% c,which resulted in a small reduction of the lift coefficients. The low-turbulence tests results of the base airfoil areshown as well. This comparison shows an over prediction of the Cl,max by the RFOIL calculations (with the Machnumber set to 0.2), when the usual amplification factor n=9 is used. However, when the increased turbulence in thetest section is accounted for, the calculated maximum values match the tunnel data quite well. Of course one couldquestion the fact that the right turbulence intensity is represented by n=5, however the figure shows that usingRFOIL not necessarily leads to under prediction of the maximum lift coefficient at the higher Reynolds numbers.
-1.0
-0.5
0.0
0.5
1.0
1.5
-10.0 0.0 10.0 20.0
α (degr.)
cl
Stuttgart
LTPT
RFOIL
NACA 63-418
-1.5
-1.0
-0.5
0.0
0.5
1.0
1.5
-20.0 -10.0 0.0 10.0 20.0
α (degr.)
cl
Stuttgart
LTPT
RFOIL
NACA 63-018
-1.0
-0.5
0.0
0.5
1.0
1.5
-10.0 0.0 10.0 20.0
α (degr.)
cl
LTPT
Stuttgart
RFOIL
NACA 63-421

American Institute of Aeronautics and Astronautics9
If and to what extent the RFOIL code fails to predict the right maximum lift coefficient remains inconclusive fromthe foregoing.
1.0
1.2
1.4
1.6
1.8
0 2 4 6 8 10 12Rex10-6
Cl,max
KKK, M=0.1
KKK, M=0.2Du 97-W-300Mod
Base airfoil, Delft
RFOIL, n=9
RFOIL, n=5
Figure 12. The variation of the maximum lift coefficients with Reynolds number as measured and calculatedfor airfoil DU 97-W-300Mod.
E. Airfoil dragThe figures 4, 8 and 9 have already shown that the drag coefficient predicted by XFOIL / RFOIL is consistentlylower compared to the measurements. Figure 13 shows the measured and RFOIL predicted drag characteristics ofairfoil NACA 64-618 for Reynolds numbers of 3x10⁶ and 9x10⁶. The predicted drag coefficient has been multipliedby a factor of 1.09.
NACA 643-618
Re = 9.0x10⁶
-0.5
0.0
0.5
1.0
1.5
0.000 0.008 0.016 0.024cd
cl
-0.5
0.0
0.5
1.0
1.5
0.000 0.008 0.016 0.024
cl
RFOIL
NACA LTPT
Re = 3x10⁶
Cd
Figure 13. The RFOIL predicted drag coefficient (multiplied by a factor of 1.09) compared to the LTPT windtunnel measurements.
The figure shows that there is a good match between the predicted drag data with a 9% increase and the wind tunneldata. In fact this factor of 1.09 to match the experimental values is applicable to the predicted drag of most airfoils

American Institute of Aeronautics and Astronautics10
and - as figure 13 shows – in a relatively broad Reynolds numbers range as well. The LTPT drag data are found tobe in good agreement with data from other sources. At the lower end of the low drag region RFOIL seems to predicta faster transition shift towards the lower surface leading edge as the angle of attack is reduced. It can be concludedthat, using a 9% higher drag coefficient, RFOIL may be used for prediction of the drag and the maximum lift to dragratio of airfoils in the clean configuration at Reynolds numbers up to 9x10⁶.
F. Roughness effectsThe contamination of rotor blades can sometimes be significant. The degree of contamination may vary, dependingon the turbine location and the time of the year. Airfoils are chosen for their low sensitivity to roughness effects, butunfortunately the degradation in performance due to a contaminated leading edge is difficult to predict. Simplyspecifying a fixed transition location near the airfoil leading edge will not do, since this does not incorporate theincrease in boundary layer thickness and momentum loss due to the roughness elements causing the transition. Theeffect on the airfoil performance of roughness elements is typically something that can be studied during windtunnel tests. In many experiments zigzag tape is used to trip the boundary layer and depending on the location andthe thickness of the tape this gives a fairly good idea of the sensitivity of the airfoil to premature transition.However, in reality things may be even worse than the configuration with zigzag tape. The NACA tests with wrap-around roughness may be considered as a worst case scenario. Figure 14 gives the performance of the airfoils offigure 2a with NACA standard roughness consisting of no. 60 grid roughness wrapped around the leading edge fromthe lower surface 8% chord station to the upper surface 8% station.
NACA 64-x18Re = 6.0x10⁶
grid roughness
-1.0
-0.5
0.0
0.5
1.0
1.5
0.00 0.01 0.02 0.03cd
cL
-1.0
-0.5
0.0
0.5
1.0
1.5
-20 -10 0 10 20 30α (o)
cL
64-01864-21864-41864-618
Figure 14. The effect of NACA standard roughness for a 18% thick NACA 64 series airfoil with variousdesign lift coefficients.
Compared to the clean situation not only the drag has increased considerably, but due to the roughness the airfoilssuffer from a significant loss in maximum lift coefficient.Figure 15 depicts the variation of maximum lift with the maximum airfoil thickness for the 64-4xx series both in theclean situation and in the case of NACA standard roughness. It appears that due to the roughness the loss inmaximum lift amounts to 18-20%.The lift curves in figure 14 do not show a regular increase with increasing camber. The zero-lift angles depicted infigure 16 show a deviating value for NACA 64-418. According to the measurements the zero-lift angle is -3.01degrees, whereas the trend line indicates a value of -2.47, a difference of 0.54 degrees.

American Institute of Aeronautics and Astronautics11
1
1.2
1.4
1.6
1.8
10 12 14 16 18 20 22
Airfoil maximum thickness (%)
Cl-m
ax
Clean
Wrap-around roughness
NACA 64-4xx series
Figure 15. The variation of the maximum lift coefficient with airfoil thickness both in the clean case and withNACA standard roughness
NACA 643-x18
Re=6x10⁶
-5
-4
-3
-2
-1
0
1
0 0.1 0.2 0.3 0.4 0.5 0.6 0.7
Design lift coefficient, Cl,i
Zer
o-lif
tang
le(d
egre
es)
Roughness off
Roughness on
Figure 16. The effect of NACA standard roughness on the zero-lift angle of an 18% thick airfoil from theNACA 64 series with varying camber.
The difference of the effect of wrap-around roughness and roughness on discrete chord locations (NASA standardroughness) has been measured for airfoil LS(1)-04178. NASA standard roughness consisted of 2.5 mm wide stripswith no. 80 grid at x/c=0.08 both on the upper and lower surface. Clearly the wrap-around roughness induces asubstantially higher loss in lift than the roughness on 8% of the chord. The maximum lift coefficient for this airfoildrops 18.5% from 2 to 1.63 whereas the NASA standard roughness only reduces lift with 4.5%. The minimum dragcoefficient increases about 50% due to the wrap-around roughness, which is significantly larger than measured forthe NACA 64-series showing an increase of about 20%.Since the effect of leading edge contamination is significant and difficult to predict and as long as it is unclear whatdegree of contamination may be expected on wind turbine blades it remains necessary to perform wind tunnel testson new airfoils at the appropriate Reynolds numbers. To establish the effect of leading edge contamination on theturbine performance side by side tests of a turbine with clean(ed) blades and one with an untreated rotor may givevaluable information, also as input to the design of new dedicated airfoils.

American Institute of Aeronautics and Astronautics12
LS(1)-0417Re = 6.0x10⁶
-1.0
-0.5
0.0
0.5
1.0
1.5
2.0
0.000 0.015 0.030 0.045
cd
cl
-1.0
-0.5
0.0
0.5
1.0
1.5
2.0
-10 0 10 20 30
α (o)
cl
NACA roughness
NASA roughness
Free transition
Figure 17. The effect of NACA standard roughness and NASA standard roughness on the performance ofairfoil LS(1)-0417
IV. Conclusions
The two-dimensional aerodynamics characteristics of the NACA 63 and 64 six-digit series of airfoils measured inthe NASA LTPT have been investigated, with a view to verify RFOIL calculations at high Reynolds numbers.The following conclusions can be drawn:
- The zero-lift angle of the NACA 64-618 airfoil needs to be adjusted with -0.4 degrees.- The zero-lift angle of The NACA 63-615 needs to be corrected with -0.87 degrees in the smooth case and
with +1 degree in case of wrap around roughness.- The maximum lift coefficients predicted with RFOIL match the LTPT data well at Re=3x10⁶, but under
predict the Cl,max at Re=6x106 by 3.5 % , up to 6.5% at Re=9x10⁶.- It is uncertain if the established differences in lift between experiment and calculations are caused by a
constant bias in the measurements or by the fact that the RFOIL code fails to predict the right level ofmaximum lift.
- RFOIL consistently under predicts the drag coefficient. The difference is about 9% for a wide range ofairfoils and Reynolds numbers
- NACA standard roughness causes a reduction in the lift coefficient of 18% to 20% for most airfoils fromthe NACA 64 series
- The zero-lift angle of airfoil NACA 64-418 with wrap-around roughness needs a correction of +0.54degrees.
- Wind tunnel experiments and side-by-side tests in the field with one clean rotor need to be done to be ableto better predict the effects of roughness.
V References
1Abbott, I.H., and von Doenhoff, A.E., Theory of Wing Sections, Dover publications, Inc. New York 19582Allen, H.J. and Vincenti, W.G., “Interference in a Two-dimensional-flow Wind Tunnel with Consideration of
the Effect of Compressibility”. NACA Report no. 782, 19443Abbott, I.H., von Doenhoff, A.E., and Stivers, L.S., “Summary of Airfoil Data”. NACA Report no. 824, 1945

American Institute of Aeronautics and Astronautics13
4 Rooij, R.P.J.O.M. van, “Modification of the boundary layer in XFOIL for improved airfoil stall prediction”.Report IW-96087R, Delft University of Technology, September 1996. Delft, The Netherlands.
5 Fuglsang, P and Bove, S., “Wind Tunnel Testing Of Airfoils Involves More Than Just Wind Tunnel WallCorrections”. Proceedings of the European Wind Energy Conference 2008, Brussels, Belgium. June 2008
6Althaus, D., Airfoils and Experimental Results from the Laminar Wind Tunnel of the Institut für Aerodynamikund Gasdynamik der Universität Stuttgart. IAG Stuttgart 1995
7 Timmer, W.A. and Schaffarczyk,A.P. “The Effect of Roughness at High Reynolds Numbers on thePerformance of DU 97-W-300Mod”. Proceedings of the conference The Science of making Torque from Wind, April2004, Delft, The Netherlands. pp. 71-77.
8 McGhee, R.J. and Beasley, W.D., “Low-Speed Aerodynamic Characteristics of a 17-Percent-thick AirfoilSection Designed for General Aviation Applications”. NASA TN D-7428, 1973.
Copyright © 2022 FDOKUMEN