Joint co-clustering: Co-clustering of genomic and clinical bioimaging data
Upload
khangminh22Category
view
0download
0
AIR VOID CLUSTERING IN CONCRETE
by
JAN VOSAHLIK
B.S., Czech Technical University in Prague, Czech Republic, 2012
A THESIS
submitted in partial fulfillment of the requirements for the degree
MASTER OF SCIENCE
Department of Civil Engineering
College of Engineering
KANSAS STATE UNIVERSITY
Manhattan, Kansas
2014
Approved by:
Major Professor
Kyle A. Riding

Copyright
JAN VOSAHLIK
2014

Abstract
Air void clustering around coarse aggregate in concrete has been identified as a potential source
of low strengths in concrete mixes by several Departments of Transportation around the country.
Research was carried out to (1) develop a quantitative measure of air void clustering around
aggregates, (2) investigate whether air void clustering can be reproduced in a laboratory
environment, (3) determine if air void clustering can blamed for lower compressive strengths in
concrete mixes, (4) and identify potential factors that may cause clustering.
Five types of coarse aggregate and five different air entraining agents were included in the
laboratory study to see if aggregate type or chemical composition of air entraining agent directly
relates to air void clustering. A total of 65 mixes were made, implementing the frequently used
technique of retempering that has been previously associated with air void clustering around
aggregates. Compressive strength specimens as well as samples for hardened void analysis were
made. Compressive strength at 7 and 28 days was determined and the automated hardened void
analysis (including a new method of clustering evaluation) was performed on all samples.
It was found that it is possible to reproduce air void clustering in laboratory conditions.
However, the results have shown that retempering does not always cause air void clustering. It was
also observed that air void clustering is not responsible for a decrease in compressive strength of
retempered concrete as neither aggregate type nor chemical composition of air entraining agent
had a significant impact on severity of void clustering around coarse aggregate particles. It was
also found that the total air content and an inhomogeneous microstructure and not air void
clustering were responsible for lower strengths.
iv
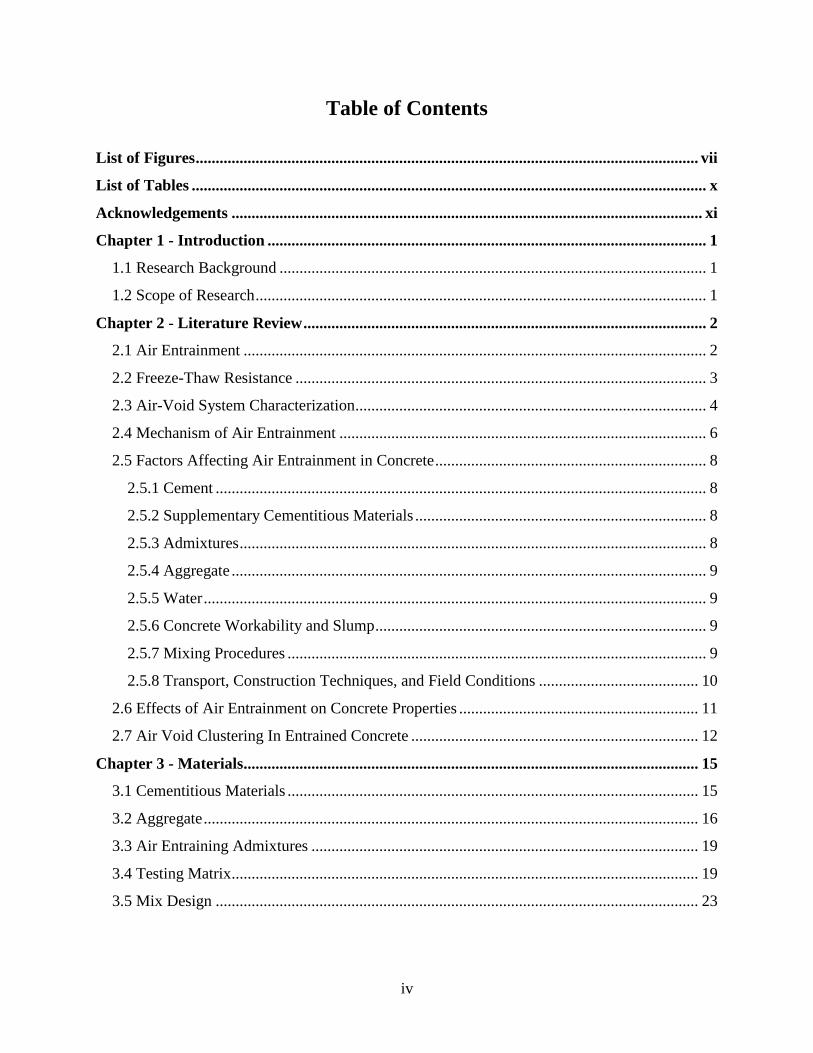
Table of Contents
List of Figures .............................................................................................................................. vii
List of Tables ................................................................................................................................. x
Acknowledgements ...................................................................................................................... xi
Chapter 1 - Introduction .............................................................................................................. 1
1.1 Research Background ........................................................................................................... 1
1.2 Scope of Research ................................................................................................................. 1
Chapter 2 - Literature Review ..................................................................................................... 2
2.1 Air Entrainment .................................................................................................................... 2
2.2 Freeze-Thaw Resistance ....................................................................................................... 3
2.3 Air-Void System Characterization ........................................................................................ 4
2.4 Mechanism of Air Entrainment ............................................................................................ 6
2.5 Factors Affecting Air Entrainment in Concrete .................................................................... 8
2.5.1 Cement ........................................................................................................................... 8
2.5.2 Supplementary Cementitious Materials ......................................................................... 8
2.5.3 Admixtures ..................................................................................................................... 8
2.5.4 Aggregate ....................................................................................................................... 9
2.5.5 Water .............................................................................................................................. 9
2.5.6 Concrete Workability and Slump ................................................................................... 9
2.5.7 Mixing Procedures ......................................................................................................... 9
2.5.8 Transport, Construction Techniques, and Field Conditions ........................................ 10
2.6 Effects of Air Entrainment on Concrete Properties ............................................................ 11
2.7 Air Void Clustering In Entrained Concrete ........................................................................ 12
Chapter 3 - Materials.................................................................................................................. 15
3.1 Cementitious Materials ....................................................................................................... 15
3.2 Aggregate ............................................................................................................................ 16
3.3 Air Entraining Admixtures ................................................................................................. 19
3.4 Testing Matrix ..................................................................................................................... 19
3.5 Mix Design ......................................................................................................................... 23
v
Chapter 4 - Laboratory Study ................................................................................................... 25
4.1 Mixing Procedure ............................................................................................................... 25
4.2 Material Testing and Evaluation Methods .......................................................................... 27
4.2.1 Fresh Concrete Properties Testing ............................................................................... 27
4.2.2 Compressive Strength .................................................................................................. 28
4.2.3 Air Void Analysis of Hardened Concrete .................................................................... 28
4.3 Cutting of Specimens .......................................................................................................... 29
4.4 Surface Polishing ................................................................................................................ 30
4.5 Scanning .............................................................................................................................. 33
4.6 Raw Image Alignment ........................................................................................................ 35
4.7 Phase Detection ................................................................................................................... 35
False Color Image ............................................................................................................. 37
4.8 Air Void Analysis ............................................................................................................... 37
4.9 Air Void Clustering Evaluation .......................................................................................... 38
4.10 Air Void Clustering Rating ............................................................................................... 39
Chapter 5 - Field Testing ............................................................................................................ 40
5.1 Introduction ......................................................................................................................... 40
5.2 Methods .............................................................................................................................. 40
5.3 Materials, Mix Design & Retempering ............................................................................... 41
Chapter 6 - Results...................................................................................................................... 42
6.1 Fresh Concrete Properties ................................................................................................... 42
6.2 Compressive Strength ......................................................................................................... 47
6.3 Air Void Content of Hardened Concrete ............................................................................ 50
6.4 Air Void Clustering ............................................................................................................ 54
6.5 Field Samples ...................................................................................................................... 57
Chapter 7 - Discussion ................................................................................................................ 60
7.1 Retempering ........................................................................................................................ 60
7.2 Aggregate Type ................................................................................................................... 69
7.3 Type of Air Entraining Agent ............................................................................................. 80
7.4 Visual Rating of Air Void Clustering ................................................................................. 88
7.5 Field Testing ....................................................................................................................... 90
vi
Chapter 8 - Conclusions and Recommendations ..................................................................... 91
8.1 Conclusions ......................................................................................................................... 91
8.2 Recommendations ............................................................................................................... 92
8.3 Future Research Needs ....................................................................................................... 92
References .................................................................................................................................... 93
Appendix A - Hardened Air Void Analysis Results ................................................................. 96
Appendix B - Visual Rating of Air Void Clustering .............................................................. 122
Appendix C - Hardened Air Void Analysis Procedure ......................................................... 187
vii
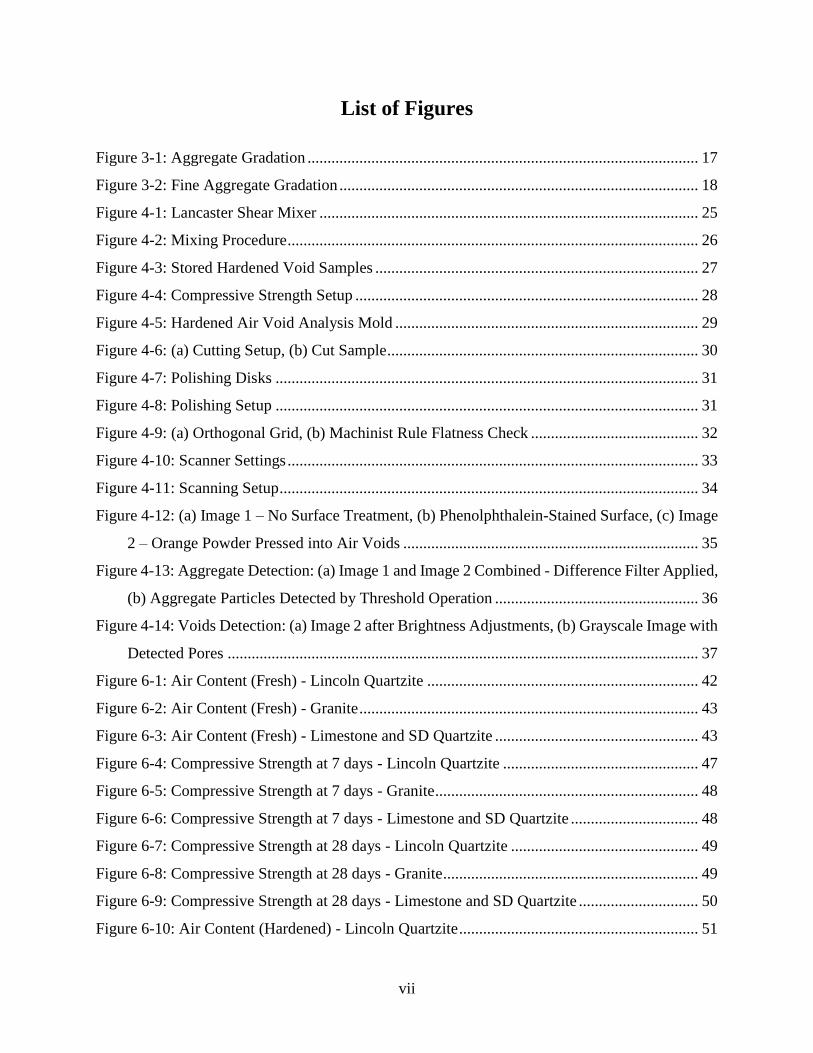
List of Figures
Figure 3-1: Aggregate Gradation .................................................................................................. 17
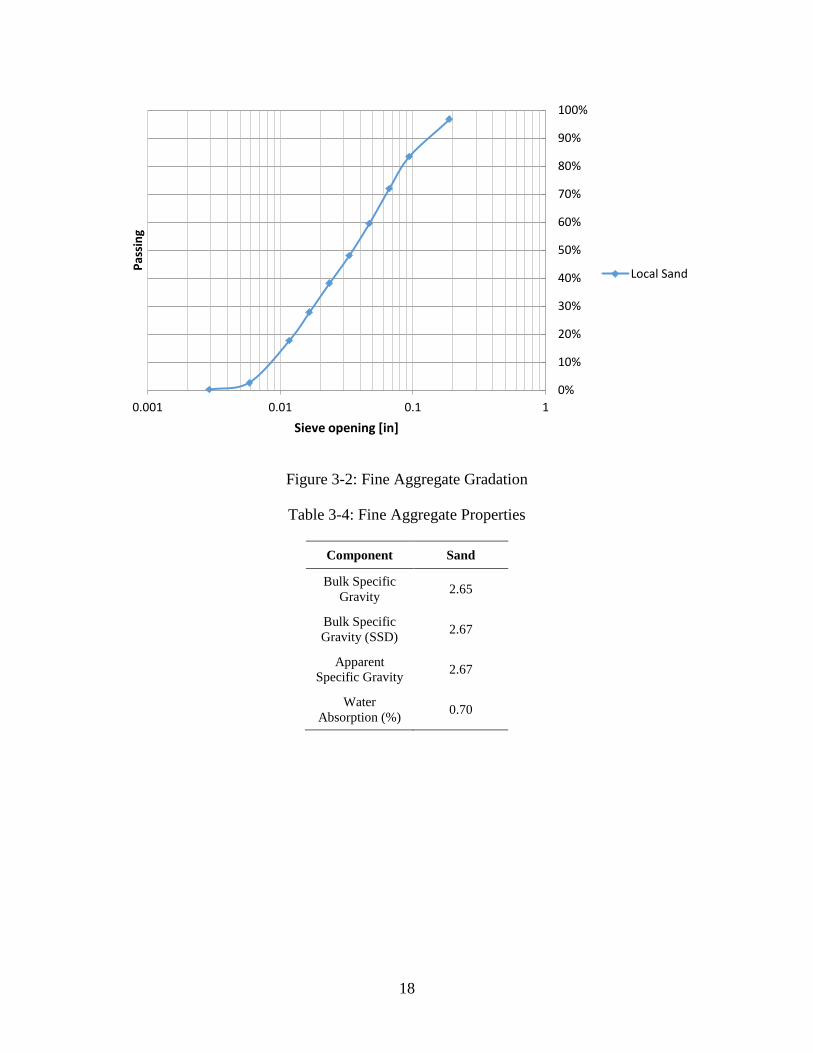
Figure 3-2: Fine Aggregate Gradation .......................................................................................... 18
Figure 4-1: Lancaster Shear Mixer ............................................................................................... 25
Figure 4-2: Mixing Procedure ....................................................................................................... 26
Figure 4-3: Stored Hardened Void Samples ................................................................................. 27
Figure 4-4: Compressive Strength Setup ...................................................................................... 28
Figure 4-5: Hardened Air Void Analysis Mold ............................................................................ 29
Figure 4-6: (a) Cutting Setup, (b) Cut Sample .............................................................................. 30
Figure 4-7: Polishing Disks .......................................................................................................... 31
Figure 4-8: Polishing Setup .......................................................................................................... 31
Figure 4-9: (a) Orthogonal Grid, (b) Machinist Rule Flatness Check .......................................... 32
Figure 4-10: Scanner Settings ....................................................................................................... 33
Figure 4-11: Scanning Setup ......................................................................................................... 34
Figure 4-12: (a) Image 1 – No Surface Treatment, (b) Phenolphthalein-Stained Surface, (c) Image
2 – Orange Powder Pressed into Air Voids .......................................................................... 35
Figure 4-13: Aggregate Detection: (a) Image 1 and Image 2 Combined - Difference Filter Applied,
(b) Aggregate Particles Detected by Threshold Operation ................................................... 36
Figure 4-14: Voids Detection: (a) Image 2 after Brightness Adjustments, (b) Grayscale Image with
Detected Pores ...................................................................................................................... 37
Figure 6-1: Air Content (Fresh) - Lincoln Quartzite .................................................................... 42
Figure 6-2: Air Content (Fresh) - Granite ..................................................................................... 43
Figure 6-3: Air Content (Fresh) - Limestone and SD Quartzite ................................................... 43
Figure 6-4: Compressive Strength at 7 days - Lincoln Quartzite ................................................. 47
Figure 6-5: Compressive Strength at 7 days - Granite .................................................................. 48
Figure 6-6: Compressive Strength at 7 days - Limestone and SD Quartzite ................................ 48
Figure 6-7: Compressive Strength at 28 days - Lincoln Quartzite ............................................... 49
Figure 6-8: Compressive Strength at 28 days - Granite ................................................................ 49
Figure 6-9: Compressive Strength at 28 days - Limestone and SD Quartzite .............................. 50
Figure 6-10: Air Content (Hardened) - Lincoln Quartzite ............................................................ 51
viii
Figure 6-11: Air Content (Hardened) - Granite ............................................................................ 51
Figure 6-12: Air Content (Hardened) - Limestone and SD Quartzite .......................................... 52
Figure 6-13: Spacing Factor - Lincoln Quartzite .......................................................................... 52
Figure 6-14: Spacing Factor - Granite .......................................................................................... 53
Figure 6-15: Spacing Factor - Limestone and SD Quartzite......................................................... 53
Figure 6-16: Clustering Index - Lincoln Quartzite ....................................................................... 54
Figure 6-17: Clustering Index - Granite........................................................................................ 55
Figure 6-18: Clustering Index - Limestone and SD Quartzite ...................................................... 55
Figure 6-19: Clustering Index (Visual Rating) - Lincoln Quartzite ............................................. 56
Figure 6-20: Clustering Index (Visual Rating) - Granite .............................................................. 56
Figure 6-21: Clustering Index (Visual Rating) - Limestone and SD Quartzite ............................ 57
Figure 6-22: Compressive Strength at 7 days - Field Testing ...................................................... 58
Figure 6-23: Compressive Strength at 28 days - Field Testing .................................................... 58
Figure 6-24: Hardened Air Void Content - Field Testing............................................................. 59
Figure 6-25: Clustering Index - Field Testing .............................................................................. 59
Figure 7-1: Slump Before and After Retempering ....................................................................... 61
Figure 7-2: Fresh Air Content Before and After Retempering ..................................................... 61
Figure 7-3: Air Content vs Unit Weight ....................................................................................... 62
Figure 7-4: Clustering Index - Before and After Retempering ..................................................... 63
Figure 7-5: Clustering Index - After Retempering and Control Mixes ........................................ 63
Figure 7-6: Compressive Strength at 7 days ................................................................................. 64
Figure 7-7: Compressive Strength at 28 days ............................................................................... 65
Figure 7-8: Clustering Index vs Compressive Strength at 7 days ................................................. 66
Figure 7-9: Clustering Index vs Compressive Strength at 28 days ............................................... 67
Figure 7-10: Fresh Air Content vs Compressive Strength at 7 days............................................. 68
Figure 7-11: Fresh Air Content vs Compressive Strength at 28 days........................................... 68
Figure 7-12: Slump Change after Retempering ............................................................................ 69
Figure 7-13: Increase in Air Content after Retempering by Aggregate Type .............................. 70
Figure 7-14: Clustering Index - Non-washed Lincoln Quartzite .................................................. 70
Figure 7-15: Clustering Index - Washed Lincoln Quartzite ......................................................... 71
Figure 7-16: Clustering Index - Granite........................................................................................ 71
ix
Figure 7-17: Clustering Index - Limestone ................................................................................... 71
Figure 7-18: Clustering Index - SD Quartzite............................................................................... 72
Figure 7-19: Clustering Index vs Compressive Strength - Non-washed Lincoln Quartzite ......... 73
Figure 7-20: Clustering Index vs Compressive Strength - Washed Lincoln Quartzite ................ 73
Figure 7-21: Clustering Index vs Compressive Strength - Granite ............................................... 74
Figure 7-22: Clustering Index vs Compressive Strength - Limestone .......................................... 74
Figure 7-23: Clustering Index vs Compressive Strength - SD Quartzite ...................................... 75
Figure 7-24: AEA Dosage vs Air Content - Lincoln Quartzite .................................................... 76
Figure 7-25: Lower Density Zones (a) 1-II-R, (b) 2-II-R, (c), 1-III-R, (d) 1-I-C. ........................ 77
Figure 7-26: Compressive Strength - Lincoln Quartzite ............................................................... 79
Figure 7-27: Increase in Slump After Retempering by Used AEA .............................................. 80
Figure 7-28: Increase in Air Content after Retempering by Used AEA ....................................... 81
Figure 7-29: Clustering Index - Daravair 1000............................................................................. 82
Figure 7-30: Clustering Index - AEA-92S .................................................................................... 82
Figure 7-31: Clustering Index - Daravair M ................................................................................. 83
Figure 7-32: Clustering Index - Polychem SA-50 ........................................................................ 83
Figure 7-33: Clustering Index - Darex II ...................................................................................... 84
Figure 7-34: Clustering Index - Average by AEA ........................................................................ 84
Figure 7-35: Compressive Strength vs Change in Clustering Index - Daravair 1000 .................. 85
Figure 7-36: Compressive Strength vs Change in Clustering Index - AEA-92S ......................... 86
Figure 7-37: Compressive Strength vs Change in Clustering Index - Daravair M ....................... 86
Figure 7-38: Compressive Strength vs Change in Clustering Index - Polychem SA-50 .............. 87
Figure 7-39: Compressive Strength vs Change in Clustering Index - Darex II ............................ 87
Figure 7-40: Compressive Strength vs Change in Fresh Air Content .......................................... 88
Figure 7-41: Visual Clustering Evaluation ................................................................................... 89
x
List of Tables
Table 2-1: Air Entraining Agents ................................................................................................... 6
Table 3-1: Cement Chemical Composition - XRF ....................................................................... 15
Table 3-2: Compound Calculations – ASTM C150 ..................................................................... 16
Table 3-3: Coarse Aggregate Properties ....................................................................................... 17
Table 3-4: Fine Aggregate Properties ........................................................................................... 18
Table 3-5: Air Entraining Agents ................................................................................................. 19
Table 3-6: Labeling System .......................................................................................................... 20
Table 3-7: Testing Matrix ............................................................................................................. 21
Table 3-8: Testing Matrix – Control Mixes .................................................................................. 22
Table 3-9: Mix Designs ................................................................................................................ 24
Table 3-10: AEA Dosages (fl oz per 100 lbs of cement) .............................................................. 24
Table 5-1: Mix Design - 1PT0835A ............................................................................................. 41
Table 6-1: Fresh Concrete Properties - Before Retempering........................................................ 44
Table 6-2: Fresh Concrete Properties - After Retempering .......................................................... 45
Table 6-3: Fresh Concrete Properties - Control Mixes ................................................................. 46
Table 6-4: Fresh Concrete Properties - Field Testing ................................................................... 57
Table 7-1: Low Density Zones in Lincoln Quartzite .................................................................... 78

xi
Acknowledgements
I would like to thank to Dr. Kyle Riding for the opportunity to work on this project and his
guidance through it as well as to Dr. Asad Esmaeily for his encouragement to pursue the master’s
degree at Kansas State University and his help on the software development. I also would like to
acknowledge the Kansas Department of Transportation for research funding provided for the study
through its K-TRAN program.
I surely appreciate all the help provided by undergraduate and graduate students who
collaborated on various tasks performed in this project. Without their support I would not have
been able to complete this research. Big thank you belongs to Ryan Benteman, K-State Department
of Civil Engineering Research Technologist, for his help with laboratory equipment and tools.
Finally, I would like to thank to my parents Jana and Radek for always supporting me during
my studies and encouraging me to pursue my dreams.
1
Chapter 1 - Introduction
1.1 Research Background
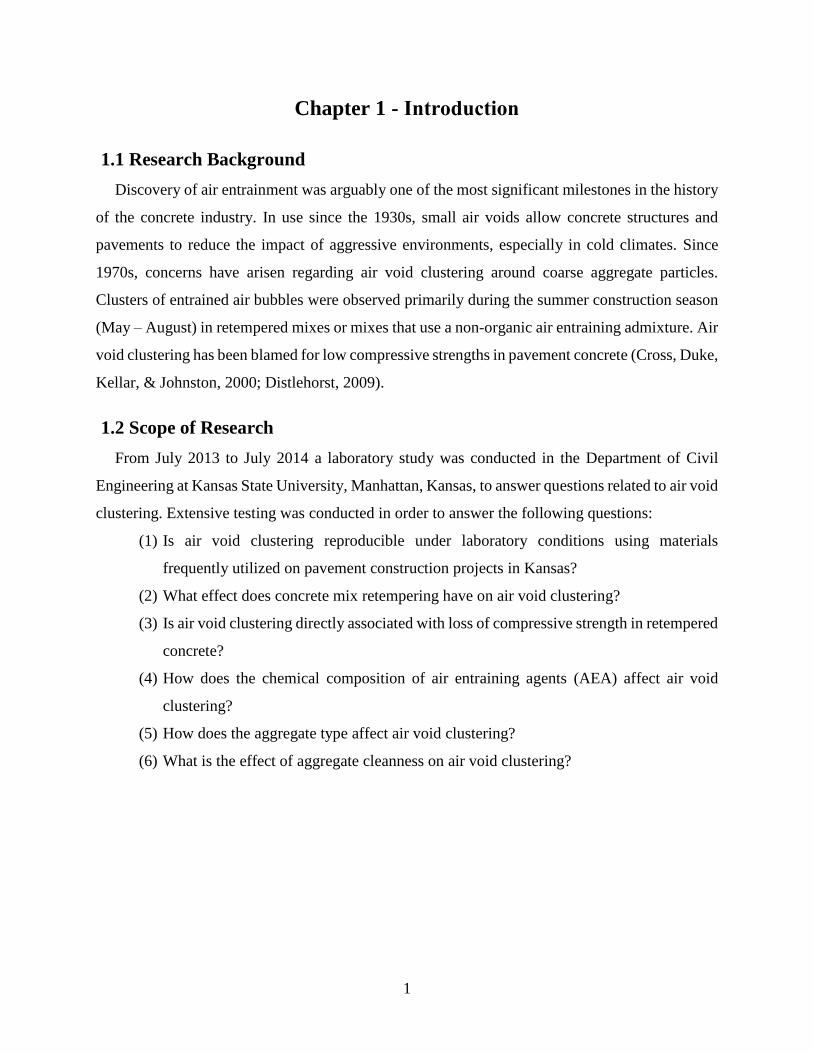
Discovery of air entrainment was arguably one of the most significant milestones in the history
of the concrete industry. In use since the 1930s, small air voids allow concrete structures and
pavements to reduce the impact of aggressive environments, especially in cold climates. Since
1970s, concerns have arisen regarding air void clustering around coarse aggregate particles.
Clusters of entrained air bubbles were observed primarily during the summer construction season
(May – August) in retempered mixes or mixes that use a non-organic air entraining admixture. Air
void clustering has been blamed for low compressive strengths in pavement concrete (Cross, Duke,
Kellar, & Johnston, 2000; Distlehorst, 2009).
1.2 Scope of Research
From July 2013 to July 2014 a laboratory study was conducted in the Department of Civil
Engineering at Kansas State University, Manhattan, Kansas, to answer questions related to air void
clustering. Extensive testing was conducted in order to answer the following questions:
(1) Is air void clustering reproducible under laboratory conditions using materials
frequently utilized on pavement construction projects in Kansas?
(2) What effect does concrete mix retempering have on air void clustering?
(3) Is air void clustering directly associated with loss of compressive strength in retempered
concrete?
(4) How does the chemical composition of air entraining agents (AEA) affect air void
clustering?
(5) How does the aggregate type affect air void clustering?
(6) What is the effect of aggregate cleanness on air void clustering?

2
Chapter 2 - Literature Review
2.1 Air Entrainment
Similar to other breakthroughs in the concrete industry (such a reinforced concrete), air
entrained concrete was discovered accidently. In the mid-1930s, a beef tallow was used as a
grinding aid in cement production in New York State (Torrans & Ivey, 1968). Concrete made from
this cement showed significantly improved resistance to freezing and thawing when exposed to
water. Subsequent research attributed improved freeze-thaw performance to the incorporation of
a fine air void system in the cement paste.
Currently, air-entrained concrete is required in cold climates or environments that include
freezing water (Kosmatka, Kerkhoff, & Panarese, 2003). However, entrained air voids are not the
only air bubbles found in concrete. T. C. Powers and his colleagues (1953), pioneers in the research
of air-entrained concrete, defined three groups of voids in concrete:
Gel pores. These are the smallest pores that can be found in cement paste (0.5 nm – 10 nm) and
water in these pores usually does not freeze. Gel pores represent approximately 28% of the total
volume of hydration products (Pigeon & Pleau, 1995).
Capillary pores. The size of these pores varies from 50nm to 10 μm (Pigeon & Pleau, 1995).
Capillary pores fill spaces between cement grains and hydration products originally occupied by
water. Gel and capillary pores are randomly distributed over the concrete mass, separated with
cement hydration products so water can move through pores with changes in ambient conditions.
Air entrained voids. These voids are larger by order of magnitude than the gel or capillary pores.
Entrained air voids size typically ranges between 10 to 1000 microns (Kosmatka, Kerkhoff, &
Panarese, 2003; Walker, Lane, & Paul, 2006). Air bubbles, defined as entrained air voids, are
“artificially” stabilized in concrete by adding air entraining admixtures (AEAs) to the concrete
mix.
In addition to these three main groups of pores, two other types of air voids can be found in
hardened concrete: entrapped voids (pores formed by air with radii bigger than 1000 micrometers)
and water voids (irregularly shaped air voids primarily formed by water). These two void types
weaken the concrete instead of offering benefits (Walker, Lane, & Paul, 2006).
3
2.2 Freeze-Thaw Resistance
A quality air void system in hardened concrete significantly improves its frost resistance.
Several theories explaining the principle how air entrained concrete improve frost durability have
been developed. The first theory adopted the basic explanation of water behavior under freezing
conditions, i.e., expansion of water volume when transforming from liquid to solid phase.
Unfortunately, this theory did not account for the micro scale of concrete air system, thereby
neglecting some important factors (such as void size, capillary effects or air void distribution in
cement paste). Consequently, Powers (1949) introduced his hydraulic pressure theory. According
to this theory, when water presented in capillary pores freezes and saturates the pores, remaining
water forced from the pores must move to available free spaces in the cement paste: air voids.
Hydraulic pressure drives this motion, thereby obeying water flow rules of Darcy’s law. When
distance to the next available pore is too long or the freezing rate is too fast, hydraulic pressure
within the cement paste may exceed available tensile strength, causing tensile crack formation in
the paste. This theory was the first to provide a mathematical relationship between paste properties,
freezing rate, and air void spacing (Pigeon & Pleau, 1995).
Power’s original theory, however, was found to be inconsistent with experimental data, so a
modified theory known as the osmotic pressure theory was introduced (Powers & Helmuth, 1953).
This theory accounts for the effect of dissolved alkalis in water in pores. Because these ions are
present in the solution and the capillary pores are very small (50nm to 10 μm), the freezing point
of water in these pores is lower than 32°F (0°C). During freezing, the concentration of dissolved
chemicals in water increases, freezing stops, and the moment of water’s melting point (reduced
due to alkali presence) becomes equal to the ambient temperature. In other words, equilibrium
between the ice and water solution is reached at that temperature. Considering the effect of pore
size on freezing temperature (the lower the pore size, the lower the freezing temperature of water
in the pore), the balanced temperature level is lower in smaller pores and, therefore, equilibrium is
not preserved. Thus, water from smaller pores (including gel pores) moves to larger pores in order
to reestablish a balanced state; this motion creates internal pressure that may cause cracking in the
cement paste. If a sufficient air void system is created in concrete, ice formed in these voids more
readily attracts water than capillary pores and protects the paste from damage.
Litvan (1973) elaborates on the assumption that water cannot freeze inside capillary pores due
to changes in vapor pressure, and states that water must travel through the paste to the external
4
surface in order to freeze. Therefore, if it requires longer period of time for water to travel from an
air void to the external surface than to freeze in the pore, internal pressure can cause damage.
One of the newest theories (Chatterji, 2003) questions many assumptions made by previous
explanations and adds several factors that have not been considered previously, such as the effect
of chemical composition of the air entraining agent used. However, despite the large number of
hypotheses explaining air void action in concrete during a freeze-thaw event, a comprehensive
theory clarifying the entire phenomena is still lacking.
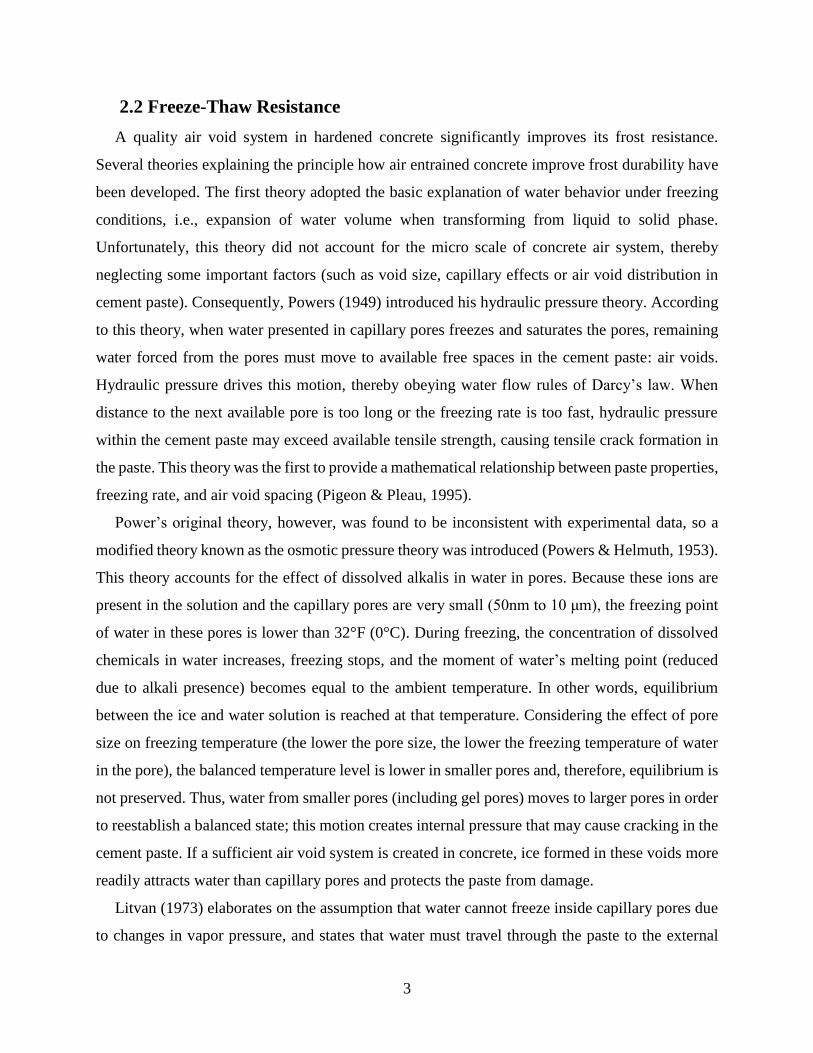
2.3 Air-Void System Characterization
Spacing factor and total air void content are the two parameters used to describe the air-void
system. Spacing factor was developed by Powers as part of his hydraulic pressure theory (Powers
& Willis, 1949). Two formulas, each developed using a specific idealized system, calculate the
spacing factor. The first formula, given by Eq. (2-1), is valid for values of p/A smaller than 4.342,
while the second formula, defined by Eq. (2-2), is valid for values of p/A greater or equal to 4.342
(Garboczi, et al., 2014).
L =
p
αA (2-1)
L =
3
α[1.4 (
p
A+ 1)
13− 1] (2-2)
Where: L spacing factor,
p paste volume,
A air void volume,
α specific surface area of voids.
The first idealized system (small values of p/A ratio) is composed of air voids uniformly
covered with a thick layer of paste; the layer thickness (or shell) is the spacing factor. The second
system utilizes the cubic lattice approach in which mono-sized air voids are distributed in the space
at vertices of a cubic array, each with a specific surface area equal to the bulk value. Lattice spacing
5
is chosen in such a way that air content equals bulk. The spacing factor then represents the distance
from the center of a unit cell to the nearest air void surface (Garboczi, et al., 2014; Peterson, 2008).
Freeze-thaw resistance clearly increases with lower spacing factors. Typically, spacing factor
of 200 microns (0.008 in) and specific surface of 25 mm2/ mm3 (600 sq. in. per cubic inch) are
considered acceptable values for freeze-thaw resistant air entrained concrete (Pigeon & Pleau,
1995). In order to calculate spacing factor, analysis of hardened concrete sample must be
conducted. For air volume, 5-8% air content by volume of concrete is typically required for freeze-
thaw durable concrete design (Chatterji, 2003; Chatterji, 2003; Kansas Department of
Transportation, 2007). Air content in concrete can be determined on a fresh concrete sample or
hardened concrete sample (ASTM C457, 2012) by utilizing one of the Pressure Method (ASTM
C231, 2010), Volumetric Method (ASTM C173, 2014), or Gravimetric Method (ASTM C138,
2012).
Fresh concrete air content, possibly the most common air void characteristic utilized daily in
field applications, is often used as a prompt indicator of air system quality. However, total air
content is not always the most accurate parameter of freeze-thaw resistance because research has
shown that total volume of air void and other parameters, such as uniform distribution of air voids
in the cement matrix, are equally important factor in freeze-thaw resistant concrete (Whiting &
Nagi, 1998).

6
2.4 Mechanism of Air Entrainment
To achieve required air entrainment in concrete, AEAs are added to concrete mix. Chemicals
which can be utilized as AEAs are often byproducts of various chemical industries. Pigeon & Pleau
(1995) classified AEAs into four groups:
1) sodium salts of wood resin
2) salts of fatty acids
3) salts of sulphonated hydrocarbon
4) alkyl-benzyl sulphonates
Classification system provided by Kosmatka et al. (2003) (adapted from Naranjo, 2007) is
shown in Table 2-1.
Table 2-1: Air Entraining Agents
Classification Performance Characteristics
Wood resin and rosin
Quick air generation. Minor air gain with initial mixing.
Air loss with prolonged mixing. Mid-size air bubbles
formed. Compatible with most other admixtures.
Tall oil
Slower air generation. Air may increase with prolonged
mixing. Smallest air bubbles of all agents. Compatible
with most other admixtures
Synthetic detergents
Quick air generation. Minor air loss with mixing.
Coarser bubbles. May be incompatible with some high
range water reducing admixtures. Also applicable to
cellular concretes.
Vegetable oil acids
Slower air generation than wood rosins. Moderate air
loss with mixing. Coarser air bubbles relative to wood
rosin. Compatible with most other admixtures.
Note. Adapted from Clustering of Air Voids Around Aggregates in Air Entrained Concrete, p. 7,
by A. Naranjo, 2007, Austin: UT at Austin.
Every AEA is a mixture of surfactants (substances reducing fluid surface tension) that must be
soluble in water. Most modern AEAs are anionic, although cationic, nonionic, or amphoteric
agents can also be used (Du & Folliard, 2005).
The process of air generation in concrete is complex, but two partial sub-processes can be easily
distinguished: air bubble formation and air bubble stabilization. Two primary processes to generate
air voids in concrete have been proposed (Ramachandran, 1997):

7
(1) Folding of air by a vortex action (similar action to stirring a liquid),
(2) Three-dimensional screen formed by fine aggregates when mass falls and cascades onto
itself during mixing.
Concrete mixing is a living process in which air bubbles come into existence and
simultaneously vanish unless stabilized. Three fundamental mechanisms may lead to the collapse
of air bubbles (Du & Folliard, 2005):
(1) Diffusion of air from a small bubble (high internal pressure) to a larger one (lower
internal pressure)
(2) Bubble coalescence due to capillary flow, leading to rupture of lamellar film between
adjacent bubbles (typically slower than Mechanism 1, occurring even in stabilized
systems). This mechanism often occurs in fresh concrete due to vibration.
(3) Rapid hydrodynamic drainage of liquid between bubbles, leading to rapid collapse. This
mechanism is not likely to occur in fresh concrete because air bubbles are immersed in
fresh concrete.
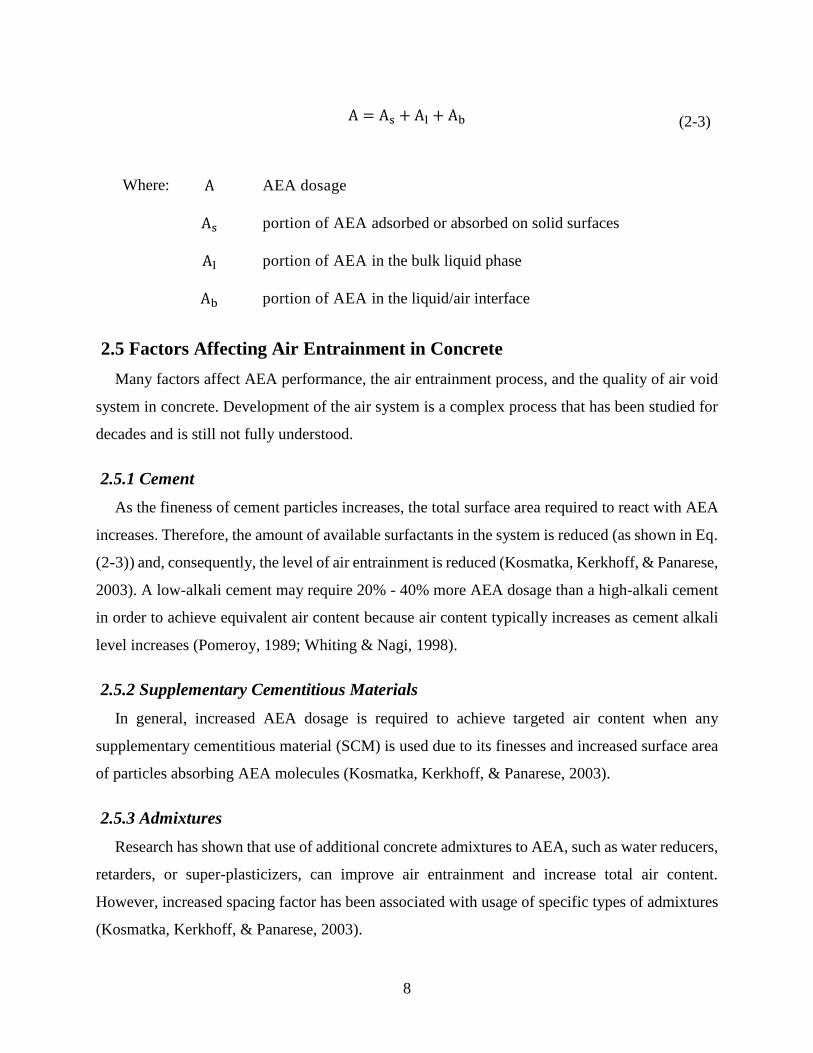
AEA molecules are responsible for various tasks during the mixing process, as symbolically
introduced in Eq. (2-3) and described as follows (Du & Folliard, 2005):
(1) Because AEA molecules are typically composed of a hydrophilic head on one end and
hydrophobic tail (usually negatively charged) on the other end, portion of AEA dosage
is absorbed or adsorbed by solid surfaces of cement particles, primarily due to electric
attraction to hydrophobic tail of surfactant.
(2) Another portion of AEA molecules dissolved in the bulk liquid phase has a primary
purpose to reduce surface tension of water (Pigeon & Pleau, 1995). Surface tension acts
as an energy barrier against the stabilization of air bubbles; therefore, the surface tension
reduction is necessary. Reduction allows for breakdown of large voids into smaller
voids.
(3) Once generated, air voids must be stabilized in the cement matrix. AEA concentrates at
the liquid/air interfaces and forms elastic film around air bubbles, thereby protecting
bubbles against collapse.
8
A = As + Al + Ab (2-3)
Where: A AEA dosage
As portion of AEA adsorbed or absorbed on solid surfaces
Al portion of AEA in the bulk liquid phase
Ab portion of AEA in the liquid/air interface
2.5 Factors Affecting Air Entrainment in Concrete
Many factors affect AEA performance, the air entrainment process, and the quality of air void
system in concrete. Development of the air system is a complex process that has been studied for
decades and is still not fully understood.
2.5.1 Cement
As the fineness of cement particles increases, the total surface area required to react with AEA
increases. Therefore, the amount of available surfactants in the system is reduced (as shown in Eq.
(2-3)) and, consequently, the level of air entrainment is reduced (Kosmatka, Kerkhoff, & Panarese,
2003). A low-alkali cement may require 20% - 40% more AEA dosage than a high-alkali cement
in order to achieve equivalent air content because air content typically increases as cement alkali
level increases (Pomeroy, 1989; Whiting & Nagi, 1998).
2.5.2 Supplementary Cementitious Materials
In general, increased AEA dosage is required to achieve targeted air content when any
supplementary cementitious material (SCM) is used due to its finesses and increased surface area
of particles absorbing AEA molecules (Kosmatka, Kerkhoff, & Panarese, 2003).
2.5.3 Admixtures
Research has shown that use of additional concrete admixtures to AEA, such as water reducers,
retarders, or super-plasticizers, can improve air entrainment and increase total air content.
However, increased spacing factor has been associated with usage of specific types of admixtures
(Kosmatka, Kerkhoff, & Panarese, 2003).
9
2.5.4 Aggregate
If the amount of fine aggregates increases, the total amount of air content typically decreases
because sand particles provide reduced shear action due to their smaller size compared to particles
that are of larger size (Du & Folliard, 2005). However, aggregate particles with sizes ranging from
0.0234 in to 0.0059 in (sieves #30 and #100, respectively) help with the persistence of small air
bubbles. In addition, the aggregate manufacturing process (natural or crushed) is important as well
as crushed rock provides increased shear action, thereby generates smaller air bubbles and higher
air content than natural rock (Du & Folliard, 2005).
2.5.5 Water
Air content increases with higher water-to-cement (w/c) ratio (Kosmatka, Kerkhoff, &
Panarese, 2003). Research has shown that increasing w/c from 0.4 to 0.8 leads to an approximate
3% increase of air content (Whiting & Nagi, 1998).
Mixing water quality can also significantly impact the quality of air entraining systems; in order
to reduce mix cost, some contractors reuse mixing water (i.e., wash water from mixing trucks).
This reuse can result in decreased air content and decreased air void system quality. In addition,
hard water can decrease air content (Kosmatka, Kerkhoff, & Panarese, 2003; Whiting & Nagi,
1998).
2.5.6 Concrete Workability and Slump
Yield stress of fresh concrete is closely related to slump: An increase in slump reduces yield
stress. As discussed, internal stress and viscosity acts as an energy barrier to air void creation.
Therefore, increased slump results in an increase of the total amount of air voids in the system,
and vice versa (Du & Folliard, 2005). Whiting and Nagi (1998) suggested that slump increase of
1 in leads to approximately 0.5% increase in air content.
2.5.7 Mixing Procedures
The order of added materials also significantly affects the total amount of air content.
Simultaneous batching provides less air content than batching of cement prior to adding AEA
(Whiting & Nagi, 1998). Highest air content is typically achieved when maximum mixer capacity
is used since small loads in the mixer cause less stirring and larger blade impact. However,
10
exceeding allowable mixer capacity causes air content loss (Whiting & Nagi, 1998; Kosmatka,
Kerkhoff, & Panarese, 2003).
Short mixing periods can also reduce air content; the minimal recommended mixing time is 75
seconds. If truck mixers are used, air content rises during the first 15 minutes of mixing (Whiting
& Nagi, 1998). Optimal mixing speed is approximately 20 rotations per minute (rpm). At higher
mixing speeds, air content may decrease due to stronger impact of the mixing blades (Kosmatka,
Kerkhoff, & Panarese, 2003).
Other properties of the mixing system, such as mixing system age, total power of the mixer,
and blade quality, strongly influence efficiency of the air void system generation (Du & Folliard,
2005).
2.5.8 Transport, Construction Techniques, and Field Conditions
Usually 1% - 2% of air content loss can be contributed to transport. Mixes with high air content
(above 6%) experience even greater loss of air while being transported from the ready-mix plant
to the construction site (Whiting & Nagi, 1998). Use of belt conveyors reduces air content by an
average of 1%, and loss in air due to pumping is approximately 2% - 3% (Kosmatka, Kerkhoff, &
Panarese, 2003).
Over-vibration can cause damage to the air void system. If excessive finishing is used, air
content in the surface layer can decrease (Whiting & Nagi, 1998).
Retempering (i.e., withholding mixing water in the plant and adding it on site) is a common
practice used by contractors to meet prescribed performance specification (typically slump or air
void content). Outside temperatures can rise high above 90 °F during the summer construction
season (May to August in the USA), typically leading to loss of concrete workability and decreased
air content. Research has shown that the loss of workability is primarily caused by evaporation,
absorption of water by aggregates, or hydration during transportation (Naranjo, 2007). To prevent
this workability loss, concrete suppliers sometimes withhold portion of the mixing water and add
that water back to the mix prior to placing (and sampling) the mix. Retempering is thought to have
no effect on spacing factor (Kosmatka, Kerkhoff, & Panarese, 2003). AEAs are occasionally used
in addition to water while retempering, despite the fact that higher dosages of AEA may be needed
for jobsite admixture additions (Whiting & Nagi, 1998). The suggestion has been made
(Kozikowski, David, Peter, & Steven, 2005; Naranjo, 2007; Walker, Lane, & Paul, 2006) that
11
retempering can also affect air void clustering and subsequently compressive strength; this issue
is discussed later in this review.
In general, higher temperatures result in lower air void content. Du and Folliard (2005) offered
the following explanations:
(1) Higher temperature leads higher viscosity of the entire system. Higher viscosity requires
more energy to form air voids; therefore, the total amount of generated air in the mix is
reduced.
(2) Polyvalent cations, such as Ca2+, Al3+, react with AEAs containing alkali salts or wood
rosin and form insoluble salts that help stabilize entrained air. Rising temperatures cause
these salts to coagulate and precipitate; therefore, the foaming ability of AEA is reduced.
In addition, significant amounts of electrolytes in the solution reduce air bubble stability
by reducing repulsion acting between layers formed around air bubble surfaces.
(3) Higher ambient temperatures accelerate the cement hydration process; therefore, more
solid surfaces areas in the solution are generated. These surfaces absorb or adsorb part
of the surfactant dosage, thereby reducing the amount of available surfactants in the
system. Therefore, the amount of created air content is also reduced, as demonstrated in
Eq. (2-3).
(4) Increased temperature decreases the amount of air that is able to solute in water.
Vaporing air joins existing air bubbles and they together form larger air bubbles. These
large bubbles are susceptible to destruction during the mixing process. Therefore, under
high temperature conditions, the amount of entrained air content is lowered and larger
air bubbles are formed.
2.6 Effects of Air Entrainment on Concrete Properties
Air entrainment in concrete positively and negatively affects concrete properties. In addition to
improved freeze-thaw resistance, air entrainment in concrete increases slump and subsequent
workability because small air bubbles in concrete act as a lubricant and reduce friction between
cement particles and aggregate. Research has shown that an increased air content of 0.5% - 1%
can increase slump by approximately 1 in (Whiting & Nagi, 1998). Concrete with entrained air
also demonstrates improved resistance to bleeding and segregation, and less vibration time is
required to consolidate air entrained concrete (Kosmatka, Kerkhoff, & Panarese, 2003).
12
Compressive strength of air entrained concrete is typically expected to be less than strength of
corresponding concrete (with identical w/c ratio) without air. For low w/c ratios, loss in strength
is typically higher compared to concretes higher w/c values. Loss in compressive strength ranges
from 2% - 6% for every percent increase in air content. Similarly, flexural strength decreases by
2% - 4% for every percent of air in concrete (Whiting & Nagi, 1998).
2.7 Air Void Clustering In Entrained Concrete
Air void clustering around coarse aggregate particles in air entrained concrete and related loss
in concrete compressive strength has recently been identified in the concrete industry community
but not fully investigated. Clustering was observed in pavement projects and reported by
Departments of Transportation (DOTs) in Delaware, Michigan, New Jersey, Virginia, and South
Dakota (Cross, Duke, Kellar, & Johnston, 2000), as well as by the Kansas Department of
Transportation (KDOT) (Distlehorst, 2009).
An extensive examination of air void clustering was conducted by the South Dakota
Department of Transportation (SSDOT) (Cross, Duke, Kellar, & Johnston, 2000). During the
summer construction season of 1997, SDDOT experienced unusual failing of concrete cylinders
in compressive strength tests. Detailed investigation was performed and investigators concluded
that low compressive strength could be attributed to a weak bond between cement paste and
aggregate particles and could be associated with formation of air void clusters around those
particles. Air void clustering was observed in mixes that utilized synthetic AEA. Foam tests of
AEA showed difference in foaming performance of synthetic AEAs and vinsol (non-synthetic)
resin agents. Results proved that synthetic AEAs drain faster than natural admixtures, resulting in
thinner bubble walls and low quality cement paste on aggregate surfaces. Researchers
hypothesized these factors led to lowered compressive strength of concrete cylinders (Cross, Duke,
Kellar, & Johnston, 2000).
KDOT has reported similar issues with the compressive strength of concrete cylinders in
pavement concrete on a new pavement project on US Highway 56 in Meade, Kan. Some of the
cylinders that were sampled in 2006 and 2007 failed to meet the required minimum strength of 20
MPa (2900 psi) at 28 days. Further investigation showed that failed samples had higher air content
(in average 14.4%) than cylinders that passed the strength requirement (average air content 8.5%).
Air void clustering in all tested samples was quantified using the method developed by Kozikowski
13
et al. (2005). Failed cylinders experienced higher clustering index than samples that did not fail.
However, compressive strength loss caused directly by air void clustering has not been proven
(Distlehorst, 2009).
An extensive research study regarding clustering was carried out in 2004 in Portland Cement
Association laboratories (Kozikowski, David, Peter, & Steven, 2005). A wide range of variables
was investigated and several conclusions were made:
(1) Similar to (Cross, Duke, Kellar, & Johnston, 2000), no air void clustering was observed
in concrete mixes in which vinsol (organic) resin admixtures were used.
(2) It was reported that clustering likely occurs in concrete mixes with late addition of water
(i.e., retempering), especially when synthetic agents are used.
(3) Total mixing time of retempered concrete was found to be another significant factor
affecting clustering rate; severity of air-void clustering increased with increased mixing
time.
(4) Aggregate shape/mineralogy may also significantly impact strength loss due to
clustering.
A rating system was developed to describe the extent of air void clustering. Each coarse
aggregate greater than 6 mm was assigned to one of four categories, depending on the visual rating
of clustering (no clustering, minor clustering, moderate clustering, and severe clustering). Then
the number of aggregates in the category was multiplied by the category number (0-3) and totals
from each category were averaged over the number of examined particles. Results indicated that
for ratings greater than 1.0 air void clustering may negatively affect compressive strength of
concrete although experimental data did not provide strong evidence for ratings ranging from 1.0
to 1.5.
Both previously discussed research programs (SSDOT and PCA) independently concluded that
use of synthetic AEAs may lead to increased rate of air void clustering and air void clustering
could possibly reduce compressive strength of concrete.
However, a recent research project in this field (Naranjo, 2007) questioned the influence of air
void clustering on concrete strength reduction. Laboratory experiments and field concrete tests
were conducted; reduction in concrete strength discovered in laboratory tests was attributed to
increased air content due to retempering. Clusters of air void were also observed in field concrete
tests, but due to lack of data, whether or not a correlation existed between clustering and concrete

14
strength was impossible to establish. Nevertheless, similar to projects discussed, results indicated
that late addition of water in concrete significantly impacts rate of air void clustering.
Since lower compressive strength was initially reported during the construction summer season,
it is possible that temperature may be a key factor to clustering issues. To the authors’ knowledge,
no research has been conducted considering temperature effects.
15
Chapter 3 - Materials
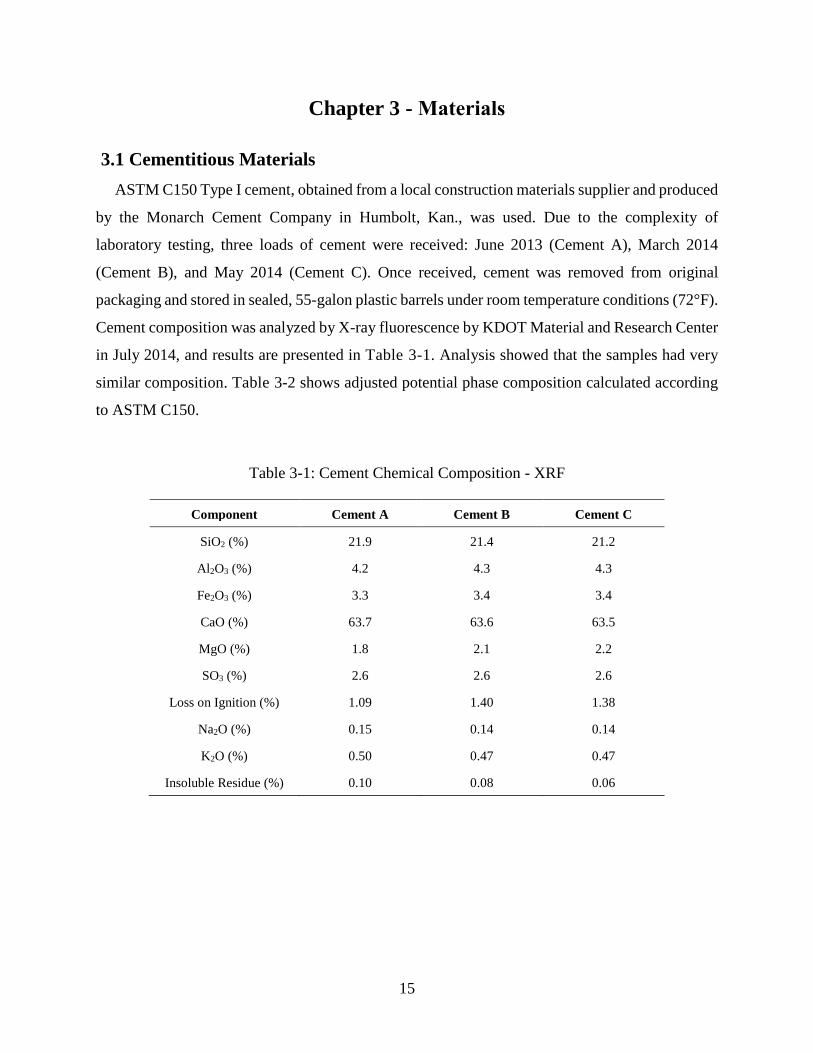
3.1 Cementitious Materials
ASTM C150 Type I cement, obtained from a local construction materials supplier and produced
by the Monarch Cement Company in Humbolt, Kan., was used. Due to the complexity of
laboratory testing, three loads of cement were received: June 2013 (Cement A), March 2014
(Cement B), and May 2014 (Cement C). Once received, cement was removed from original
packaging and stored in sealed, 55-galon plastic barrels under room temperature conditions (72°F).
Cement composition was analyzed by X-ray fluorescence by KDOT Material and Research Center
in July 2014, and results are presented in Table 3-1. Analysis showed that the samples had very
similar composition. Table 3-2 shows adjusted potential phase composition calculated according
to ASTM C150.
Table 3-1: Cement Chemical Composition - XRF
Component Cement A Cement B Cement C
SiO2 (%) 21.9 21.4 21.2
Al2O3 (%) 4.2 4.3 4.3
Fe2O3 (%) 3.3 3.4 3.4
CaO (%) 63.7 63.6 63.5
MgO (%) 1.8 2.1 2.2
SO3 (%) 2.6 2.6 2.6
Loss on Ignition (%) 1.09 1.40 1.38
Na2O (%) 0.15 0.14 0.14
K2O (%) 0.50 0.47 0.47
Insoluble Residue (%) 0.10 0.08 0.06
16
Table 3-2: Compound Calculations – ASTM C150
Component Cement I Cement II Cement III
Al2O3 / Fe2O3 1.3 1.3 1.3
C3S 52.5 55.8 56.3
C23 22.9 19.2 18.3
C3A 5.5 5.5 5.5
C3S + C3A 58.0 61.3 61.8
Total Alkali as Na2Oeq 0.48 0.45 0.45
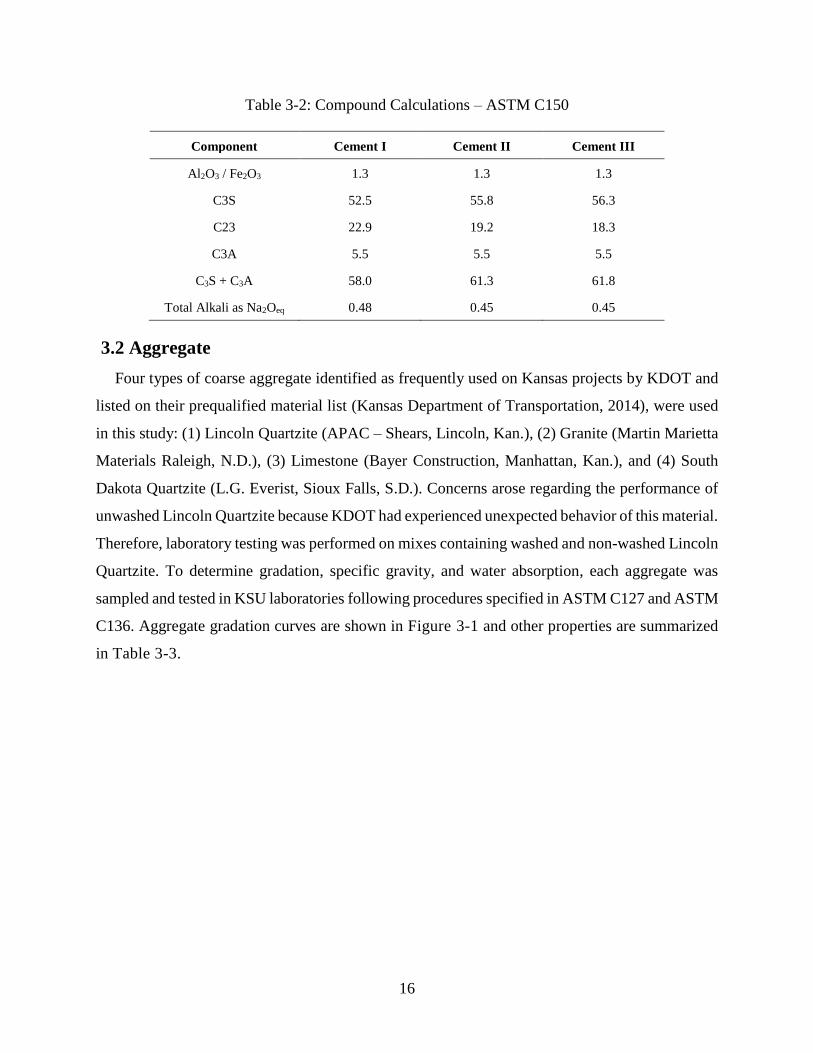
3.2 Aggregate
Four types of coarse aggregate identified as frequently used on Kansas projects by KDOT and
listed on their prequalified material list (Kansas Department of Transportation, 2014), were used
in this study: (1) Lincoln Quartzite (APAC – Shears, Lincoln, Kan.), (2) Granite (Martin Marietta
Materials Raleigh, N.D.), (3) Limestone (Bayer Construction, Manhattan, Kan.), and (4) South
Dakota Quartzite (L.G. Everist, Sioux Falls, S.D.). Concerns arose regarding the performance of
unwashed Lincoln Quartzite because KDOT had experienced unexpected behavior of this material.
Therefore, laboratory testing was performed on mixes containing washed and non-washed Lincoln
Quartzite. To determine gradation, specific gravity, and water absorption, each aggregate was
sampled and tested in KSU laboratories following procedures specified in ASTM C127 and ASTM
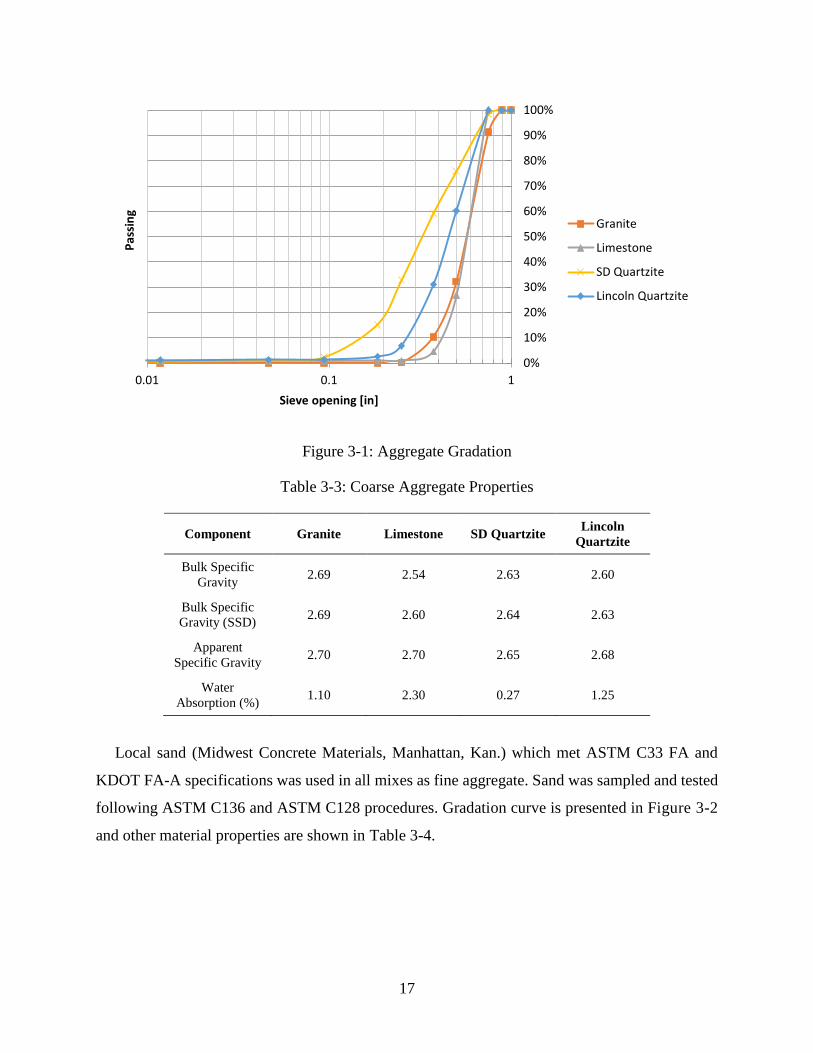
C136. Aggregate gradation curves are shown in Figure 3-1 and other properties are summarized
in Table 3-3.
17
Figure 3-1: Aggregate Gradation
Table 3-3: Coarse Aggregate Properties
Component Granite Limestone SD Quartzite Lincoln
Quartzite
Bulk Specific
Gravity 2.69 2.54 2.63 2.60
Bulk Specific
Gravity (SSD) 2.69 2.60 2.64 2.63
Apparent
Specific Gravity 2.70 2.70 2.65 2.68
Water
Absorption (%) 1.10 2.30 0.27 1.25
Local sand (Midwest Concrete Materials, Manhattan, Kan.) which met ASTM C33 FA and
KDOT FA-A specifications was used in all mixes as fine aggregate. Sand was sampled and tested
following ASTM C136 and ASTM C128 procedures. Gradation curve is presented in Figure 3-2
and other material properties are shown in Table 3-4.
0%
10%
20%
30%
40%
50%
60%
70%
80%
90%
100%
0.01 0.1 1
Pas
sin
g
Sieve opening [in]
Granite
Limestone
SD Quartzite
Lincoln Quartzite
18
Figure 3-2: Fine Aggregate Gradation
Table 3-4: Fine Aggregate Properties
Component Sand
Bulk Specific
Gravity 2.65
Bulk Specific
Gravity (SSD) 2.67
Apparent
Specific Gravity 2.67
Water
Absorption (%) 0.70
0%
10%
20%
30%
40%
50%
60%
70%
80%
90%
100%
0.001 0.01 0.1 1
Pas
sin
g
Sieve opening [in]
Local Sand
19
3.3 Air Entraining Admixtures
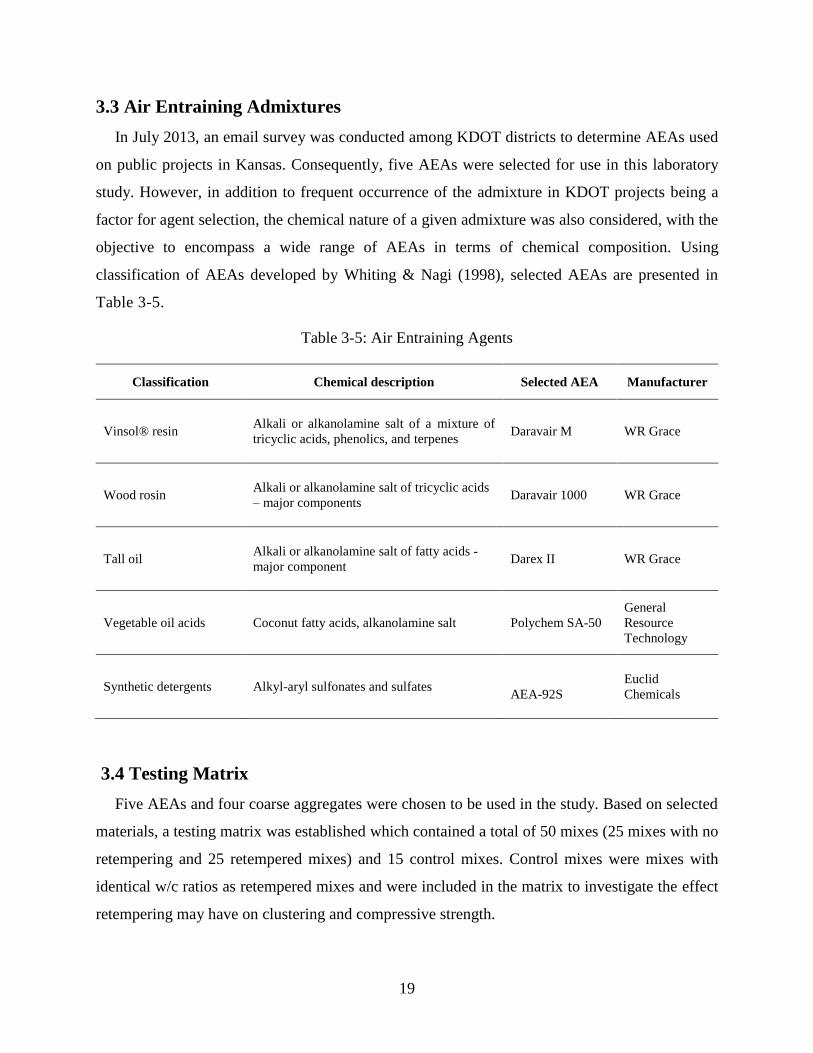
In July 2013, an email survey was conducted among KDOT districts to determine AEAs used
on public projects in Kansas. Consequently, five AEAs were selected for use in this laboratory
study. However, in addition to frequent occurrence of the admixture in KDOT projects being a
factor for agent selection, the chemical nature of a given admixture was also considered, with the
objective to encompass a wide range of AEAs in terms of chemical composition. Using
classification of AEAs developed by Whiting & Nagi (1998), selected AEAs are presented in
Table 3-5.
Table 3-5: Air Entraining Agents
Classification Chemical description Selected AEA Manufacturer
Vinsol® resin Alkali or alkanolamine salt of a mixture of
tricyclic acids, phenolics, and terpenes Daravair M WR Grace
Wood rosin Alkali or alkanolamine salt of tricyclic acids
– major components Daravair 1000 WR Grace
Tall oil Alkali or alkanolamine salt of fatty acids -
major component Darex II WR Grace
Vegetable oil acids Coconut fatty acids, alkanolamine salt Polychem SA-50
General
Resource
Technology
Synthetic detergents Alkyl-aryl sulfonates and sulfates
AEA-92S
Euclid
Chemicals
3.4 Testing Matrix
Five AEAs and four coarse aggregates were chosen to be used in the study. Based on selected
materials, a testing matrix was established which contained a total of 50 mixes (25 mixes with no
retempering and 25 retempered mixes) and 15 control mixes. Control mixes were mixes with
identical w/c ratios as retempered mixes and were included in the matrix to investigate the effect
retempering may have on clustering and compressive strength.
20
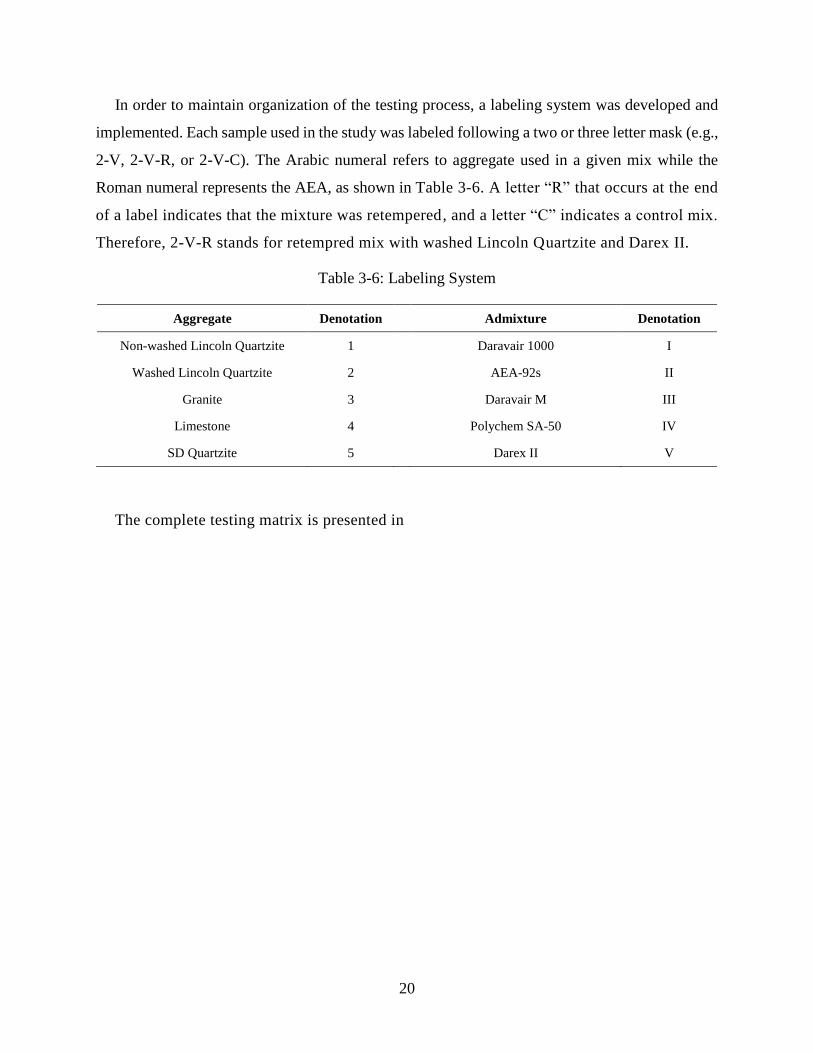
In order to maintain organization of the testing process, a labeling system was developed and
implemented. Each sample used in the study was labeled following a two or three letter mask (e.g.,
2-V, 2-V-R, or 2-V-C). The Arabic numeral refers to aggregate used in a given mix while the
Roman numeral represents the AEA, as shown in Table 3-6. A letter “R” that occurs at the end
of a label indicates that the mixture was retempered, and a letter “C” indicates a control mix.
Therefore, 2-V-R stands for retempred mix with washed Lincoln Quartzite and Darex II.
Table 3-6: Labeling System
Aggregate Denotation Admixture Denotation
Non-washed Lincoln Quartzite 1 Daravair 1000 I
Washed Lincoln Quartzite 2 AEA-92s II
Granite 3 Daravair M III
Limestone 4 Polychem SA-50 IV
SD Quartzite 5 Darex II V
The complete testing matrix is presented in

21
Table 3-7 and Table 3-8.
Table 3-7: Testing Matrix
22
Mix ID AEA Type Coarse Aggregate
1 I Daravair 1000 Lincoln Quartzite - Non-Washed
1 II AEA-92s Lincoln Quartzite - Non-Washed
1 III Daravair M Lincoln Quartzite - Non-Washed
1 IV Polychem SA-50 Lincoln Quartzite - Non-Washed
1 V Darex II Lincoln Quartzite - Non-Washed
2 I Daravair 1000 Lincoln Quartzite - Washed
2 II AEA-92s Lincoln Quartzite - Washed
2 III Daravair M Lincoln Quartzite - Washed
2 IV Polychem SA-50 Lincoln Quartzite - Washed
2 V Darex II Lincoln Quartzite - Washed
3 I Daravair 1000 Granite
3 II AEA-92s Granite
3 III Daravair M Granite
3 IV Polychem SA-50 Granite
3 V Darex II Granite
4 I Daravair 1000 Limestone
4 II AEA-92s Limestone
4 III Daravair M Limestone
4 IV Polychem SA-50 Limestone
4 V Darex II Limestone
5 I Daravair 1000 SD Quartzite
5 II AEA-92s SD Quartzite
5 III Daravair M SD Quartzite
5 IV Polychem SA-50 SD Quartzite
5 V Darex II SD Quartzite
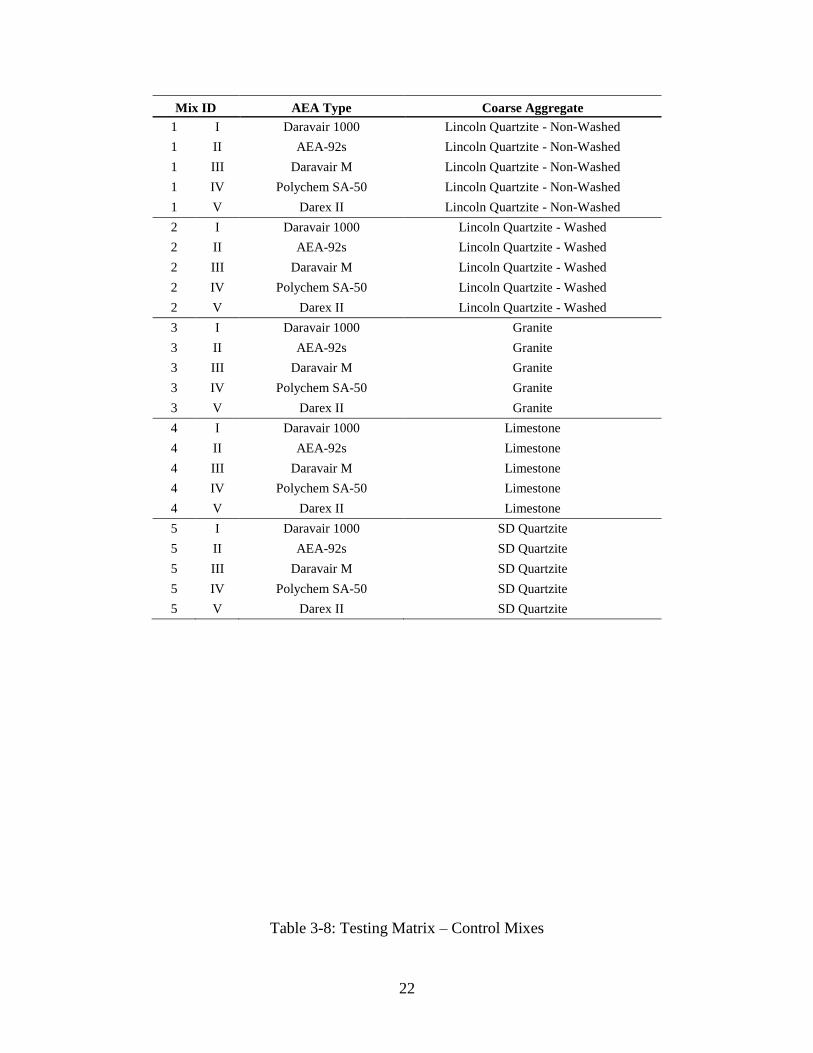
Table 3-8: Testing Matrix – Control Mixes
23
Mix ID AEA Type Coarse Aggregate
1 I-C Daravair 1000 Lincoln Quartzite - Non-Washed
1 II-C AEA-92s Lincoln Quartzite - Non-Washed
1 III-C Daravair M Lincoln Quartzite - Non-Washed
1 IV-C Polychem SA-50 Lincoln Quartzite - Non-Washed
1 V-C Darex II Lincoln Quartzite - Non-Washed
2 I-C Daravair 1000 Lincoln Quartzite - Washed
2 II-C AEA-92s Lincoln Quartzite - Washed
2 III-C Daravair M Lincoln Quartzite - Washed
2 IV-C Polychem SA-50 Lincoln Quartzite - Washed
2 V-C Darex II Lincoln Quartzite - Washed
3 I-C Daravair 1000 Granite
3 II-C AEA-92s Granite
3 III-C Daravair M Granite
3 IV-C Polychem SA-50 Granite
3 V-C Darex II Granite
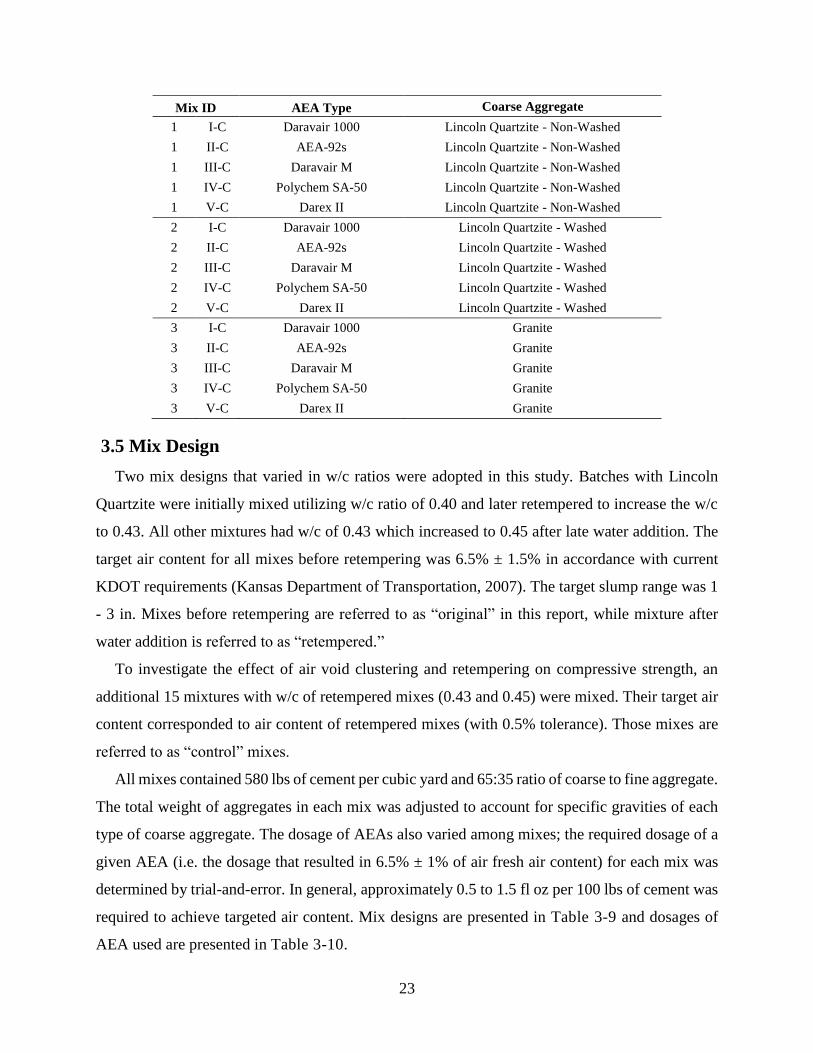
3.5 Mix Design
Two mix designs that varied in w/c ratios were adopted in this study. Batches with Lincoln
Quartzite were initially mixed utilizing w/c ratio of 0.40 and later retempered to increase the w/c
to 0.43. All other mixtures had w/c of 0.43 which increased to 0.45 after late water addition. The
target air content for all mixes before retempering was 6.5% ± 1.5% in accordance with current
KDOT requirements (Kansas Department of Transportation, 2007). The target slump range was 1
- 3 in. Mixes before retempering are referred to as “original” in this report, while mixture after
water addition is referred to as “retempered.”
To investigate the effect of air void clustering and retempering on compressive strength, an
additional 15 mixtures with w/c of retempered mixes (0.43 and 0.45) were mixed. Their target air
content corresponded to air content of retempered mixes (with 0.5% tolerance). Those mixes are
referred to as “control” mixes.
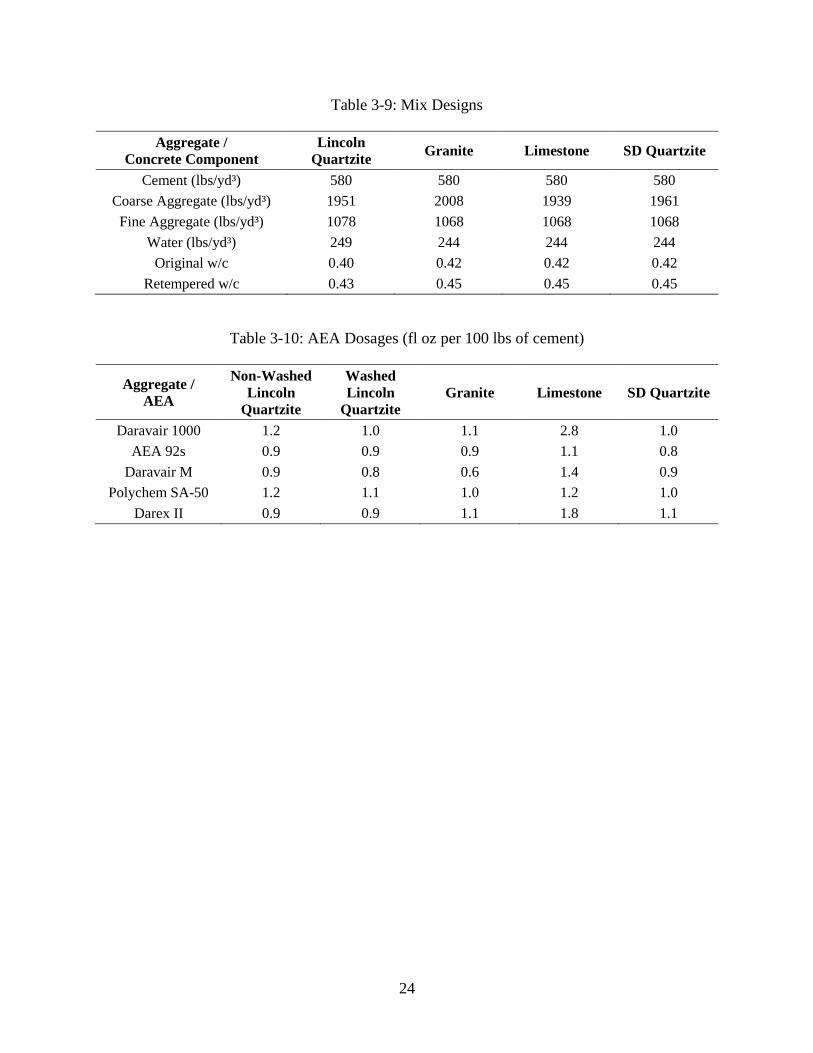
All mixes contained 580 lbs of cement per cubic yard and 65:35 ratio of coarse to fine aggregate.
The total weight of aggregates in each mix was adjusted to account for specific gravities of each
type of coarse aggregate. The dosage of AEAs also varied among mixes; the required dosage of a
given AEA (i.e. the dosage that resulted in 6.5% ± 1% of air fresh air content) for each mix was
determined by trial-and-error. In general, approximately 0.5 to 1.5 fl oz per 100 lbs of cement was
required to achieve targeted air content. Mix designs are presented in Table 3-9 and dosages of
AEA used are presented in Table 3-10.
24
Table 3-9: Mix Designs
Aggregate /
Concrete Component
Lincoln
Quartzite Granite Limestone SD Quartzite
Cement (lbs/yd³) 580 580 580 580
Coarse Aggregate (lbs/yd³) 1951 2008 1939 1961
Fine Aggregate (lbs/yd³) 1078 1068 1068 1068
Water (lbs/yd³) 249 244 244 244
Original w/c 0.40 0.42 0.42 0.42
Retempered w/c 0.43 0.45 0.45 0.45
Table 3-10: AEA Dosages (fl oz per 100 lbs of cement)
Aggregate /
AEA
Non-Washed
Lincoln
Quartzite
Washed
Lincoln
Quartzite
Granite Limestone SD Quartzite
Daravair 1000 1.2 1.0 1.1 2.8 1.0
AEA 92s 0.9 0.9 0.9 1.1 0.8
Daravair M 0.9 0.8 0.6 1.4 0.9
Polychem SA-50 1.2 1.1 1.0 1.2 1.0
Darex II 0.9 0.9 1.1 1.8 1.1

25
Chapter 4 - Laboratory Study
4.1 Mixing Procedure
Valid ASTM standards for making and testing concrete in laboratory were followed for this
study: C138 (2012), C143 (2012), C172 (2010), C192 (2013), and C213 (2010).
Prior to mixing, all materials were moved into the mixing laboratory to ensure they were at
room temperature (72 °F) at the moment of mixing. In addition, all aggregates were placed in the
oven (200 °F) and dried to constant mass before placing in the mixing laboratory to cool to room
temperature. This procedure allowed identification of the volume of water that had to be added to
the w/c ratio-calculated mixing water due to aggregates’ absorption capability.
A Lancaster shear mixer (Figure 4-1) was used to perform mixing. With its maximum capacity
of 2 cubic ft, the volume of all regular mixes was designed to be 1.8 ft3, while the control mixes
were 1.05 ft3 (1.05 ft³ corresponds to the volume of concrete left in the mixer after the Phase 1 of
mixing).
Figure 4-1: Lancaster Shear Mixer
26
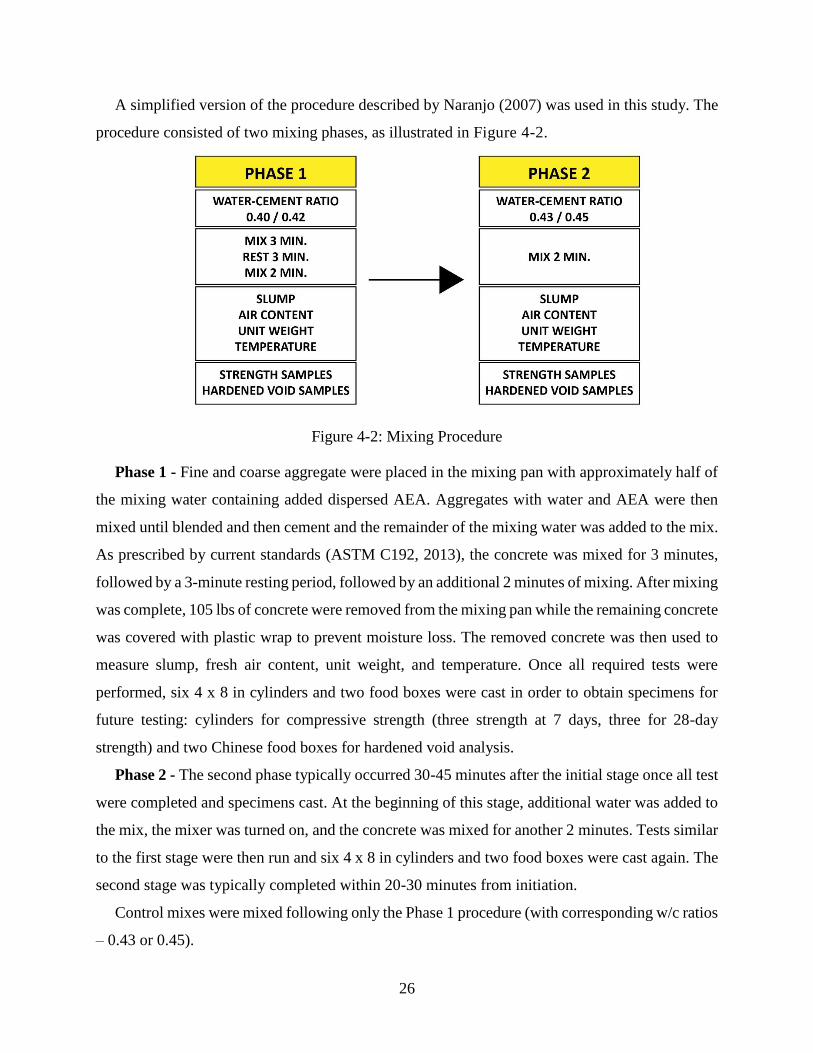
A simplified version of the procedure described by Naranjo (2007) was used in this study. The
procedure consisted of two mixing phases, as illustrated in Figure 4-2.
Figure 4-2: Mixing Procedure
Phase 1 - Fine and coarse aggregate were placed in the mixing pan with approximately half of
the mixing water containing added dispersed AEA. Aggregates with water and AEA were then
mixed until blended and then cement and the remainder of the mixing water was added to the mix.
As prescribed by current standards (ASTM C192, 2013), the concrete was mixed for 3 minutes,
followed by a 3-minute resting period, followed by an additional 2 minutes of mixing. After mixing
was complete, 105 lbs of concrete were removed from the mixing pan while the remaining concrete
was covered with plastic wrap to prevent moisture loss. The removed concrete was then used to
measure slump, fresh air content, unit weight, and temperature. Once all required tests were
performed, six 4 x 8 in cylinders and two food boxes were cast in order to obtain specimens for
future testing: cylinders for compressive strength (three strength at 7 days, three for 28-day
strength) and two Chinese food boxes for hardened void analysis.
Phase 2 - The second phase typically occurred 30-45 minutes after the initial stage once all test
were completed and specimens cast. At the beginning of this stage, additional water was added to
the mix, the mixer was turned on, and the concrete was mixed for another 2 minutes. Tests similar
to the first stage were then run and six 4 x 8 in cylinders and two food boxes were cast again. The
second stage was typically completed within 20-30 minutes from initiation.
Control mixes were mixed following only the Phase 1 procedure (with corresponding w/c ratios
– 0.43 or 0.45).
27
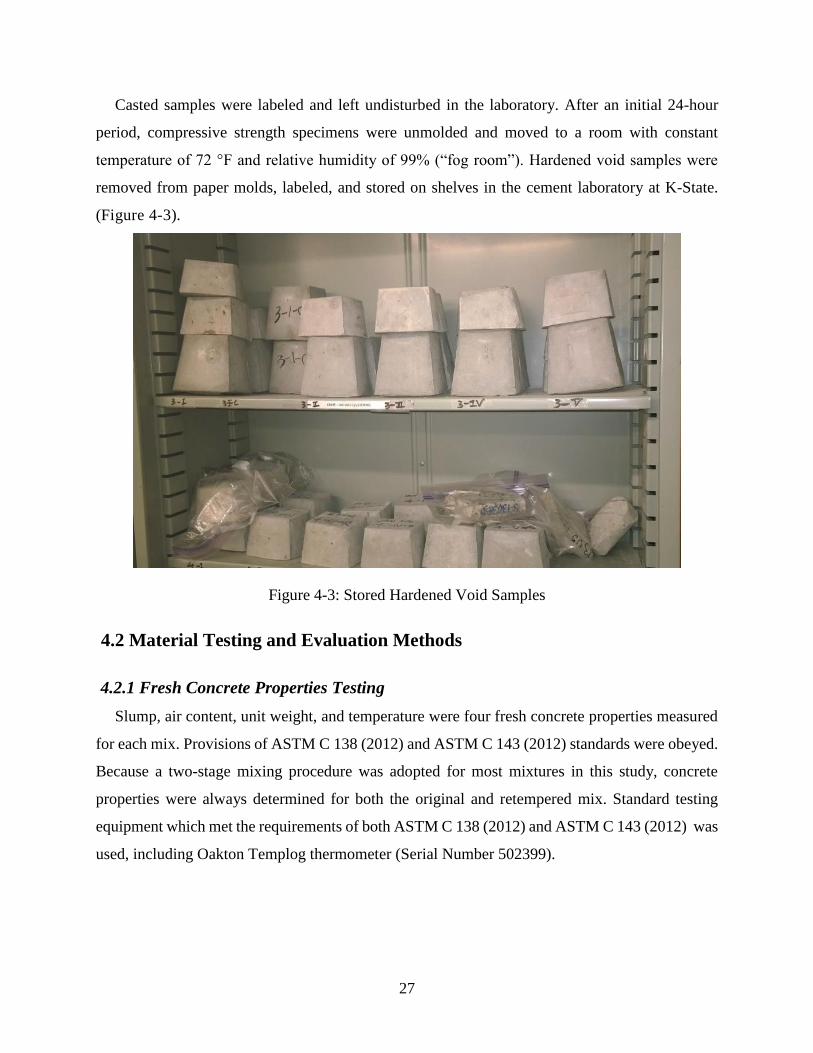
Casted samples were labeled and left undisturbed in the laboratory. After an initial 24-hour
period, compressive strength specimens were unmolded and moved to a room with constant
temperature of 72 °F and relative humidity of 99% (“fog room”). Hardened void samples were
removed from paper molds, labeled, and stored on shelves in the cement laboratory at K-State.
(Figure 4-3).
Figure 4-3: Stored Hardened Void Samples
4.2 Material Testing and Evaluation Methods
4.2.1 Fresh Concrete Properties Testing
Slump, air content, unit weight, and temperature were four fresh concrete properties measured
for each mix. Provisions of ASTM C 138 (2012) and ASTM C 143 (2012) standards were obeyed.
Because a two-stage mixing procedure was adopted for most mixtures in this study, concrete
properties were always determined for both the original and retempered mix. Standard testing
equipment which met the requirements of both ASTM C 138 (2012) and ASTM C 143 (2012) was
used, including Oakton Templog thermometer (Serial Number 502399).

28
4.2.2 Compressive Strength
ASTM C39 (2012), ASTM C192 (2013), and ASTM C1231 (2014) were followed to perform
all tasks associated with concrete compressive strength testing. Standard 4x8-in plastic molds
(Deslauriers Inc) were used to make concrete specimens. Cylinders were covered with plastic lids
immediately after they were formed and left undisturbed in the laboratory under constant
temperature (72 °F) for the first 24 hours. Cylinders were then removed from plastic molds using
compressed air, labeled, and stored in the curing room (73 °F, 50% relative humidity).
Specimens were tested for compressive strength at 7 and 28 days after casting. Steel retaining
cups, rubber compression pads, and Forney compression machine were utilized for the testing.
Test setup is shown in Figure 4-4. Each tested set of cylinders was composed of three samples,
and total compressive strength was calculated as an average of obtained values.
Figure 4-4: Compressive Strength Setup
4.2.3 Air Void Analysis of Hardened Concrete
Samples for air void analysis of hardened concrete were cast into paper boxes typically used as
food containers (Figure 4-5). Compared to rounded cylinders typically used for hardened void
analysis, cutting and other operations with specimens were easier and more convenient when
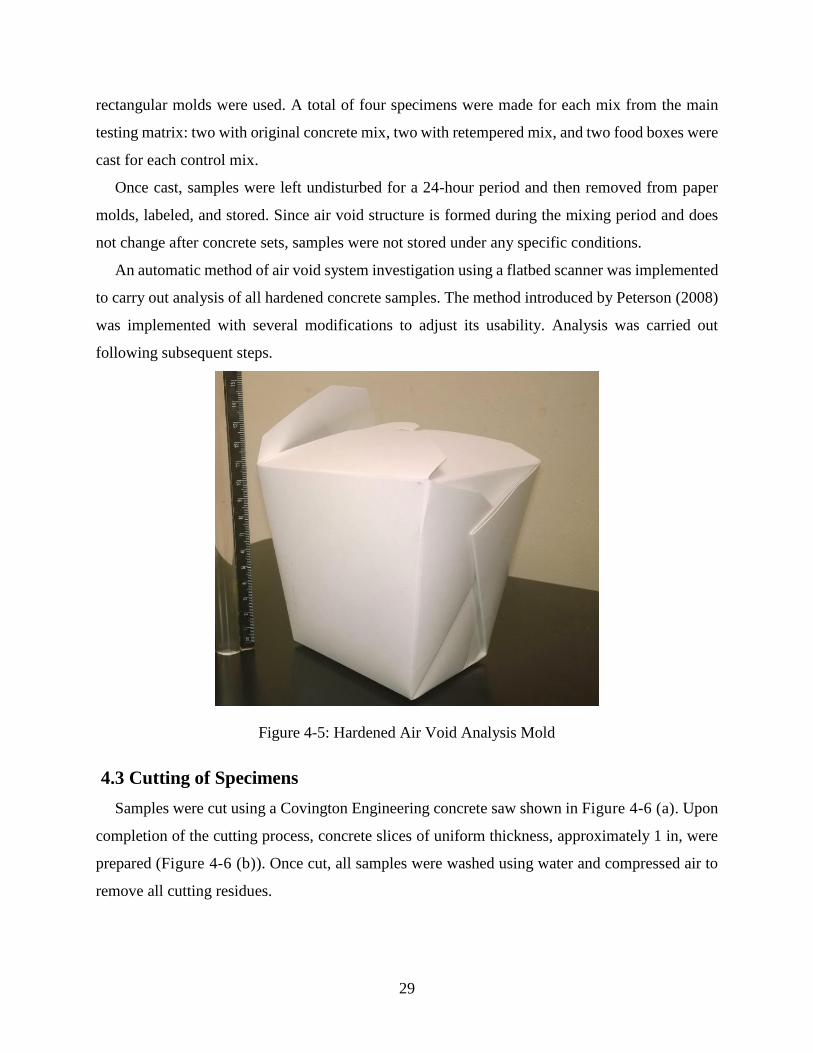
29
rectangular molds were used. A total of four specimens were made for each mix from the main
testing matrix: two with original concrete mix, two with retempered mix, and two food boxes were
cast for each control mix.
Once cast, samples were left undisturbed for a 24-hour period and then removed from paper
molds, labeled, and stored. Since air void structure is formed during the mixing period and does
not change after concrete sets, samples were not stored under any specific conditions.
An automatic method of air void system investigation using a flatbed scanner was implemented
to carry out analysis of all hardened concrete samples. The method introduced by Peterson (2008)
was implemented with several modifications to adjust its usability. Analysis was carried out
following subsequent steps.
Figure 4-5: Hardened Air Void Analysis Mold
4.3 Cutting of Specimens
Samples were cut using a Covington Engineering concrete saw shown in Figure 4-6 (a). Upon
completion of the cutting process, concrete slices of uniform thickness, approximately 1 in, were
prepared (Figure 4-6 (b)). Once cut, all samples were washed using water and compressed air to
remove all cutting residues.

30
(a)
(b)
Figure 4-6: (a) Cutting Setup, (b) Cut Sample
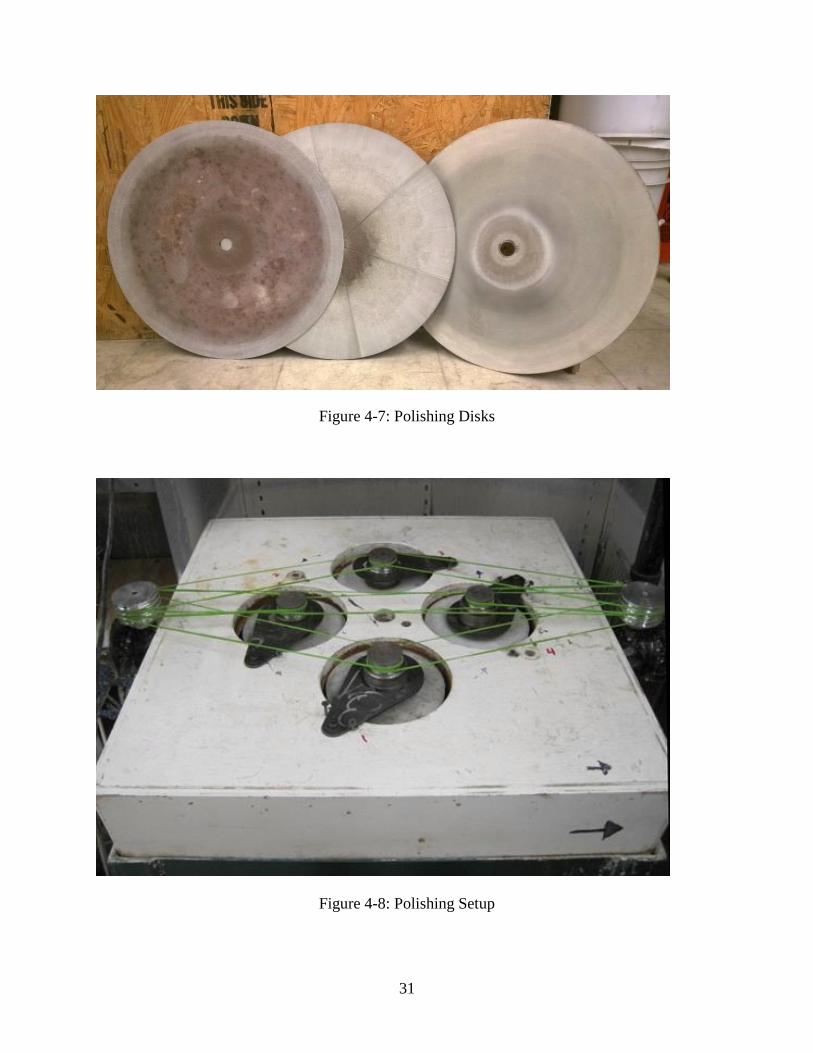
4.4 Surface Polishing
A horizontal polishing table (ASW Diamond SW-1800), equipped with diamond nickel-plated
disks (ASW Diamond NT-80, NT-100) and flexible resin processing disks (ASW Diamond PP360,
PP600), was used to polish all samples. Disks are shown in Figure 4-7. The polishing table
presented in Figure 4-8 was adjusted with a custom-made mounting setup (including two Fischer
Scientific DynaMix electric motors), allowing four samples to be polished simultaneously and
ensuring that expected polished surface quality was achieved. Polishing procedure was derived
from procedure developed by Ley (2007).
31
Figure 4-7: Polishing Disks
Figure 4-8: Polishing Setup
32
Cut and washed samples were attached to plastic cylinders (5.5 in diameter, 2 in height) using
a hot glue gun. Cylinders were designed to hold samples on the lapping wheel. Once the glue dried,
a 60:40 solution of acetone and clear lacquer was applied to the sample surface to stabilize the
cement paste during polishing. The surface was allowed to dry. Water with a small amount of dish
soap (approximately 0.15 fl oz per 5 gallons) was used to lubricate samples and disks during
polishing; the amount of water applied to the disk depended on its fineness and was determined
by the operator.
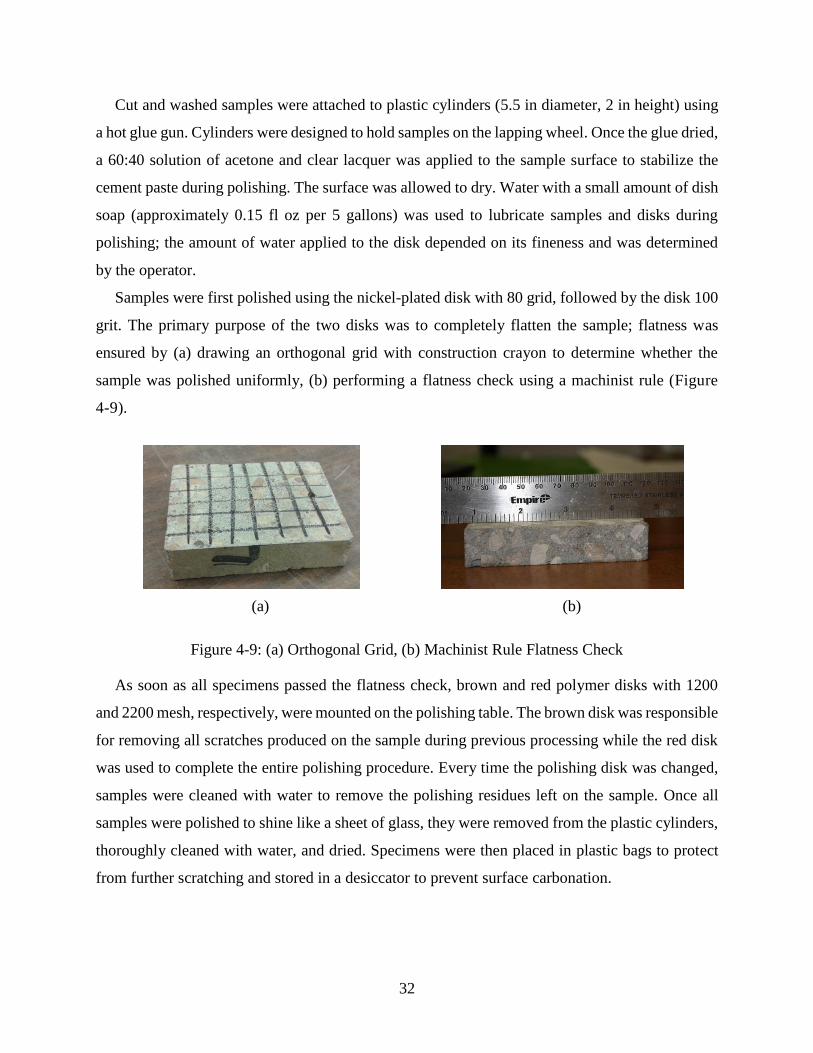
Samples were first polished using the nickel-plated disk with 80 grid, followed by the disk 100
grit. The primary purpose of the two disks was to completely flatten the sample; flatness was
ensured by (a) drawing an orthogonal grid with construction crayon to determine whether the
sample was polished uniformly, (b) performing a flatness check using a machinist rule (Figure
4-9).
(a)
(b)
Figure 4-9: (a) Orthogonal Grid, (b) Machinist Rule Flatness Check
As soon as all specimens passed the flatness check, brown and red polymer disks with 1200
and 2200 mesh, respectively, were mounted on the polishing table. The brown disk was responsible
for removing all scratches produced on the sample during previous processing while the red disk
was used to complete the entire polishing procedure. Every time the polishing disk was changed,
samples were cleaned with water to remove the polishing residues left on the sample. Once all
samples were polished to shine like a sheet of glass, they were removed from the plastic cylinders,
thoroughly cleaned with water, and dried. Specimens were then placed in plastic bags to protect
from further scratching and stored in a desiccator to prevent surface carbonation.
33
4.5 Scanning
Immediately prior to scanning, specimens were submerged in an acetone bath for 3-5 minutes
to remove lacquer from all voids if present. Samples were then dried using a hairdryer.
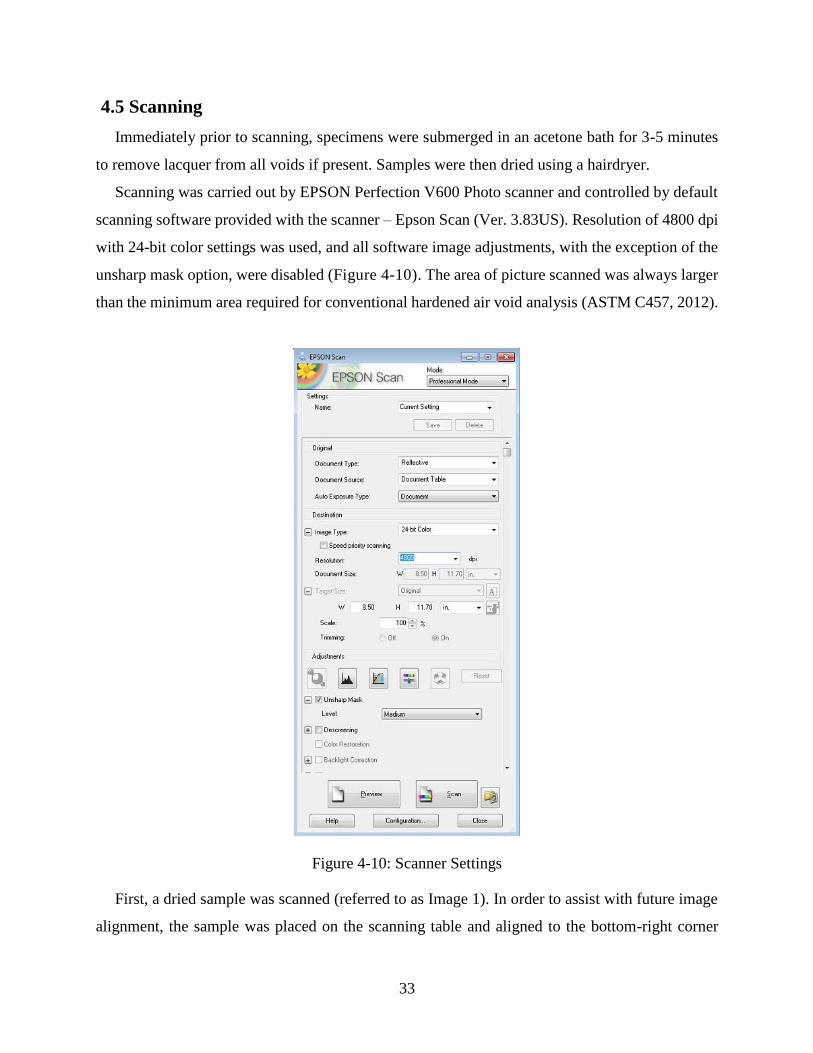
Scanning was carried out by EPSON Perfection V600 Photo scanner and controlled by default
scanning software provided with the scanner – Epson Scan (Ver. 3.83US). Resolution of 4800 dpi
with 24-bit color settings was used, and all software image adjustments, with the exception of the
unsharp mask option, were disabled (Figure 4-10). The area of picture scanned was always larger
than the minimum area required for conventional hardened air void analysis (ASTM C457, 2012).
Figure 4-10: Scanner Settings
First, a dried sample was scanned (referred to as Image 1). In order to assist with future image
alignment, the sample was placed on the scanning table and aligned to the bottom-right corner
34
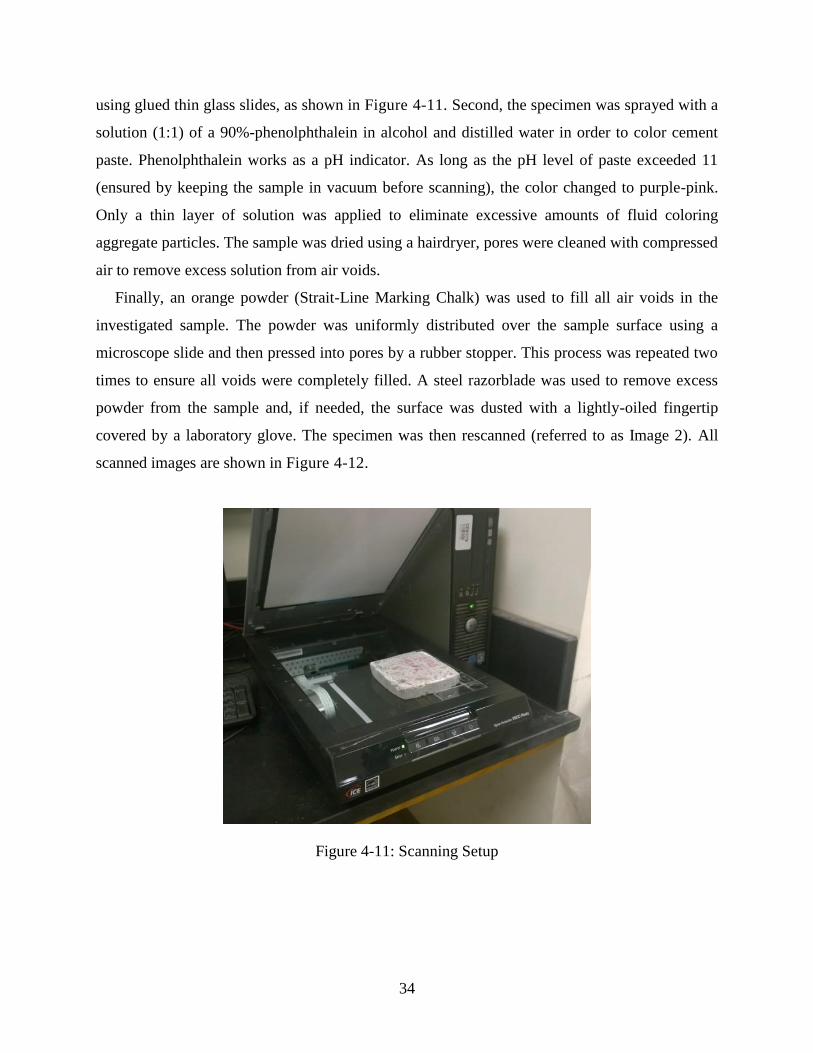
using glued thin glass slides, as shown in Figure 4-11. Second, the specimen was sprayed with a
solution (1:1) of a 90%-phenolphthalein in alcohol and distilled water in order to color cement
paste. Phenolphthalein works as a pH indicator. As long as the pH level of paste exceeded 11
(ensured by keeping the sample in vacuum before scanning), the color changed to purple-pink.
Only a thin layer of solution was applied to eliminate excessive amounts of fluid coloring
aggregate particles. The sample was dried using a hairdryer, pores were cleaned with compressed
air to remove excess solution from air voids.
Finally, an orange powder (Strait-Line Marking Chalk) was used to fill all air voids in the
investigated sample. The powder was uniformly distributed over the sample surface using a
microscope slide and then pressed into pores by a rubber stopper. This process was repeated two
times to ensure all voids were completely filled. A steel razorblade was used to remove excess
powder from the sample and, if needed, the surface was dusted with a lightly-oiled fingertip
covered by a laboratory glove. The specimen was then rescanned (referred to as Image 2). All
scanned images are shown in Figure 4-12.
Figure 4-11: Scanning Setup
35
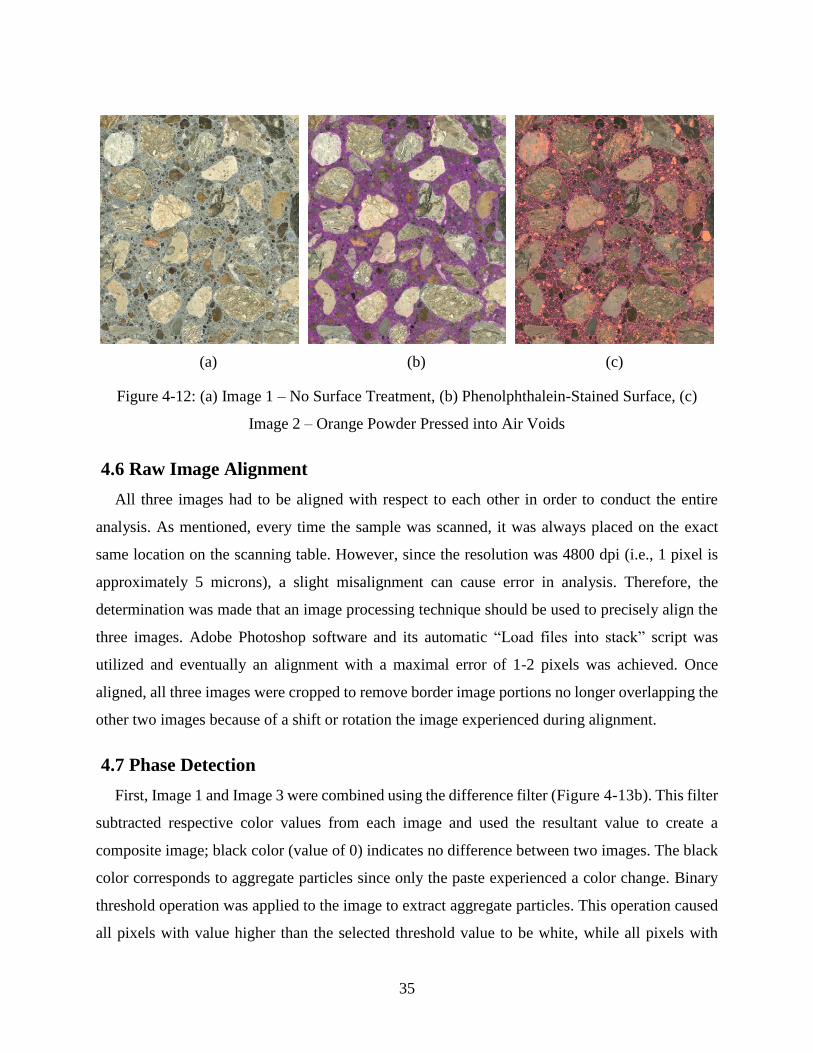
(a)
(b)
(c)
Figure 4-12: (a) Image 1 – No Surface Treatment, (b) Phenolphthalein-Stained Surface, (c)
Image 2 – Orange Powder Pressed into Air Voids
4.6 Raw Image Alignment
All three images had to be aligned with respect to each other in order to conduct the entire
analysis. As mentioned, every time the sample was scanned, it was always placed on the exact
same location on the scanning table. However, since the resolution was 4800 dpi (i.e., 1 pixel is
approximately 5 microns), a slight misalignment can cause error in analysis. Therefore, the
determination was made that an image processing technique should be used to precisely align the
three images. Adobe Photoshop software and its automatic “Load files into stack” script was
utilized and eventually an alignment with a maximal error of 1-2 pixels was achieved. Once
aligned, all three images were cropped to remove border image portions no longer overlapping the
other two images because of a shift or rotation the image experienced during alignment.
4.7 Phase Detection
First, Image 1 and Image 3 were combined using the difference filter (Figure 4-13b). This filter
subtracted respective color values from each image and used the resultant value to create a
composite image; black color (value of 0) indicates no difference between two images. The black
color corresponds to aggregate particles since only the paste experienced a color change. Binary
threshold operation was applied to the image to extract aggregate particles. This operation caused
all pixels with value higher than the selected threshold value to be white, while all pixels with
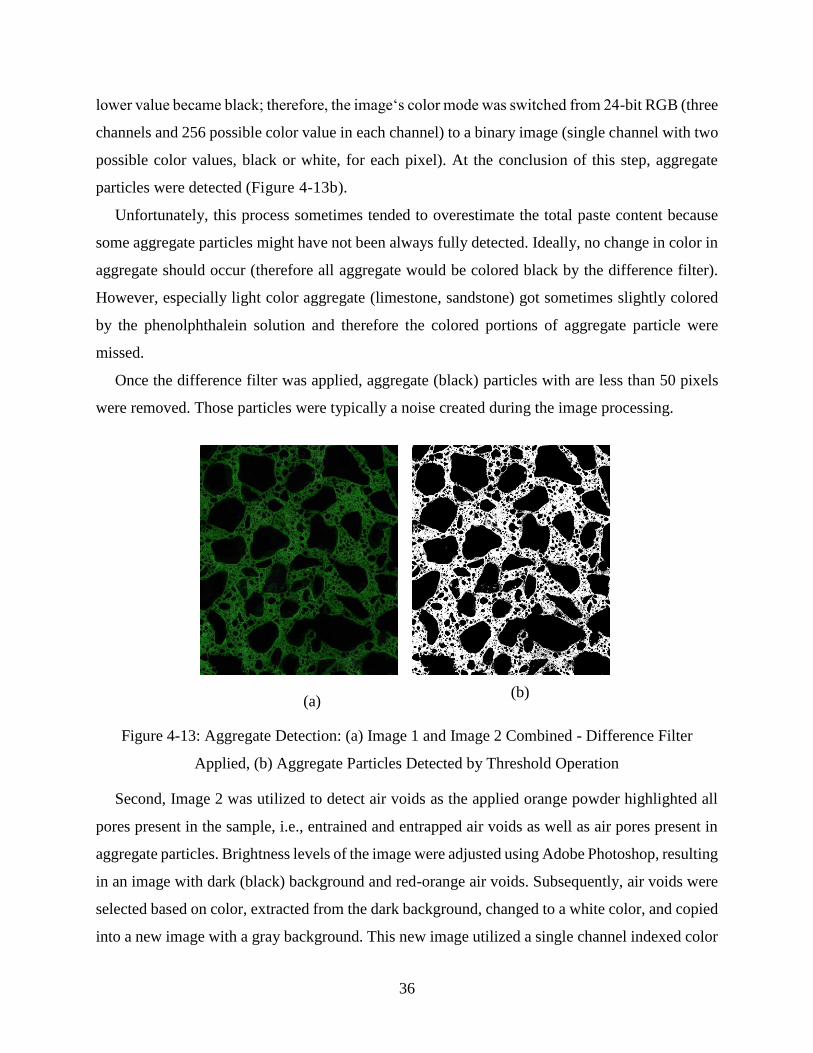
36
lower value became black; therefore, the image‘s color mode was switched from 24-bit RGB (three
channels and 256 possible color value in each channel) to a binary image (single channel with two
possible color values, black or white, for each pixel). At the conclusion of this step, aggregate
particles were detected (Figure 4-13b).
Unfortunately, this process sometimes tended to overestimate the total paste content because
some aggregate particles might have not been always fully detected. Ideally, no change in color in
aggregate should occur (therefore all aggregate would be colored black by the difference filter).
However, especially light color aggregate (limestone, sandstone) got sometimes slightly colored
by the phenolphthalein solution and therefore the colored portions of aggregate particle were
missed.
Once the difference filter was applied, aggregate (black) particles with are less than 50 pixels
were removed. Those particles were typically a noise created during the image processing.
(a)
(b)
Figure 4-13: Aggregate Detection: (a) Image 1 and Image 2 Combined - Difference Filter
Applied, (b) Aggregate Particles Detected by Threshold Operation
Second, Image 2 was utilized to detect air voids as the applied orange powder highlighted all
pores present in the sample, i.e., entrained and entrapped air voids as well as air pores present in
aggregate particles. Brightness levels of the image were adjusted using Adobe Photoshop, resulting
in an image with dark (black) background and red-orange air voids. Subsequently, air voids were
selected based on color, extracted from the dark background, changed to a white color, and copied
into a new image with a gray background. This new image utilized a single channel indexed color

37
mode (often referred to as grayscale mode), allowing each pixel to have a color value from 0 to
255 (Figure 4-14).
(a)
(b)
Figure 4-14: Voids Detection: (a) Image 2 after Brightness Adjustments, (b) Grayscale Image
with Detected Pores
False Color Image
The false color image, created using the binary image shown in Figure 4-13b and Figure 4-14,
used the grayscale mode with black color representing aggregate, white color corresponding to air
voids, and gray color indicating cement paste.
4.8 Air Void Analysis
A new software application, KSU Void Analyzer, was developed to facilitate air void analysis
of previously generated images. .NET Framework 4.5 with 64-bit architecture, Microsoft Visual
Studio 2012 and C# programing language were used to create this application. In order to perform
advanced image processing tasks, AForge, EmguCV, and ClipperLibrary frameworks (all
available under the GPU/GPL license) were incorporated into KSU Void Analyzer.
KSU Void Analyzer provided all information obtained using conventional analysis methods
such as total air void content and spacing factor and total areas of concrete phases such as
aggregate, cement paste, and air. In addition, information such as sizes, centroid locations, and
other properties could be obtained from the software.

38
Spacing factor was obtained by performing the linear traverse method (ASTM C457, 2012) on
the false color image as if it was a real hardened concrete sample. However, analysis was
performed by computer software rather than a human operator. The software iterated through the
sample from left to right, investigating every pixel. Total length of traverse, traverse length through
air, and traverse length through paste were recorded in order to calculate the spacing factor.
4.9 Air Void Clustering Evaluation
To investigate the effect air void clustering may have on compressive strength of concrete, an
evaluation method was implemented in the software that could quantify air clustering serenity.
This method utilized existing false-color image and information obtained in previous steps of the
analysis, particularly location of air void centroids and areas of aggregate particles. Since analysis
of each aggregate would be extremely demanding computationally, only particles with area of
more than 20,000,000 pixels (0.86 in²) were investigated.
As a first step, equidistant lines derived from boundaries of selected aggregate particles were
formed, creating 5 layers of uniform thickness (0.26 mm) immediately surrounding analyzed
particles. Each layer was then searched for the presence of air void, and the total percentage of air
voids within the investigated area was recorded for each layer. Local values of air content were
then compared to the total air void content of the analyzed sample. Clustering index was defined
as a ratio of air void content of the first investigated layer to the total air void content of the entire
sample.
39
4.10 Air Void Clustering Rating
A method of clustering evaluation developed by Kozikowski et al. (2005) was also used to
estimate the air void clustering extent. This method was performed by an independent operator
than the person performing the hardened air void sample image analysis. Twenty or more largest
aggregate particles in each sample were selected for rating. Those particles were then investigated
under a microscope and assigned to a category represented with a number from 0 to 3 based on
severity of void clustering. Once all particles were rated, the number of particles in each category
were multiplied by a category number and then averaged over the total number of particles.
Therefore, a single number indicating the air void level was generated.

40
Chapter 5 - Field Testing
5.1 Introduction
Two ongoing construction projects under the supervision of KDOT, with the retempering
practice implemented, were visited in summer 2014.
The first site (Site I) was located in northwest Topeka, KS (Shawnee County) where a new
interchange at US 24 and Menoken Road was being constructed. Site I was visited and samples
were taken on June 20th, 2014, when a deck of the Bridge No. 70-44 (US-75 SB) was placed.
The second site (Site II) was located approximately 15 miles south of Topeka, KS, near
Carbondale, KS (Osage County). This project, visited and sampled on July 7th, 2014, included
placing a new overlay on the north bridge approach (Bridge No. 70-44 on US-75).
5.2 Methods
At both sites, fresh concrete properties (before and after water addition) were measured and
recorded. Samples for compressive strength were made according to ASTM C31 (2012) were
followed. Samples for hardened air void analysis were also made. After casting, samples were
stored in a cooler on site for the initial 24-hour curing period and then transported to K-State
laboratories and stored in the 100% moisture room at 72°F.
Similarly to mixes in the laboratory study, compressive strength was tested at 7 and 28 days
(ASTM C39, 2012; ASTM C1231, 2014), and hardened air void analysis (including the automatic
clustering evaluation) was carried out.
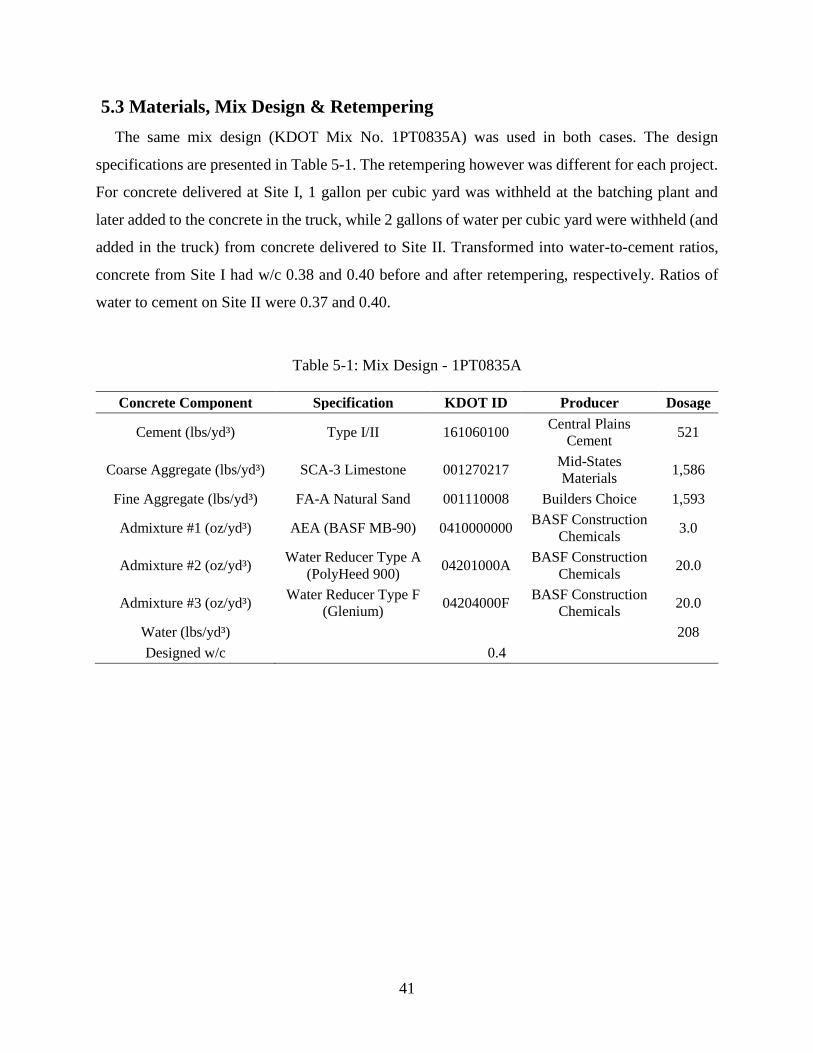
41
5.3 Materials, Mix Design & Retempering
The same mix design (KDOT Mix No. 1PT0835A) was used in both cases. The design
specifications are presented in Table 5-1. The retempering however was different for each project.
For concrete delivered at Site I, 1 gallon per cubic yard was withheld at the batching plant and
later added to the concrete in the truck, while 2 gallons of water per cubic yard were withheld (and
added in the truck) from concrete delivered to Site II. Transformed into water-to-cement ratios,
concrete from Site I had w/c 0.38 and 0.40 before and after retempering, respectively. Ratios of
water to cement on Site II were 0.37 and 0.40.
Table 5-1: Mix Design - 1PT0835A
Concrete Component Specification KDOT ID Producer Dosage
Cement (lbs/yd³) Type I/II 161060100 Central Plains
Cement 521
Coarse Aggregate (lbs/yd³) SCA-3 Limestone 001270217 Mid-States
Materials 1,586
Fine Aggregate (lbs/yd³) FA-A Natural Sand 001110008 Builders Choice 1,593
Admixture #1 (oz/yd³) AEA (BASF MB-90) 0410000000 BASF Construction
Chemicals 3.0
Admixture #2 (oz/yd³) Water Reducer Type A
(PolyHeed 900) 04201000A
BASF Construction
Chemicals 20.0
Admixture #3 (oz/yd³) Water Reducer Type F
(Glenium) 04204000F
BASF Construction
Chemicals 20.0
Water (lbs/yd³) 208
Designed w/c 0.4
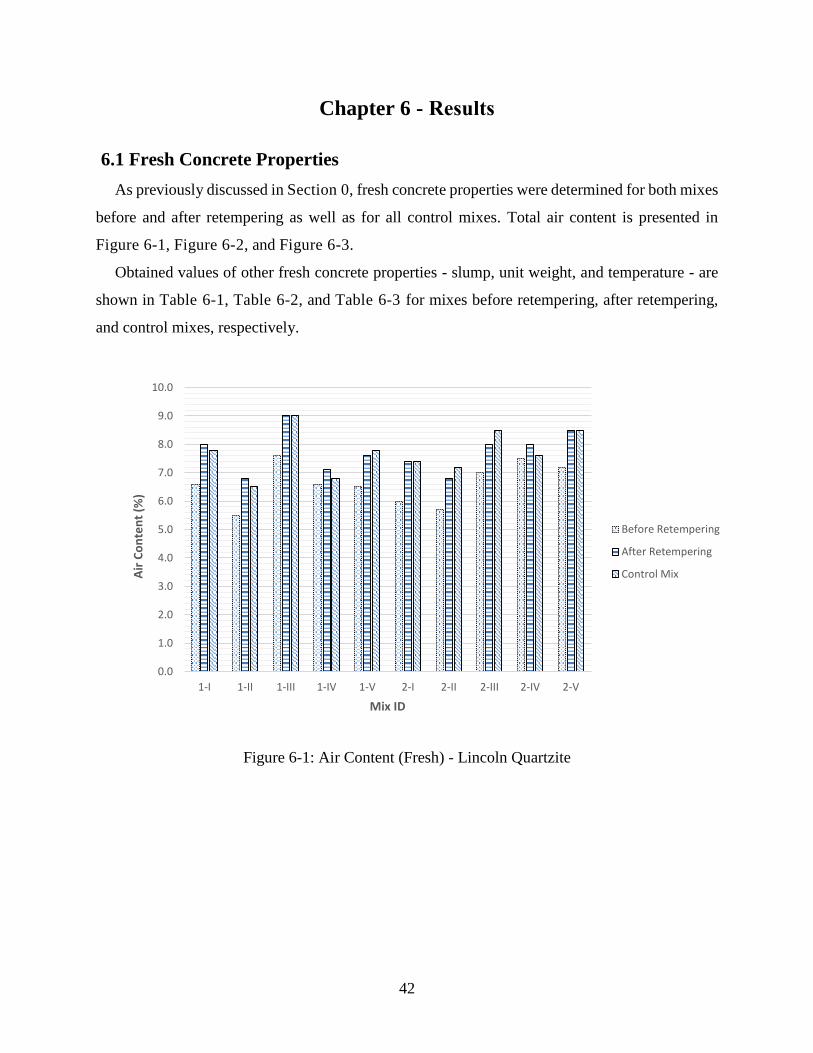
42
Chapter 6 - Results
6.1 Fresh Concrete Properties
As previously discussed in Section 0, fresh concrete properties were determined for both mixes
before and after retempering as well as for all control mixes. Total air content is presented in
Figure 6-1, Figure 6-2, and Figure 6-3.
Obtained values of other fresh concrete properties - slump, unit weight, and temperature - are
shown in Table 6-1, Table 6-2, and Table 6-3 for mixes before retempering, after retempering,
and control mixes, respectively.
Figure 6-1: Air Content (Fresh) - Lincoln Quartzite
0.0
1.0
2.0
3.0
4.0
5.0
6.0
7.0
8.0
9.0
10.0
1-I 1-II 1-III 1-IV 1-V 2-I 2-II 2-III 2-IV 2-V
Air
Co
nte
nt
(%)
Mix ID
Before Retempering
After Retempering
Control Mix
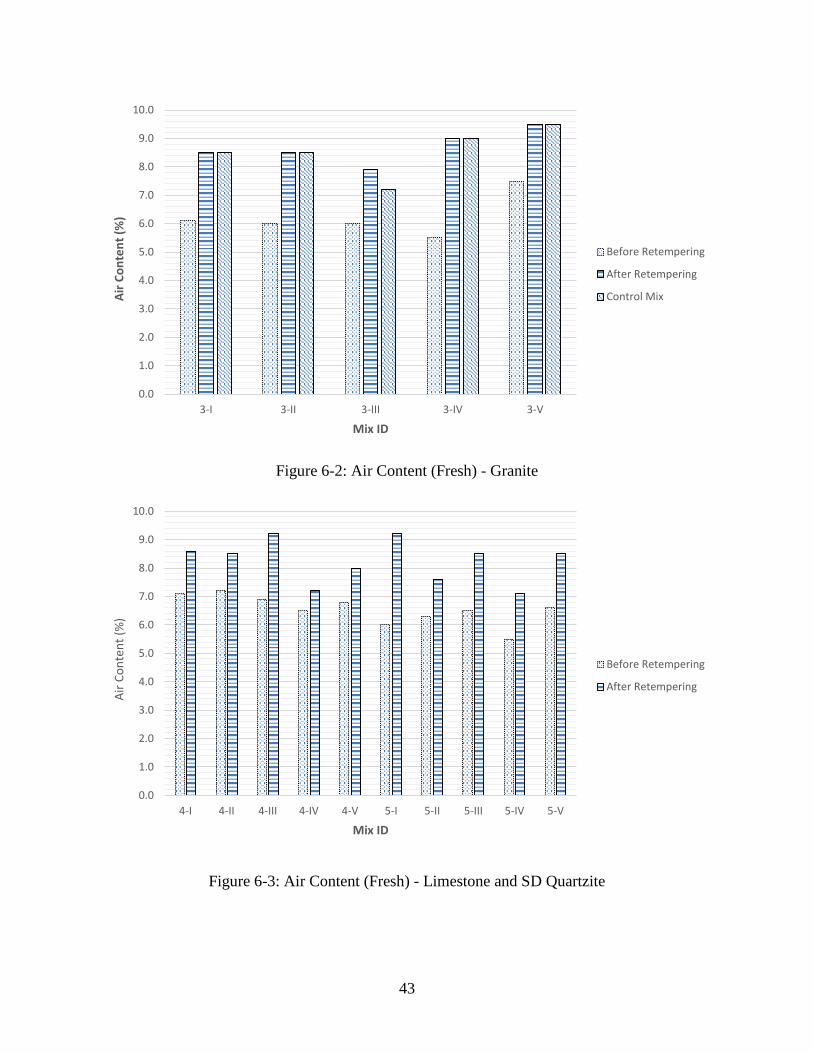
43
Figure 6-2: Air Content (Fresh) - Granite
Figure 6-3: Air Content (Fresh) - Limestone and SD Quartzite
0.0
1.0
2.0
3.0
4.0
5.0
6.0
7.0
8.0
9.0
10.0
3-I 3-II 3-III 3-IV 3-V
Air
Co
nte
nt
(%)
Mix ID
Before Retempering
After Retempering
Control Mix
0.0
1.0
2.0
3.0
4.0
5.0
6.0
7.0
8.0
9.0
10.0
4-I 4-II 4-III 4-IV 4-V 5-I 5-II 5-III 5-IV 5-V
Air
Co
nte
nt
(%)
Mix ID
Before Retempering
After Retempering
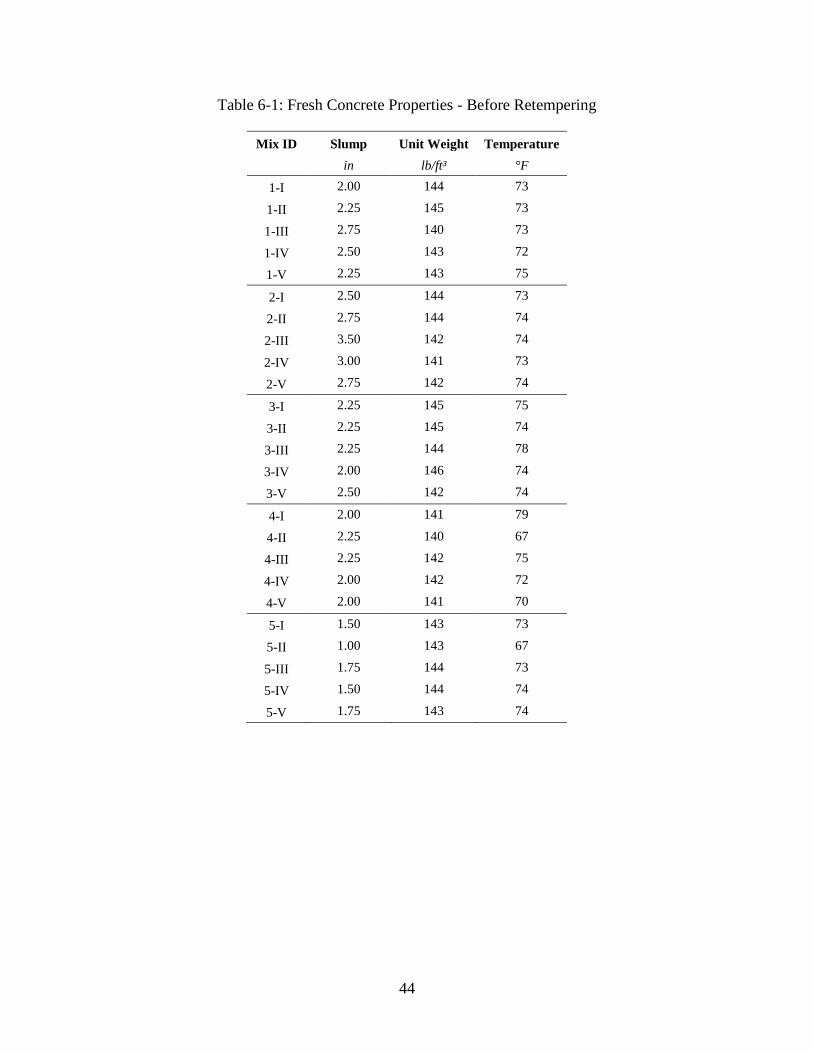
44
Table 6-1: Fresh Concrete Properties - Before Retempering
Mix ID Slump Unit Weight Temperature
in lb/ft³ °F
1-I 2.00 144 73
1-II 2.25 145 73
1-III 2.75 140 73
1-IV 2.50 143 72
1-V 2.25 143 75
2-I 2.50 144 73
2-II 2.75 144 74
2-III 3.50 142 74
2-IV 3.00 141 73
2-V 2.75 142 74
3-I 2.25 145 75
3-II 2.25 145 74
3-III 2.25 144 78
3-IV 2.00 146 74
3-V 2.50 142 74
4-I 2.00 141 79
4-II 2.25 140 67
4-III 2.25 142 75
4-IV 2.00 142 72
4-V 2.00 141 70
5-I 1.50 143 73
5-II 1.00 143 67
5-III 1.75 144 73
5-IV 1.50 144 74
5-V 1.75 143 74
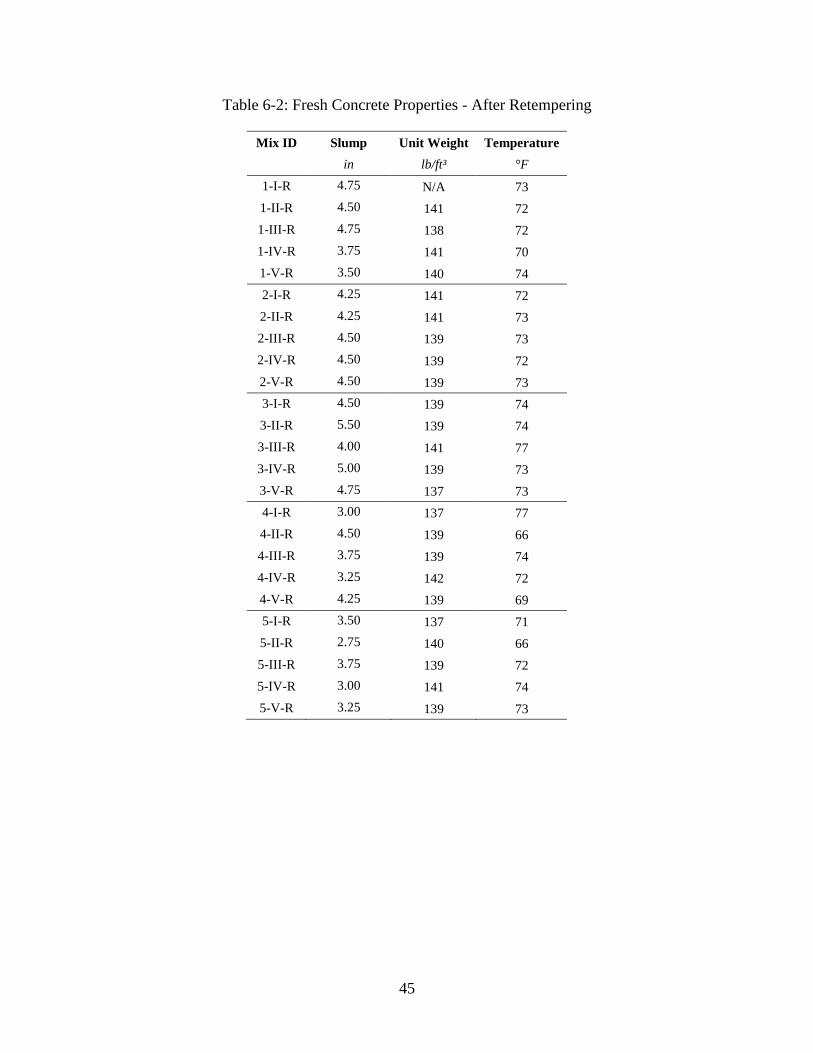
45
Table 6-2: Fresh Concrete Properties - After Retempering
Mix ID Slump Unit Weight Temperature
in lb/ft³ °F
1-I-R 4.75 N/A 73
1-II-R 4.50 141 72
1-III-R 4.75 138 72
1-IV-R 3.75 141 70
1-V-R 3.50 140 74
2-I-R 4.25 141 72
2-II-R 4.25 141 73
2-III-R 4.50 139 73
2-IV-R 4.50 139 72
2-V-R 4.50 139 73
3-I-R 4.50 139 74
3-II-R 5.50 139 74
3-III-R 4.00 141 77
3-IV-R 5.00 139 73
3-V-R 4.75 137 73
4-I-R 3.00 137 77
4-II-R 4.50 139 66
4-III-R 3.75 139 74
4-IV-R 3.25 142 72
4-V-R 4.25 139 69
5-I-R 3.50 137 71
5-II-R 2.75 140 66
5-III-R 3.75 139 72
5-IV-R 3.00 141 74
5-V-R 3.25 139 73
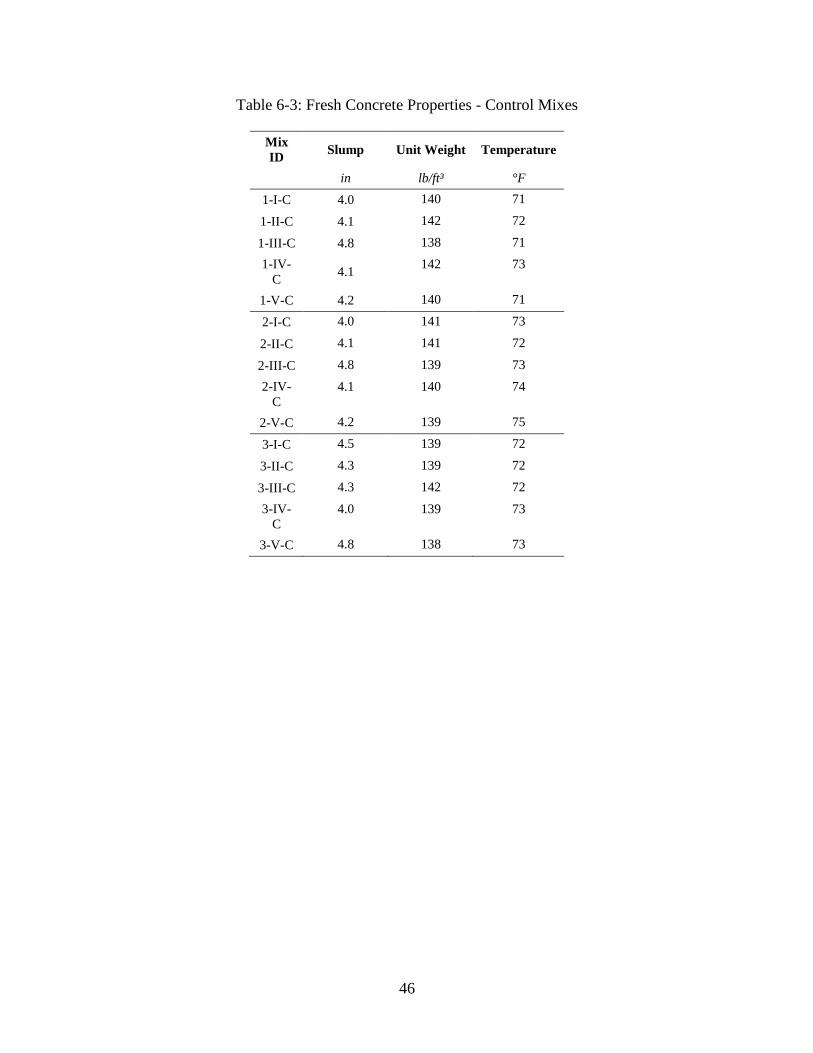
46
Table 6-3: Fresh Concrete Properties - Control Mixes
Mix
ID Slump Unit Weight Temperature
in lb/ft³ °F
1-I-C 4.0 140 71
1-II-C 4.1 142 72
1-III-C 4.8 138 71
1-IV-
C 4.1
142 73
1-V-C 4.2 140 71
2-I-C 4.0 141 73
2-II-C 4.1 141 72
2-III-C 4.8 139 73
2-IV-
C
4.1 140 74
2-V-C 4.2 139 75
3-I-C 4.5 139 72
3-II-C 4.3 139 72
3-III-C 4.3 142 72
3-IV-
C
4.0 139 73
3-V-C 4.8 138 73
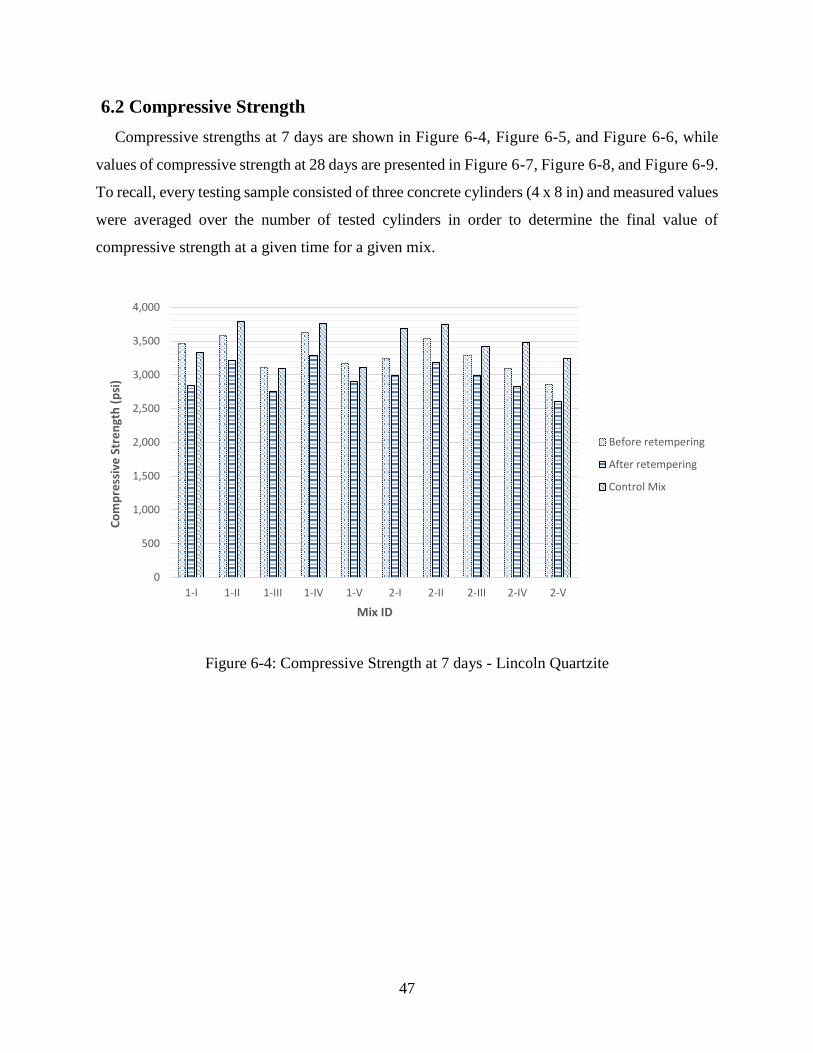
47
6.2 Compressive Strength
Compressive strengths at 7 days are shown in Figure 6-4, Figure 6-5, and Figure 6-6, while
values of compressive strength at 28 days are presented in Figure 6-7, Figure 6-8, and Figure 6-9.
To recall, every testing sample consisted of three concrete cylinders (4 x 8 in) and measured values
were averaged over the number of tested cylinders in order to determine the final value of
compressive strength at a given time for a given mix.
Figure 6-4: Compressive Strength at 7 days - Lincoln Quartzite
0
500
1,000
1,500
2,000
2,500
3,000
3,500
4,000
1-I 1-II 1-III 1-IV 1-V 2-I 2-II 2-III 2-IV 2-V
Co
mp
ress
ive
Str
en
gth
(p
si)
Mix ID
Before retempering
After retempering
Control Mix

48
Figure 6-5: Compressive Strength at 7 days - Granite
Figure 6-6: Compressive Strength at 7 days - Limestone and SD Quartzite
0
500
1,000
1,500
2,000
2,500
3,000
3,500
4,000
3-I 3-II 3-III 3-IV 3-V
Co
mp
ress
ive
Str
en
gth
(p
si)
Mix ID
Before retempering
After retempering
Control Mix
0
500
1,000
1,500
2,000
2,500
3,000
3,500
4,000
4,500
4-I 4-II 4-III 4-IV 4-V 5-I 5-II 5-III 5-IV 5-V
Co
mp
ress
ive
Str
en
gth
(p
si)
Mix ID
Before retempering
After retempering

49
Figure 6-7: Compressive Strength at 28 days - Lincoln Quartzite
Figure 6-8: Compressive Strength at 28 days - Granite
0
1,000
2,000
3,000
4,000
5,000
6,000
1-I 1-II 1-III 1-IV 1-V 2-I 2-II 2-III 2-IV 2-V
Co
mp
ress
ive
Str
en
gth
(p
si)
Mix ID
Before retempering
After retempering
Control Mix
0
1,000
2,000
3,000
4,000
5,000
6,000
7,000
3-I 3-II 3-III 3-IV 3-V
Co
mp
ress
ive
Str
en
gth
(p
si)
Mix ID
Before retempering
After retempering
Control Mix
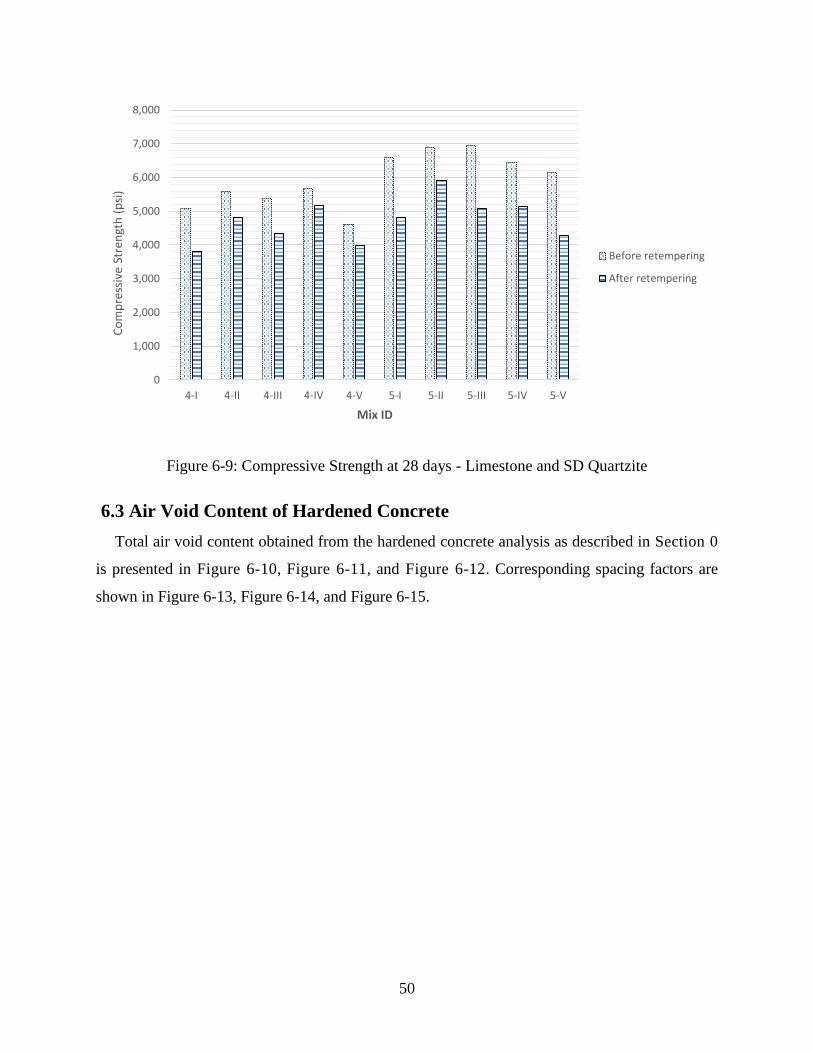
50
Figure 6-9: Compressive Strength at 28 days - Limestone and SD Quartzite
6.3 Air Void Content of Hardened Concrete
Total air void content obtained from the hardened concrete analysis as described in Section 0
is presented in Figure 6-10, Figure 6-11, and Figure 6-12. Corresponding spacing factors are
shown in Figure 6-13, Figure 6-14, and Figure 6-15.
0
1,000
2,000
3,000
4,000
5,000
6,000
7,000
8,000
4-I 4-II 4-III 4-IV 4-V 5-I 5-II 5-III 5-IV 5-V
Co
mp
ress
ive
Stre
ngt
h (
psi
)
Mix ID
Before retempering
After retempering
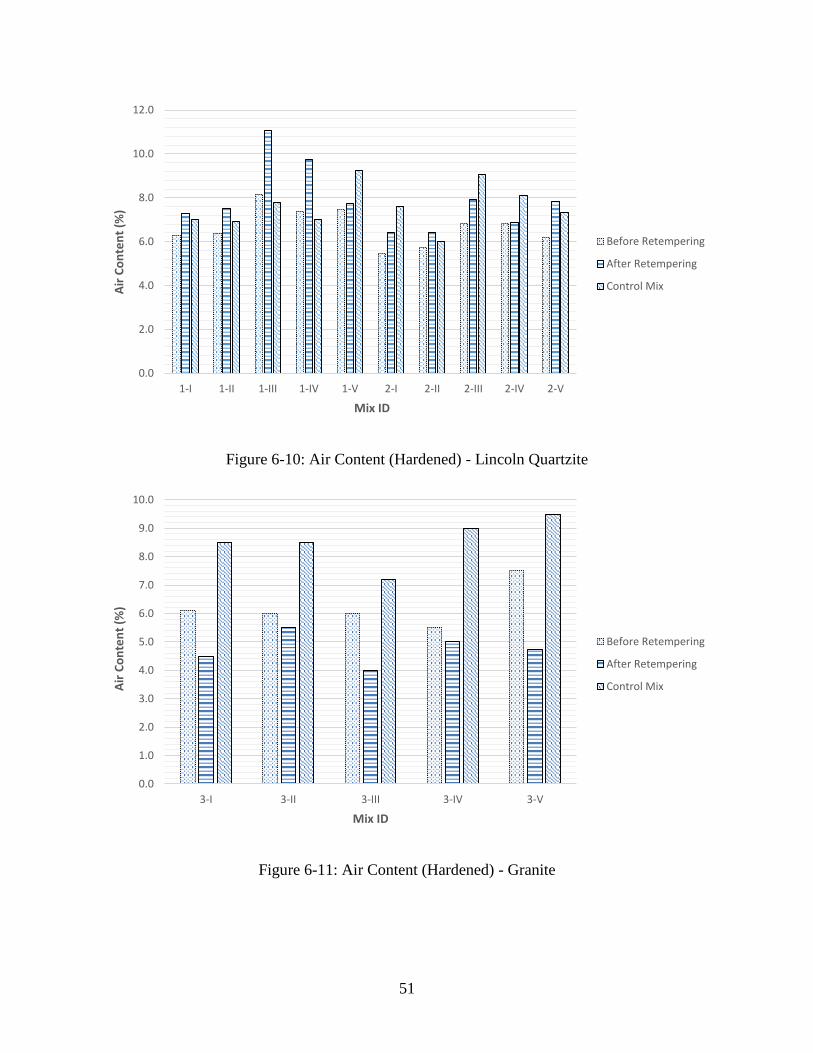
51
Figure 6-10: Air Content (Hardened) - Lincoln Quartzite
Figure 6-11: Air Content (Hardened) - Granite
0.0
2.0
4.0
6.0
8.0
10.0
12.0
1-I 1-II 1-III 1-IV 1-V 2-I 2-II 2-III 2-IV 2-V
Air
Co
nte
nt
(%)
Mix ID
Before Retempering
After Retempering
Control Mix
0.0
1.0
2.0
3.0
4.0
5.0
6.0
7.0
8.0
9.0
10.0
3-I 3-II 3-III 3-IV 3-V
Air
Co
nte
nt
(%)
Mix ID
Before Retempering
After Retempering
Control Mix
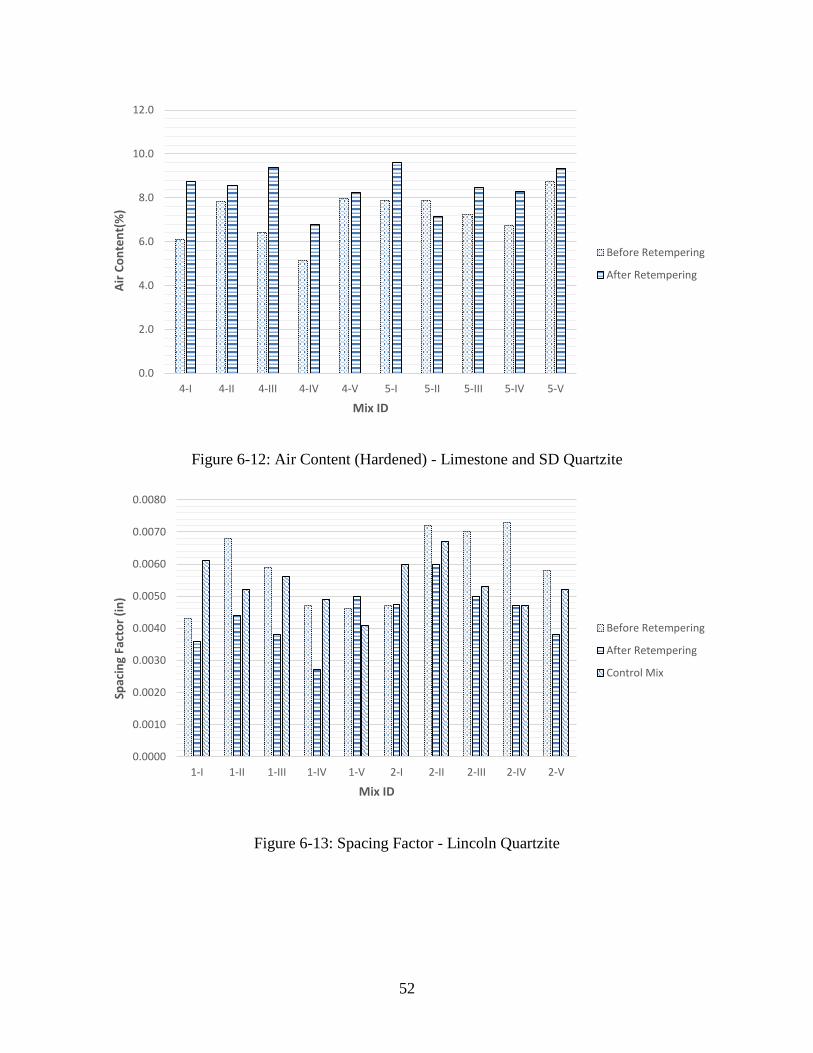
52
Figure 6-12: Air Content (Hardened) - Limestone and SD Quartzite
Figure 6-13: Spacing Factor - Lincoln Quartzite
0.0
2.0
4.0
6.0
8.0
10.0
12.0
4-I 4-II 4-III 4-IV 4-V 5-I 5-II 5-III 5-IV 5-V
Air
Co
nte
nt(
%)
Mix ID
Before Retempering
After Retempering
0.0000
0.0010
0.0020
0.0030
0.0040
0.0050
0.0060
0.0070
0.0080
1-I 1-II 1-III 1-IV 1-V 2-I 2-II 2-III 2-IV 2-V
Spac
ing
Fact
or
(in
)
Mix ID
Before Retempering
After Retempering
Control Mix
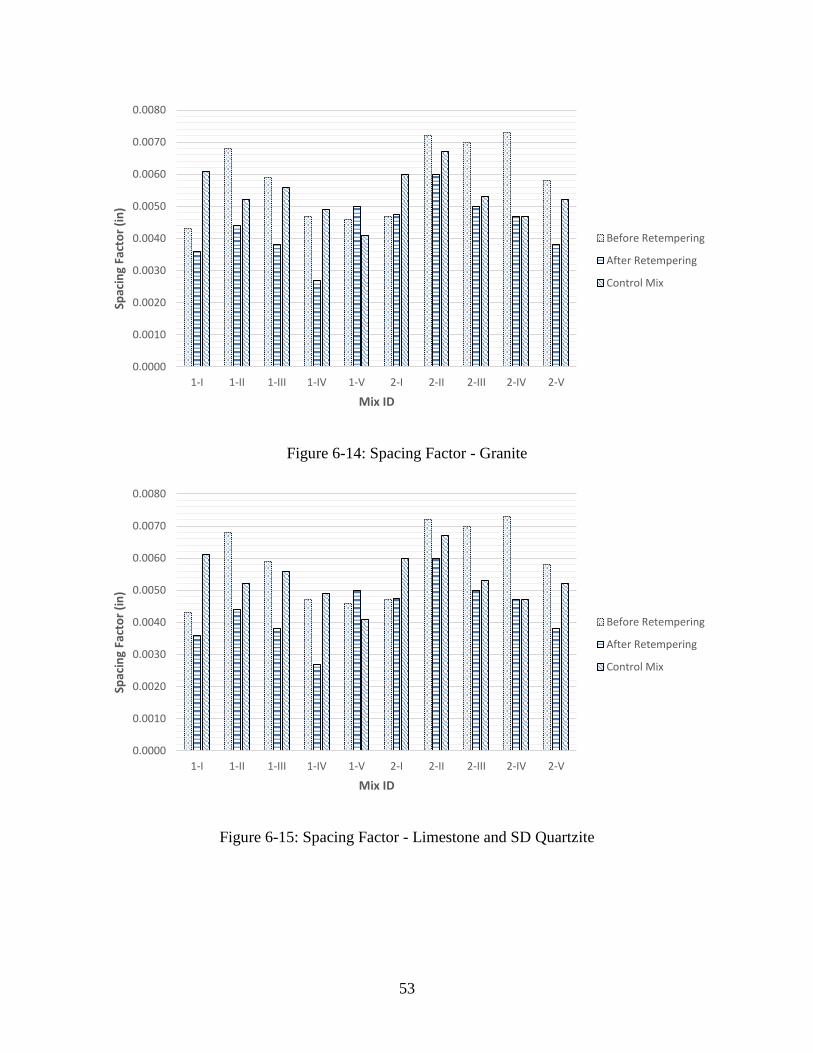
53
Figure 6-14: Spacing Factor - Granite
Figure 6-15: Spacing Factor - Limestone and SD Quartzite
0.0000
0.0010
0.0020
0.0030
0.0040
0.0050
0.0060
0.0070
0.0080
1-I 1-II 1-III 1-IV 1-V 2-I 2-II 2-III 2-IV 2-V
Spac
ing
Fact
or
(in
)
Mix ID
Before Retempering
After Retempering
Control Mix
0.0000
0.0010
0.0020
0.0030
0.0040
0.0050
0.0060
0.0070
0.0080
1-I 1-II 1-III 1-IV 1-V 2-I 2-II 2-III 2-IV 2-V
Spac
ing
Fact
or
(in
)
Mix ID
Before Retempering
After Retempering
Control Mix
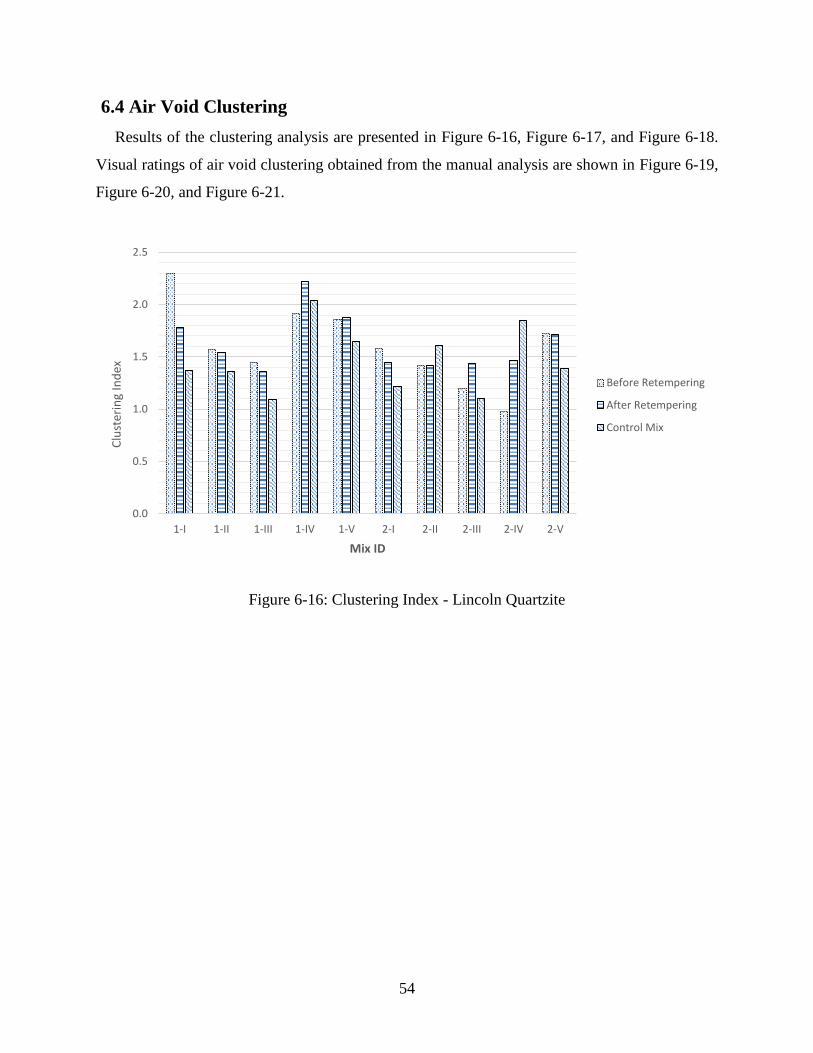
54
6.4 Air Void Clustering
Results of the clustering analysis are presented in Figure 6-16, Figure 6-17, and Figure 6-18.
Visual ratings of air void clustering obtained from the manual analysis are shown in Figure 6-19,
Figure 6-20, and Figure 6-21.
Figure 6-16: Clustering Index - Lincoln Quartzite
0.0
0.5
1.0
1.5
2.0
2.5
1-I 1-II 1-III 1-IV 1-V 2-I 2-II 2-III 2-IV 2-V
Clu
ster
ing
Ind
ex
Mix ID
Before Retempering
After Retempering
Control Mix
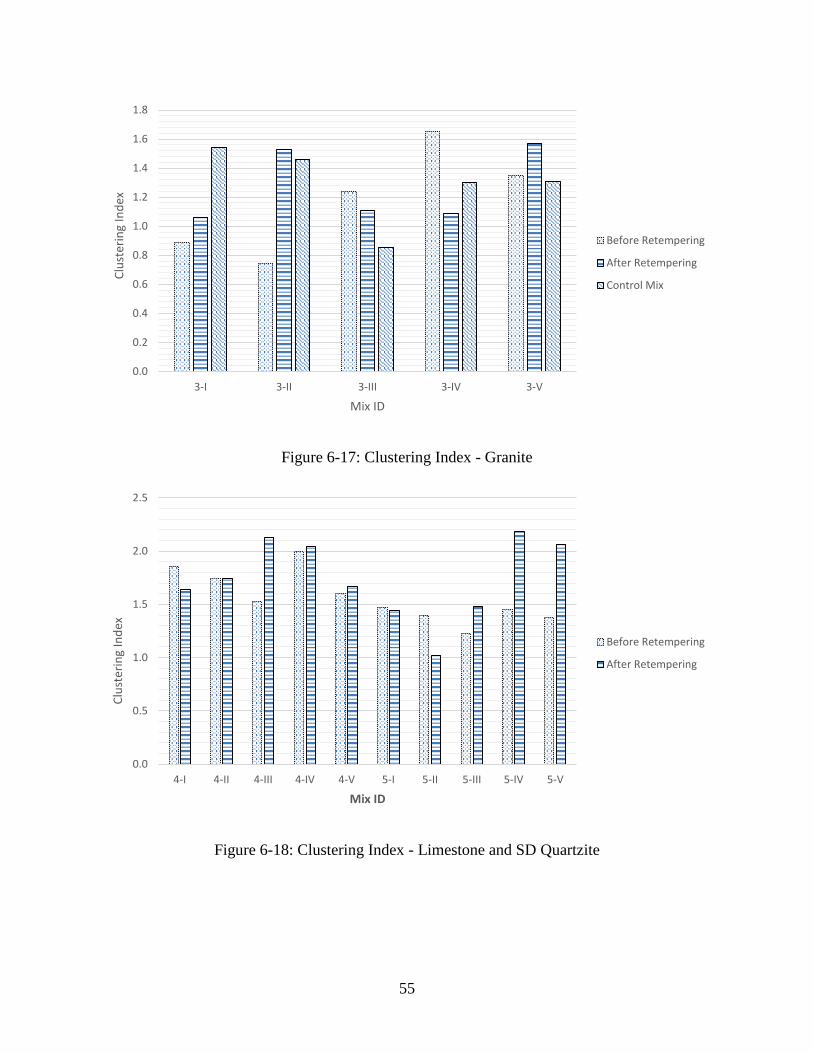
55
Figure 6-17: Clustering Index - Granite
Figure 6-18: Clustering Index - Limestone and SD Quartzite
0.0
0.2
0.4
0.6
0.8
1.0
1.2
1.4
1.6
1.8
3-I 3-II 3-III 3-IV 3-V
Clu
ster
ing
Ind
ex
Mix ID
Before Retempering
After Retempering
Control Mix
0.0
0.5
1.0
1.5
2.0
2.5
4-I 4-II 4-III 4-IV 4-V 5-I 5-II 5-III 5-IV 5-V
Clu
ster
ing
Ind
ex
Mix ID
Before Retempering
After Retempering
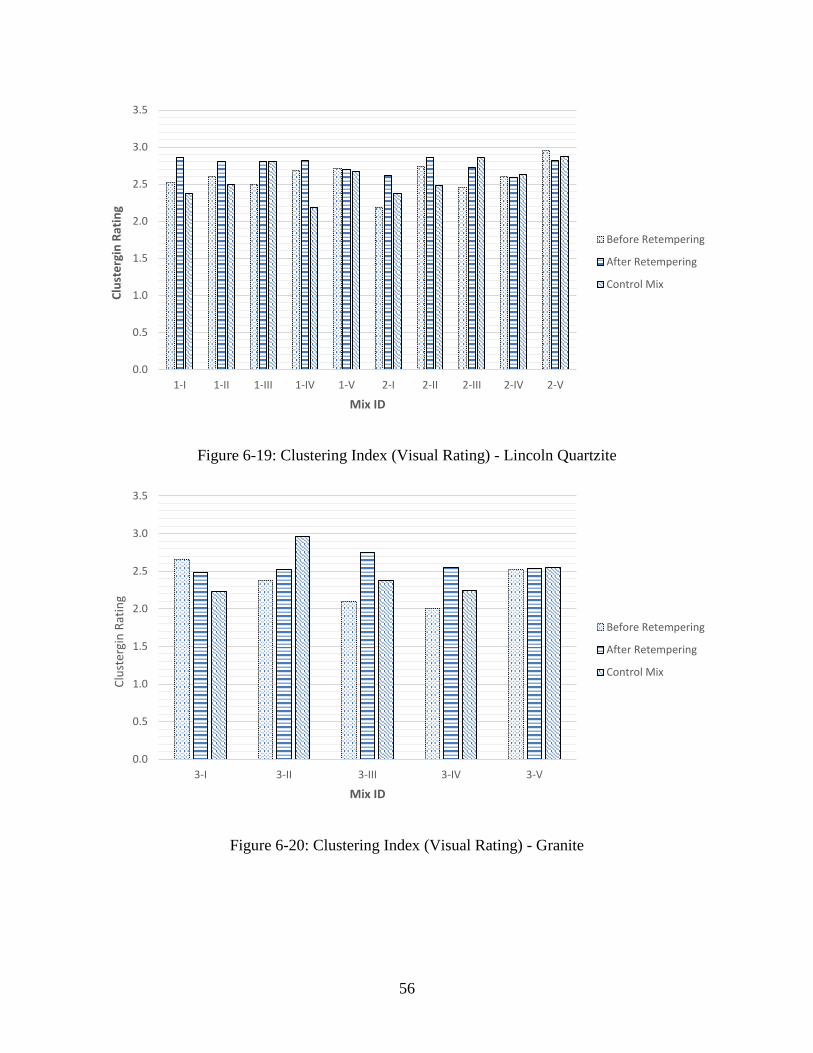
56
Figure 6-19: Clustering Index (Visual Rating) - Lincoln Quartzite
Figure 6-20: Clustering Index (Visual Rating) - Granite
0.0
0.5
1.0
1.5
2.0
2.5
3.0
3.5
1-I 1-II 1-III 1-IV 1-V 2-I 2-II 2-III 2-IV 2-V
Clu
ste
rgin
Rat
ing
Mix ID
Before Retempering
After Retempering
Control Mix
0.0
0.5
1.0
1.5
2.0
2.5
3.0
3.5
3-I 3-II 3-III 3-IV 3-V
Clu
ster
gin
Rat
ing
Mix ID
Before Retempering
After Retempering
Control Mix

57
Figure 6-21: Clustering Index (Visual Rating) - Limestone and SD Quartzite
6.5 Field Samples
Fresh concrete properties of field mixes are presented in Table 6-4.
Table 6-4: Fresh Concrete Properties - Field Testing
Site Slump Air Content Unit Weight Temperature
in % lb/ft³ °F
Site I – Before Water Addition 3.25 6.2 144 84
Site I – After Water Addition 4.00 6.6 142 85
Site II – Before Water Addition 0.50 4.5 147 79
Site II – After Water Addition 1.50 5.8 145 81
0.0
0.5
1.0
1.5
2.0
2.5
4-I 4-II 4-III 4-IV 4-V 5-I 5-II 5-III 5-IV 5-V
Clu
ster
ing
Rat
ing
Mix ID
Before Retempering
After Retempering
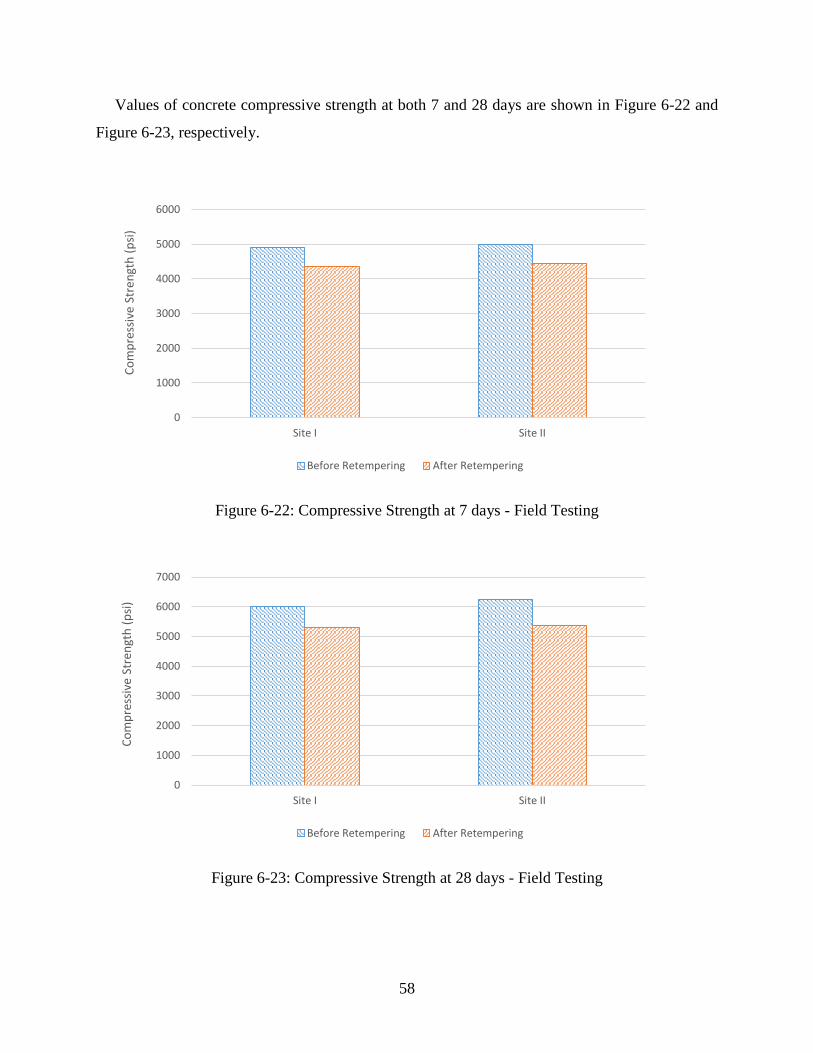
58
Values of concrete compressive strength at both 7 and 28 days are shown in Figure 6-22 and
Figure 6-23, respectively.
Figure 6-22: Compressive Strength at 7 days - Field Testing
Figure 6-23: Compressive Strength at 28 days - Field Testing
0
1000
2000
3000
4000
5000
6000
Site I Site II
Co
mp
ress
ive
Stre
ngt
h (
psi
)
Before Retempering After Retempering
0
1000
2000
3000
4000
5000
6000
7000
Site I Site II
Co
mp
ress
ive
Stre
ngt
h (
psi
)
Before Retempering After Retempering
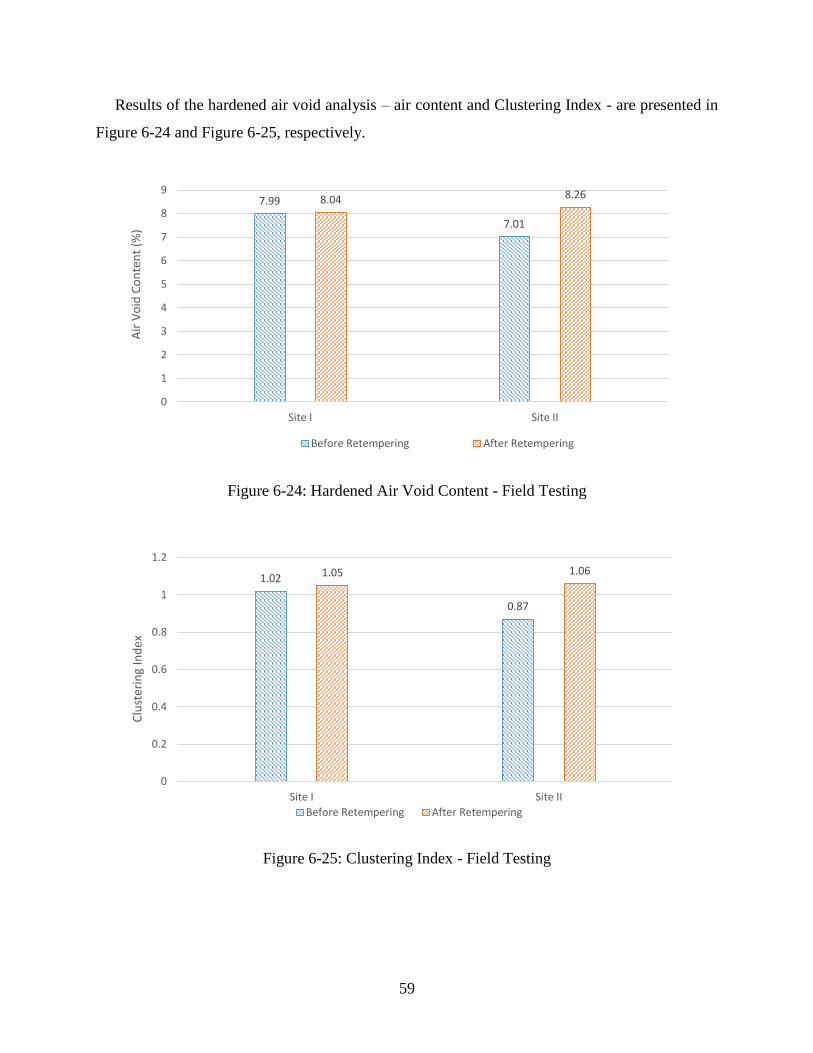
59
Results of the hardened air void analysis – air content and Clustering Index - are presented in
Figure 6-24 and Figure 6-25, respectively.
Figure 6-24: Hardened Air Void Content - Field Testing
Figure 6-25: Clustering Index - Field Testing
7.99
7.01
8.04 8.26
0
1
2
3
4
5
6
7
8
9
Site I Site II
Air
Vo
id C
on
ten
t (%
)
Before Retempering After Retempering
1.02
0.87
1.05 1.06
0
0.2
0.4
0.6
0.8
1
1.2
Site I Site II
Clu
ster
ing
Ind
ex
Before Retempering After Retempering
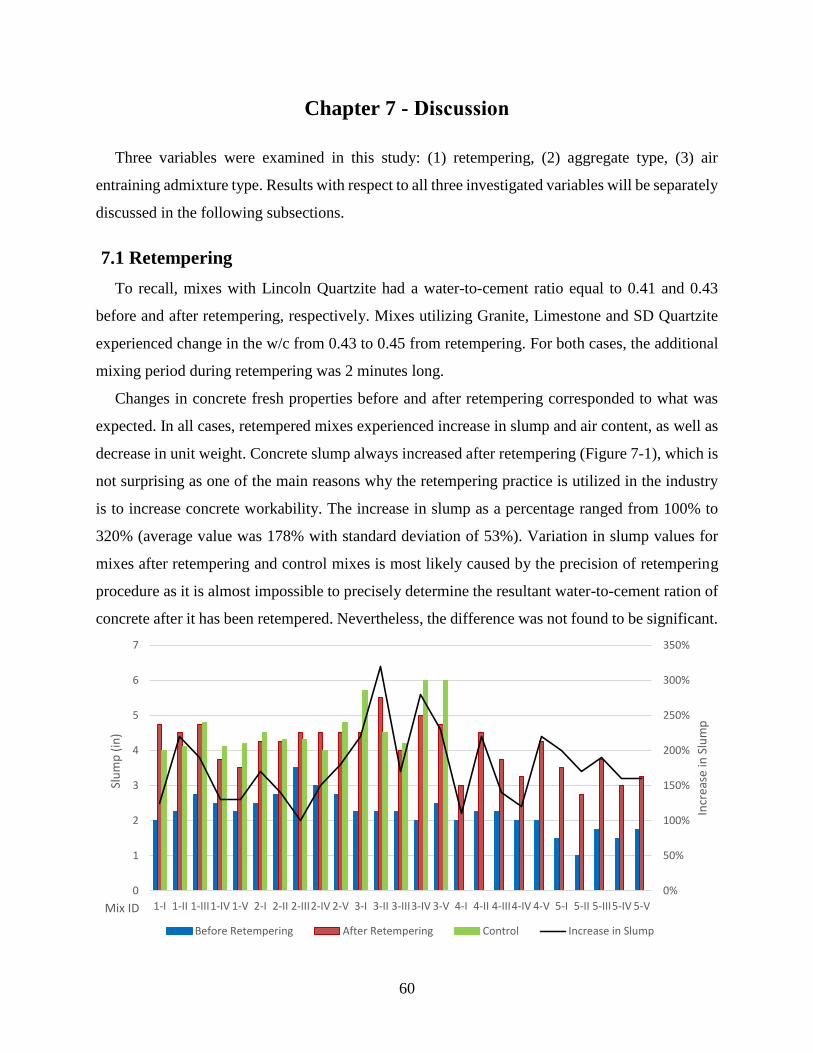
60
Chapter 7 - Discussion
Three variables were examined in this study: (1) retempering, (2) aggregate type, (3) air
entraining admixture type. Results with respect to all three investigated variables will be separately
discussed in the following subsections.
7.1 Retempering
To recall, mixes with Lincoln Quartzite had a water-to-cement ratio equal to 0.41 and 0.43
before and after retempering, respectively. Mixes utilizing Granite, Limestone and SD Quartzite
experienced change in the w/c from 0.43 to 0.45 from retempering. For both cases, the additional
mixing period during retempering was 2 minutes long.
Changes in concrete fresh properties before and after retempering corresponded to what was
expected. In all cases, retempered mixes experienced increase in slump and air content, as well as
decrease in unit weight. Concrete slump always increased after retempering (Figure 7-1), which is
not surprising as one of the main reasons why the retempering practice is utilized in the industry
is to increase concrete workability. The increase in slump as a percentage ranged from 100% to
320% (average value was 178% with standard deviation of 53%). Variation in slump values for
mixes after retempering and control mixes is most likely caused by the precision of retempering
procedure as it is almost impossible to precisely determine the resultant water-to-cement ration of
concrete after it has been retempered. Nevertheless, the difference was not found to be significant.
0%
50%
100%
150%
200%
250%
300%
350%
0
1
2
3
4
5
6
7
1-I 1-II 1-III1-IV 1-V 2-I 2-II 2-III2-IV 2-V 3-I 3-II 3-III3-IV 3-V 4-I 4-II 4-III4-IV 4-V 5-I 5-II 5-III5-IV 5-V
Incr
ease
in S
lum
p
Slu
mp
(in
)
Mix ID
Before Retempering After Retempering Control Increase in Slump
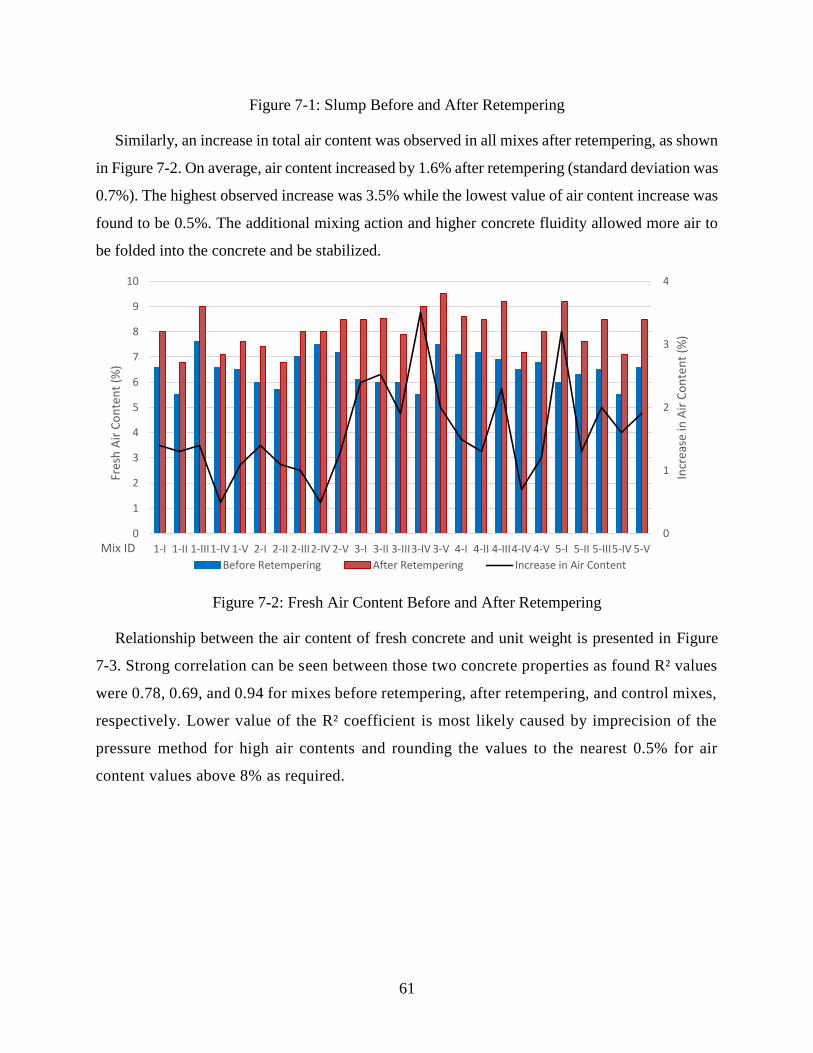
61
Figure 7-1: Slump Before and After Retempering
Similarly, an increase in total air content was observed in all mixes after retempering, as shown
in Figure 7-2. On average, air content increased by 1.6% after retempering (standard deviation was
0.7%). The highest observed increase was 3.5% while the lowest value of air content increase was
found to be 0.5%. The additional mixing action and higher concrete fluidity allowed more air to
be folded into the concrete and be stabilized.
Figure 7-2: Fresh Air Content Before and After Retempering
Relationship between the air content of fresh concrete and unit weight is presented in Figure
7-3. Strong correlation can be seen between those two concrete properties as found R² values
were 0.78, 0.69, and 0.94 for mixes before retempering, after retempering, and control mixes,
respectively. Lower value of the R² coefficient is most likely caused by imprecision of the
pressure method for high air contents and rounding the values to the nearest 0.5% for air
content values above 8% as required.
0
1
2
3
4
0
1
2
3
4
5
6
7
8
9
10
1-I 1-II 1-III1-IV 1-V 2-I 2-II 2-III2-IV 2-V 3-I 3-II 3-III3-IV 3-V 4-I 4-II 4-III4-IV 4-V 5-I 5-II 5-III5-IV 5-V
Incr
ease
in A
ir C
on
ten
t (%
)
Fres
h A
ir C
on
ten
t (%
)
Mix IDBefore Retempering After Retempering Increase in Air Content
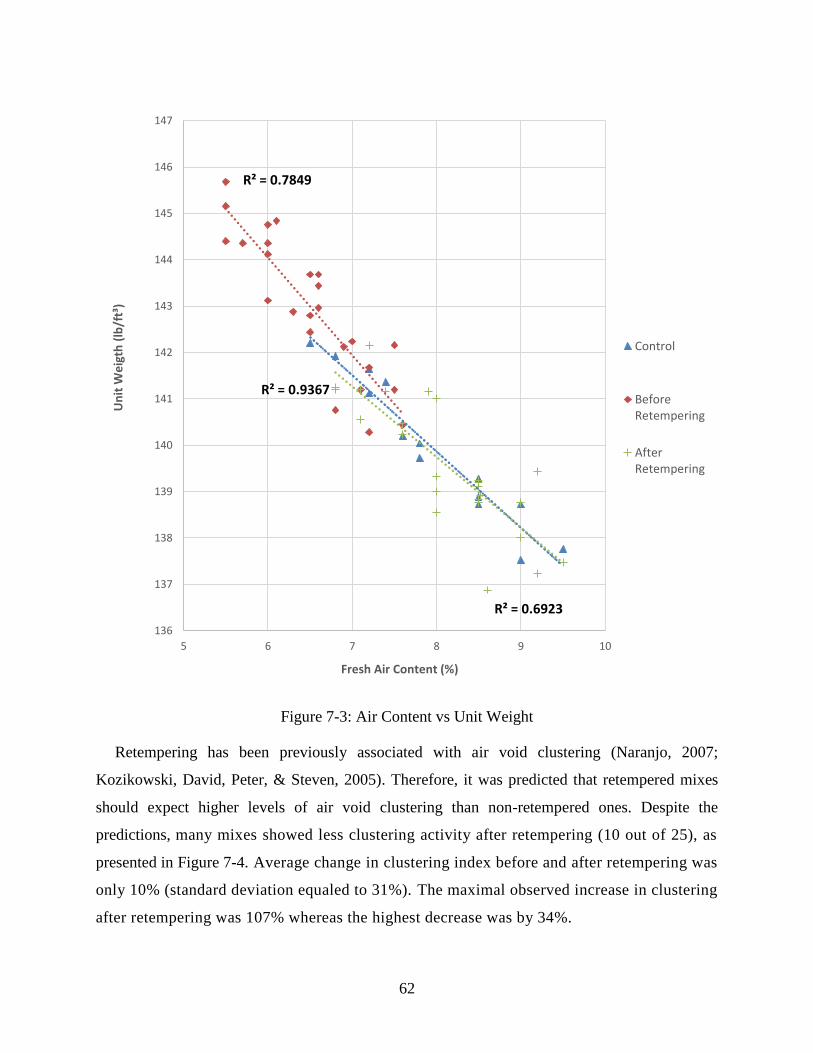
62
Figure 7-3: Air Content vs Unit Weight
Retempering has been previously associated with air void clustering (Naranjo, 2007;
Kozikowski, David, Peter, & Steven, 2005). Therefore, it was predicted that retempered mixes
should expect higher levels of air void clustering than non-retempered ones. Despite the
predictions, many mixes showed less clustering activity after retempering (10 out of 25), as
presented in Figure 7-4. Average change in clustering index before and after retempering was
only 10% (standard deviation equaled to 31%). The maximal observed increase in clustering
after retempering was 107% whereas the highest decrease was by 34%.
R² = 0.9367
R² = 0.7849
R² = 0.6923
136
137
138
139
140
141
142
143
144
145
146
147
5 6 7 8 9 10
Un
it W
eig
th (
lb/f
t³)
Fresh Air Content (%)
Control
BeforeRetempering
AfterRetempering
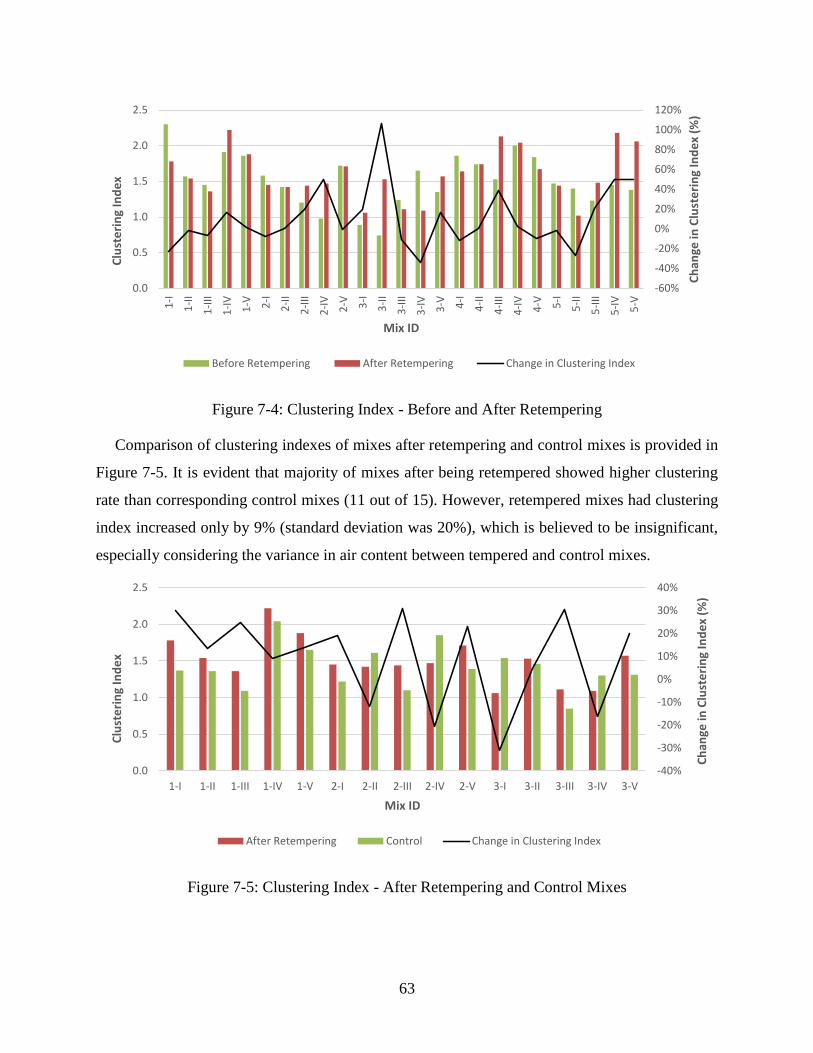
63
Figure 7-4: Clustering Index - Before and After Retempering
Comparison of clustering indexes of mixes after retempering and control mixes is provided in
Figure 7-5. It is evident that majority of mixes after being retempered showed higher clustering
rate than corresponding control mixes (11 out of 15). However, retempered mixes had clustering
index increased only by 9% (standard deviation was 20%), which is believed to be insignificant,
especially considering the variance in air content between tempered and control mixes.
Figure 7-5: Clustering Index - After Retempering and Control Mixes
-60%
-40%
-20%
0%
20%
40%
60%
80%
100%
120%
0.0
0.5
1.0
1.5
2.0
2.5
1-I
1-I
I
1-I
II
1-I
V
1-V 2-I
2-I
I
2-I
II
2-I
V
2-V 3-I
3-I
I
3-I
II
3-I
V
3-V 4-I
4-I
I
4-I
II
4-I
V
4-V 5-I
5-I
I
5-I
II
5-I
V
5-V
Ch
ange
in C
lust
eri
ng
Ind
ex
(%)
Clu
ste
rin
g In
de
x
Mix ID
Before Retempering After Retempering Change in Clustering Index
-40%
-30%
-20%
-10%
0%
10%
20%
30%
40%
0.0
0.5
1.0
1.5
2.0
2.5
1-I 1-II 1-III 1-IV 1-V 2-I 2-II 2-III 2-IV 2-V 3-I 3-II 3-III 3-IV 3-V
Ch
ange
in C
lust
eri
ng
Ind
ex
(%)
Clu
ste
rin
g In
de
x
Mix ID
After Retempering Control Change in Clustering Index
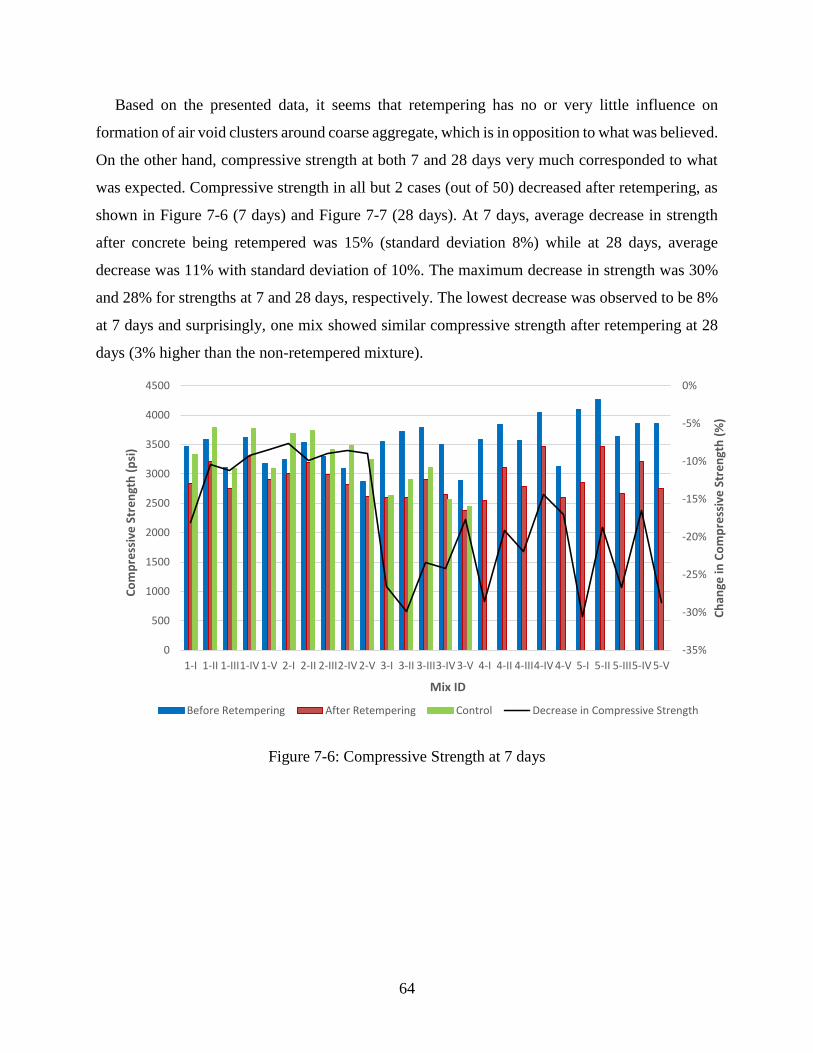
64
Based on the presented data, it seems that retempering has no or very little influence on
formation of air void clusters around coarse aggregate, which is in opposition to what was believed.
On the other hand, compressive strength at both 7 and 28 days very much corresponded to what
was expected. Compressive strength in all but 2 cases (out of 50) decreased after retempering, as
shown in Figure 7-6 (7 days) and Figure 7-7 (28 days). At 7 days, average decrease in strength
after concrete being retempered was 15% (standard deviation 8%) while at 28 days, average
decrease was 11% with standard deviation of 10%. The maximum decrease in strength was 30%
and 28% for strengths at 7 and 28 days, respectively. The lowest decrease was observed to be 8%
at 7 days and surprisingly, one mix showed similar compressive strength after retempering at 28
days (3% higher than the non-retempered mixture).
Figure 7-6: Compressive Strength at 7 days
-35%
-30%
-25%
-20%
-15%
-10%
-5%
0%
0
500
1000
1500
2000
2500
3000
3500
4000
4500
1-I 1-II 1-III1-IV 1-V 2-I 2-II 2-III2-IV 2-V 3-I 3-II 3-III3-IV 3-V 4-I 4-II 4-III4-IV 4-V 5-I 5-II 5-III5-IV 5-V
Ch
ange
in C
om
pre
ssiv
e S
tre
ngt
h (
%)
Co
mp
ress
ive
Str
en
gth
(p
si)
Mix ID
Before Retempering After Retempering Control Decrease in Compressive Strength
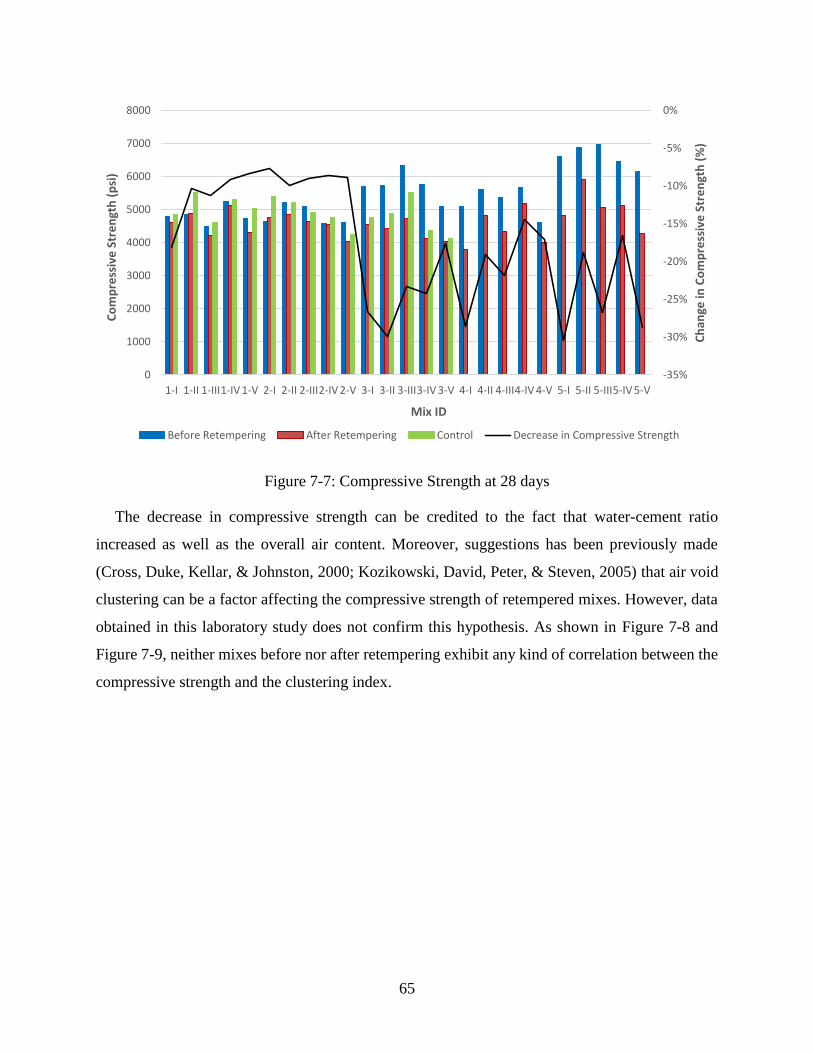
65
Figure 7-7: Compressive Strength at 28 days
The decrease in compressive strength can be credited to the fact that water-cement ratio
increased as well as the overall air content. Moreover, suggestions has been previously made
(Cross, Duke, Kellar, & Johnston, 2000; Kozikowski, David, Peter, & Steven, 2005) that air void
clustering can be a factor affecting the compressive strength of retempered mixes. However, data
obtained in this laboratory study does not confirm this hypothesis. As shown in Figure 7-8 and
Figure 7-9, neither mixes before nor after retempering exhibit any kind of correlation between the
compressive strength and the clustering index.
-35%
-30%
-25%
-20%
-15%
-10%
-5%
0%
0
1000
2000
3000
4000
5000
6000
7000
8000
1-I 1-II 1-III1-IV 1-V 2-I 2-II 2-III2-IV 2-V 3-I 3-II 3-III3-IV 3-V 4-I 4-II 4-III4-IV 4-V 5-I 5-II 5-III5-IV 5-V
Ch
ange
in C
om
pre
ssiv
e S
tre
ngt
h (
%)
Co
mp
ress
ive
Str
en
gth
(p
si)
Mix ID
Before Retempering After Retempering Control Decrease in Compressive Strength
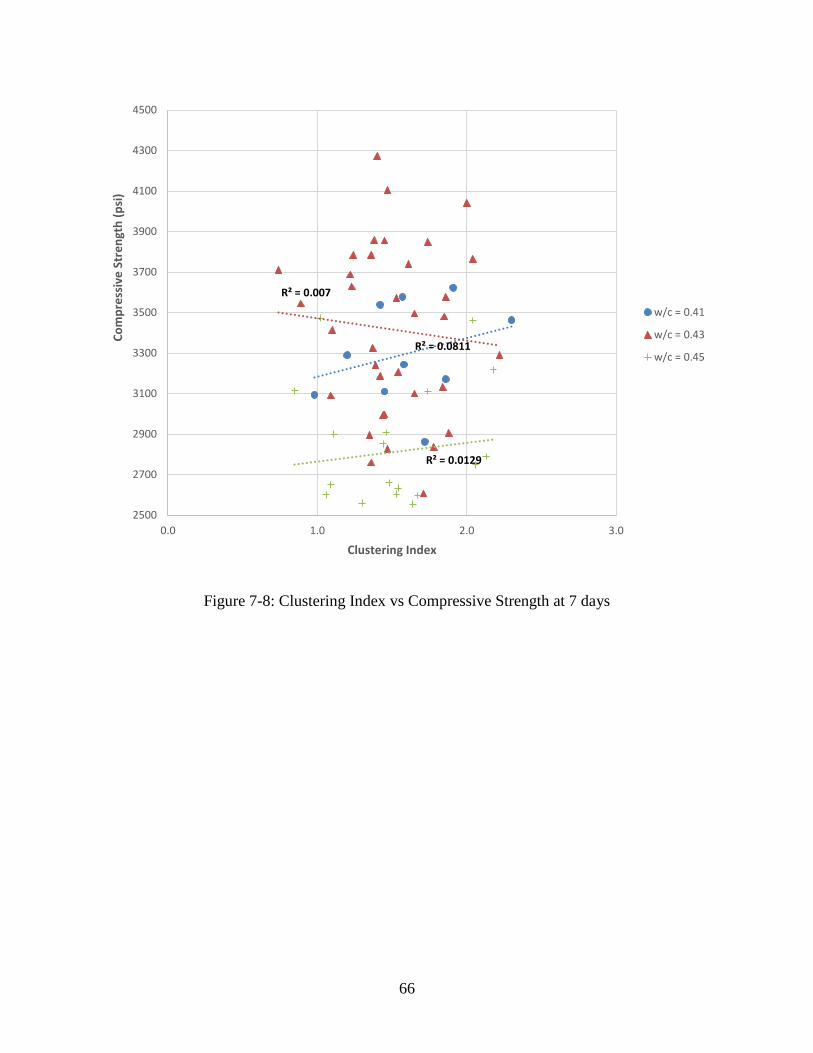
66
Figure 7-8: Clustering Index vs Compressive Strength at 7 days
R² = 0.0811
R² = 0.007
R² = 0.0129
2500
2700
2900
3100
3300
3500
3700
3900
4100
4300
4500
0.0 1.0 2.0 3.0
Co
mp
ress
ive
Str
en
gth
(p
si)
Clustering Index
w/c = 0.41
w/c = 0.43
w/c = 0.45
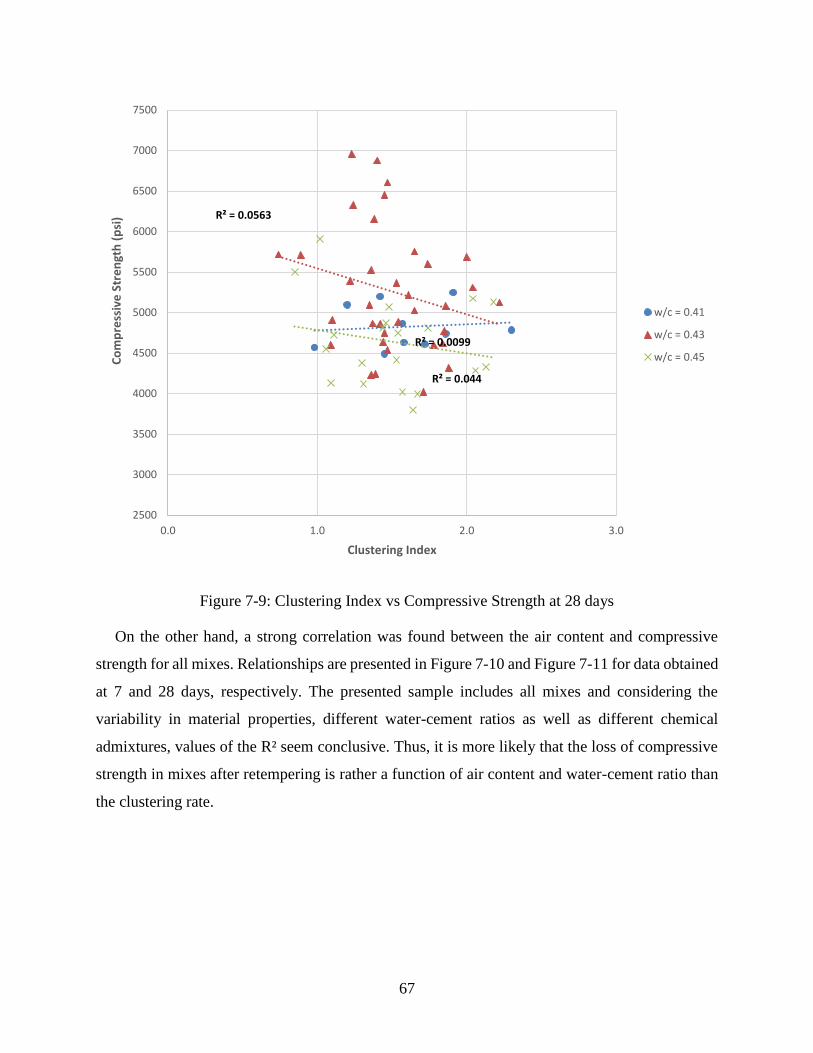
67
Figure 7-9: Clustering Index vs Compressive Strength at 28 days
On the other hand, a strong correlation was found between the air content and compressive
strength for all mixes. Relationships are presented in Figure 7-10 and Figure 7-11 for data obtained
at 7 and 28 days, respectively. The presented sample includes all mixes and considering the
variability in material properties, different water-cement ratios as well as different chemical
admixtures, values of the R² seem conclusive. Thus, it is more likely that the loss of compressive
strength in mixes after retempering is rather a function of air content and water-cement ratio than
the clustering rate.
R² = 0.0099
R² = 0.0563
R² = 0.044
2500
3000
3500
4000
4500
5000
5500
6000
6500
7000
7500
0.0 1.0 2.0 3.0
Co
mp
ress
ive
Str
en
gth
(p
si)
Clustering Index
w/c = 0.41
w/c = 0.43
w/c = 0.45
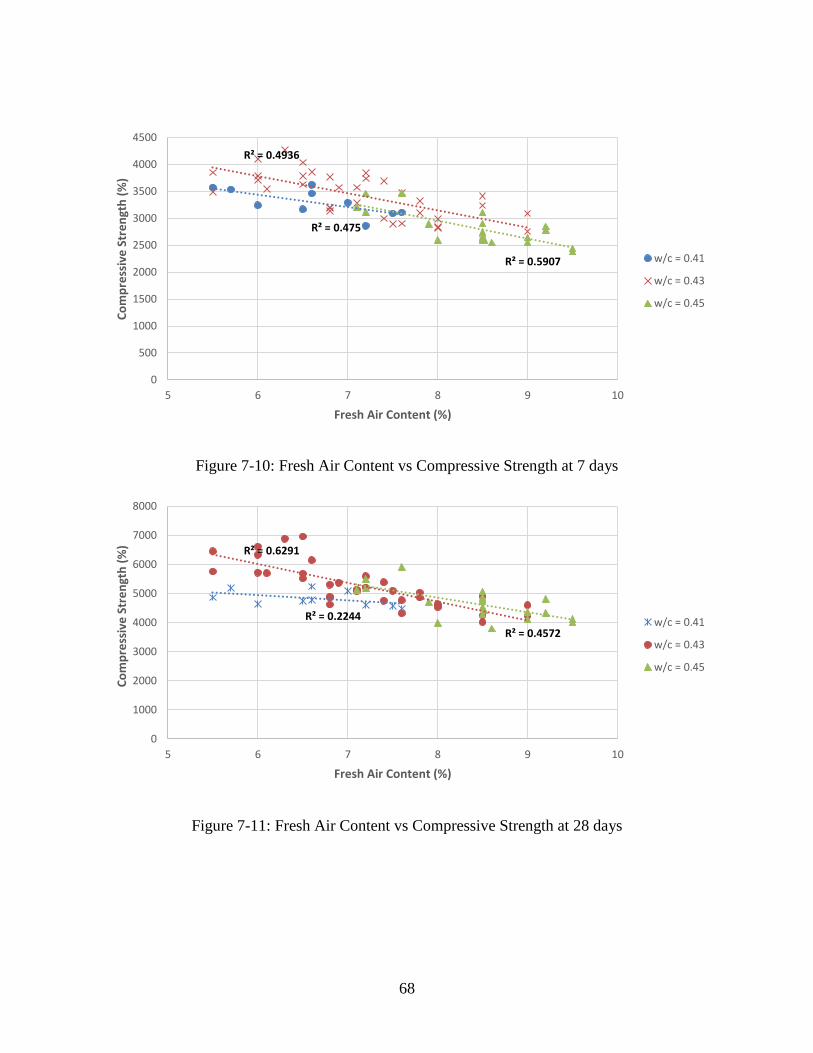
68
Figure 7-10: Fresh Air Content vs Compressive Strength at 7 days
Figure 7-11: Fresh Air Content vs Compressive Strength at 28 days
R² = 0.475
R² = 0.4936
R² = 0.5907
0
500
1000
1500
2000
2500
3000
3500
4000
4500
5 6 7 8 9 10
Co
mp
ress
ive
Str
en
gth
(%
)
Fresh Air Content (%)
w/c = 0.41
w/c = 0.43
w/c = 0.45
R² = 0.2244
R² = 0.6291
R² = 0.4572
0
1000
2000
3000
4000
5000
6000
7000
8000
5 6 7 8 9 10
Co
mp
ress
ive
Str
en
gth
(%
)
Fresh Air Content (%)
w/c = 0.41
w/c = 0.43
w/c = 0.45
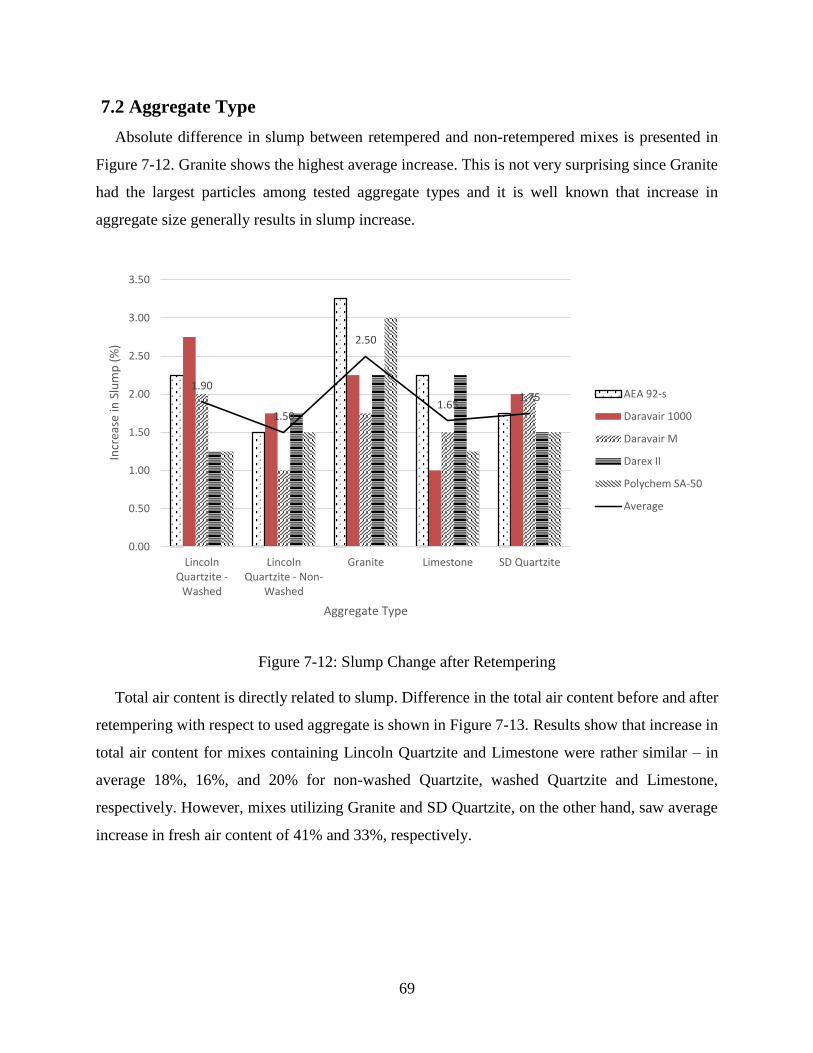
69
7.2 Aggregate Type
Absolute difference in slump between retempered and non-retempered mixes is presented in
Figure 7-12. Granite shows the highest average increase. This is not very surprising since Granite
had the largest particles among tested aggregate types and it is well known that increase in
aggregate size generally results in slump increase.
Figure 7-12: Slump Change after Retempering
Total air content is directly related to slump. Difference in the total air content before and after
retempering with respect to used aggregate is shown in Figure 7-13. Results show that increase in
total air content for mixes containing Lincoln Quartzite and Limestone were rather similar – in
average 18%, 16%, and 20% for non-washed Quartzite, washed Quartzite and Limestone,
respectively. However, mixes utilizing Granite and SD Quartzite, on the other hand, saw average
increase in fresh air content of 41% and 33%, respectively.
1.90
1.50
2.50
1.651.75
0.00
0.50
1.00
1.50
2.00
2.50
3.00
3.50
LincolnQuartzite -
Washed
LincolnQuartzite - Non-
Washed
Granite Limestone SD Quartzite
Incr
ease
in S
lum
p (
%)
Aggregate Type
AEA 92-s
Daravair 1000
Daravair M
Darex II
Polychem SA-50
Average
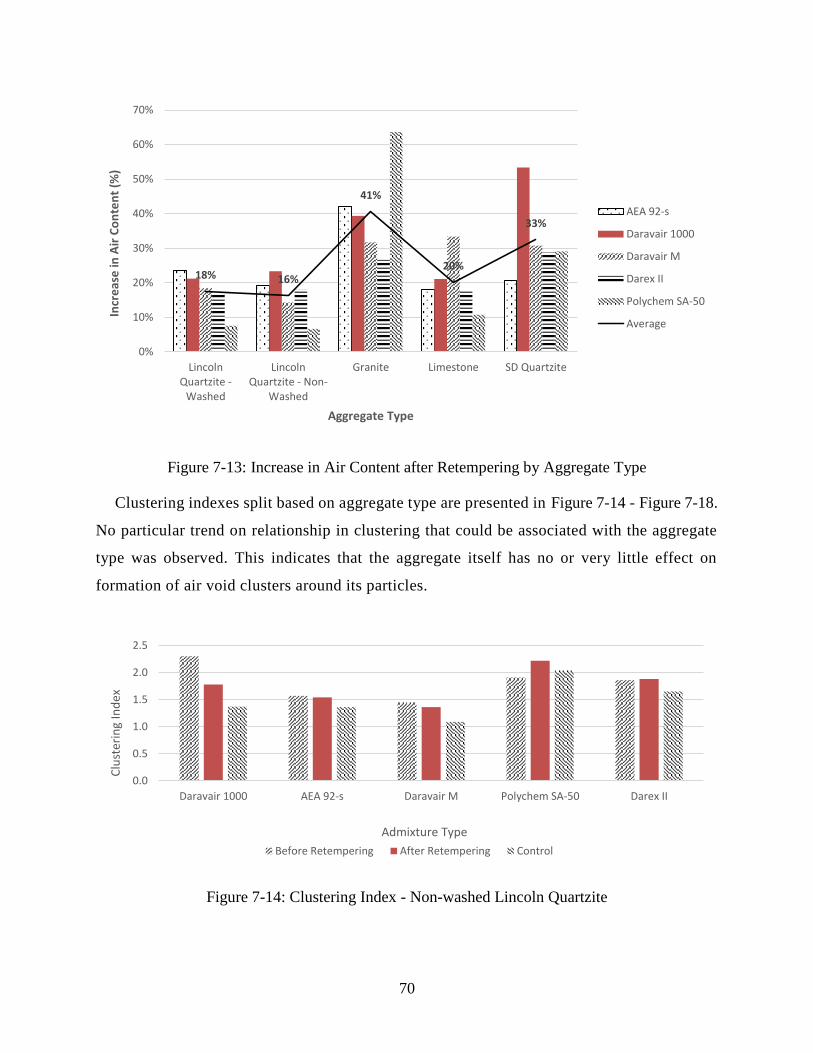
70
Figure 7-13: Increase in Air Content after Retempering by Aggregate Type
Clustering indexes split based on aggregate type are presented in Figure 7-14 - Figure 7-18.
No particular trend on relationship in clustering that could be associated with the aggregate
type was observed. This indicates that the aggregate itself has no or very little effect on
formation of air void clusters around its particles.
Figure 7-14: Clustering Index - Non-washed Lincoln Quartzite
18% 16%
41%
20%
33%
0%
10%
20%
30%
40%
50%
60%
70%
LincolnQuartzite -
Washed
LincolnQuartzite - Non-
Washed
Granite Limestone SD Quartzite
Incr
eas
e in
Air
Co
nte
nt
(%)
Aggregate Type
AEA 92-s
Daravair 1000
Daravair M
Darex II
Polychem SA-50
Average
0.0
0.5
1.0
1.5
2.0
2.5
Daravair 1000 AEA 92-s Daravair M Polychem SA-50 Darex II
Clu
ster
ing
Ind
ex
Admixture Type
Before Retempering After Retempering Control
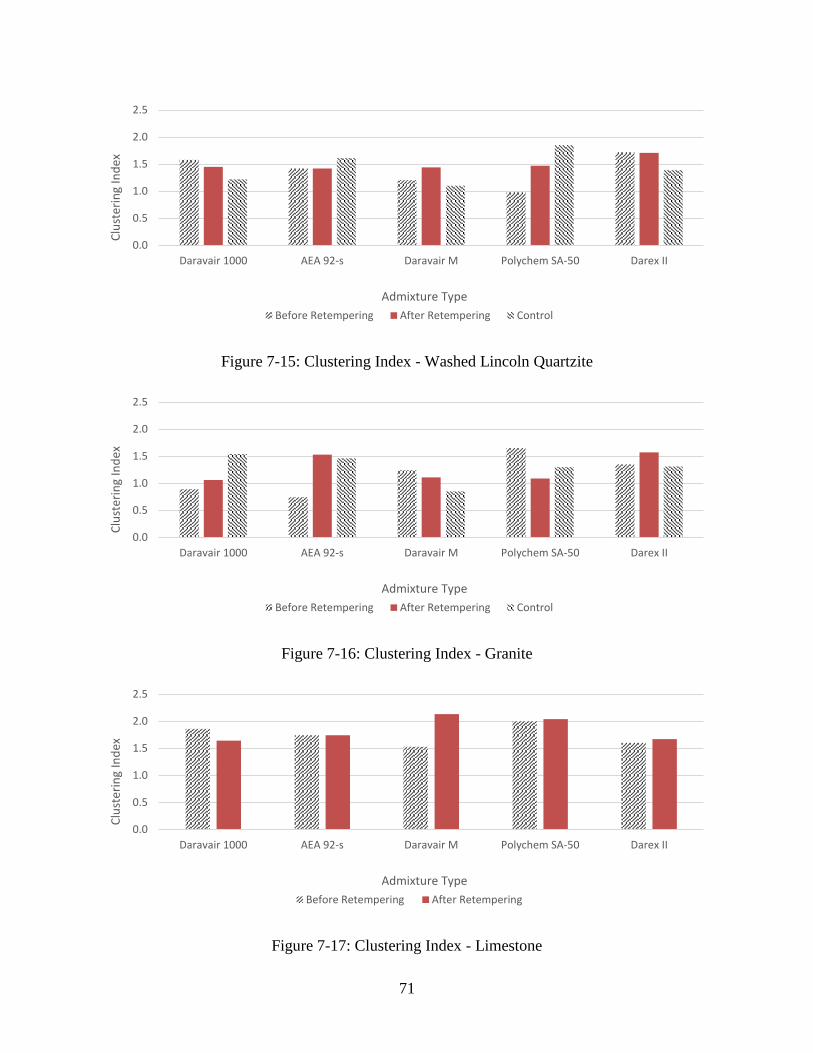
71
Figure 7-15: Clustering Index - Washed Lincoln Quartzite
Figure 7-16: Clustering Index - Granite
Figure 7-17: Clustering Index - Limestone
0.0
0.5
1.0
1.5
2.0
2.5
Daravair 1000 AEA 92-s Daravair M Polychem SA-50 Darex II
Clu
ster
ing
Ind
ex
Admixture Type
Before Retempering After Retempering Control
0.0
0.5
1.0
1.5
2.0
2.5
Daravair 1000 AEA 92-s Daravair M Polychem SA-50 Darex II
Clu
ster
ing
Ind
ex
Admixture Type
Before Retempering After Retempering Control
0.0
0.5
1.0
1.5
2.0
2.5
Daravair 1000 AEA 92-s Daravair M Polychem SA-50 Darex II
Clu
ster
ing
Ind
ex
Admixture Type
Before Retempering After Retempering
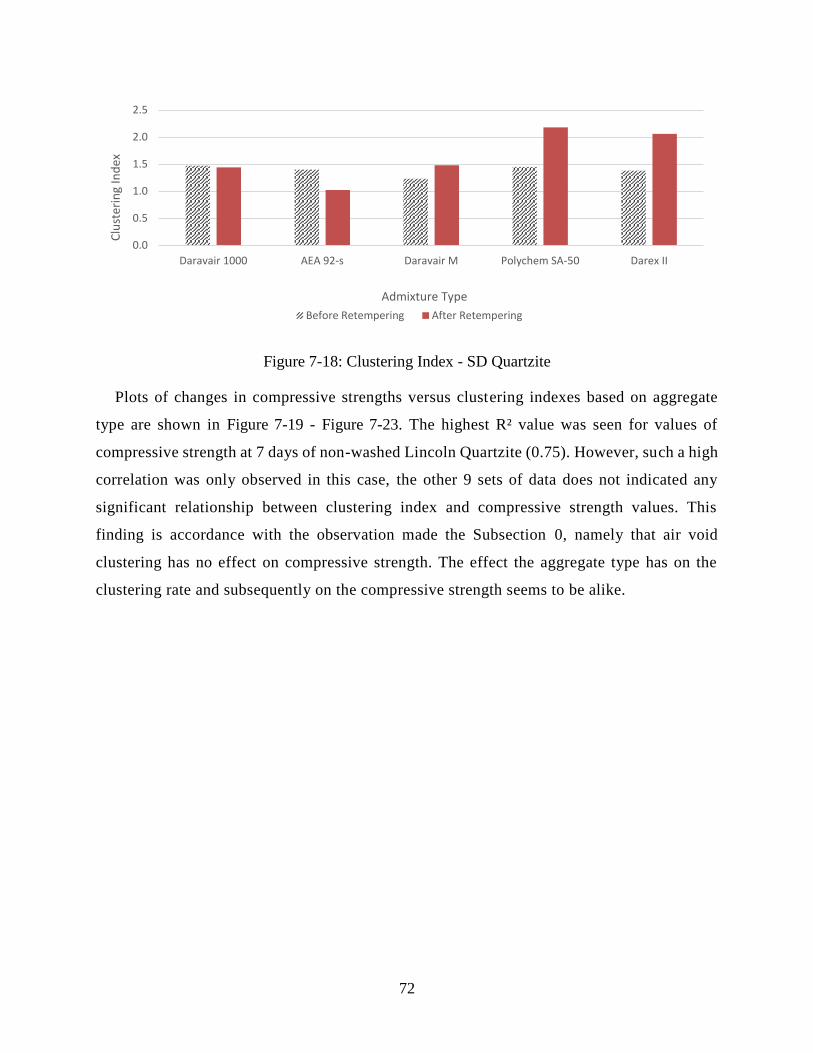
72
Figure 7-18: Clustering Index - SD Quartzite
Plots of changes in compressive strengths versus clustering indexes based on aggregate
type are shown in Figure 7-19 - Figure 7-23. The highest R² value was seen for values of
compressive strength at 7 days of non-washed Lincoln Quartzite (0.75). However, such a high
correlation was only observed in this case, the other 9 sets of data does not indicated any
significant relationship between clustering index and compressive strength values. This
finding is accordance with the observation made the Subsection 0, namely that air void
clustering has no effect on compressive strength. The effect the aggregate type has on the
clustering rate and subsequently on the compressive strength seems to be alike.
0.0
0.5
1.0
1.5
2.0
2.5
Daravair 1000 AEA 92-s Daravair M Polychem SA-50 Darex II
Clu
ster
ing
Ind
ex
Admixture Type
Before Retempering After Retempering
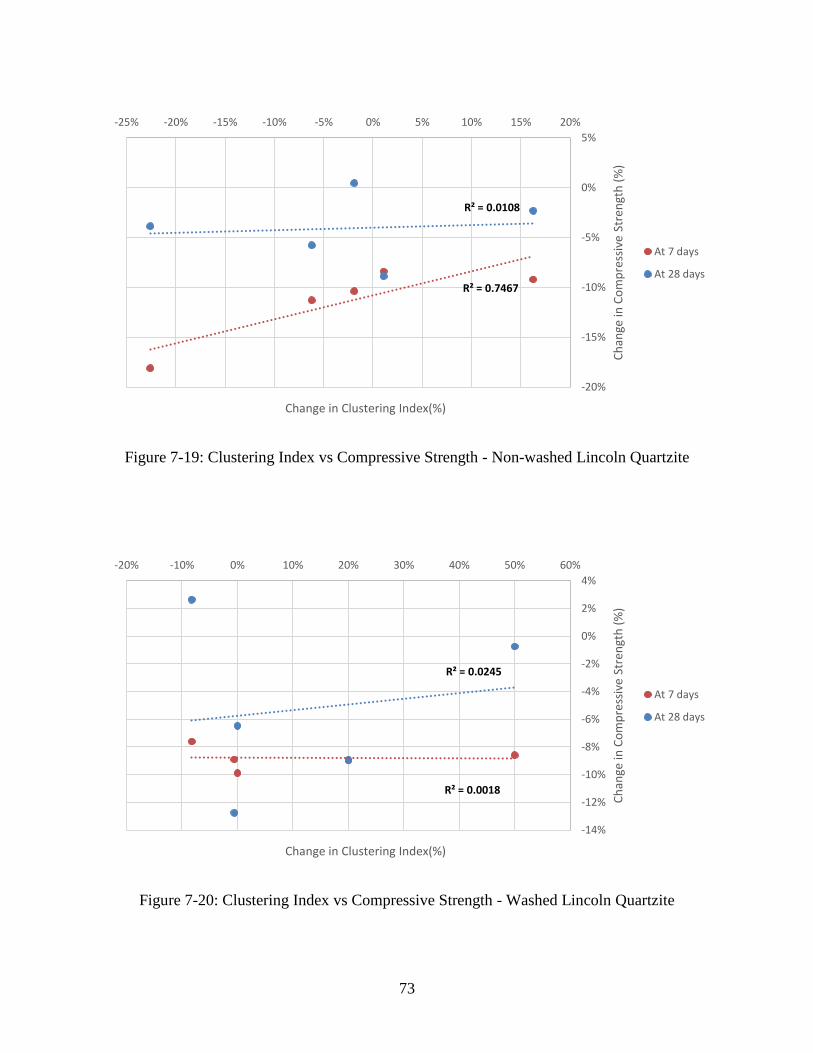
73
Figure 7-19: Clustering Index vs Compressive Strength - Non-washed Lincoln Quartzite
Figure 7-20: Clustering Index vs Compressive Strength - Washed Lincoln Quartzite
R² = 0.7467
R² = 0.0108
-20%
-15%
-10%
-5%
0%
5%
-25% -20% -15% -10% -5% 0% 5% 10% 15% 20%
Ch
ange
in C
om
pre
ssiv
e St
ren
gth
(%
)
Change in Clustering Index(%)
At 7 days
At 28 days
R² = 0.0018
R² = 0.0245
-14%
-12%
-10%
-8%
-6%
-4%
-2%
0%
2%
4%
-20% -10% 0% 10% 20% 30% 40% 50% 60%
Ch
ange
in C
om
pre
ssiv
e St
ren
gth
(%
)
Change in Clustering Index(%)
At 7 days
At 28 days
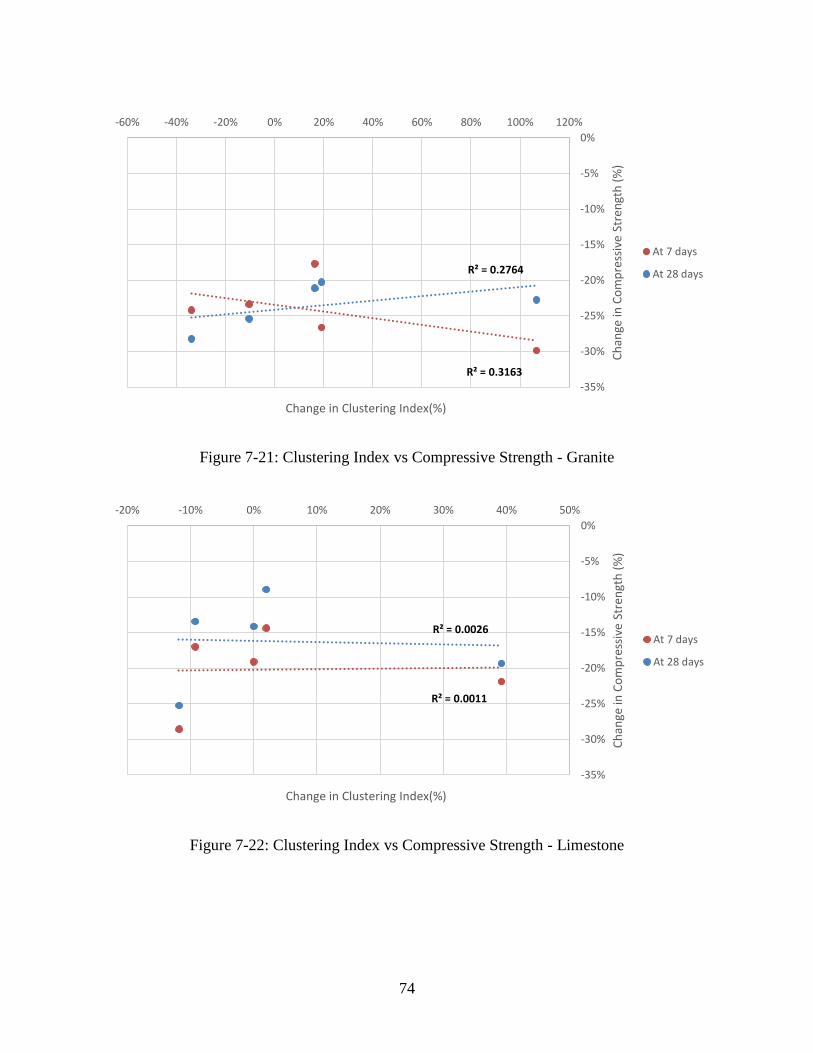
74
Figure 7-21: Clustering Index vs Compressive Strength - Granite
Figure 7-22: Clustering Index vs Compressive Strength - Limestone
R² = 0.3163
R² = 0.2764
-35%
-30%
-25%
-20%
-15%
-10%
-5%
0%
-60% -40% -20% 0% 20% 40% 60% 80% 100% 120%
Ch
ange
in C
om
pre
ssiv
e St
ren
gth
(%
)
Change in Clustering Index(%)
At 7 days
At 28 days
R² = 0.0011
R² = 0.0026
-35%
-30%
-25%
-20%
-15%
-10%
-5%
0%
-20% -10% 0% 10% 20% 30% 40% 50%
Ch
ange
in C
om
pre
ssiv
e St
ren
gth
(%
)
Change in Clustering Index(%)
At 7 days
At 28 days

75
Figure 7-23: Clustering Index vs Compressive Strength - SD Quartzite
Concern with a performance of dirty Lincoln Quartzite was expressed by KDOT in the past and
was one of the reasons why this study was conducted. Particularly, compressive strength samples
from a pavement project in Kansas, which utilized non-washed Lincoln Quartzite, failed to meet
the compressive strength requirements prescribed by KDOT. Several interesting observation
regarding the behavior of washed and non-washed aggregate were made:
A lower dosage of air entraining admixture in mixes with washed aggregate was typically
required to achieve the same air content as for the mixtures containing dirty rock, as shown in
Figure 7-25. This was much expected as the dirty aggregate contains more fine particles and clay
than washed rock, thus its specific surface is higher and potential for absorption by clay particles
requires a higher dosage of AEA to achieve the same total air content.
R² = 0.0005
R² = 0.299
-35%
-30%
-25%
-20%
-15%
-10%
-5%
0%
-40% -30% -20% -10% 0% 10% 20% 30% 40% 50% 60%
Ch
ange
in C
om
pre
ssiv
e St
ren
gth
(%
)
Change in Clustering Index(%)
At 7 days
At 28 days
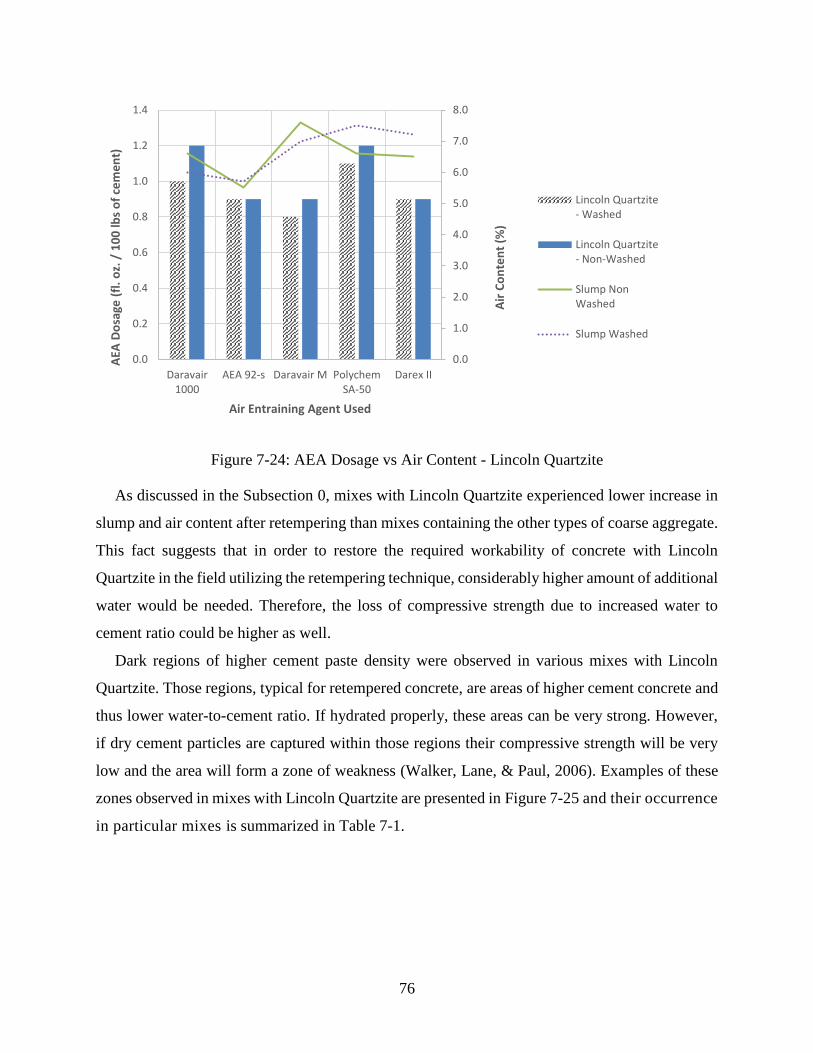
76
Figure 7-24: AEA Dosage vs Air Content - Lincoln Quartzite
As discussed in the Subsection 0, mixes with Lincoln Quartzite experienced lower increase in
slump and air content after retempering than mixes containing the other types of coarse aggregate.
This fact suggests that in order to restore the required workability of concrete with Lincoln
Quartzite in the field utilizing the retempering technique, considerably higher amount of additional
water would be needed. Therefore, the loss of compressive strength due to increased water to
cement ratio could be higher as well.
Dark regions of higher cement paste density were observed in various mixes with Lincoln
Quartzite. Those regions, typical for retempered concrete, are areas of higher cement concrete and
thus lower water-to-cement ratio. If hydrated properly, these areas can be very strong. However,
if dry cement particles are captured within those regions their compressive strength will be very
low and the area will form a zone of weakness (Walker, Lane, & Paul, 2006). Examples of these
zones observed in mixes with Lincoln Quartzite are presented in Figure 7-25 and their occurrence
in particular mixes is summarized in Table 7-1.
0.0
1.0
2.0
3.0
4.0
5.0
6.0
7.0
8.0
0.0
0.2
0.4
0.6
0.8
1.0
1.2
1.4
Daravair1000
AEA 92-s Daravair M PolychemSA-50
Darex II
Air
Co
nte
nt
(%)
AEA
Do
sage
(fl
. o
z. /
10
0 lb
s o
f ce
me
nt)
Air Entraining Agent Used
Lincoln Quartzite- Washed
Lincoln Quartzite- Non-Washed
Slump NonWashed
Slump Washed
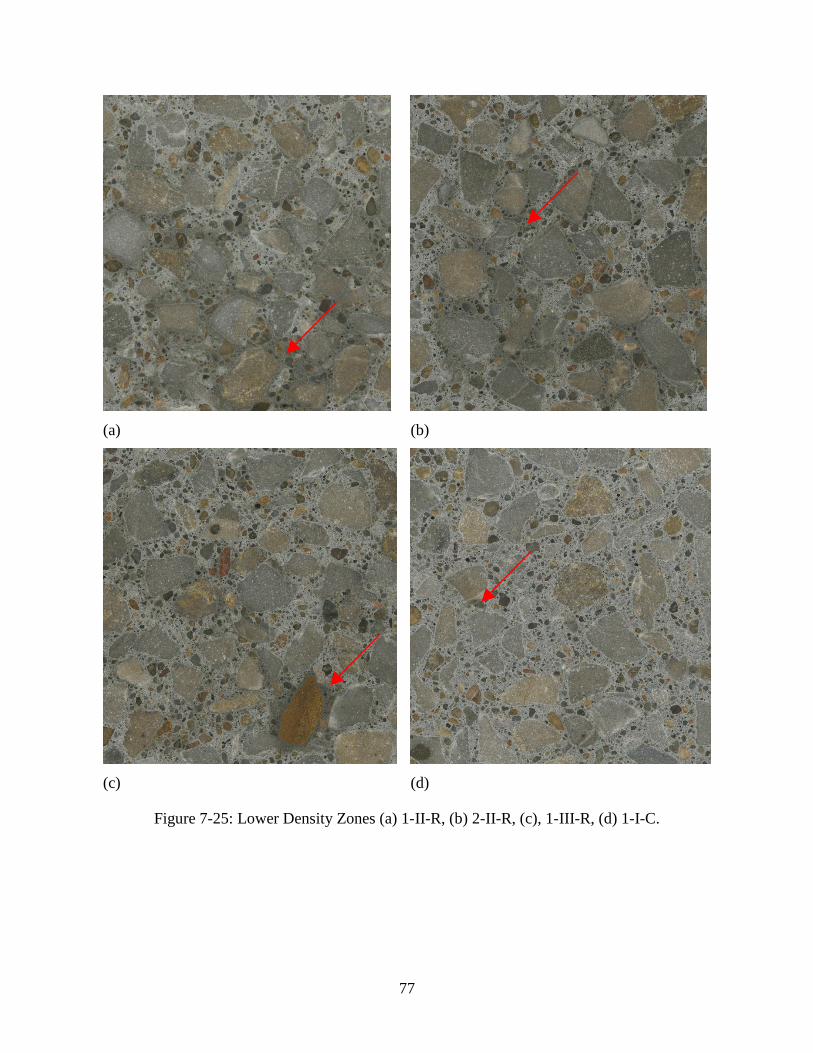
77
(a)
(b)
(c)
(d)
Figure 7-25: Lower Density Zones (a) 1-II-R, (b) 2-II-R, (c), 1-III-R, (d) 1-I-C.
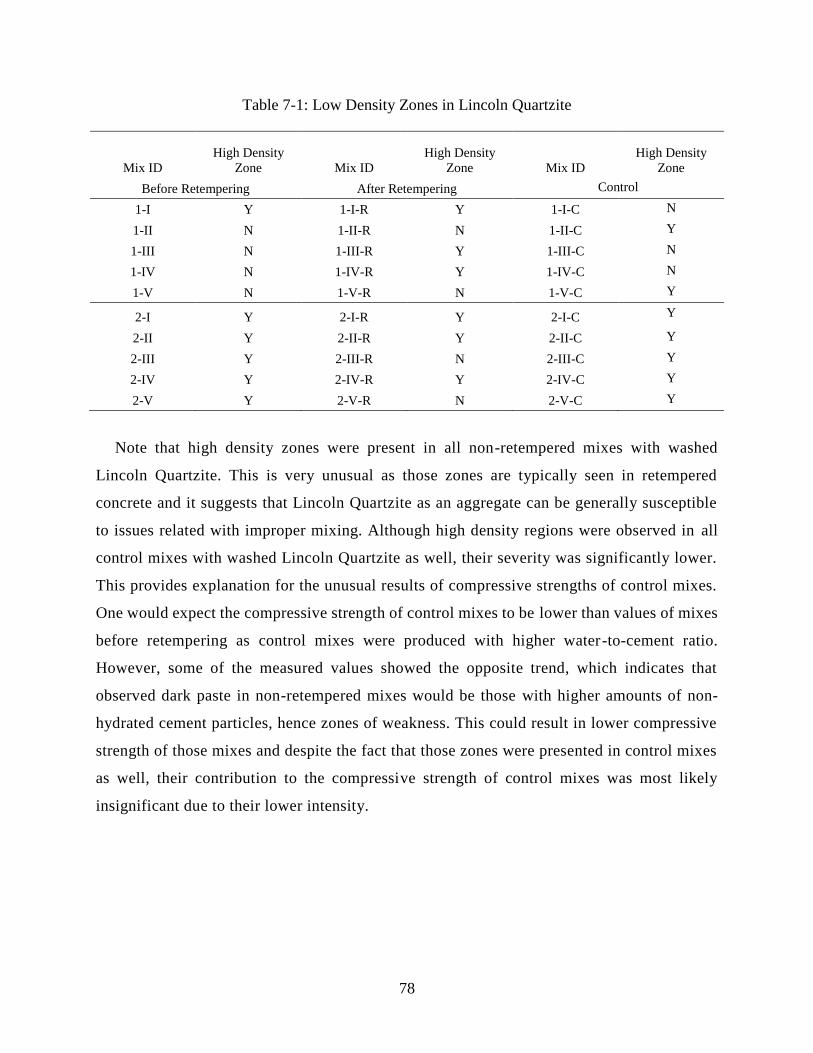
78
Table 7-1: Low Density Zones in Lincoln Quartzite
Mix ID
High Density
Zone Mix ID
High Density
Zone Mix ID
High Density
Zone
Before Retempering After Retempering Control
1-I Y 1-I-R Y 1-I-C N
1-II N 1-II-R N 1-II-C Y
1-III N 1-III-R Y 1-III-C N
1-IV N 1-IV-R Y 1-IV-C N
1-V N 1-V-R N 1-V-C Y
2-I Y 2-I-R Y 2-I-C Y
2-II Y 2-II-R Y 2-II-C Y
2-III Y 2-III-R N 2-III-C Y
2-IV Y 2-IV-R Y 2-IV-C Y
2-V Y 2-V-R N 2-V-C Y
Note that high density zones were present in all non-retempered mixes with washed
Lincoln Quartzite. This is very unusual as those zones are typically seen in retempered
concrete and it suggests that Lincoln Quartzite as an aggregate can be generally susceptible
to issues related with improper mixing. Although high density regions were observed in all
control mixes with washed Lincoln Quartzite as well, their severity was significantly lower.
This provides explanation for the unusual results of compressive strengths of control mixes.
One would expect the compressive strength of control mixes to be lower than values of mixes
before retempering as control mixes were produced with higher water-to-cement ratio.
However, some of the measured values showed the opposite trend, which indicates that
observed dark paste in non-retempered mixes would be those with higher amounts of non-
hydrated cement particles, hence zones of weakness. This could result in lower compressive
strength of those mixes and despite the fact that those zones were presented in control mixes
as well, their contribution to the compressive strength of control mixes was most likely
insignificant due to their lower intensity.
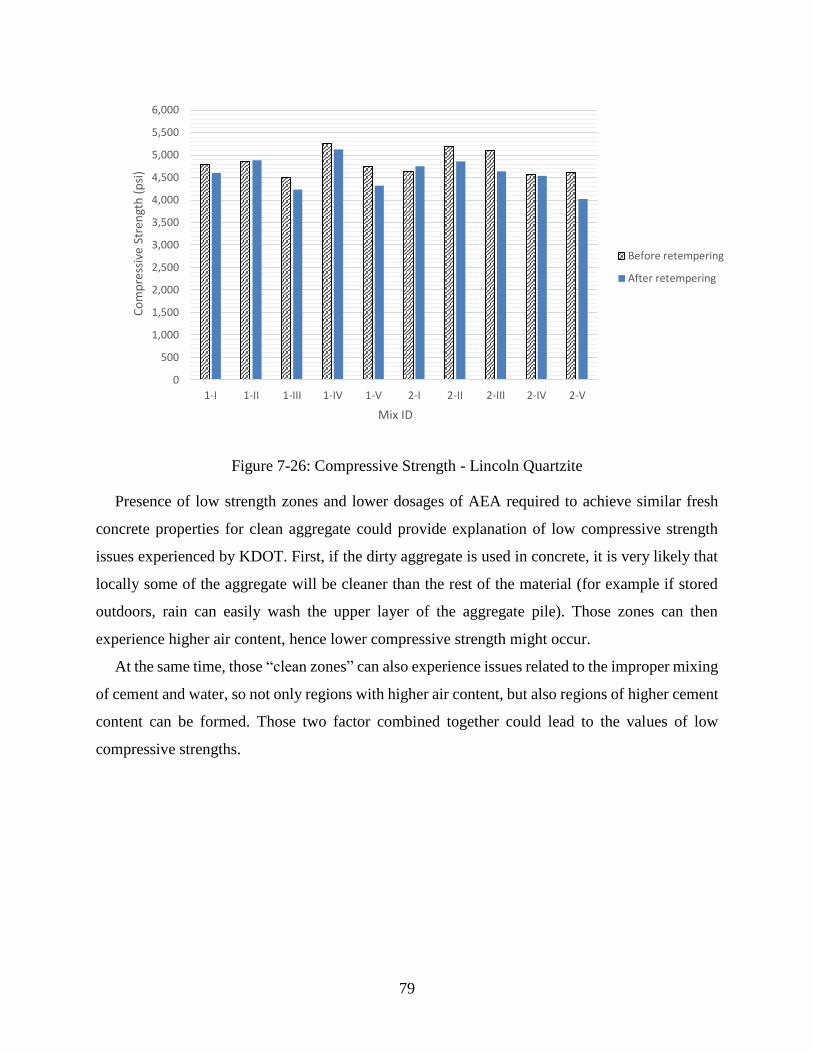
79
Figure 7-26: Compressive Strength - Lincoln Quartzite
Presence of low strength zones and lower dosages of AEA required to achieve similar fresh
concrete properties for clean aggregate could provide explanation of low compressive strength
issues experienced by KDOT. First, if the dirty aggregate is used in concrete, it is very likely that
locally some of the aggregate will be cleaner than the rest of the material (for example if stored
outdoors, rain can easily wash the upper layer of the aggregate pile). Those zones can then
experience higher air content, hence lower compressive strength might occur.
At the same time, those “clean zones” can also experience issues related to the improper mixing
of cement and water, so not only regions with higher air content, but also regions of higher cement
content can be formed. Those two factor combined together could lead to the values of low
compressive strengths.
0
500
1,000
1,500
2,000
2,500
3,000
3,500
4,000
4,500
5,000
5,500
6,000
1-I 1-II 1-III 1-IV 1-V 2-I 2-II 2-III 2-IV 2-V
Co
mp
ress
ive
Stre
ngt
h (
psi
)
Mix ID
Before retempering
After retempering
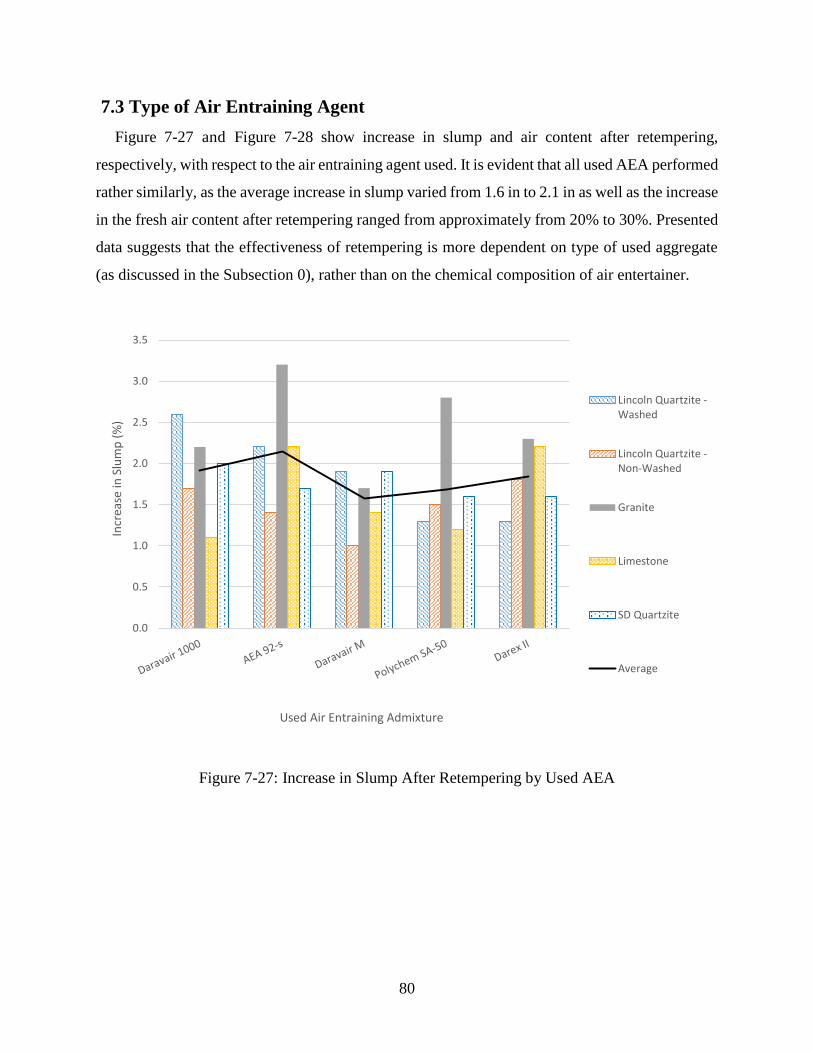
80
7.3 Type of Air Entraining Agent
Figure 7-27 and Figure 7-28 show increase in slump and air content after retempering,
respectively, with respect to the air entraining agent used. It is evident that all used AEA performed
rather similarly, as the average increase in slump varied from 1.6 in to 2.1 in as well as the increase
in the fresh air content after retempering ranged from approximately from 20% to 30%. Presented
data suggests that the effectiveness of retempering is more dependent on type of used aggregate
(as discussed in the Subsection 0), rather than on the chemical composition of air entertainer.
Figure 7-27: Increase in Slump After Retempering by Used AEA
0.0
0.5
1.0
1.5
2.0
2.5
3.0
3.5
Incr
ease
in S
lum
p (
%)
Used Air Entraining Admixture
Lincoln Quartzite -Washed
Lincoln Quartzite -Non-Washed
Granite
Limestone
SD Quartzite
Average
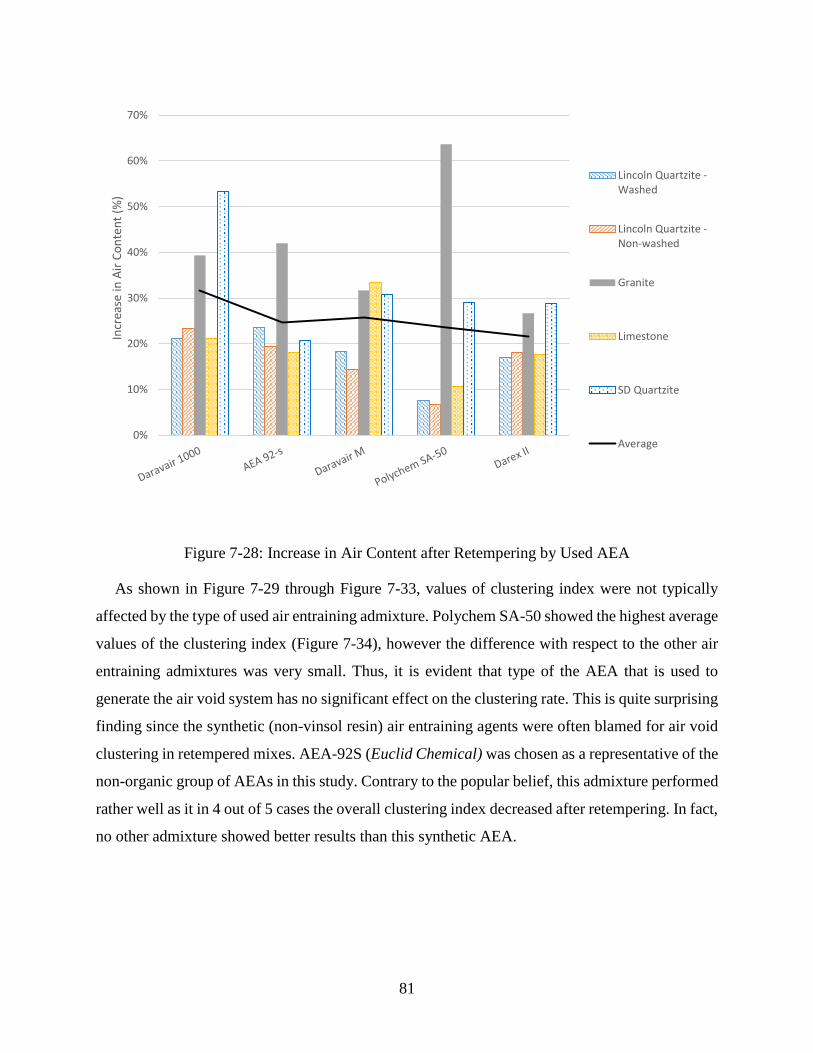
81
Figure 7-28: Increase in Air Content after Retempering by Used AEA
As shown in Figure 7-29 through Figure 7-33, values of clustering index were not typically
affected by the type of used air entraining admixture. Polychem SA-50 showed the highest average
values of the clustering index (Figure 7-34), however the difference with respect to the other air
entraining admixtures was very small. Thus, it is evident that type of the AEA that is used to
generate the air void system has no significant effect on the clustering rate. This is quite surprising
finding since the synthetic (non-vinsol resin) air entraining agents were often blamed for air void
clustering in retempered mixes. AEA-92S (Euclid Chemical) was chosen as a representative of the
non-organic group of AEAs in this study. Contrary to the popular belief, this admixture performed
rather well as it in 4 out of 5 cases the overall clustering index decreased after retempering. In fact,
no other admixture showed better results than this synthetic AEA.
0%
10%
20%
30%
40%
50%
60%
70%In
crea
se in
Air
Co
nte
nt
(%)
Lincoln Quartzite -Washed
Lincoln Quartzite -Non-washed
Granite
Limestone
SD Quartzite
Average
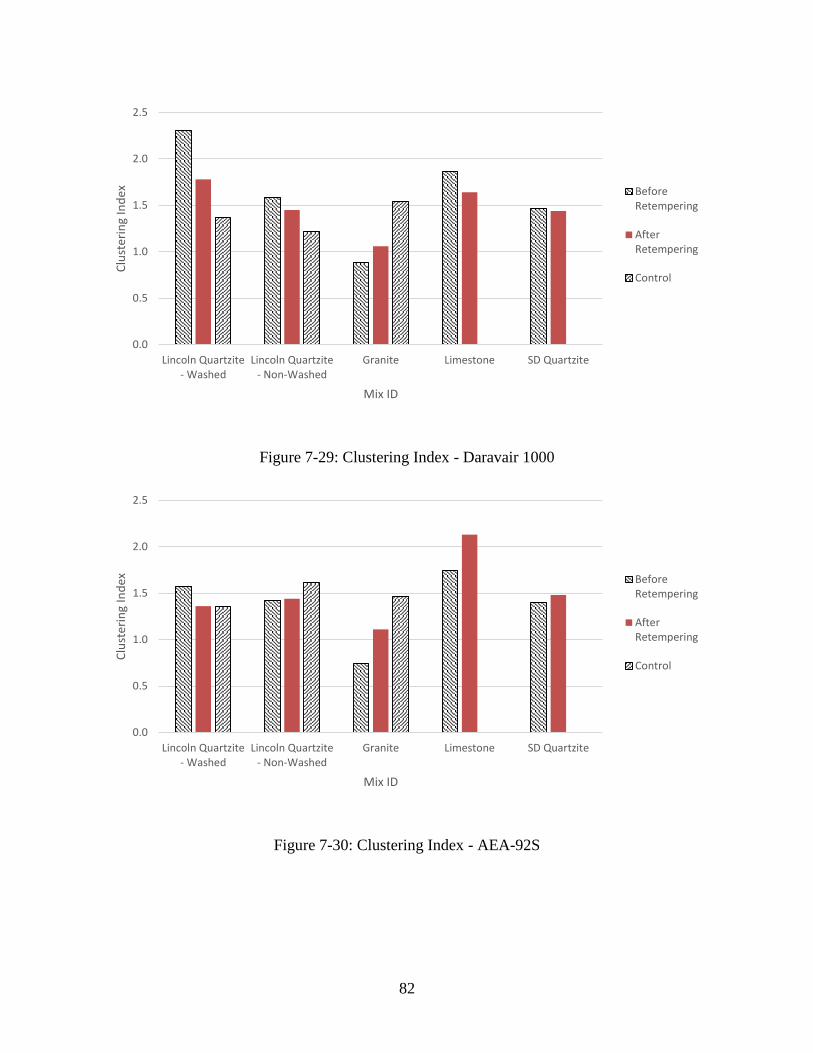
82
Figure 7-29: Clustering Index - Daravair 1000
Figure 7-30: Clustering Index - AEA-92S
0.0
0.5
1.0
1.5
2.0
2.5
Lincoln Quartzite- Washed
Lincoln Quartzite- Non-Washed
Granite Limestone SD Quartzite
Clu
ster
ing
Ind
ex
Mix ID
BeforeRetempering
AfterRetempering
Control
0.0
0.5
1.0
1.5
2.0
2.5
Lincoln Quartzite- Washed
Lincoln Quartzite- Non-Washed
Granite Limestone SD Quartzite
Clu
ster
ing
Ind
ex
Mix ID
BeforeRetempering
AfterRetempering
Control
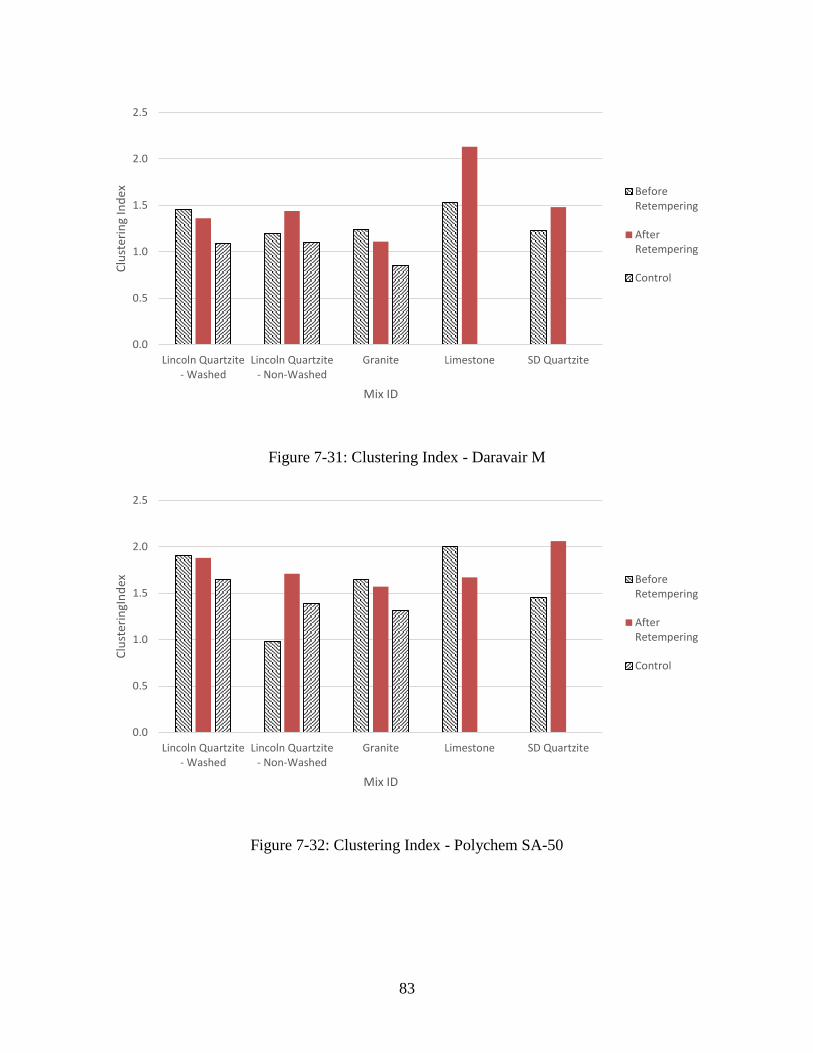
83
Figure 7-31: Clustering Index - Daravair M
Figure 7-32: Clustering Index - Polychem SA-50
0.0
0.5
1.0
1.5
2.0
2.5
Lincoln Quartzite- Washed
Lincoln Quartzite- Non-Washed
Granite Limestone SD Quartzite
Clu
ster
ing
Ind
ex
Mix ID
BeforeRetempering
AfterRetempering
Control
0.0
0.5
1.0
1.5
2.0
2.5
Lincoln Quartzite- Washed
Lincoln Quartzite- Non-Washed
Granite Limestone SD Quartzite
Clu
ster
ingI
nd
ex
Mix ID
BeforeRetempering
AfterRetempering
Control
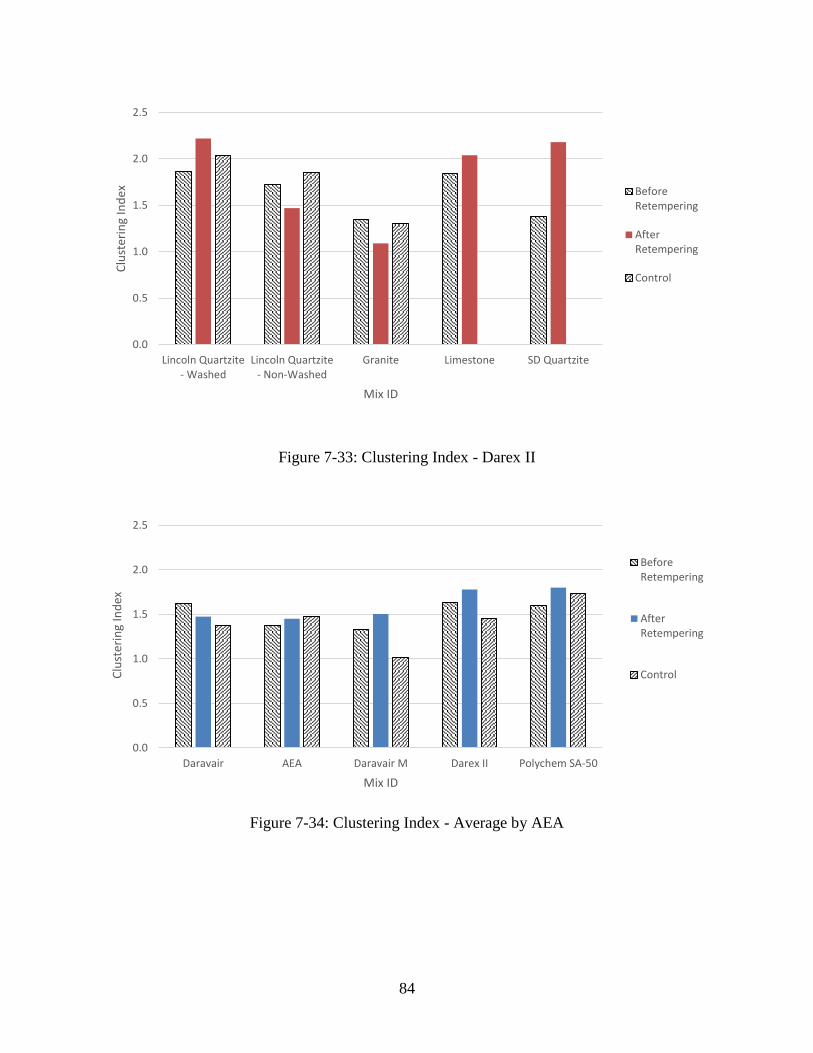
84
Figure 7-33: Clustering Index - Darex II
Figure 7-34: Clustering Index - Average by AEA
0.0
0.5
1.0
1.5
2.0
2.5
Lincoln Quartzite- Washed
Lincoln Quartzite- Non-Washed
Granite Limestone SD Quartzite
Clu
ster
ing
Ind
ex
Mix ID
BeforeRetempering
AfterRetempering
Control
0.0
0.5
1.0
1.5
2.0
2.5
Daravair AEA Daravair M Darex II Polychem SA-50
Clu
ster
ing
Ind
ex
Mix ID
BeforeRetempering
AfterRetempering
Control
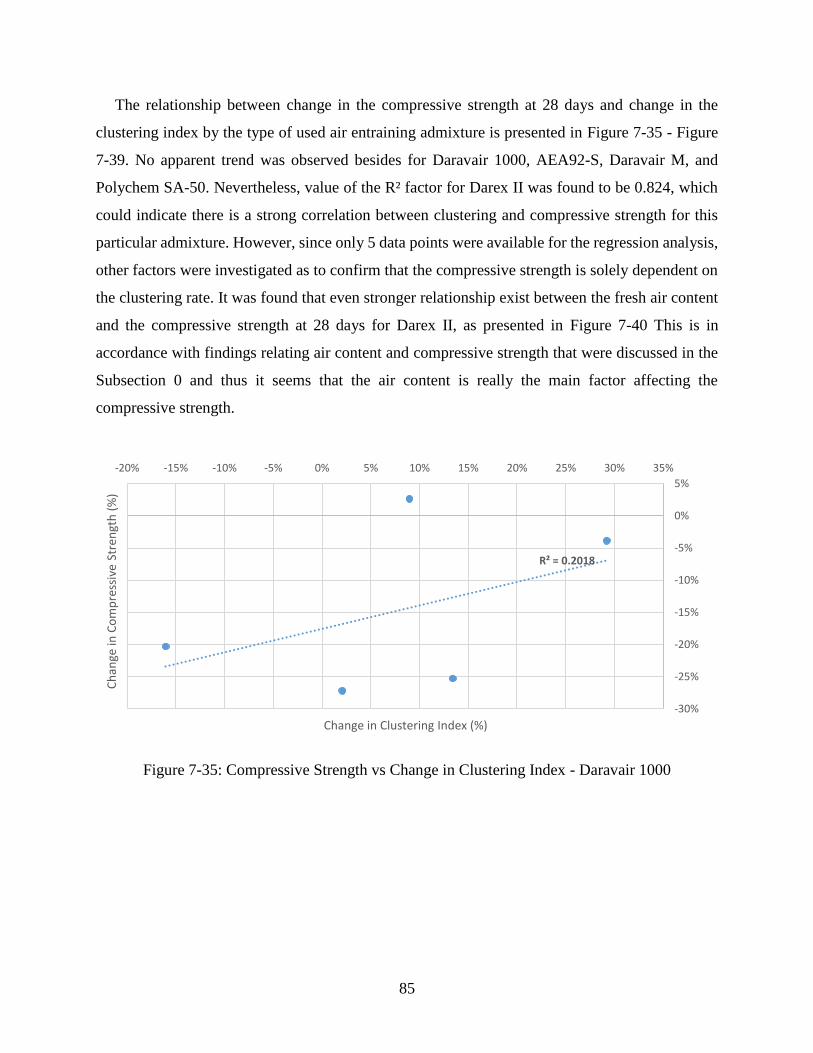
85
The relationship between change in the compressive strength at 28 days and change in the
clustering index by the type of used air entraining admixture is presented in Figure 7-35 - Figure
7-39. No apparent trend was observed besides for Daravair 1000, AEA92-S, Daravair M, and
Polychem SA-50. Nevertheless, value of the R² factor for Darex II was found to be 0.824, which
could indicate there is a strong correlation between clustering and compressive strength for this
particular admixture. However, since only 5 data points were available for the regression analysis,
other factors were investigated as to confirm that the compressive strength is solely dependent on
the clustering rate. It was found that even stronger relationship exist between the fresh air content
and the compressive strength at 28 days for Darex II, as presented in Figure 7-40 This is in
accordance with findings relating air content and compressive strength that were discussed in the
Subsection 0 and thus it seems that the air content is really the main factor affecting the
compressive strength.
Figure 7-35: Compressive Strength vs Change in Clustering Index - Daravair 1000
R² = 0.2018
-30%
-25%
-20%
-15%
-10%
-5%
0%
5%
-20% -15% -10% -5% 0% 5% 10% 15% 20% 25% 30% 35%
Ch
ange
in C
om
pre
ssiv
e St
ren
gth
(%
)
Change in Clustering Index (%)
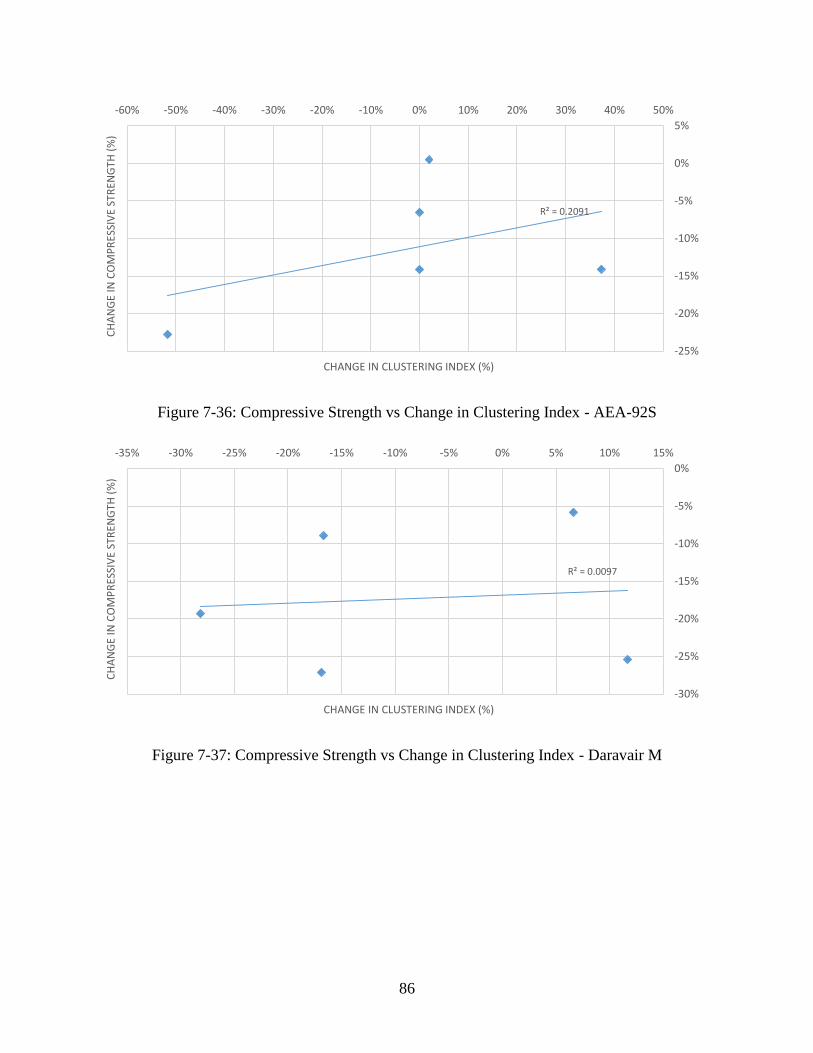
86
Figure 7-36: Compressive Strength vs Change in Clustering Index - AEA-92S
Figure 7-37: Compressive Strength vs Change in Clustering Index - Daravair M
R² = 0.2091
-25%
-20%
-15%
-10%
-5%
0%
5%
-60% -50% -40% -30% -20% -10% 0% 10% 20% 30% 40% 50%C
HA
NG
E IN
CO
MP
RES
SIV
E ST
REN
GTH
(%
)
CHANGE IN CLUSTERING INDEX (%)
R² = 0.0097
-30%
-25%
-20%
-15%
-10%
-5%
0%
-35% -30% -25% -20% -15% -10% -5% 0% 5% 10% 15%
CH
AN
GE
IN C
OM
PR
ESSI
VE
STR
ENG
TH (
%)
CHANGE IN CLUSTERING INDEX (%)
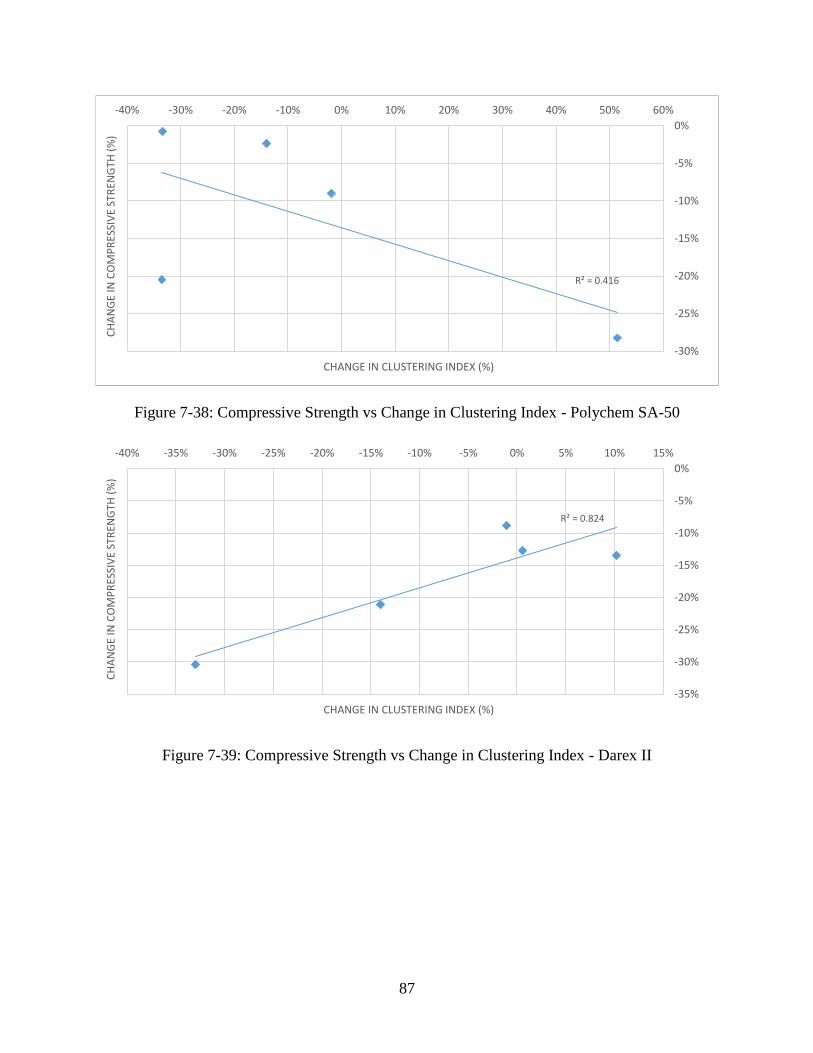
87
Figure 7-38: Compressive Strength vs Change in Clustering Index - Polychem SA-50
Figure 7-39: Compressive Strength vs Change in Clustering Index - Darex II
R² = 0.416
-30%
-25%
-20%
-15%
-10%
-5%
0%
-40% -30% -20% -10% 0% 10% 20% 30% 40% 50% 60%C
HA
NG
E IN
CO
MP
RES
SIV
E ST
REN
GTH
(%
)
CHANGE IN CLUSTERING INDEX (%)
R² = 0.824
-35%
-30%
-25%
-20%
-15%
-10%
-5%
0%
-40% -35% -30% -25% -20% -15% -10% -5% 0% 5% 10% 15%
CH
AN
GE
IN C
OM
PR
ESSI
VE
STR
ENG
TH (
%)
CHANGE IN CLUSTERING INDEX (%)
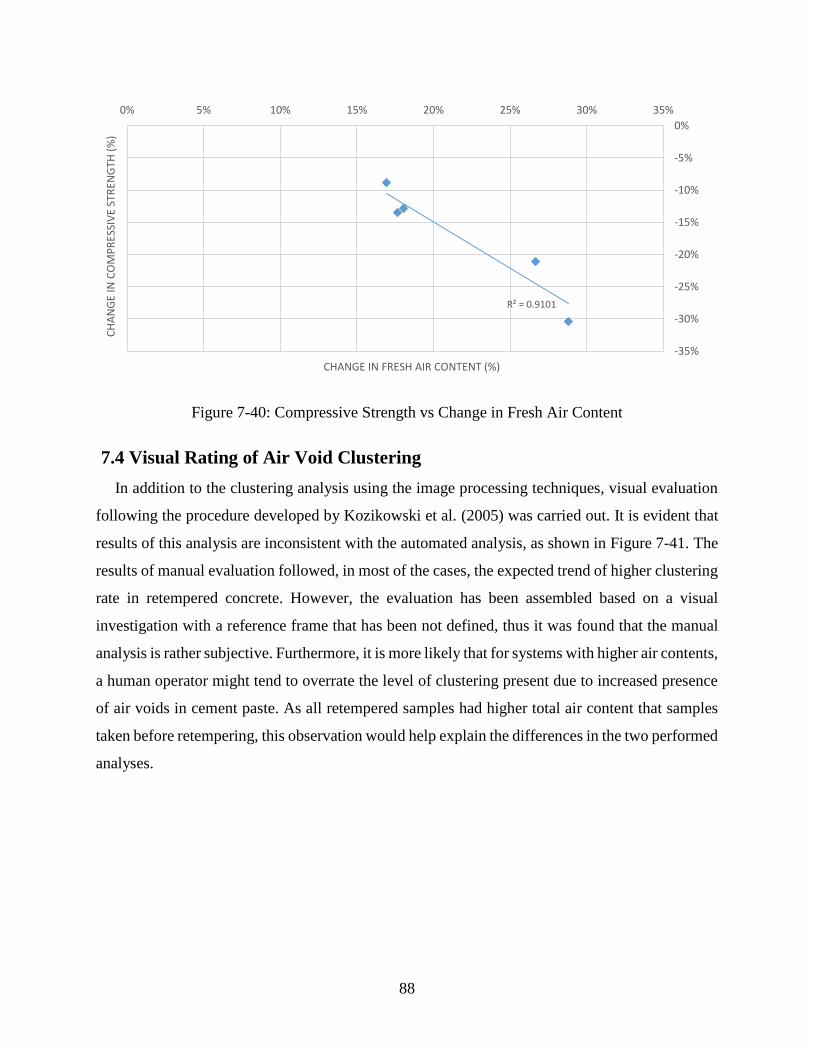
88
Figure 7-40: Compressive Strength vs Change in Fresh Air Content
7.4 Visual Rating of Air Void Clustering
In addition to the clustering analysis using the image processing techniques, visual evaluation
following the procedure developed by Kozikowski et al. (2005) was carried out. It is evident that
results of this analysis are inconsistent with the automated analysis, as shown in Figure 7-41. The
results of manual evaluation followed, in most of the cases, the expected trend of higher clustering
rate in retempered concrete. However, the evaluation has been assembled based on a visual
investigation with a reference frame that has been not defined, thus it was found that the manual
analysis is rather subjective. Furthermore, it is more likely that for systems with higher air contents,
a human operator might tend to overrate the level of clustering present due to increased presence
of air voids in cement paste. As all retempered samples had higher total air content that samples
taken before retempering, this observation would help explain the differences in the two performed
analyses.
R² = 0.9101
-35%
-30%
-25%
-20%
-15%
-10%
-5%
0%
0% 5% 10% 15% 20% 25% 30% 35%C
HA
NG
E IN
CO
MP
RES
SIV
E ST
REN
GTH
(%
)
CHANGE IN FRESH AIR CONTENT (%)

89
Figure 7-41: Visual Clustering Evaluation
0.0
0.5
1.0
1.5
2.0
2.5
3.0
3.5
1-I 1-II 1-III 1-IV 1-V 2-I 2-II 2-III 2-IV 2-V 3-I 3-II 3-III 3-IV 3-V 4-I 4-II 4-III 4-IV 4-V 5-I 5-II 5-III 5-IV 5-V
Clu
ste
rin
g R
atin
g
Mix ID
Before Retempering After Retempering

90
7.5 Field Testing
Results obtained from the field testing correspond to what was found in the laboratory
environment. Increases in fresh concrete properties (slump, air content) in mixes after retempering
occurred in both case. Samples obtained from Site I, where concrete was retempered with only 1
gallon of mixing water per cubic yard, experienced smaller change than samples from Site II. The
hardened air void content followed a similar pattern as a very small change in the air content
(7.99% vs 8.04%) was observed in mixes from Site I.
As for the clustering activity, retempering in both cases did not cause any significant increase
in the clustering index. Again, the change in the clustering rate before and after water addition was
higher for samples from Site II, however it was still insignificant (change from 0.87 to 1.06).
MasterAir AE 90 (formerly MB-AE 90) air entraining admixture was used. Although this
admixture is rosin-based (organic), the manufacturer warns regarding the possibility of air void
clustering in the product information sheet as some clustering concerns were raised in the past
(Kozikowski, David, Peter, & Steven, 2005). However, those concerns were not found to be
justified for mixes used in this study.
Compressive strength at 7 days decreased by 11% in both cases, and by 11% and 14% at 28
days for the Site I and Site II samples, respectively. These values are in the range that were
observed in laboratory study and occurred because of the increase in w/c and retempering and not
air void clustering. It is interesting to see almost a uniform strength drop although the amount of
retempering water was different for Site I and Site II. However, caution should be exercised in
drawing too strong of conclusions from this because of the small sample size (two field sites).
91
Chapter 8 - Conclusions and Recommendations
8.1 Conclusions
Based on the results presented and discussed in two previous sections, the following
conclusions have been made:
(1) Air void clustering is reproducible in the laboratory environment as it was observed in
several mixes. The highest value of the clustering index was 2.3 and 2.2 for mixes before
and after retempering, respectively.
(2) A correlation between the air void clustering and compressive strength was not found.
Instead, the loss in compressive strength after retempering seems to be simply a function
of air void content and water-to-cement ratio.
(3) Air void clustering was not significantly affected by retempering. 10 out of 25 mixes
experience decrease in clustering activity after retempering, and only a small increase
was observed in the remaining 15 mixes.
(4) Granite and SD Quartzite showed higher increase in both slump and air content after
retempering than other aggregates. Lincoln Quartzite, on the other hand, experienced
lower increase in slump and air content after retempering than mixes containing the
other types of coarse aggregate. This fact suggests that in order to restore the required
workability of concrete with Lincoln Quartzite in the field utilizing the retempering
technique, considerably higher amount of additional water would be needed. Therefore,
the loss of compressive strength due to increased water to cement ratio could be higher
as well.
(5) High density zones of cement paste were observed in mixes with Lincoln Quartzite,
especially mixes that utilized washed aggregate experience occurrence of those zones.
Presence of those zones could explain low compressive strengths experienced in some
projects where Lincoln Quartzite was used.
(6) Lower dosage of AEA was found to be required for clean Lincoln Quartzite to achieve
the same level of workability as the non-washed aggregate.
(7) The hypothesis that retempering of concrete with non-organic air entraining admixture
will cause air void clustering was not confirmed. In fact, AEA-92S, synthetic air
entraining agent used in the study, showed the best performance of all used AEAs as 4
92
out 5 mixes with this admixture experienced decrease in clustering index after
retempering.
(8) Kozikowki’s visual rating of air void clustering was in disagreement with the
automated, analytical method developed and implemented as part of the KSU Air Void
Analyzer software. Visual evaluation led to biased results, and it seems that air void
clustering tends to be overrated in concrete systems with high air content if this method
is used.
(9) Concrete obtained from real pavement projects shown similar behavior as concrete
prepared under laboratory conditions.
8.2 Recommendations
Lincoln Quartzite showed some behavior different than other aggregates (high density paste
zone, low increase in slump and air content after retempering). Retempering of concrete with
Lincoln Quartzite should be avoided.
8.3 Future Research Needs
(1) The effect of temperature on the clustering of air voids is still unclear. Further research
investigating this factor is needed to better understand the phenomena of air void
clustering.
(2) Fine aggregate is known to have strong impact on performance of air entraining agents,
thus its effect on air void clustering and retempering should be scrutinized.
(3) Further testing of Lincoln Quartzite, especially with focus on the formation of high
density paste zones, is needed.

93
References
ASTM C1231. (2014). Standard Practice for Use of Unbonded Caps in Determination of
Compressive Strength of Hardened Concrete Cylinders. West Conshohocken, PA: ASTM
International.
ASTM C127. (2012). Standard Test Method for Density, Relative Density (Specific Gravity),
and Absorption of Coarse Aggregate. West Conshohocken, PA: ASTM International.
ASTM C128. (2012). Standard Test Method for Density, Relative Density (Specific Gravity),
and Absorption of Fine Aggregate. West Conshohocken, PA: ASTM International.
ASTM C136. (2006). Standard Test Method for Sieve Analysis of Fine and Coarse Aggregates.
West Conshohocken, PA.
ASTM C138. (2012). Standard Test Method for Density (Unit Weight), Yield, and Air Content
(Gravimetric) of Concrete. West Conshohocken, PA: ASTM International.
ASTM C143. (2012). Standard Test Method for Slump of Hydraulic-Cement Concrete. West
Conshohocken, PA: ASTM International.
ASTM C172. (2010). Standard Practice for Sampling Freshly Mixed Concrete. West
Conshohocken, PA: ASTM International.
ASTM C173. (2014). Standard Test Method for Air Content of Freshly Mixed Concrete by the
Volumetric Method. West Conshohocken, PA: ASTM International.
ASTM C192. (2013). Standard Practice for Making and Curing Concrete Test Specimens in the
Laboratory. West Conshohocken, PA: ASTM International.
ASTM C231. (2010). Standard Test Method for Air Content of Freshly Mixed Concrete by the
Pressure Method. West Conshohocken, PA: ASTM International.
ASTM C31. (2012). Standard Practice for Making and Curing Concrete Test Specimens in the
Field. West Conshohocken, PA: ASTM International.
ASTM C39. (2012). Standard Test Method for Compressive Strength of Cylindrical Concrete
Specimens. West Conshohocken, PA: ASTM International.
ASTM C457. (2012). Microscopical Determination of Parameters of the Air-Void System in
Hardened Concrete. West Conshohocken, PA: ASTM International.
Chatterji, S. (2003). Freezing of Air-Entrained Cement-Based Materials and Specific Actions of
Air-Entraining Agents. Cement and Concrete Composites, 25(7), 759-765.
Cross, W., Duke, E., Kellar, J., & Johnston, D. (2000). Investigation of Low Compressive
Strengths of Concrete Paving,. Pierre, SD: South Dakota Department of Transportation.

94
Distlehorst, J. (2009). Evaluation of Air-Void Clustering in Concrete Pavement from Meade,
Kansas. Topeka, KS: Kansas Department of Transportation.
Du, L., & Folliard, K. J. (2005). Mechanism of Air Entrainment in Concrete. Cement and
Concrete Research, 1463-1471.
Garboczi, E. J., Bentz, D. P., Snyder, K. A., Martys, N. S., Stutzman, P. E., Ferraris, F. C., &
Bullard, J. W. (2014). An Electronic Monograph: Modeling and Measuring the Structure
and Properties of Cement-Based Materials. Gaithersburg, MD: Materials and Structural
Systems DIvision, National Institute of Standards and Technology. Retrieved from
http://ciks.cbt.nist.gov/~garbocz/
Kansas Department of Transportation. (2007). Standard Specifications For State Road & Bridge
Construction. Division 400 - Concrete. Topeka, KS: Kansas Department of
Transportation.
Kansas Department of Transportation. (2014). List of Non-Reactive Siliceous Aggregate Sources
for Concrete (Revised 04/25/14). Topeka, KS: Kansas Department of Transportation.
Kosmatka, S. H., Kerkhoff, B., & Panarese, W. C. (2003). Design and Control of Concrete
Mixtures (14th ed.). Skokie, IL: Portland Cement Association.
Kozikowski, R. L., David, B. V., Peter, C. T., & Steven, H. G. (2005). Factors Affecting the
Origin of Air-Void Clustering. (PCA R&D Serial No. 2789). Skokie, Illinios: Portland
Cement Association.
Ley, T. (2007). The Effects of Fly Ash on the Ability to Entrain and Stabilize Air in Concrete.
Dissertation, The University of Texas at Austin, Austin.
Litvan, G. (1973). Frost Action in Cement Paste. Materials and Structures, 6(4), 293-298.
Naranjo, A. (2007). Clustering of Air Voids Around Aggregates in Air Entrained Concrete.
Master's Thesis, The University of Texas in Austin.
Peterson, K. (2008). Automated Air-Void System Characterization of Hardened Concrete:
Helping Computers to Count Air-voids Like People Count Air-Voids – Methods for
Flatbed Scanner Calibration. Dissertation, Michigan Technological University.
Pigeon, M., & Pleau, R. (1995). Durability of Concrete in Cold Climates. CRC Press.
Pomeroy, D. (1989). ACI Special Publication. Concrete Durability: From Basic Research to
Practical Reality, 111-130. Farmington Hills, MI: American Concrete Institute.
Powers , T. C., & Willis, T. F. (1949). The Air Requirement of Frost Resistant Concrete.
Proceedings of the Twenty-Ninth Annual Meeting of the Highway Research Board (pp.
184-211). Washington, D.C.: Highway Research Board.
95
Powers, T. C., & Helmuth, R. A. (1953). Theory of Volume Changes in Hardened Portland-
Cement Paste During Freezing. Skokie, IL: Portland Cement Association.
Ramachandran, V. S. (1997). Concrete Admixtures Handbook (2nd ed.). William Andrew.
Torrans, P. H., & Ivey, D. L. (1968). Review of Literature on Air-Entrained Concrete. College
Station, Texas: Texas Transportation Institute, Texas A&M University.
Walker, H. N., Lane, D. S., & Paul, E. S. (2006). Petrographic Methods of Examining Hardened
Concrete: A Pethrographic Manual. Virginia Transportation Research Council. McLean,
VA: Federal Highway Administration.
Whiting, D. A., & Nagi, M. A. (1998). Manual on Control of Air Content in Concrete. Skokie,
IL: Portland Cement Association.
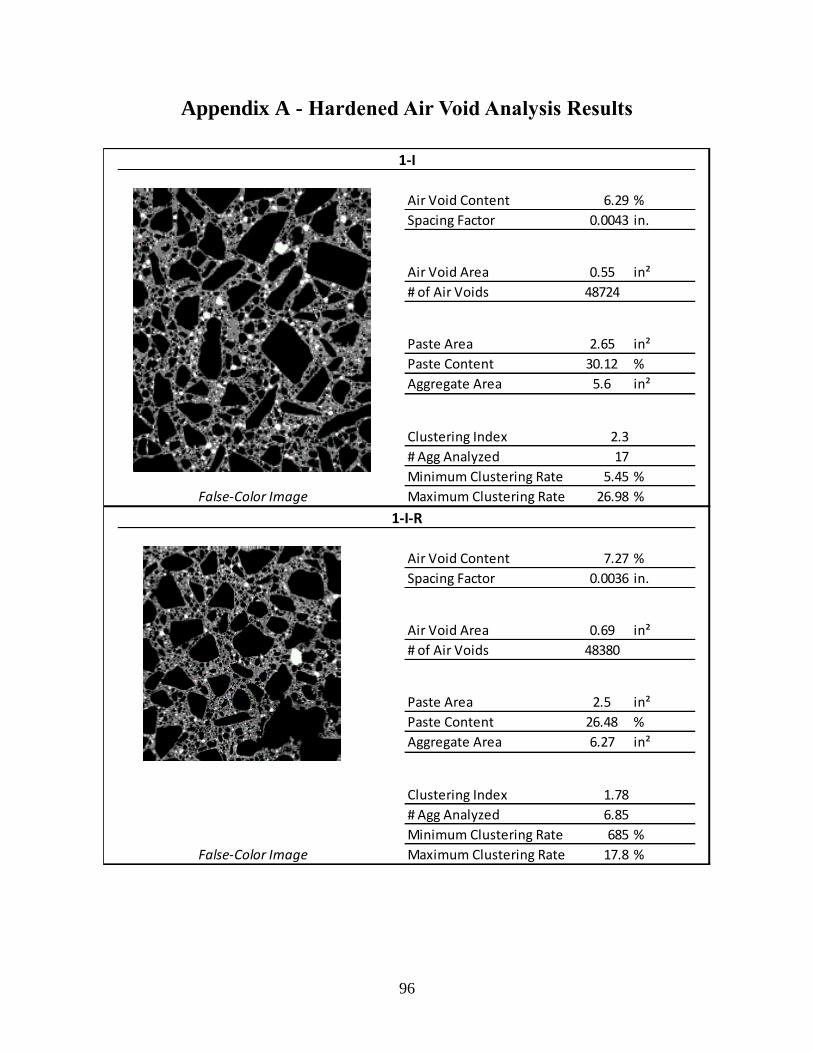
96
Appendix A - Hardened Air Void Analysis Results
Air Void Content 6.29 %
Spacing Factor 0.0043 in.
Air Void Area 0.55 in²
# of Air Voids 48724
Paste Area 2.65 in²
Paste Content 30.12 %
Aggregate Area 5.6 in²
Clustering Index 2.3
# Agg Analyzed 17
Minimum Clustering Rate 5.45 %
False-Color Image Maximum Clustering Rate 26.98 %
Air Void Content 7.27 %
Spacing Factor 0.0036 in.
Air Void Area 0.69 in²
# of Air Voids 48380
Paste Area 2.5 in²
Paste Content 26.48 %
Aggregate Area 6.27 in²
Clustering Index 1.78
# Agg Analyzed 6.85
Minimum Clustering Rate 685 %
False-Color Image Maximum Clustering Rate 17.8 %
1-I
1-I-R
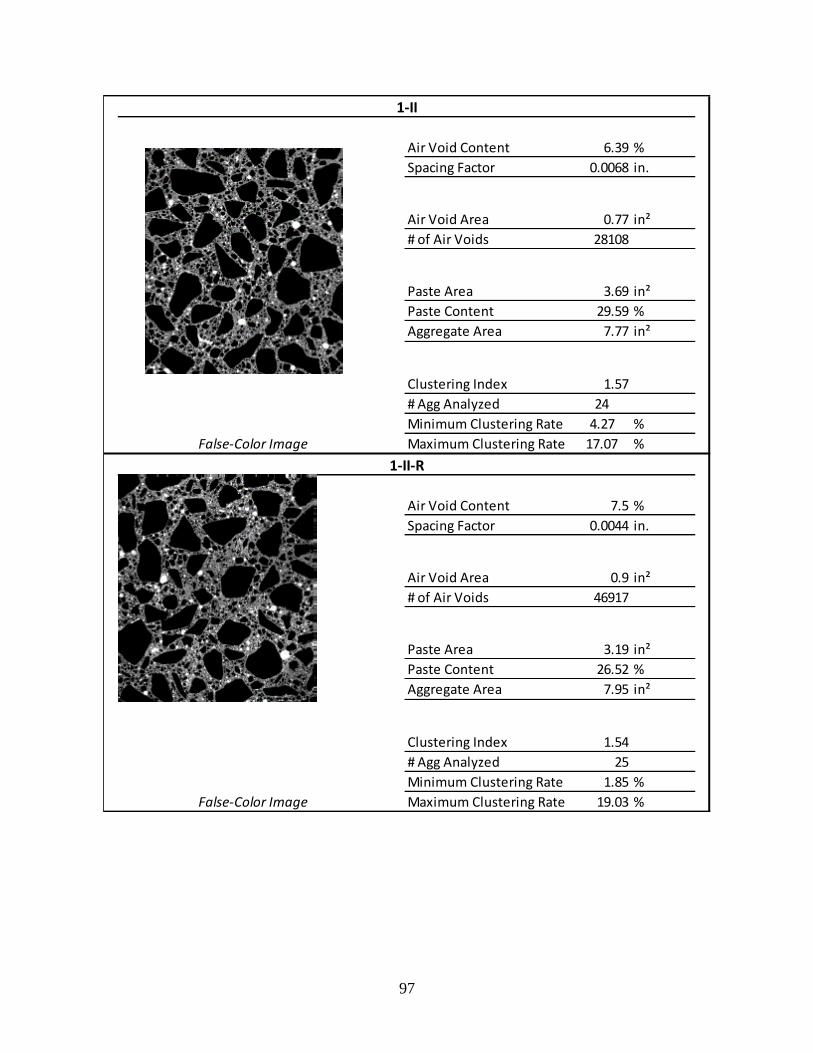
97
Air Void Content 6.39 %
Spacing Factor 0.0068 in.
Air Void Area 0.77 in²
# of Air Voids 28108
Paste Area 3.69 in²
Paste Content 29.59 %
Aggregate Area 7.77 in²
Clustering Index 1.57
# Agg Analyzed 24
Minimum Clustering Rate 4.27 %
False-Color Image Maximum Clustering Rate 17.07 %
Air Void Content 7.5 %
Spacing Factor 0.0044 in.
Air Void Area 0.9 in²
# of Air Voids 46917
Paste Area 3.19 in²
Paste Content 26.52 %
Aggregate Area 7.95 in²
Clustering Index 1.54
# Agg Analyzed 25
Minimum Clustering Rate 1.85 %
False-Color Image Maximum Clustering Rate 19.03 %
1-II-R
1-II

98
Air Void Content 8.17 %
Spacing Factor 0.0059 in.
Air Void Area 0.99 in²
# of Air Voids 31833
Paste Area 3.49 in²
Paste Content 28.65 %
Aggregate Area 7.69 in²
Clustering Index 1.45
# Agg Analyzed 23
Minimum Clustering Rate 4.32 %
False-Color Image Maximum Clustering Rate 19.26 %
Air Void Content 11.08 %
Spacing Factor 0.0038 in.
Air Void Area 1.34 in²
# of Air Voids 44843
Paste Area 3.42 in²
Paste Content 28.26 %
Aggregate Area 7.35 in²
Clustering Index 1.36
# Agg Analyzed 22
Minimum Clustering Rate 7.15 %
False-Color Image Maximum Clustering Rate 24.97 %
1-III
1-III-R

99
Air Void Content 7.39 %
Spacing Factor 0.0047 in.
Air Void Area 0.9 in²
# of Air Voids 38146
Paste Area 3.06 in²
Paste Content 25.19 %
Aggregate Area 8.18 in²
Clustering Index 1.91
# Agg Analyzed 23
Minimum Clustering Rate 7 %
False-Color Image Maximum Clustering Rate 23.86 %
Air Void Content 9.74 %
Spacing Factor 0.0027 in.
Air Void Area 0.94 in²
# of Air Voids 48218
Paste Area 2.3 in²
Paste Content 23.82 %
Aggregate Area 6.42 in²
Clustering Index 2.22
# Agg Analyzed 21
Minimum Clustering Rate 36.19 %
False-Color Image Maximum Clustering Rate 13.53 %
1-IV
N/A
1-IV-R
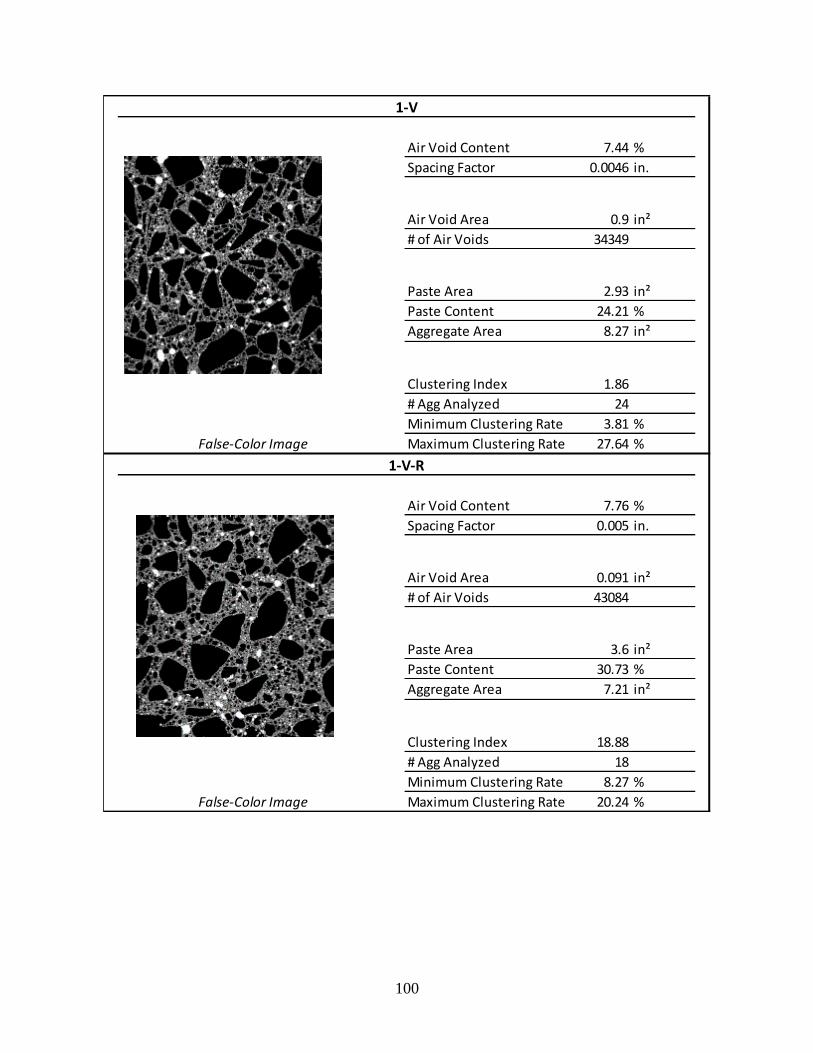
100
Air Void Content 7.44 %
Spacing Factor 0.0046 in.
Air Void Area 0.9 in²
# of Air Voids 34349
Paste Area 2.93 in²
Paste Content 24.21 %
Aggregate Area 8.27 in²
Clustering Index 1.86
# Agg Analyzed 24
Minimum Clustering Rate 3.81 %
False-Color Image Maximum Clustering Rate 27.64 %
Air Void Content 7.76 %
Spacing Factor 0.005 in.
Air Void Area 0.091 in²
# of Air Voids 43084
Paste Area 3.6 in²
Paste Content 30.73 %
Aggregate Area 7.21 in²
Clustering Index 18.88
# Agg Analyzed 18
Minimum Clustering Rate 8.27 %
False-Color Image Maximum Clustering Rate 20.24 %
1-V
1-V-R
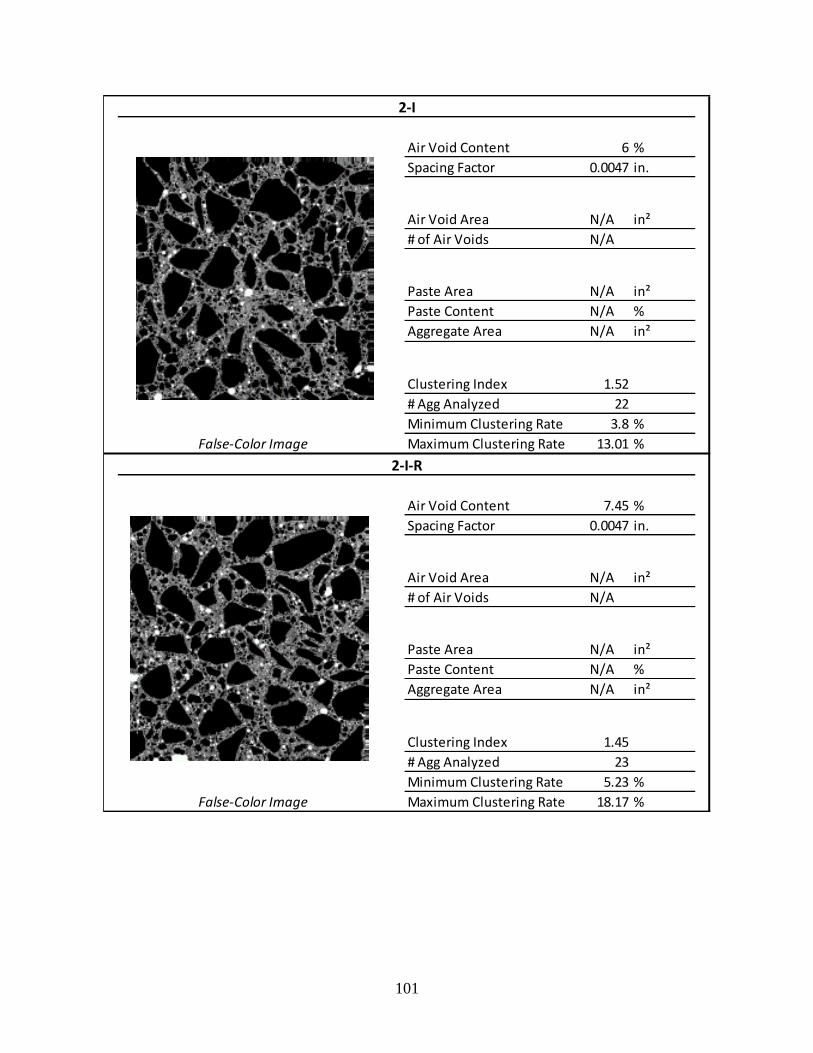
101
Air Void Content 6 %
Spacing Factor 0.0047 in.
Air Void Area N/A in²
# of Air Voids N/A
Paste Area N/A in²
Paste Content N/A %
Aggregate Area N/A in²
Clustering Index 1.52
# Agg Analyzed 22
Minimum Clustering Rate 3.8 %
False-Color Image Maximum Clustering Rate 13.01 %
Air Void Content 7.45 %
Spacing Factor 0.0047 in.
Air Void Area N/A in²
# of Air Voids N/A
Paste Area N/A in²
Paste Content N/A %
Aggregate Area N/A in²
Clustering Index 1.45
# Agg Analyzed 23
Minimum Clustering Rate 5.23 %
False-Color Image Maximum Clustering Rate 18.17 %
2-I
2-I-R
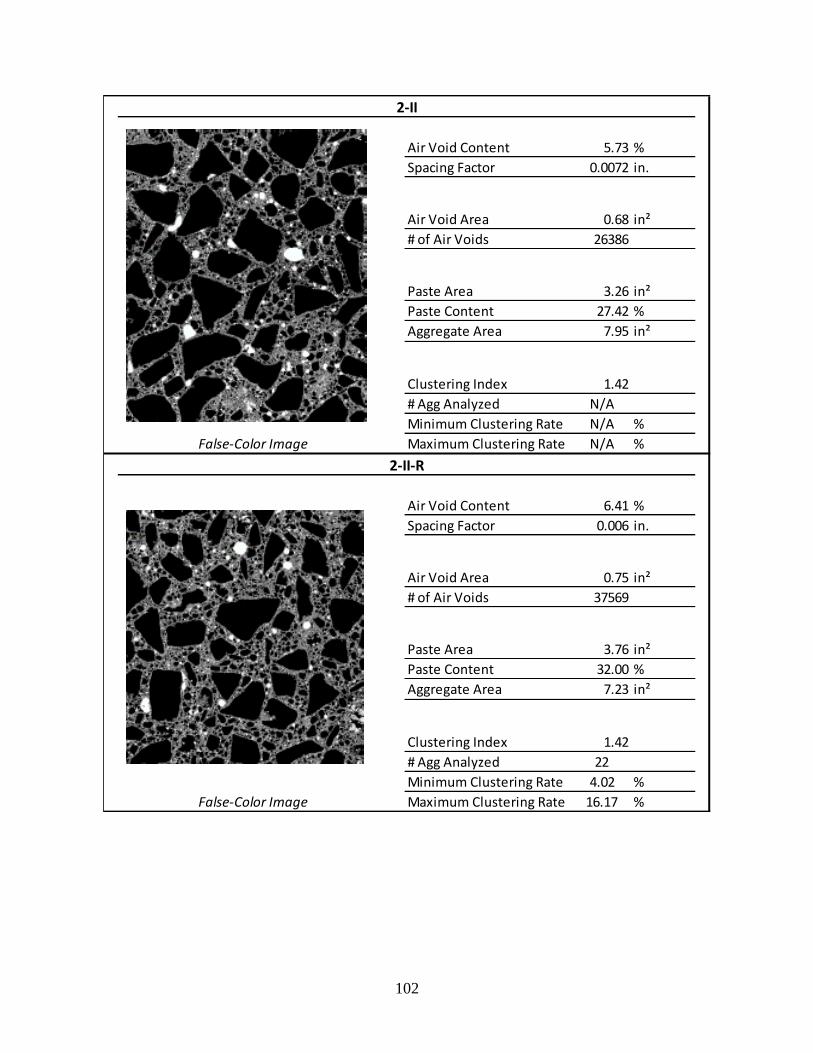
102
Air Void Content 5.73 %
Spacing Factor 0.0072 in.
Air Void Area 0.68 in²
# of Air Voids 26386
Paste Area 3.26 in²
Paste Content 27.42 %
Aggregate Area 7.95 in²
Clustering Index 1.42
# Agg Analyzed N/A
Minimum Clustering Rate N/A %
False-Color Image Maximum Clustering Rate N/A %
Air Void Content 6.41 %
Spacing Factor 0.006 in.
Air Void Area 0.75 in²
# of Air Voids 37569
Paste Area 3.76 in²
Paste Content 32.00 %
Aggregate Area 7.23 in²
Clustering Index 1.42
# Agg Analyzed 22
Minimum Clustering Rate 4.02 %
False-Color Image Maximum Clustering Rate 16.17 %
2-II-R
2-II
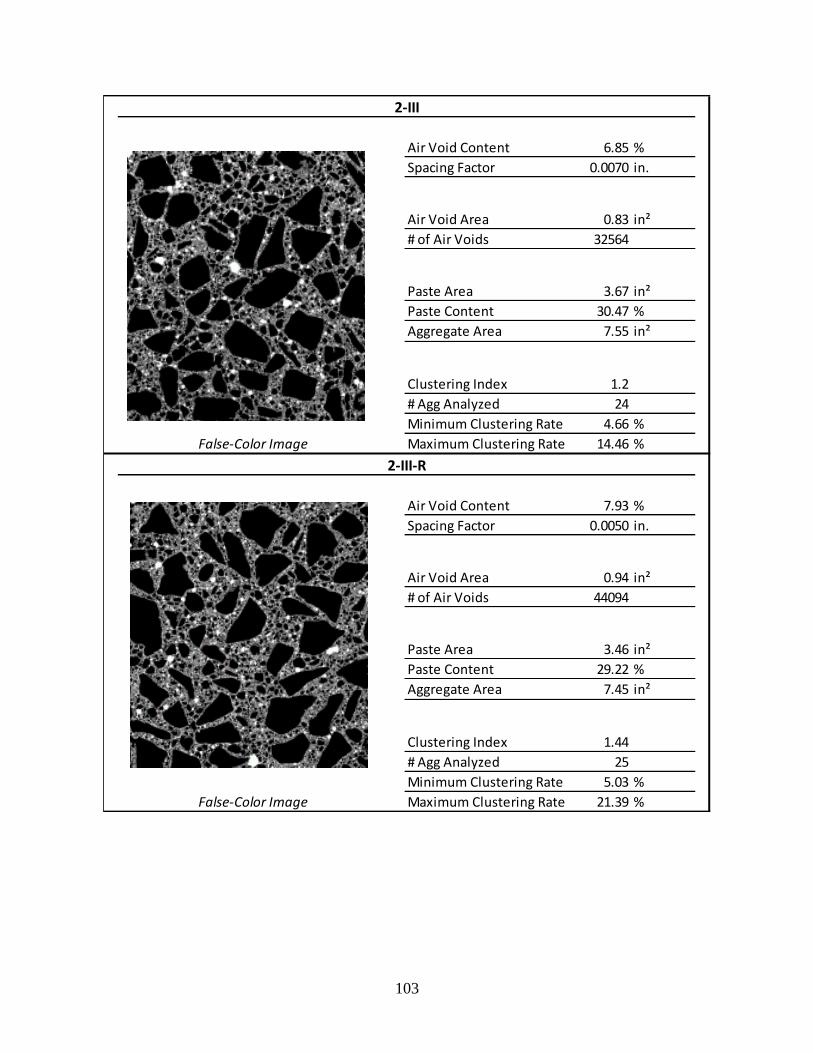
103
Air Void Content 6.85 %
Spacing Factor 0.0070 in.
Air Void Area 0.83 in²
# of Air Voids 32564
Paste Area 3.67 in²
Paste Content 30.47 %
Aggregate Area 7.55 in²
Clustering Index 1.2
# Agg Analyzed 24
Minimum Clustering Rate 4.66 %
False-Color Image Maximum Clustering Rate 14.46 %
Air Void Content 7.93 %
Spacing Factor 0.0050 in.
Air Void Area 0.94 in²
# of Air Voids 44094
Paste Area 3.46 in²
Paste Content 29.22 %
Aggregate Area 7.45 in²
Clustering Index 1.44
# Agg Analyzed 25
Minimum Clustering Rate 5.03 %
False-Color Image Maximum Clustering Rate 21.39 %
2-III
2-III-R
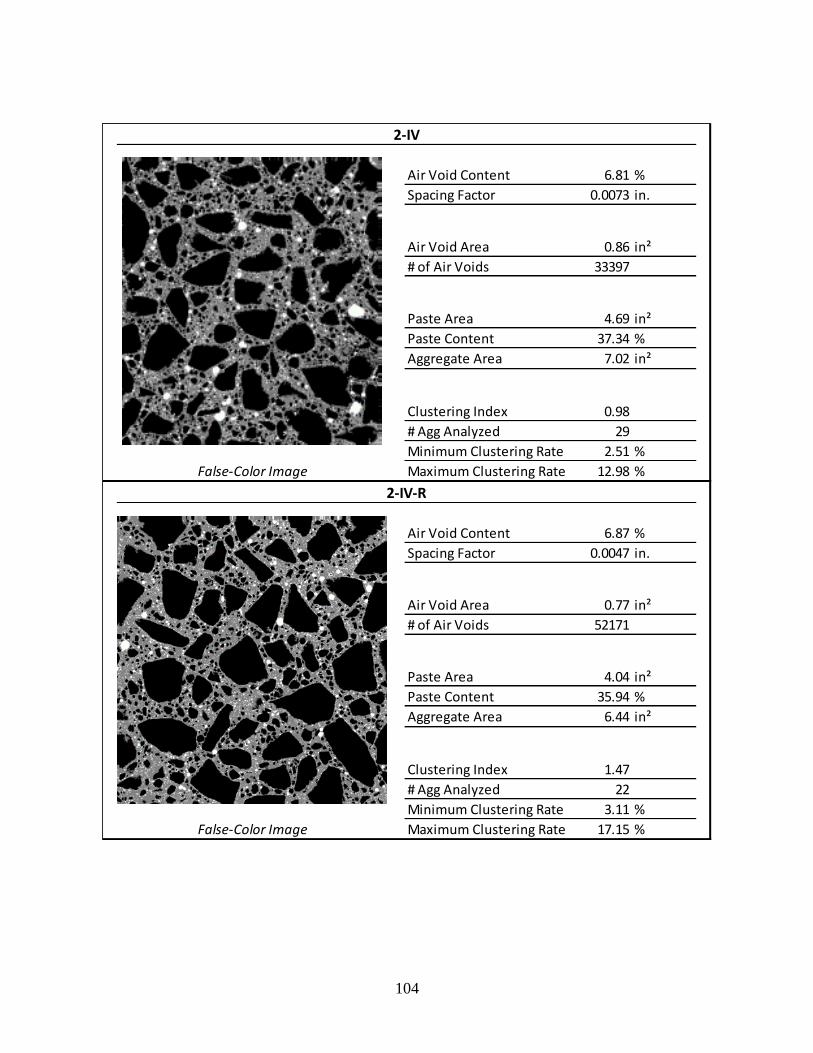
104
Air Void Content 6.81 %
Spacing Factor 0.0073 in.
Air Void Area 0.86 in²
# of Air Voids 33397
Paste Area 4.69 in²
Paste Content 37.34 %
Aggregate Area 7.02 in²
Clustering Index 0.98
# Agg Analyzed 29
Minimum Clustering Rate 2.51 %
False-Color Image Maximum Clustering Rate 12.98 %
Air Void Content 6.87 %
Spacing Factor 0.0047 in.
Air Void Area 0.77 in²
# of Air Voids 52171
Paste Area 4.04 in²
Paste Content 35.94 %
Aggregate Area 6.44 in²
Clustering Index 1.47
# Agg Analyzed 22
Minimum Clustering Rate 3.11 %
False-Color Image Maximum Clustering Rate 17.15 %
2-IV
2-IV-R
N/A
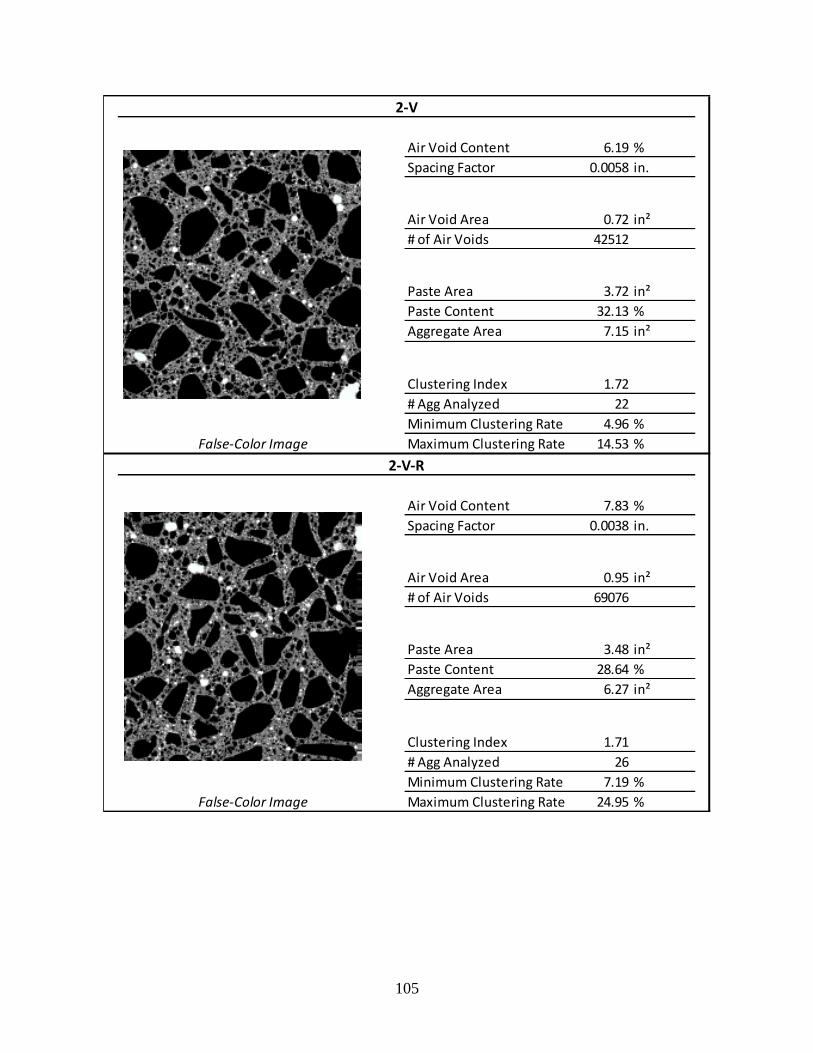
105
Air Void Content 6.19 %
Spacing Factor 0.0058 in.
Air Void Area 0.72 in²
# of Air Voids 42512
Paste Area 3.72 in²
Paste Content 32.13 %
Aggregate Area 7.15 in²
Clustering Index 1.72
# Agg Analyzed 22
Minimum Clustering Rate 4.96 %
False-Color Image Maximum Clustering Rate 14.53 %
Air Void Content 7.83 %
Spacing Factor 0.0038 in.
Air Void Area 0.95 in²
# of Air Voids 69076
Paste Area 3.48 in²
Paste Content 28.64 %
Aggregate Area 6.27 in²
Clustering Index 1.71
# Agg Analyzed 26
Minimum Clustering Rate 7.19 %
False-Color Image Maximum Clustering Rate 24.95 %
2-V
2-V-R
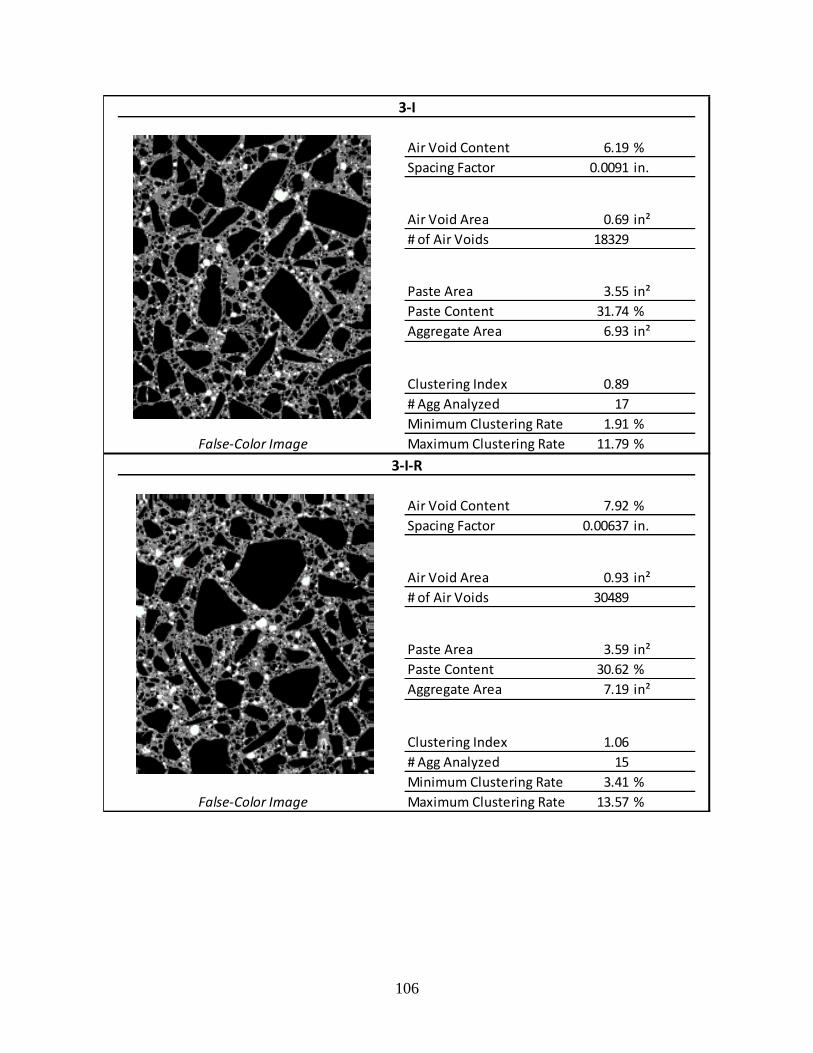
106
Air Void Content 6.19 %
Spacing Factor 0.0091 in.
Air Void Area 0.69 in²
# of Air Voids 18329
Paste Area 3.55 in²
Paste Content 31.74 %
Aggregate Area 6.93 in²
Clustering Index 0.89
# Agg Analyzed 17
Minimum Clustering Rate 1.91 %
False-Color Image Maximum Clustering Rate 11.79 %
Air Void Content 7.92 %
Spacing Factor 0.00637 in.
Air Void Area 0.93 in²
# of Air Voids 30489
Paste Area 3.59 in²
Paste Content 30.62 %
Aggregate Area 7.19 in²
Clustering Index 1.06
# Agg Analyzed 15
Minimum Clustering Rate 3.41 %
False-Color Image Maximum Clustering Rate 13.57 %
3-I
3-I-R
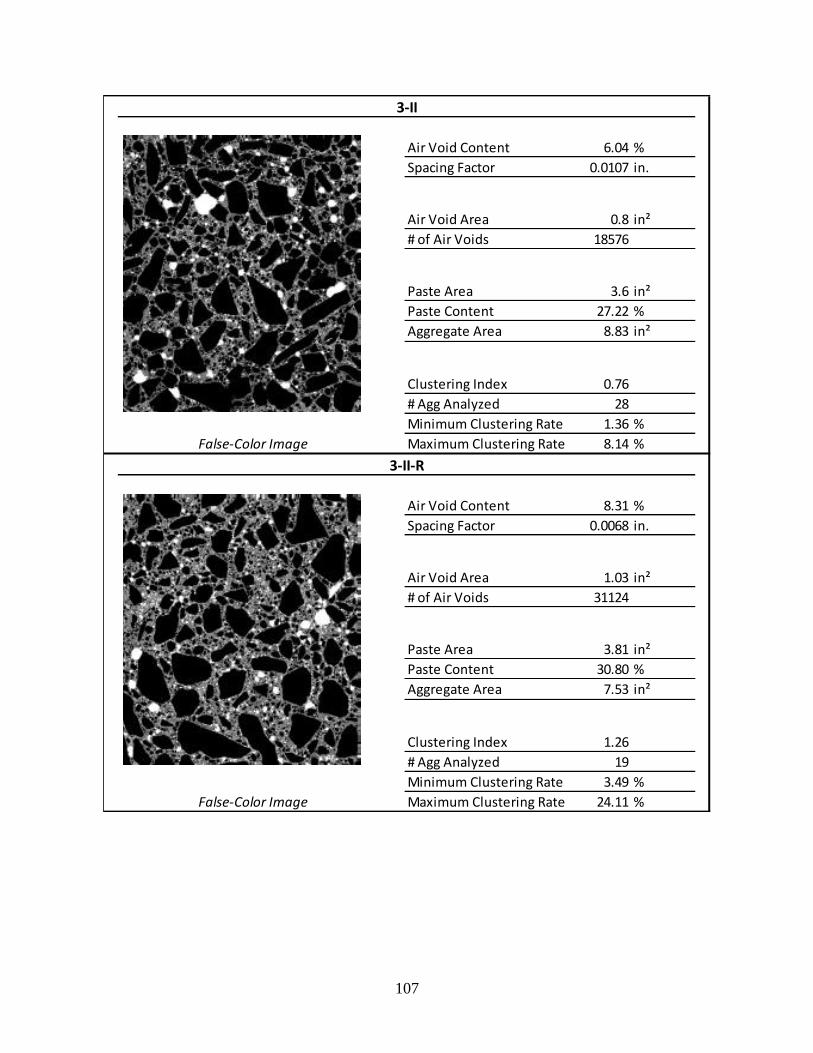
107
Air Void Content 6.04 %
Spacing Factor 0.0107 in.
Air Void Area 0.8 in²
# of Air Voids 18576
Paste Area 3.6 in²
Paste Content 27.22 %
Aggregate Area 8.83 in²
Clustering Index 0.76
# Agg Analyzed 28
Minimum Clustering Rate 1.36 %
False-Color Image Maximum Clustering Rate 8.14 %
Air Void Content 8.31 %
Spacing Factor 0.0068 in.
Air Void Area 1.03 in²
# of Air Voids 31124
Paste Area 3.81 in²
Paste Content 30.80 %
Aggregate Area 7.53 in²
Clustering Index 1.26
# Agg Analyzed 19
Minimum Clustering Rate 3.49 %
False-Color Image Maximum Clustering Rate 24.11 %
3-II-R
3-II
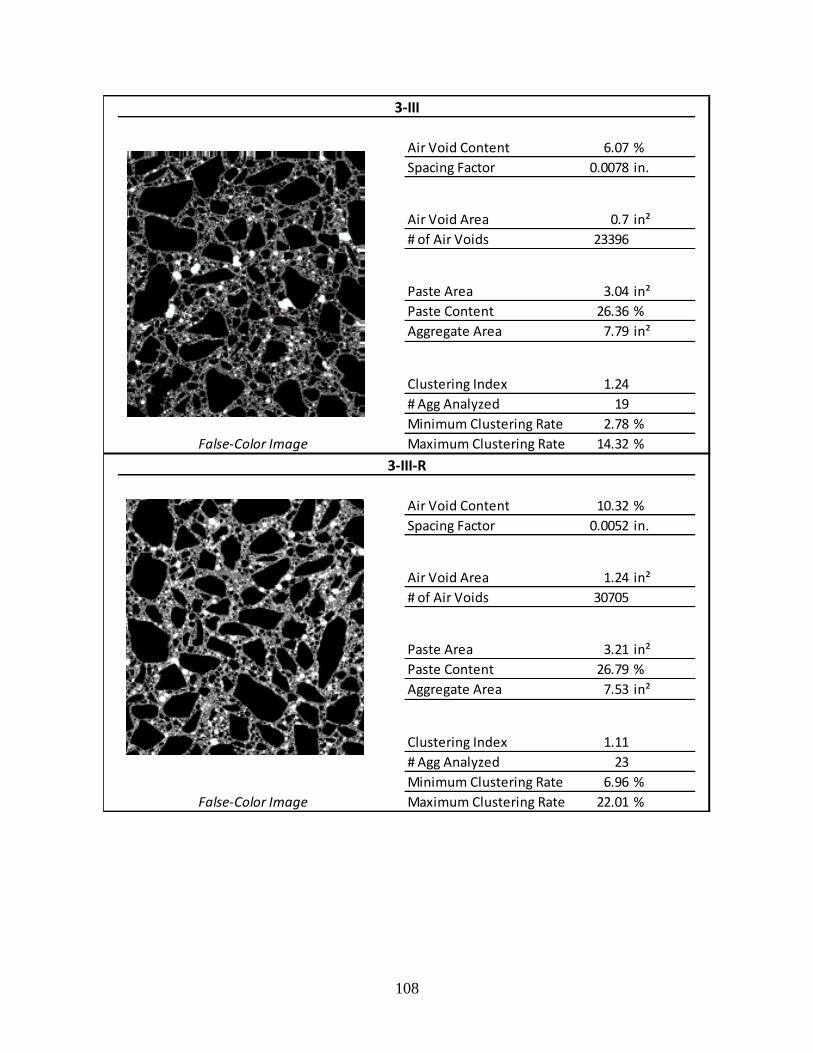
108
Air Void Content 6.07 %
Spacing Factor 0.0078 in.
Air Void Area 0.7 in²
# of Air Voids 23396
Paste Area 3.04 in²
Paste Content 26.36 %
Aggregate Area 7.79 in²
Clustering Index 1.24
# Agg Analyzed 19
Minimum Clustering Rate 2.78 %
False-Color Image Maximum Clustering Rate 14.32 %
Air Void Content 10.32 %
Spacing Factor 0.0052 in.
Air Void Area 1.24 in²
# of Air Voids 30705
Paste Area 3.21 in²
Paste Content 26.79 %
Aggregate Area 7.53 in²
Clustering Index 1.11
# Agg Analyzed 23
Minimum Clustering Rate 6.96 %
False-Color Image Maximum Clustering Rate 22.01 %
3-III
3-III-R
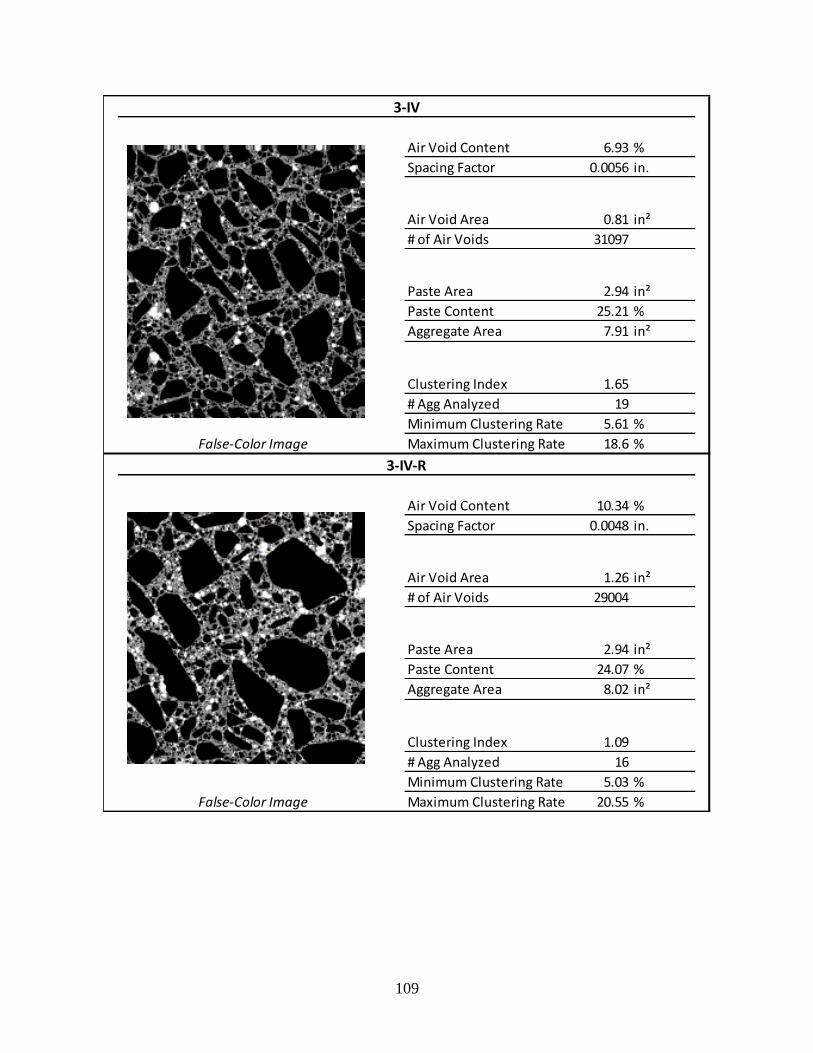
109
Air Void Content 6.93 %
Spacing Factor 0.0056 in.
Air Void Area 0.81 in²
# of Air Voids 31097
Paste Area 2.94 in²
Paste Content 25.21 %
Aggregate Area 7.91 in²
Clustering Index 1.65
# Agg Analyzed 19
Minimum Clustering Rate 5.61 %
False-Color Image Maximum Clustering Rate 18.6 %
Air Void Content 10.34 %
Spacing Factor 0.0048 in.
Air Void Area 1.26 in²
# of Air Voids 29004
Paste Area 2.94 in²
Paste Content 24.07 %
Aggregate Area 8.02 in²
Clustering Index 1.09
# Agg Analyzed 16
Minimum Clustering Rate 5.03 %
False-Color Image Maximum Clustering Rate 20.55 %
3-IV
3-IV-R
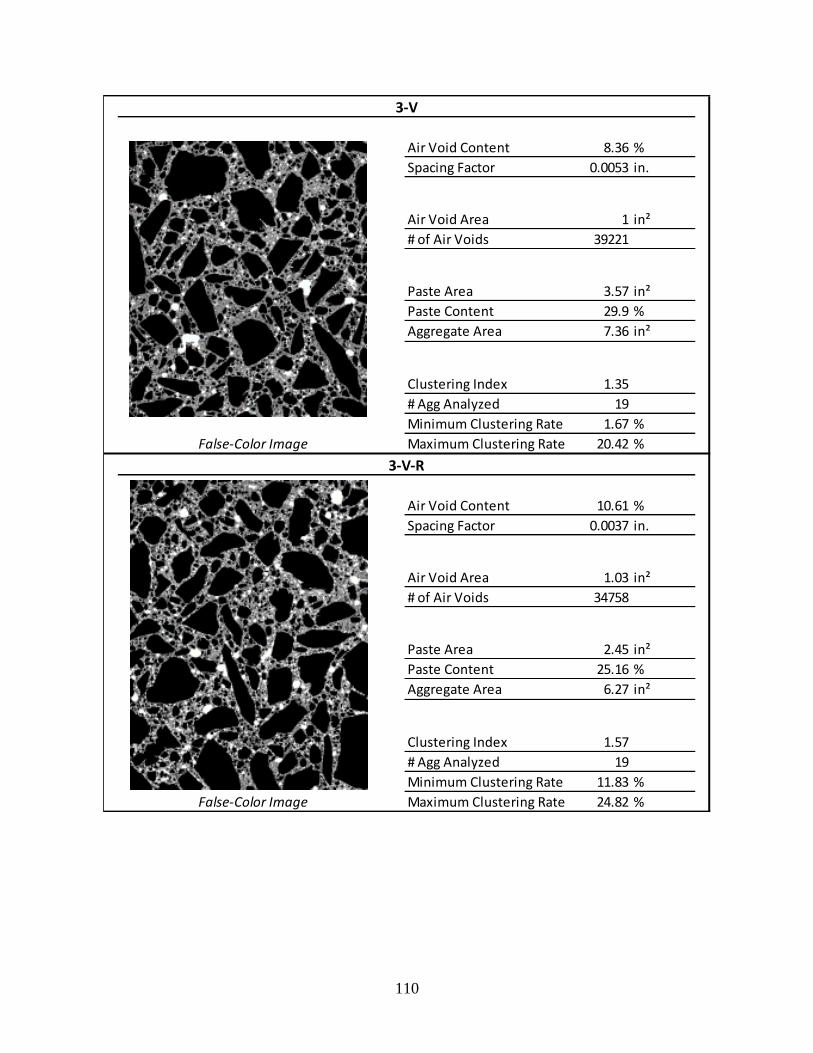
110
Air Void Content 8.36 %
Spacing Factor 0.0053 in.
Air Void Area 1 in²
# of Air Voids 39221
Paste Area 3.57 in²
Paste Content 29.9 %
Aggregate Area 7.36 in²
Clustering Index 1.35
# Agg Analyzed 19
Minimum Clustering Rate 1.67 %
False-Color Image Maximum Clustering Rate 20.42 %
Air Void Content 10.61 %
Spacing Factor 0.0037 in.
Air Void Area 1.03 in²
# of Air Voids 34758
Paste Area 2.45 in²
Paste Content 25.16 %
Aggregate Area 6.27 in²
Clustering Index 1.57
# Agg Analyzed 19
Minimum Clustering Rate 11.83 %
False-Color Image Maximum Clustering Rate 24.82 %
3-V
3-V-R

111
Air Void Content 6.11 %
Spacing Factor 0.0054 in.
Air Void Area 0.68 in²
# of Air Voids 39329
Paste Area 3.21 in²
Paste Content 28.63 %
Aggregate Area 7.32 in²
Clustering Index 1.86
# Agg Analyzed 23
Minimum Clustering Rate 5.92 %
False-Color Image Maximum Clustering Rate 18.71 %
Air Void Content 8.73 %
Spacing Factor 0.0042 in.
Air Void Area 1.02 in²
# of Air Voids 52614
Paste Area 3.61 in²
Paste Content 30.75 %
Aggregate Area 7.1 in²
Clustering Index 1.64
# Agg Analyzed 26
Minimum Clustering Rate 6.53 %
False-Color Image Maximum Clustering Rate 23.96 %
4-I
4-I-R
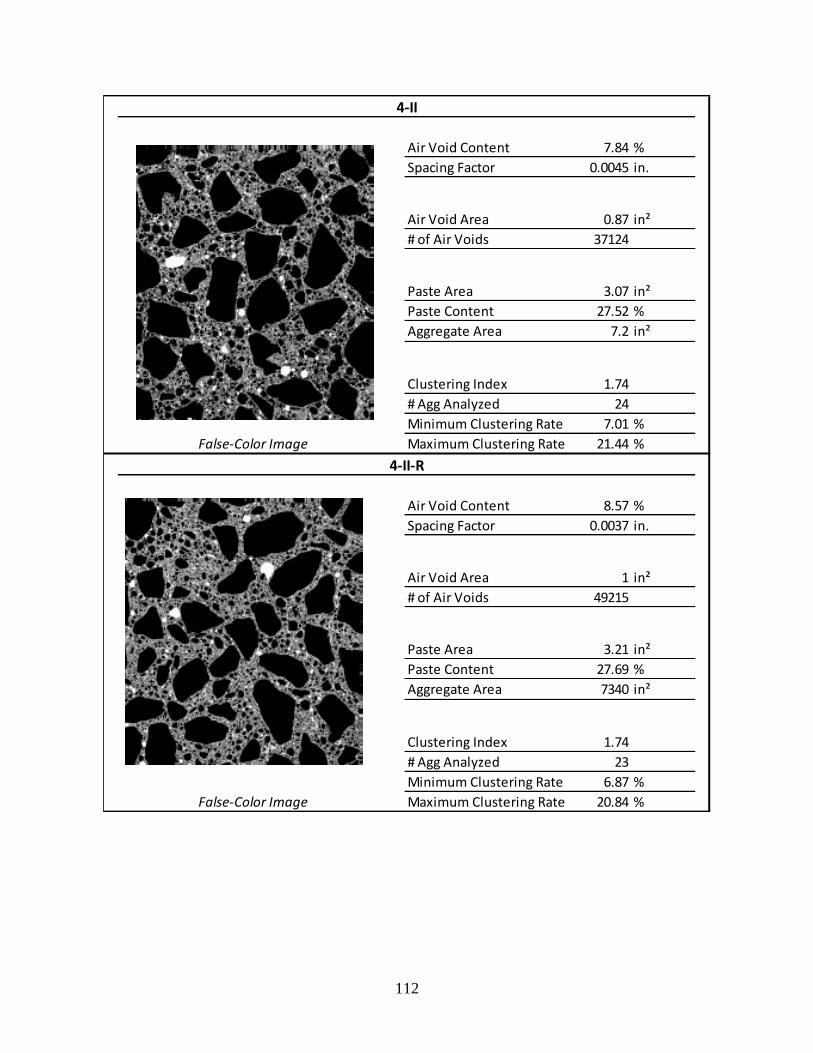
112
Air Void Content 7.84 %
Spacing Factor 0.0045 in.
Air Void Area 0.87 in²
# of Air Voids 37124
Paste Area 3.07 in²
Paste Content 27.52 %
Aggregate Area 7.2 in²
Clustering Index 1.74
# Agg Analyzed 24
Minimum Clustering Rate 7.01 %
False-Color Image Maximum Clustering Rate 21.44 %
Air Void Content 8.57 %
Spacing Factor 0.0037 in.
Air Void Area 1 in²
# of Air Voids 49215
Paste Area 3.21 in²
Paste Content 27.69 %
Aggregate Area 7340 in²
Clustering Index 1.74
# Agg Analyzed 23
Minimum Clustering Rate 6.87 %
False-Color Image Maximum Clustering Rate 20.84 %
4-II-R
4-II
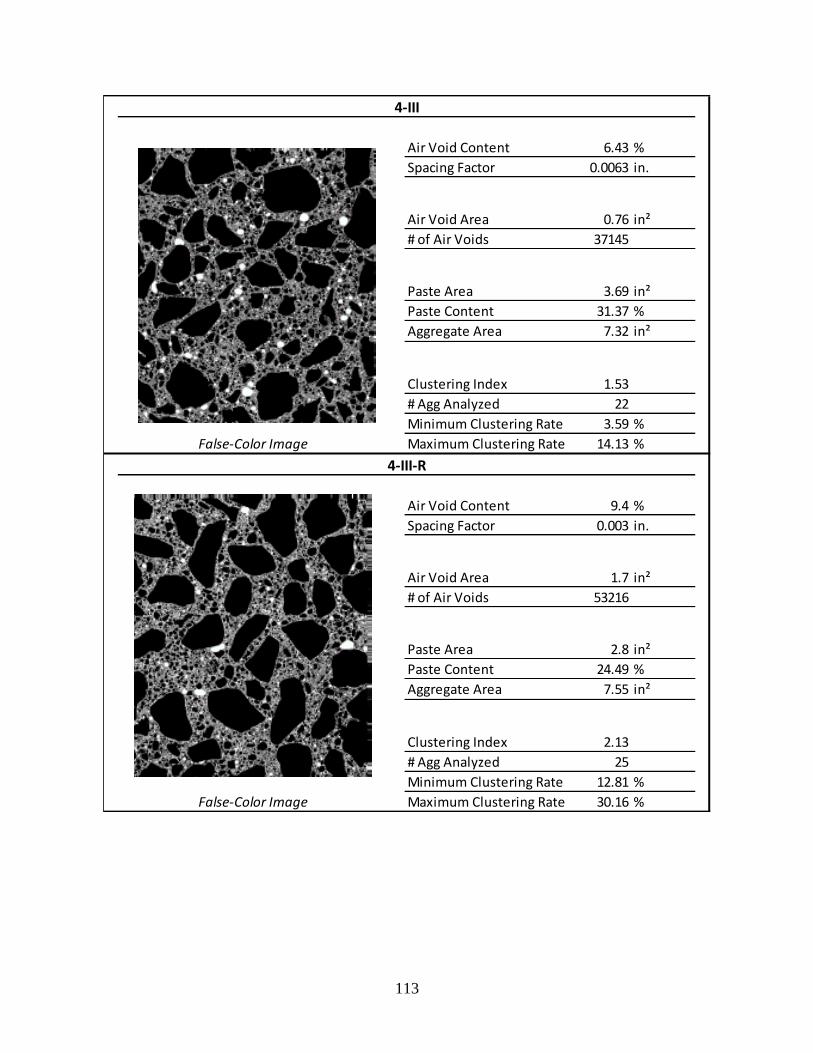
113
Air Void Content 6.43 %
Spacing Factor 0.0063 in.
Air Void Area 0.76 in²
# of Air Voids 37145
Paste Area 3.69 in²
Paste Content 31.37 %
Aggregate Area 7.32 in²
Clustering Index 1.53
# Agg Analyzed 22
Minimum Clustering Rate 3.59 %
False-Color Image Maximum Clustering Rate 14.13 %
Air Void Content 9.4 %
Spacing Factor 0.003 in.
Air Void Area 1.7 in²
# of Air Voids 53216
Paste Area 2.8 in²
Paste Content 24.49 %
Aggregate Area 7.55 in²
Clustering Index 2.13
# Agg Analyzed 25
Minimum Clustering Rate 12.81 %
False-Color Image Maximum Clustering Rate 30.16 %
4-III
4-III-R
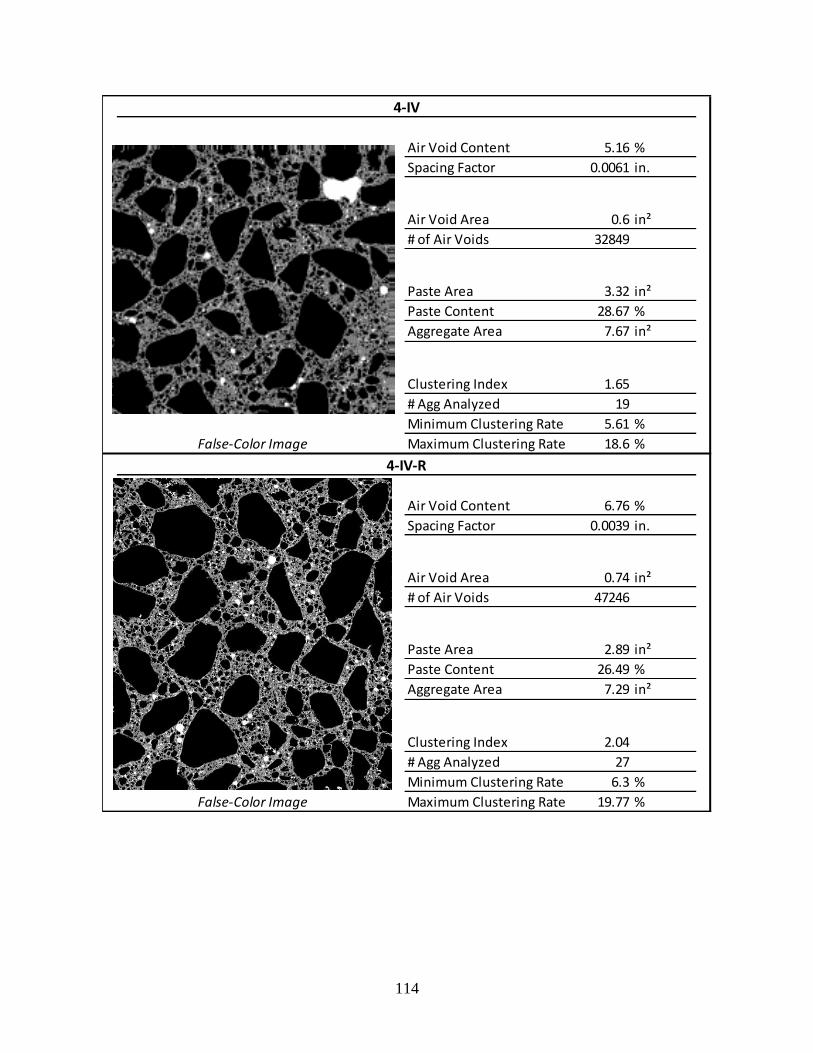
114
Air Void Content 5.16 %
Spacing Factor 0.0061 in.
Air Void Area 0.6 in²
# of Air Voids 32849
Paste Area 3.32 in²
Paste Content 28.67 %
Aggregate Area 7.67 in²
Clustering Index 1.65
# Agg Analyzed 19
Minimum Clustering Rate 5.61 %
False-Color Image Maximum Clustering Rate 18.6 %
Air Void Content 6.76 %
Spacing Factor 0.0039 in.
Air Void Area 0.74 in²
# of Air Voids 47246
Paste Area 2.89 in²
Paste Content 26.49 %
Aggregate Area 7.29 in²
Clustering Index 2.04
# Agg Analyzed 27
Minimum Clustering Rate 6.3 %
False-Color Image Maximum Clustering Rate 19.77 %
4-IV
4-IV-R
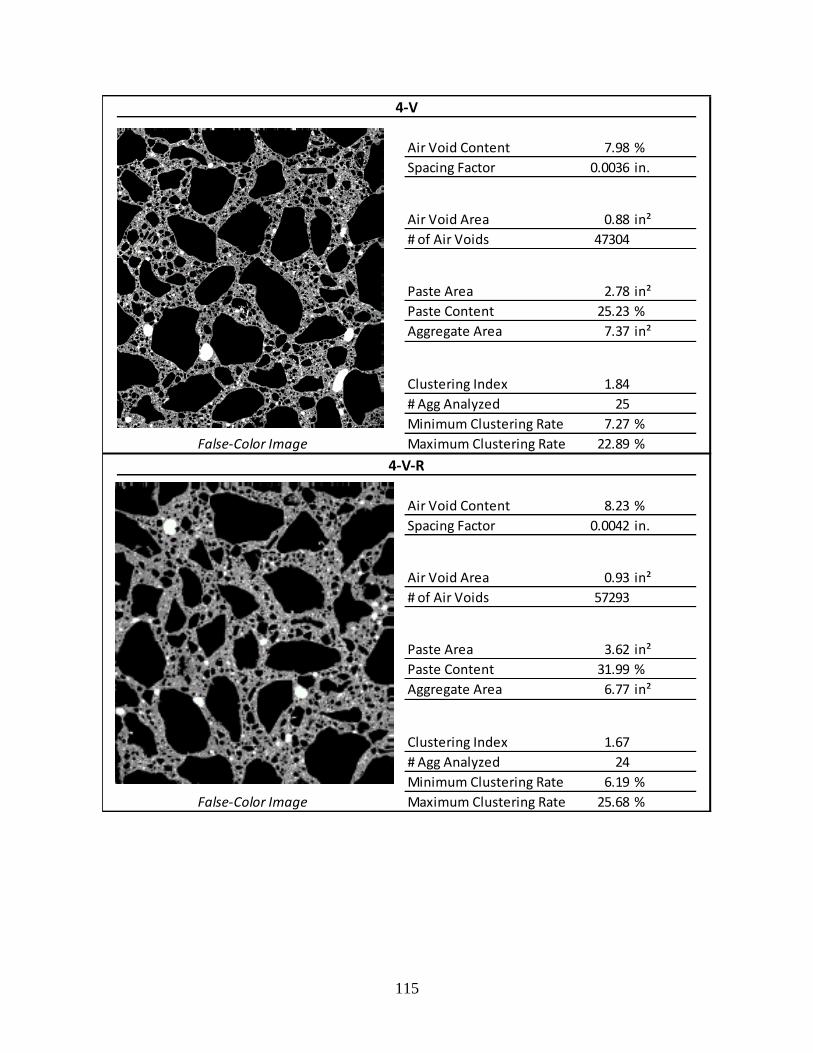
115
Air Void Content 7.98 %
Spacing Factor 0.0036 in.
Air Void Area 0.88 in²
# of Air Voids 47304
Paste Area 2.78 in²
Paste Content 25.23 %
Aggregate Area 7.37 in²
Clustering Index 1.84
# Agg Analyzed 25
Minimum Clustering Rate 7.27 %
False-Color Image Maximum Clustering Rate 22.89 %
Air Void Content 8.23 %
Spacing Factor 0.0042 in.
Air Void Area 0.93 in²
# of Air Voids 57293
Paste Area 3.62 in²
Paste Content 31.99 %
Aggregate Area 6.77 in²
Clustering Index 1.67
# Agg Analyzed 24
Minimum Clustering Rate 6.19 %
False-Color Image Maximum Clustering Rate 25.68 %
4-V
4-V-R
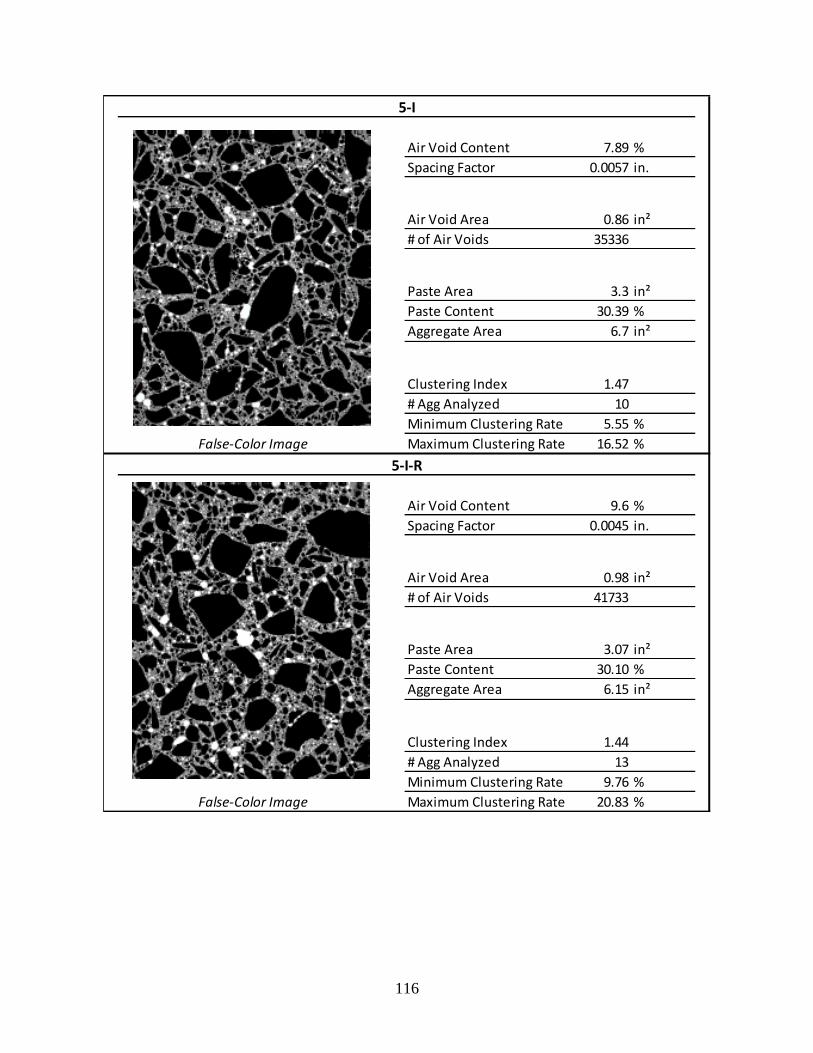
116
Air Void Content 7.89 %
Spacing Factor 0.0057 in.
Air Void Area 0.86 in²
# of Air Voids 35336
Paste Area 3.3 in²
Paste Content 30.39 %
Aggregate Area 6.7 in²
Clustering Index 1.47
# Agg Analyzed 10
Minimum Clustering Rate 5.55 %
False-Color Image Maximum Clustering Rate 16.52 %
Air Void Content 9.6 %
Spacing Factor 0.0045 in.
Air Void Area 0.98 in²
# of Air Voids 41733
Paste Area 3.07 in²
Paste Content 30.10 %
Aggregate Area 6.15 in²
Clustering Index 1.44
# Agg Analyzed 13
Minimum Clustering Rate 9.76 %
False-Color Image Maximum Clustering Rate 20.83 %
5-I
5-I-R
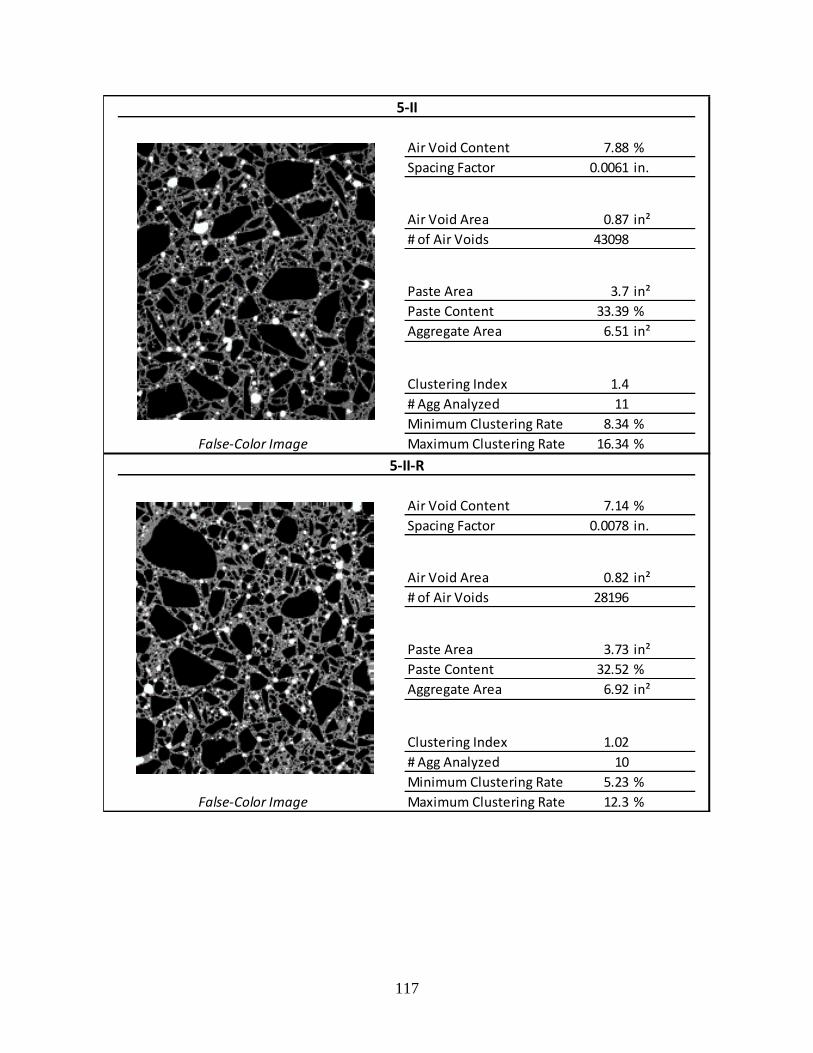
117
Air Void Content 7.88 %
Spacing Factor 0.0061 in.
Air Void Area 0.87 in²
# of Air Voids 43098
Paste Area 3.7 in²
Paste Content 33.39 %
Aggregate Area 6.51 in²
Clustering Index 1.4
# Agg Analyzed 11
Minimum Clustering Rate 8.34 %
False-Color Image Maximum Clustering Rate 16.34 %
Air Void Content 7.14 %
Spacing Factor 0.0078 in.
Air Void Area 0.82 in²
# of Air Voids 28196
Paste Area 3.73 in²
Paste Content 32.52 %
Aggregate Area 6.92 in²
Clustering Index 1.02
# Agg Analyzed 10
Minimum Clustering Rate 5.23 %
False-Color Image Maximum Clustering Rate 12.3 %
5-II-R
5-II
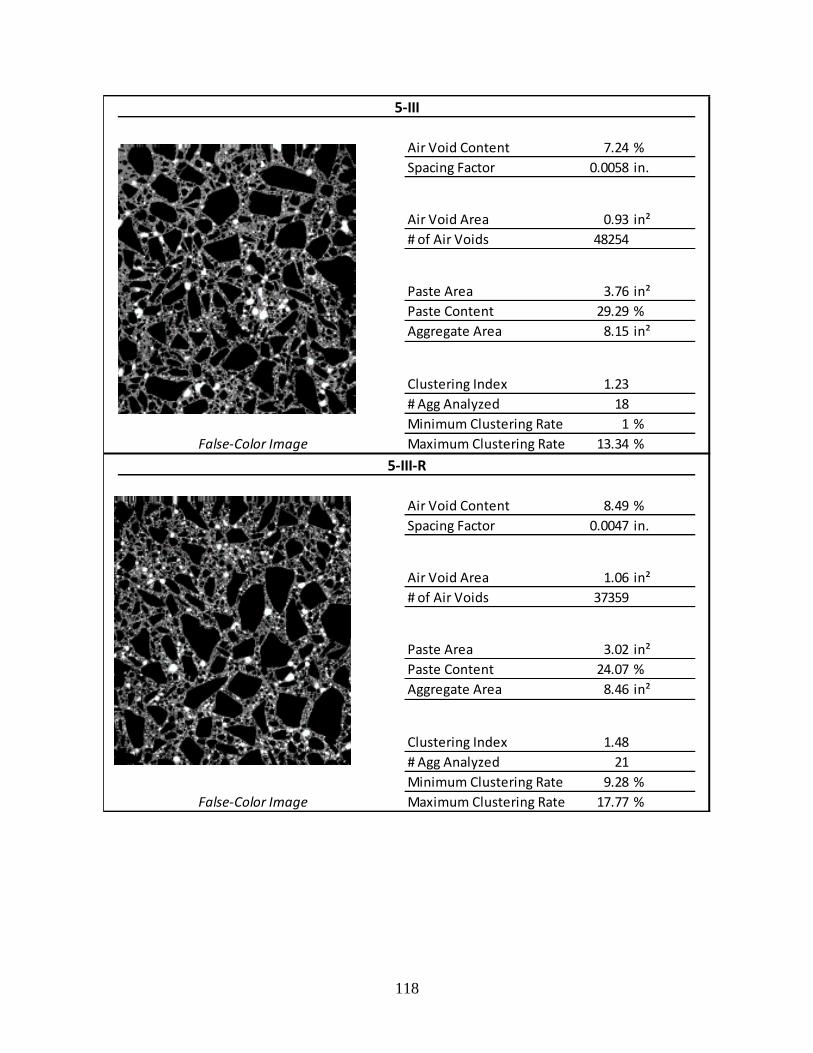
118
Air Void Content 7.24 %
Spacing Factor 0.0058 in.
Air Void Area 0.93 in²
# of Air Voids 48254
Paste Area 3.76 in²
Paste Content 29.29 %
Aggregate Area 8.15 in²
Clustering Index 1.23
# Agg Analyzed 18
Minimum Clustering Rate 1 %
False-Color Image Maximum Clustering Rate 13.34 %
Air Void Content 8.49 %
Spacing Factor 0.0047 in.
Air Void Area 1.06 in²
# of Air Voids 37359
Paste Area 3.02 in²
Paste Content 24.07 %
Aggregate Area 8.46 in²
Clustering Index 1.48
# Agg Analyzed 21
Minimum Clustering Rate 9.28 %
False-Color Image Maximum Clustering Rate 17.77 %
5-III
5-III-R
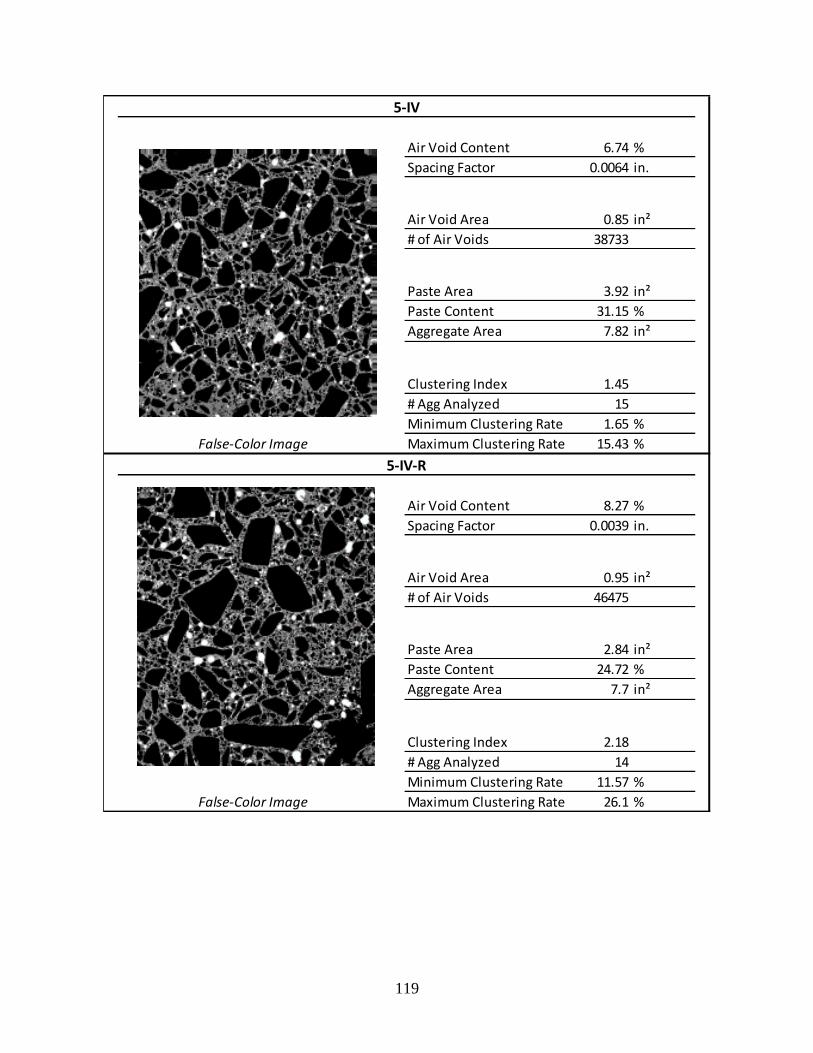
119
Air Void Content 6.74 %
Spacing Factor 0.0064 in.
Air Void Area 0.85 in²
# of Air Voids 38733
Paste Area 3.92 in²
Paste Content 31.15 %
Aggregate Area 7.82 in²
Clustering Index 1.45
# Agg Analyzed 15
Minimum Clustering Rate 1.65 %
False-Color Image Maximum Clustering Rate 15.43 %
Air Void Content 8.27 %
Spacing Factor 0.0039 in.
Air Void Area 0.95 in²
# of Air Voids 46475
Paste Area 2.84 in²
Paste Content 24.72 %
Aggregate Area 7.7 in²
Clustering Index 2.18
# Agg Analyzed 14
Minimum Clustering Rate 11.57 %
False-Color Image Maximum Clustering Rate 26.1 %
5-IV
5-IV-R
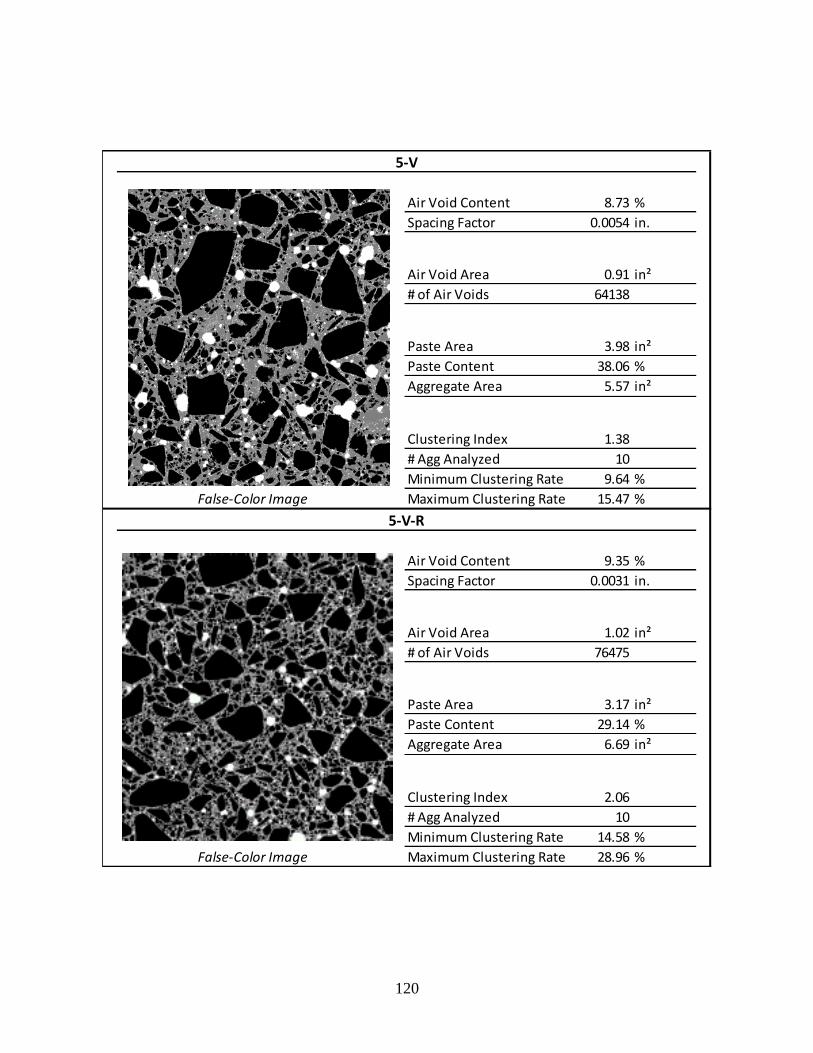
120
Air Void Content 8.73 %
Spacing Factor 0.0054 in.
Air Void Area 0.91 in²
# of Air Voids 64138
Paste Area 3.98 in²
Paste Content 38.06 %
Aggregate Area 5.57 in²
Clustering Index 1.38
# Agg Analyzed 10
Minimum Clustering Rate 9.64 %
False-Color Image Maximum Clustering Rate 15.47 %
Air Void Content 9.35 %
Spacing Factor 0.0031 in.
Air Void Area 1.02 in²
# of Air Voids 76475
Paste Area 3.17 in²
Paste Content 29.14 %
Aggregate Area 6.69 in²
Clustering Index 2.06
# Agg Analyzed 10
Minimum Clustering Rate 14.58 %
False-Color Image Maximum Clustering Rate 28.96 %
5-V
5-V-R

121
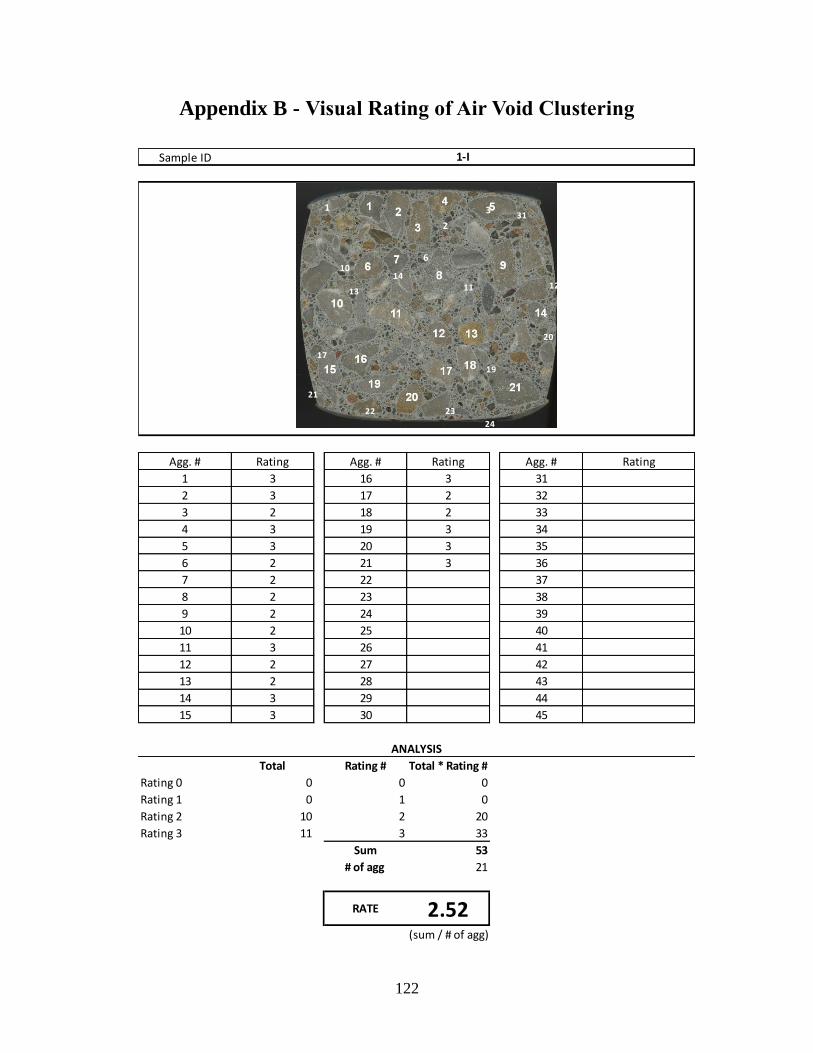
122
Appendix B - Visual Rating of Air Void Clustering
Sample ID
Agg. # Rating Agg. # Rating Agg. # Rating
1 3 16 3 31
2 3 17 2 32
3 2 18 2 33
4 3 19 3 34
5 3 20 3 35
6 2 21 3 36
7 2 22 37
8 2 23 38
9 2 24 39
10 2 25 40
11 3 26 41
12 2 27 42
13 2 28 43
14 3 29 44
15 3 30 45
Total Rating # Total * Rating #
Rating 0 0 0 0
Rating 1 0 1 0
Rating 2 10 2 20
Rating 3 11 3 33
Sum 53
# of agg 21
(sum / # of agg)
RATE 2.52
1-I
ANALYSIS
1
2
3
45
6
79
8 10
11 1213
14
15
16
17
19
20
21
22 2324 2526
33
3132
1
2
3
45
6
79
8 10
11 1213
14
15
16
17
19
20
21
22 23
242526
33
3132
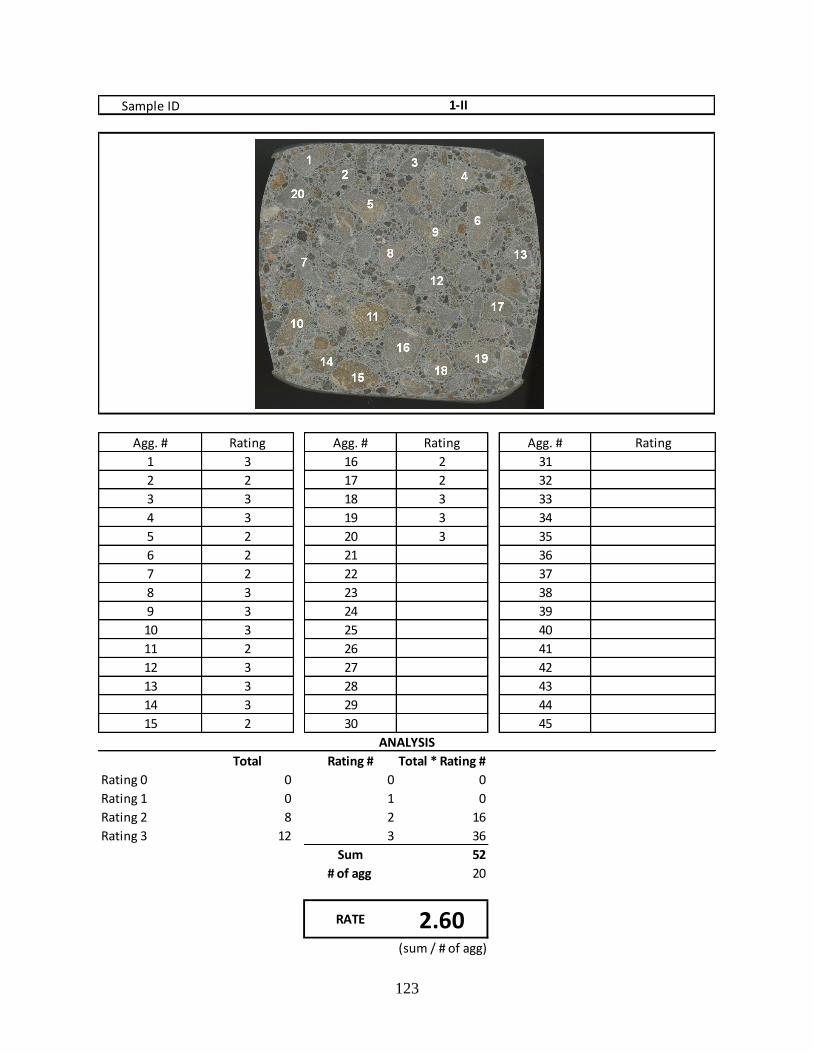
123
Sample ID
Agg. # Rating Agg. # Rating Agg. # Rating
1 3 16 2 31
2 2 17 2 32
3 3 18 3 33
4 3 19 3 34
5 2 20 3 35
6 2 21 36
7 2 22 37
8 3 23 38
9 3 24 39
10 3 25 40
11 2 26 41
12 3 27 42
13 3 28 43
14 3 29 44
15 2 30 45
Total Rating # Total * Rating #
Rating 0 0 0 0
Rating 1 0 1 0
Rating 2 8 2 16
Rating 3 12 3 36
Sum 52
# of agg 20
(sum / # of agg)
RATE 2.60
1-II
ANALYSIS
1
2
3
45
6
79
8 10
11 1213
14
15
16
17
19
20
21
22 23
242526
33
3132
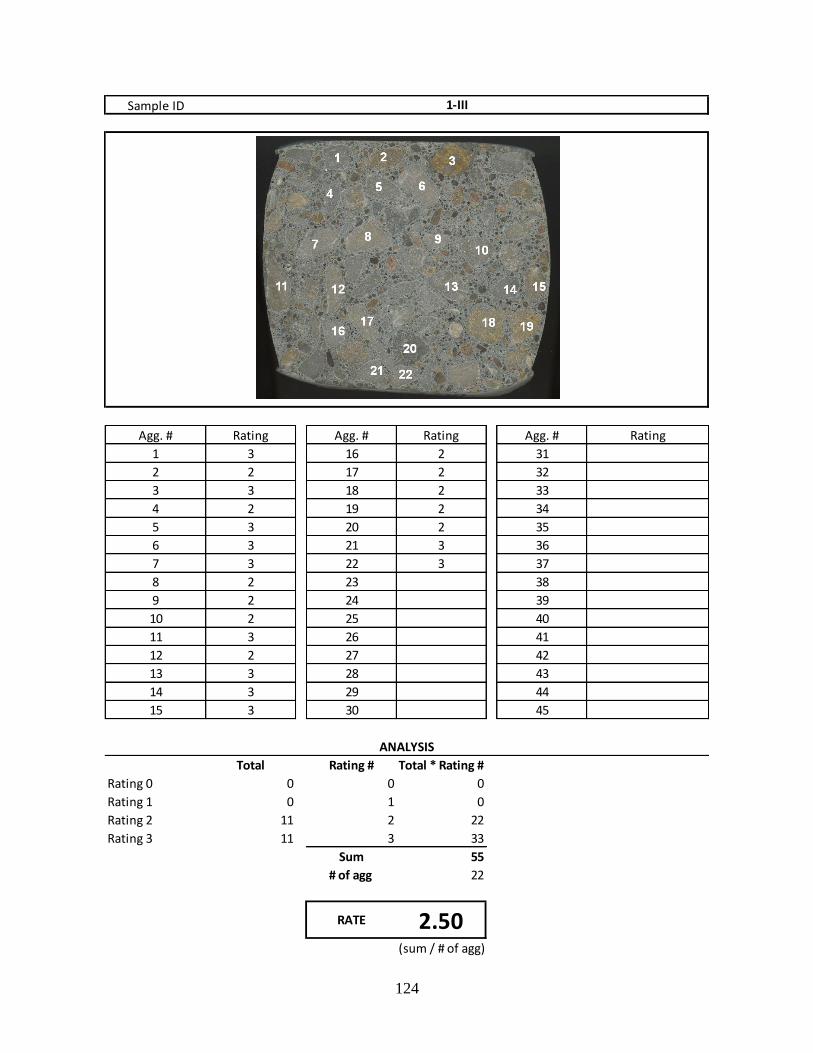
124
Sample ID
Agg. # Rating Agg. # Rating Agg. # Rating
1 3 16 2 31
2 2 17 2 32
3 3 18 2 33
4 2 19 2 34
5 3 20 2 35
6 3 21 3 36
7 3 22 3 37
8 2 23 38
9 2 24 39
10 2 25 40
11 3 26 41
12 2 27 42
13 3 28 43
14 3 29 44
15 3 30 45
Total Rating # Total * Rating #
Rating 0 0 0 0
Rating 1 0 1 0
Rating 2 11 2 22
Rating 3 11 3 33
Sum 55
# of agg 22
(sum / # of agg)
RATE 2.50
1-III
ANALYSIS
1
2
3
45
6
79
8 10
11 1213
14
15
16
17
19
20
21
22 23
242526
33
3132
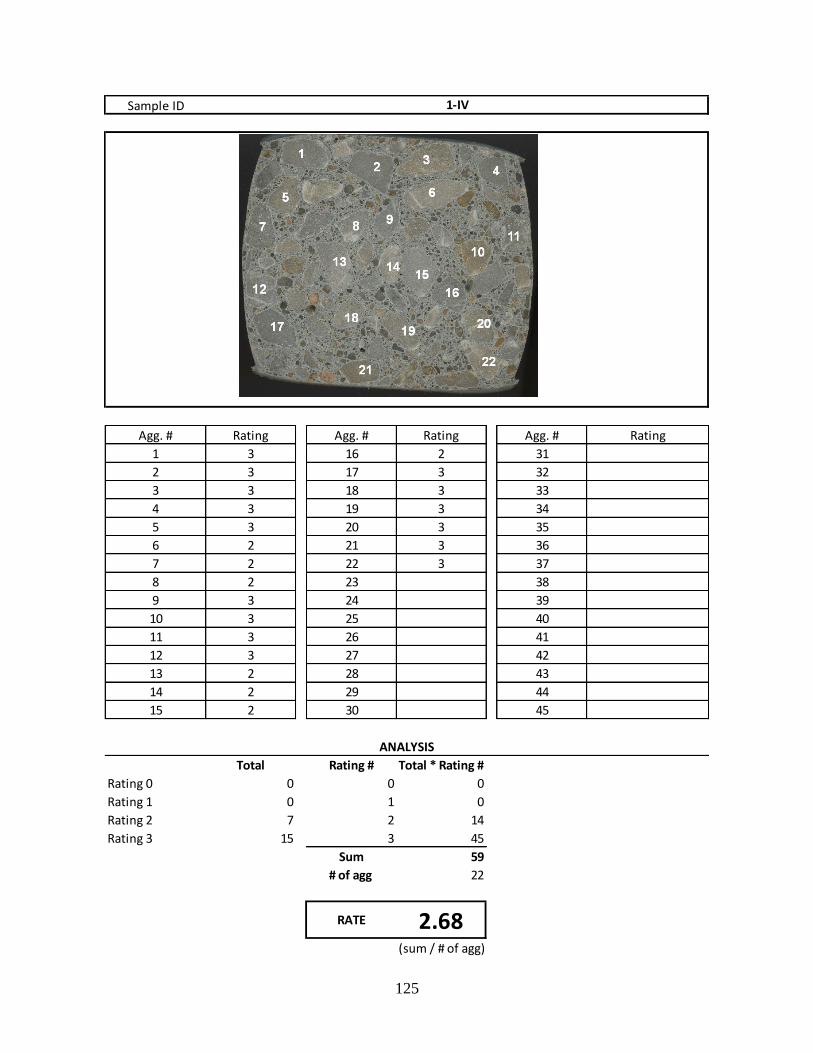
125
Sample ID
Agg. # Rating Agg. # Rating Agg. # Rating
1 3 16 2 31
2 3 17 3 32
3 3 18 3 33
4 3 19 3 34
5 3 20 3 35
6 2 21 3 36
7 2 22 3 37
8 2 23 38
9 3 24 39
10 3 25 40
11 3 26 41
12 3 27 42
13 2 28 43
14 2 29 44
15 2 30 45
Total Rating # Total * Rating #
Rating 0 0 0 0
Rating 1 0 1 0
Rating 2 7 2 14
Rating 3 15 3 45
Sum 59
# of agg 22
(sum / # of agg)
RATE 2.68
1-IV
ANALYSIS
1
2
3
45
6
79
8 10
11 1213
14
15
16
17
19
20
21
22 23
242526
33
3132

126
Sample ID
Agg. # Rating Agg. # Rating Agg. # Rating
1 3 16 3 31
2 2 17 3 32
3 3 18 3 33
4 3 19 3 34
5 3 20 3 35
6 2 21 3 36
7 2 22 37
8 3 23 38
9 2 24 39
10 3 25 40
11 3 26 41
12 2 27 42
13 3 28 43
14 2 29 44
15 3 30 45
Total Rating # Total * Rating #
Rating 0 0 0 0
Rating 1 0 1 0
Rating 2 6 2 12
Rating 3 15 3 45
Sum 57
# of agg 21
(sum / # of agg)
RATE 2.71
1-V
ANALYSIS
1
2
3
45
6
79
8 10
11 1213
14
15
16
17
19
20
21
22 23
242526
33
3132
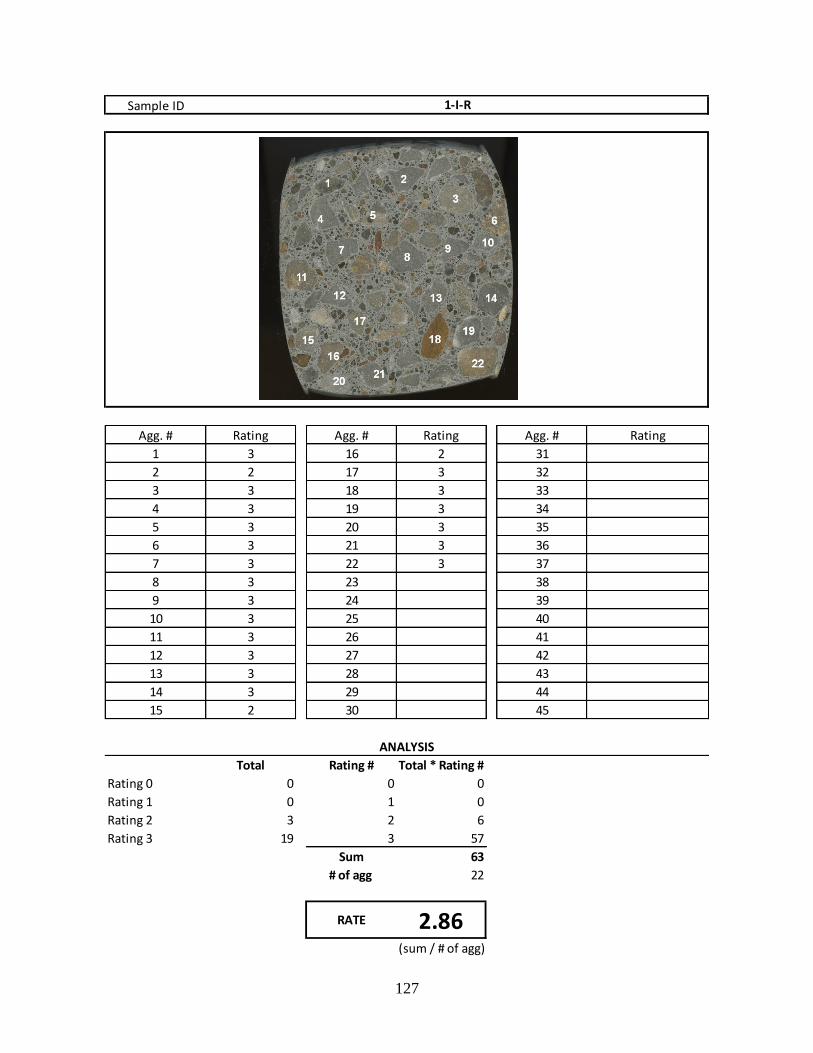
127
Sample ID
Agg. # Rating Agg. # Rating Agg. # Rating
1 3 16 2 31
2 2 17 3 32
3 3 18 3 33
4 3 19 3 34
5 3 20 3 35
6 3 21 3 36
7 3 22 3 37
8 3 23 38
9 3 24 39
10 3 25 40
11 3 26 41
12 3 27 42
13 3 28 43
14 3 29 44
15 2 30 45
Total Rating # Total * Rating #
Rating 0 0 0 0
Rating 1 0 1 0
Rating 2 3 2 6
Rating 3 19 3 57
Sum 63
# of agg 22
(sum / # of agg)
RATE 2.86
1-I-R
ANALYSIS
1
2
3
45
6
79
8 10
11 1213
14
15
16
17
19
20
21
22 23
242526
33
3132
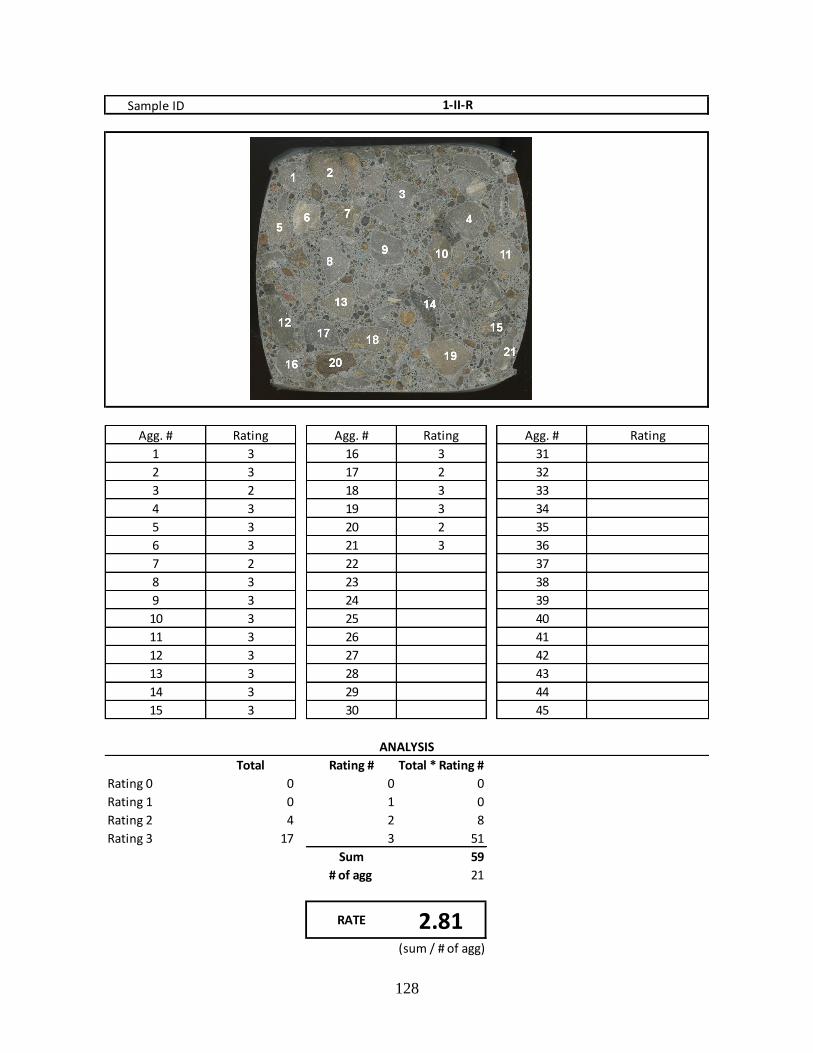
128
Sample ID
Agg. # Rating Agg. # Rating Agg. # Rating
1 3 16 3 31
2 3 17 2 32
3 2 18 3 33
4 3 19 3 34
5 3 20 2 35
6 3 21 3 36
7 2 22 37
8 3 23 38
9 3 24 39
10 3 25 40
11 3 26 41
12 3 27 42
13 3 28 43
14 3 29 44
15 3 30 45
Total Rating # Total * Rating #
Rating 0 0 0 0
Rating 1 0 1 0
Rating 2 4 2 8
Rating 3 17 3 51
Sum 59
# of agg 21
(sum / # of agg)
RATE 2.81
1-II-R
ANALYSIS
1
2
3
45
6
79
8 10
11 1213
14
15
16
17
19
20
21
22 23
242526
33
3132
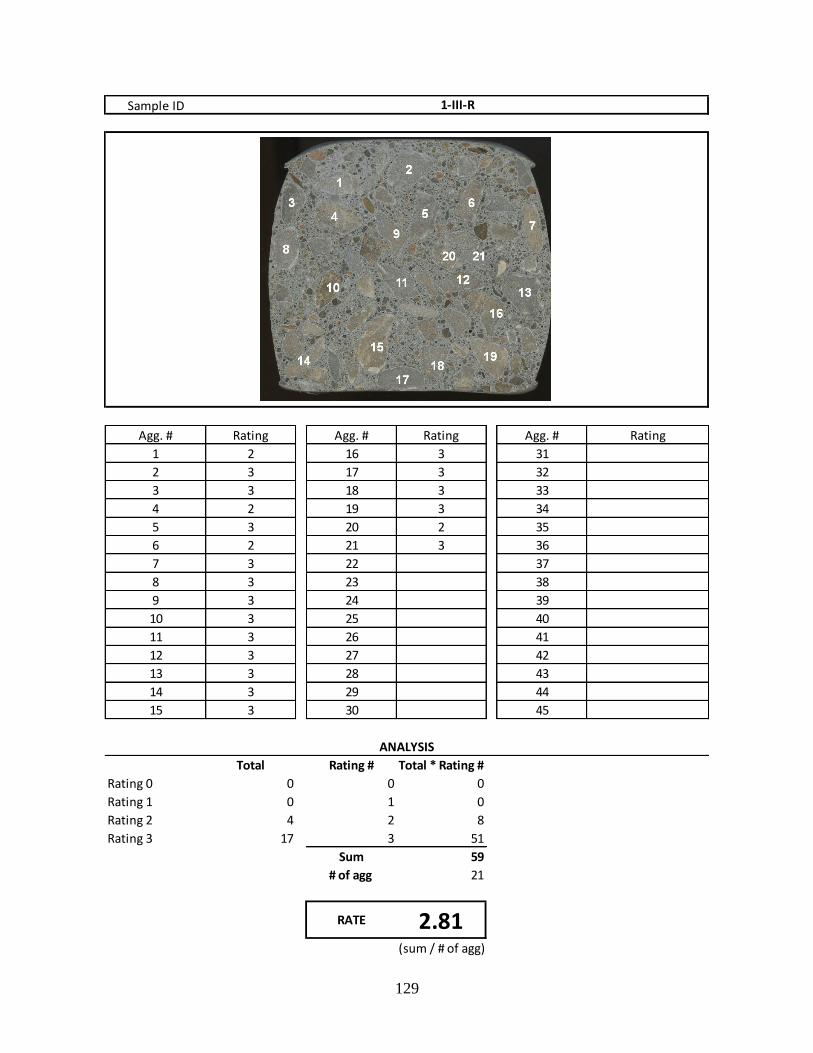
129
Sample ID
Agg. # Rating Agg. # Rating Agg. # Rating
1 2 16 3 31
2 3 17 3 32
3 3 18 3 33
4 2 19 3 34
5 3 20 2 35
6 2 21 3 36
7 3 22 37
8 3 23 38
9 3 24 39
10 3 25 40
11 3 26 41
12 3 27 42
13 3 28 43
14 3 29 44
15 3 30 45
Total Rating # Total * Rating #
Rating 0 0 0 0
Rating 1 0 1 0
Rating 2 4 2 8
Rating 3 17 3 51
Sum 59
# of agg 21
(sum / # of agg)
RATE 2.81
1-III-R
ANALYSIS
1
2
3
45
6
79
8 10
11 1213
14
15
16
17
19
20
21
22 23
242526
33
3132

130
Sample ID
Agg. # Rating Agg. # Rating Agg. # Rating
1 3 16 2 31
2 3 17 3 32
3 3 18 3 33
4 2 19 3 34
5 3 20 3 35
6 3 21 2 36
7 3 22 3 37
8 3 23 38
9 3 24 39
10 3 25 40
11 3 26 41
12 3 27 42
13 3 28 43
14 3 29 44
15 2 30 45
Total Rating # Total * Rating #
Rating 0 0 0 0
Rating 1 0 1 0
Rating 2 4 2 8
Rating 3 18 3 54
Sum 62
# of agg 22
(sum / # of agg)
RATE 2.82
1-IV-R
ANALYSIS
1
2
3
45
6
79
8 10
11 1213
14
15
16
17
19
20
21
22 23
242526
33
3132
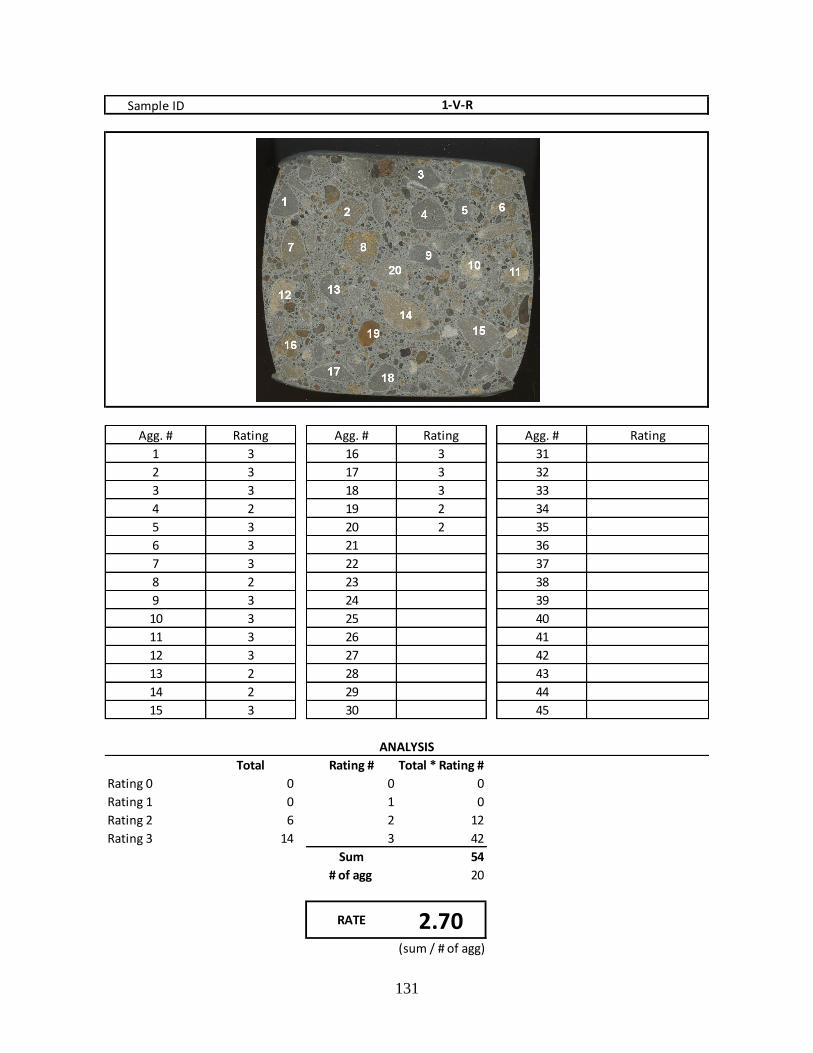
131
Sample ID
Agg. # Rating Agg. # Rating Agg. # Rating
1 3 16 3 31
2 3 17 3 32
3 3 18 3 33
4 2 19 2 34
5 3 20 2 35
6 3 21 36
7 3 22 37
8 2 23 38
9 3 24 39
10 3 25 40
11 3 26 41
12 3 27 42
13 2 28 43
14 2 29 44
15 3 30 45
Total Rating # Total * Rating #
Rating 0 0 0 0
Rating 1 0 1 0
Rating 2 6 2 12
Rating 3 14 3 42
Sum 54
# of agg 20
(sum / # of agg)
1-V-R
ANALYSIS
RATE 2.70
1
2
3
45
6
79
8 10
11 1213
14
15
16
17
19
20
21
22 23
242526
33
3132
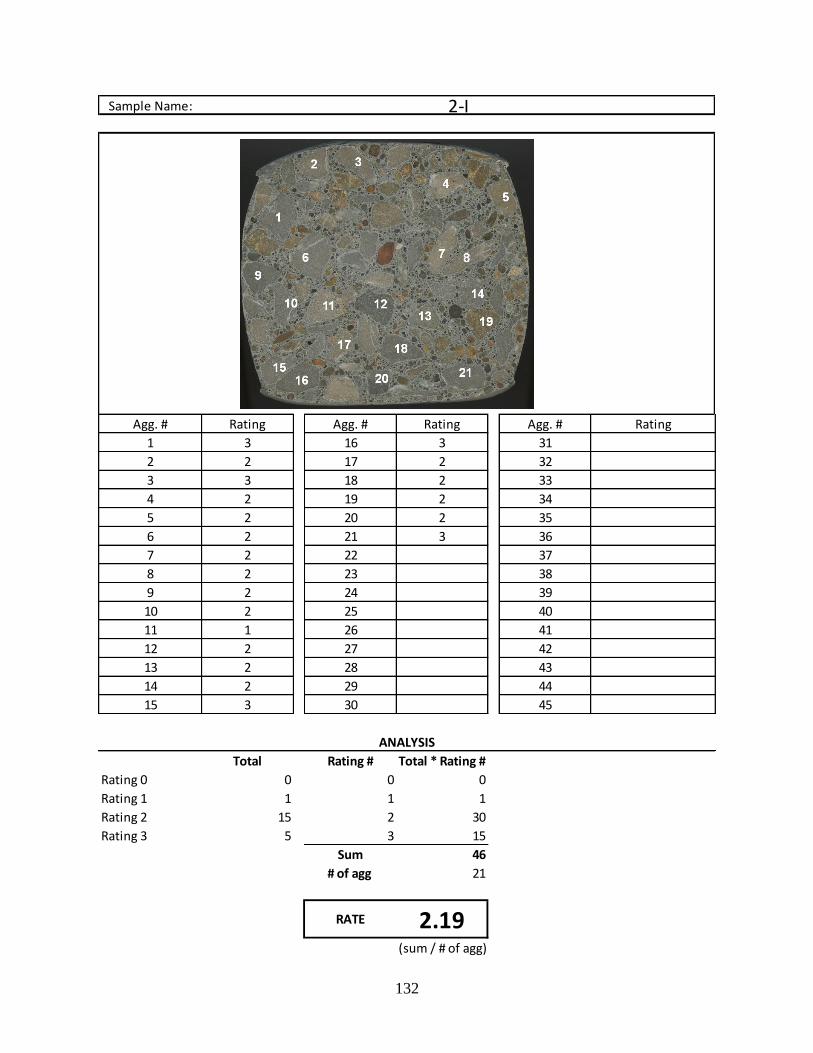
132
Sample Name:
Agg. # Rating Agg. # Rating Agg. # Rating
1 3 16 3 31
2 2 17 2 32
3 3 18 2 33
4 2 19 2 34
5 2 20 2 35
6 2 21 3 36
7 2 22 37
8 2 23 38
9 2 24 39
10 2 25 40
11 1 26 41
12 2 27 42
13 2 28 43
14 2 29 44
15 3 30 45
Total Rating # Total * Rating #
Rating 0 0 0 0
Rating 1 1 1 1
Rating 2 15 2 30
Rating 3 5 3 15
Sum 46
# of agg 21
(sum / # of agg)
RATE 2.19
2-I
ANALYSIS
1
2
3
45
6
79
8 10
11 1213
14
15
16
17
19
20
21
22 23
242526
33
3132
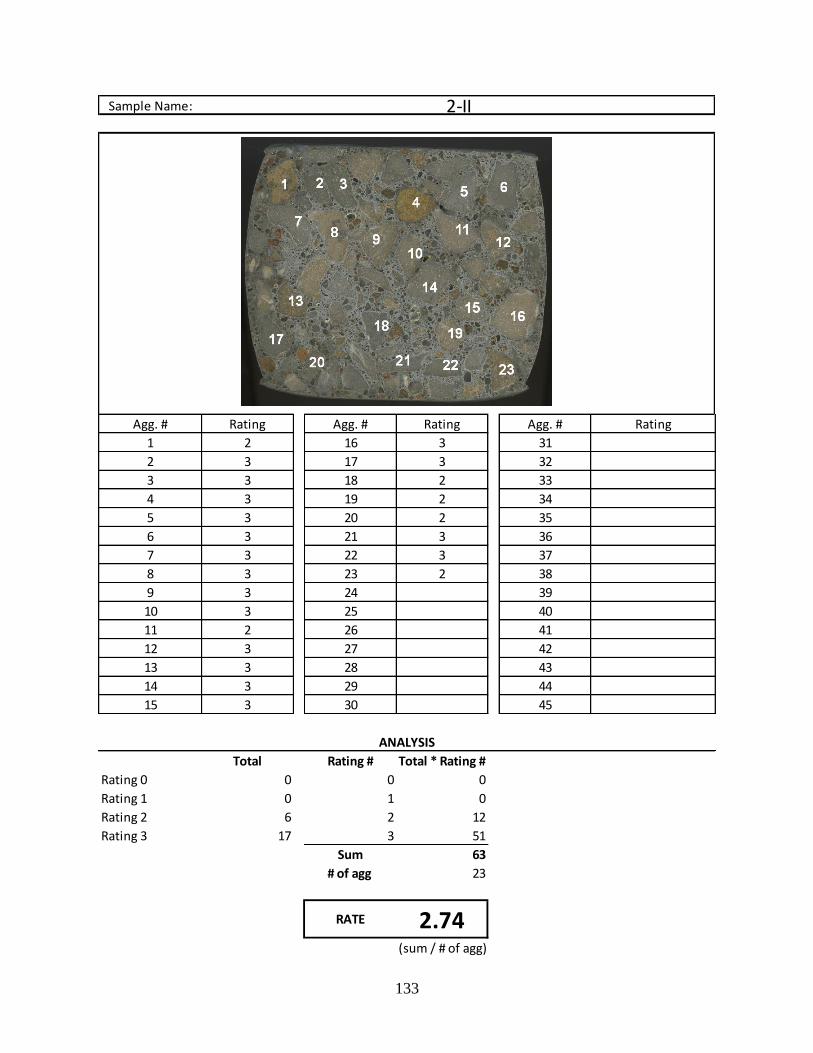
133
Sample Name:
Agg. # Rating Agg. # Rating Agg. # Rating
1 2 16 3 31
2 3 17 3 32
3 3 18 2 33
4 3 19 2 34
5 3 20 2 35
6 3 21 3 36
7 3 22 3 37
8 3 23 2 38
9 3 24 39
10 3 25 40
11 2 26 41
12 3 27 42
13 3 28 43
14 3 29 44
15 3 30 45
Total Rating # Total * Rating #
Rating 0 0 0 0
Rating 1 0 1 0
Rating 2 6 2 12
Rating 3 17 3 51
Sum 63
# of agg 23
(sum / # of agg)
RATE 2.74
2-II
ANALYSIS
1
2
3
45
6
79
8 10
11 1213
14
15
16
17
19
20
21
22 23
242526
33
3132
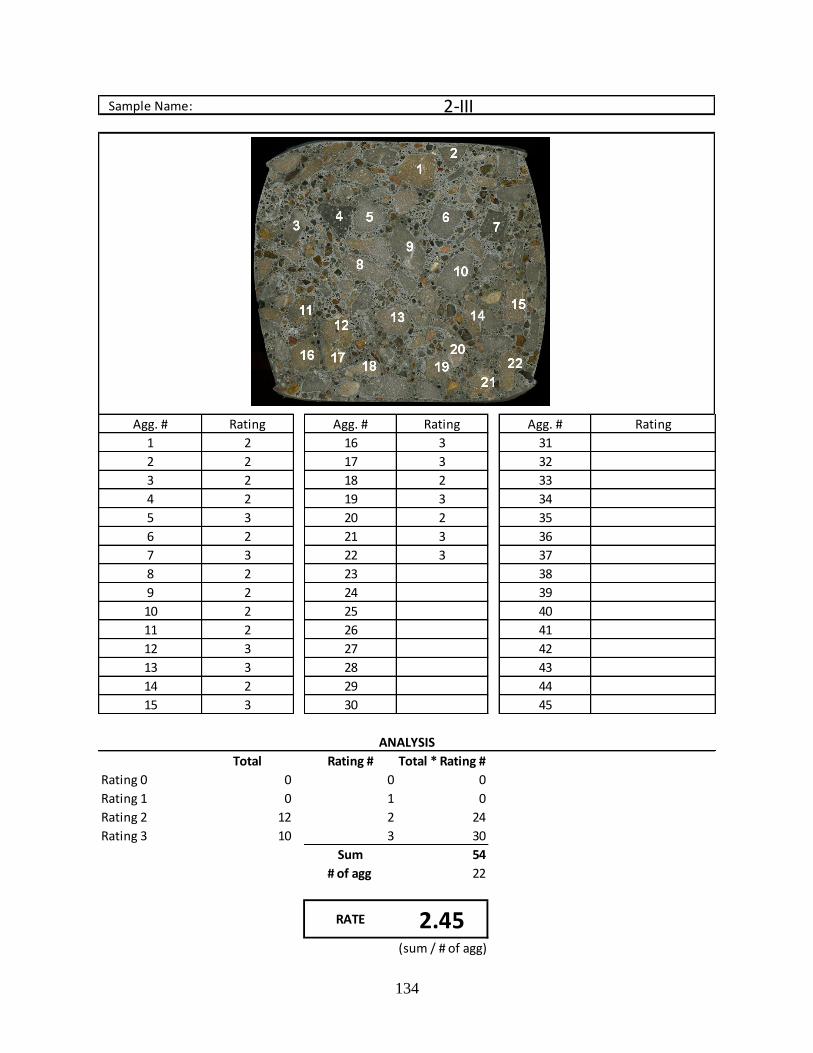
134
Sample Name:
Agg. # Rating Agg. # Rating Agg. # Rating
1 2 16 3 31
2 2 17 3 32
3 2 18 2 33
4 2 19 3 34
5 3 20 2 35
6 2 21 3 36
7 3 22 3 37
8 2 23 38
9 2 24 39
10 2 25 40
11 2 26 41
12 3 27 42
13 3 28 43
14 2 29 44
15 3 30 45
Total Rating # Total * Rating #
Rating 0 0 0 0
Rating 1 0 1 0
Rating 2 12 2 24
Rating 3 10 3 30
Sum 54
# of agg 22
(sum / # of agg)
RATE 2.45
2-III
ANALYSIS
1
2
3
45
6
79
8 10
11 1213
14
15
16
17
19
20
21
22 23
242526
33
3132
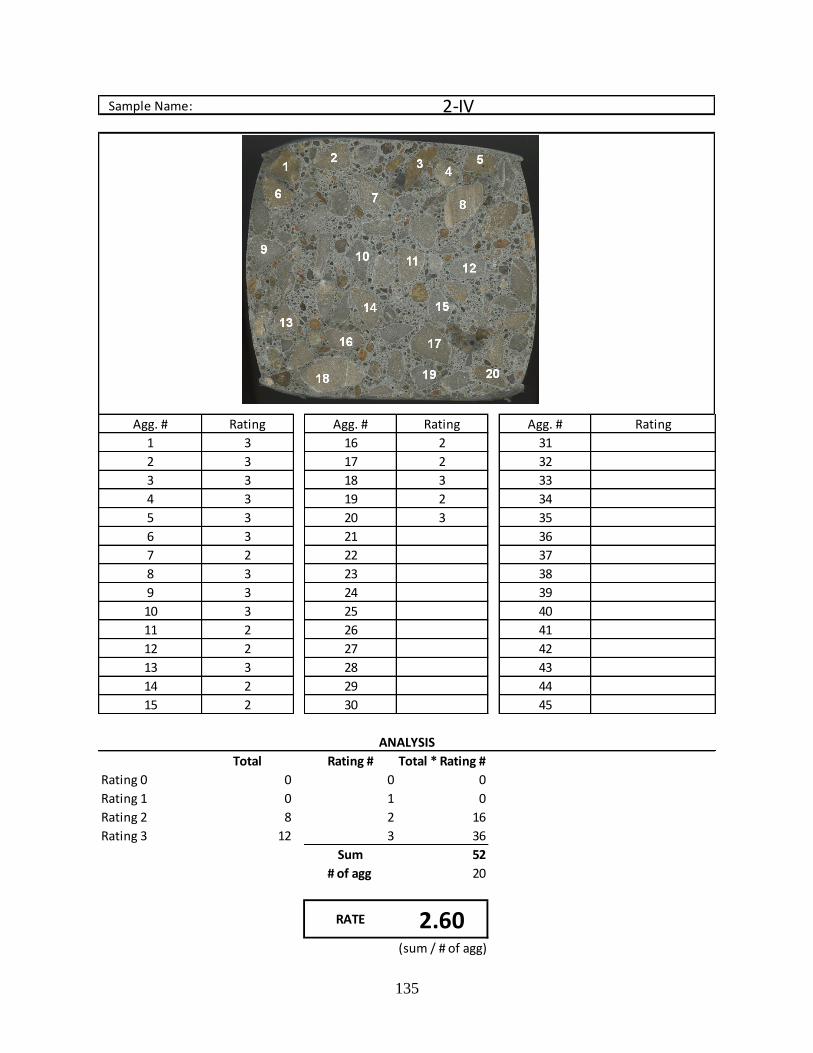
135
Sample Name:
Agg. # Rating Agg. # Rating Agg. # Rating
1 3 16 2 31
2 3 17 2 32
3 3 18 3 33
4 3 19 2 34
5 3 20 3 35
6 3 21 36
7 2 22 37
8 3 23 38
9 3 24 39
10 3 25 40
11 2 26 41
12 2 27 42
13 3 28 43
14 2 29 44
15 2 30 45
Total Rating # Total * Rating #
Rating 0 0 0 0
Rating 1 0 1 0
Rating 2 8 2 16
Rating 3 12 3 36
Sum 52
# of agg 20
(sum / # of agg)
RATE 2.60
2-IV
ANALYSIS
1
2
3
45
6
79
8 10
11 1213
14
15
16
17
19
20
21
22 23
242526
33
3132
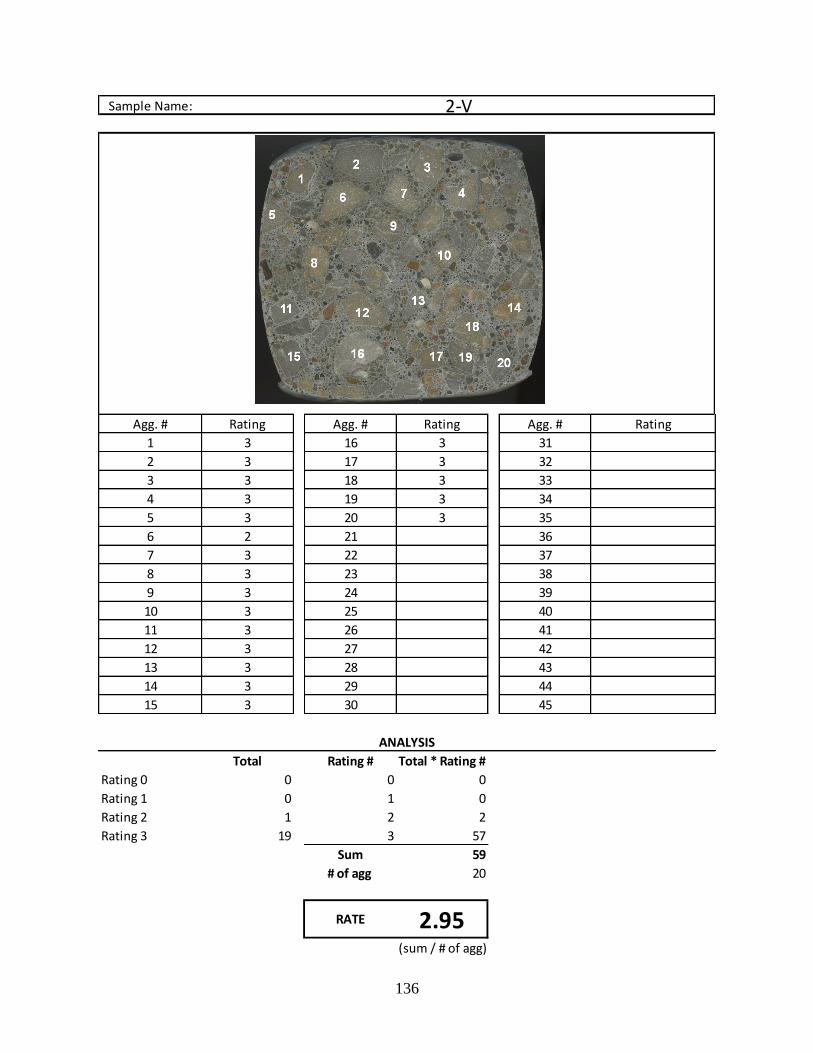
136
Sample Name:
Agg. # Rating Agg. # Rating Agg. # Rating
1 3 16 3 31
2 3 17 3 32
3 3 18 3 33
4 3 19 3 34
5 3 20 3 35
6 2 21 36
7 3 22 37
8 3 23 38
9 3 24 39
10 3 25 40
11 3 26 41
12 3 27 42
13 3 28 43
14 3 29 44
15 3 30 45
Total Rating # Total * Rating #
Rating 0 0 0 0
Rating 1 0 1 0
Rating 2 1 2 2
Rating 3 19 3 57
Sum 59
# of agg 20
(sum / # of agg)
RATE 2.95
2-V
ANALYSIS
1
2
3
45
6
79
8 10
11 1213
14
15
16
17
19
20
21
22 23
242526
33
3132
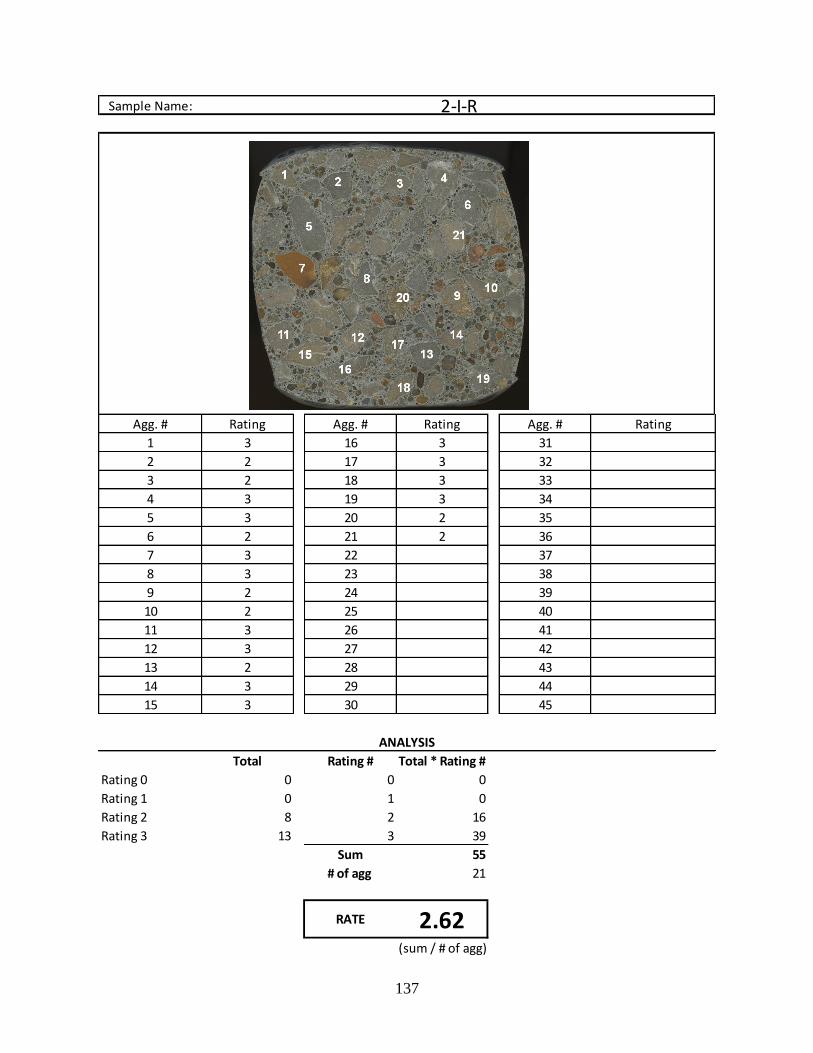
137
Sample Name:
Agg. # Rating Agg. # Rating Agg. # Rating
1 3 16 3 31
2 2 17 3 32
3 2 18 3 33
4 3 19 3 34
5 3 20 2 35
6 2 21 2 36
7 3 22 37
8 3 23 38
9 2 24 39
10 2 25 40
11 3 26 41
12 3 27 42
13 2 28 43
14 3 29 44
15 3 30 45
Total Rating # Total * Rating #
Rating 0 0 0 0
Rating 1 0 1 0
Rating 2 8 2 16
Rating 3 13 3 39
Sum 55
# of agg 21
(sum / # of agg)
RATE 2.62
2-I-R
ANALYSIS
1
2
3
45
6
79
8 10
11 1213
14
15
16
17
19
20
21
22 23
242526
33
3132
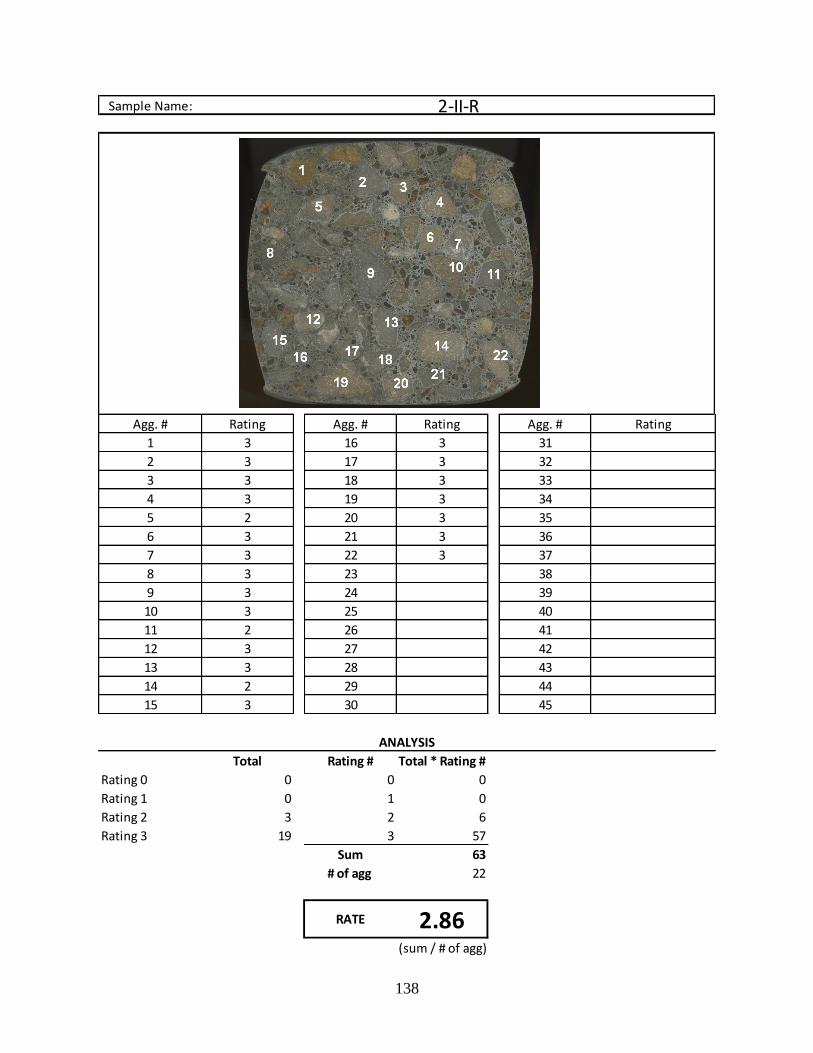
138
Sample Name:
Agg. # Rating Agg. # Rating Agg. # Rating
1 3 16 3 31
2 3 17 3 32
3 3 18 3 33
4 3 19 3 34
5 2 20 3 35
6 3 21 3 36
7 3 22 3 37
8 3 23 38
9 3 24 39
10 3 25 40
11 2 26 41
12 3 27 42
13 3 28 43
14 2 29 44
15 3 30 45
Total Rating # Total * Rating #
Rating 0 0 0 0
Rating 1 0 1 0
Rating 2 3 2 6
Rating 3 19 3 57
Sum 63
# of agg 22
(sum / # of agg)
RATE 2.86
2-II-R
ANALYSIS
1
2
3
45
6
79
8 10
11 1213
14
15
16
17
19
20
21
22 23
242526
33
3132
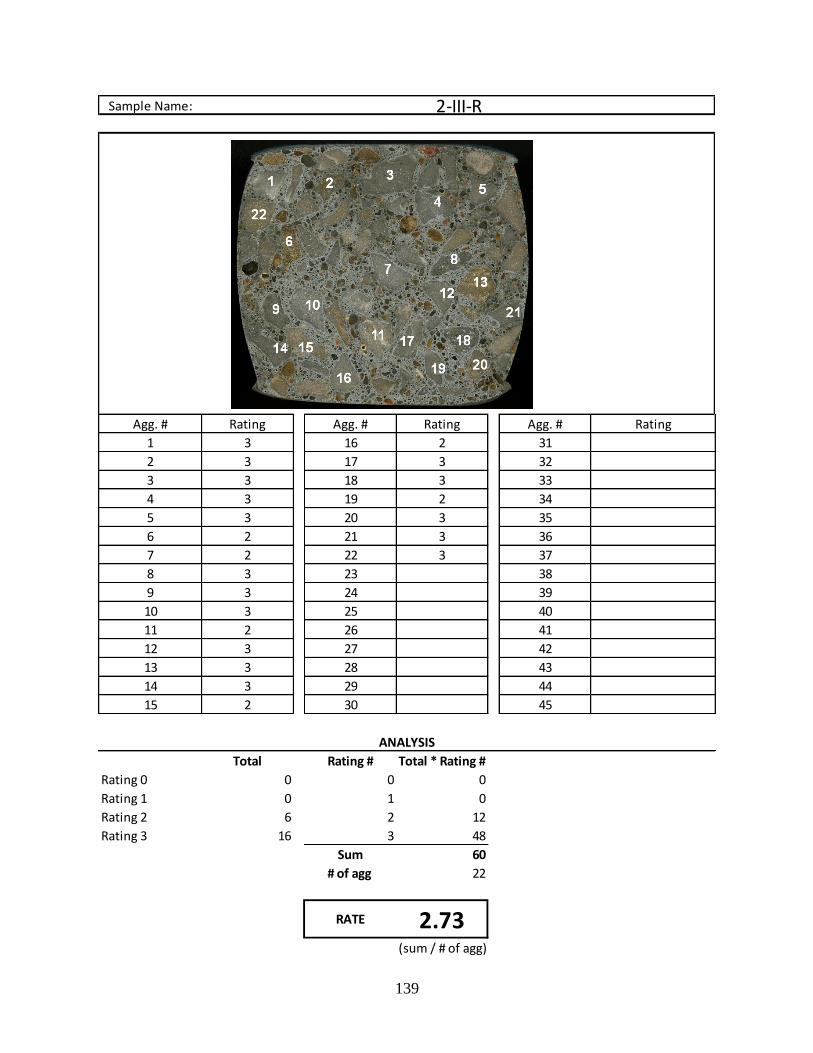
139
Sample Name:
Agg. # Rating Agg. # Rating Agg. # Rating
1 3 16 2 31
2 3 17 3 32
3 3 18 3 33
4 3 19 2 34
5 3 20 3 35
6 2 21 3 36
7 2 22 3 37
8 3 23 38
9 3 24 39
10 3 25 40
11 2 26 41
12 3 27 42
13 3 28 43
14 3 29 44
15 2 30 45
Total Rating # Total * Rating #
Rating 0 0 0 0
Rating 1 0 1 0
Rating 2 6 2 12
Rating 3 16 3 48
Sum 60
# of agg 22
(sum / # of agg)
RATE 2.73
2-III-R
ANALYSIS
1
2
3
45
6
79
8 10
11 1213
14
15
16
17
19
20
21
22 23
242526
33
3132
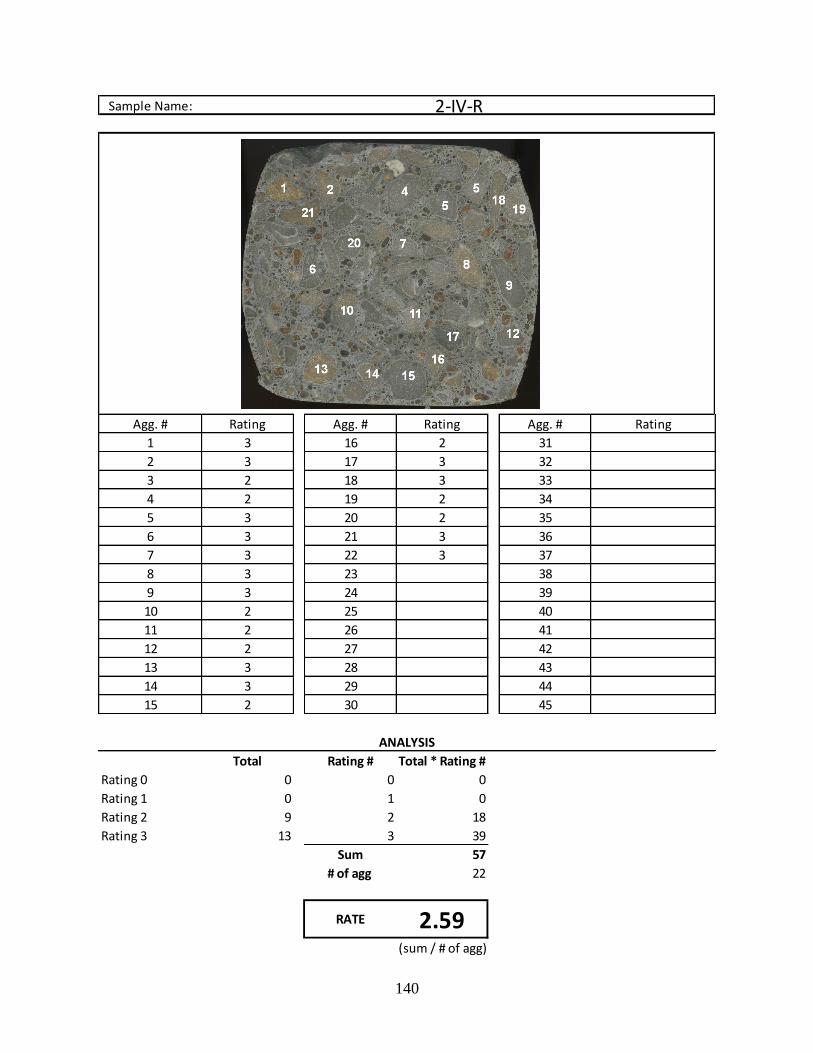
140
Sample Name:
Agg. # Rating Agg. # Rating Agg. # Rating
1 3 16 2 31
2 3 17 3 32
3 2 18 3 33
4 2 19 2 34
5 3 20 2 35
6 3 21 3 36
7 3 22 3 37
8 3 23 38
9 3 24 39
10 2 25 40
11 2 26 41
12 2 27 42
13 3 28 43
14 3 29 44
15 2 30 45
Total Rating # Total * Rating #
Rating 0 0 0 0
Rating 1 0 1 0
Rating 2 9 2 18
Rating 3 13 3 39
Sum 57
# of agg 22
(sum / # of agg)
RATE 2.59
2-IV-R
ANALYSIS
1
2
3
45
6
79
8 10
11 1213
14
15
16
17
19
20
21
22 23
242526
33
3132
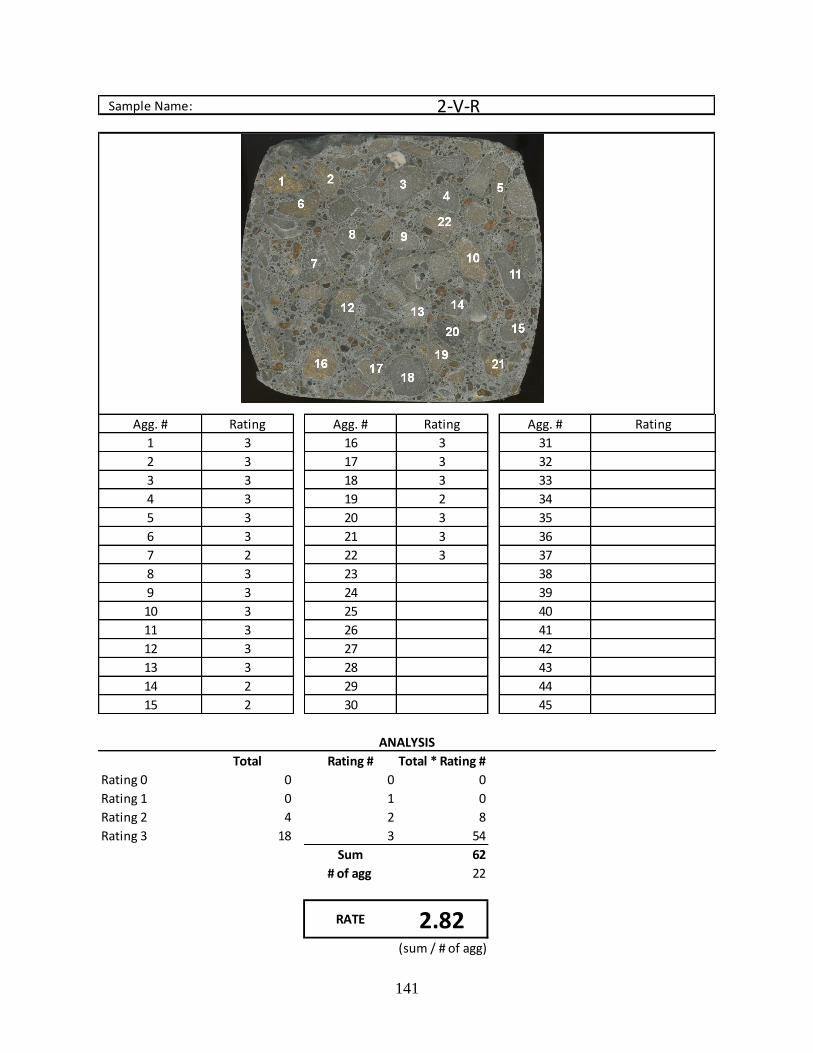
141
Sample Name:
Agg. # Rating Agg. # Rating Agg. # Rating
1 3 16 3 31
2 3 17 3 32
3 3 18 3 33
4 3 19 2 34
5 3 20 3 35
6 3 21 3 36
7 2 22 3 37
8 3 23 38
9 3 24 39
10 3 25 40
11 3 26 41
12 3 27 42
13 3 28 43
14 2 29 44
15 2 30 45
Total Rating # Total * Rating #
Rating 0 0 0 0
Rating 1 0 1 0
Rating 2 4 2 8
Rating 3 18 3 54
Sum 62
# of agg 22
(sum / # of agg)
RATE 2.82
2-V-R
ANALYSIS
1
2
3
45
6
79
8 10
11 1213
14
15
16
17
19
20
21
22 23
242526
33
3132

142
Sample Name:
Agg. # Rating Agg. # Rating Agg. # Rating
1 3 16 2 31
2 3 17 3 32
3 3 18 2 33
4 3 19 3 34
5 3 20 3 35
6 3 21 36
7 3 22 37
8 3 23 38
9 3 24 39
10 3 25 40
11 2 26 41
12 2 27 42
13 2 28 43
14 2 29 44
15 2 30 45
Total Rating # Total * Rating #
Rating 0 0 0 0
Rating 1 0 1 0
Rating 2 7 2 14
Rating 3 13 3 39
Sum 53
# of agg 20
(sum / # of agg)
RATE 2.65
3-I
ANALYSIS
1
2
3
45
6
79
8 10
11 1213
14
15
16
17
19
20
21
22 23
242526
28
29 30
33
3132
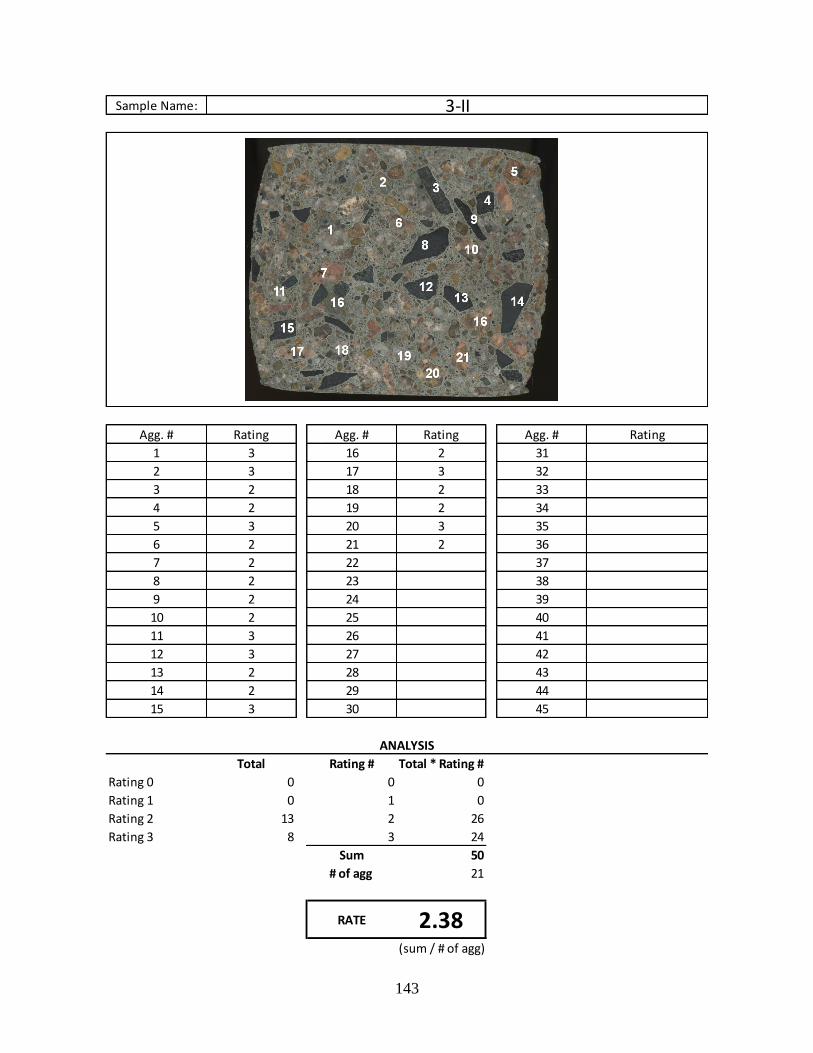
143
Sample Name:
Agg. # Rating Agg. # Rating Agg. # Rating
1 3 16 2 31
2 3 17 3 32
3 2 18 2 33
4 2 19 2 34
5 3 20 3 35
6 2 21 2 36
7 2 22 37
8 2 23 38
9 2 24 39
10 2 25 40
11 3 26 41
12 3 27 42
13 2 28 43
14 2 29 44
15 3 30 45
Total Rating # Total * Rating #
Rating 0 0 0 0
Rating 1 0 1 0
Rating 2 13 2 26
Rating 3 8 3 24
Sum 50
# of agg 21
(sum / # of agg)
RATE 2.38
3-II
ANALYSIS
1
2
3
45
6
79
8 10
11 1213
14
15
16
17
19
20
21
22 23
242526
28
29 30
33
3132
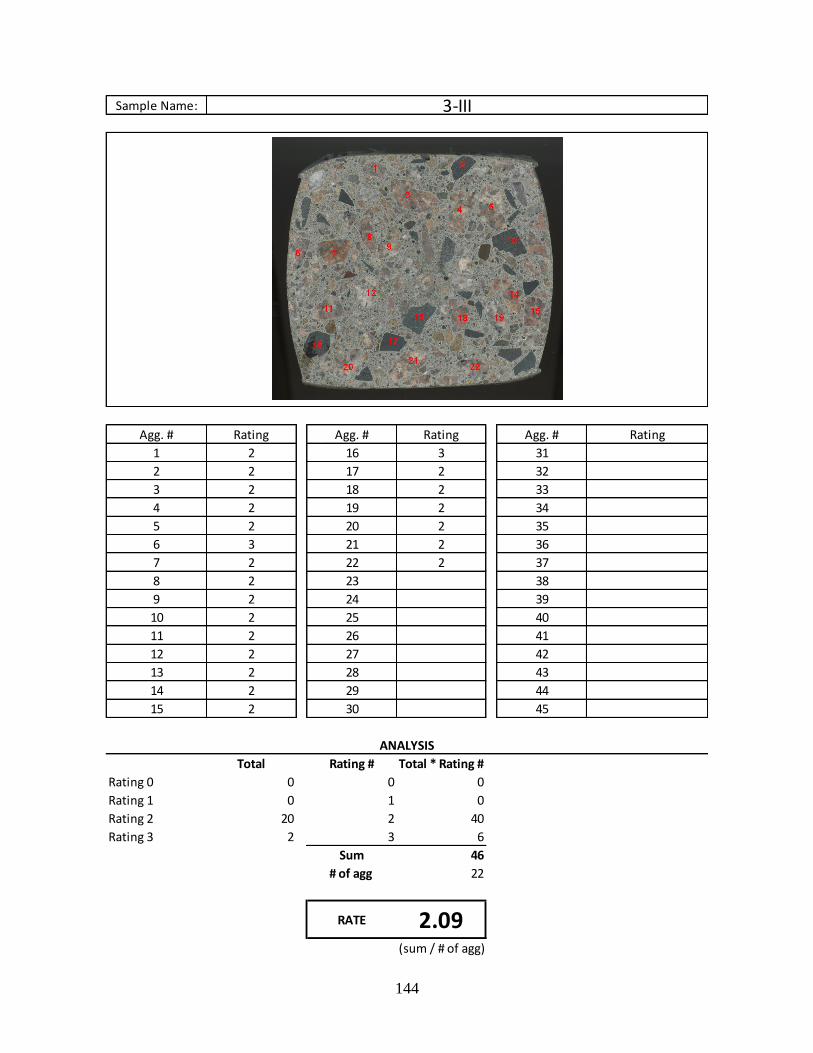
144
Sample Name:
Agg. # Rating Agg. # Rating Agg. # Rating
1 2 16 3 31
2 2 17 2 32
3 2 18 2 33
4 2 19 2 34
5 2 20 2 35
6 3 21 2 36
7 2 22 2 37
8 2 23 38
9 2 24 39
10 2 25 40
11 2 26 41
12 2 27 42
13 2 28 43
14 2 29 44
15 2 30 45
Total Rating # Total * Rating #
Rating 0 0 0 0
Rating 1 0 1 0
Rating 2 20 2 40
Rating 3 2 3 6
Sum 46
# of agg 22
(sum / # of agg)
RATE 2.09
3-III
ANALYSIS
1
2
3
45
6
79
8 10
11 1213
14
15
16
17
19
20
21
22 23
242526
28
29 30
33
3132
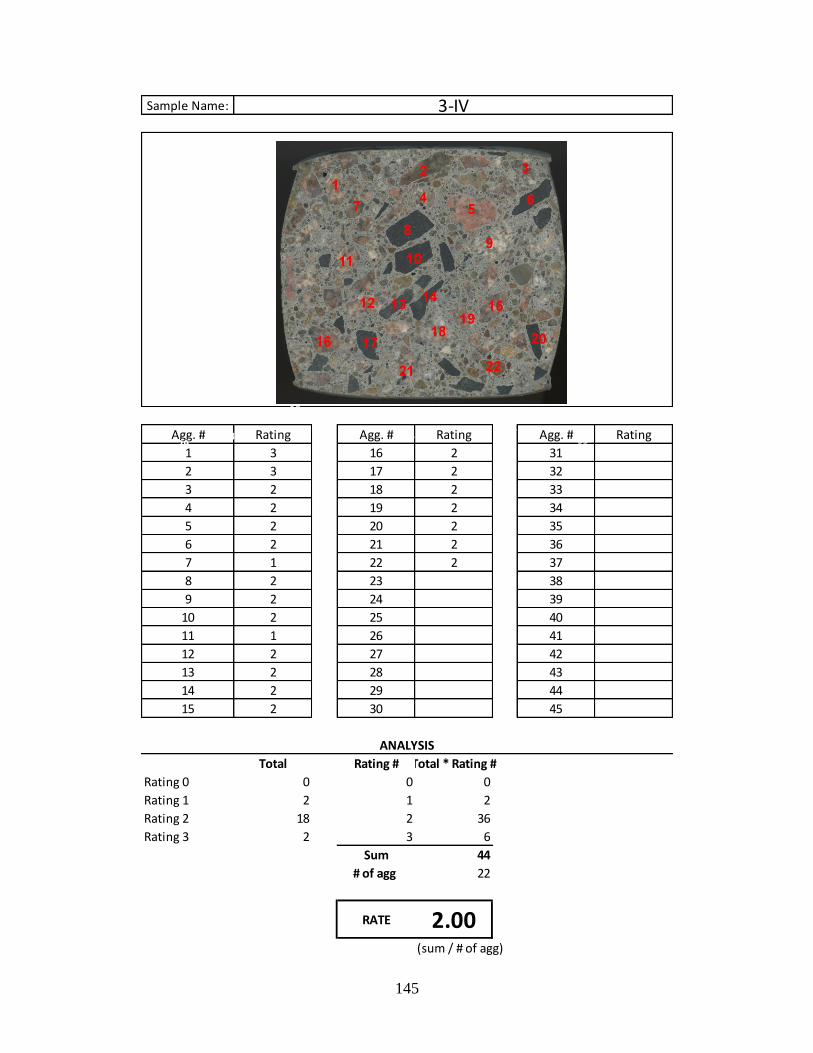
145
Sample Name:
Agg. # Rating Agg. # Rating Agg. # Rating
1 3 16 2 31
2 3 17 2 32
3 2 18 2 33
4 2 19 2 34
5 2 20 2 35
6 2 21 2 36
7 1 22 2 37
8 2 23 38
9 2 24 39
10 2 25 40
11 1 26 41
12 2 27 42
13 2 28 43
14 2 29 44
15 2 30 45
Total Rating # Total * Rating #
Rating 0 0 0 0
Rating 1 2 1 2
Rating 2 18 2 36
Rating 3 2 3 6
Sum 44
# of agg 22
(sum / # of agg)
RATE 2.00
3-IV
ANALYSIS
1
6
5
11
10
4
2
1615
12
13
14
28 26
2524
19
23
343533
27
3230
17
18
3
78
20 22
21
31
29
9
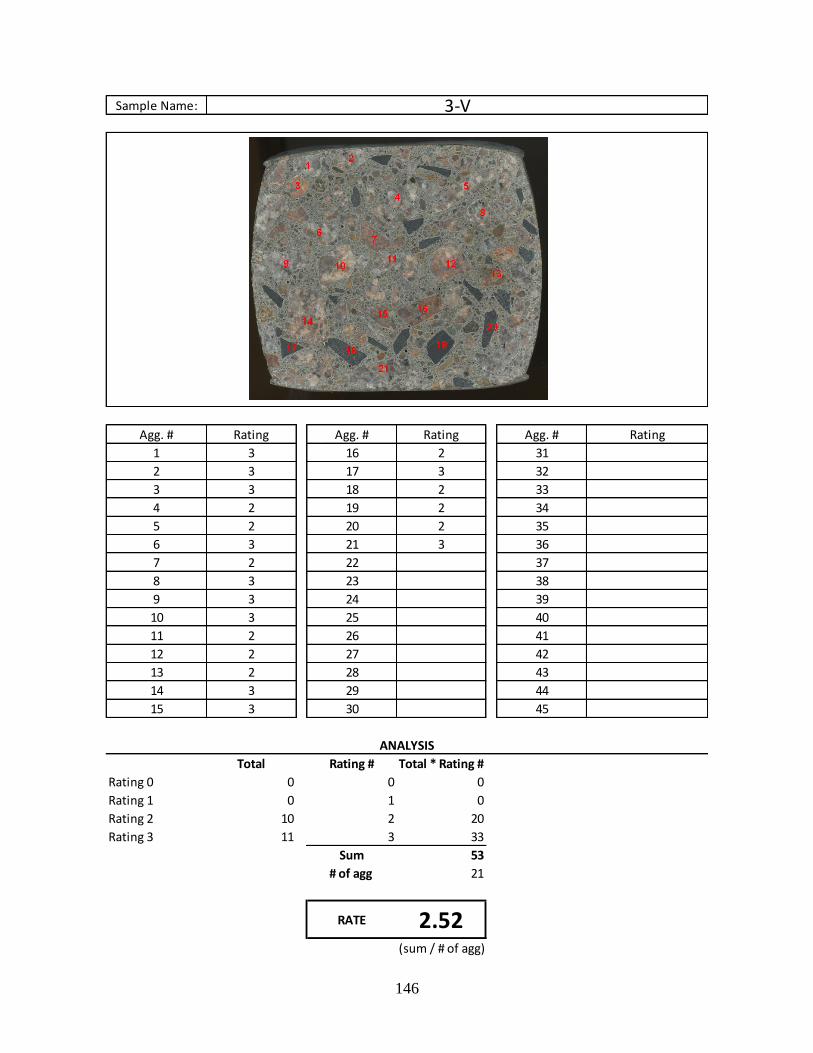
146
Sample Name:
Agg. # Rating Agg. # Rating Agg. # Rating
1 3 16 2 31
2 3 17 3 32
3 3 18 2 33
4 2 19 2 34
5 2 20 2 35
6 3 21 3 36
7 2 22 37
8 3 23 38
9 3 24 39
10 3 25 40
11 2 26 41
12 2 27 42
13 2 28 43
14 3 29 44
15 3 30 45
Total Rating # Total * Rating #
Rating 0 0 0 0
Rating 1 0 1 0
Rating 2 10 2 20
Rating 3 11 3 33
Sum 53
# of agg 21
(sum / # of agg)
RATE 2.52
3-V
ANALYSIS
1
2
3
45
6
79
8 10
11 1213
14
15
16
17
19
20
21
22 23
242526
28
29 30
33
3132
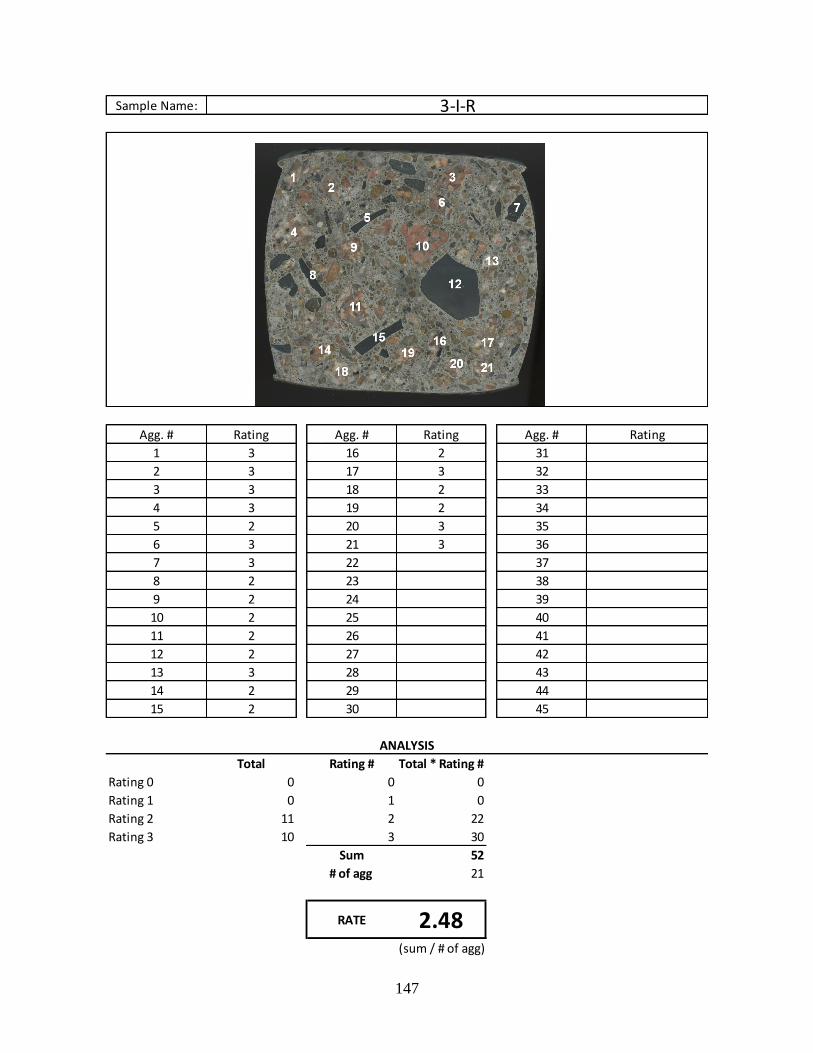
147
Sample Name:
Agg. # Rating Agg. # Rating Agg. # Rating
1 3 16 2 31
2 3 17 3 32
3 3 18 2 33
4 3 19 2 34
5 2 20 3 35
6 3 21 3 36
7 3 22 37
8 2 23 38
9 2 24 39
10 2 25 40
11 2 26 41
12 2 27 42
13 3 28 43
14 2 29 44
15 2 30 45
Total Rating # Total * Rating #
Rating 0 0 0 0
Rating 1 0 1 0
Rating 2 11 2 22
Rating 3 10 3 30
Sum 52
# of agg 21
(sum / # of agg)
RATE 2.48
3-I-R
ANALYSIS
1
2
3
45
6
79
8 10
11 1213
14
15
16
17
19
20
21
22 23
242526
28
29 30
33
3132
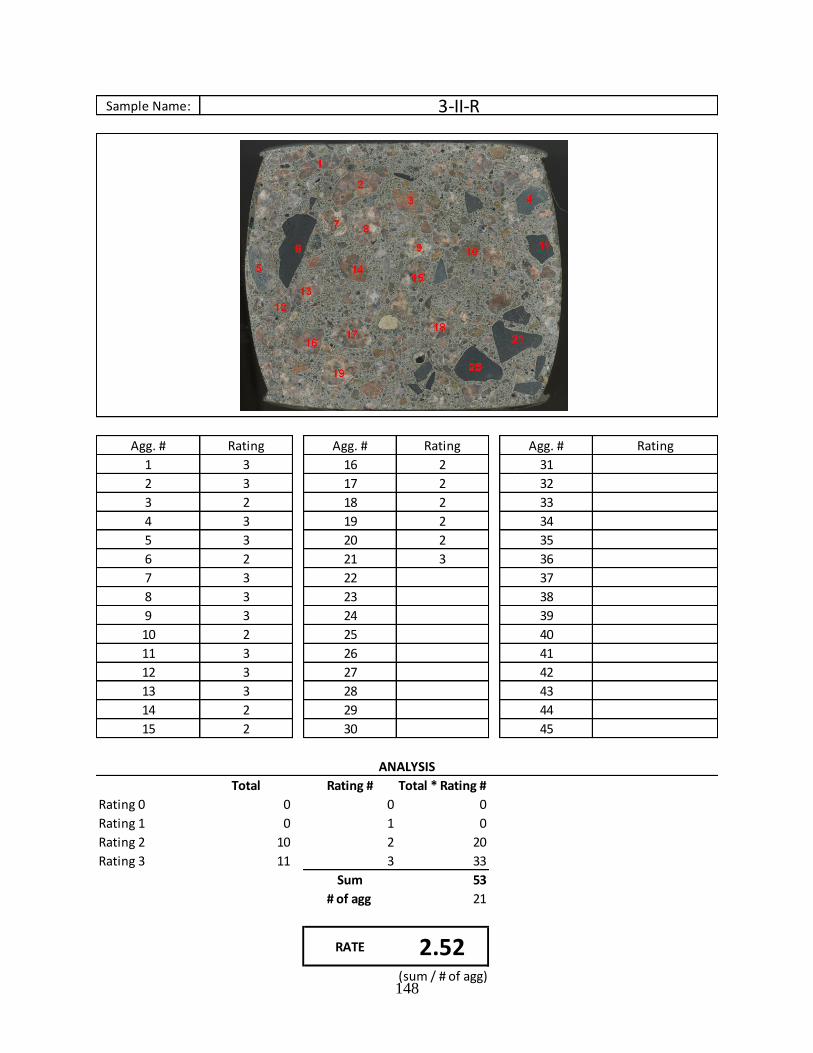
148
Sample Name:
Agg. # Rating Agg. # Rating Agg. # Rating
1 3 16 2 31
2 3 17 2 32
3 2 18 2 33
4 3 19 2 34
5 3 20 2 35
6 2 21 3 36
7 3 22 37
8 3 23 38
9 3 24 39
10 2 25 40
11 3 26 41
12 3 27 42
13 3 28 43
14 2 29 44
15 2 30 45
Total Rating # Total * Rating #
Rating 0 0 0 0
Rating 1 0 1 0
Rating 2 10 2 20
Rating 3 11 3 33
Sum 53
# of agg 21
(sum / # of agg)
RATE 2.52
3-II-R
ANALYSIS
1
2
3
45
6
79
8 10
11 1213
14
15
16
17
19
20
21
22 23
242526
28
29 30
33
3132
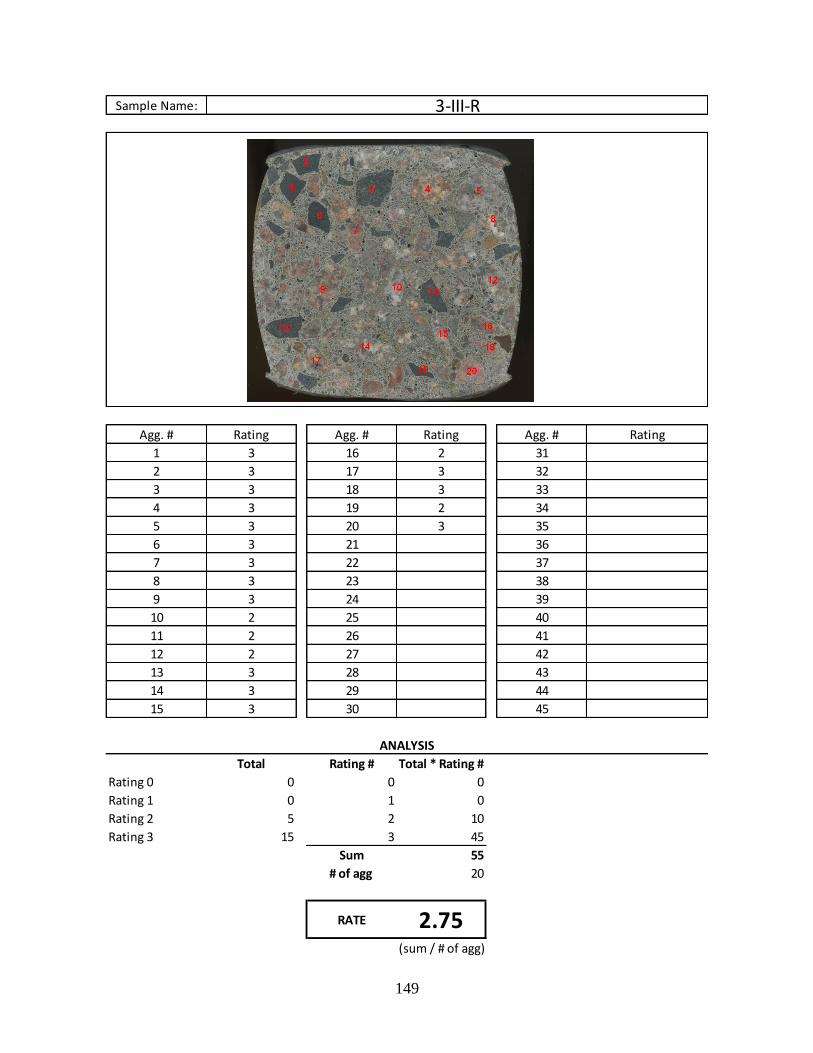
149
Sample Name:
Agg. # Rating Agg. # Rating Agg. # Rating
1 3 16 2 31
2 3 17 3 32
3 3 18 3 33
4 3 19 2 34
5 3 20 3 35
6 3 21 36
7 3 22 37
8 3 23 38
9 3 24 39
10 2 25 40
11 2 26 41
12 2 27 42
13 3 28 43
14 3 29 44
15 3 30 45
Total Rating # Total * Rating #
Rating 0 0 0 0
Rating 1 0 1 0
Rating 2 5 2 10
Rating 3 15 3 45
Sum 55
# of agg 20
(sum / # of agg)
RATE 2.75
3-III-R
ANALYSIS
1
2
3
45
6
79
8 10
11 1213
14
15
16
17
19
20
21
22 23
242526
28
29 30
33
3132
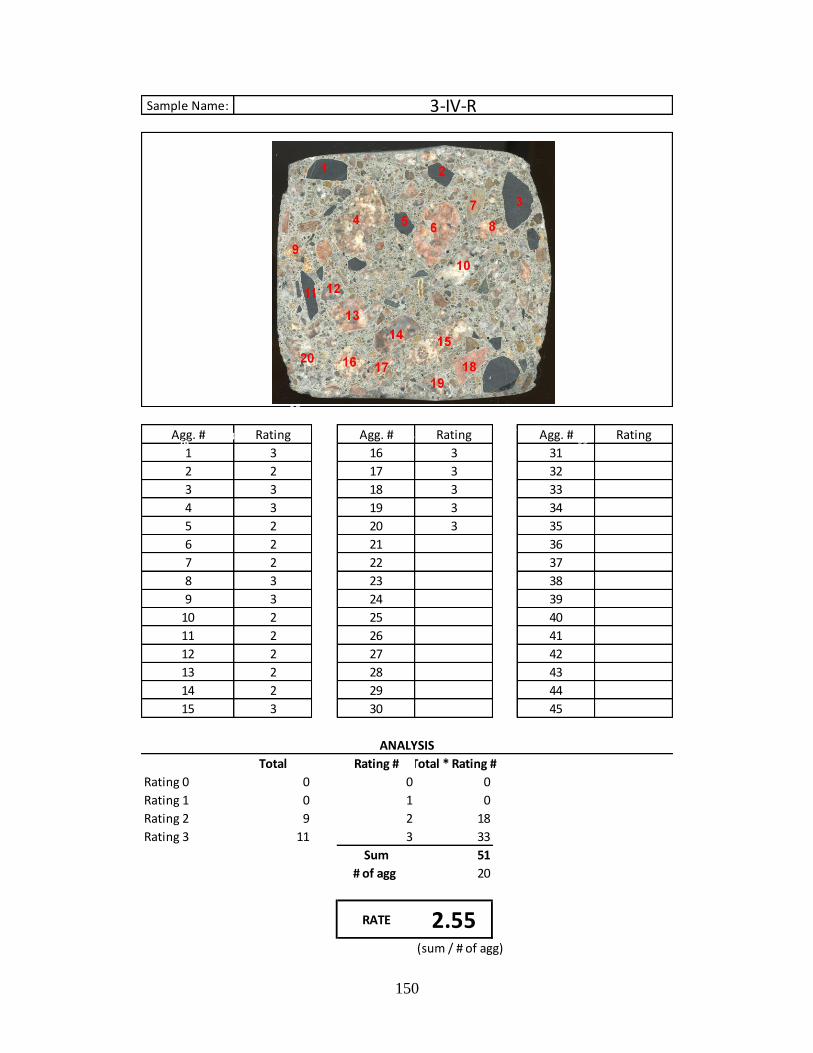
150
Sample Name:
Agg. # Rating Agg. # Rating Agg. # Rating
1 3 16 3 31
2 2 17 3 32
3 3 18 3 33
4 3 19 3 34
5 2 20 3 35
6 2 21 36
7 2 22 37
8 3 23 38
9 3 24 39
10 2 25 40
11 2 26 41
12 2 27 42
13 2 28 43
14 2 29 44
15 3 30 45
Total Rating # Total * Rating #
Rating 0 0 0 0
Rating 1 0 1 0
Rating 2 9 2 18
Rating 3 11 3 33
Sum 51
# of agg 20
(sum / # of agg)
RATE 2.55
3-IV-R
ANALYSIS
1
6
5
11
10
4
2
1615
12
13
14
28 26
2524
19
23
343533
27
3230
17
18
3
78
20 22
21
31
29
9
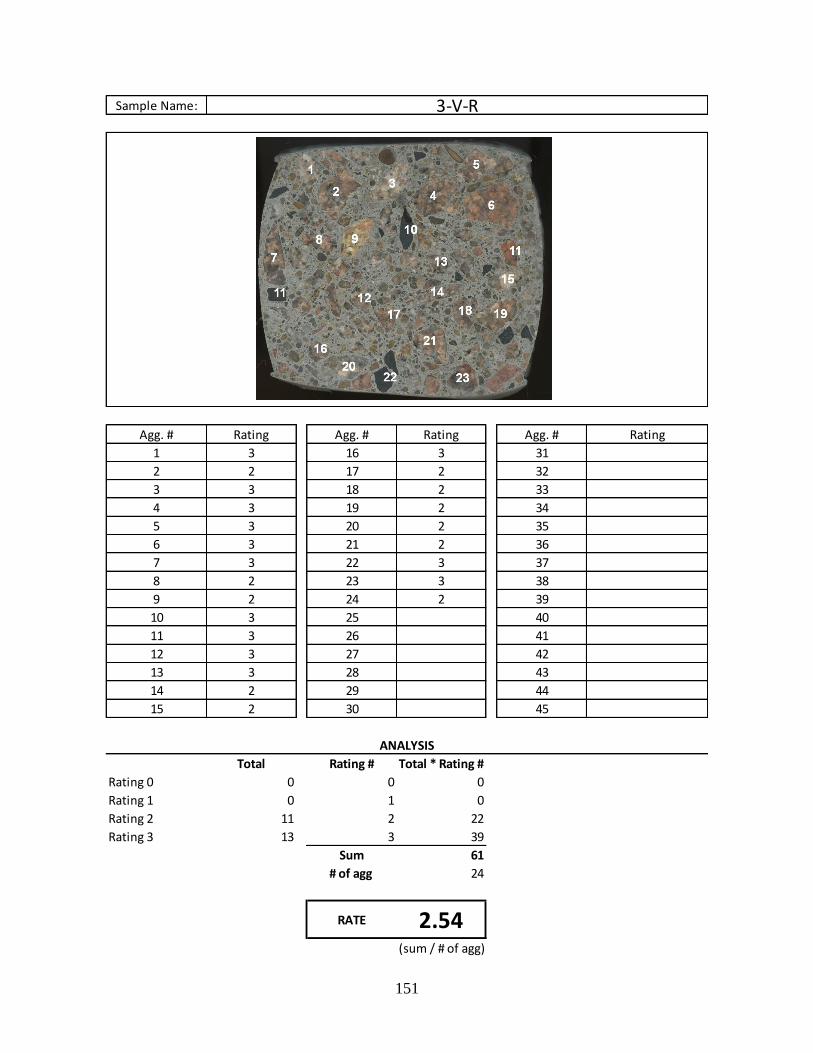
151
Sample Name:
Agg. # Rating Agg. # Rating Agg. # Rating
1 3 16 3 31
2 2 17 2 32
3 3 18 2 33
4 3 19 2 34
5 3 20 2 35
6 3 21 2 36
7 3 22 3 37
8 2 23 3 38
9 2 24 2 39
10 3 25 40
11 3 26 41
12 3 27 42
13 3 28 43
14 2 29 44
15 2 30 45
Total Rating # Total * Rating #
Rating 0 0 0 0
Rating 1 0 1 0
Rating 2 11 2 22
Rating 3 13 3 39
Sum 61
# of agg 24
(sum / # of agg)
RATE 2.54
3-V-R
ANALYSIS
1
2
3
45
6
79
8 10
11 1213
14
15
16
17
19
20
21
22 23
242526
33
3132
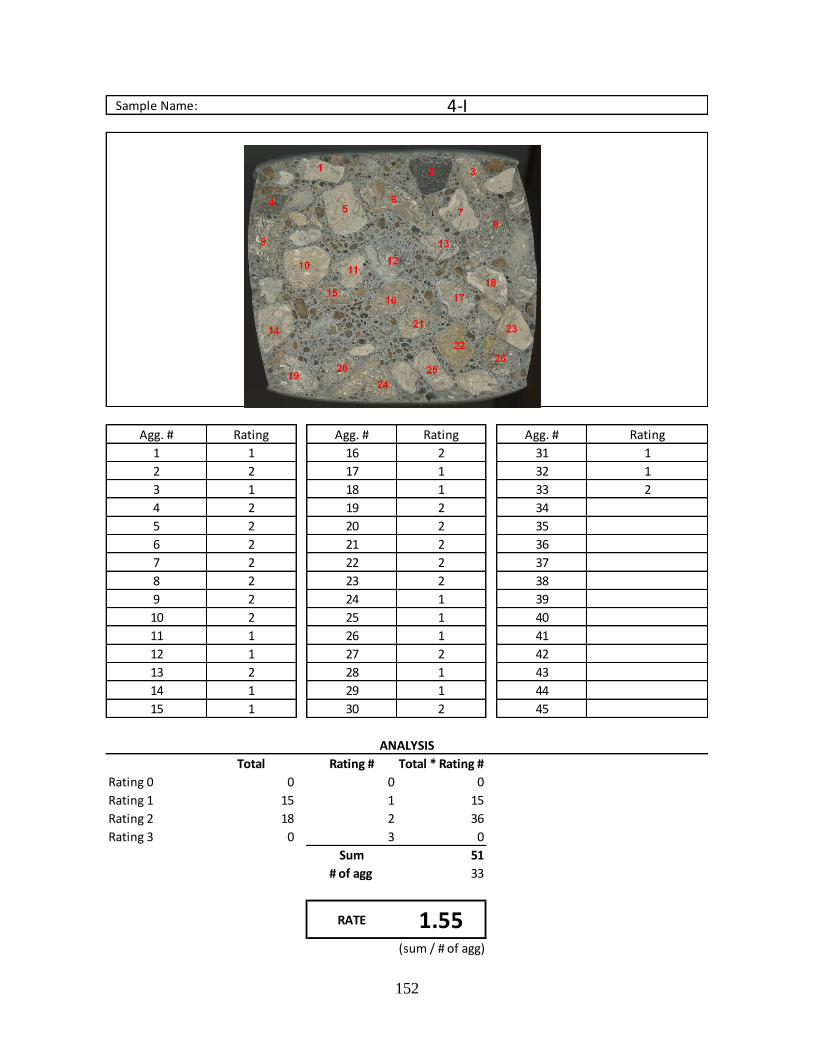
152
Sample Name:
Agg. # Rating Agg. # Rating Agg. # Rating
1 1 16 2 31 1
2 2 17 1 32 1
3 1 18 1 33 2
4 2 19 2 34
5 2 20 2 35
6 2 21 2 36
7 2 22 2 37
8 2 23 2 38
9 2 24 1 39
10 2 25 1 40
11 1 26 1 41
12 1 27 2 42
13 2 28 1 43
14 1 29 1 44
15 1 30 2 45
Total Rating # Total * Rating #
Rating 0 0 0 0
Rating 1 15 1 15
Rating 2 18 2 36
Rating 3 0 3 0
Sum 51
# of agg 33
(sum / # of agg)
RATE 1.55
4-I
ANALYSIS
1
2
3
45
6
79
8 10
11 1213
14
15
16
17
19
20
21
22 23
242526
28
29 30
33
3132
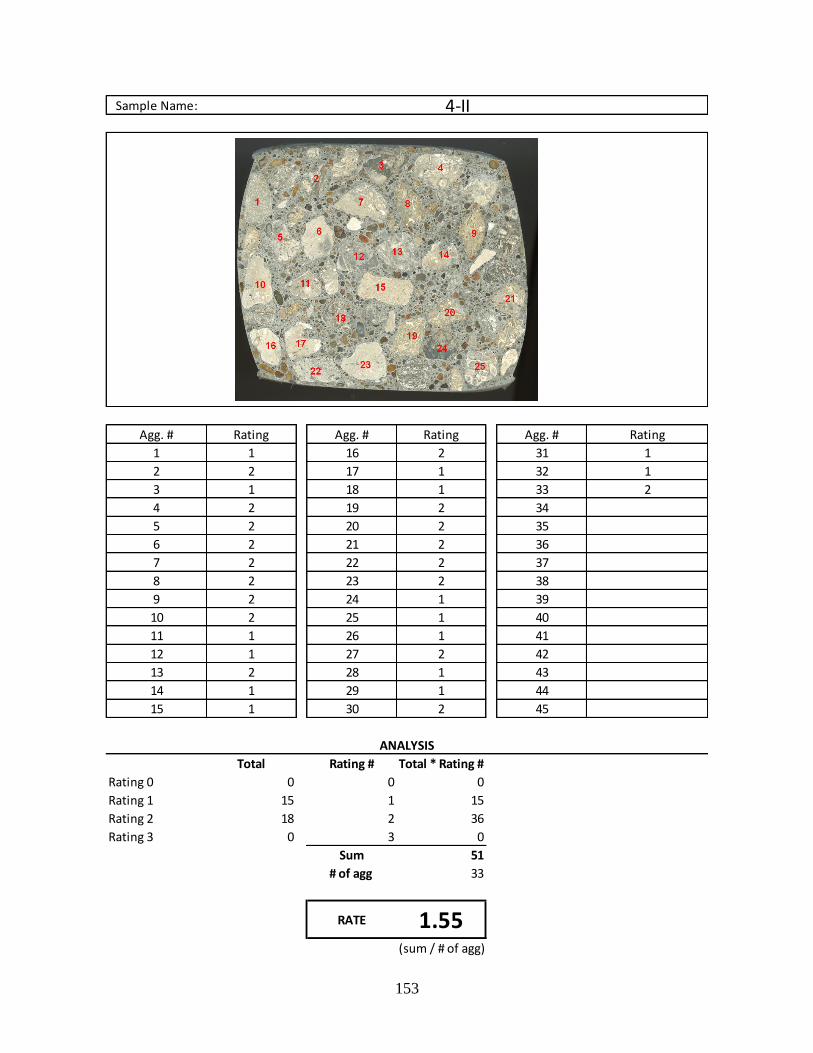
153
Sample Name:
Agg. # Rating Agg. # Rating Agg. # Rating
1 1 16 2 31 1
2 2 17 1 32 1
3 1 18 1 33 2
4 2 19 2 34
5 2 20 2 35
6 2 21 2 36
7 2 22 2 37
8 2 23 2 38
9 2 24 1 39
10 2 25 1 40
11 1 26 1 41
12 1 27 2 42
13 2 28 1 43
14 1 29 1 44
15 1 30 2 45
Total Rating # Total * Rating #
Rating 0 0 0 0
Rating 1 15 1 15
Rating 2 18 2 36
Rating 3 0 3 0
Sum 51
# of agg 33
(sum / # of agg)
RATE 1.55
4-II
ANALYSIS
1
2
3
45
6
79
8 10
11 1213
14
15
16
17
19
20
21
22 23
242526
28
29 30
33
3132

154
Sample Name:
Agg. # Rating Agg. # Rating Agg. # Rating
1 3 16 3 31
2 2 17 3 32
3 2 18 2 33
4 3 19 2 34
5 2 20 3 35
6 2 21 2 36
7 2 22 2 37
8 3 23 3 38
9 3 24 39
10 2 25 40
11 2 26 41
12 3 27 42
13 3 28 43
14 2 29 44
15 2 30 45
Total Rating # Total * Rating #
Rating 0 0 0 0
Rating 1 0 1 0
Rating 2 13 2 26
Rating 3 10 3 30
Sum 56
# of agg 23
(sum / # of agg)
RATE 2.43
4-III
ANALYSIS
1
6
5
11
10
4
2
1615
12
13
14
28 26
2524
19
23
343533
27
3230
17
18
3
78
20 22
21
31
29
9
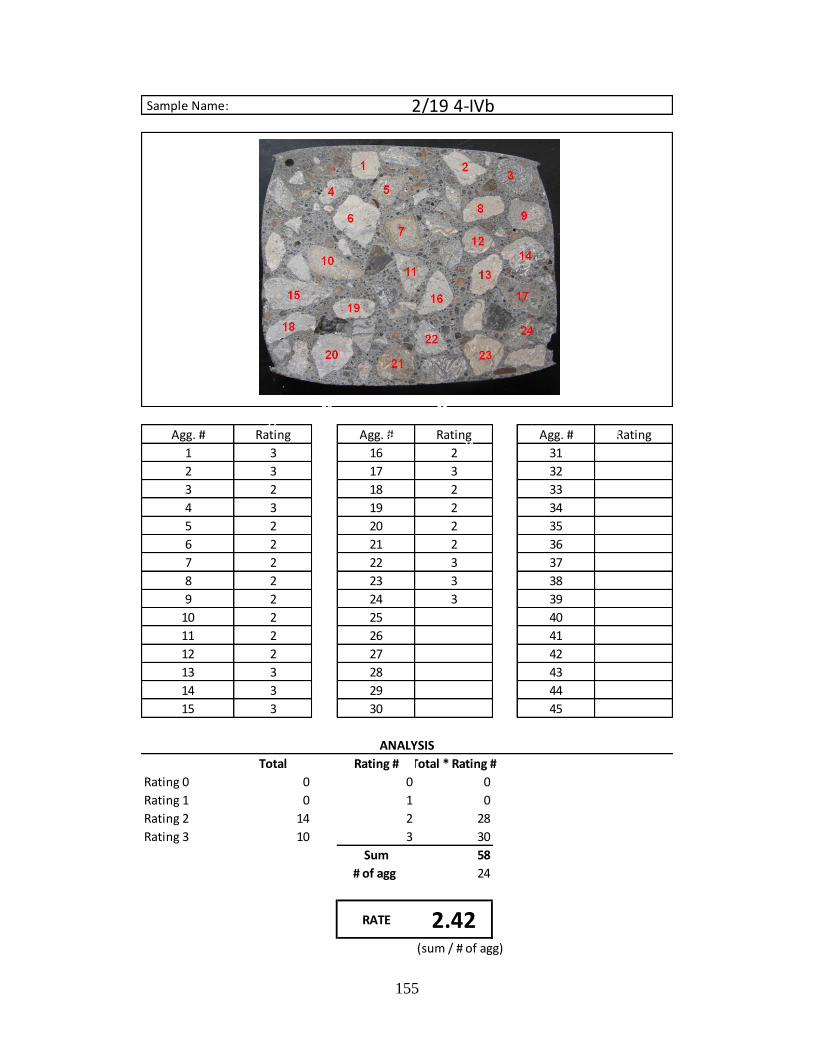
155
Sample Name:
Agg. # Rating Agg. # Rating Agg. # Rating
1 3 16 2 31
2 3 17 3 32
3 2 18 2 33
4 3 19 2 34
5 2 20 2 35
6 2 21 2 36
7 2 22 3 37
8 2 23 3 38
9 2 24 3 39
10 2 25 40
11 2 26 41
12 2 27 42
13 3 28 43
14 3 29 44
15 3 30 45
Total Rating # Total * Rating #
Rating 0 0 0 0
Rating 1 0 1 0
Rating 2 14 2 28
Rating 3 10 3 30
Sum 58
# of agg 24
(sum / # of agg)
RATE 2.42
2/19 4-IVb
ANALYSIS
8 7
65
10
43
21
11
22
21 20 19
23
24
39
3837
36
35
33
34
30
3132
9
12
18
26
27 28
29
15
16
14
13
17
25
40
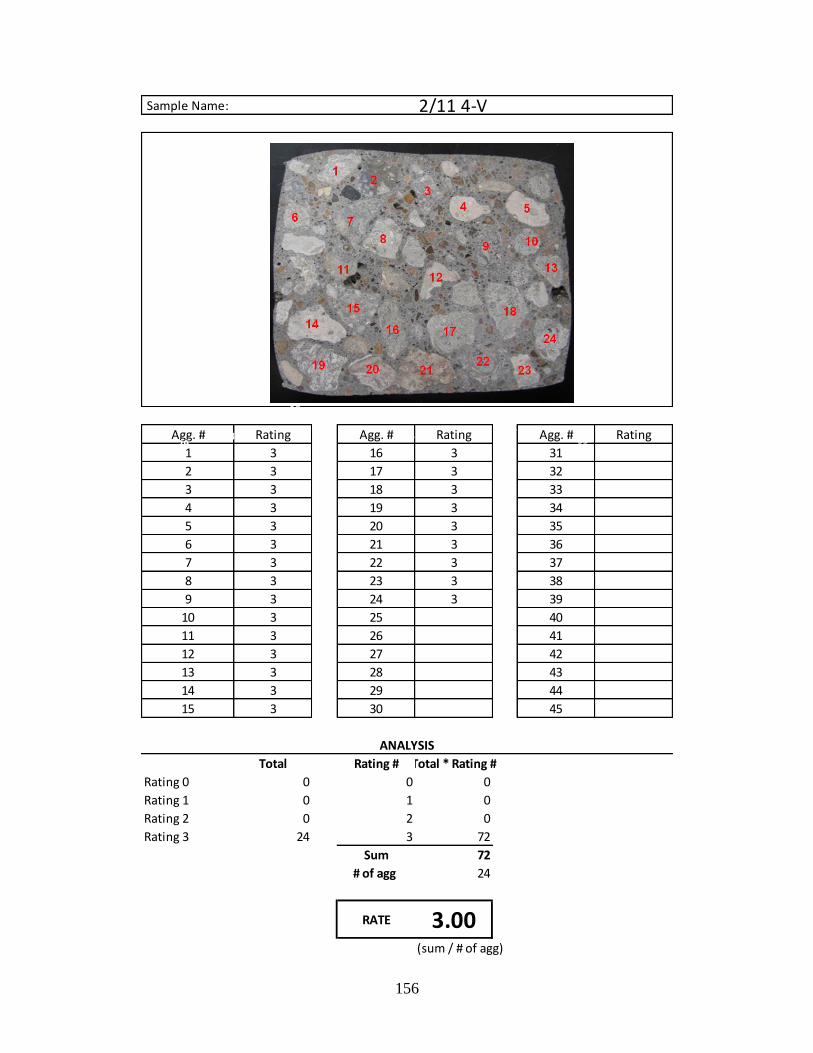
156
Sample Name:
Agg. # Rating Agg. # Rating Agg. # Rating
1 3 16 3 31
2 3 17 3 32
3 3 18 3 33
4 3 19 3 34
5 3 20 3 35
6 3 21 3 36
7 3 22 3 37
8 3 23 3 38
9 3 24 3 39
10 3 25 40
11 3 26 41
12 3 27 42
13 3 28 43
14 3 29 44
15 3 30 45
Total Rating # Total * Rating #
Rating 0 0 0 0
Rating 1 0 1 0
Rating 2 0 2 0
Rating 3 24 3 72
Sum 72
# of agg 24
(sum / # of agg)
RATE 3.00
2/11 4-V
ANALYSIS
1
6
5
11
10
4
2
1615
12
13
14
28 26
2524
19
23
343533
27
3230
17
18
3
78
20 22
21
31
29
9
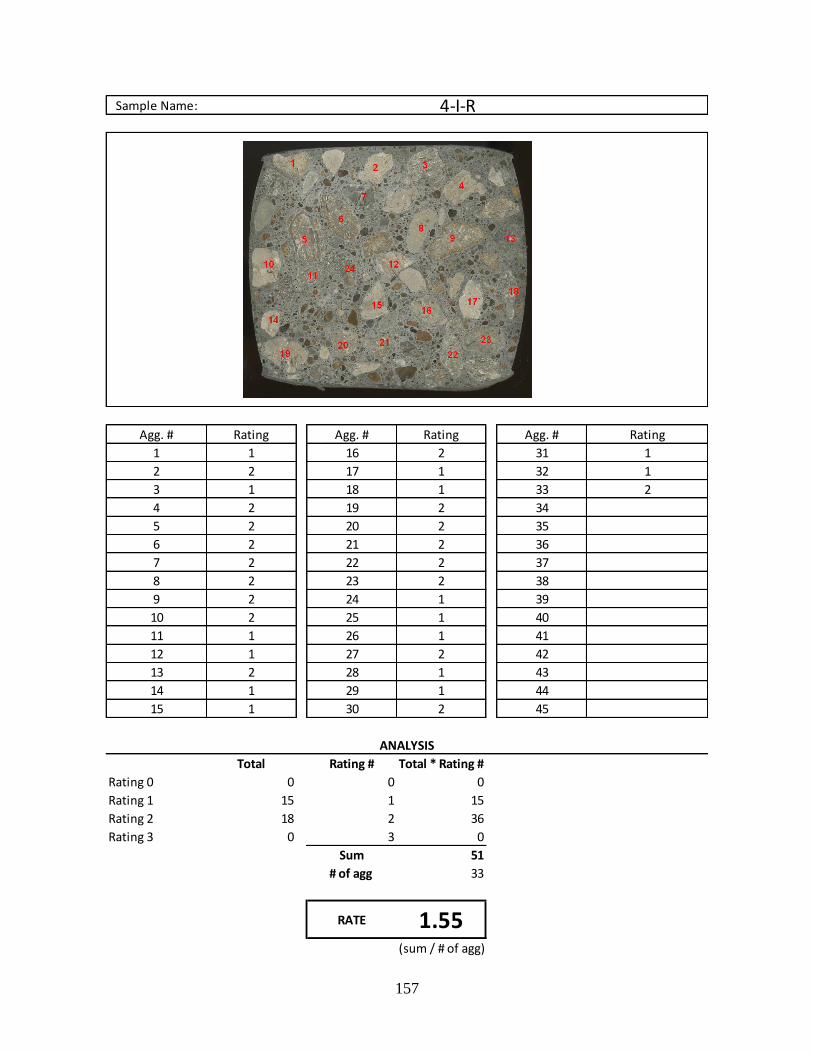
157
Sample Name:
Agg. # Rating Agg. # Rating Agg. # Rating
1 1 16 2 31 1
2 2 17 1 32 1
3 1 18 1 33 2
4 2 19 2 34
5 2 20 2 35
6 2 21 2 36
7 2 22 2 37
8 2 23 2 38
9 2 24 1 39
10 2 25 1 40
11 1 26 1 41
12 1 27 2 42
13 2 28 1 43
14 1 29 1 44
15 1 30 2 45
Total Rating # Total * Rating #
Rating 0 0 0 0
Rating 1 15 1 15
Rating 2 18 2 36
Rating 3 0 3 0
Sum 51
# of agg 33
(sum / # of agg)
RATE 1.55
4-I-R
ANALYSIS
1
2
3
45
6
79
8 10
11 1213
14
15
16
17
19
20
21
22 23
242526
28
29 30
33
3132
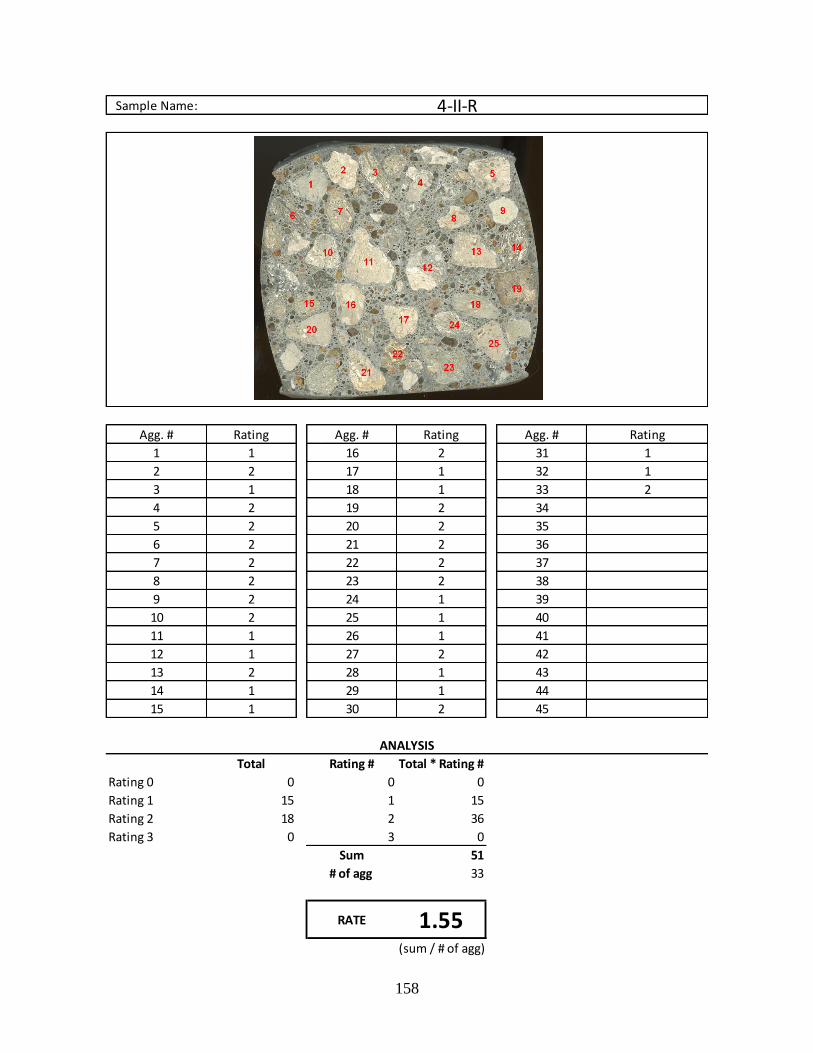
158
Sample Name:
Agg. # Rating Agg. # Rating Agg. # Rating
1 1 16 2 31 1
2 2 17 1 32 1
3 1 18 1 33 2
4 2 19 2 34
5 2 20 2 35
6 2 21 2 36
7 2 22 2 37
8 2 23 2 38
9 2 24 1 39
10 2 25 1 40
11 1 26 1 41
12 1 27 2 42
13 2 28 1 43
14 1 29 1 44
15 1 30 2 45
Total Rating # Total * Rating #
Rating 0 0 0 0
Rating 1 15 1 15
Rating 2 18 2 36
Rating 3 0 3 0
Sum 51
# of agg 33
(sum / # of agg)
RATE 1.55
4-II-R
ANALYSIS
1
2
3
45
6
79
8 10
11 1213
14
15
16
17
19
20
21
22 23
242526
28
29 30
33
3132
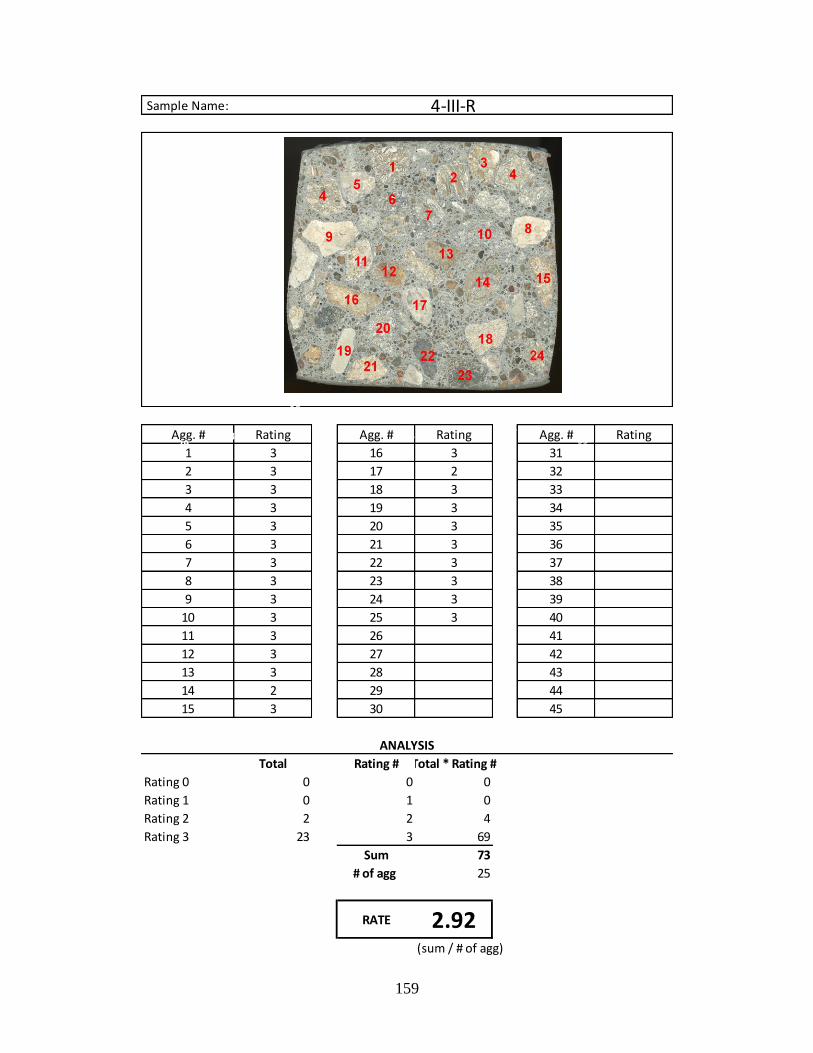
159
Sample Name:
Agg. # Rating Agg. # Rating Agg. # Rating
1 3 16 3 31
2 3 17 2 32
3 3 18 3 33
4 3 19 3 34
5 3 20 3 35
6 3 21 3 36
7 3 22 3 37
8 3 23 3 38
9 3 24 3 39
10 3 25 3 40
11 3 26 41
12 3 27 42
13 3 28 43
14 2 29 44
15 3 30 45
Total Rating # Total * Rating #
Rating 0 0 0 0
Rating 1 0 1 0
Rating 2 2 2 4
Rating 3 23 3 69
Sum 73
# of agg 25
(sum / # of agg)
RATE 2.92
4-III-R
ANALYSIS
1
6
5
11
10
4
2
1615
12
13
14
28 26
2524
19
23
343533
27
3230
17
18
3
78
20 22
21
31
29
9

160
Sample Name:
Agg. # Rating Agg. # Rating Agg. # Rating
1 3 16 3 31
2 2 17 3 32
3 3 18 3 33
4 3 19 3 34
5 2 20 2 35
6 3 21 3 36
7 3 22 37
8 3 23 38
9 3 24 39
10 3 25 40
11 3 26 41
12 2 27 42
13 3 28 43
14 2 29 44
15 3 30 45
Total Rating # Total * Rating #
Rating 0 0 0 0
Rating 1 0 1 0
Rating 2 5 2 10
Rating 3 16 3 48
Sum 58
# of agg 21
(sum / # of agg)
RATE 2.76
4-IV-R
ANALYSIS
15
3
2
11
1
12
1314
20
19
25
1727
2930
31 33
26
34
24
23
22
40
42
39
41 3837
3635
28
18
9
10
4
5
6
21
78
32
16
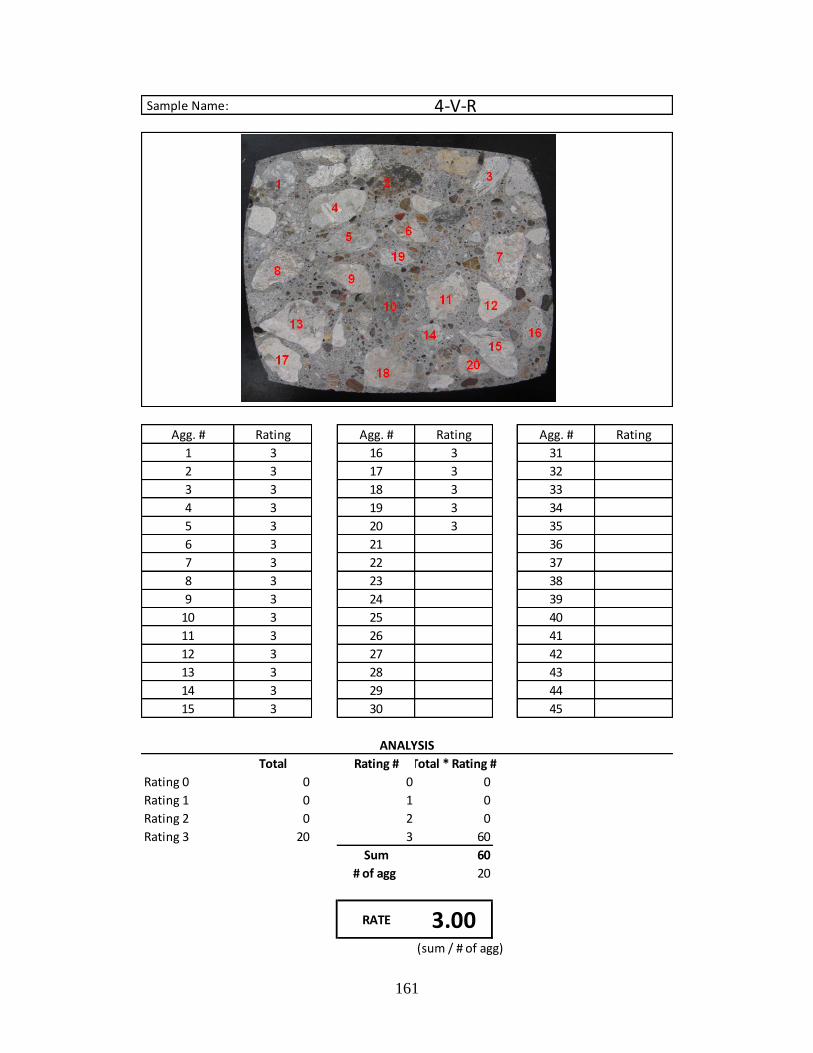
161
Sample Name:
Agg. # Rating Agg. # Rating Agg. # Rating
1 3 16 3 31
2 3 17 3 32
3 3 18 3 33
4 3 19 3 34
5 3 20 3 35
6 3 21 36
7 3 22 37
8 3 23 38
9 3 24 39
10 3 25 40
11 3 26 41
12 3 27 42
13 3 28 43
14 3 29 44
15 3 30 45
Total Rating # Total * Rating #
Rating 0 0 0 0
Rating 1 0 1 0
Rating 2 0 2 0
Rating 3 20 3 60
Sum 60
# of agg 20
(sum / # of agg)
RATE 3.00
4-V-R
ANALYSIS
5
4
3
2
1
1714
15
16
28
3033
32
242526
29
34
13
18
27
20 21
19
12
6
78
9
10
2223
11
31
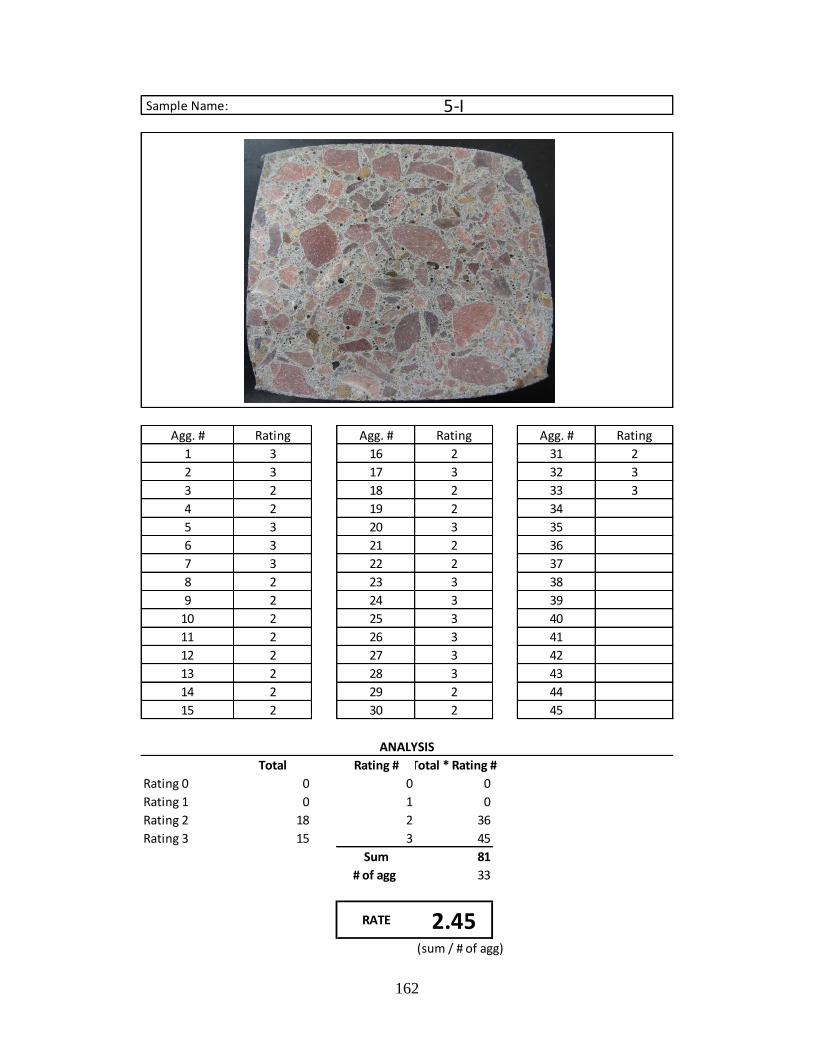
162
Sample Name:
Agg. # Rating Agg. # Rating Agg. # Rating
1 3 16 2 31 2
2 3 17 3 32 3
3 2 18 2 33 3
4 2 19 2 34
5 3 20 3 35
6 3 21 2 36
7 3 22 2 37
8 2 23 3 38
9 2 24 3 39
10 2 25 3 40
11 2 26 3 41
12 2 27 3 42
13 2 28 3 43
14 2 29 2 44
15 2 30 2 45
Total Rating # Total * Rating #
Rating 0 0 0 0
Rating 1 0 1 0
Rating 2 18 2 36
Rating 3 15 3 45
Sum 81
# of agg 33
(sum / # of agg)
RATE 2.45
5-I
ANALYSIS
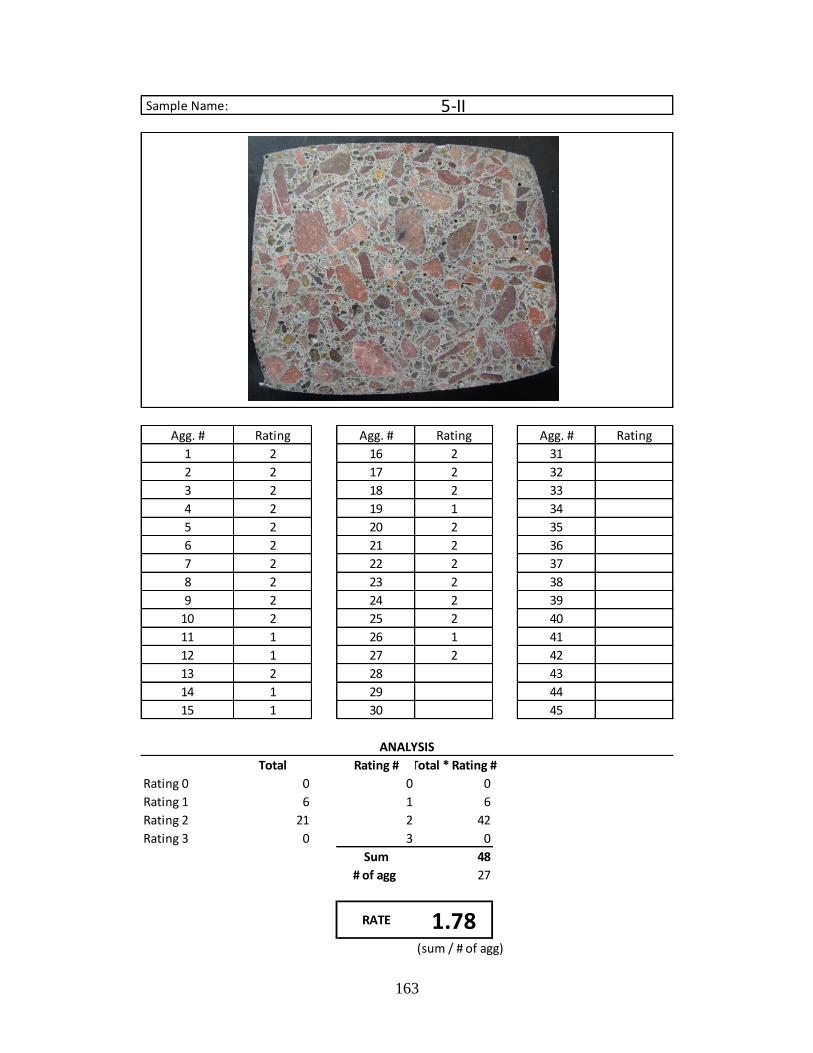
163
Sample Name:
Agg. # Rating Agg. # Rating Agg. # Rating
1 2 16 2 31
2 2 17 2 32
3 2 18 2 33
4 2 19 1 34
5 2 20 2 35
6 2 21 2 36
7 2 22 2 37
8 2 23 2 38
9 2 24 2 39
10 2 25 2 40
11 1 26 1 41
12 1 27 2 42
13 2 28 43
14 1 29 44
15 1 30 45
Total Rating # Total * Rating #
Rating 0 0 0 0
Rating 1 6 1 6
Rating 2 21 2 42
Rating 3 0 3 0
Sum 48
# of agg 27
(sum / # of agg)
RATE 1.78
5-II
ANALYSIS
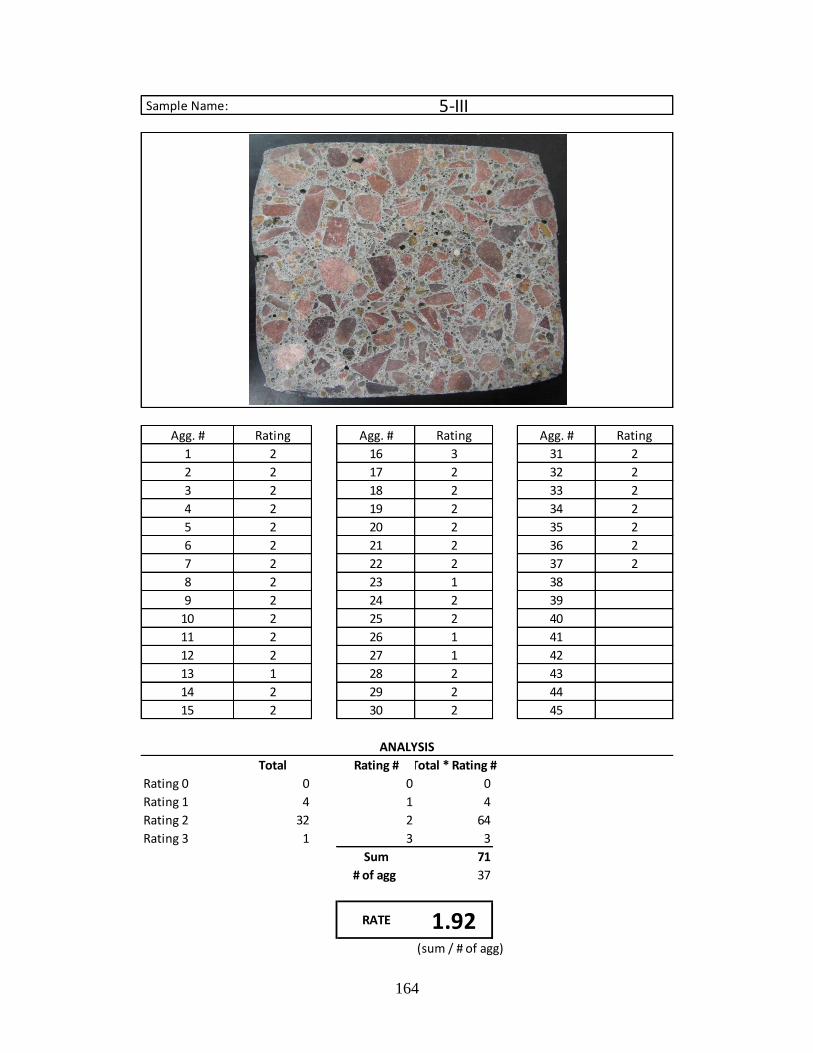
164
Sample Name:
Agg. # Rating Agg. # Rating Agg. # Rating
1 2 16 3 31 2
2 2 17 2 32 2
3 2 18 2 33 2
4 2 19 2 34 2
5 2 20 2 35 2
6 2 21 2 36 2
7 2 22 2 37 2
8 2 23 1 38
9 2 24 2 39
10 2 25 2 40
11 2 26 1 41
12 2 27 1 42
13 1 28 2 43
14 2 29 2 44
15 2 30 2 45
Total Rating # Total * Rating #
Rating 0 0 0 0
Rating 1 4 1 4
Rating 2 32 2 64
Rating 3 1 3 3
Sum 71
# of agg 37
(sum / # of agg)
RATE 1.92
5-III
ANALYSIS
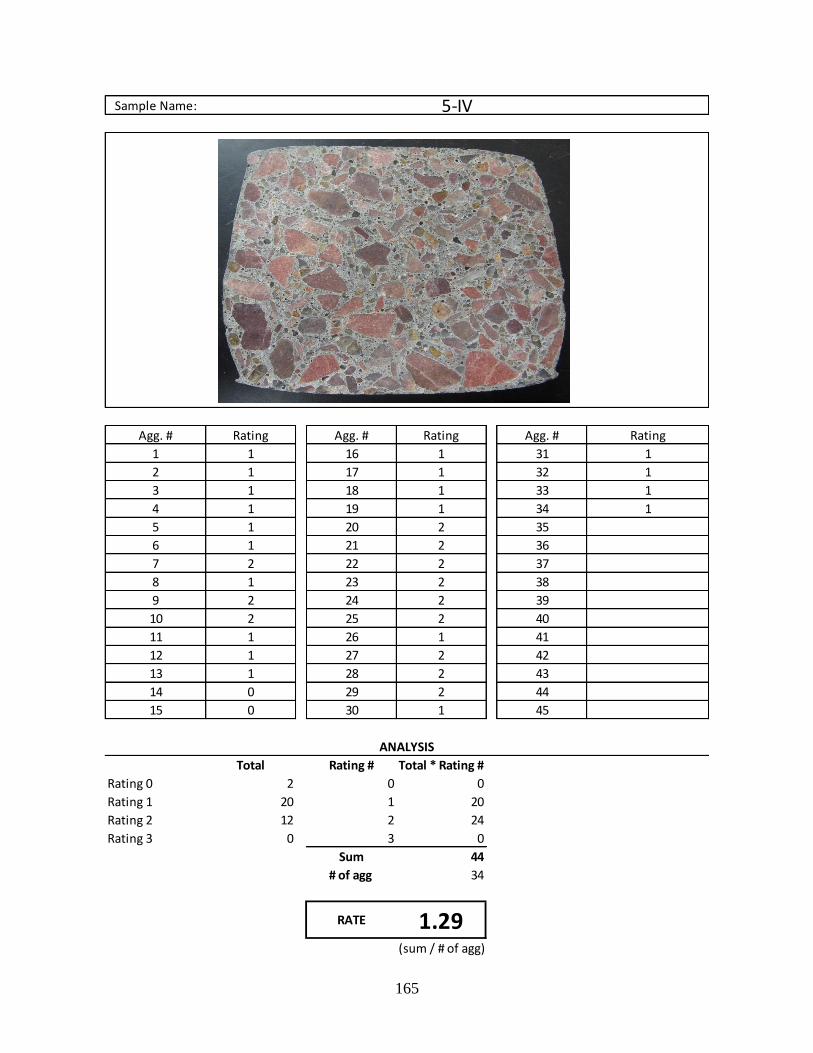
165
Sample Name:
Agg. # Rating Agg. # Rating Agg. # Rating
1 1 16 1 31 1
2 1 17 1 32 1
3 1 18 1 33 1
4 1 19 1 34 1
5 1 20 2 35
6 1 21 2 36
7 2 22 2 37
8 1 23 2 38
9 2 24 2 39
10 2 25 2 40
11 1 26 1 41
12 1 27 2 42
13 1 28 2 43
14 0 29 2 44
15 0 30 1 45
Total Rating # Total * Rating #
Rating 0 2 0 0
Rating 1 20 1 20
Rating 2 12 2 24
Rating 3 0 3 0
Sum 44
# of agg 34
(sum / # of agg)
RATE 1.29
5-IV
ANALYSIS

166
Sample Name:
Agg. # Rating Agg. # Rating Agg. # Rating
1 2 16 2 31 2
2 2 17 2 32 1
3 1 18 2 33 2
4 2 19 2 34
5 2 20 2 35
6 2 21 2 36
7 2 22 2 37
8 2 23 1 38
9 2 24 1 39
10 2 25 2 40
11 2 26 1 41
12 2 27 2 42
13 2 28 1 43
14 2 29 2 44
15 2 30 2 45
Total Rating # Total * Rating #
Rating 0 0 0 0
Rating 1 6 1 6
Rating 2 27 2 54
Rating 3 0 3 0
Sum 60
# of agg 33
(sum / # of agg)
RATE 1.82
5-V
ANALYSIS
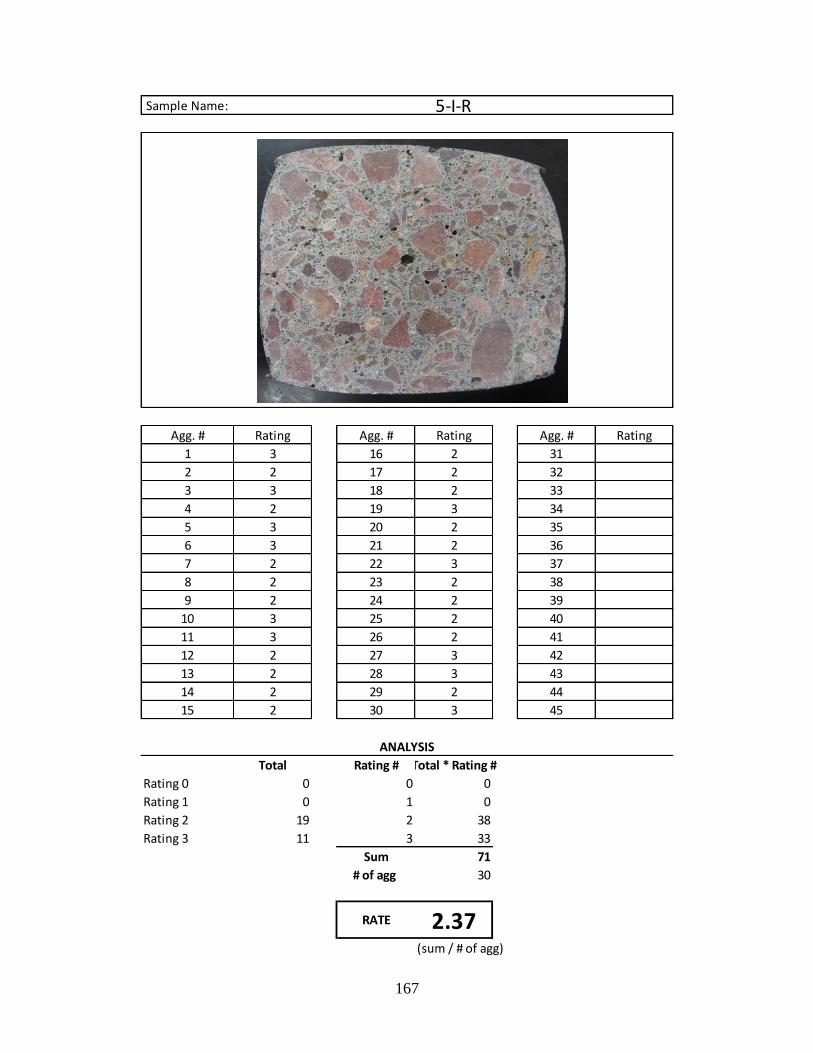
167
Sample Name:
Agg. # Rating Agg. # Rating Agg. # Rating
1 3 16 2 31
2 2 17 2 32
3 3 18 2 33
4 2 19 3 34
5 3 20 2 35
6 3 21 2 36
7 2 22 3 37
8 2 23 2 38
9 2 24 2 39
10 3 25 2 40
11 3 26 2 41
12 2 27 3 42
13 2 28 3 43
14 2 29 2 44
15 2 30 3 45
Total Rating # Total * Rating #
Rating 0 0 0 0
Rating 1 0 1 0
Rating 2 19 2 38
Rating 3 11 3 33
Sum 71
# of agg 30
(sum / # of agg)
RATE 2.37
5-I-R
ANALYSIS
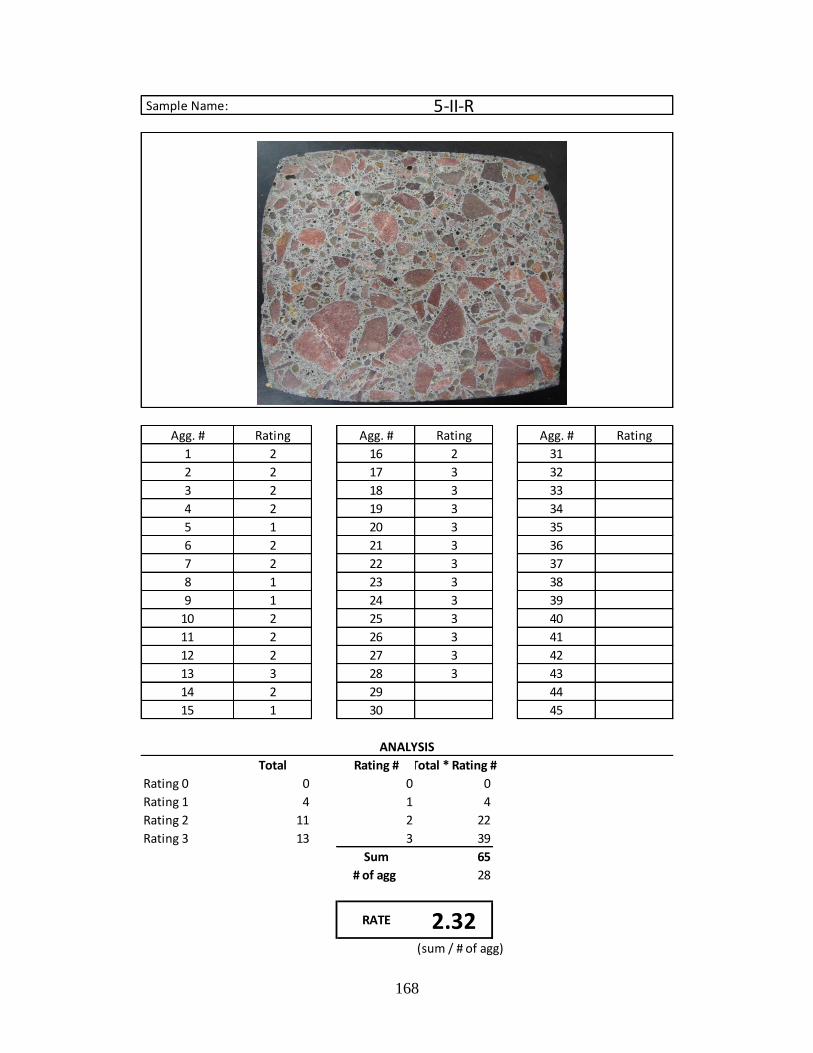
168
Sample Name:
Agg. # Rating Agg. # Rating Agg. # Rating
1 2 16 2 31
2 2 17 3 32
3 2 18 3 33
4 2 19 3 34
5 1 20 3 35
6 2 21 3 36
7 2 22 3 37
8 1 23 3 38
9 1 24 3 39
10 2 25 3 40
11 2 26 3 41
12 2 27 3 42
13 3 28 3 43
14 2 29 44
15 1 30 45
Total Rating # Total * Rating #
Rating 0 0 0 0
Rating 1 4 1 4
Rating 2 11 2 22
Rating 3 13 3 39
Sum 65
# of agg 28
(sum / # of agg)
RATE 2.32
5-II-R
ANALYSIS
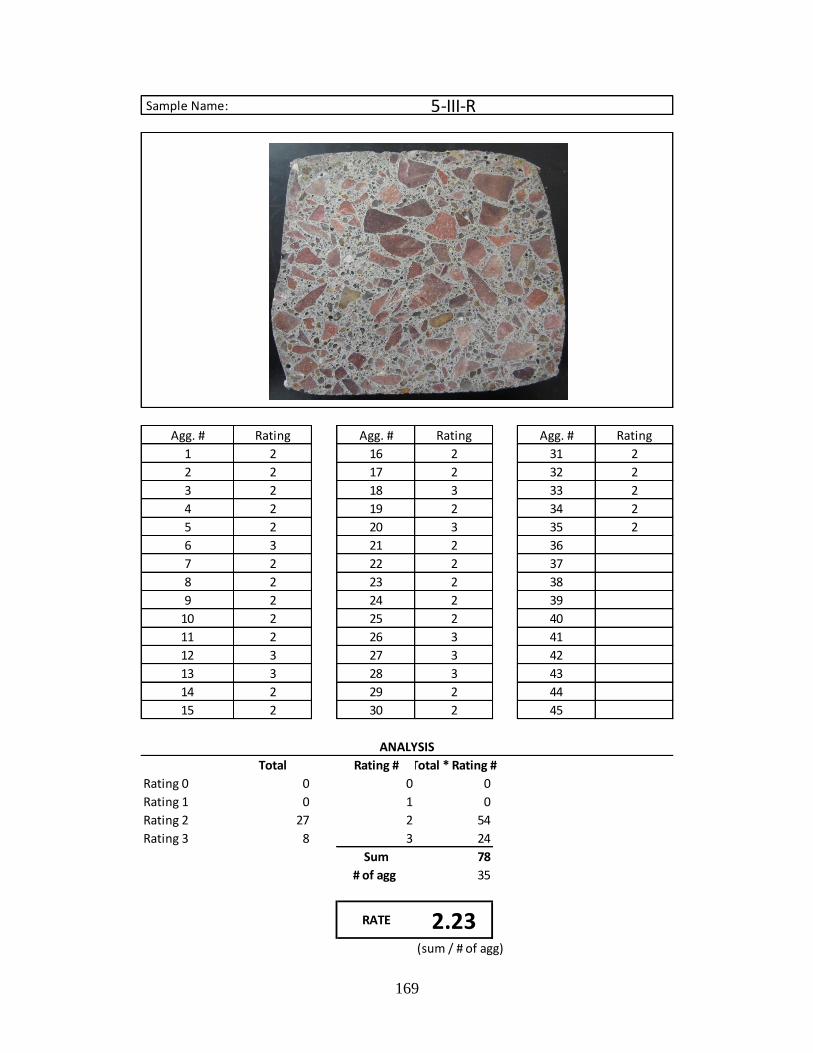
169
Sample Name:
Agg. # Rating Agg. # Rating Agg. # Rating
1 2 16 2 31 2
2 2 17 2 32 2
3 2 18 3 33 2
4 2 19 2 34 2
5 2 20 3 35 2
6 3 21 2 36
7 2 22 2 37
8 2 23 2 38
9 2 24 2 39
10 2 25 2 40
11 2 26 3 41
12 3 27 3 42
13 3 28 3 43
14 2 29 2 44
15 2 30 2 45
Total Rating # Total * Rating #
Rating 0 0 0 0
Rating 1 0 1 0
Rating 2 27 2 54
Rating 3 8 3 24
Sum 78
# of agg 35
(sum / # of agg)
RATE 2.23
5-III-R
ANALYSIS
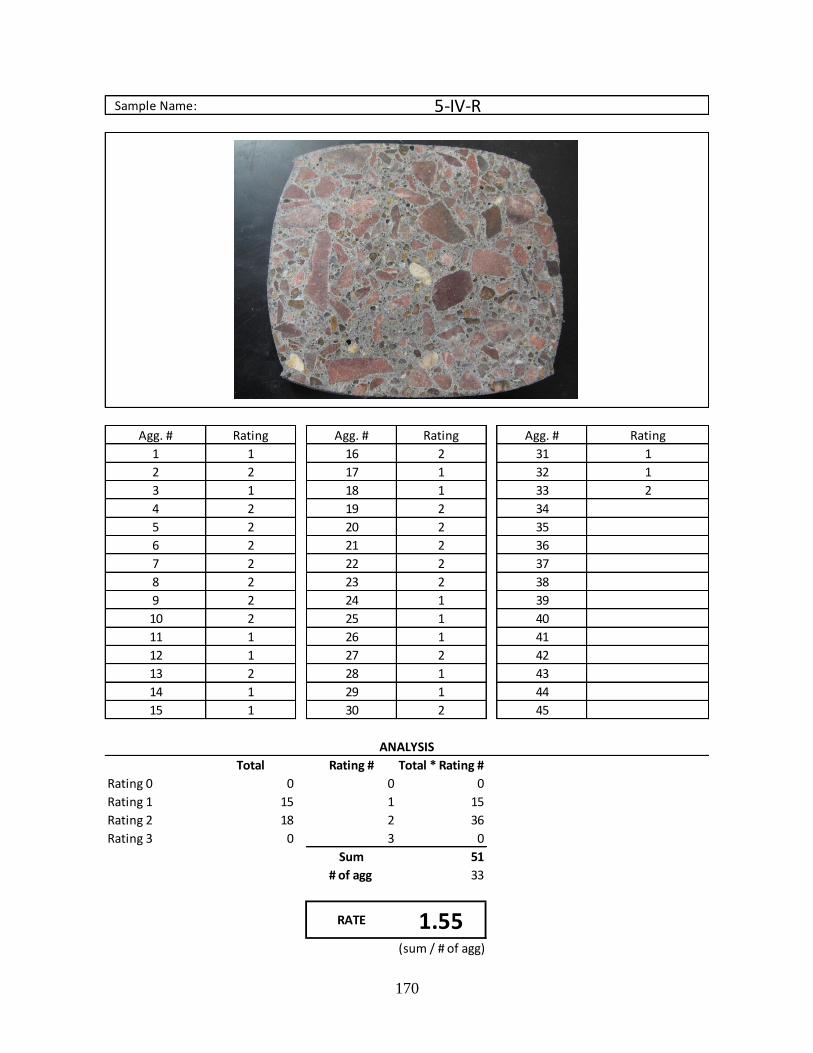
170
Sample Name:
Agg. # Rating Agg. # Rating Agg. # Rating
1 1 16 2 31 1
2 2 17 1 32 1
3 1 18 1 33 2
4 2 19 2 34
5 2 20 2 35
6 2 21 2 36
7 2 22 2 37
8 2 23 2 38
9 2 24 1 39
10 2 25 1 40
11 1 26 1 41
12 1 27 2 42
13 2 28 1 43
14 1 29 1 44
15 1 30 2 45
Total Rating # Total * Rating #
Rating 0 0 0 0
Rating 1 15 1 15
Rating 2 18 2 36
Rating 3 0 3 0
Sum 51
# of agg 33
(sum / # of agg)
RATE 1.55
5-IV-R
ANALYSIS

171
Sample Name:
Agg. # Rating Agg. # Rating Agg. # Rating
1 2 16 2 31
2 1 17 2 32
3 2 18 2 33
4 2 19 2 34
5 3 20 3 35
6 3 21 2 36
7 3 22 2 37
8 2 23 2 38
9 3 24 3 39
10 3 25 2 40
11 2 26 3 41
12 2 27 1 42
13 3 28 3 43
14 2 29 2 44
15 2 30 1 45
Total Rating # Total * Rating #
Rating 0 0 0 0
Rating 1 3 1 3
Rating 2 17 2 34
Rating 3 10 3 30
Sum 67
# of agg 30
(sum / # of agg)
RATE 2.23
5-V-R
ANALYSIS
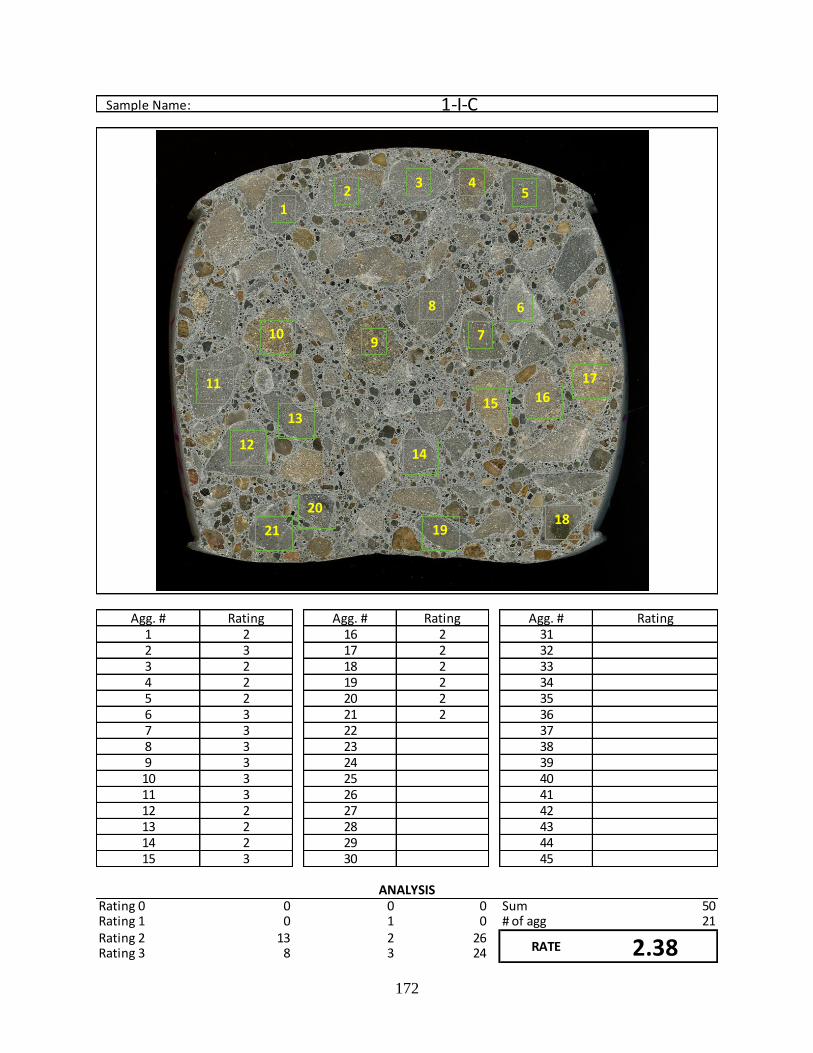
172
Sample Name:
Agg. # Rating Agg. # Rating Agg. # Rating1 2 16 2 312 3 17 2 323 2 18 2 334 2 19 2 345 2 20 2 356 3 21 2 367 3 22 378 3 23 389 3 24 3910 3 25 4011 3 26 4112 2 27 4213 2 28 4314 2 29 4415 3 30 45
Rating 0 0 0 0 Sum 50Rating 1 0 1 0 # of agg 21Rating 2 13 2 26Rating 3 8 3 24
1-I-C
ANALYSIS
RATE 2.38
1
2
3
45
6
7
9
8 10
11 1213
14
15
16
17
19
20
21
22 23
242526
28
2930
33
31
32
12
3 45
68
7910
11
12
1315 16
17
18
14
19
20
21

173
Sample Name:
Agg. # Rating Agg. # Rating Agg. # Rating1 3 16 3 312 2 17 2 323 3 18 2 334 2 19 3 345 2 20 2 356 3 21 3 367 3 22 3 378 2 23 389 3 24 3910 3 25 4011 2 26 4112 2 27 4213 2 28 4314 3 29 4415 2 30 45
Rating 0 0 0 0 Sum 55Rating 1 0 1 0 # of agg 22Rating 2 11 2 22Rating 3 11 3 33
1-II-C
ANALYSIS
RATE 2.50
1
2
3
45
6
7
9
8 10
11 1213
14
15
16
17
19
20
21
22 23
242526
28
2930
33
31
32
1
2 34
6
89
10
17
1213
22
16
2119
20
1
1511
14
5
7
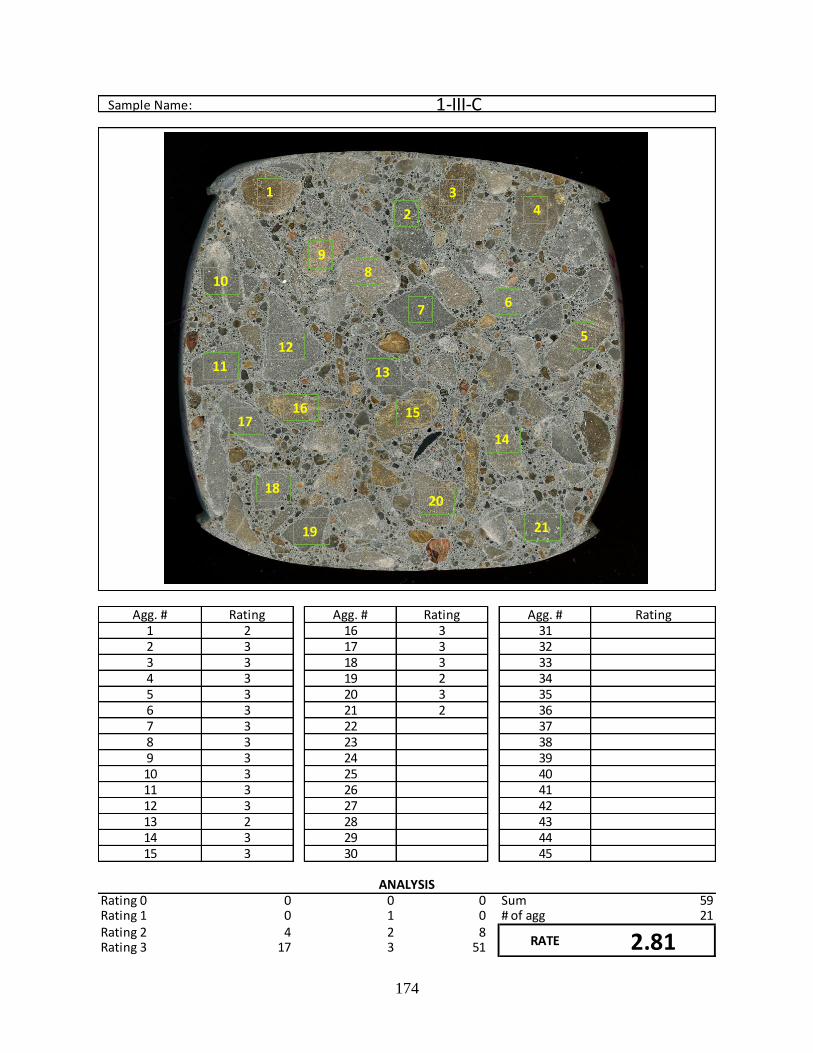
174
Sample Name:
Agg. # Rating Agg. # Rating Agg. # Rating1 2 16 3 312 3 17 3 323 3 18 3 334 3 19 2 345 3 20 3 356 3 21 2 367 3 22 378 3 23 389 3 24 3910 3 25 4011 3 26 4112 3 27 4213 2 28 4314 3 29 4415 3 30 45
Rating 0 0 0 0 Sum 59Rating 1 0 1 0 # of agg 21Rating 2 4 2 8Rating 3 17 3 51
1-III-C
ANALYSIS
RATE 2.81
1
2
3
45
6
7
9
8 10
11 1213
14
15
16
17
19
20
21
22 23
242526
28
2930
33
31
321
10
2
34
5
67
89
12
11
15
14
21
20
19
17
18
16
13
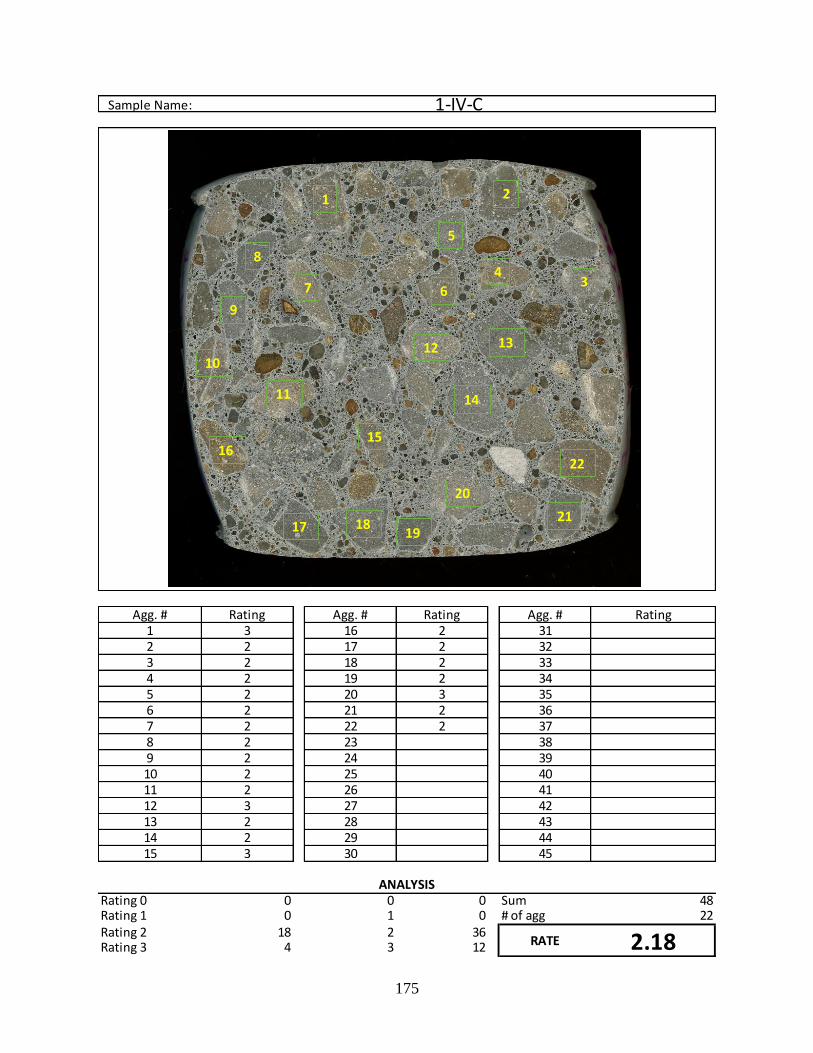
175
Sample Name:
Agg. # Rating Agg. # Rating Agg. # Rating1 3 16 2 312 2 17 2 323 2 18 2 334 2 19 2 345 2 20 3 356 2 21 2 367 2 22 2 378 2 23 389 2 24 3910 2 25 4011 2 26 4112 3 27 4213 2 28 4314 2 29 4415 3 30 45
Rating 0 0 0 0 Sum 48Rating 1 0 1 0 # of agg 22Rating 2 18 2 36Rating 3 4 3 12
1-IV-C
ANALYSIS
RATE 2.18
1
2
3
45
6
7
9
8 10
11 1213
14
15
16
17
19
20
21
22 23
242526
28
2930
33
31
32
1
12
2
34
5
67
8
9
10
11 14
13
22
20
1817
16
1921
15
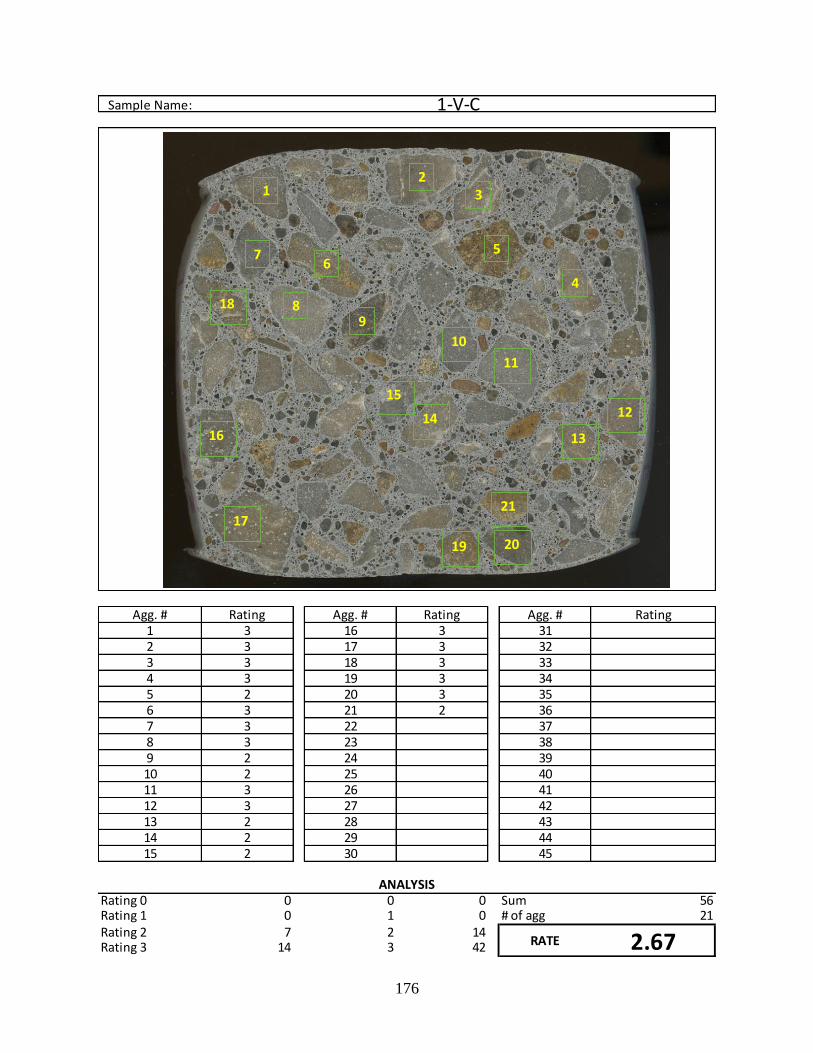
176
Sample Name:
Agg. # Rating Agg. # Rating Agg. # Rating1 3 16 3 312 3 17 3 323 3 18 3 334 3 19 3 345 2 20 3 356 3 21 2 367 3 22 378 3 23 389 2 24 3910 2 25 4011 3 26 4112 3 27 4213 2 28 4314 2 29 4415 2 30 45
Rating 0 0 0 0 Sum 56Rating 1 0 1 0 # of agg 21Rating 2 7 2 14Rating 3 14 3 42
1-V-C
ANALYSIS
RATE 2.67
33
12
3
4
56
8
7
9
10
11
12
13
15
16
17
18
14
19 20
21
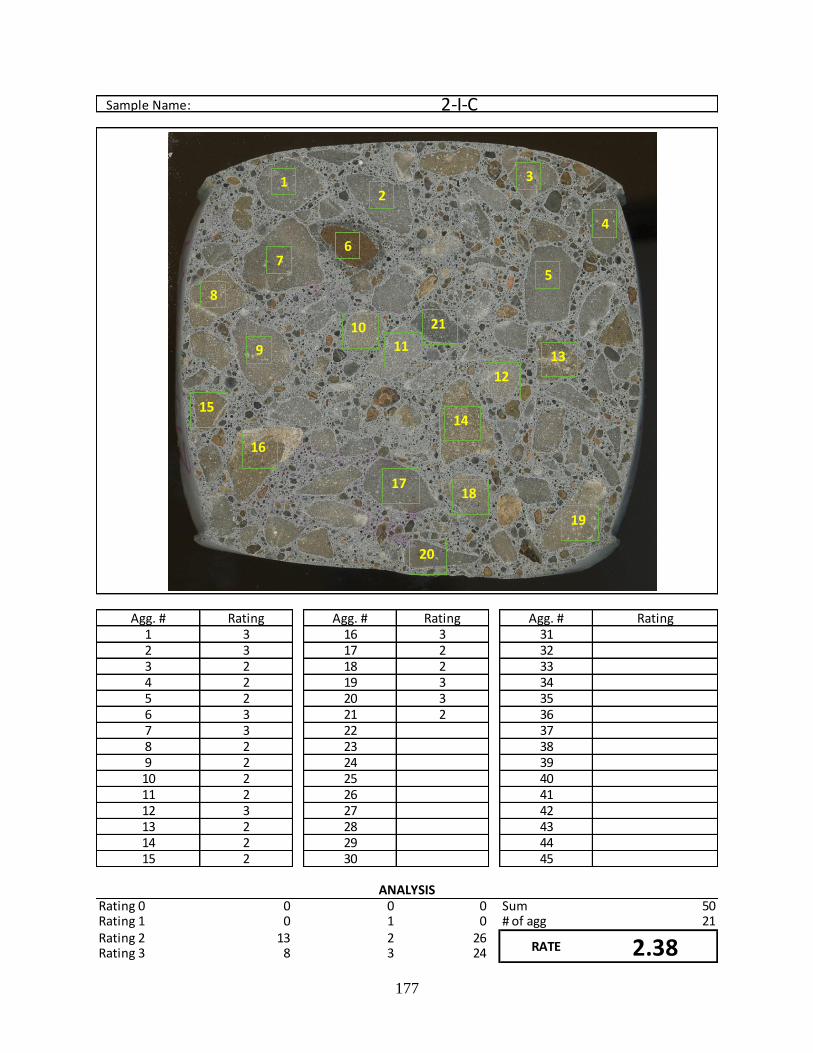
177
Sample Name:
Agg. # Rating Agg. # Rating Agg. # Rating1 3 16 3 312 3 17 2 323 2 18 2 334 2 19 3 345 2 20 3 356 3 21 2 367 3 22 378 2 23 389 2 24 3910 2 25 4011 2 26 4112 3 27 4213 2 28 4314 2 29 4415 2 30 45
Rating 0 0 0 0 Sum 50Rating 1 0 1 0 # of agg 21Rating 2 13 2 26Rating 3 8 3 24
2-I-C
ANALYSIS
RATE 2.38
1
11
2
3
4
5
67
8
9
10
13
14
16
15
1718
19
20
12
21
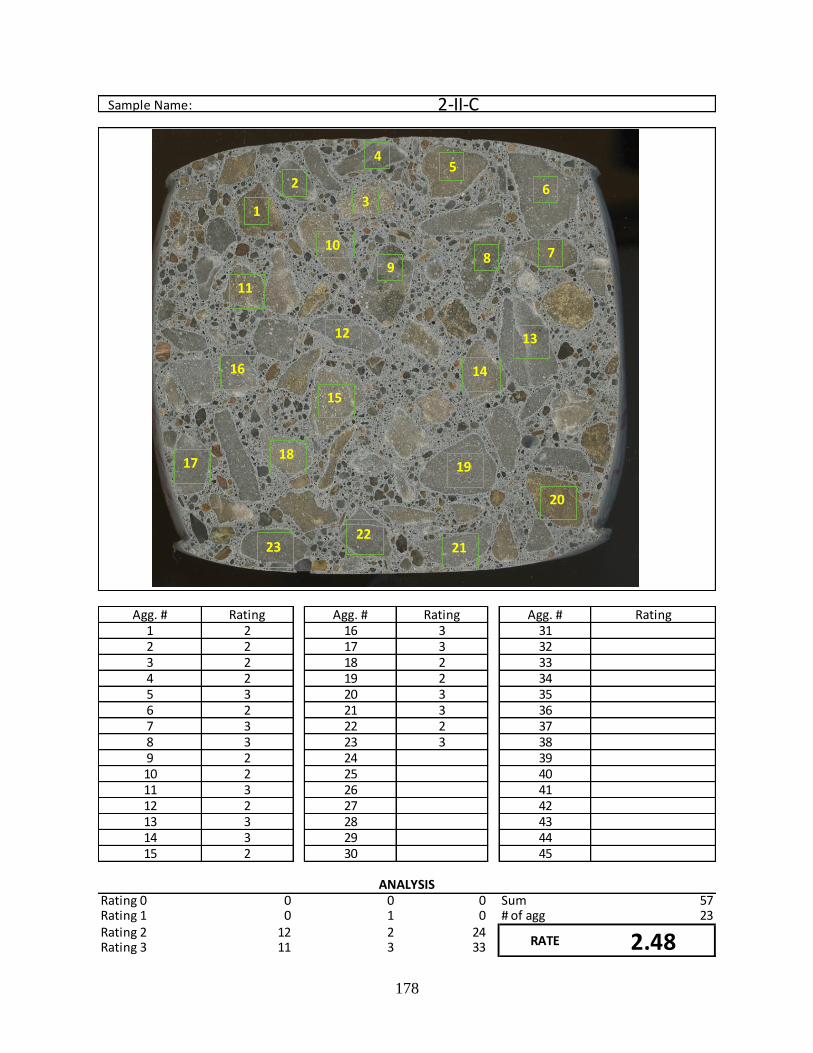
178
Sample Name:
Agg. # Rating Agg. # Rating Agg. # Rating1 2 16 3 312 2 17 3 323 2 18 2 334 2 19 2 345 3 20 3 356 2 21 3 367 3 22 2 378 3 23 3 389 2 24 3910 2 25 4011 3 26 4112 2 27 4213 3 28 4314 3 29 4415 2 30 45
Rating 0 0 0 0 Sum 57Rating 1 0 1 0 # of agg 23Rating 2 12 2 24Rating 3 11 3 33
2-II-C
ANALYSIS
RATE 2.48
1
14
2
45
6
789
10
11
16
12 13
15
18
2322
19
20
21
3
17
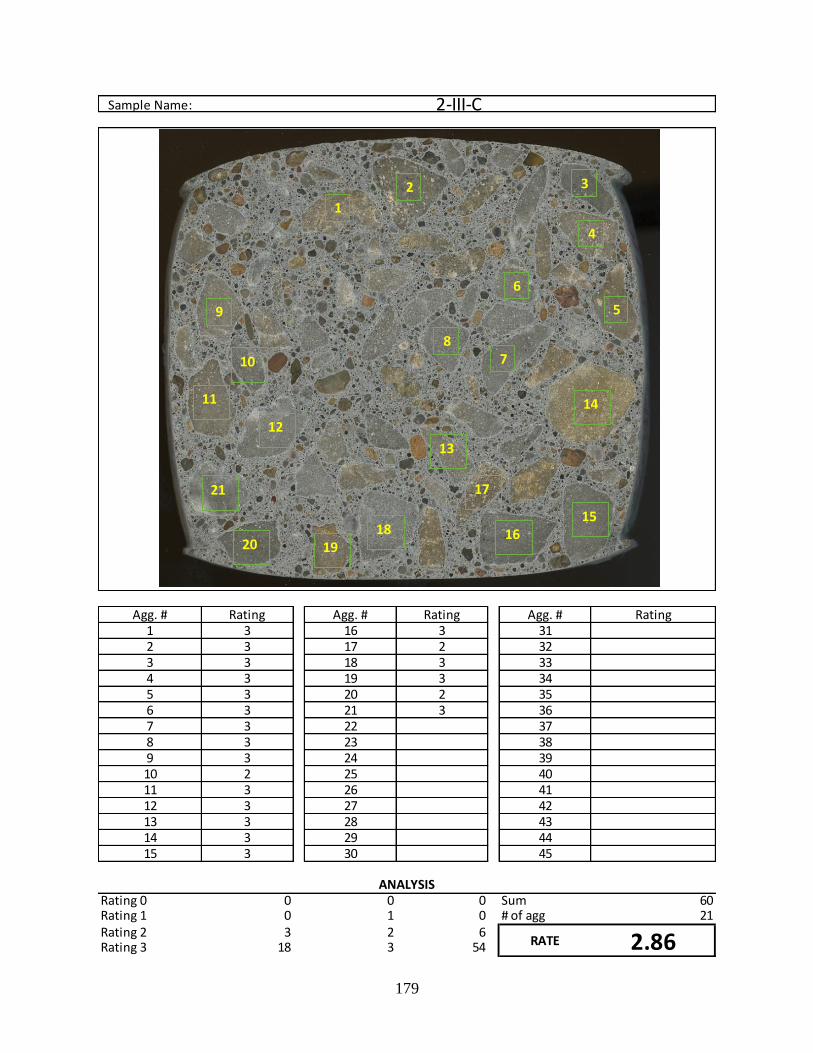
179
Sample Name:
Agg. # Rating Agg. # Rating Agg. # Rating1 3 16 3 312 3 17 2 323 3 18 3 334 3 19 3 345 3 20 2 356 3 21 3 367 3 22 378 3 23 389 3 24 3910 2 25 4011 3 26 4112 3 27 4213 3 28 4314 3 29 4415 3 30 45
Rating 0 0 0 0 Sum 60Rating 1 0 1 0 # of agg 21Rating 2 3 2 6Rating 3 18 3 54
2-III-C
ANALYSIS
RATE 2.86
1
10
2
4
3
5
6
78
9
11
12
13
14
1516
17
181920
21
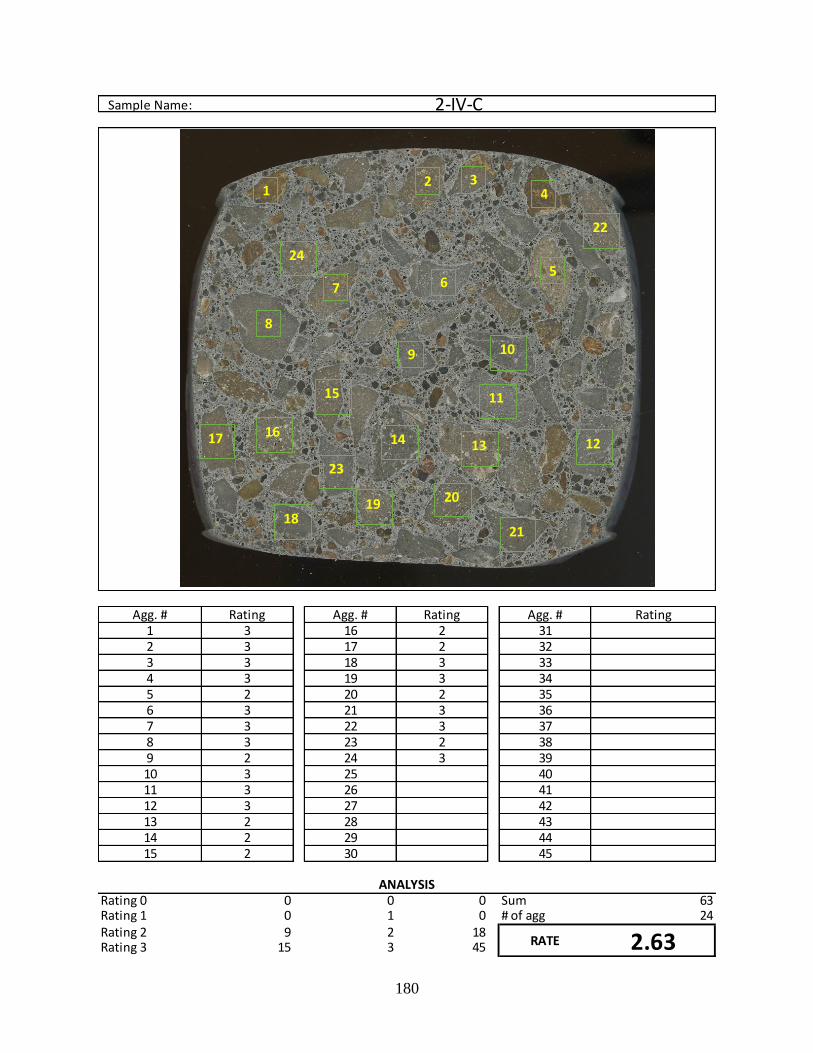
180
Sample Name:
Agg. # Rating Agg. # Rating Agg. # Rating1 3 16 2 312 3 17 2 323 3 18 3 334 3 19 3 345 2 20 2 356 3 21 3 367 3 22 3 378 3 23 2 389 2 24 3 3910 3 25 4011 3 26 4112 3 27 4213 2 28 4314 2 29 4415 2 30 45
Rating 0 0 0 0 Sum 63Rating 1 0 1 0 # of agg 24Rating 2 9 2 18Rating 3 15 3 45
2-IV-C
ANALYSIS
RATE 2.63
33
12 3
4
56
8
7
9 10
11
1213
15
1617
18
14
19 20
21
22
23
24

181
Sample Name:
Agg. # Rating Agg. # Rating Agg. # Rating1 3 16 3 312 3 17 3 323 3 18 3 334 3 19 2 345 3 20 3 356 3 21 3 367 3 22 3 378 3 23 3 389 3 24 3910 3 25 4011 3 26 4112 2 27 4213 2 28 4314 3 29 4415 3 30 45
Rating 0 0 0 0 Sum 66Rating 1 0 1 0 # of agg 23Rating 2 3 2 6Rating 3 20 3 60
2-V-C
ANALYSIS
RATE 2.87
1
11
2
3
4
5
6
78
9 10 13
14
1615
17
18
19
20
12
21
22
23

182
Sample Name:
Agg. # Rating Agg. # Rating Agg. # Rating1 2 16 2 312 2 17 2 323 2 18 2 334 2 19 2 345 3 20 2 356 2 21 2 367 2 22 3 378 2 23 2 389 2 24 3 3910 2 25 2 4011 2 26 3 4112 2 27 4213 3 28 4314 2 29 4415 3 30 45
Rating 0 0 0 0 Sum 58Rating 1 0 1 0 # of agg 26Rating 2 20 2 40Rating 3 6 3 18
3-I-C
ANALYSIS
RATE 2.23
1
11
2
3
45
6
7
8910
13
14
16
15
1718
1920
12
21
22
23
26
24
25
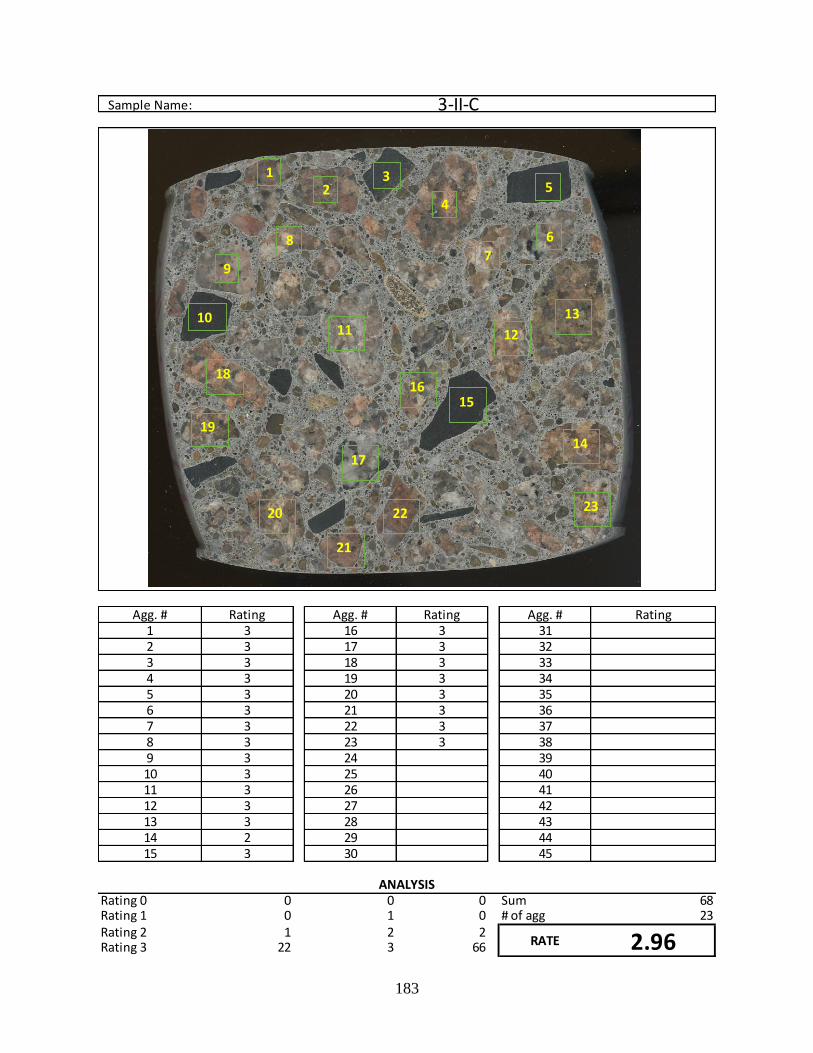
183
Sample Name:
Agg. # Rating Agg. # Rating Agg. # Rating1 3 16 3 312 3 17 3 323 3 18 3 334 3 19 3 345 3 20 3 356 3 21 3 367 3 22 3 378 3 23 3 389 3 24 3910 3 25 4011 3 26 4112 3 27 4213 3 28 4314 2 29 4415 3 30 45
Rating 0 0 0 0 Sum 68Rating 1 0 1 0 # of agg 23Rating 2 1 2 2Rating 3 22 3 66
3-II-C
ANALYSIS
RATE 2.96
1
14
24
5
6
78
9
1011
16
12
13
15
18
2322
19
20
21
3
17

184
Sample Name:
Agg. # Rating Agg. # Rating Agg. # Rating1 3 16 3 312 2 17 2 323 3 18 3 334 2 19 3 345 2 20 2 356 2 21 2 367 2 22 2 378 2 23 2 389 3 24 2 3910 3 25 4011 2 26 4112 2 27 4213 2 28 4314 3 29 4415 3 30 45
Rating 0 0 0 0 Sum 57Rating 1 0 1 0 # of agg 24Rating 2 15 2 30Rating 3 9 3 27
3-III-C
ANALYSIS
RATE 2.38
1
10
2 4
3 5
6
7
8
9
1112
131415
16
17
18
19
2021
22
24
23

185
Sample Name:
Agg. # Rating Agg. # Rating Agg. # Rating1 2 16 2 312 2 17 3 323 2 18 2 334 3 19 3 345 2 20 2 356 2 21 2 367 2 22 2 378 3 23 2 389 2 24 2 3910 3 25 2 4011 2 26 4112 2 27 4213 2 28 4314 3 29 4415 2 30 45
Rating 0 0 0 0 Sum 56Rating 1 0 1 0 # of agg 25Rating 2 19 2 38Rating 3 6 3 18
3-IV-C
ANALYSIS
RATE 2.24
1
14
2 4
56
78
910
11
16
12
1315
18
23
2219
20
21
3
17
24
25
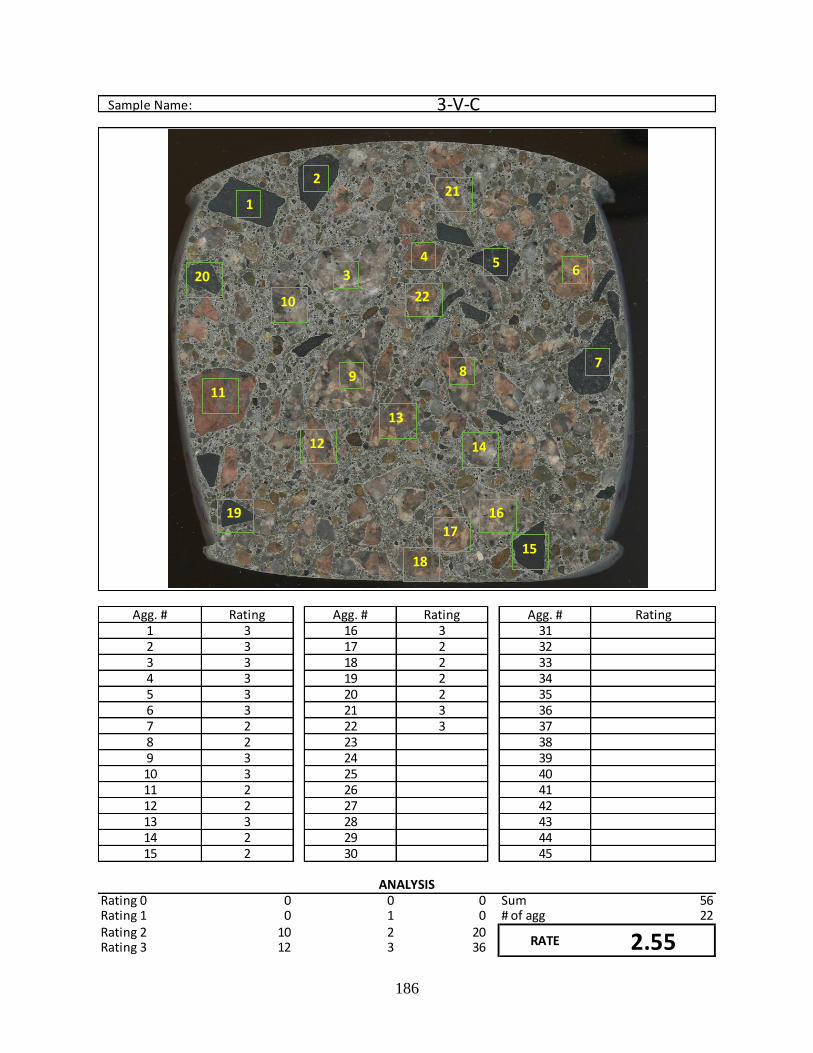
186
Sample Name:
Agg. # Rating Agg. # Rating Agg. # Rating1 3 16 3 312 3 17 2 323 3 18 2 334 3 19 2 345 3 20 2 356 3 21 3 367 2 22 3 378 2 23 389 3 24 3910 3 25 4011 2 26 4112 2 27 4213 3 28 4314 2 29 4415 2 30 45
Rating 0 0 0 0 Sum 56Rating 1 0 1 0 # of agg 22Rating 2 10 2 20Rating 3 12 3 36
3-V-C
ANALYSIS
RATE 2.55
1
10
2
43
56
789
11
12
13
14
15
1617
18
19
20
21
22
187
Appendix C - Hardened Air Void Analysis Procedure
This appendix describes the procedure of air void analysis of hardened concrete that was
implemented in this study. Sample polishing is always required prior to hardened void analysis
itself, however this is not presented in this appendix as there are many guidelines available in the
literature discussing this topic.
Part A: Material and Equipment Needed
Flatbed scanner allowing scanning in color (sometimes referred to as the “photo mode”)
and in high resolution (minimum of 4800 dpi is recommended)
The newest version of the scanning software
Solution of Phenolphthalein (1.0% in 95% Alcohol, Macron Fine Chemicals) in distilled
water (1:1)
Plastic bottle with sprayer (for phenolphthalein application)
Orange chalk powder (Irwin Strait-Line Marking Chalk)
Rubber stopper
Thin microscope slides (1 mm thickens)
Steel razorblade
Scanner glass cleaning cloth
Paper towels
Adobe Photoshop (or equivalent image processing software)
K-State Air Void Analyzer software
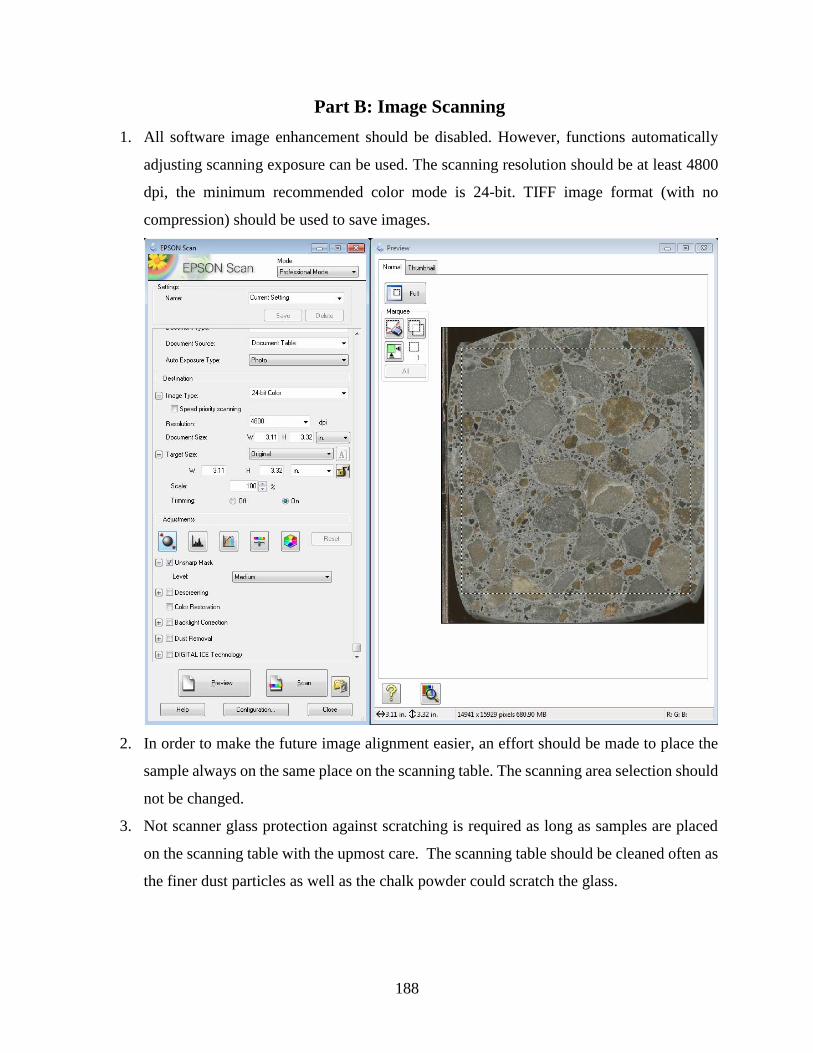
188
Part B: Image Scanning
1. All software image enhancement should be disabled. However, functions automatically
adjusting scanning exposure can be used. The scanning resolution should be at least 4800
dpi, the minimum recommended color mode is 24-bit. TIFF image format (with no
compression) should be used to save images.
2. In order to make the future image alignment easier, an effort should be made to place the
sample always on the same place on the scanning table. The scanning area selection should
not be changed.
3. Not scanner glass protection against scratching is required as long as samples are placed
on the scanning table with the upmost care. The scanning table should be cleaned often as
the finer dust particles as well as the chalk powder could scratch the glass.
189
4. Sample shall be scanned twice:
(1) First, a dried polished sample should be scanned.
(2) Sample sprayed with a phenolphthalein solution and with pores filled with an
orange powder should be scanned. Spray the sample with a phenolphthalein
solution. Only a thin layer of solution shall be applied to eliminate excessive
amounts of fluid coloring aggregate particles. The sample should be dried using a
hairdryer. Finally, fill all air voids with the orange powder. The powder should be
uniformly distributed over the sample surface using a microscope slide and then
pressed into pores by a rubber stopper. This process should be repeated two times
to ensure all voids were completely filled. A steel razorblade can be used to remove
excess powder from the sample and, if needed, the surface can be dusted with a
lightly-oiled fingertip covered by a laboratory glove.
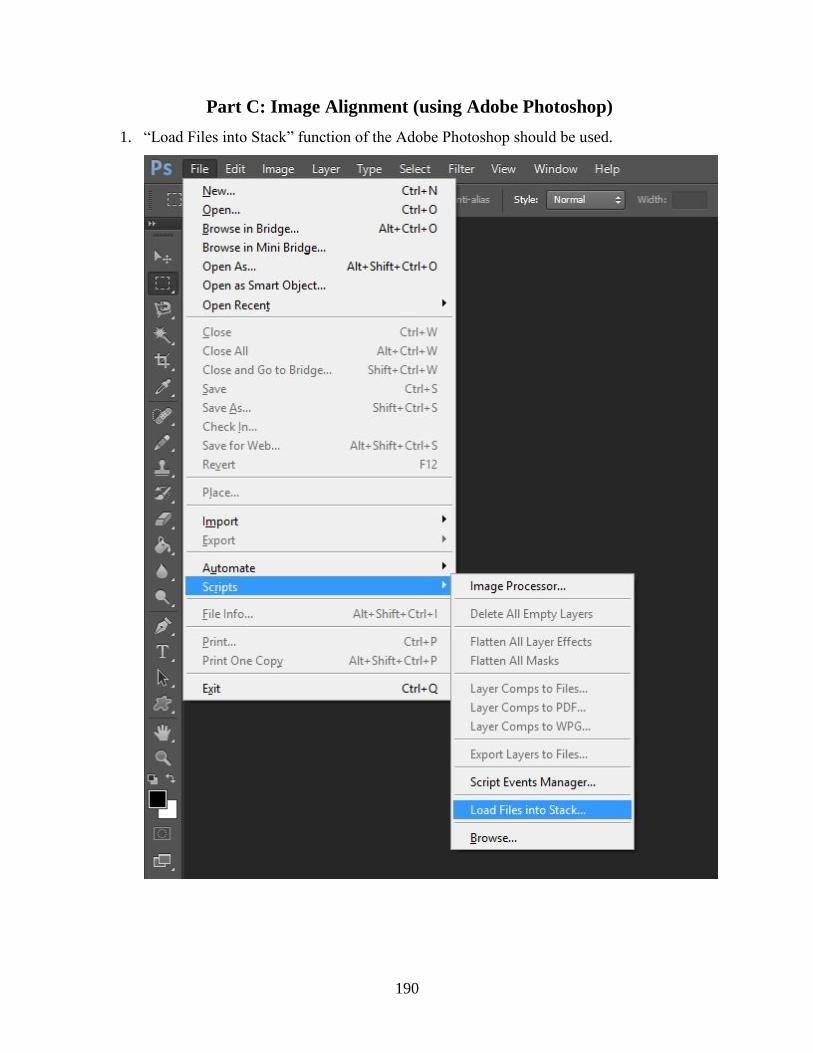
190
Part C: Image Alignment (using Adobe Photoshop)
1. “Load Files into Stack” function of the Adobe Photoshop should be used.
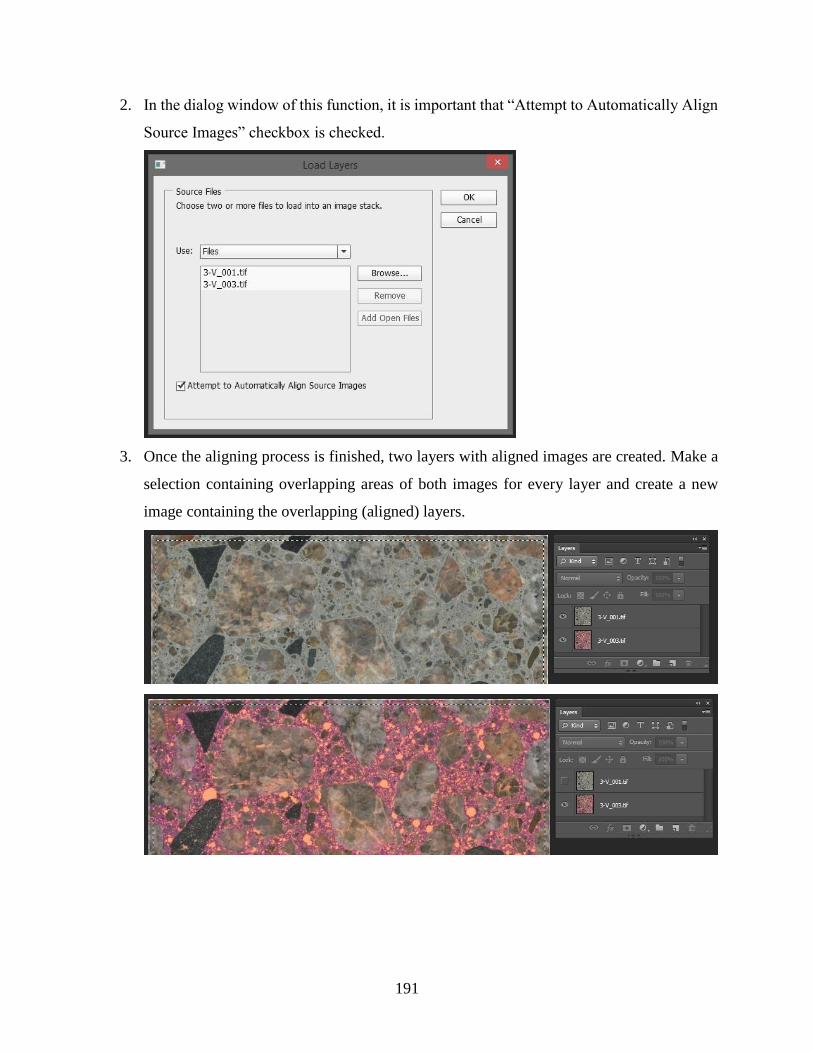
191
2. In the dialog window of this function, it is important that “Attempt to Automatically Align
Source Images” checkbox is checked.
3. Once the aligning process is finished, two layers with aligned images are created. Make a
selection containing overlapping areas of both images for every layer and create a new
image containing the overlapping (aligned) layers.
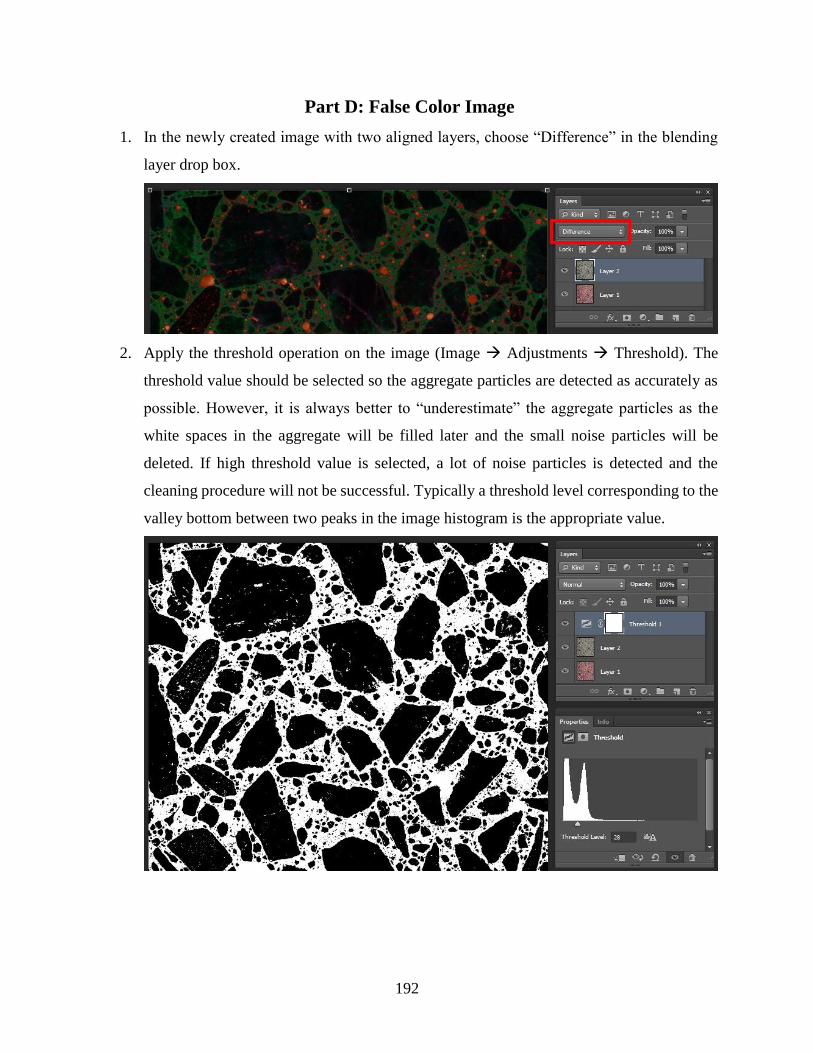
192
Part D: False Color Image
1. In the newly created image with two aligned layers, choose “Difference” in the blending
layer drop box.
2. Apply the threshold operation on the image (Image Adjustments Threshold). The
threshold value should be selected so the aggregate particles are detected as accurately as
possible. However, it is always better to “underestimate” the aggregate particles as the
white spaces in the aggregate will be filled later and the small noise particles will be
deleted. If high threshold value is selected, a lot of noise particles is detected and the
cleaning procedure will not be successful. Typically a threshold level corresponding to the
valley bottom between two peaks in the image histogram is the appropriate value.
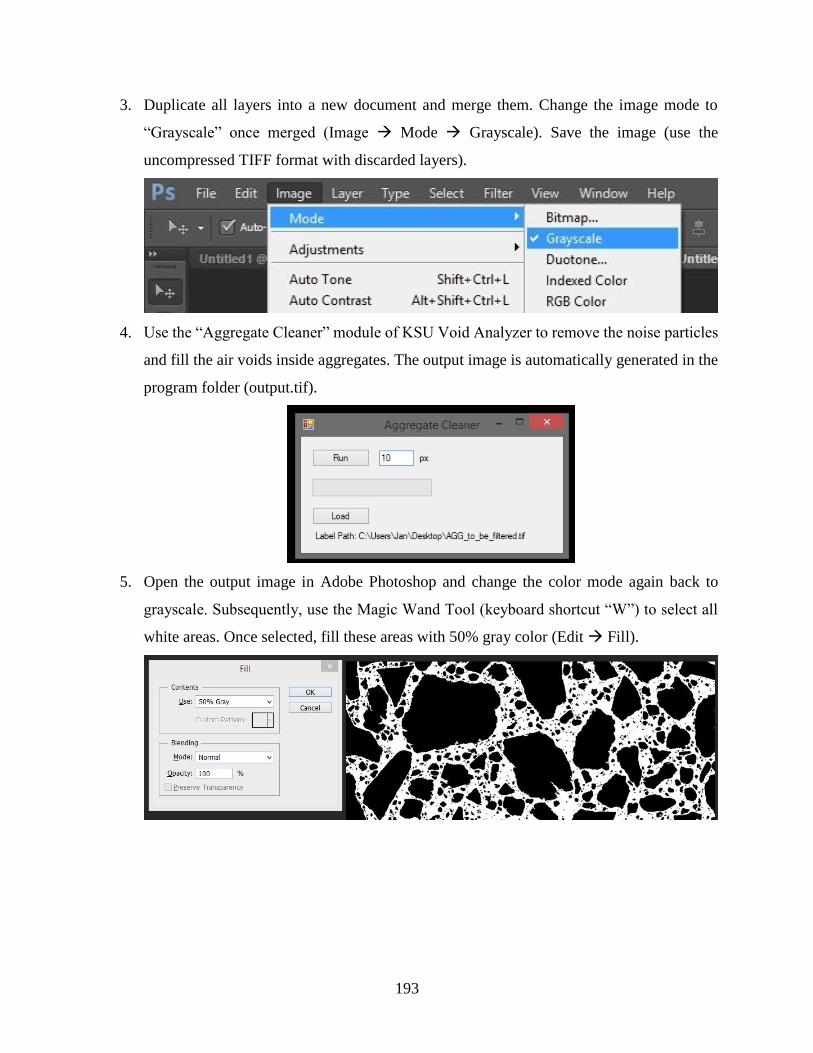
193
3. Duplicate all layers into a new document and merge them. Change the image mode to
“Grayscale” once merged (Image Mode Grayscale). Save the image (use the
uncompressed TIFF format with discarded layers).
4. Use the “Aggregate Cleaner” module of KSU Void Analyzer to remove the noise particles
and fill the air voids inside aggregates. The output image is automatically generated in the
program folder (output.tif).
5. Open the output image in Adobe Photoshop and change the color mode again back to
grayscale. Subsequently, use the Magic Wand Tool (keyboard shortcut “W”) to select all
white areas. Once selected, fill these areas with 50% gray color (Edit Fill).

194
6. Get back to the document from step 2. All layers besides the layer containing the image
with powder pressed into the air voids can be removed. Use the “Curves” function to detect
air voids (Image Adjustments Curves) on the powdered image. The “Input” value
depends on the quality of contrast between the paste and air voids and typically ranges
from 185 to 225. Visual comparison of detected voids to the original image needs to be
made when choosing the value.
7. Create a new, empty layer and place it on top of all layers. Use the Magic Wand Tool
(keyboard shortcut “W”) to color select all black areas (the “curves” layer must be
selected).

195
8. Select the new layer, invert the selection (Ctrl + Shift + I) and fill the selection with white
color (Ctrl + Shift + F5 or Edit Fill). Thus, a new layer containing only the air voids is
created.
9. Duplicate this layer into the document containing the filtered aggregate image (most
probably named output.tif). Select “Hard Mix” in layer blending options drop box. This is
the final step as the false color image is generated. Optionally, manual corrections can be
performed on this image.
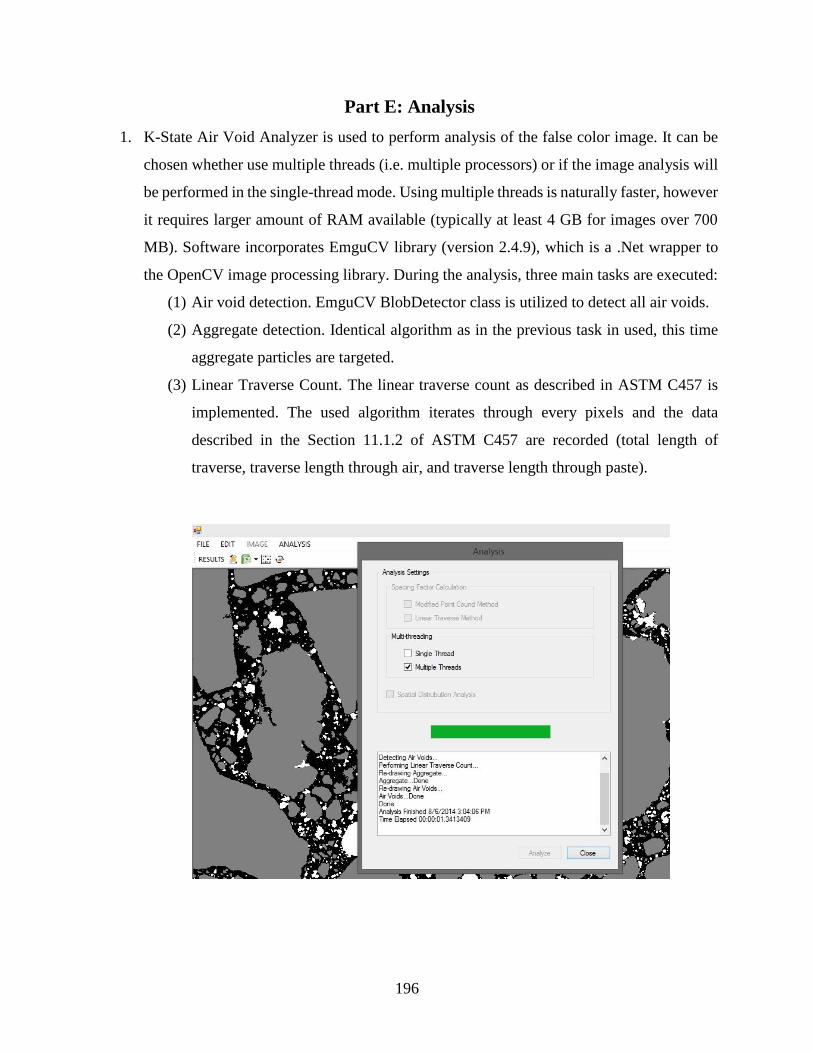
196
Part E: Analysis
1. K-State Air Void Analyzer is used to perform analysis of the false color image. It can be
chosen whether use multiple threads (i.e. multiple processors) or if the image analysis will
be performed in the single-thread mode. Using multiple threads is naturally faster, however
it requires larger amount of RAM available (typically at least 4 GB for images over 700
MB). Software incorporates EmguCV library (version 2.4.9), which is a .Net wrapper to
the OpenCV image processing library. During the analysis, three main tasks are executed:
(1) Air void detection. EmguCV BlobDetector class is utilized to detect all air voids.
(2) Aggregate detection. Identical algorithm as in the previous task in used, this time
aggregate particles are targeted.
(3) Linear Traverse Count. The linear traverse count as described in ASTM C457 is
implemented. The used algorithm iterates through every pixels and the data
described in the Section 11.1.2 of ASTM C457 are recorded (total length of
traverse, traverse length through air, and traverse length through paste).
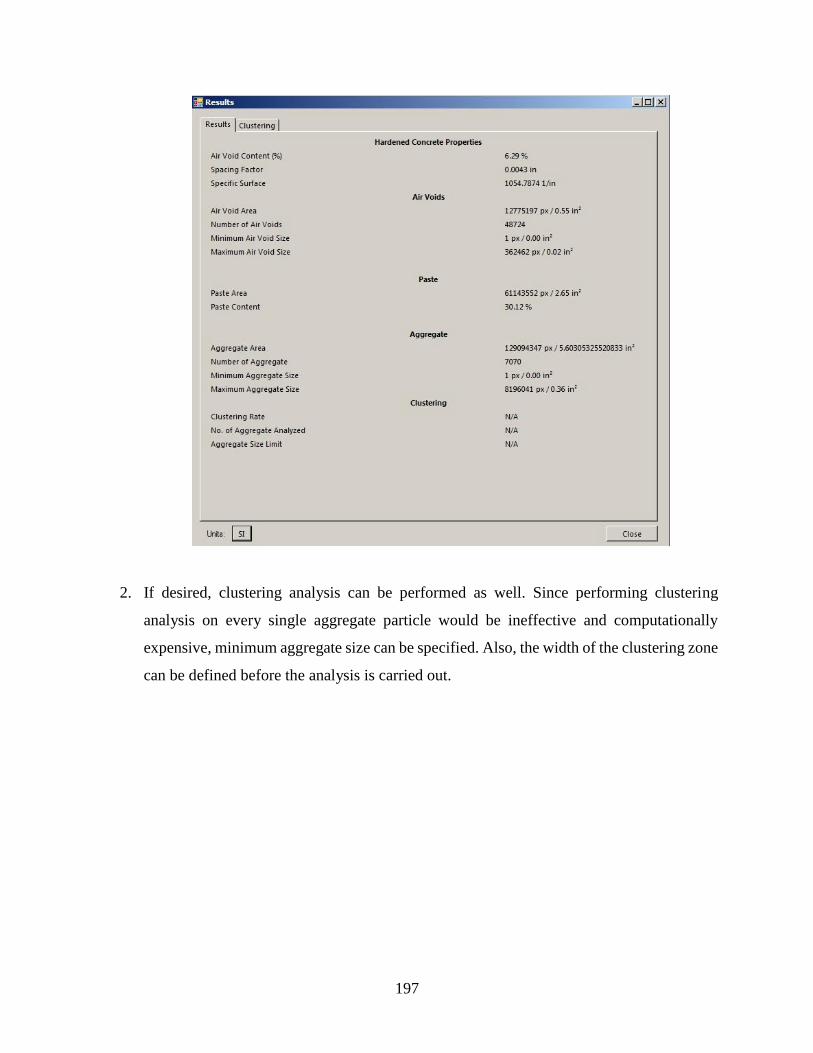
197
2. If desired, clustering analysis can be performed as well. Since performing clustering
analysis on every single aggregate particle would be ineffective and computationally
expensive, minimum aggregate size can be specified. Also, the width of the clustering zone
can be defined before the analysis is carried out.

198
Copyright © 2022 FDOKUMEN